Rocky Point, NY Map & Demographics
Rocky Point Map
Rocky Point Overview
$51,803
PER CAPITA INCOME
$129,388
AVG FAMILY INCOME
$115,173
AVG HOUSEHOLD INCOME
40.3%
WAGE / INCOME GAP [ % ]
59.7¢/ $1
WAGE / INCOME GAP [ $ ]
$13,970
FAMILY INCOME DEFICIT
0.39
INEQUALITY / GINI INDEX
13,716
TOTAL POPULATION
6,643
MALE POPULATION
7,073
FEMALE POPULATION
93.92
MALES / 100 FEMALES
106.47
FEMALES / 100 MALES
38.9
MEDIAN AGE
3.4
AVG FAMILY SIZE
2.7
AVG HOUSEHOLD SIZE
7,794
LABOR FORCE [ PEOPLE ]
72.6%
PERCENT IN LABOR FORCE
6.4%
UNEMPLOYMENT RATE
Rocky Point Zip Codes
Rocky Point Area Codes
Income in Rocky Point
Income Overview in Rocky Point
Per Capita Income in Rocky Point is $51,803, while median incomes of families and households are $129,388 and $115,173 respectively.
| Characteristic | Number | Measure |
| Per Capita Income | 13,716 | $51,803 |
| Median Family Income | 3,452 | $129,388 |
| Mean Family Income | 3,452 | $162,320 |
| Median Household Income | 5,003 | $115,173 |
| Mean Household Income | 5,003 | $138,983 |
| Income Deficit | 3,452 | $13,970 |
| Wage / Income Gap (%) | 13,716 | 40.30% |
| Wage / Income Gap ($) | 13,716 | 59.70¢ per $1 |
| Gini / Inequality Index | 13,716 | 0.39 |
Earnings by Sex in Rocky Point
Average Earnings in Rocky Point are $59,918, $77,064 for men and $46,005 for women, a difference of 40.3%.
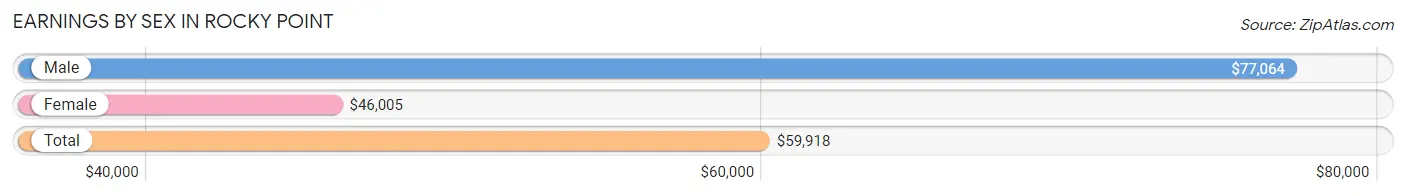
| Sex | Number | Average Earnings |
| Male | 4,196 (51.6%) | $77,064 |
| Female | 3,928 (48.3%) | $46,005 |
| Total | 8,124 (100.0%) | $59,918 |
Earnings by Sex by Income Bracket in Rocky Point
The most common earnings brackets in Rocky Point are $100,000+ for men (1,336 | 31.8%) and $100,000+ for women (671 | 17.1%).
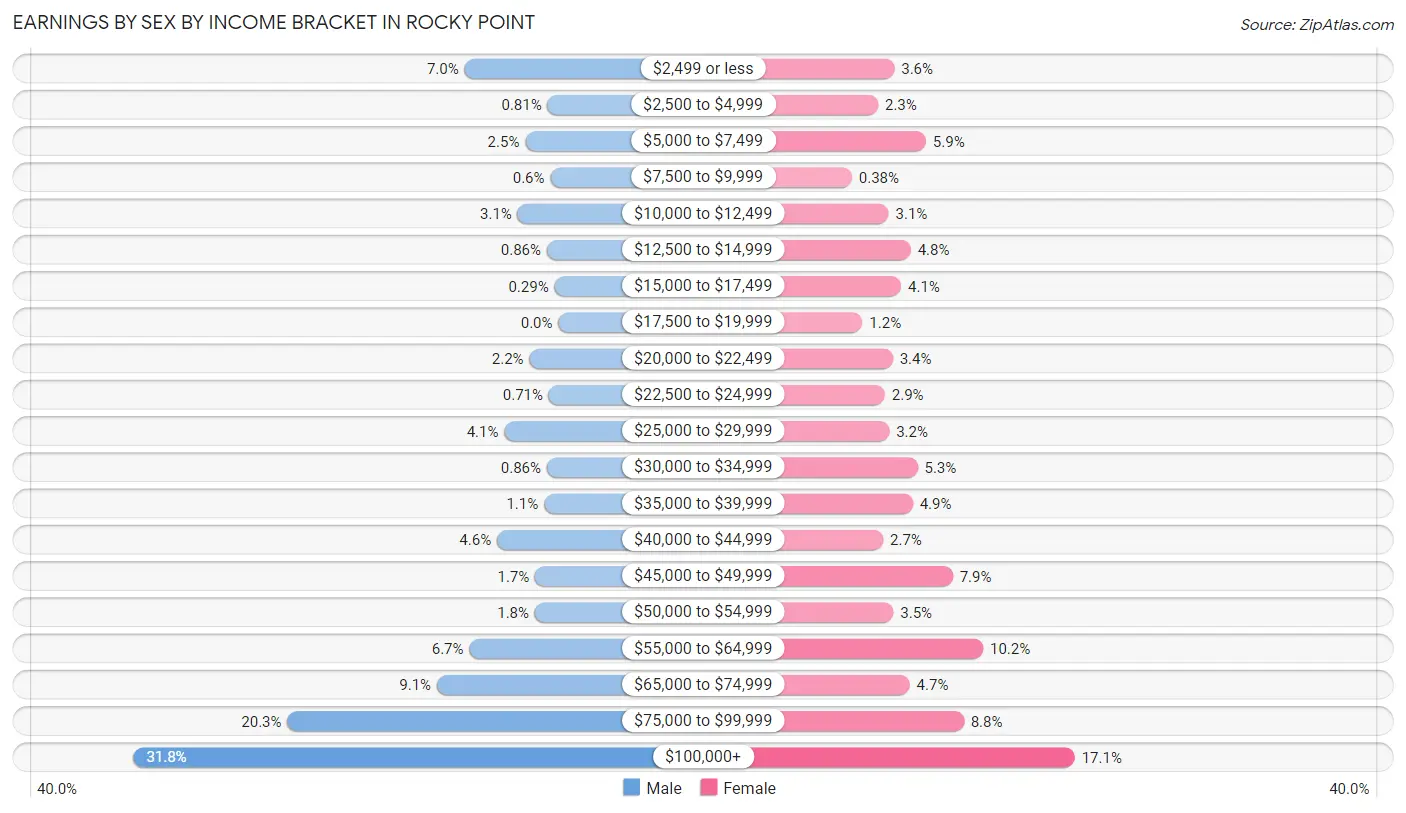
| Income | Male | Female |
| $2,499 or less | 295 (7.0%) | 140 (3.6%) |
| $2,500 to $4,999 | 34 (0.8%) | 92 (2.3%) |
| $5,000 to $7,499 | 104 (2.5%) | 233 (5.9%) |
| $7,500 to $9,999 | 25 (0.6%) | 15 (0.4%) |
| $10,000 to $12,499 | 128 (3.0%) | 123 (3.1%) |
| $12,500 to $14,999 | 36 (0.9%) | 188 (4.8%) |
| $15,000 to $17,499 | 12 (0.3%) | 160 (4.1%) |
| $17,500 to $19,999 | 0 (0.0%) | 46 (1.2%) |
| $20,000 to $22,499 | 91 (2.2%) | 135 (3.4%) |
| $22,500 to $24,999 | 30 (0.7%) | 112 (2.9%) |
| $25,000 to $29,999 | 170 (4.1%) | 125 (3.2%) |
| $30,000 to $34,999 | 36 (0.9%) | 208 (5.3%) |
| $35,000 to $39,999 | 45 (1.1%) | 194 (4.9%) |
| $40,000 to $44,999 | 193 (4.6%) | 107 (2.7%) |
| $45,000 to $49,999 | 73 (1.7%) | 312 (7.9%) |
| $50,000 to $54,999 | 74 (1.8%) | 137 (3.5%) |
| $55,000 to $64,999 | 280 (6.7%) | 401 (10.2%) |
| $65,000 to $74,999 | 382 (9.1%) | 185 (4.7%) |
| $75,000 to $99,999 | 852 (20.3%) | 344 (8.8%) |
| $100,000+ | 1,336 (31.8%) | 671 (17.1%) |
| Total | 4,196 (100.0%) | 3,928 (100.0%) |
Earnings by Sex by Educational Attainment in Rocky Point
Average earnings in Rocky Point are $81,575 for men and $51,806 for women, a difference of 36.5%. Men with an educational attainment of graduate degree enjoy the highest average annual earnings of $152,313, while those with college or associate's degree education earn the least with $76,463. Women with an educational attainment of graduate degree earn the most with the average annual earnings of $97,368, while those with less than high school education have the smallest earnings of $22,262.
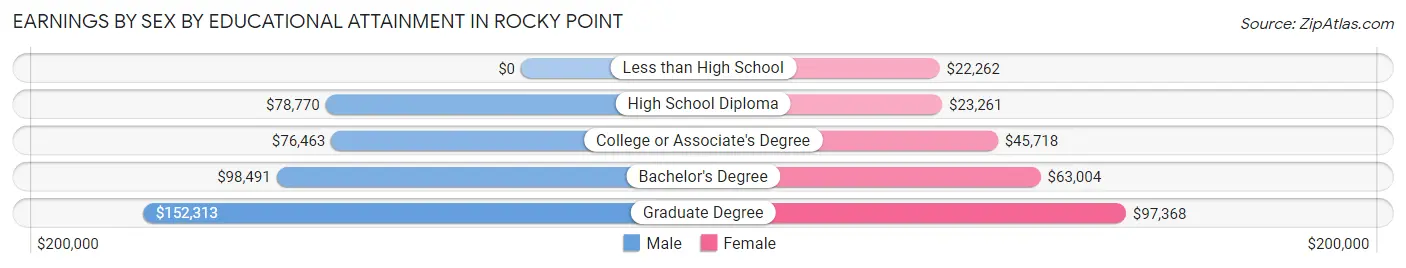
| Educational Attainment | Male Income | Female Income |
| Less than High School | - | - |
| High School Diploma | $78,770 | $23,261 |
| College or Associate's Degree | $76,463 | $45,718 |
| Bachelor's Degree | $98,491 | $63,004 |
| Graduate Degree | $152,313 | $97,368 |
| Total | $81,575 | $51,806 |
Family Income in Rocky Point
Family Income Brackets in Rocky Point
According to the Rocky Point family income data, there are 1,032 families falling into the $100,000 to $149,999 income range, which is the most common income bracket and makes up 29.9% of all families. Conversely, the $10,000 to $14,999 income bracket is the least frequent group with only 17 families (0.5%) belonging to this category.
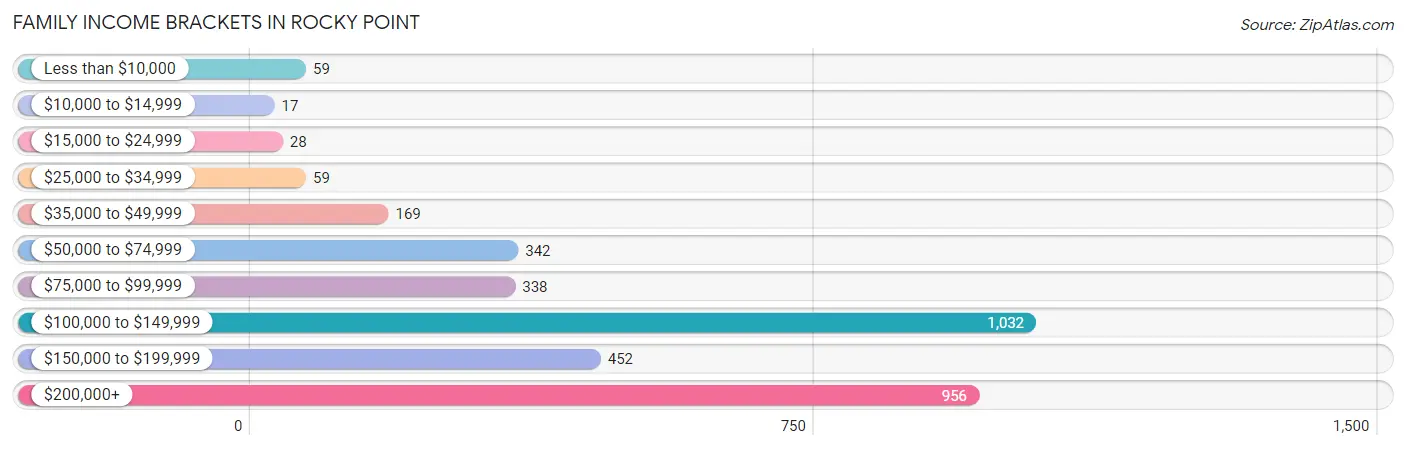
| Income Bracket | # Families | % Families |
| Less than $10,000 | 59 | 1.7% |
| $10,000 to $14,999 | 17 | 0.5% |
| $15,000 to $24,999 | 28 | 0.8% |
| $25,000 to $34,999 | 59 | 1.7% |
| $35,000 to $49,999 | 169 | 4.9% |
| $50,000 to $74,999 | 342 | 9.9% |
| $75,000 to $99,999 | 338 | 9.8% |
| $100,000 to $149,999 | 1,032 | 29.9% |
| $150,000 to $199,999 | 452 | 13.1% |
| $200,000+ | 956 | 27.7% |
Family Income by Famaliy Size in Rocky Point
7+ person families (36 | 1.0%) account for the highest median family income in Rocky Point with $250,001 per family, while 2-person families (991 | 28.7%) have the highest median income of $56,386 per family member.
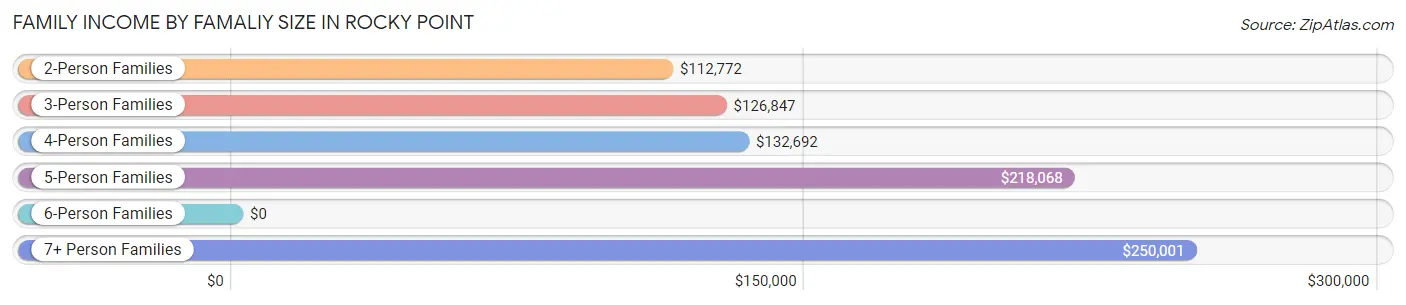
| Income Bracket | # Families | Median Income |
| 2-Person Families | 991 (28.7%) | $112,772 |
| 3-Person Families | 1,039 (30.1%) | $126,847 |
| 4-Person Families | 1,150 (33.3%) | $132,692 |
| 5-Person Families | 224 (6.5%) | $218,068 |
| 6-Person Families | 12 (0.4%) | $0 |
| 7+ Person Families | 36 (1.0%) | $250,001 |
| Total | 3,452 (100.0%) | $129,388 |
Family Income by Number of Earners in Rocky Point
The median family income in Rocky Point is $129,388, with families comprising 3+ earners (660) having the highest median family income of $208,409, while families with 1 earner (752) have the lowest median family income of $76,341, accounting for 19.1% and 21.8% of families, respectively.
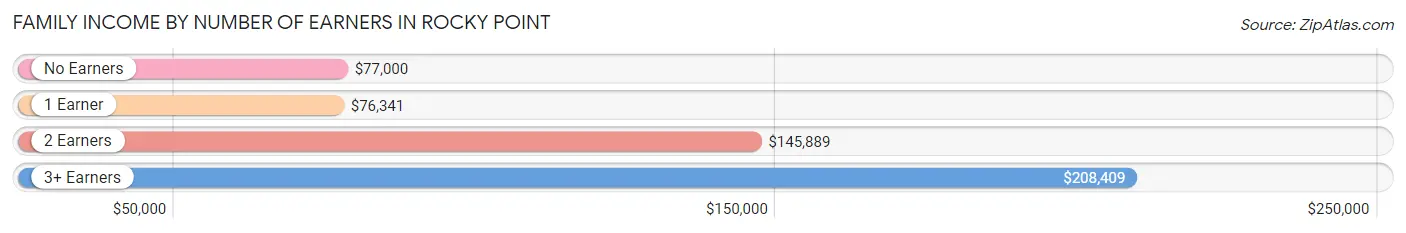
| Number of Earners | # Families | Median Income |
| No Earners | 304 (8.8%) | $77,000 |
| 1 Earner | 752 (21.8%) | $76,341 |
| 2 Earners | 1,736 (50.3%) | $145,889 |
| 3+ Earners | 660 (19.1%) | $208,409 |
| Total | 3,452 (100.0%) | $129,388 |
Household Income in Rocky Point
Household Income Brackets in Rocky Point
With 1,246 households falling in the category, the $100,000 to $149,999 income range is the most frequent in Rocky Point, accounting for 24.9% of all households. In contrast, only 115 households (2.3%) fall into the less than $10,000 income bracket, making it the least populous group.
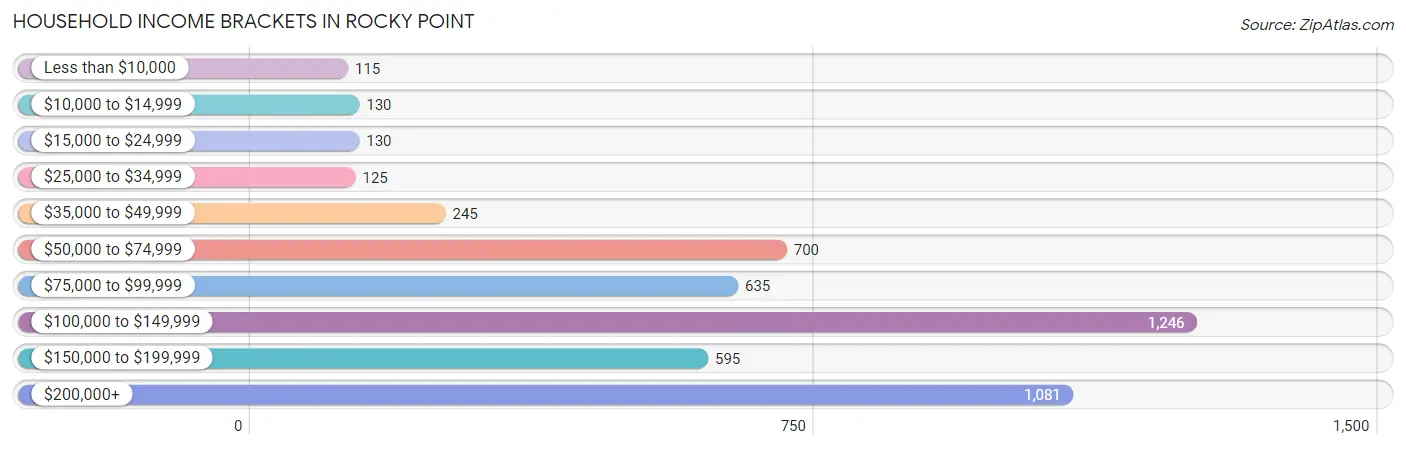
| Income Bracket | # Households | % Households |
| Less than $10,000 | 115 | 2.3% |
| $10,000 to $14,999 | 130 | 2.6% |
| $15,000 to $24,999 | 130 | 2.6% |
| $25,000 to $34,999 | 125 | 2.5% |
| $35,000 to $49,999 | 245 | 4.9% |
| $50,000 to $74,999 | 700 | 14.0% |
| $75,000 to $99,999 | 635 | 12.7% |
| $100,000 to $149,999 | 1,246 | 24.9% |
| $150,000 to $199,999 | 595 | 11.9% |
| $200,000+ | 1,081 | 21.6% |
Household Income by Householder Age in Rocky Point
The median household income in Rocky Point is $115,173, with the highest median household income of $127,702 found in the 45 to 64 years age bracket for the primary householder. A total of 2,569 households (51.3%) fall into this category. Meanwhile, the 15 to 24 years age bracket for the primary householder has the lowest median household income of $0, with 6 households (0.1%) in this group.
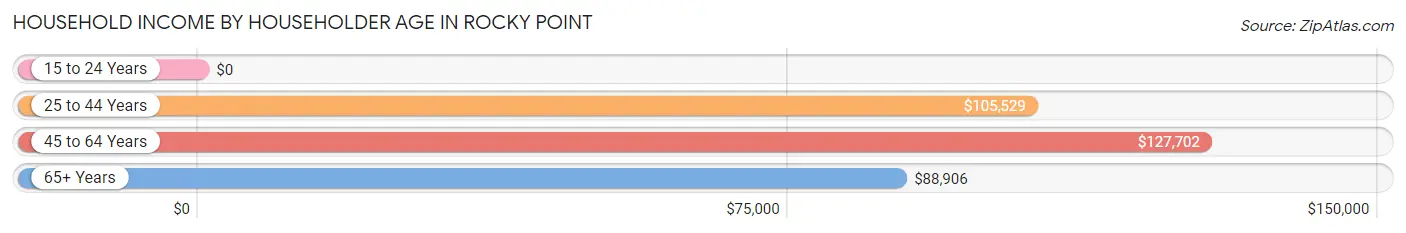
| Income Bracket | # Households | Median Income |
| 15 to 24 Years | 6 (0.1%) | $0 |
| 25 to 44 Years | 1,501 (30.0%) | $105,529 |
| 45 to 64 Years | 2,569 (51.3%) | $127,702 |
| 65+ Years | 927 (18.5%) | $88,906 |
| Total | 5,003 (100.0%) | $115,173 |
Poverty in Rocky Point
Income Below Poverty by Sex and Age in Rocky Point
With 3.4% poverty level for males and 5.3% for females among the residents of Rocky Point, 45 to 54 year old males and 5 year old females are the most vulnerable to poverty, with 80 males (6.2%) and 39 females (62.9%) in their respective age groups living below the poverty level.
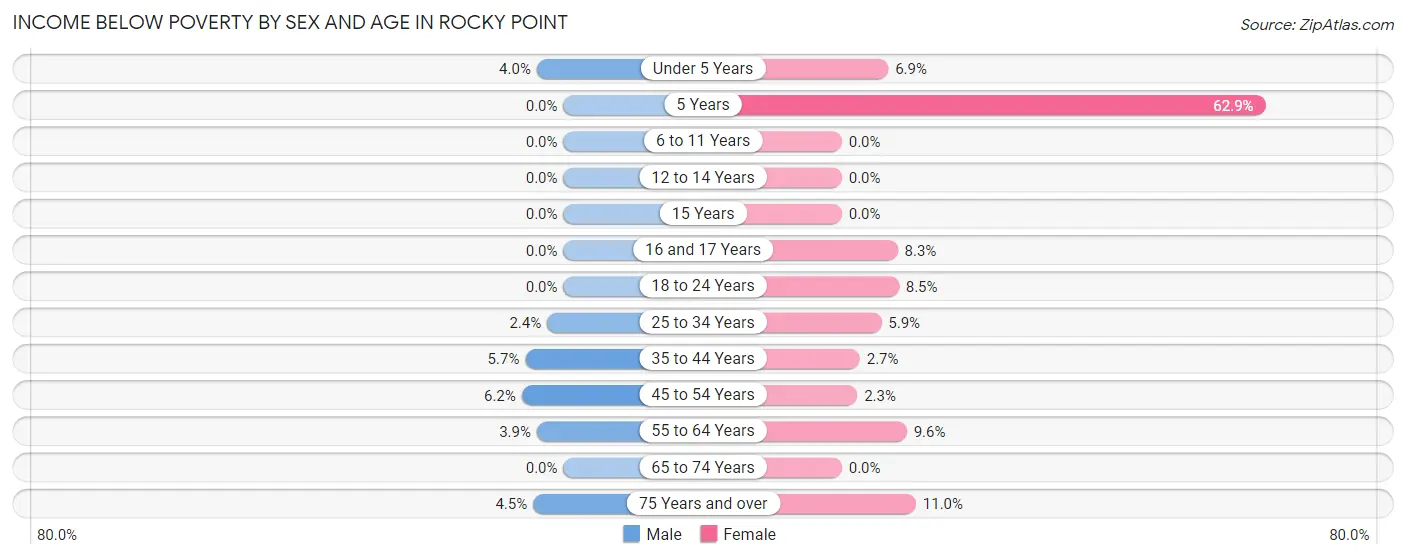
| Age Bracket | Male | Female |
| Under 5 Years | 23 (4.0%) | 29 (6.9%) |
| 5 Years | 0 (0.0%) | 39 (62.9%) |
| 6 to 11 Years | 0 (0.0%) | 0 (0.0%) |
| 12 to 14 Years | 0 (0.0%) | 0 (0.0%) |
| 15 Years | 0 (0.0%) | 0 (0.0%) |
| 16 and 17 Years | 0 (0.0%) | 15 (8.3%) |
| 18 to 24 Years | 0 (0.0%) | 66 (8.5%) |
| 25 to 34 Years | 23 (2.4%) | 45 (5.9%) |
| 35 to 44 Years | 48 (5.7%) | 18 (2.7%) |
| 45 to 54 Years | 80 (6.2%) | 30 (2.3%) |
| 55 to 64 Years | 36 (3.9%) | 78 (9.6%) |
| 65 to 74 Years | 0 (0.0%) | 0 (0.0%) |
| 75 Years and over | 13 (4.5%) | 55 (11.0%) |
| Total | 223 (3.4%) | 375 (5.3%) |
Income Above Poverty by Sex and Age in Rocky Point
According to the poverty statistics in Rocky Point, males aged 5 years and females aged 6 to 11 years are the age groups that are most secure financially, with 100.0% of males and 100.0% of females in these age groups living above the poverty line.
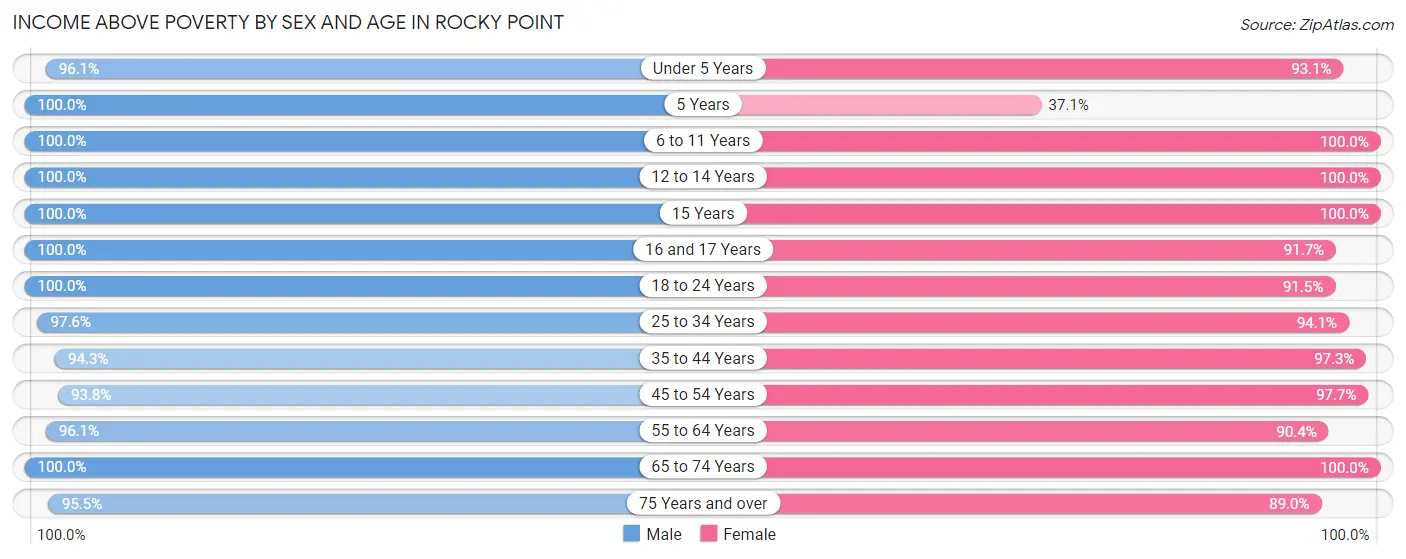
| Age Bracket | Male | Female |
| Under 5 Years | 560 (96.1%) | 392 (93.1%) |
| 5 Years | 46 (100.0%) | 23 (37.1%) |
| 6 to 11 Years | 390 (100.0%) | 660 (100.0%) |
| 12 to 14 Years | 258 (100.0%) | 380 (100.0%) |
| 15 Years | 108 (100.0%) | 72 (100.0%) |
| 16 and 17 Years | 135 (100.0%) | 166 (91.7%) |
| 18 to 24 Years | 455 (100.0%) | 714 (91.5%) |
| 25 to 34 Years | 927 (97.6%) | 722 (94.1%) |
| 35 to 44 Years | 800 (94.3%) | 657 (97.3%) |
| 45 to 54 Years | 1,210 (93.8%) | 1,281 (97.7%) |
| 55 to 64 Years | 878 (96.1%) | 731 (90.4%) |
| 65 to 74 Years | 377 (100.0%) | 455 (100.0%) |
| 75 Years and over | 276 (95.5%) | 445 (89.0%) |
| Total | 6,420 (96.6%) | 6,698 (94.7%) |
Income Below Poverty Among Married-Couple Families in Rocky Point
The poverty statistics for married-couple families in Rocky Point show that 2.2% or 61 of the total 2,803 families live below the poverty line. Families with no children have the highest poverty rate of 2.6%, comprising of 30 families. On the other hand, families with 3 or 4 children have the lowest poverty rate of 0.0%, which includes 0 families.
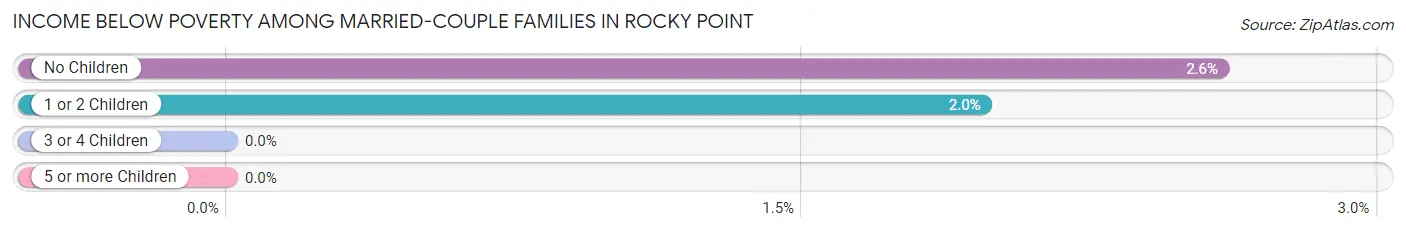
| Children | Above Poverty | Below Poverty |
| No Children | 1,129 (97.4%) | 30 (2.6%) |
| 1 or 2 Children | 1,539 (98.0%) | 31 (2.0%) |
| 3 or 4 Children | 74 (100.0%) | 0 (0.0%) |
| 5 or more Children | 0 (0.0%) | 0 (0.0%) |
| Total | 2,742 (97.8%) | 61 (2.2%) |
Income Below Poverty Among Single-Parent Households in Rocky Point
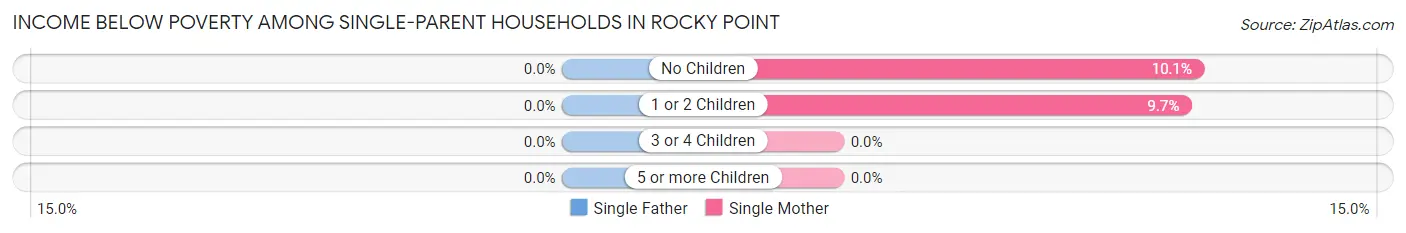
| Children | Single Father | Single Mother |
| No Children | 0 (0.0%) | 16 (10.1%) |
| 1 or 2 Children | 0 (0.0%) | 27 (9.7%) |
| 3 or 4 Children | 0 (0.0%) | 0 (0.0%) |
| 5 or more Children | 0 (0.0%) | 0 (0.0%) |
| Total | 0 (0.0%) | 43 (9.7%) |
Income Below Poverty Among Married-Couple vs Single-Parent Households in Rocky Point
The poverty data for Rocky Point shows that 61 of the married-couple family households (2.2%) and 43 of the single-parent households (6.6%) are living below the poverty level. Within the married-couple family households, those with no children have the highest poverty rate, with 30 households (2.6%) falling below the poverty line. Among the single-parent households, those with 1 or 2 children have the highest poverty rate, with 27 household (7.3%) living below poverty.
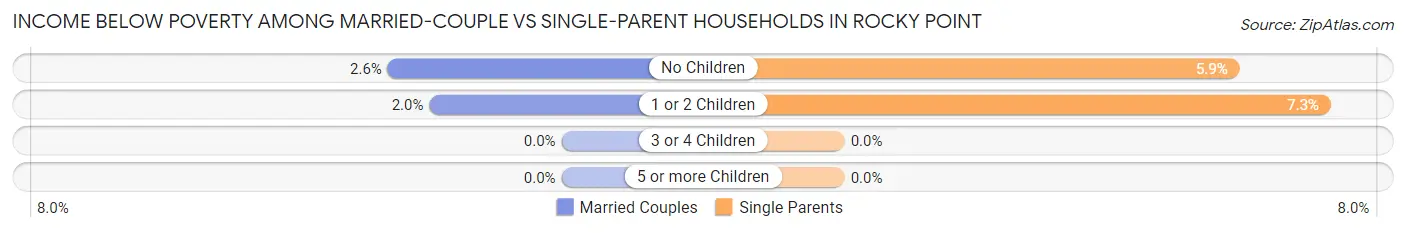
| Children | Married-Couple Families | Single-Parent Households |
| No Children | 30 (2.6%) | 16 (5.9%) |
| 1 or 2 Children | 31 (2.0%) | 27 (7.3%) |
| 3 or 4 Children | 0 (0.0%) | 0 (0.0%) |
| 5 or more Children | 0 (0.0%) | 0 (0.0%) |
| Total | 61 (2.2%) | 43 (6.6%) |
Race in Rocky Point
The most populous races in Rocky Point are White / Caucasian (12,282 | 89.5%), Hispanic or Latino (1,881 | 13.7%), and Two or more Races (877 | 6.4%).
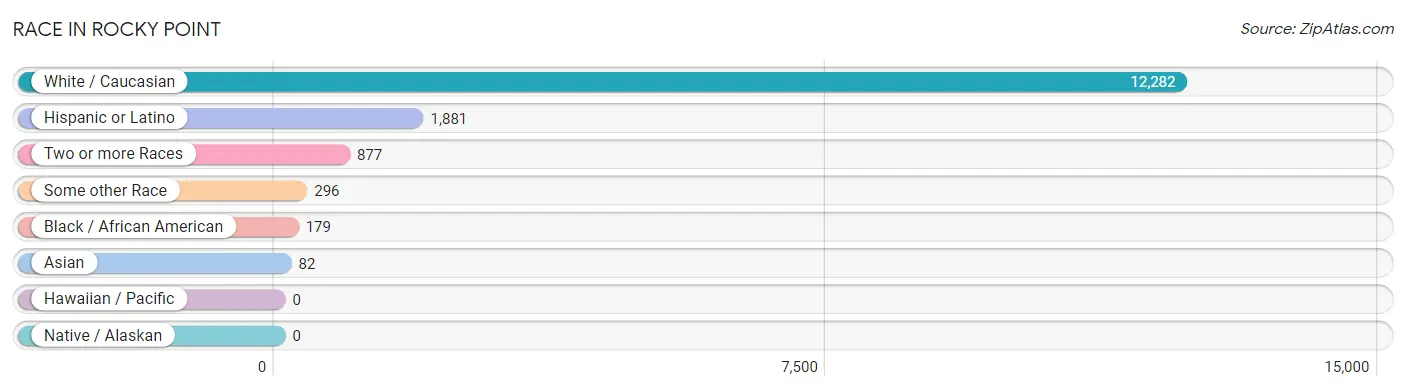
| Race | # Population | % Population |
| Asian | 82 | 0.6% |
| Black / African American | 179 | 1.3% |
| Hawaiian / Pacific | 0 | 0.0% |
| Hispanic or Latino | 1,881 | 13.7% |
| Native / Alaskan | 0 | 0.0% |
| White / Caucasian | 12,282 | 89.5% |
| Two or more Races | 877 | 6.4% |
| Some other Race | 296 | 2.2% |
| Total | 13,716 | 100.0% |
Ancestry in Rocky Point
The most populous ancestries reported in Rocky Point are Italian (3,865 | 28.2%), Irish (3,139 | 22.9%), German (2,671 | 19.5%), American (1,271 | 9.3%), and Polish (869 | 6.3%), together accounting for 86.1% of all Rocky Point residents.
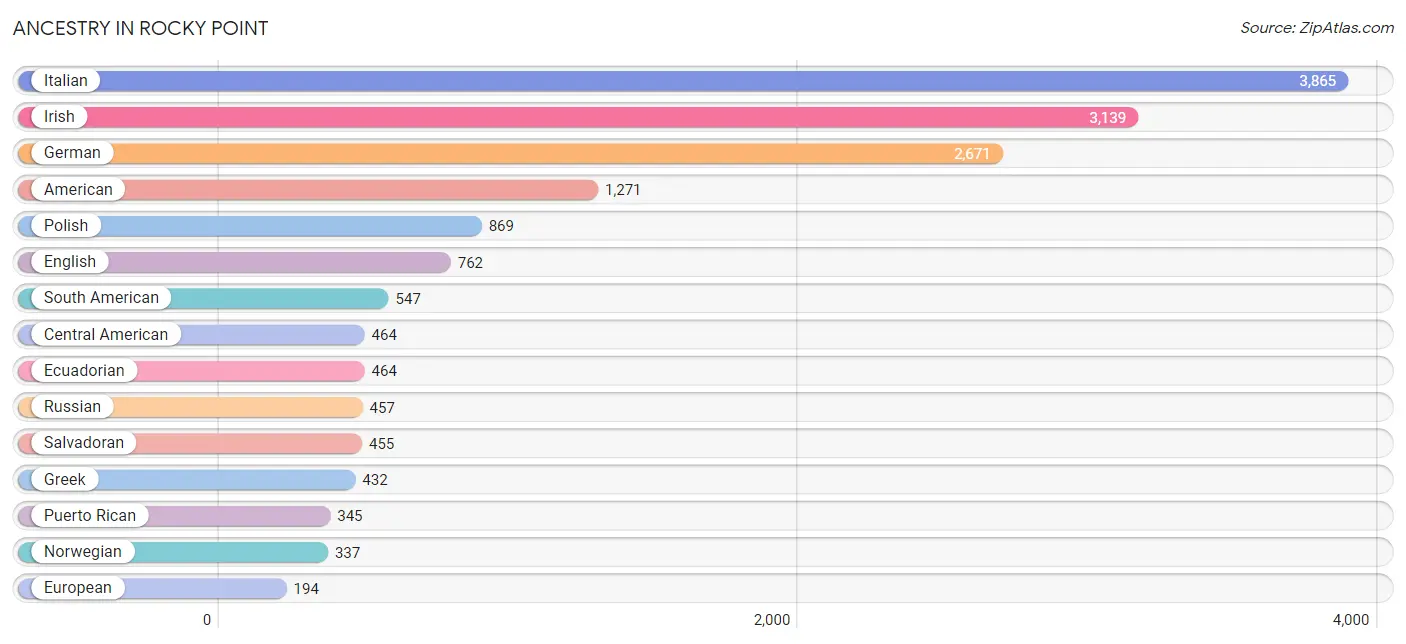
| Ancestry | # Population | % Population |
| Albanian | 43 | 0.3% |
| American | 1,271 | 9.3% |
| Arab | 37 | 0.3% |
| Argentinean | 17 | 0.1% |
| Austrian | 22 | 0.2% |
| Bhutanese | 9 | 0.1% |
| Blackfeet | 25 | 0.2% |
| Brazilian | 11 | 0.1% |
| Burmese | 4 | 0.0% |
| Canadian | 35 | 0.3% |
| Central American | 464 | 3.4% |
| Central American Indian | 23 | 0.2% |
| Chilean | 35 | 0.3% |
| Colombian | 19 | 0.1% |
| Croatian | 28 | 0.2% |
| Cuban | 85 | 0.6% |
| Czech | 40 | 0.3% |
| Danish | 15 | 0.1% |
| Dominican | 50 | 0.4% |
| Dutch | 33 | 0.2% |
| Eastern European | 64 | 0.5% |
| Ecuadorian | 464 | 3.4% |
| English | 762 | 5.6% |
| European | 194 | 1.4% |
| Finnish | 28 | 0.2% |
| French | 194 | 1.4% |
| French Canadian | 91 | 0.7% |
| German | 2,671 | 19.5% |
| Greek | 432 | 3.2% |
| Guatemalan | 9 | 0.1% |
| Guyanese | 60 | 0.4% |
| Haitian | 11 | 0.1% |
| Hungarian | 111 | 0.8% |
| Indian (Asian) | 118 | 0.9% |
| Irish | 3,139 | 22.9% |
| Iroquois | 15 | 0.1% |
| Israeli | 23 | 0.2% |
| Italian | 3,865 | 28.2% |
| Jamaican | 8 | 0.1% |
| Korean | 122 | 0.9% |
| Lithuanian | 62 | 0.4% |
| Maltese | 67 | 0.5% |
| Mexican | 124 | 0.9% |
| Mexican American Indian | 23 | 0.2% |
| Norwegian | 337 | 2.5% |
| Polish | 869 | 6.3% |
| Portuguese | 53 | 0.4% |
| Puerto Rican | 345 | 2.5% |
| Romanian | 59 | 0.4% |
| Russian | 457 | 3.3% |
| Salvadoran | 455 | 3.3% |
| Scandinavian | 6 | 0.0% |
| Scotch-Irish | 75 | 0.5% |
| Scottish | 100 | 0.7% |
| Slavic | 9 | 0.1% |
| Slovak | 13 | 0.1% |
| South American | 547 | 4.0% |
| Spaniard | 11 | 0.1% |
| Sri Lankan | 25 | 0.2% |
| Subsaharan African | 27 | 0.2% |
| Swedish | 119 | 0.9% |
| Swiss | 131 | 1.0% |
| Syrian | 23 | 0.2% |
| Thai | 29 | 0.2% |
| Turkish | 6 | 0.0% |
| Ukrainian | 55 | 0.4% |
| Venezuelan | 12 | 0.1% |
| Welsh | 8 | 0.1% |
| Yaqui | 25 | 0.2% |
| Yugoslavian | 69 | 0.5% |
| Zimbabwean | 27 | 0.2% | View All 71 Rows |
Immigrants in Rocky Point
The most numerous immigrant groups reported in Rocky Point came from Latin America (282 | 2.1%), Europe (182 | 1.3%), South America (158 | 1.1%), Southern Europe (120 | 0.9%), and Greece (100 | 0.7%), together accounting for 6.1% of all Rocky Point residents.
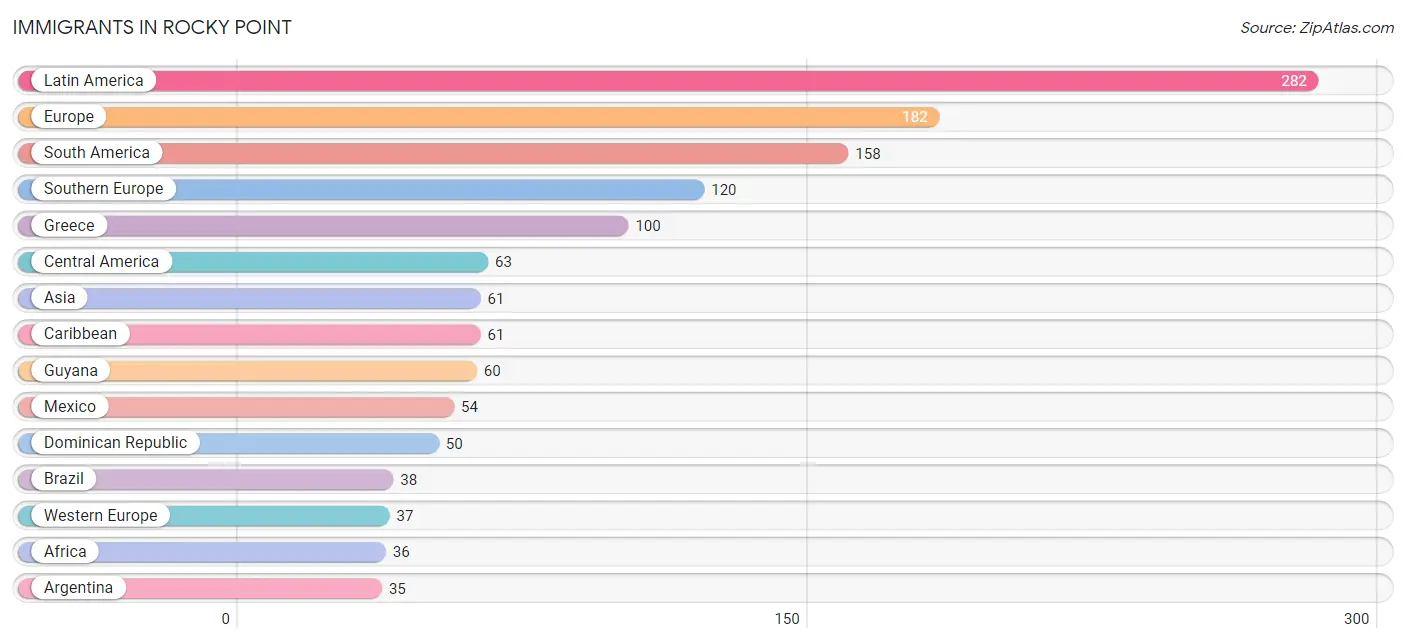
| Immigration Origin | # Population | % Population |
| Africa | 36 | 0.3% |
| Argentina | 35 | 0.3% |
| Asia | 61 | 0.4% |
| Belgium | 1 | 0.0% |
| Brazil | 38 | 0.3% |
| Canada | 25 | 0.2% |
| Caribbean | 61 | 0.4% |
| Central America | 63 | 0.5% |
| China | 35 | 0.3% |
| Colombia | 19 | 0.1% |
| Dominican Republic | 50 | 0.4% |
| Eastern Africa | 14 | 0.1% |
| Eastern Asia | 35 | 0.3% |
| Eastern Europe | 9 | 0.1% |
| Europe | 182 | 1.3% |
| France | 10 | 0.1% |
| Germany | 26 | 0.2% |
| Greece | 100 | 0.7% |
| Guatemala | 9 | 0.1% |
| Guyana | 60 | 0.4% |
| Haiti | 11 | 0.1% |
| India | 17 | 0.1% |
| Ireland | 16 | 0.1% |
| Italy | 9 | 0.1% |
| Latin America | 282 | 2.1% |
| Mexico | 54 | 0.4% |
| Morocco | 22 | 0.2% |
| Northern Africa | 22 | 0.2% |
| Northern Europe | 16 | 0.1% |
| South America | 158 | 1.1% |
| South Central Asia | 17 | 0.1% |
| South Eastern Asia | 9 | 0.1% |
| Southern Europe | 120 | 0.9% |
| Spain | 11 | 0.1% |
| Taiwan | 8 | 0.1% |
| Venezuela | 6 | 0.0% |
| Western Europe | 37 | 0.3% |
| Zimbabwe | 14 | 0.1% | View All 38 Rows |
Sex and Age in Rocky Point
Sex and Age in Rocky Point
The most populous age groups in Rocky Point are 45 to 49 Years (758 | 11.4%) for men and 45 to 49 Years (824 | 11.7%) for women.
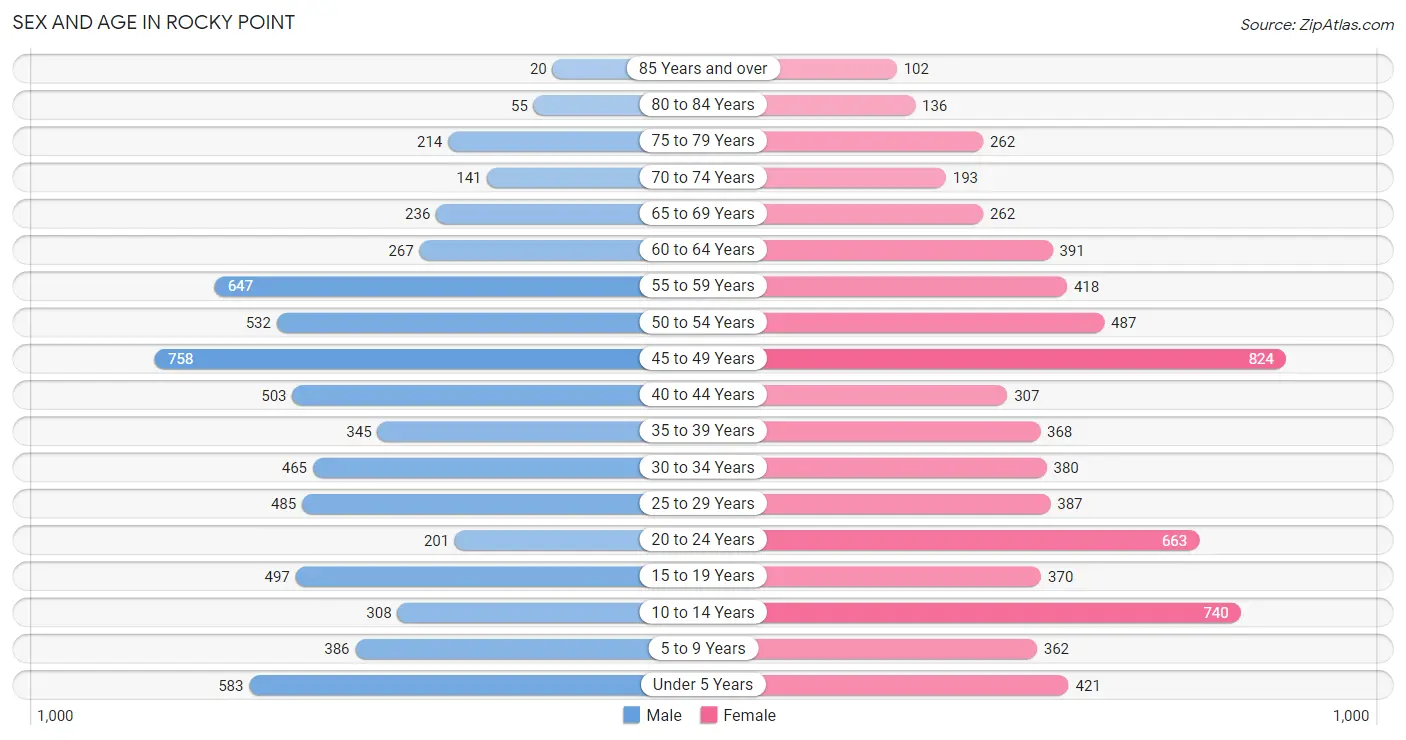
| Age Bracket | Male | Female |
| Under 5 Years | 583 (8.8%) | 421 (5.9%) |
| 5 to 9 Years | 386 (5.8%) | 362 (5.1%) |
| 10 to 14 Years | 308 (4.6%) | 740 (10.5%) |
| 15 to 19 Years | 497 (7.5%) | 370 (5.2%) |
| 20 to 24 Years | 201 (3.0%) | 663 (9.4%) |
| 25 to 29 Years | 485 (7.3%) | 387 (5.5%) |
| 30 to 34 Years | 465 (7.0%) | 380 (5.4%) |
| 35 to 39 Years | 345 (5.2%) | 368 (5.2%) |
| 40 to 44 Years | 503 (7.6%) | 307 (4.3%) |
| 45 to 49 Years | 758 (11.4%) | 824 (11.7%) |
| 50 to 54 Years | 532 (8.0%) | 487 (6.9%) |
| 55 to 59 Years | 647 (9.7%) | 418 (5.9%) |
| 60 to 64 Years | 267 (4.0%) | 391 (5.5%) |
| 65 to 69 Years | 236 (3.5%) | 262 (3.7%) |
| 70 to 74 Years | 141 (2.1%) | 193 (2.7%) |
| 75 to 79 Years | 214 (3.2%) | 262 (3.7%) |
| 80 to 84 Years | 55 (0.8%) | 136 (1.9%) |
| 85 Years and over | 20 (0.3%) | 102 (1.4%) |
| Total | 6,643 (100.0%) | 7,073 (100.0%) |
Families and Households in Rocky Point
Median Family Size in Rocky Point
The median family size in Rocky Point is 3.38 persons per family, with married-couple families (2,803 | 81.2%) accounting for the largest median family size of 3.43 persons per family. On the other hand, single male/father families (206 | 6.0%) represent the smallest median family size with 2.89 persons per family.
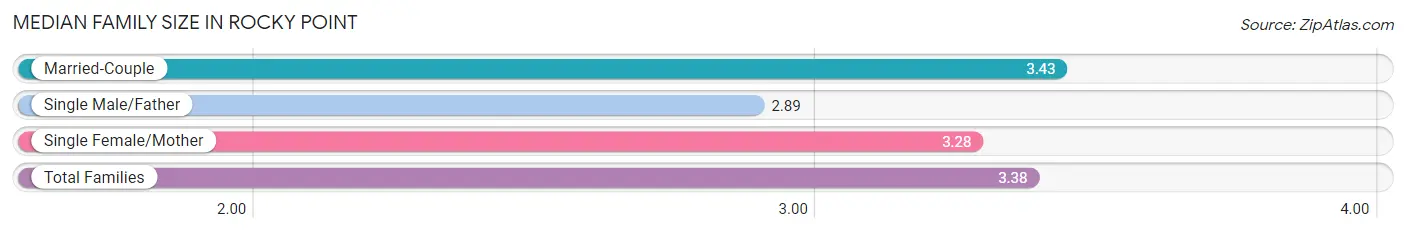
| Family Type | # Families | Family Size |
| Married-Couple | 2,803 (81.2%) | 3.43 |
| Single Male/Father | 206 (6.0%) | 2.89 |
| Single Female/Mother | 443 (12.8%) | 3.28 |
| Total Families | 3,452 (100.0%) | 3.38 |
Median Household Size in Rocky Point
The median household size in Rocky Point is 2.73 persons per household, with single female/mother households (443 | 8.8%) accounting for the largest median household size of 3.6 persons per household. non-family households (1,551 | 31.0%) represent the smallest median household size with 1.15 persons per household.
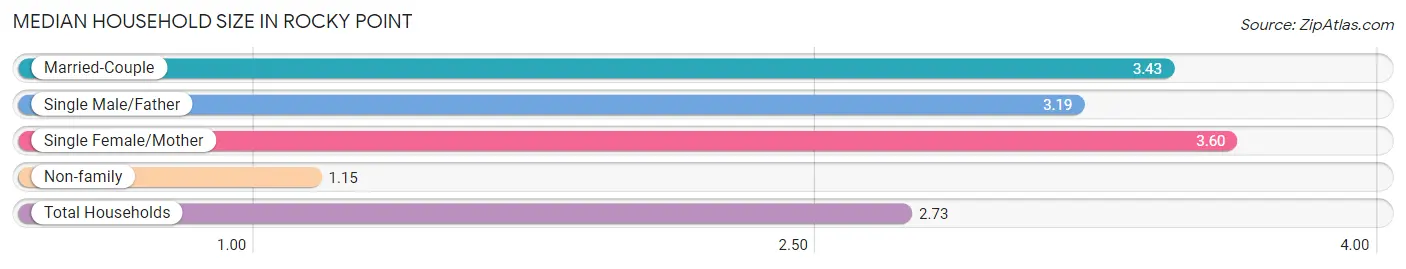
| Household Type | # Households | Household Size |
| Married-Couple | 2,803 (56.0%) | 3.43 |
| Single Male/Father | 206 (4.1%) | 3.19 |
| Single Female/Mother | 443 (8.8%) | 3.60 |
| Non-family | 1,551 (31.0%) | 1.15 |
| Total Households | 5,003 (100.0%) | 2.73 |
Household Size by Marriage Status in Rocky Point
Out of a total of 5,003 households in Rocky Point, 3,452 (69.0%) are family households, while 1,551 (31.0%) are nonfamily households. The most numerous type of family households are 4-person households, comprising 1,196, and the most common type of nonfamily households are 1-person households, comprising 1,342.
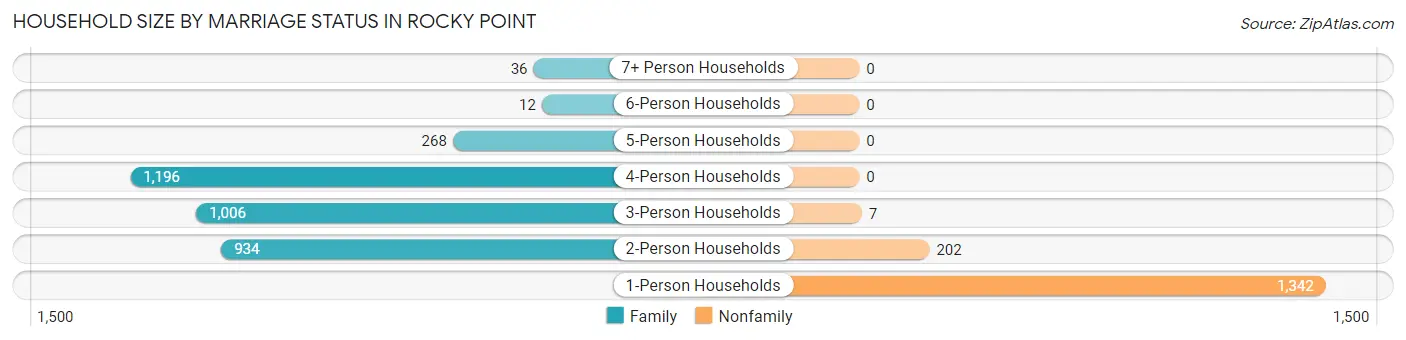
| Household Size | Family Households | Nonfamily Households |
| 1-Person Households | - | 1,342 (26.8%) |
| 2-Person Households | 934 (18.7%) | 202 (4.0%) |
| 3-Person Households | 1,006 (20.1%) | 7 (0.1%) |
| 4-Person Households | 1,196 (23.9%) | 0 (0.0%) |
| 5-Person Households | 268 (5.4%) | 0 (0.0%) |
| 6-Person Households | 12 (0.2%) | 0 (0.0%) |
| 7+ Person Households | 36 (0.7%) | 0 (0.0%) |
| Total | 3,452 (69.0%) | 1,551 (31.0%) |
Female Fertility in Rocky Point
Fertility by Age in Rocky Point
Average fertility rate in Rocky Point is 54.0 births per 1,000 women. Women in the age bracket of 20 to 34 years have the highest fertility rate with 99.0 births per 1,000 women. Women in the age bracket of 20 to 34 years acount for 78.9% of all women with births.
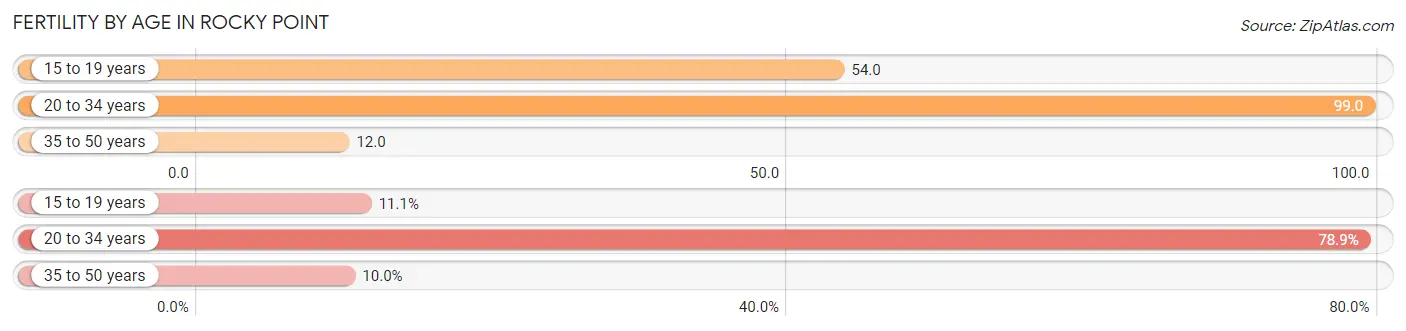
| Age Bracket | Women with Births | Births / 1,000 Women |
| 15 to 19 years | 20 (11.1%) | 54.0 |
| 20 to 34 years | 142 (78.9%) | 99.0 |
| 35 to 50 years | 18 (10.0%) | 12.0 |
| Total | 180 (100.0%) | 54.0 |
Fertility by Age by Marriage Status in Rocky Point
96.7% of women with births (180) in Rocky Point are married. The highest percentage of unmarried women with births falls into 35 to 50 years age bracket with 33.3% of them unmarried at the time of birth, while the lowest percentage of unmarried women with births belong to 15 to 19 years age bracket with 0.0% of them unmarried.
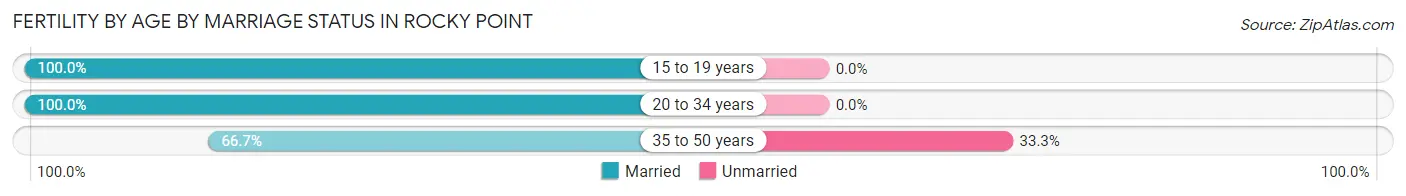
| Age Bracket | Married | Unmarried |
| 15 to 19 years | 20 (100.0%) | 0 (0.0%) |
| 20 to 34 years | 142 (100.0%) | 0 (0.0%) |
| 35 to 50 years | 12 (66.7%) | 6 (33.3%) |
| Total | 174 (96.7%) | 6 (3.3%) |
Fertility by Education in Rocky Point
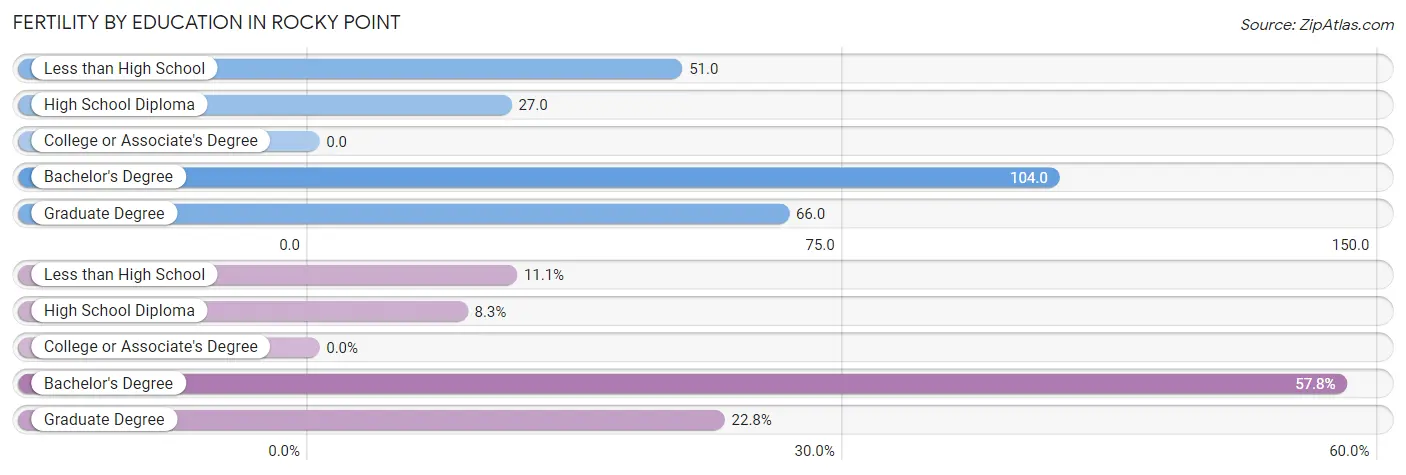
| Educational Attainment | Women with Births | Births / 1,000 Women |
| Less than High School | 20 (11.1%) | 51.0 |
| High School Diploma | 15 (8.3%) | 27.0 |
| College or Associate's Degree | 0 (0.0%) | 0.0 |
| Bachelor's Degree | 104 (57.8%) | 104.0 |
| Graduate Degree | 41 (22.8%) | 66.0 |
| Total | 180 (100.0%) | 54.0 |
Fertility by Education by Marriage Status in Rocky Point
3.3% of women with births in Rocky Point are unmarried. Women with the educational attainment of less than high school are most likely to be married with 100.0% of them married at childbirth, while women with the educational attainment of high school diploma are least likely to be married with 40.0% of them unmarried at childbirth.
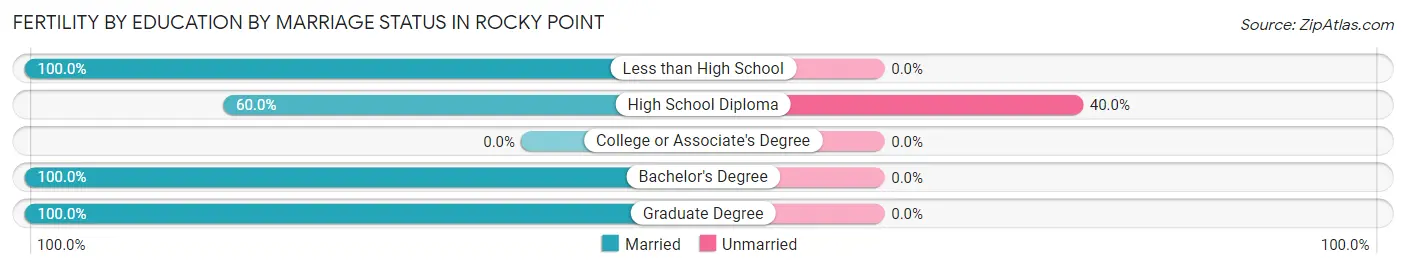
| Educational Attainment | Married | Unmarried |
| Less than High School | 20 (100.0%) | 0 (0.0%) |
| High School Diploma | 9 (60.0%) | 6 (40.0%) |
| College or Associate's Degree | 0 (0.0%) | 0 (0.0%) |
| Bachelor's Degree | 104 (100.0%) | 0 (0.0%) |
| Graduate Degree | 41 (100.0%) | 0 (0.0%) |
| Total | 174 (96.7%) | 6 (3.3%) |
Employment Characteristics in Rocky Point
Employment by Class of Employer in Rocky Point
Among the 7,194 employed individuals in Rocky Point, private company employees (3,946 | 54.8%), local government employees (1,075 | 14.9%), and state government employees (662 | 9.2%) make up the most common classes of employment.
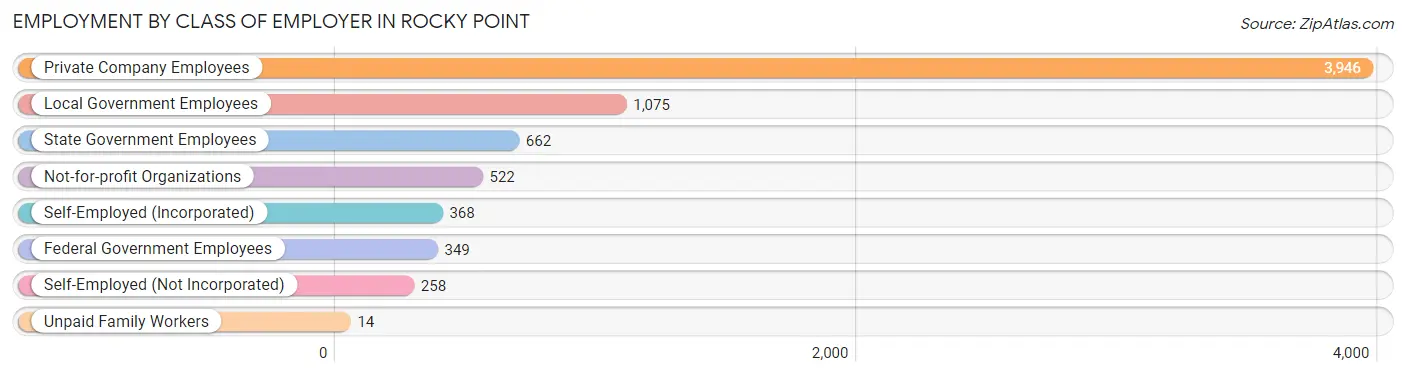
| Employer Class | # Employees | % Employees |
| Private Company Employees | 3,946 | 54.8% |
| Self-Employed (Incorporated) | 368 | 5.1% |
| Self-Employed (Not Incorporated) | 258 | 3.6% |
| Not-for-profit Organizations | 522 | 7.3% |
| Local Government Employees | 1,075 | 14.9% |
| State Government Employees | 662 | 9.2% |
| Federal Government Employees | 349 | 4.9% |
| Unpaid Family Workers | 14 | 0.2% |
| Total | 7,194 | 100.0% |
Employment Status by Age in Rocky Point
According to the labor force statistics for Rocky Point, out of the total population over 16 years of age (10,736), 72.6% or 7,794 individuals are in the labor force, with 6.4% or 499 of them unemployed. The age group with the highest labor force participation rate is 30 to 34 years, with 94.3% or 797 individuals in the labor force. Within the labor force, the 65 to 74 years age range has the highest percentage of unemployed individuals, with 31.7% or 108 of them being unemployed.
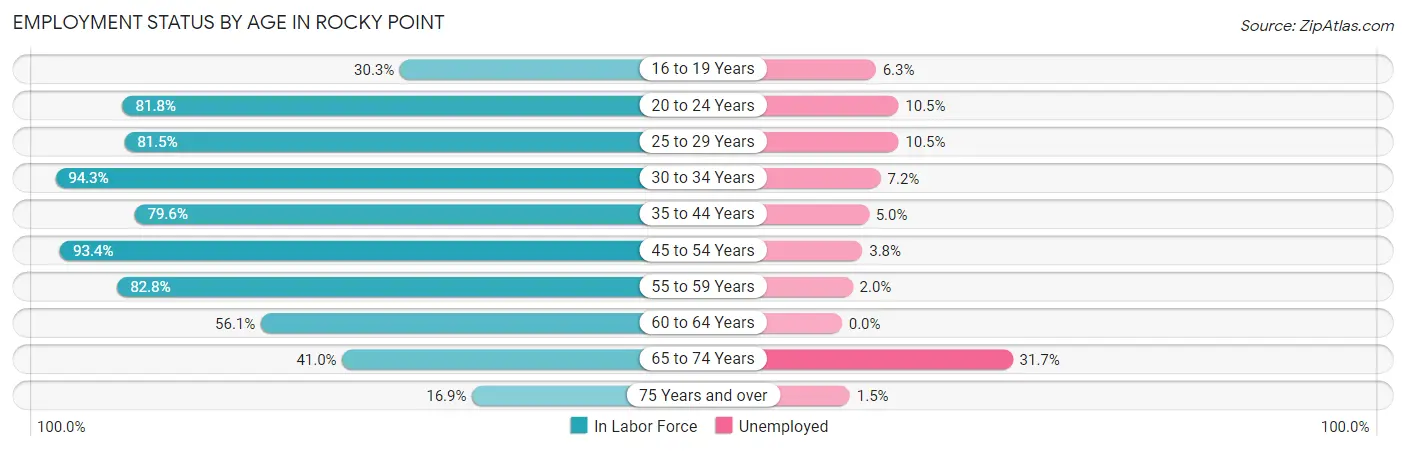
| Age Bracket | In Labor Force | Unemployed |
| 16 to 19 Years | 208 (30.3%) | 13 (6.3%) |
| 20 to 24 Years | 707 (81.8%) | 74 (10.5%) |
| 25 to 29 Years | 711 (81.5%) | 75 (10.5%) |
| 30 to 34 Years | 797 (94.3%) | 57 (7.2%) |
| 35 to 44 Years | 1,212 (79.6%) | 61 (5.0%) |
| 45 to 54 Years | 2,429 (93.4%) | 92 (3.8%) |
| 55 to 59 Years | 882 (82.8%) | 18 (2.0%) |
| 60 to 64 Years | 369 (56.1%) | 0 (0.0%) |
| 65 to 74 Years | 341 (41.0%) | 108 (31.7%) |
| 75 Years and over | 133 (16.9%) | 2 (1.5%) |
| Total | 7,794 (72.6%) | 499 (6.4%) |
Employment Status by Educational Attainment in Rocky Point
According to labor force statistics for Rocky Point, 84.6% of individuals (6,399) out of the total population between 25 and 64 years of age (7,564) are in the labor force, with 4.7% or 301 of them being unemployed. The group with the highest labor force participation rate are those with the educational attainment of bachelor's degree or higher, with 91.7% or 2,786 individuals in the labor force. Within the labor force, individuals with less than high school education have the highest percentage of unemployment, with 33.3% or 67 of them being unemployed.
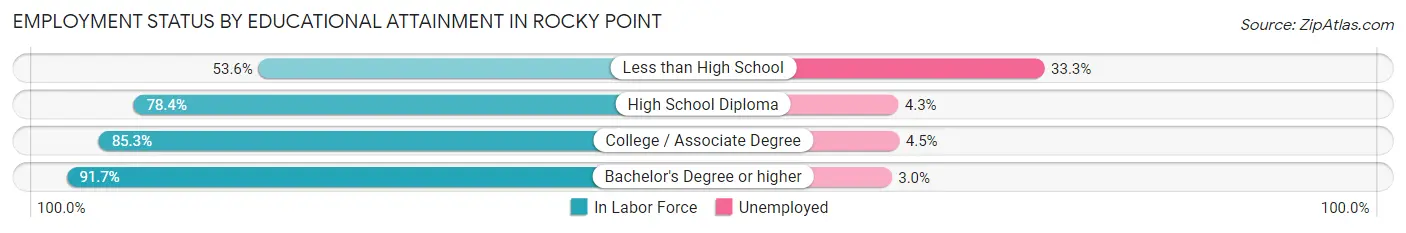
| Educational Attainment | In Labor Force | Unemployed |
| Less than High School | 201 (53.6%) | 125 (33.3%) |
| High School Diploma | 1,430 (78.4%) | 78 (4.3%) |
| College / Associate Degree | 1,985 (85.3%) | 105 (4.5%) |
| Bachelor's Degree or higher | 2,786 (91.7%) | 91 (3.0%) |
| Total | 6,399 (84.6%) | 356 (4.7%) |
Employment Occupations by Sex in Rocky Point
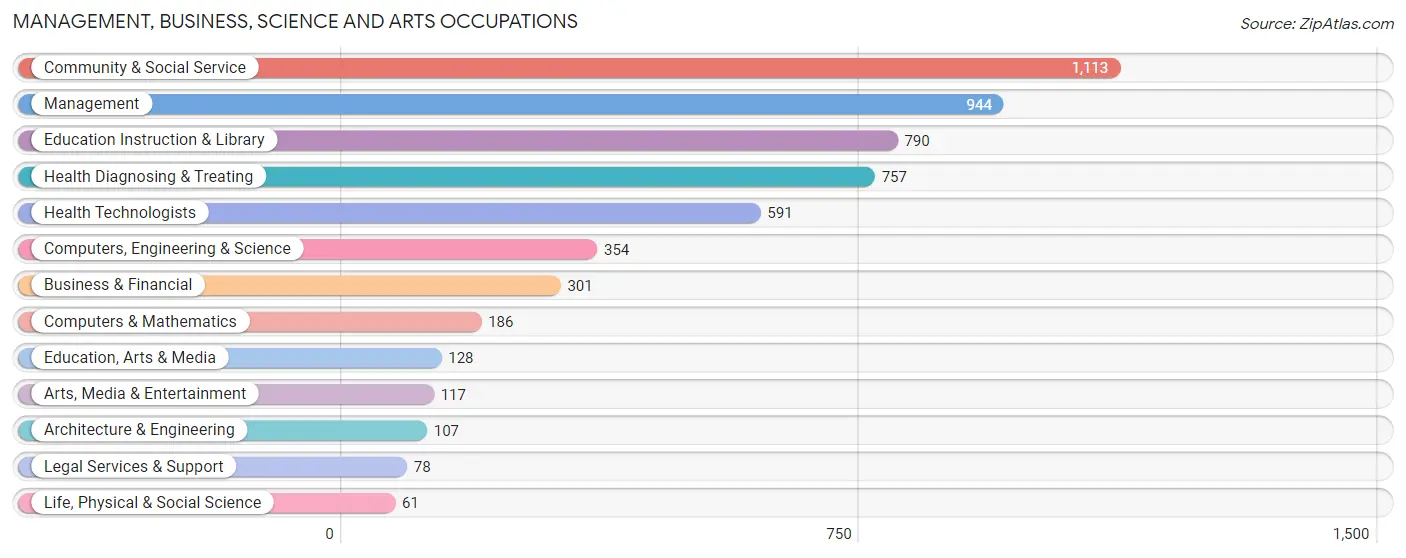
Management, Business, Science and Arts Occupations
The most common Management, Business, Science and Arts occupations in Rocky Point are Community & Social Service (1,113 | 15.3%), Management (944 | 13.0%), Education Instruction & Library (790 | 10.8%), Health Diagnosing & Treating (757 | 10.4%), and Health Technologists (591 | 8.1%).
Management, Business, Science and Arts Occupations by Sex
Within the Management, Business, Science and Arts occupations in Rocky Point, the most male-oriented occupations are Architecture & Engineering (94.4%), Computers, Engineering & Science (81.9%), and Computers & Mathematics (79.0%), while the most female-oriented occupations are Education, Arts & Media (89.1%), Health Diagnosing & Treating (86.5%), and Health Technologists (85.8%).
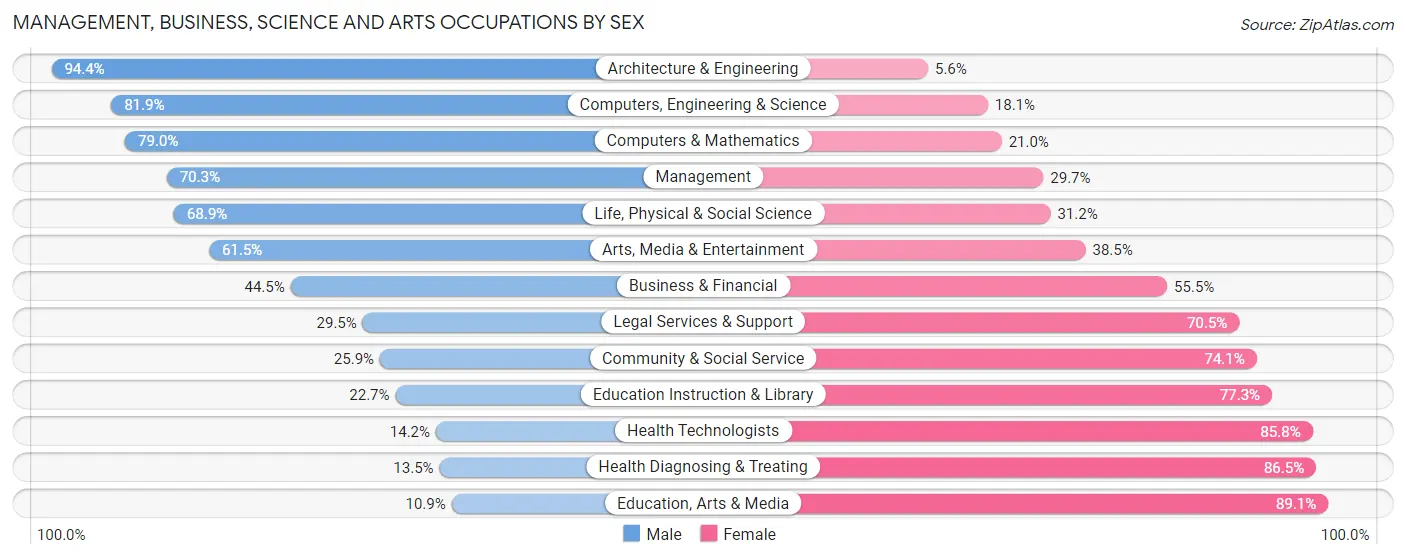
| Occupation | Male | Female |
| Management | 664 (70.3%) | 280 (29.7%) |
| Business & Financial | 134 (44.5%) | 167 (55.5%) |
| Computers, Engineering & Science | 290 (81.9%) | 64 (18.1%) |
| Computers & Mathematics | 147 (79.0%) | 39 (21.0%) |
| Architecture & Engineering | 101 (94.4%) | 6 (5.6%) |
| Life, Physical & Social Science | 42 (68.9%) | 19 (31.1%) |
| Community & Social Service | 288 (25.9%) | 825 (74.1%) |
| Education, Arts & Media | 14 (10.9%) | 114 (89.1%) |
| Legal Services & Support | 23 (29.5%) | 55 (70.5%) |
| Education Instruction & Library | 179 (22.7%) | 611 (77.3%) |
| Arts, Media & Entertainment | 72 (61.5%) | 45 (38.5%) |
| Health Diagnosing & Treating | 102 (13.5%) | 655 (86.5%) |
| Health Technologists | 84 (14.2%) | 507 (85.8%) |
| Total (Category) | 1,478 (42.6%) | 1,991 (57.4%) |
| Total (Overall) | 3,752 (51.5%) | 3,528 (48.5%) |
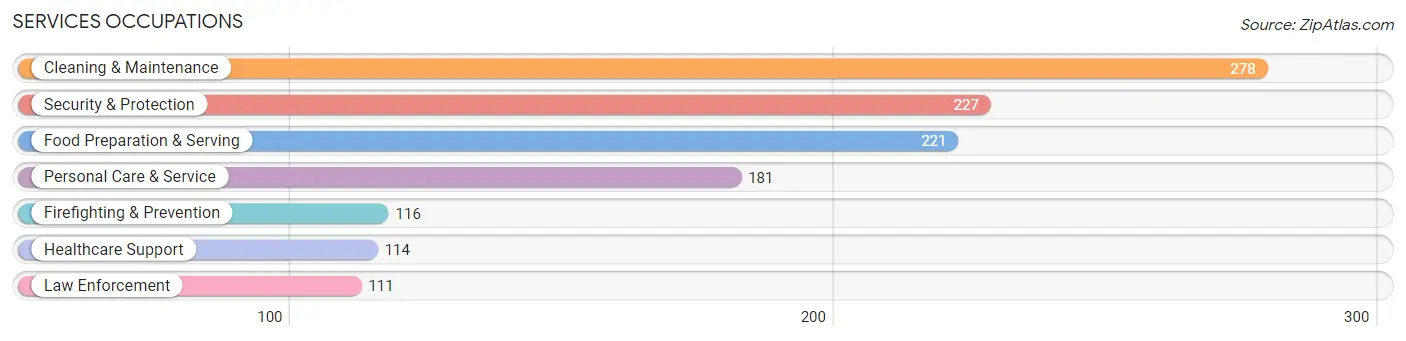
Services Occupations
The most common Services occupations in Rocky Point are Cleaning & Maintenance (278 | 3.8%), Security & Protection (227 | 3.1%), Food Preparation & Serving (221 | 3.0%), Personal Care & Service (181 | 2.5%), and Firefighting & Prevention (116 | 1.6%).
Services Occupations by Sex
Within the Services occupations in Rocky Point, the most male-oriented occupations are Law Enforcement (100.0%), Cleaning & Maintenance (84.9%), and Security & Protection (70.9%), while the most female-oriented occupations are Personal Care & Service (65.2%), Firefighting & Prevention (56.9%), and Healthcare Support (50.9%).
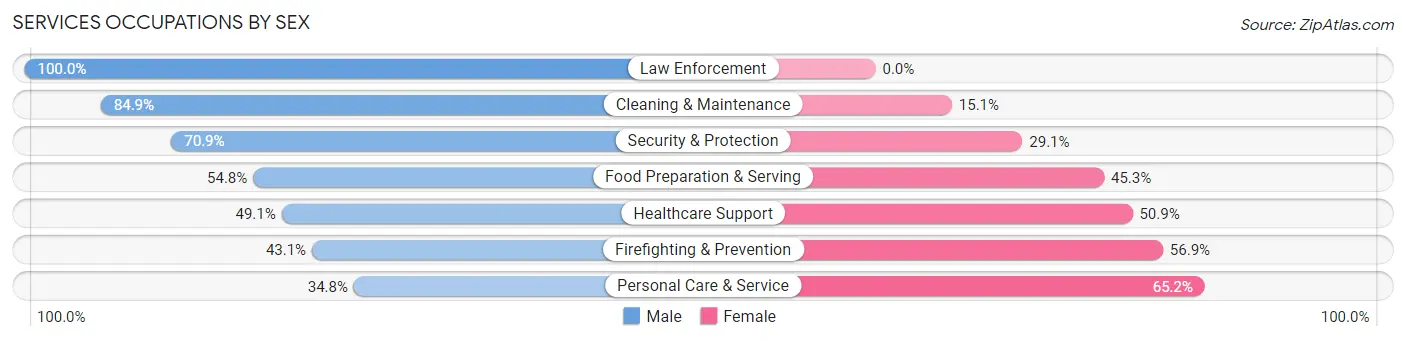
| Occupation | Male | Female |
| Healthcare Support | 56 (49.1%) | 58 (50.9%) |
| Security & Protection | 161 (70.9%) | 66 (29.1%) |
| Firefighting & Prevention | 50 (43.1%) | 66 (56.9%) |
| Law Enforcement | 111 (100.0%) | 0 (0.0%) |
| Food Preparation & Serving | 121 (54.7%) | 100 (45.3%) |
| Cleaning & Maintenance | 236 (84.9%) | 42 (15.1%) |
| Personal Care & Service | 63 (34.8%) | 118 (65.2%) |
| Total (Category) | 637 (62.4%) | 384 (37.6%) |
| Total (Overall) | 3,752 (51.5%) | 3,528 (48.5%) |
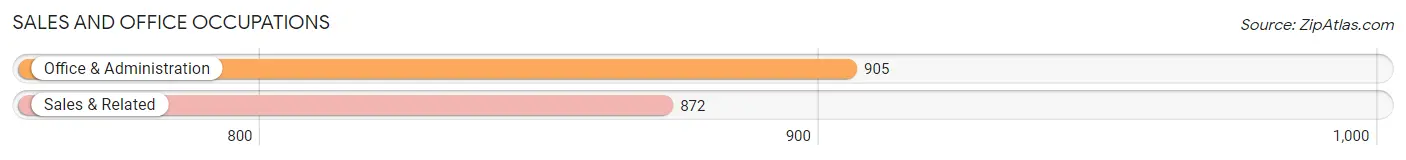
Sales and Office Occupations
The most common Sales and Office occupations in Rocky Point are Office & Administration (905 | 12.4%), and Sales & Related (872 | 12.0%).
Sales and Office Occupations by Sex
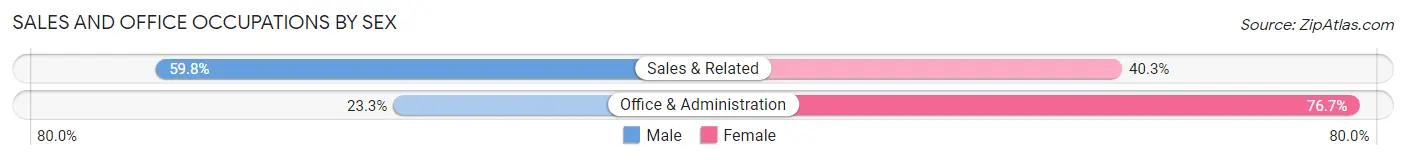
| Occupation | Male | Female |
| Sales & Related | 521 (59.8%) | 351 (40.3%) |
| Office & Administration | 211 (23.3%) | 694 (76.7%) |
| Total (Category) | 732 (41.2%) | 1,045 (58.8%) |
| Total (Overall) | 3,752 (51.5%) | 3,528 (48.5%) |
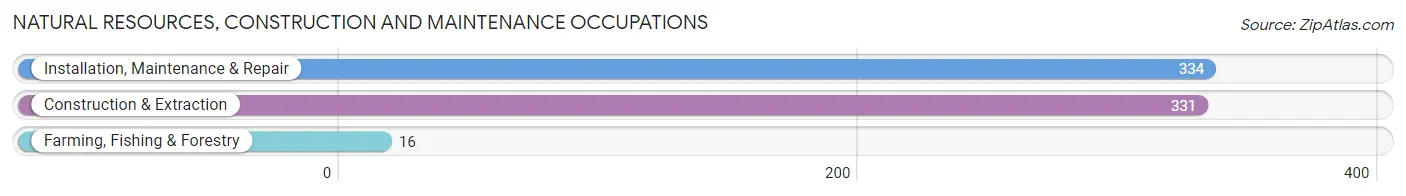
Natural Resources, Construction and Maintenance Occupations
The most common Natural Resources, Construction and Maintenance occupations in Rocky Point are Installation, Maintenance & Repair (334 | 4.6%), Construction & Extraction (331 | 4.5%), and Farming, Fishing & Forestry (16 | 0.2%).
Natural Resources, Construction and Maintenance Occupations by Sex
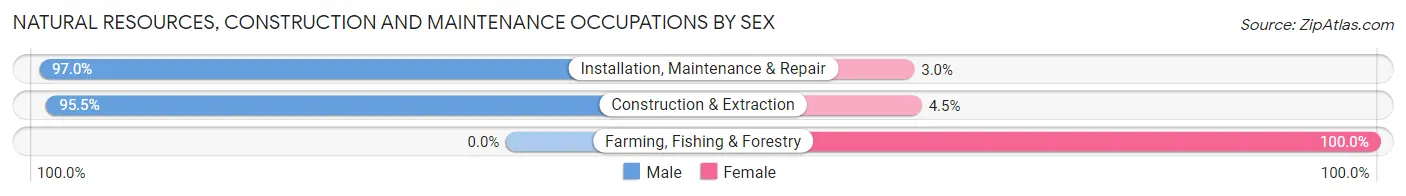
| Occupation | Male | Female |
| Farming, Fishing & Forestry | 0 (0.0%) | 16 (100.0%) |
| Construction & Extraction | 316 (95.5%) | 15 (4.5%) |
| Installation, Maintenance & Repair | 324 (97.0%) | 10 (3.0%) |
| Total (Category) | 640 (94.0%) | 41 (6.0%) |
| Total (Overall) | 3,752 (51.5%) | 3,528 (48.5%) |
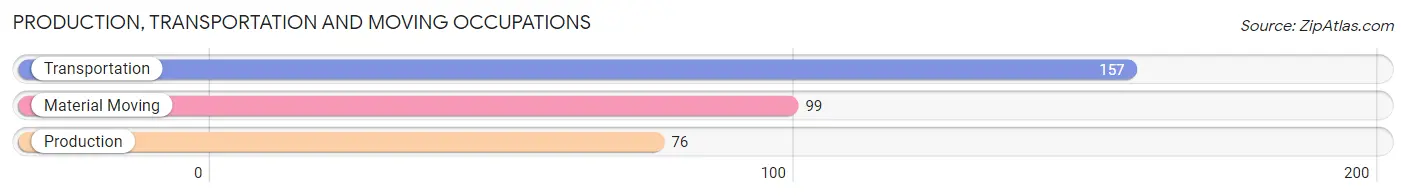
Production, Transportation and Moving Occupations
The most common Production, Transportation and Moving occupations in Rocky Point are Transportation (157 | 2.2%), Material Moving (99 | 1.4%), and Production (76 | 1.0%).
Production, Transportation and Moving Occupations by Sex
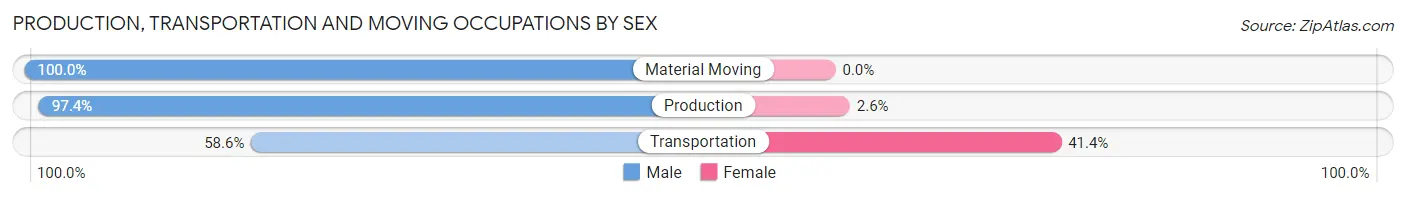
| Occupation | Male | Female |
| Production | 74 (97.4%) | 2 (2.6%) |
| Transportation | 92 (58.6%) | 65 (41.4%) |
| Material Moving | 99 (100.0%) | 0 (0.0%) |
| Total (Category) | 265 (79.8%) | 67 (20.2%) |
| Total (Overall) | 3,752 (51.5%) | 3,528 (48.5%) |
Employment Industries by Sex in Rocky Point
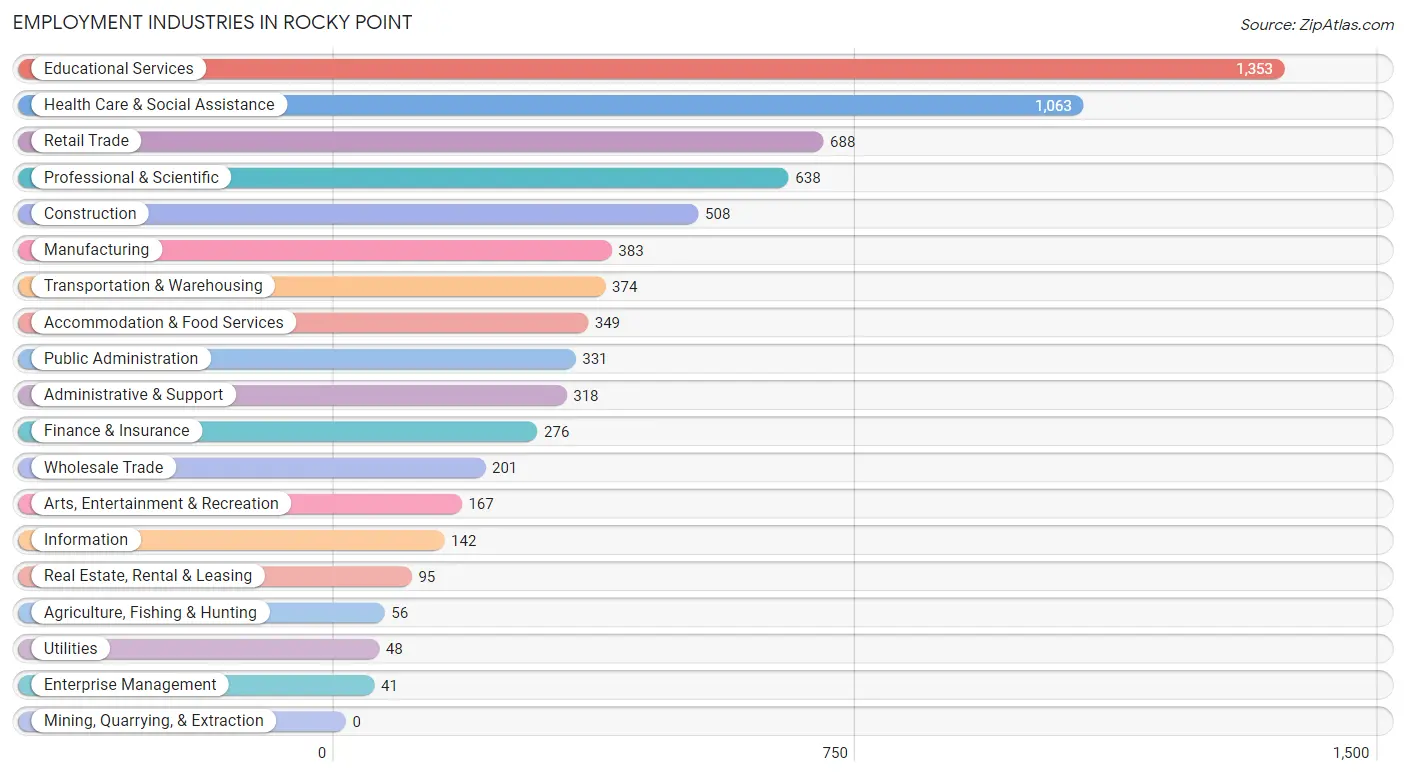
Employment Industries in Rocky Point
The major employment industries in Rocky Point include Educational Services (1,353 | 18.6%), Health Care & Social Assistance (1,063 | 14.6%), Retail Trade (688 | 9.5%), Professional & Scientific (638 | 8.8%), and Construction (508 | 7.0%).
Employment Industries by Sex in Rocky Point
The Rocky Point industries that see more men than women are Utilities (100.0%), Enterprise Management (100.0%), and Construction (86.8%), whereas the industries that tend to have a higher number of women are Agriculture, Fishing & Hunting (100.0%), Health Care & Social Assistance (80.0%), and Educational Services (72.4%).
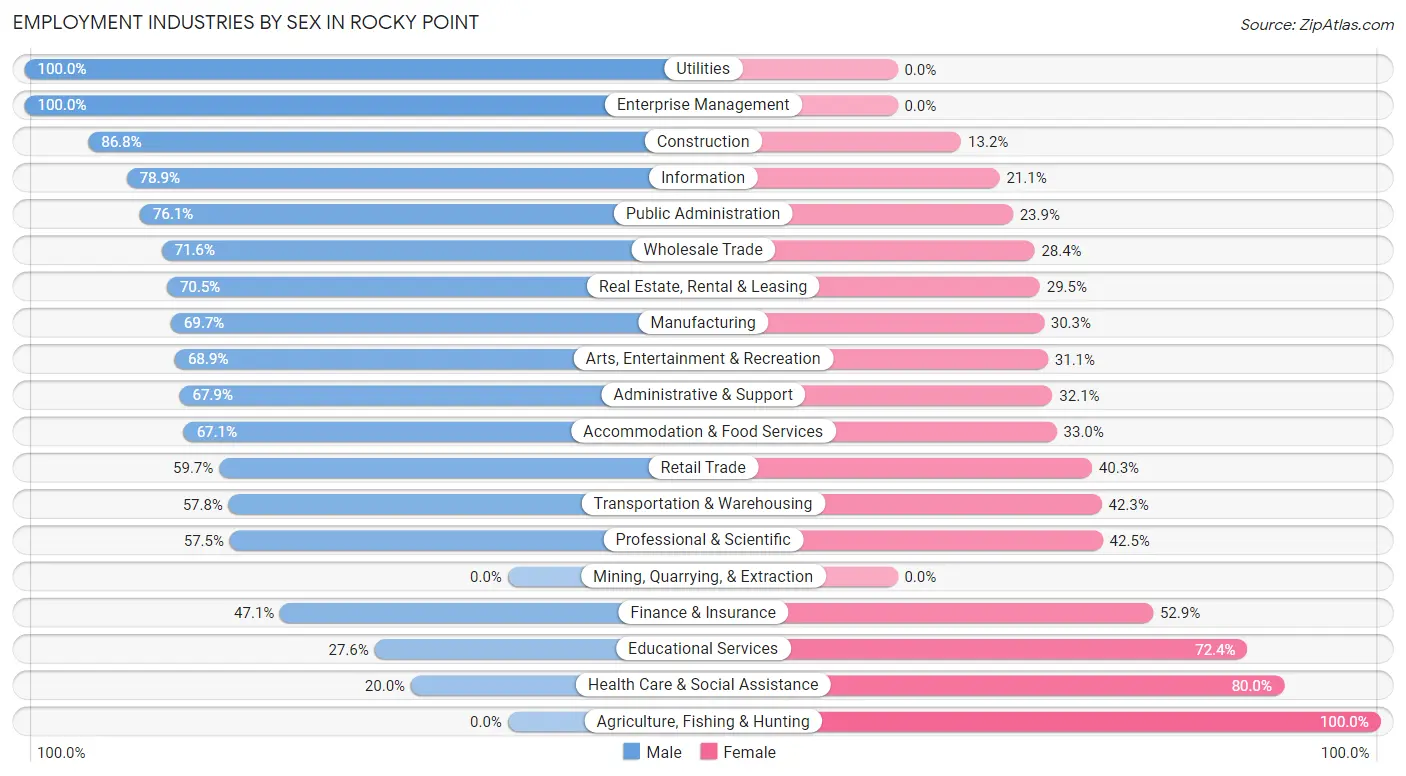
| Industry | Male | Female |
| Agriculture, Fishing & Hunting | 0 (0.0%) | 56 (100.0%) |
| Mining, Quarrying, & Extraction | 0 (0.0%) | 0 (0.0%) |
| Construction | 441 (86.8%) | 67 (13.2%) |
| Manufacturing | 267 (69.7%) | 116 (30.3%) |
| Wholesale Trade | 144 (71.6%) | 57 (28.4%) |
| Retail Trade | 411 (59.7%) | 277 (40.3%) |
| Transportation & Warehousing | 216 (57.8%) | 158 (42.2%) |
| Utilities | 48 (100.0%) | 0 (0.0%) |
| Information | 112 (78.9%) | 30 (21.1%) |
| Finance & Insurance | 130 (47.1%) | 146 (52.9%) |
| Real Estate, Rental & Leasing | 67 (70.5%) | 28 (29.5%) |
| Professional & Scientific | 367 (57.5%) | 271 (42.5%) |
| Enterprise Management | 41 (100.0%) | 0 (0.0%) |
| Administrative & Support | 216 (67.9%) | 102 (32.1%) |
| Educational Services | 373 (27.6%) | 980 (72.4%) |
| Health Care & Social Assistance | 213 (20.0%) | 850 (80.0%) |
| Arts, Entertainment & Recreation | 115 (68.9%) | 52 (31.1%) |
| Accommodation & Food Services | 234 (67.0%) | 115 (33.0%) |
| Public Administration | 252 (76.1%) | 79 (23.9%) |
| Total | 3,752 (51.5%) | 3,528 (48.5%) |
Education in Rocky Point
School Enrollment in Rocky Point
The most common levels of schooling among the 3,538 students in Rocky Point are high school (866 | 24.5%), middle school (846 | 23.9%), and elementary school (563 | 15.9%).
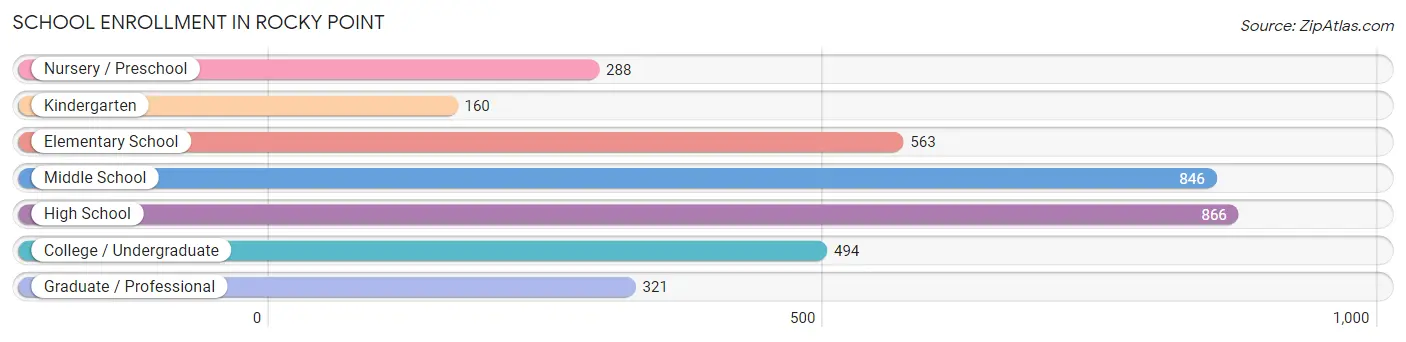
| School Level | # Students | % Students |
| Nursery / Preschool | 288 | 8.1% |
| Kindergarten | 160 | 4.5% |
| Elementary School | 563 | 15.9% |
| Middle School | 846 | 23.9% |
| High School | 866 | 24.5% |
| College / Undergraduate | 494 | 14.0% |
| Graduate / Professional | 321 | 9.1% |
| Total | 3,538 | 100.0% |
School Enrollment by Age by Funding Source in Rocky Point
Out of a total of 3,538 students who are enrolled in schools in Rocky Point, 538 (15.2%) attend a private institution, while the remaining 3,000 (84.8%) are enrolled in public schools. The age group of 35 years and over has the highest likelihood of being enrolled in private schools, with 139 (76.0% in the age bracket) enrolled. Conversely, the age group of 15 to 17 year olds has the lowest likelihood of being enrolled in a private school, with 490 (100.0% in the age bracket) attending a public institution.
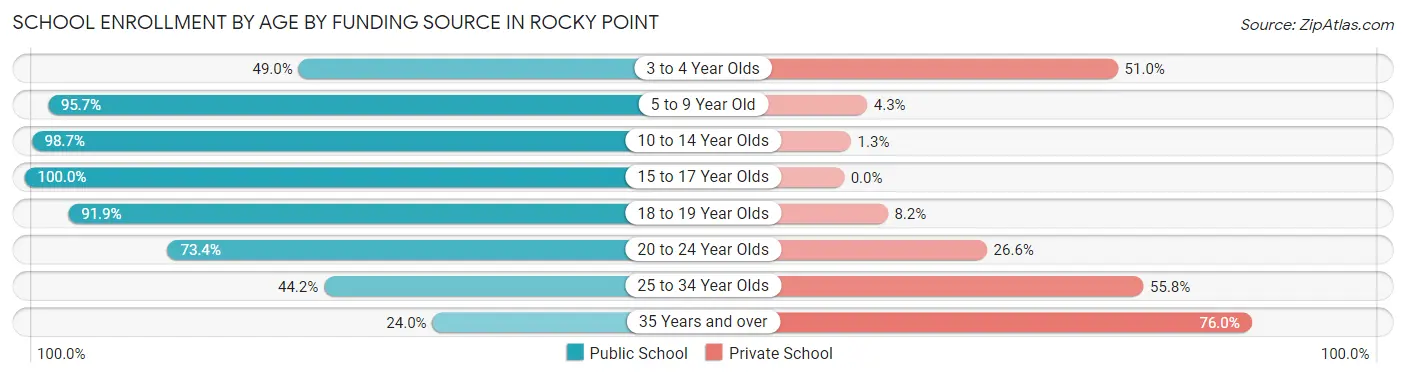
| Age Bracket | Public School | Private School |
| 3 to 4 Year Olds | 143 (49.0%) | 149 (51.0%) |
| 5 to 9 Year Old | 686 (95.7%) | 31 (4.3%) |
| 10 to 14 Year Olds | 987 (98.7%) | 13 (1.3%) |
| 15 to 17 Year Olds | 490 (100.0%) | 0 (0.0%) |
| 18 to 19 Year Olds | 327 (91.8%) | 29 (8.2%) |
| 20 to 24 Year Olds | 259 (73.4%) | 94 (26.6%) |
| 25 to 34 Year Olds | 65 (44.2%) | 82 (55.8%) |
| 35 Years and over | 44 (24.0%) | 139 (76.0%) |
| Total | 3,000 (84.8%) | 538 (15.2%) |
Educational Attainment by Field of Study in Rocky Point
Business (660 | 18.4%), education (656 | 18.3%), science & technology (595 | 16.6%), arts & humanities (293 | 8.2%), and bio, nature & agricultural (215 | 6.0%) are the most common fields of study among 3,587 individuals in Rocky Point who have obtained a bachelor's degree or higher.
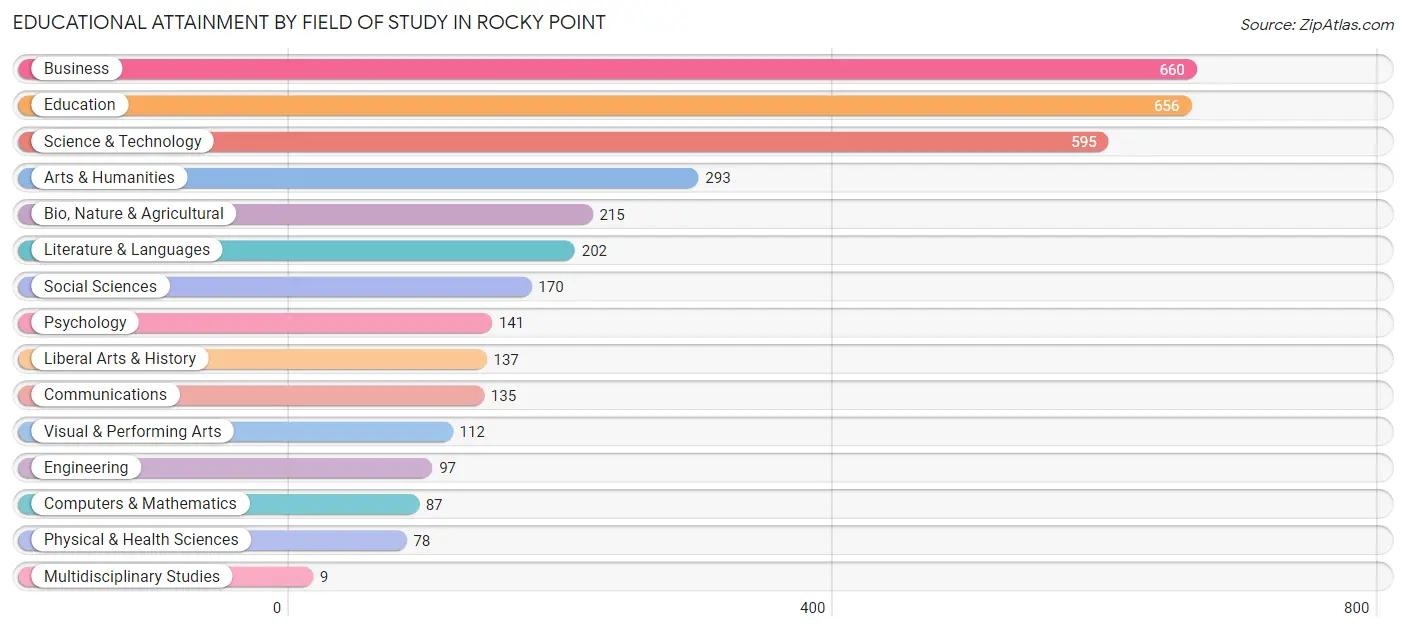
| Field of Study | # Graduates | % Graduates |
| Computers & Mathematics | 87 | 2.4% |
| Bio, Nature & Agricultural | 215 | 6.0% |
| Physical & Health Sciences | 78 | 2.2% |
| Psychology | 141 | 3.9% |
| Social Sciences | 170 | 4.7% |
| Engineering | 97 | 2.7% |
| Multidisciplinary Studies | 9 | 0.3% |
| Science & Technology | 595 | 16.6% |
| Business | 660 | 18.4% |
| Education | 656 | 18.3% |
| Literature & Languages | 202 | 5.6% |
| Liberal Arts & History | 137 | 3.8% |
| Visual & Performing Arts | 112 | 3.1% |
| Communications | 135 | 3.8% |
| Arts & Humanities | 293 | 8.2% |
| Total | 3,587 | 100.0% |
Transportation & Commute in Rocky Point
Vehicle Availability by Sex in Rocky Point
The most prevalent vehicle ownership categories in Rocky Point are males with 2 vehicles (1,906, accounting for 51.0%) and females with 2 vehicles (1,422, making up 55.2%).
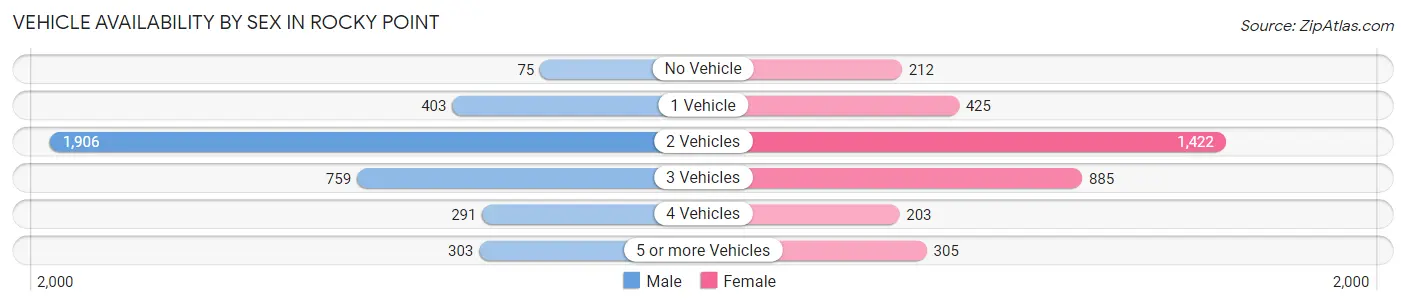
| Vehicles Available | Male | Female |
| No Vehicle | 75 (2.0%) | 212 (6.1%) |
| 1 Vehicle | 403 (10.8%) | 425 (12.3%) |
| 2 Vehicles | 1,906 (51.0%) | 1,422 (41.2%) |
| 3 Vehicles | 759 (20.3%) | 885 (25.6%) |
| 4 Vehicles | 291 (7.8%) | 203 (5.9%) |
| 5 or more Vehicles | 303 (8.1%) | 305 (8.8%) |
| Total | 3,737 (100.0%) | 3,452 (100.0%) |
Commute Time in Rocky Point
The most frequently occuring commute durations in Rocky Point are 30 to 34 minutes (1,367 commuters, 20.2%), 25 to 29 minutes (768 commuters, 11.4%), and 60 to 89 minutes (759 commuters, 11.2%).
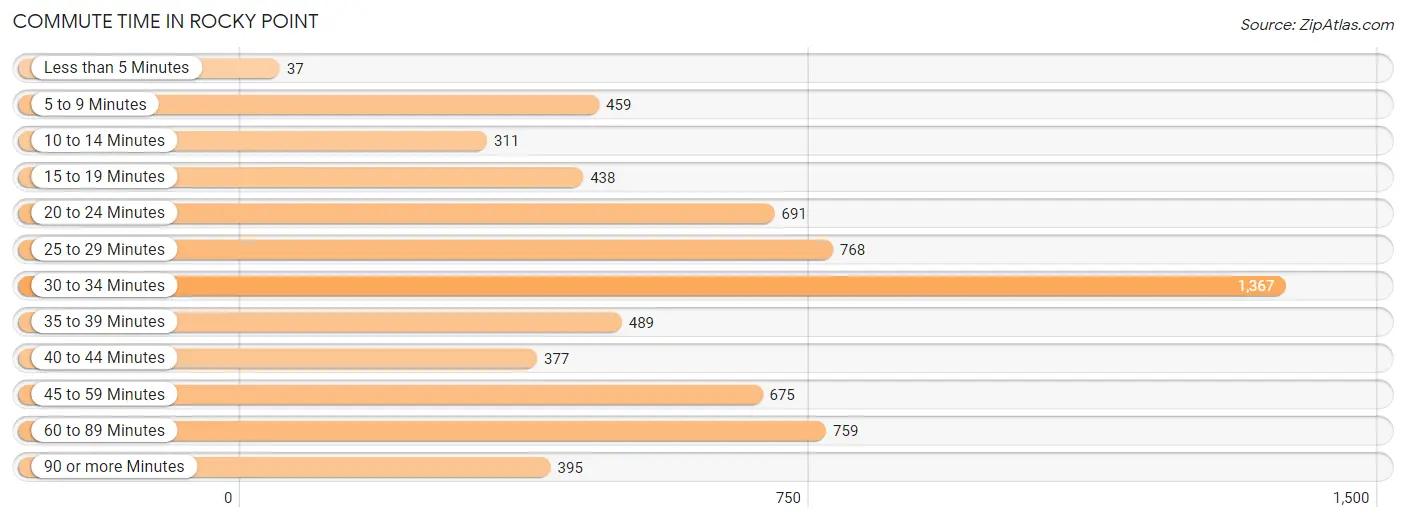
| Commute Time | # Commuters | % Commuters |
| Less than 5 Minutes | 37 | 0.5% |
| 5 to 9 Minutes | 459 | 6.8% |
| 10 to 14 Minutes | 311 | 4.6% |
| 15 to 19 Minutes | 438 | 6.5% |
| 20 to 24 Minutes | 691 | 10.2% |
| 25 to 29 Minutes | 768 | 11.4% |
| 30 to 34 Minutes | 1,367 | 20.2% |
| 35 to 39 Minutes | 489 | 7.2% |
| 40 to 44 Minutes | 377 | 5.6% |
| 45 to 59 Minutes | 675 | 10.0% |
| 60 to 89 Minutes | 759 | 11.2% |
| 90 or more Minutes | 395 | 5.8% |
Commute Time by Sex in Rocky Point
The most common commute times in Rocky Point are 30 to 34 minutes (881 commuters, 24.4%) for males and 30 to 34 minutes (486 commuters, 15.4%) for females.
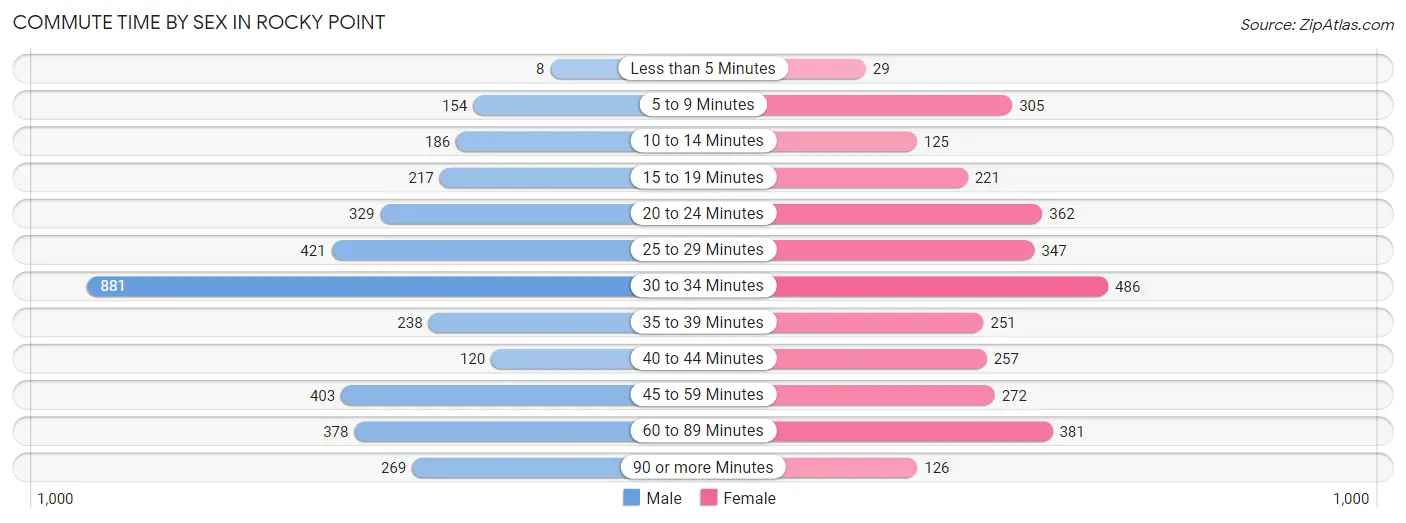
| Commute Time | Male | Female |
| Less than 5 Minutes | 8 (0.2%) | 29 (0.9%) |
| 5 to 9 Minutes | 154 (4.3%) | 305 (9.7%) |
| 10 to 14 Minutes | 186 (5.2%) | 125 (4.0%) |
| 15 to 19 Minutes | 217 (6.0%) | 221 (7.0%) |
| 20 to 24 Minutes | 329 (9.1%) | 362 (11.5%) |
| 25 to 29 Minutes | 421 (11.7%) | 347 (11.0%) |
| 30 to 34 Minutes | 881 (24.4%) | 486 (15.4%) |
| 35 to 39 Minutes | 238 (6.6%) | 251 (7.9%) |
| 40 to 44 Minutes | 120 (3.3%) | 257 (8.1%) |
| 45 to 59 Minutes | 403 (11.2%) | 272 (8.6%) |
| 60 to 89 Minutes | 378 (10.5%) | 381 (12.0%) |
| 90 or more Minutes | 269 (7.5%) | 126 (4.0%) |
Time of Departure to Work by Sex in Rocky Point
The most frequent times of departure to work in Rocky Point are 7:00 AM to 7:29 AM (584, 16.2%) for males and 8:00 AM to 8:29 AM (598, 18.9%) for females.
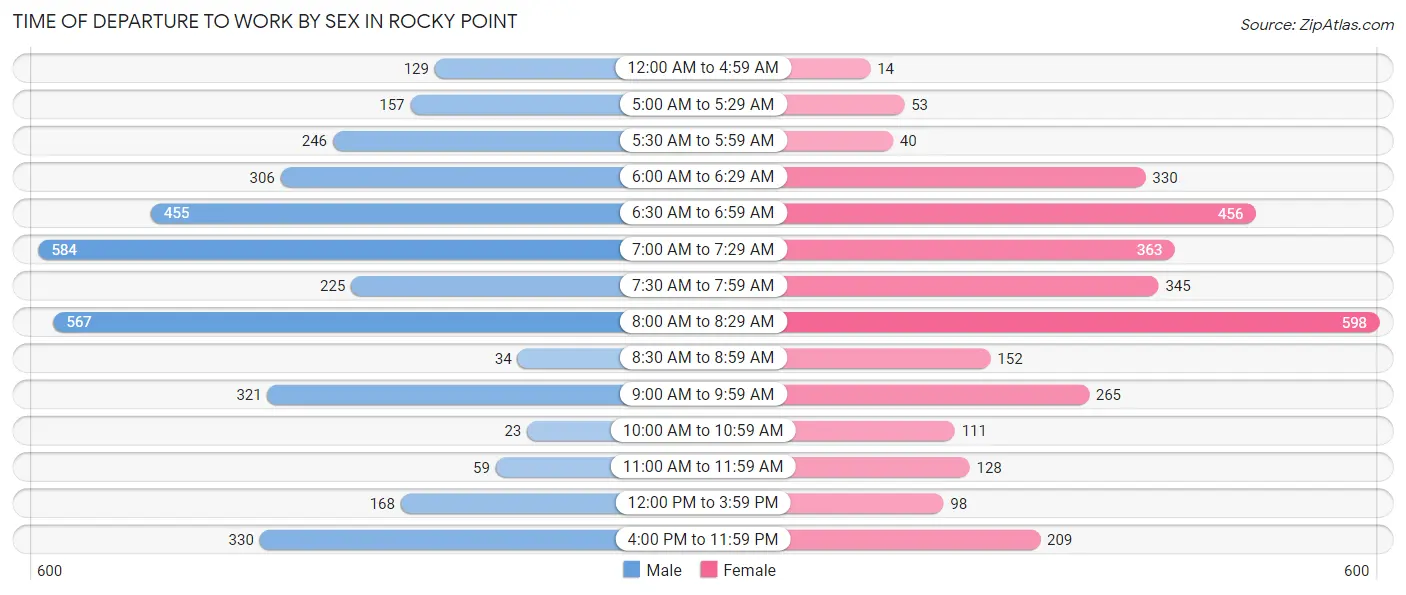
| Time of Departure | Male | Female |
| 12:00 AM to 4:59 AM | 129 (3.6%) | 14 (0.4%) |
| 5:00 AM to 5:29 AM | 157 (4.4%) | 53 (1.7%) |
| 5:30 AM to 5:59 AM | 246 (6.8%) | 40 (1.3%) |
| 6:00 AM to 6:29 AM | 306 (8.5%) | 330 (10.4%) |
| 6:30 AM to 6:59 AM | 455 (12.6%) | 456 (14.4%) |
| 7:00 AM to 7:29 AM | 584 (16.2%) | 363 (11.5%) |
| 7:30 AM to 7:59 AM | 225 (6.2%) | 345 (10.9%) |
| 8:00 AM to 8:29 AM | 567 (15.7%) | 598 (18.9%) |
| 8:30 AM to 8:59 AM | 34 (0.9%) | 152 (4.8%) |
| 9:00 AM to 9:59 AM | 321 (8.9%) | 265 (8.4%) |
| 10:00 AM to 10:59 AM | 23 (0.6%) | 111 (3.5%) |
| 11:00 AM to 11:59 AM | 59 (1.6%) | 128 (4.1%) |
| 12:00 PM to 3:59 PM | 168 (4.7%) | 98 (3.1%) |
| 4:00 PM to 11:59 PM | 330 (9.2%) | 209 (6.6%) |
| Total | 3,604 (100.0%) | 3,162 (100.0%) |
Housing Occupancy in Rocky Point
Occupancy by Ownership in Rocky Point
Of the total 5,003 dwellings in Rocky Point, owner-occupied units account for 4,625 (92.4%), while renter-occupied units make up 378 (7.6%).
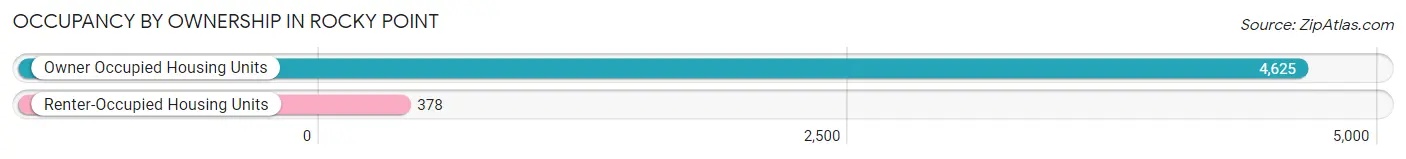
| Occupancy | # Housing Units | % Housing Units |
| Owner Occupied Housing Units | 4,625 | 92.4% |
| Renter-Occupied Housing Units | 378 | 7.6% |
| Total Occupied Housing Units | 5,003 | 100.0% |
Occupancy by Household Size in Rocky Point
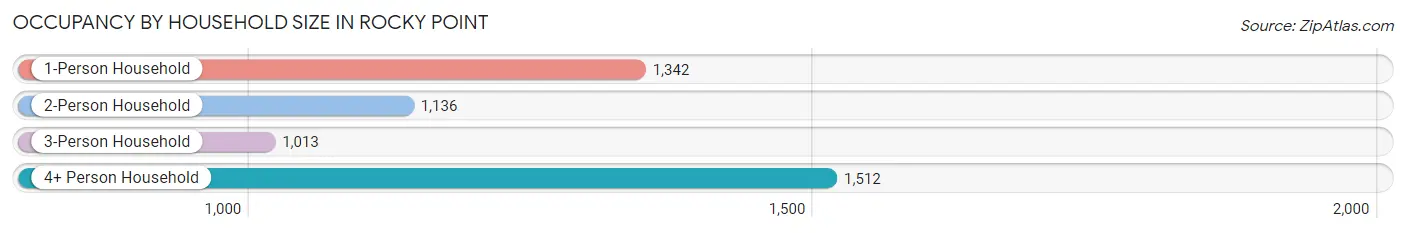
| Household Size | # Housing Units | % Housing Units |
| 1-Person Household | 1,342 | 26.8% |
| 2-Person Household | 1,136 | 22.7% |
| 3-Person Household | 1,013 | 20.3% |
| 4+ Person Household | 1,512 | 30.2% |
| Total Housing Units | 5,003 | 100.0% |
Occupancy by Ownership by Household Size in Rocky Point
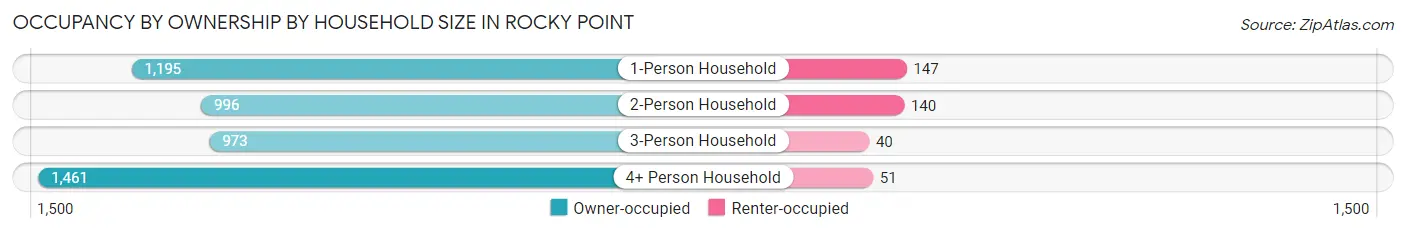
| Household Size | Owner-occupied | Renter-occupied |
| 1-Person Household | 1,195 (89.0%) | 147 (11.0%) |
| 2-Person Household | 996 (87.7%) | 140 (12.3%) |
| 3-Person Household | 973 (96.1%) | 40 (4.0%) |
| 4+ Person Household | 1,461 (96.6%) | 51 (3.4%) |
| Total Housing Units | 4,625 (92.4%) | 378 (7.6%) |
Occupancy by Educational Attainment in Rocky Point
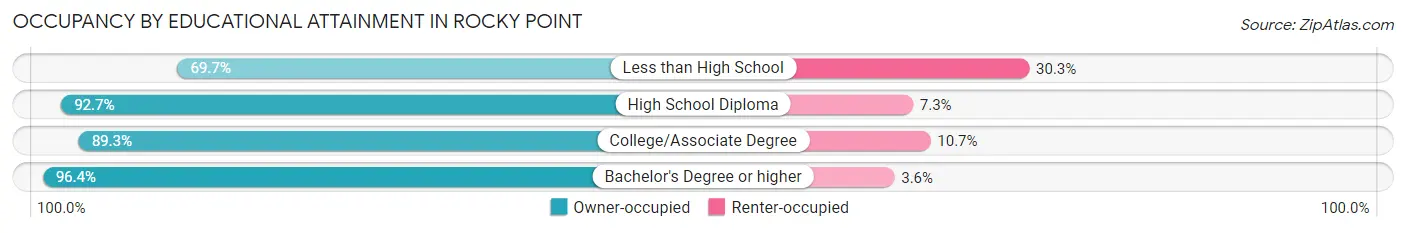
| Household Size | Owner-occupied | Renter-occupied |
| Less than High School | 108 (69.7%) | 47 (30.3%) |
| High School Diploma | 1,136 (92.7%) | 89 (7.3%) |
| College/Associate Degree | 1,396 (89.3%) | 168 (10.7%) |
| Bachelor's Degree or higher | 1,985 (96.4%) | 74 (3.6%) |
Occupancy by Age of Householder in Rocky Point
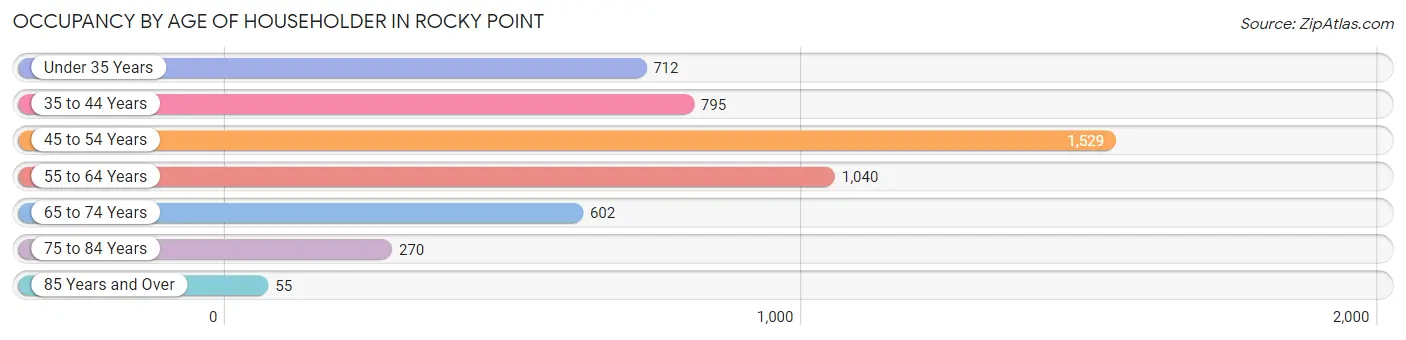
| Age Bracket | # Households | % Households |
| Under 35 Years | 712 | 14.2% |
| 35 to 44 Years | 795 | 15.9% |
| 45 to 54 Years | 1,529 | 30.6% |
| 55 to 64 Years | 1,040 | 20.8% |
| 65 to 74 Years | 602 | 12.0% |
| 75 to 84 Years | 270 | 5.4% |
| 85 Years and Over | 55 | 1.1% |
| Total | 5,003 | 100.0% |
Housing Finances in Rocky Point
Median Income by Occupancy in Rocky Point
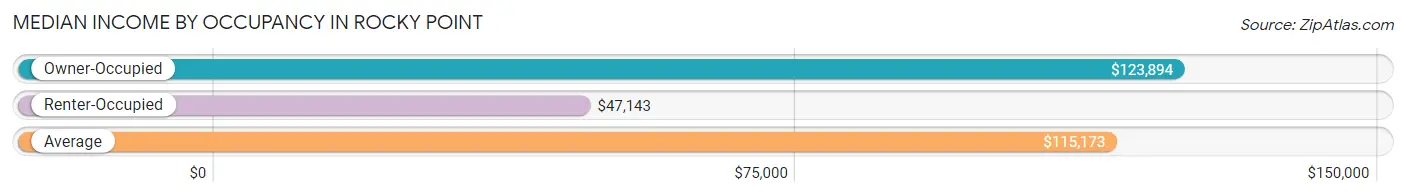
| Occupancy Type | # Households | Median Income |
| Owner-Occupied | 4,625 (92.4%) | $123,894 |
| Renter-Occupied | 378 (7.6%) | $47,143 |
| Average | 5,003 (100.0%) | $115,173 |
Occupancy by Householder Income Bracket in Rocky Point
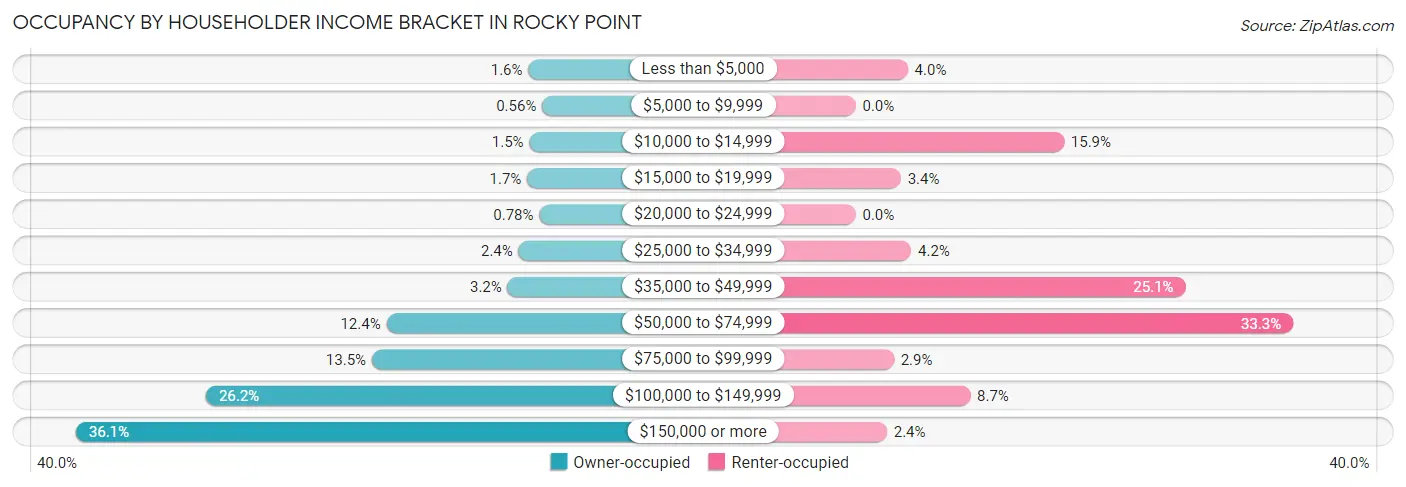
| Income Bracket | Owner-occupied | Renter-occupied |
| Less than $5,000 | 75 (1.6%) | 15 (4.0%) |
| $5,000 to $9,999 | 26 (0.6%) | 0 (0.0%) |
| $10,000 to $14,999 | 71 (1.5%) | 60 (15.9%) |
| $15,000 to $19,999 | 79 (1.7%) | 13 (3.4%) |
| $20,000 to $24,999 | 36 (0.8%) | 0 (0.0%) |
| $25,000 to $34,999 | 109 (2.4%) | 16 (4.2%) |
| $35,000 to $49,999 | 148 (3.2%) | 95 (25.1%) |
| $50,000 to $74,999 | 575 (12.4%) | 126 (33.3%) |
| $75,000 to $99,999 | 626 (13.5%) | 11 (2.9%) |
| $100,000 to $149,999 | 1,211 (26.2%) | 33 (8.7%) |
| $150,000 or more | 1,669 (36.1%) | 9 (2.4%) |
| Total | 4,625 (100.0%) | 378 (100.0%) |
Monthly Housing Cost Tiers in Rocky Point
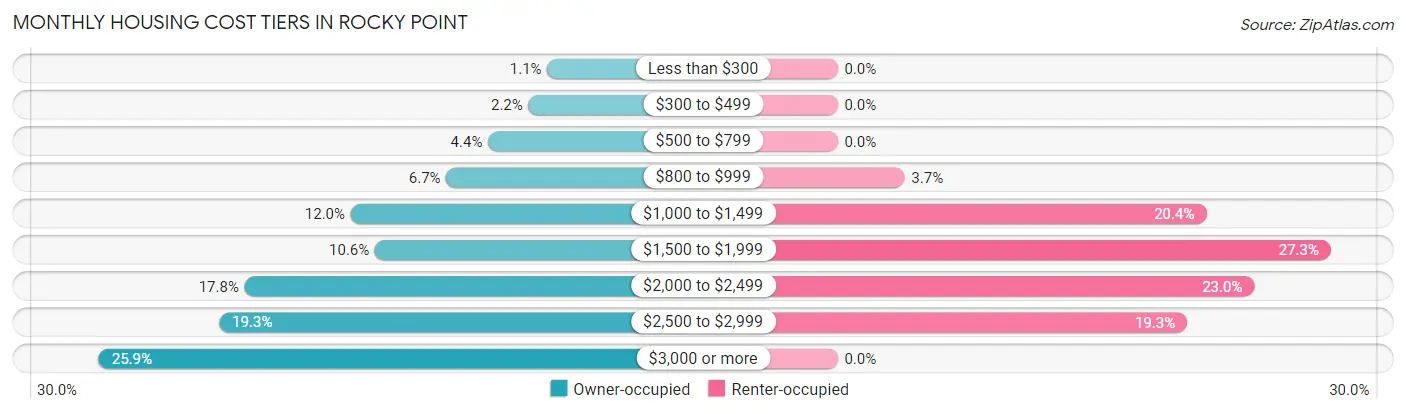
| Monthly Cost | Owner-occupied | Renter-occupied |
| Less than $300 | 52 (1.1%) | 0 (0.0%) |
| $300 to $499 | 100 (2.2%) | 0 (0.0%) |
| $500 to $799 | 203 (4.4%) | 0 (0.0%) |
| $800 to $999 | 310 (6.7%) | 14 (3.7%) |
| $1,000 to $1,499 | 554 (12.0%) | 77 (20.4%) |
| $1,500 to $1,999 | 492 (10.6%) | 103 (27.3%) |
| $2,000 to $2,499 | 825 (17.8%) | 87 (23.0%) |
| $2,500 to $2,999 | 891 (19.3%) | 73 (19.3%) |
| $3,000 or more | 1,198 (25.9%) | 0 (0.0%) |
| Total | 4,625 (100.0%) | 378 (100.0%) |
Physical Housing Characteristics in Rocky Point
Housing Structures in Rocky Point
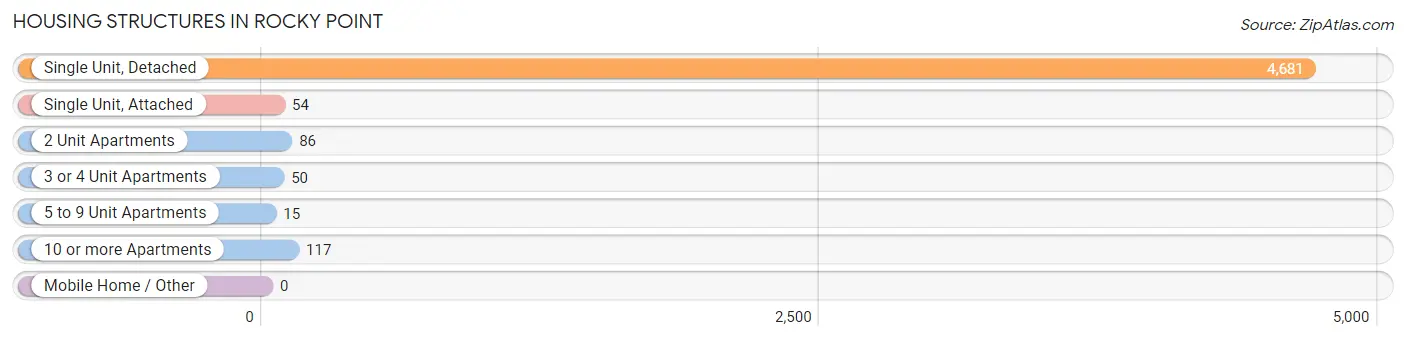
| Structure Type | # Housing Units | % Housing Units |
| Single Unit, Detached | 4,681 | 93.6% |
| Single Unit, Attached | 54 | 1.1% |
| 2 Unit Apartments | 86 | 1.7% |
| 3 or 4 Unit Apartments | 50 | 1.0% |
| 5 to 9 Unit Apartments | 15 | 0.3% |
| 10 or more Apartments | 117 | 2.3% |
| Mobile Home / Other | 0 | 0.0% |
| Total | 5,003 | 100.0% |
Housing Structures by Occupancy in Rocky Point
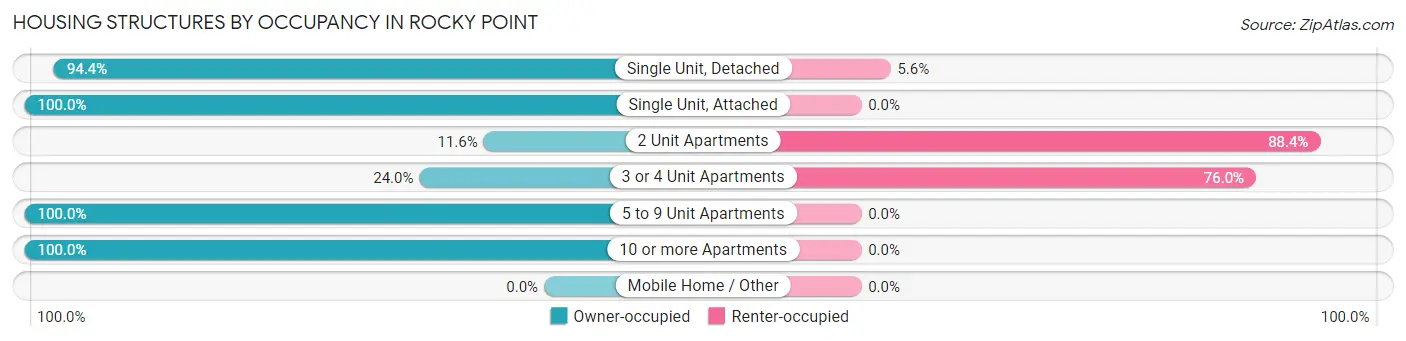
| Structure Type | Owner-occupied | Renter-occupied |
| Single Unit, Detached | 4,417 (94.4%) | 264 (5.6%) |
| Single Unit, Attached | 54 (100.0%) | 0 (0.0%) |
| 2 Unit Apartments | 10 (11.6%) | 76 (88.4%) |
| 3 or 4 Unit Apartments | 12 (24.0%) | 38 (76.0%) |
| 5 to 9 Unit Apartments | 15 (100.0%) | 0 (0.0%) |
| 10 or more Apartments | 117 (100.0%) | 0 (0.0%) |
| Mobile Home / Other | 0 (0.0%) | 0 (0.0%) |
| Total | 4,625 (92.4%) | 378 (7.6%) |
Housing Structures by Number of Rooms in Rocky Point
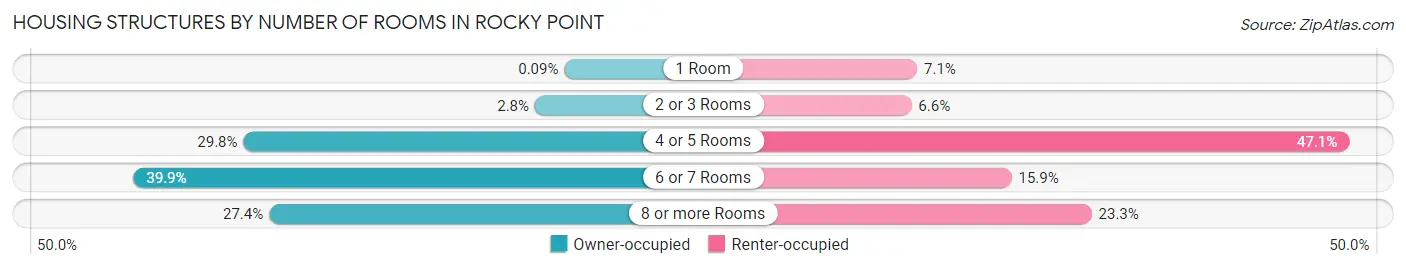
| Number of Rooms | Owner-occupied | Renter-occupied |
| 1 Room | 4 (0.1%) | 27 (7.1%) |
| 2 or 3 Rooms | 130 (2.8%) | 25 (6.6%) |
| 4 or 5 Rooms | 1,377 (29.8%) | 178 (47.1%) |
| 6 or 7 Rooms | 1,847 (39.9%) | 60 (15.9%) |
| 8 or more Rooms | 1,267 (27.4%) | 88 (23.3%) |
| Total | 4,625 (100.0%) | 378 (100.0%) |
Housing Structure by Heating Type in Rocky Point
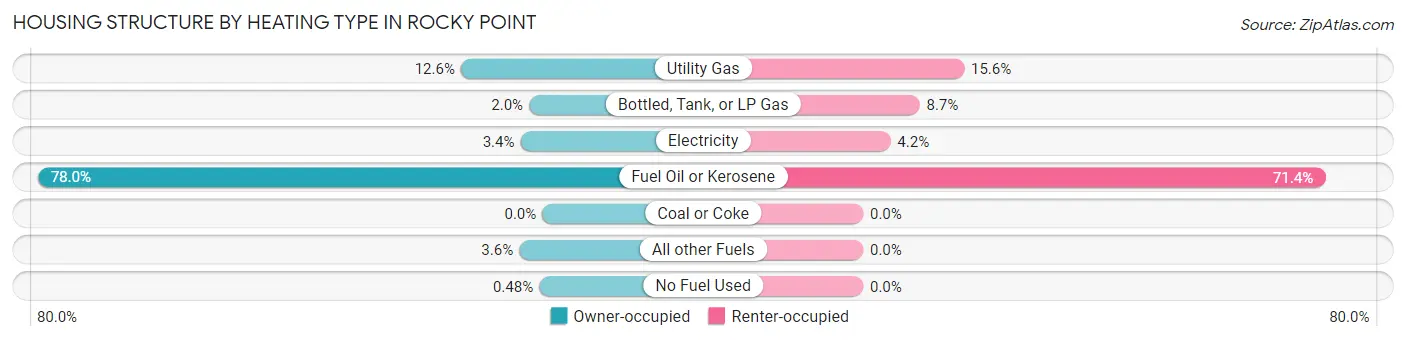
| Heating Type | Owner-occupied | Renter-occupied |
| Utility Gas | 582 (12.6%) | 59 (15.6%) |
| Bottled, Tank, or LP Gas | 94 (2.0%) | 33 (8.7%) |
| Electricity | 156 (3.4%) | 16 (4.2%) |
| Fuel Oil or Kerosene | 3,606 (78.0%) | 270 (71.4%) |
| Coal or Coke | 0 (0.0%) | 0 (0.0%) |
| All other Fuels | 165 (3.6%) | 0 (0.0%) |
| No Fuel Used | 22 (0.5%) | 0 (0.0%) |
| Total | 4,625 (100.0%) | 378 (100.0%) |
Household Vehicle Usage in Rocky Point
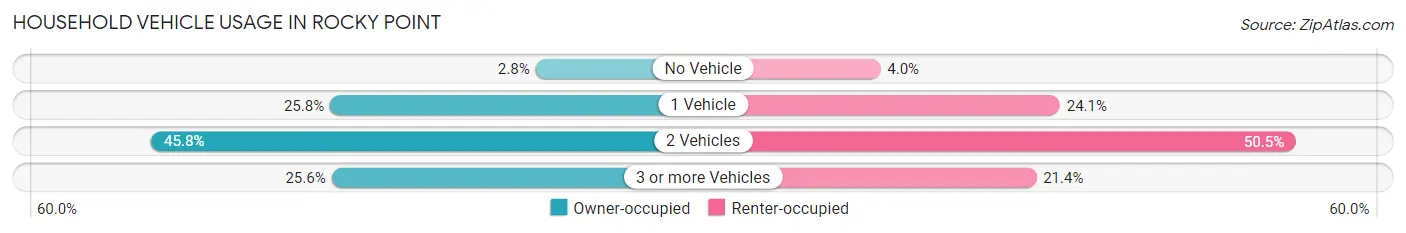
| Vehicles per Household | Owner-occupied | Renter-occupied |
| No Vehicle | 128 (2.8%) | 15 (4.0%) |
| 1 Vehicle | 1,193 (25.8%) | 91 (24.1%) |
| 2 Vehicles | 2,119 (45.8%) | 191 (50.5%) |
| 3 or more Vehicles | 1,185 (25.6%) | 81 (21.4%) |
| Total | 4,625 (100.0%) | 378 (100.0%) |
Real Estate & Mortgages in Rocky Point
Real Estate and Mortgage Overview in Rocky Point
| Characteristic | Without Mortgage | With Mortgage |
| Housing Units | 1,265 | 3,360 |
| Median Property Value | $365,400 | $390,400 |
| Median Household Income | $91,495 | $1,379 |
| Monthly Housing Costs | $1,061 | $1,191 |
| Real Estate Taxes | $7,751 | $46 |
Property Value by Mortgage Status in Rocky Point
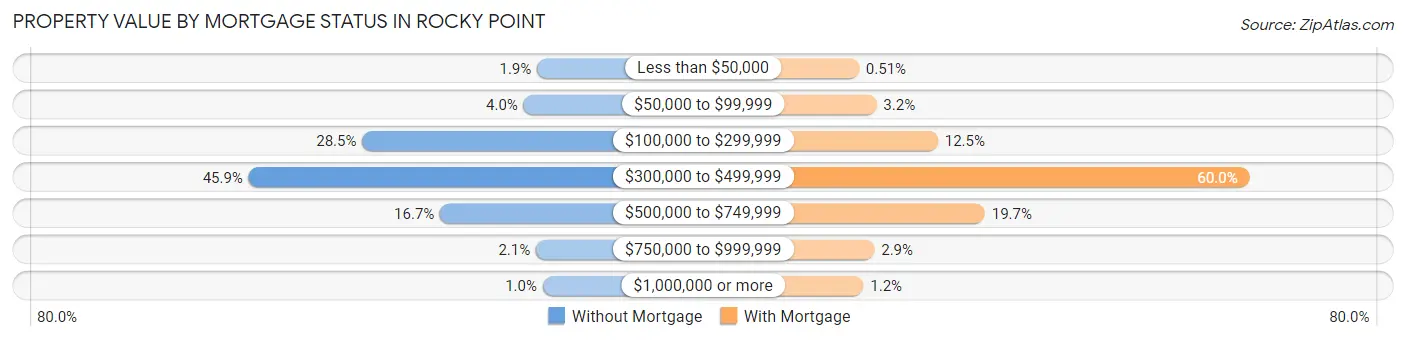
| Property Value | Without Mortgage | With Mortgage |
| Less than $50,000 | 24 (1.9%) | 17 (0.5%) |
| $50,000 to $99,999 | 50 (4.0%) | 107 (3.2%) |
| $100,000 to $299,999 | 361 (28.5%) | 421 (12.5%) |
| $300,000 to $499,999 | 580 (45.9%) | 2,017 (60.0%) |
| $500,000 to $749,999 | 211 (16.7%) | 662 (19.7%) |
| $750,000 to $999,999 | 26 (2.1%) | 96 (2.9%) |
| $1,000,000 or more | 13 (1.0%) | 40 (1.2%) |
| Total | 1,265 (100.0%) | 3,360 (100.0%) |
Household Income by Mortgage Status in Rocky Point
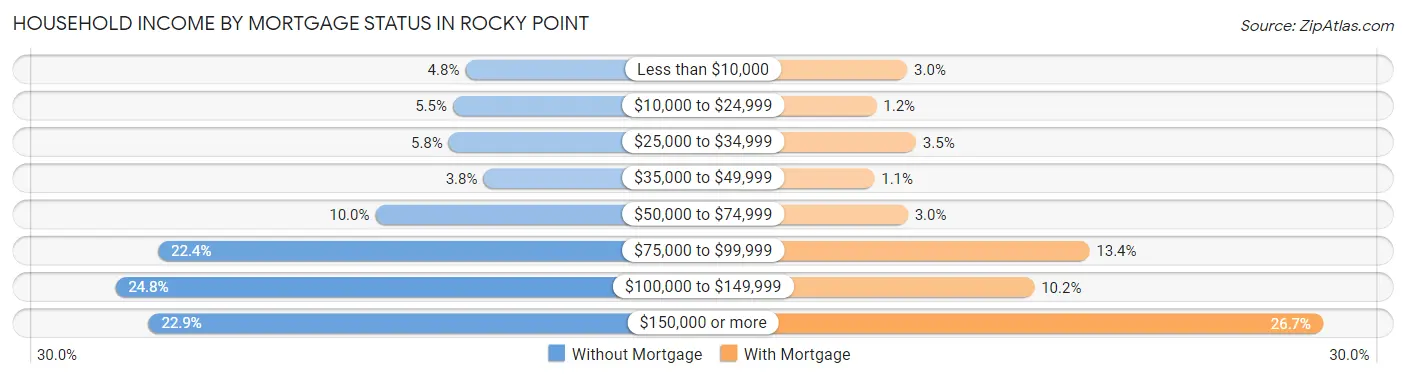
| Household Income | Without Mortgage | With Mortgage |
| Less than $10,000 | 61 (4.8%) | 99 (2.9%) |
| $10,000 to $24,999 | 70 (5.5%) | 40 (1.2%) |
| $25,000 to $34,999 | 73 (5.8%) | 116 (3.5%) |
| $35,000 to $49,999 | 48 (3.8%) | 36 (1.1%) |
| $50,000 to $74,999 | 126 (10.0%) | 100 (3.0%) |
| $75,000 to $99,999 | 283 (22.4%) | 449 (13.4%) |
| $100,000 to $149,999 | 314 (24.8%) | 343 (10.2%) |
| $150,000 or more | 290 (22.9%) | 897 (26.7%) |
| Total | 1,265 (100.0%) | 3,360 (100.0%) |
Property Value to Household Income Ratio in Rocky Point
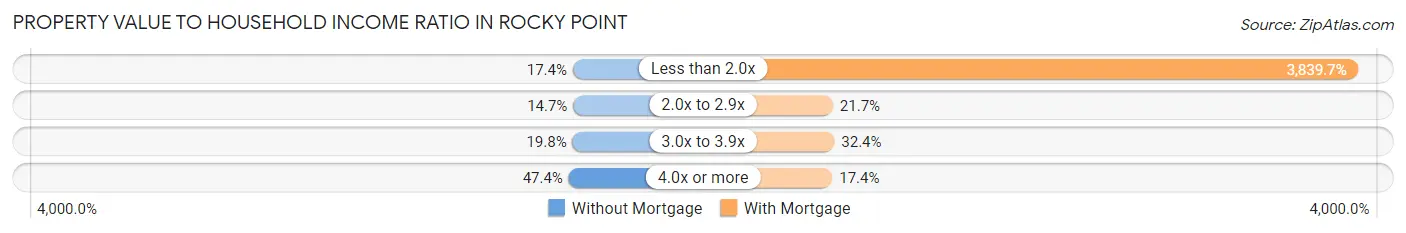
| Value-to-Income Ratio | Without Mortgage | With Mortgage |
| Less than 2.0x | 220 (17.4%) | 129,014 (3,839.7%) |
| 2.0x to 2.9x | 186 (14.7%) | 730 (21.7%) |
| 3.0x to 3.9x | 250 (19.8%) | 1,090 (32.4%) |
| 4.0x or more | 600 (47.4%) | 583 (17.3%) |
| Total | 1,265 (100.0%) | 3,360 (100.0%) |
Real Estate Taxes by Mortgage Status in Rocky Point
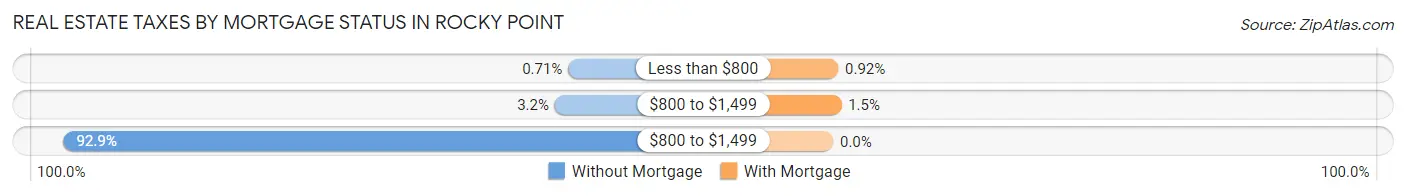
| Property Taxes | Without Mortgage | With Mortgage |
| Less than $800 | 9 (0.7%) | 31 (0.9%) |
| $800 to $1,499 | 40 (3.2%) | 50 (1.5%) |
| $800 to $1,499 | 1,175 (92.9%) | 0 (0.0%) |
| Total | 1,265 (100.0%) | 3,360 (100.0%) |
Health & Disability in Rocky Point
Health Insurance Coverage by Age in Rocky Point
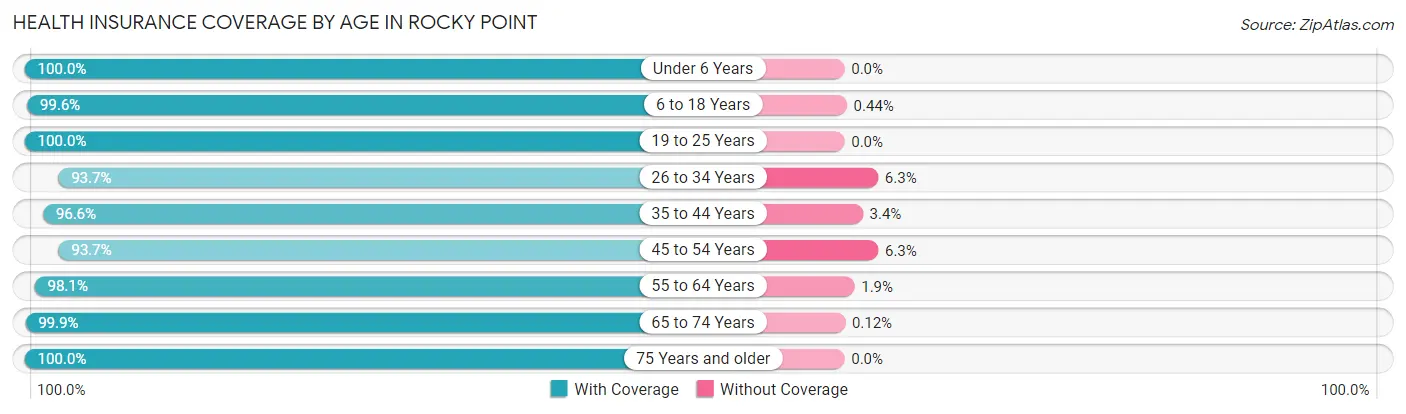
| Age Bracket | With Coverage | Without Coverage |
| Under 6 Years | 1,112 (100.0%) | 0 (0.0%) |
| 6 to 18 Years | 2,482 (99.6%) | 11 (0.4%) |
| 19 to 25 Years | 1,079 (100.0%) | 0 (0.0%) |
| 26 to 34 Years | 1,466 (93.7%) | 98 (6.3%) |
| 35 to 44 Years | 1,471 (96.6%) | 52 (3.4%) |
| 45 to 54 Years | 2,428 (93.7%) | 163 (6.3%) |
| 55 to 64 Years | 1,691 (98.1%) | 32 (1.9%) |
| 65 to 74 Years | 831 (99.9%) | 1 (0.1%) |
| 75 Years and older | 789 (100.0%) | 0 (0.0%) |
| Total | 13,349 (97.4%) | 357 (2.6%) |
Health Insurance Coverage by Citizenship Status in Rocky Point
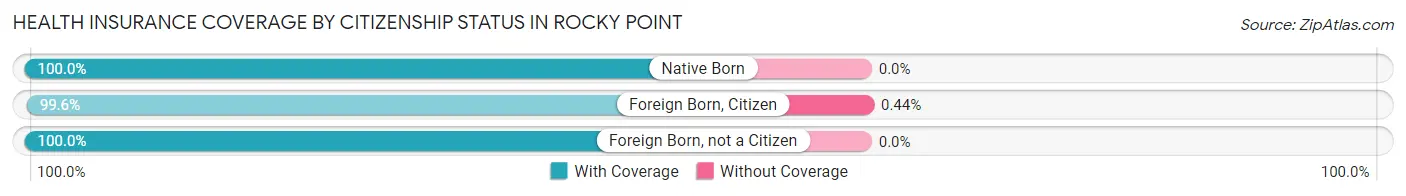
| Citizenship Status | With Coverage | Without Coverage |
| Native Born | 1,112 (100.0%) | 0 (0.0%) |
| Foreign Born, Citizen | 2,482 (99.6%) | 11 (0.4%) |
| Foreign Born, not a Citizen | 1,079 (100.0%) | 0 (0.0%) |
Health Insurance Coverage by Household Income in Rocky Point
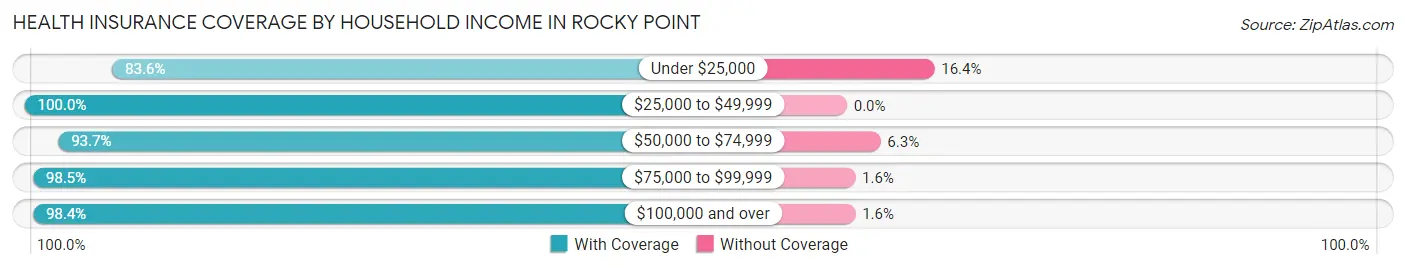
| Household Income | With Coverage | Without Coverage |
| Under $25,000 | 464 (83.6%) | 91 (16.4%) |
| $25,000 to $49,999 | 614 (100.0%) | 0 (0.0%) |
| $50,000 to $74,999 | 1,368 (93.7%) | 92 (6.3%) |
| $75,000 to $99,999 | 1,592 (98.5%) | 25 (1.5%) |
| $100,000 and over | 9,253 (98.4%) | 148 (1.6%) |
Public vs Private Health Insurance Coverage by Age in Rocky Point
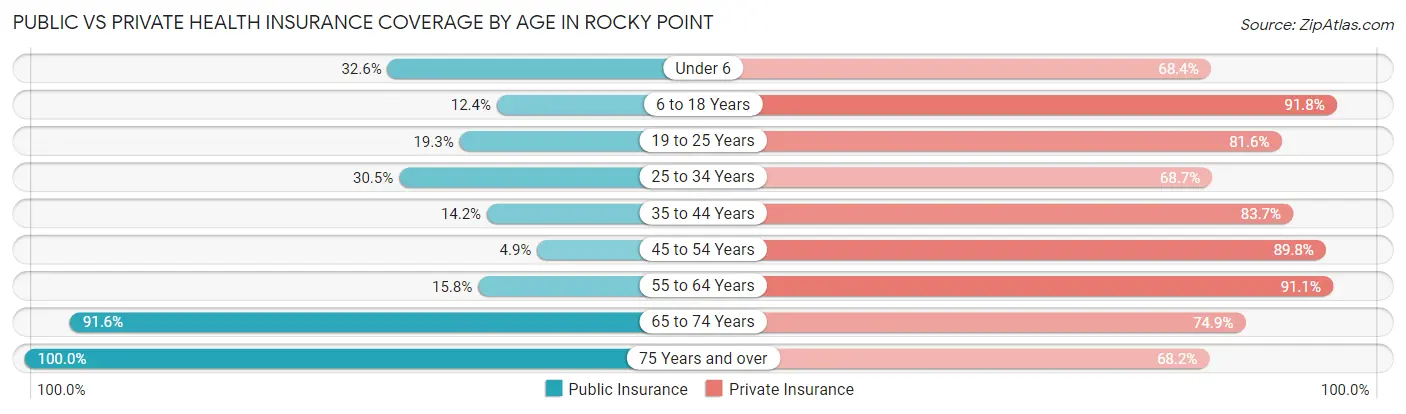
| Age Bracket | Public Insurance | Private Insurance |
| Under 6 | 363 (32.6%) | 761 (68.4%) |
| 6 to 18 Years | 308 (12.3%) | 2,289 (91.8%) |
| 19 to 25 Years | 208 (19.3%) | 880 (81.6%) |
| 25 to 34 Years | 477 (30.5%) | 1,075 (68.7%) |
| 35 to 44 Years | 216 (14.2%) | 1,275 (83.7%) |
| 45 to 54 Years | 126 (4.9%) | 2,327 (89.8%) |
| 55 to 64 Years | 273 (15.8%) | 1,570 (91.1%) |
| 65 to 74 Years | 762 (91.6%) | 623 (74.9%) |
| 75 Years and over | 789 (100.0%) | 538 (68.2%) |
| Total | 3,522 (25.7%) | 11,338 (82.7%) |
Disability Status by Sex by Age in Rocky Point
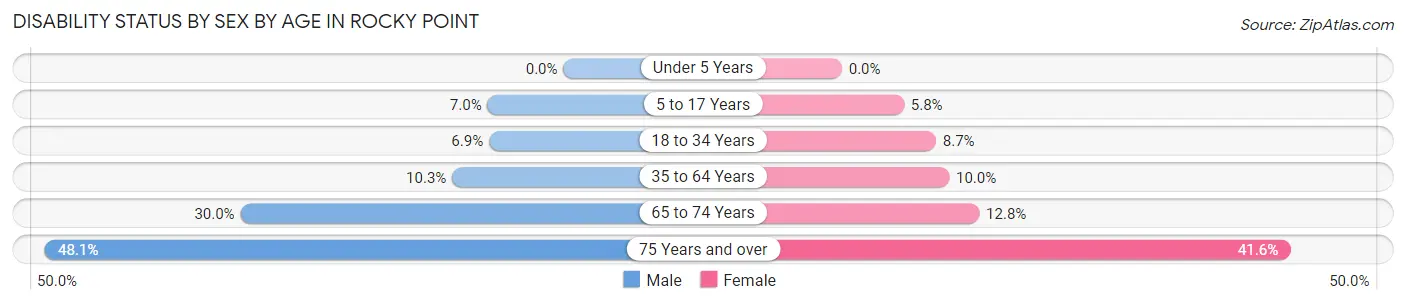
| Age Bracket | Male | Female |
| Under 5 Years | 0 (0.0%) | 0 (0.0%) |
| 5 to 17 Years | 66 (7.0%) | 78 (5.8%) |
| 18 to 34 Years | 97 (6.9%) | 135 (8.7%) |
| 35 to 64 Years | 314 (10.3%) | 278 (10.0%) |
| 65 to 74 Years | 113 (30.0%) | 58 (12.8%) |
| 75 Years and over | 139 (48.1%) | 208 (41.6%) |
Disability Class by Sex by Age in Rocky Point
Disability Class: Hearing Difficulty
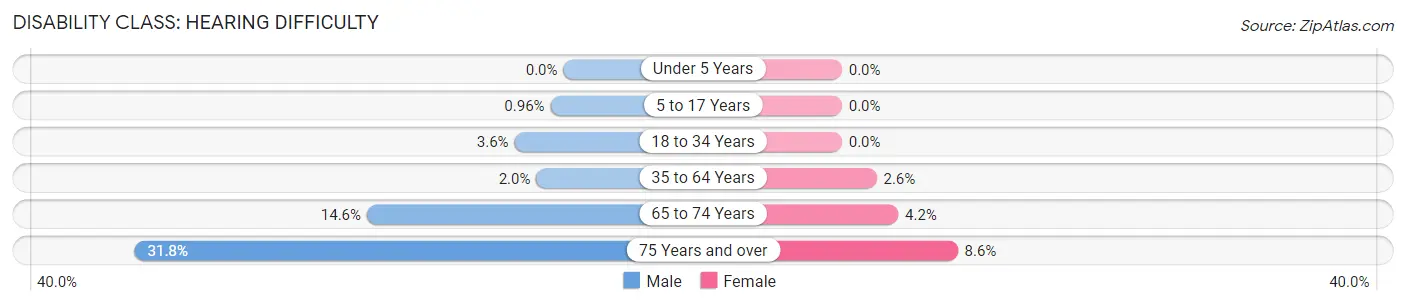
| Age Bracket | Male | Female |
| Under 5 Years | 0 (0.0%) | 0 (0.0%) |
| 5 to 17 Years | 9 (1.0%) | 0 (0.0%) |
| 18 to 34 Years | 51 (3.6%) | 0 (0.0%) |
| 35 to 64 Years | 61 (2.0%) | 72 (2.6%) |
| 65 to 74 Years | 55 (14.6%) | 19 (4.2%) |
| 75 Years and over | 92 (31.8%) | 43 (8.6%) |
Disability Class: Vision Difficulty
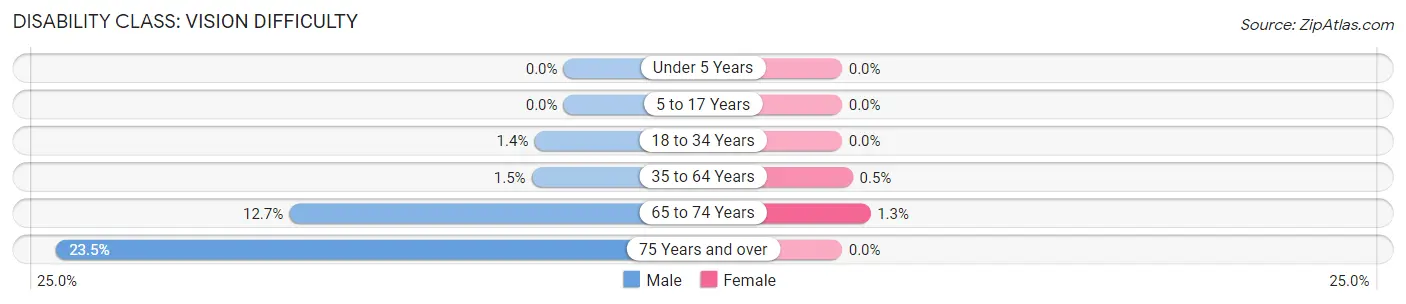
| Age Bracket | Male | Female |
| Under 5 Years | 0 (0.0%) | 0 (0.0%) |
| 5 to 17 Years | 0 (0.0%) | 0 (0.0%) |
| 18 to 34 Years | 19 (1.3%) | 0 (0.0%) |
| 35 to 64 Years | 45 (1.5%) | 14 (0.5%) |
| 65 to 74 Years | 48 (12.7%) | 6 (1.3%) |
| 75 Years and over | 68 (23.5%) | 0 (0.0%) |
Disability Class: Cognitive Difficulty
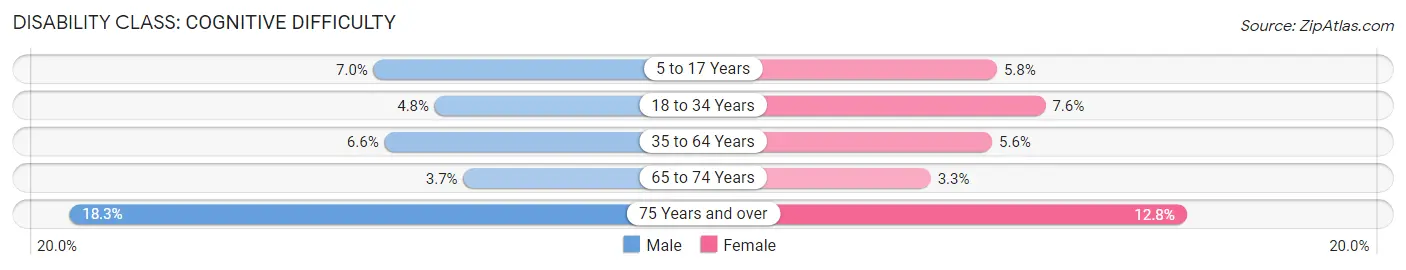
| Age Bracket | Male | Female |
| 5 to 17 Years | 66 (7.0%) | 78 (5.8%) |
| 18 to 34 Years | 67 (4.8%) | 117 (7.6%) |
| 35 to 64 Years | 202 (6.6%) | 156 (5.6%) |
| 65 to 74 Years | 14 (3.7%) | 15 (3.3%) |
| 75 Years and over | 53 (18.3%) | 64 (12.8%) |
Disability Class: Ambulatory Difficulty
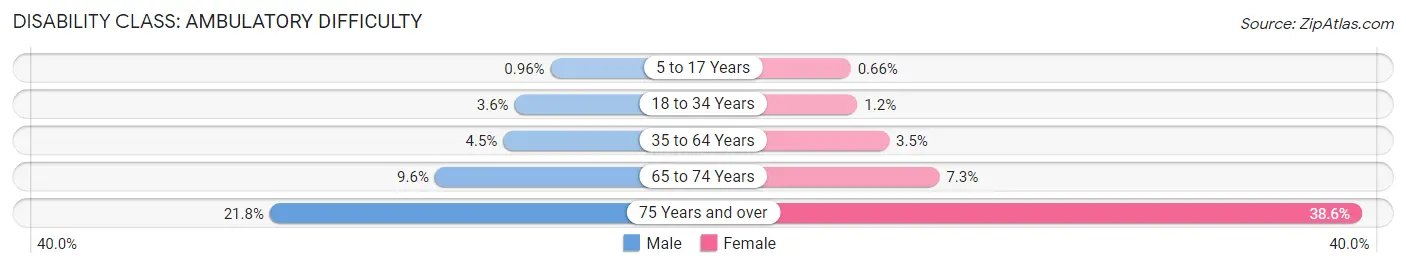
| Age Bracket | Male | Female |
| 5 to 17 Years | 9 (1.0%) | 9 (0.7%) |
| 18 to 34 Years | 51 (3.6%) | 18 (1.2%) |
| 35 to 64 Years | 136 (4.5%) | 98 (3.5%) |
| 65 to 74 Years | 36 (9.6%) | 33 (7.2%) |
| 75 Years and over | 63 (21.8%) | 193 (38.6%) |
Disability Class: Self-Care Difficulty
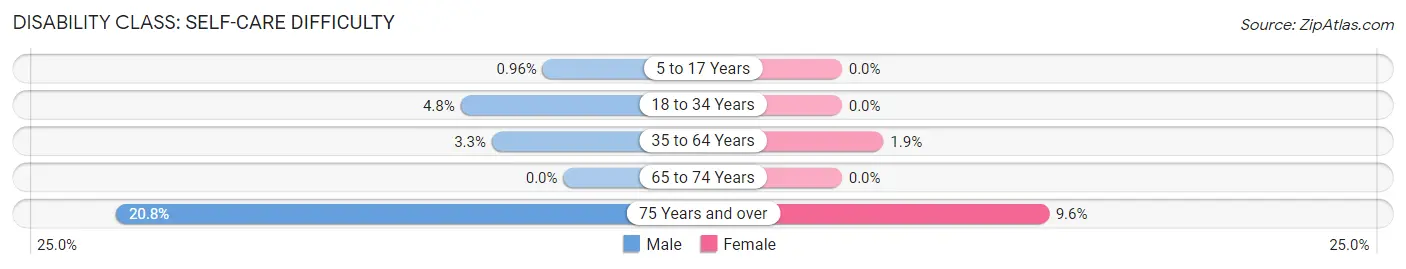
| Age Bracket | Male | Female |
| 5 to 17 Years | 9 (1.0%) | 0 (0.0%) |
| 18 to 34 Years | 67 (4.8%) | 0 (0.0%) |
| 35 to 64 Years | 101 (3.3%) | 54 (1.9%) |
| 65 to 74 Years | 0 (0.0%) | 0 (0.0%) |
| 75 Years and over | 60 (20.8%) | 48 (9.6%) |
Technology Access in Rocky Point
Computing Device Access in Rocky Point
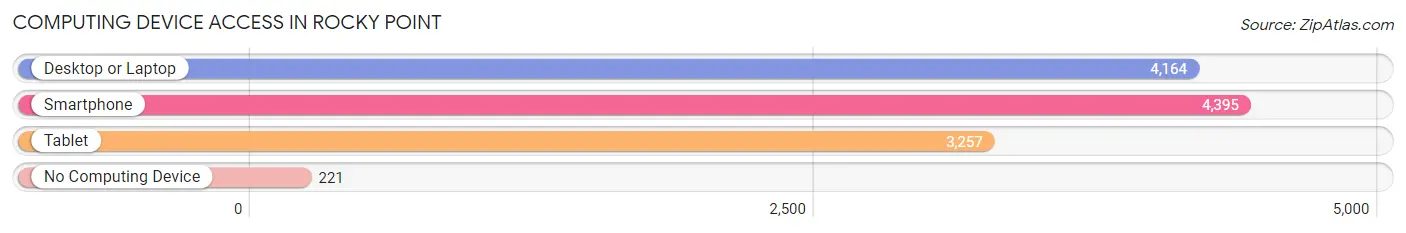
| Device Type | # Households | % Households |
| Desktop or Laptop | 4,164 | 83.2% |
| Smartphone | 4,395 | 87.8% |
| Tablet | 3,257 | 65.1% |
| No Computing Device | 221 | 4.4% |
| Total | 5,003 | 100.0% |
Internet Access in Rocky Point
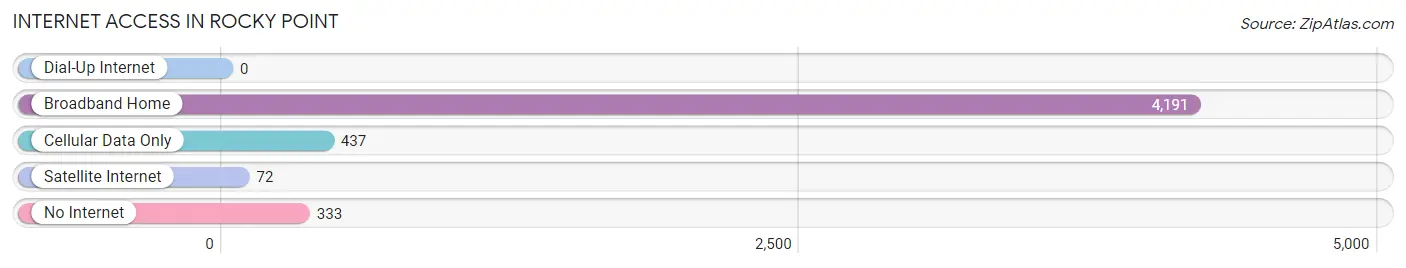
| Internet Type | # Households | % Households |
| Dial-Up Internet | 0 | 0.0% |
| Broadband Home | 4,191 | 83.8% |
| Cellular Data Only | 437 | 8.7% |
| Satellite Internet | 72 | 1.4% |
| No Internet | 333 | 6.7% |
| Total | 5,003 | 100.0% |
Rocky Point Summary
Rocky Point is a hamlet located in the Town of Brookhaven in Suffolk County, New York. It is situated on the north shore of Long Island, approximately 60 miles east of New York City. The hamlet is bordered by the Long Island Sound to the north, the Nissequogue River to the east, and the hamlet of Shoreham to the south.
History
The area that is now Rocky Point was originally inhabited by the Setalcott Indians, a branch of the Algonquin tribe. The first European settlers arrived in the area in the late 1600s, and the hamlet was officially established in 1721. The hamlet was originally known as “Rocky Point” due to its rocky shoreline.
In the late 1700s, Rocky Point became a popular destination for wealthy New Yorkers who wanted to escape the hustle and bustle of the city. The area was known for its beautiful beaches and scenic views of the Long Island Sound.
In the early 1800s, Rocky Point became a popular destination for whaling ships. The whaling industry was a major source of income for the hamlet, and it continued to be a major industry until the late 1800s.
In the late 1800s, Rocky Point became a popular destination for vacationers. The area was known for its beautiful beaches and scenic views of the Long Island Sound. The hamlet also became a popular destination for fishing and boating.
In the early 1900s, Rocky Point became a popular destination for summer homes. The area was known for its beautiful beaches and scenic views of the Long Island Sound. The hamlet also became a popular destination for fishing and boating.
In the late 1900s, Rocky Point became a popular destination for retirees. The area was known for its beautiful beaches and scenic views of the Long Island Sound. The hamlet also became a popular destination for fishing and boating.
Geography
Rocky Point is located on the north shore of Long Island, approximately 60 miles east of New York City. The hamlet is bordered by the Long Island Sound to the north, the Nissequogue River to the east, and the hamlet of Shoreham to the south.
The hamlet is situated on a peninsula, with the Long Island Sound to the north and the Nissequogue River to the east. The hamlet is home to several beaches, including Rocky Point Beach, which is located on the Long Island Sound.
The hamlet is home to several parks, including Rocky Point Park, which is located on the Long Island Sound. The park features a playground, picnic areas, and a boat launch.
Economy
The economy of Rocky Point is largely based on tourism. The hamlet is home to several beaches, parks, and marinas, which attract visitors from all over the world. The hamlet is also home to several restaurants, bars, and shops, which cater to tourists and locals alike.
The hamlet is also home to several businesses, including boat builders, marinas, and seafood restaurants. The hamlet is also home to several boatyards, which provide services such as boat repairs and maintenance.
Demographics
As of the 2010 census, the population of Rocky Point was 5,845. The population is largely white (90.3%), with small percentages of African American (3.2%), Asian (2.2%), and Hispanic (2.2%) residents. The median household income is $87,917, and the median home value is $521,400.
Conclusion
Rocky Point is a hamlet located in the Town of Brookhaven in Suffolk County, New York. It is situated on the north shore of Long Island, approximately 60 miles east of New York City. The hamlet is bordered by the Long Island Sound to the north, the Nissequogue River to the east, and the hamlet of Shoreham to the south. The economy of Rocky Point is largely based on tourism, and the population is largely white. The hamlet is home to several beaches, parks, and marinas, which attract visitors from all over the world. The hamlet is also home to several businesses, including boat builders, marinas, and seafood restaurants.
Common Questions
What is Per Capita Income in Rocky Point?
Per Capita income in Rocky Point is $51,803.
What is the Median Family Income in Rocky Point?
Median Family Income in Rocky Point is $129,388.
What is the Median Household income in Rocky Point?
Median Household Income in Rocky Point is $115,173.
What is Income or Wage Gap in Rocky Point?
Income or Wage Gap in Rocky Point is 40.3%.
Women in Rocky Point earn 59.7 cents for every dollar earned by a man.
What is Family Income Deficit in Rocky Point?
Family Income Deficit in Rocky Point is $13,970.
Families that are below poverty line in Rocky Point earn $13,970 less on average than the poverty threshold level.
What is Inequality or Gini Index in Rocky Point?
Inequality or Gini Index in Rocky Point is 0.39.
What is the Total Population of Rocky Point?
Total Population of Rocky Point is 13,716.
What is the Total Male Population of Rocky Point?
Total Male Population of Rocky Point is 6,643.
What is the Total Female Population of Rocky Point?
Total Female Population of Rocky Point is 7,073.
What is the Ratio of Males per 100 Females in Rocky Point?
There are 93.92 Males per 100 Females in Rocky Point.
What is the Ratio of Females per 100 Males in Rocky Point?
There are 106.47 Females per 100 Males in Rocky Point.
What is the Median Population Age in Rocky Point?
Median Population Age in Rocky Point is 38.9 Years.
What is the Average Family Size in Rocky Point
Average Family Size in Rocky Point is 3.4 People.
What is the Average Household Size in Rocky Point
Average Household Size in Rocky Point is 2.7 People.
How Large is the Labor Force in Rocky Point?
There are 7,794 People in the Labor Forcein in Rocky Point.
What is the Percentage of People in the Labor Force in Rocky Point?
72.6% of People are in the Labor Force in Rocky Point.
What is the Unemployment Rate in Rocky Point?
Unemployment Rate in Rocky Point is 6.4%.