Rolla, MO Map & Demographics
Rolla Map
Rolla Overview
$23,040
PER CAPITA INCOME
$61,812
AVG FAMILY INCOME
$37,685
AVG HOUSEHOLD INCOME
9.8%
WAGE / INCOME GAP [ % ]
90.2¢/ $1
WAGE / INCOME GAP [ $ ]
$11,315
FAMILY INCOME DEFICIT
0.48
INEQUALITY / GINI INDEX
20,025
TOTAL POPULATION
11,002
MALE POPULATION
9,023
FEMALE POPULATION
121.93
MALES / 100 FEMALES
82.01
FEMALES / 100 MALES
26.9
MEDIAN AGE
2.8
AVG FAMILY SIZE
2.1
AVG HOUSEHOLD SIZE
8,413
LABOR FORCE [ PEOPLE ]
50.1%
PERCENT IN LABOR FORCE
5.0%
UNEMPLOYMENT RATE
Rolla Area Codes
Income in Rolla
Income Overview in Rolla
Per Capita Income in Rolla is $23,040, while median incomes of families and households are $61,812 and $37,685 respectively.
| Characteristic | Number | Measure |
| Per Capita Income | 20,025 | $23,040 |
| Median Family Income | 3,813 | $61,812 |
| Mean Family Income | 3,813 | $78,784 |
| Median Household Income | 8,222 | $37,685 |
| Mean Household Income | 8,222 | $55,184 |
| Income Deficit | 3,813 | $11,315 |
| Wage / Income Gap (%) | 20,025 | 9.82% |
| Wage / Income Gap ($) | 20,025 | 90.18¢ per $1 |
| Gini / Inequality Index | 20,025 | 0.48 |
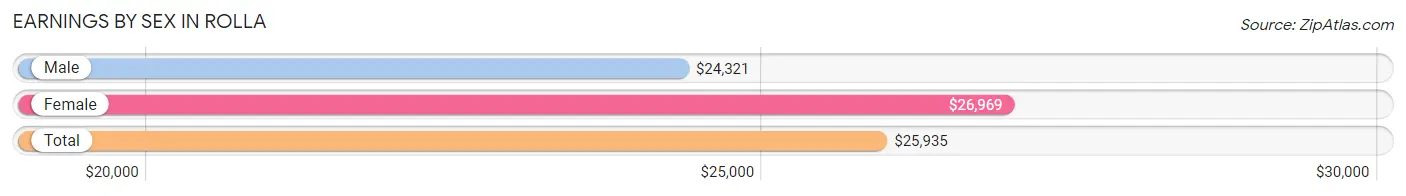
Earnings by Sex in Rolla
Average Earnings in Rolla are $25,935, $24,321 for men and $26,969 for women, a difference of 9.8%.
| Sex | Number | Average Earnings |
| Male | 5,573 (56.6%) | $24,321 |
| Female | 4,269 (43.4%) | $26,969 |
| Total | 9,842 (100.0%) | $25,935 |
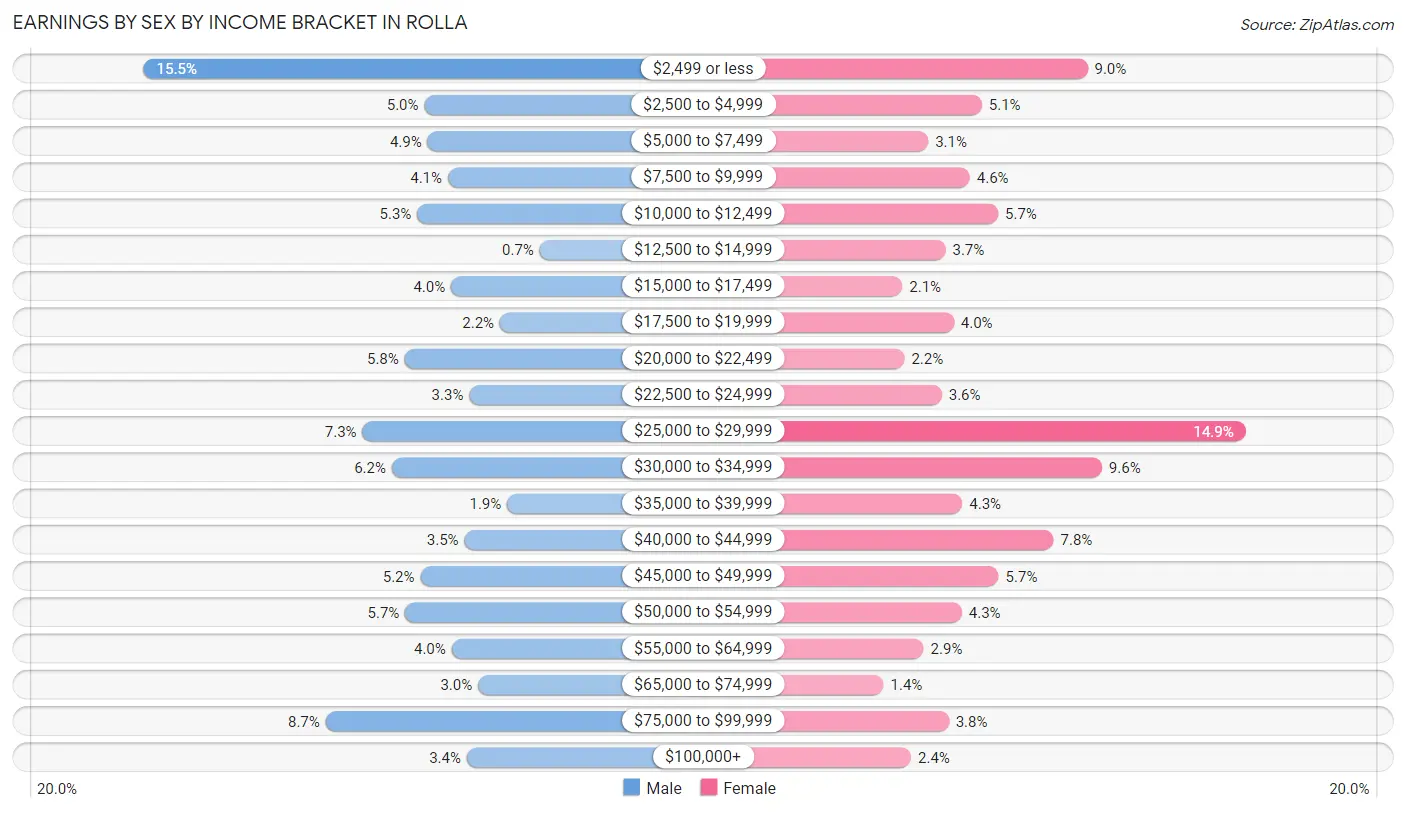
Earnings by Sex by Income Bracket in Rolla
The most common earnings brackets in Rolla are $2,499 or less for men (866 | 15.5%) and $25,000 to $29,999 for women (638 | 14.9%).
| Income | Male | Female |
| $2,499 or less | 866 (15.5%) | 385 (9.0%) |
| $2,500 to $4,999 | 280 (5.0%) | 216 (5.1%) |
| $5,000 to $7,499 | 273 (4.9%) | 130 (3.0%) |
| $7,500 to $9,999 | 231 (4.1%) | 197 (4.6%) |
| $10,000 to $12,499 | 295 (5.3%) | 242 (5.7%) |
| $12,500 to $14,999 | 39 (0.7%) | 158 (3.7%) |
| $15,000 to $17,499 | 224 (4.0%) | 89 (2.1%) |
| $17,500 to $19,999 | 122 (2.2%) | 171 (4.0%) |
| $20,000 to $22,499 | 321 (5.8%) | 92 (2.2%) |
| $22,500 to $24,999 | 186 (3.3%) | 152 (3.6%) |
| $25,000 to $29,999 | 409 (7.3%) | 638 (14.9%) |
| $30,000 to $34,999 | 348 (6.2%) | 408 (9.6%) |
| $35,000 to $39,999 | 107 (1.9%) | 185 (4.3%) |
| $40,000 to $44,999 | 196 (3.5%) | 331 (7.7%) |
| $45,000 to $49,999 | 288 (5.2%) | 243 (5.7%) |
| $50,000 to $54,999 | 320 (5.7%) | 184 (4.3%) |
| $55,000 to $64,999 | 223 (4.0%) | 123 (2.9%) |
| $65,000 to $74,999 | 168 (3.0%) | 59 (1.4%) |
| $75,000 to $99,999 | 486 (8.7%) | 163 (3.8%) |
| $100,000+ | 191 (3.4%) | 103 (2.4%) |
| Total | 5,573 (100.0%) | 4,269 (100.0%) |
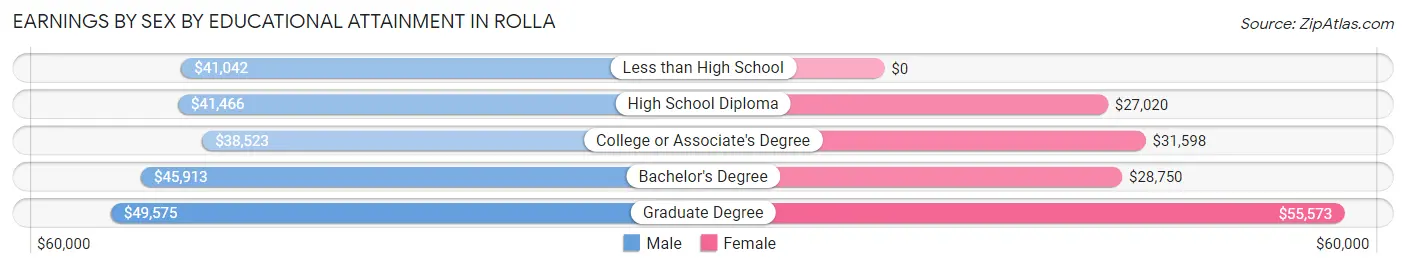
Earnings by Sex by Educational Attainment in Rolla
Average earnings in Rolla are $43,510 for men and $30,913 for women, a difference of 28.9%. Men with an educational attainment of graduate degree enjoy the highest average annual earnings of $49,575, while those with college or associate's degree education earn the least with $38,523. Women with an educational attainment of graduate degree earn the most with the average annual earnings of $55,573, while those with high school diploma education have the smallest earnings of $27,020.
| Educational Attainment | Male Income | Female Income |
| Less than High School | $41,042 | $0 |
| High School Diploma | $41,466 | $27,020 |
| College or Associate's Degree | $38,523 | $31,598 |
| Bachelor's Degree | $45,913 | $28,750 |
| Graduate Degree | $49,575 | $55,573 |
| Total | $43,510 | $30,913 |
Family Income in Rolla
Family Income Brackets in Rolla
According to the Rolla family income data, there are 991 families falling into the $50,000 to $74,999 income range, which is the most common income bracket and makes up 26.0% of all families. Conversely, the $10,000 to $14,999 income bracket is the least frequent group with only 80 families (2.1%) belonging to this category.
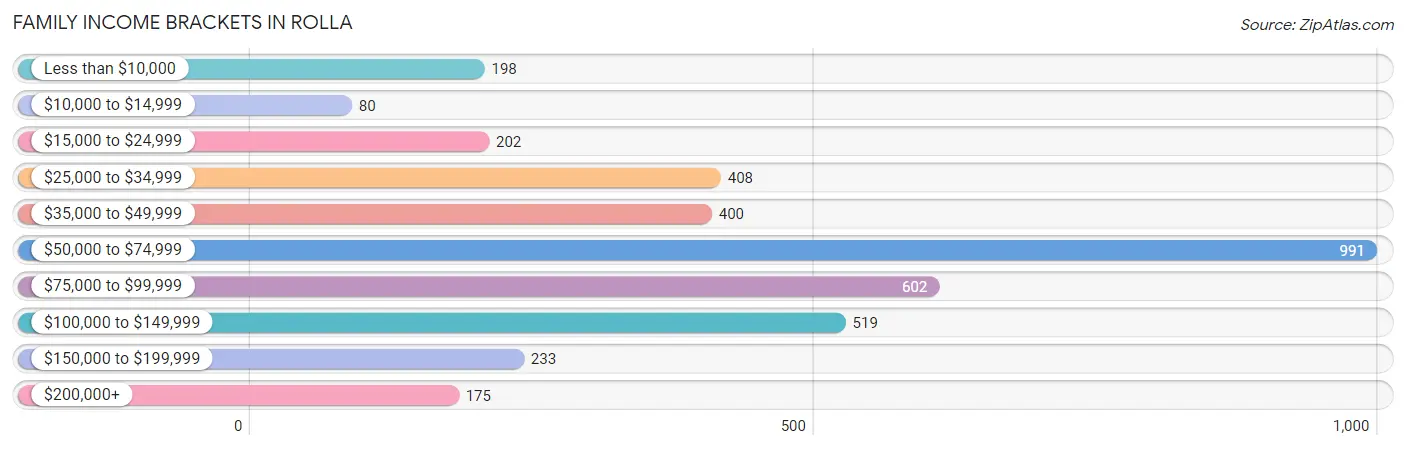
| Income Bracket | # Families | % Families |
| Less than $10,000 | 198 | 5.2% |
| $10,000 to $14,999 | 80 | 2.1% |
| $15,000 to $24,999 | 202 | 5.3% |
| $25,000 to $34,999 | 408 | 10.7% |
| $35,000 to $49,999 | 400 | 10.5% |
| $50,000 to $74,999 | 991 | 26.0% |
| $75,000 to $99,999 | 602 | 15.8% |
| $100,000 to $149,999 | 519 | 13.6% |
| $150,000 to $199,999 | 233 | 6.1% |
| $200,000+ | 175 | 4.6% |
Family Income by Famaliy Size in Rolla
6-person families (118 | 3.1%) account for the highest median family income in Rolla with $93,158 per family, while 2-person families (2,076 | 54.4%) have the highest median income of $31,126 per family member.
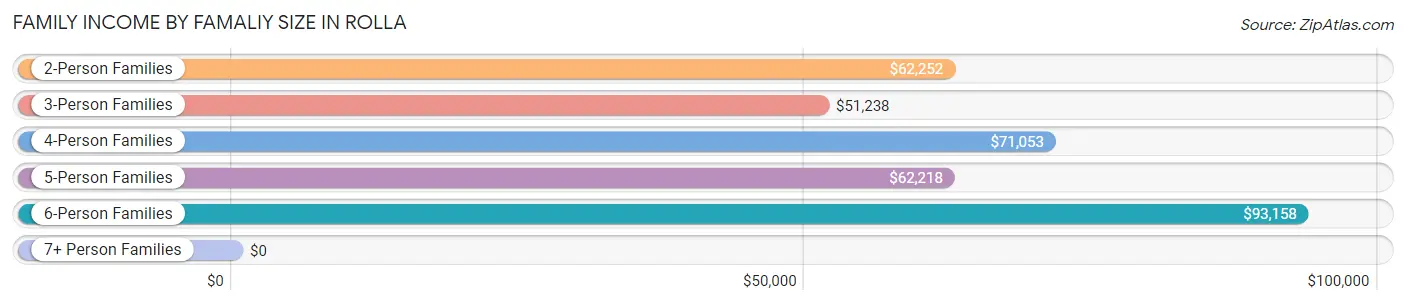
| Income Bracket | # Families | Median Income |
| 2-Person Families | 2,076 (54.4%) | $62,252 |
| 3-Person Families | 870 (22.8%) | $51,238 |
| 4-Person Families | 498 (13.1%) | $71,053 |
| 5-Person Families | 202 (5.3%) | $62,218 |
| 6-Person Families | 118 (3.1%) | $93,158 |
| 7+ Person Families | 49 (1.3%) | $0 |
| Total | 3,813 (100.0%) | $61,812 |
Family Income by Number of Earners in Rolla
The median family income in Rolla is $61,812, with families comprising 3+ earners (181) having the highest median family income of $103,224, while families with 1 earner (1,493) have the lowest median family income of $45,642, accounting for 4.8% and 39.2% of families, respectively.
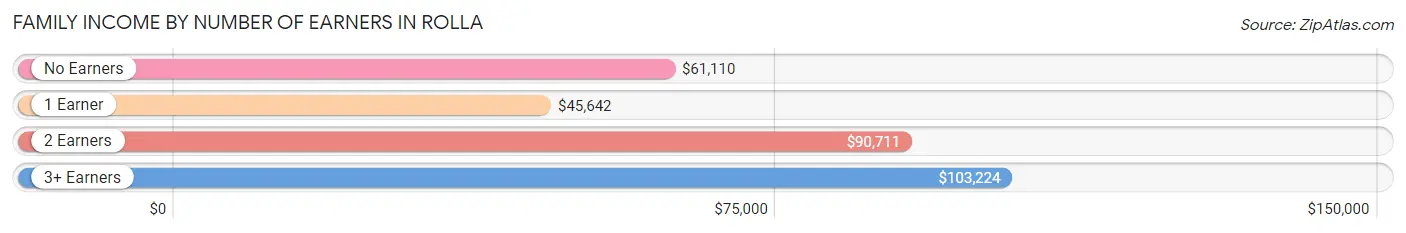
| Number of Earners | # Families | Median Income |
| No Earners | 681 (17.9%) | $61,110 |
| 1 Earner | 1,493 (39.2%) | $45,642 |
| 2 Earners | 1,458 (38.2%) | $90,711 |
| 3+ Earners | 181 (4.8%) | $103,224 |
| Total | 3,813 (100.0%) | $61,812 |
Household Income in Rolla
Household Income Brackets in Rolla
With 1,406 households falling in the category, the $50,000 to $74,999 income range is the most frequent in Rolla, accounting for 17.1% of all households. In contrast, only 189 households (2.3%) fall into the $200,000+ income bracket, making it the least populous group.
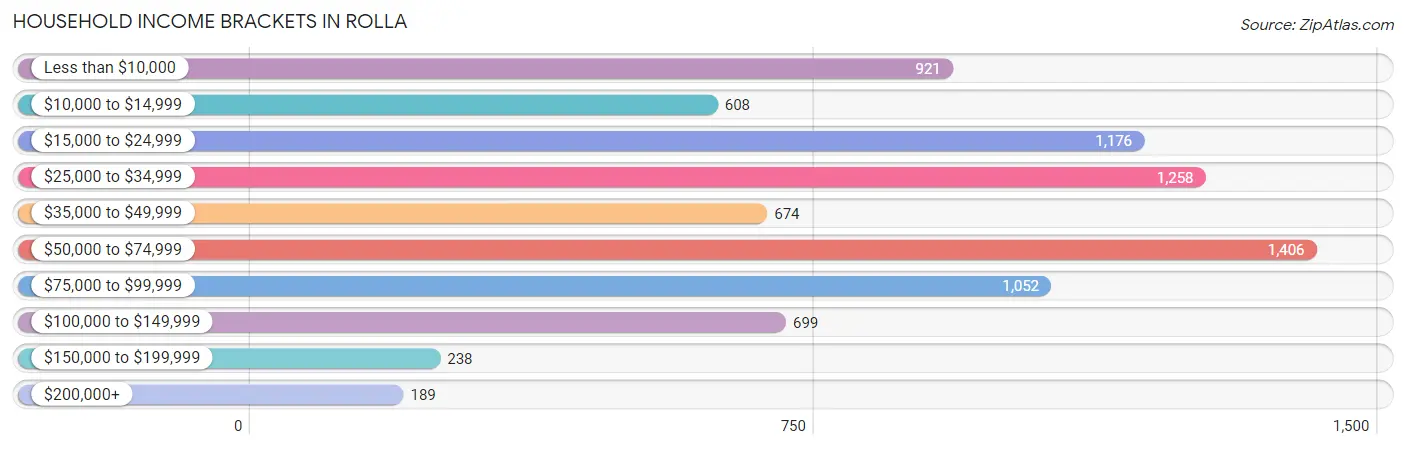
| Income Bracket | # Households | % Households |
| Less than $10,000 | 921 | 11.2% |
| $10,000 to $14,999 | 608 | 7.4% |
| $15,000 to $24,999 | 1,176 | 14.3% |
| $25,000 to $34,999 | 1,258 | 15.3% |
| $35,000 to $49,999 | 674 | 8.2% |
| $50,000 to $74,999 | 1,406 | 17.1% |
| $75,000 to $99,999 | 1,052 | 12.8% |
| $100,000 to $149,999 | 699 | 8.5% |
| $150,000 to $199,999 | 238 | 2.9% |
| $200,000+ | 189 | 2.3% |
Household Income by Householder Age in Rolla
The median household income in Rolla is $37,685, with the highest median household income of $73,438 found in the 45 to 64 years age bracket for the primary householder. A total of 1,970 households (24.0%) fall into this category. Meanwhile, the 15 to 24 years age bracket for the primary householder has the lowest median household income of $22,500, with 1,346 households (16.4%) in this group.
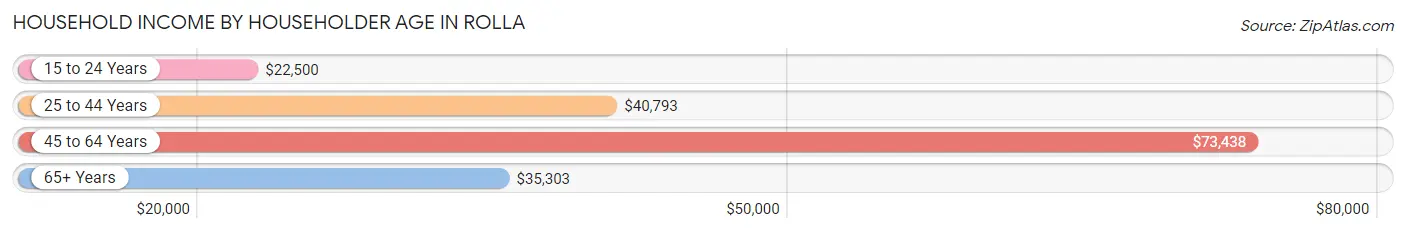
| Income Bracket | # Households | Median Income |
| 15 to 24 Years | 1,346 (16.4%) | $22,500 |
| 25 to 44 Years | 2,908 (35.4%) | $40,793 |
| 45 to 64 Years | 1,970 (24.0%) | $73,438 |
| 65+ Years | 1,998 (24.3%) | $35,303 |
| Total | 8,222 (100.0%) | $37,685 |
Poverty in Rolla
Income Below Poverty by Sex and Age in Rolla
With 26.7% poverty level for males and 22.1% for females among the residents of Rolla, 18 to 24 year old males and 18 to 24 year old females are the most vulnerable to poverty, with 1,253 males (63.2%) and 557 females (42.6%) in their respective age groups living below the poverty level.
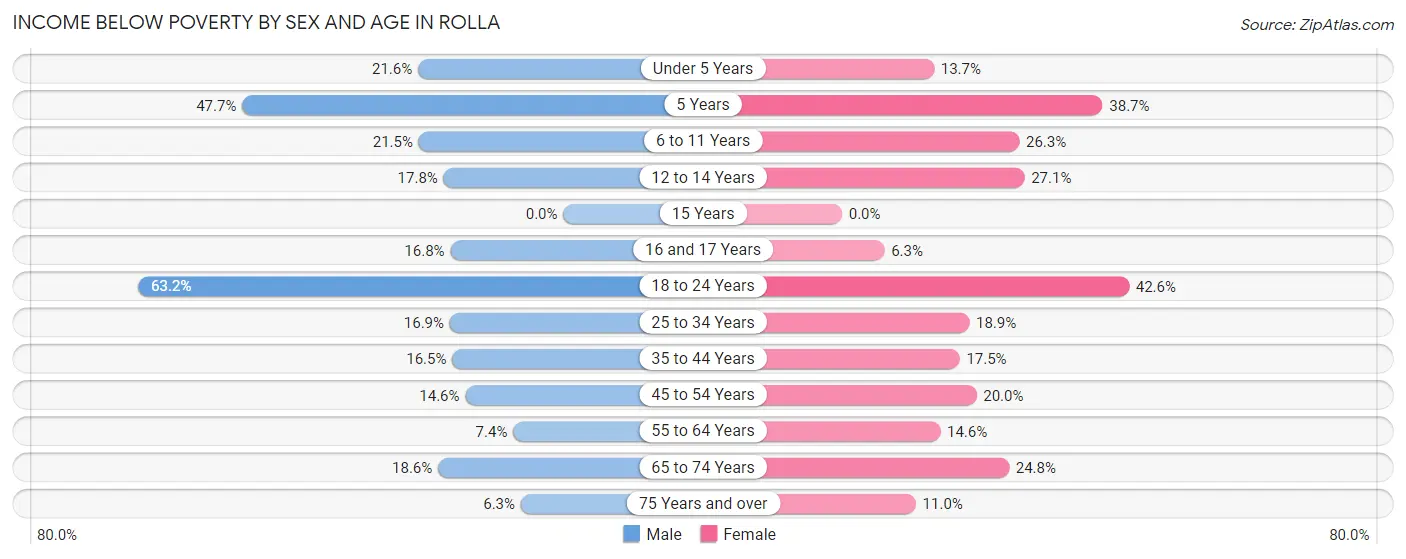
| Age Bracket | Male | Female |
| Under 5 Years | 112 (21.6%) | 62 (13.7%) |
| 5 Years | 72 (47.7%) | 53 (38.7%) |
| 6 to 11 Years | 102 (21.5%) | 160 (26.3%) |
| 12 to 14 Years | 67 (17.8%) | 68 (27.1%) |
| 15 Years | 0 (0.0%) | 0 (0.0%) |
| 16 and 17 Years | 27 (16.8%) | 8 (6.3%) |
| 18 to 24 Years | 1,253 (63.2%) | 557 (42.6%) |
| 25 to 34 Years | 255 (16.9%) | 248 (18.9%) |
| 35 to 44 Years | 152 (16.5%) | 137 (17.5%) |
| 45 to 54 Years | 116 (14.5%) | 134 (20.0%) |
| 55 to 64 Years | 54 (7.4%) | 135 (14.6%) |
| 65 to 74 Years | 117 (18.6%) | 183 (24.8%) |
| 75 Years and over | 32 (6.3%) | 96 (11.0%) |
| Total | 2,359 (26.7%) | 1,841 (22.1%) |
Income Above Poverty by Sex and Age in Rolla
According to the poverty statistics in Rolla, males aged 15 years and females aged 15 years are the age groups that are most secure financially, with 100.0% of males and 100.0% of females in these age groups living above the poverty line.
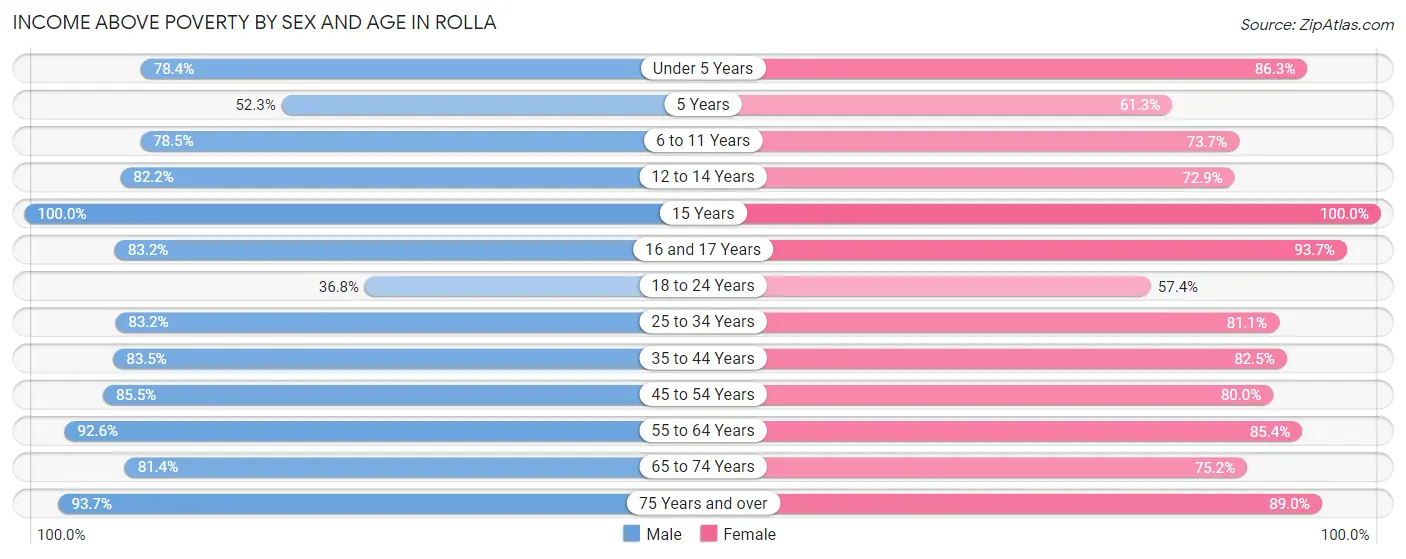
| Age Bracket | Male | Female |
| Under 5 Years | 407 (78.4%) | 392 (86.3%) |
| 5 Years | 79 (52.3%) | 84 (61.3%) |
| 6 to 11 Years | 373 (78.5%) | 448 (73.7%) |
| 12 to 14 Years | 310 (82.2%) | 183 (72.9%) |
| 15 Years | 62 (100.0%) | 161 (100.0%) |
| 16 and 17 Years | 134 (83.2%) | 119 (93.7%) |
| 18 to 24 Years | 731 (36.8%) | 750 (57.4%) |
| 25 to 34 Years | 1,258 (83.2%) | 1,065 (81.1%) |
| 35 to 44 Years | 770 (83.5%) | 647 (82.5%) |
| 45 to 54 Years | 681 (85.5%) | 537 (80.0%) |
| 55 to 64 Years | 672 (92.6%) | 790 (85.4%) |
| 65 to 74 Years | 512 (81.4%) | 555 (75.2%) |
| 75 Years and over | 475 (93.7%) | 779 (89.0%) |
| Total | 6,464 (73.3%) | 6,510 (77.9%) |
Income Below Poverty Among Married-Couple Families in Rolla
The poverty statistics for married-couple families in Rolla show that 5.0% or 131 of the total 2,628 families live below the poverty line. Families with 3 or 4 children have the highest poverty rate of 19.9%, comprising of 32 families. On the other hand, families with 5 or more children have the lowest poverty rate of 0.0%, which includes 0 families.
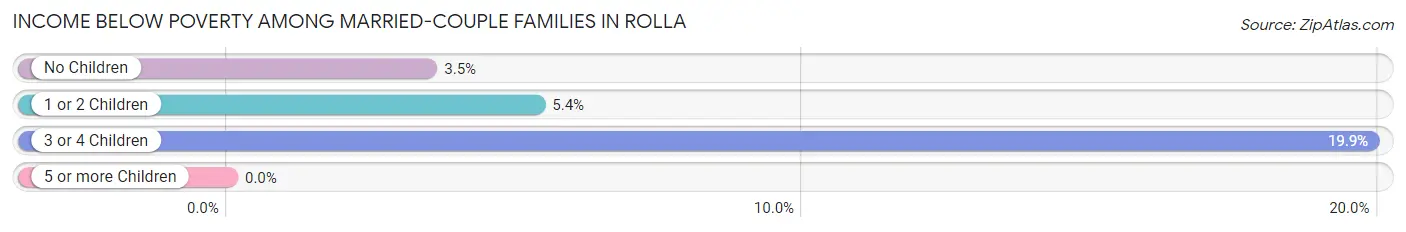
| Children | Above Poverty | Below Poverty |
| No Children | 1,558 (96.5%) | 56 (3.5%) |
| 1 or 2 Children | 761 (94.7%) | 43 (5.3%) |
| 3 or 4 Children | 129 (80.1%) | 32 (19.9%) |
| 5 or more Children | 49 (100.0%) | 0 (0.0%) |
| Total | 2,497 (95.0%) | 131 (5.0%) |
Income Below Poverty Among Single-Parent Households in Rolla
According to the poverty data in Rolla, 17.6% or 62 single-father households and 29.2% or 243 single-mother households are living below the poverty line. Among single-father households, those with no children have the highest poverty rate, with 46 households (50.0%) experiencing poverty. Likewise, among single-mother households, those with 3 or 4 children have the highest poverty rate, with 46 households (63.0%) falling below the poverty line.
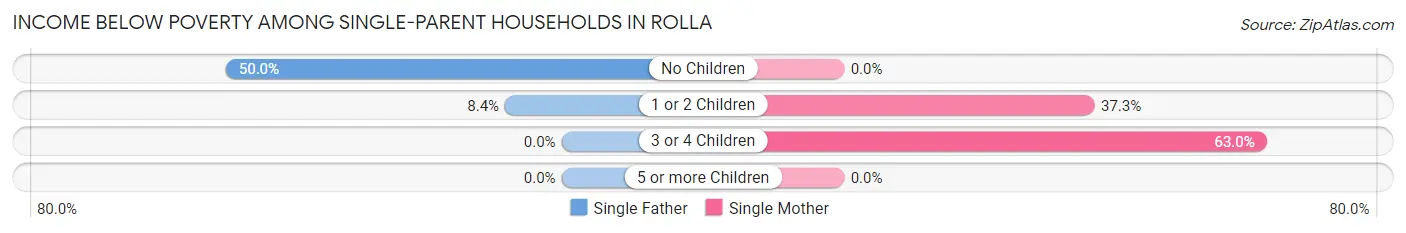
| Children | Single Father | Single Mother |
| No Children | 46 (50.0%) | 0 (0.0%) |
| 1 or 2 Children | 16 (8.4%) | 197 (37.3%) |
| 3 or 4 Children | 0 (0.0%) | 46 (63.0%) |
| 5 or more Children | 0 (0.0%) | 0 (0.0%) |
| Total | 62 (17.6%) | 243 (29.2%) |
Income Below Poverty Among Married-Couple vs Single-Parent Households in Rolla
The poverty data for Rolla shows that 131 of the married-couple family households (5.0%) and 305 of the single-parent households (25.7%) are living below the poverty level. Within the married-couple family households, those with 3 or 4 children have the highest poverty rate, with 32 households (19.9%) falling below the poverty line. Among the single-parent households, those with 3 or 4 children have the highest poverty rate, with 46 household (31.9%) living below poverty.
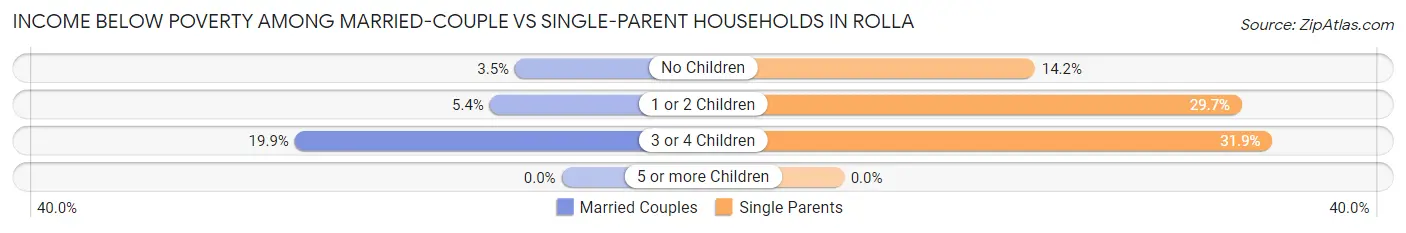
| Children | Married-Couple Families | Single-Parent Households |
| No Children | 56 (3.5%) | 46 (14.2%) |
| 1 or 2 Children | 43 (5.3%) | 213 (29.7%) |
| 3 or 4 Children | 32 (19.9%) | 46 (31.9%) |
| 5 or more Children | 0 (0.0%) | 0 (0.0%) |
| Total | 131 (5.0%) | 305 (25.7%) |
Race in Rolla
The most populous races in Rolla are White / Caucasian (16,673 | 83.3%), Asian (1,150 | 5.7%), and Two or more Races (1,056 | 5.3%).
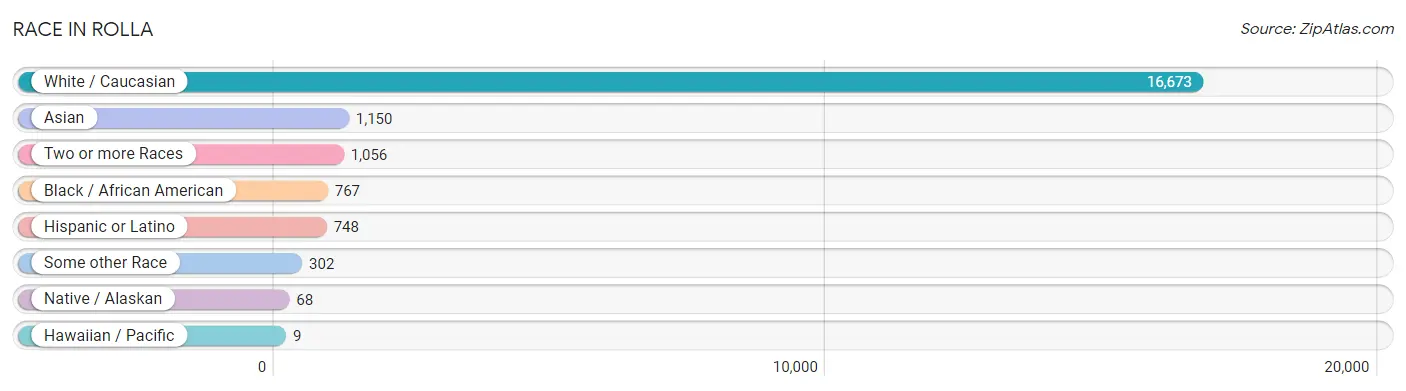
| Race | # Population | % Population |
| Asian | 1,150 | 5.7% |
| Black / African American | 767 | 3.8% |
| Hawaiian / Pacific | 9 | 0.0% |
| Hispanic or Latino | 748 | 3.7% |
| Native / Alaskan | 68 | 0.3% |
| White / Caucasian | 16,673 | 83.3% |
| Two or more Races | 1,056 | 5.3% |
| Some other Race | 302 | 1.5% |
| Total | 20,025 | 100.0% |
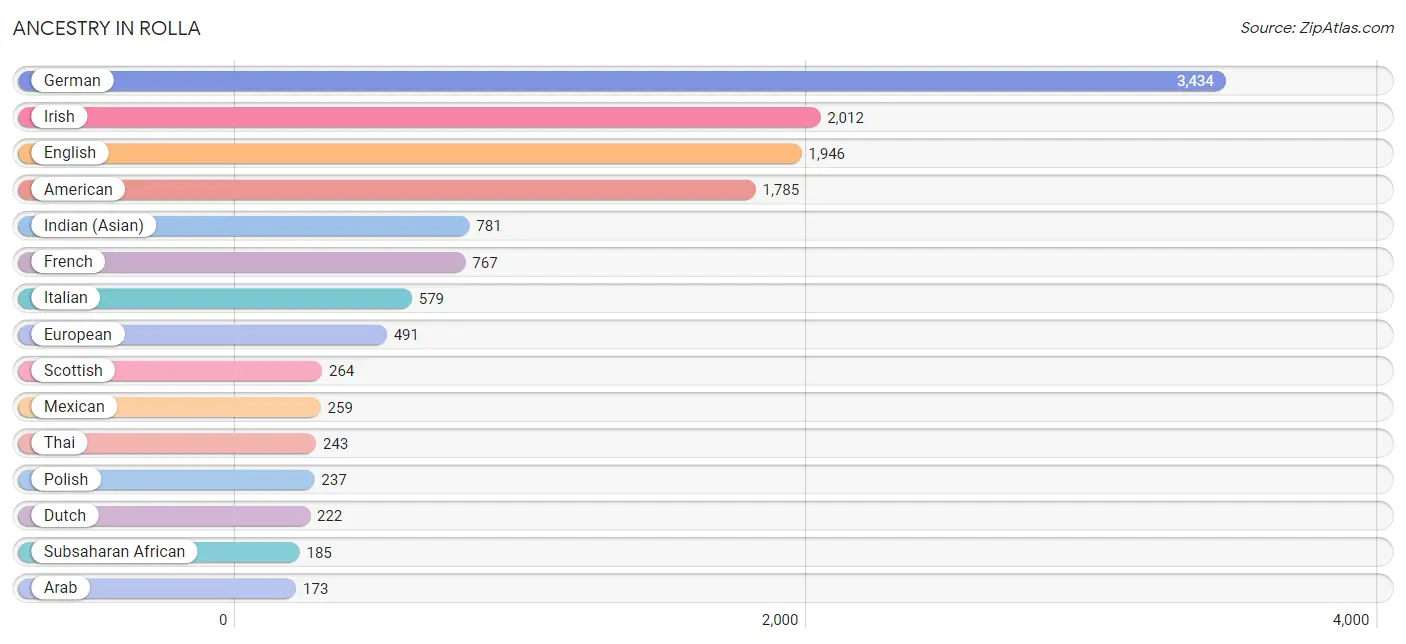
Ancestry in Rolla
The most populous ancestries reported in Rolla are German (3,434 | 17.2%), Irish (2,012 | 10.1%), English (1,946 | 9.7%), American (1,785 | 8.9%), and Indian (Asian) (781 | 3.9%), together accounting for 49.7% of all Rolla residents.
| Ancestry | # Population | % Population |
| African | 56 | 0.3% |
| Alaska Native | 14 | 0.1% |
| Albanian | 14 | 0.1% |
| American | 1,785 | 8.9% |
| Apache | 43 | 0.2% |
| Arab | 173 | 0.9% |
| Argentinean | 5 | 0.0% |
| Austrian | 57 | 0.3% |
| Belgian | 12 | 0.1% |
| Bhutanese | 29 | 0.1% |
| British | 139 | 0.7% |
| Burmese | 44 | 0.2% |
| Canadian | 40 | 0.2% |
| Central American | 64 | 0.3% |
| Cherokee | 69 | 0.3% |
| Choctaw | 35 | 0.2% |
| Colombian | 147 | 0.7% |
| Cuban | 67 | 0.3% |
| Czech | 88 | 0.4% |
| Czechoslovakian | 16 | 0.1% |
| Danish | 55 | 0.3% |
| Dutch | 222 | 1.1% |
| Dutch West Indian | 8 | 0.0% |
| Eastern European | 10 | 0.1% |
| Egyptian | 72 | 0.4% |
| English | 1,946 | 9.7% |
| European | 491 | 2.5% |
| Filipino | 5 | 0.0% |
| Finnish | 58 | 0.3% |
| French | 767 | 3.8% |
| French Canadian | 38 | 0.2% |
| German | 3,434 | 17.2% |
| Greek | 47 | 0.2% |
| Guatemalan | 64 | 0.3% |
| Hungarian | 29 | 0.1% |
| Indian (Asian) | 781 | 3.9% |
| Irish | 2,012 | 10.1% |
| Italian | 579 | 2.9% |
| Korean | 60 | 0.3% |
| Lebanese | 31 | 0.2% |
| Lithuanian | 8 | 0.0% |
| Lumbee | 12 | 0.1% |
| Mexican | 259 | 1.3% |
| Nigerian | 89 | 0.4% |
| Northern European | 10 | 0.1% |
| Norwegian | 77 | 0.4% |
| Pakistani | 74 | 0.4% |
| Palestinian | 3 | 0.0% |
| Peruvian | 11 | 0.1% |
| Polish | 237 | 1.2% |
| Portuguese | 16 | 0.1% |
| Puerto Rican | 21 | 0.1% |
| Romanian | 76 | 0.4% |
| Russian | 32 | 0.2% |
| Samoan | 9 | 0.0% |
| Scotch-Irish | 100 | 0.5% |
| Scottish | 264 | 1.3% |
| Serbian | 9 | 0.0% |
| Sioux | 11 | 0.1% |
| Slavic | 17 | 0.1% |
| South American | 163 | 0.8% |
| Spaniard | 43 | 0.2% |
| Spanish | 8 | 0.0% |
| Sri Lankan | 136 | 0.7% |
| Subsaharan African | 185 | 0.9% |
| Swedish | 150 | 0.7% |
| Swiss | 28 | 0.1% |
| Thai | 243 | 1.2% |
| Trinidadian and Tobagonian | 11 | 0.1% |
| Turkish | 46 | 0.2% |
| Ukrainian | 32 | 0.2% |
| Welsh | 43 | 0.2% |
| West Indian | 13 | 0.1% |
| Zimbabwean | 40 | 0.2% | View All 74 Rows |
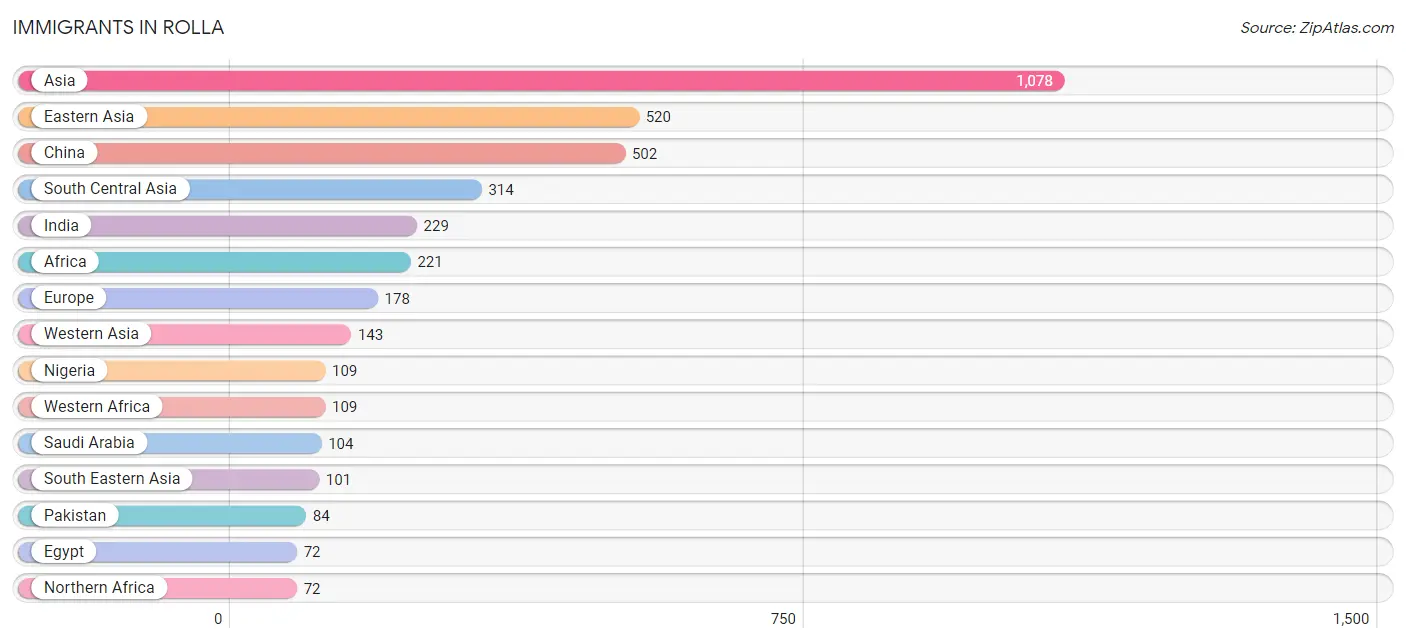
Immigrants in Rolla
The most numerous immigrant groups reported in Rolla came from Asia (1,078 | 5.4%), Eastern Asia (520 | 2.6%), China (502 | 2.5%), South Central Asia (314 | 1.6%), and India (229 | 1.1%), together accounting for 13.2% of all Rolla residents.
| Immigration Origin | # Population | % Population |
| Africa | 221 | 1.1% |
| Asia | 1,078 | 5.4% |
| Austria | 14 | 0.1% |
| Canada | 11 | 0.1% |
| Caribbean | 13 | 0.1% |
| Central America | 24 | 0.1% |
| China | 502 | 2.5% |
| Colombia | 20 | 0.1% |
| Eastern Africa | 40 | 0.2% |
| Eastern Asia | 520 | 2.6% |
| Eastern Europe | 53 | 0.3% |
| Egypt | 72 | 0.4% |
| England | 3 | 0.0% |
| Europe | 178 | 0.9% |
| France | 11 | 0.1% |
| Germany | 38 | 0.2% |
| Greece | 13 | 0.1% |
| India | 229 | 1.1% |
| Korea | 18 | 0.1% |
| Latin America | 57 | 0.3% |
| Mexico | 24 | 0.1% |
| Nigeria | 109 | 0.5% |
| Northern Africa | 72 | 0.4% |
| Northern Europe | 23 | 0.1% |
| Pakistan | 84 | 0.4% |
| Philippines | 34 | 0.2% |
| Poland | 22 | 0.1% |
| Saudi Arabia | 104 | 0.5% |
| Serbia | 9 | 0.0% |
| South America | 20 | 0.1% |
| South Central Asia | 314 | 1.6% |
| South Eastern Asia | 101 | 0.5% |
| Southern Europe | 29 | 0.1% |
| Spain | 16 | 0.1% |
| Sri Lanka | 1 | 0.0% |
| Sweden | 12 | 0.1% |
| Taiwan | 5 | 0.0% |
| Trinidad and Tobago | 13 | 0.1% |
| Turkey | 39 | 0.2% |
| Ukraine | 22 | 0.1% |
| Vietnam | 67 | 0.3% |
| Western Africa | 109 | 0.5% |
| Western Asia | 143 | 0.7% |
| Western Europe | 63 | 0.3% |
| Zimbabwe | 40 | 0.2% | View All 45 Rows |
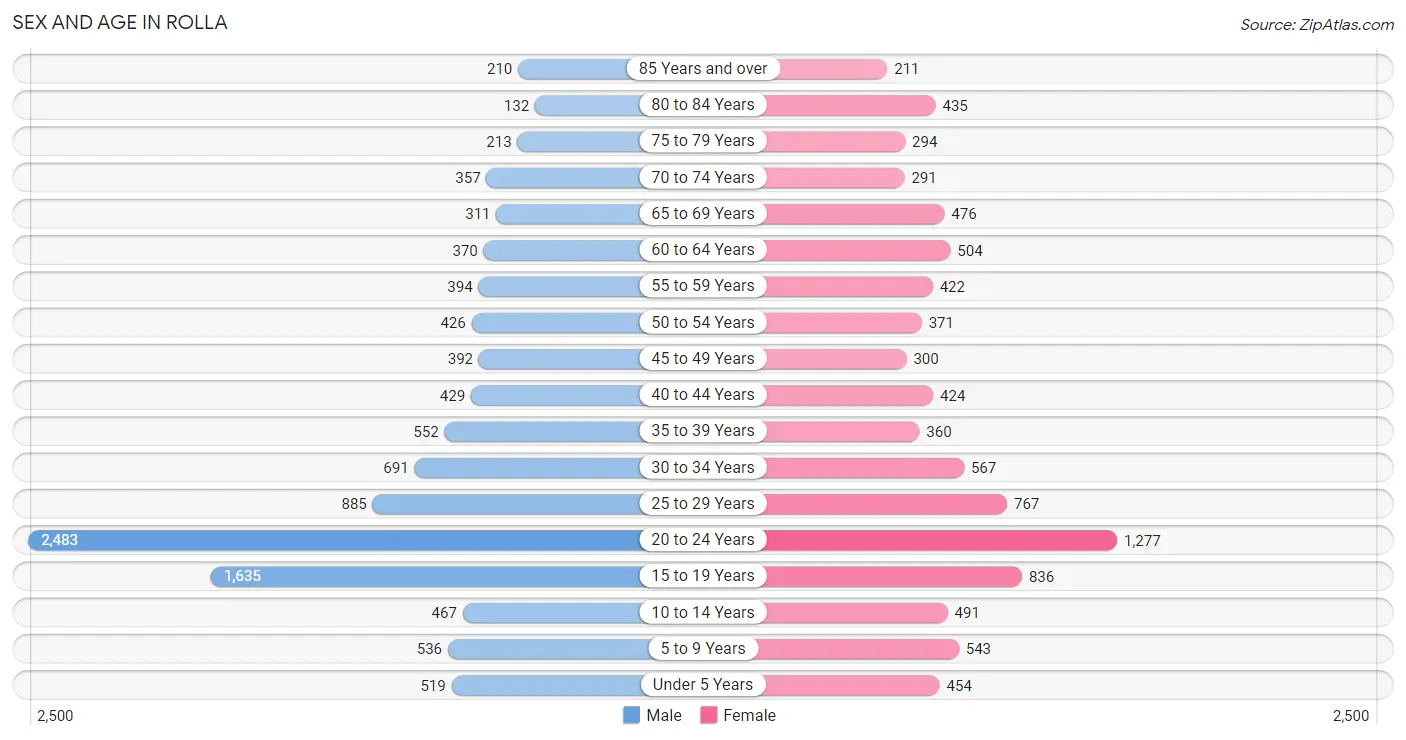
Sex and Age in Rolla
Sex and Age in Rolla
The most populous age groups in Rolla are 20 to 24 Years (2,483 | 22.6%) for men and 20 to 24 Years (1,277 | 14.1%) for women.
| Age Bracket | Male | Female |
| Under 5 Years | 519 (4.7%) | 454 (5.0%) |
| 5 to 9 Years | 536 (4.9%) | 543 (6.0%) |
| 10 to 14 Years | 467 (4.2%) | 491 (5.4%) |
| 15 to 19 Years | 1,635 (14.9%) | 836 (9.3%) |
| 20 to 24 Years | 2,483 (22.6%) | 1,277 (14.1%) |
| 25 to 29 Years | 885 (8.0%) | 767 (8.5%) |
| 30 to 34 Years | 691 (6.3%) | 567 (6.3%) |
| 35 to 39 Years | 552 (5.0%) | 360 (4.0%) |
| 40 to 44 Years | 429 (3.9%) | 424 (4.7%) |
| 45 to 49 Years | 392 (3.6%) | 300 (3.3%) |
| 50 to 54 Years | 426 (3.9%) | 371 (4.1%) |
| 55 to 59 Years | 394 (3.6%) | 422 (4.7%) |
| 60 to 64 Years | 370 (3.4%) | 504 (5.6%) |
| 65 to 69 Years | 311 (2.8%) | 476 (5.3%) |
| 70 to 74 Years | 357 (3.2%) | 291 (3.2%) |
| 75 to 79 Years | 213 (1.9%) | 294 (3.3%) |
| 80 to 84 Years | 132 (1.2%) | 435 (4.8%) |
| 85 Years and over | 210 (1.9%) | 211 (2.3%) |
| Total | 11,002 (100.0%) | 9,023 (100.0%) |
Families and Households in Rolla
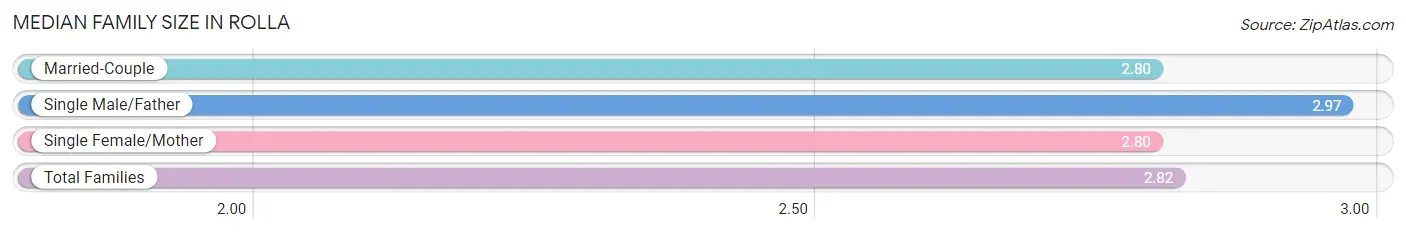
Median Family Size in Rolla
The median family size in Rolla is 2.82 persons per family, with single male/father families (353 | 9.3%) accounting for the largest median family size of 2.97 persons per family. On the other hand, married-couple families (2,628 | 68.9%) represent the smallest median family size with 2.80 persons per family.
| Family Type | # Families | Family Size |
| Married-Couple | 2,628 (68.9%) | 2.80 |
| Single Male/Father | 353 (9.3%) | 2.97 |
| Single Female/Mother | 832 (21.8%) | 2.80 |
| Total Families | 3,813 (100.0%) | 2.82 |
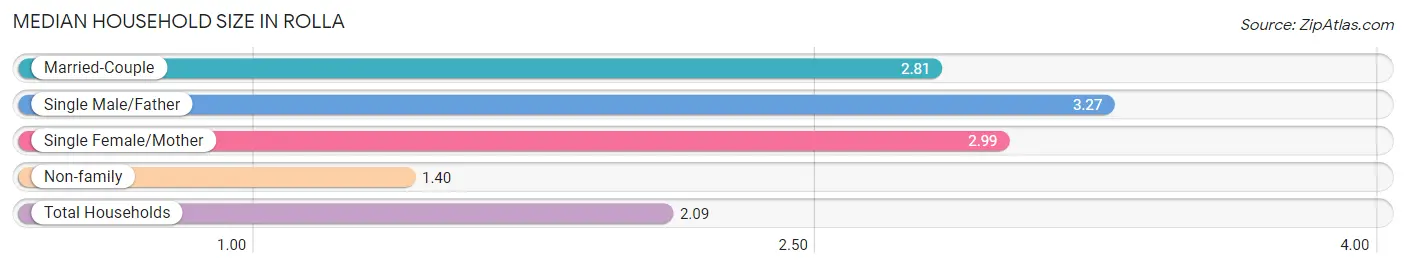
Median Household Size in Rolla
The median household size in Rolla is 2.09 persons per household, with single male/father households (353 | 4.3%) accounting for the largest median household size of 3.27 persons per household. non-family households (4,409 | 53.6%) represent the smallest median household size with 1.40 persons per household.
| Household Type | # Households | Household Size |
| Married-Couple | 2,628 (32.0%) | 2.81 |
| Single Male/Father | 353 (4.3%) | 3.27 |
| Single Female/Mother | 832 (10.1%) | 2.99 |
| Non-family | 4,409 (53.6%) | 1.40 |
| Total Households | 8,222 (100.0%) | 2.09 |
Household Size by Marriage Status in Rolla
Out of a total of 8,222 households in Rolla, 3,813 (46.4%) are family households, while 4,409 (53.6%) are nonfamily households. The most numerous type of family households are 2-person households, comprising 1,996, and the most common type of nonfamily households are 1-person households, comprising 3,410.
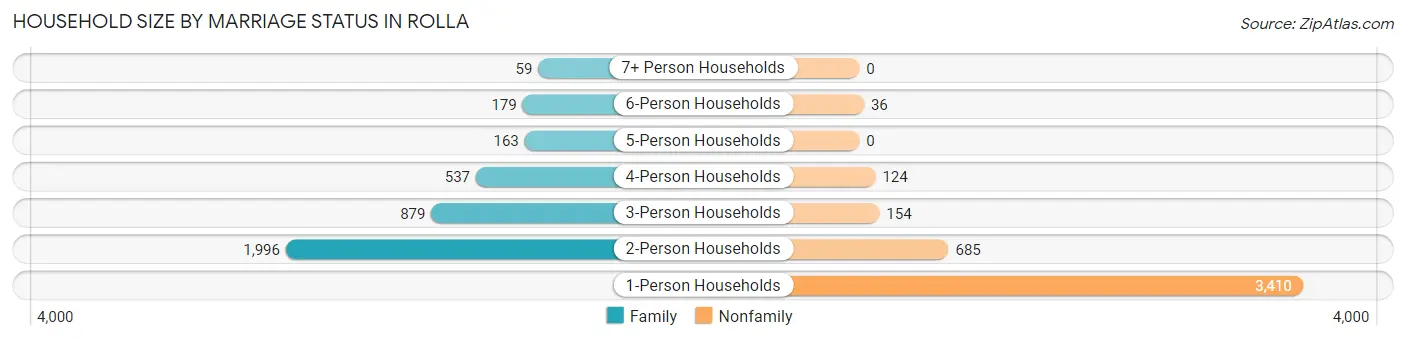
| Household Size | Family Households | Nonfamily Households |
| 1-Person Households | - | 3,410 (41.5%) |
| 2-Person Households | 1,996 (24.3%) | 685 (8.3%) |
| 3-Person Households | 879 (10.7%) | 154 (1.9%) |
| 4-Person Households | 537 (6.5%) | 124 (1.5%) |
| 5-Person Households | 163 (2.0%) | 0 (0.0%) |
| 6-Person Households | 179 (2.2%) | 36 (0.4%) |
| 7+ Person Households | 59 (0.7%) | 0 (0.0%) |
| Total | 3,813 (46.4%) | 4,409 (53.6%) |
Female Fertility in Rolla
Fertility by Age in Rolla
Average fertility rate in Rolla is 33.0 births per 1,000 women. Women in the age bracket of 20 to 34 years have the highest fertility rate with 55.0 births per 1,000 women. Women in the age bracket of 20 to 34 years acount for 94.7% of all women with births.
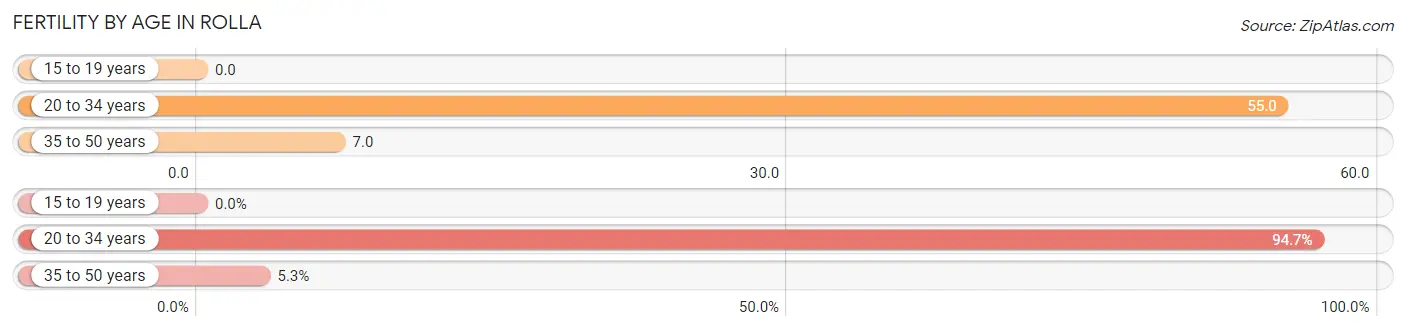
| Age Bracket | Women with Births | Births / 1,000 Women |
| 15 to 19 years | 0 (0.0%) | 0.0 |
| 20 to 34 years | 143 (94.7%) | 55.0 |
| 35 to 50 years | 8 (5.3%) | 7.0 |
| Total | 151 (100.0%) | 33.0 |
Fertility by Age by Marriage Status in Rolla
75.5% of women with births (151) in Rolla are married. The highest percentage of unmarried women with births falls into 20 to 34 years age bracket with 25.9% of them unmarried at the time of birth, while the lowest percentage of unmarried women with births belong to 35 to 50 years age bracket with 0.0% of them unmarried.
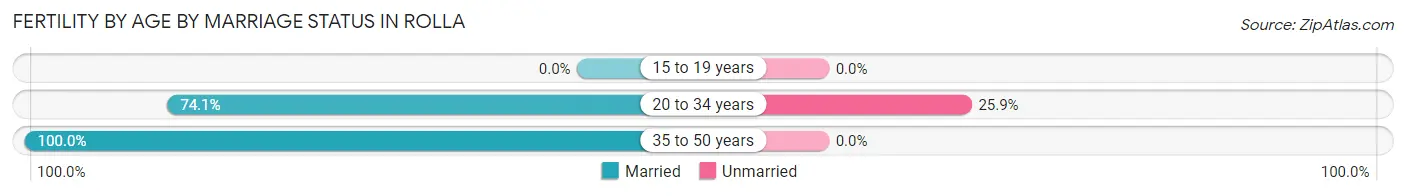
| Age Bracket | Married | Unmarried |
| 15 to 19 years | 0 (0.0%) | 0 (0.0%) |
| 20 to 34 years | 106 (74.1%) | 37 (25.9%) |
| 35 to 50 years | 8 (100.0%) | 0 (0.0%) |
| Total | 114 (75.5%) | 37 (24.5%) |
Fertility by Education in Rolla
Average fertility rate in Rolla is 33.0 births per 1,000 women. Women with the education attainment of high school diploma have the highest fertility rate of 70.0 births per 1,000 women, while women with the education attainment of college or associate's degree have the lowest fertility at 5.0 births per 1,000 women. Women with the education attainment of high school diploma represent 41.7% of all women with births.
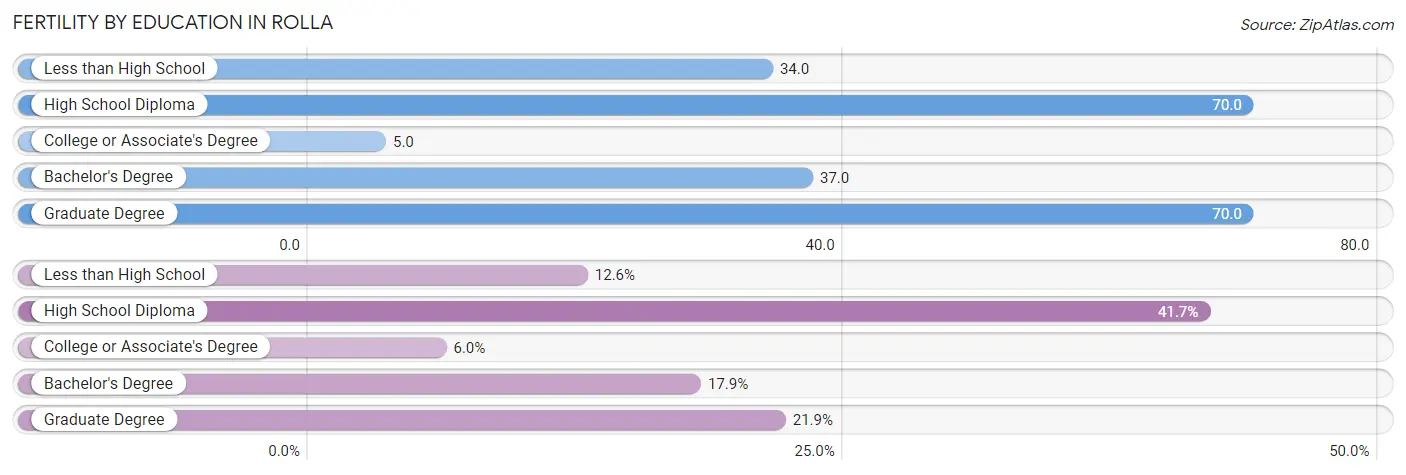
| Educational Attainment | Women with Births | Births / 1,000 Women |
| Less than High School | 19 (12.6%) | 34.0 |
| High School Diploma | 63 (41.7%) | 70.0 |
| College or Associate's Degree | 9 (6.0%) | 5.0 |
| Bachelor's Degree | 27 (17.9%) | 37.0 |
| Graduate Degree | 33 (21.8%) | 70.0 |
| Total | 151 (100.0%) | 33.0 |
Fertility by Education by Marriage Status in Rolla
24.5% of women with births in Rolla are unmarried. Women with the educational attainment of less than high school are most likely to be married with 100.0% of them married at childbirth, while women with the educational attainment of college or associate's degree are least likely to be married with 100.0% of them unmarried at childbirth.
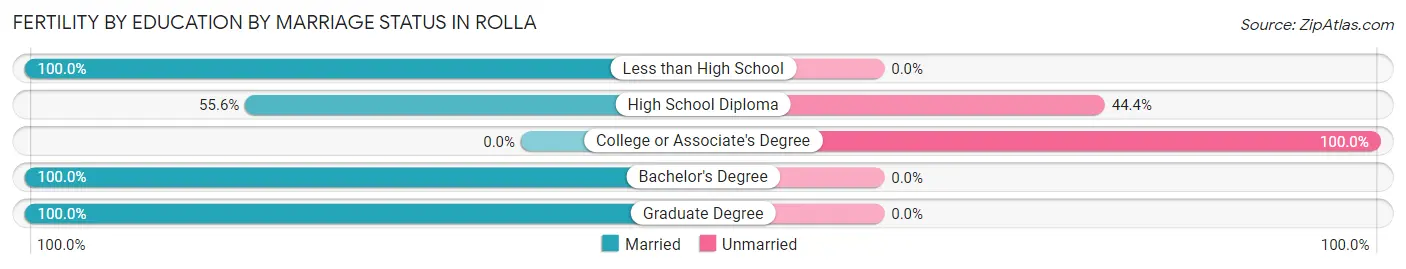
| Educational Attainment | Married | Unmarried |
| Less than High School | 19 (100.0%) | 0 (0.0%) |
| High School Diploma | 35 (55.6%) | 28 (44.4%) |
| College or Associate's Degree | 0 (0.0%) | 9 (100.0%) |
| Bachelor's Degree | 27 (100.0%) | 0 (0.0%) |
| Graduate Degree | 33 (100.0%) | 0 (0.0%) |
| Total | 114 (75.5%) | 37 (24.5%) |
Employment Characteristics in Rolla
Employment by Class of Employer in Rolla
Among the 7,763 employed individuals in Rolla, private company employees (4,133 | 53.2%), state government employees (1,234 | 15.9%), and not-for-profit organizations (964 | 12.4%) make up the most common classes of employment.
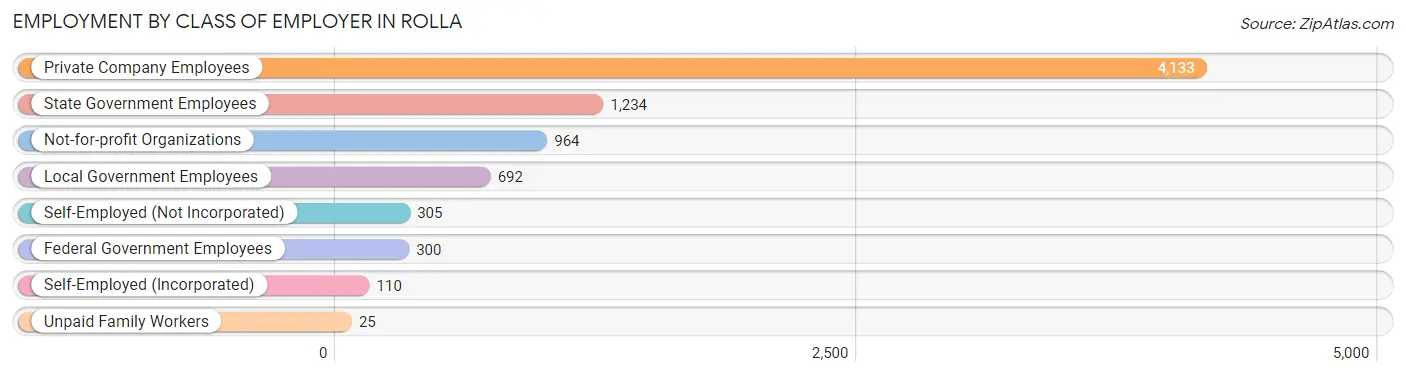
| Employer Class | # Employees | % Employees |
| Private Company Employees | 4,133 | 53.2% |
| Self-Employed (Incorporated) | 110 | 1.4% |
| Self-Employed (Not Incorporated) | 305 | 3.9% |
| Not-for-profit Organizations | 964 | 12.4% |
| Local Government Employees | 692 | 8.9% |
| State Government Employees | 1,234 | 15.9% |
| Federal Government Employees | 300 | 3.9% |
| Unpaid Family Workers | 25 | 0.3% |
| Total | 7,763 | 100.0% |
Employment Status by Age in Rolla
According to the labor force statistics for Rolla, out of the total population over 16 years of age (16,792), 50.1% or 8,413 individuals are in the labor force, with 5.0% or 421 of them unemployed. The age group with the highest labor force participation rate is 25 to 29 years, with 82.2% or 1,358 individuals in the labor force. Within the labor force, the 16 to 19 years age range has the highest percentage of unemployed individuals, with 25.1% or 108 of them being unemployed.
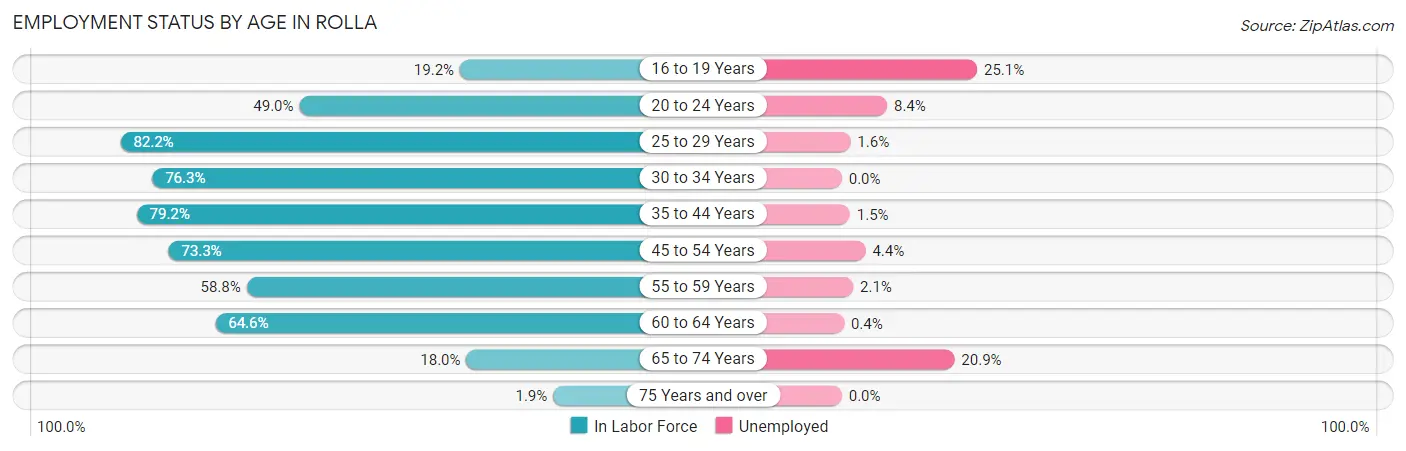
| Age Bracket | In Labor Force | Unemployed |
| 16 to 19 Years | 432 (19.2%) | 108 (25.1%) |
| 20 to 24 Years | 1,842 (49.0%) | 155 (8.4%) |
| 25 to 29 Years | 1,358 (82.2%) | 22 (1.6%) |
| 30 to 34 Years | 960 (76.3%) | 0 (0.0%) |
| 35 to 44 Years | 1,398 (79.2%) | 21 (1.5%) |
| 45 to 54 Years | 1,091 (73.3%) | 48 (4.4%) |
| 55 to 59 Years | 480 (58.8%) | 10 (2.1%) |
| 60 to 64 Years | 565 (64.6%) | 2 (0.4%) |
| 65 to 74 Years | 258 (18.0%) | 54 (20.9%) |
| 75 Years and over | 28 (1.9%) | 0 (0.0%) |
| Total | 8,413 (50.1%) | 421 (5.0%) |
Employment Status by Educational Attainment in Rolla
According to labor force statistics for Rolla, 74.5% of individuals (5,851) out of the total population between 25 and 64 years of age (7,854) are in the labor force, with 1.8% or 105 of them being unemployed. The group with the highest labor force participation rate are those with the educational attainment of bachelor's degree or higher, with 82.1% or 2,539 individuals in the labor force. Within the labor force, individuals with college / associate degree education have the highest percentage of unemployment, with 2.3% or 43 of them being unemployed.
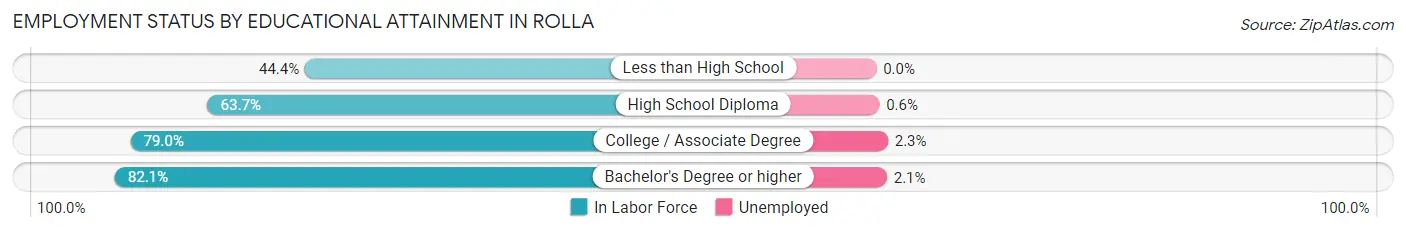
| Educational Attainment | In Labor Force | Unemployed |
| Less than High School | 178 (44.4%) | 0 (0.0%) |
| High School Diploma | 1,279 (63.7%) | 12 (0.6%) |
| College / Associate Degree | 1,859 (79.0%) | 54 (2.3%) |
| Bachelor's Degree or higher | 2,539 (82.1%) | 65 (2.1%) |
| Total | 5,851 (74.5%) | 141 (1.8%) |
Employment Occupations by Sex in Rolla
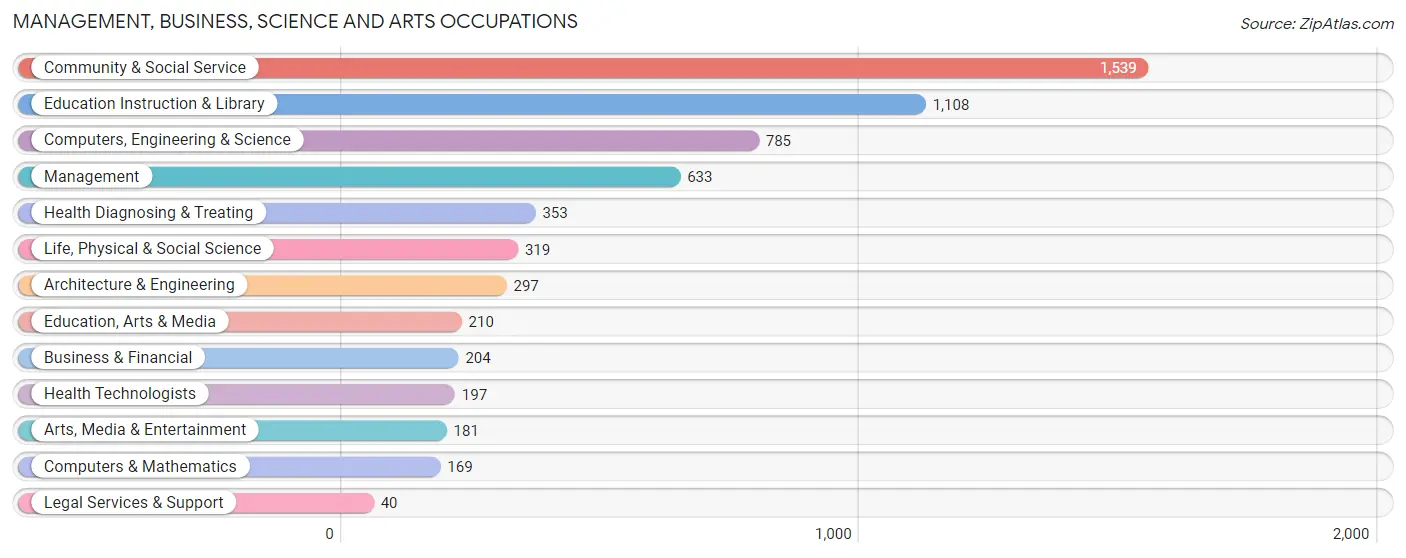
Management, Business, Science and Arts Occupations
The most common Management, Business, Science and Arts occupations in Rolla are Community & Social Service (1,539 | 19.3%), Education Instruction & Library (1,108 | 13.9%), Computers, Engineering & Science (785 | 9.9%), Management (633 | 7.9%), and Health Diagnosing & Treating (353 | 4.4%).
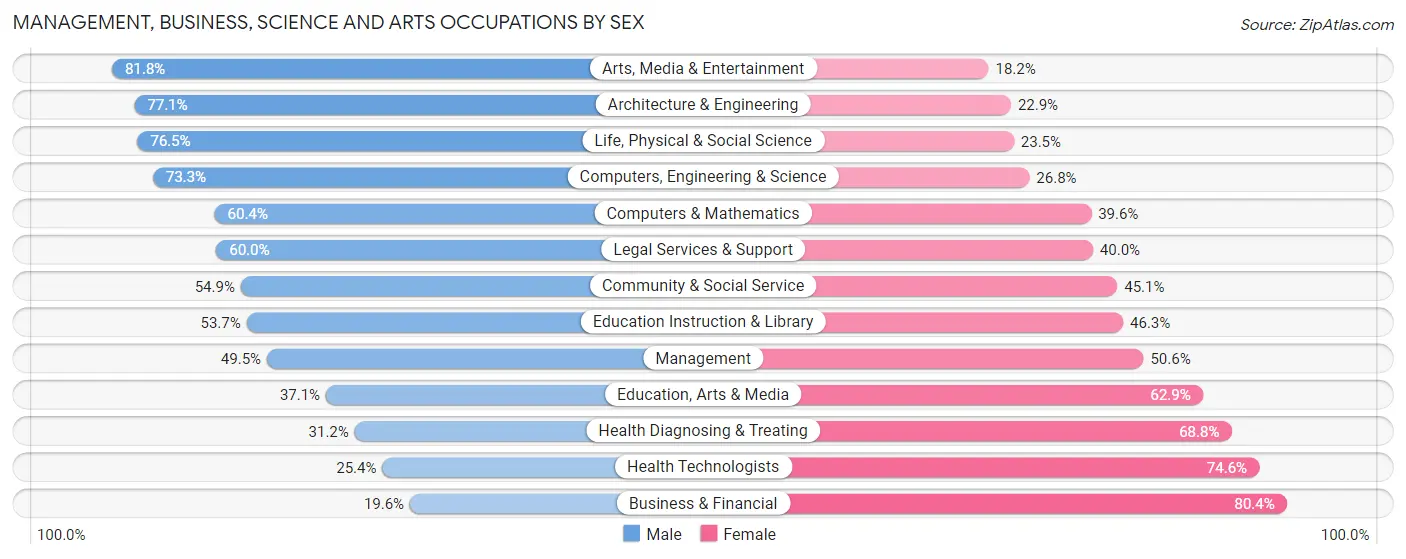
Management, Business, Science and Arts Occupations by Sex
Within the Management, Business, Science and Arts occupations in Rolla, the most male-oriented occupations are Arts, Media & Entertainment (81.8%), Architecture & Engineering (77.1%), and Life, Physical & Social Science (76.5%), while the most female-oriented occupations are Business & Financial (80.4%), Health Technologists (74.6%), and Health Diagnosing & Treating (68.8%).
| Occupation | Male | Female |
| Management | 313 (49.4%) | 320 (50.5%) |
| Business & Financial | 40 (19.6%) | 164 (80.4%) |
| Computers, Engineering & Science | 575 (73.3%) | 210 (26.8%) |
| Computers & Mathematics | 102 (60.4%) | 67 (39.6%) |
| Architecture & Engineering | 229 (77.1%) | 68 (22.9%) |
| Life, Physical & Social Science | 244 (76.5%) | 75 (23.5%) |
| Community & Social Service | 845 (54.9%) | 694 (45.1%) |
| Education, Arts & Media | 78 (37.1%) | 132 (62.9%) |
| Legal Services & Support | 24 (60.0%) | 16 (40.0%) |
| Education Instruction & Library | 595 (53.7%) | 513 (46.3%) |
| Arts, Media & Entertainment | 148 (81.8%) | 33 (18.2%) |
| Health Diagnosing & Treating | 110 (31.2%) | 243 (68.8%) |
| Health Technologists | 50 (25.4%) | 147 (74.6%) |
| Total (Category) | 1,883 (53.6%) | 1,631 (46.4%) |
| Total (Overall) | 4,254 (53.4%) | 3,718 (46.6%) |
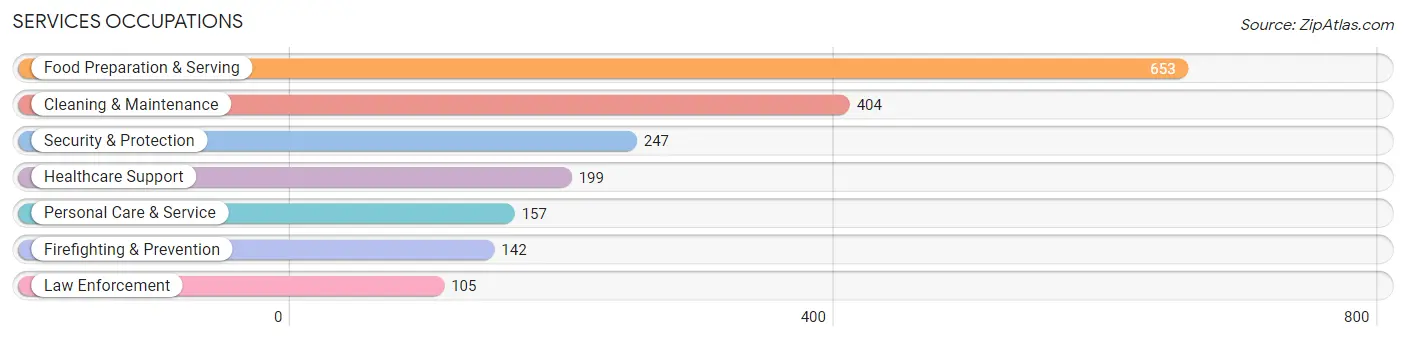
Services Occupations
The most common Services occupations in Rolla are Food Preparation & Serving (653 | 8.2%), Cleaning & Maintenance (404 | 5.1%), Security & Protection (247 | 3.1%), Healthcare Support (199 | 2.5%), and Personal Care & Service (157 | 2.0%).
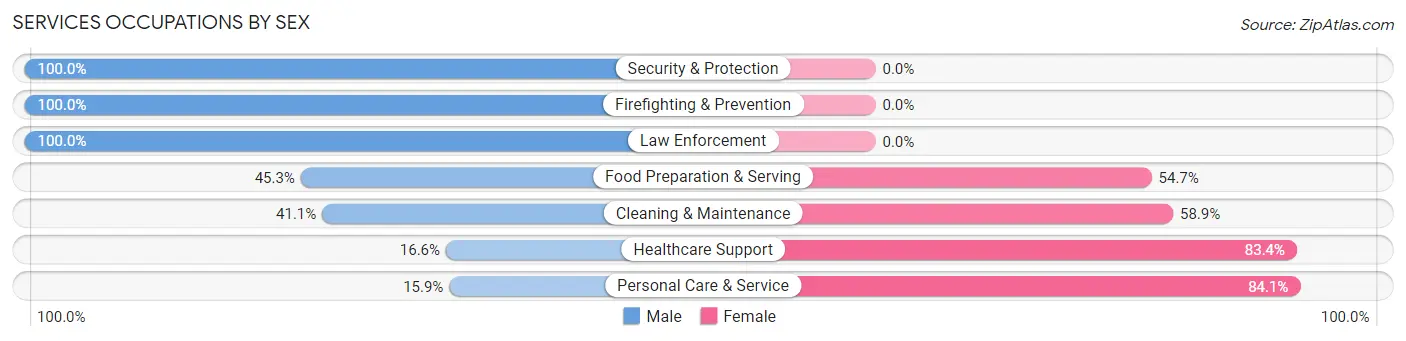
Services Occupations by Sex
Within the Services occupations in Rolla, the most male-oriented occupations are Security & Protection (100.0%), Firefighting & Prevention (100.0%), and Law Enforcement (100.0%), while the most female-oriented occupations are Personal Care & Service (84.1%), Healthcare Support (83.4%), and Cleaning & Maintenance (58.9%).
| Occupation | Male | Female |
| Healthcare Support | 33 (16.6%) | 166 (83.4%) |
| Security & Protection | 247 (100.0%) | 0 (0.0%) |
| Firefighting & Prevention | 142 (100.0%) | 0 (0.0%) |
| Law Enforcement | 105 (100.0%) | 0 (0.0%) |
| Food Preparation & Serving | 296 (45.3%) | 357 (54.7%) |
| Cleaning & Maintenance | 166 (41.1%) | 238 (58.9%) |
| Personal Care & Service | 25 (15.9%) | 132 (84.1%) |
| Total (Category) | 767 (46.2%) | 893 (53.8%) |
| Total (Overall) | 4,254 (53.4%) | 3,718 (46.6%) |
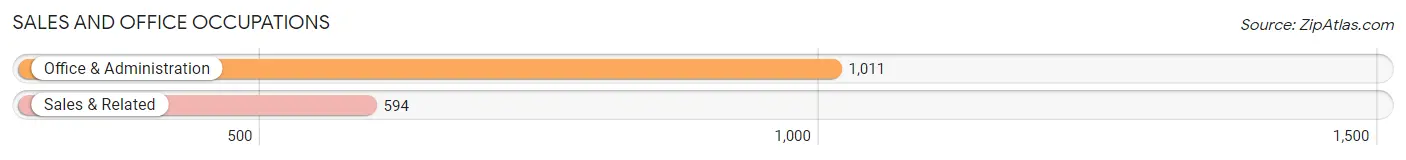
Sales and Office Occupations
The most common Sales and Office occupations in Rolla are Office & Administration (1,011 | 12.7%), and Sales & Related (594 | 7.4%).
Sales and Office Occupations by Sex
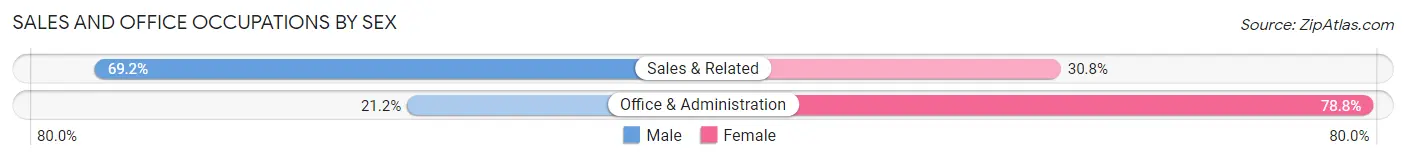
| Occupation | Male | Female |
| Sales & Related | 411 (69.2%) | 183 (30.8%) |
| Office & Administration | 214 (21.2%) | 797 (78.8%) |
| Total (Category) | 625 (38.9%) | 980 (61.1%) |
| Total (Overall) | 4,254 (53.4%) | 3,718 (46.6%) |
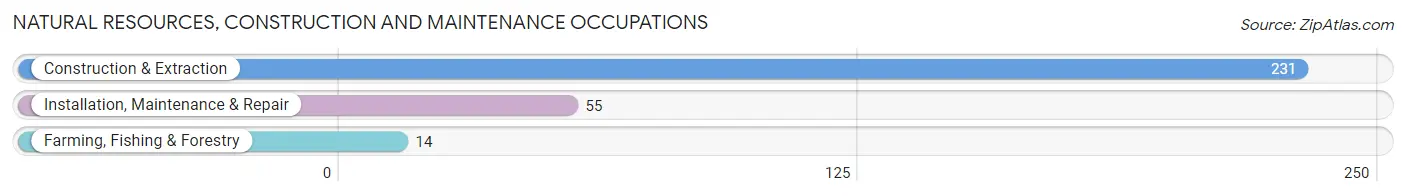
Natural Resources, Construction and Maintenance Occupations
The most common Natural Resources, Construction and Maintenance occupations in Rolla are Construction & Extraction (231 | 2.9%), Installation, Maintenance & Repair (55 | 0.7%), and Farming, Fishing & Forestry (14 | 0.2%).
Natural Resources, Construction and Maintenance Occupations by Sex
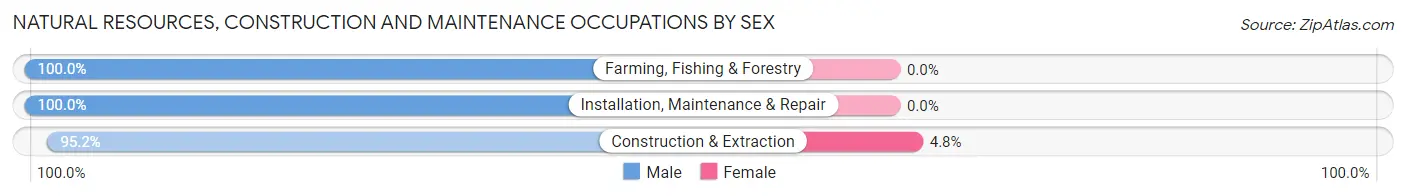
| Occupation | Male | Female |
| Farming, Fishing & Forestry | 14 (100.0%) | 0 (0.0%) |
| Construction & Extraction | 220 (95.2%) | 11 (4.8%) |
| Installation, Maintenance & Repair | 55 (100.0%) | 0 (0.0%) |
| Total (Category) | 289 (96.3%) | 11 (3.7%) |
| Total (Overall) | 4,254 (53.4%) | 3,718 (46.6%) |
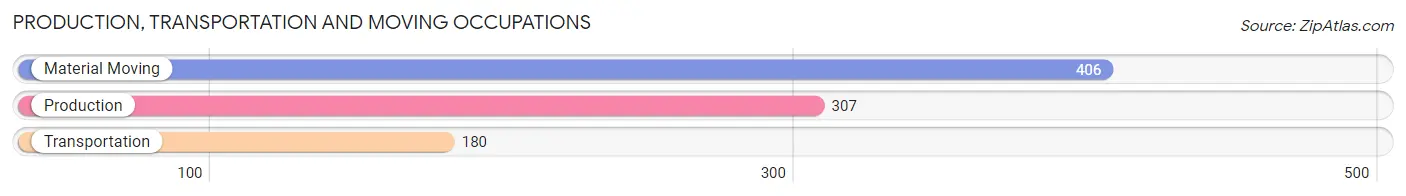
Production, Transportation and Moving Occupations
The most common Production, Transportation and Moving occupations in Rolla are Material Moving (406 | 5.1%), Production (307 | 3.8%), and Transportation (180 | 2.3%).
Production, Transportation and Moving Occupations by Sex
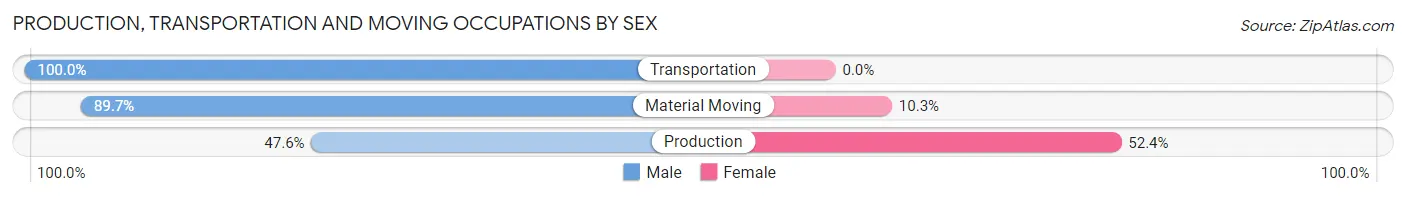
| Occupation | Male | Female |
| Production | 146 (47.6%) | 161 (52.4%) |
| Transportation | 180 (100.0%) | 0 (0.0%) |
| Material Moving | 364 (89.7%) | 42 (10.3%) |
| Total (Category) | 690 (77.3%) | 203 (22.7%) |
| Total (Overall) | 4,254 (53.4%) | 3,718 (46.6%) |
Employment Industries by Sex in Rolla
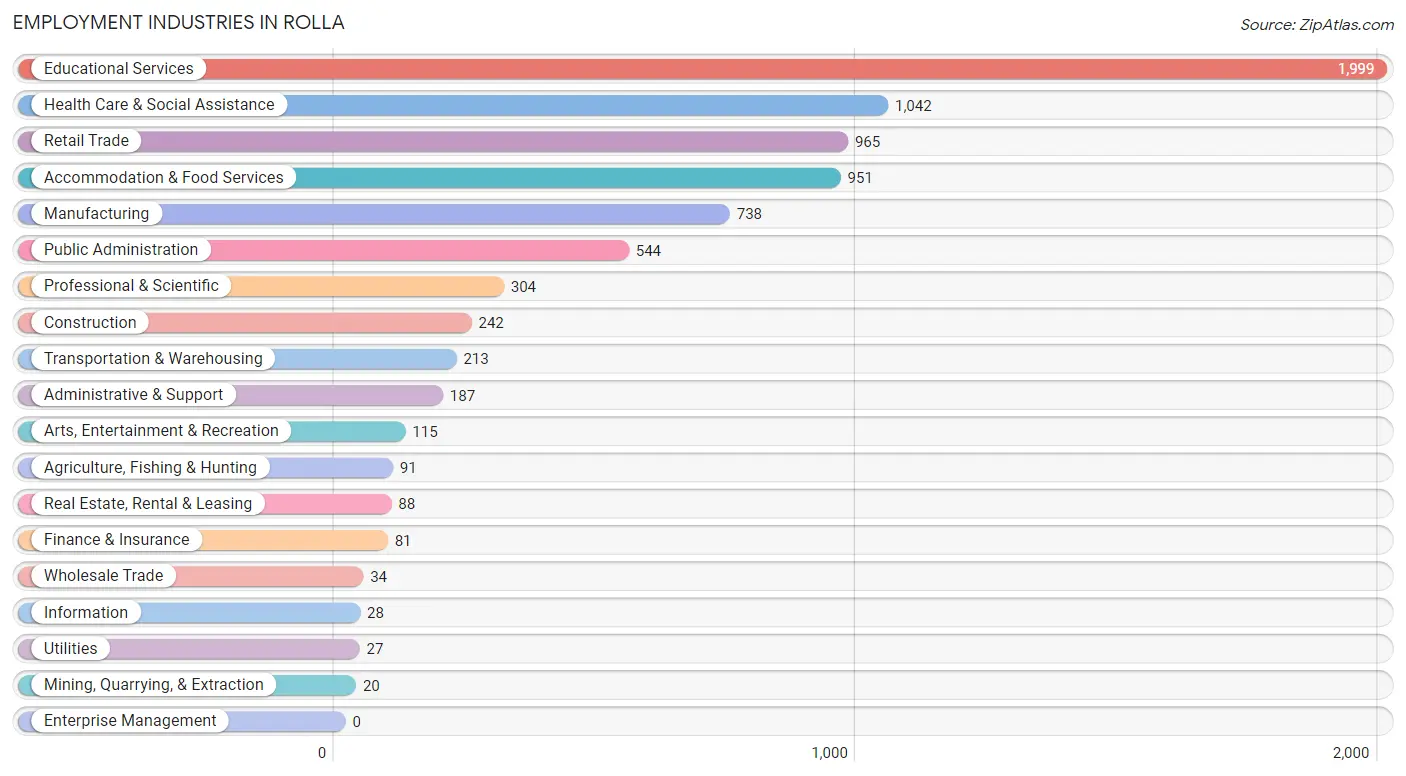
Employment Industries in Rolla
The major employment industries in Rolla include Educational Services (1,999 | 25.1%), Health Care & Social Assistance (1,042 | 13.1%), Retail Trade (965 | 12.1%), Accommodation & Food Services (951 | 11.9%), and Manufacturing (738 | 9.3%).
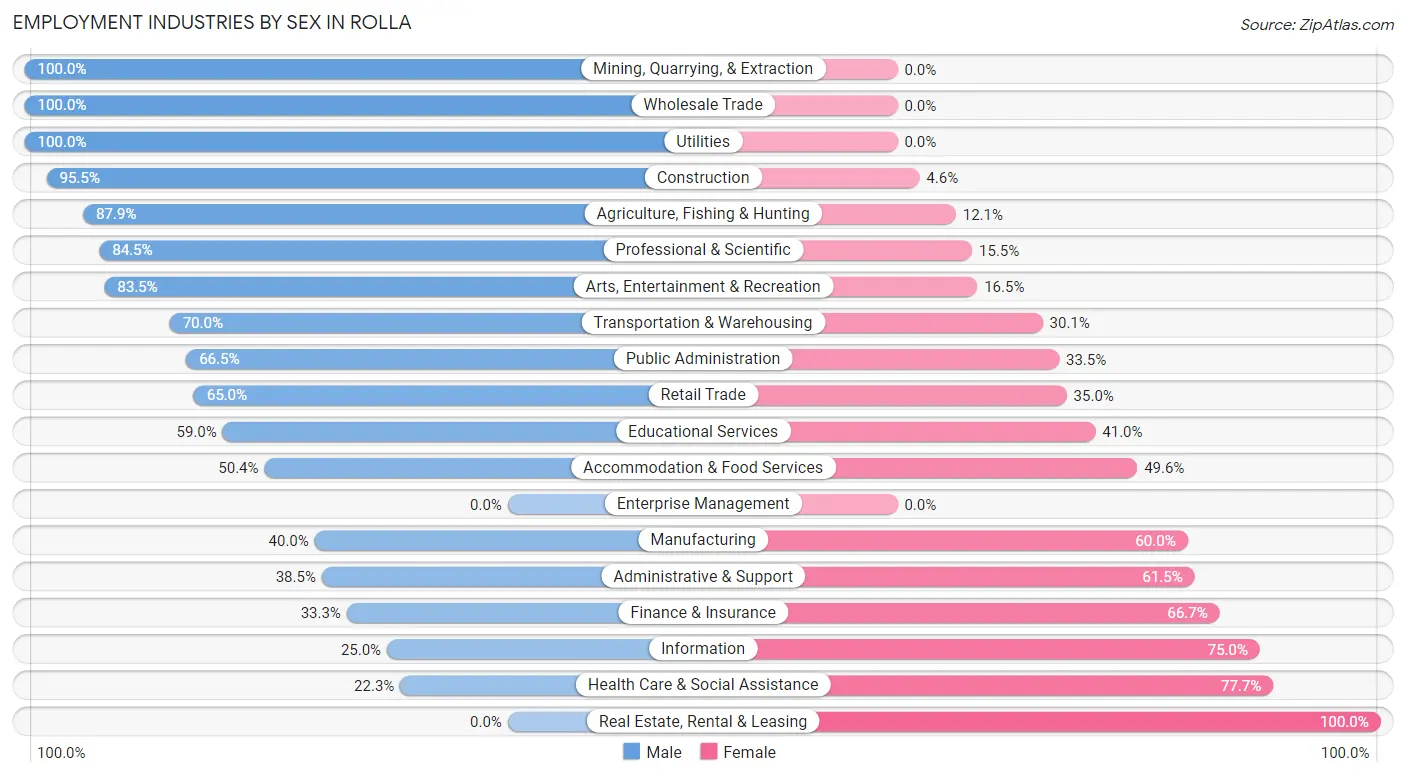
Employment Industries by Sex in Rolla
The Rolla industries that see more men than women are Mining, Quarrying, & Extraction (100.0%), Wholesale Trade (100.0%), and Utilities (100.0%), whereas the industries that tend to have a higher number of women are Real Estate, Rental & Leasing (100.0%), Health Care & Social Assistance (77.7%), and Information (75.0%).
| Industry | Male | Female |
| Agriculture, Fishing & Hunting | 80 (87.9%) | 11 (12.1%) |
| Mining, Quarrying, & Extraction | 20 (100.0%) | 0 (0.0%) |
| Construction | 231 (95.5%) | 11 (4.5%) |
| Manufacturing | 295 (40.0%) | 443 (60.0%) |
| Wholesale Trade | 34 (100.0%) | 0 (0.0%) |
| Retail Trade | 627 (65.0%) | 338 (35.0%) |
| Transportation & Warehousing | 149 (70.0%) | 64 (30.0%) |
| Utilities | 27 (100.0%) | 0 (0.0%) |
| Information | 7 (25.0%) | 21 (75.0%) |
| Finance & Insurance | 27 (33.3%) | 54 (66.7%) |
| Real Estate, Rental & Leasing | 0 (0.0%) | 88 (100.0%) |
| Professional & Scientific | 257 (84.5%) | 47 (15.5%) |
| Enterprise Management | 0 (0.0%) | 0 (0.0%) |
| Administrative & Support | 72 (38.5%) | 115 (61.5%) |
| Educational Services | 1,180 (59.0%) | 819 (41.0%) |
| Health Care & Social Assistance | 232 (22.3%) | 810 (77.7%) |
| Arts, Entertainment & Recreation | 96 (83.5%) | 19 (16.5%) |
| Accommodation & Food Services | 479 (50.4%) | 472 (49.6%) |
| Public Administration | 362 (66.5%) | 182 (33.5%) |
| Total | 4,254 (53.4%) | 3,718 (46.6%) |
Education in Rolla
School Enrollment in Rolla
The most common levels of schooling among the 8,629 students in Rolla are college / undergraduate (4,795 | 55.6%), graduate / professional (1,216 | 14.1%), and middle school (833 | 9.7%).
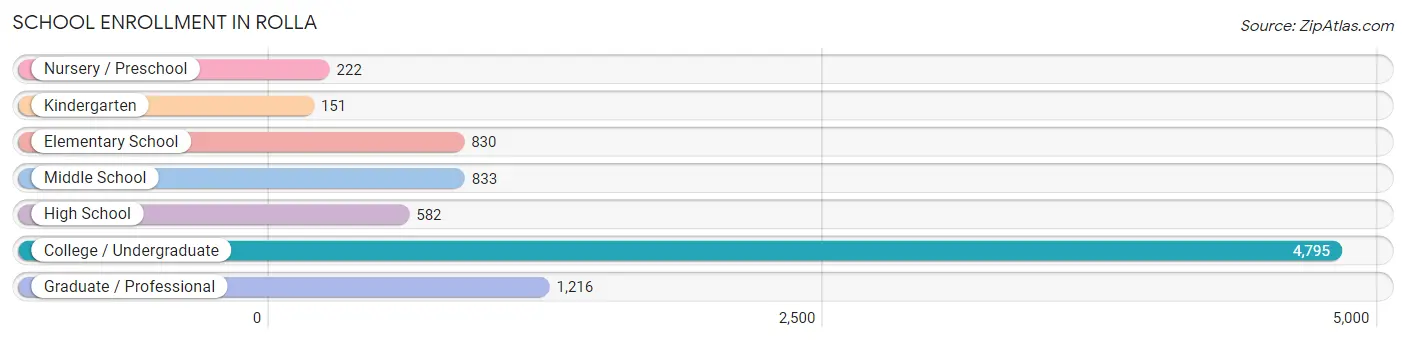
| School Level | # Students | % Students |
| Nursery / Preschool | 222 | 2.6% |
| Kindergarten | 151 | 1.8% |
| Elementary School | 830 | 9.6% |
| Middle School | 833 | 9.7% |
| High School | 582 | 6.7% |
| College / Undergraduate | 4,795 | 55.6% |
| Graduate / Professional | 1,216 | 14.1% |
| Total | 8,629 | 100.0% |
School Enrollment by Age by Funding Source in Rolla
Out of a total of 8,629 students who are enrolled in schools in Rolla, 302 (3.5%) attend a private institution, while the remaining 8,327 (96.5%) are enrolled in public schools. The age group of 35 years and over has the highest likelihood of being enrolled in private schools, with 41 (20.7% in the age bracket) enrolled. Conversely, the age group of 3 to 4 year olds has the lowest likelihood of being enrolled in a private school, with 164 (100.0% in the age bracket) attending a public institution.
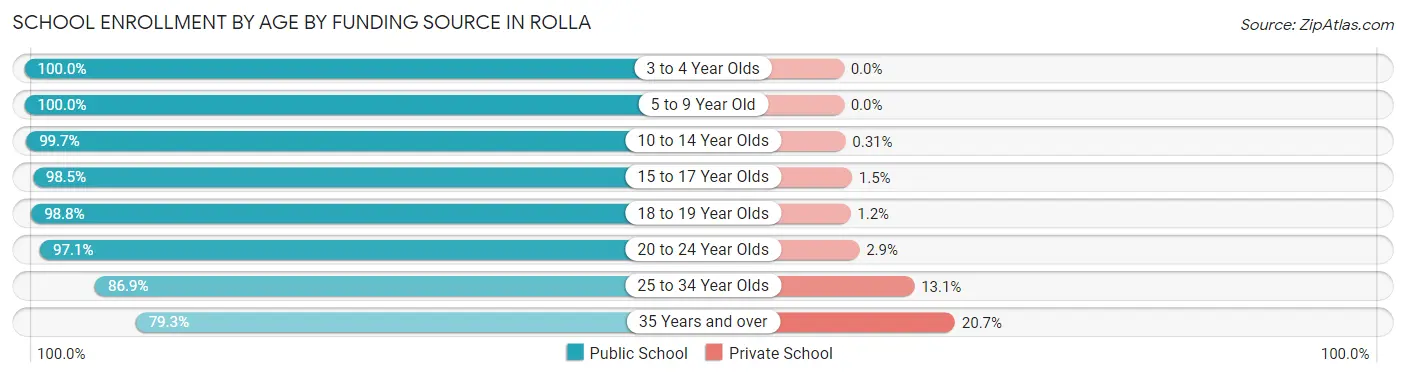
| Age Bracket | Public School | Private School |
| 3 to 4 Year Olds | 164 (100.0%) | 0 (0.0%) |
| 5 to 9 Year Old | 933 (100.0%) | 0 (0.0%) |
| 10 to 14 Year Olds | 955 (99.7%) | 3 (0.3%) |
| 15 to 17 Year Olds | 515 (98.5%) | 8 (1.5%) |
| 18 to 19 Year Olds | 1,826 (98.8%) | 23 (1.2%) |
| 20 to 24 Year Olds | 2,861 (97.1%) | 85 (2.9%) |
| 25 to 34 Year Olds | 919 (86.9%) | 139 (13.1%) |
| 35 Years and over | 157 (79.3%) | 41 (20.7%) |
| Total | 8,327 (96.5%) | 302 (3.5%) |
Educational Attainment by Field of Study in Rolla
Engineering (683 | 16.3%), business (548 | 13.1%), education (452 | 10.8%), bio, nature & agricultural (383 | 9.1%), and arts & humanities (327 | 7.8%) are the most common fields of study among 4,195 individuals in Rolla who have obtained a bachelor's degree or higher.
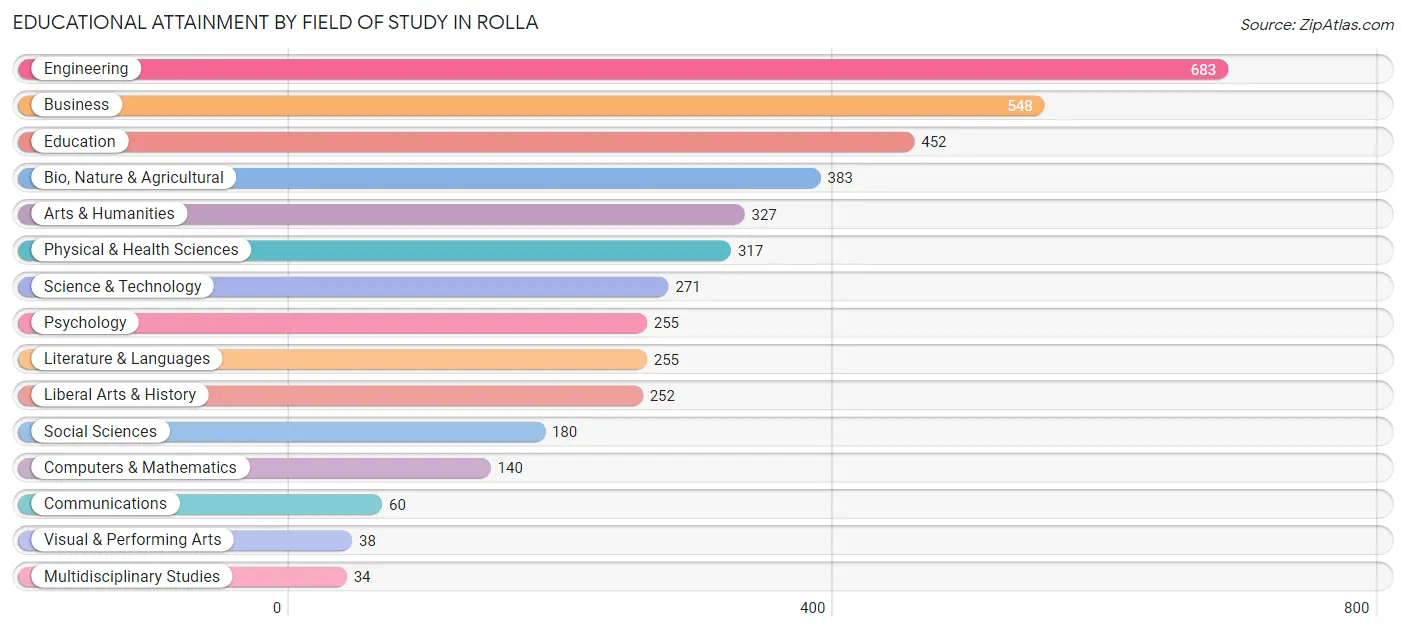
| Field of Study | # Graduates | % Graduates |
| Computers & Mathematics | 140 | 3.3% |
| Bio, Nature & Agricultural | 383 | 9.1% |
| Physical & Health Sciences | 317 | 7.6% |
| Psychology | 255 | 6.1% |
| Social Sciences | 180 | 4.3% |
| Engineering | 683 | 16.3% |
| Multidisciplinary Studies | 34 | 0.8% |
| Science & Technology | 271 | 6.5% |
| Business | 548 | 13.1% |
| Education | 452 | 10.8% |
| Literature & Languages | 255 | 6.1% |
| Liberal Arts & History | 252 | 6.0% |
| Visual & Performing Arts | 38 | 0.9% |
| Communications | 60 | 1.4% |
| Arts & Humanities | 327 | 7.8% |
| Total | 4,195 | 100.0% |
Transportation & Commute in Rolla
Vehicle Availability by Sex in Rolla
The most prevalent vehicle ownership categories in Rolla are males with 2 vehicles (1,783, accounting for 43.8%) and females with 2 vehicles (1,519, making up 48.5%).
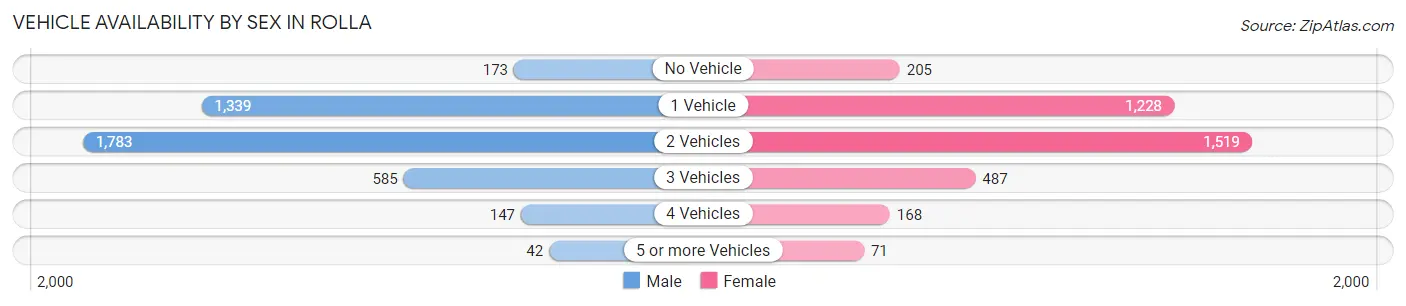
| Vehicles Available | Male | Female |
| No Vehicle | 173 (4.3%) | 205 (5.6%) |
| 1 Vehicle | 1,339 (32.9%) | 1,228 (33.4%) |
| 2 Vehicles | 1,783 (43.8%) | 1,519 (41.3%) |
| 3 Vehicles | 585 (14.4%) | 487 (13.2%) |
| 4 Vehicles | 147 (3.6%) | 168 (4.6%) |
| 5 or more Vehicles | 42 (1.0%) | 71 (1.9%) |
| Total | 4,069 (100.0%) | 3,678 (100.0%) |
Commute Time in Rolla
The most frequently occuring commute durations in Rolla are 5 to 9 minutes (2,576 commuters, 35.0%), 10 to 14 minutes (2,249 commuters, 30.6%), and 15 to 19 minutes (941 commuters, 12.8%).
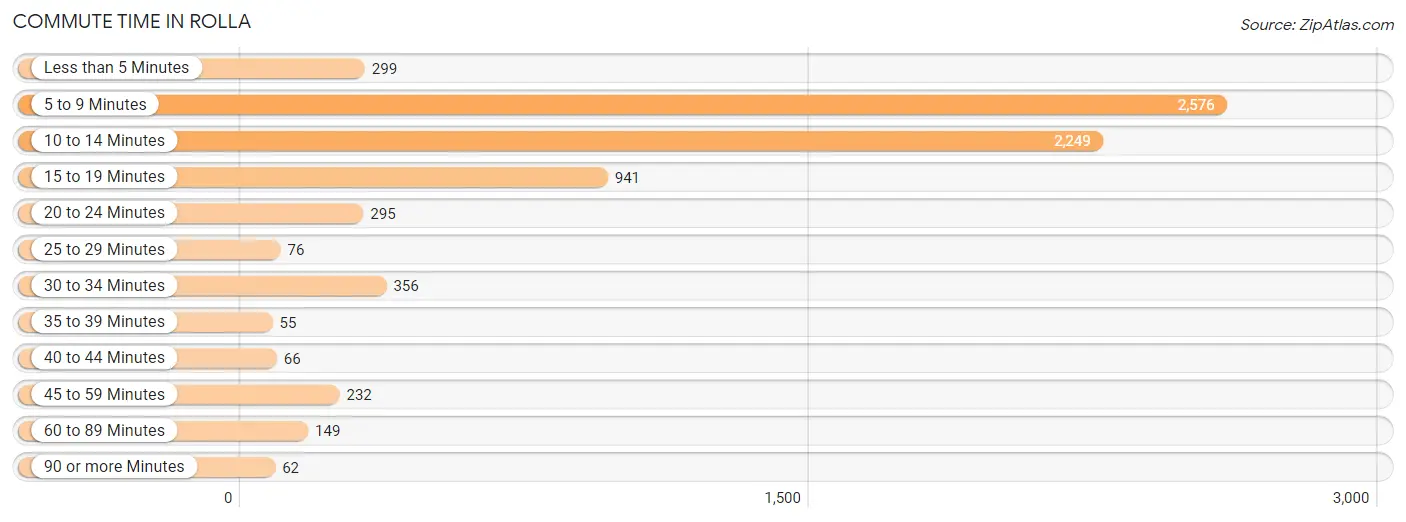
| Commute Time | # Commuters | % Commuters |
| Less than 5 Minutes | 299 | 4.1% |
| 5 to 9 Minutes | 2,576 | 35.0% |
| 10 to 14 Minutes | 2,249 | 30.6% |
| 15 to 19 Minutes | 941 | 12.8% |
| 20 to 24 Minutes | 295 | 4.0% |
| 25 to 29 Minutes | 76 | 1.0% |
| 30 to 34 Minutes | 356 | 4.8% |
| 35 to 39 Minutes | 55 | 0.7% |
| 40 to 44 Minutes | 66 | 0.9% |
| 45 to 59 Minutes | 232 | 3.2% |
| 60 to 89 Minutes | 149 | 2.0% |
| 90 or more Minutes | 62 | 0.8% |
Commute Time by Sex in Rolla
The most common commute times in Rolla are 10 to 14 minutes (1,234 commuters, 32.1%) for males and 5 to 9 minutes (1,430 commuters, 40.7%) for females.
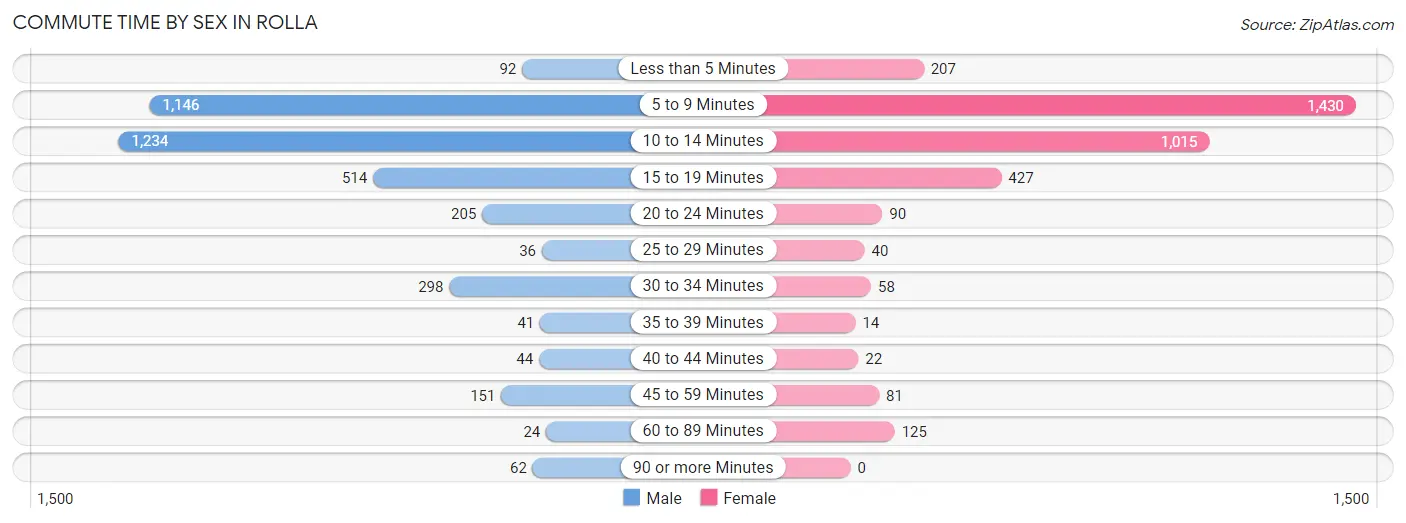
| Commute Time | Male | Female |
| Less than 5 Minutes | 92 (2.4%) | 207 (5.9%) |
| 5 to 9 Minutes | 1,146 (29.8%) | 1,430 (40.7%) |
| 10 to 14 Minutes | 1,234 (32.1%) | 1,015 (28.9%) |
| 15 to 19 Minutes | 514 (13.4%) | 427 (12.2%) |
| 20 to 24 Minutes | 205 (5.3%) | 90 (2.6%) |
| 25 to 29 Minutes | 36 (0.9%) | 40 (1.1%) |
| 30 to 34 Minutes | 298 (7.7%) | 58 (1.7%) |
| 35 to 39 Minutes | 41 (1.1%) | 14 (0.4%) |
| 40 to 44 Minutes | 44 (1.1%) | 22 (0.6%) |
| 45 to 59 Minutes | 151 (3.9%) | 81 (2.3%) |
| 60 to 89 Minutes | 24 (0.6%) | 125 (3.6%) |
| 90 or more Minutes | 62 (1.6%) | 0 (0.0%) |
Time of Departure to Work by Sex in Rolla
The most frequent times of departure to work in Rolla are 6:30 AM to 6:59 AM (636, 16.5%) for males and 7:30 AM to 7:59 AM (915, 26.1%) for females.
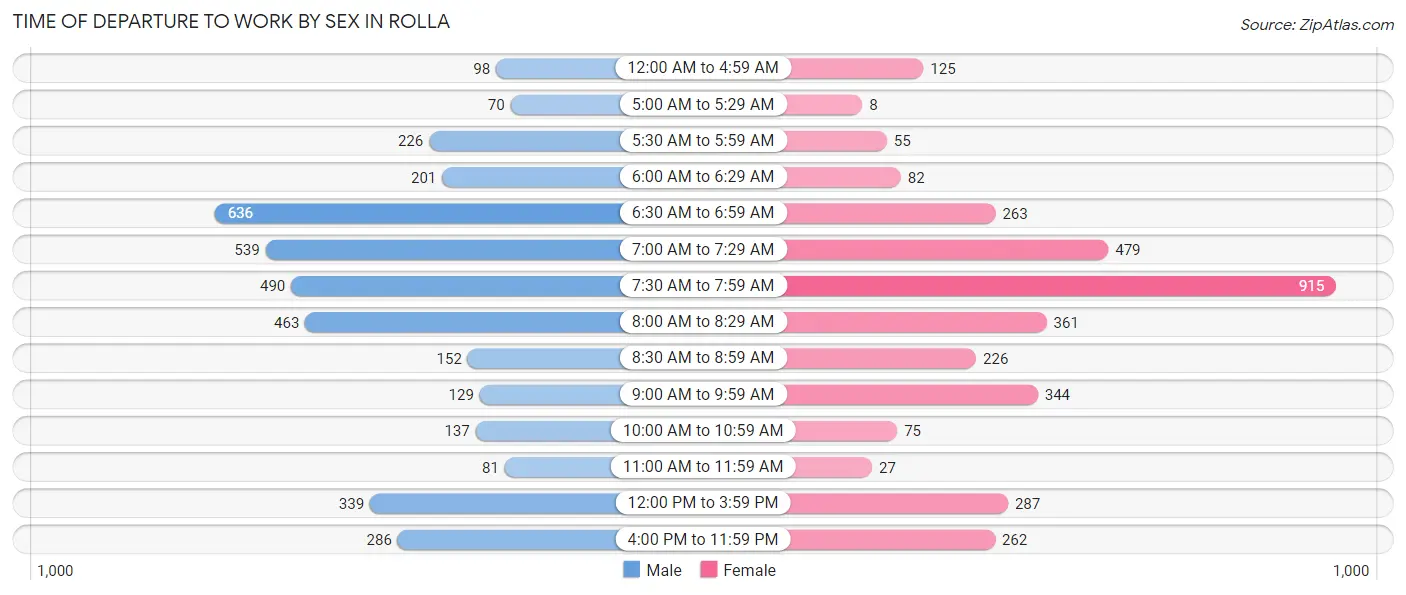
| Time of Departure | Male | Female |
| 12:00 AM to 4:59 AM | 98 (2.5%) | 125 (3.6%) |
| 5:00 AM to 5:29 AM | 70 (1.8%) | 8 (0.2%) |
| 5:30 AM to 5:59 AM | 226 (5.9%) | 55 (1.6%) |
| 6:00 AM to 6:29 AM | 201 (5.2%) | 82 (2.3%) |
| 6:30 AM to 6:59 AM | 636 (16.5%) | 263 (7.5%) |
| 7:00 AM to 7:29 AM | 539 (14.0%) | 479 (13.7%) |
| 7:30 AM to 7:59 AM | 490 (12.7%) | 915 (26.1%) |
| 8:00 AM to 8:29 AM | 463 (12.0%) | 361 (10.3%) |
| 8:30 AM to 8:59 AM | 152 (4.0%) | 226 (6.4%) |
| 9:00 AM to 9:59 AM | 129 (3.4%) | 344 (9.8%) |
| 10:00 AM to 10:59 AM | 137 (3.6%) | 75 (2.1%) |
| 11:00 AM to 11:59 AM | 81 (2.1%) | 27 (0.8%) |
| 12:00 PM to 3:59 PM | 339 (8.8%) | 287 (8.2%) |
| 4:00 PM to 11:59 PM | 286 (7.4%) | 262 (7.5%) |
| Total | 3,847 (100.0%) | 3,509 (100.0%) |
Housing Occupancy in Rolla
Occupancy by Ownership in Rolla
Of the total 8,222 dwellings in Rolla, owner-occupied units account for 3,326 (40.5%), while renter-occupied units make up 4,896 (59.6%).
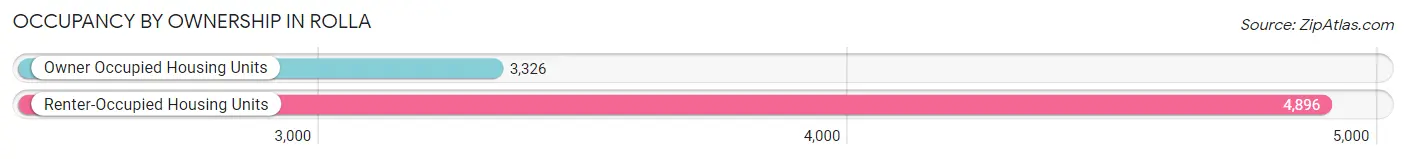
| Occupancy | # Housing Units | % Housing Units |
| Owner Occupied Housing Units | 3,326 | 40.5% |
| Renter-Occupied Housing Units | 4,896 | 59.6% |
| Total Occupied Housing Units | 8,222 | 100.0% |
Occupancy by Household Size in Rolla
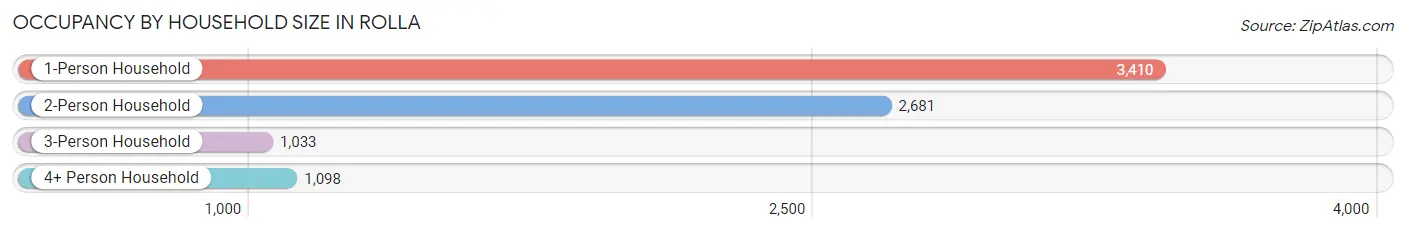
| Household Size | # Housing Units | % Housing Units |
| 1-Person Household | 3,410 | 41.5% |
| 2-Person Household | 2,681 | 32.6% |
| 3-Person Household | 1,033 | 12.6% |
| 4+ Person Household | 1,098 | 13.4% |
| Total Housing Units | 8,222 | 100.0% |
Occupancy by Ownership by Household Size in Rolla
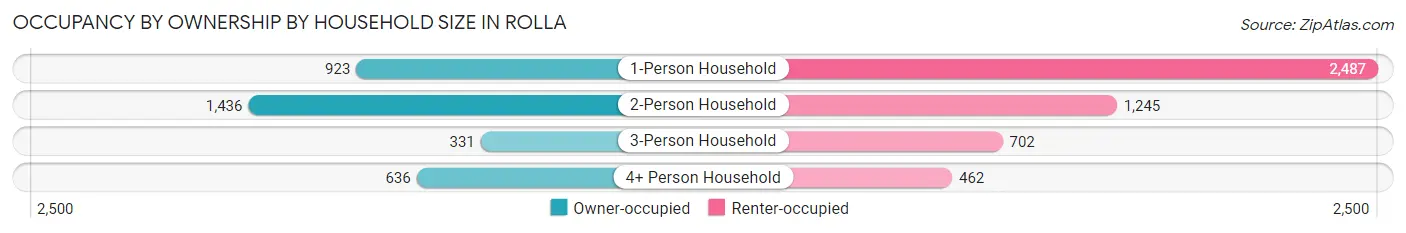
| Household Size | Owner-occupied | Renter-occupied |
| 1-Person Household | 923 (27.1%) | 2,487 (72.9%) |
| 2-Person Household | 1,436 (53.6%) | 1,245 (46.4%) |
| 3-Person Household | 331 (32.0%) | 702 (68.0%) |
| 4+ Person Household | 636 (57.9%) | 462 (42.1%) |
| Total Housing Units | 3,326 (40.5%) | 4,896 (59.6%) |
Occupancy by Educational Attainment in Rolla
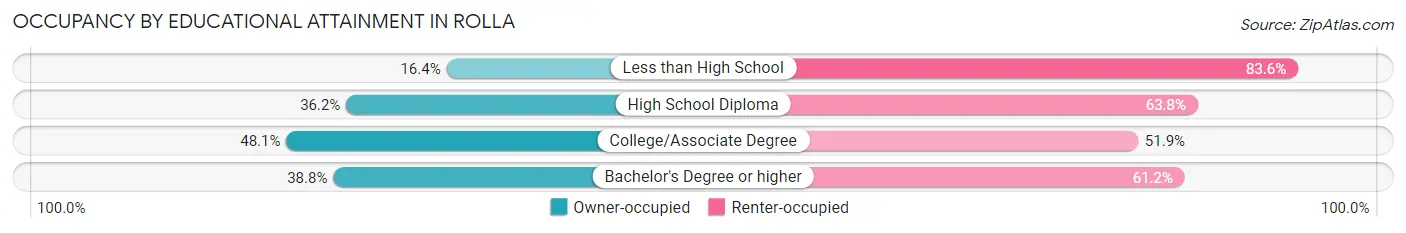
| Household Size | Owner-occupied | Renter-occupied |
| Less than High School | 72 (16.4%) | 368 (83.6%) |
| High School Diploma | 624 (36.2%) | 1,098 (63.8%) |
| College/Associate Degree | 1,438 (48.1%) | 1,551 (51.9%) |
| Bachelor's Degree or higher | 1,192 (38.8%) | 1,879 (61.2%) |
Occupancy by Age of Householder in Rolla
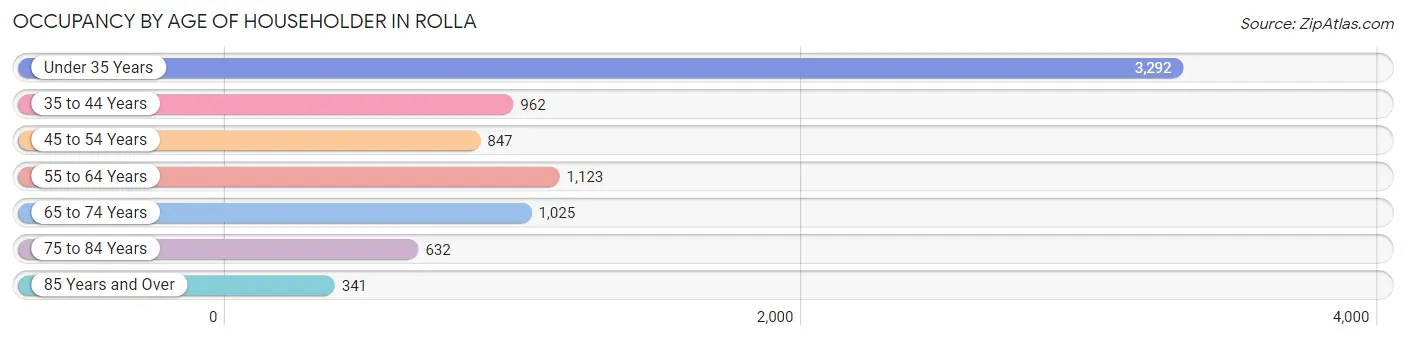
| Age Bracket | # Households | % Households |
| Under 35 Years | 3,292 | 40.0% |
| 35 to 44 Years | 962 | 11.7% |
| 45 to 54 Years | 847 | 10.3% |
| 55 to 64 Years | 1,123 | 13.7% |
| 65 to 74 Years | 1,025 | 12.5% |
| 75 to 84 Years | 632 | 7.7% |
| 85 Years and Over | 341 | 4.2% |
| Total | 8,222 | 100.0% |
Housing Finances in Rolla
Median Income by Occupancy in Rolla
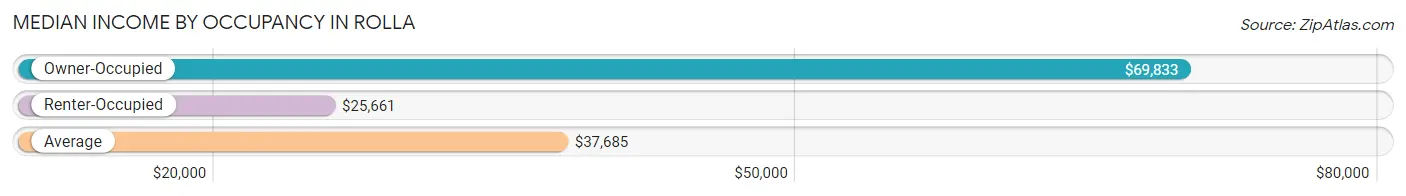
| Occupancy Type | # Households | Median Income |
| Owner-Occupied | 3,326 (40.5%) | $69,833 |
| Renter-Occupied | 4,896 (59.6%) | $25,661 |
| Average | 8,222 (100.0%) | $37,685 |
Occupancy by Householder Income Bracket in Rolla
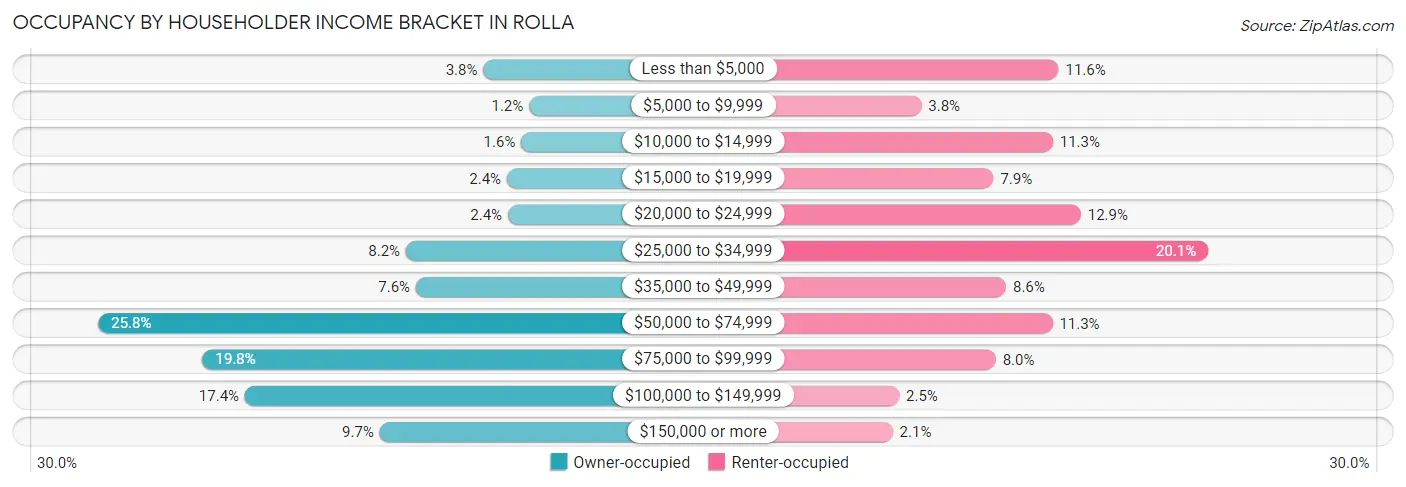
| Income Bracket | Owner-occupied | Renter-occupied |
| Less than $5,000 | 126 (3.8%) | 568 (11.6%) |
| $5,000 to $9,999 | 39 (1.2%) | 184 (3.8%) |
| $10,000 to $14,999 | 54 (1.6%) | 552 (11.3%) |
| $15,000 to $19,999 | 81 (2.4%) | 386 (7.9%) |
| $20,000 to $24,999 | 79 (2.4%) | 630 (12.9%) |
| $25,000 to $34,999 | 273 (8.2%) | 986 (20.1%) |
| $35,000 to $49,999 | 254 (7.6%) | 421 (8.6%) |
| $50,000 to $74,999 | 858 (25.8%) | 551 (11.3%) |
| $75,000 to $99,999 | 660 (19.8%) | 392 (8.0%) |
| $100,000 to $149,999 | 579 (17.4%) | 122 (2.5%) |
| $150,000 or more | 323 (9.7%) | 104 (2.1%) |
| Total | 3,326 (100.0%) | 4,896 (100.0%) |
Monthly Housing Cost Tiers in Rolla
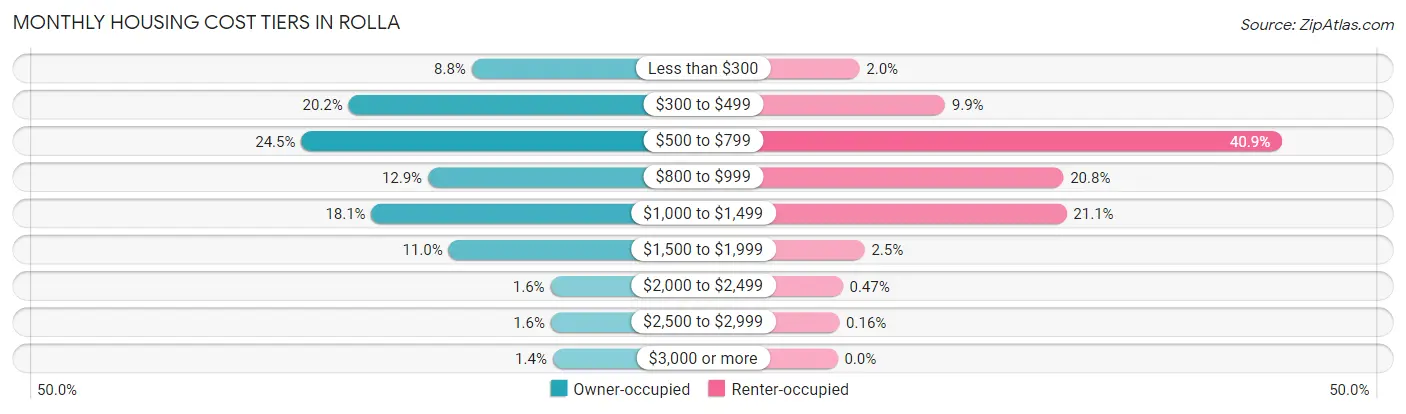
| Monthly Cost | Owner-occupied | Renter-occupied |
| Less than $300 | 294 (8.8%) | 99 (2.0%) |
| $300 to $499 | 671 (20.2%) | 484 (9.9%) |
| $500 to $799 | 816 (24.5%) | 2,004 (40.9%) |
| $800 to $999 | 428 (12.9%) | 1,018 (20.8%) |
| $1,000 to $1,499 | 601 (18.1%) | 1,032 (21.1%) |
| $1,500 to $1,999 | 365 (11.0%) | 122 (2.5%) |
| $2,000 to $2,499 | 53 (1.6%) | 23 (0.5%) |
| $2,500 to $2,999 | 52 (1.6%) | 8 (0.2%) |
| $3,000 or more | 46 (1.4%) | 0 (0.0%) |
| Total | 3,326 (100.0%) | 4,896 (100.0%) |
Physical Housing Characteristics in Rolla
Housing Structures in Rolla
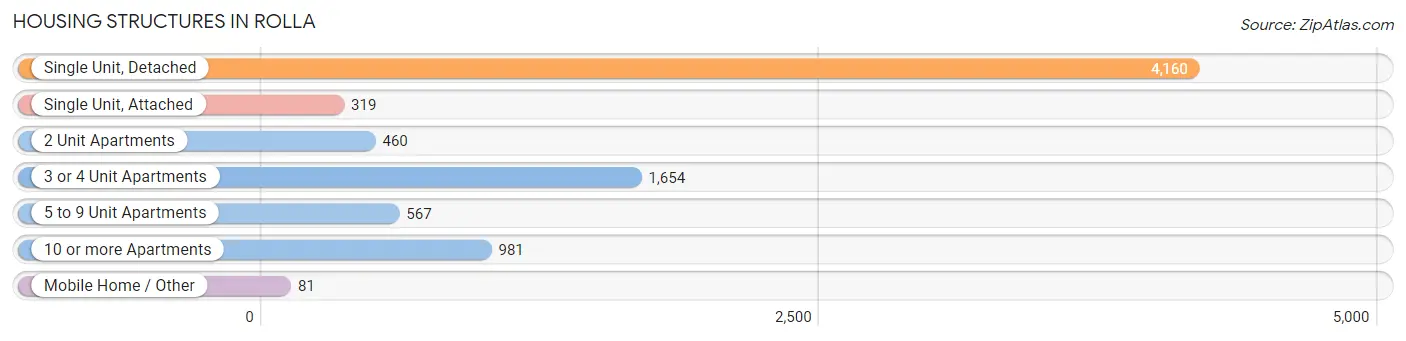
| Structure Type | # Housing Units | % Housing Units |
| Single Unit, Detached | 4,160 | 50.6% |
| Single Unit, Attached | 319 | 3.9% |
| 2 Unit Apartments | 460 | 5.6% |
| 3 or 4 Unit Apartments | 1,654 | 20.1% |
| 5 to 9 Unit Apartments | 567 | 6.9% |
| 10 or more Apartments | 981 | 11.9% |
| Mobile Home / Other | 81 | 1.0% |
| Total | 8,222 | 100.0% |
Housing Structures by Occupancy in Rolla
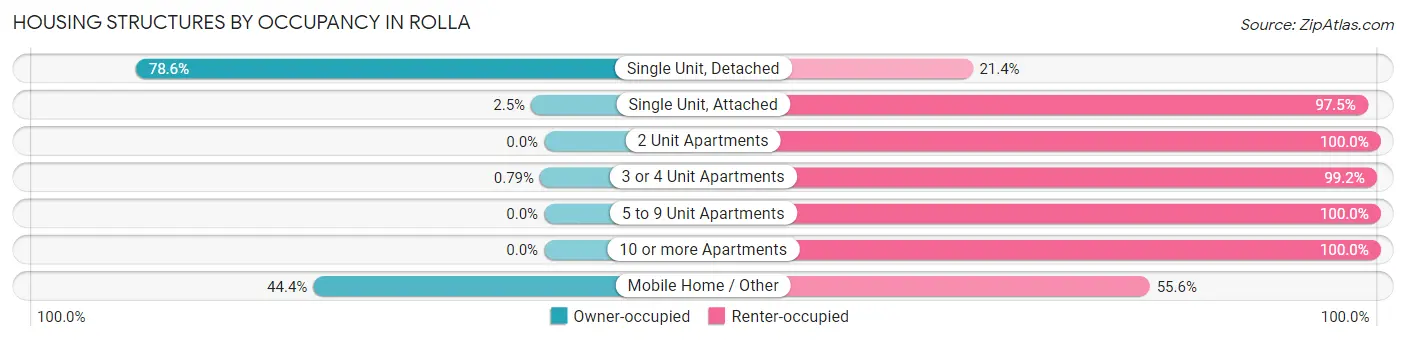
| Structure Type | Owner-occupied | Renter-occupied |
| Single Unit, Detached | 3,269 (78.6%) | 891 (21.4%) |
| Single Unit, Attached | 8 (2.5%) | 311 (97.5%) |
| 2 Unit Apartments | 0 (0.0%) | 460 (100.0%) |
| 3 or 4 Unit Apartments | 13 (0.8%) | 1,641 (99.2%) |
| 5 to 9 Unit Apartments | 0 (0.0%) | 567 (100.0%) |
| 10 or more Apartments | 0 (0.0%) | 981 (100.0%) |
| Mobile Home / Other | 36 (44.4%) | 45 (55.6%) |
| Total | 3,326 (40.5%) | 4,896 (59.6%) |
Housing Structures by Number of Rooms in Rolla
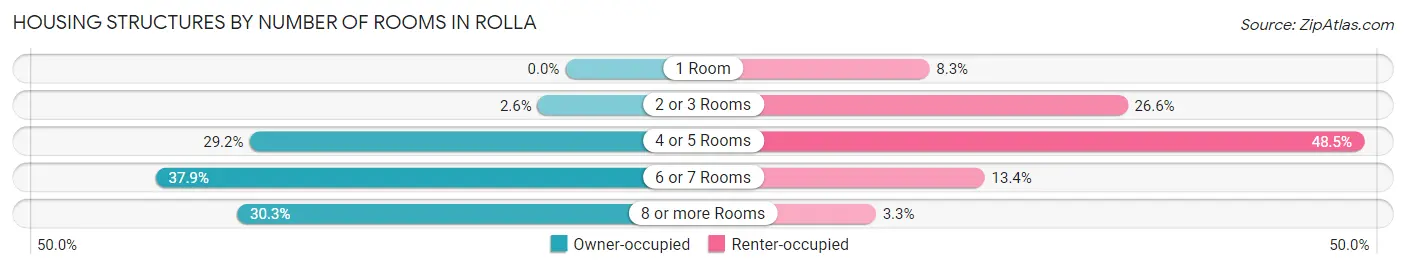
| Number of Rooms | Owner-occupied | Renter-occupied |
| 1 Room | 0 (0.0%) | 405 (8.3%) |
| 2 or 3 Rooms | 85 (2.6%) | 1,302 (26.6%) |
| 4 or 5 Rooms | 972 (29.2%) | 2,372 (48.4%) |
| 6 or 7 Rooms | 1,260 (37.9%) | 655 (13.4%) |
| 8 or more Rooms | 1,009 (30.3%) | 162 (3.3%) |
| Total | 3,326 (100.0%) | 4,896 (100.0%) |
Housing Structure by Heating Type in Rolla
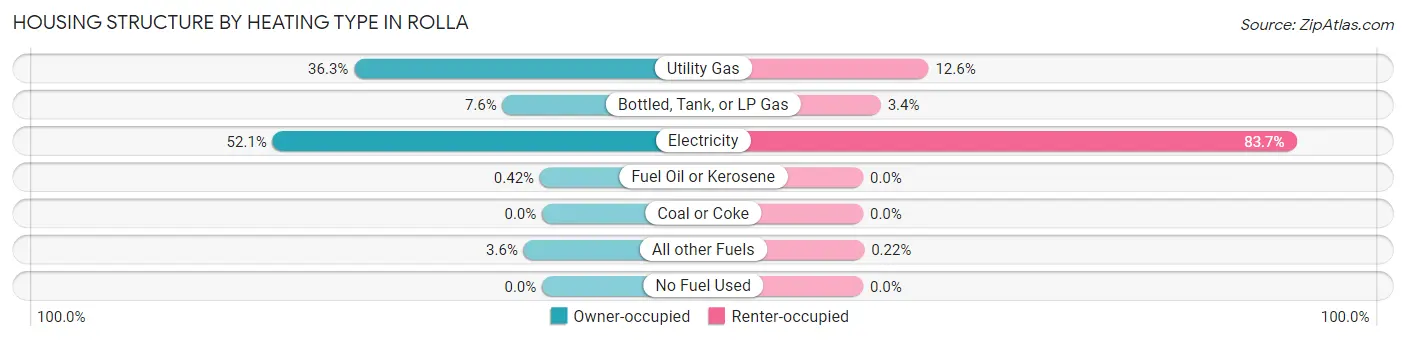
| Heating Type | Owner-occupied | Renter-occupied |
| Utility Gas | 1,208 (36.3%) | 619 (12.6%) |
| Bottled, Tank, or LP Gas | 254 (7.6%) | 167 (3.4%) |
| Electricity | 1,732 (52.1%) | 4,099 (83.7%) |
| Fuel Oil or Kerosene | 14 (0.4%) | 0 (0.0%) |
| Coal or Coke | 0 (0.0%) | 0 (0.0%) |
| All other Fuels | 118 (3.5%) | 11 (0.2%) |
| No Fuel Used | 0 (0.0%) | 0 (0.0%) |
| Total | 3,326 (100.0%) | 4,896 (100.0%) |
Household Vehicle Usage in Rolla
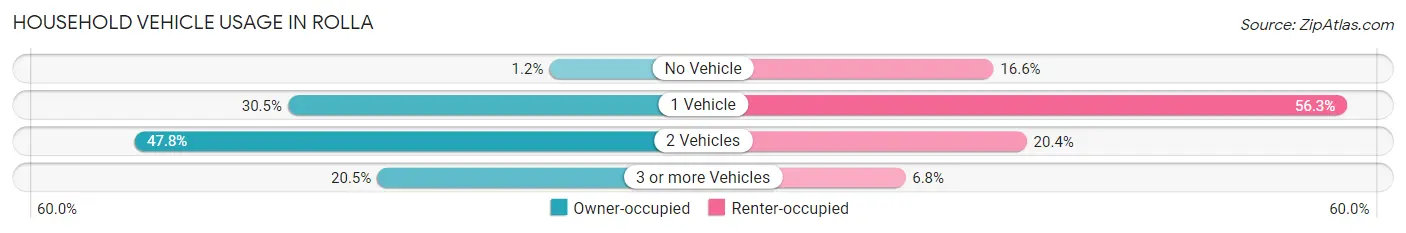
| Vehicles per Household | Owner-occupied | Renter-occupied |
| No Vehicle | 41 (1.2%) | 814 (16.6%) |
| 1 Vehicle | 1,015 (30.5%) | 2,754 (56.2%) |
| 2 Vehicles | 1,588 (47.7%) | 997 (20.4%) |
| 3 or more Vehicles | 682 (20.5%) | 331 (6.8%) |
| Total | 3,326 (100.0%) | 4,896 (100.0%) |
Real Estate & Mortgages in Rolla
Real Estate and Mortgage Overview in Rolla
| Characteristic | Without Mortgage | With Mortgage |
| Housing Units | 1,632 | 1,694 |
| Median Property Value | $149,400 | $169,000 |
| Median Household Income | $61,678 | $195 |
| Monthly Housing Costs | $462 | $35 |
| Real Estate Taxes | $1,169 | $26 |
Property Value by Mortgage Status in Rolla
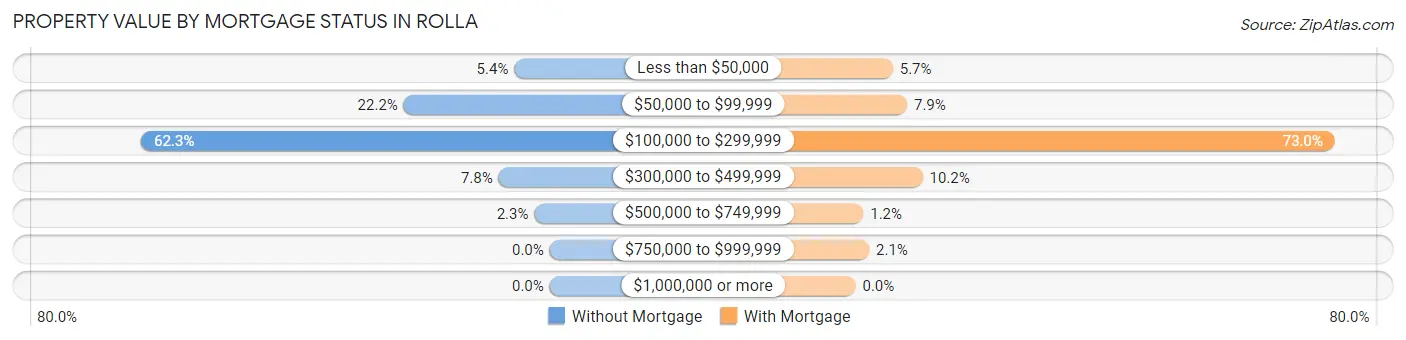
| Property Value | Without Mortgage | With Mortgage |
| Less than $50,000 | 88 (5.4%) | 96 (5.7%) |
| $50,000 to $99,999 | 363 (22.2%) | 133 (7.9%) |
| $100,000 to $299,999 | 1,016 (62.3%) | 1,237 (73.0%) |
| $300,000 to $499,999 | 127 (7.8%) | 173 (10.2%) |
| $500,000 to $749,999 | 38 (2.3%) | 20 (1.2%) |
| $750,000 to $999,999 | 0 (0.0%) | 35 (2.1%) |
| $1,000,000 or more | 0 (0.0%) | 0 (0.0%) |
| Total | 1,632 (100.0%) | 1,694 (100.0%) |
Household Income by Mortgage Status in Rolla
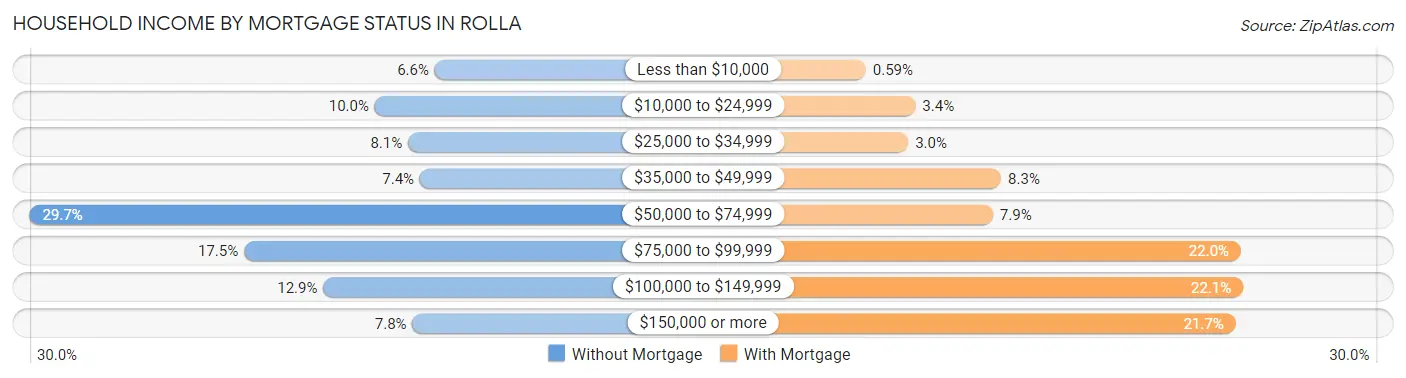
| Household Income | Without Mortgage | With Mortgage |
| Less than $10,000 | 107 (6.6%) | 10 (0.6%) |
| $10,000 to $24,999 | 163 (10.0%) | 58 (3.4%) |
| $25,000 to $34,999 | 132 (8.1%) | 51 (3.0%) |
| $35,000 to $49,999 | 121 (7.4%) | 141 (8.3%) |
| $50,000 to $74,999 | 485 (29.7%) | 133 (7.9%) |
| $75,000 to $99,999 | 285 (17.5%) | 373 (22.0%) |
| $100,000 to $149,999 | 211 (12.9%) | 375 (22.1%) |
| $150,000 or more | 128 (7.8%) | 368 (21.7%) |
| Total | 1,632 (100.0%) | 1,694 (100.0%) |
Property Value to Household Income Ratio in Rolla
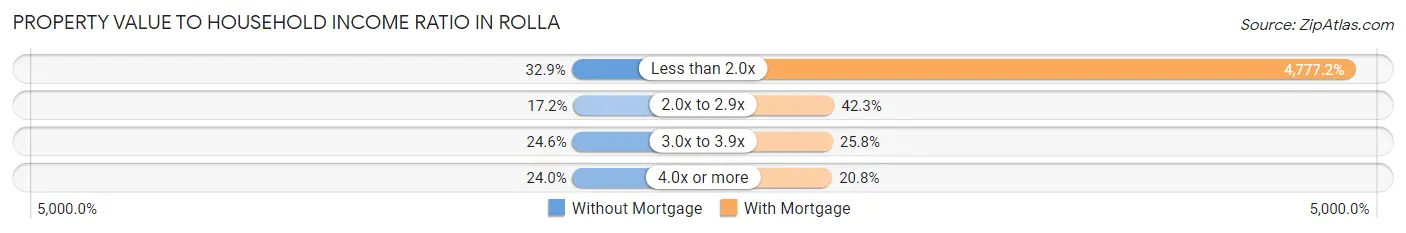
| Value-to-Income Ratio | Without Mortgage | With Mortgage |
| Less than 2.0x | 537 (32.9%) | 80,926 (4,777.2%) |
| 2.0x to 2.9x | 280 (17.2%) | 717 (42.3%) |
| 3.0x to 3.9x | 401 (24.6%) | 437 (25.8%) |
| 4.0x or more | 392 (24.0%) | 353 (20.8%) |
| Total | 1,632 (100.0%) | 1,694 (100.0%) |
Real Estate Taxes by Mortgage Status in Rolla
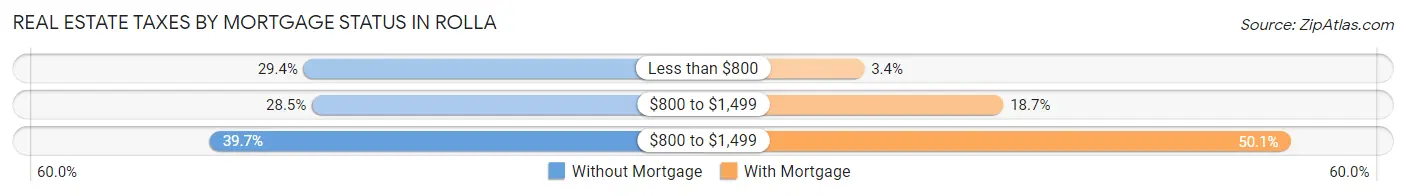
| Property Taxes | Without Mortgage | With Mortgage |
| Less than $800 | 480 (29.4%) | 58 (3.4%) |
| $800 to $1,499 | 465 (28.5%) | 316 (18.6%) |
| $800 to $1,499 | 648 (39.7%) | 849 (50.1%) |
| Total | 1,632 (100.0%) | 1,694 (100.0%) |
Health & Disability in Rolla
Health Insurance Coverage by Age in Rolla
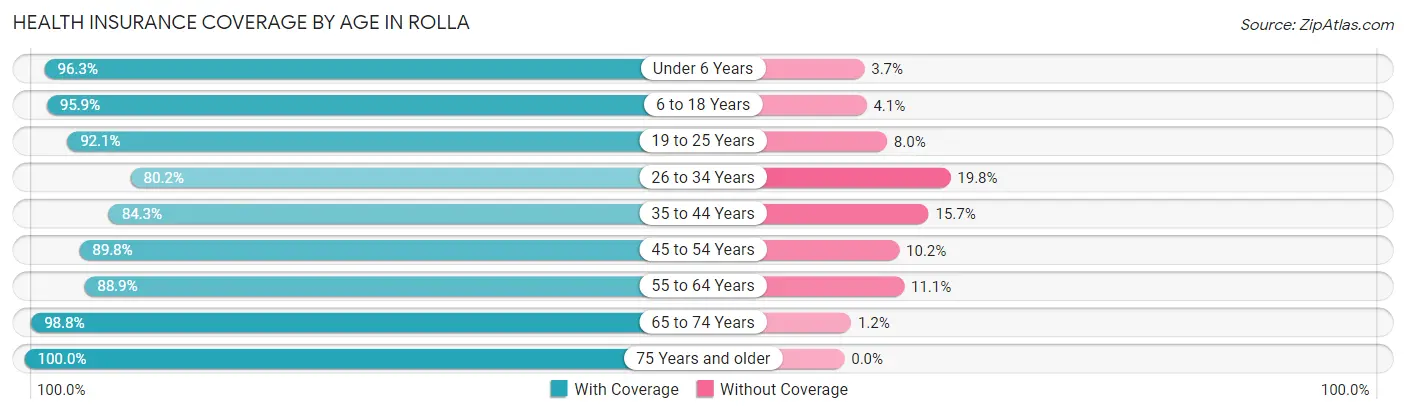
| Age Bracket | With Coverage | Without Coverage |
| Under 6 Years | 1,214 (96.3%) | 47 (3.7%) |
| 6 to 18 Years | 2,988 (95.9%) | 129 (4.1%) |
| 19 to 25 Years | 4,664 (92.0%) | 403 (8.0%) |
| 26 to 34 Years | 2,076 (80.2%) | 512 (19.8%) |
| 35 to 44 Years | 1,438 (84.3%) | 268 (15.7%) |
| 45 to 54 Years | 1,318 (89.8%) | 150 (10.2%) |
| 55 to 64 Years | 1,467 (88.9%) | 184 (11.1%) |
| 65 to 74 Years | 1,350 (98.8%) | 17 (1.2%) |
| 75 Years and older | 1,382 (100.0%) | 0 (0.0%) |
| Total | 17,897 (91.3%) | 1,710 (8.7%) |
Health Insurance Coverage by Citizenship Status in Rolla
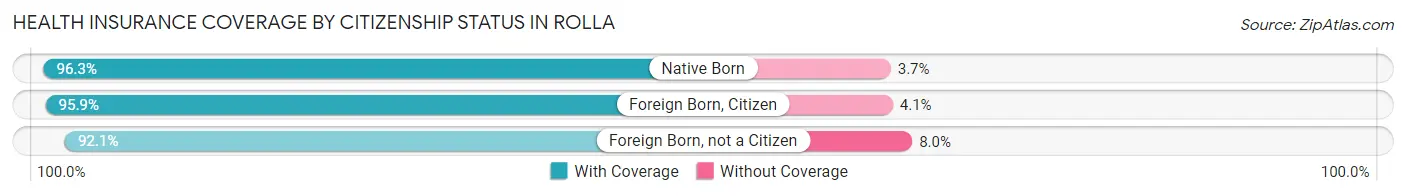
| Citizenship Status | With Coverage | Without Coverage |
| Native Born | 1,214 (96.3%) | 47 (3.7%) |
| Foreign Born, Citizen | 2,988 (95.9%) | 129 (4.1%) |
| Foreign Born, not a Citizen | 4,664 (92.0%) | 403 (8.0%) |
Health Insurance Coverage by Household Income in Rolla
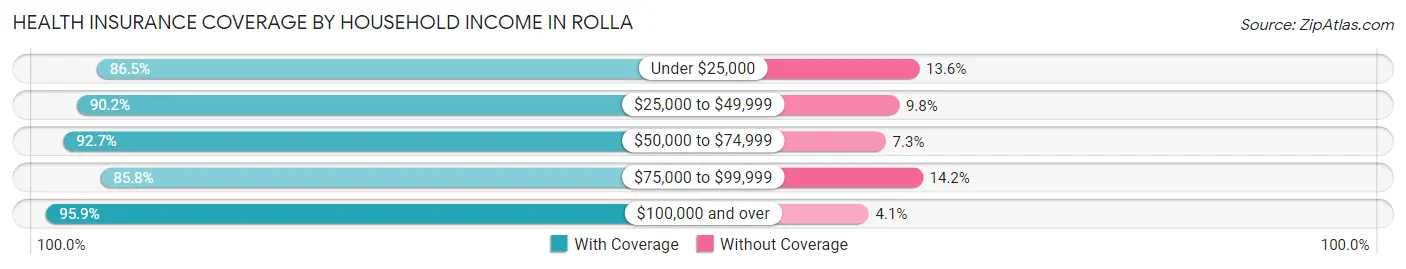
| Household Income | With Coverage | Without Coverage |
| Under $25,000 | 3,553 (86.5%) | 557 (13.6%) |
| $25,000 to $49,999 | 3,422 (90.2%) | 371 (9.8%) |
| $50,000 to $74,999 | 2,931 (92.7%) | 230 (7.3%) |
| $75,000 to $99,999 | 2,490 (85.8%) | 412 (14.2%) |
| $100,000 and over | 3,079 (95.9%) | 131 (4.1%) |
Public vs Private Health Insurance Coverage by Age in Rolla
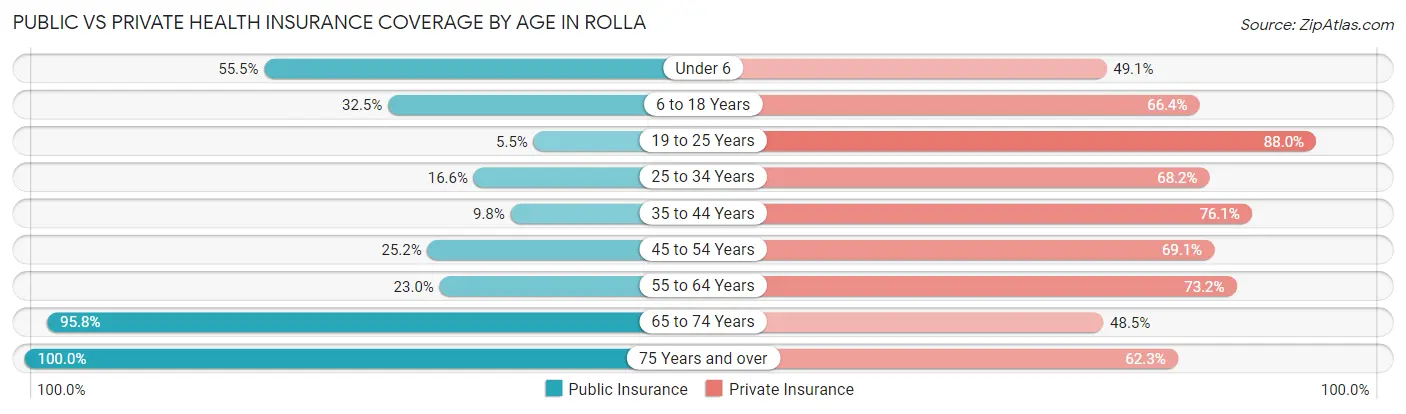
| Age Bracket | Public Insurance | Private Insurance |
| Under 6 | 700 (55.5%) | 619 (49.1%) |
| 6 to 18 Years | 1,014 (32.5%) | 2,068 (66.3%) |
| 19 to 25 Years | 279 (5.5%) | 4,459 (88.0%) |
| 25 to 34 Years | 430 (16.6%) | 1,765 (68.2%) |
| 35 to 44 Years | 167 (9.8%) | 1,298 (76.1%) |
| 45 to 54 Years | 370 (25.2%) | 1,014 (69.1%) |
| 55 to 64 Years | 379 (23.0%) | 1,209 (73.2%) |
| 65 to 74 Years | 1,310 (95.8%) | 663 (48.5%) |
| 75 Years and over | 1,382 (100.0%) | 861 (62.3%) |
| Total | 6,031 (30.8%) | 13,956 (71.2%) |
Disability Status by Sex by Age in Rolla
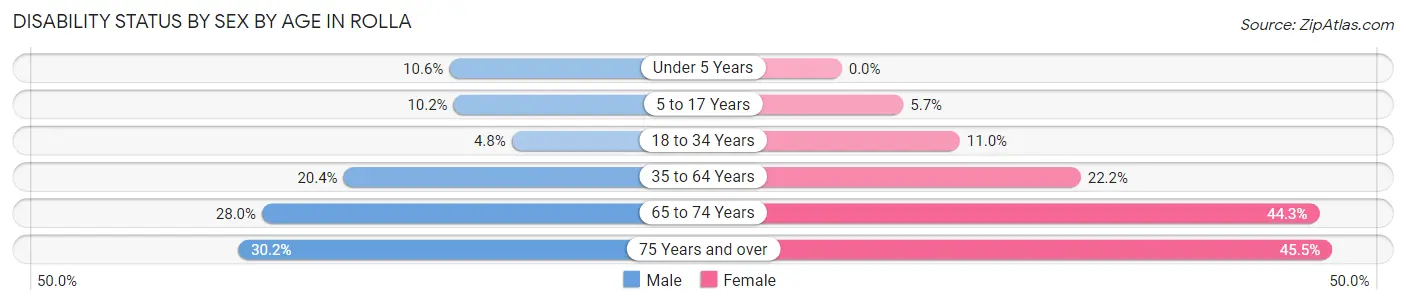
| Age Bracket | Male | Female |
| Under 5 Years | 55 (10.6%) | 0 (0.0%) |
| 5 to 17 Years | 125 (10.2%) | 76 (5.7%) |
| 18 to 34 Years | 259 (4.8%) | 342 (11.0%) |
| 35 to 64 Years | 499 (20.4%) | 528 (22.2%) |
| 65 to 74 Years | 176 (28.0%) | 327 (44.3%) |
| 75 Years and over | 153 (30.2%) | 398 (45.5%) |
Disability Class by Sex by Age in Rolla
Disability Class: Hearing Difficulty
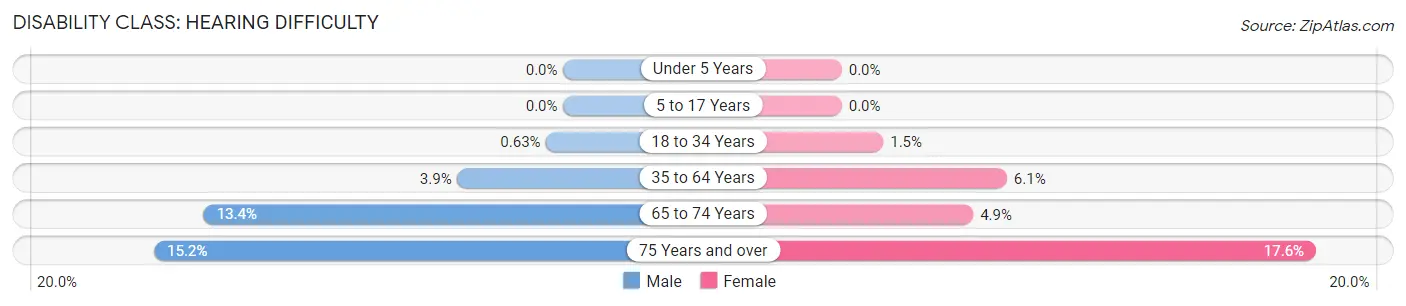
| Age Bracket | Male | Female |
| Under 5 Years | 0 (0.0%) | 0 (0.0%) |
| 5 to 17 Years | 0 (0.0%) | 0 (0.0%) |
| 18 to 34 Years | 34 (0.6%) | 48 (1.5%) |
| 35 to 64 Years | 96 (3.9%) | 146 (6.1%) |
| 65 to 74 Years | 84 (13.4%) | 36 (4.9%) |
| 75 Years and over | 77 (15.2%) | 154 (17.6%) |
Disability Class: Vision Difficulty
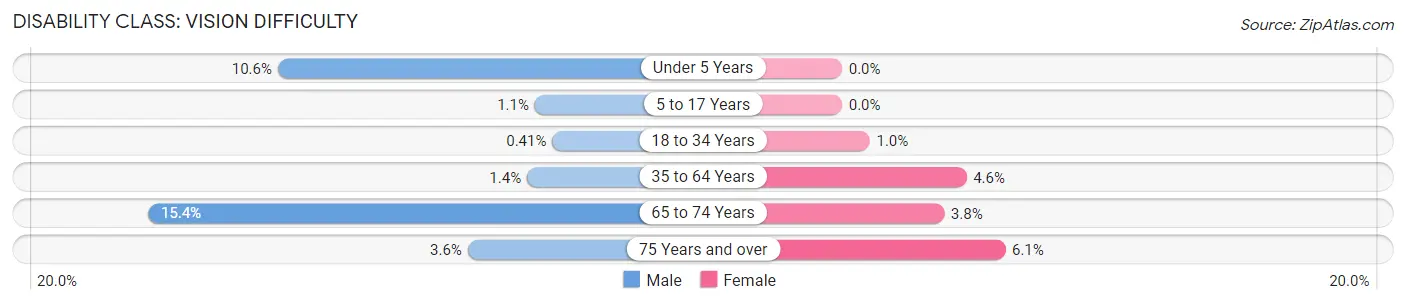
| Age Bracket | Male | Female |
| Under 5 Years | 55 (10.6%) | 0 (0.0%) |
| 5 to 17 Years | 13 (1.1%) | 0 (0.0%) |
| 18 to 34 Years | 22 (0.4%) | 32 (1.0%) |
| 35 to 64 Years | 33 (1.3%) | 110 (4.6%) |
| 65 to 74 Years | 97 (15.4%) | 28 (3.8%) |
| 75 Years and over | 18 (3.5%) | 53 (6.1%) |
Disability Class: Cognitive Difficulty
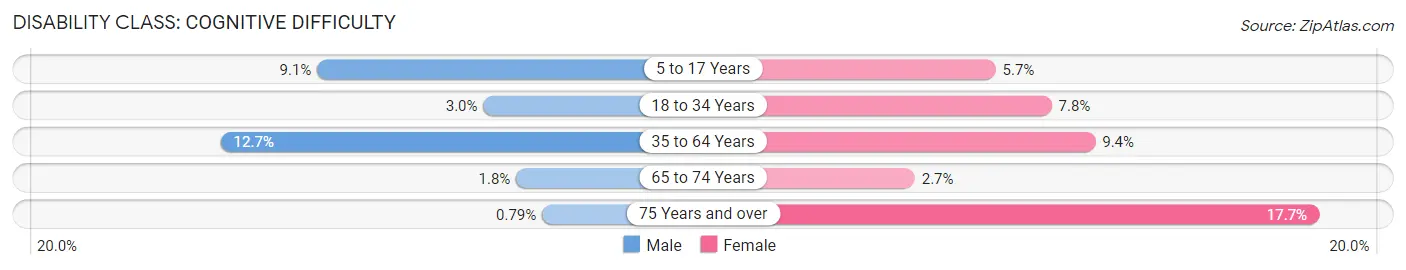
| Age Bracket | Male | Female |
| 5 to 17 Years | 112 (9.1%) | 76 (5.7%) |
| 18 to 34 Years | 160 (3.0%) | 243 (7.8%) |
| 35 to 64 Years | 311 (12.7%) | 224 (9.4%) |
| 65 to 74 Years | 11 (1.8%) | 20 (2.7%) |
| 75 Years and over | 4 (0.8%) | 155 (17.7%) |
Disability Class: Ambulatory Difficulty
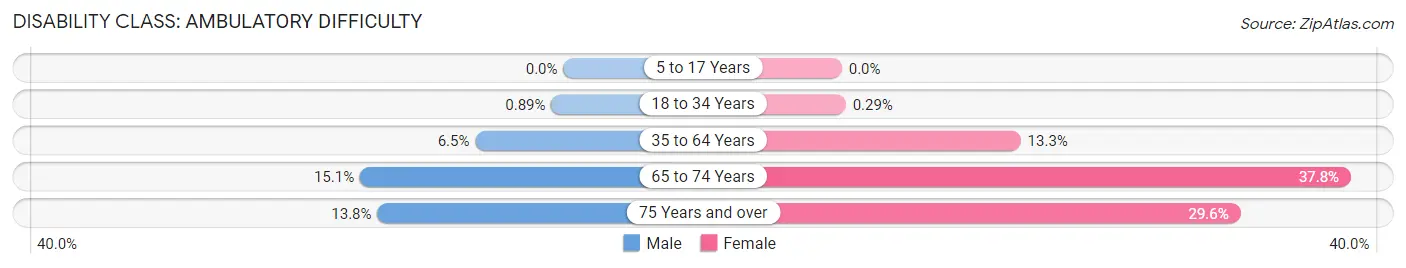
| Age Bracket | Male | Female |
| 5 to 17 Years | 0 (0.0%) | 0 (0.0%) |
| 18 to 34 Years | 48 (0.9%) | 9 (0.3%) |
| 35 to 64 Years | 160 (6.5%) | 316 (13.3%) |
| 65 to 74 Years | 95 (15.1%) | 279 (37.8%) |
| 75 Years and over | 70 (13.8%) | 259 (29.6%) |
Disability Class: Self-Care Difficulty
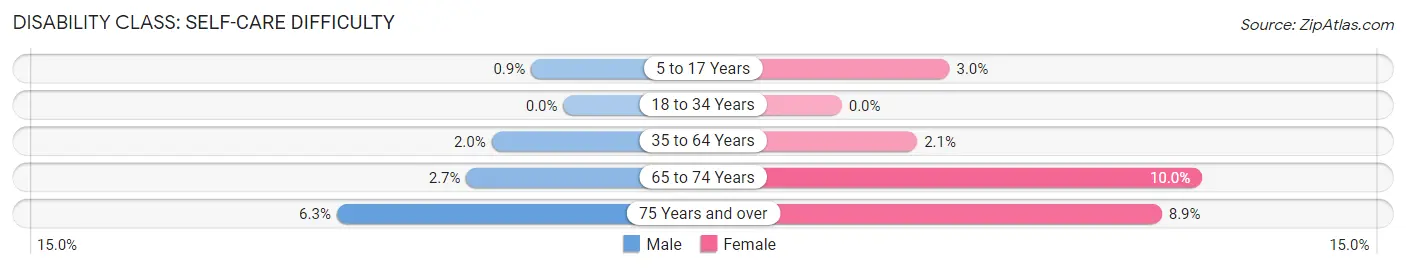
| Age Bracket | Male | Female |
| 5 to 17 Years | 11 (0.9%) | 40 (3.0%) |
| 18 to 34 Years | 0 (0.0%) | 0 (0.0%) |
| 35 to 64 Years | 49 (2.0%) | 50 (2.1%) |
| 65 to 74 Years | 17 (2.7%) | 74 (10.0%) |
| 75 Years and over | 32 (6.3%) | 78 (8.9%) |
Technology Access in Rolla
Computing Device Access in Rolla
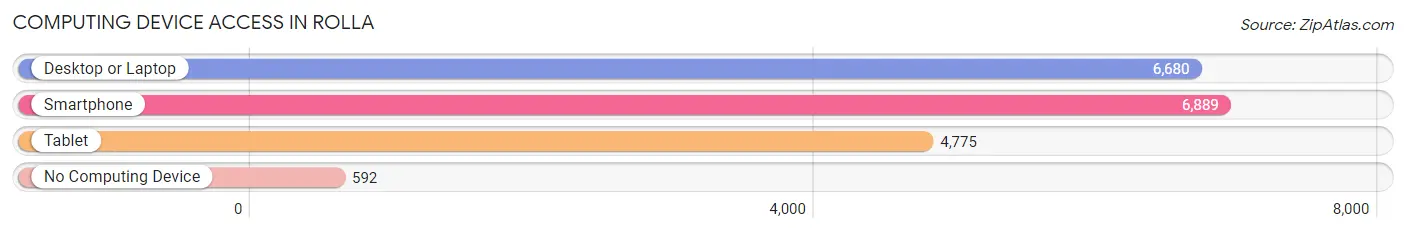
| Device Type | # Households | % Households |
| Desktop or Laptop | 6,680 | 81.2% |
| Smartphone | 6,889 | 83.8% |
| Tablet | 4,775 | 58.1% |
| No Computing Device | 592 | 7.2% |
| Total | 8,222 | 100.0% |
Internet Access in Rolla
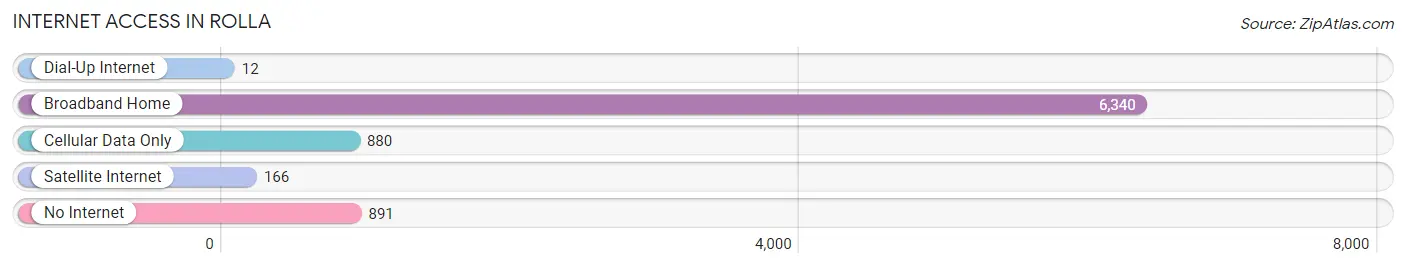
| Internet Type | # Households | % Households |
| Dial-Up Internet | 12 | 0.2% |
| Broadband Home | 6,340 | 77.1% |
| Cellular Data Only | 880 | 10.7% |
| Satellite Internet | 166 | 2.0% |
| No Internet | 891 | 10.8% |
| Total | 8,222 | 100.0% |
Rolla Summary
Rolla, Missouri is a city located in Phelps County, in the south-central part of the state. It is the county seat and the largest city in the county. The city is located along the I-44 corridor, approximately halfway between St. Louis and Springfield. The city is home to the Missouri University of Science and Technology, which is the largest employer in the area.
History
Rolla was founded in 1858 by the Phelps County Land Company. The city was named after the nearby Rolla Creek, which was named after a French settler, Pierre Rolla. The city was originally intended to be a railroad hub, and the first railroad line was completed in 1859. The city was incorporated in 1869, and the first mayor was elected in 1870.
In the late 19th century, Rolla was a major stop on the St. Louis-San Francisco Railway, and the city was a major hub for the timber industry. The city was also home to a large number of coal mines, and the city was a major producer of coal for many years.
Geography
Rolla is located in the Ozark Mountains region of Missouri. The city is situated in the Ozark Plateau, which is characterized by rolling hills and valleys. The city is located at the intersection of I-44 and US Route 63. The city is located approximately halfway between St. Louis and Springfield, and is approximately 90 miles from both cities.
The city has a total area of 11.3 square miles, of which 11.2 square miles is land and 0.1 square miles is water. The city is located at an elevation of 890 feet above sea level.
Economy
Rolla is a major economic center in the region. The city is home to the Missouri University of Science and Technology, which is the largest employer in the area. Other major employers in the city include Phelps County Regional Medical Center, the Rolla Public Schools, and the Phelps County Bank.
The city is also home to a number of manufacturing companies, including Rolla Plastics, Rolla Steel, and Rolla Machine Works. The city is also home to a number of retail stores, restaurants, and other businesses.
Demographics
As of the 2010 census, the city had a population of 19,559. The racial makeup of the city was 90.2% White, 4.3% African American, 0.5% Native American, 1.7% Asian, 0.1% Pacific Islander, 1.2% from other races, and 2.0% from two or more races. Hispanic or Latino of any race were 3.3% of the population.
The median income for a household in the city was $37,945, and the median income for a family was $50,945. The per capita income for the city was $20,945. About 11.2% of families and 16.2% of the population were below the poverty line, including 22.2% of those under age 18 and 8.2% of those age 65 or over.
Common Questions
What is Per Capita Income in Rolla?
Per Capita income in Rolla is $23,040.
What is the Median Family Income in Rolla?
Median Family Income in Rolla is $61,812.
What is the Median Household income in Rolla?
Median Household Income in Rolla is $37,685.
What is Income or Wage Gap in Rolla?
Income or Wage Gap in Rolla is 9.8%.
Women in Rolla earn 90.2 cents for every dollar earned by a man.
What is Family Income Deficit in Rolla?
Family Income Deficit in Rolla is $11,315.
Families that are below poverty line in Rolla earn $11,315 less on average than the poverty threshold level.
What is Inequality or Gini Index in Rolla?
Inequality or Gini Index in Rolla is 0.48.
What is the Total Population of Rolla?
Total Population of Rolla is 20,025.
What is the Total Male Population of Rolla?
Total Male Population of Rolla is 11,002.
What is the Total Female Population of Rolla?
Total Female Population of Rolla is 9,023.
What is the Ratio of Males per 100 Females in Rolla?
There are 121.93 Males per 100 Females in Rolla.
What is the Ratio of Females per 100 Males in Rolla?
There are 82.01 Females per 100 Males in Rolla.
What is the Median Population Age in Rolla?
Median Population Age in Rolla is 26.9 Years.
What is the Average Family Size in Rolla
Average Family Size in Rolla is 2.8 People.
What is the Average Household Size in Rolla
Average Household Size in Rolla is 2.1 People.
How Large is the Labor Force in Rolla?
There are 8,413 People in the Labor Forcein in Rolla.
What is the Percentage of People in the Labor Force in Rolla?
50.1% of People are in the Labor Force in Rolla.
What is the Unemployment Rate in Rolla?
Unemployment Rate in Rolla is 5.0%.