Zion, IL Map & Demographics
Zion Map
Zion Overview
$31,191
PER CAPITA INCOME
$80,771
AVG FAMILY INCOME
$65,018
AVG HOUSEHOLD INCOME
15.9%
WAGE / INCOME GAP [ % ]
84.1¢/ $1
WAGE / INCOME GAP [ $ ]
$10,862
FAMILY INCOME DEFICIT
0.50
INEQUALITY / GINI INDEX
24,570
TOTAL POPULATION
12,146
MALE POPULATION
12,424
FEMALE POPULATION
97.76
MALES / 100 FEMALES
102.29
FEMALES / 100 MALES
32.3
MEDIAN AGE
3.6
AVG FAMILY SIZE
2.8
AVG HOUSEHOLD SIZE
12,848
LABOR FORCE [ PEOPLE ]
69.3%
PERCENT IN LABOR FORCE
6.4%
UNEMPLOYMENT RATE
Zion Zip Codes
Income in Zion
Income Overview in Zion
Per Capita Income in Zion is $31,191, while median incomes of families and households are $80,771 and $65,018 respectively.
| Characteristic | Number | Measure |
| Per Capita Income | 24,570 | $31,191 |
| Median Family Income | 5,580 | $80,771 |
| Mean Family Income | 5,580 | $105,302 |
| Median Household Income | 8,727 | $65,018 |
| Mean Household Income | 8,727 | $87,242 |
| Income Deficit | 5,580 | $10,862 |
| Wage / Income Gap (%) | 24,570 | 15.92% |
| Wage / Income Gap ($) | 24,570 | 84.08¢ per $1 |
| Gini / Inequality Index | 24,570 | 0.50 |
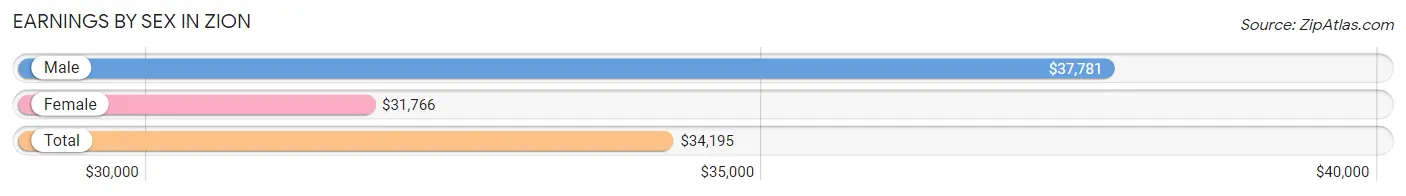
Earnings by Sex in Zion
Average Earnings in Zion are $34,195, $37,781 for men and $31,766 for women, a difference of 15.9%.
| Sex | Number | Average Earnings |
| Male | 6,657 (51.7%) | $37,781 |
| Female | 6,218 (48.3%) | $31,766 |
| Total | 12,875 (100.0%) | $34,195 |
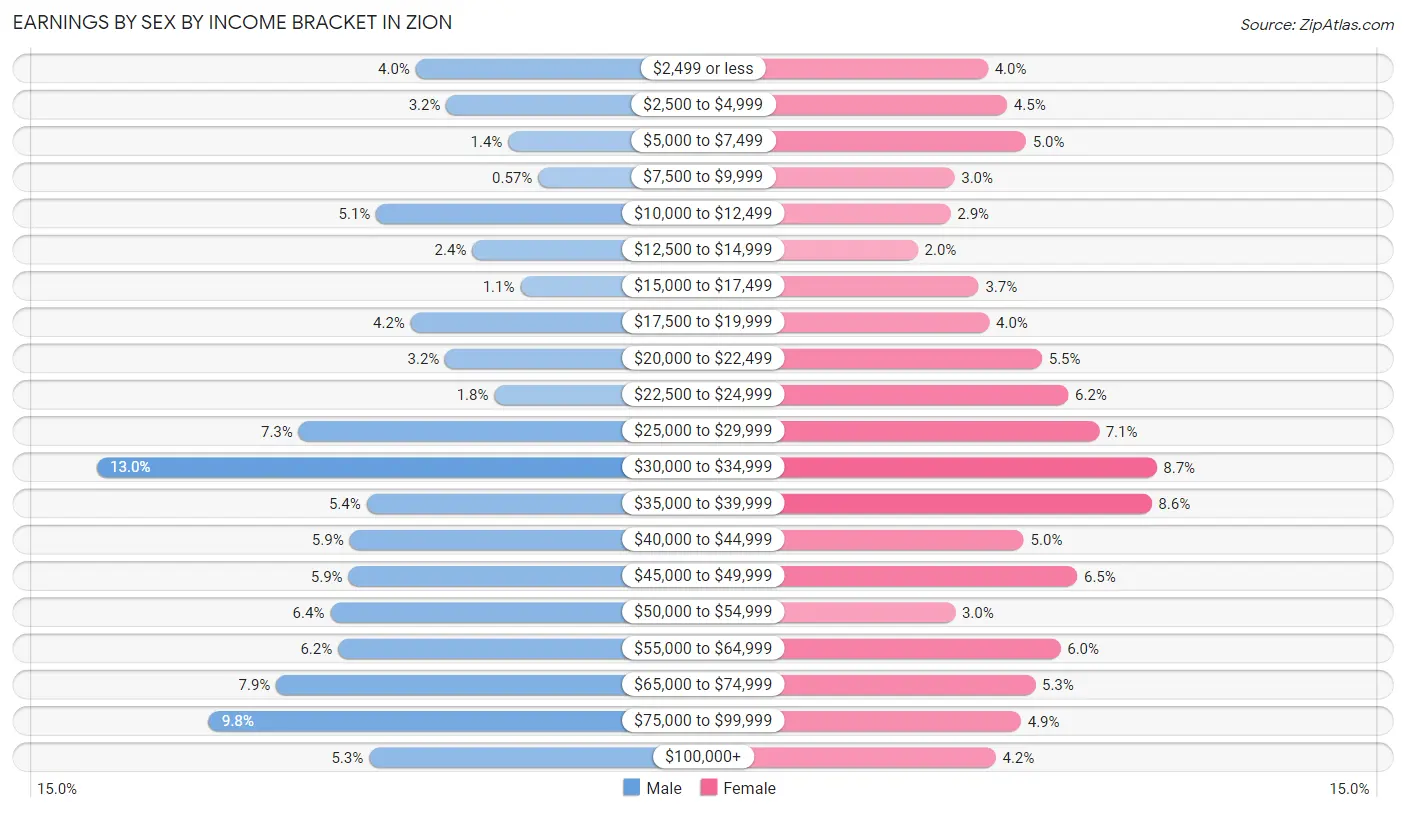
Earnings by Sex by Income Bracket in Zion
The most common earnings brackets in Zion are $30,000 to $34,999 for men (863 | 13.0%) and $30,000 to $34,999 for women (541 | 8.7%).
| Income | Male | Female |
| $2,499 or less | 267 (4.0%) | 246 (4.0%) |
| $2,500 to $4,999 | 210 (3.2%) | 280 (4.5%) |
| $5,000 to $7,499 | 94 (1.4%) | 313 (5.0%) |
| $7,500 to $9,999 | 38 (0.6%) | 188 (3.0%) |
| $10,000 to $12,499 | 341 (5.1%) | 181 (2.9%) |
| $12,500 to $14,999 | 161 (2.4%) | 124 (2.0%) |
| $15,000 to $17,499 | 71 (1.1%) | 230 (3.7%) |
| $17,500 to $19,999 | 276 (4.2%) | 249 (4.0%) |
| $20,000 to $22,499 | 212 (3.2%) | 341 (5.5%) |
| $22,500 to $24,999 | 120 (1.8%) | 387 (6.2%) |
| $25,000 to $29,999 | 486 (7.3%) | 440 (7.1%) |
| $30,000 to $34,999 | 863 (13.0%) | 541 (8.7%) |
| $35,000 to $39,999 | 359 (5.4%) | 532 (8.6%) |
| $40,000 to $44,999 | 391 (5.9%) | 309 (5.0%) |
| $45,000 to $49,999 | 393 (5.9%) | 402 (6.5%) |
| $50,000 to $54,999 | 427 (6.4%) | 189 (3.0%) |
| $55,000 to $64,999 | 412 (6.2%) | 373 (6.0%) |
| $65,000 to $74,999 | 528 (7.9%) | 329 (5.3%) |
| $75,000 to $99,999 | 654 (9.8%) | 304 (4.9%) |
| $100,000+ | 354 (5.3%) | 260 (4.2%) |
| Total | 6,657 (100.0%) | 6,218 (100.0%) |
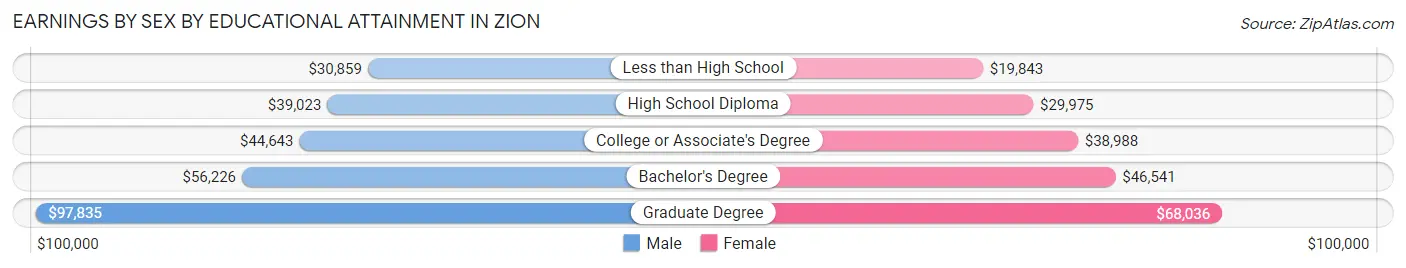
Earnings by Sex by Educational Attainment in Zion
Average earnings in Zion are $44,924 for men and $36,122 for women, a difference of 19.6%. Men with an educational attainment of graduate degree enjoy the highest average annual earnings of $97,835, while those with less than high school education earn the least with $30,859. Women with an educational attainment of graduate degree earn the most with the average annual earnings of $68,036, while those with less than high school education have the smallest earnings of $19,843.
| Educational Attainment | Male Income | Female Income |
| Less than High School | $30,859 | $19,843 |
| High School Diploma | $39,023 | $29,975 |
| College or Associate's Degree | $44,643 | $38,988 |
| Bachelor's Degree | $56,226 | $46,541 |
| Graduate Degree | $97,835 | $68,036 |
| Total | $44,924 | $36,122 |
Family Income in Zion
Family Income Brackets in Zion
According to the Zion family income data, there are 1,518 families falling into the $100,000 to $149,999 income range, which is the most common income bracket and makes up 27.2% of all families. Conversely, the $10,000 to $14,999 income bracket is the least frequent group with only 123 families (2.2%) belonging to this category.
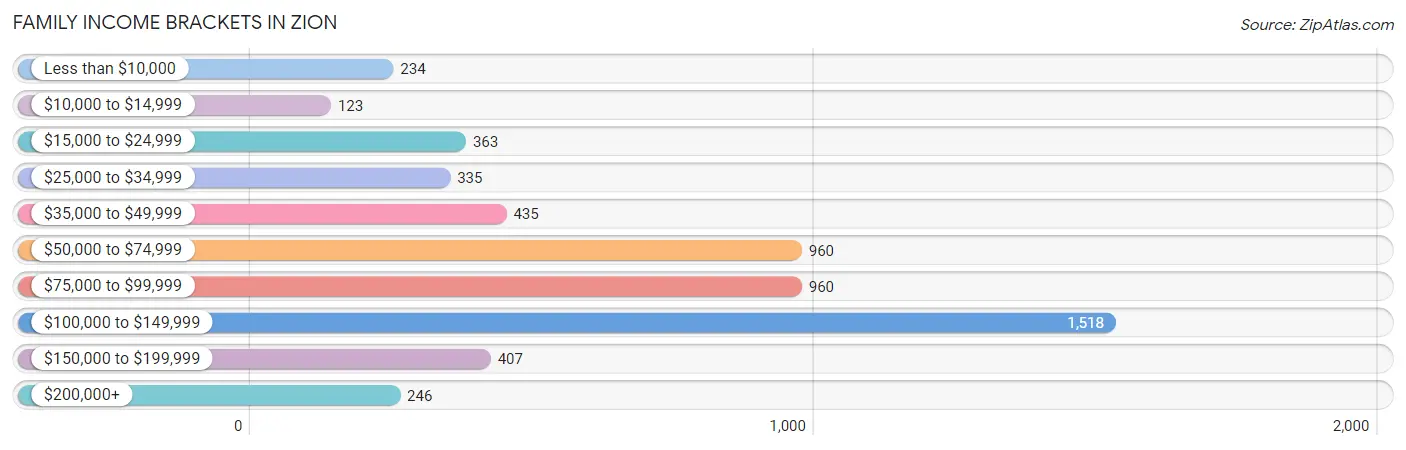
| Income Bracket | # Families | % Families |
| Less than $10,000 | 234 | 4.2% |
| $10,000 to $14,999 | 123 | 2.2% |
| $15,000 to $24,999 | 363 | 6.5% |
| $25,000 to $34,999 | 335 | 6.0% |
| $35,000 to $49,999 | 435 | 7.8% |
| $50,000 to $74,999 | 960 | 17.2% |
| $75,000 to $99,999 | 960 | 17.2% |
| $100,000 to $149,999 | 1,518 | 27.2% |
| $150,000 to $199,999 | 407 | 7.3% |
| $200,000+ | 246 | 4.4% |
Family Income by Famaliy Size in Zion
7+ person families (176 | 3.2%) account for the highest median family income in Zion with $145,408 per family, while 2-person families (1,747 | 31.3%) have the highest median income of $36,636 per family member.
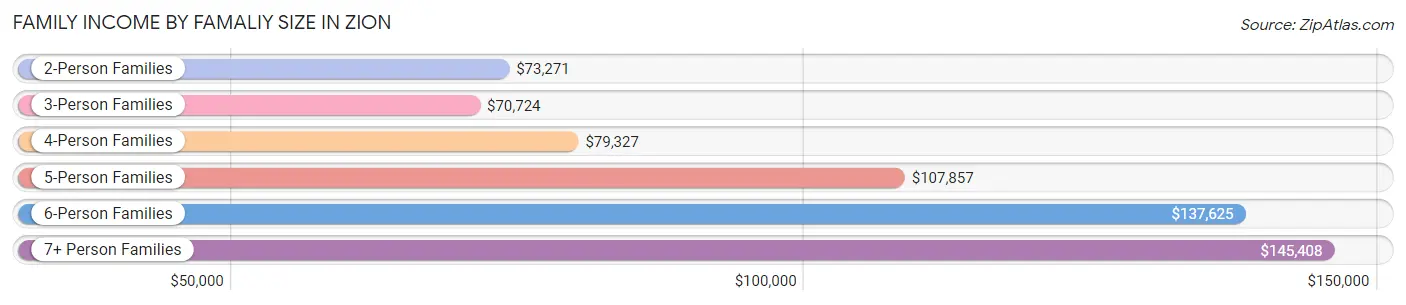
| Income Bracket | # Families | Median Income |
| 2-Person Families | 1,747 (31.3%) | $73,271 |
| 3-Person Families | 1,773 (31.8%) | $70,724 |
| 4-Person Families | 811 (14.5%) | $79,327 |
| 5-Person Families | 628 (11.3%) | $107,857 |
| 6-Person Families | 445 (8.0%) | $137,625 |
| 7+ Person Families | 176 (3.2%) | $145,408 |
| Total | 5,580 (100.0%) | $80,771 |
Family Income by Number of Earners in Zion
The median family income in Zion is $80,771, with families comprising 3+ earners (1,260) having the highest median family income of $135,000, while families with no earners (597) have the lowest median family income of $29,375, accounting for 22.6% and 10.7% of families, respectively.
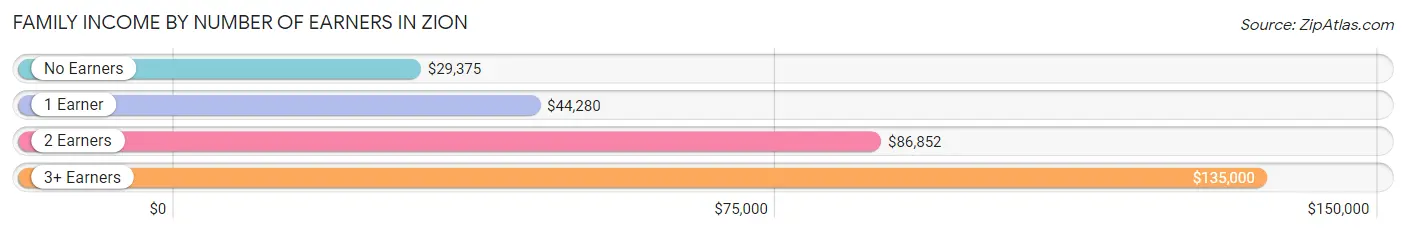
| Number of Earners | # Families | Median Income |
| No Earners | 597 (10.7%) | $29,375 |
| 1 Earner | 1,659 (29.7%) | $44,280 |
| 2 Earners | 2,064 (37.0%) | $86,852 |
| 3+ Earners | 1,260 (22.6%) | $135,000 |
| Total | 5,580 (100.0%) | $80,771 |
Household Income in Zion
Household Income Brackets in Zion
With 1,693 households falling in the category, the $100,000 to $149,999 income range is the most frequent in Zion, accounting for 19.4% of all households. In contrast, only 279 households (3.2%) fall into the $200,000+ income bracket, making it the least populous group.
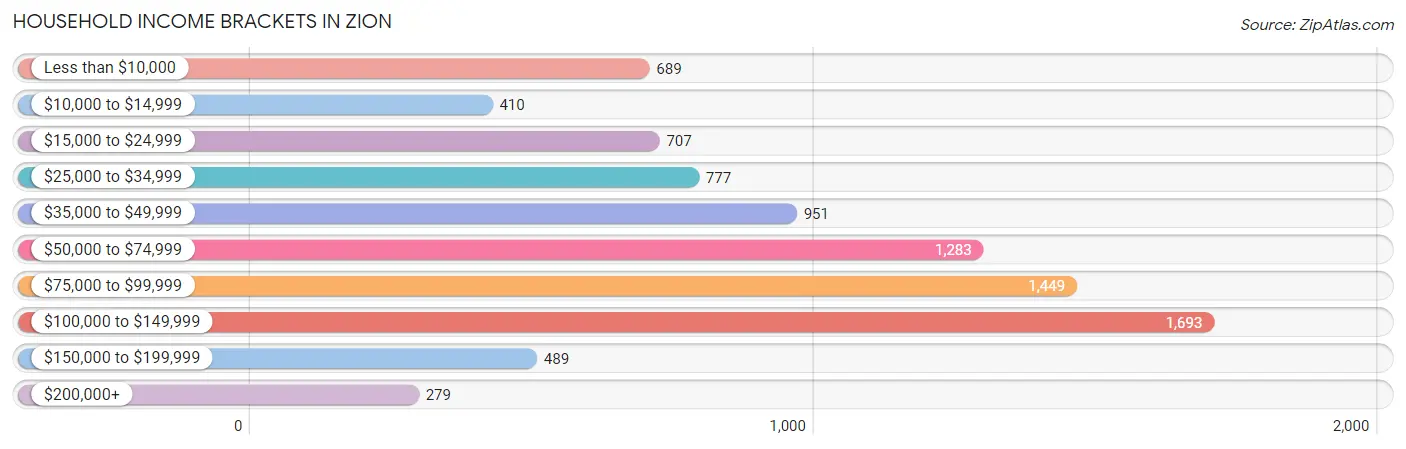
| Income Bracket | # Households | % Households |
| Less than $10,000 | 689 | 7.9% |
| $10,000 to $14,999 | 410 | 4.7% |
| $15,000 to $24,999 | 707 | 8.1% |
| $25,000 to $34,999 | 777 | 8.9% |
| $35,000 to $49,999 | 951 | 10.9% |
| $50,000 to $74,999 | 1,283 | 14.7% |
| $75,000 to $99,999 | 1,449 | 16.6% |
| $100,000 to $149,999 | 1,693 | 19.4% |
| $150,000 to $199,999 | 489 | 5.6% |
| $200,000+ | 279 | 3.2% |
Household Income by Householder Age in Zion
The median household income in Zion is $65,018, with the highest median household income of $68,396 found in the 45 to 64 years age bracket for the primary householder. A total of 3,450 households (39.5%) fall into this category. Meanwhile, the 15 to 24 years age bracket for the primary householder has the lowest median household income of $0, with 372 households (4.3%) in this group.
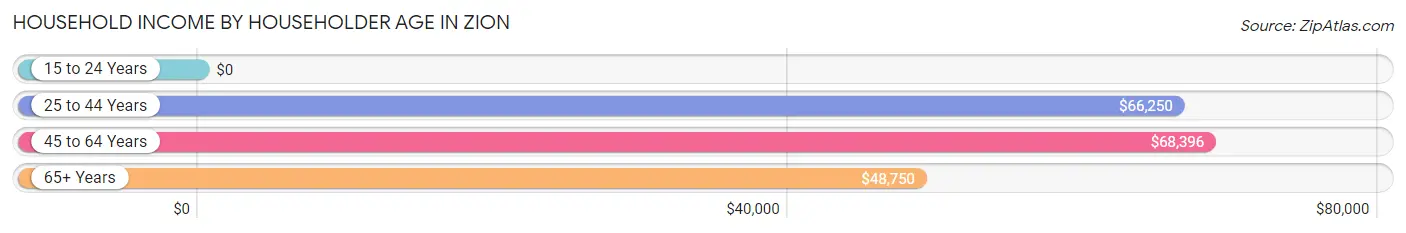
| Income Bracket | # Households | Median Income |
| 15 to 24 Years | 372 (4.3%) | $0 |
| 25 to 44 Years | 3,187 (36.5%) | $66,250 |
| 45 to 64 Years | 3,450 (39.5%) | $68,396 |
| 65+ Years | 1,718 (19.7%) | $48,750 |
| Total | 8,727 (100.0%) | $65,018 |
Poverty in Zion
Income Below Poverty by Sex and Age in Zion
With 12.5% poverty level for males and 16.5% for females among the residents of Zion, 5 year old males and under 5 year old females are the most vulnerable to poverty, with 134 males (55.8%) and 263 females (31.0%) in their respective age groups living below the poverty level.
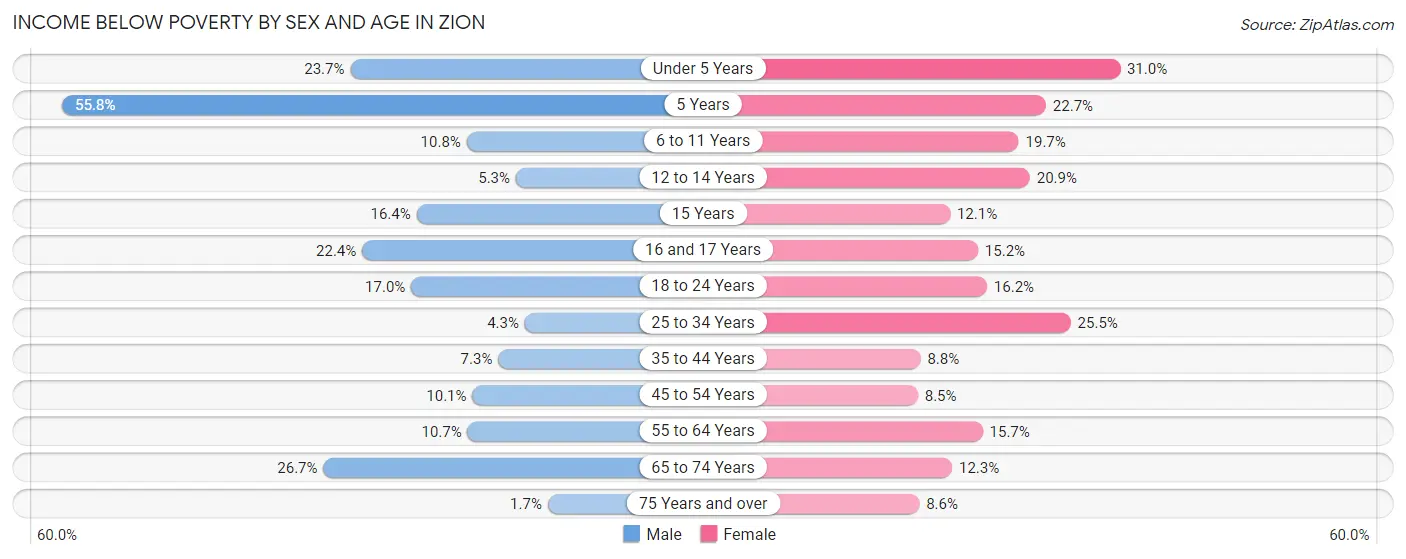
| Age Bracket | Male | Female |
| Under 5 Years | 177 (23.7%) | 263 (31.0%) |
| 5 Years | 134 (55.8%) | 25 (22.7%) |
| 6 to 11 Years | 116 (10.8%) | 179 (19.7%) |
| 12 to 14 Years | 38 (5.3%) | 138 (20.9%) |
| 15 Years | 43 (16.4%) | 47 (12.0%) |
| 16 and 17 Years | 52 (22.4%) | 67 (15.2%) |
| 18 to 24 Years | 240 (17.0%) | 211 (16.2%) |
| 25 to 34 Years | 82 (4.3%) | 471 (25.5%) |
| 35 to 44 Years | 94 (7.2%) | 119 (8.8%) |
| 45 to 54 Years | 142 (10.1%) | 141 (8.5%) |
| 55 to 64 Years | 150 (10.7%) | 180 (15.7%) |
| 65 to 74 Years | 213 (26.7%) | 130 (12.3%) |
| 75 Years and over | 7 (1.7%) | 43 (8.6%) |
| Total | 1,488 (12.5%) | 2,014 (16.5%) |
Income Above Poverty by Sex and Age in Zion
According to the poverty statistics in Zion, males aged 75 years and over and females aged 45 to 54 years are the age groups that are most secure financially, with 98.3% of males and 91.5% of females in these age groups living above the poverty line.
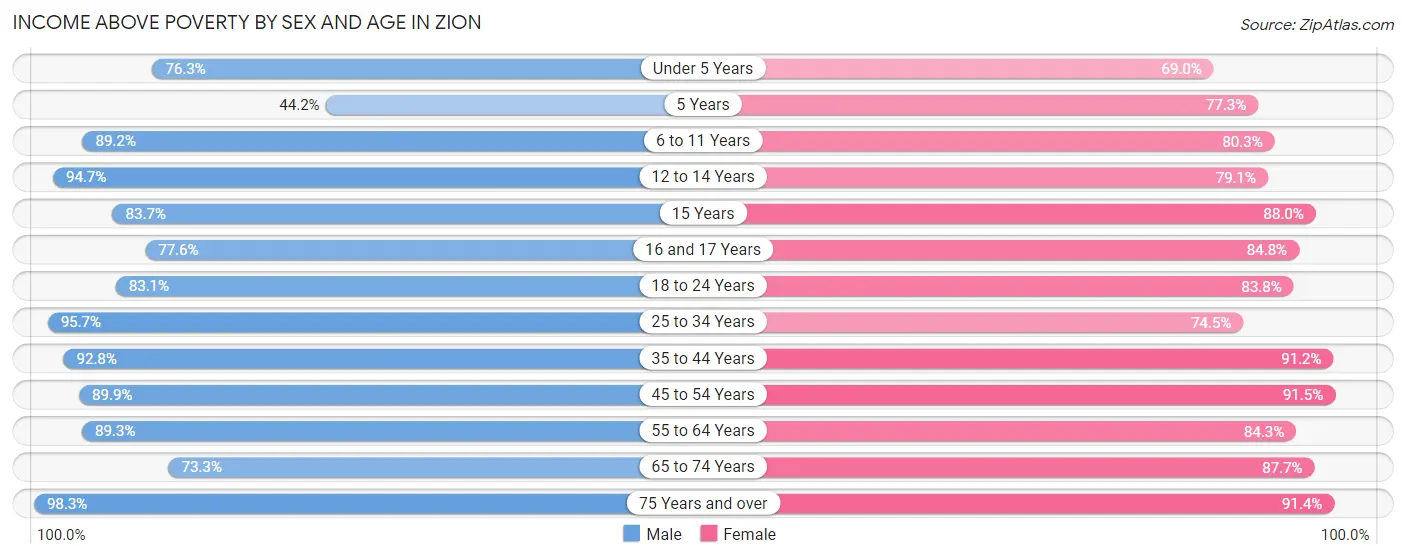
| Age Bracket | Male | Female |
| Under 5 Years | 569 (76.3%) | 586 (69.0%) |
| 5 Years | 106 (44.2%) | 85 (77.3%) |
| 6 to 11 Years | 961 (89.2%) | 730 (80.3%) |
| 12 to 14 Years | 681 (94.7%) | 521 (79.1%) |
| 15 Years | 220 (83.7%) | 343 (87.9%) |
| 16 and 17 Years | 180 (77.6%) | 375 (84.8%) |
| 18 to 24 Years | 1,176 (83.1%) | 1,095 (83.8%) |
| 25 to 34 Years | 1,828 (95.7%) | 1,377 (74.5%) |
| 35 to 44 Years | 1,202 (92.7%) | 1,240 (91.2%) |
| 45 to 54 Years | 1,260 (89.9%) | 1,525 (91.5%) |
| 55 to 64 Years | 1,256 (89.3%) | 968 (84.3%) |
| 65 to 74 Years | 584 (73.3%) | 929 (87.7%) |
| 75 Years and over | 395 (98.3%) | 456 (91.4%) |
| Total | 10,418 (87.5%) | 10,230 (83.6%) |
Income Below Poverty Among Married-Couple Families in Zion
The poverty statistics for married-couple families in Zion show that 2.5% or 88 of the total 3,461 families live below the poverty line. Families with 3 or 4 children have the highest poverty rate of 3.7%, comprising of 21 families. On the other hand, families with 5 or more children have the lowest poverty rate of 0.0%, which includes 0 families.
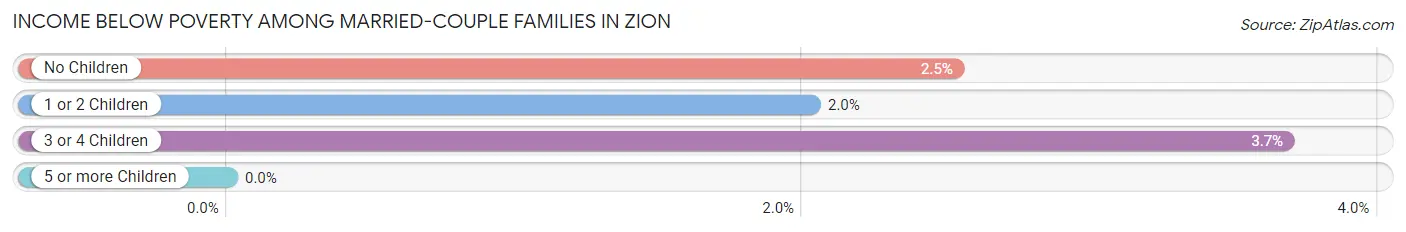
| Children | Above Poverty | Below Poverty |
| No Children | 1,772 (97.5%) | 46 (2.5%) |
| 1 or 2 Children | 1,014 (98.0%) | 21 (2.0%) |
| 3 or 4 Children | 549 (96.3%) | 21 (3.7%) |
| 5 or more Children | 38 (100.0%) | 0 (0.0%) |
| Total | 3,373 (97.5%) | 88 (2.5%) |
Income Below Poverty Among Single-Parent Households in Zion
According to the poverty data in Zion, 18.7% or 146 single-father households and 31.4% or 420 single-mother households are living below the poverty line. Among single-father households, those with 3 or 4 children have the highest poverty rate, with 12 households (26.1%) experiencing poverty. Likewise, among single-mother households, those with 3 or 4 children have the highest poverty rate, with 112 households (50.4%) falling below the poverty line.
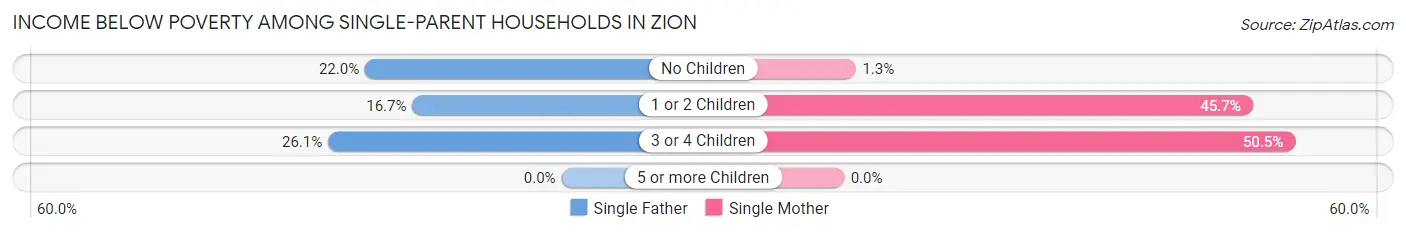
| Children | Single Father | Single Mother |
| No Children | 47 (22.0%) | 6 (1.3%) |
| 1 or 2 Children | 87 (16.7%) | 302 (45.7%) |
| 3 or 4 Children | 12 (26.1%) | 112 (50.4%) |
| 5 or more Children | 0 (0.0%) | 0 (0.0%) |
| Total | 146 (18.7%) | 420 (31.4%) |
Income Below Poverty Among Married-Couple vs Single-Parent Households in Zion
The poverty data for Zion shows that 88 of the married-couple family households (2.5%) and 566 of the single-parent households (26.7%) are living below the poverty level. Within the married-couple family households, those with 3 or 4 children have the highest poverty rate, with 21 households (3.7%) falling below the poverty line. Among the single-parent households, those with 3 or 4 children have the highest poverty rate, with 124 household (46.3%) living below poverty.
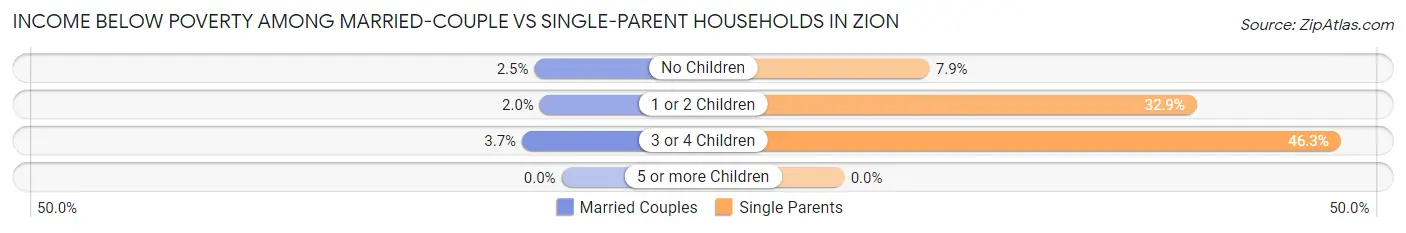
| Children | Married-Couple Families | Single-Parent Households |
| No Children | 46 (2.5%) | 53 (7.9%) |
| 1 or 2 Children | 21 (2.0%) | 389 (32.9%) |
| 3 or 4 Children | 21 (3.7%) | 124 (46.3%) |
| 5 or more Children | 0 (0.0%) | 0 (0.0%) |
| Total | 88 (2.5%) | 566 (26.7%) |
Race in Zion
The most populous races in Zion are White / Caucasian (10,589 | 43.1%), Hispanic or Latino (9,990 | 40.7%), and Black / African American (5,817 | 23.7%).
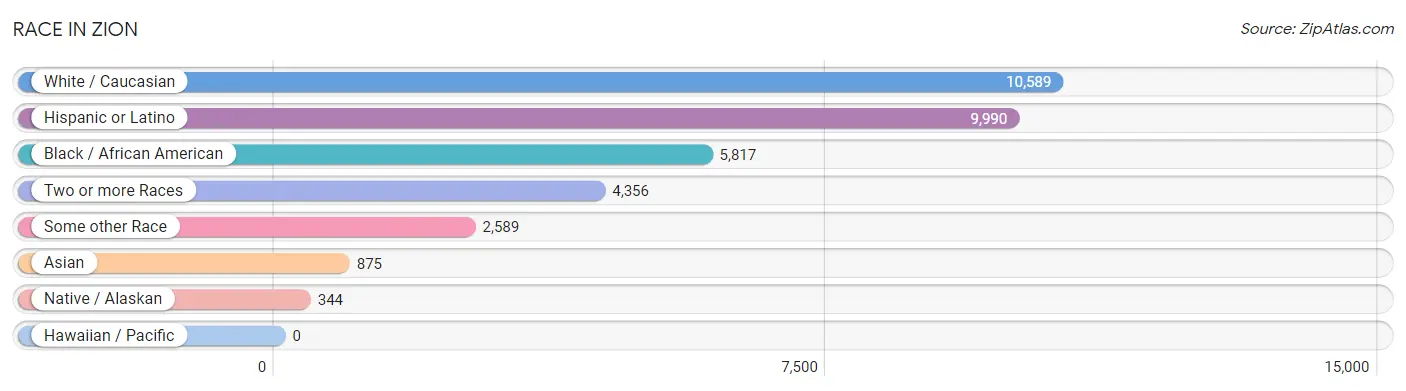
| Race | # Population | % Population |
| Asian | 875 | 3.6% |
| Black / African American | 5,817 | 23.7% |
| Hawaiian / Pacific | 0 | 0.0% |
| Hispanic or Latino | 9,990 | 40.7% |
| Native / Alaskan | 344 | 1.4% |
| White / Caucasian | 10,589 | 43.1% |
| Two or more Races | 4,356 | 17.7% |
| Some other Race | 2,589 | 10.5% |
| Total | 24,570 | 100.0% |
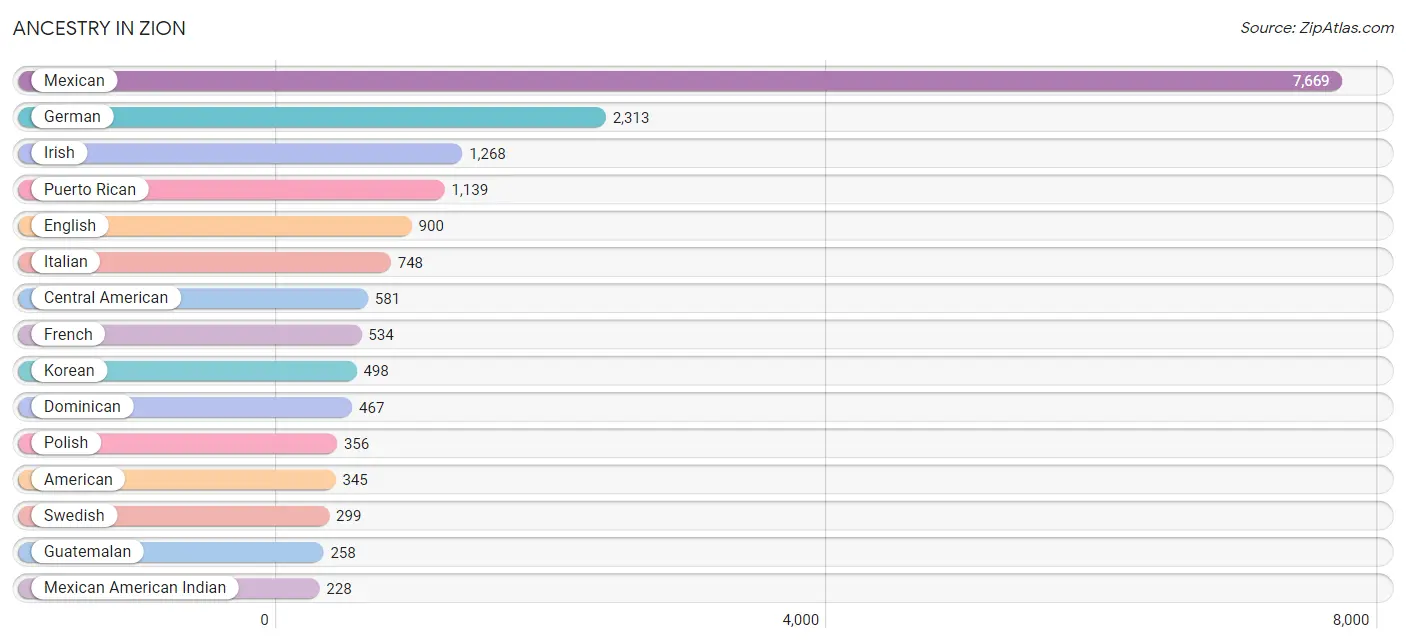
Ancestry in Zion
The most populous ancestries reported in Zion are Mexican (7,669 | 31.2%), German (2,313 | 9.4%), Irish (1,268 | 5.2%), Puerto Rican (1,139 | 4.6%), and English (900 | 3.7%), together accounting for 54.1% of all Zion residents.
| Ancestry | # Population | % Population |
| African | 146 | 0.6% |
| Aleut | 12 | 0.1% |
| American | 345 | 1.4% |
| Austrian | 11 | 0.0% |
| Belgian | 9 | 0.0% |
| Belizean | 69 | 0.3% |
| Bhutanese | 29 | 0.1% |
| Blackfeet | 10 | 0.0% |
| British | 62 | 0.3% |
| Burmese | 49 | 0.2% |
| Canadian | 12 | 0.1% |
| Central American | 581 | 2.4% |
| Central American Indian | 45 | 0.2% |
| Cherokee | 109 | 0.4% |
| Chickasaw | 8 | 0.0% |
| Chippewa | 11 | 0.0% |
| Choctaw | 16 | 0.1% |
| Colombian | 16 | 0.1% |
| Croatian | 10 | 0.0% |
| Cuban | 14 | 0.1% |
| Czech | 67 | 0.3% |
| Czechoslovakian | 49 | 0.2% |
| Danish | 28 | 0.1% |
| Dominican | 467 | 1.9% |
| Dutch | 69 | 0.3% |
| Eastern European | 16 | 0.1% |
| English | 900 | 3.7% |
| European | 139 | 0.6% |
| Finnish | 211 | 0.9% |
| French | 534 | 2.2% |
| German | 2,313 | 9.4% |
| Greek | 51 | 0.2% |
| Guatemalan | 258 | 1.1% |
| Haitian | 40 | 0.2% |
| Honduran | 169 | 0.7% |
| Hungarian | 34 | 0.1% |
| Indian (Asian) | 12 | 0.1% |
| Irish | 1,268 | 5.2% |
| Italian | 748 | 3.0% |
| Jamaican | 28 | 0.1% |
| Japanese | 22 | 0.1% |
| Korean | 498 | 2.0% |
| Lithuanian | 41 | 0.2% |
| Mexican | 7,669 | 31.2% |
| Mexican American Indian | 228 | 0.9% |
| Nicaraguan | 46 | 0.2% |
| Norwegian | 155 | 0.6% |
| Osage | 2 | 0.0% |
| Panamanian | 53 | 0.2% |
| Peruvian | 79 | 0.3% |
| Polish | 356 | 1.5% |
| Potawatomi | 10 | 0.0% |
| Puerto Rican | 1,139 | 4.6% |
| Romanian | 47 | 0.2% |
| Russian | 73 | 0.3% |
| Salvadoran | 55 | 0.2% |
| Scandinavian | 31 | 0.1% |
| Scotch-Irish | 94 | 0.4% |
| Scottish | 143 | 0.6% |
| Serbian | 8 | 0.0% |
| Sioux | 87 | 0.4% |
| Slovak | 5 | 0.0% |
| South American | 95 | 0.4% |
| Spaniard | 8 | 0.0% |
| Sri Lankan | 208 | 0.9% |
| Subsaharan African | 204 | 0.8% |
| Swedish | 299 | 1.2% |
| Swiss | 25 | 0.1% |
| Thai | 206 | 0.8% |
| Ukrainian | 73 | 0.3% |
| Welsh | 17 | 0.1% |
| Yugoslavian | 7 | 0.0% |
| Zimbabwean | 58 | 0.2% | View All 73 Rows |
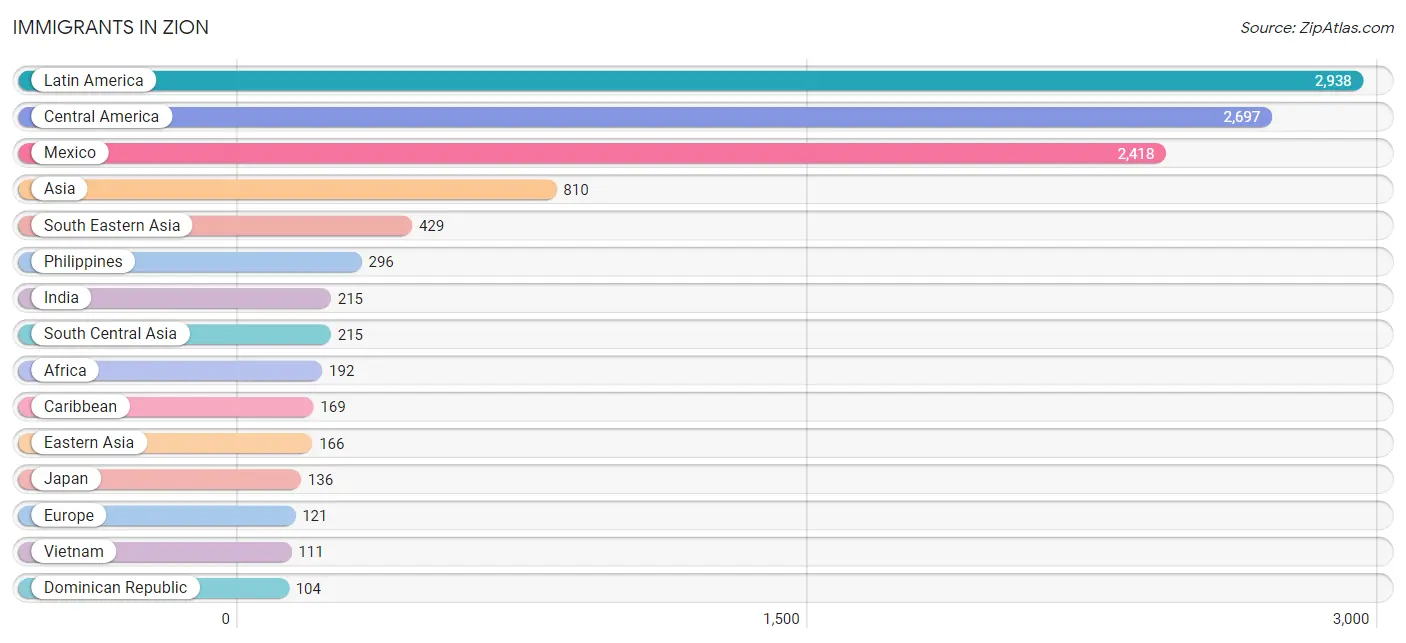
Immigrants in Zion
The most numerous immigrant groups reported in Zion came from Latin America (2,938 | 12.0%), Central America (2,697 | 11.0%), Mexico (2,418 | 9.8%), Asia (810 | 3.3%), and South Eastern Asia (429 | 1.8%), together accounting for 37.8% of all Zion residents.
| Immigration Origin | # Population | % Population |
| Africa | 192 | 0.8% |
| Asia | 810 | 3.3% |
| Belgium | 9 | 0.0% |
| Belize | 38 | 0.2% |
| Bolivia | 6 | 0.0% |
| Cambodia | 22 | 0.1% |
| Caribbean | 169 | 0.7% |
| Central America | 2,697 | 11.0% |
| Colombia | 16 | 0.1% |
| Congo | 58 | 0.2% |
| Dominican Republic | 104 | 0.4% |
| Eastern Africa | 58 | 0.2% |
| Eastern Asia | 166 | 0.7% |
| Eastern Europe | 72 | 0.3% |
| El Salvador | 104 | 0.4% |
| England | 9 | 0.0% |
| Europe | 121 | 0.5% |
| Germany | 15 | 0.1% |
| Ghana | 67 | 0.3% |
| Guatemala | 54 | 0.2% |
| Honduras | 58 | 0.2% |
| India | 215 | 0.9% |
| Italy | 6 | 0.0% |
| Jamaica | 65 | 0.3% |
| Japan | 136 | 0.5% |
| Korea | 30 | 0.1% |
| Latin America | 2,938 | 12.0% |
| Mexico | 2,418 | 9.8% |
| Middle Africa | 58 | 0.2% |
| Morocco | 9 | 0.0% |
| Nicaragua | 13 | 0.1% |
| Northern Africa | 9 | 0.0% |
| Northern Europe | 19 | 0.1% |
| Panama | 12 | 0.1% |
| Peru | 50 | 0.2% |
| Philippines | 296 | 1.2% |
| Poland | 17 | 0.1% |
| Romania | 26 | 0.1% |
| Russia | 17 | 0.1% |
| South America | 72 | 0.3% |
| South Central Asia | 215 | 0.9% |
| South Eastern Asia | 429 | 1.8% |
| Southern Europe | 6 | 0.0% |
| Vietnam | 111 | 0.4% |
| Western Africa | 67 | 0.3% |
| Western Europe | 24 | 0.1% |
| Zimbabwe | 58 | 0.2% | View All 47 Rows |
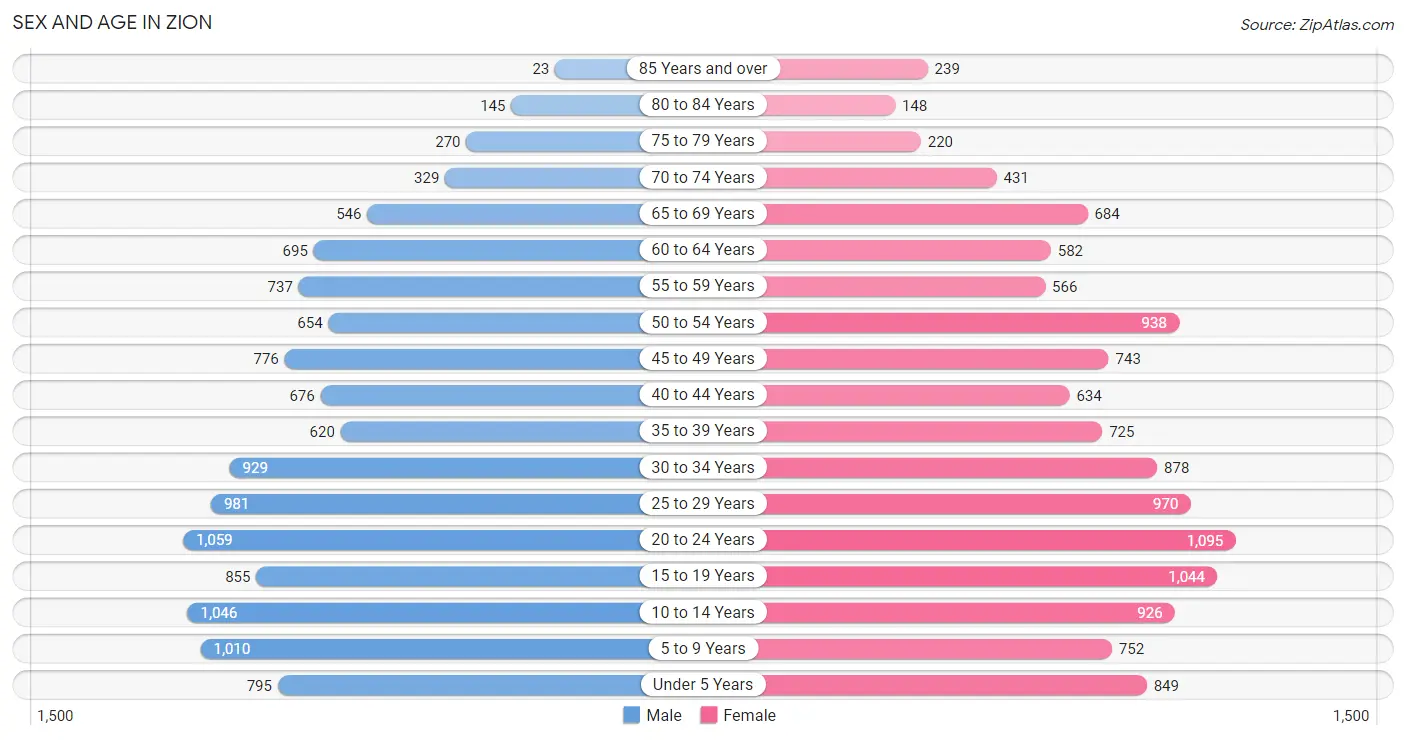
Sex and Age in Zion
Sex and Age in Zion
The most populous age groups in Zion are 20 to 24 Years (1,059 | 8.7%) for men and 20 to 24 Years (1,095 | 8.8%) for women.
| Age Bracket | Male | Female |
| Under 5 Years | 795 (6.6%) | 849 (6.8%) |
| 5 to 9 Years | 1,010 (8.3%) | 752 (6.0%) |
| 10 to 14 Years | 1,046 (8.6%) | 926 (7.4%) |
| 15 to 19 Years | 855 (7.0%) | 1,044 (8.4%) |
| 20 to 24 Years | 1,059 (8.7%) | 1,095 (8.8%) |
| 25 to 29 Years | 981 (8.1%) | 970 (7.8%) |
| 30 to 34 Years | 929 (7.6%) | 878 (7.1%) |
| 35 to 39 Years | 620 (5.1%) | 725 (5.8%) |
| 40 to 44 Years | 676 (5.6%) | 634 (5.1%) |
| 45 to 49 Years | 776 (6.4%) | 743 (6.0%) |
| 50 to 54 Years | 654 (5.4%) | 938 (7.5%) |
| 55 to 59 Years | 737 (6.1%) | 566 (4.6%) |
| 60 to 64 Years | 695 (5.7%) | 582 (4.7%) |
| 65 to 69 Years | 546 (4.5%) | 684 (5.5%) |
| 70 to 74 Years | 329 (2.7%) | 431 (3.5%) |
| 75 to 79 Years | 270 (2.2%) | 220 (1.8%) |
| 80 to 84 Years | 145 (1.2%) | 148 (1.2%) |
| 85 Years and over | 23 (0.2%) | 239 (1.9%) |
| Total | 12,146 (100.0%) | 12,424 (100.0%) |
Families and Households in Zion
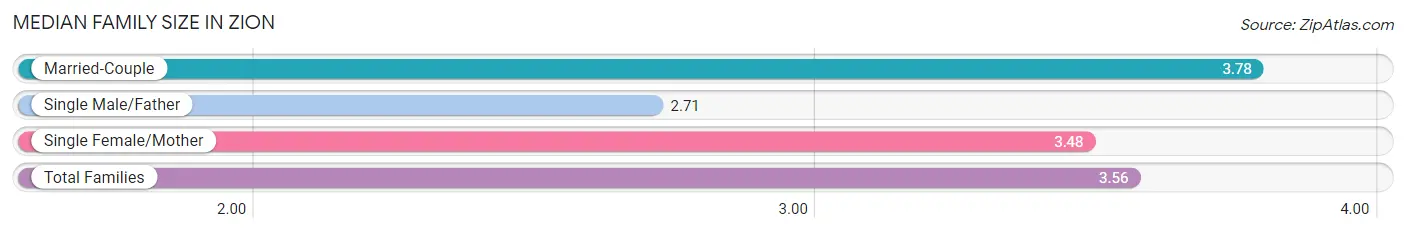
Median Family Size in Zion
The median family size in Zion is 3.56 persons per family, with married-couple families (3,461 | 62.0%) accounting for the largest median family size of 3.78 persons per family. On the other hand, single male/father families (782 | 14.0%) represent the smallest median family size with 2.71 persons per family.
| Family Type | # Families | Family Size |
| Married-Couple | 3,461 (62.0%) | 3.78 |
| Single Male/Father | 782 (14.0%) | 2.71 |
| Single Female/Mother | 1,337 (24.0%) | 3.48 |
| Total Families | 5,580 (100.0%) | 3.56 |
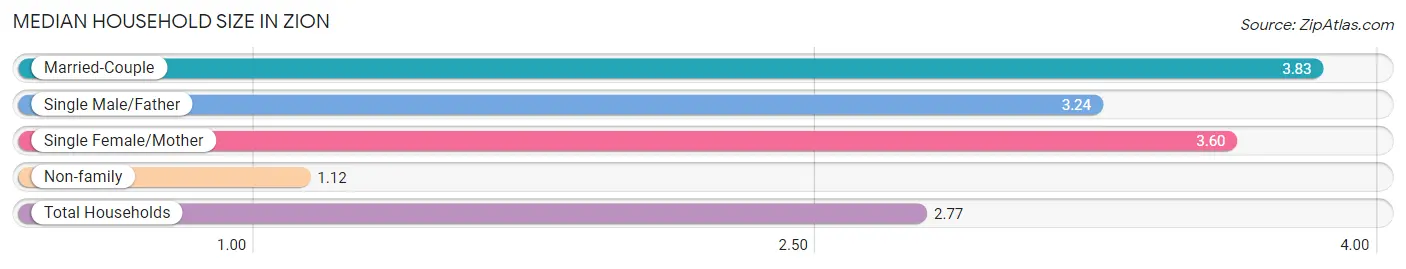
Median Household Size in Zion
The median household size in Zion is 2.77 persons per household, with married-couple households (3,461 | 39.7%) accounting for the largest median household size of 3.83 persons per household. non-family households (3,147 | 36.1%) represent the smallest median household size with 1.12 persons per household.
| Household Type | # Households | Household Size |
| Married-Couple | 3,461 (39.7%) | 3.83 |
| Single Male/Father | 782 (9.0%) | 3.24 |
| Single Female/Mother | 1,337 (15.3%) | 3.60 |
| Non-family | 3,147 (36.1%) | 1.12 |
| Total Households | 8,727 (100.0%) | 2.77 |
Household Size by Marriage Status in Zion
Out of a total of 8,727 households in Zion, 5,580 (63.9%) are family households, while 3,147 (36.1%) are nonfamily households. The most numerous type of family households are 3-person households, comprising 1,723, and the most common type of nonfamily households are 1-person households, comprising 2,771.
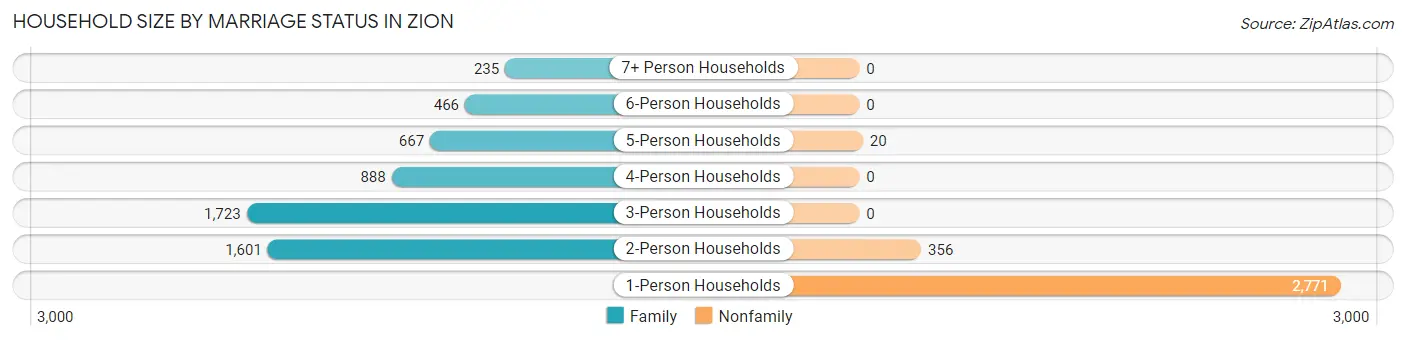
| Household Size | Family Households | Nonfamily Households |
| 1-Person Households | - | 2,771 (31.8%) |
| 2-Person Households | 1,601 (18.3%) | 356 (4.1%) |
| 3-Person Households | 1,723 (19.7%) | 0 (0.0%) |
| 4-Person Households | 888 (10.2%) | 0 (0.0%) |
| 5-Person Households | 667 (7.6%) | 20 (0.2%) |
| 6-Person Households | 466 (5.3%) | 0 (0.0%) |
| 7+ Person Households | 235 (2.7%) | 0 (0.0%) |
| Total | 5,580 (63.9%) | 3,147 (36.1%) |
Female Fertility in Zion
Fertility by Age in Zion
Average fertility rate in Zion is 27.0 births per 1,000 women. Women in the age bracket of 20 to 34 years have the highest fertility rate with 45.0 births per 1,000 women. Women in the age bracket of 20 to 34 years acount for 77.6% of all women with births.
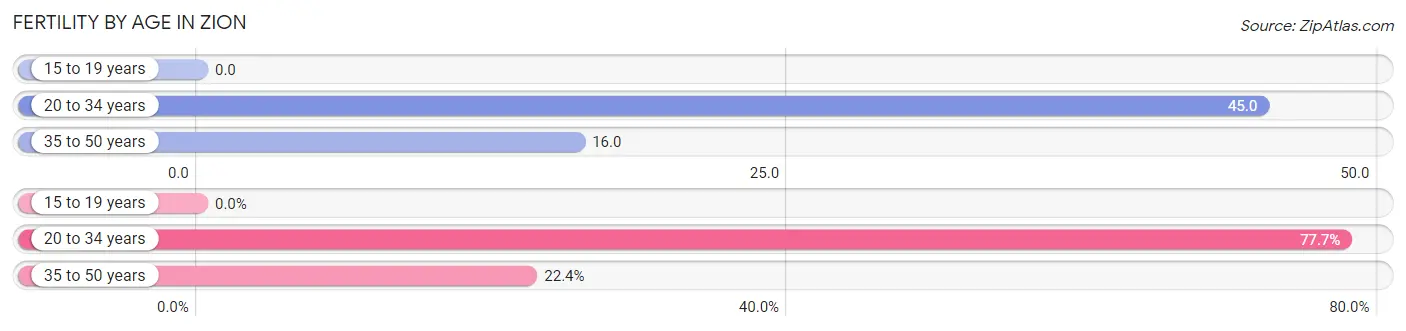
| Age Bracket | Women with Births | Births / 1,000 Women |
| 15 to 19 years | 0 (0.0%) | 0.0 |
| 20 to 34 years | 132 (77.6%) | 45.0 |
| 35 to 50 years | 38 (22.4%) | 16.0 |
| Total | 170 (100.0%) | 27.0 |
Fertility by Age by Marriage Status in Zion
45.9% of women with births (170) in Zion are married. The highest percentage of unmarried women with births falls into 20 to 34 years age bracket with 69.7% of them unmarried at the time of birth, while the lowest percentage of unmarried women with births belong to 35 to 50 years age bracket with 0.0% of them unmarried.
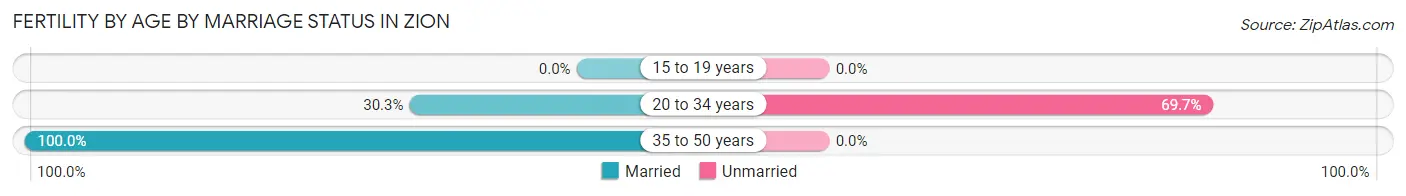
| Age Bracket | Married | Unmarried |
| 15 to 19 years | 0 (0.0%) | 0 (0.0%) |
| 20 to 34 years | 40 (30.3%) | 92 (69.7%) |
| 35 to 50 years | 38 (100.0%) | 0 (0.0%) |
| Total | 78 (45.9%) | 92 (54.1%) |
Fertility by Education in Zion
Average fertility rate in Zion is 27.0 births per 1,000 women. Women with the education attainment of graduate degree have the highest fertility rate of 109.0 births per 1,000 women, while women with the education attainment of less than high school have the lowest fertility at 8.0 births per 1,000 women. Women with the education attainment of college or associate's degree represent 35.3% of all women with births.
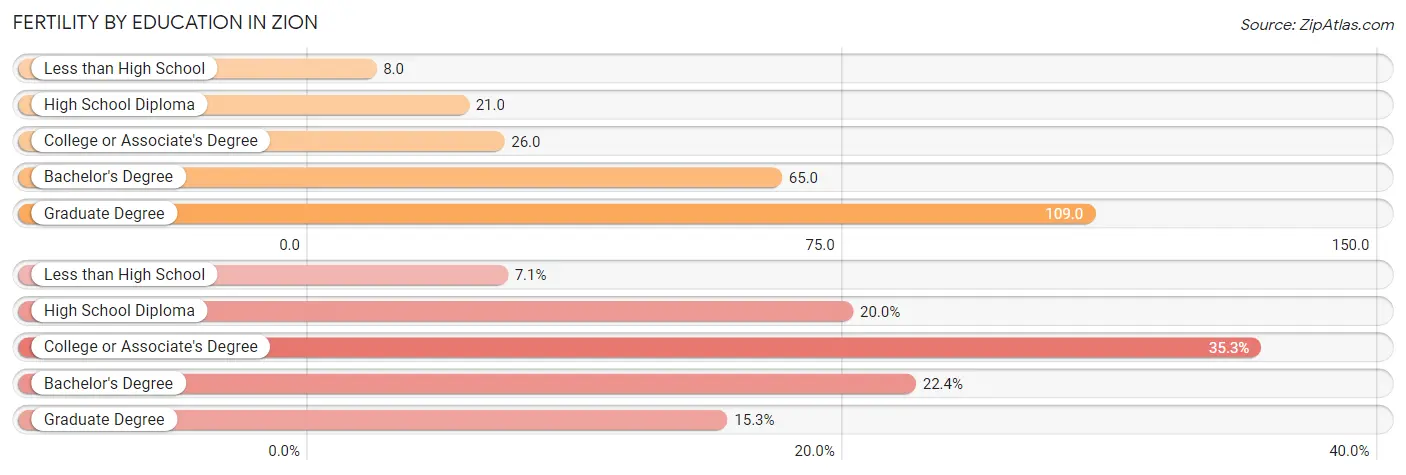
| Educational Attainment | Women with Births | Births / 1,000 Women |
| Less than High School | 12 (7.1%) | 8.0 |
| High School Diploma | 34 (20.0%) | 21.0 |
| College or Associate's Degree | 60 (35.3%) | 26.0 |
| Bachelor's Degree | 38 (22.4%) | 65.0 |
| Graduate Degree | 26 (15.3%) | 109.0 |
| Total | 170 (100.0%) | 27.0 |
Fertility by Education by Marriage Status in Zion
54.1% of women with births in Zion are unmarried. Women with the educational attainment of bachelor's degree are most likely to be married with 100.0% of them married at childbirth, while women with the educational attainment of less than high school are least likely to be married with 100.0% of them unmarried at childbirth.
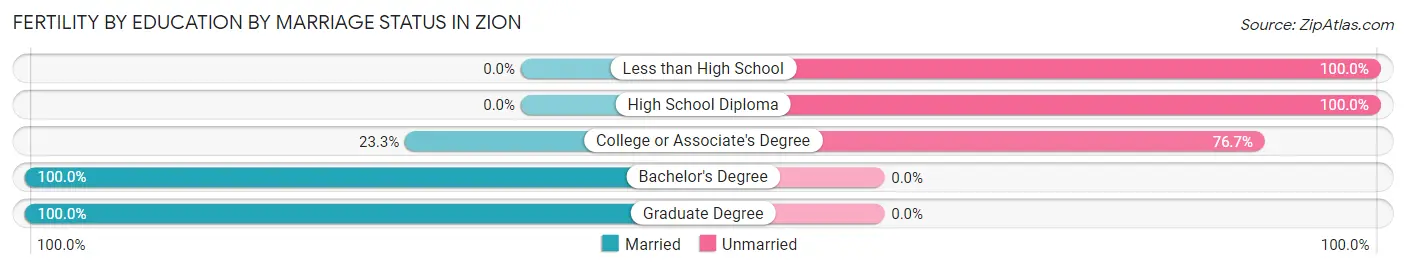
| Educational Attainment | Married | Unmarried |
| Less than High School | 0 (0.0%) | 12 (100.0%) |
| High School Diploma | 0 (0.0%) | 34 (100.0%) |
| College or Associate's Degree | 14 (23.3%) | 46 (76.7%) |
| Bachelor's Degree | 38 (100.0%) | 0 (0.0%) |
| Graduate Degree | 26 (100.0%) | 0 (0.0%) |
| Total | 78 (45.9%) | 92 (54.1%) |
Employment Characteristics in Zion
Employment by Class of Employer in Zion
Among the 11,867 employed individuals in Zion, private company employees (9,065 | 76.4%), local government employees (784 | 6.6%), and not-for-profit organizations (745 | 6.3%) make up the most common classes of employment.
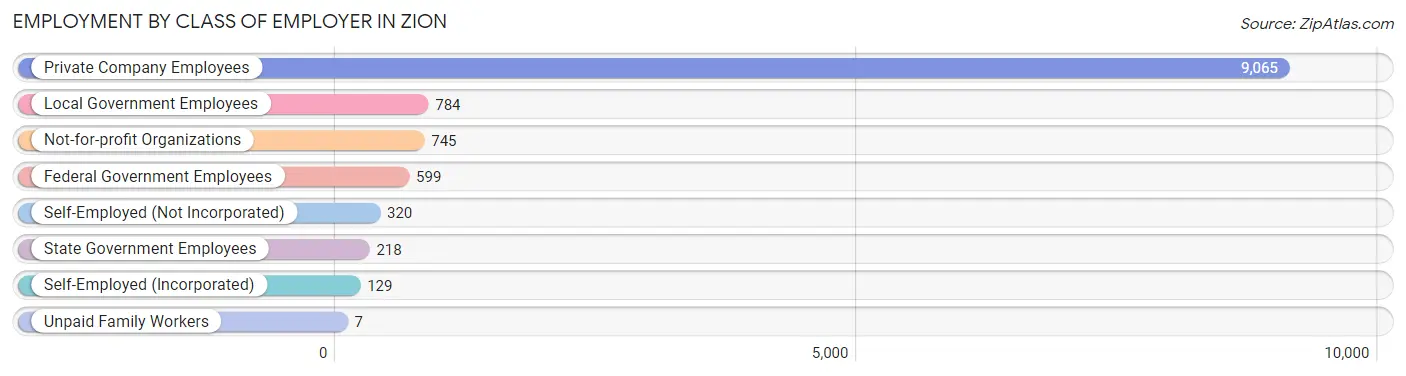
| Employer Class | # Employees | % Employees |
| Private Company Employees | 9,065 | 76.4% |
| Self-Employed (Incorporated) | 129 | 1.1% |
| Self-Employed (Not Incorporated) | 320 | 2.7% |
| Not-for-profit Organizations | 745 | 6.3% |
| Local Government Employees | 784 | 6.6% |
| State Government Employees | 218 | 1.8% |
| Federal Government Employees | 599 | 5.1% |
| Unpaid Family Workers | 7 | 0.1% |
| Total | 11,867 | 100.0% |
Employment Status by Age in Zion
According to the labor force statistics for Zion, out of the total population over 16 years of age (18,539), 69.3% or 12,848 individuals are in the labor force, with 6.4% or 822 of them unemployed. The age group with the highest labor force participation rate is 35 to 44 years, with 91.1% or 2,419 individuals in the labor force. Within the labor force, the 30 to 34 years age range has the highest percentage of unemployed individuals, with 16.8% or 257 of them being unemployed.
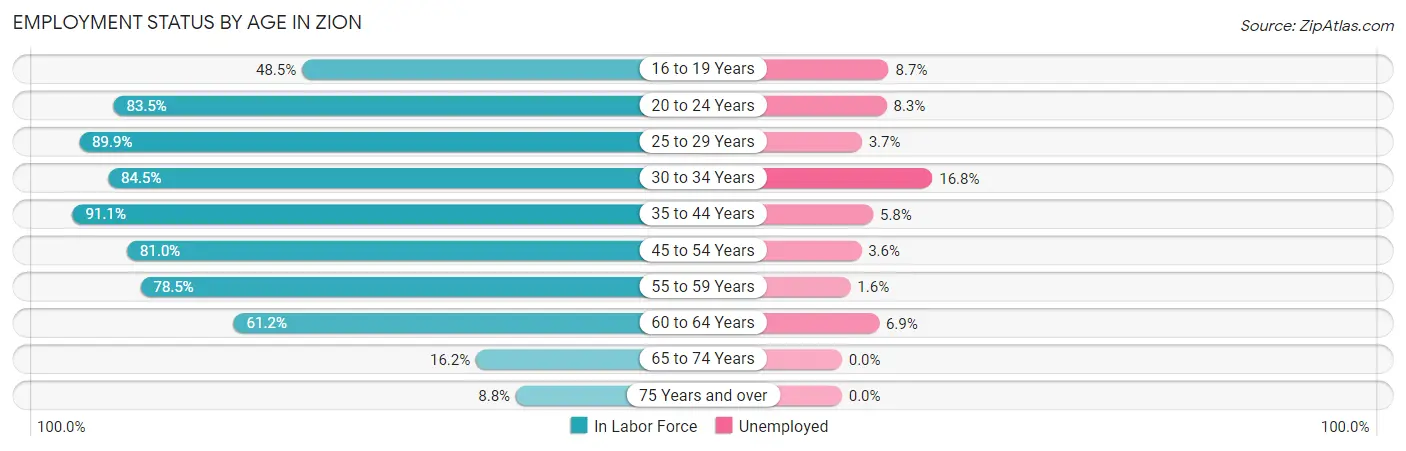
| Age Bracket | In Labor Force | Unemployed |
| 16 to 19 Years | 604 (48.5%) | 53 (8.7%) |
| 20 to 24 Years | 1,799 (83.5%) | 149 (8.3%) |
| 25 to 29 Years | 1,754 (89.9%) | 65 (3.7%) |
| 30 to 34 Years | 1,527 (84.5%) | 257 (16.8%) |
| 35 to 44 Years | 2,419 (91.1%) | 140 (5.8%) |
| 45 to 54 Years | 2,520 (81.0%) | 91 (3.6%) |
| 55 to 59 Years | 1,023 (78.5%) | 16 (1.6%) |
| 60 to 64 Years | 782 (61.2%) | 54 (6.9%) |
| 65 to 74 Years | 322 (16.2%) | 0 (0.0%) |
| 75 Years and over | 92 (8.8%) | 0 (0.0%) |
| Total | 12,848 (69.3%) | 822 (6.4%) |
Employment Status by Educational Attainment in Zion
According to labor force statistics for Zion, 82.8% of individuals (10,022) out of the total population between 25 and 64 years of age (12,104) are in the labor force, with 6.2% or 621 of them being unemployed. The group with the highest labor force participation rate are those with the educational attainment of college / associate degree, with 90.8% or 3,894 individuals in the labor force. Within the labor force, individuals with high school diploma education have the highest percentage of unemployment, with 10.9% or 335 of them being unemployed.
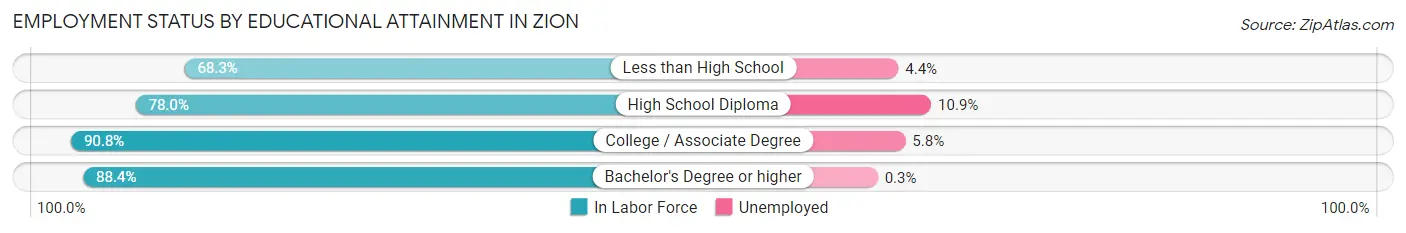
| Educational Attainment | In Labor Force | Unemployed |
| Less than High School | 1,250 (68.3%) | 81 (4.4%) |
| High School Diploma | 3,069 (78.0%) | 429 (10.9%) |
| College / Associate Degree | 3,894 (90.8%) | 249 (5.8%) |
| Bachelor's Degree or higher | 1,812 (88.4%) | 6 (0.3%) |
| Total | 10,022 (82.8%) | 750 (6.2%) |
Employment Occupations by Sex in Zion
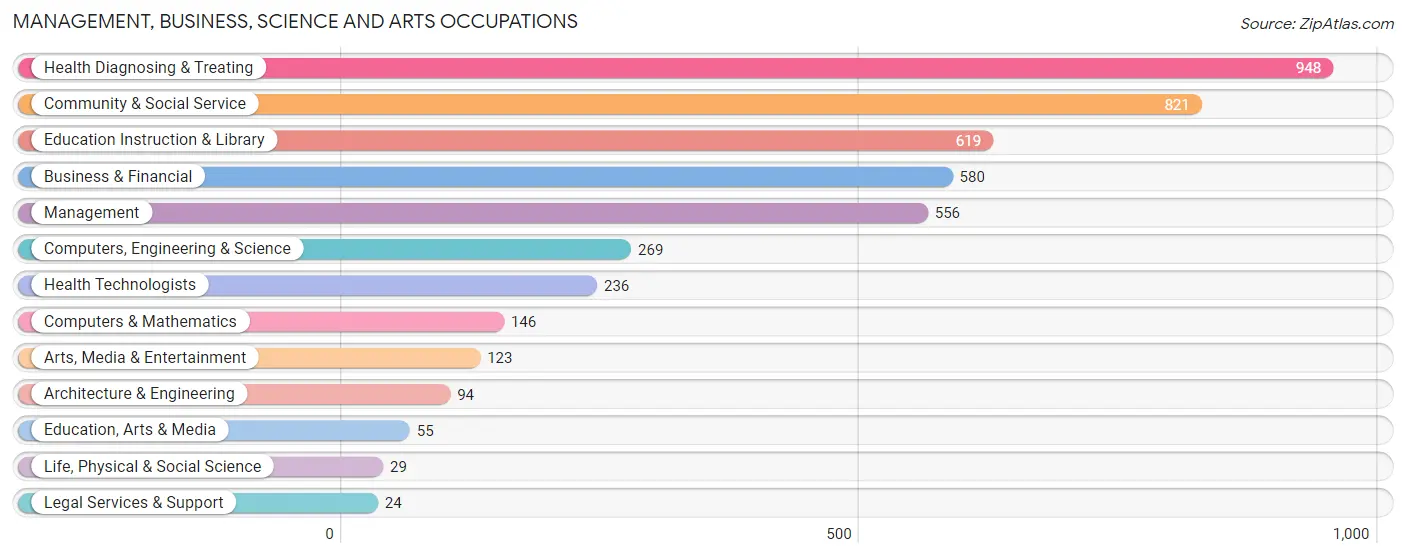
Management, Business, Science and Arts Occupations
The most common Management, Business, Science and Arts occupations in Zion are Health Diagnosing & Treating (948 | 8.0%), Community & Social Service (821 | 6.9%), Education Instruction & Library (619 | 5.2%), Business & Financial (580 | 4.9%), and Management (556 | 4.7%).
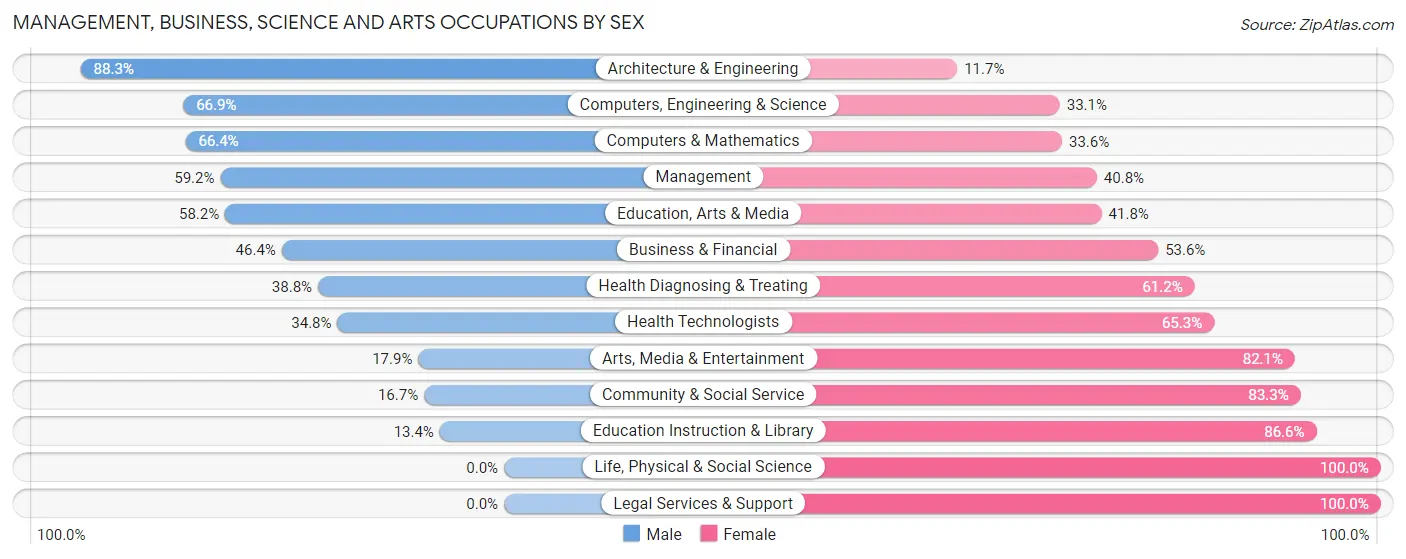
Management, Business, Science and Arts Occupations by Sex
Within the Management, Business, Science and Arts occupations in Zion, the most male-oriented occupations are Architecture & Engineering (88.3%), Computers, Engineering & Science (66.9%), and Computers & Mathematics (66.4%), while the most female-oriented occupations are Life, Physical & Social Science (100.0%), Legal Services & Support (100.0%), and Education Instruction & Library (86.6%).
| Occupation | Male | Female |
| Management | 329 (59.2%) | 227 (40.8%) |
| Business & Financial | 269 (46.4%) | 311 (53.6%) |
| Computers, Engineering & Science | 180 (66.9%) | 89 (33.1%) |
| Computers & Mathematics | 97 (66.4%) | 49 (33.6%) |
| Architecture & Engineering | 83 (88.3%) | 11 (11.7%) |
| Life, Physical & Social Science | 0 (0.0%) | 29 (100.0%) |
| Community & Social Service | 137 (16.7%) | 684 (83.3%) |
| Education, Arts & Media | 32 (58.2%) | 23 (41.8%) |
| Legal Services & Support | 0 (0.0%) | 24 (100.0%) |
| Education Instruction & Library | 83 (13.4%) | 536 (86.6%) |
| Arts, Media & Entertainment | 22 (17.9%) | 101 (82.1%) |
| Health Diagnosing & Treating | 368 (38.8%) | 580 (61.2%) |
| Health Technologists | 82 (34.7%) | 154 (65.2%) |
| Total (Category) | 1,283 (40.4%) | 1,891 (59.6%) |
| Total (Overall) | 6,108 (51.2%) | 5,818 (48.8%) |
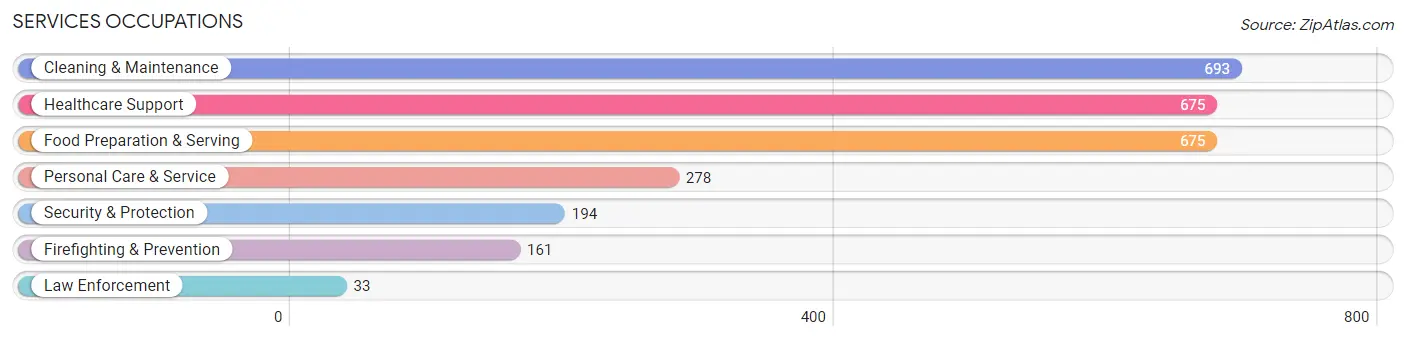
Services Occupations
The most common Services occupations in Zion are Cleaning & Maintenance (693 | 5.8%), Healthcare Support (675 | 5.7%), Food Preparation & Serving (675 | 5.7%), Personal Care & Service (278 | 2.3%), and Security & Protection (194 | 1.6%).
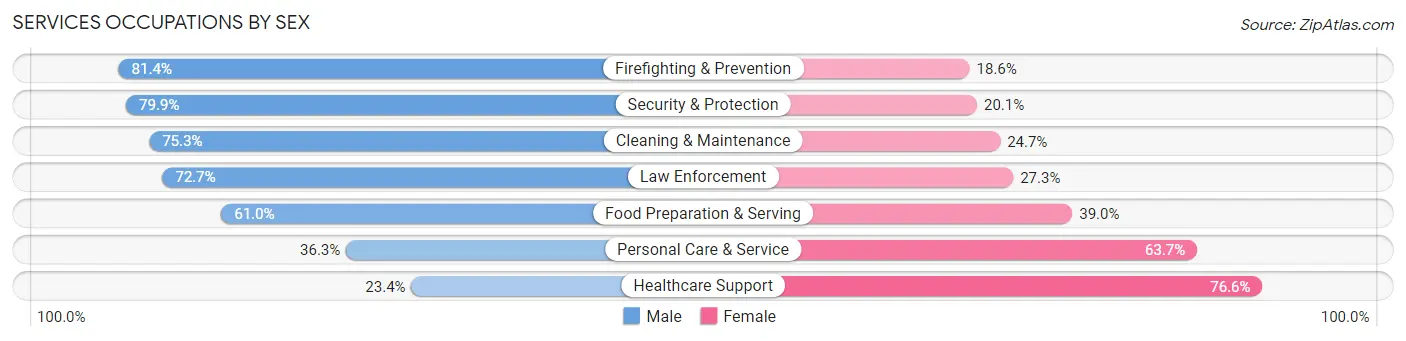
Services Occupations by Sex
Within the Services occupations in Zion, the most male-oriented occupations are Firefighting & Prevention (81.4%), Security & Protection (79.9%), and Cleaning & Maintenance (75.3%), while the most female-oriented occupations are Healthcare Support (76.6%), Personal Care & Service (63.7%), and Food Preparation & Serving (39.0%).
| Occupation | Male | Female |
| Healthcare Support | 158 (23.4%) | 517 (76.6%) |
| Security & Protection | 155 (79.9%) | 39 (20.1%) |
| Firefighting & Prevention | 131 (81.4%) | 30 (18.6%) |
| Law Enforcement | 24 (72.7%) | 9 (27.3%) |
| Food Preparation & Serving | 412 (61.0%) | 263 (39.0%) |
| Cleaning & Maintenance | 522 (75.3%) | 171 (24.7%) |
| Personal Care & Service | 101 (36.3%) | 177 (63.7%) |
| Total (Category) | 1,348 (53.6%) | 1,167 (46.4%) |
| Total (Overall) | 6,108 (51.2%) | 5,818 (48.8%) |
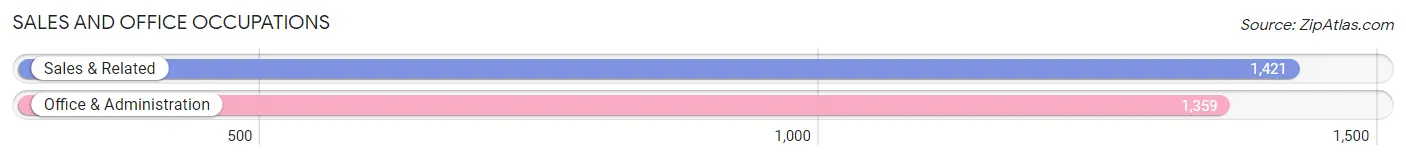
Sales and Office Occupations
The most common Sales and Office occupations in Zion are Sales & Related (1,421 | 11.9%), and Office & Administration (1,359 | 11.4%).
Sales and Office Occupations by Sex
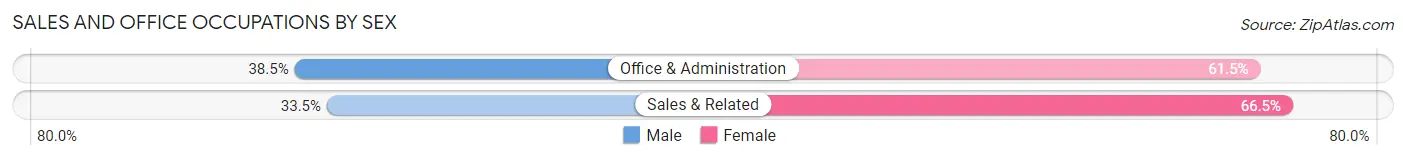
| Occupation | Male | Female |
| Sales & Related | 476 (33.5%) | 945 (66.5%) |
| Office & Administration | 523 (38.5%) | 836 (61.5%) |
| Total (Category) | 999 (35.9%) | 1,781 (64.1%) |
| Total (Overall) | 6,108 (51.2%) | 5,818 (48.8%) |
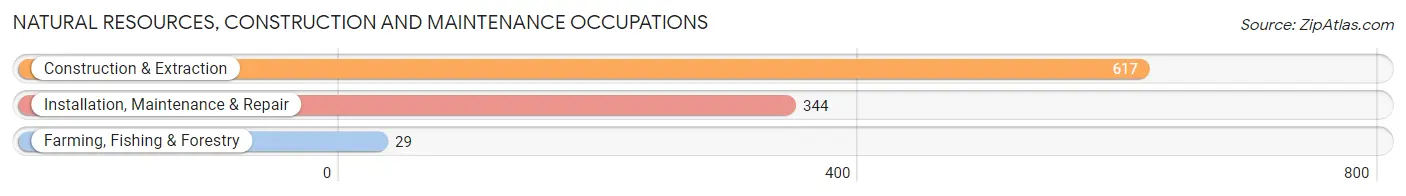
Natural Resources, Construction and Maintenance Occupations
The most common Natural Resources, Construction and Maintenance occupations in Zion are Construction & Extraction (617 | 5.2%), Installation, Maintenance & Repair (344 | 2.9%), and Farming, Fishing & Forestry (29 | 0.2%).
Natural Resources, Construction and Maintenance Occupations by Sex
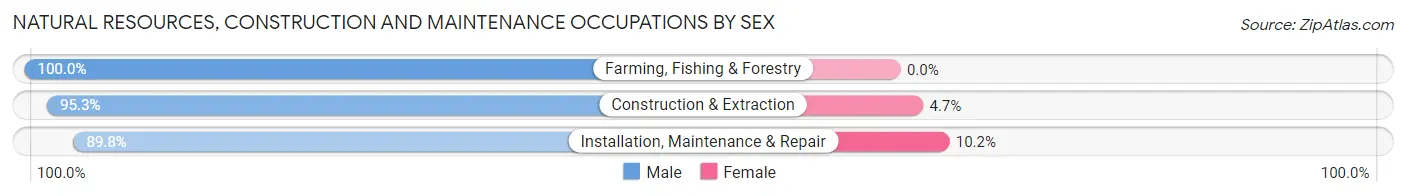
| Occupation | Male | Female |
| Farming, Fishing & Forestry | 29 (100.0%) | 0 (0.0%) |
| Construction & Extraction | 588 (95.3%) | 29 (4.7%) |
| Installation, Maintenance & Repair | 309 (89.8%) | 35 (10.2%) |
| Total (Category) | 926 (93.5%) | 64 (6.5%) |
| Total (Overall) | 6,108 (51.2%) | 5,818 (48.8%) |
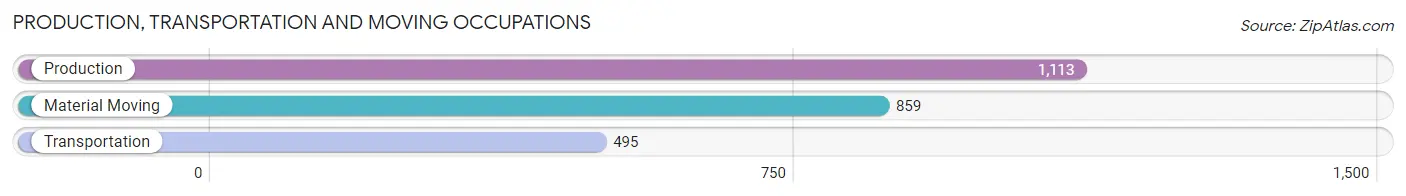
Production, Transportation and Moving Occupations
The most common Production, Transportation and Moving occupations in Zion are Production (1,113 | 9.3%), Material Moving (859 | 7.2%), and Transportation (495 | 4.2%).
Production, Transportation and Moving Occupations by Sex
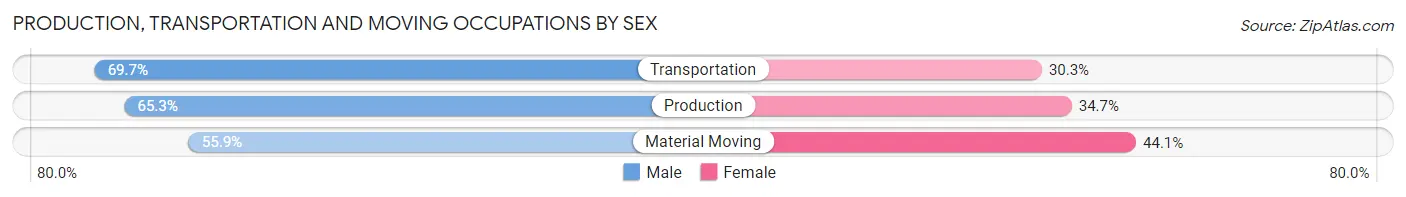
| Occupation | Male | Female |
| Production | 727 (65.3%) | 386 (34.7%) |
| Transportation | 345 (69.7%) | 150 (30.3%) |
| Material Moving | 480 (55.9%) | 379 (44.1%) |
| Total (Category) | 1,552 (62.9%) | 915 (37.1%) |
| Total (Overall) | 6,108 (51.2%) | 5,818 (48.8%) |
Employment Industries by Sex in Zion
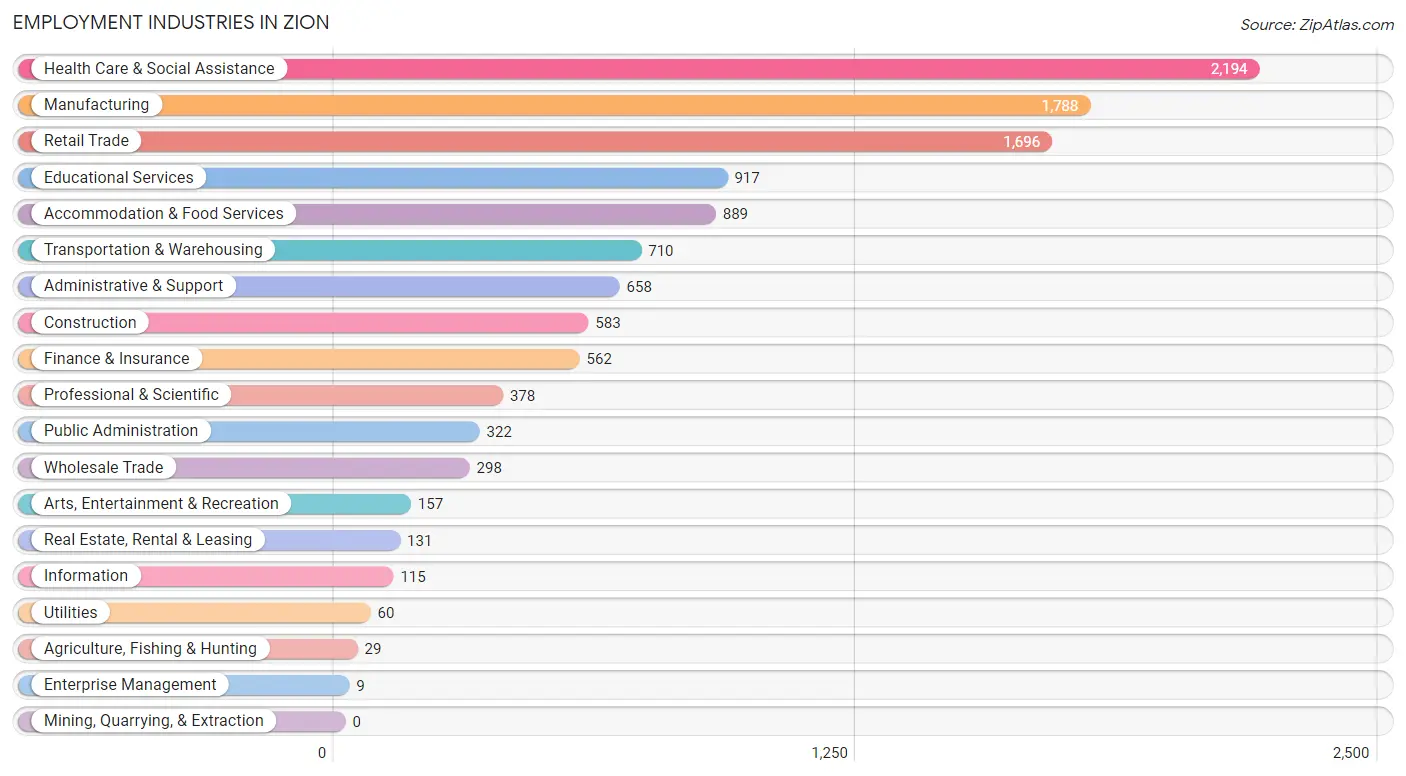
Employment Industries in Zion
The major employment industries in Zion include Health Care & Social Assistance (2,194 | 18.4%), Manufacturing (1,788 | 15.0%), Retail Trade (1,696 | 14.2%), Educational Services (917 | 7.7%), and Accommodation & Food Services (889 | 7.4%).
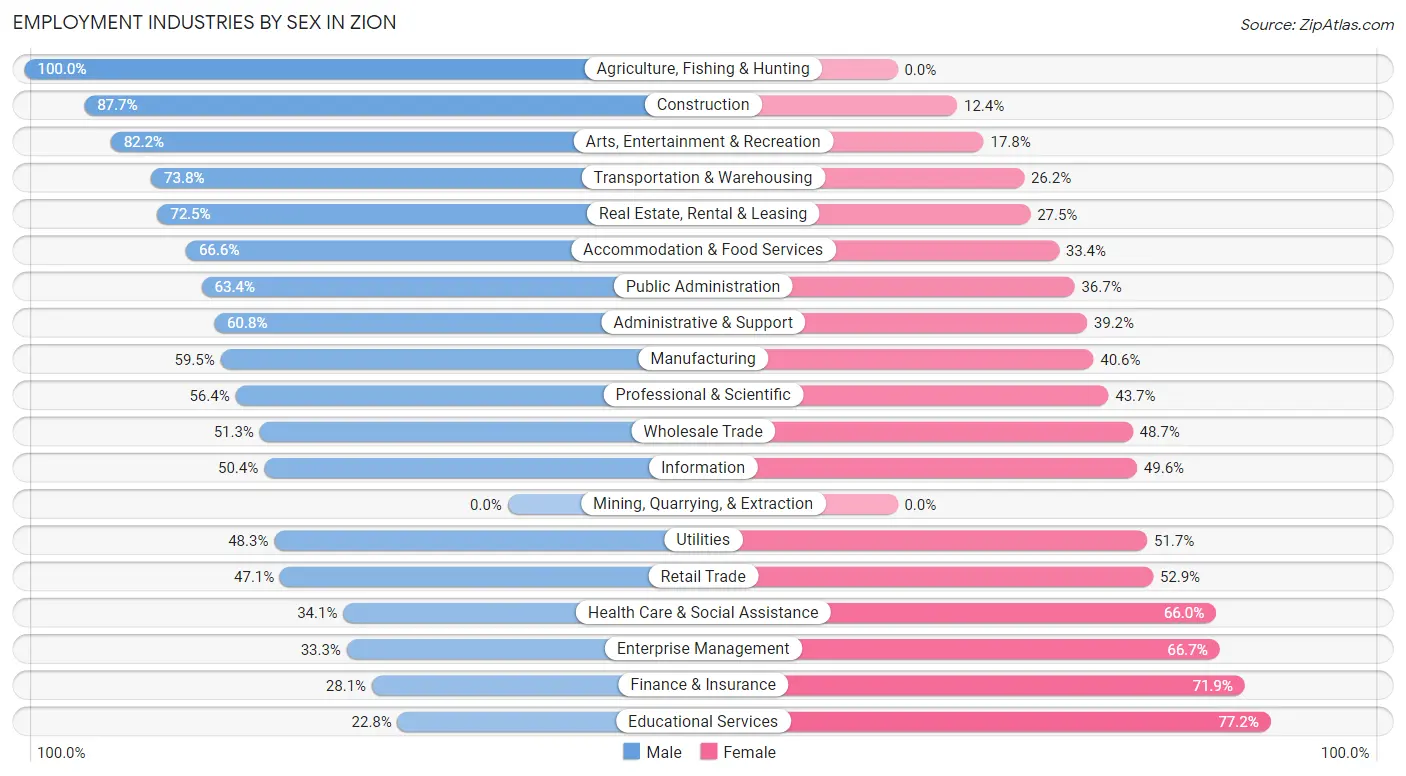
Employment Industries by Sex in Zion
The Zion industries that see more men than women are Agriculture, Fishing & Hunting (100.0%), Construction (87.6%), and Arts, Entertainment & Recreation (82.2%), whereas the industries that tend to have a higher number of women are Educational Services (77.2%), Finance & Insurance (71.9%), and Enterprise Management (66.7%).
| Industry | Male | Female |
| Agriculture, Fishing & Hunting | 29 (100.0%) | 0 (0.0%) |
| Mining, Quarrying, & Extraction | 0 (0.0%) | 0 (0.0%) |
| Construction | 511 (87.6%) | 72 (12.3%) |
| Manufacturing | 1,063 (59.5%) | 725 (40.6%) |
| Wholesale Trade | 153 (51.3%) | 145 (48.7%) |
| Retail Trade | 799 (47.1%) | 897 (52.9%) |
| Transportation & Warehousing | 524 (73.8%) | 186 (26.2%) |
| Utilities | 29 (48.3%) | 31 (51.7%) |
| Information | 58 (50.4%) | 57 (49.6%) |
| Finance & Insurance | 158 (28.1%) | 404 (71.9%) |
| Real Estate, Rental & Leasing | 95 (72.5%) | 36 (27.5%) |
| Professional & Scientific | 213 (56.4%) | 165 (43.6%) |
| Enterprise Management | 3 (33.3%) | 6 (66.7%) |
| Administrative & Support | 400 (60.8%) | 258 (39.2%) |
| Educational Services | 209 (22.8%) | 708 (77.2%) |
| Health Care & Social Assistance | 747 (34.1%) | 1,447 (65.9%) |
| Arts, Entertainment & Recreation | 129 (82.2%) | 28 (17.8%) |
| Accommodation & Food Services | 592 (66.6%) | 297 (33.4%) |
| Public Administration | 204 (63.3%) | 118 (36.6%) |
| Total | 6,108 (51.2%) | 5,818 (48.8%) |
Education in Zion
School Enrollment in Zion
The most common levels of schooling among the 6,671 students in Zion are high school (1,644 | 24.6%), middle school (1,479 | 22.2%), and elementary school (1,452 | 21.8%).
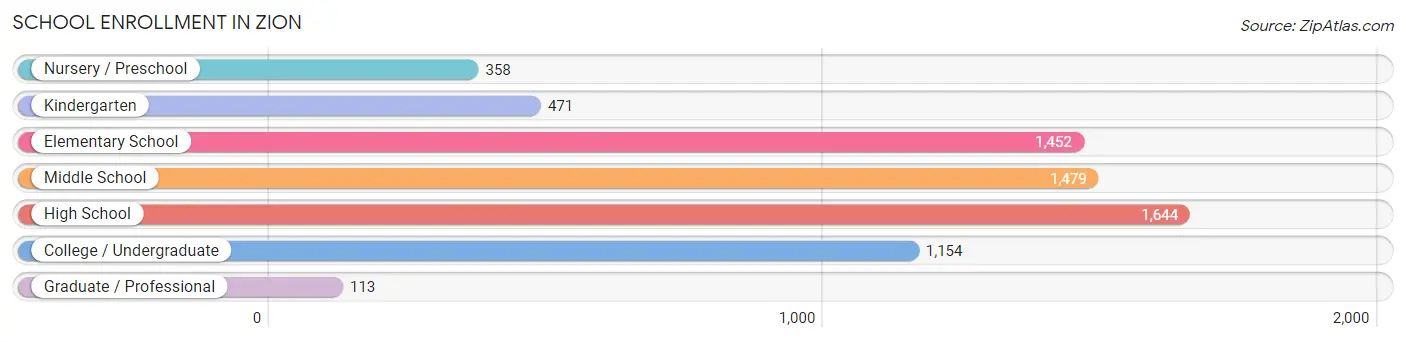
| School Level | # Students | % Students |
| Nursery / Preschool | 358 | 5.4% |
| Kindergarten | 471 | 7.1% |
| Elementary School | 1,452 | 21.8% |
| Middle School | 1,479 | 22.2% |
| High School | 1,644 | 24.6% |
| College / Undergraduate | 1,154 | 17.3% |
| Graduate / Professional | 113 | 1.7% |
| Total | 6,671 | 100.0% |
School Enrollment by Age by Funding Source in Zion
Out of a total of 6,671 students who are enrolled in schools in Zion, 1,227 (18.4%) attend a private institution, while the remaining 5,444 (81.6%) are enrolled in public schools. The age group of 20 to 24 year olds has the highest likelihood of being enrolled in private schools, with 228 (41.4% in the age bracket) enrolled. Conversely, the age group of 18 to 19 year olds has the lowest likelihood of being enrolled in a private school, with 266 (96.0% in the age bracket) attending a public institution.
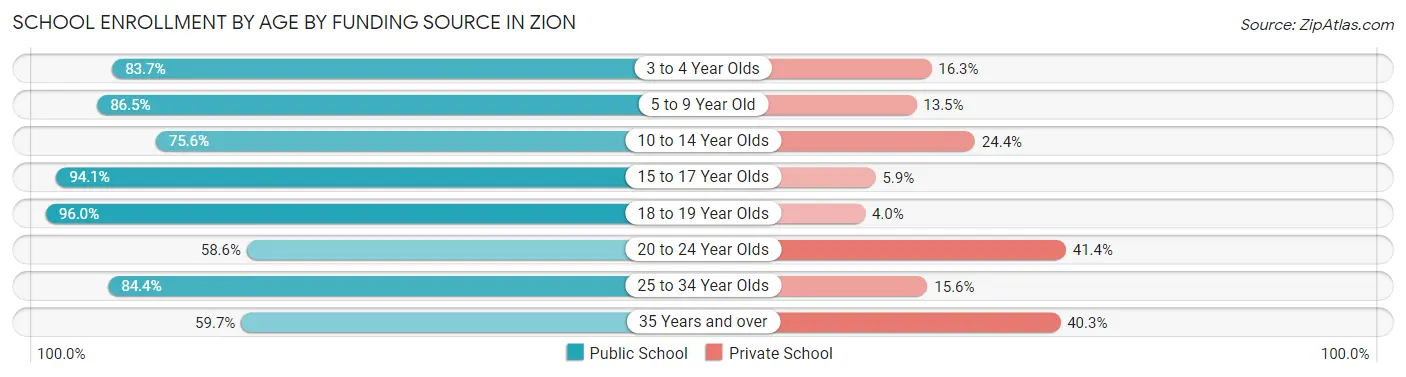
| Age Bracket | Public School | Private School |
| 3 to 4 Year Olds | 246 (83.7%) | 48 (16.3%) |
| 5 to 9 Year Old | 1,469 (86.5%) | 230 (13.5%) |
| 10 to 14 Year Olds | 1,438 (75.6%) | 465 (24.4%) |
| 15 to 17 Year Olds | 1,239 (94.1%) | 78 (5.9%) |
| 18 to 19 Year Olds | 266 (96.0%) | 11 (4.0%) |
| 20 to 24 Year Olds | 323 (58.6%) | 228 (41.4%) |
| 25 to 34 Year Olds | 287 (84.4%) | 53 (15.6%) |
| 35 Years and over | 173 (59.7%) | 117 (40.3%) |
| Total | 5,444 (81.6%) | 1,227 (18.4%) |
Educational Attainment by Field of Study in Zion
Business (603 | 21.3%), education (481 | 17.0%), science & technology (283 | 10.0%), engineering (226 | 8.0%), and liberal arts & history (190 | 6.7%) are the most common fields of study among 2,824 individuals in Zion who have obtained a bachelor's degree or higher.
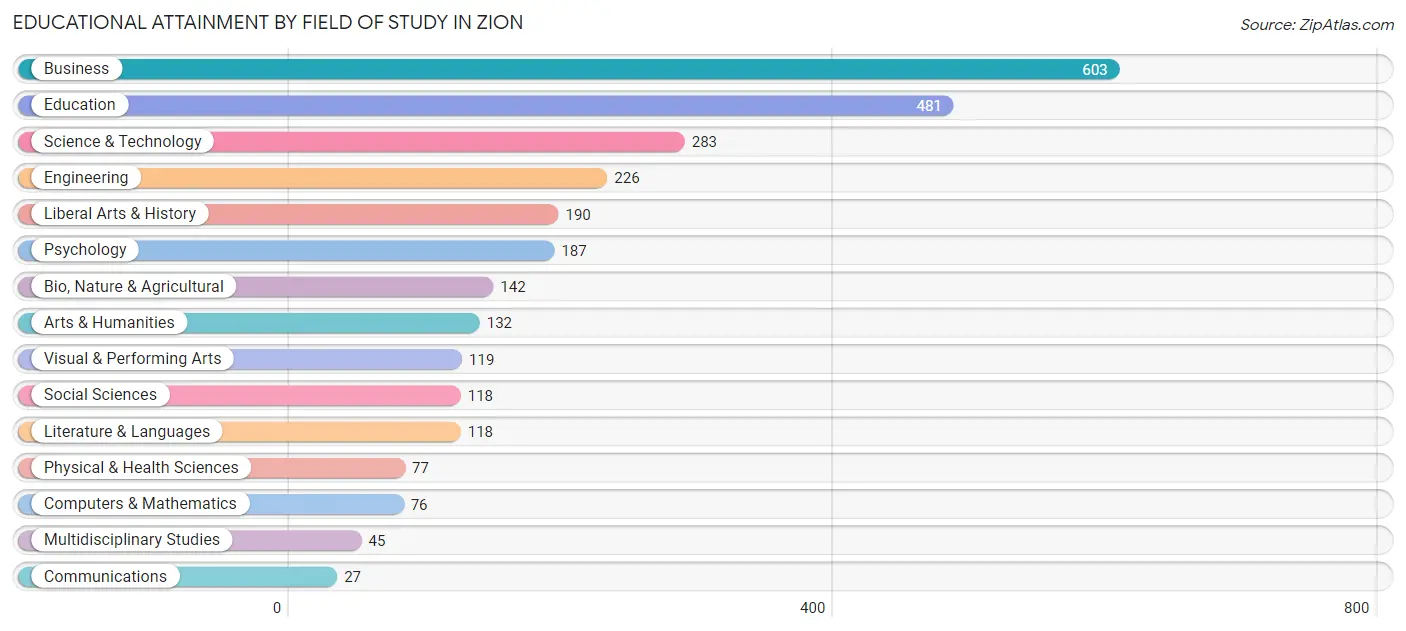
| Field of Study | # Graduates | % Graduates |
| Computers & Mathematics | 76 | 2.7% |
| Bio, Nature & Agricultural | 142 | 5.0% |
| Physical & Health Sciences | 77 | 2.7% |
| Psychology | 187 | 6.6% |
| Social Sciences | 118 | 4.2% |
| Engineering | 226 | 8.0% |
| Multidisciplinary Studies | 45 | 1.6% |
| Science & Technology | 283 | 10.0% |
| Business | 603 | 21.3% |
| Education | 481 | 17.0% |
| Literature & Languages | 118 | 4.2% |
| Liberal Arts & History | 190 | 6.7% |
| Visual & Performing Arts | 119 | 4.2% |
| Communications | 27 | 1.0% |
| Arts & Humanities | 132 | 4.7% |
| Total | 2,824 | 100.0% |
Transportation & Commute in Zion
Vehicle Availability by Sex in Zion
The most prevalent vehicle ownership categories in Zion are males with 2 vehicles (2,237, accounting for 36.2%) and females with 2 vehicles (1,835, making up 39.3%).
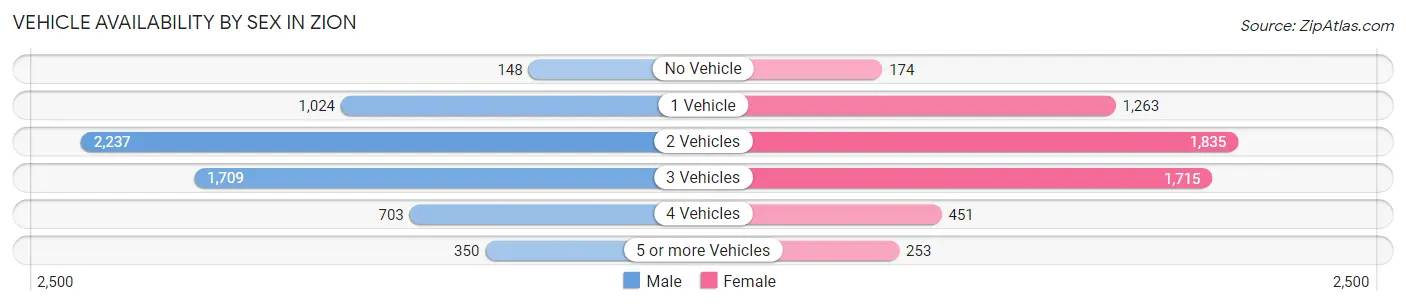
| Vehicles Available | Male | Female |
| No Vehicle | 148 (2.4%) | 174 (3.1%) |
| 1 Vehicle | 1,024 (16.6%) | 1,263 (22.2%) |
| 2 Vehicles | 2,237 (36.2%) | 1,835 (32.2%) |
| 3 Vehicles | 1,709 (27.7%) | 1,715 (30.1%) |
| 4 Vehicles | 703 (11.4%) | 451 (7.9%) |
| 5 or more Vehicles | 350 (5.7%) | 253 (4.4%) |
| Total | 6,171 (100.0%) | 5,691 (100.0%) |
Commute Time in Zion
The most frequently occuring commute durations in Zion are 45 to 59 minutes (1,538 commuters, 13.5%), 20 to 24 minutes (1,491 commuters, 13.1%), and 30 to 34 minutes (1,469 commuters, 12.9%).
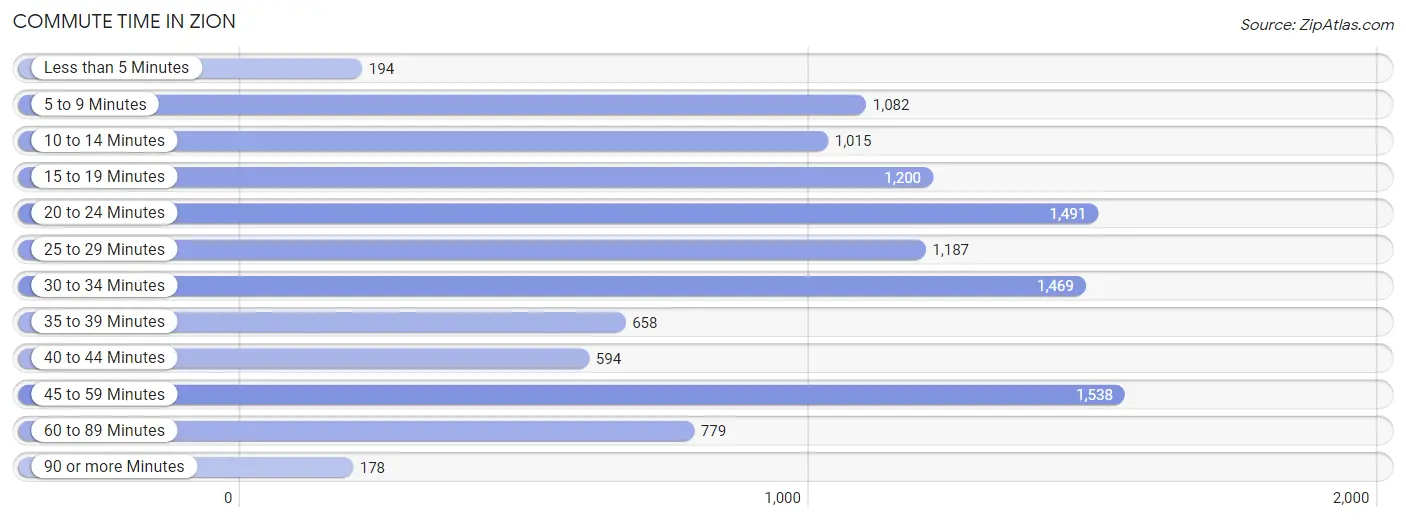
| Commute Time | # Commuters | % Commuters |
| Less than 5 Minutes | 194 | 1.7% |
| 5 to 9 Minutes | 1,082 | 9.5% |
| 10 to 14 Minutes | 1,015 | 8.9% |
| 15 to 19 Minutes | 1,200 | 10.5% |
| 20 to 24 Minutes | 1,491 | 13.1% |
| 25 to 29 Minutes | 1,187 | 10.4% |
| 30 to 34 Minutes | 1,469 | 12.9% |
| 35 to 39 Minutes | 658 | 5.8% |
| 40 to 44 Minutes | 594 | 5.2% |
| 45 to 59 Minutes | 1,538 | 13.5% |
| 60 to 89 Minutes | 779 | 6.8% |
| 90 or more Minutes | 178 | 1.6% |
Commute Time by Sex in Zion
The most common commute times in Zion are 45 to 59 minutes (1,004 commuters, 16.9%) for males and 20 to 24 minutes (885 commuters, 16.3%) for females.
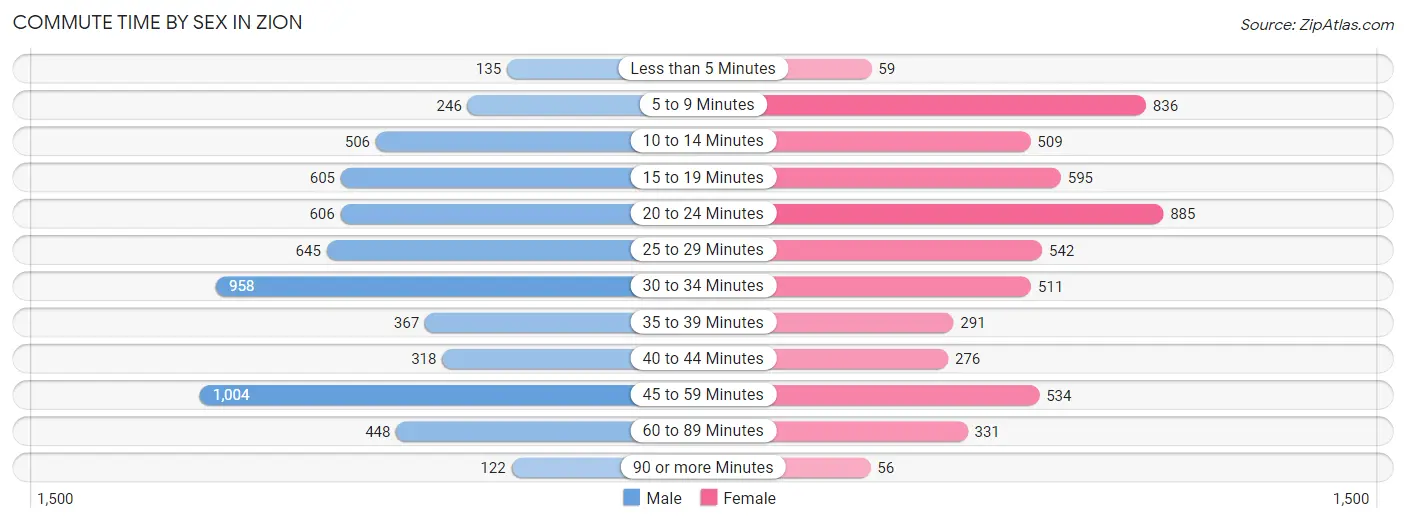
| Commute Time | Male | Female |
| Less than 5 Minutes | 135 (2.3%) | 59 (1.1%) |
| 5 to 9 Minutes | 246 (4.1%) | 836 (15.4%) |
| 10 to 14 Minutes | 506 (8.5%) | 509 (9.4%) |
| 15 to 19 Minutes | 605 (10.2%) | 595 (11.0%) |
| 20 to 24 Minutes | 606 (10.2%) | 885 (16.3%) |
| 25 to 29 Minutes | 645 (10.8%) | 542 (10.0%) |
| 30 to 34 Minutes | 958 (16.1%) | 511 (9.4%) |
| 35 to 39 Minutes | 367 (6.2%) | 291 (5.4%) |
| 40 to 44 Minutes | 318 (5.3%) | 276 (5.1%) |
| 45 to 59 Minutes | 1,004 (16.9%) | 534 (9.8%) |
| 60 to 89 Minutes | 448 (7.5%) | 331 (6.1%) |
| 90 or more Minutes | 122 (2.1%) | 56 (1.0%) |
Time of Departure to Work by Sex in Zion
The most frequent times of departure to work in Zion are 6:00 AM to 6:29 AM (988, 16.6%) for males and 7:30 AM to 7:59 AM (751, 13.8%) for females.
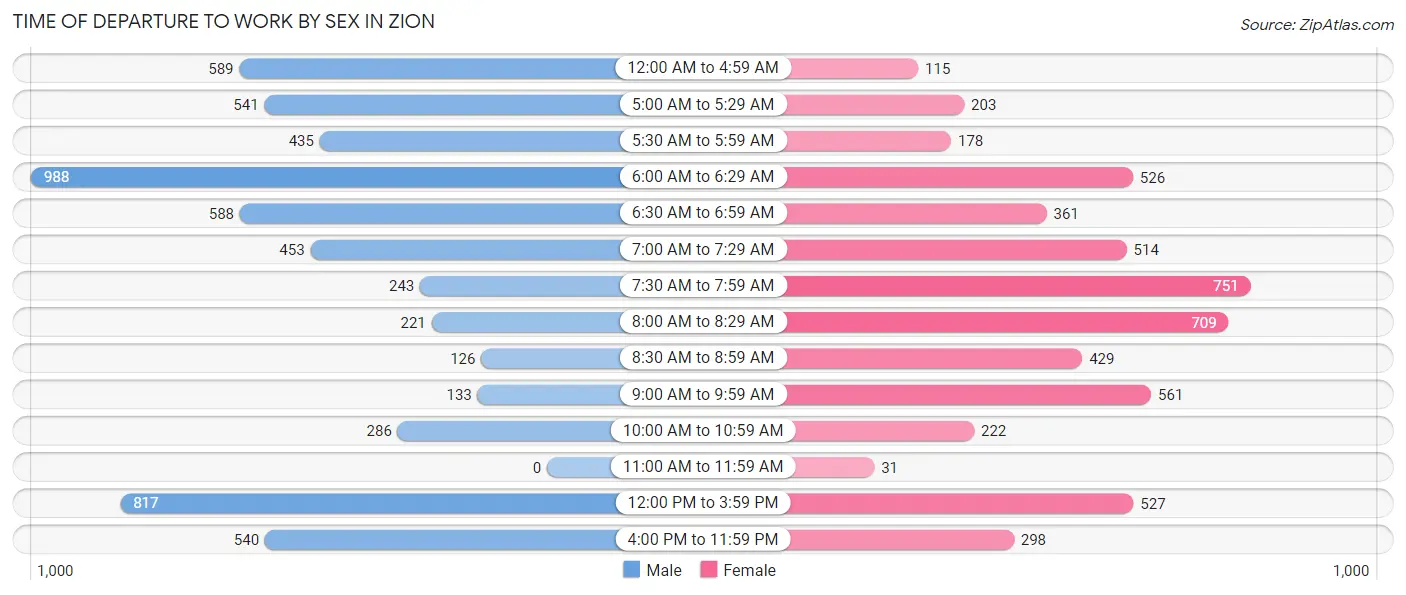
| Time of Departure | Male | Female |
| 12:00 AM to 4:59 AM | 589 (9.9%) | 115 (2.1%) |
| 5:00 AM to 5:29 AM | 541 (9.1%) | 203 (3.7%) |
| 5:30 AM to 5:59 AM | 435 (7.3%) | 178 (3.3%) |
| 6:00 AM to 6:29 AM | 988 (16.6%) | 526 (9.7%) |
| 6:30 AM to 6:59 AM | 588 (9.9%) | 361 (6.7%) |
| 7:00 AM to 7:29 AM | 453 (7.6%) | 514 (9.5%) |
| 7:30 AM to 7:59 AM | 243 (4.1%) | 751 (13.8%) |
| 8:00 AM to 8:29 AM | 221 (3.7%) | 709 (13.1%) |
| 8:30 AM to 8:59 AM | 126 (2.1%) | 429 (7.9%) |
| 9:00 AM to 9:59 AM | 133 (2.2%) | 561 (10.3%) |
| 10:00 AM to 10:59 AM | 286 (4.8%) | 222 (4.1%) |
| 11:00 AM to 11:59 AM | 0 (0.0%) | 31 (0.6%) |
| 12:00 PM to 3:59 PM | 817 (13.7%) | 527 (9.7%) |
| 4:00 PM to 11:59 PM | 540 (9.1%) | 298 (5.5%) |
| Total | 5,960 (100.0%) | 5,425 (100.0%) |
Housing Occupancy in Zion
Occupancy by Ownership in Zion
Of the total 8,727 dwellings in Zion, owner-occupied units account for 4,880 (55.9%), while renter-occupied units make up 3,847 (44.1%).
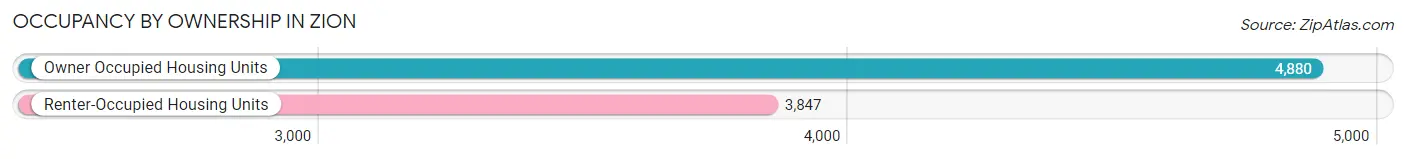
| Occupancy | # Housing Units | % Housing Units |
| Owner Occupied Housing Units | 4,880 | 55.9% |
| Renter-Occupied Housing Units | 3,847 | 44.1% |
| Total Occupied Housing Units | 8,727 | 100.0% |
Occupancy by Household Size in Zion
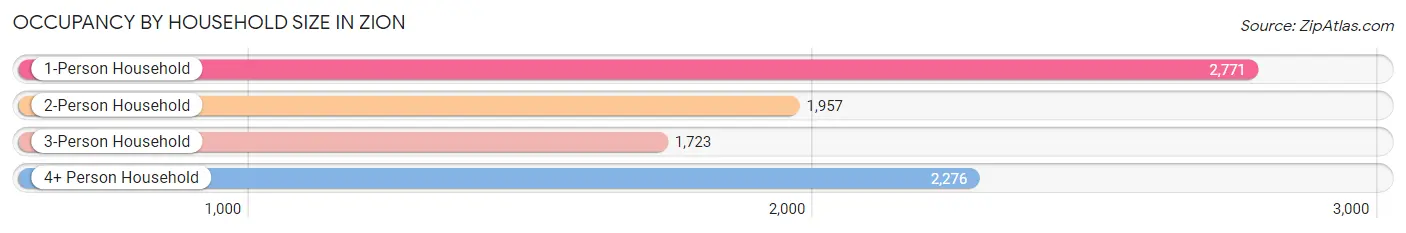
| Household Size | # Housing Units | % Housing Units |
| 1-Person Household | 2,771 | 31.8% |
| 2-Person Household | 1,957 | 22.4% |
| 3-Person Household | 1,723 | 19.7% |
| 4+ Person Household | 2,276 | 26.1% |
| Total Housing Units | 8,727 | 100.0% |
Occupancy by Ownership by Household Size in Zion

| Household Size | Owner-occupied | Renter-occupied |
| 1-Person Household | 1,106 (39.9%) | 1,665 (60.1%) |
| 2-Person Household | 1,205 (61.6%) | 752 (38.4%) |
| 3-Person Household | 942 (54.7%) | 781 (45.3%) |
| 4+ Person Household | 1,627 (71.5%) | 649 (28.5%) |
| Total Housing Units | 4,880 (55.9%) | 3,847 (44.1%) |
Occupancy by Educational Attainment in Zion
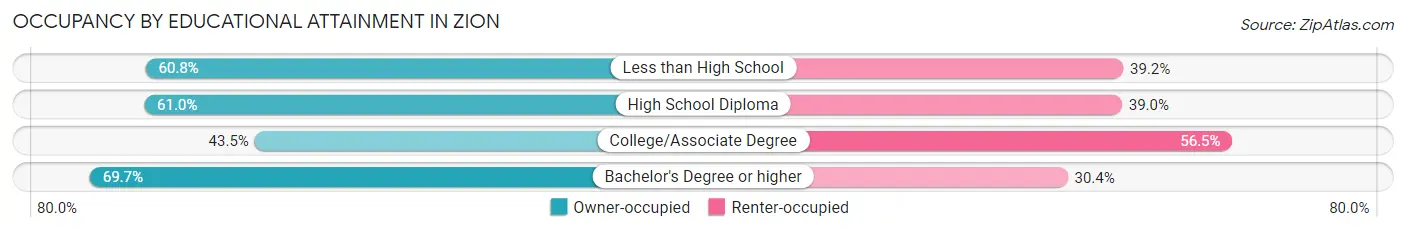
| Household Size | Owner-occupied | Renter-occupied |
| Less than High School | 685 (60.8%) | 441 (39.2%) |
| High School Diploma | 1,595 (61.0%) | 1,018 (39.0%) |
| College/Associate Degree | 1,455 (43.5%) | 1,889 (56.5%) |
| Bachelor's Degree or higher | 1,145 (69.7%) | 499 (30.3%) |
Occupancy by Age of Householder in Zion
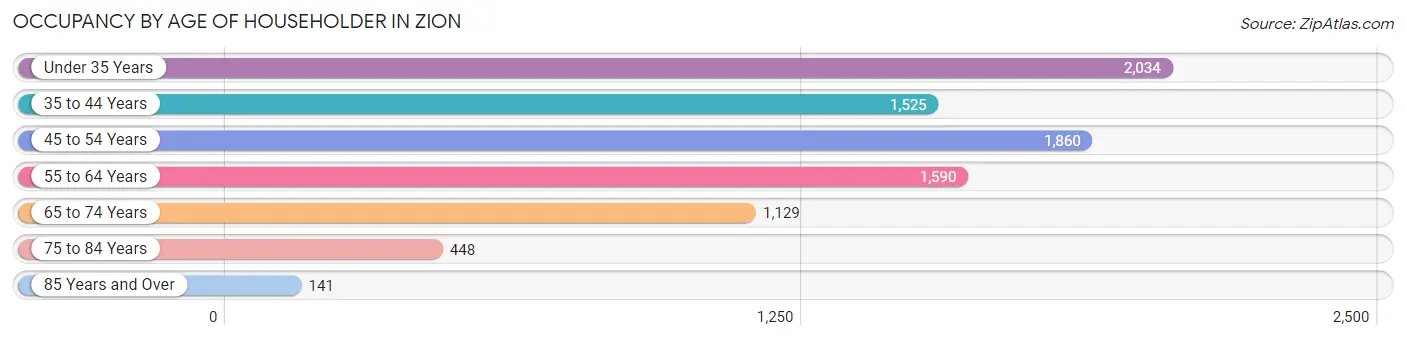
| Age Bracket | # Households | % Households |
| Under 35 Years | 2,034 | 23.3% |
| 35 to 44 Years | 1,525 | 17.5% |
| 45 to 54 Years | 1,860 | 21.3% |
| 55 to 64 Years | 1,590 | 18.2% |
| 65 to 74 Years | 1,129 | 12.9% |
| 75 to 84 Years | 448 | 5.1% |
| 85 Years and Over | 141 | 1.6% |
| Total | 8,727 | 100.0% |
Housing Finances in Zion
Median Income by Occupancy in Zion
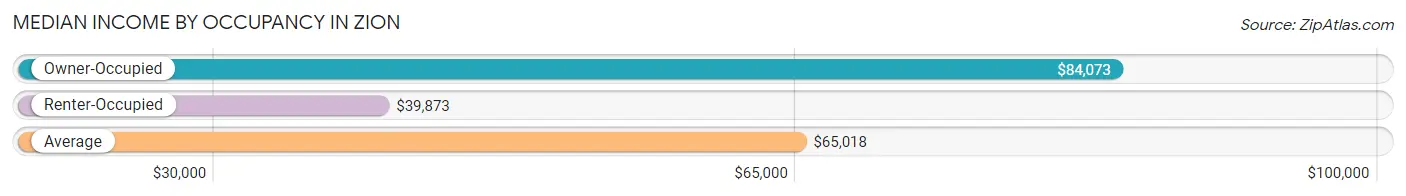
| Occupancy Type | # Households | Median Income |
| Owner-Occupied | 4,880 (55.9%) | $84,073 |
| Renter-Occupied | 3,847 (44.1%) | $39,873 |
| Average | 8,727 (100.0%) | $65,018 |
Occupancy by Householder Income Bracket in Zion
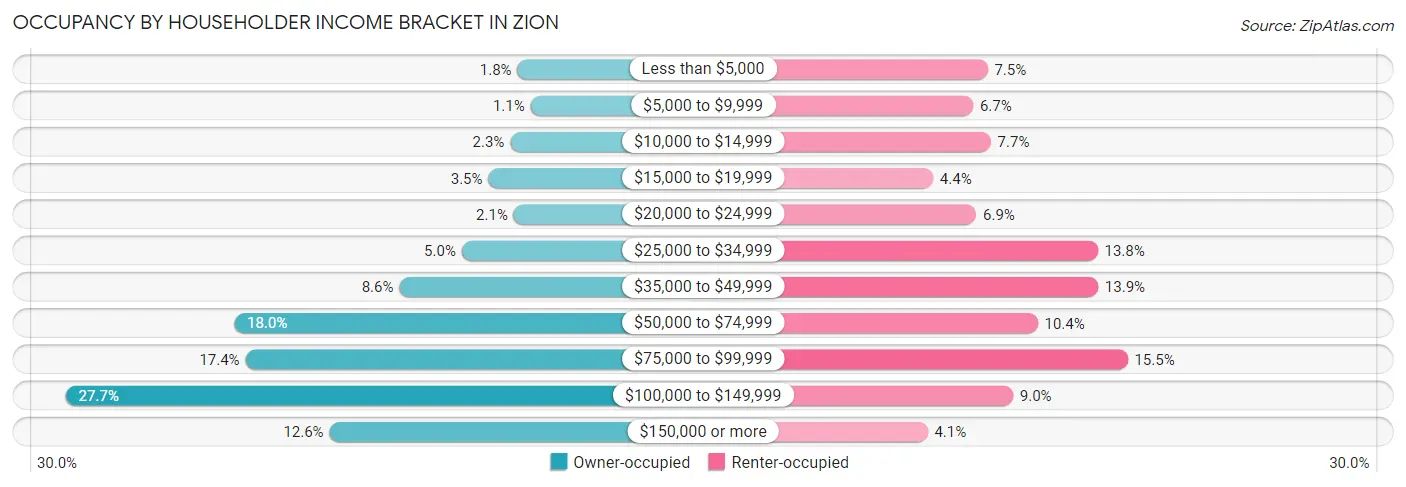
| Income Bracket | Owner-occupied | Renter-occupied |
| Less than $5,000 | 90 (1.8%) | 290 (7.5%) |
| $5,000 to $9,999 | 53 (1.1%) | 258 (6.7%) |
| $10,000 to $14,999 | 110 (2.2%) | 297 (7.7%) |
| $15,000 to $19,999 | 171 (3.5%) | 170 (4.4%) |
| $20,000 to $24,999 | 100 (2.1%) | 265 (6.9%) |
| $25,000 to $34,999 | 245 (5.0%) | 532 (13.8%) |
| $35,000 to $49,999 | 419 (8.6%) | 533 (13.9%) |
| $50,000 to $74,999 | 880 (18.0%) | 400 (10.4%) |
| $75,000 to $99,999 | 848 (17.4%) | 598 (15.5%) |
| $100,000 to $149,999 | 1,350 (27.7%) | 346 (9.0%) |
| $150,000 or more | 614 (12.6%) | 158 (4.1%) |
| Total | 4,880 (100.0%) | 3,847 (100.0%) |
Monthly Housing Cost Tiers in Zion
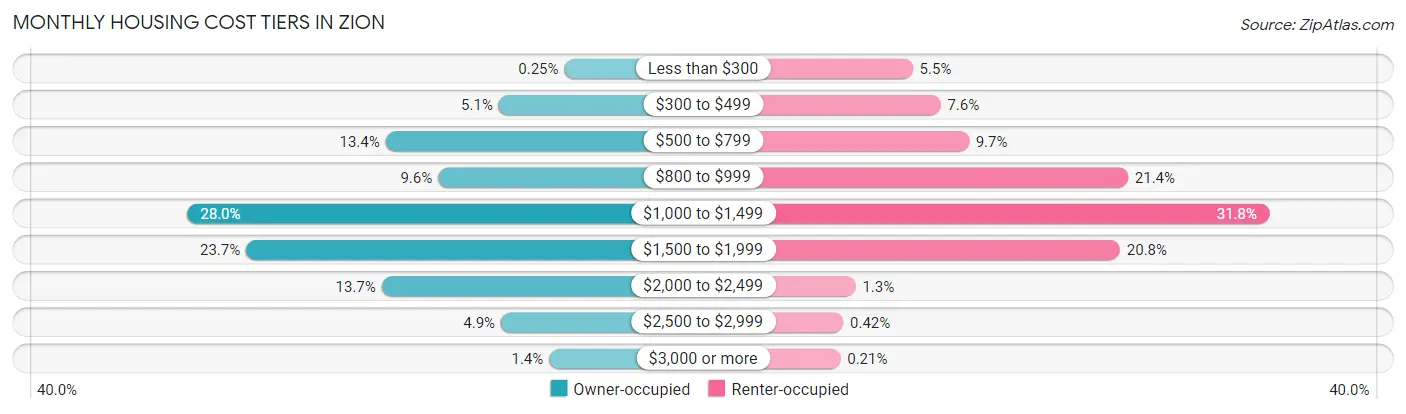
| Monthly Cost | Owner-occupied | Renter-occupied |
| Less than $300 | 12 (0.3%) | 213 (5.5%) |
| $300 to $499 | 248 (5.1%) | 292 (7.6%) |
| $500 to $799 | 655 (13.4%) | 372 (9.7%) |
| $800 to $999 | 466 (9.6%) | 823 (21.4%) |
| $1,000 to $1,499 | 1,367 (28.0%) | 1,222 (31.8%) |
| $1,500 to $1,999 | 1,156 (23.7%) | 800 (20.8%) |
| $2,000 to $2,499 | 669 (13.7%) | 51 (1.3%) |
| $2,500 to $2,999 | 240 (4.9%) | 16 (0.4%) |
| $3,000 or more | 67 (1.4%) | 8 (0.2%) |
| Total | 4,880 (100.0%) | 3,847 (100.0%) |
Physical Housing Characteristics in Zion
Housing Structures in Zion
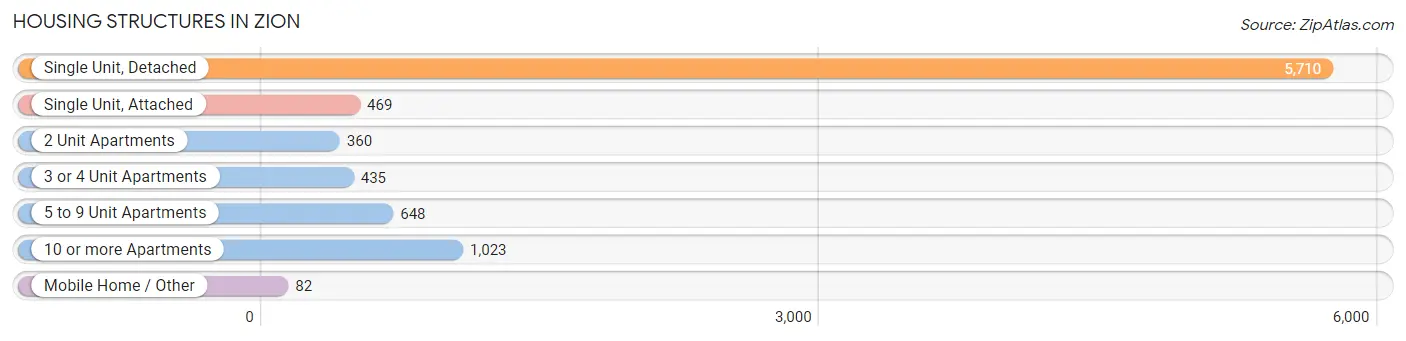
| Structure Type | # Housing Units | % Housing Units |
| Single Unit, Detached | 5,710 | 65.4% |
| Single Unit, Attached | 469 | 5.4% |
| 2 Unit Apartments | 360 | 4.1% |
| 3 or 4 Unit Apartments | 435 | 5.0% |
| 5 to 9 Unit Apartments | 648 | 7.4% |
| 10 or more Apartments | 1,023 | 11.7% |
| Mobile Home / Other | 82 | 0.9% |
| Total | 8,727 | 100.0% |
Housing Structures by Occupancy in Zion
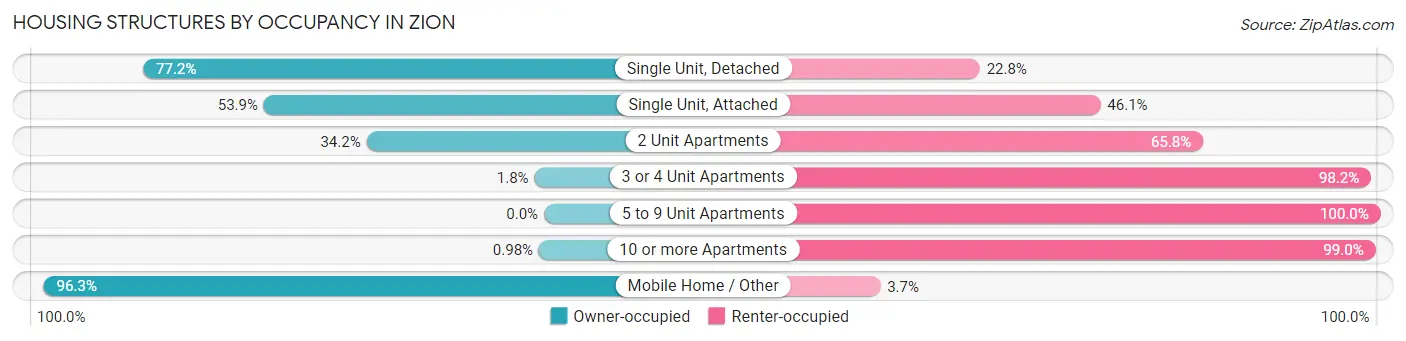
| Structure Type | Owner-occupied | Renter-occupied |
| Single Unit, Detached | 4,407 (77.2%) | 1,303 (22.8%) |
| Single Unit, Attached | 253 (53.9%) | 216 (46.1%) |
| 2 Unit Apartments | 123 (34.2%) | 237 (65.8%) |
| 3 or 4 Unit Apartments | 8 (1.8%) | 427 (98.2%) |
| 5 to 9 Unit Apartments | 0 (0.0%) | 648 (100.0%) |
| 10 or more Apartments | 10 (1.0%) | 1,013 (99.0%) |
| Mobile Home / Other | 79 (96.3%) | 3 (3.7%) |
| Total | 4,880 (55.9%) | 3,847 (44.1%) |
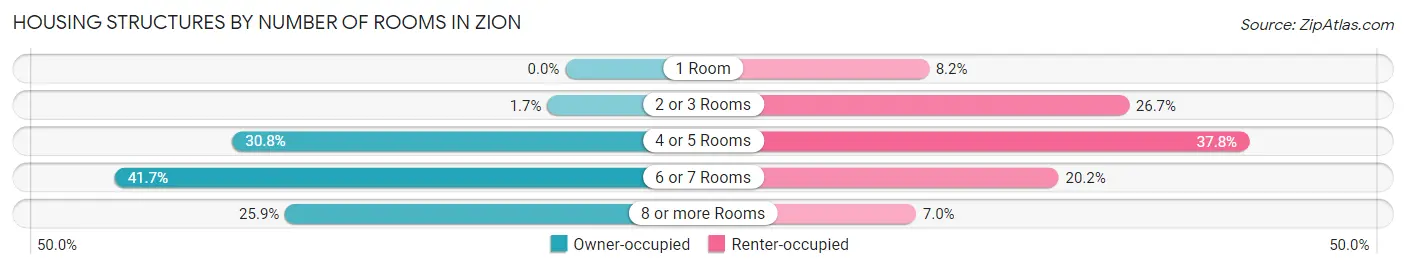
Housing Structures by Number of Rooms in Zion
| Number of Rooms | Owner-occupied | Renter-occupied |
| 1 Room | 0 (0.0%) | 316 (8.2%) |
| 2 or 3 Rooms | 81 (1.7%) | 1,028 (26.7%) |
| 4 or 5 Rooms | 1,502 (30.8%) | 1,455 (37.8%) |
| 6 or 7 Rooms | 2,033 (41.7%) | 778 (20.2%) |
| 8 or more Rooms | 1,264 (25.9%) | 270 (7.0%) |
| Total | 4,880 (100.0%) | 3,847 (100.0%) |
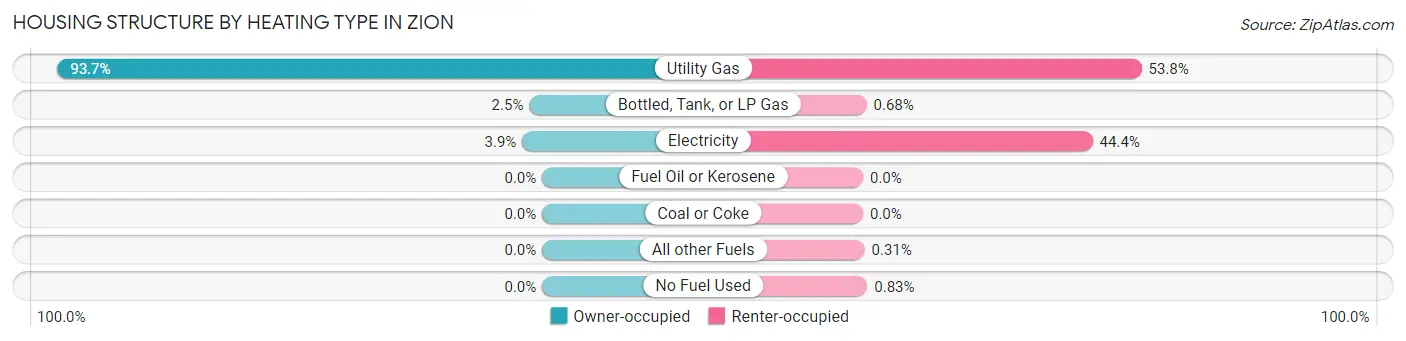
Housing Structure by Heating Type in Zion
| Heating Type | Owner-occupied | Renter-occupied |
| Utility Gas | 4,571 (93.7%) | 2,070 (53.8%) |
| Bottled, Tank, or LP Gas | 121 (2.5%) | 26 (0.7%) |
| Electricity | 188 (3.8%) | 1,707 (44.4%) |
| Fuel Oil or Kerosene | 0 (0.0%) | 0 (0.0%) |
| Coal or Coke | 0 (0.0%) | 0 (0.0%) |
| All other Fuels | 0 (0.0%) | 12 (0.3%) |
| No Fuel Used | 0 (0.0%) | 32 (0.8%) |
| Total | 4,880 (100.0%) | 3,847 (100.0%) |
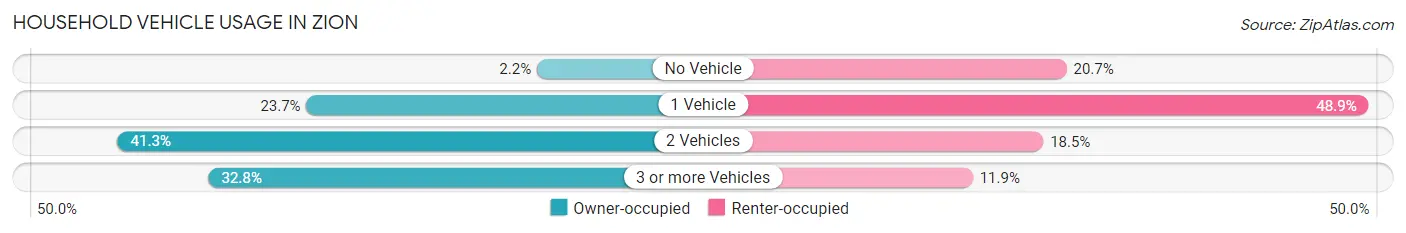
Household Vehicle Usage in Zion
| Vehicles per Household | Owner-occupied | Renter-occupied |
| No Vehicle | 106 (2.2%) | 796 (20.7%) |
| 1 Vehicle | 1,156 (23.7%) | 1,880 (48.9%) |
| 2 Vehicles | 2,016 (41.3%) | 712 (18.5%) |
| 3 or more Vehicles | 1,602 (32.8%) | 459 (11.9%) |
| Total | 4,880 (100.0%) | 3,847 (100.0%) |
Real Estate & Mortgages in Zion
Real Estate and Mortgage Overview in Zion
| Characteristic | Without Mortgage | With Mortgage |
| Housing Units | 1,720 | 3,160 |
| Median Property Value | $165,100 | $162,600 |
| Median Household Income | $63,721 | $454 |
| Monthly Housing Costs | $815 | $37 |
| Real Estate Taxes | $5,646 | $79 |
Property Value by Mortgage Status in Zion
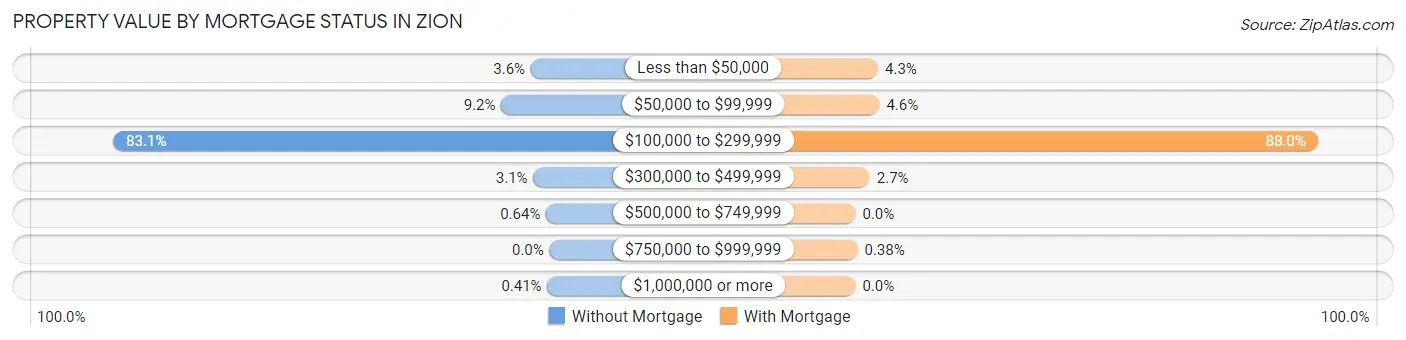
| Property Value | Without Mortgage | With Mortgage |
| Less than $50,000 | 61 (3.5%) | 136 (4.3%) |
| $50,000 to $99,999 | 158 (9.2%) | 144 (4.6%) |
| $100,000 to $299,999 | 1,430 (83.1%) | 2,782 (88.0%) |
| $300,000 to $499,999 | 53 (3.1%) | 86 (2.7%) |
| $500,000 to $749,999 | 11 (0.6%) | 0 (0.0%) |
| $750,000 to $999,999 | 0 (0.0%) | 12 (0.4%) |
| $1,000,000 or more | 7 (0.4%) | 0 (0.0%) |
| Total | 1,720 (100.0%) | 3,160 (100.0%) |
Household Income by Mortgage Status in Zion
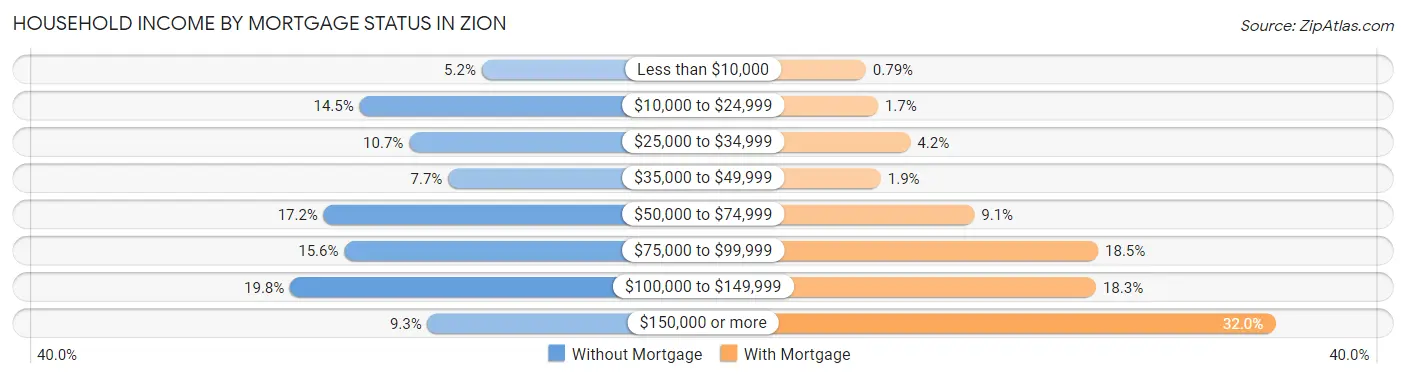
| Household Income | Without Mortgage | With Mortgage |
| Less than $10,000 | 89 (5.2%) | 25 (0.8%) |
| $10,000 to $24,999 | 249 (14.5%) | 54 (1.7%) |
| $25,000 to $34,999 | 184 (10.7%) | 132 (4.2%) |
| $35,000 to $49,999 | 133 (7.7%) | 61 (1.9%) |
| $50,000 to $74,999 | 296 (17.2%) | 286 (9.0%) |
| $75,000 to $99,999 | 269 (15.6%) | 584 (18.5%) |
| $100,000 to $149,999 | 340 (19.8%) | 579 (18.3%) |
| $150,000 or more | 160 (9.3%) | 1,010 (32.0%) |
| Total | 1,720 (100.0%) | 3,160 (100.0%) |
Property Value to Household Income Ratio in Zion
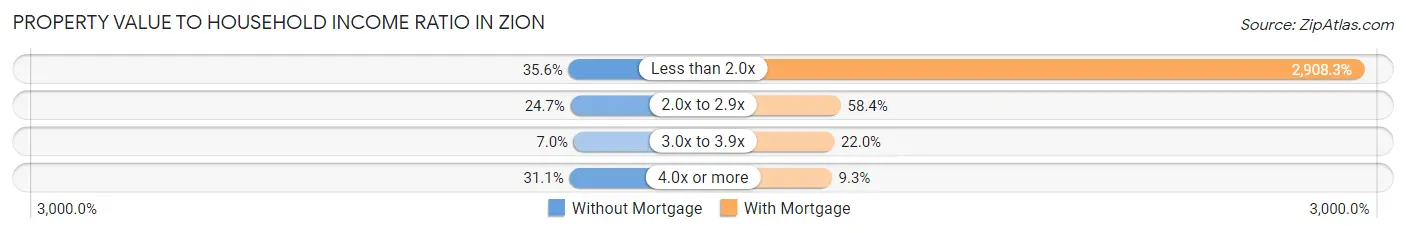
| Value-to-Income Ratio | Without Mortgage | With Mortgage |
| Less than 2.0x | 612 (35.6%) | 91,902 (2,908.3%) |
| 2.0x to 2.9x | 424 (24.6%) | 1,844 (58.4%) |
| 3.0x to 3.9x | 121 (7.0%) | 695 (22.0%) |
| 4.0x or more | 535 (31.1%) | 293 (9.3%) |
| Total | 1,720 (100.0%) | 3,160 (100.0%) |
Real Estate Taxes by Mortgage Status in Zion
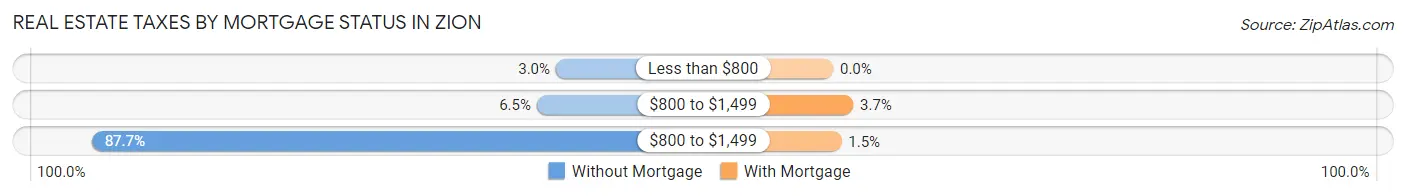
| Property Taxes | Without Mortgage | With Mortgage |
| Less than $800 | 51 (3.0%) | 0 (0.0%) |
| $800 to $1,499 | 111 (6.5%) | 116 (3.7%) |
| $800 to $1,499 | 1,509 (87.7%) | 48 (1.5%) |
| Total | 1,720 (100.0%) | 3,160 (100.0%) |
Health & Disability in Zion
Health Insurance Coverage by Age in Zion
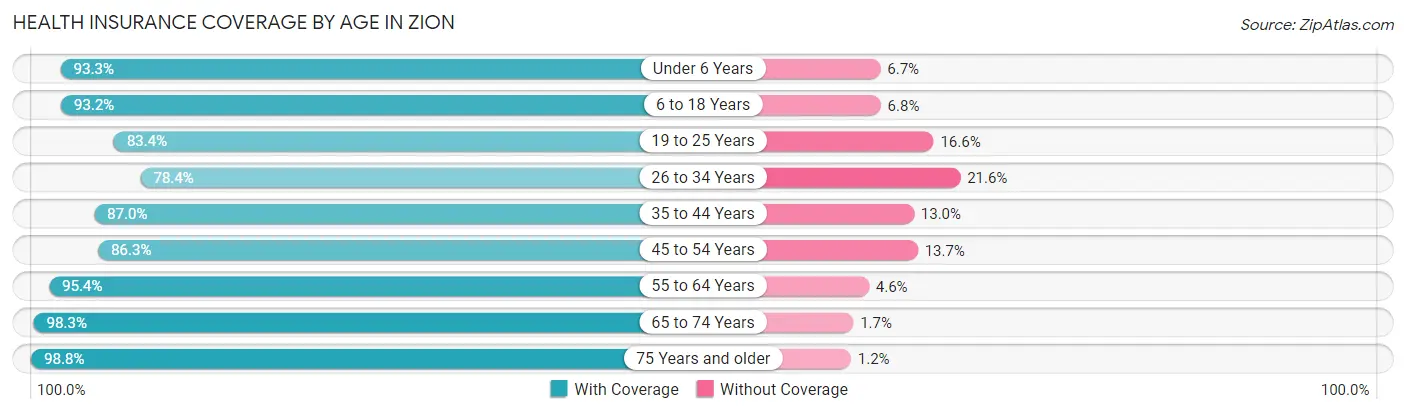
| Age Bracket | With Coverage | Without Coverage |
| Under 6 Years | 1,860 (93.3%) | 134 (6.7%) |
| 6 to 18 Years | 4,702 (93.2%) | 342 (6.8%) |
| 19 to 25 Years | 2,145 (83.4%) | 428 (16.6%) |
| 26 to 34 Years | 2,738 (78.4%) | 755 (21.6%) |
| 35 to 44 Years | 2,294 (87.0%) | 342 (13.0%) |
| 45 to 54 Years | 2,648 (86.3%) | 420 (13.7%) |
| 55 to 64 Years | 2,437 (95.4%) | 117 (4.6%) |
| 65 to 74 Years | 1,825 (98.3%) | 31 (1.7%) |
| 75 Years and older | 890 (98.8%) | 11 (1.2%) |
| Total | 21,539 (89.3%) | 2,580 (10.7%) |
Health Insurance Coverage by Citizenship Status in Zion
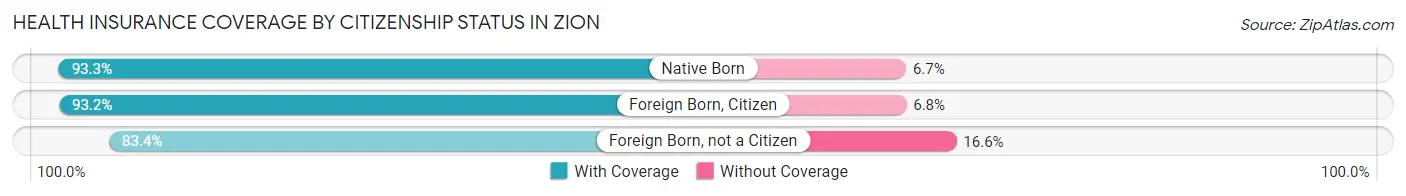
| Citizenship Status | With Coverage | Without Coverage |
| Native Born | 1,860 (93.3%) | 134 (6.7%) |
| Foreign Born, Citizen | 4,702 (93.2%) | 342 (6.8%) |
| Foreign Born, not a Citizen | 2,145 (83.4%) | 428 (16.6%) |
Health Insurance Coverage by Household Income in Zion
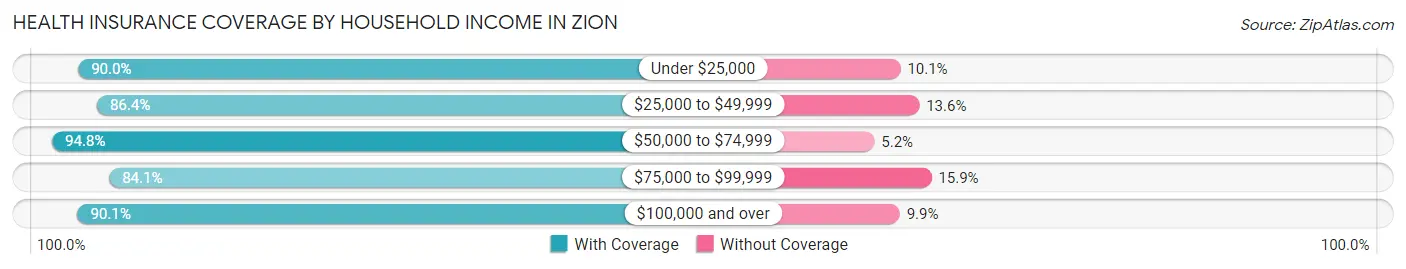
| Household Income | With Coverage | Without Coverage |
| Under $25,000 | 2,919 (89.9%) | 326 (10.1%) |
| $25,000 to $49,999 | 3,108 (86.4%) | 488 (13.6%) |
| $50,000 to $74,999 | 3,400 (94.8%) | 185 (5.2%) |
| $75,000 to $99,999 | 3,262 (84.1%) | 615 (15.9%) |
| $100,000 and over | 8,770 (90.1%) | 966 (9.9%) |
Public vs Private Health Insurance Coverage by Age in Zion
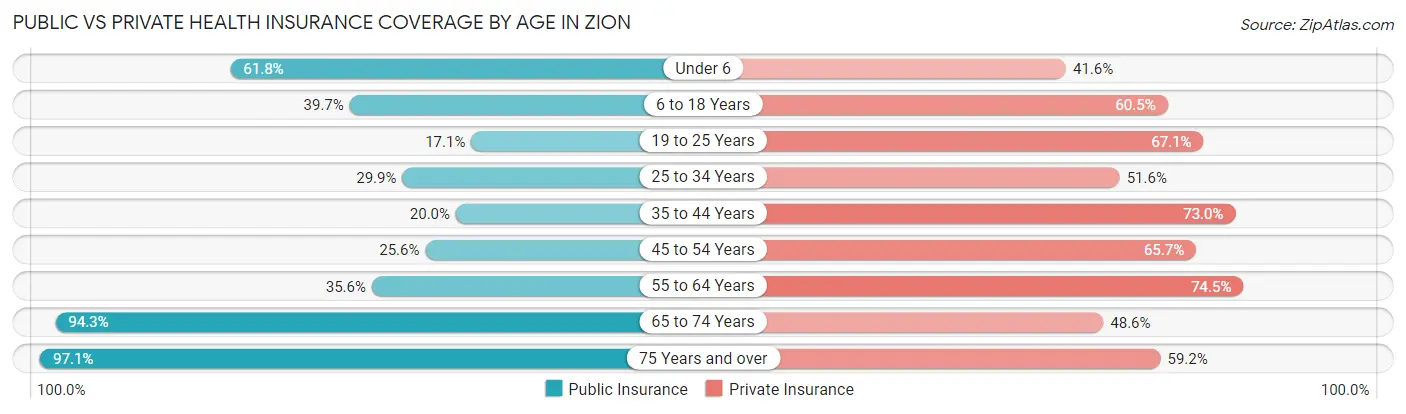
| Age Bracket | Public Insurance | Private Insurance |
| Under 6 | 1,232 (61.8%) | 830 (41.6%) |
| 6 to 18 Years | 2,001 (39.7%) | 3,049 (60.5%) |
| 19 to 25 Years | 440 (17.1%) | 1,727 (67.1%) |
| 25 to 34 Years | 1,044 (29.9%) | 1,802 (51.6%) |
| 35 to 44 Years | 526 (20.0%) | 1,925 (73.0%) |
| 45 to 54 Years | 786 (25.6%) | 2,017 (65.7%) |
| 55 to 64 Years | 908 (35.5%) | 1,903 (74.5%) |
| 65 to 74 Years | 1,750 (94.3%) | 901 (48.5%) |
| 75 Years and over | 875 (97.1%) | 533 (59.2%) |
| Total | 9,562 (39.7%) | 14,687 (60.9%) |
Disability Status by Sex by Age in Zion
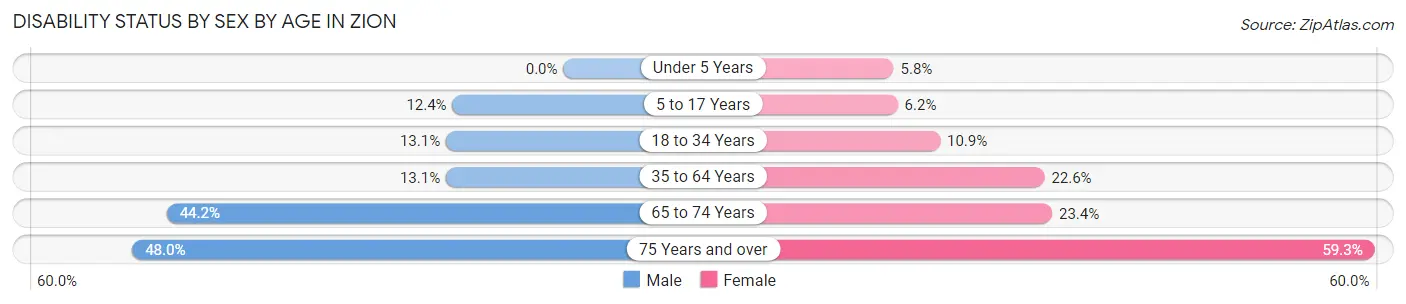
| Age Bracket | Male | Female |
| Under 5 Years | 0 (0.0%) | 49 (5.8%) |
| 5 to 17 Years | 315 (12.3%) | 156 (6.2%) |
| 18 to 34 Years | 424 (13.1%) | 345 (10.9%) |
| 35 to 64 Years | 534 (13.1%) | 942 (22.6%) |
| 65 to 74 Years | 352 (44.2%) | 248 (23.4%) |
| 75 Years and over | 193 (48.0%) | 296 (59.3%) |
Disability Class by Sex by Age in Zion
Disability Class: Hearing Difficulty
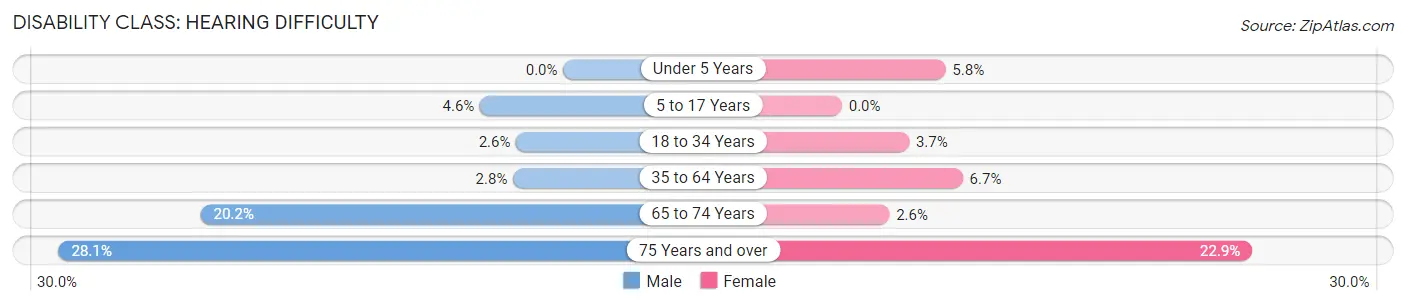
| Age Bracket | Male | Female |
| Under 5 Years | 0 (0.0%) | 49 (5.8%) |
| 5 to 17 Years | 118 (4.6%) | 0 (0.0%) |
| 18 to 34 Years | 85 (2.6%) | 118 (3.7%) |
| 35 to 64 Years | 114 (2.8%) | 281 (6.7%) |
| 65 to 74 Years | 161 (20.2%) | 28 (2.6%) |
| 75 Years and over | 113 (28.1%) | 114 (22.9%) |
Disability Class: Vision Difficulty
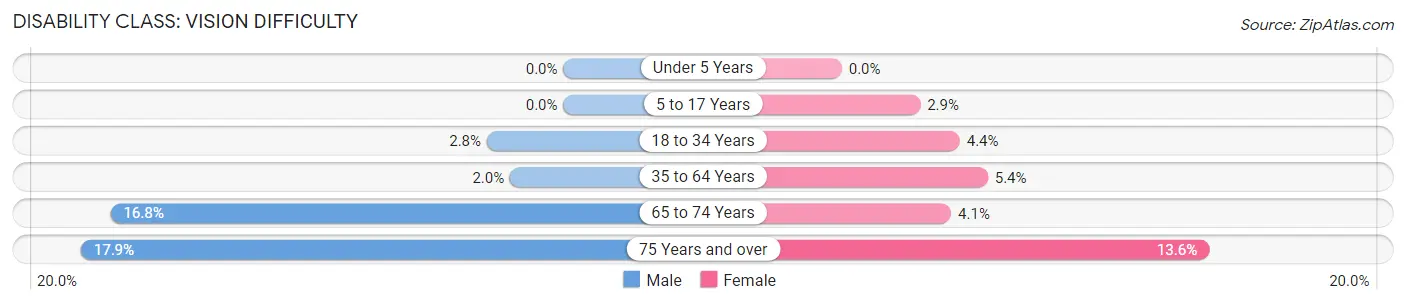
| Age Bracket | Male | Female |
| Under 5 Years | 0 (0.0%) | 0 (0.0%) |
| 5 to 17 Years | 0 (0.0%) | 73 (2.9%) |
| 18 to 34 Years | 92 (2.8%) | 138 (4.4%) |
| 35 to 64 Years | 81 (2.0%) | 226 (5.4%) |
| 65 to 74 Years | 134 (16.8%) | 43 (4.1%) |
| 75 Years and over | 72 (17.9%) | 68 (13.6%) |
Disability Class: Cognitive Difficulty
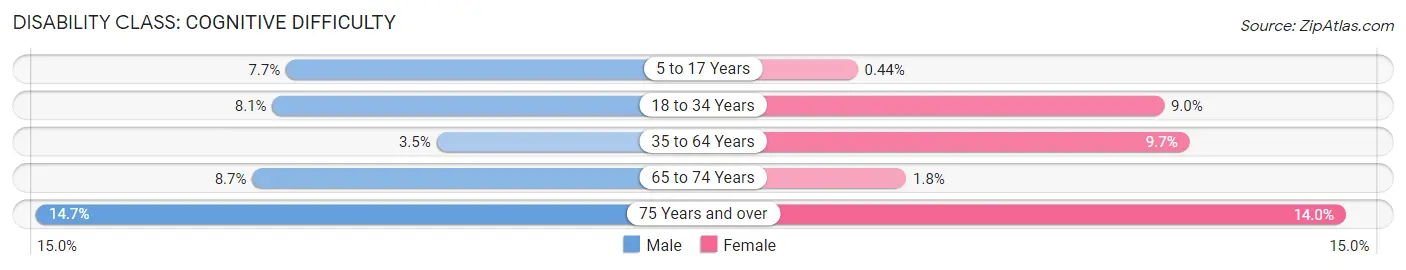
| Age Bracket | Male | Female |
| 5 to 17 Years | 197 (7.7%) | 11 (0.4%) |
| 18 to 34 Years | 263 (8.1%) | 283 (9.0%) |
| 35 to 64 Years | 144 (3.5%) | 404 (9.7%) |
| 65 to 74 Years | 69 (8.7%) | 19 (1.8%) |
| 75 Years and over | 59 (14.7%) | 70 (14.0%) |
Disability Class: Ambulatory Difficulty
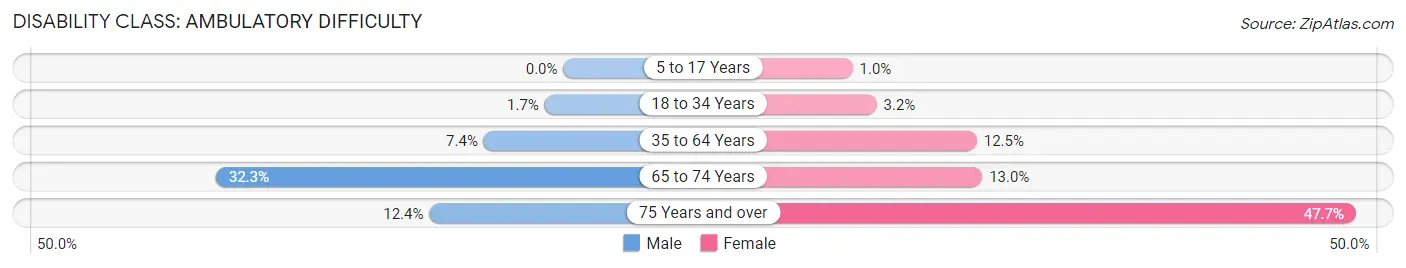
| Age Bracket | Male | Female |
| 5 to 17 Years | 0 (0.0%) | 25 (1.0%) |
| 18 to 34 Years | 56 (1.7%) | 102 (3.2%) |
| 35 to 64 Years | 302 (7.4%) | 523 (12.5%) |
| 65 to 74 Years | 257 (32.3%) | 138 (13.0%) |
| 75 Years and over | 50 (12.4%) | 238 (47.7%) |
Disability Class: Self-Care Difficulty
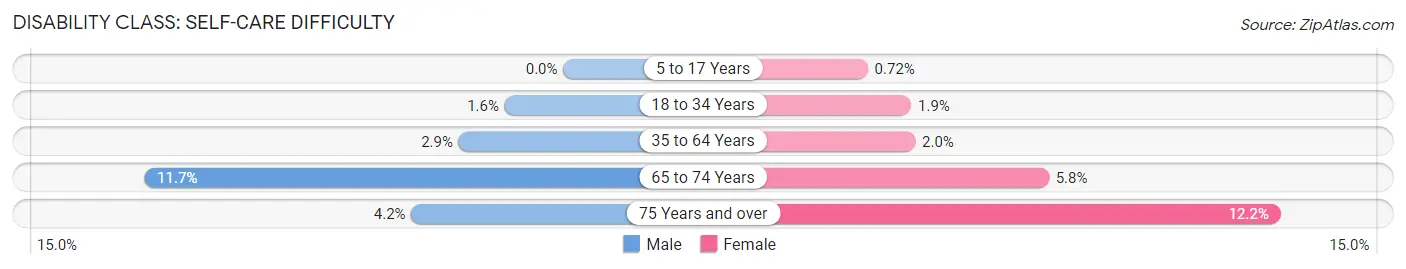
| Age Bracket | Male | Female |
| 5 to 17 Years | 0 (0.0%) | 18 (0.7%) |
| 18 to 34 Years | 53 (1.6%) | 61 (1.9%) |
| 35 to 64 Years | 119 (2.9%) | 85 (2.0%) |
| 65 to 74 Years | 93 (11.7%) | 61 (5.8%) |
| 75 Years and over | 17 (4.2%) | 61 (12.2%) |
Technology Access in Zion
Computing Device Access in Zion
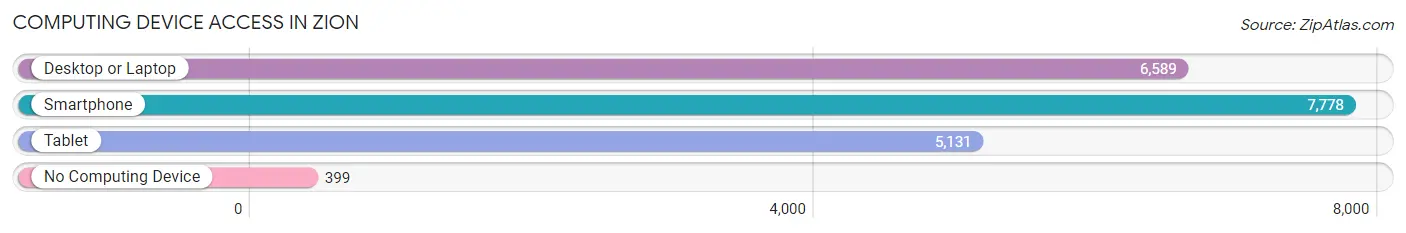
| Device Type | # Households | % Households |
| Desktop or Laptop | 6,589 | 75.5% |
| Smartphone | 7,778 | 89.1% |
| Tablet | 5,131 | 58.8% |
| No Computing Device | 399 | 4.6% |
| Total | 8,727 | 100.0% |
Internet Access in Zion
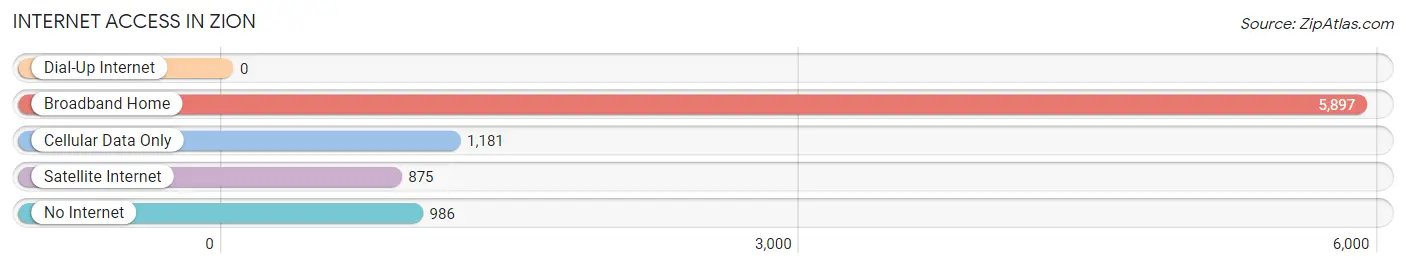
| Internet Type | # Households | % Households |
| Dial-Up Internet | 0 | 0.0% |
| Broadband Home | 5,897 | 67.6% |
| Cellular Data Only | 1,181 | 13.5% |
| Satellite Internet | 875 | 10.0% |
| No Internet | 986 | 11.3% |
| Total | 8,727 | 100.0% |
Zion Summary
Zion, Illinois is a city located in Lake County, Illinois, United States. It is a suburb of Chicago, located approximately 40 miles north of the city. The population of Zion was 24,413 at the 2010 census, making it the largest city in Lake County.
History
The area that is now Zion was first settled in the early 19th century by a group of settlers from New England. The settlers were attracted to the area by its natural beauty and its proximity to Lake Michigan. The town was originally named Shiloh, after the Biblical city of the same name. In 1901, the town was renamed Zion, after the Biblical city of Zion.
The city of Zion was officially incorporated in 1901. The city was initially a farming community, but it soon developed into a manufacturing center. The city was home to several factories, including the Zion Electric Company, which produced electrical equipment, and the Zion Car Company, which produced automobiles.
In the 1950s, the city began to experience a population boom, as many people moved to the city from Chicago. This population growth continued into the 1960s and 1970s, and the city's population reached its peak in 1980, when it had a population of over 30,000.
Geography
Zion is located in northeastern Illinois, approximately 40 miles north of Chicago. The city is situated on the shore of Lake Michigan, and is bordered by the cities of Waukegan to the north, North Chicago to the east, and Beach Park to the south. The city covers an area of 8.3 square miles, and has a population density of 2,945 people per square mile.
Economy
The economy of Zion is largely based on manufacturing and retail. The city is home to several factories, including the Zion Electric Company, which produces electrical equipment, and the Zion Car Company, which produces automobiles. The city is also home to several retail stores, including a Walmart Supercenter, a Target, and a Kohl's.
The city is also home to several corporate headquarters, including the headquarters of the American Family Insurance Group, the American Red Cross, and the American Cancer Society.
Demographics
As of the 2010 census, the population of Zion was 24,413. The racial makeup of the city was 79.2% White, 11.2% African American, 0.4% Native American, 1.7% Asian, 0.1% Pacific Islander, 4.7% from other races, and 2.7% from two or more races. Hispanic or Latino of any race were 11.3% of the population.
The median household income in Zion was $50,945, and the median family income was $60,945. The per capita income in Zion was $23,945. About 8.3% of families and 10.2% of the population were below the poverty line, including 14.2% of those under age 18 and 6.2% of those age 65 or over.
Common Questions
What is Per Capita Income in Zion?
Per Capita income in Zion is $31,191.
What is the Median Family Income in Zion?
Median Family Income in Zion is $80,771.
What is the Median Household income in Zion?
Median Household Income in Zion is $65,018.
What is Income or Wage Gap in Zion?
Income or Wage Gap in Zion is 15.9%.
Women in Zion earn 84.1 cents for every dollar earned by a man.
What is Family Income Deficit in Zion?
Family Income Deficit in Zion is $10,862.
Families that are below poverty line in Zion earn $10,862 less on average than the poverty threshold level.
What is Inequality or Gini Index in Zion?
Inequality or Gini Index in Zion is 0.50.
What is the Total Population of Zion?
Total Population of Zion is 24,570.
What is the Total Male Population of Zion?
Total Male Population of Zion is 12,146.
What is the Total Female Population of Zion?
Total Female Population of Zion is 12,424.
What is the Ratio of Males per 100 Females in Zion?
There are 97.76 Males per 100 Females in Zion.
What is the Ratio of Females per 100 Males in Zion?
There are 102.29 Females per 100 Males in Zion.
What is the Median Population Age in Zion?
Median Population Age in Zion is 32.3 Years.
What is the Average Family Size in Zion
Average Family Size in Zion is 3.6 People.
What is the Average Household Size in Zion
Average Household Size in Zion is 2.8 People.
How Large is the Labor Force in Zion?
There are 12,848 People in the Labor Forcein in Zion.
What is the Percentage of People in the Labor Force in Zion?
69.3% of People are in the Labor Force in Zion.
What is the Unemployment Rate in Zion?
Unemployment Rate in Zion is 6.4%.