Glenn Dale, MD Map & Demographics
Glenn Dale Map
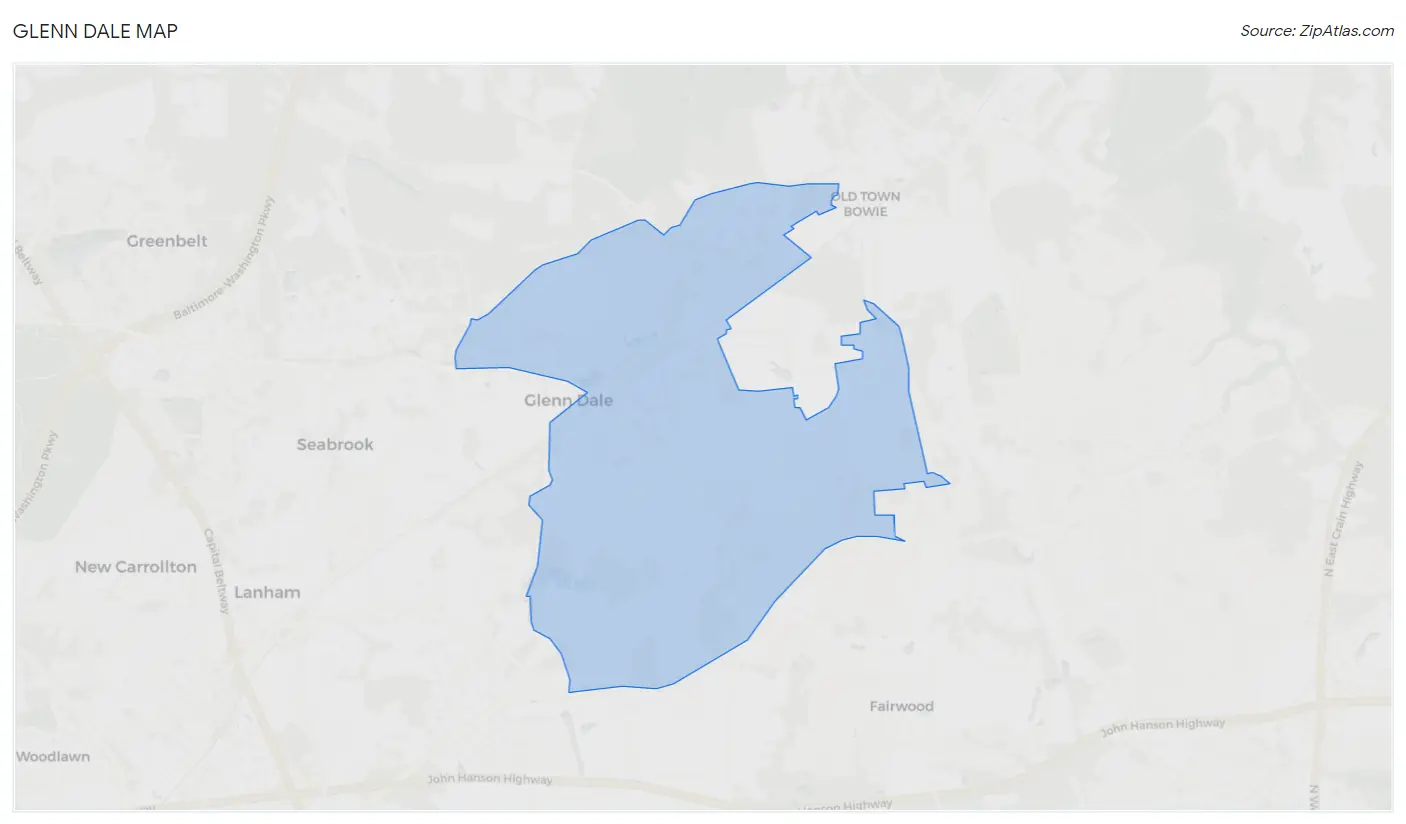
Glenn Dale Overview
$50,052
PER CAPITA INCOME
$139,286
AVG FAMILY INCOME
$131,012
AVG HOUSEHOLD INCOME
17.3%
WAGE / INCOME GAP [ % ]
82.7¢/ $1
WAGE / INCOME GAP [ $ ]
0.35
INEQUALITY / GINI INDEX
15,244
TOTAL POPULATION
7,697
MALE POPULATION
7,547
FEMALE POPULATION
101.99
MALES / 100 FEMALES
98.05
FEMALES / 100 MALES
39.0
MEDIAN AGE
3.6
AVG FAMILY SIZE
3.2
AVG HOUSEHOLD SIZE
8,426
LABOR FORCE [ PEOPLE ]
71.3%
PERCENT IN LABOR FORCE
7.2%
UNEMPLOYMENT RATE
Glenn Dale Zip Codes
Income in Glenn Dale
Income Overview in Glenn Dale
Per Capita Income in Glenn Dale is $50,052, while median incomes of families and households are $139,286 and $131,012 respectively.
| Characteristic | Number | Measure |
| Per Capita Income | 15,244 | $50,052 |
| Median Family Income | 3,794 | $139,286 |
| Mean Family Income | 3,794 | $169,412 |
| Median Household Income | 4,672 | $131,012 |
| Mean Household Income | 4,672 | $160,098 |
| Income Deficit | 3,794 | $0 |
| Wage / Income Gap (%) | 15,244 | 17.27% |
| Wage / Income Gap ($) | 15,244 | 82.73¢ per $1 |
| Gini / Inequality Index | 15,244 | 0.35 |
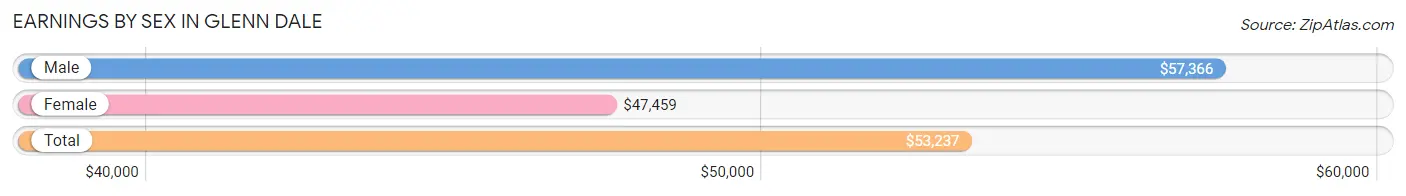
Earnings by Sex in Glenn Dale
Average Earnings in Glenn Dale are $53,237, $57,366 for men and $47,459 for women, a difference of 17.3%.
| Sex | Number | Average Earnings |
| Male | 4,359 (49.9%) | $57,366 |
| Female | 4,381 (50.1%) | $47,459 |
| Total | 8,740 (100.0%) | $53,237 |
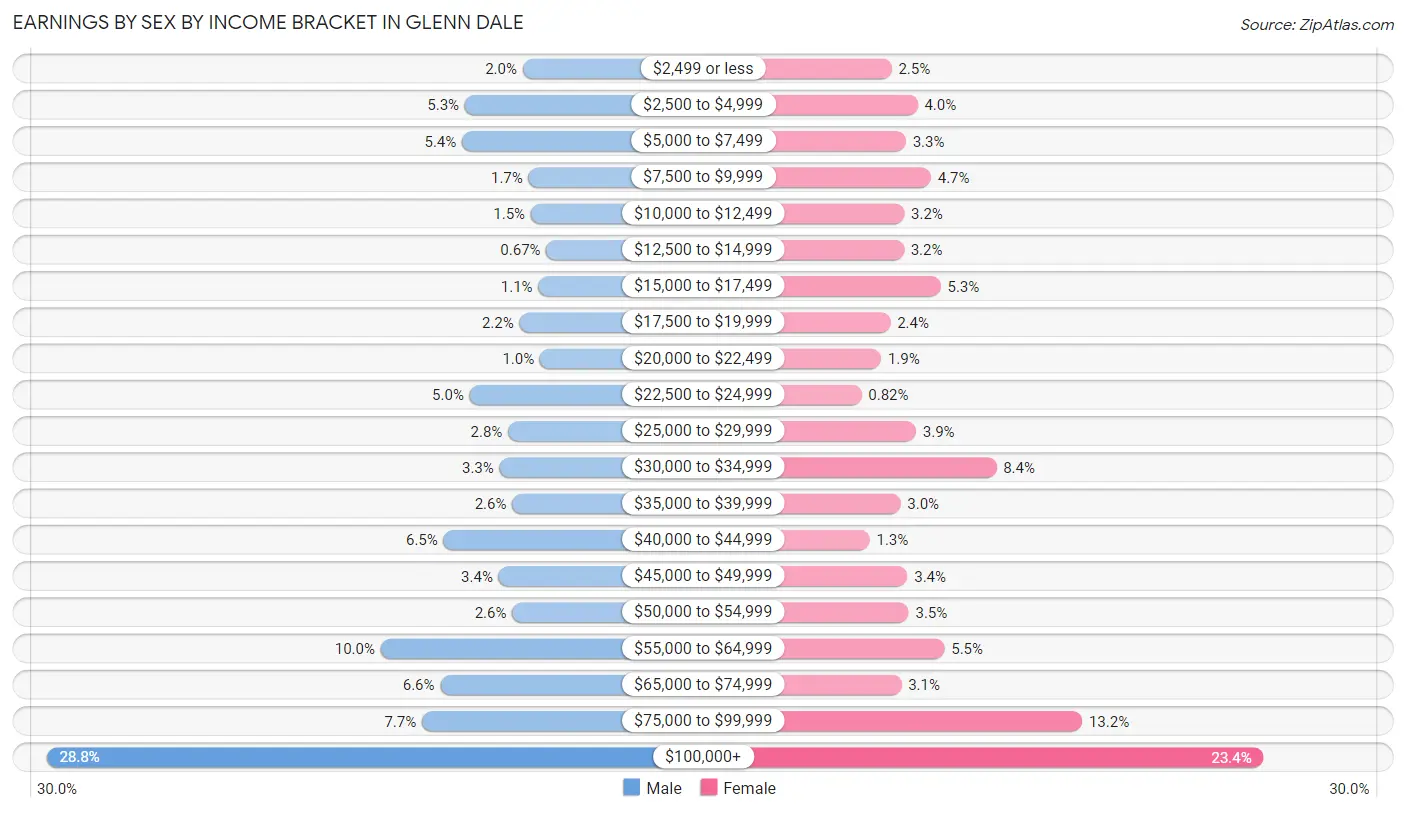
Earnings by Sex by Income Bracket in Glenn Dale
The most common earnings brackets in Glenn Dale are $100,000+ for men (1,254 | 28.8%) and $100,000+ for women (1,026 | 23.4%).
| Income | Male | Female |
| $2,499 or less | 87 (2.0%) | 110 (2.5%) |
| $2,500 to $4,999 | 229 (5.2%) | 174 (4.0%) |
| $5,000 to $7,499 | 236 (5.4%) | 145 (3.3%) |
| $7,500 to $9,999 | 73 (1.7%) | 207 (4.7%) |
| $10,000 to $12,499 | 67 (1.5%) | 141 (3.2%) |
| $12,500 to $14,999 | 29 (0.7%) | 140 (3.2%) |
| $15,000 to $17,499 | 49 (1.1%) | 231 (5.3%) |
| $17,500 to $19,999 | 95 (2.2%) | 107 (2.4%) |
| $20,000 to $22,499 | 45 (1.0%) | 84 (1.9%) |
| $22,500 to $24,999 | 217 (5.0%) | 36 (0.8%) |
| $25,000 to $29,999 | 123 (2.8%) | 170 (3.9%) |
| $30,000 to $34,999 | 144 (3.3%) | 368 (8.4%) |
| $35,000 to $39,999 | 113 (2.6%) | 132 (3.0%) |
| $40,000 to $44,999 | 281 (6.5%) | 56 (1.3%) |
| $45,000 to $49,999 | 146 (3.4%) | 149 (3.4%) |
| $50,000 to $54,999 | 113 (2.6%) | 152 (3.5%) |
| $55,000 to $64,999 | 435 (10.0%) | 240 (5.5%) |
| $65,000 to $74,999 | 289 (6.6%) | 134 (3.1%) |
| $75,000 to $99,999 | 334 (7.7%) | 579 (13.2%) |
| $100,000+ | 1,254 (28.8%) | 1,026 (23.4%) |
| Total | 4,359 (100.0%) | 4,381 (100.0%) |
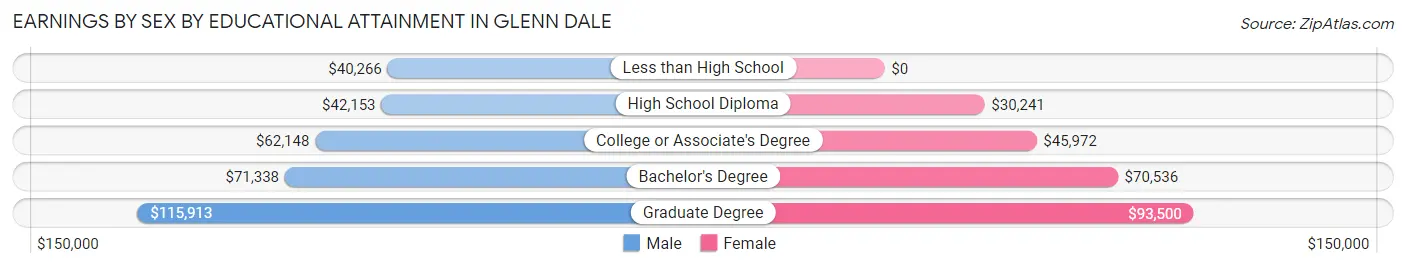
Earnings by Sex by Educational Attainment in Glenn Dale
Average earnings in Glenn Dale are $64,527 for men and $52,732 for women, a difference of 18.3%. Men with an educational attainment of graduate degree enjoy the highest average annual earnings of $115,913, while those with less than high school education earn the least with $40,266. Women with an educational attainment of graduate degree earn the most with the average annual earnings of $93,500, while those with high school diploma education have the smallest earnings of $30,241.
| Educational Attainment | Male Income | Female Income |
| Less than High School | $40,266 | $0 |
| High School Diploma | $42,153 | $30,241 |
| College or Associate's Degree | $62,148 | $45,972 |
| Bachelor's Degree | $71,338 | $70,536 |
| Graduate Degree | $115,913 | $93,500 |
| Total | $64,527 | $52,732 |
Family Income in Glenn Dale
Family Income Brackets in Glenn Dale
According to the Glenn Dale family income data, there are 1,313 families falling into the $200,000+ income range, which is the most common income bracket and makes up 34.6% of all families. Conversely, the $15,000 to $24,999 income bracket is the least frequent group with only 8 families (0.2%) belonging to this category.
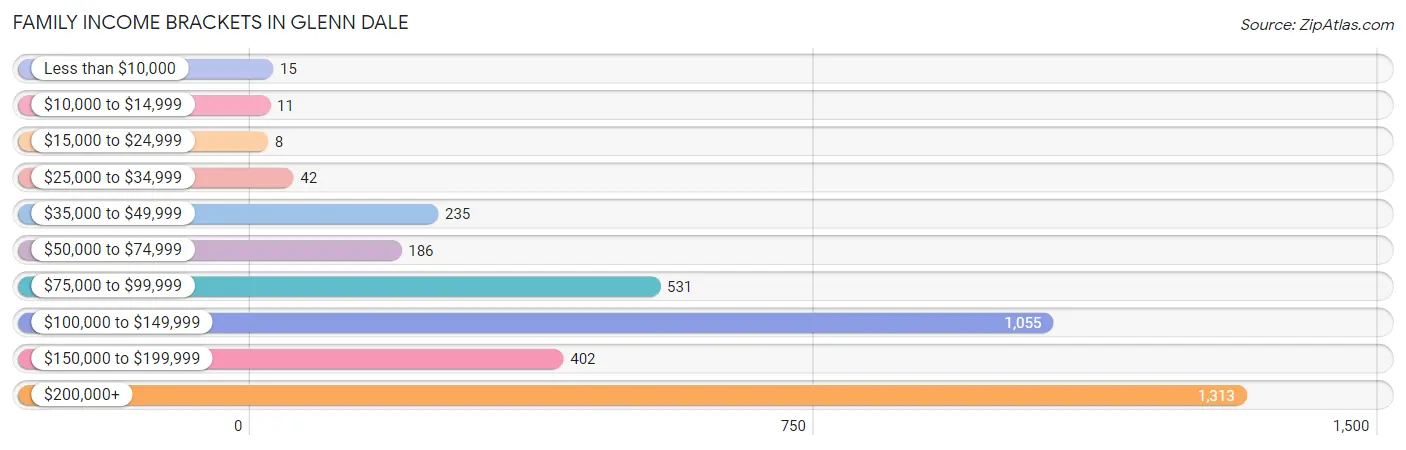
| Income Bracket | # Families | % Families |
| Less than $10,000 | 15 | 0.4% |
| $10,000 to $14,999 | 11 | 0.3% |
| $15,000 to $24,999 | 8 | 0.2% |
| $25,000 to $34,999 | 42 | 1.1% |
| $35,000 to $49,999 | 235 | 6.2% |
| $50,000 to $74,999 | 186 | 4.9% |
| $75,000 to $99,999 | 531 | 14.0% |
| $100,000 to $149,999 | 1,055 | 27.8% |
| $150,000 to $199,999 | 402 | 10.6% |
| $200,000+ | 1,313 | 34.6% |
Family Income by Famaliy Size in Glenn Dale
5-person families (462 | 12.2%) account for the highest median family income in Glenn Dale with $185,750 per family, while 2-person families (1,405 | 37.0%) have the highest median income of $63,934 per family member.
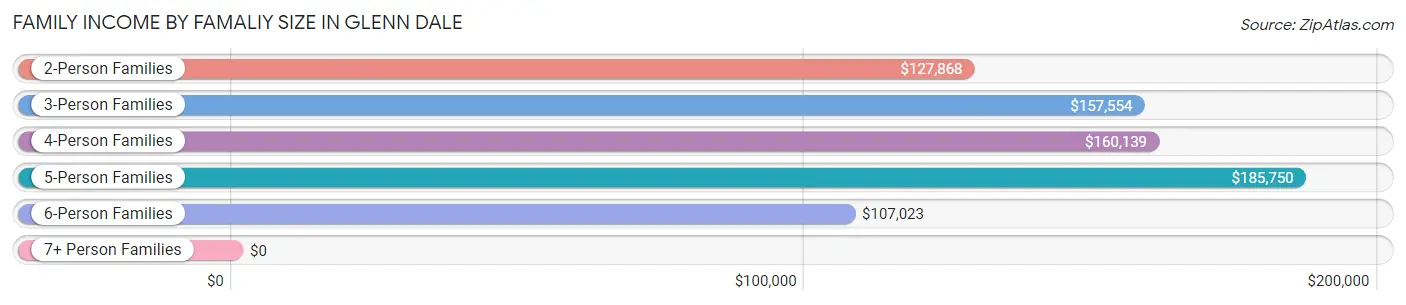
| Income Bracket | # Families | Median Income |
| 2-Person Families | 1,405 (37.0%) | $127,868 |
| 3-Person Families | 837 (22.1%) | $157,554 |
| 4-Person Families | 773 (20.4%) | $160,139 |
| 5-Person Families | 462 (12.2%) | $185,750 |
| 6-Person Families | 149 (3.9%) | $107,023 |
| 7+ Person Families | 168 (4.4%) | $0 |
| Total | 3,794 (100.0%) | $139,286 |
Family Income by Number of Earners in Glenn Dale
The median family income in Glenn Dale is $139,286, with families comprising 3+ earners (890) having the highest median family income of $223,846, while families with 1 earner (963) have the lowest median family income of $118,693, accounting for 23.5% and 25.4% of families, respectively.
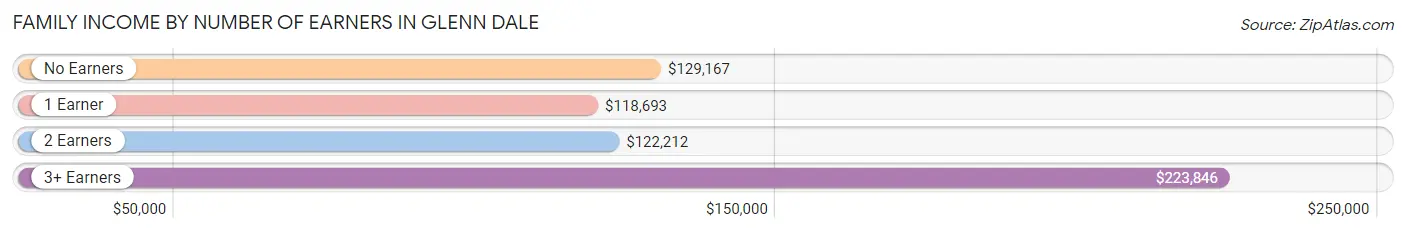
| Number of Earners | # Families | Median Income |
| No Earners | 242 (6.4%) | $129,167 |
| 1 Earner | 963 (25.4%) | $118,693 |
| 2 Earners | 1,699 (44.8%) | $122,212 |
| 3+ Earners | 890 (23.5%) | $223,846 |
| Total | 3,794 (100.0%) | $139,286 |
Household Income in Glenn Dale
Household Income Brackets in Glenn Dale
With 1,434 households falling in the category, the $200,000+ income range is the most frequent in Glenn Dale, accounting for 30.7% of all households. In contrast, only 9 households (0.2%) fall into the $10,000 to $14,999 income bracket, making it the least populous group.
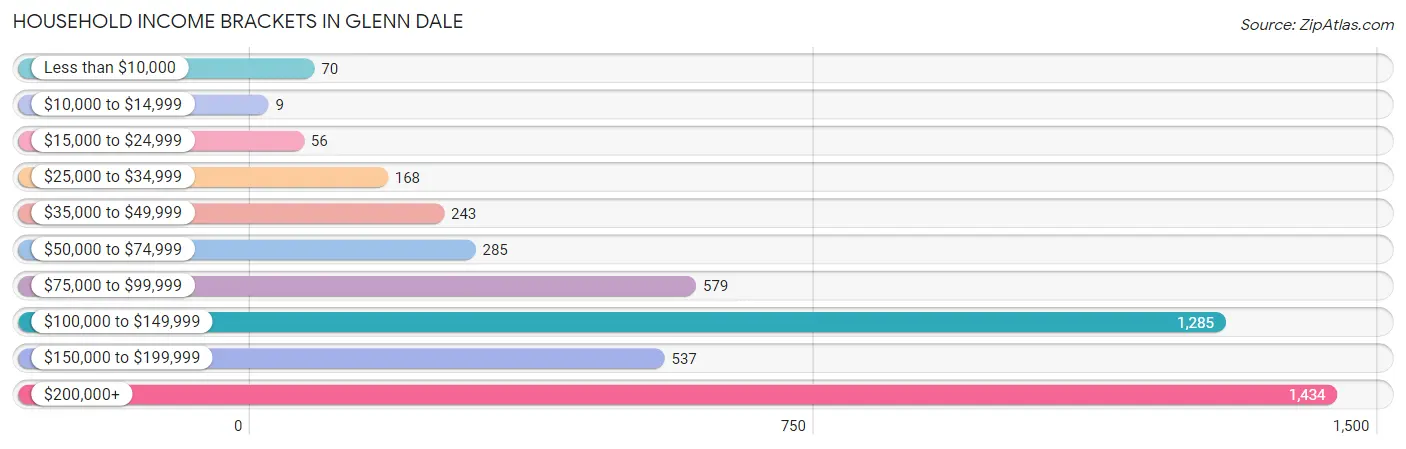
| Income Bracket | # Households | % Households |
| Less than $10,000 | 70 | 1.5% |
| $10,000 to $14,999 | 9 | 0.2% |
| $15,000 to $24,999 | 56 | 1.2% |
| $25,000 to $34,999 | 168 | 3.6% |
| $35,000 to $49,999 | 243 | 5.2% |
| $50,000 to $74,999 | 285 | 6.1% |
| $75,000 to $99,999 | 579 | 12.4% |
| $100,000 to $149,999 | 1,285 | 27.5% |
| $150,000 to $199,999 | 537 | 11.5% |
| $200,000+ | 1,434 | 30.7% |
Household Income by Householder Age in Glenn Dale
The median household income in Glenn Dale is $131,012, with the highest median household income of $144,947 found in the 45 to 64 years age bracket for the primary householder. A total of 2,102 households (45.0%) fall into this category. Meanwhile, the 15 to 24 years age bracket for the primary householder has the lowest median household income of $0, with 52 households (1.1%) in this group.
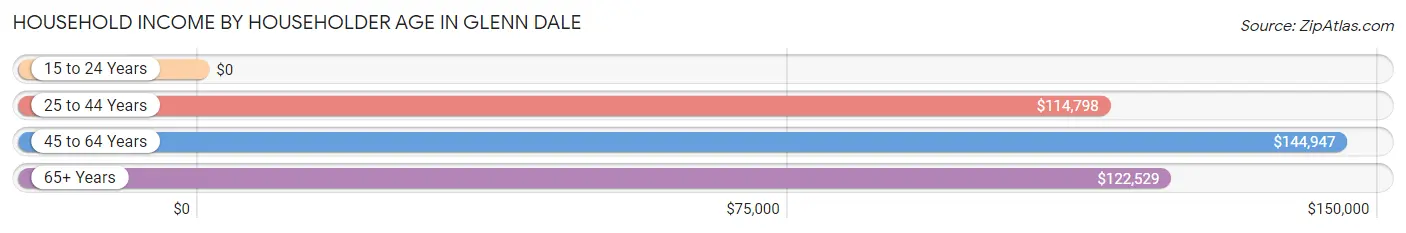
| Income Bracket | # Households | Median Income |
| 15 to 24 Years | 52 (1.1%) | $0 |
| 25 to 44 Years | 1,159 (24.8%) | $114,798 |
| 45 to 64 Years | 2,102 (45.0%) | $144,947 |
| 65+ Years | 1,359 (29.1%) | $122,529 |
| Total | 4,672 (100.0%) | $131,012 |
Poverty in Glenn Dale
Income Below Poverty by Sex and Age in Glenn Dale
With 1.1% poverty level for males and 4.7% for females among the residents of Glenn Dale, 75 year old and over males and 16 and 17 year old females are the most vulnerable to poverty, with 24 males (7.3%) and 55 females (43.0%) in their respective age groups living below the poverty level.
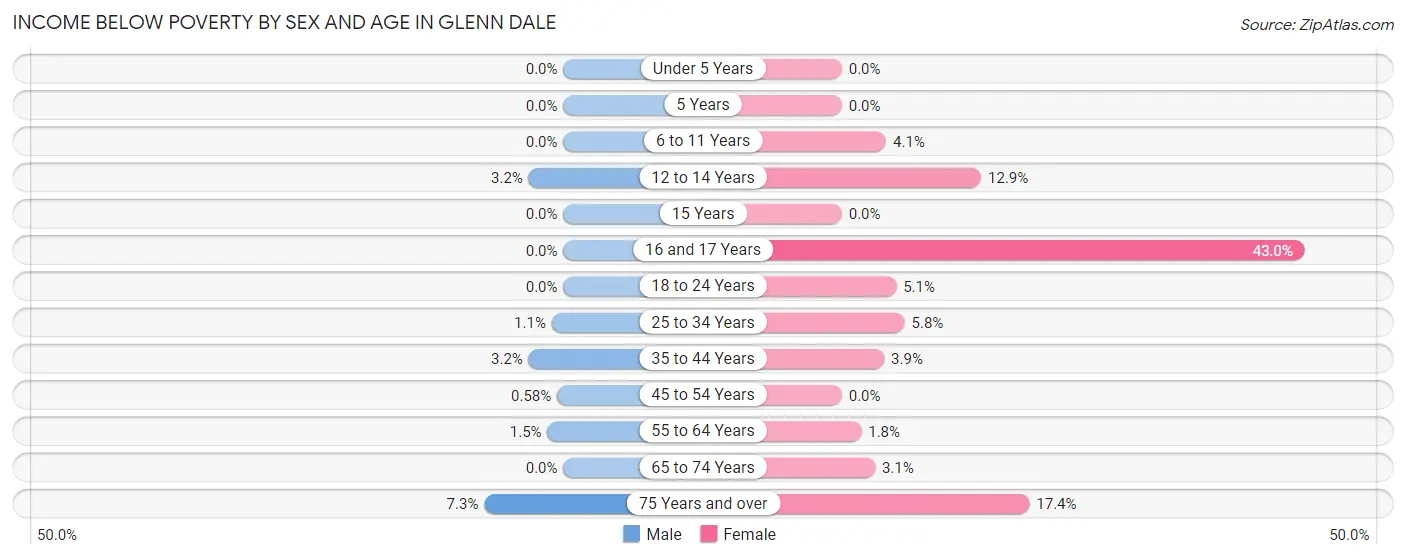
| Age Bracket | Male | Female |
| Under 5 Years | 0 (0.0%) | 0 (0.0%) |
| 5 Years | 0 (0.0%) | 0 (0.0%) |
| 6 to 11 Years | 0 (0.0%) | 25 (4.1%) |
| 12 to 14 Years | 13 (3.2%) | 15 (12.9%) |
| 15 Years | 0 (0.0%) | 0 (0.0%) |
| 16 and 17 Years | 0 (0.0%) | 55 (43.0%) |
| 18 to 24 Years | 0 (0.0%) | 25 (5.1%) |
| 25 to 34 Years | 9 (1.1%) | 58 (5.8%) |
| 35 to 44 Years | 23 (3.2%) | 37 (3.9%) |
| 45 to 54 Years | 6 (0.6%) | 0 (0.0%) |
| 55 to 64 Years | 13 (1.5%) | 20 (1.8%) |
| 65 to 74 Years | 0 (0.0%) | 26 (3.1%) |
| 75 Years and over | 24 (7.3%) | 94 (17.4%) |
| Total | 88 (1.1%) | 355 (4.7%) |
Income Above Poverty by Sex and Age in Glenn Dale
According to the poverty statistics in Glenn Dale, males aged under 5 years and females aged under 5 years are the age groups that are most secure financially, with 100.0% of males and 100.0% of females in these age groups living above the poverty line.
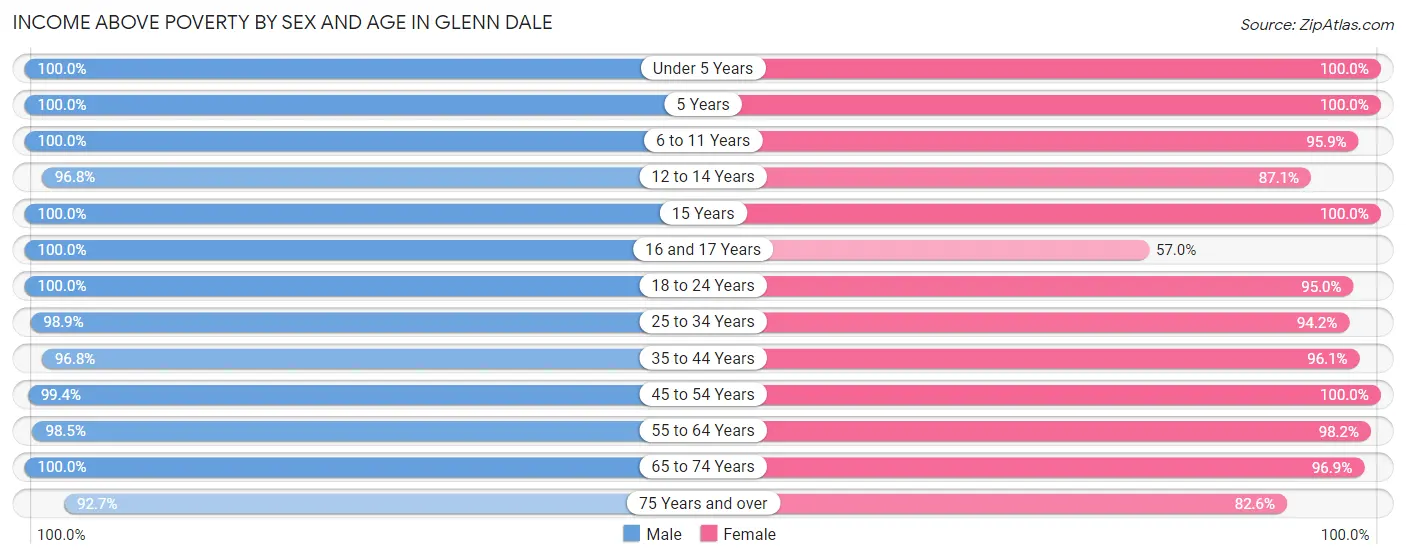
| Age Bracket | Male | Female |
| Under 5 Years | 473 (100.0%) | 558 (100.0%) |
| 5 Years | 54 (100.0%) | 30 (100.0%) |
| 6 to 11 Years | 863 (100.0%) | 583 (95.9%) |
| 12 to 14 Years | 391 (96.8%) | 101 (87.1%) |
| 15 Years | 149 (100.0%) | 131 (100.0%) |
| 16 and 17 Years | 244 (100.0%) | 73 (57.0%) |
| 18 to 24 Years | 807 (100.0%) | 470 (95.0%) |
| 25 to 34 Years | 828 (98.9%) | 937 (94.2%) |
| 35 to 44 Years | 691 (96.8%) | 905 (96.1%) |
| 45 to 54 Years | 1,028 (99.4%) | 1,053 (100.0%) |
| 55 to 64 Years | 864 (98.5%) | 1,082 (98.2%) |
| 65 to 74 Years | 864 (100.0%) | 817 (96.9%) |
| 75 Years and over | 303 (92.7%) | 446 (82.6%) |
| Total | 7,559 (98.9%) | 7,186 (95.3%) |
Income Below Poverty Among Married-Couple Families in Glenn Dale
The poverty statistics for married-couple families in Glenn Dale show that 1.0% or 30 of the total 2,994 families live below the poverty line. Families with 3 or 4 children have the highest poverty rate of 3.9%, comprising of 13 families. On the other hand, families with 1 or 2 children have the lowest poverty rate of 0.0%, which includes 0 families.
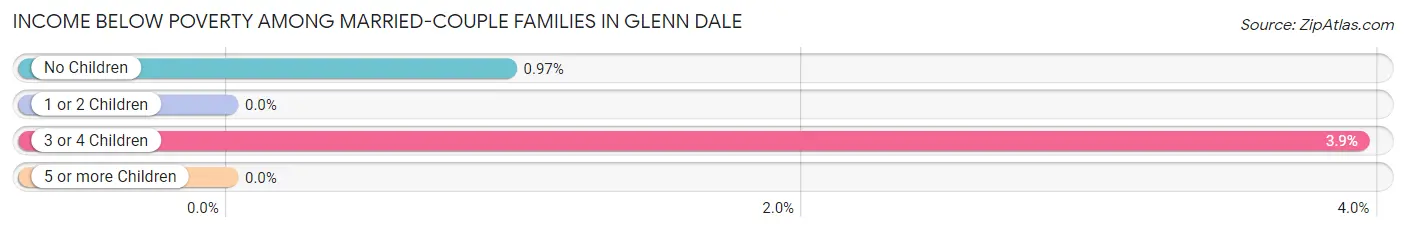
| Children | Above Poverty | Below Poverty |
| No Children | 1,730 (99.0%) | 17 (1.0%) |
| 1 or 2 Children | 844 (100.0%) | 0 (0.0%) |
| 3 or 4 Children | 317 (96.1%) | 13 (3.9%) |
| 5 or more Children | 73 (100.0%) | 0 (0.0%) |
| Total | 2,964 (99.0%) | 30 (1.0%) |
Income Below Poverty Among Single-Parent Households in Glenn Dale
According to the poverty data in Glenn Dale, 5.0% or 9 single-father households and 1.1% or 7 single-mother households are living below the poverty line. Among single-father households, those with 1 or 2 children have the highest poverty rate, with 9 households (12.2%) experiencing poverty. Likewise, among single-mother households, those with no children have the highest poverty rate, with 7 households (1.9%) falling below the poverty line.
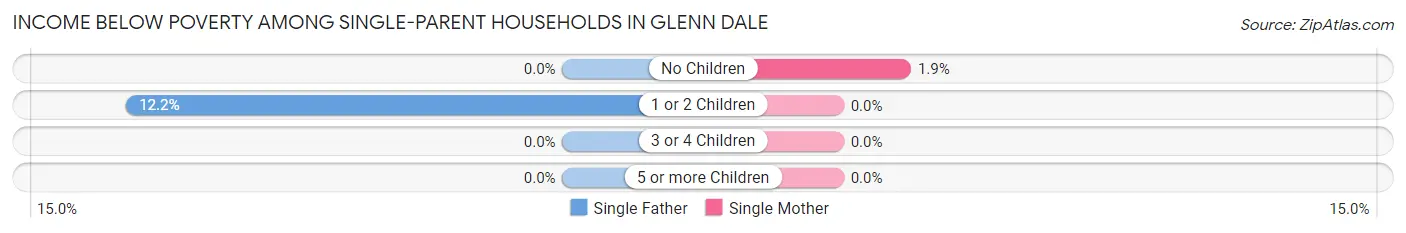
| Children | Single Father | Single Mother |
| No Children | 0 (0.0%) | 7 (1.9%) |
| 1 or 2 Children | 9 (12.2%) | 0 (0.0%) |
| 3 or 4 Children | 0 (0.0%) | 0 (0.0%) |
| 5 or more Children | 0 (0.0%) | 0 (0.0%) |
| Total | 9 (5.0%) | 7 (1.1%) |
Income Below Poverty Among Married-Couple vs Single-Parent Households in Glenn Dale
The poverty data for Glenn Dale shows that 30 of the married-couple family households (1.0%) and 16 of the single-parent households (2.0%) are living below the poverty level. Within the married-couple family households, those with 3 or 4 children have the highest poverty rate, with 13 households (3.9%) falling below the poverty line. Among the single-parent households, those with 1 or 2 children have the highest poverty rate, with 9 household (2.9%) living below poverty.
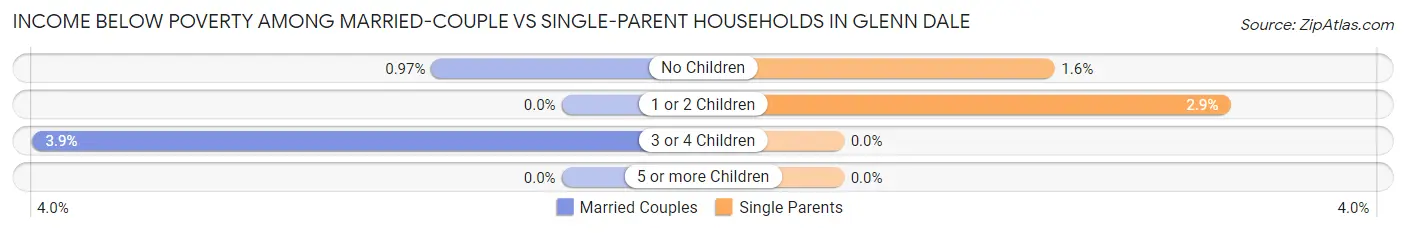
| Children | Married-Couple Families | Single-Parent Households |
| No Children | 17 (1.0%) | 7 (1.6%) |
| 1 or 2 Children | 0 (0.0%) | 9 (2.9%) |
| 3 or 4 Children | 13 (3.9%) | 0 (0.0%) |
| 5 or more Children | 0 (0.0%) | 0 (0.0%) |
| Total | 30 (1.0%) | 16 (2.0%) |
Race in Glenn Dale
The most populous races in Glenn Dale are Black / African American (8,137 | 53.4%), White / Caucasian (3,164 | 20.8%), and Hispanic or Latino (2,767 | 18.1%).
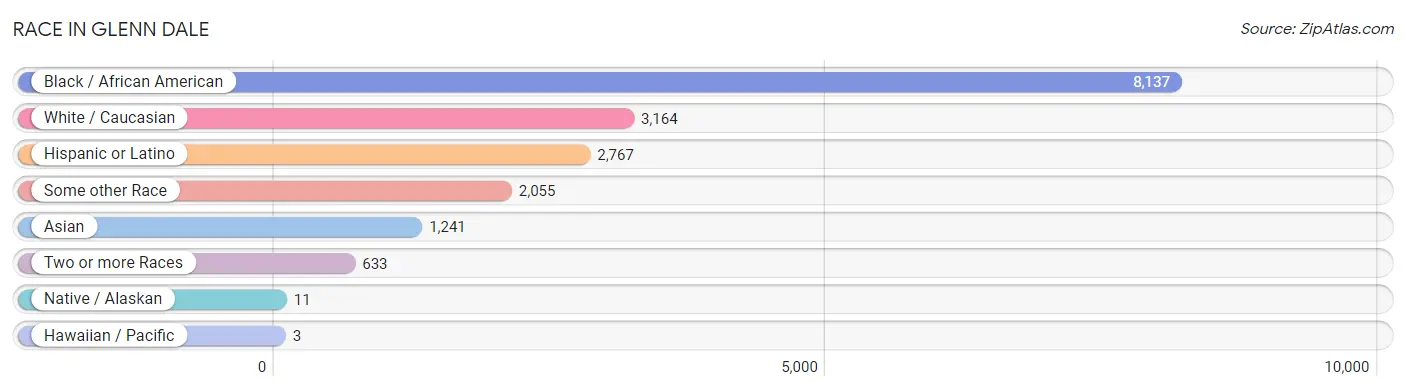
| Race | # Population | % Population |
| Asian | 1,241 | 8.1% |
| Black / African American | 8,137 | 53.4% |
| Hawaiian / Pacific | 3 | 0.0% |
| Hispanic or Latino | 2,767 | 18.1% |
| Native / Alaskan | 11 | 0.1% |
| White / Caucasian | 3,164 | 20.8% |
| Two or more Races | 633 | 4.2% |
| Some other Race | 2,055 | 13.5% |
| Total | 15,244 | 100.0% |
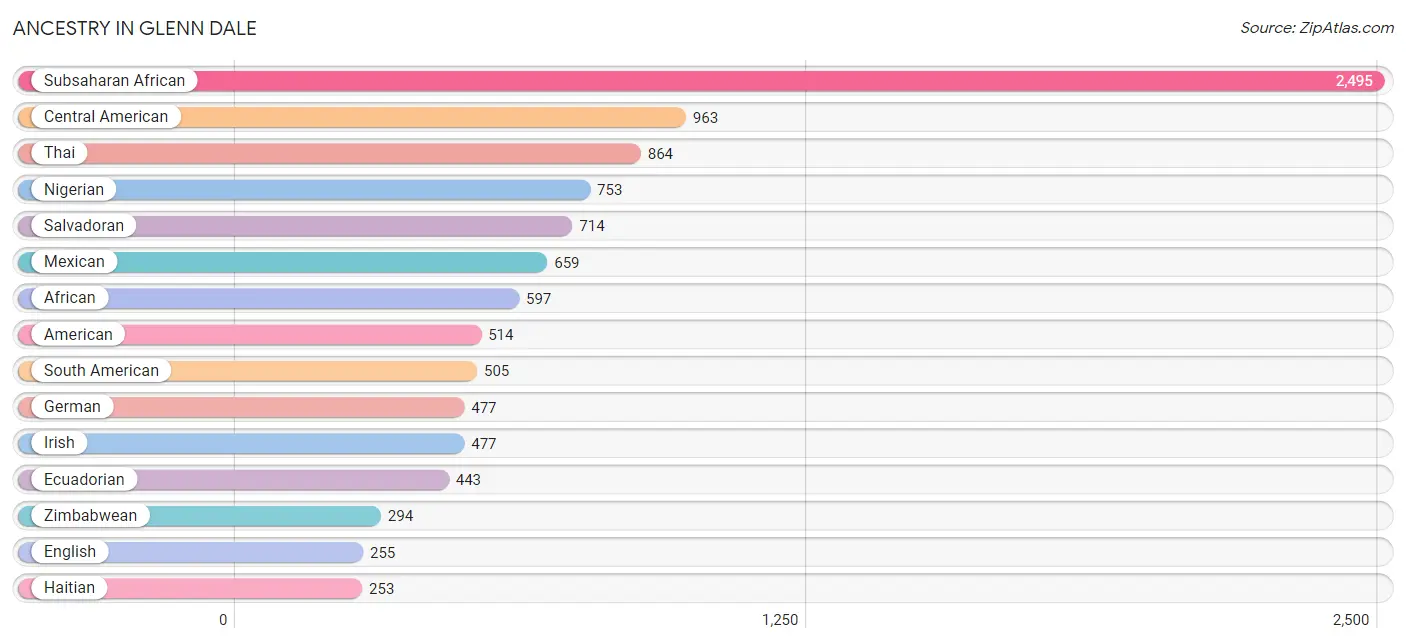
Ancestry in Glenn Dale
The most populous ancestries reported in Glenn Dale are Subsaharan African (2,495 | 16.4%), Central American (963 | 6.3%), Thai (864 | 5.7%), Nigerian (753 | 4.9%), and Salvadoran (714 | 4.7%), together accounting for 38.0% of all Glenn Dale residents.
| Ancestry | # Population | % Population |
| Afghan | 78 | 0.5% |
| African | 597 | 3.9% |
| American | 514 | 3.4% |
| Armenian | 10 | 0.1% |
| Barbadian | 7 | 0.1% |
| Bhutanese | 52 | 0.3% |
| Bolivian | 5 | 0.0% |
| British | 43 | 0.3% |
| Burmese | 51 | 0.3% |
| Central American | 963 | 6.3% |
| Cherokee | 45 | 0.3% |
| Colombian | 29 | 0.2% |
| Cuban | 71 | 0.5% |
| Czechoslovakian | 5 | 0.0% |
| Dominican | 59 | 0.4% |
| Dutch | 9 | 0.1% |
| Ecuadorian | 443 | 2.9% |
| English | 255 | 1.7% |
| Ethiopian | 95 | 0.6% |
| European | 80 | 0.5% |
| French Canadian | 10 | 0.1% |
| German | 477 | 3.1% |
| Greek | 82 | 0.5% |
| Guatemalan | 113 | 0.7% |
| Guyanese | 38 | 0.3% |
| Haitian | 253 | 1.7% |
| Honduran | 52 | 0.3% |
| Hungarian | 9 | 0.1% |
| Indonesian | 10 | 0.1% |
| Irish | 477 | 3.1% |
| Italian | 218 | 1.4% |
| Jamaican | 71 | 0.5% |
| Korean | 15 | 0.1% |
| Liberian | 110 | 0.7% |
| Lumbee | 18 | 0.1% |
| Mexican | 659 | 4.3% |
| Nicaraguan | 75 | 0.5% |
| Nigerian | 753 | 4.9% |
| Northern European | 14 | 0.1% |
| Norwegian | 11 | 0.1% |
| Pennsylvania German | 198 | 1.3% |
| Peruvian | 11 | 0.1% |
| Polish | 162 | 1.1% |
| Puerto Rican | 121 | 0.8% |
| Russian | 36 | 0.2% |
| Salvadoran | 714 | 4.7% |
| Scandinavian | 50 | 0.3% |
| Scotch-Irish | 34 | 0.2% |
| Scottish | 91 | 0.6% |
| Sierra Leonean | 252 | 1.7% |
| Slovak | 9 | 0.1% |
| South American | 505 | 3.3% |
| South American Indian | 11 | 0.1% |
| Spanish | 184 | 1.2% |
| Sri Lankan | 108 | 0.7% |
| Subsaharan African | 2,495 | 16.4% |
| Swedish | 19 | 0.1% |
| Thai | 864 | 5.7% |
| Trinidadian and Tobagonian | 48 | 0.3% |
| Turkish | 24 | 0.2% |
| Venezuelan | 17 | 0.1% |
| Welsh | 19 | 0.1% |
| West Indian | 68 | 0.4% |
| Zimbabwean | 294 | 1.9% | View All 64 Rows |
Immigrants in Glenn Dale
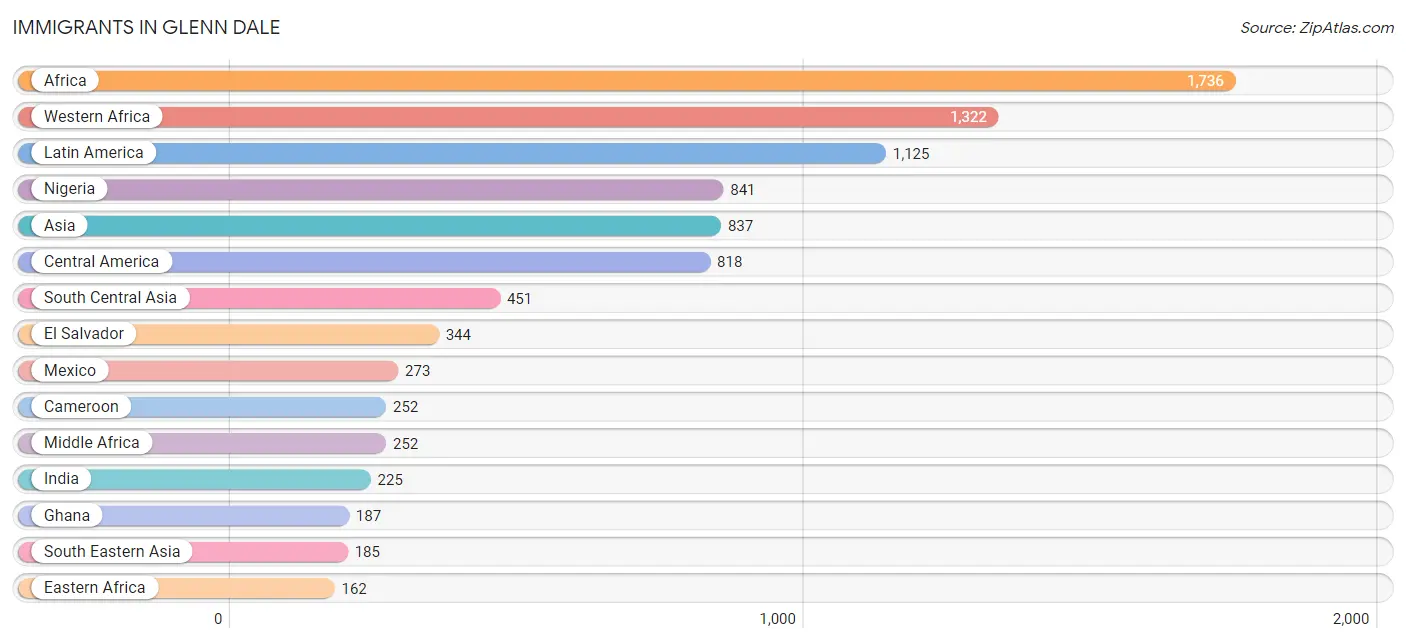
The most numerous immigrant groups reported in Glenn Dale came from Africa (1,736 | 11.4%), Western Africa (1,322 | 8.7%), Latin America (1,125 | 7.4%), Nigeria (841 | 5.5%), and Asia (837 | 5.5%), together accounting for 38.5% of all Glenn Dale residents.
| Immigration Origin | # Population | % Population |
| Afghanistan | 38 | 0.3% |
| Africa | 1,736 | 11.4% |
| Asia | 837 | 5.5% |
| Barbados | 7 | 0.1% |
| Bolivia | 15 | 0.1% |
| Cameroon | 252 | 1.7% |
| Canada | 19 | 0.1% |
| Caribbean | 147 | 1.0% |
| Central America | 818 | 5.4% |
| Colombia | 29 | 0.2% |
| Costa Rica | 66 | 0.4% |
| Czechoslovakia | 9 | 0.1% |
| Dominican Republic | 16 | 0.1% |
| Eastern Africa | 162 | 1.1% |
| Eastern Asia | 134 | 0.9% |
| Eastern Europe | 43 | 0.3% |
| Ecuador | 38 | 0.3% |
| El Salvador | 344 | 2.3% |
| Ethiopia | 94 | 0.6% |
| Europe | 96 | 0.6% |
| Fiji | 3 | 0.0% |
| Germany | 10 | 0.1% |
| Ghana | 187 | 1.2% |
| Guatemala | 39 | 0.3% |
| Guyana | 35 | 0.2% |
| Honduras | 73 | 0.5% |
| India | 225 | 1.5% |
| Italy | 11 | 0.1% |
| Jamaica | 56 | 0.4% |
| Korea | 134 | 0.9% |
| Laos | 97 | 0.6% |
| Latin America | 1,125 | 7.4% |
| Latvia | 13 | 0.1% |
| Liberia | 137 | 0.9% |
| Mexico | 273 | 1.8% |
| Middle Africa | 252 | 1.7% |
| Nicaragua | 23 | 0.2% |
| Nigeria | 841 | 5.5% |
| Northern Europe | 32 | 0.2% |
| Oceania | 3 | 0.0% |
| Pakistan | 150 | 1.0% |
| Peru | 11 | 0.1% |
| Philippines | 15 | 0.1% |
| Poland | 10 | 0.1% |
| Russia | 11 | 0.1% |
| Sierra Leone | 142 | 0.9% |
| South America | 160 | 1.1% |
| South Central Asia | 451 | 3.0% |
| South Eastern Asia | 185 | 1.2% |
| Southern Europe | 11 | 0.1% |
| Sri Lanka | 38 | 0.3% |
| Trinidad and Tobago | 68 | 0.4% |
| Turkey | 24 | 0.2% |
| Vietnam | 63 | 0.4% |
| Western Africa | 1,322 | 8.7% |
| Western Asia | 24 | 0.2% |
| Western Europe | 10 | 0.1% |
| Zimbabwe | 68 | 0.4% | View All 58 Rows |
Sex and Age in Glenn Dale
Sex and Age in Glenn Dale
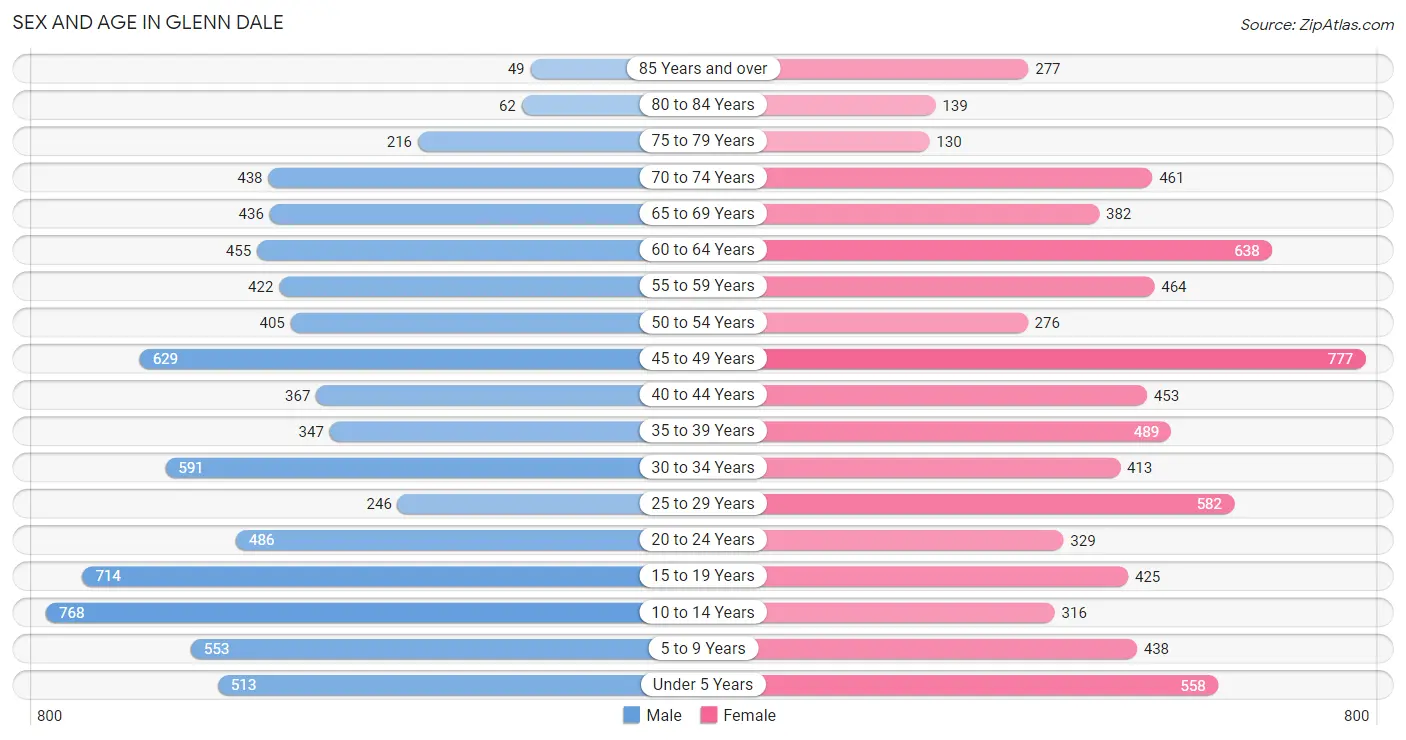
The most populous age groups in Glenn Dale are 10 to 14 Years (768 | 10.0%) for men and 45 to 49 Years (777 | 10.3%) for women.
| Age Bracket | Male | Female |
| Under 5 Years | 513 (6.7%) | 558 (7.4%) |
| 5 to 9 Years | 553 (7.2%) | 438 (5.8%) |
| 10 to 14 Years | 768 (10.0%) | 316 (4.2%) |
| 15 to 19 Years | 714 (9.3%) | 425 (5.6%) |
| 20 to 24 Years | 486 (6.3%) | 329 (4.4%) |
| 25 to 29 Years | 246 (3.2%) | 582 (7.7%) |
| 30 to 34 Years | 591 (7.7%) | 413 (5.5%) |
| 35 to 39 Years | 347 (4.5%) | 489 (6.5%) |
| 40 to 44 Years | 367 (4.8%) | 453 (6.0%) |
| 45 to 49 Years | 629 (8.2%) | 777 (10.3%) |
| 50 to 54 Years | 405 (5.3%) | 276 (3.7%) |
| 55 to 59 Years | 422 (5.5%) | 464 (6.1%) |
| 60 to 64 Years | 455 (5.9%) | 638 (8.5%) |
| 65 to 69 Years | 436 (5.7%) | 382 (5.1%) |
| 70 to 74 Years | 438 (5.7%) | 461 (6.1%) |
| 75 to 79 Years | 216 (2.8%) | 130 (1.7%) |
| 80 to 84 Years | 62 (0.8%) | 139 (1.8%) |
| 85 Years and over | 49 (0.6%) | 277 (3.7%) |
| Total | 7,697 (100.0%) | 7,547 (100.0%) |
Families and Households in Glenn Dale
Median Family Size in Glenn Dale
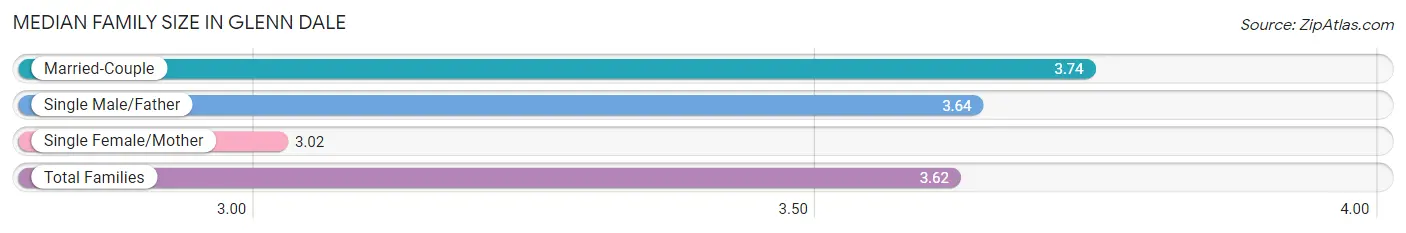
The median family size in Glenn Dale is 3.62 persons per family, with married-couple families (2,994 | 78.9%) accounting for the largest median family size of 3.74 persons per family. On the other hand, single female/mother families (620 | 16.3%) represent the smallest median family size with 3.02 persons per family.
| Family Type | # Families | Family Size |
| Married-Couple | 2,994 (78.9%) | 3.74 |
| Single Male/Father | 180 (4.7%) | 3.64 |
| Single Female/Mother | 620 (16.3%) | 3.02 |
| Total Families | 3,794 (100.0%) | 3.62 |
Median Household Size in Glenn Dale
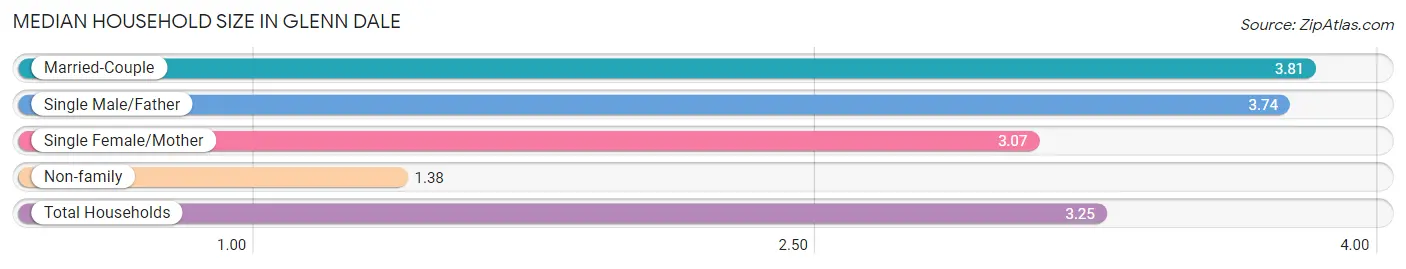
The median household size in Glenn Dale is 3.25 persons per household, with married-couple households (2,994 | 64.1%) accounting for the largest median household size of 3.81 persons per household. non-family households (878 | 18.8%) represent the smallest median household size with 1.38 persons per household.
| Household Type | # Households | Household Size |
| Married-Couple | 2,994 (64.1%) | 3.81 |
| Single Male/Father | 180 (3.8%) | 3.74 |
| Single Female/Mother | 620 (13.3%) | 3.07 |
| Non-family | 878 (18.8%) | 1.38 |
| Total Households | 4,672 (100.0%) | 3.25 |
Household Size by Marriage Status in Glenn Dale
Out of a total of 4,672 households in Glenn Dale, 3,794 (81.2%) are family households, while 878 (18.8%) are nonfamily households. The most numerous type of family households are 2-person households, comprising 1,383, and the most common type of nonfamily households are 1-person households, comprising 792.
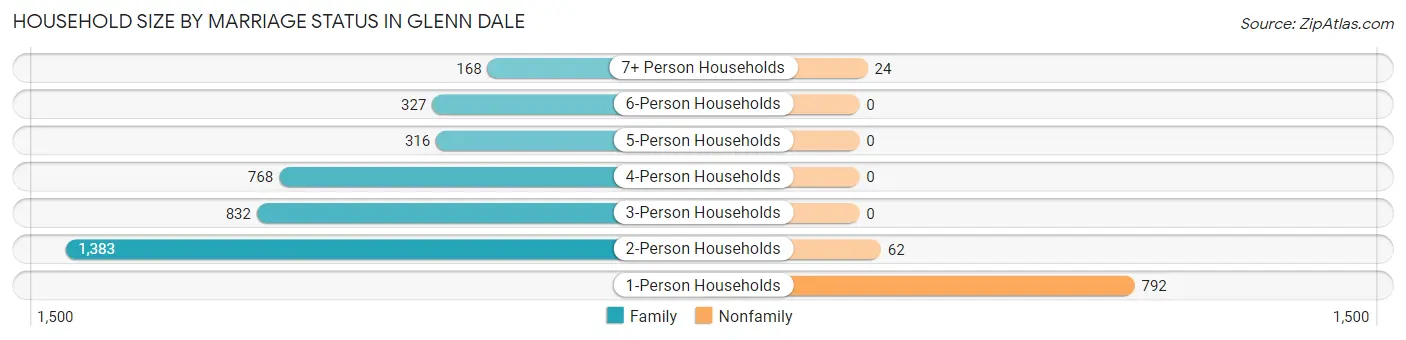
| Household Size | Family Households | Nonfamily Households |
| 1-Person Households | - | 792 (17.0%) |
| 2-Person Households | 1,383 (29.6%) | 62 (1.3%) |
| 3-Person Households | 832 (17.8%) | 0 (0.0%) |
| 4-Person Households | 768 (16.4%) | 0 (0.0%) |
| 5-Person Households | 316 (6.8%) | 0 (0.0%) |
| 6-Person Households | 327 (7.0%) | 0 (0.0%) |
| 7+ Person Households | 168 (3.6%) | 24 (0.5%) |
| Total | 3,794 (81.2%) | 878 (18.8%) |
Female Fertility in Glenn Dale
Fertility by Age in Glenn Dale
Average fertility rate in Glenn Dale is 44.0 births per 1,000 women. Women in the age bracket of 20 to 34 years have the highest fertility rate with 57.0 births per 1,000 women. Women in the age bracket of 35 to 50 years acount for 50.6% of all women with births.
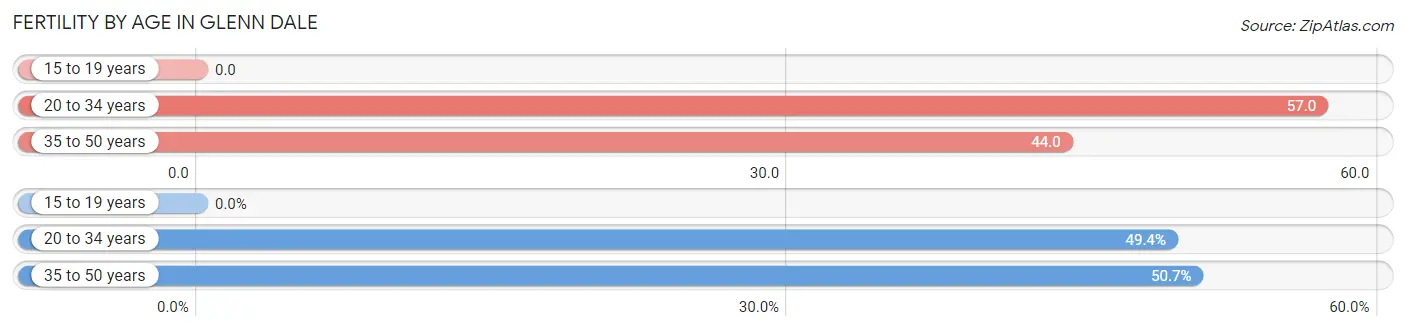
| Age Bracket | Women with Births | Births / 1,000 Women |
| 15 to 19 years | 0 (0.0%) | 0.0 |
| 20 to 34 years | 76 (49.3%) | 57.0 |
| 35 to 50 years | 78 (50.6%) | 44.0 |
| Total | 154 (100.0%) | 44.0 |
Fertility by Age by Marriage Status in Glenn Dale
89.0% of women with births (154) in Glenn Dale are married. The highest percentage of unmarried women with births falls into 20 to 34 years age bracket with 22.4% of them unmarried at the time of birth, while the lowest percentage of unmarried women with births belong to 35 to 50 years age bracket with 0.0% of them unmarried.
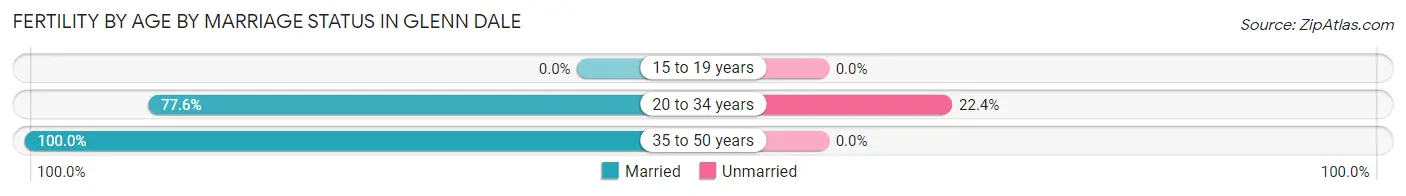
| Age Bracket | Married | Unmarried |
| 15 to 19 years | 0 (0.0%) | 0 (0.0%) |
| 20 to 34 years | 59 (77.6%) | 17 (22.4%) |
| 35 to 50 years | 78 (100.0%) | 0 (0.0%) |
| Total | 137 (89.0%) | 17 (11.0%) |
Fertility by Education in Glenn Dale
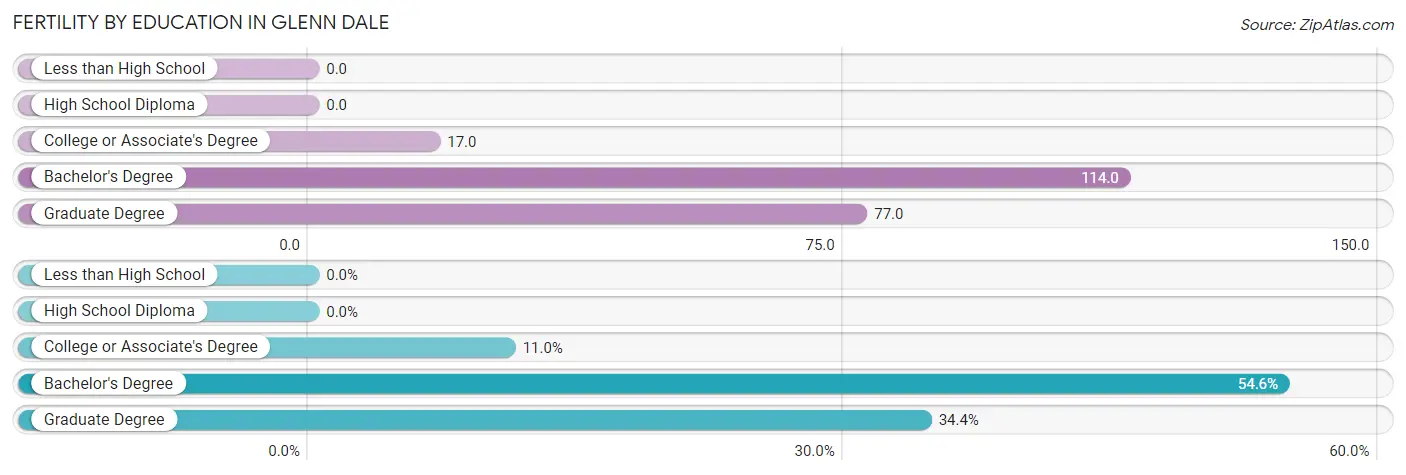
| Educational Attainment | Women with Births | Births / 1,000 Women |
| Less than High School | 0 (0.0%) | 0.0 |
| High School Diploma | 0 (0.0%) | 0.0 |
| College or Associate's Degree | 17 (11.0%) | 17.0 |
| Bachelor's Degree | 84 (54.5%) | 114.0 |
| Graduate Degree | 53 (34.4%) | 77.0 |
| Total | 154 (100.0%) | 44.0 |
Fertility by Education by Marriage Status in Glenn Dale
11.0% of women with births in Glenn Dale are unmarried. Women with the educational attainment of bachelor's degree are most likely to be married with 100.0% of them married at childbirth, while women with the educational attainment of college or associate's degree are least likely to be married with 100.0% of them unmarried at childbirth.
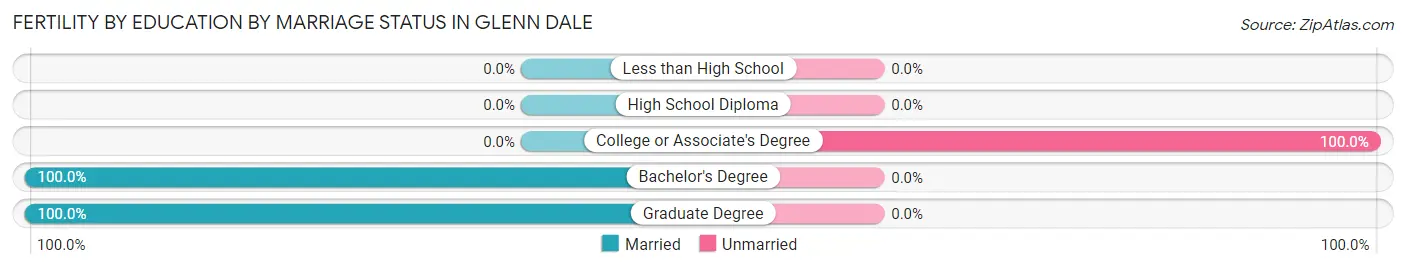
| Educational Attainment | Married | Unmarried |
| Less than High School | 0 (0.0%) | 0 (0.0%) |
| High School Diploma | 0 (0.0%) | 0 (0.0%) |
| College or Associate's Degree | 0 (0.0%) | 17 (100.0%) |
| Bachelor's Degree | 84 (100.0%) | 0 (0.0%) |
| Graduate Degree | 53 (100.0%) | 0 (0.0%) |
| Total | 137 (89.0%) | 17 (11.0%) |
Employment Characteristics in Glenn Dale
Employment by Class of Employer in Glenn Dale
Among the 7,532 employed individuals in Glenn Dale, private company employees (3,759 | 49.9%), federal government employees (1,203 | 16.0%), and not-for-profit organizations (793 | 10.5%) make up the most common classes of employment.
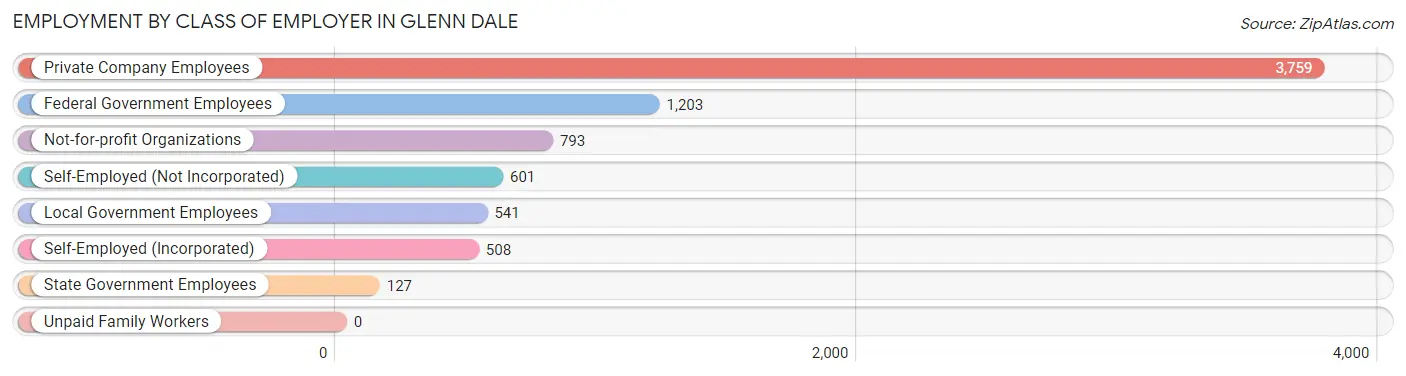
| Employer Class | # Employees | % Employees |
| Private Company Employees | 3,759 | 49.9% |
| Self-Employed (Incorporated) | 508 | 6.7% |
| Self-Employed (Not Incorporated) | 601 | 8.0% |
| Not-for-profit Organizations | 793 | 10.5% |
| Local Government Employees | 541 | 7.2% |
| State Government Employees | 127 | 1.7% |
| Federal Government Employees | 1,203 | 16.0% |
| Unpaid Family Workers | 0 | 0.0% |
| Total | 7,532 | 100.0% |
Employment Status by Age in Glenn Dale
According to the labor force statistics for Glenn Dale, out of the total population over 16 years of age (11,818), 71.3% or 8,426 individuals are in the labor force, with 7.2% or 607 of them unemployed. The age group with the highest labor force participation rate is 30 to 34 years, with 89.9% or 903 individuals in the labor force. Within the labor force, the 25 to 29 years age range has the highest percentage of unemployed individuals, with 26.4% or 187 of them being unemployed.
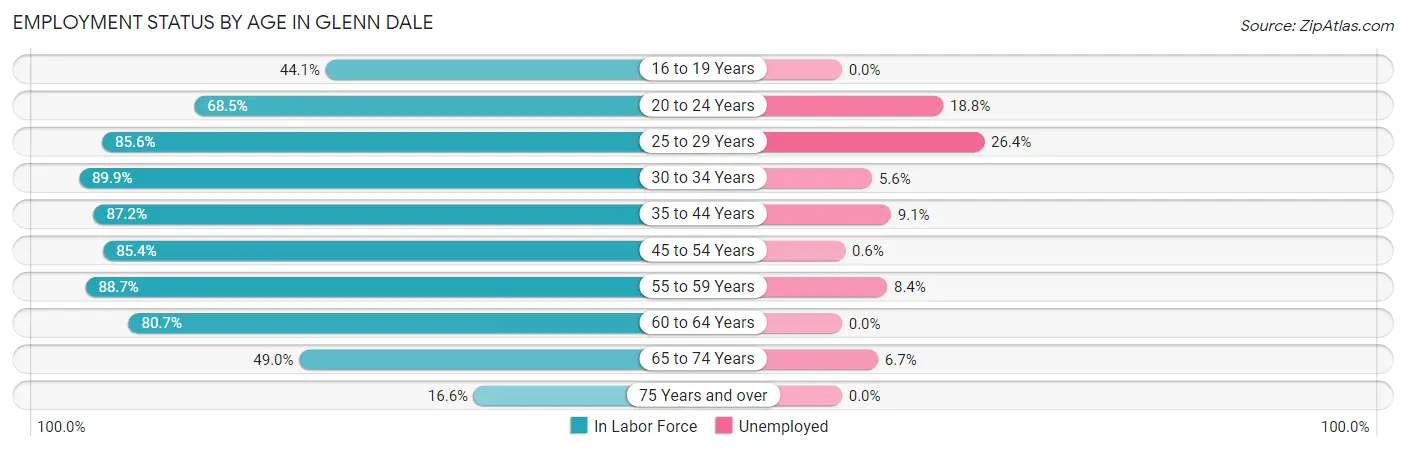
| Age Bracket | In Labor Force | Unemployed |
| 16 to 19 Years | 379 (44.1%) | 0 (0.0%) |
| 20 to 24 Years | 558 (68.5%) | 105 (18.8%) |
| 25 to 29 Years | 709 (85.6%) | 187 (26.4%) |
| 30 to 34 Years | 903 (89.9%) | 51 (5.6%) |
| 35 to 44 Years | 1,444 (87.2%) | 131 (9.1%) |
| 45 to 54 Years | 1,782 (85.4%) | 11 (0.6%) |
| 55 to 59 Years | 786 (88.7%) | 66 (8.4%) |
| 60 to 64 Years | 882 (80.7%) | 0 (0.0%) |
| 65 to 74 Years | 841 (49.0%) | 56 (6.7%) |
| 75 Years and over | 145 (16.6%) | 0 (0.0%) |
| Total | 8,426 (71.3%) | 607 (7.2%) |
Employment Status by Educational Attainment in Glenn Dale
According to labor force statistics for Glenn Dale, 86.1% of individuals (6,504) out of the total population between 25 and 64 years of age (7,554) are in the labor force, with 6.9% or 449 of them being unemployed. The group with the highest labor force participation rate are those with the educational attainment of high school diploma, with 88.0% or 1,327 individuals in the labor force. Within the labor force, individuals with college / associate degree education have the highest percentage of unemployment, with 18.4% or 272 of them being unemployed.
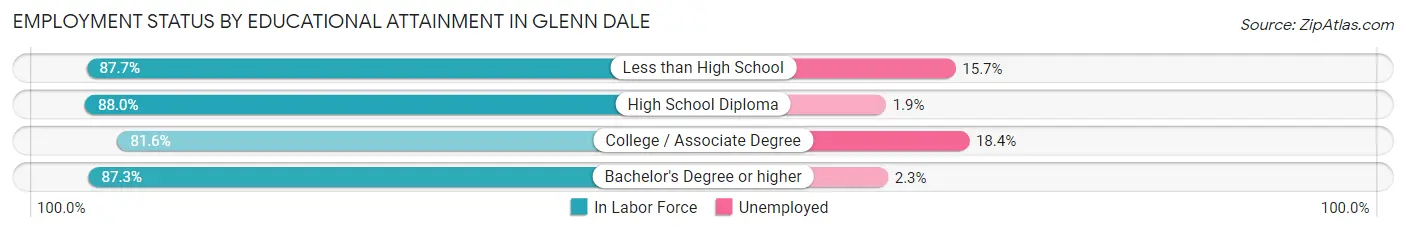
| Educational Attainment | In Labor Force | Unemployed |
| Less than High School | 508 (87.7%) | 91 (15.7%) |
| High School Diploma | 1,327 (88.0%) | 29 (1.9%) |
| College / Associate Degree | 1,476 (81.6%) | 333 (18.4%) |
| Bachelor's Degree or higher | 3,193 (87.3%) | 84 (2.3%) |
| Total | 6,504 (86.1%) | 521 (6.9%) |
Employment Occupations by Sex in Glenn Dale
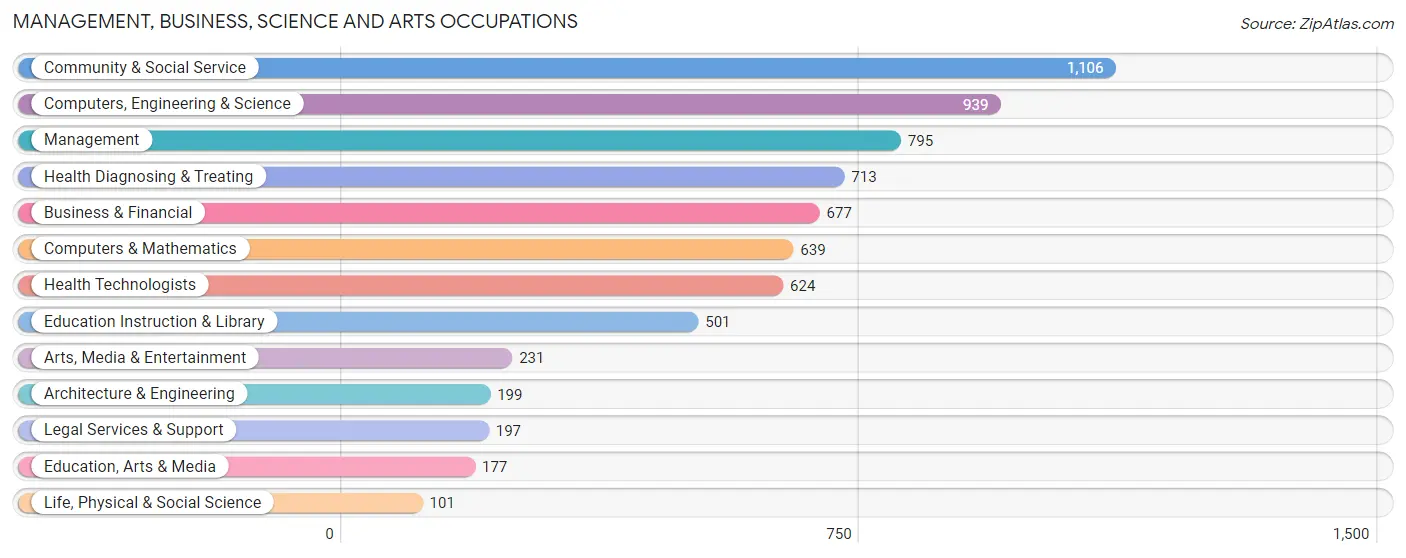
Management, Business, Science and Arts Occupations
The most common Management, Business, Science and Arts occupations in Glenn Dale are Community & Social Service (1,106 | 14.2%), Computers, Engineering & Science (939 | 12.0%), Management (795 | 10.2%), Health Diagnosing & Treating (713 | 9.1%), and Business & Financial (677 | 8.7%).
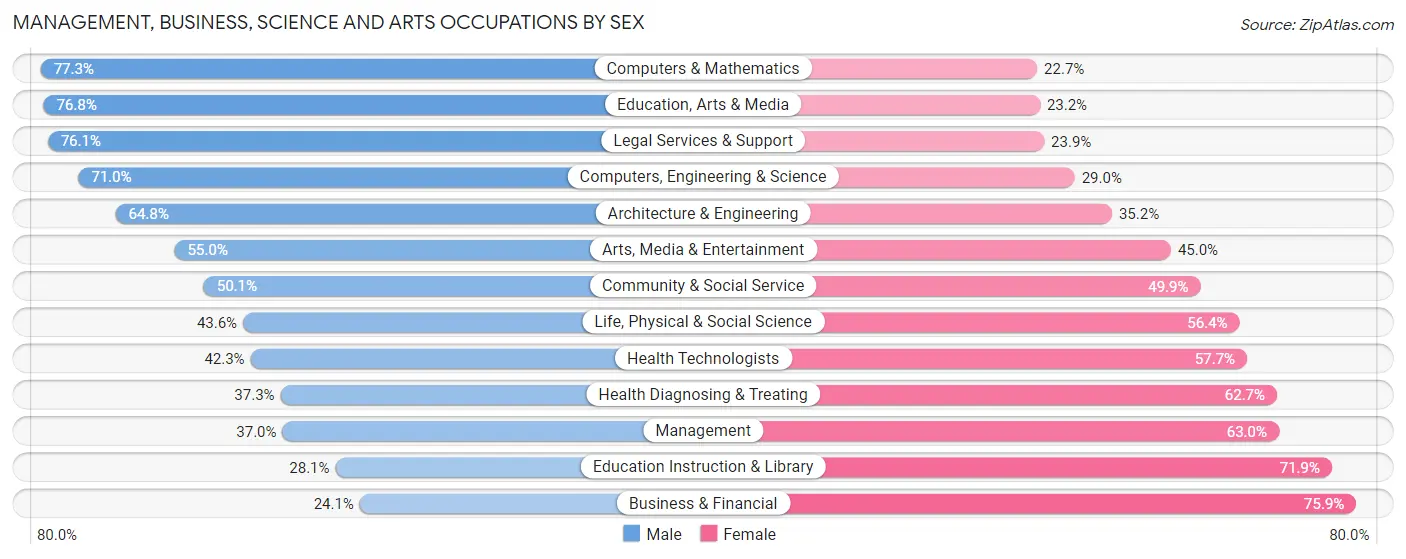
Management, Business, Science and Arts Occupations by Sex
Within the Management, Business, Science and Arts occupations in Glenn Dale, the most male-oriented occupations are Computers & Mathematics (77.3%), Education, Arts & Media (76.8%), and Legal Services & Support (76.1%), while the most female-oriented occupations are Business & Financial (75.9%), Education Instruction & Library (71.9%), and Management (63.0%).
| Occupation | Male | Female |
| Management | 294 (37.0%) | 501 (63.0%) |
| Business & Financial | 163 (24.1%) | 514 (75.9%) |
| Computers, Engineering & Science | 667 (71.0%) | 272 (29.0%) |
| Computers & Mathematics | 494 (77.3%) | 145 (22.7%) |
| Architecture & Engineering | 129 (64.8%) | 70 (35.2%) |
| Life, Physical & Social Science | 44 (43.6%) | 57 (56.4%) |
| Community & Social Service | 554 (50.1%) | 552 (49.9%) |
| Education, Arts & Media | 136 (76.8%) | 41 (23.2%) |
| Legal Services & Support | 150 (76.1%) | 47 (23.9%) |
| Education Instruction & Library | 141 (28.1%) | 360 (71.9%) |
| Arts, Media & Entertainment | 127 (55.0%) | 104 (45.0%) |
| Health Diagnosing & Treating | 266 (37.3%) | 447 (62.7%) |
| Health Technologists | 264 (42.3%) | 360 (57.7%) |
| Total (Category) | 1,944 (46.0%) | 2,286 (54.0%) |
| Total (Overall) | 3,792 (48.6%) | 4,014 (51.4%) |
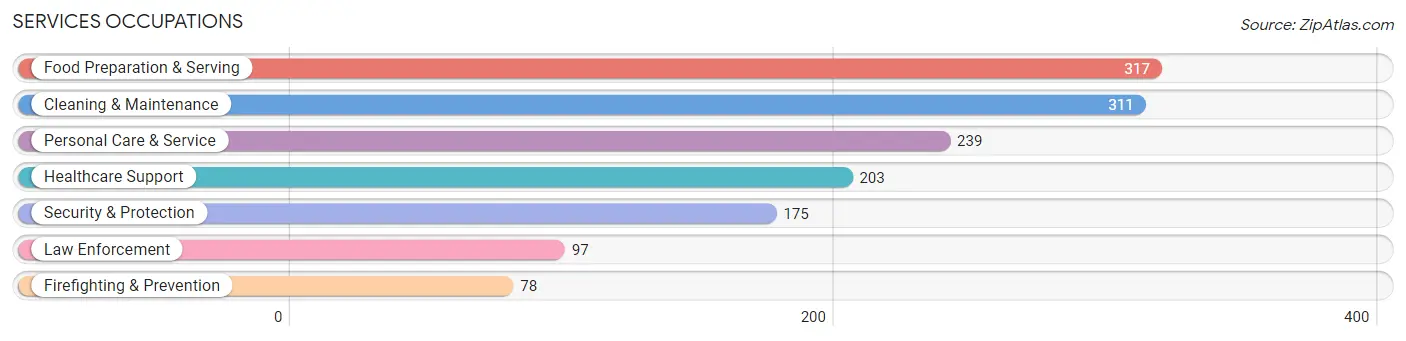
Services Occupations
The most common Services occupations in Glenn Dale are Food Preparation & Serving (317 | 4.1%), Cleaning & Maintenance (311 | 4.0%), Personal Care & Service (239 | 3.1%), Healthcare Support (203 | 2.6%), and Security & Protection (175 | 2.2%).
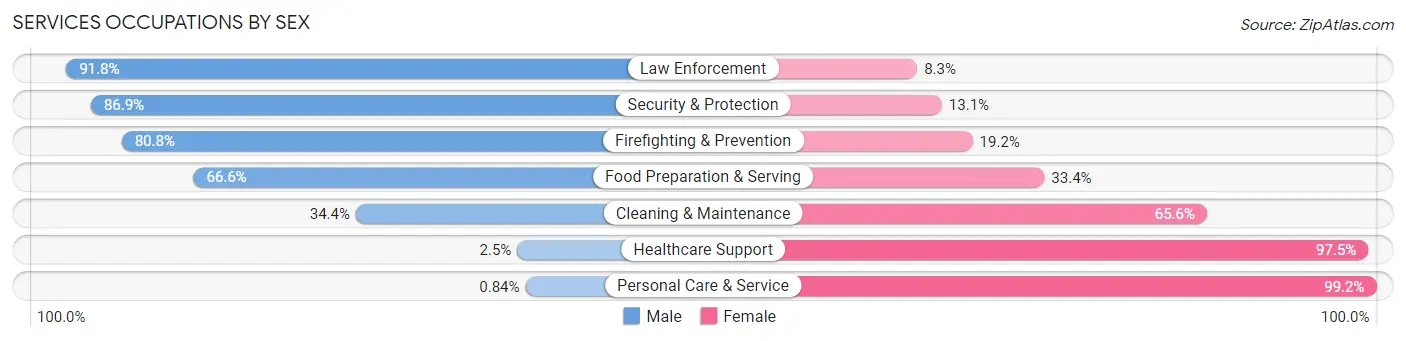
Services Occupations by Sex
Within the Services occupations in Glenn Dale, the most male-oriented occupations are Law Enforcement (91.7%), Security & Protection (86.9%), and Firefighting & Prevention (80.8%), while the most female-oriented occupations are Personal Care & Service (99.2%), Healthcare Support (97.5%), and Cleaning & Maintenance (65.6%).
| Occupation | Male | Female |
| Healthcare Support | 5 (2.5%) | 198 (97.5%) |
| Security & Protection | 152 (86.9%) | 23 (13.1%) |
| Firefighting & Prevention | 63 (80.8%) | 15 (19.2%) |
| Law Enforcement | 89 (91.7%) | 8 (8.3%) |
| Food Preparation & Serving | 211 (66.6%) | 106 (33.4%) |
| Cleaning & Maintenance | 107 (34.4%) | 204 (65.6%) |
| Personal Care & Service | 2 (0.8%) | 237 (99.2%) |
| Total (Category) | 477 (38.3%) | 768 (61.7%) |
| Total (Overall) | 3,792 (48.6%) | 4,014 (51.4%) |
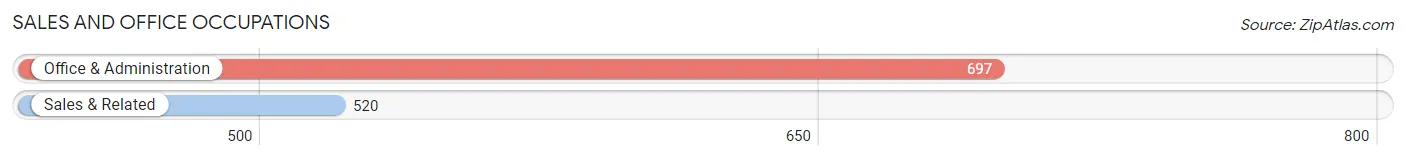
Sales and Office Occupations
The most common Sales and Office occupations in Glenn Dale are Office & Administration (697 | 8.9%), and Sales & Related (520 | 6.7%).
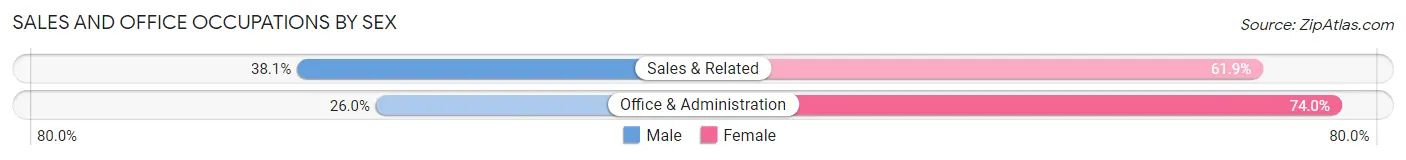
Sales and Office Occupations by Sex
| Occupation | Male | Female |
| Sales & Related | 198 (38.1%) | 322 (61.9%) |
| Office & Administration | 181 (26.0%) | 516 (74.0%) |
| Total (Category) | 379 (31.1%) | 838 (68.9%) |
| Total (Overall) | 3,792 (48.6%) | 4,014 (51.4%) |
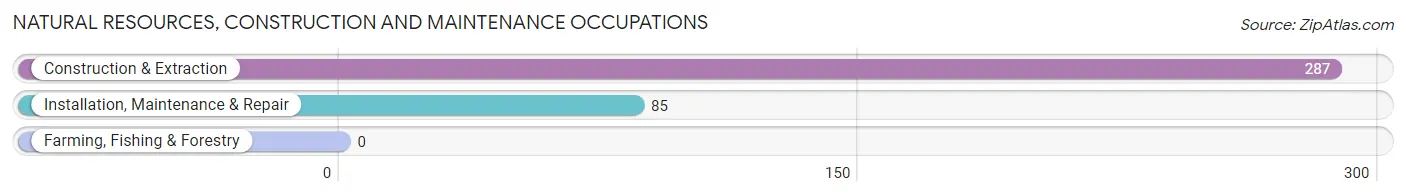
Natural Resources, Construction and Maintenance Occupations
The most common Natural Resources, Construction and Maintenance occupations in Glenn Dale are Construction & Extraction (287 | 3.7%), and Installation, Maintenance & Repair (85 | 1.1%).
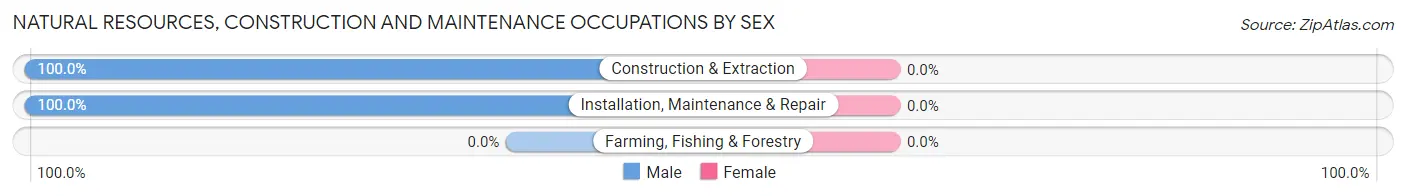
Natural Resources, Construction and Maintenance Occupations by Sex
| Occupation | Male | Female |
| Farming, Fishing & Forestry | 0 (0.0%) | 0 (0.0%) |
| Construction & Extraction | 287 (100.0%) | 0 (0.0%) |
| Installation, Maintenance & Repair | 85 (100.0%) | 0 (0.0%) |
| Total (Category) | 372 (100.0%) | 0 (0.0%) |
| Total (Overall) | 3,792 (48.6%) | 4,014 (51.4%) |
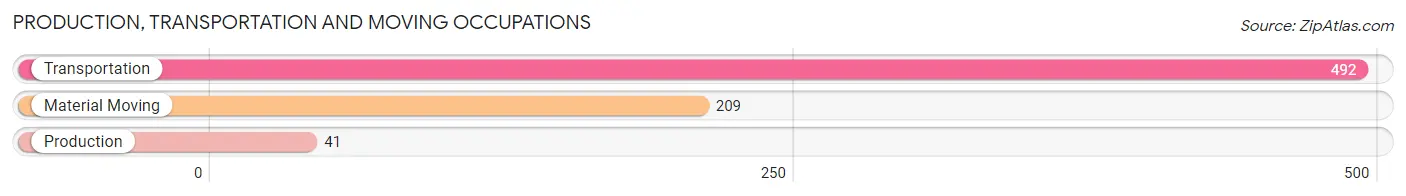
Production, Transportation and Moving Occupations
The most common Production, Transportation and Moving occupations in Glenn Dale are Transportation (492 | 6.3%), Material Moving (209 | 2.7%), and Production (41 | 0.5%).
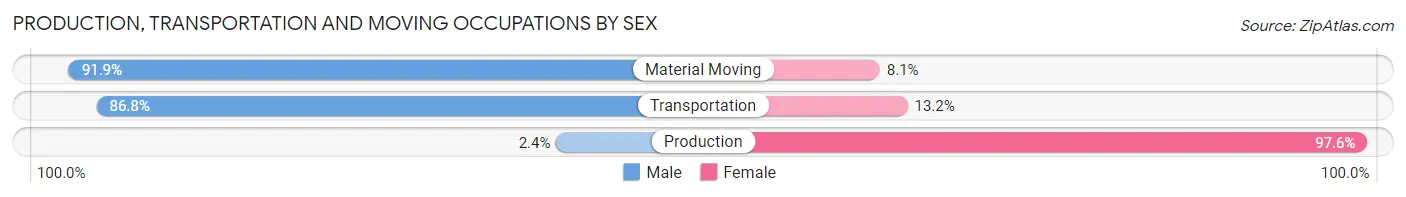
Production, Transportation and Moving Occupations by Sex
| Occupation | Male | Female |
| Production | 1 (2.4%) | 40 (97.6%) |
| Transportation | 427 (86.8%) | 65 (13.2%) |
| Material Moving | 192 (91.9%) | 17 (8.1%) |
| Total (Category) | 620 (83.6%) | 122 (16.4%) |
| Total (Overall) | 3,792 (48.6%) | 4,014 (51.4%) |
Employment Industries by Sex in Glenn Dale
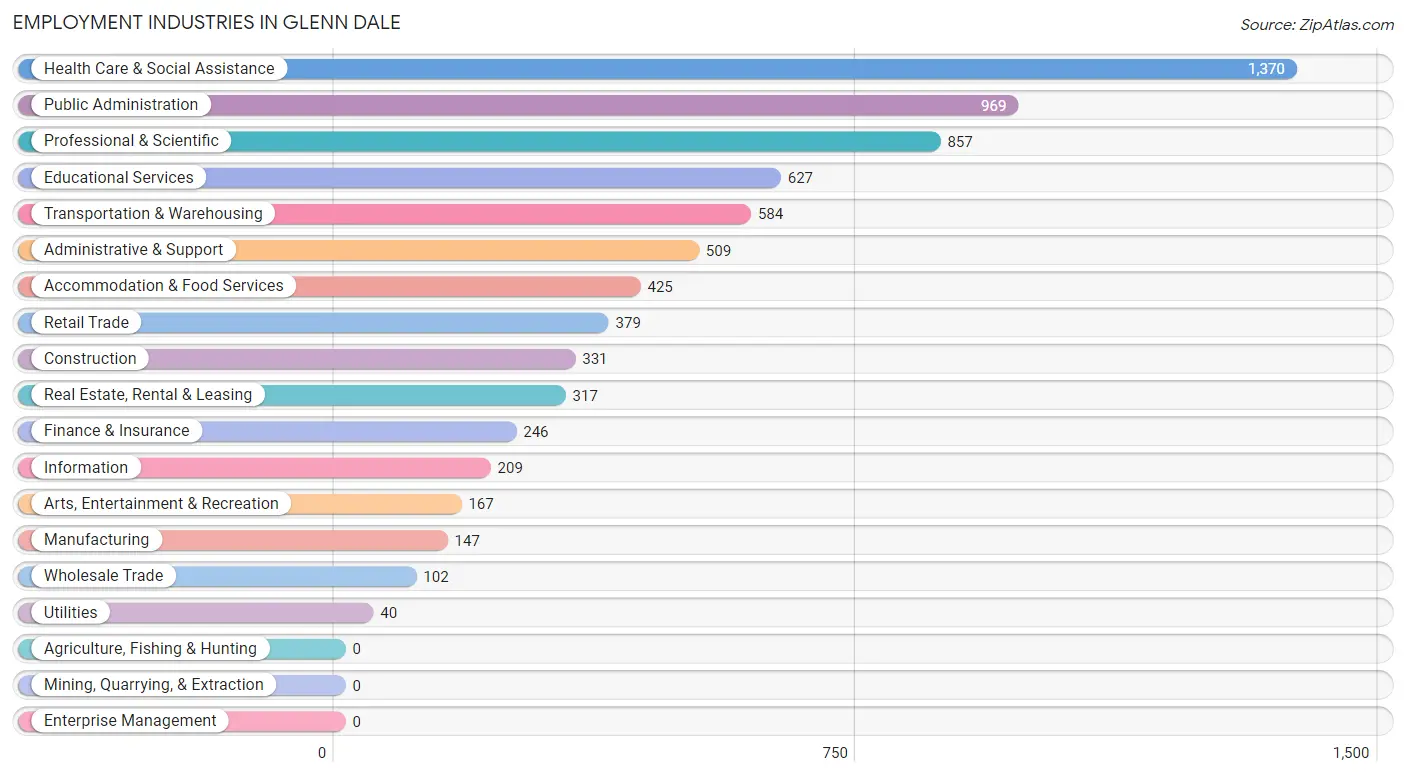
Employment Industries in Glenn Dale
The major employment industries in Glenn Dale include Health Care & Social Assistance (1,370 | 17.5%), Public Administration (969 | 12.4%), Professional & Scientific (857 | 11.0%), Educational Services (627 | 8.0%), and Transportation & Warehousing (584 | 7.5%).
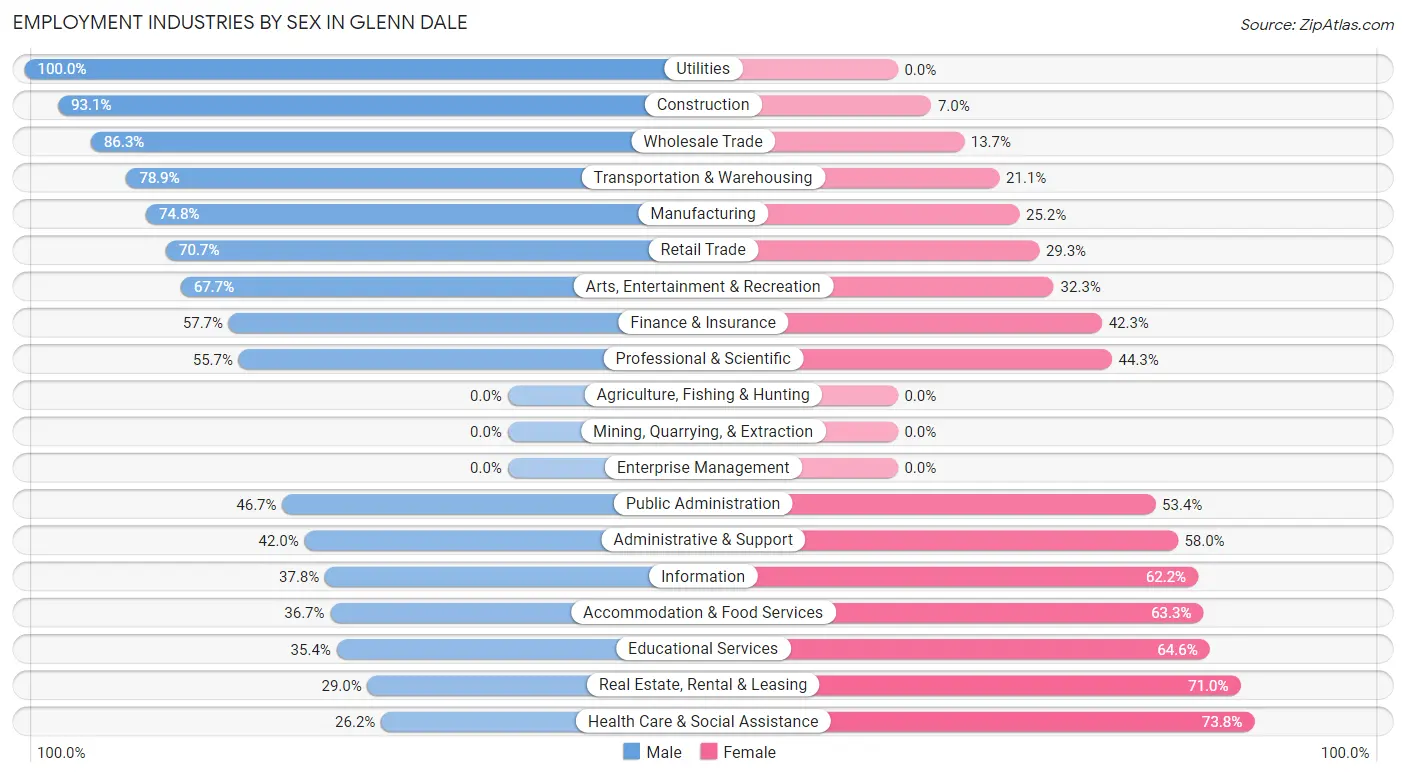
Employment Industries by Sex in Glenn Dale
The Glenn Dale industries that see more men than women are Utilities (100.0%), Construction (93.0%), and Wholesale Trade (86.3%), whereas the industries that tend to have a higher number of women are Health Care & Social Assistance (73.8%), Real Estate, Rental & Leasing (71.0%), and Educational Services (64.6%).
| Industry | Male | Female |
| Agriculture, Fishing & Hunting | 0 (0.0%) | 0 (0.0%) |
| Mining, Quarrying, & Extraction | 0 (0.0%) | 0 (0.0%) |
| Construction | 308 (93.0%) | 23 (7.0%) |
| Manufacturing | 110 (74.8%) | 37 (25.2%) |
| Wholesale Trade | 88 (86.3%) | 14 (13.7%) |
| Retail Trade | 268 (70.7%) | 111 (29.3%) |
| Transportation & Warehousing | 461 (78.9%) | 123 (21.1%) |
| Utilities | 40 (100.0%) | 0 (0.0%) |
| Information | 79 (37.8%) | 130 (62.2%) |
| Finance & Insurance | 142 (57.7%) | 104 (42.3%) |
| Real Estate, Rental & Leasing | 92 (29.0%) | 225 (71.0%) |
| Professional & Scientific | 477 (55.7%) | 380 (44.3%) |
| Enterprise Management | 0 (0.0%) | 0 (0.0%) |
| Administrative & Support | 214 (42.0%) | 295 (58.0%) |
| Educational Services | 222 (35.4%) | 405 (64.6%) |
| Health Care & Social Assistance | 359 (26.2%) | 1,011 (73.8%) |
| Arts, Entertainment & Recreation | 113 (67.7%) | 54 (32.3%) |
| Accommodation & Food Services | 156 (36.7%) | 269 (63.3%) |
| Public Administration | 452 (46.7%) | 517 (53.3%) |
| Total | 3,792 (48.6%) | 4,014 (51.4%) |
Education in Glenn Dale
School Enrollment in Glenn Dale
The most common levels of schooling among the 4,300 students in Glenn Dale are middle school (1,024 | 23.8%), college / undergraduate (1,022 | 23.8%), and high school (852 | 19.8%).
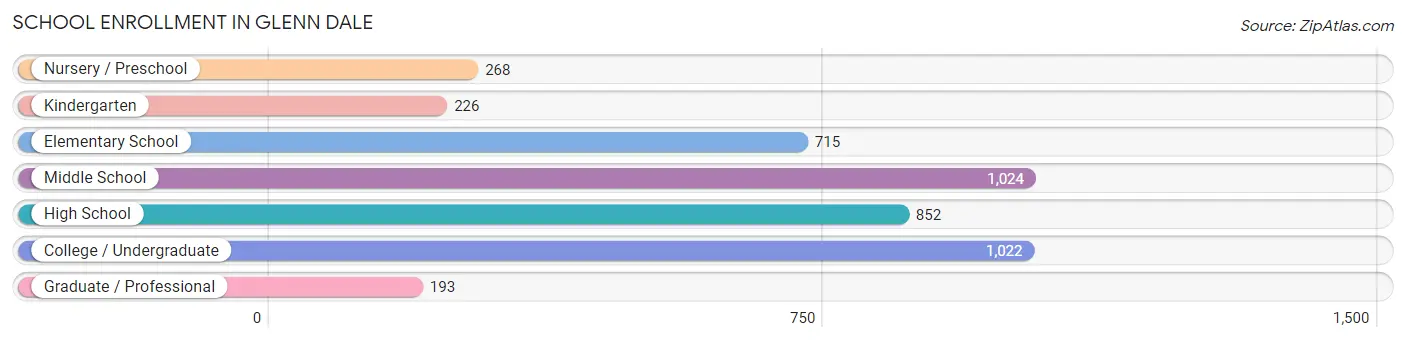
| School Level | # Students | % Students |
| Nursery / Preschool | 268 | 6.2% |
| Kindergarten | 226 | 5.3% |
| Elementary School | 715 | 16.6% |
| Middle School | 1,024 | 23.8% |
| High School | 852 | 19.8% |
| College / Undergraduate | 1,022 | 23.8% |
| Graduate / Professional | 193 | 4.5% |
| Total | 4,300 | 100.0% |
School Enrollment by Age by Funding Source in Glenn Dale
Out of a total of 4,300 students who are enrolled in schools in Glenn Dale, 1,019 (23.7%) attend a private institution, while the remaining 3,281 (76.3%) are enrolled in public schools. The age group of 5 to 9 year old has the highest likelihood of being enrolled in private schools, with 356 (36.9% in the age bracket) enrolled. Conversely, the age group of 25 to 34 year olds has the lowest likelihood of being enrolled in a private school, with 377 (95.0% in the age bracket) attending a public institution.
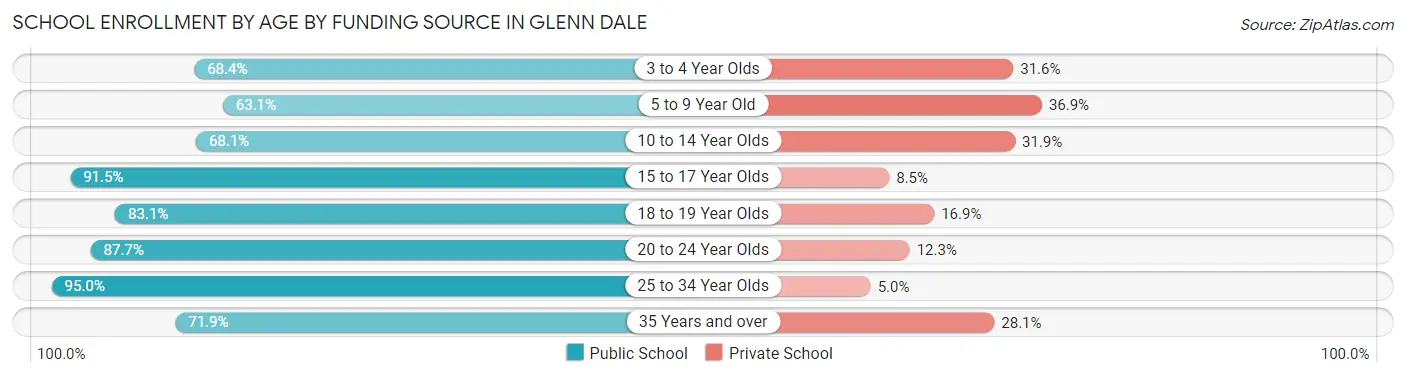
| Age Bracket | Public School | Private School |
| 3 to 4 Year Olds | 171 (68.4%) | 79 (31.6%) |
| 5 to 9 Year Old | 608 (63.1%) | 356 (36.9%) |
| 10 to 14 Year Olds | 738 (68.1%) | 346 (31.9%) |
| 15 to 17 Year Olds | 549 (91.5%) | 51 (8.5%) |
| 18 to 19 Year Olds | 335 (83.1%) | 68 (16.9%) |
| 20 to 24 Year Olds | 378 (87.7%) | 53 (12.3%) |
| 25 to 34 Year Olds | 377 (95.0%) | 20 (5.0%) |
| 35 Years and over | 123 (71.9%) | 48 (28.1%) |
| Total | 3,281 (76.3%) | 1,019 (23.7%) |
Educational Attainment by Field of Study in Glenn Dale
Social sciences (880 | 17.1%), business (751 | 14.6%), science & technology (555 | 10.8%), computers & mathematics (470 | 9.1%), and physical & health sciences (346 | 6.7%) are the most common fields of study among 5,138 individuals in Glenn Dale who have obtained a bachelor's degree or higher.
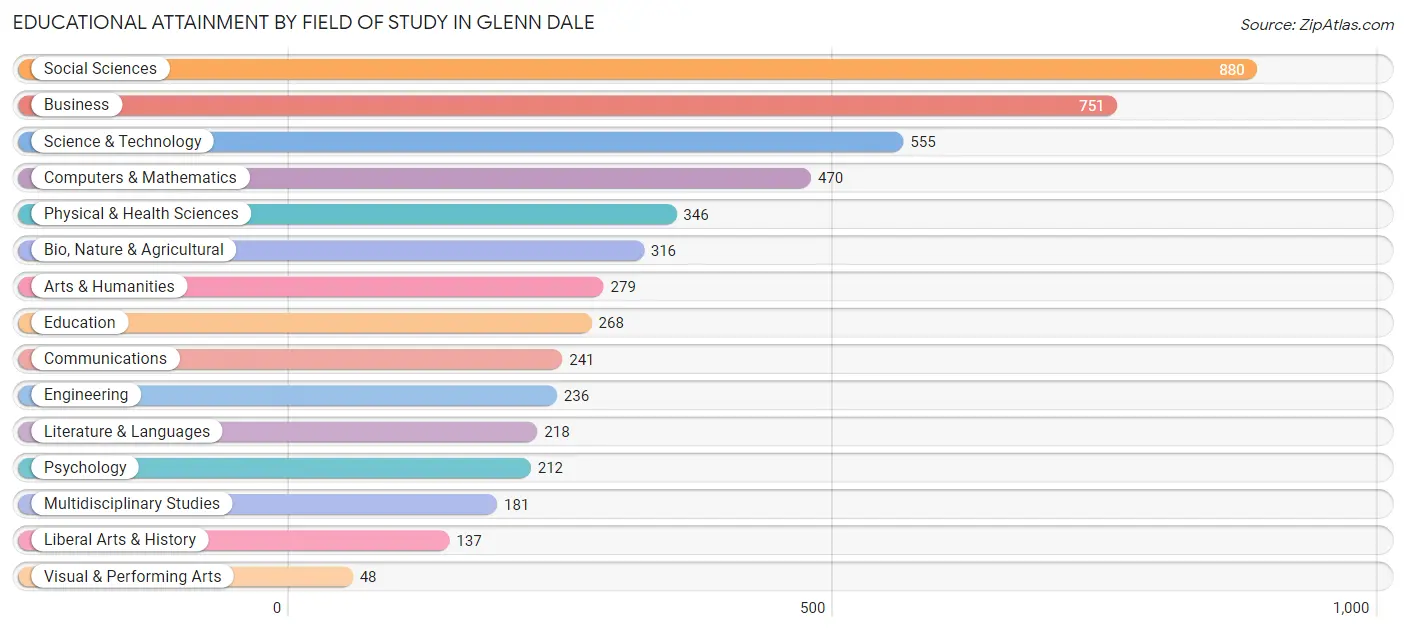
| Field of Study | # Graduates | % Graduates |
| Computers & Mathematics | 470 | 9.1% |
| Bio, Nature & Agricultural | 316 | 6.1% |
| Physical & Health Sciences | 346 | 6.7% |
| Psychology | 212 | 4.1% |
| Social Sciences | 880 | 17.1% |
| Engineering | 236 | 4.6% |
| Multidisciplinary Studies | 181 | 3.5% |
| Science & Technology | 555 | 10.8% |
| Business | 751 | 14.6% |
| Education | 268 | 5.2% |
| Literature & Languages | 218 | 4.2% |
| Liberal Arts & History | 137 | 2.7% |
| Visual & Performing Arts | 48 | 0.9% |
| Communications | 241 | 4.7% |
| Arts & Humanities | 279 | 5.4% |
| Total | 5,138 | 100.0% |
Transportation & Commute in Glenn Dale
Vehicle Availability by Sex in Glenn Dale
The most prevalent vehicle ownership categories in Glenn Dale are males with 2 vehicles (1,278, accounting for 34.0%) and females with 2 vehicles (1,386, making up 33.9%).
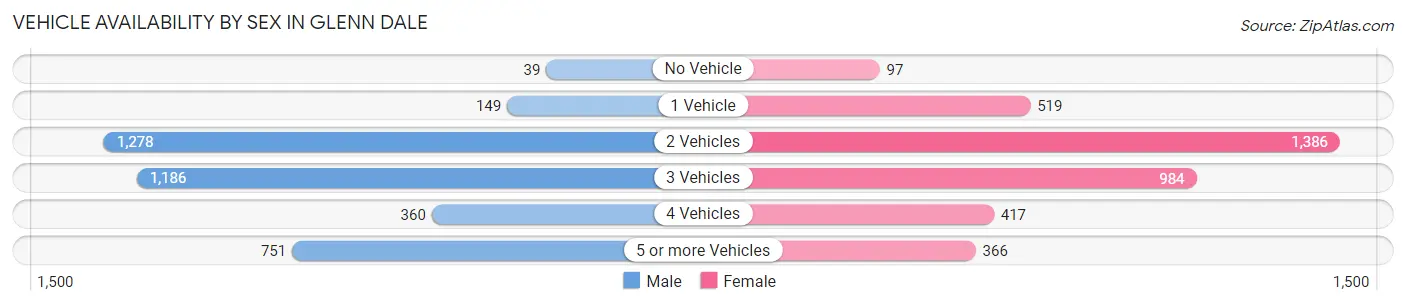
| Vehicles Available | Male | Female |
| No Vehicle | 39 (1.0%) | 97 (2.6%) |
| 1 Vehicle | 149 (4.0%) | 519 (13.8%) |
| 2 Vehicles | 1,278 (34.0%) | 1,386 (36.8%) |
| 3 Vehicles | 1,186 (31.5%) | 984 (26.1%) |
| 4 Vehicles | 360 (9.6%) | 417 (11.1%) |
| 5 or more Vehicles | 751 (20.0%) | 366 (9.7%) |
| Total | 3,763 (100.0%) | 3,769 (100.0%) |
Commute Time in Glenn Dale
The most frequently occuring commute durations in Glenn Dale are 30 to 34 minutes (1,073 commuters, 17.2%), 25 to 29 minutes (814 commuters, 13.0%), and 20 to 24 minutes (813 commuters, 13.0%).
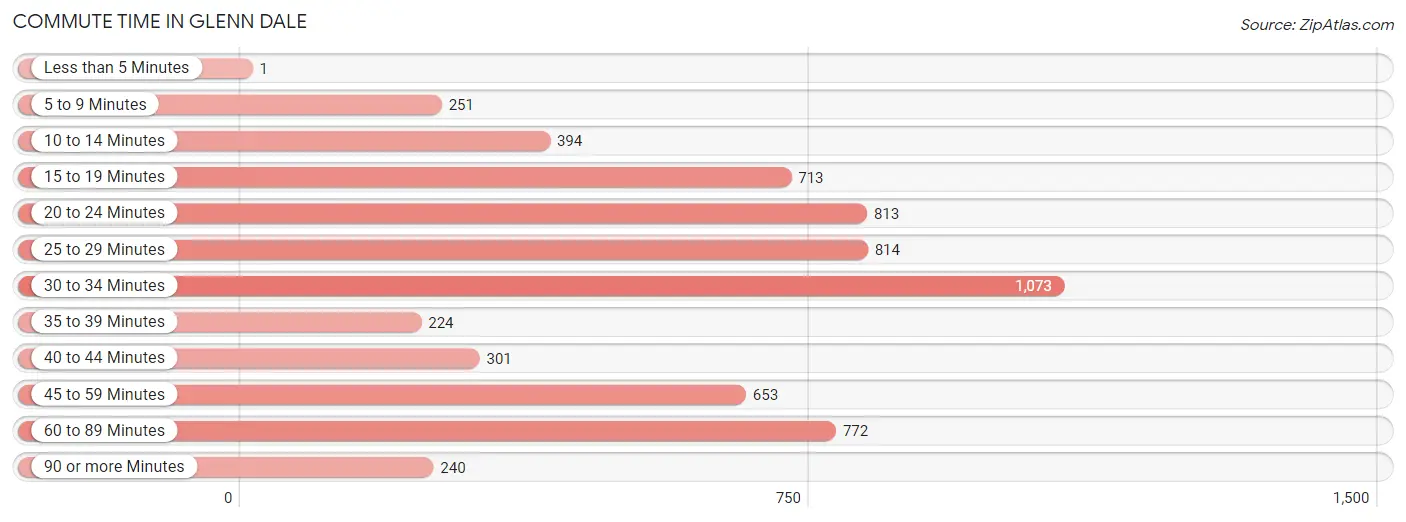
| Commute Time | # Commuters | % Commuters |
| Less than 5 Minutes | 1 | 0.0% |
| 5 to 9 Minutes | 251 | 4.0% |
| 10 to 14 Minutes | 394 | 6.3% |
| 15 to 19 Minutes | 713 | 11.4% |
| 20 to 24 Minutes | 813 | 13.0% |
| 25 to 29 Minutes | 814 | 13.0% |
| 30 to 34 Minutes | 1,073 | 17.2% |
| 35 to 39 Minutes | 224 | 3.6% |
| 40 to 44 Minutes | 301 | 4.8% |
| 45 to 59 Minutes | 653 | 10.4% |
| 60 to 89 Minutes | 772 | 12.3% |
| 90 or more Minutes | 240 | 3.8% |
Commute Time by Sex in Glenn Dale
The most common commute times in Glenn Dale are 30 to 34 minutes (668 commuters, 21.0%) for males and 25 to 29 minutes (516 commuters, 16.8%) for females.
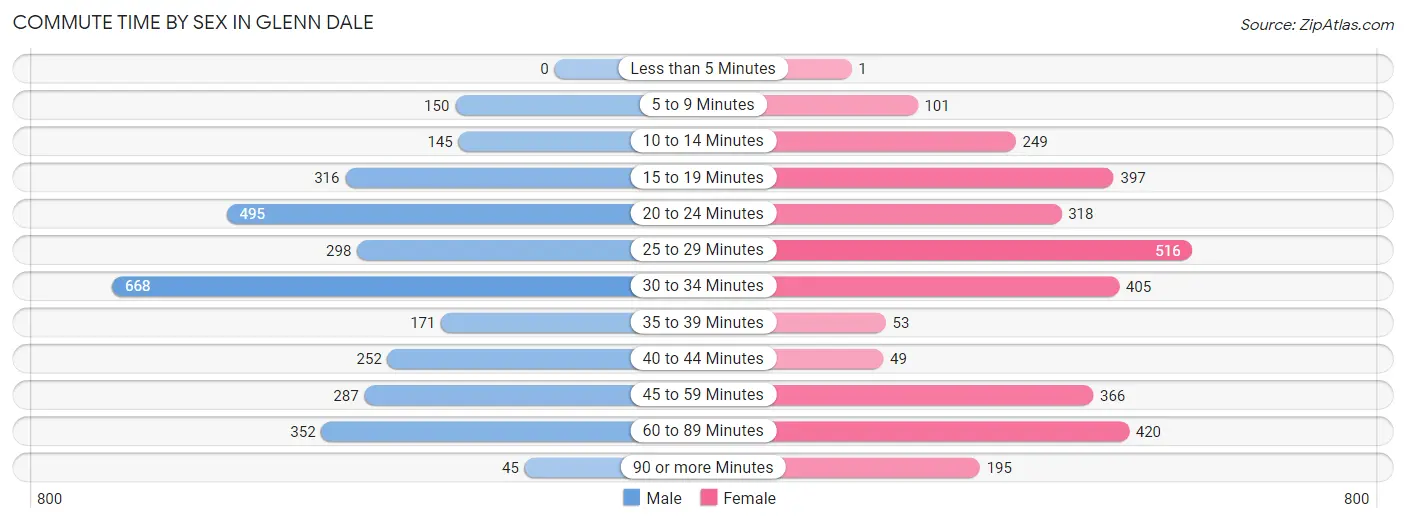
| Commute Time | Male | Female |
| Less than 5 Minutes | 0 (0.0%) | 1 (0.0%) |
| 5 to 9 Minutes | 150 (4.7%) | 101 (3.3%) |
| 10 to 14 Minutes | 145 (4.6%) | 249 (8.1%) |
| 15 to 19 Minutes | 316 (9.9%) | 397 (12.9%) |
| 20 to 24 Minutes | 495 (15.6%) | 318 (10.4%) |
| 25 to 29 Minutes | 298 (9.4%) | 516 (16.8%) |
| 30 to 34 Minutes | 668 (21.0%) | 405 (13.2%) |
| 35 to 39 Minutes | 171 (5.4%) | 53 (1.7%) |
| 40 to 44 Minutes | 252 (7.9%) | 49 (1.6%) |
| 45 to 59 Minutes | 287 (9.0%) | 366 (11.9%) |
| 60 to 89 Minutes | 352 (11.1%) | 420 (13.7%) |
| 90 or more Minutes | 45 (1.4%) | 195 (6.4%) |
Time of Departure to Work by Sex in Glenn Dale
The most frequent times of departure to work in Glenn Dale are 12:00 PM to 3:59 PM (388, 12.2%) for males and 7:00 AM to 7:29 AM (544, 17.7%) for females.
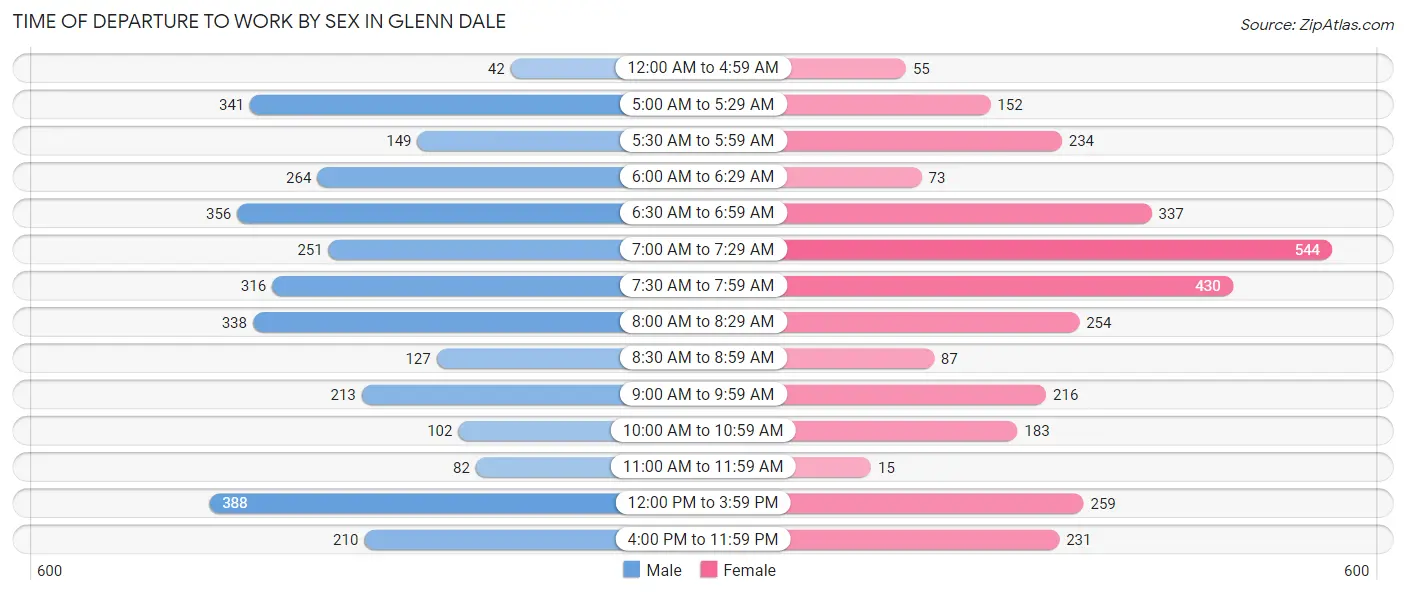
| Time of Departure | Male | Female |
| 12:00 AM to 4:59 AM | 42 (1.3%) | 55 (1.8%) |
| 5:00 AM to 5:29 AM | 341 (10.7%) | 152 (5.0%) |
| 5:30 AM to 5:59 AM | 149 (4.7%) | 234 (7.6%) |
| 6:00 AM to 6:29 AM | 264 (8.3%) | 73 (2.4%) |
| 6:30 AM to 6:59 AM | 356 (11.2%) | 337 (11.0%) |
| 7:00 AM to 7:29 AM | 251 (7.9%) | 544 (17.7%) |
| 7:30 AM to 7:59 AM | 316 (9.9%) | 430 (14.0%) |
| 8:00 AM to 8:29 AM | 338 (10.6%) | 254 (8.3%) |
| 8:30 AM to 8:59 AM | 127 (4.0%) | 87 (2.8%) |
| 9:00 AM to 9:59 AM | 213 (6.7%) | 216 (7.0%) |
| 10:00 AM to 10:59 AM | 102 (3.2%) | 183 (6.0%) |
| 11:00 AM to 11:59 AM | 82 (2.6%) | 15 (0.5%) |
| 12:00 PM to 3:59 PM | 388 (12.2%) | 259 (8.4%) |
| 4:00 PM to 11:59 PM | 210 (6.6%) | 231 (7.5%) |
| Total | 3,179 (100.0%) | 3,070 (100.0%) |
Housing Occupancy in Glenn Dale
Occupancy by Ownership in Glenn Dale
Of the total 4,672 dwellings in Glenn Dale, owner-occupied units account for 4,178 (89.4%), while renter-occupied units make up 494 (10.6%).
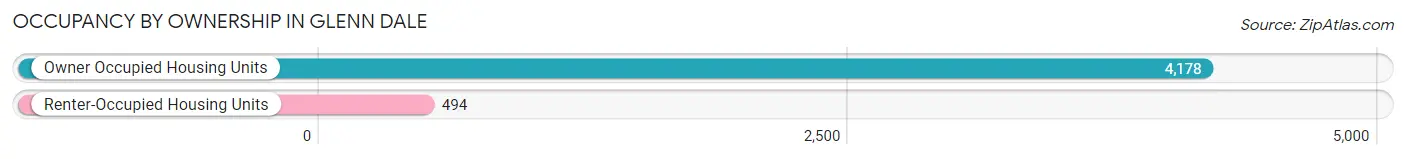
| Occupancy | # Housing Units | % Housing Units |
| Owner Occupied Housing Units | 4,178 | 89.4% |
| Renter-Occupied Housing Units | 494 | 10.6% |
| Total Occupied Housing Units | 4,672 | 100.0% |
Occupancy by Household Size in Glenn Dale
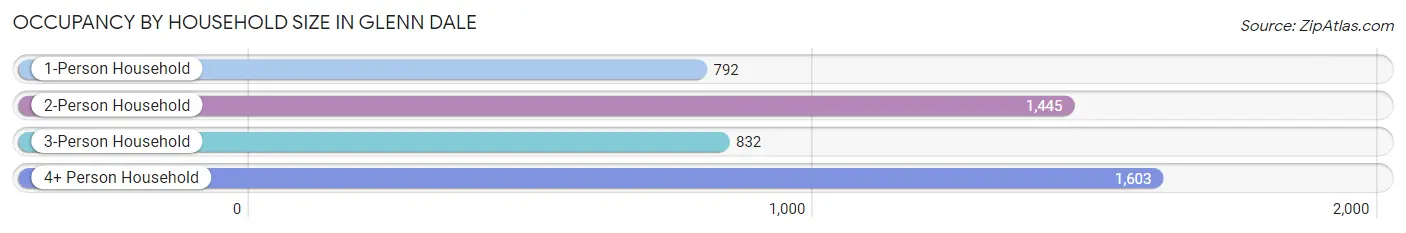
| Household Size | # Housing Units | % Housing Units |
| 1-Person Household | 792 | 17.0% |
| 2-Person Household | 1,445 | 30.9% |
| 3-Person Household | 832 | 17.8% |
| 4+ Person Household | 1,603 | 34.3% |
| Total Housing Units | 4,672 | 100.0% |
Occupancy by Ownership by Household Size in Glenn Dale
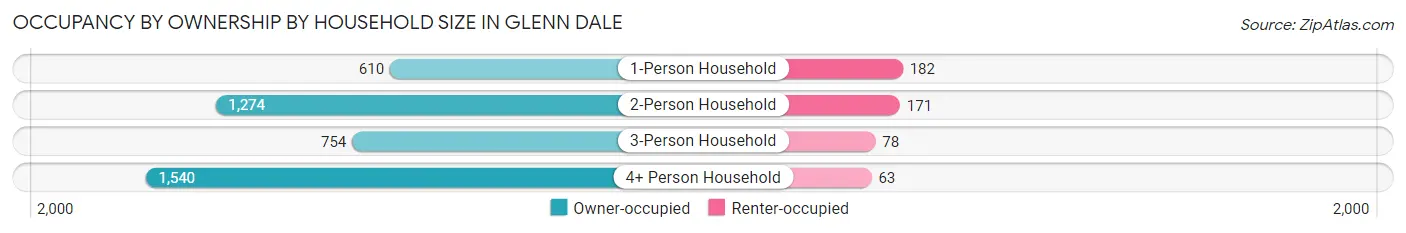
| Household Size | Owner-occupied | Renter-occupied |
| 1-Person Household | 610 (77.0%) | 182 (23.0%) |
| 2-Person Household | 1,274 (88.2%) | 171 (11.8%) |
| 3-Person Household | 754 (90.6%) | 78 (9.4%) |
| 4+ Person Household | 1,540 (96.1%) | 63 (3.9%) |
| Total Housing Units | 4,178 (89.4%) | 494 (10.6%) |
Occupancy by Educational Attainment in Glenn Dale
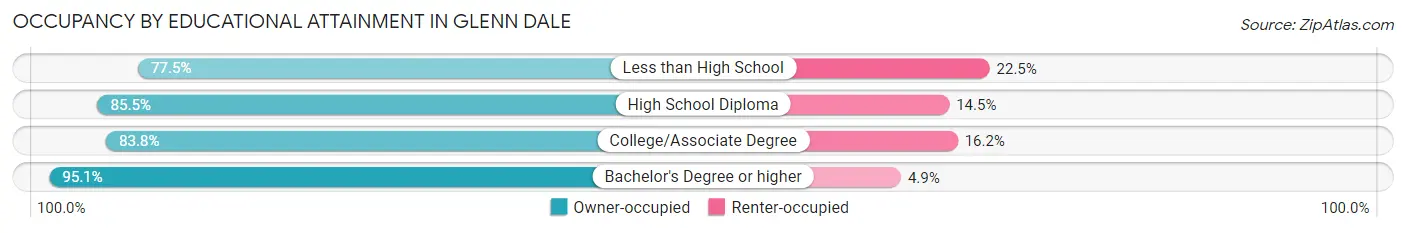
| Household Size | Owner-occupied | Renter-occupied |
| Less than High School | 293 (77.5%) | 85 (22.5%) |
| High School Diploma | 649 (85.5%) | 110 (14.5%) |
| College/Associate Degree | 934 (83.8%) | 180 (16.2%) |
| Bachelor's Degree or higher | 2,302 (95.1%) | 119 (4.9%) |
Occupancy by Age of Householder in Glenn Dale
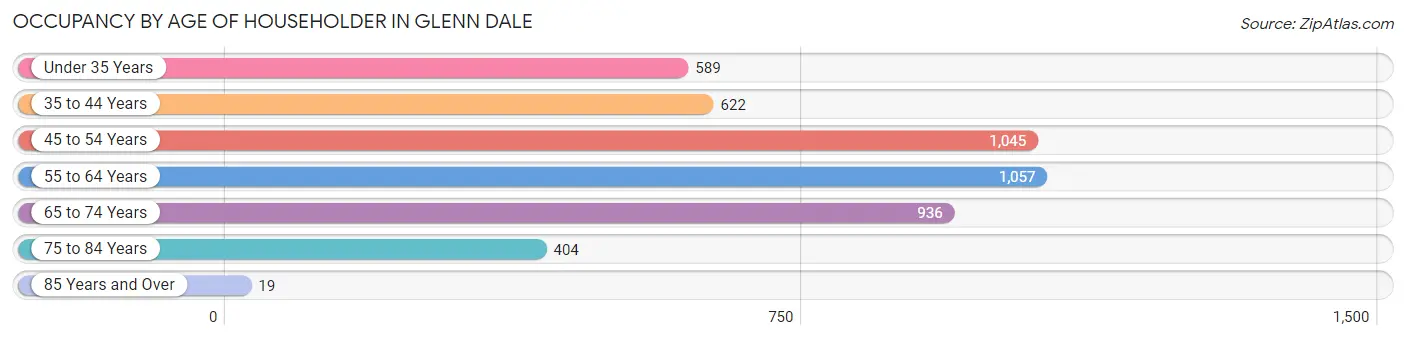
| Age Bracket | # Households | % Households |
| Under 35 Years | 589 | 12.6% |
| 35 to 44 Years | 622 | 13.3% |
| 45 to 54 Years | 1,045 | 22.4% |
| 55 to 64 Years | 1,057 | 22.6% |
| 65 to 74 Years | 936 | 20.0% |
| 75 to 84 Years | 404 | 8.6% |
| 85 Years and Over | 19 | 0.4% |
| Total | 4,672 | 100.0% |
Housing Finances in Glenn Dale
Median Income by Occupancy in Glenn Dale
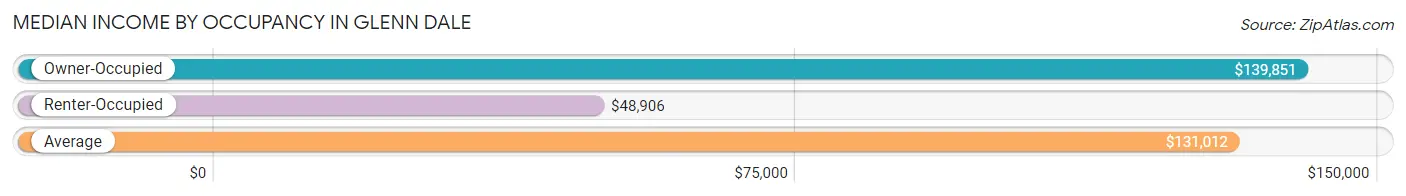
| Occupancy Type | # Households | Median Income |
| Owner-Occupied | 4,178 (89.4%) | $139,851 |
| Renter-Occupied | 494 (10.6%) | $48,906 |
| Average | 4,672 (100.0%) | $131,012 |
Occupancy by Householder Income Bracket in Glenn Dale
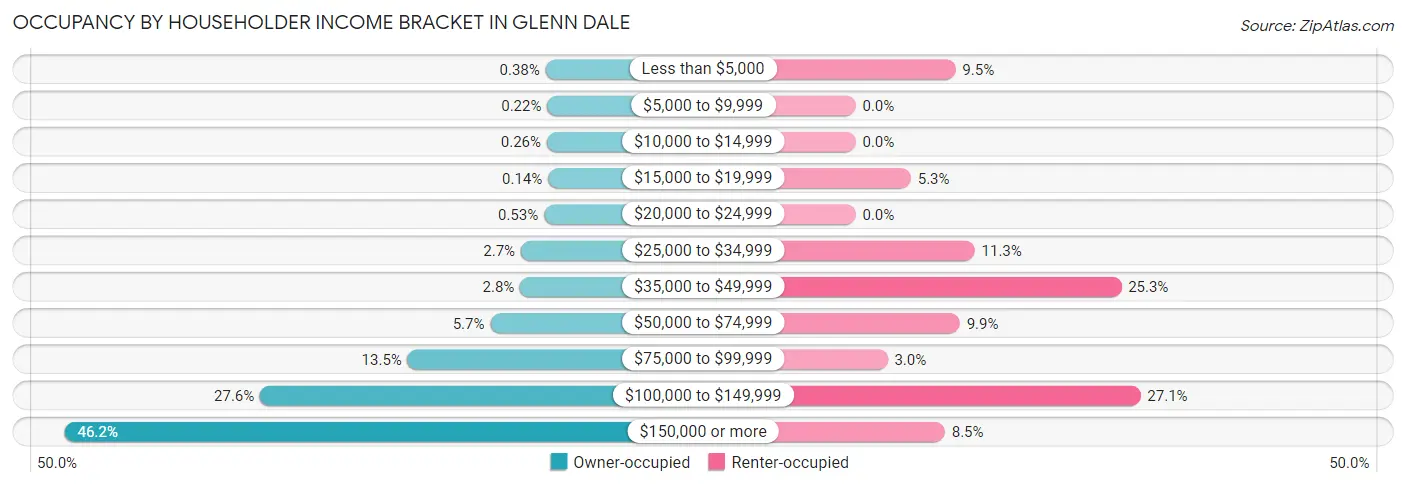
| Income Bracket | Owner-occupied | Renter-occupied |
| Less than $5,000 | 16 (0.4%) | 47 (9.5%) |
| $5,000 to $9,999 | 9 (0.2%) | 0 (0.0%) |
| $10,000 to $14,999 | 11 (0.3%) | 0 (0.0%) |
| $15,000 to $19,999 | 6 (0.1%) | 26 (5.3%) |
| $20,000 to $24,999 | 22 (0.5%) | 0 (0.0%) |
| $25,000 to $34,999 | 114 (2.7%) | 56 (11.3%) |
| $35,000 to $49,999 | 117 (2.8%) | 125 (25.3%) |
| $50,000 to $74,999 | 236 (5.7%) | 49 (9.9%) |
| $75,000 to $99,999 | 565 (13.5%) | 15 (3.0%) |
| $100,000 to $149,999 | 1,152 (27.6%) | 134 (27.1%) |
| $150,000 or more | 1,930 (46.2%) | 42 (8.5%) |
| Total | 4,178 (100.0%) | 494 (100.0%) |
Monthly Housing Cost Tiers in Glenn Dale
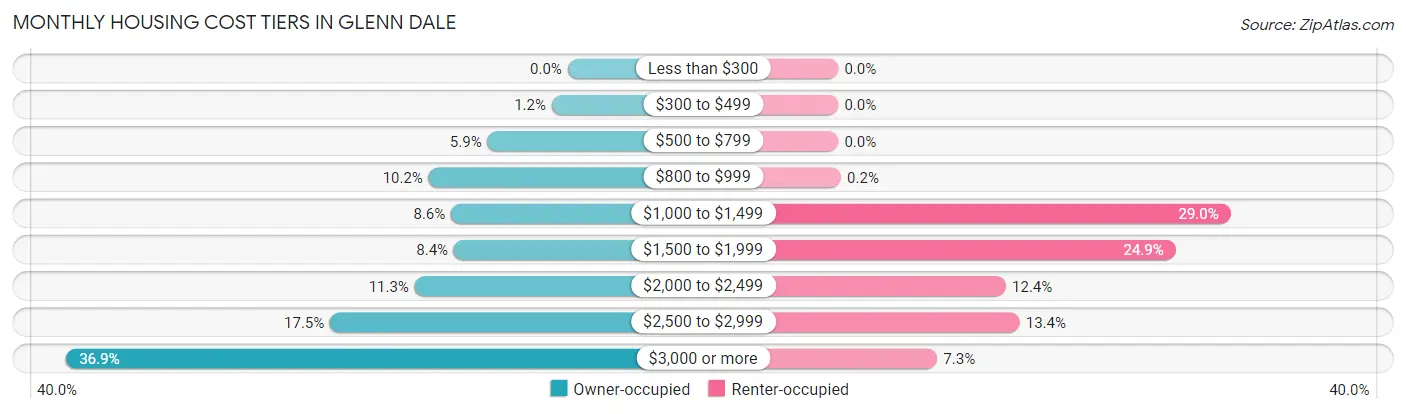
| Monthly Cost | Owner-occupied | Renter-occupied |
| Less than $300 | 0 (0.0%) | 0 (0.0%) |
| $300 to $499 | 49 (1.2%) | 0 (0.0%) |
| $500 to $799 | 247 (5.9%) | 0 (0.0%) |
| $800 to $999 | 428 (10.2%) | 1 (0.2%) |
| $1,000 to $1,499 | 359 (8.6%) | 143 (28.9%) |
| $1,500 to $1,999 | 350 (8.4%) | 123 (24.9%) |
| $2,000 to $2,499 | 471 (11.3%) | 61 (12.3%) |
| $2,500 to $2,999 | 731 (17.5%) | 66 (13.4%) |
| $3,000 or more | 1,543 (36.9%) | 36 (7.3%) |
| Total | 4,178 (100.0%) | 494 (100.0%) |
Physical Housing Characteristics in Glenn Dale
Housing Structures in Glenn Dale
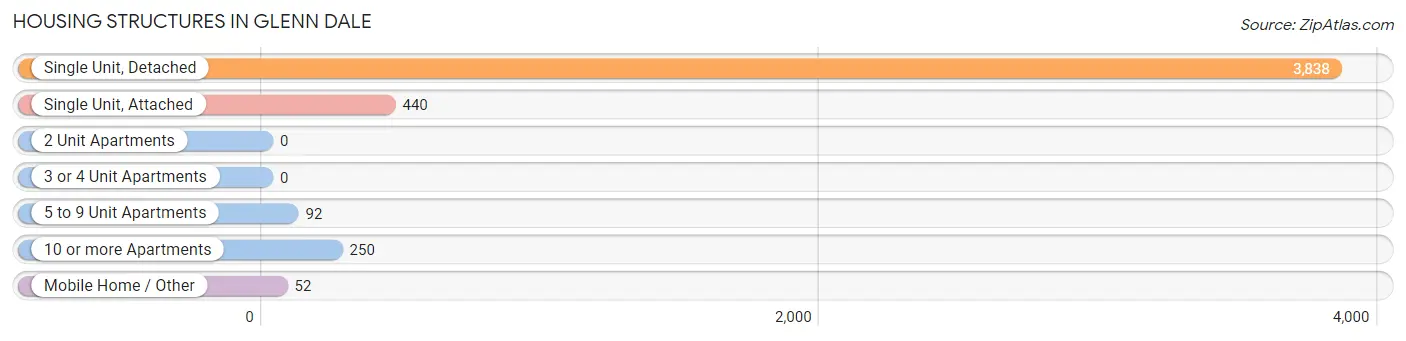
| Structure Type | # Housing Units | % Housing Units |
| Single Unit, Detached | 3,838 | 82.2% |
| Single Unit, Attached | 440 | 9.4% |
| 2 Unit Apartments | 0 | 0.0% |
| 3 or 4 Unit Apartments | 0 | 0.0% |
| 5 to 9 Unit Apartments | 92 | 2.0% |
| 10 or more Apartments | 250 | 5.3% |
| Mobile Home / Other | 52 | 1.1% |
| Total | 4,672 | 100.0% |
Housing Structures by Occupancy in Glenn Dale
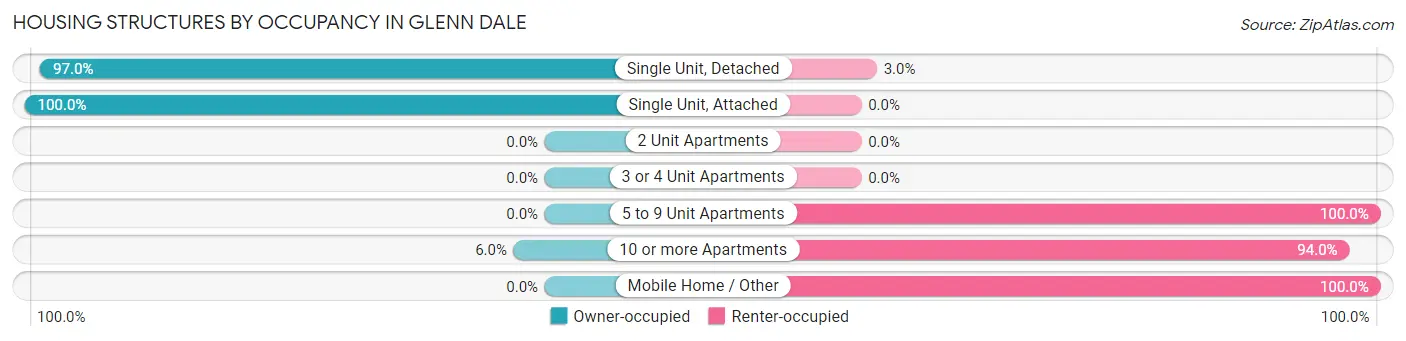
| Structure Type | Owner-occupied | Renter-occupied |
| Single Unit, Detached | 3,723 (97.0%) | 115 (3.0%) |
| Single Unit, Attached | 440 (100.0%) | 0 (0.0%) |
| 2 Unit Apartments | 0 (0.0%) | 0 (0.0%) |
| 3 or 4 Unit Apartments | 0 (0.0%) | 0 (0.0%) |
| 5 to 9 Unit Apartments | 0 (0.0%) | 92 (100.0%) |
| 10 or more Apartments | 15 (6.0%) | 235 (94.0%) |
| Mobile Home / Other | 0 (0.0%) | 52 (100.0%) |
| Total | 4,178 (89.4%) | 494 (10.6%) |
Housing Structures by Number of Rooms in Glenn Dale
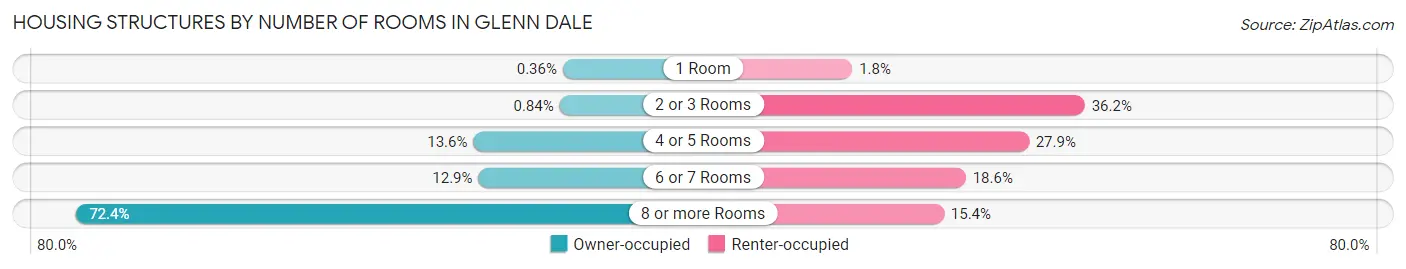
| Number of Rooms | Owner-occupied | Renter-occupied |
| 1 Room | 15 (0.4%) | 9 (1.8%) |
| 2 or 3 Rooms | 35 (0.8%) | 179 (36.2%) |
| 4 or 5 Rooms | 568 (13.6%) | 138 (27.9%) |
| 6 or 7 Rooms | 537 (12.9%) | 92 (18.6%) |
| 8 or more Rooms | 3,023 (72.4%) | 76 (15.4%) |
| Total | 4,178 (100.0%) | 494 (100.0%) |
Housing Structure by Heating Type in Glenn Dale
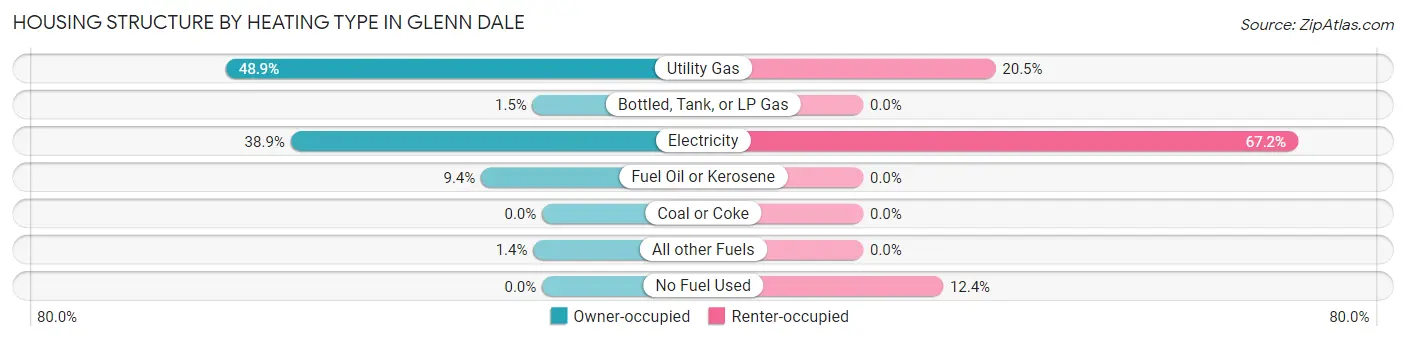
| Heating Type | Owner-occupied | Renter-occupied |
| Utility Gas | 2,042 (48.9%) | 101 (20.4%) |
| Bottled, Tank, or LP Gas | 61 (1.5%) | 0 (0.0%) |
| Electricity | 1,624 (38.9%) | 332 (67.2%) |
| Fuel Oil or Kerosene | 394 (9.4%) | 0 (0.0%) |
| Coal or Coke | 0 (0.0%) | 0 (0.0%) |
| All other Fuels | 57 (1.4%) | 0 (0.0%) |
| No Fuel Used | 0 (0.0%) | 61 (12.3%) |
| Total | 4,178 (100.0%) | 494 (100.0%) |
Household Vehicle Usage in Glenn Dale
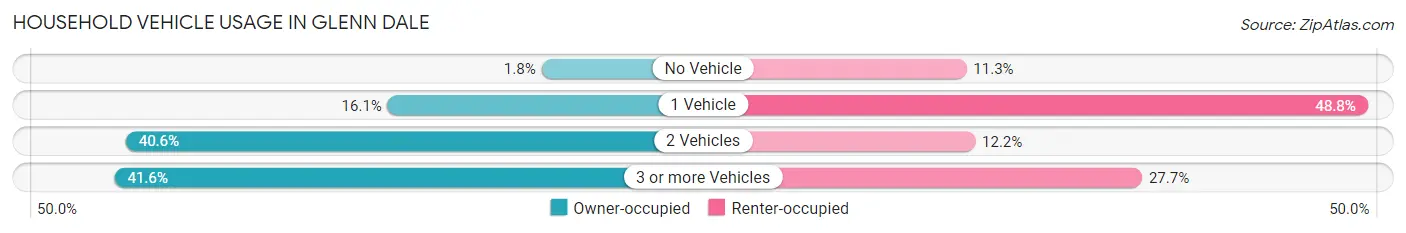
| Vehicles per Household | Owner-occupied | Renter-occupied |
| No Vehicle | 73 (1.8%) | 56 (11.3%) |
| 1 Vehicle | 673 (16.1%) | 241 (48.8%) |
| 2 Vehicles | 1,694 (40.6%) | 60 (12.1%) |
| 3 or more Vehicles | 1,738 (41.6%) | 137 (27.7%) |
| Total | 4,178 (100.0%) | 494 (100.0%) |
Real Estate & Mortgages in Glenn Dale
Real Estate and Mortgage Overview in Glenn Dale
| Characteristic | Without Mortgage | With Mortgage |
| Housing Units | 995 | 3,183 |
| Median Property Value | $480,900 | $499,000 |
| Median Household Income | $108,623 | $1,657 |
| Monthly Housing Costs | $919 | $1,543 |
| Real Estate Taxes | $5,738 | $12 |
Property Value by Mortgage Status in Glenn Dale
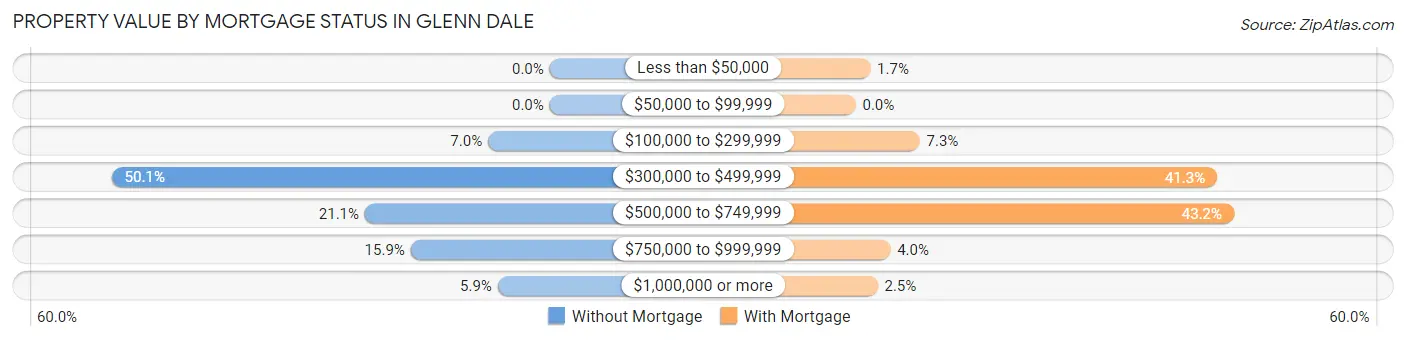
| Property Value | Without Mortgage | With Mortgage |
| Less than $50,000 | 0 (0.0%) | 53 (1.7%) |
| $50,000 to $99,999 | 0 (0.0%) | 0 (0.0%) |
| $100,000 to $299,999 | 70 (7.0%) | 233 (7.3%) |
| $300,000 to $499,999 | 498 (50.0%) | 1,315 (41.3%) |
| $500,000 to $749,999 | 210 (21.1%) | 1,376 (43.2%) |
| $750,000 to $999,999 | 158 (15.9%) | 126 (4.0%) |
| $1,000,000 or more | 59 (5.9%) | 80 (2.5%) |
| Total | 995 (100.0%) | 3,183 (100.0%) |
Household Income by Mortgage Status in Glenn Dale
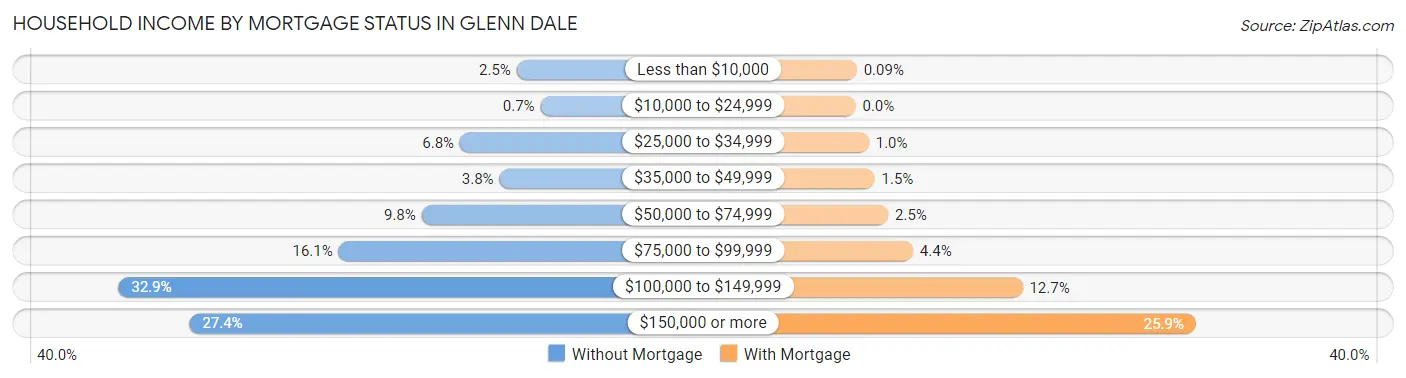
| Household Income | Without Mortgage | With Mortgage |
| Less than $10,000 | 25 (2.5%) | 3 (0.1%) |
| $10,000 to $24,999 | 7 (0.7%) | 0 (0.0%) |
| $25,000 to $34,999 | 68 (6.8%) | 32 (1.0%) |
| $35,000 to $49,999 | 38 (3.8%) | 46 (1.5%) |
| $50,000 to $74,999 | 97 (9.8%) | 79 (2.5%) |
| $75,000 to $99,999 | 160 (16.1%) | 139 (4.4%) |
| $100,000 to $149,999 | 327 (32.9%) | 405 (12.7%) |
| $150,000 or more | 273 (27.4%) | 825 (25.9%) |
| Total | 995 (100.0%) | 3,183 (100.0%) |
Property Value to Household Income Ratio in Glenn Dale
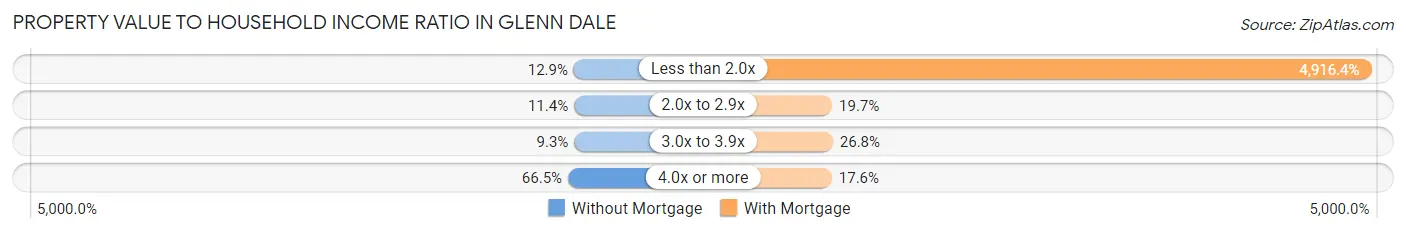
| Value-to-Income Ratio | Without Mortgage | With Mortgage |
| Less than 2.0x | 128 (12.9%) | 156,488 (4,916.4%) |
| 2.0x to 2.9x | 113 (11.4%) | 628 (19.7%) |
| 3.0x to 3.9x | 92 (9.2%) | 852 (26.8%) |
| 4.0x or more | 662 (66.5%) | 559 (17.6%) |
| Total | 995 (100.0%) | 3,183 (100.0%) |
Real Estate Taxes by Mortgage Status in Glenn Dale
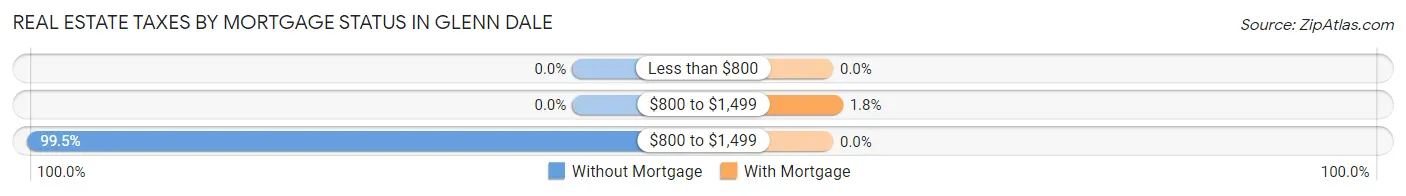
| Property Taxes | Without Mortgage | With Mortgage |
| Less than $800 | 0 (0.0%) | 0 (0.0%) |
| $800 to $1,499 | 0 (0.0%) | 56 (1.8%) |
| $800 to $1,499 | 990 (99.5%) | 0 (0.0%) |
| Total | 995 (100.0%) | 3,183 (100.0%) |
Health & Disability in Glenn Dale
Health Insurance Coverage by Age in Glenn Dale
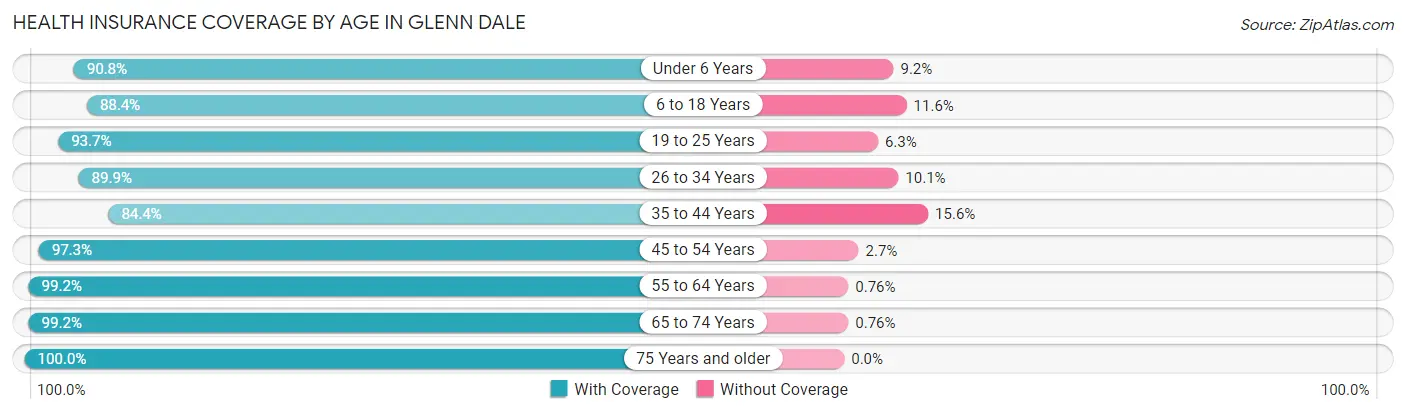
| Age Bracket | With Coverage | Without Coverage |
| Under 6 Years | 1,049 (90.8%) | 106 (9.2%) |
| 6 to 18 Years | 2,469 (88.4%) | 325 (11.6%) |
| 19 to 25 Years | 1,208 (93.7%) | 81 (6.3%) |
| 26 to 34 Years | 1,523 (89.9%) | 171 (10.1%) |
| 35 to 44 Years | 1,397 (84.4%) | 259 (15.6%) |
| 45 to 54 Years | 2,014 (97.3%) | 55 (2.7%) |
| 55 to 64 Years | 1,964 (99.2%) | 15 (0.8%) |
| 65 to 74 Years | 1,694 (99.2%) | 13 (0.8%) |
| 75 Years and older | 867 (100.0%) | 0 (0.0%) |
| Total | 14,185 (93.3%) | 1,025 (6.7%) |
Health Insurance Coverage by Citizenship Status in Glenn Dale
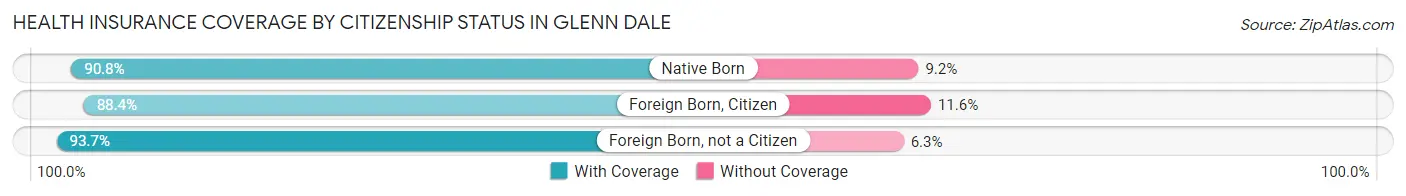
| Citizenship Status | With Coverage | Without Coverage |
| Native Born | 1,049 (90.8%) | 106 (9.2%) |
| Foreign Born, Citizen | 2,469 (88.4%) | 325 (11.6%) |
| Foreign Born, not a Citizen | 1,208 (93.7%) | 81 (6.3%) |
Health Insurance Coverage by Household Income in Glenn Dale
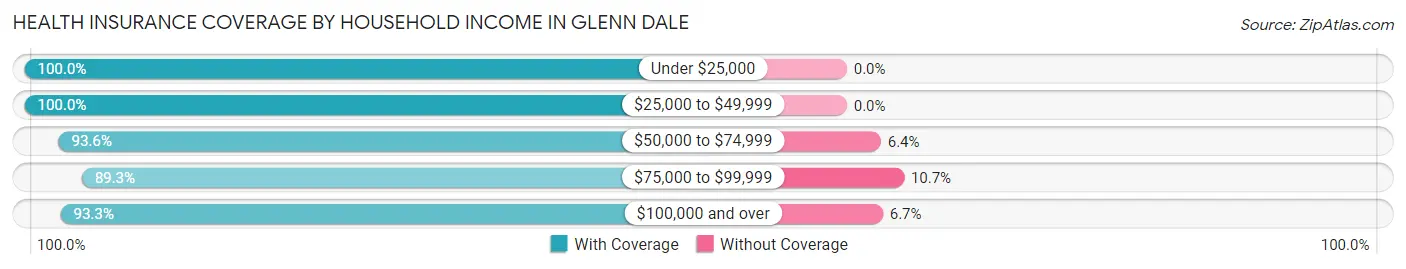
| Household Income | With Coverage | Without Coverage |
| Under $25,000 | 183 (100.0%) | 0 (0.0%) |
| $25,000 to $49,999 | 898 (100.0%) | 0 (0.0%) |
| $50,000 to $74,999 | 661 (93.6%) | 45 (6.4%) |
| $75,000 to $99,999 | 1,734 (89.3%) | 208 (10.7%) |
| $100,000 and over | 10,685 (93.3%) | 772 (6.7%) |
Public vs Private Health Insurance Coverage by Age in Glenn Dale
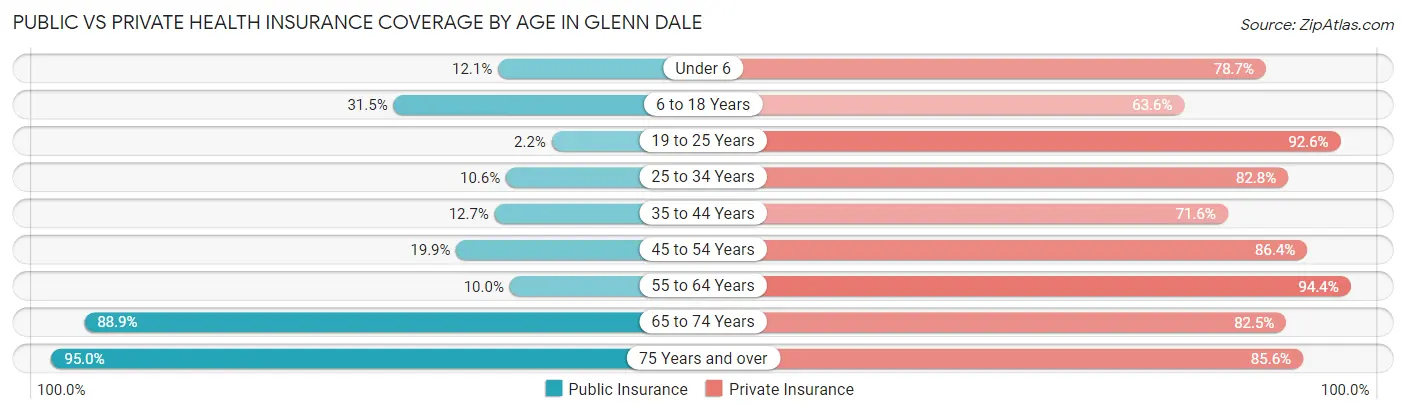
| Age Bracket | Public Insurance | Private Insurance |
| Under 6 | 140 (12.1%) | 909 (78.7%) |
| 6 to 18 Years | 881 (31.5%) | 1,776 (63.6%) |
| 19 to 25 Years | 28 (2.2%) | 1,193 (92.5%) |
| 25 to 34 Years | 180 (10.6%) | 1,403 (82.8%) |
| 35 to 44 Years | 211 (12.7%) | 1,186 (71.6%) |
| 45 to 54 Years | 411 (19.9%) | 1,787 (86.4%) |
| 55 to 64 Years | 197 (10.0%) | 1,869 (94.4%) |
| 65 to 74 Years | 1,518 (88.9%) | 1,408 (82.5%) |
| 75 Years and over | 824 (95.0%) | 742 (85.6%) |
| Total | 4,390 (28.9%) | 12,273 (80.7%) |
Disability Status by Sex by Age in Glenn Dale
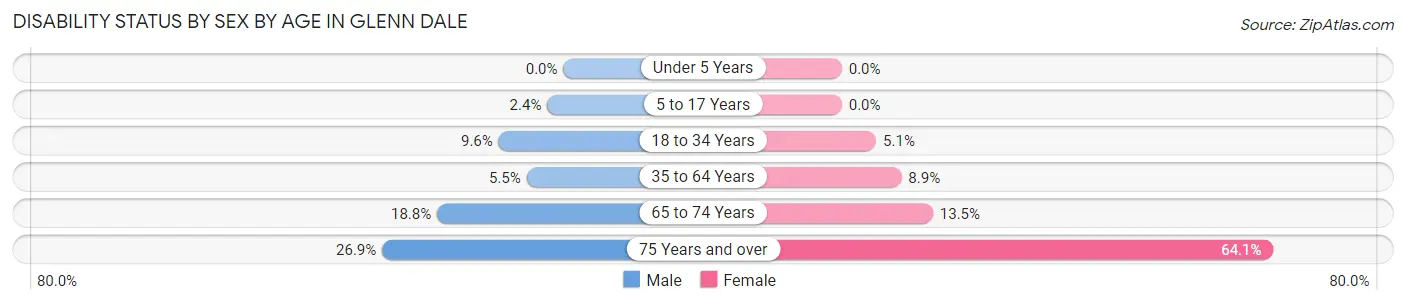
| Age Bracket | Male | Female |
| Under 5 Years | 0 (0.0%) | 0 (0.0%) |
| 5 to 17 Years | 41 (2.4%) | 0 (0.0%) |
| 18 to 34 Years | 158 (9.6%) | 76 (5.1%) |
| 35 to 64 Years | 142 (5.4%) | 274 (8.8%) |
| 65 to 74 Years | 162 (18.8%) | 114 (13.5%) |
| 75 Years and over | 88 (26.9%) | 346 (64.1%) |
Disability Class by Sex by Age in Glenn Dale
Disability Class: Hearing Difficulty
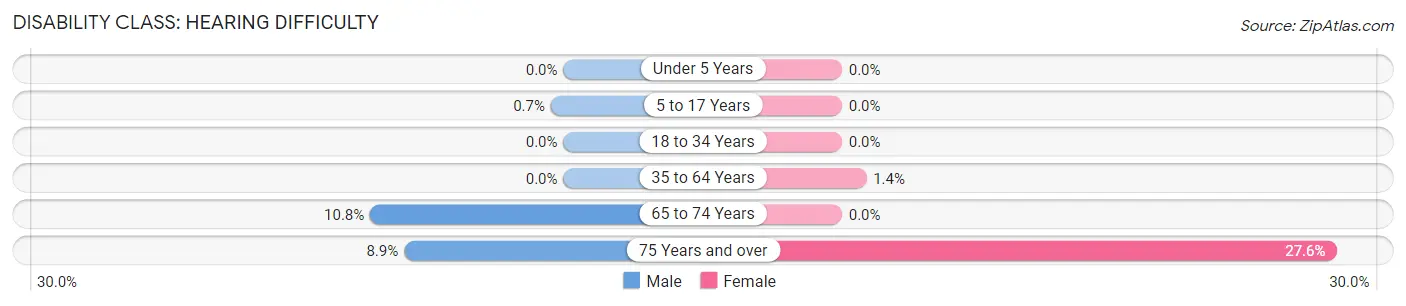
| Age Bracket | Male | Female |
| Under 5 Years | 0 (0.0%) | 0 (0.0%) |
| 5 to 17 Years | 12 (0.7%) | 0 (0.0%) |
| 18 to 34 Years | 0 (0.0%) | 0 (0.0%) |
| 35 to 64 Years | 0 (0.0%) | 42 (1.4%) |
| 65 to 74 Years | 93 (10.8%) | 0 (0.0%) |
| 75 Years and over | 29 (8.9%) | 149 (27.6%) |
Disability Class: Vision Difficulty
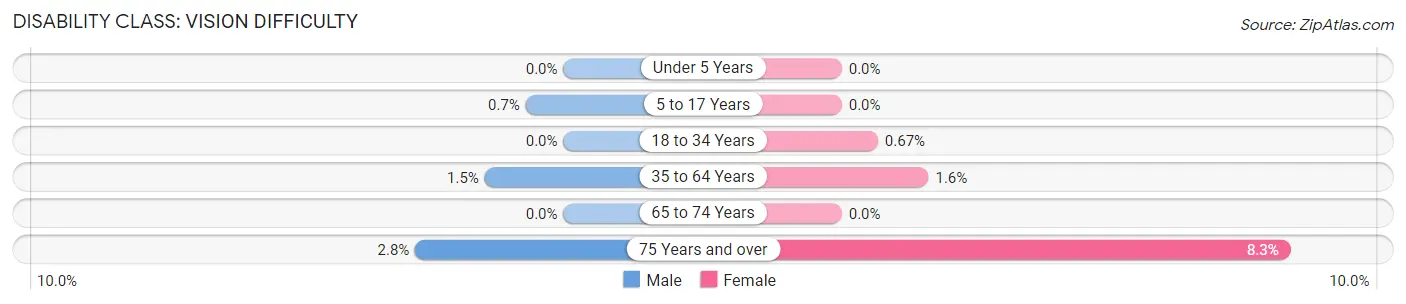
| Age Bracket | Male | Female |
| Under 5 Years | 0 (0.0%) | 0 (0.0%) |
| 5 to 17 Years | 12 (0.7%) | 0 (0.0%) |
| 18 to 34 Years | 0 (0.0%) | 10 (0.7%) |
| 35 to 64 Years | 38 (1.5%) | 50 (1.6%) |
| 65 to 74 Years | 0 (0.0%) | 0 (0.0%) |
| 75 Years and over | 9 (2.8%) | 45 (8.3%) |
Disability Class: Cognitive Difficulty
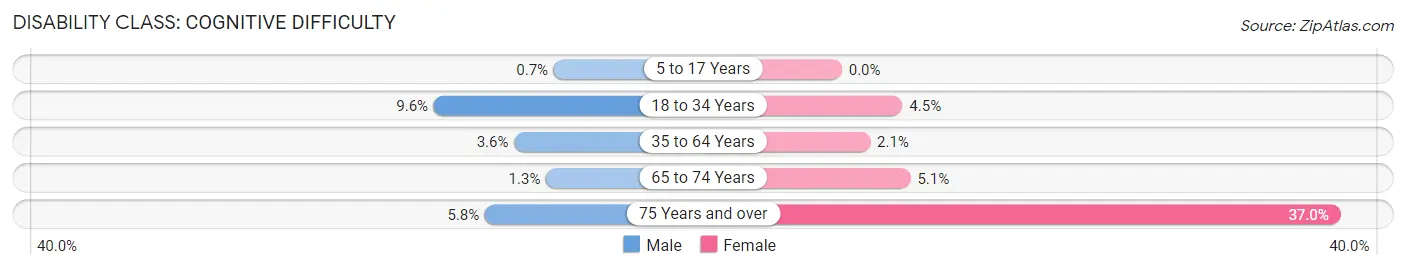
| Age Bracket | Male | Female |
| 5 to 17 Years | 12 (0.7%) | 0 (0.0%) |
| 18 to 34 Years | 158 (9.6%) | 67 (4.5%) |
| 35 to 64 Years | 95 (3.6%) | 65 (2.1%) |
| 65 to 74 Years | 11 (1.3%) | 43 (5.1%) |
| 75 Years and over | 19 (5.8%) | 200 (37.0%) |
Disability Class: Ambulatory Difficulty
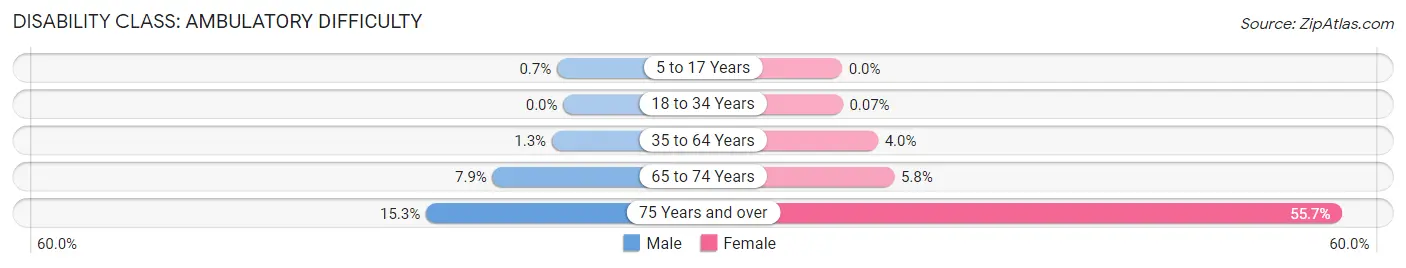
| Age Bracket | Male | Female |
| 5 to 17 Years | 12 (0.7%) | 0 (0.0%) |
| 18 to 34 Years | 0 (0.0%) | 1 (0.1%) |
| 35 to 64 Years | 33 (1.3%) | 124 (4.0%) |
| 65 to 74 Years | 68 (7.9%) | 49 (5.8%) |
| 75 Years and over | 50 (15.3%) | 301 (55.7%) |
Disability Class: Self-Care Difficulty
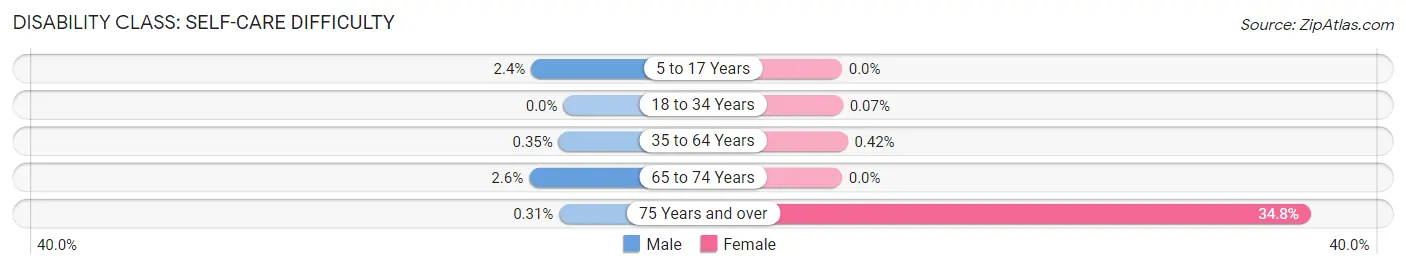
| Age Bracket | Male | Female |
| 5 to 17 Years | 41 (2.4%) | 0 (0.0%) |
| 18 to 34 Years | 0 (0.0%) | 1 (0.1%) |
| 35 to 64 Years | 9 (0.4%) | 13 (0.4%) |
| 65 to 74 Years | 22 (2.5%) | 0 (0.0%) |
| 75 Years and over | 1 (0.3%) | 188 (34.8%) |
Technology Access in Glenn Dale
Computing Device Access in Glenn Dale
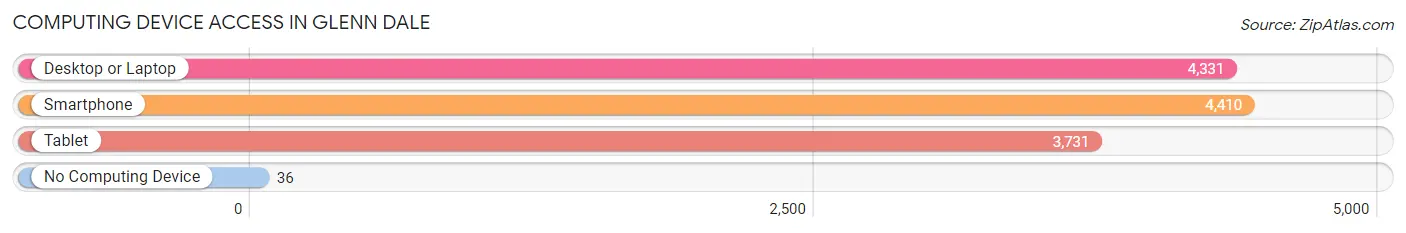
| Device Type | # Households | % Households |
| Desktop or Laptop | 4,331 | 92.7% |
| Smartphone | 4,410 | 94.4% |
| Tablet | 3,731 | 79.9% |
| No Computing Device | 36 | 0.8% |
| Total | 4,672 | 100.0% |
Internet Access in Glenn Dale
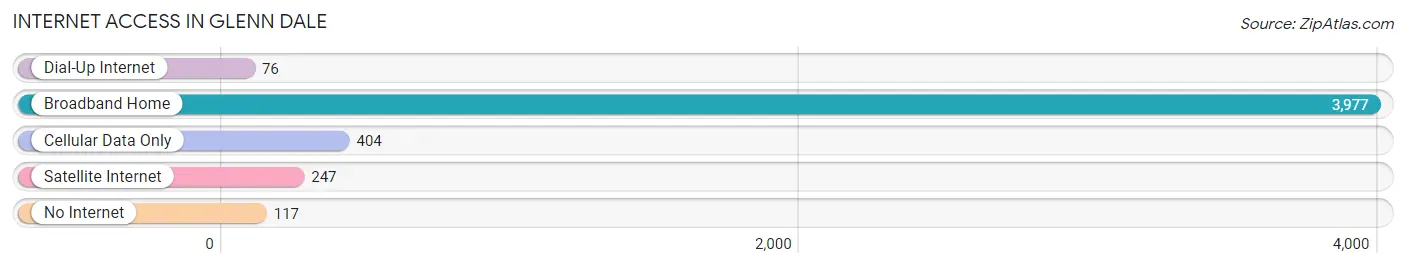
| Internet Type | # Households | % Households |
| Dial-Up Internet | 76 | 1.6% |
| Broadband Home | 3,977 | 85.1% |
| Cellular Data Only | 404 | 8.6% |
| Satellite Internet | 247 | 5.3% |
| No Internet | 117 | 2.5% |
| Total | 4,672 | 100.0% |
Glenn Dale Summary
Glenn Dale is an unincorporated community located in Prince George’s County, Maryland, United States. It is located approximately 15 miles northeast of Washington, D.C. and is part of the Washington metropolitan area. The community is bordered by Bowie to the north, Lanham to the east, and Mitchellville to the south.
History
Glenn Dale was founded in 1873 by William Glenn, a former slave who purchased the land from the estate of John Bowie. Glenn named the community after himself and his wife, Mary Dale. The community was originally a farming community, with tobacco, corn, and wheat being the main crops. In the early 1900s, the Glenn Dale area began to develop as a residential community. The Glenn Dale Golf Club was established in 1922, and the Glenn Dale Hospital was built in 1934. The hospital was used to treat tuberculosis patients until it closed in 1981.
Geography
Glenn Dale is located in Prince George’s County, Maryland, approximately 15 miles northeast of Washington, D.C. The community is bordered by Bowie to the north, Lanham to the east, and Mitchellville to the south. The total area of Glenn Dale is 4.3 square miles, with a population of 8,845 as of the 2010 census.
Economy
The economy of Glenn Dale is largely based on the service industry. The community is home to several restaurants, retail stores, and other businesses. The Glenn Dale Golf Club is a popular destination for golfers, and the Glenn Dale Shopping Center is a popular shopping destination. The community is also home to several government agencies, including the National Institutes of Health and the National Oceanic and Atmospheric Administration.
Demographics
As of the 2010 census, the population of Glenn Dale was 8,845. The racial makeup of the community was 57.3% African American, 33.2% White, 4.2% Asian, and 3.3% Hispanic or Latino. The median household income was $87,945, and the median age was 40.7 years.
Glenn Dale is a diverse community with a rich history and a vibrant economy. The community is home to a variety of businesses, government agencies, and recreational activities. The community is also home to a diverse population, with a variety of racial and ethnic backgrounds.
Common Questions
What is Per Capita Income in Glenn Dale?
Per Capita income in Glenn Dale is $50,052.
What is the Median Family Income in Glenn Dale?
Median Family Income in Glenn Dale is $139,286.
What is the Median Household income in Glenn Dale?
Median Household Income in Glenn Dale is $131,012.
What is Income or Wage Gap in Glenn Dale?
Income or Wage Gap in Glenn Dale is 17.3%.
Women in Glenn Dale earn 82.7 cents for every dollar earned by a man.
What is Inequality or Gini Index in Glenn Dale?
Inequality or Gini Index in Glenn Dale is 0.35.
What is the Total Population of Glenn Dale?
Total Population of Glenn Dale is 15,244.
What is the Total Male Population of Glenn Dale?
Total Male Population of Glenn Dale is 7,697.
What is the Total Female Population of Glenn Dale?
Total Female Population of Glenn Dale is 7,547.
What is the Ratio of Males per 100 Females in Glenn Dale?
There are 101.99 Males per 100 Females in Glenn Dale.
What is the Ratio of Females per 100 Males in Glenn Dale?
There are 98.05 Females per 100 Males in Glenn Dale.
What is the Median Population Age in Glenn Dale?
Median Population Age in Glenn Dale is 39.0 Years.
What is the Average Family Size in Glenn Dale
Average Family Size in Glenn Dale is 3.6 People.
What is the Average Household Size in Glenn Dale
Average Household Size in Glenn Dale is 3.2 People.
How Large is the Labor Force in Glenn Dale?
There are 8,426 People in the Labor Forcein in Glenn Dale.
What is the Percentage of People in the Labor Force in Glenn Dale?
71.3% of People are in the Labor Force in Glenn Dale.
What is the Unemployment Rate in Glenn Dale?
Unemployment Rate in Glenn Dale is 7.2%.