Martinsville, NJ Map & Demographics
Martinsville Map
Martinsville Overview
$81,746
PER CAPITA INCOME
$208,710
AVG FAMILY INCOME
$194,485
AVG HOUSEHOLD INCOME
46.9%
WAGE / INCOME GAP [ % ]
53.1¢/ $1
WAGE / INCOME GAP [ $ ]
0.42
INEQUALITY / GINI INDEX
12,370
TOTAL POPULATION
6,020
MALE POPULATION
6,350
FEMALE POPULATION
94.80
MALES / 100 FEMALES
105.48
FEMALES / 100 MALES
45.2
MEDIAN AGE
3.2
AVG FAMILY SIZE
2.9
AVG HOUSEHOLD SIZE
6,306
LABOR FORCE [ PEOPLE ]
63.3%
PERCENT IN LABOR FORCE
2.9%
UNEMPLOYMENT RATE
Martinsville Zip Codes
Income in Martinsville
Income Overview in Martinsville
Per Capita Income in Martinsville is $81,746, while median incomes of families and households are $208,710 and $194,485 respectively.
| Characteristic | Number | Measure |
| Per Capita Income | 12,370 | $81,746 |
| Median Family Income | 3,564 | $208,710 |
| Mean Family Income | 3,564 | $260,712 |
| Median Household Income | 4,246 | $194,485 |
| Mean Household Income | 4,246 | $234,703 |
| Income Deficit | 3,564 | $0 |
| Wage / Income Gap (%) | 12,370 | 46.93% |
| Wage / Income Gap ($) | 12,370 | 53.07¢ per $1 |
| Gini / Inequality Index | 12,370 | 0.42 |
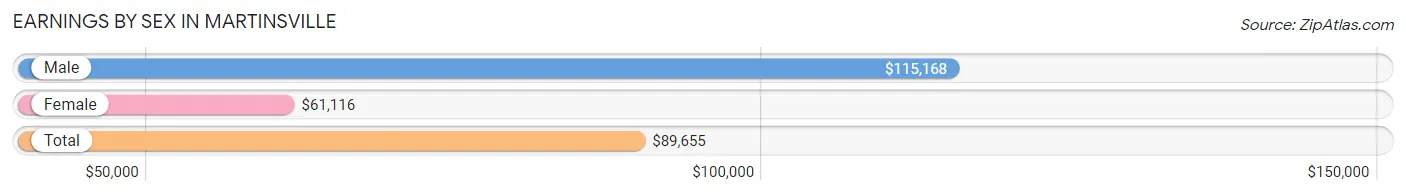
Earnings by Sex in Martinsville
Average Earnings in Martinsville are $89,655, $115,168 for men and $61,116 for women, a difference of 46.9%.
| Sex | Number | Average Earnings |
| Male | 3,545 (53.6%) | $115,168 |
| Female | 3,068 (46.4%) | $61,116 |
| Total | 6,613 (100.0%) | $89,655 |
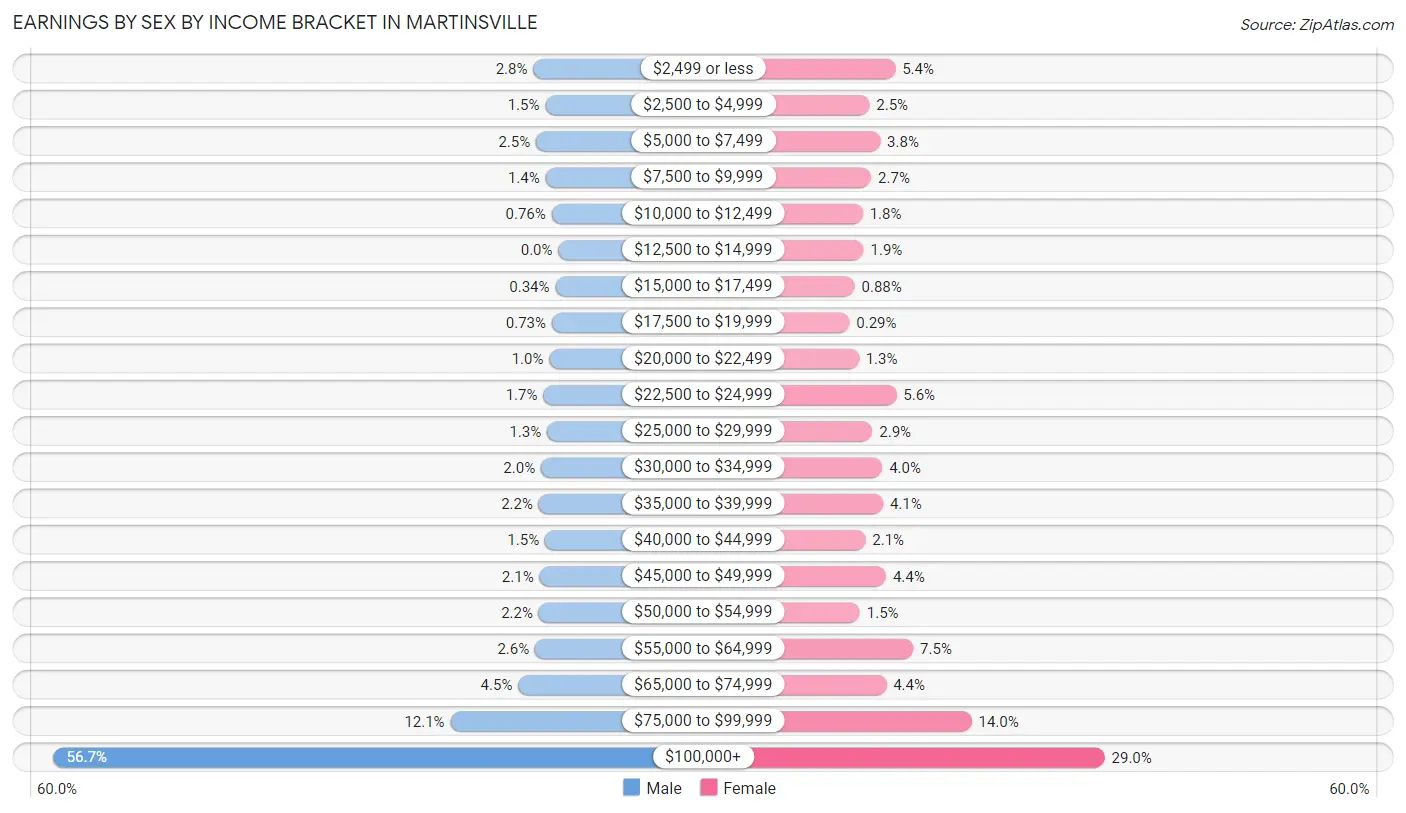
Earnings by Sex by Income Bracket in Martinsville
The most common earnings brackets in Martinsville are $100,000+ for men (2,011 | 56.7%) and $100,000+ for women (889 | 29.0%).
| Income | Male | Female |
| $2,499 or less | 100 (2.8%) | 167 (5.4%) |
| $2,500 to $4,999 | 52 (1.5%) | 78 (2.5%) |
| $5,000 to $7,499 | 89 (2.5%) | 115 (3.7%) |
| $7,500 to $9,999 | 51 (1.4%) | 84 (2.7%) |
| $10,000 to $12,499 | 27 (0.8%) | 55 (1.8%) |
| $12,500 to $14,999 | 0 (0.0%) | 58 (1.9%) |
| $15,000 to $17,499 | 12 (0.3%) | 27 (0.9%) |
| $17,500 to $19,999 | 26 (0.7%) | 9 (0.3%) |
| $20,000 to $22,499 | 36 (1.0%) | 41 (1.3%) |
| $22,500 to $24,999 | 60 (1.7%) | 171 (5.6%) |
| $25,000 to $29,999 | 45 (1.3%) | 88 (2.9%) |
| $30,000 to $34,999 | 69 (1.9%) | 122 (4.0%) |
| $35,000 to $39,999 | 78 (2.2%) | 125 (4.1%) |
| $40,000 to $44,999 | 53 (1.5%) | 64 (2.1%) |
| $45,000 to $49,999 | 75 (2.1%) | 135 (4.4%) |
| $50,000 to $54,999 | 78 (2.2%) | 45 (1.5%) |
| $55,000 to $64,999 | 93 (2.6%) | 229 (7.5%) |
| $65,000 to $74,999 | 160 (4.5%) | 136 (4.4%) |
| $75,000 to $99,999 | 430 (12.1%) | 430 (14.0%) |
| $100,000+ | 2,011 (56.7%) | 889 (29.0%) |
| Total | 3,545 (100.0%) | 3,068 (100.0%) |
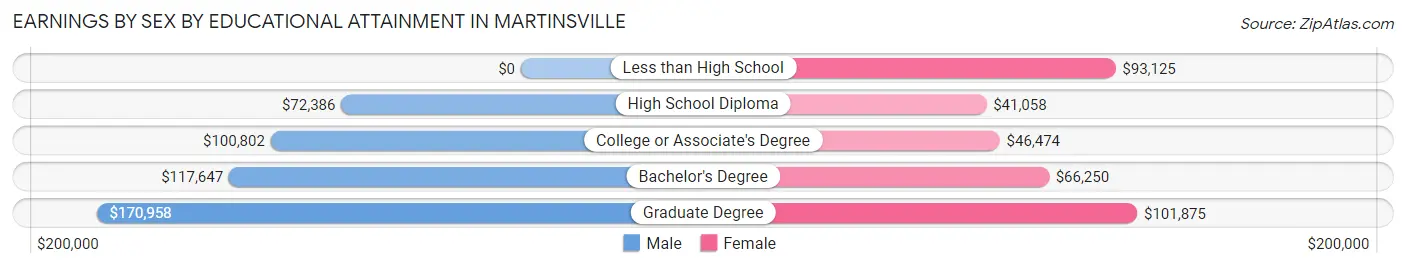
Earnings by Sex by Educational Attainment in Martinsville
Average earnings in Martinsville are $123,614 for men and $74,583 for women, a difference of 39.7%. Men with an educational attainment of graduate degree enjoy the highest average annual earnings of $170,958, while those with high school diploma education earn the least with $72,386. Women with an educational attainment of graduate degree earn the most with the average annual earnings of $101,875, while those with high school diploma education have the smallest earnings of $41,058.
| Educational Attainment | Male Income | Female Income |
| Less than High School | - | - |
| High School Diploma | $72,386 | $41,058 |
| College or Associate's Degree | $100,802 | $46,474 |
| Bachelor's Degree | $117,647 | $66,250 |
| Graduate Degree | $170,958 | $101,875 |
| Total | $123,614 | $74,583 |
Family Income in Martinsville
Family Income Brackets in Martinsville
According to the Martinsville family income data, there are 1,900 families falling into the $200,000+ income range, which is the most common income bracket and makes up 53.3% of all families.
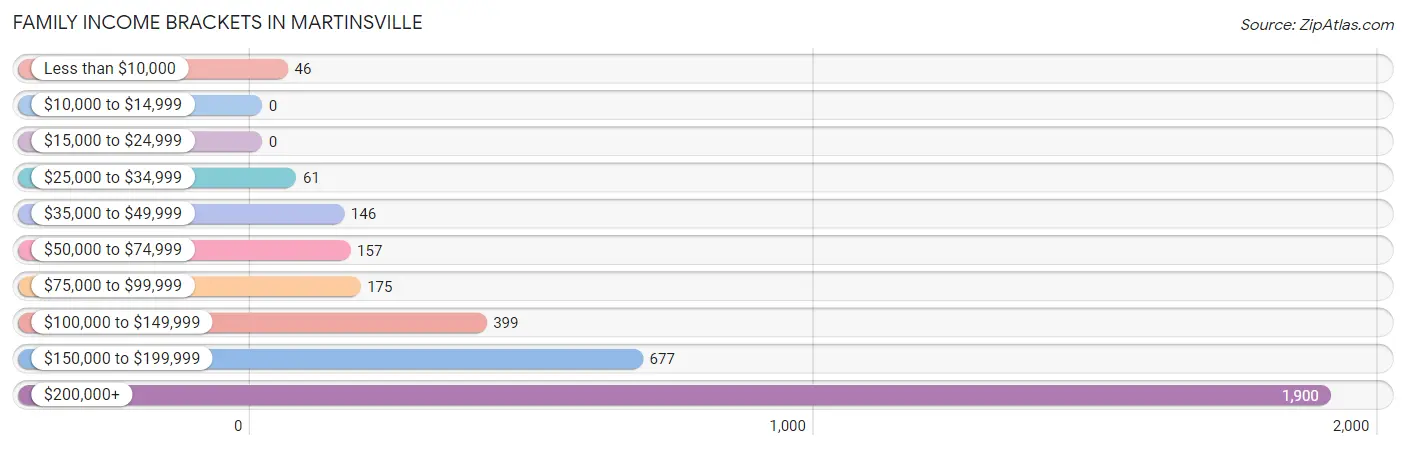
| Income Bracket | # Families | % Families |
| Less than $10,000 | 46 | 1.3% |
| $10,000 to $14,999 | 0 | 0.0% |
| $15,000 to $24,999 | 0 | 0.0% |
| $25,000 to $34,999 | 61 | 1.7% |
| $35,000 to $49,999 | 146 | 4.1% |
| $50,000 to $74,999 | 157 | 4.4% |
| $75,000 to $99,999 | 175 | 4.9% |
| $100,000 to $149,999 | 399 | 11.2% |
| $150,000 to $199,999 | 677 | 19.0% |
| $200,000+ | 1,900 | 53.3% |
Family Income by Famaliy Size in Martinsville
4-person families (875 | 24.5%) account for the highest median family income in Martinsville with $250,001 per family, while 2-person families (1,534 | 43.0%) have the highest median income of $85,000 per family member.
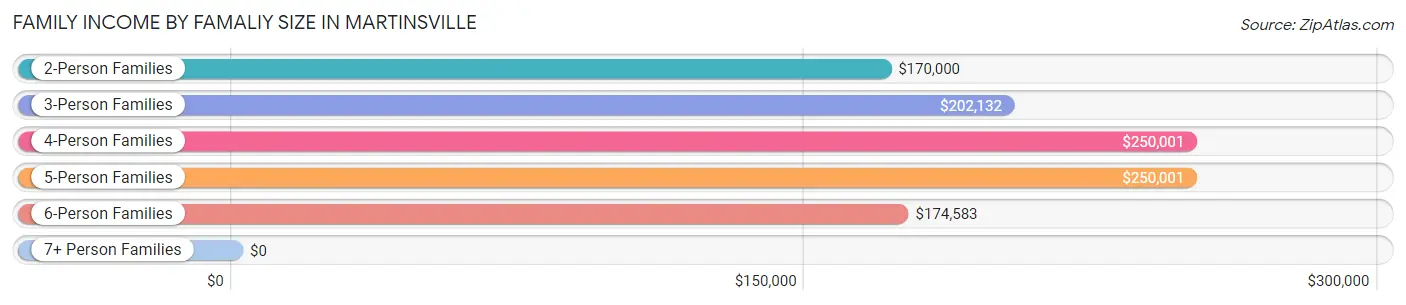
| Income Bracket | # Families | Median Income |
| 2-Person Families | 1,534 (43.0%) | $170,000 |
| 3-Person Families | 767 (21.5%) | $202,132 |
| 4-Person Families | 875 (24.5%) | $250,001 |
| 5-Person Families | 233 (6.5%) | $250,001 |
| 6-Person Families | 127 (3.6%) | $174,583 |
| 7+ Person Families | 28 (0.8%) | $0 |
| Total | 3,564 (100.0%) | $208,710 |
Family Income by Number of Earners in Martinsville
The median family income in Martinsville is $208,710, with families comprising 3+ earners (574) having the highest median family income of $250,001, while families with no earners (527) have the lowest median family income of $87,031, accounting for 16.1% and 14.8% of families, respectively.
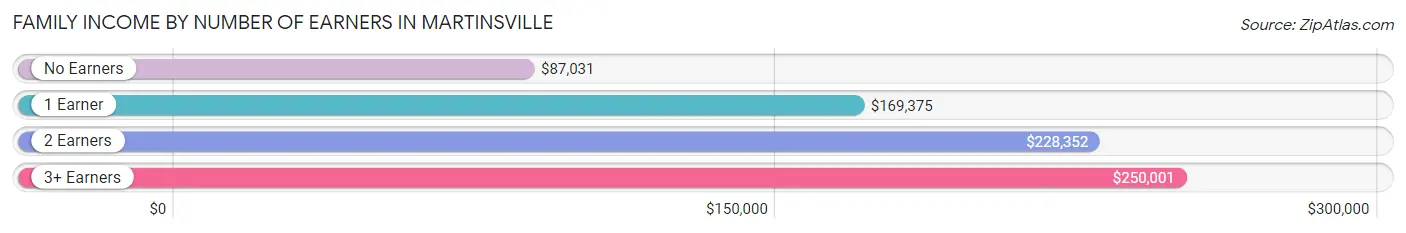
| Number of Earners | # Families | Median Income |
| No Earners | 527 (14.8%) | $87,031 |
| 1 Earner | 860 (24.1%) | $169,375 |
| 2 Earners | 1,603 (45.0%) | $228,352 |
| 3+ Earners | 574 (16.1%) | $250,001 |
| Total | 3,564 (100.0%) | $208,710 |
Household Income in Martinsville
Household Income Brackets in Martinsville
With 1,983 households falling in the category, the $200,000+ income range is the most frequent in Martinsville, accounting for 46.7% of all households. In contrast, only 17 households (0.4%) fall into the $10,000 to $14,999 income bracket, making it the least populous group.
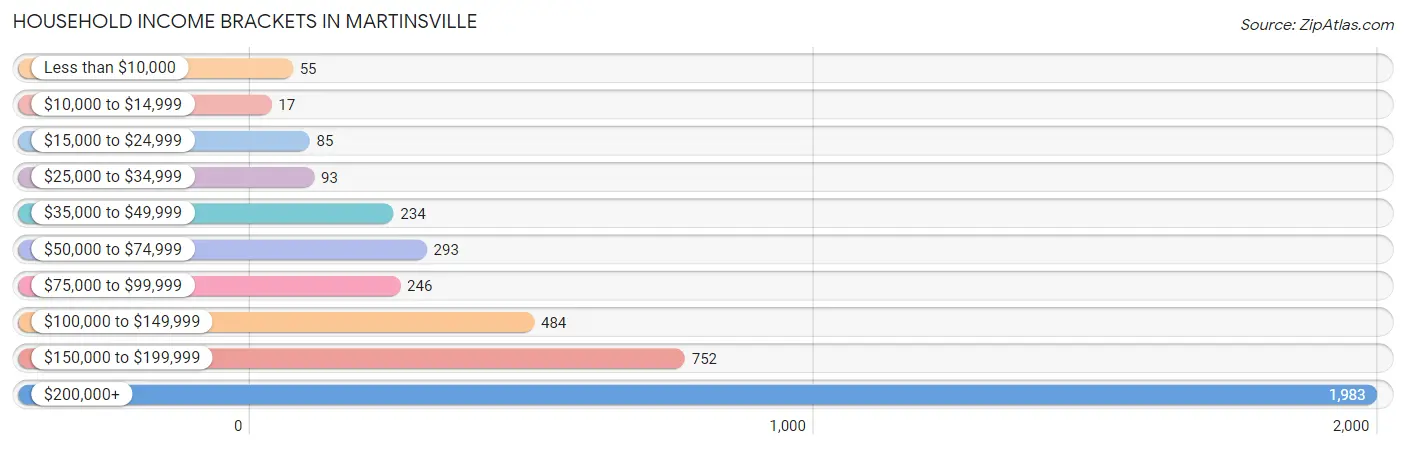
| Income Bracket | # Households | % Households |
| Less than $10,000 | 55 | 1.3% |
| $10,000 to $14,999 | 17 | 0.4% |
| $15,000 to $24,999 | 85 | 2.0% |
| $25,000 to $34,999 | 93 | 2.2% |
| $35,000 to $49,999 | 234 | 5.5% |
| $50,000 to $74,999 | 293 | 6.9% |
| $75,000 to $99,999 | 246 | 5.8% |
| $100,000 to $149,999 | 484 | 11.4% |
| $150,000 to $199,999 | 752 | 17.7% |
| $200,000+ | 1,983 | 46.7% |
Household Income by Householder Age in Martinsville
The median household income in Martinsville is $194,485, with the highest median household income of $234,231 found in the 45 to 64 years age bracket for the primary householder. A total of 1,862 households (43.9%) fall into this category. Meanwhile, the 15 to 24 years age bracket for the primary householder has the lowest median household income of $0, with 23 households (0.5%) in this group.
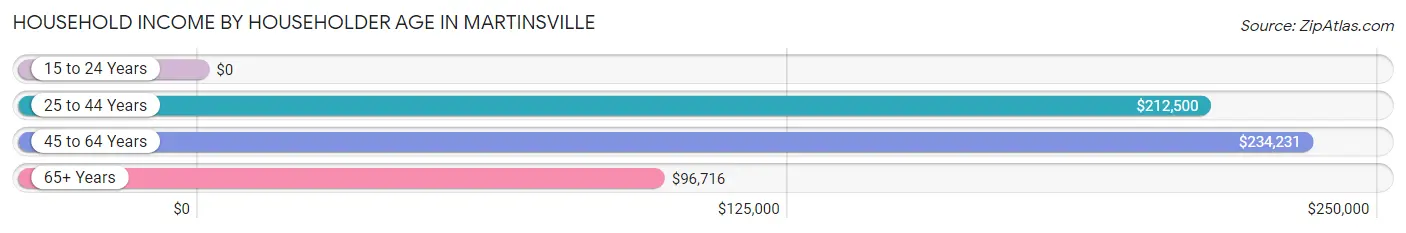
| Income Bracket | # Households | Median Income |
| 15 to 24 Years | 23 (0.5%) | $0 |
| 25 to 44 Years | 968 (22.8%) | $212,500 |
| 45 to 64 Years | 1,862 (43.9%) | $234,231 |
| 65+ Years | 1,393 (32.8%) | $96,716 |
| Total | 4,246 (100.0%) | $194,485 |
Poverty in Martinsville
Income Below Poverty by Sex and Age in Martinsville
With 1.5% poverty level for males and 1.4% for females among the residents of Martinsville, 18 to 24 year old males and 15 year old females are the most vulnerable to poverty, with 34 males (7.3%) and 9 females (10.7%) in their respective age groups living below the poverty level.
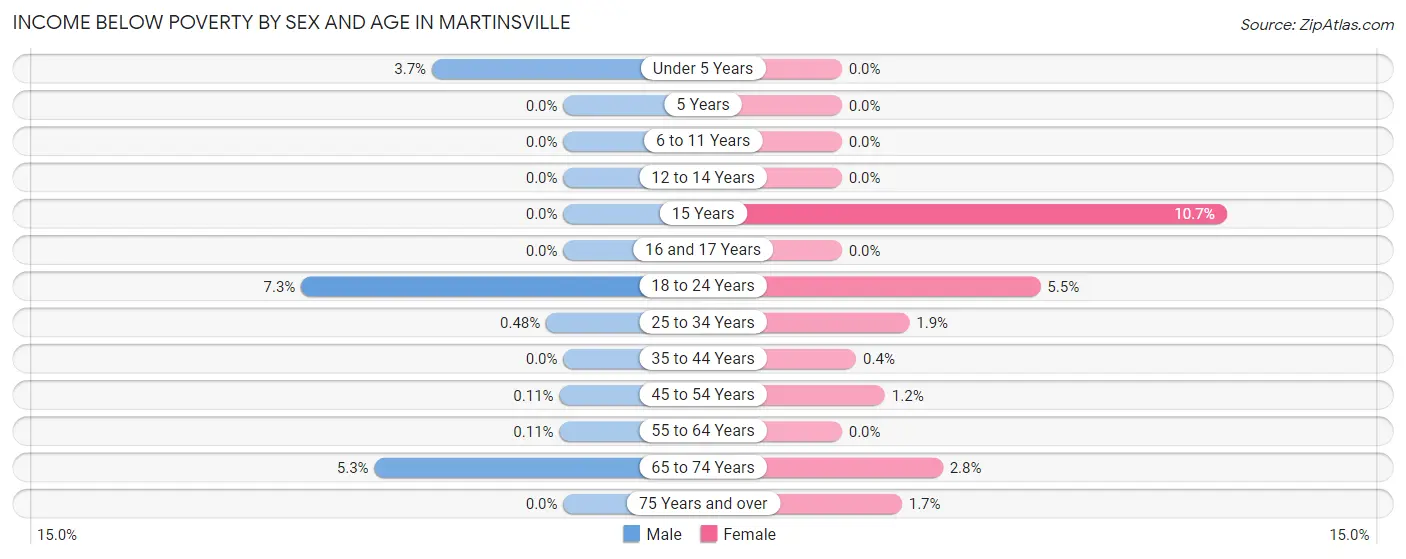
| Age Bracket | Male | Female |
| Under 5 Years | 16 (3.7%) | 0 (0.0%) |
| 5 Years | 0 (0.0%) | 0 (0.0%) |
| 6 to 11 Years | 0 (0.0%) | 0 (0.0%) |
| 12 to 14 Years | 0 (0.0%) | 0 (0.0%) |
| 15 Years | 0 (0.0%) | 9 (10.7%) |
| 16 and 17 Years | 0 (0.0%) | 0 (0.0%) |
| 18 to 24 Years | 34 (7.3%) | 23 (5.5%) |
| 25 to 34 Years | 3 (0.5%) | 10 (1.9%) |
| 35 to 44 Years | 0 (0.0%) | 3 (0.4%) |
| 45 to 54 Years | 1 (0.1%) | 11 (1.2%) |
| 55 to 64 Years | 1 (0.1%) | 0 (0.0%) |
| 65 to 74 Years | 36 (5.3%) | 19 (2.8%) |
| 75 Years and over | 0 (0.0%) | 10 (1.7%) |
| Total | 91 (1.5%) | 85 (1.4%) |
Income Above Poverty by Sex and Age in Martinsville
According to the poverty statistics in Martinsville, males aged 5 years and females aged under 5 years are the age groups that are most secure financially, with 100.0% of males and 100.0% of females in these age groups living above the poverty line.
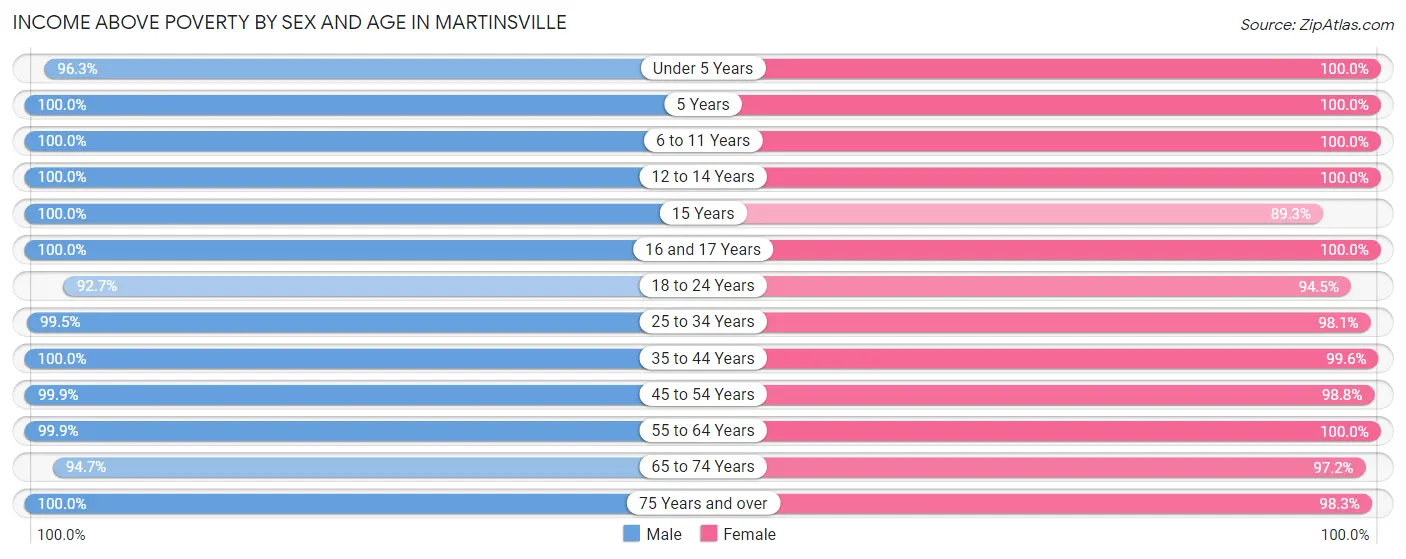
| Age Bracket | Male | Female |
| Under 5 Years | 421 (96.3%) | 345 (100.0%) |
| 5 Years | 74 (100.0%) | 58 (100.0%) |
| 6 to 11 Years | 394 (100.0%) | 454 (100.0%) |
| 12 to 14 Years | 260 (100.0%) | 241 (100.0%) |
| 15 Years | 60 (100.0%) | 75 (89.3%) |
| 16 and 17 Years | 161 (100.0%) | 264 (100.0%) |
| 18 to 24 Years | 432 (92.7%) | 393 (94.5%) |
| 25 to 34 Years | 623 (99.5%) | 523 (98.1%) |
| 35 to 44 Years | 542 (100.0%) | 738 (99.6%) |
| 45 to 54 Years | 896 (99.9%) | 902 (98.8%) |
| 55 to 64 Years | 935 (99.9%) | 937 (100.0%) |
| 65 to 74 Years | 648 (94.7%) | 658 (97.2%) |
| 75 Years and over | 451 (100.0%) | 590 (98.3%) |
| Total | 5,897 (98.5%) | 6,178 (98.6%) |
Income Below Poverty Among Married-Couple Families in Martinsville
The poverty statistics for married-couple families in Martinsville show that 0.5% or 16 of the total 3,194 families live below the poverty line. Families with no children have the highest poverty rate of 0.9%, comprising of 16 families. On the other hand, families with 1 or 2 children have the lowest poverty rate of 0.0%, which includes 0 families.
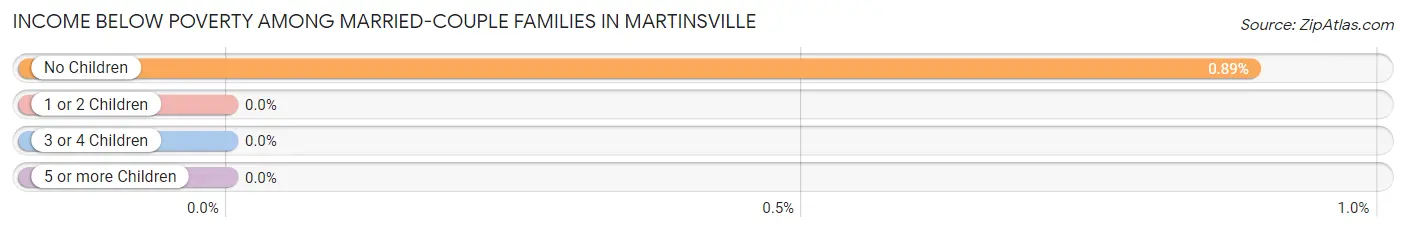
| Children | Above Poverty | Below Poverty |
| No Children | 1,775 (99.1%) | 16 (0.9%) |
| 1 or 2 Children | 1,203 (100.0%) | 0 (0.0%) |
| 3 or 4 Children | 200 (100.0%) | 0 (0.0%) |
| 5 or more Children | 0 (0.0%) | 0 (0.0%) |
| Total | 3,178 (99.5%) | 16 (0.5%) |
Income Below Poverty Among Single-Parent Households in Martinsville
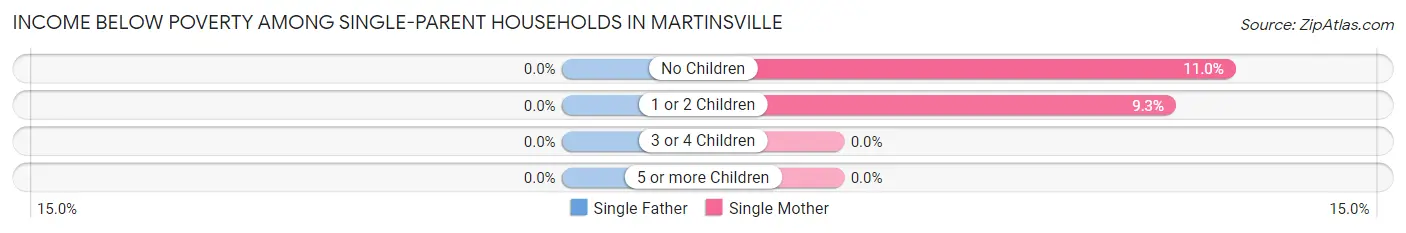
| Children | Single Father | Single Mother |
| No Children | 0 (0.0%) | 23 (11.0%) |
| 1 or 2 Children | 0 (0.0%) | 9 (9.3%) |
| 3 or 4 Children | 0 (0.0%) | 0 (0.0%) |
| 5 or more Children | 0 (0.0%) | 0 (0.0%) |
| Total | 0 (0.0%) | 32 (10.4%) |
Income Below Poverty Among Married-Couple vs Single-Parent Households in Martinsville
The poverty data for Martinsville shows that 16 of the married-couple family households (0.5%) and 32 of the single-parent households (8.6%) are living below the poverty level. Within the married-couple family households, those with no children have the highest poverty rate, with 16 households (0.9%) falling below the poverty line. Among the single-parent households, those with no children have the highest poverty rate, with 23 household (8.9%) living below poverty.
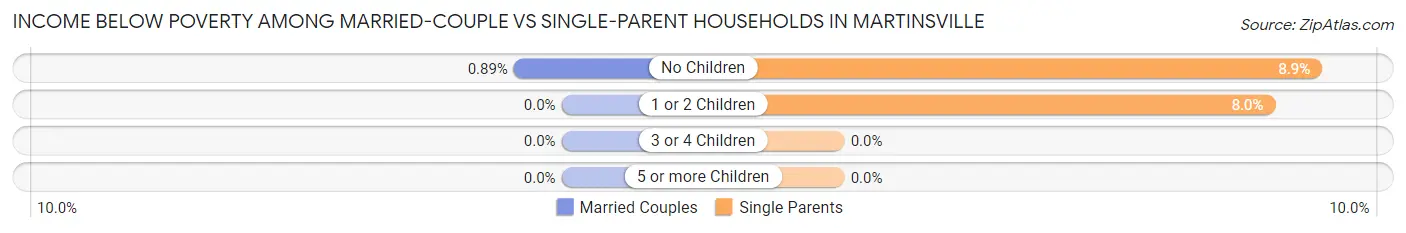
| Children | Married-Couple Families | Single-Parent Households |
| No Children | 16 (0.9%) | 23 (8.9%) |
| 1 or 2 Children | 0 (0.0%) | 9 (8.0%) |
| 3 or 4 Children | 0 (0.0%) | 0 (0.0%) |
| 5 or more Children | 0 (0.0%) | 0 (0.0%) |
| Total | 16 (0.5%) | 32 (8.6%) |
Race in Martinsville
The most populous races in Martinsville are White / Caucasian (9,228 | 74.6%), Asian (1,919 | 15.5%), and Two or more Races (835 | 6.8%).
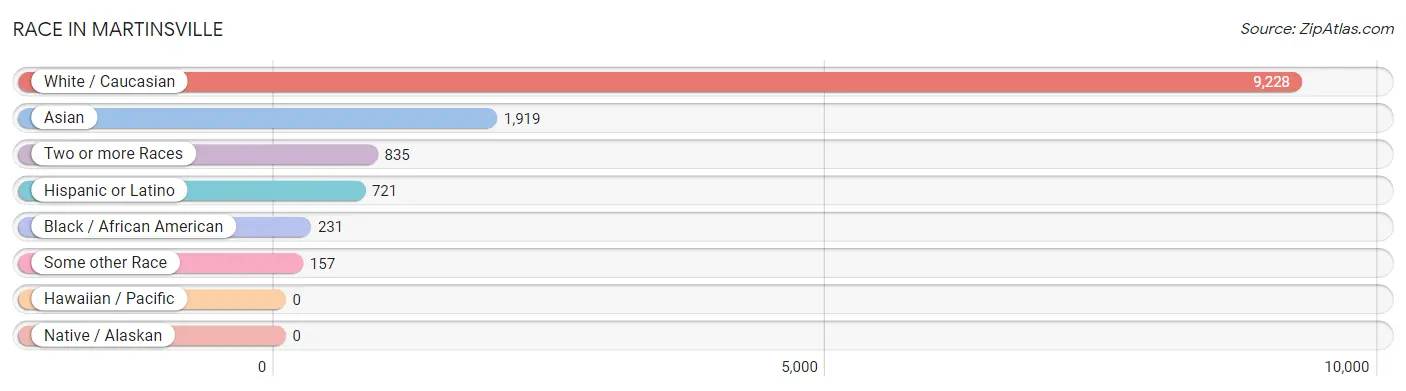
| Race | # Population | % Population |
| Asian | 1,919 | 15.5% |
| Black / African American | 231 | 1.9% |
| Hawaiian / Pacific | 0 | 0.0% |
| Hispanic or Latino | 721 | 5.8% |
| Native / Alaskan | 0 | 0.0% |
| White / Caucasian | 9,228 | 74.6% |
| Two or more Races | 835 | 6.8% |
| Some other Race | 157 | 1.3% |
| Total | 12,370 | 100.0% |
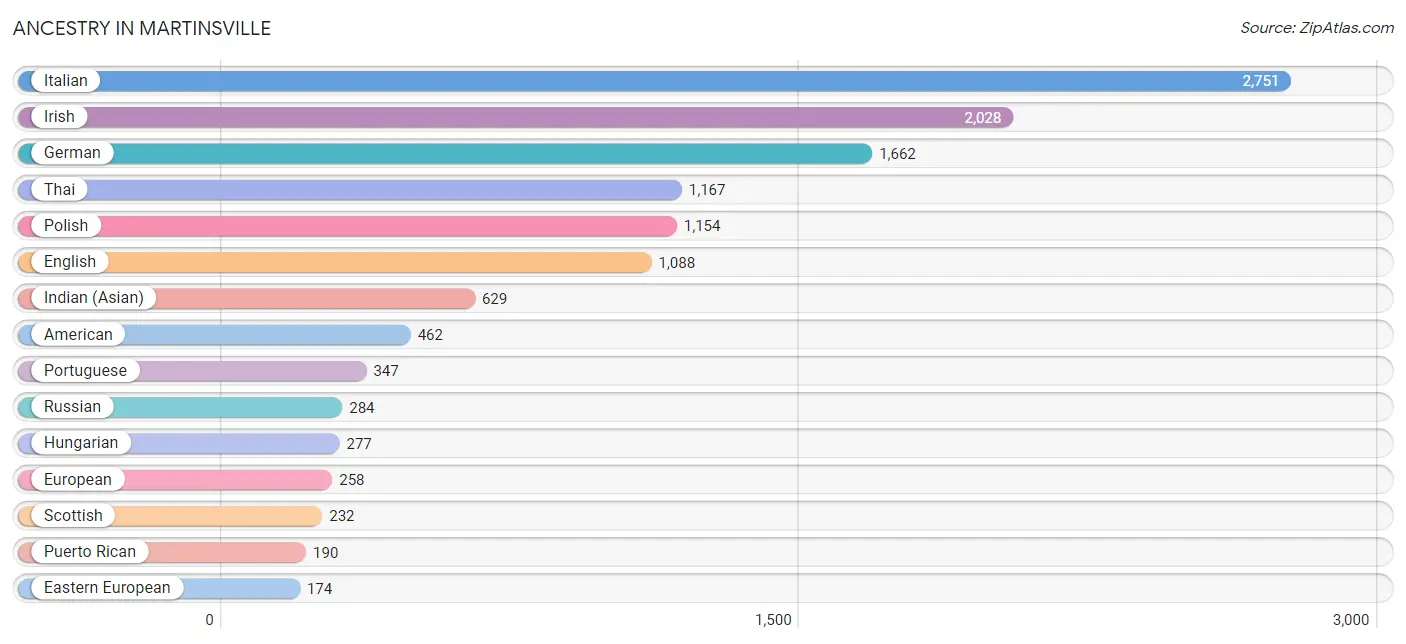
Ancestry in Martinsville
The most populous ancestries reported in Martinsville are Italian (2,751 | 22.2%), Irish (2,028 | 16.4%), German (1,662 | 13.4%), Thai (1,167 | 9.4%), and Polish (1,154 | 9.3%), together accounting for 70.8% of all Martinsville residents.
| Ancestry | # Population | % Population |
| Albanian | 109 | 0.9% |
| American | 462 | 3.7% |
| Arab | 163 | 1.3% |
| Argentinean | 12 | 0.1% |
| Armenian | 8 | 0.1% |
| Austrian | 9 | 0.1% |
| Bhutanese | 10 | 0.1% |
| Brazilian | 2 | 0.0% |
| British | 161 | 1.3% |
| Burmese | 120 | 1.0% |
| Central American | 26 | 0.2% |
| Colombian | 13 | 0.1% |
| Croatian | 8 | 0.1% |
| Cuban | 98 | 0.8% |
| Czech | 45 | 0.4% |
| Czechoslovakian | 40 | 0.3% |
| Danish | 43 | 0.4% |
| Dominican | 140 | 1.1% |
| Dutch | 130 | 1.1% |
| Eastern European | 174 | 1.4% |
| Egyptian | 44 | 0.4% |
| English | 1,088 | 8.8% |
| European | 258 | 2.1% |
| Filipino | 81 | 0.6% |
| French | 153 | 1.2% |
| French Canadian | 49 | 0.4% |
| German | 1,662 | 13.4% |
| Ghanaian | 8 | 0.1% |
| Greek | 146 | 1.2% |
| Guatemalan | 17 | 0.1% |
| Haitian | 21 | 0.2% |
| Hungarian | 277 | 2.2% |
| Indian (Asian) | 629 | 5.1% |
| Irish | 2,028 | 16.4% |
| Israeli | 46 | 0.4% |
| Italian | 2,751 | 22.2% |
| Korean | 106 | 0.9% |
| Laotian | 3 | 0.0% |
| Lebanese | 55 | 0.4% |
| Lithuanian | 168 | 1.4% |
| Mexican | 24 | 0.2% |
| Moroccan | 27 | 0.2% |
| Norwegian | 106 | 0.9% |
| Pakistani | 13 | 0.1% |
| Palestinian | 29 | 0.2% |
| Panamanian | 9 | 0.1% |
| Pennsylvania German | 10 | 0.1% |
| Peruvian | 37 | 0.3% |
| Polish | 1,154 | 9.3% |
| Portuguese | 347 | 2.8% |
| Puerto Rican | 190 | 1.5% |
| Romanian | 42 | 0.3% |
| Russian | 284 | 2.3% |
| Scotch-Irish | 48 | 0.4% |
| Scottish | 232 | 1.9% |
| Slovak | 26 | 0.2% |
| South American | 96 | 0.8% |
| Spaniard | 98 | 0.8% |
| Spanish | 29 | 0.2% |
| Sri Lankan | 6 | 0.1% |
| Subsaharan African | 23 | 0.2% |
| Swedish | 99 | 0.8% |
| Swiss | 15 | 0.1% |
| Syrian | 12 | 0.1% |
| Thai | 1,167 | 9.4% |
| Ukrainian | 165 | 1.3% |
| Venezuelan | 34 | 0.3% |
| Welsh | 13 | 0.1% |
| Zimbabwean | 15 | 0.1% | View All 69 Rows |
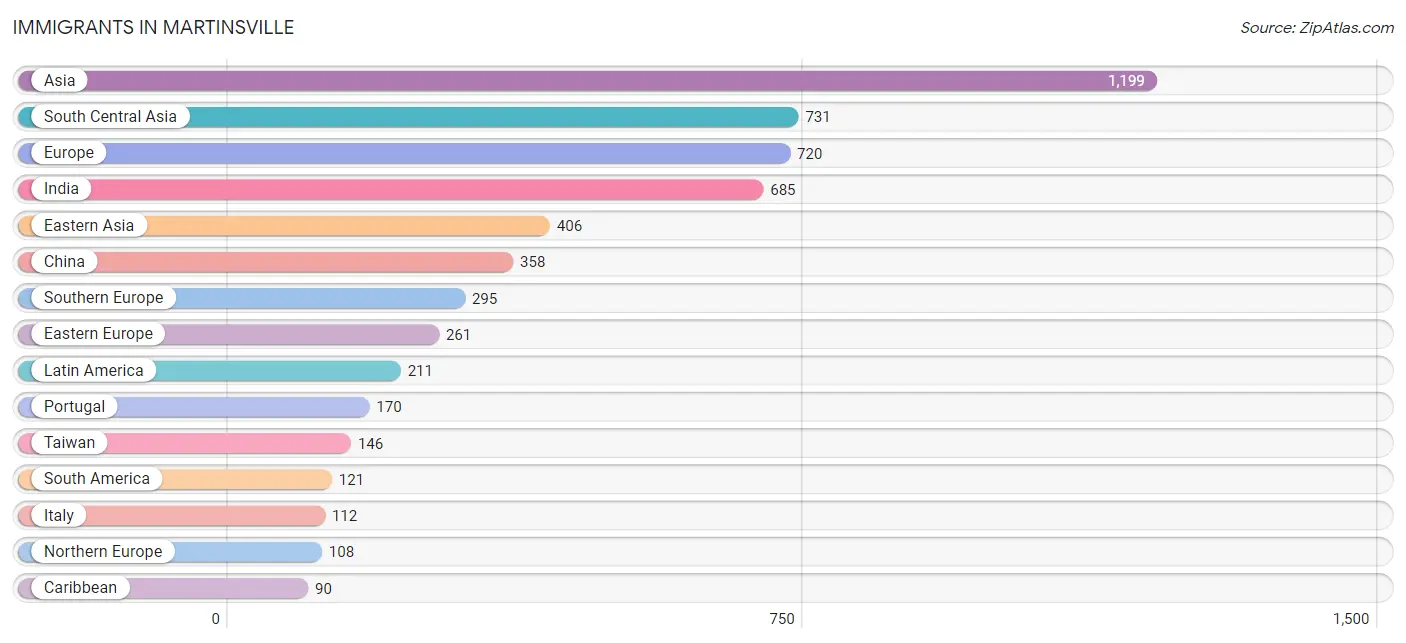
Immigrants in Martinsville
The most numerous immigrant groups reported in Martinsville came from Asia (1,199 | 9.7%), South Central Asia (731 | 5.9%), Europe (720 | 5.8%), India (685 | 5.5%), and Eastern Asia (406 | 3.3%), together accounting for 30.2% of all Martinsville residents.
| Immigration Origin | # Population | % Population |
| Africa | 24 | 0.2% |
| Albania | 35 | 0.3% |
| Argentina | 12 | 0.1% |
| Asia | 1,199 | 9.7% |
| Brazil | 26 | 0.2% |
| Canada | 18 | 0.2% |
| Caribbean | 90 | 0.7% |
| China | 358 | 2.9% |
| Colombia | 13 | 0.1% |
| Cuba | 16 | 0.1% |
| Dominican Republic | 74 | 0.6% |
| Eastern Asia | 406 | 3.3% |
| Eastern Europe | 261 | 2.1% |
| Egypt | 8 | 0.1% |
| England | 13 | 0.1% |
| Europe | 720 | 5.8% |
| Germany | 46 | 0.4% |
| Hong Kong | 34 | 0.3% |
| Hungary | 29 | 0.2% |
| India | 685 | 5.5% |
| Indonesia | 3 | 0.0% |
| Ireland | 19 | 0.2% |
| Israel | 12 | 0.1% |
| Italy | 112 | 0.9% |
| Korea | 48 | 0.4% |
| Latin America | 211 | 1.7% |
| Moldova | 8 | 0.1% |
| Morocco | 16 | 0.1% |
| Netherlands | 10 | 0.1% |
| Northern Africa | 24 | 0.2% |
| Northern Europe | 108 | 0.9% |
| Pakistan | 46 | 0.4% |
| Peru | 54 | 0.4% |
| Philippines | 20 | 0.2% |
| Poland | 59 | 0.5% |
| Portugal | 170 | 1.4% |
| Russia | 4 | 0.0% |
| South America | 121 | 1.0% |
| South Central Asia | 731 | 5.9% |
| South Eastern Asia | 32 | 0.3% |
| Southern Europe | 295 | 2.4% |
| Spain | 13 | 0.1% |
| Sweden | 3 | 0.0% |
| Taiwan | 146 | 1.2% |
| Ukraine | 63 | 0.5% |
| Venezuela | 16 | 0.1% |
| Vietnam | 9 | 0.1% |
| Western Asia | 18 | 0.2% |
| Western Europe | 56 | 0.4% | View All 49 Rows |
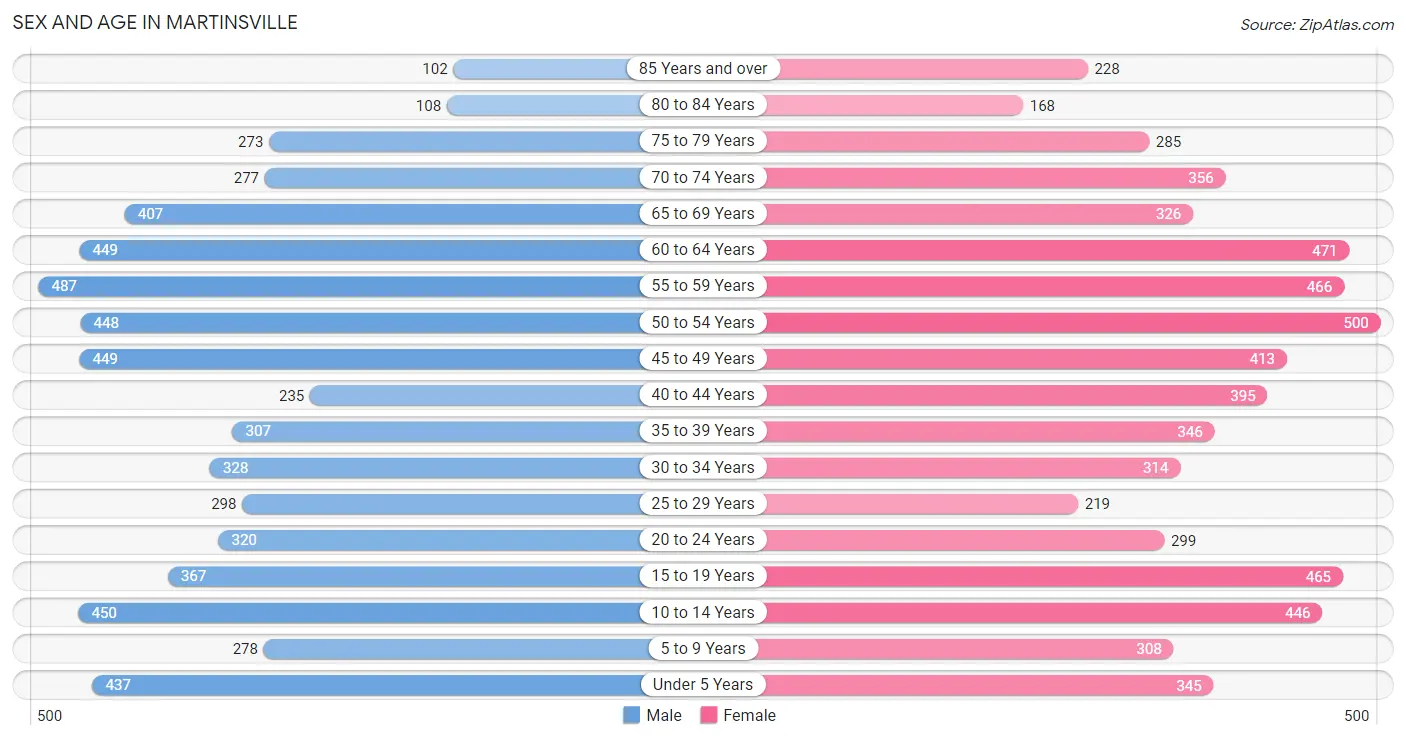
Sex and Age in Martinsville
Sex and Age in Martinsville
The most populous age groups in Martinsville are 55 to 59 Years (487 | 8.1%) for men and 50 to 54 Years (500 | 7.9%) for women.
| Age Bracket | Male | Female |
| Under 5 Years | 437 (7.3%) | 345 (5.4%) |
| 5 to 9 Years | 278 (4.6%) | 308 (4.9%) |
| 10 to 14 Years | 450 (7.5%) | 446 (7.0%) |
| 15 to 19 Years | 367 (6.1%) | 465 (7.3%) |
| 20 to 24 Years | 320 (5.3%) | 299 (4.7%) |
| 25 to 29 Years | 298 (5.0%) | 219 (3.5%) |
| 30 to 34 Years | 328 (5.4%) | 314 (4.9%) |
| 35 to 39 Years | 307 (5.1%) | 346 (5.4%) |
| 40 to 44 Years | 235 (3.9%) | 395 (6.2%) |
| 45 to 49 Years | 449 (7.5%) | 413 (6.5%) |
| 50 to 54 Years | 448 (7.4%) | 500 (7.9%) |
| 55 to 59 Years | 487 (8.1%) | 466 (7.3%) |
| 60 to 64 Years | 449 (7.5%) | 471 (7.4%) |
| 65 to 69 Years | 407 (6.8%) | 326 (5.1%) |
| 70 to 74 Years | 277 (4.6%) | 356 (5.6%) |
| 75 to 79 Years | 273 (4.5%) | 285 (4.5%) |
| 80 to 84 Years | 108 (1.8%) | 168 (2.6%) |
| 85 Years and over | 102 (1.7%) | 228 (3.6%) |
| Total | 6,020 (100.0%) | 6,350 (100.0%) |
Families and Households in Martinsville
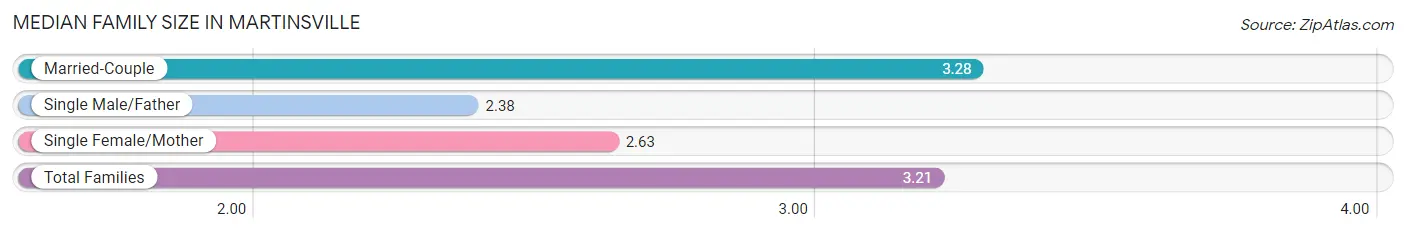
Median Family Size in Martinsville
The median family size in Martinsville is 3.21 persons per family, with married-couple families (3,194 | 89.6%) accounting for the largest median family size of 3.28 persons per family. On the other hand, single male/father families (63 | 1.8%) represent the smallest median family size with 2.38 persons per family.
| Family Type | # Families | Family Size |
| Married-Couple | 3,194 (89.6%) | 3.28 |
| Single Male/Father | 63 (1.8%) | 2.38 |
| Single Female/Mother | 307 (8.6%) | 2.63 |
| Total Families | 3,564 (100.0%) | 3.21 |
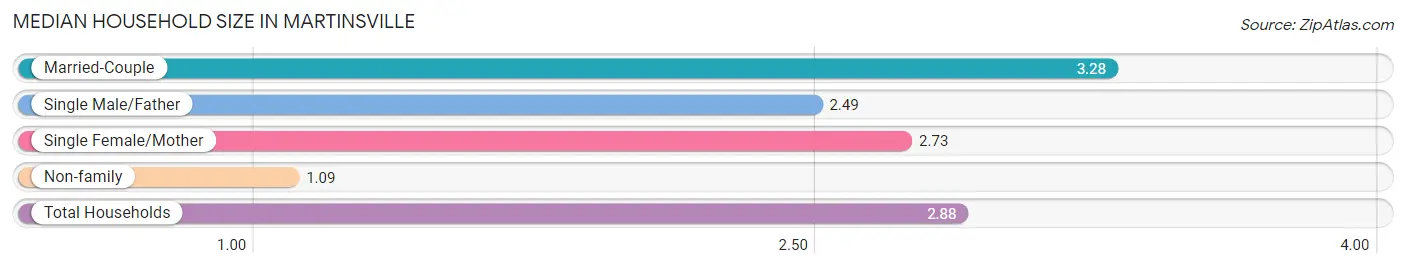
Median Household Size in Martinsville
The median household size in Martinsville is 2.88 persons per household, with married-couple households (3,194 | 75.2%) accounting for the largest median household size of 3.28 persons per household. non-family households (682 | 16.1%) represent the smallest median household size with 1.09 persons per household.
| Household Type | # Households | Household Size |
| Married-Couple | 3,194 (75.2%) | 3.28 |
| Single Male/Father | 63 (1.5%) | 2.49 |
| Single Female/Mother | 307 (7.2%) | 2.73 |
| Non-family | 682 (16.1%) | 1.09 |
| Total Households | 4,246 (100.0%) | 2.88 |
Household Size by Marriage Status in Martinsville
Out of a total of 4,246 households in Martinsville, 3,564 (83.9%) are family households, while 682 (16.1%) are nonfamily households. The most numerous type of family households are 2-person households, comprising 1,520, and the most common type of nonfamily households are 1-person households, comprising 648.
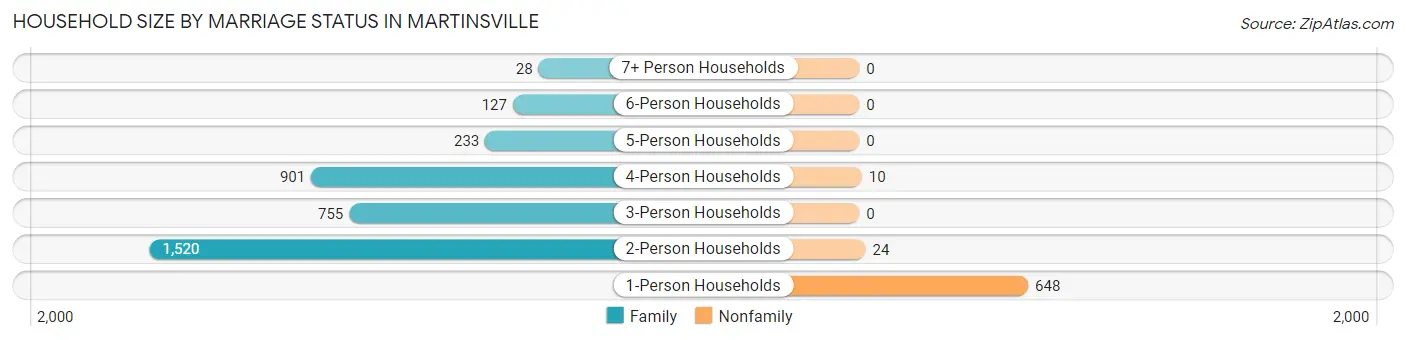
| Household Size | Family Households | Nonfamily Households |
| 1-Person Households | - | 648 (15.3%) |
| 2-Person Households | 1,520 (35.8%) | 24 (0.6%) |
| 3-Person Households | 755 (17.8%) | 0 (0.0%) |
| 4-Person Households | 901 (21.2%) | 10 (0.2%) |
| 5-Person Households | 233 (5.5%) | 0 (0.0%) |
| 6-Person Households | 127 (3.0%) | 0 (0.0%) |
| 7+ Person Households | 28 (0.7%) | 0 (0.0%) |
| Total | 3,564 (83.9%) | 682 (16.1%) |
Female Fertility in Martinsville
Fertility by Age in Martinsville
Average fertility rate in Martinsville is 73.0 births per 1,000 women. Women in the age bracket of 20 to 34 years have the highest fertility rate with 171.0 births per 1,000 women. Women in the age bracket of 20 to 34 years acount for 74.0% of all women with births.
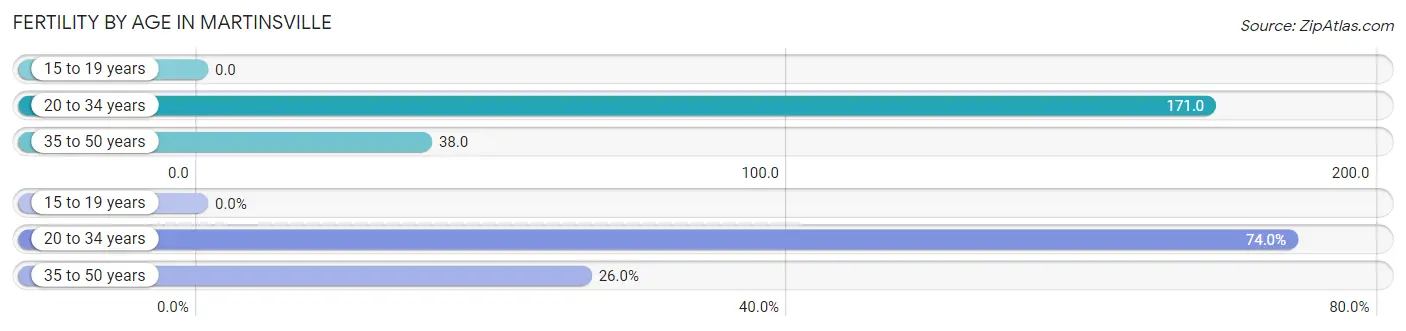
| Age Bracket | Women with Births | Births / 1,000 Women |
| 15 to 19 years | 0 (0.0%) | 0.0 |
| 20 to 34 years | 142 (74.0%) | 171.0 |
| 35 to 50 years | 50 (26.0%) | 38.0 |
| Total | 192 (100.0%) | 73.0 |
Fertility by Age by Marriage Status in Martinsville
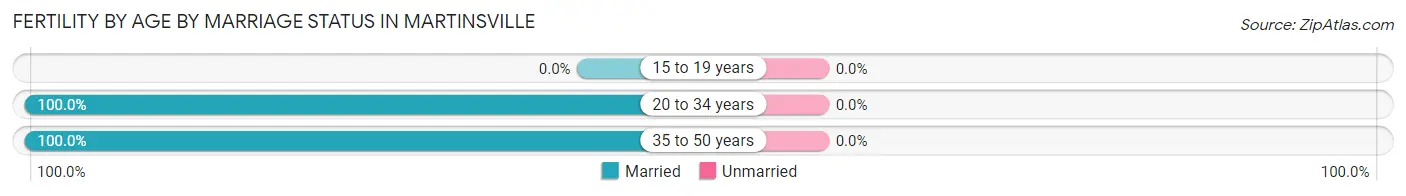
| Age Bracket | Married | Unmarried |
| 15 to 19 years | 0 (0.0%) | 0 (0.0%) |
| 20 to 34 years | 142 (100.0%) | 0 (0.0%) |
| 35 to 50 years | 50 (100.0%) | 0 (0.0%) |
| Total | 192 (100.0%) | 0 (0.0%) |
Fertility by Education in Martinsville
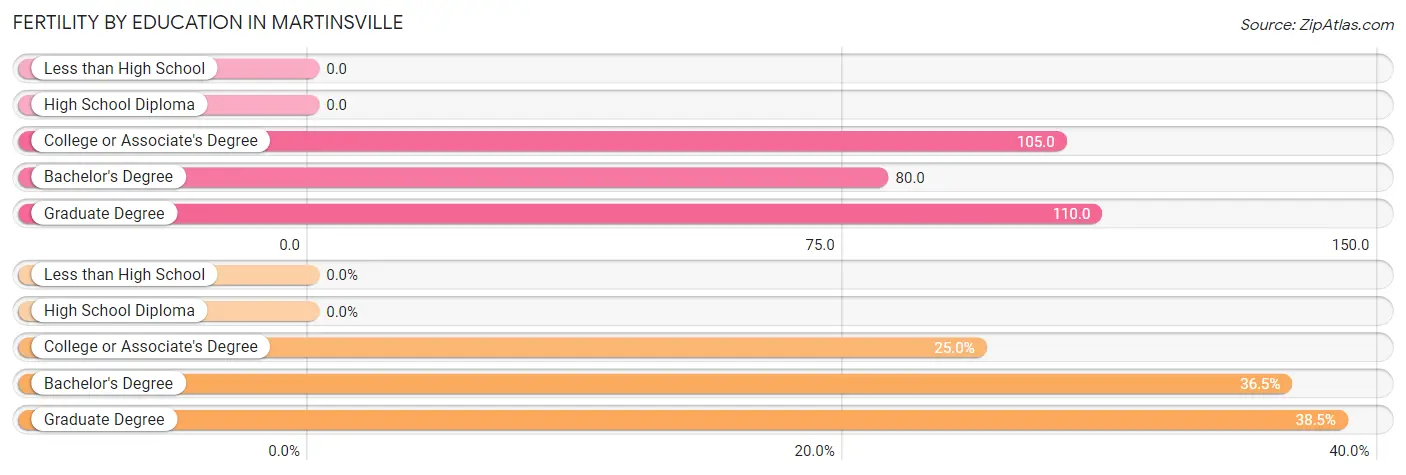
| Educational Attainment | Women with Births | Births / 1,000 Women |
| Less than High School | 0 (0.0%) | 0.0 |
| High School Diploma | 0 (0.0%) | 0.0 |
| College or Associate's Degree | 48 (25.0%) | 105.0 |
| Bachelor's Degree | 70 (36.5%) | 80.0 |
| Graduate Degree | 74 (38.5%) | 110.0 |
| Total | 192 (100.0%) | 73.0 |
Fertility by Education by Marriage Status in Martinsville
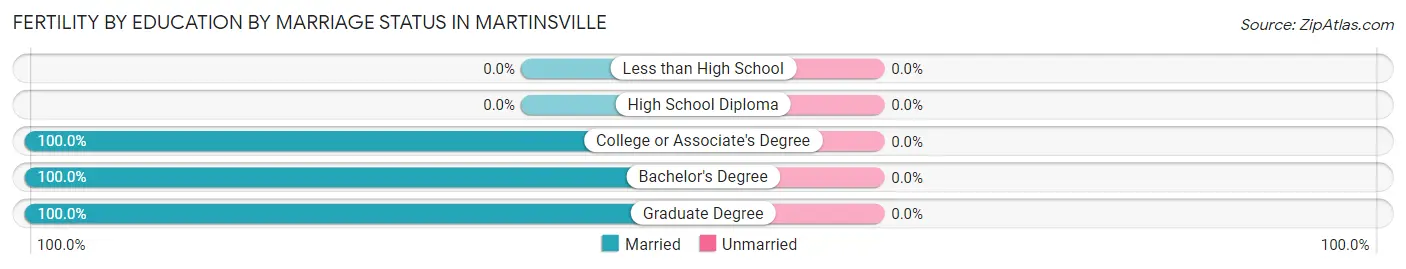
| Educational Attainment | Married | Unmarried |
| Less than High School | 0 (0.0%) | 0 (0.0%) |
| High School Diploma | 0 (0.0%) | 0 (0.0%) |
| College or Associate's Degree | 48 (100.0%) | 0 (0.0%) |
| Bachelor's Degree | 70 (100.0%) | 0 (0.0%) |
| Graduate Degree | 74 (100.0%) | 0 (0.0%) |
| Total | 192 (100.0%) | 0 (0.0%) |
Employment Characteristics in Martinsville
Employment by Class of Employer in Martinsville
Among the 5,956 employed individuals in Martinsville, private company employees (4,372 | 73.4%), self-employed (incorporated) (409 | 6.9%), and local government employees (369 | 6.2%) make up the most common classes of employment.
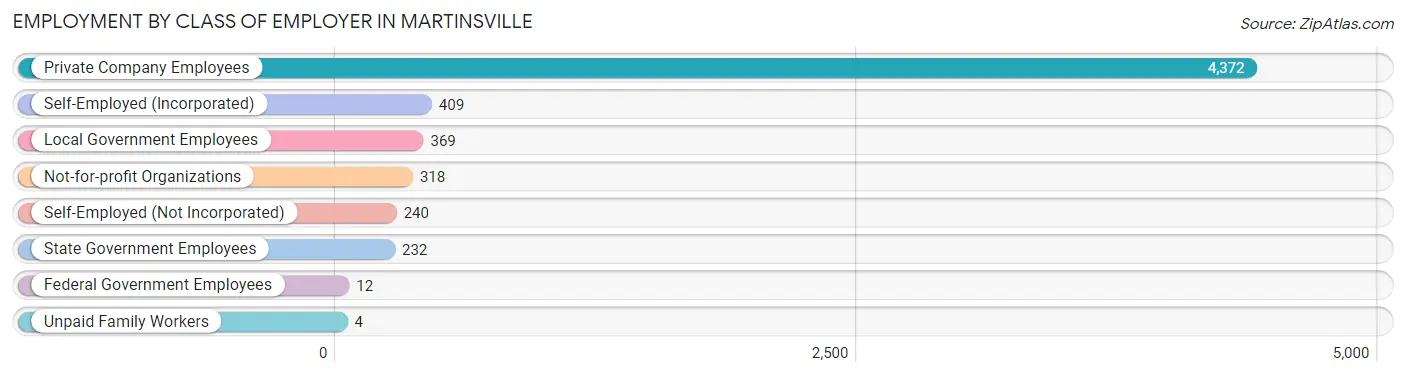
| Employer Class | # Employees | % Employees |
| Private Company Employees | 4,372 | 73.4% |
| Self-Employed (Incorporated) | 409 | 6.9% |
| Self-Employed (Not Incorporated) | 240 | 4.0% |
| Not-for-profit Organizations | 318 | 5.3% |
| Local Government Employees | 369 | 6.2% |
| State Government Employees | 232 | 3.9% |
| Federal Government Employees | 12 | 0.2% |
| Unpaid Family Workers | 4 | 0.1% |
| Total | 5,956 | 100.0% |
Employment Status by Age in Martinsville
According to the labor force statistics for Martinsville, out of the total population over 16 years of age (9,962), 63.3% or 6,306 individuals are in the labor force, with 2.9% or 183 of them unemployed. The age group with the highest labor force participation rate is 30 to 34 years, with 90.5% or 581 individuals in the labor force. Within the labor force, the 20 to 24 years age range has the highest percentage of unemployed individuals, with 8.5% or 30 of them being unemployed.
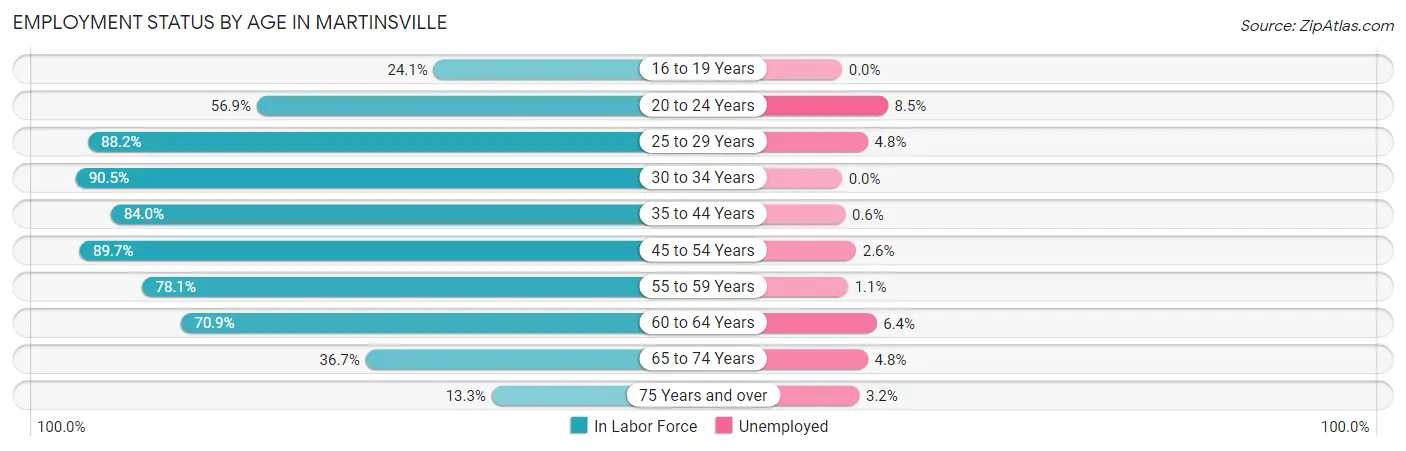
| Age Bracket | In Labor Force | Unemployed |
| 16 to 19 Years | 166 (24.1%) | 0 (0.0%) |
| 20 to 24 Years | 352 (56.9%) | 30 (8.5%) |
| 25 to 29 Years | 456 (88.2%) | 22 (4.8%) |
| 30 to 34 Years | 581 (90.5%) | 0 (0.0%) |
| 35 to 44 Years | 1,078 (84.0%) | 6 (0.6%) |
| 45 to 54 Years | 1,624 (89.7%) | 42 (2.6%) |
| 55 to 59 Years | 744 (78.1%) | 8 (1.1%) |
| 60 to 64 Years | 652 (70.9%) | 42 (6.4%) |
| 65 to 74 Years | 501 (36.7%) | 24 (4.8%) |
| 75 Years and over | 155 (13.3%) | 5 (3.2%) |
| Total | 6,306 (63.3%) | 183 (2.9%) |
Employment Status by Educational Attainment in Martinsville
According to labor force statistics for Martinsville, 83.8% of individuals (5,133) out of the total population between 25 and 64 years of age (6,125) are in the labor force, with 2.4% or 123 of them being unemployed. The group with the highest labor force participation rate are those with the educational attainment of bachelor's degree or higher, with 87.9% or 3,956 individuals in the labor force. Within the labor force, individuals with bachelor's degree or higher education have the highest percentage of unemployment, with 2.6% or 103 of them being unemployed.
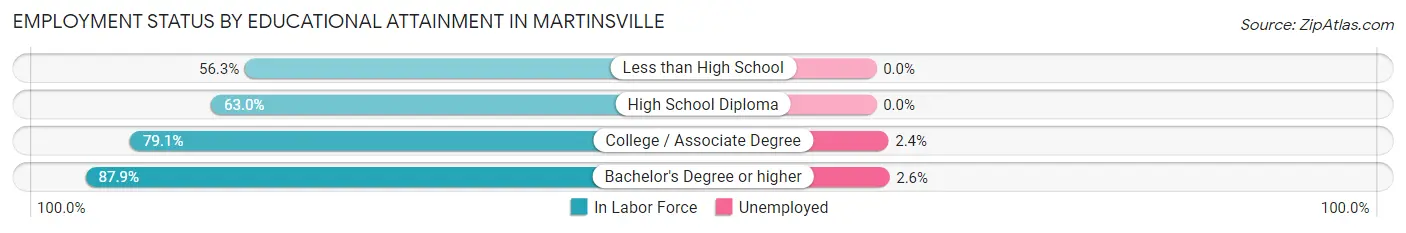
| Educational Attainment | In Labor Force | Unemployed |
| Less than High School | 18 (56.3%) | 0 (0.0%) |
| High School Diploma | 394 (63.0%) | 0 (0.0%) |
| College / Associate Degree | 765 (79.1%) | 23 (2.4%) |
| Bachelor's Degree or higher | 3,956 (87.9%) | 117 (2.6%) |
| Total | 5,133 (83.8%) | 147 (2.4%) |
Employment Occupations by Sex in Martinsville
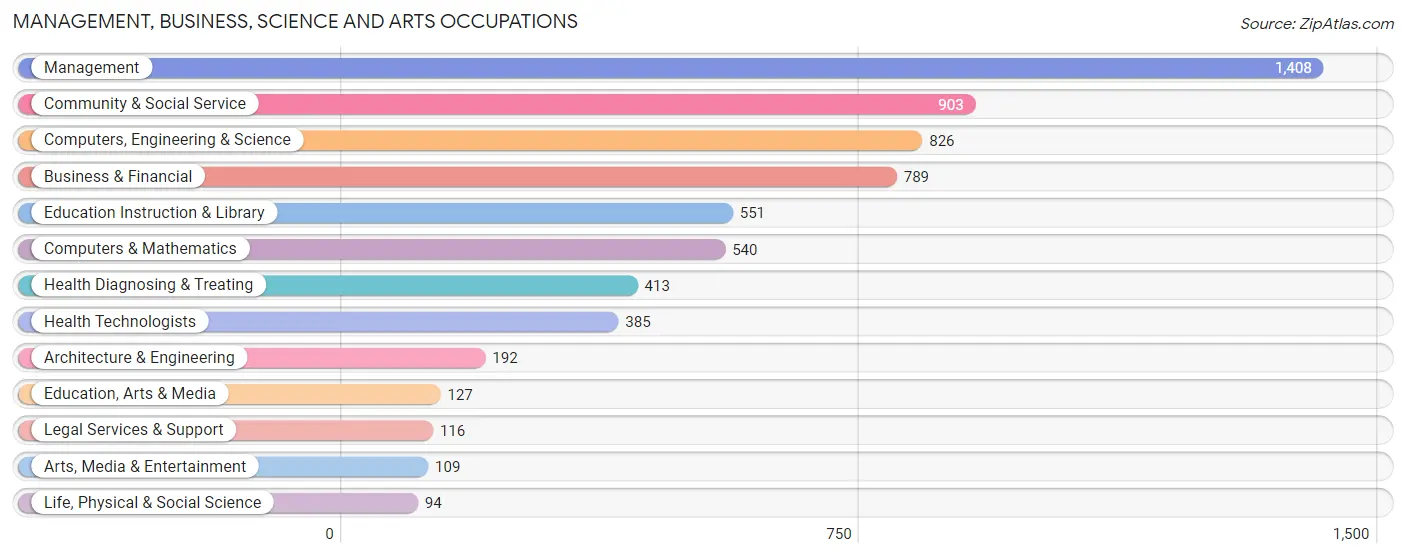
Management, Business, Science and Arts Occupations
The most common Management, Business, Science and Arts occupations in Martinsville are Management (1,408 | 23.0%), Community & Social Service (903 | 14.7%), Computers, Engineering & Science (826 | 13.5%), Business & Financial (789 | 12.9%), and Education Instruction & Library (551 | 9.0%).
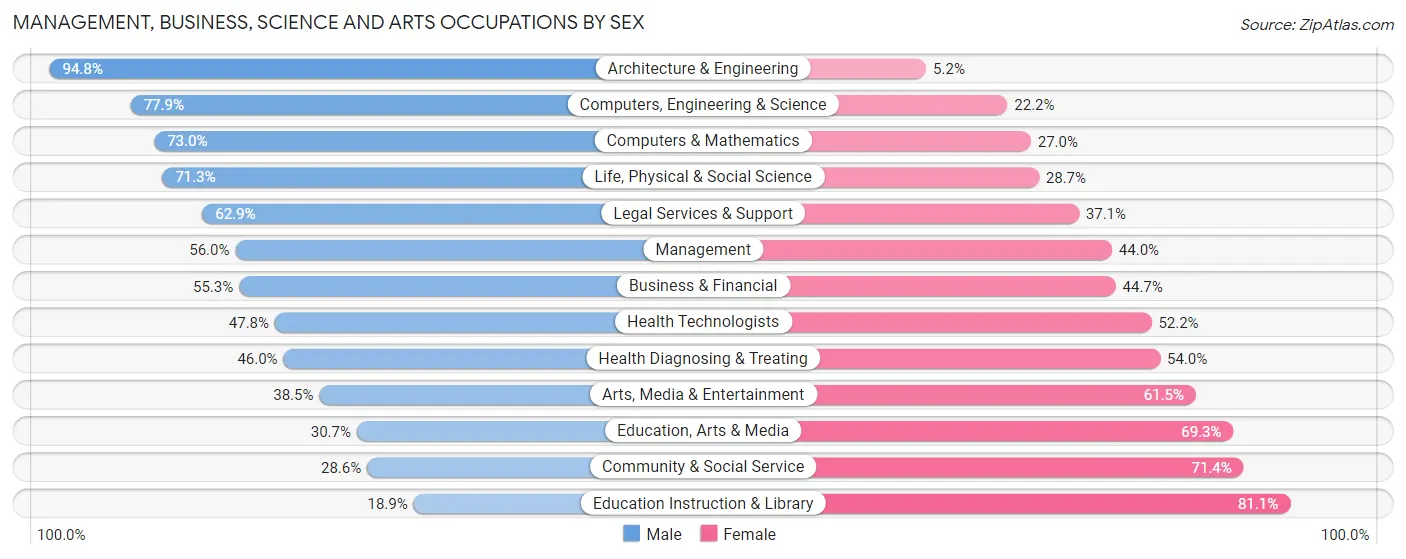
Management, Business, Science and Arts Occupations by Sex
Within the Management, Business, Science and Arts occupations in Martinsville, the most male-oriented occupations are Architecture & Engineering (94.8%), Computers, Engineering & Science (77.8%), and Computers & Mathematics (73.0%), while the most female-oriented occupations are Education Instruction & Library (81.1%), Community & Social Service (71.4%), and Education, Arts & Media (69.3%).
| Occupation | Male | Female |
| Management | 789 (56.0%) | 619 (44.0%) |
| Business & Financial | 436 (55.3%) | 353 (44.7%) |
| Computers, Engineering & Science | 643 (77.8%) | 183 (22.2%) |
| Computers & Mathematics | 394 (73.0%) | 146 (27.0%) |
| Architecture & Engineering | 182 (94.8%) | 10 (5.2%) |
| Life, Physical & Social Science | 67 (71.3%) | 27 (28.7%) |
| Community & Social Service | 258 (28.6%) | 645 (71.4%) |
| Education, Arts & Media | 39 (30.7%) | 88 (69.3%) |
| Legal Services & Support | 73 (62.9%) | 43 (37.1%) |
| Education Instruction & Library | 104 (18.9%) | 447 (81.1%) |
| Arts, Media & Entertainment | 42 (38.5%) | 67 (61.5%) |
| Health Diagnosing & Treating | 190 (46.0%) | 223 (54.0%) |
| Health Technologists | 184 (47.8%) | 201 (52.2%) |
| Total (Category) | 2,316 (53.4%) | 2,023 (46.6%) |
| Total (Overall) | 3,366 (54.9%) | 2,763 (45.1%) |
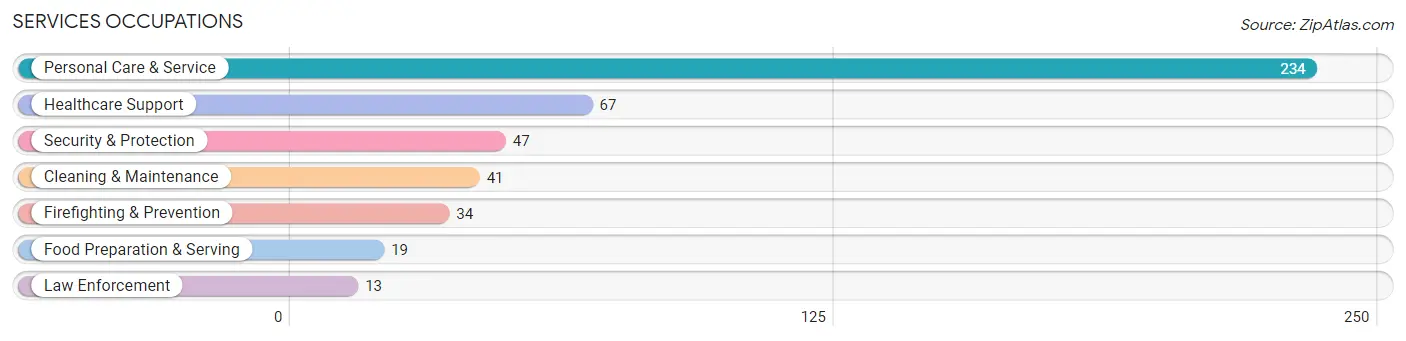
Services Occupations
The most common Services occupations in Martinsville are Personal Care & Service (234 | 3.8%), Healthcare Support (67 | 1.1%), Security & Protection (47 | 0.8%), Cleaning & Maintenance (41 | 0.7%), and Firefighting & Prevention (34 | 0.5%).
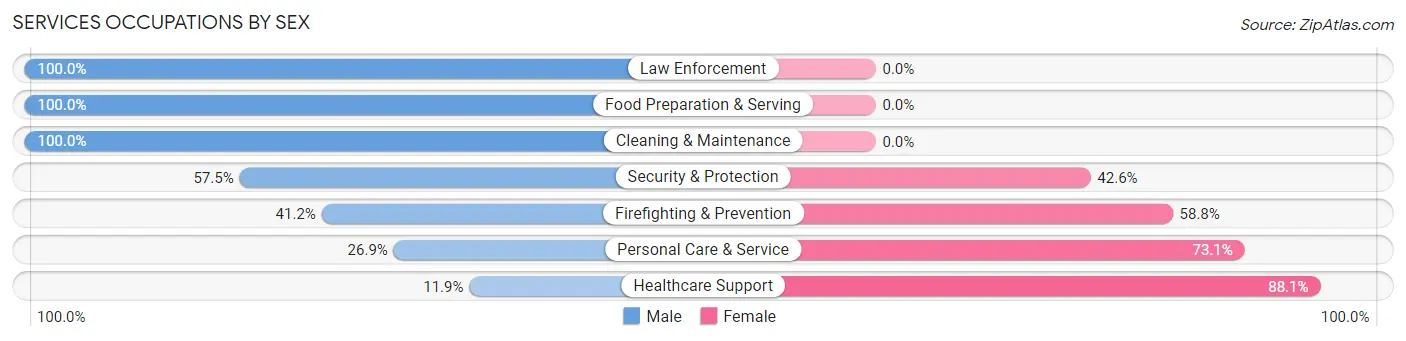
Services Occupations by Sex
Within the Services occupations in Martinsville, the most male-oriented occupations are Law Enforcement (100.0%), Food Preparation & Serving (100.0%), and Cleaning & Maintenance (100.0%), while the most female-oriented occupations are Healthcare Support (88.1%), Personal Care & Service (73.1%), and Firefighting & Prevention (58.8%).
| Occupation | Male | Female |
| Healthcare Support | 8 (11.9%) | 59 (88.1%) |
| Security & Protection | 27 (57.5%) | 20 (42.5%) |
| Firefighting & Prevention | 14 (41.2%) | 20 (58.8%) |
| Law Enforcement | 13 (100.0%) | 0 (0.0%) |
| Food Preparation & Serving | 19 (100.0%) | 0 (0.0%) |
| Cleaning & Maintenance | 41 (100.0%) | 0 (0.0%) |
| Personal Care & Service | 63 (26.9%) | 171 (73.1%) |
| Total (Category) | 158 (38.7%) | 250 (61.3%) |
| Total (Overall) | 3,366 (54.9%) | 2,763 (45.1%) |
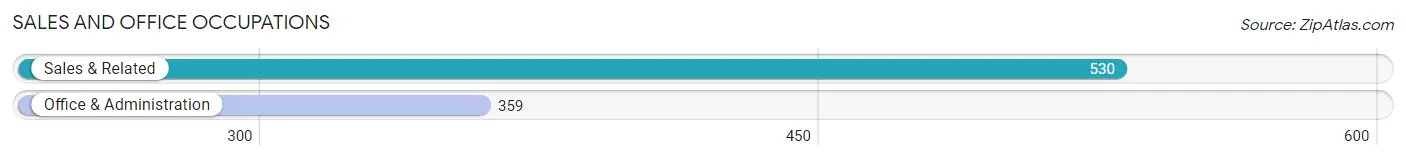
Sales and Office Occupations
The most common Sales and Office occupations in Martinsville are Sales & Related (530 | 8.6%), and Office & Administration (359 | 5.9%).
Sales and Office Occupations by Sex
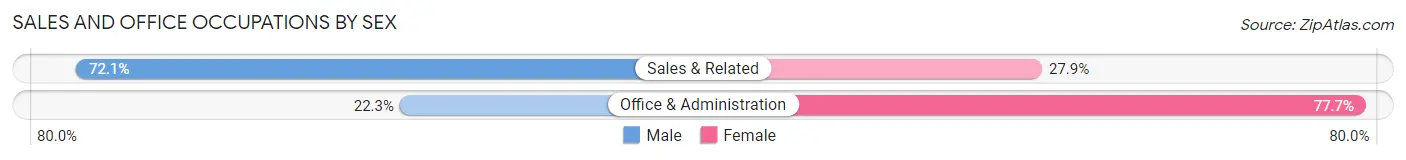
| Occupation | Male | Female |
| Sales & Related | 382 (72.1%) | 148 (27.9%) |
| Office & Administration | 80 (22.3%) | 279 (77.7%) |
| Total (Category) | 462 (52.0%) | 427 (48.0%) |
| Total (Overall) | 3,366 (54.9%) | 2,763 (45.1%) |
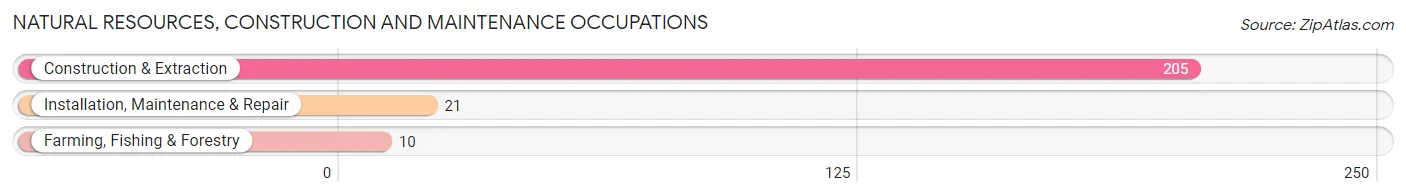
Natural Resources, Construction and Maintenance Occupations
The most common Natural Resources, Construction and Maintenance occupations in Martinsville are Construction & Extraction (205 | 3.3%), Installation, Maintenance & Repair (21 | 0.3%), and Farming, Fishing & Forestry (10 | 0.2%).
Natural Resources, Construction and Maintenance Occupations by Sex
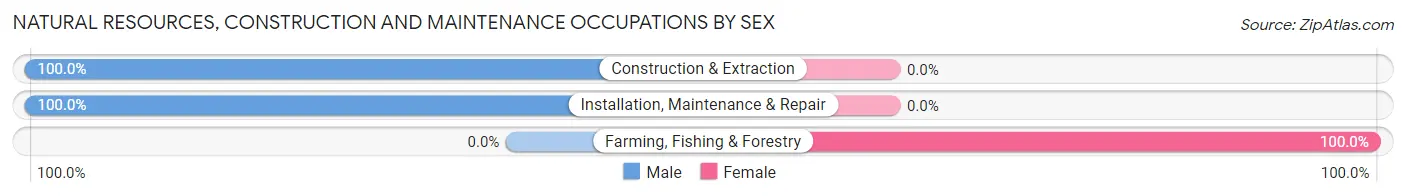
| Occupation | Male | Female |
| Farming, Fishing & Forestry | 0 (0.0%) | 10 (100.0%) |
| Construction & Extraction | 205 (100.0%) | 0 (0.0%) |
| Installation, Maintenance & Repair | 21 (100.0%) | 0 (0.0%) |
| Total (Category) | 226 (95.8%) | 10 (4.2%) |
| Total (Overall) | 3,366 (54.9%) | 2,763 (45.1%) |
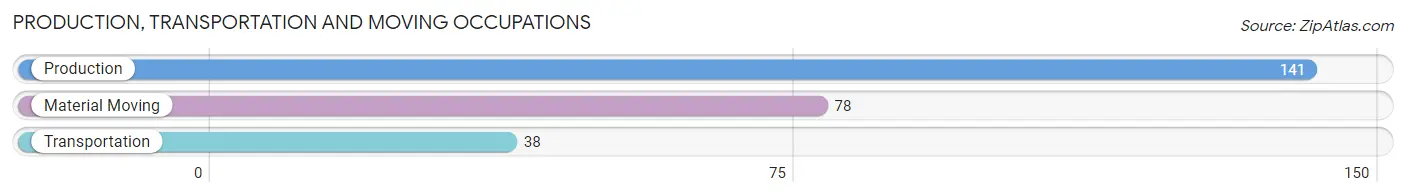
Production, Transportation and Moving Occupations
The most common Production, Transportation and Moving occupations in Martinsville are Production (141 | 2.3%), Material Moving (78 | 1.3%), and Transportation (38 | 0.6%).
Production, Transportation and Moving Occupations by Sex
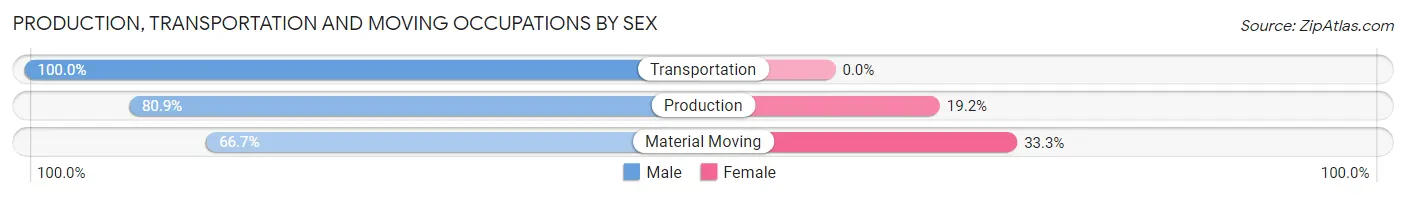
| Occupation | Male | Female |
| Production | 114 (80.8%) | 27 (19.2%) |
| Transportation | 38 (100.0%) | 0 (0.0%) |
| Material Moving | 52 (66.7%) | 26 (33.3%) |
| Total (Category) | 204 (79.4%) | 53 (20.6%) |
| Total (Overall) | 3,366 (54.9%) | 2,763 (45.1%) |
Employment Industries by Sex in Martinsville
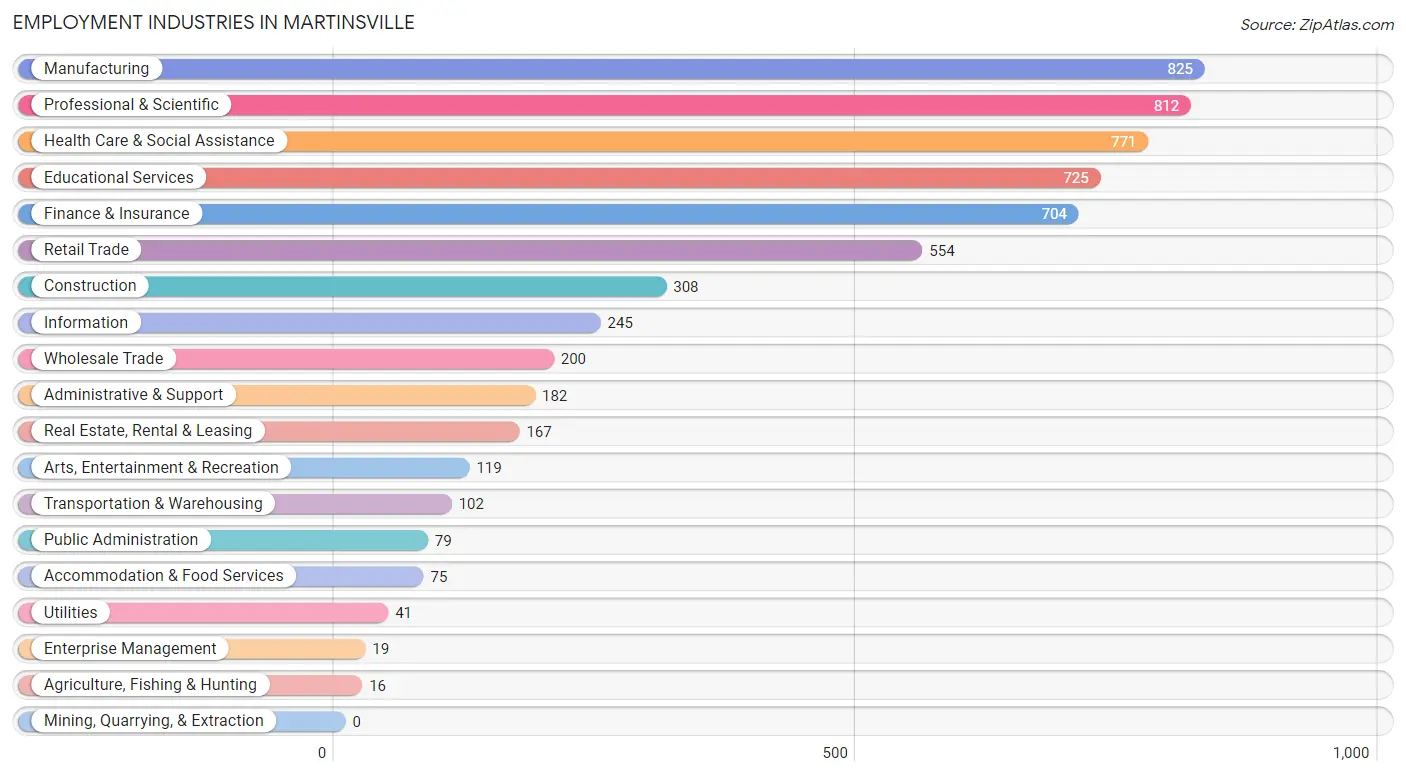
Employment Industries in Martinsville
The major employment industries in Martinsville include Manufacturing (825 | 13.5%), Professional & Scientific (812 | 13.3%), Health Care & Social Assistance (771 | 12.6%), Educational Services (725 | 11.8%), and Finance & Insurance (704 | 11.5%).
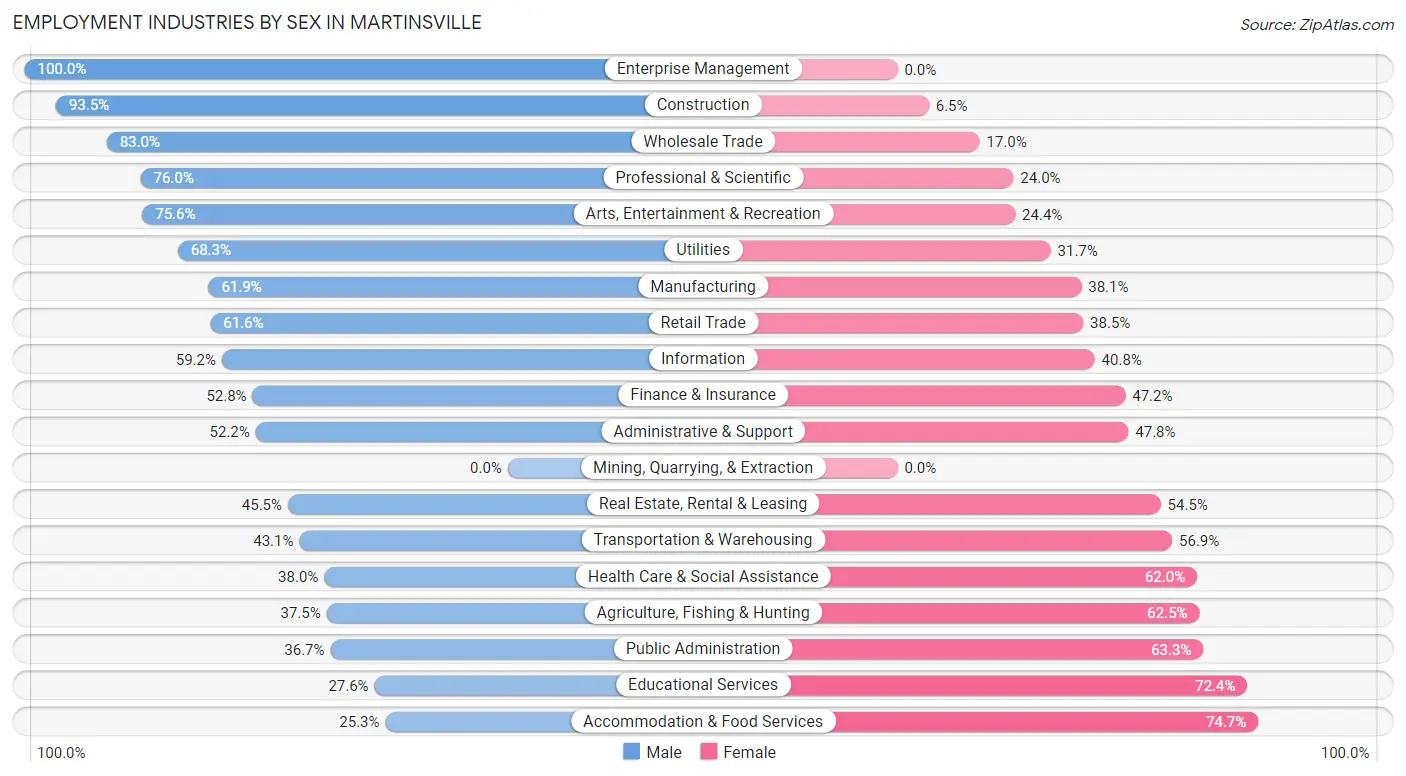
Employment Industries by Sex in Martinsville
The Martinsville industries that see more men than women are Enterprise Management (100.0%), Construction (93.5%), and Wholesale Trade (83.0%), whereas the industries that tend to have a higher number of women are Accommodation & Food Services (74.7%), Educational Services (72.4%), and Public Administration (63.3%).
| Industry | Male | Female |
| Agriculture, Fishing & Hunting | 6 (37.5%) | 10 (62.5%) |
| Mining, Quarrying, & Extraction | 0 (0.0%) | 0 (0.0%) |
| Construction | 288 (93.5%) | 20 (6.5%) |
| Manufacturing | 511 (61.9%) | 314 (38.1%) |
| Wholesale Trade | 166 (83.0%) | 34 (17.0%) |
| Retail Trade | 341 (61.6%) | 213 (38.5%) |
| Transportation & Warehousing | 44 (43.1%) | 58 (56.9%) |
| Utilities | 28 (68.3%) | 13 (31.7%) |
| Information | 145 (59.2%) | 100 (40.8%) |
| Finance & Insurance | 372 (52.8%) | 332 (47.2%) |
| Real Estate, Rental & Leasing | 76 (45.5%) | 91 (54.5%) |
| Professional & Scientific | 617 (76.0%) | 195 (24.0%) |
| Enterprise Management | 19 (100.0%) | 0 (0.0%) |
| Administrative & Support | 95 (52.2%) | 87 (47.8%) |
| Educational Services | 200 (27.6%) | 525 (72.4%) |
| Health Care & Social Assistance | 293 (38.0%) | 478 (62.0%) |
| Arts, Entertainment & Recreation | 90 (75.6%) | 29 (24.4%) |
| Accommodation & Food Services | 19 (25.3%) | 56 (74.7%) |
| Public Administration | 29 (36.7%) | 50 (63.3%) |
| Total | 3,366 (54.9%) | 2,763 (45.1%) |
Education in Martinsville
School Enrollment in Martinsville
The most common levels of schooling among the 2,979 students in Martinsville are high school (763 | 25.6%), middle school (599 | 20.1%), and elementary school (524 | 17.6%).
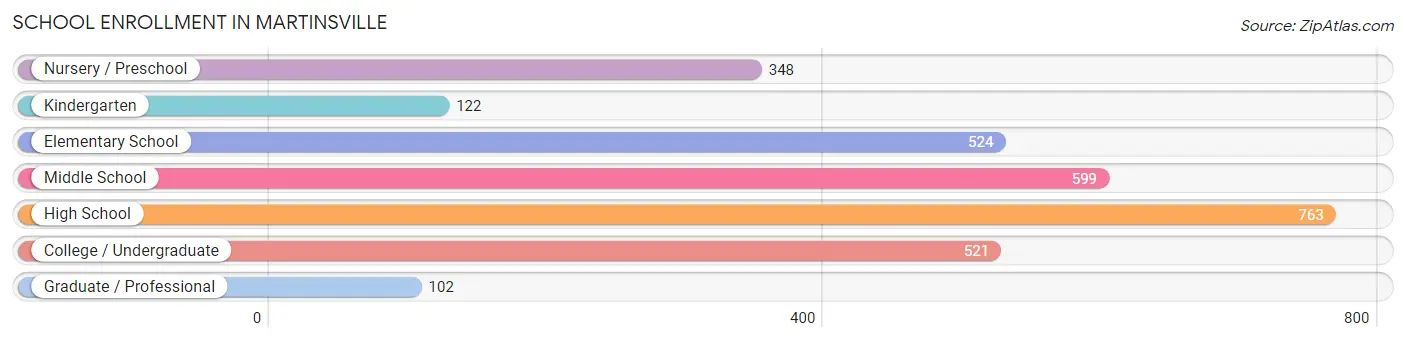
| School Level | # Students | % Students |
| Nursery / Preschool | 348 | 11.7% |
| Kindergarten | 122 | 4.1% |
| Elementary School | 524 | 17.6% |
| Middle School | 599 | 20.1% |
| High School | 763 | 25.6% |
| College / Undergraduate | 521 | 17.5% |
| Graduate / Professional | 102 | 3.4% |
| Total | 2,979 | 100.0% |
School Enrollment by Age by Funding Source in Martinsville
Out of a total of 2,979 students who are enrolled in schools in Martinsville, 730 (24.5%) attend a private institution, while the remaining 2,249 (75.5%) are enrolled in public schools. The age group of 20 to 24 year olds has the highest likelihood of being enrolled in private schools, with 225 (64.8% in the age bracket) enrolled. Conversely, the age group of 25 to 34 year olds has the lowest likelihood of being enrolled in a private school, with 61 (100.0% in the age bracket) attending a public institution.
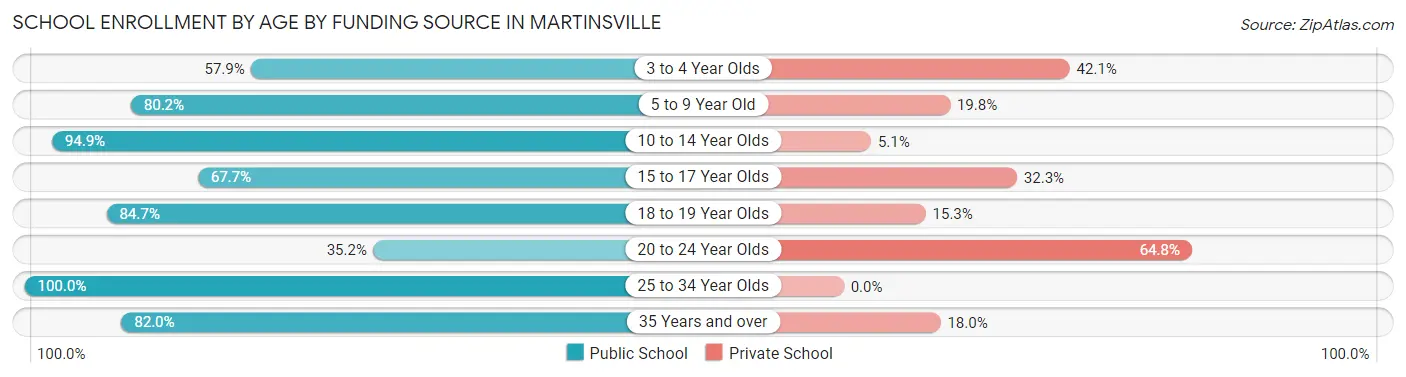
| Age Bracket | Public School | Private School |
| 3 to 4 Year Olds | 172 (57.9%) | 125 (42.1%) |
| 5 to 9 Year Old | 470 (80.2%) | 116 (19.8%) |
| 10 to 14 Year Olds | 802 (94.9%) | 43 (5.1%) |
| 15 to 17 Year Olds | 361 (67.7%) | 172 (32.3%) |
| 18 to 19 Year Olds | 211 (84.7%) | 38 (15.3%) |
| 20 to 24 Year Olds | 122 (35.2%) | 225 (64.8%) |
| 25 to 34 Year Olds | 61 (100.0%) | 0 (0.0%) |
| 35 Years and over | 50 (82.0%) | 11 (18.0%) |
| Total | 2,249 (75.5%) | 730 (24.5%) |
Educational Attainment by Field of Study in Martinsville
Business (1,392 | 22.3%), engineering (938 | 15.1%), social sciences (574 | 9.2%), education (468 | 7.5%), and science & technology (461 | 7.4%) are the most common fields of study among 6,230 individuals in Martinsville who have obtained a bachelor's degree or higher.
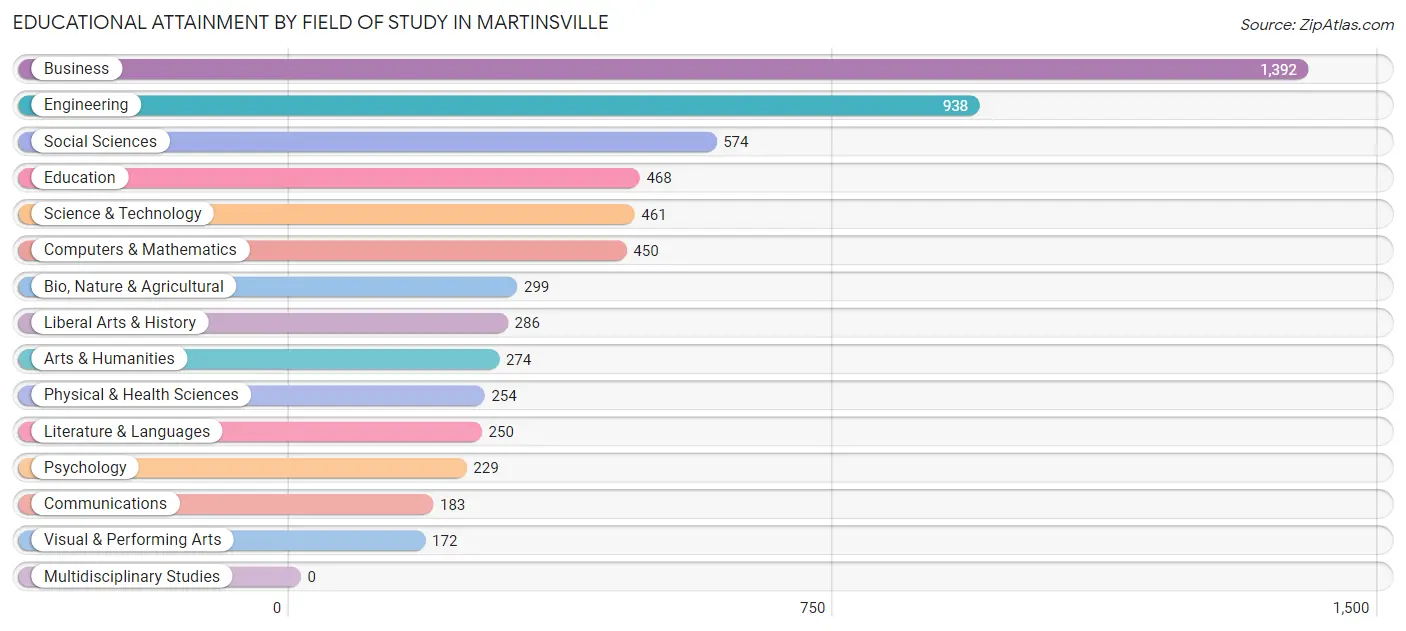
| Field of Study | # Graduates | % Graduates |
| Computers & Mathematics | 450 | 7.2% |
| Bio, Nature & Agricultural | 299 | 4.8% |
| Physical & Health Sciences | 254 | 4.1% |
| Psychology | 229 | 3.7% |
| Social Sciences | 574 | 9.2% |
| Engineering | 938 | 15.1% |
| Multidisciplinary Studies | 0 | 0.0% |
| Science & Technology | 461 | 7.4% |
| Business | 1,392 | 22.3% |
| Education | 468 | 7.5% |
| Literature & Languages | 250 | 4.0% |
| Liberal Arts & History | 286 | 4.6% |
| Visual & Performing Arts | 172 | 2.8% |
| Communications | 183 | 2.9% |
| Arts & Humanities | 274 | 4.4% |
| Total | 6,230 | 100.0% |
Transportation & Commute in Martinsville
Vehicle Availability by Sex in Martinsville
The most prevalent vehicle ownership categories in Martinsville are males with 2 vehicles (1,499, accounting for 44.9%) and females with 2 vehicles (1,036, making up 57.4%).
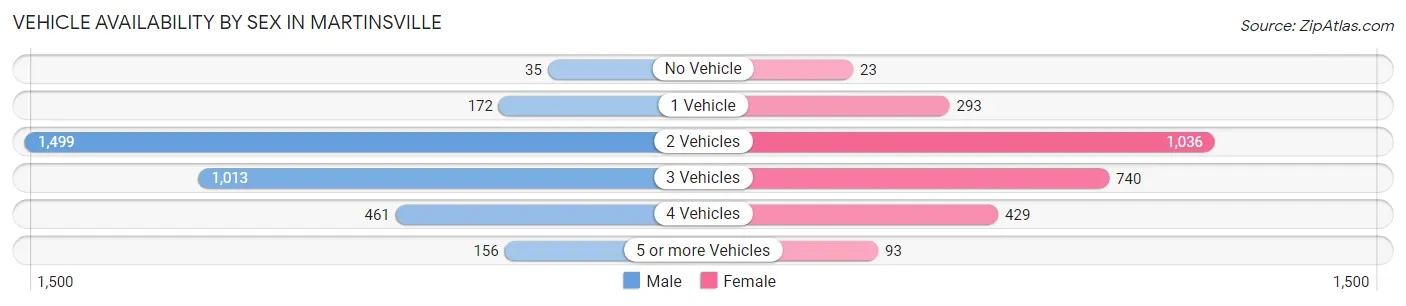
| Vehicles Available | Male | Female |
| No Vehicle | 35 (1.1%) | 23 (0.9%) |
| 1 Vehicle | 172 (5.2%) | 293 (11.2%) |
| 2 Vehicles | 1,499 (44.9%) | 1,036 (39.6%) |
| 3 Vehicles | 1,013 (30.4%) | 740 (28.3%) |
| 4 Vehicles | 461 (13.8%) | 429 (16.4%) |
| 5 or more Vehicles | 156 (4.7%) | 93 (3.6%) |
| Total | 3,336 (100.0%) | 2,614 (100.0%) |
Commute Time in Martinsville
The most frequently occuring commute durations in Martinsville are 30 to 34 minutes (783 commuters, 16.3%), 20 to 24 minutes (721 commuters, 15.0%), and 15 to 19 minutes (560 commuters, 11.6%).
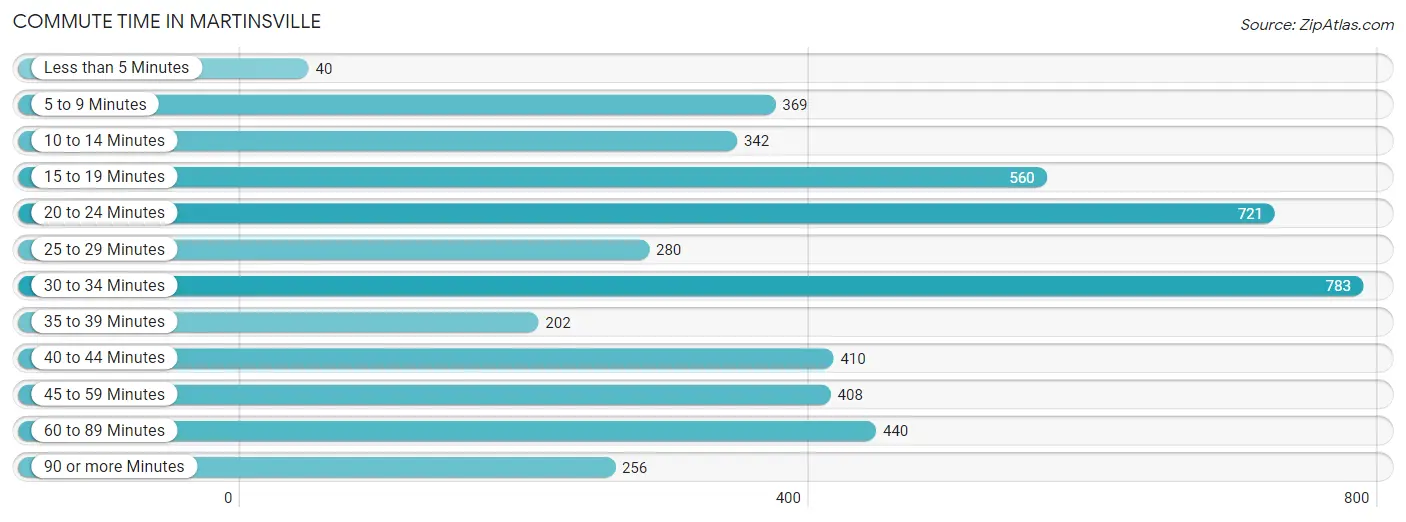
| Commute Time | # Commuters | % Commuters |
| Less than 5 Minutes | 40 | 0.8% |
| 5 to 9 Minutes | 369 | 7.7% |
| 10 to 14 Minutes | 342 | 7.1% |
| 15 to 19 Minutes | 560 | 11.6% |
| 20 to 24 Minutes | 721 | 15.0% |
| 25 to 29 Minutes | 280 | 5.8% |
| 30 to 34 Minutes | 783 | 16.3% |
| 35 to 39 Minutes | 202 | 4.2% |
| 40 to 44 Minutes | 410 | 8.5% |
| 45 to 59 Minutes | 408 | 8.5% |
| 60 to 89 Minutes | 440 | 9.1% |
| 90 or more Minutes | 256 | 5.3% |
Commute Time by Sex in Martinsville
The most common commute times in Martinsville are 30 to 34 minutes (414 commuters, 15.7%) for males and 30 to 34 minutes (369 commuters, 17.0%) for females.
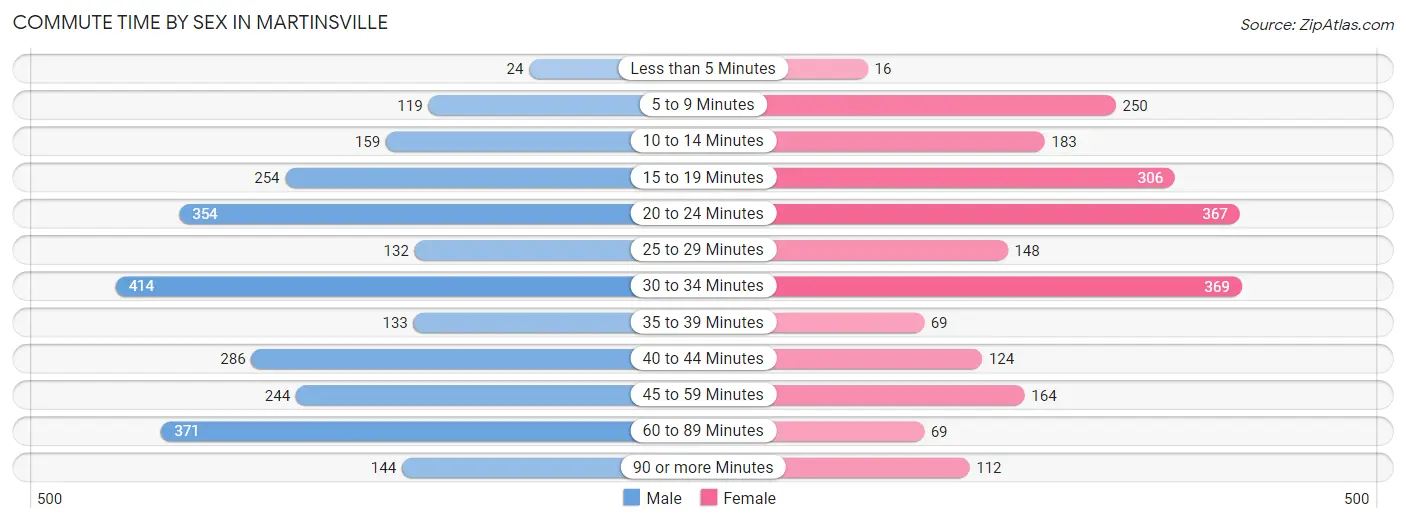
| Commute Time | Male | Female |
| Less than 5 Minutes | 24 (0.9%) | 16 (0.7%) |
| 5 to 9 Minutes | 119 (4.5%) | 250 (11.5%) |
| 10 to 14 Minutes | 159 (6.0%) | 183 (8.4%) |
| 15 to 19 Minutes | 254 (9.6%) | 306 (14.1%) |
| 20 to 24 Minutes | 354 (13.4%) | 367 (16.9%) |
| 25 to 29 Minutes | 132 (5.0%) | 148 (6.8%) |
| 30 to 34 Minutes | 414 (15.7%) | 369 (17.0%) |
| 35 to 39 Minutes | 133 (5.1%) | 69 (3.2%) |
| 40 to 44 Minutes | 286 (10.9%) | 124 (5.7%) |
| 45 to 59 Minutes | 244 (9.3%) | 164 (7.5%) |
| 60 to 89 Minutes | 371 (14.1%) | 69 (3.2%) |
| 90 or more Minutes | 144 (5.5%) | 112 (5.1%) |
Time of Departure to Work by Sex in Martinsville
The most frequent times of departure to work in Martinsville are 8:00 AM to 8:29 AM (548, 20.8%) for males and 8:00 AM to 8:29 AM (543, 24.9%) for females.
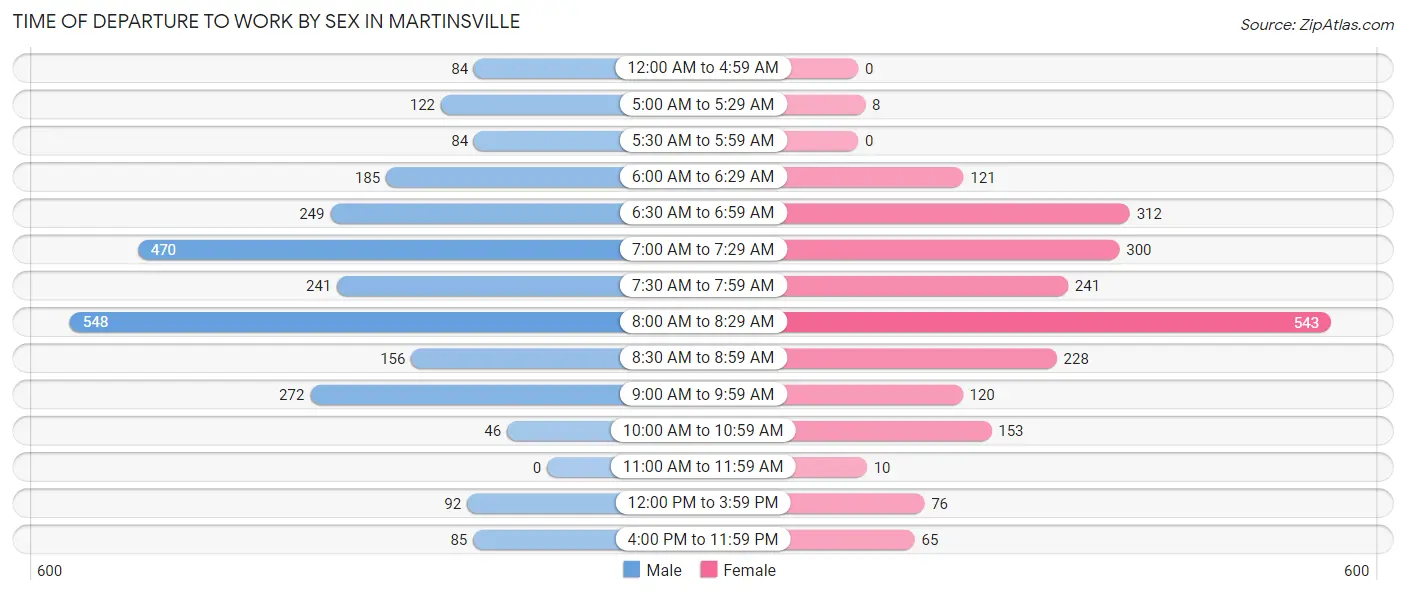
| Time of Departure | Male | Female |
| 12:00 AM to 4:59 AM | 84 (3.2%) | 0 (0.0%) |
| 5:00 AM to 5:29 AM | 122 (4.6%) | 8 (0.4%) |
| 5:30 AM to 5:59 AM | 84 (3.2%) | 0 (0.0%) |
| 6:00 AM to 6:29 AM | 185 (7.0%) | 121 (5.6%) |
| 6:30 AM to 6:59 AM | 249 (9.5%) | 312 (14.3%) |
| 7:00 AM to 7:29 AM | 470 (17.8%) | 300 (13.8%) |
| 7:30 AM to 7:59 AM | 241 (9.1%) | 241 (11.1%) |
| 8:00 AM to 8:29 AM | 548 (20.8%) | 543 (24.9%) |
| 8:30 AM to 8:59 AM | 156 (5.9%) | 228 (10.5%) |
| 9:00 AM to 9:59 AM | 272 (10.3%) | 120 (5.5%) |
| 10:00 AM to 10:59 AM | 46 (1.8%) | 153 (7.0%) |
| 11:00 AM to 11:59 AM | 0 (0.0%) | 10 (0.5%) |
| 12:00 PM to 3:59 PM | 92 (3.5%) | 76 (3.5%) |
| 4:00 PM to 11:59 PM | 85 (3.2%) | 65 (3.0%) |
| Total | 2,634 (100.0%) | 2,177 (100.0%) |
Housing Occupancy in Martinsville
Occupancy by Ownership in Martinsville
Of the total 4,246 dwellings in Martinsville, owner-occupied units account for 4,012 (94.5%), while renter-occupied units make up 234 (5.5%).
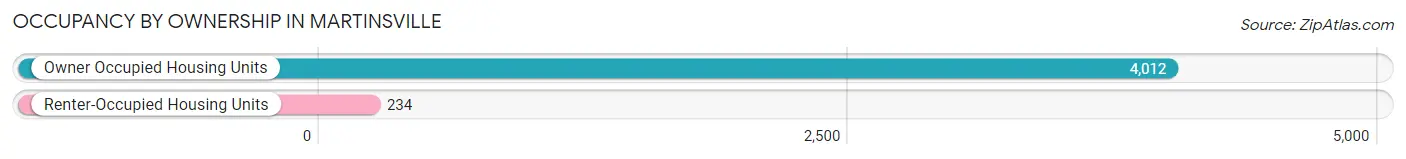
| Occupancy | # Housing Units | % Housing Units |
| Owner Occupied Housing Units | 4,012 | 94.5% |
| Renter-Occupied Housing Units | 234 | 5.5% |
| Total Occupied Housing Units | 4,246 | 100.0% |
Occupancy by Household Size in Martinsville
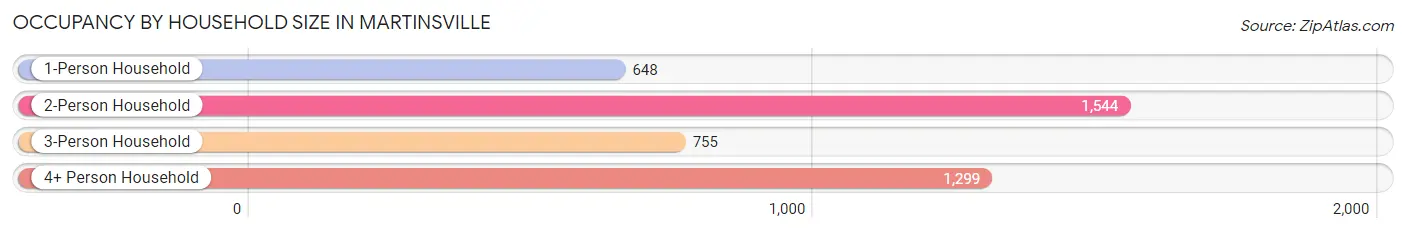
| Household Size | # Housing Units | % Housing Units |
| 1-Person Household | 648 | 15.3% |
| 2-Person Household | 1,544 | 36.4% |
| 3-Person Household | 755 | 17.8% |
| 4+ Person Household | 1,299 | 30.6% |
| Total Housing Units | 4,246 | 100.0% |
Occupancy by Ownership by Household Size in Martinsville
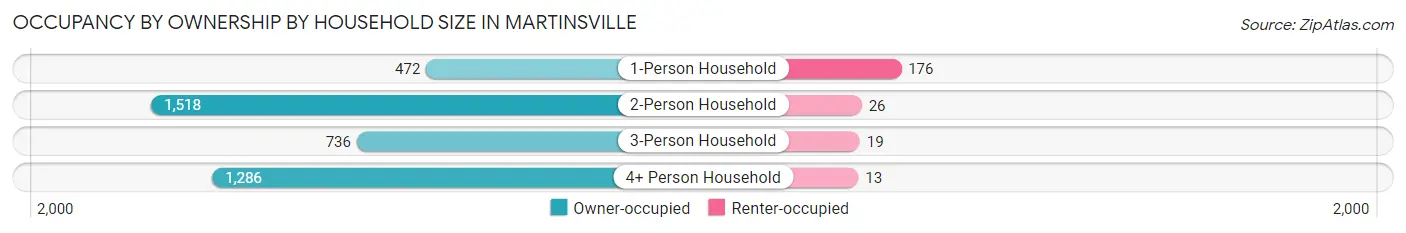
| Household Size | Owner-occupied | Renter-occupied |
| 1-Person Household | 472 (72.8%) | 176 (27.2%) |
| 2-Person Household | 1,518 (98.3%) | 26 (1.7%) |
| 3-Person Household | 736 (97.5%) | 19 (2.5%) |
| 4+ Person Household | 1,286 (99.0%) | 13 (1.0%) |
| Total Housing Units | 4,012 (94.5%) | 234 (5.5%) |
Occupancy by Educational Attainment in Martinsville
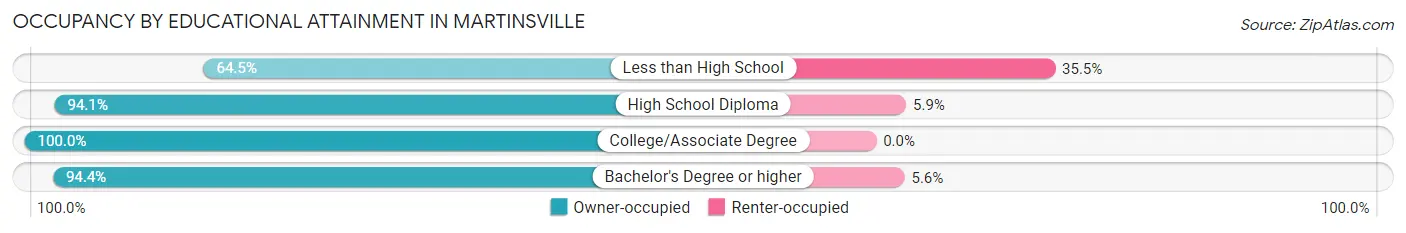
| Household Size | Owner-occupied | Renter-occupied |
| Less than High School | 60 (64.5%) | 33 (35.5%) |
| High School Diploma | 412 (94.1%) | 26 (5.9%) |
| College/Associate Degree | 608 (100.0%) | 0 (0.0%) |
| Bachelor's Degree or higher | 2,932 (94.4%) | 175 (5.6%) |
Occupancy by Age of Householder in Martinsville
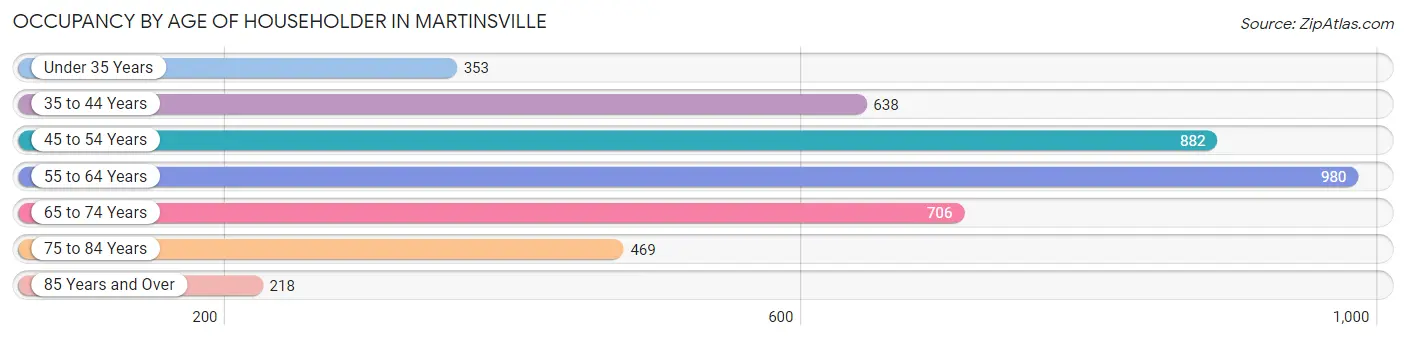
| Age Bracket | # Households | % Households |
| Under 35 Years | 353 | 8.3% |
| 35 to 44 Years | 638 | 15.0% |
| 45 to 54 Years | 882 | 20.8% |
| 55 to 64 Years | 980 | 23.1% |
| 65 to 74 Years | 706 | 16.6% |
| 75 to 84 Years | 469 | 11.1% |
| 85 Years and Over | 218 | 5.1% |
| Total | 4,246 | 100.0% |
Housing Finances in Martinsville
Median Income by Occupancy in Martinsville
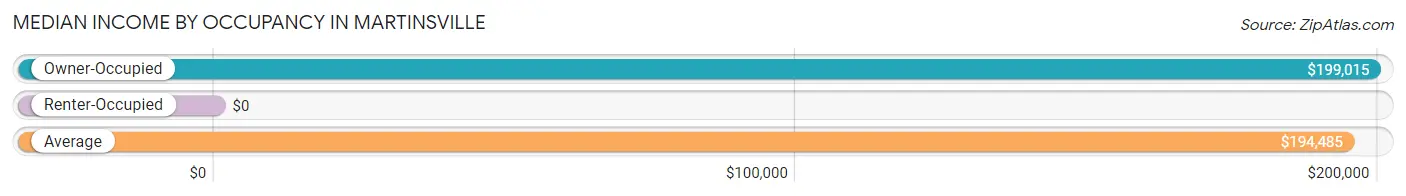
| Occupancy Type | # Households | Median Income |
| Owner-Occupied | 4,012 (94.5%) | $199,015 |
| Renter-Occupied | 234 (5.5%) | $0 |
| Average | 4,246 (100.0%) | $194,485 |
Occupancy by Householder Income Bracket in Martinsville
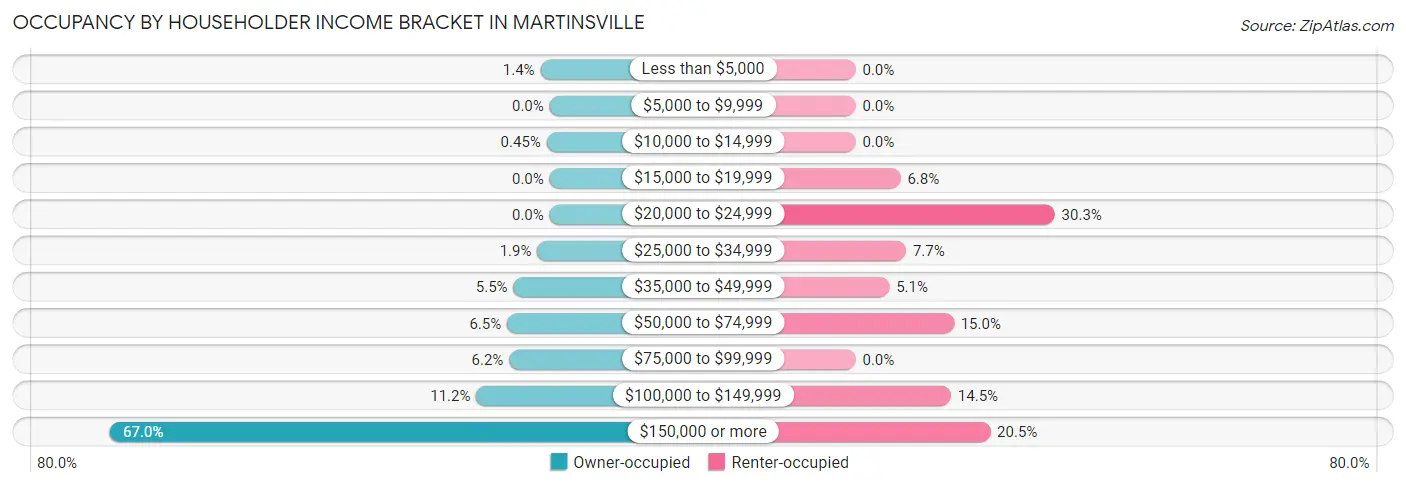
| Income Bracket | Owner-occupied | Renter-occupied |
| Less than $5,000 | 56 (1.4%) | 0 (0.0%) |
| $5,000 to $9,999 | 0 (0.0%) | 0 (0.0%) |
| $10,000 to $14,999 | 18 (0.4%) | 0 (0.0%) |
| $15,000 to $19,999 | 0 (0.0%) | 16 (6.8%) |
| $20,000 to $24,999 | 0 (0.0%) | 71 (30.3%) |
| $25,000 to $34,999 | 75 (1.9%) | 18 (7.7%) |
| $35,000 to $49,999 | 221 (5.5%) | 12 (5.1%) |
| $50,000 to $74,999 | 260 (6.5%) | 35 (15.0%) |
| $75,000 to $99,999 | 247 (6.2%) | 0 (0.0%) |
| $100,000 to $149,999 | 448 (11.2%) | 34 (14.5%) |
| $150,000 or more | 2,687 (67.0%) | 48 (20.5%) |
| Total | 4,012 (100.0%) | 234 (100.0%) |
Monthly Housing Cost Tiers in Martinsville
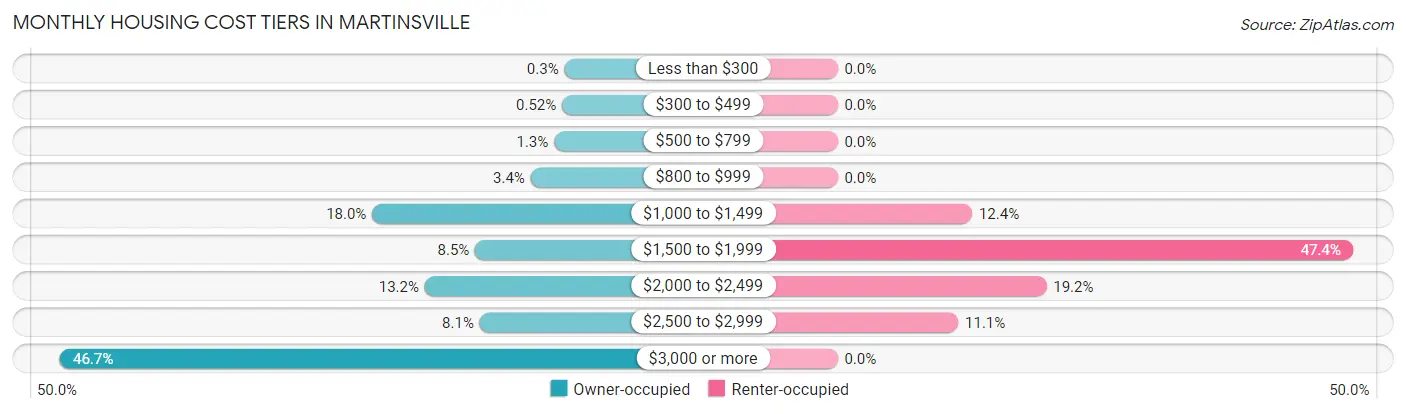
| Monthly Cost | Owner-occupied | Renter-occupied |
| Less than $300 | 12 (0.3%) | 0 (0.0%) |
| $300 to $499 | 21 (0.5%) | 0 (0.0%) |
| $500 to $799 | 50 (1.3%) | 0 (0.0%) |
| $800 to $999 | 137 (3.4%) | 0 (0.0%) |
| $1,000 to $1,499 | 722 (18.0%) | 29 (12.4%) |
| $1,500 to $1,999 | 342 (8.5%) | 111 (47.4%) |
| $2,000 to $2,499 | 528 (13.2%) | 45 (19.2%) |
| $2,500 to $2,999 | 325 (8.1%) | 26 (11.1%) |
| $3,000 or more | 1,875 (46.7%) | 0 (0.0%) |
| Total | 4,012 (100.0%) | 234 (100.0%) |
Physical Housing Characteristics in Martinsville
Housing Structures in Martinsville
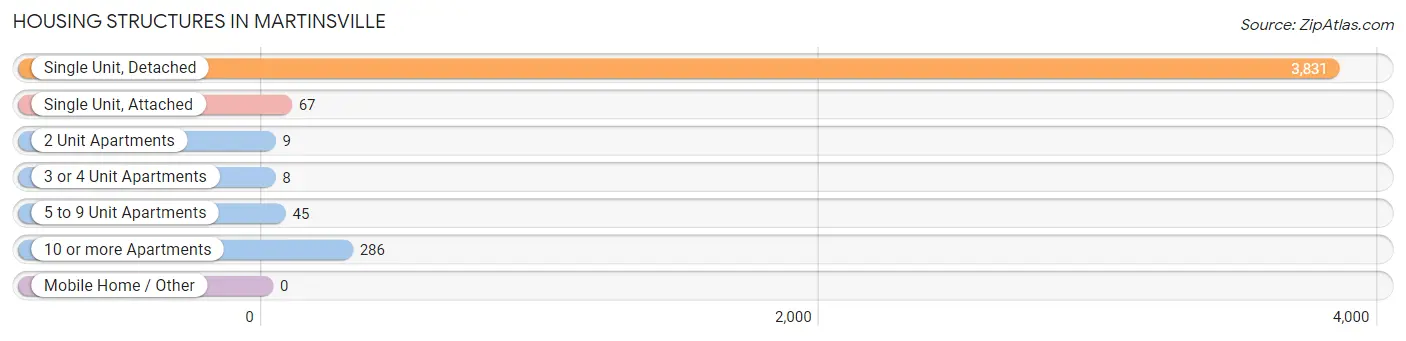
| Structure Type | # Housing Units | % Housing Units |
| Single Unit, Detached | 3,831 | 90.2% |
| Single Unit, Attached | 67 | 1.6% |
| 2 Unit Apartments | 9 | 0.2% |
| 3 or 4 Unit Apartments | 8 | 0.2% |
| 5 to 9 Unit Apartments | 45 | 1.1% |
| 10 or more Apartments | 286 | 6.7% |
| Mobile Home / Other | 0 | 0.0% |
| Total | 4,246 | 100.0% |
Housing Structures by Occupancy in Martinsville
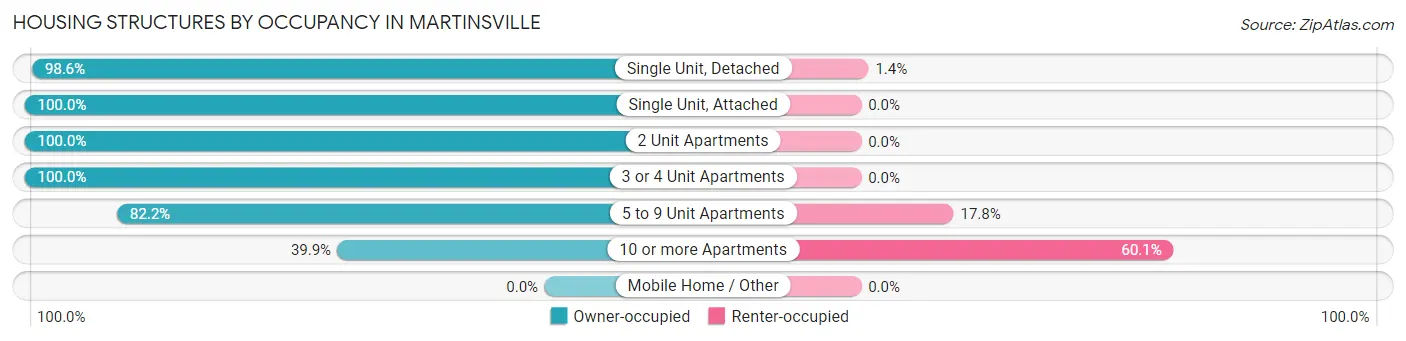
| Structure Type | Owner-occupied | Renter-occupied |
| Single Unit, Detached | 3,777 (98.6%) | 54 (1.4%) |
| Single Unit, Attached | 67 (100.0%) | 0 (0.0%) |
| 2 Unit Apartments | 9 (100.0%) | 0 (0.0%) |
| 3 or 4 Unit Apartments | 8 (100.0%) | 0 (0.0%) |
| 5 to 9 Unit Apartments | 37 (82.2%) | 8 (17.8%) |
| 10 or more Apartments | 114 (39.9%) | 172 (60.1%) |
| Mobile Home / Other | 0 (0.0%) | 0 (0.0%) |
| Total | 4,012 (94.5%) | 234 (5.5%) |
Housing Structures by Number of Rooms in Martinsville
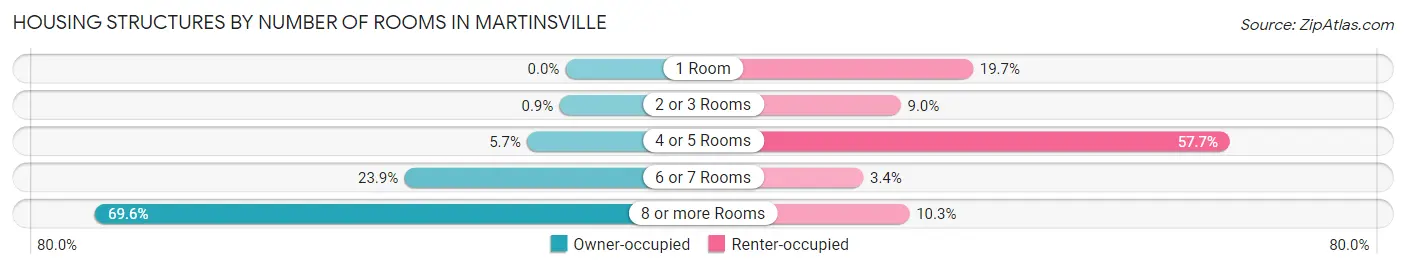
| Number of Rooms | Owner-occupied | Renter-occupied |
| 1 Room | 0 (0.0%) | 46 (19.7%) |
| 2 or 3 Rooms | 36 (0.9%) | 21 (9.0%) |
| 4 or 5 Rooms | 228 (5.7%) | 135 (57.7%) |
| 6 or 7 Rooms | 957 (23.8%) | 8 (3.4%) |
| 8 or more Rooms | 2,791 (69.6%) | 24 (10.3%) |
| Total | 4,012 (100.0%) | 234 (100.0%) |
Housing Structure by Heating Type in Martinsville
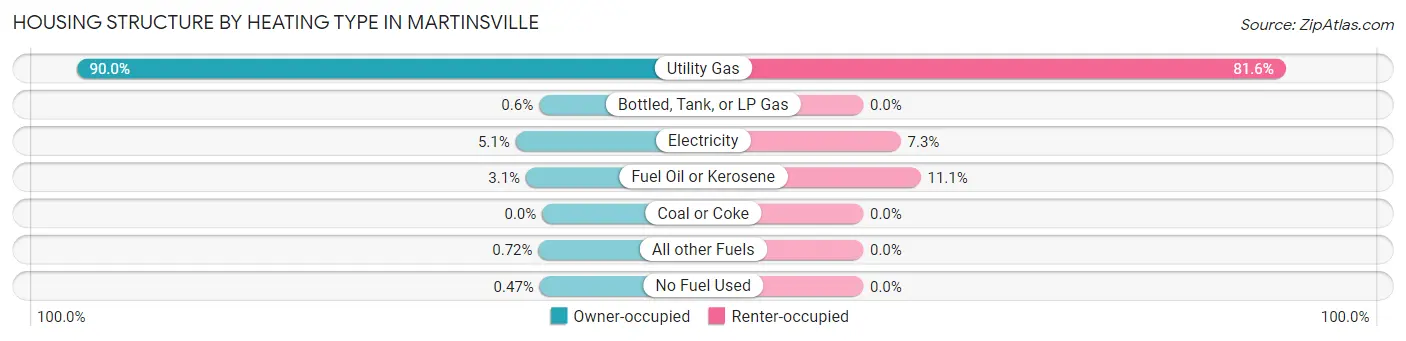
| Heating Type | Owner-occupied | Renter-occupied |
| Utility Gas | 3,609 (90.0%) | 191 (81.6%) |
| Bottled, Tank, or LP Gas | 24 (0.6%) | 0 (0.0%) |
| Electricity | 206 (5.1%) | 17 (7.3%) |
| Fuel Oil or Kerosene | 125 (3.1%) | 26 (11.1%) |
| Coal or Coke | 0 (0.0%) | 0 (0.0%) |
| All other Fuels | 29 (0.7%) | 0 (0.0%) |
| No Fuel Used | 19 (0.5%) | 0 (0.0%) |
| Total | 4,012 (100.0%) | 234 (100.0%) |
Household Vehicle Usage in Martinsville
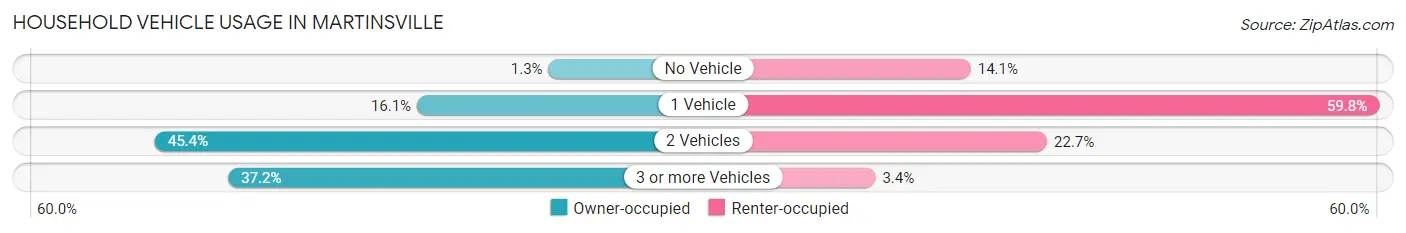
| Vehicles per Household | Owner-occupied | Renter-occupied |
| No Vehicle | 53 (1.3%) | 33 (14.1%) |
| 1 Vehicle | 644 (16.1%) | 140 (59.8%) |
| 2 Vehicles | 1,822 (45.4%) | 53 (22.7%) |
| 3 or more Vehicles | 1,493 (37.2%) | 8 (3.4%) |
| Total | 4,012 (100.0%) | 234 (100.0%) |
Real Estate & Mortgages in Martinsville
Real Estate and Mortgage Overview in Martinsville
| Characteristic | Without Mortgage | With Mortgage |
| Housing Units | 1,554 | 2,458 |
| Median Property Value | $638,300 | $677,600 |
| Median Household Income | $151,094 | $1,903 |
| Monthly Housing Costs | $1,382 | $1,781 |
| Real Estate Taxes | $10,001 | $0 |
Property Value by Mortgage Status in Martinsville
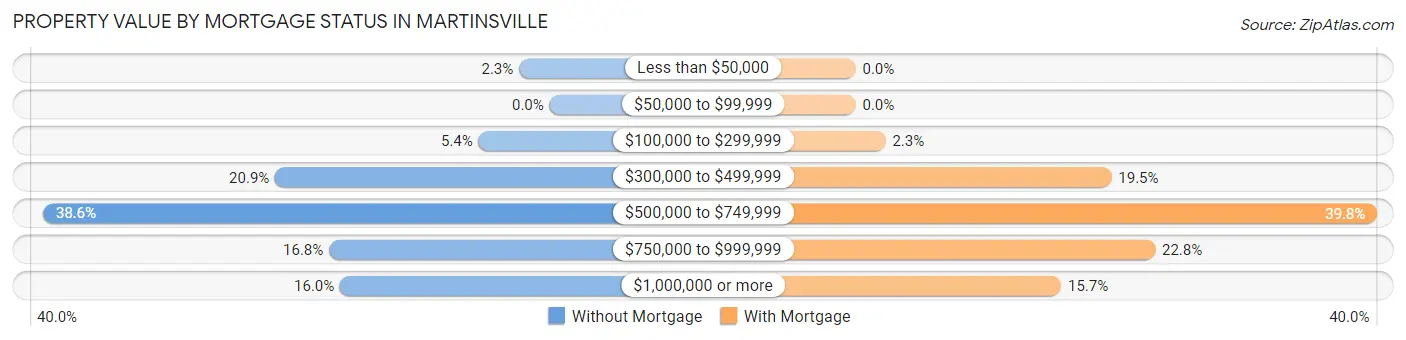
| Property Value | Without Mortgage | With Mortgage |
| Less than $50,000 | 36 (2.3%) | 0 (0.0%) |
| $50,000 to $99,999 | 0 (0.0%) | 0 (0.0%) |
| $100,000 to $299,999 | 84 (5.4%) | 56 (2.3%) |
| $300,000 to $499,999 | 325 (20.9%) | 479 (19.5%) |
| $500,000 to $749,999 | 600 (38.6%) | 977 (39.8%) |
| $750,000 to $999,999 | 261 (16.8%) | 561 (22.8%) |
| $1,000,000 or more | 248 (16.0%) | 385 (15.7%) |
| Total | 1,554 (100.0%) | 2,458 (100.0%) |
Household Income by Mortgage Status in Martinsville
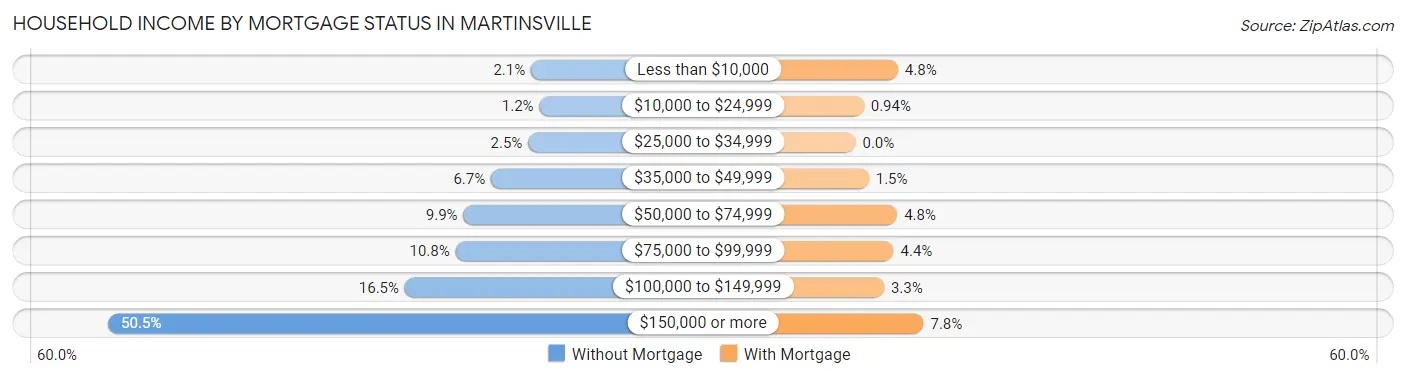
| Household Income | Without Mortgage | With Mortgage |
| Less than $10,000 | 33 (2.1%) | 119 (4.8%) |
| $10,000 to $24,999 | 18 (1.2%) | 23 (0.9%) |
| $25,000 to $34,999 | 38 (2.5%) | 0 (0.0%) |
| $35,000 to $49,999 | 104 (6.7%) | 37 (1.5%) |
| $50,000 to $74,999 | 153 (9.9%) | 117 (4.8%) |
| $75,000 to $99,999 | 167 (10.7%) | 107 (4.3%) |
| $100,000 to $149,999 | 257 (16.5%) | 80 (3.3%) |
| $150,000 or more | 784 (50.4%) | 191 (7.8%) |
| Total | 1,554 (100.0%) | 2,458 (100.0%) |
Property Value to Household Income Ratio in Martinsville
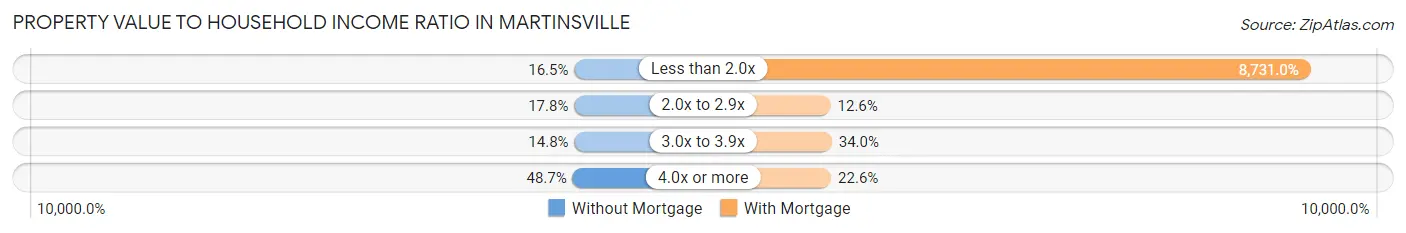
| Value-to-Income Ratio | Without Mortgage | With Mortgage |
| Less than 2.0x | 257 (16.5%) | 214,609 (8,731.0%) |
| 2.0x to 2.9x | 277 (17.8%) | 309 (12.6%) |
| 3.0x to 3.9x | 230 (14.8%) | 835 (34.0%) |
| 4.0x or more | 757 (48.7%) | 555 (22.6%) |
| Total | 1,554 (100.0%) | 2,458 (100.0%) |
Real Estate Taxes by Mortgage Status in Martinsville
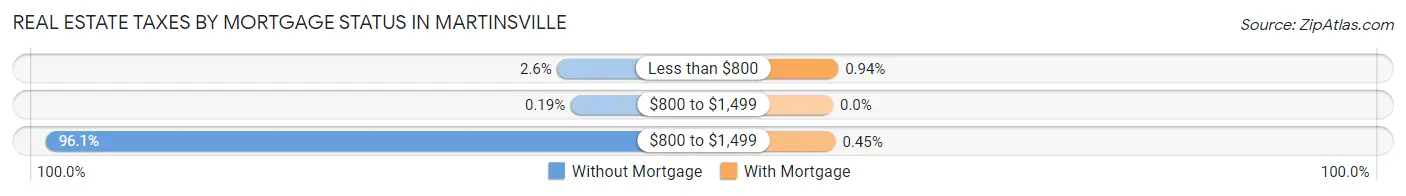
| Property Taxes | Without Mortgage | With Mortgage |
| Less than $800 | 41 (2.6%) | 23 (0.9%) |
| $800 to $1,499 | 3 (0.2%) | 0 (0.0%) |
| $800 to $1,499 | 1,494 (96.1%) | 11 (0.4%) |
| Total | 1,554 (100.0%) | 2,458 (100.0%) |
Health & Disability in Martinsville
Health Insurance Coverage by Age in Martinsville
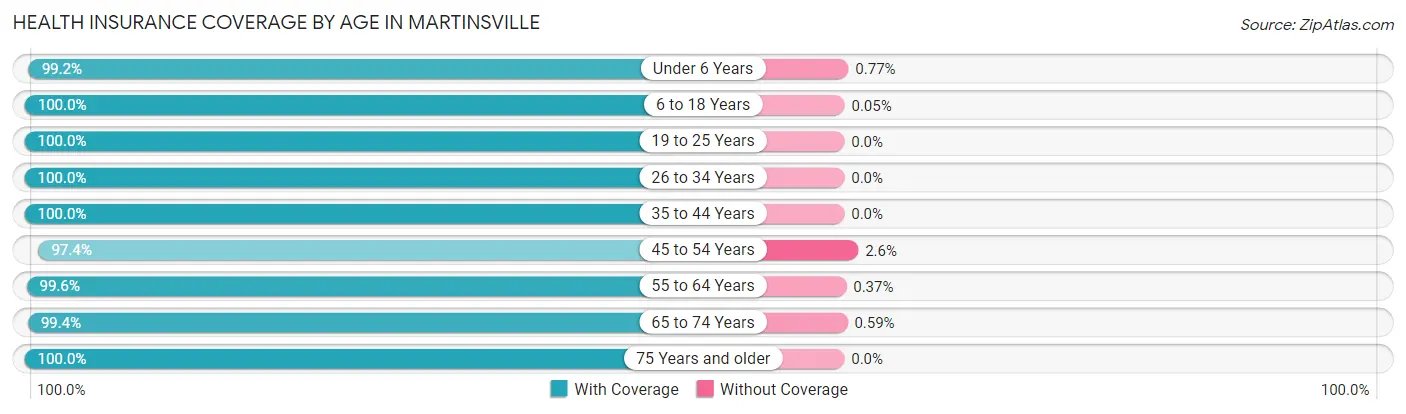
| Age Bracket | With Coverage | Without Coverage |
| Under 6 Years | 907 (99.2%) | 7 (0.8%) |
| 6 to 18 Years | 2,108 (100.0%) | 1 (0.1%) |
| 19 to 25 Years | 795 (100.0%) | 0 (0.0%) |
| 26 to 34 Years | 1,056 (100.0%) | 0 (0.0%) |
| 35 to 44 Years | 1,283 (100.0%) | 0 (0.0%) |
| 45 to 54 Years | 1,763 (97.4%) | 47 (2.6%) |
| 55 to 64 Years | 1,866 (99.6%) | 7 (0.4%) |
| 65 to 74 Years | 1,353 (99.4%) | 8 (0.6%) |
| 75 Years and older | 1,051 (100.0%) | 0 (0.0%) |
| Total | 12,182 (99.4%) | 70 (0.6%) |
Health Insurance Coverage by Citizenship Status in Martinsville
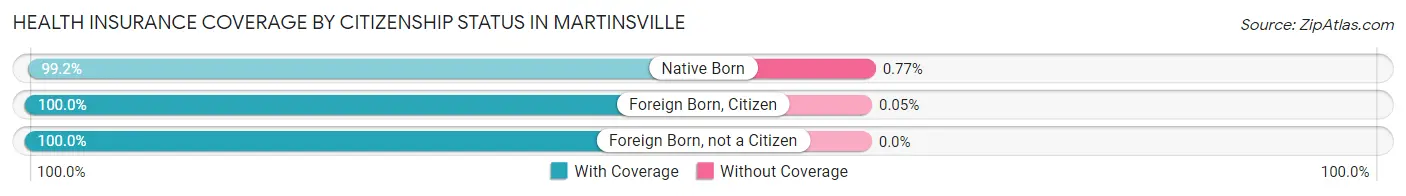
| Citizenship Status | With Coverage | Without Coverage |
| Native Born | 907 (99.2%) | 7 (0.8%) |
| Foreign Born, Citizen | 2,108 (100.0%) | 1 (0.1%) |
| Foreign Born, not a Citizen | 795 (100.0%) | 0 (0.0%) |
Health Insurance Coverage by Household Income in Martinsville
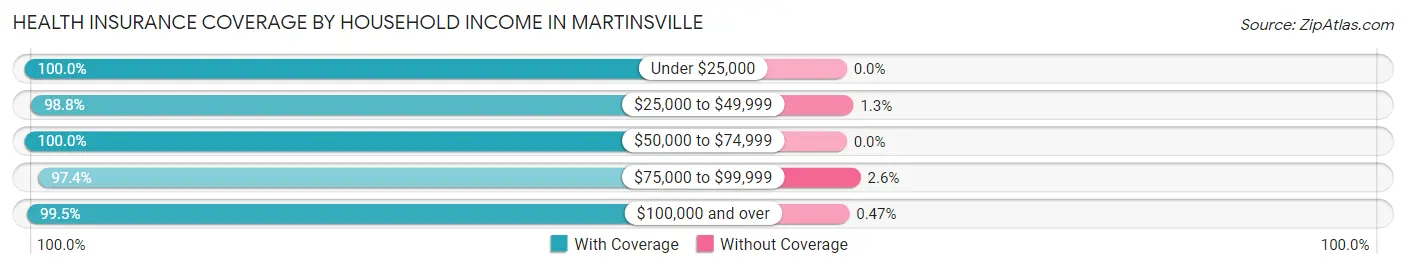
| Household Income | With Coverage | Without Coverage |
| Under $25,000 | 212 (100.0%) | 0 (0.0%) |
| $25,000 to $49,999 | 634 (98.8%) | 8 (1.3%) |
| $50,000 to $74,999 | 515 (100.0%) | 0 (0.0%) |
| $75,000 to $99,999 | 452 (97.4%) | 12 (2.6%) |
| $100,000 and over | 10,343 (99.5%) | 49 (0.5%) |
Public vs Private Health Insurance Coverage by Age in Martinsville
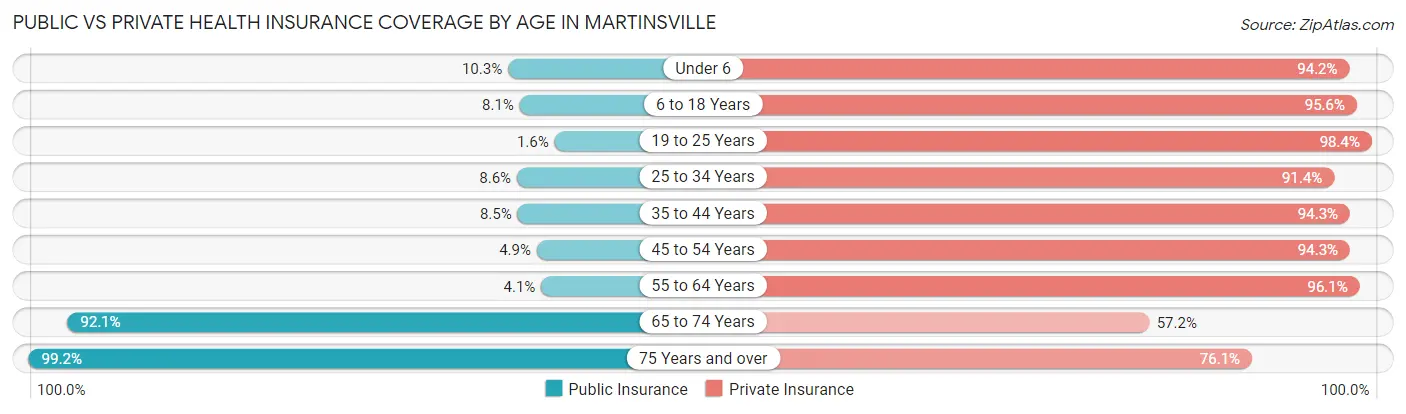
| Age Bracket | Public Insurance | Private Insurance |
| Under 6 | 94 (10.3%) | 861 (94.2%) |
| 6 to 18 Years | 171 (8.1%) | 2,016 (95.6%) |
| 19 to 25 Years | 13 (1.6%) | 782 (98.4%) |
| 25 to 34 Years | 91 (8.6%) | 965 (91.4%) |
| 35 to 44 Years | 109 (8.5%) | 1,210 (94.3%) |
| 45 to 54 Years | 89 (4.9%) | 1,707 (94.3%) |
| 55 to 64 Years | 77 (4.1%) | 1,800 (96.1%) |
| 65 to 74 Years | 1,253 (92.1%) | 778 (57.2%) |
| 75 Years and over | 1,043 (99.2%) | 800 (76.1%) |
| Total | 2,940 (24.0%) | 10,919 (89.1%) |
Disability Status by Sex by Age in Martinsville
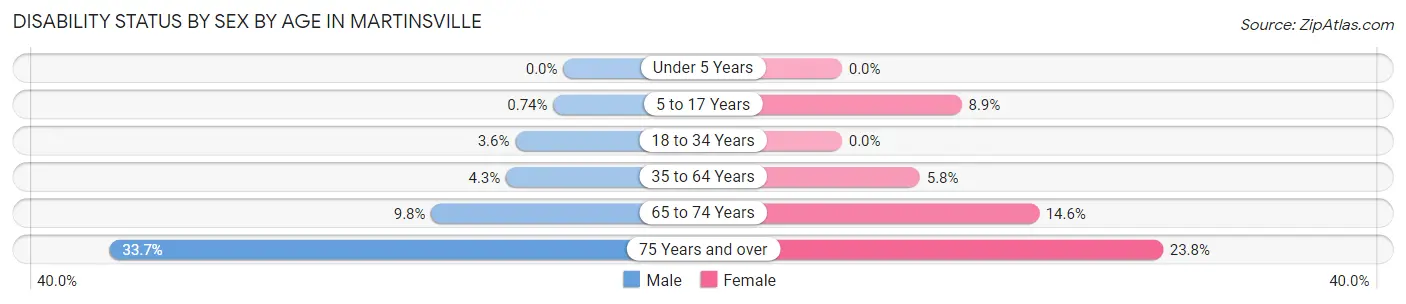
| Age Bracket | Male | Female |
| Under 5 Years | 0 (0.0%) | 0 (0.0%) |
| 5 to 17 Years | 7 (0.7%) | 98 (8.9%) |
| 18 to 34 Years | 39 (3.6%) | 0 (0.0%) |
| 35 to 64 Years | 101 (4.3%) | 150 (5.8%) |
| 65 to 74 Years | 67 (9.8%) | 99 (14.6%) |
| 75 Years and over | 152 (33.7%) | 143 (23.8%) |
Disability Class by Sex by Age in Martinsville
Disability Class: Hearing Difficulty
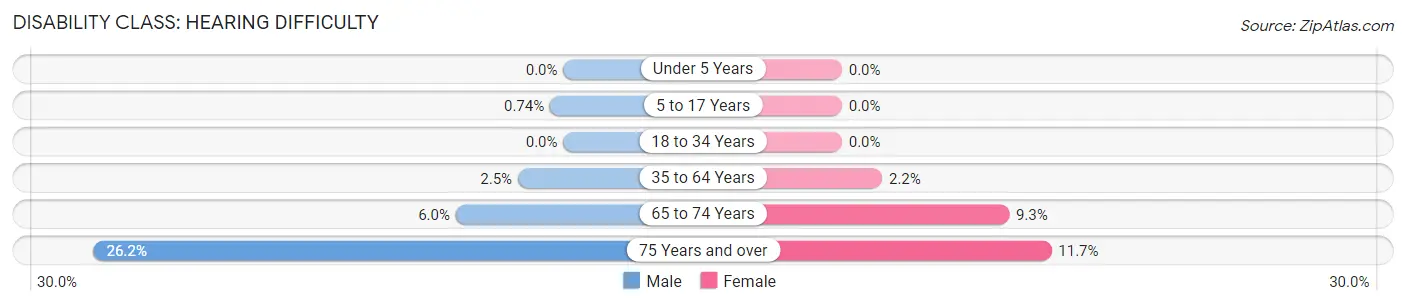
| Age Bracket | Male | Female |
| Under 5 Years | 0 (0.0%) | 0 (0.0%) |
| 5 to 17 Years | 7 (0.7%) | 0 (0.0%) |
| 18 to 34 Years | 0 (0.0%) | 0 (0.0%) |
| 35 to 64 Years | 60 (2.5%) | 58 (2.2%) |
| 65 to 74 Years | 41 (6.0%) | 63 (9.3%) |
| 75 Years and over | 118 (26.2%) | 70 (11.7%) |
Disability Class: Vision Difficulty
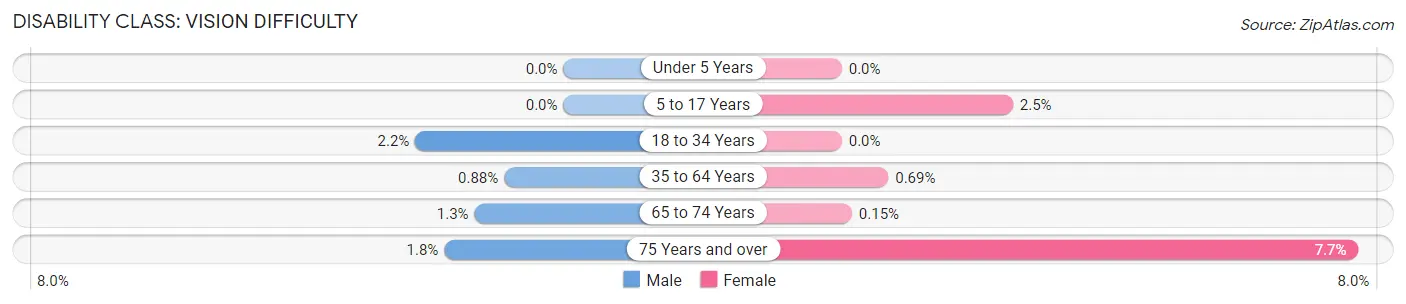
| Age Bracket | Male | Female |
| Under 5 Years | 0 (0.0%) | 0 (0.0%) |
| 5 to 17 Years | 0 (0.0%) | 28 (2.5%) |
| 18 to 34 Years | 24 (2.2%) | 0 (0.0%) |
| 35 to 64 Years | 21 (0.9%) | 18 (0.7%) |
| 65 to 74 Years | 9 (1.3%) | 1 (0.2%) |
| 75 Years and over | 8 (1.8%) | 46 (7.7%) |
Disability Class: Cognitive Difficulty
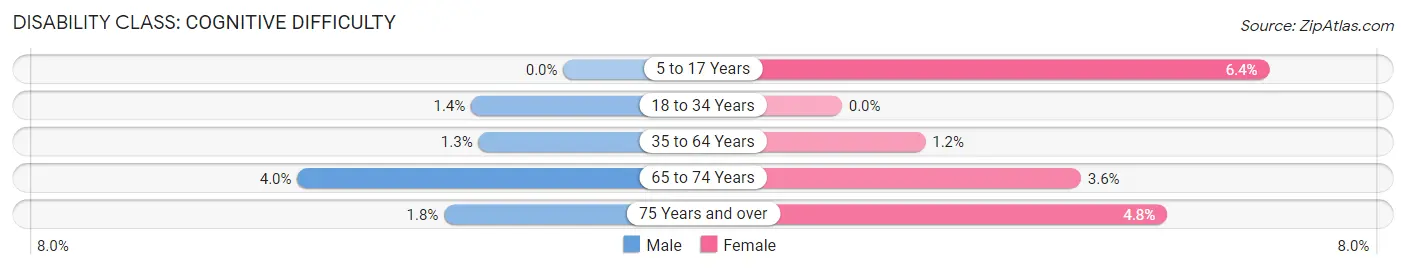
| Age Bracket | Male | Female |
| 5 to 17 Years | 0 (0.0%) | 70 (6.4%) |
| 18 to 34 Years | 15 (1.4%) | 0 (0.0%) |
| 35 to 64 Years | 30 (1.3%) | 32 (1.2%) |
| 65 to 74 Years | 27 (4.0%) | 24 (3.5%) |
| 75 Years and over | 8 (1.8%) | 29 (4.8%) |
Disability Class: Ambulatory Difficulty
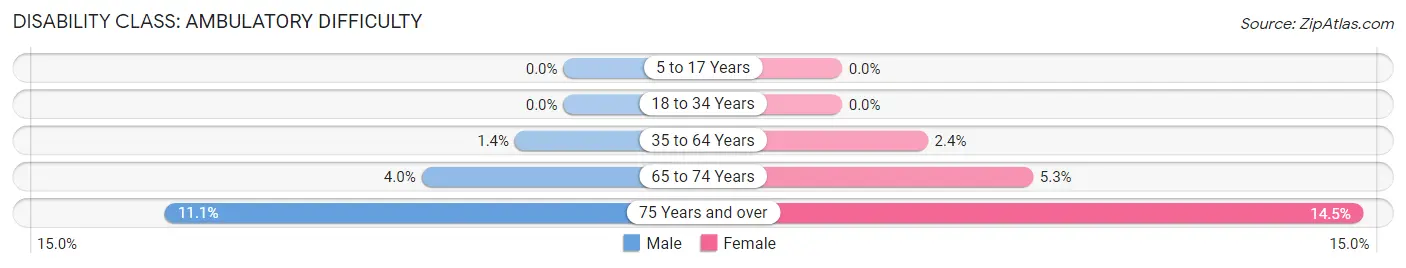
| Age Bracket | Male | Female |
| 5 to 17 Years | 0 (0.0%) | 0 (0.0%) |
| 18 to 34 Years | 0 (0.0%) | 0 (0.0%) |
| 35 to 64 Years | 32 (1.3%) | 62 (2.4%) |
| 65 to 74 Years | 27 (4.0%) | 36 (5.3%) |
| 75 Years and over | 50 (11.1%) | 87 (14.5%) |
Disability Class: Self-Care Difficulty
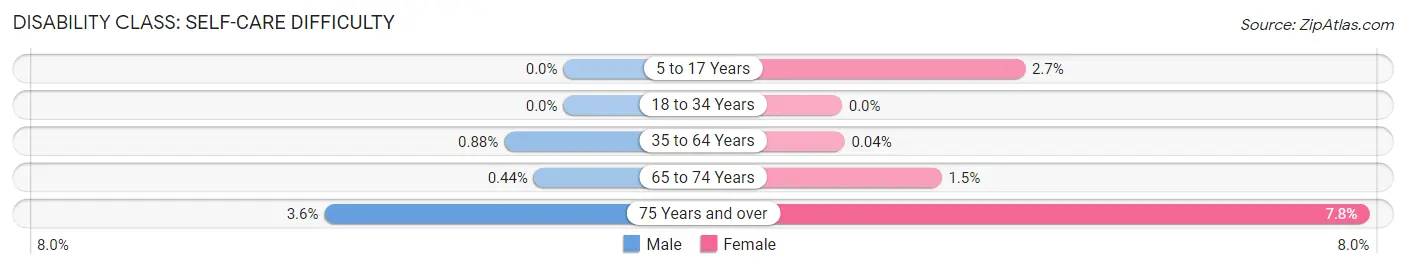
| Age Bracket | Male | Female |
| 5 to 17 Years | 0 (0.0%) | 30 (2.7%) |
| 18 to 34 Years | 0 (0.0%) | 0 (0.0%) |
| 35 to 64 Years | 21 (0.9%) | 1 (0.0%) |
| 65 to 74 Years | 3 (0.4%) | 10 (1.5%) |
| 75 Years and over | 16 (3.5%) | 47 (7.8%) |
Technology Access in Martinsville
Computing Device Access in Martinsville
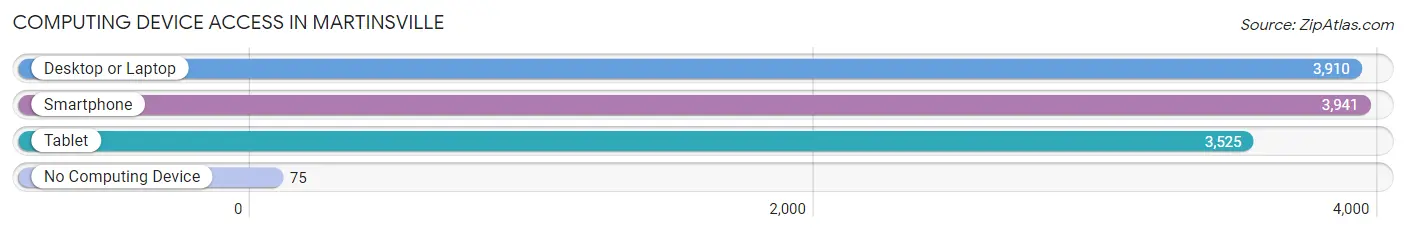
| Device Type | # Households | % Households |
| Desktop or Laptop | 3,910 | 92.1% |
| Smartphone | 3,941 | 92.8% |
| Tablet | 3,525 | 83.0% |
| No Computing Device | 75 | 1.8% |
| Total | 4,246 | 100.0% |
Internet Access in Martinsville
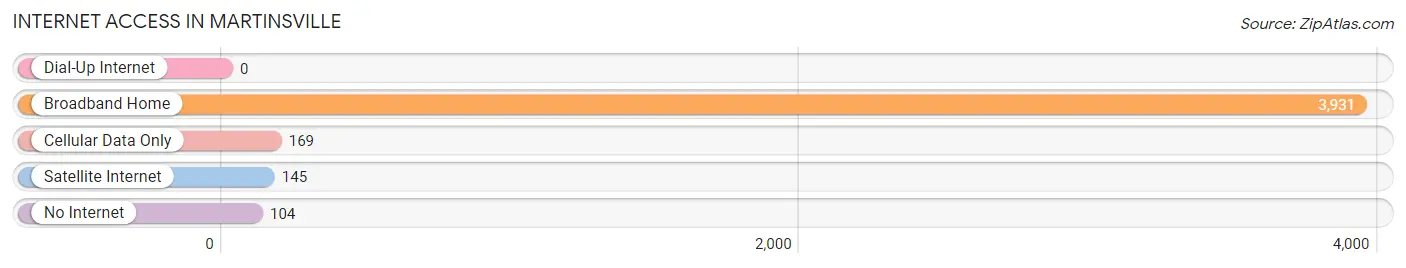
| Internet Type | # Households | % Households |
| Dial-Up Internet | 0 | 0.0% |
| Broadband Home | 3,931 | 92.6% |
| Cellular Data Only | 169 | 4.0% |
| Satellite Internet | 145 | 3.4% |
| No Internet | 104 | 2.5% |
| Total | 4,246 | 100.0% |
Martinsville Summary
Martinsville, NJ is a small borough located in Somerset County, New Jersey. It is situated in the Raritan Valley region of Central New Jersey, and is part of the larger New York metropolitan area. The borough is home to a population of approximately 8,000 people, and is known for its rural charm and small-town atmosphere.
History
Martinsville was first settled in the late 1700s by a group of Dutch settlers. The area was originally known as “Vlacktown”, after the Dutch word for black, and was part of Bridgewater Township. In 1891, the area was incorporated as the Borough of Martinsville, named after the prominent Martin family who had settled in the area in the early 1800s.
The borough was largely agricultural in its early years, with many of the residents working in the local farms and orchards. In the early 1900s, the area began to experience a period of growth and development, as the railroad and other transportation networks were established. This allowed for the growth of industry and commerce in the area, and the population began to grow.
Geography
Martinsville is located in the Raritan Valley region of Central New Jersey. It is situated in the northern part of Somerset County, and is bordered by Bridgewater Township to the north, Hillsborough Township to the east, Manville to the south, and Franklin Township to the west. The borough covers an area of approximately 4.2 square miles, and is home to a population of 8,000 people.
The borough is situated in a rural area, and is known for its rolling hills and lush forests. The Raritan River runs through the borough, and is a popular spot for fishing and other recreational activities. The borough is also home to several parks and recreational areas, including the Martinsville Park and the Martinsville Recreation Center.
Economy
The economy of Martinsville is largely based on the service industry. The borough is home to a number of small businesses, including restaurants, retail stores, and professional services. The borough is also home to several large employers, including the Johnson & Johnson Corporation, which has a large manufacturing facility in the area.
The borough is also home to a number of educational institutions, including the Somerset County Vocational and Technical High School, and the Raritan Valley Community College. These institutions provide a number of educational and employment opportunities for the residents of the borough.
Demographics
As of the 2010 census, the population of Martinsville was 8,000 people. The racial makeup of the borough was 87.3% White, 5.2% African American, 0.3% Native American, 3.2% Asian, and 3.9% from other races. The median household income was $76,000, and the median family income was $90,000.
The borough is home to a diverse population, with a variety of religious and cultural backgrounds. The largest religious group in the borough is the Roman Catholic Church, followed by the Presbyterian Church, and the United Methodist Church. The borough is also home to a number of Jewish synagogues, and a Hindu temple.
Conclusion
Martinsville, NJ is a small borough located in Somerset County, New Jersey. It is situated in the Raritan Valley region of Central New Jersey, and is part of the larger New York metropolitan area. The borough is home to a population of approximately 8,000 people, and is known for its rural charm and small-town atmosphere. The economy of the borough is largely based on the service industry, and the borough is home to a number of educational institutions. The borough is also home to a diverse population, with a variety of religious and cultural backgrounds.
Common Questions
What is Per Capita Income in Martinsville?
Per Capita income in Martinsville is $81,746.
What is the Median Family Income in Martinsville?
Median Family Income in Martinsville is $208,710.
What is the Median Household income in Martinsville?
Median Household Income in Martinsville is $194,485.
What is Income or Wage Gap in Martinsville?
Income or Wage Gap in Martinsville is 46.9%.
Women in Martinsville earn 53.1 cents for every dollar earned by a man.
What is Inequality or Gini Index in Martinsville?
Inequality or Gini Index in Martinsville is 0.42.
What is the Total Population of Martinsville?
Total Population of Martinsville is 12,370.
What is the Total Male Population of Martinsville?
Total Male Population of Martinsville is 6,020.
What is the Total Female Population of Martinsville?
Total Female Population of Martinsville is 6,350.
What is the Ratio of Males per 100 Females in Martinsville?
There are 94.80 Males per 100 Females in Martinsville.
What is the Ratio of Females per 100 Males in Martinsville?
There are 105.48 Females per 100 Males in Martinsville.
What is the Median Population Age in Martinsville?
Median Population Age in Martinsville is 45.2 Years.
What is the Average Family Size in Martinsville
Average Family Size in Martinsville is 3.2 People.
What is the Average Household Size in Martinsville
Average Household Size in Martinsville is 2.9 People.
How Large is the Labor Force in Martinsville?
There are 6,306 People in the Labor Forcein in Martinsville.
What is the Percentage of People in the Labor Force in Martinsville?
63.3% of People are in the Labor Force in Martinsville.
What is the Unemployment Rate in Martinsville?
Unemployment Rate in Martinsville is 2.9%.