Denver, NC Map & Demographics
Denver Map
Denver Overview
$35,642
PER CAPITA INCOME
$98,625
AVG FAMILY INCOME
$65,577
AVG HOUSEHOLD INCOME
24.8%
WAGE / INCOME GAP [ % ]
75.2¢/ $1
WAGE / INCOME GAP [ $ ]
0.39
INEQUALITY / GINI INDEX
2,739
TOTAL POPULATION
1,467
MALE POPULATION
1,272
FEMALE POPULATION
115.33
MALES / 100 FEMALES
86.71
FEMALES / 100 MALES
38.6
MEDIAN AGE
3.1
AVG FAMILY SIZE
2.4
AVG HOUSEHOLD SIZE
1,471
LABOR FORCE [ PEOPLE ]
70.0%
PERCENT IN LABOR FORCE
3.7%
UNEMPLOYMENT RATE
Denver Zip Codes
Income in Denver
Income Overview in Denver
Per Capita Income in Denver is $35,642, while median incomes of families and households are $98,625 and $65,577 respectively.
| Characteristic | Number | Measure |
| Per Capita Income | 2,739 | $35,642 |
| Median Family Income | 757 | $98,625 |
| Mean Family Income | 757 | $106,466 |
| Median Household Income | 1,138 | $65,577 |
| Mean Household Income | 1,138 | $84,151 |
| Income Deficit | 757 | $0 |
| Wage / Income Gap (%) | 2,739 | 24.83% |
| Wage / Income Gap ($) | 2,739 | 75.17¢ per $1 |
| Gini / Inequality Index | 2,739 | 0.39 |
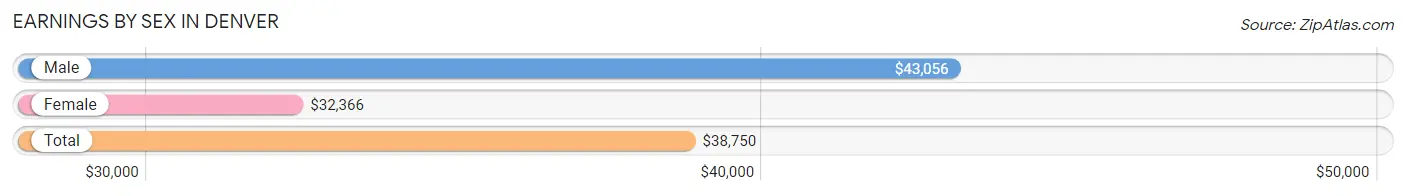
Earnings by Sex in Denver
Average Earnings in Denver are $38,750, $43,056 for men and $32,366 for women, a difference of 24.8%.
| Sex | Number | Average Earnings |
| Male | 816 (52.0%) | $43,056 |
| Female | 752 (48.0%) | $32,366 |
| Total | 1,568 (100.0%) | $38,750 |
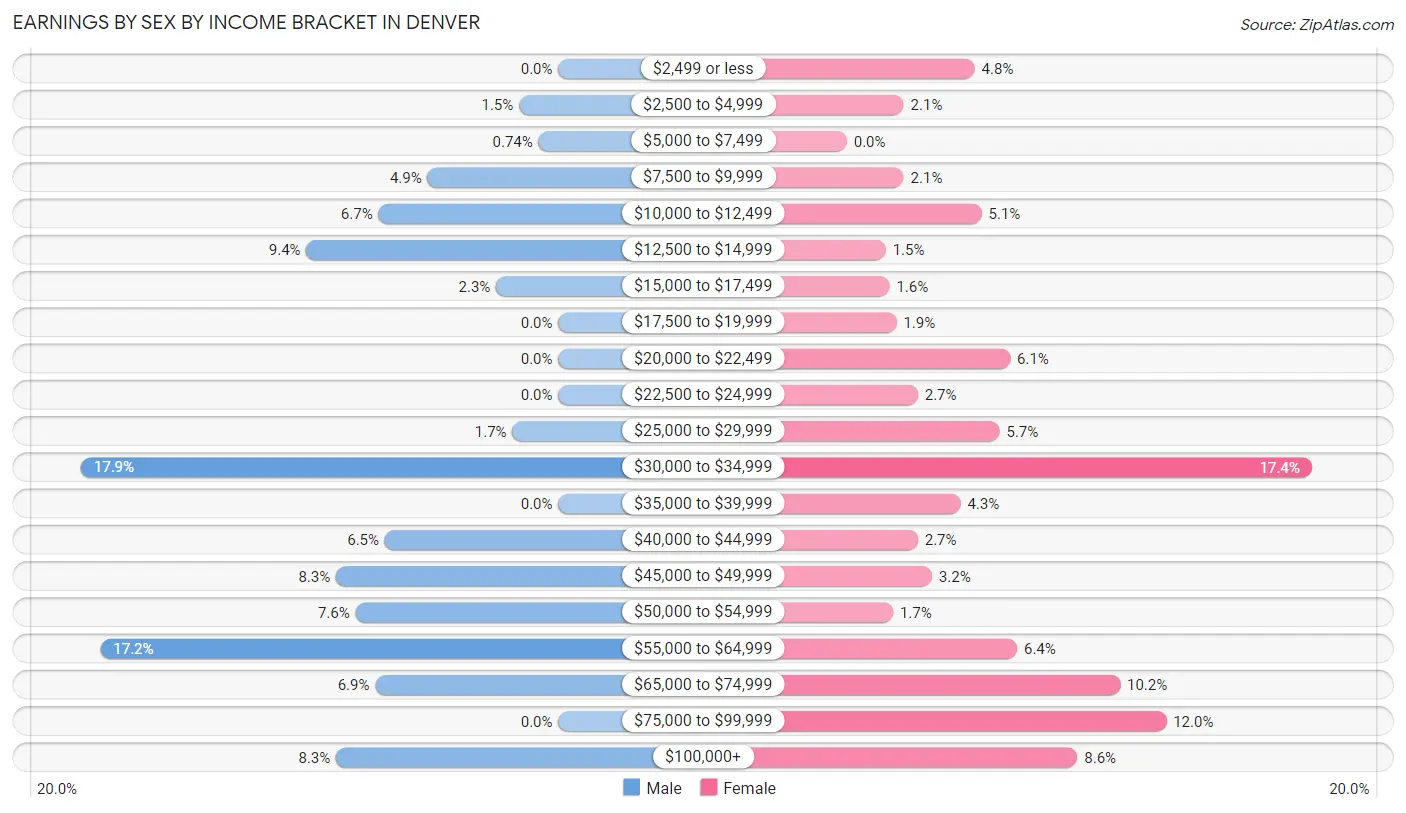
Earnings by Sex by Income Bracket in Denver
The most common earnings brackets in Denver are $30,000 to $34,999 for men (146 | 17.9%) and $30,000 to $34,999 for women (131 | 17.4%).
| Income | Male | Female |
| $2,499 or less | 0 (0.0%) | 36 (4.8%) |
| $2,500 to $4,999 | 12 (1.5%) | 16 (2.1%) |
| $5,000 to $7,499 | 6 (0.7%) | 0 (0.0%) |
| $7,500 to $9,999 | 40 (4.9%) | 16 (2.1%) |
| $10,000 to $12,499 | 55 (6.7%) | 38 (5.1%) |
| $12,500 to $14,999 | 77 (9.4%) | 11 (1.5%) |
| $15,000 to $17,499 | 19 (2.3%) | 12 (1.6%) |
| $17,500 to $19,999 | 0 (0.0%) | 14 (1.9%) |
| $20,000 to $22,499 | 0 (0.0%) | 46 (6.1%) |
| $22,500 to $24,999 | 0 (0.0%) | 20 (2.7%) |
| $25,000 to $29,999 | 14 (1.7%) | 43 (5.7%) |
| $30,000 to $34,999 | 146 (17.9%) | 131 (17.4%) |
| $35,000 to $39,999 | 0 (0.0%) | 32 (4.3%) |
| $40,000 to $44,999 | 53 (6.5%) | 20 (2.7%) |
| $45,000 to $49,999 | 68 (8.3%) | 24 (3.2%) |
| $50,000 to $54,999 | 62 (7.6%) | 13 (1.7%) |
| $55,000 to $64,999 | 140 (17.2%) | 48 (6.4%) |
| $65,000 to $74,999 | 56 (6.9%) | 77 (10.2%) |
| $75,000 to $99,999 | 0 (0.0%) | 90 (12.0%) |
| $100,000+ | 68 (8.3%) | 65 (8.6%) |
| Total | 816 (100.0%) | 752 (100.0%) |
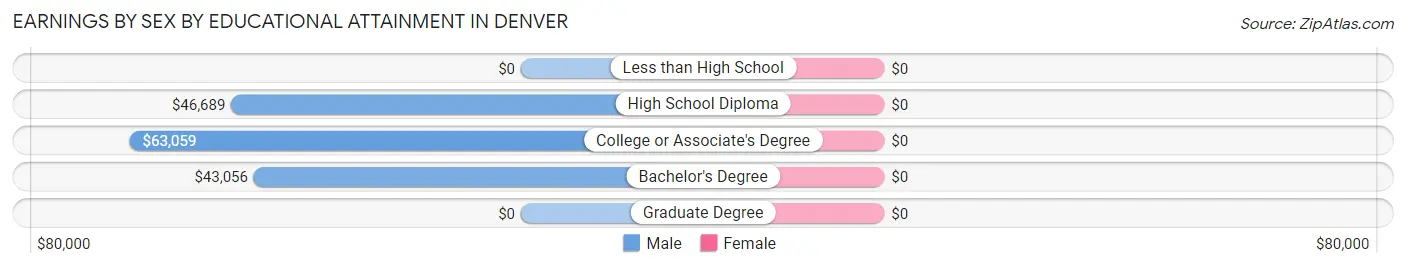
Earnings by Sex by Educational Attainment in Denver
| Educational Attainment | Male Income | Female Income |
| Less than High School | - | - |
| High School Diploma | $46,689 | $0 |
| College or Associate's Degree | $63,059 | $0 |
| Bachelor's Degree | $43,056 | $0 |
| Graduate Degree | - | - |
| Total | $47,243 | $35,938 |
Family Income in Denver
Family Income Brackets in Denver
According to the Denver family income data, there are 291 families falling into the $100,000 to $149,999 income range, which is the most common income bracket and makes up 38.4% of all families.
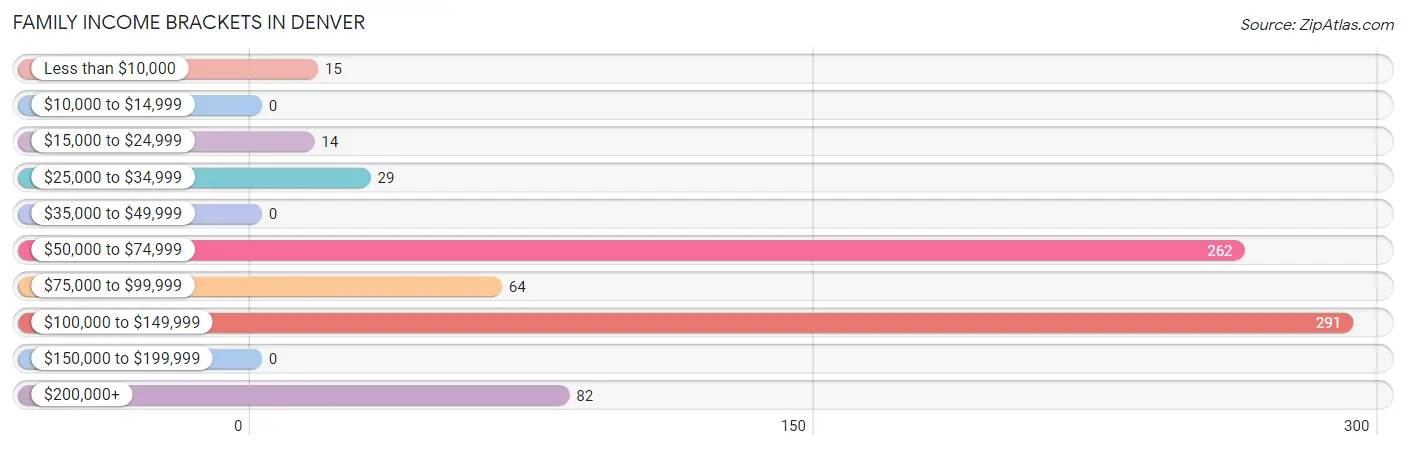
| Income Bracket | # Families | % Families |
| Less than $10,000 | 15 | 2.0% |
| $10,000 to $14,999 | 0 | 0.0% |
| $15,000 to $24,999 | 14 | 1.8% |
| $25,000 to $34,999 | 29 | 3.8% |
| $35,000 to $49,999 | 0 | 0.0% |
| $50,000 to $74,999 | 262 | 34.6% |
| $75,000 to $99,999 | 64 | 8.5% |
| $100,000 to $149,999 | 291 | 38.4% |
| $150,000 to $199,999 | 0 | 0.0% |
| $200,000+ | 82 | 10.8% |
Family Income by Famaliy Size in Denver
2-person families (371 | 49.0%) account for the highest median family income in Denver with $117,878 per family, while 2-person families (371 | 49.0%) have the highest median income of $58,939 per family member.
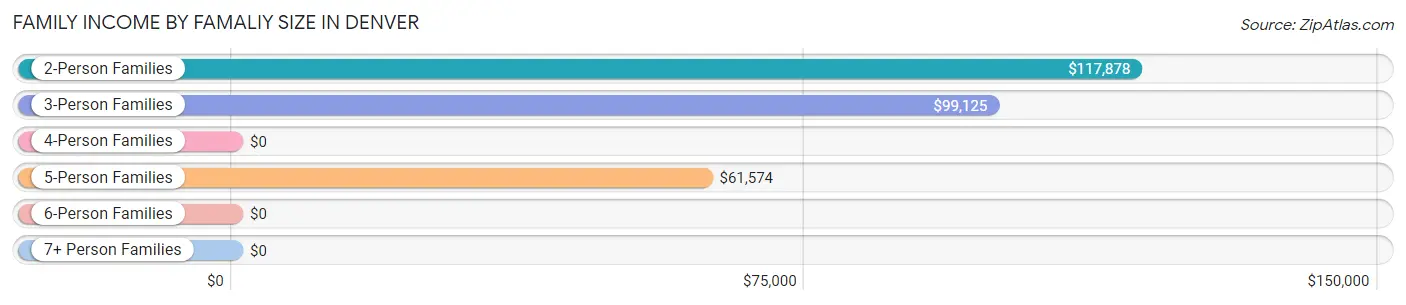
| Income Bracket | # Families | Median Income |
| 2-Person Families | 371 (49.0%) | $117,878 |
| 3-Person Families | 151 (20.0%) | $99,125 |
| 4-Person Families | 54 (7.1%) | $0 |
| 5-Person Families | 165 (21.8%) | $61,574 |
| 6-Person Families | 0 (0.0%) | $0 |
| 7+ Person Families | 16 (2.1%) | $0 |
| Total | 757 (100.0%) | $98,625 |
Family Income by Number of Earners in Denver
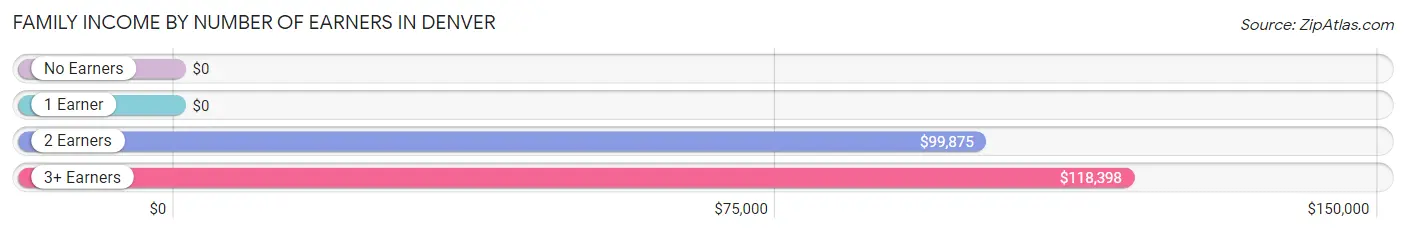
| Number of Earners | # Families | Median Income |
| No Earners | 15 (2.0%) | $0 |
| 1 Earner | 288 (38.0%) | $0 |
| 2 Earners | 349 (46.1%) | $99,875 |
| 3+ Earners | 105 (13.9%) | $118,398 |
| Total | 757 (100.0%) | $98,625 |
Household Income in Denver
Household Income Brackets in Denver
With 306 households falling in the category, the $50,000 to $74,999 income range is the most frequent in Denver, accounting for 26.9% of all households.
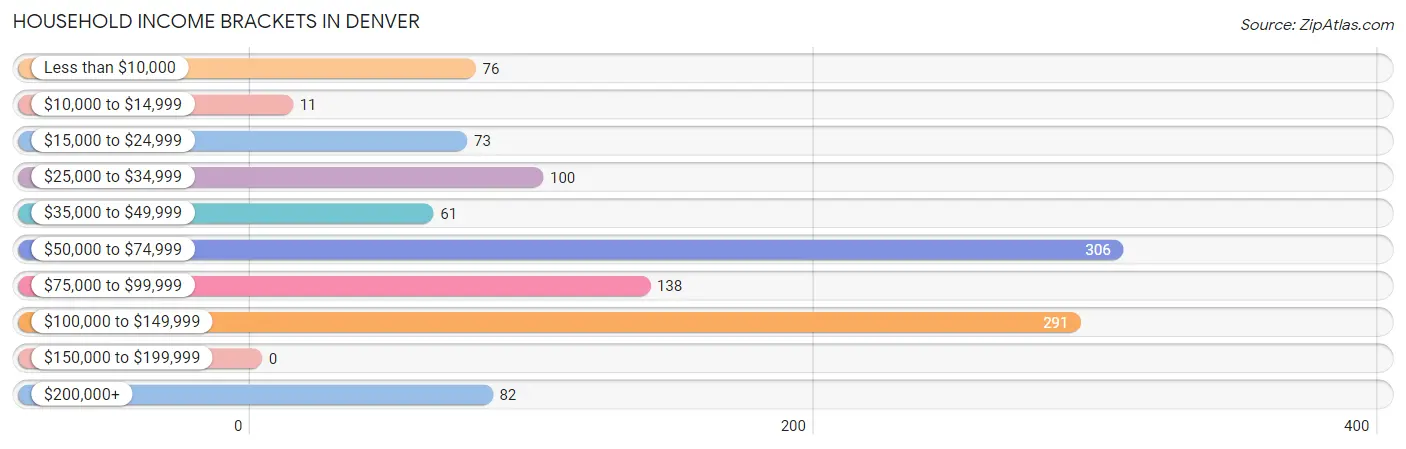
| Income Bracket | # Households | % Households |
| Less than $10,000 | 76 | 6.7% |
| $10,000 to $14,999 | 11 | 1.0% |
| $15,000 to $24,999 | 73 | 6.4% |
| $25,000 to $34,999 | 100 | 8.8% |
| $35,000 to $49,999 | 61 | 5.4% |
| $50,000 to $74,999 | 306 | 26.9% |
| $75,000 to $99,999 | 138 | 12.1% |
| $100,000 to $149,999 | 291 | 25.6% |
| $150,000 to $199,999 | 0 | 0.0% |
| $200,000+ | 82 | 7.2% |
Household Income by Householder Age in Denver
The median household income in Denver is $65,577, with the highest median household income of $80,227 found in the 45 to 64 years age bracket for the primary householder. A total of 530 households (46.6%) fall into this category.
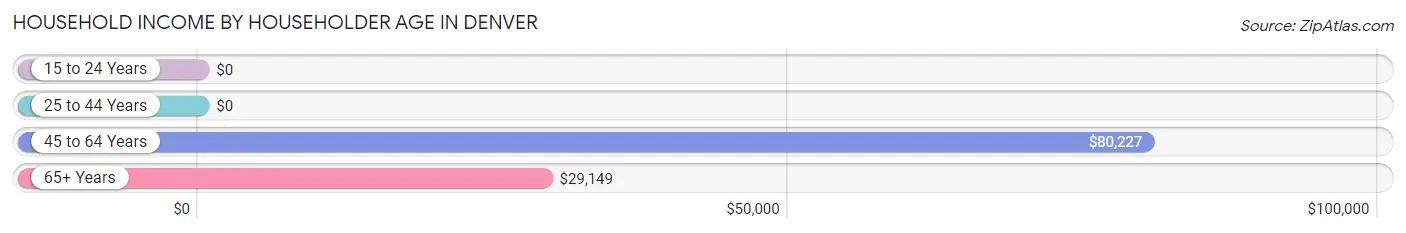
| Income Bracket | # Households | Median Income |
| 15 to 24 Years | 0 (0.0%) | $0 |
| 25 to 44 Years | 369 (32.4%) | $0 |
| 45 to 64 Years | 530 (46.6%) | $80,227 |
| 65+ Years | 239 (21.0%) | $29,149 |
| Total | 1,138 (100.0%) | $65,577 |
Poverty in Denver
Income Below Poverty by Sex and Age in Denver
With 5.2% poverty level for males and 3.8% for females among the residents of Denver, 55 to 64 year old males and 45 to 54 year old females are the most vulnerable to poverty, with 61 males (48.8%) and 18 females (10.8%) in their respective age groups living below the poverty level.
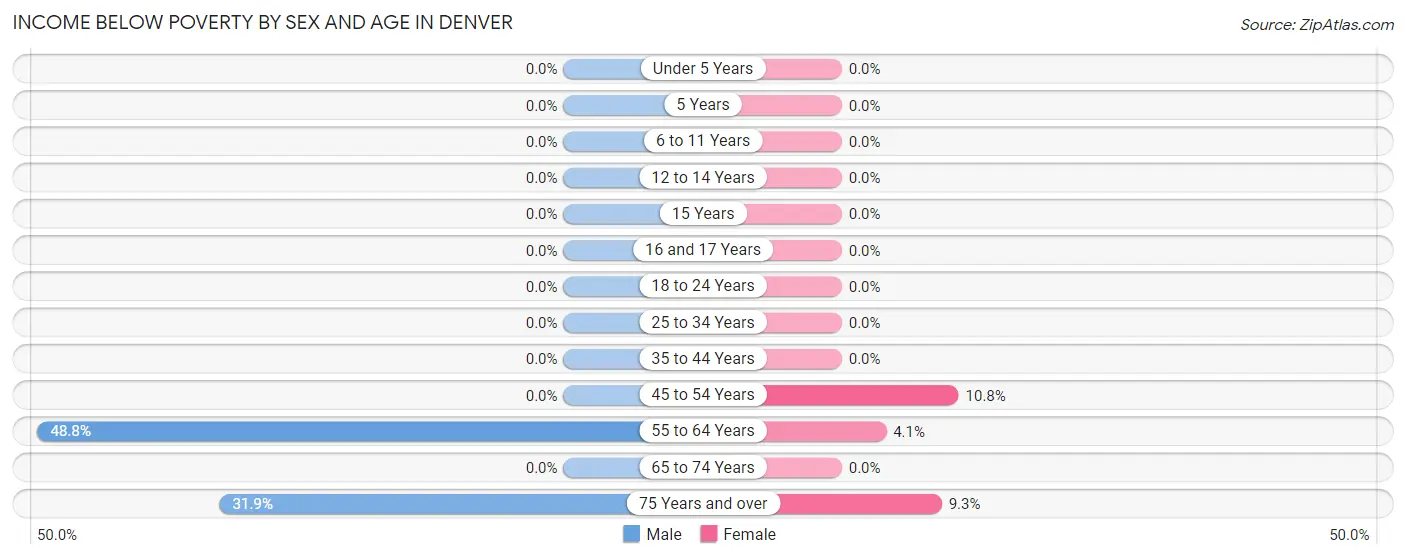
| Age Bracket | Male | Female |
| Under 5 Years | 0 (0.0%) | 0 (0.0%) |
| 5 Years | 0 (0.0%) | 0 (0.0%) |
| 6 to 11 Years | 0 (0.0%) | 0 (0.0%) |
| 12 to 14 Years | 0 (0.0%) | 0 (0.0%) |
| 15 Years | 0 (0.0%) | 0 (0.0%) |
| 16 and 17 Years | 0 (0.0%) | 0 (0.0%) |
| 18 to 24 Years | 0 (0.0%) | 0 (0.0%) |
| 25 to 34 Years | 0 (0.0%) | 0 (0.0%) |
| 35 to 44 Years | 0 (0.0%) | 0 (0.0%) |
| 45 to 54 Years | 0 (0.0%) | 18 (10.8%) |
| 55 to 64 Years | 61 (48.8%) | 11 (4.1%) |
| 65 to 74 Years | 0 (0.0%) | 0 (0.0%) |
| 75 Years and over | 15 (31.9%) | 19 (9.3%) |
| Total | 76 (5.2%) | 48 (3.8%) |
Income Above Poverty by Sex and Age in Denver
According to the poverty statistics in Denver, males aged under 5 years and females aged under 5 years are the age groups that are most secure financially, with 100.0% of males and 100.0% of females in these age groups living above the poverty line.
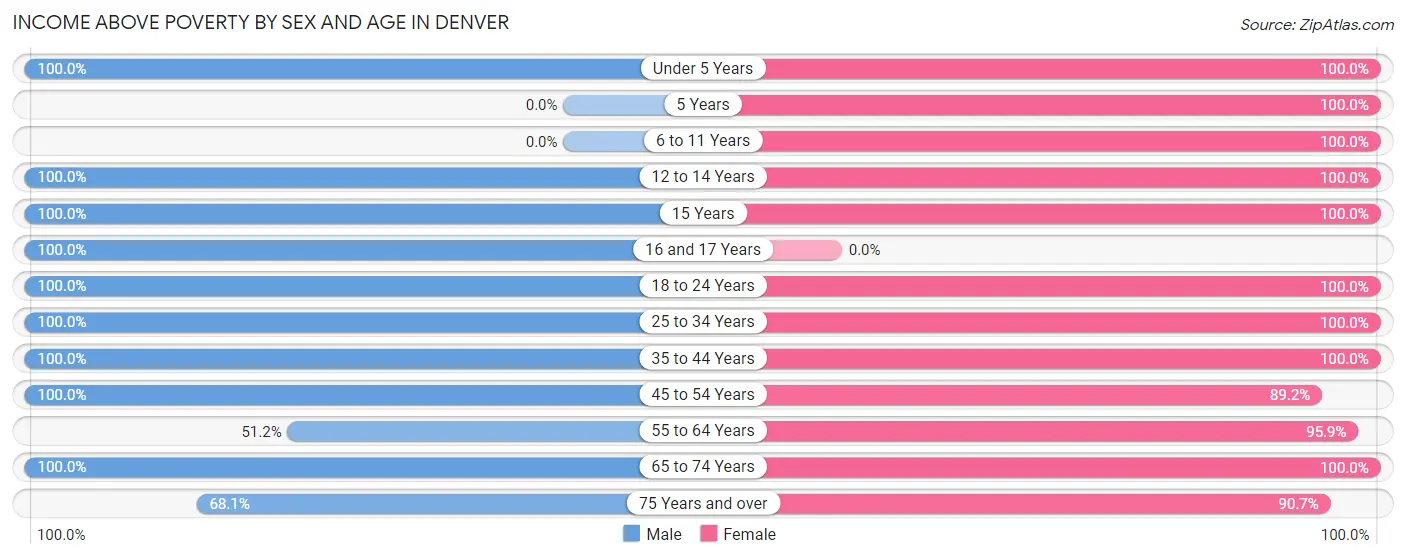
| Age Bracket | Male | Female |
| Under 5 Years | 380 (100.0%) | 35 (100.0%) |
| 5 Years | 0 (0.0%) | 17 (100.0%) |
| 6 to 11 Years | 0 (0.0%) | 58 (100.0%) |
| 12 to 14 Years | 89 (100.0%) | 21 (100.0%) |
| 15 Years | 12 (100.0%) | 26 (100.0%) |
| 16 and 17 Years | 12 (100.0%) | 0 (0.0%) |
| 18 to 24 Years | 138 (100.0%) | 38 (100.0%) |
| 25 to 34 Years | 207 (100.0%) | 198 (100.0%) |
| 35 to 44 Years | 111 (100.0%) | 164 (100.0%) |
| 45 to 54 Years | 237 (100.0%) | 148 (89.2%) |
| 55 to 64 Years | 64 (51.2%) | 256 (95.9%) |
| 65 to 74 Years | 109 (100.0%) | 77 (100.0%) |
| 75 Years and over | 32 (68.1%) | 186 (90.7%) |
| Total | 1,391 (94.8%) | 1,224 (96.2%) |
Income Below Poverty Among Married-Couple Families in Denver
The poverty statistics for married-couple families in Denver show that 2.5% or 15 of the total 589 families live below the poverty line. Families with no children have the highest poverty rate of 4.4%, comprising of 15 families. On the other hand, families with 1 or 2 children have the lowest poverty rate of 0.0%, which includes 0 families.
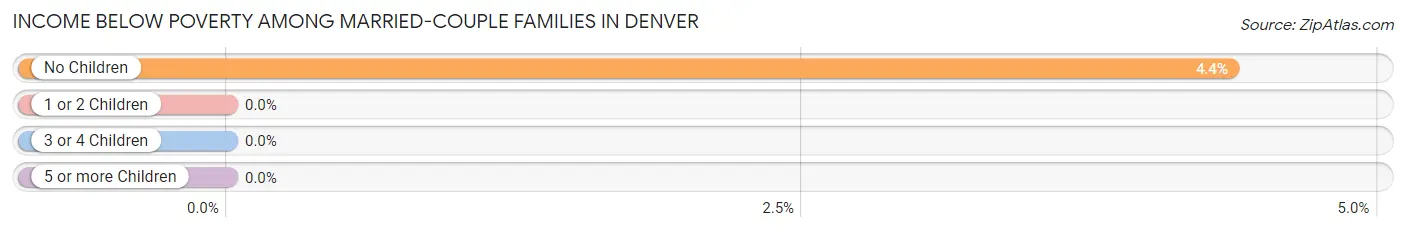
| Children | Above Poverty | Below Poverty |
| No Children | 329 (95.6%) | 15 (4.4%) |
| 1 or 2 Children | 83 (100.0%) | 0 (0.0%) |
| 3 or 4 Children | 162 (100.0%) | 0 (0.0%) |
| 5 or more Children | 0 (0.0%) | 0 (0.0%) |
| Total | 574 (97.5%) | 15 (2.5%) |
Income Below Poverty Among Single-Parent Households in Denver
| Children | Single Father | Single Mother |
| No Children | 0 (0.0%) | 0 (0.0%) |
| 1 or 2 Children | 0 (0.0%) | 0 (0.0%) |
| 3 or 4 Children | 0 (0.0%) | 0 (0.0%) |
| 5 or more Children | 0 (0.0%) | 0 (0.0%) |
| Total | 0 (0.0%) | 0 (0.0%) |
Income Below Poverty Among Married-Couple vs Single-Parent Households in Denver
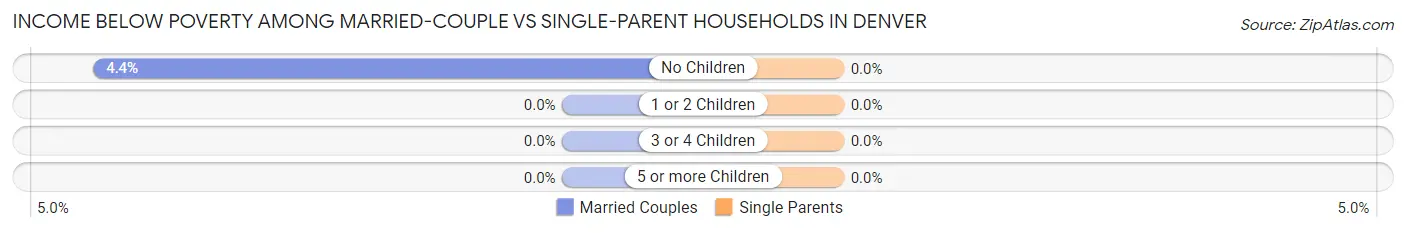
| Children | Married-Couple Families | Single-Parent Households |
| No Children | 15 (4.4%) | 0 (0.0%) |
| 1 or 2 Children | 0 (0.0%) | 0 (0.0%) |
| 3 or 4 Children | 0 (0.0%) | 0 (0.0%) |
| 5 or more Children | 0 (0.0%) | 0 (0.0%) |
| Total | 15 (2.5%) | 0 (0.0%) |
Race in Denver
The most populous races in Denver are White / Caucasian (2,545 | 92.9%), Two or more Races (109 | 4.0%), and Asian (68 | 2.5%).
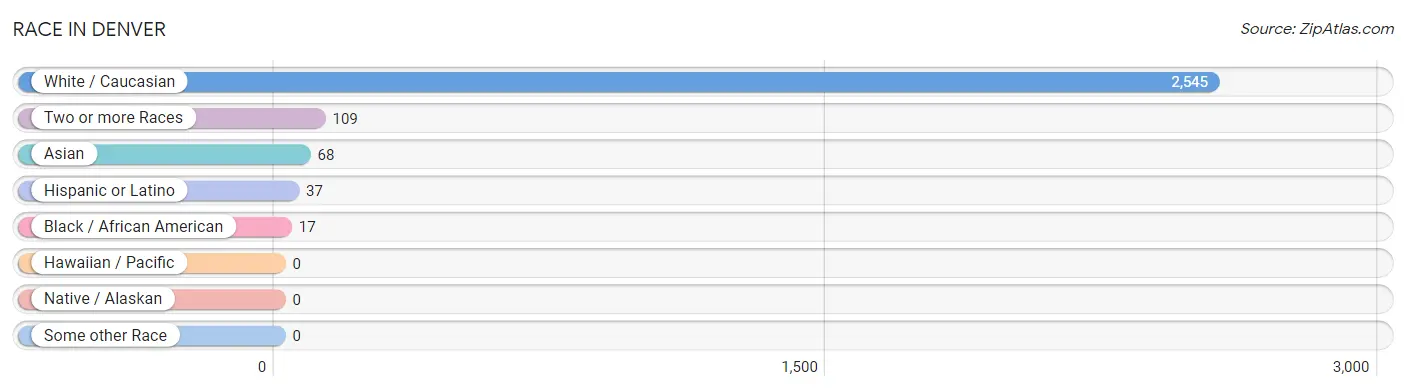
| Race | # Population | % Population |
| Asian | 68 | 2.5% |
| Black / African American | 17 | 0.6% |
| Hawaiian / Pacific | 0 | 0.0% |
| Hispanic or Latino | 37 | 1.3% |
| Native / Alaskan | 0 | 0.0% |
| White / Caucasian | 2,545 | 92.9% |
| Two or more Races | 109 | 4.0% |
| Some other Race | 0 | 0.0% |
| Total | 2,739 | 100.0% |
Ancestry in Denver
The most populous ancestries reported in Denver are American (802 | 29.3%), English (306 | 11.2%), German (265 | 9.7%), European (242 | 8.8%), and Scottish (158 | 5.8%), together accounting for 64.7% of all Denver residents.
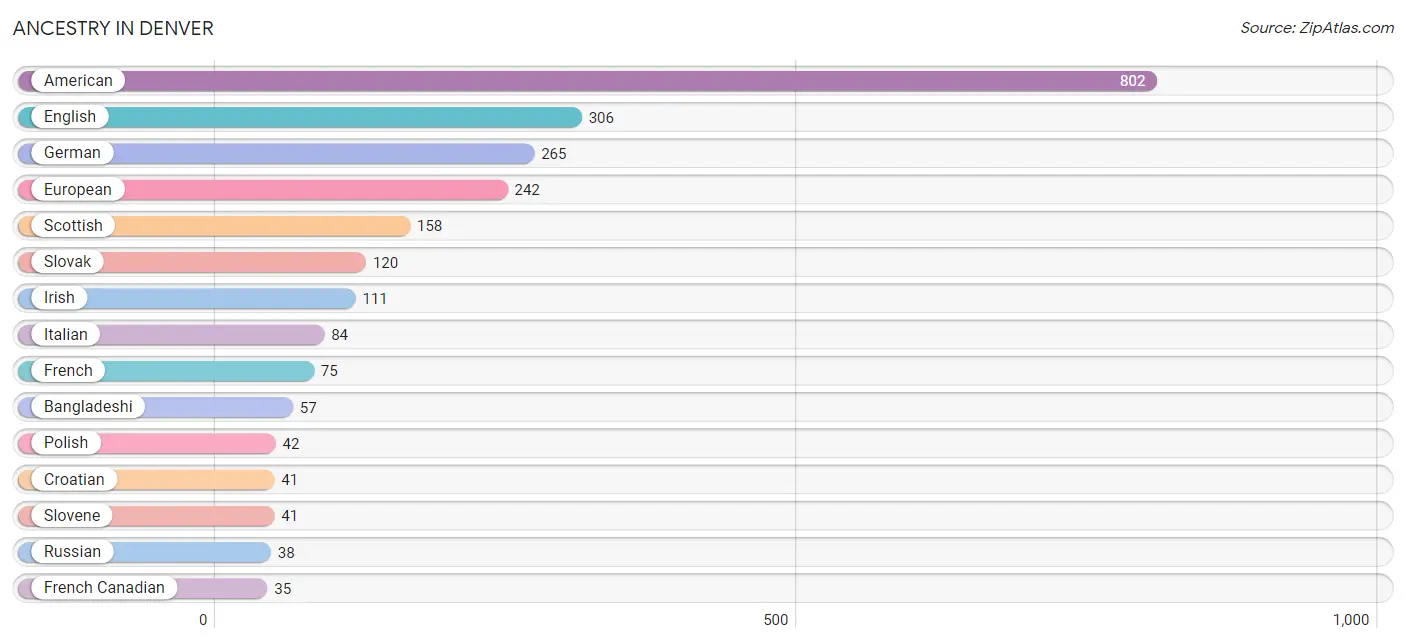
| Ancestry | # Population | % Population |
| American | 802 | 29.3% |
| Bangladeshi | 57 | 2.1% |
| Croatian | 41 | 1.5% |
| Czech | 21 | 0.8% |
| English | 306 | 11.2% |
| European | 242 | 8.8% |
| French | 75 | 2.7% |
| French Canadian | 35 | 1.3% |
| German | 265 | 9.7% |
| Irish | 111 | 4.1% |
| Italian | 84 | 3.1% |
| Korean | 11 | 0.4% |
| Mexican | 10 | 0.4% |
| Norwegian | 16 | 0.6% |
| Polish | 42 | 1.5% |
| Puerto Rican | 27 | 1.0% |
| Russian | 38 | 1.4% |
| Scotch-Irish | 30 | 1.1% |
| Scottish | 158 | 5.8% |
| Slovak | 120 | 4.4% |
| Slovene | 41 | 1.5% |
| Swiss | 19 | 0.7% |
| Ukrainian | 35 | 1.3% | View All 23 Rows |
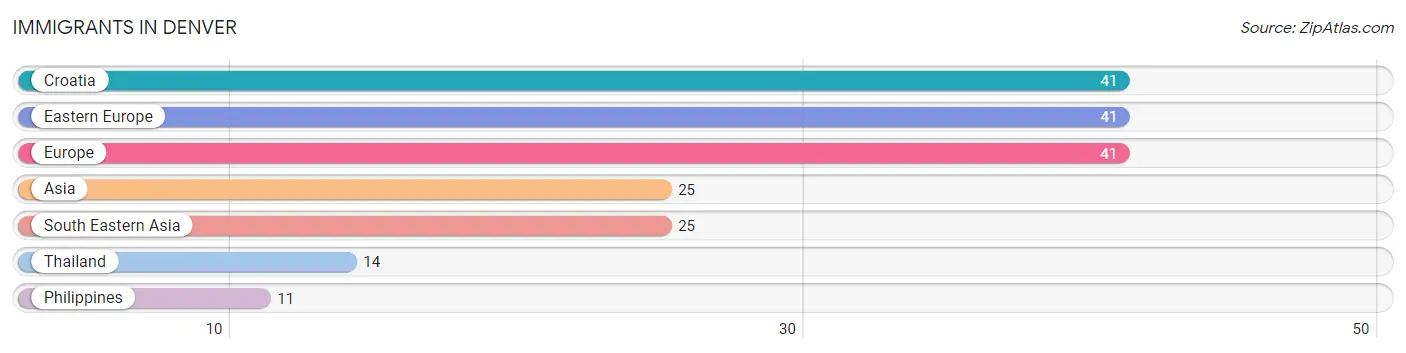
Immigrants in Denver
The most numerous immigrant groups reported in Denver came from Croatia (41 | 1.5%), Eastern Europe (41 | 1.5%), Europe (41 | 1.5%), Asia (25 | 0.9%), and South Eastern Asia (25 | 0.9%), together accounting for 6.3% of all Denver residents.
| Immigration Origin | # Population | % Population |
| Asia | 25 | 0.9% |
| Croatia | 41 | 1.5% |
| Eastern Europe | 41 | 1.5% |
| Europe | 41 | 1.5% |
| Philippines | 11 | 0.4% |
| South Eastern Asia | 25 | 0.9% |
| Thailand | 14 | 0.5% | View All 7 Rows |
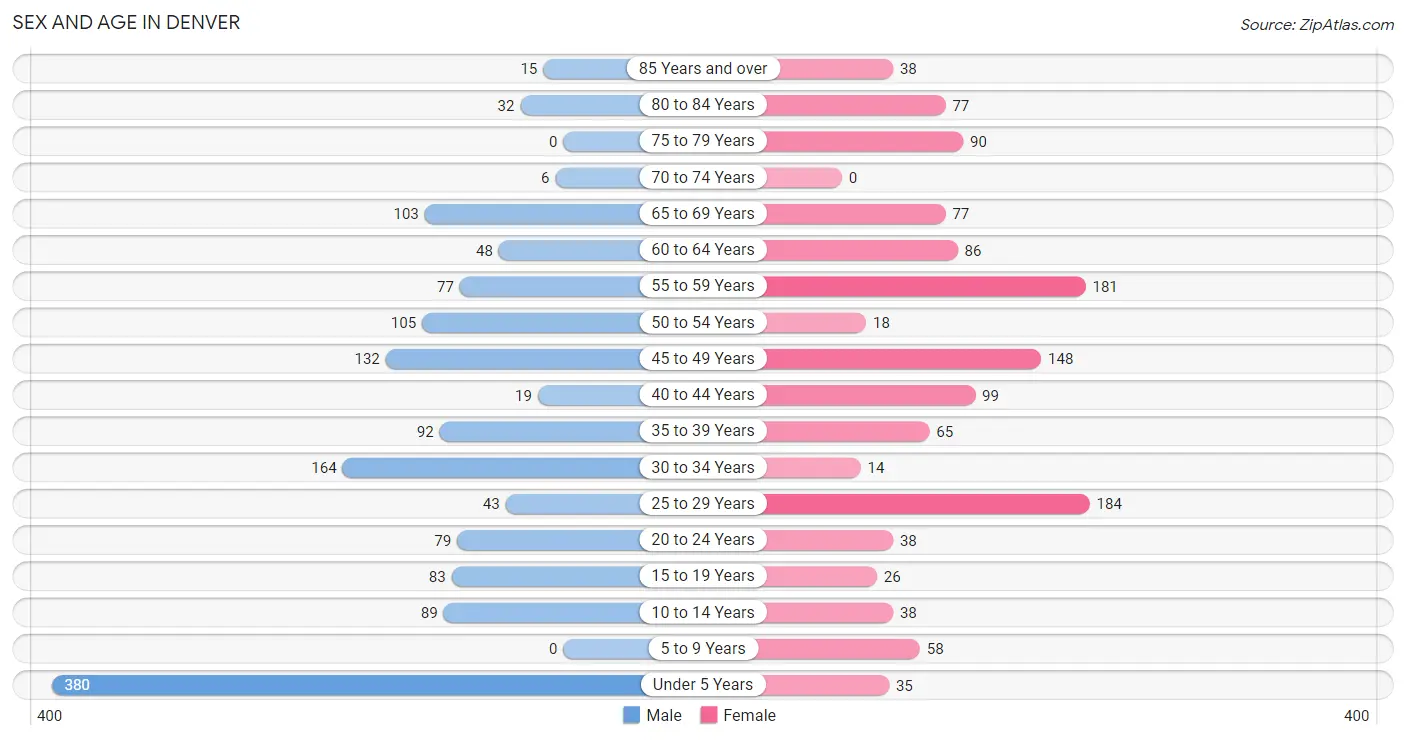
Sex and Age in Denver
Sex and Age in Denver
The most populous age groups in Denver are Under 5 Years (380 | 25.9%) for men and 25 to 29 Years (184 | 14.5%) for women.
| Age Bracket | Male | Female |
| Under 5 Years | 380 (25.9%) | 35 (2.8%) |
| 5 to 9 Years | 0 (0.0%) | 58 (4.6%) |
| 10 to 14 Years | 89 (6.1%) | 38 (3.0%) |
| 15 to 19 Years | 83 (5.7%) | 26 (2.0%) |
| 20 to 24 Years | 79 (5.4%) | 38 (3.0%) |
| 25 to 29 Years | 43 (2.9%) | 184 (14.5%) |
| 30 to 34 Years | 164 (11.2%) | 14 (1.1%) |
| 35 to 39 Years | 92 (6.3%) | 65 (5.1%) |
| 40 to 44 Years | 19 (1.3%) | 99 (7.8%) |
| 45 to 49 Years | 132 (9.0%) | 148 (11.6%) |
| 50 to 54 Years | 105 (7.2%) | 18 (1.4%) |
| 55 to 59 Years | 77 (5.2%) | 181 (14.2%) |
| 60 to 64 Years | 48 (3.3%) | 86 (6.8%) |
| 65 to 69 Years | 103 (7.0%) | 77 (6.0%) |
| 70 to 74 Years | 6 (0.4%) | 0 (0.0%) |
| 75 to 79 Years | 0 (0.0%) | 90 (7.1%) |
| 80 to 84 Years | 32 (2.2%) | 77 (6.0%) |
| 85 Years and over | 15 (1.0%) | 38 (3.0%) |
| Total | 1,467 (100.0%) | 1,272 (100.0%) |
Families and Households in Denver
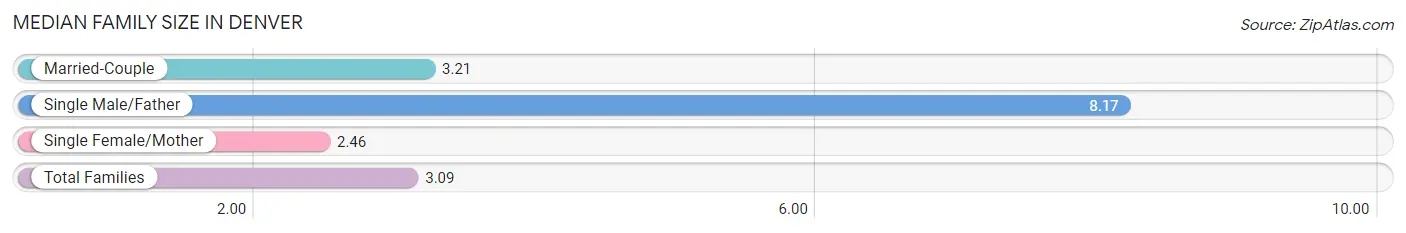
Median Family Size in Denver
The median family size in Denver is 3.09 persons per family, with single male/father families (6 | 0.8%) accounting for the largest median family size of 8.17 persons per family. On the other hand, single female/mother families (162 | 21.4%) represent the smallest median family size with 2.46 persons per family.
| Family Type | # Families | Family Size |
| Married-Couple | 589 (77.8%) | 3.21 |
| Single Male/Father | 6 (0.8%) | 8.17 |
| Single Female/Mother | 162 (21.4%) | 2.46 |
| Total Families | 757 (100.0%) | 3.09 |
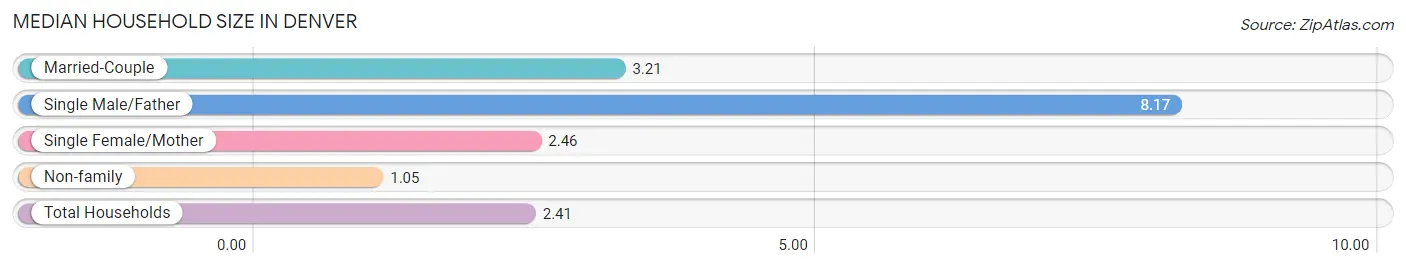
Median Household Size in Denver
The median household size in Denver is 2.41 persons per household, with single male/father households (6 | 0.5%) accounting for the largest median household size of 8.17 persons per household. non-family households (381 | 33.5%) represent the smallest median household size with 1.05 persons per household.
| Household Type | # Households | Household Size |
| Married-Couple | 589 (51.8%) | 3.21 |
| Single Male/Father | 6 (0.5%) | 8.17 |
| Single Female/Mother | 162 (14.2%) | 2.46 |
| Non-family | 381 (33.5%) | 1.05 |
| Total Households | 1,138 (100.0%) | 2.41 |
Household Size by Marriage Status in Denver
Out of a total of 1,138 households in Denver, 757 (66.5%) are family households, while 381 (33.5%) are nonfamily households. The most numerous type of family households are 2-person households, comprising 371, and the most common type of nonfamily households are 1-person households, comprising 367.
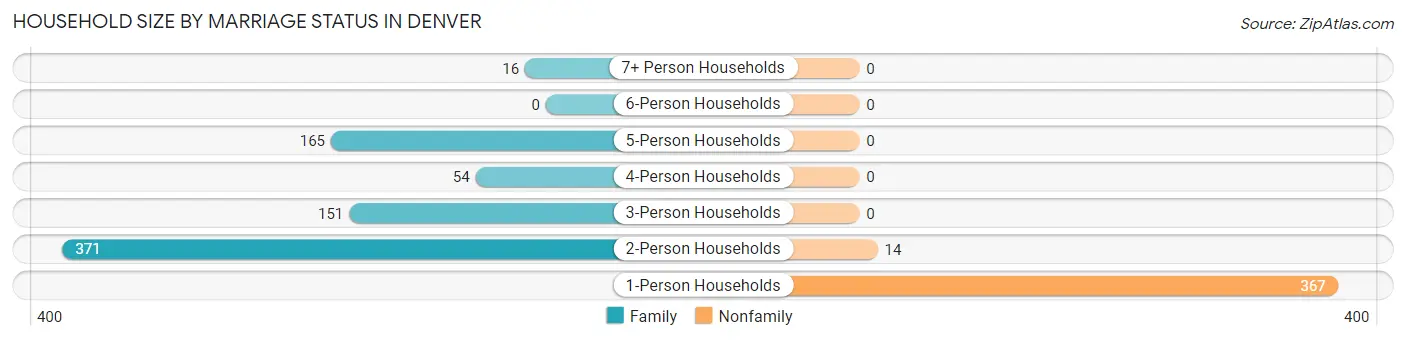
| Household Size | Family Households | Nonfamily Households |
| 1-Person Households | - | 367 (32.3%) |
| 2-Person Households | 371 (32.6%) | 14 (1.2%) |
| 3-Person Households | 151 (13.3%) | 0 (0.0%) |
| 4-Person Households | 54 (4.8%) | 0 (0.0%) |
| 5-Person Households | 165 (14.5%) | 0 (0.0%) |
| 6-Person Households | 0 (0.0%) | 0 (0.0%) |
| 7+ Person Households | 16 (1.4%) | 0 (0.0%) |
| Total | 757 (66.5%) | 381 (33.5%) |
Female Fertility in Denver
Fertility by Age in Denver
Average fertility rate in Denver is 254.0 births per 1,000 women. Women in the age bracket of 20 to 34 years have the highest fertility rate with 555.0 births per 1,000 women. Women in the age bracket of 20 to 34 years acount for 89.7% of all women with births.
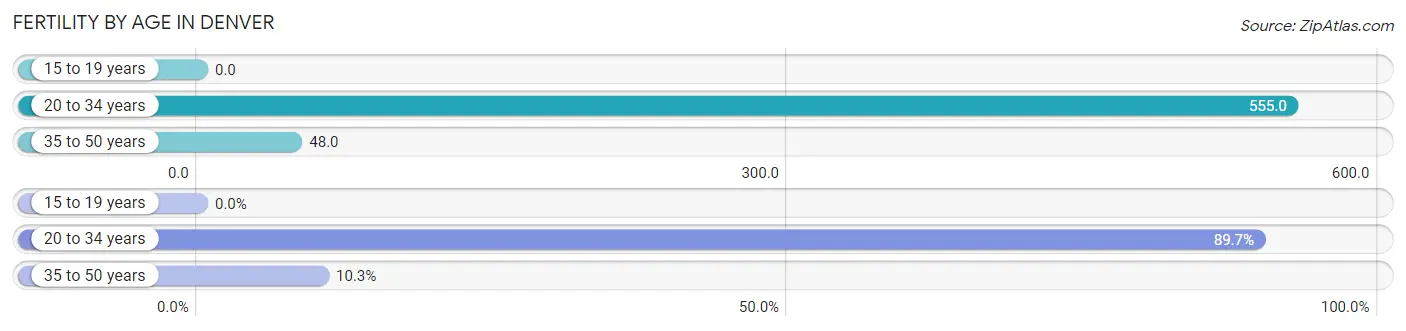
| Age Bracket | Women with Births | Births / 1,000 Women |
| 15 to 19 years | 0 (0.0%) | 0.0 |
| 20 to 34 years | 131 (89.7%) | 555.0 |
| 35 to 50 years | 15 (10.3%) | 48.0 |
| Total | 146 (100.0%) | 254.0 |
Fertility by Age by Marriage Status in Denver
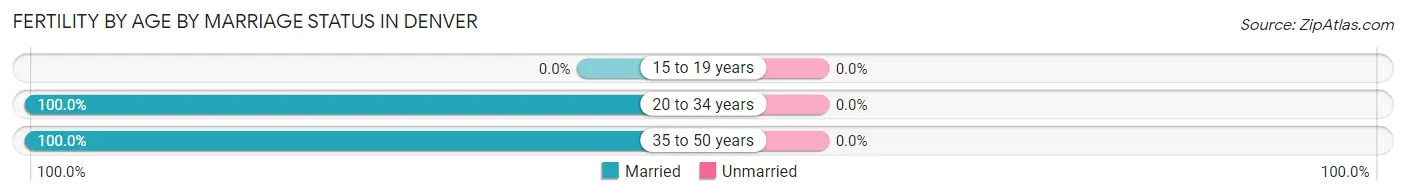
| Age Bracket | Married | Unmarried |
| 15 to 19 years | 0 (0.0%) | 0 (0.0%) |
| 20 to 34 years | 131 (100.0%) | 0 (0.0%) |
| 35 to 50 years | 15 (100.0%) | 0 (0.0%) |
| Total | 146 (100.0%) | 0 (0.0%) |
Fertility by Education in Denver
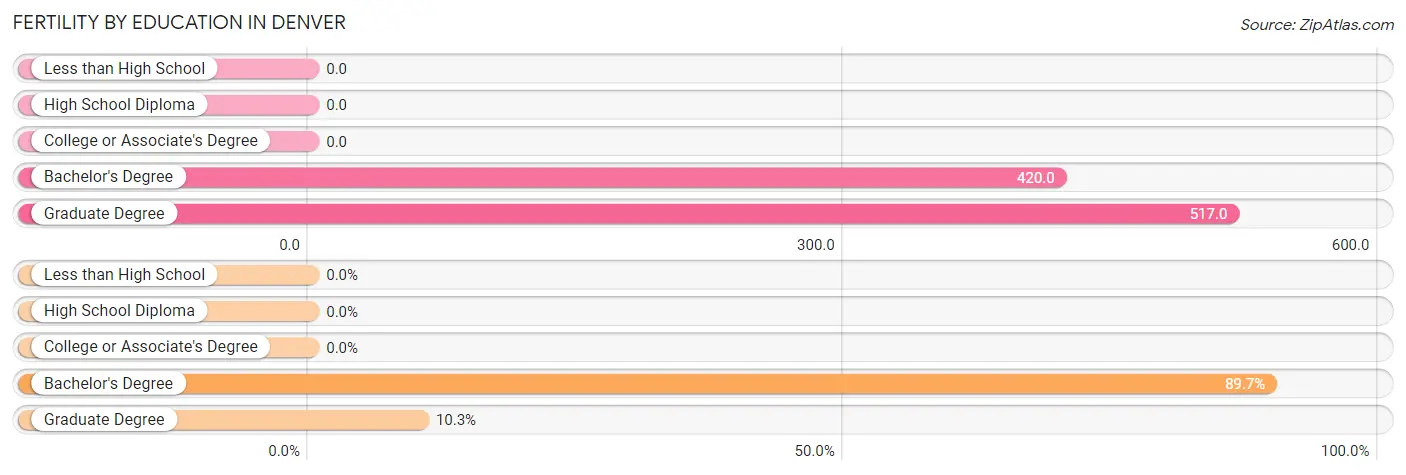
| Educational Attainment | Women with Births | Births / 1,000 Women |
| Less than High School | 0 (0.0%) | 0.0 |
| High School Diploma | 0 (0.0%) | 0.0 |
| College or Associate's Degree | 0 (0.0%) | 0.0 |
| Bachelor's Degree | 131 (89.7%) | 420.0 |
| Graduate Degree | 15 (10.3%) | 517.0 |
| Total | 146 (100.0%) | 254.0 |
Fertility by Education by Marriage Status in Denver
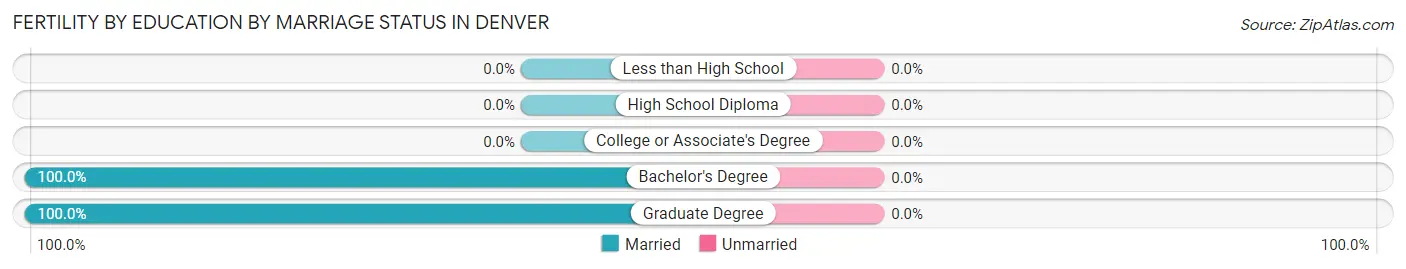
| Educational Attainment | Married | Unmarried |
| Less than High School | 0 (0.0%) | 0 (0.0%) |
| High School Diploma | 0 (0.0%) | 0 (0.0%) |
| College or Associate's Degree | 0 (0.0%) | 0 (0.0%) |
| Bachelor's Degree | 131 (100.0%) | 0 (0.0%) |
| Graduate Degree | 15 (100.0%) | 0 (0.0%) |
| Total | 146 (100.0%) | 0 (0.0%) |
Employment Characteristics in Denver
Employment by Class of Employer in Denver
Among the 1,185 employed individuals in Denver, private company employees (833 | 70.3%), local government employees (85 | 7.2%), and self-employed (incorporated) (83 | 7.0%) make up the most common classes of employment.
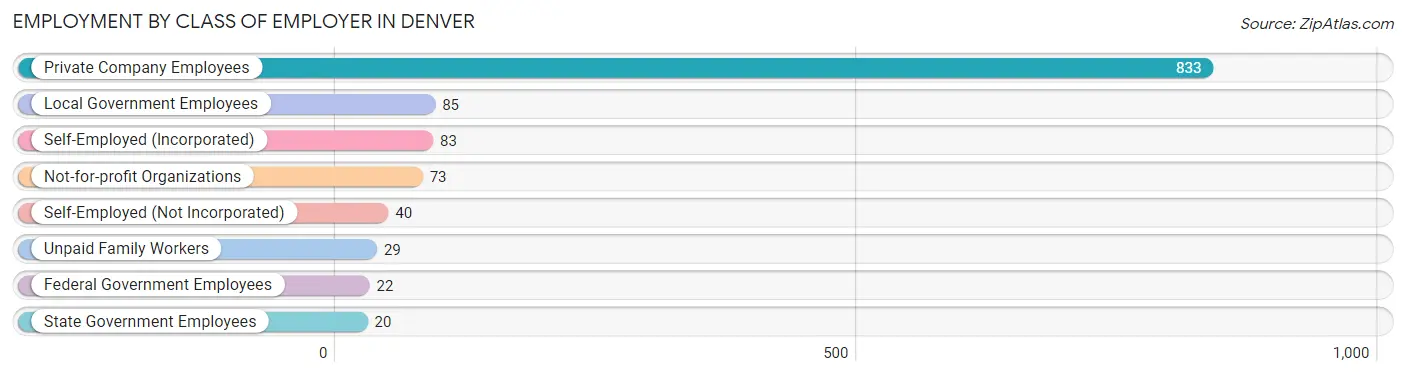
| Employer Class | # Employees | % Employees |
| Private Company Employees | 833 | 70.3% |
| Self-Employed (Incorporated) | 83 | 7.0% |
| Self-Employed (Not Incorporated) | 40 | 3.4% |
| Not-for-profit Organizations | 73 | 6.2% |
| Local Government Employees | 85 | 7.2% |
| State Government Employees | 20 | 1.7% |
| Federal Government Employees | 22 | 1.9% |
| Unpaid Family Workers | 29 | 2.5% |
| Total | 1,185 | 100.0% |
Employment Status by Age in Denver
According to the labor force statistics for Denver, out of the total population over 16 years of age (2,101), 70.0% or 1,471 individuals are in the labor force, with 3.7% or 54 of them unemployed. The age group with the highest labor force participation rate is 20 to 24 years, with 100.0% or 117 individuals in the labor force. Within the labor force, the 55 to 59 years age range has the highest percentage of unemployed individuals, with 22.8% or 36 of them being unemployed.
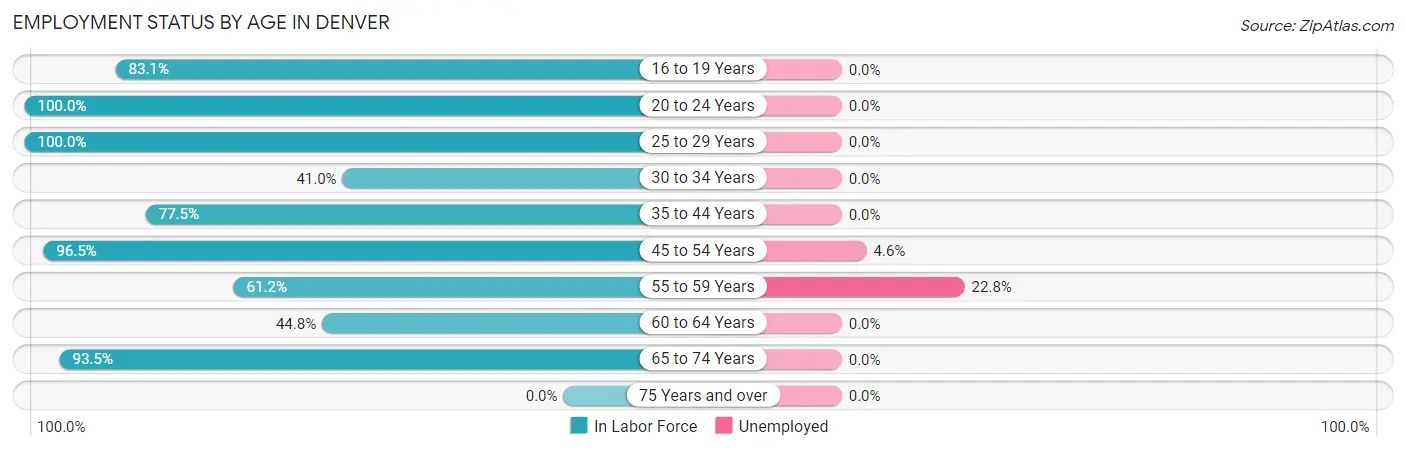
| Age Bracket | In Labor Force | Unemployed |
| 16 to 19 Years | 59 (83.1%) | 0 (0.0%) |
| 20 to 24 Years | 117 (100.0%) | 0 (0.0%) |
| 25 to 29 Years | 227 (100.0%) | 0 (0.0%) |
| 30 to 34 Years | 73 (41.0%) | 0 (0.0%) |
| 35 to 44 Years | 213 (77.5%) | 0 (0.0%) |
| 45 to 54 Years | 389 (96.5%) | 18 (4.6%) |
| 55 to 59 Years | 158 (61.2%) | 36 (22.8%) |
| 60 to 64 Years | 60 (44.8%) | 0 (0.0%) |
| 65 to 74 Years | 174 (93.5%) | 0 (0.0%) |
| 75 Years and over | 0 (0.0%) | 0 (0.0%) |
| Total | 1,471 (70.0%) | 54 (3.7%) |
Employment Status by Educational Attainment in Denver
According to labor force statistics for Denver, 75.9% of individuals (1,120) out of the total population between 25 and 64 years of age (1,475) are in the labor force, with 4.8% or 54 of them being unemployed. The group with the highest labor force participation rate are those with the educational attainment of college / associate degree, with 82.6% or 309 individuals in the labor force. Within the labor force, individuals with bachelor's degree or higher education have the highest percentage of unemployment, with 9.1% or 54 of them being unemployed.
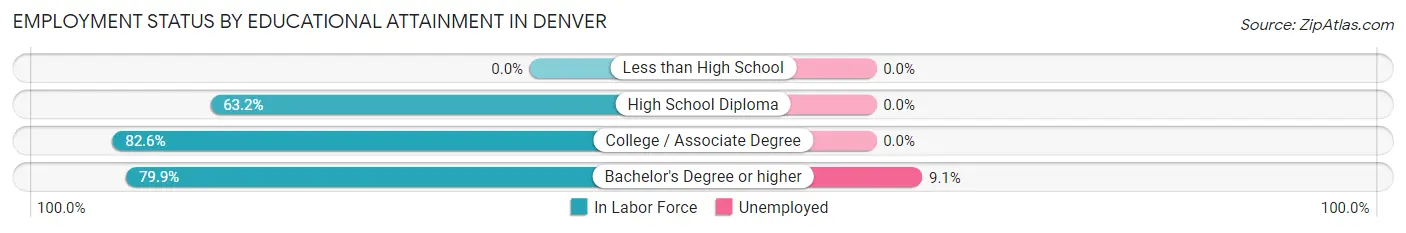
| Educational Attainment | In Labor Force | Unemployed |
| Less than High School | 0 (0.0%) | 0 (0.0%) |
| High School Diploma | 218 (63.2%) | 0 (0.0%) |
| College / Associate Degree | 309 (82.6%) | 0 (0.0%) |
| Bachelor's Degree or higher | 593 (79.9%) | 68 (9.1%) |
| Total | 1,120 (75.9%) | 71 (4.8%) |
Employment Occupations by Sex in Denver
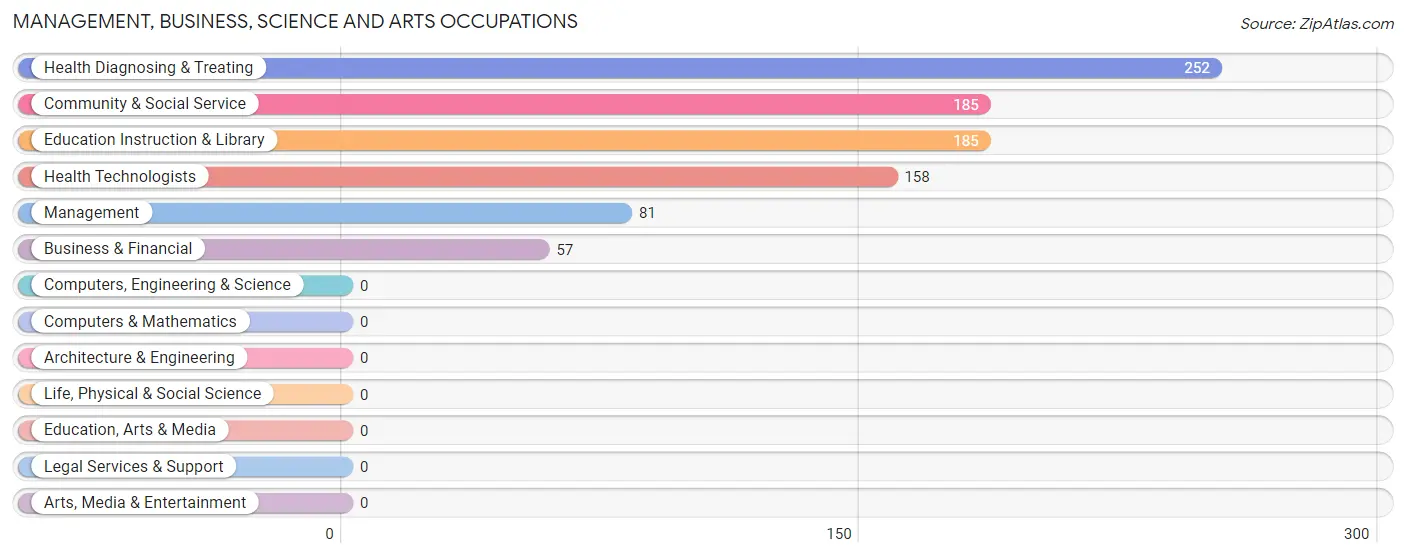
Management, Business, Science and Arts Occupations
The most common Management, Business, Science and Arts occupations in Denver are Health Diagnosing & Treating (252 | 17.8%), Community & Social Service (185 | 13.1%), Education Instruction & Library (185 | 13.1%), Health Technologists (158 | 11.2%), and Management (81 | 5.7%).
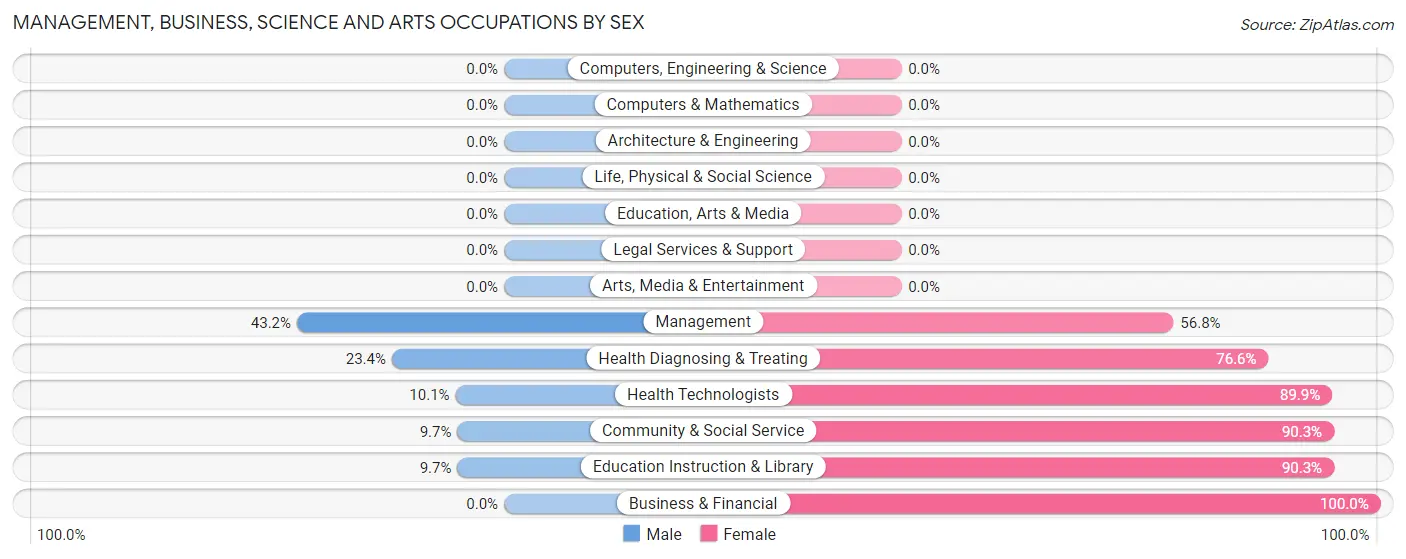
Management, Business, Science and Arts Occupations by Sex
Within the Management, Business, Science and Arts occupations in Denver, the most male-oriented occupations are Management (43.2%), Health Diagnosing & Treating (23.4%), and Health Technologists (10.1%), while the most female-oriented occupations are Business & Financial (100.0%), Community & Social Service (90.3%), and Education Instruction & Library (90.3%).
| Occupation | Male | Female |
| Management | 35 (43.2%) | 46 (56.8%) |
| Business & Financial | 0 (0.0%) | 57 (100.0%) |
| Computers, Engineering & Science | 0 (0.0%) | 0 (0.0%) |
| Computers & Mathematics | 0 (0.0%) | 0 (0.0%) |
| Architecture & Engineering | 0 (0.0%) | 0 (0.0%) |
| Life, Physical & Social Science | 0 (0.0%) | 0 (0.0%) |
| Community & Social Service | 18 (9.7%) | 167 (90.3%) |
| Education, Arts & Media | 0 (0.0%) | 0 (0.0%) |
| Legal Services & Support | 0 (0.0%) | 0 (0.0%) |
| Education Instruction & Library | 18 (9.7%) | 167 (90.3%) |
| Arts, Media & Entertainment | 0 (0.0%) | 0 (0.0%) |
| Health Diagnosing & Treating | 59 (23.4%) | 193 (76.6%) |
| Health Technologists | 16 (10.1%) | 142 (89.9%) |
| Total (Category) | 112 (19.5%) | 463 (80.5%) |
| Total (Overall) | 699 (49.4%) | 717 (50.6%) |
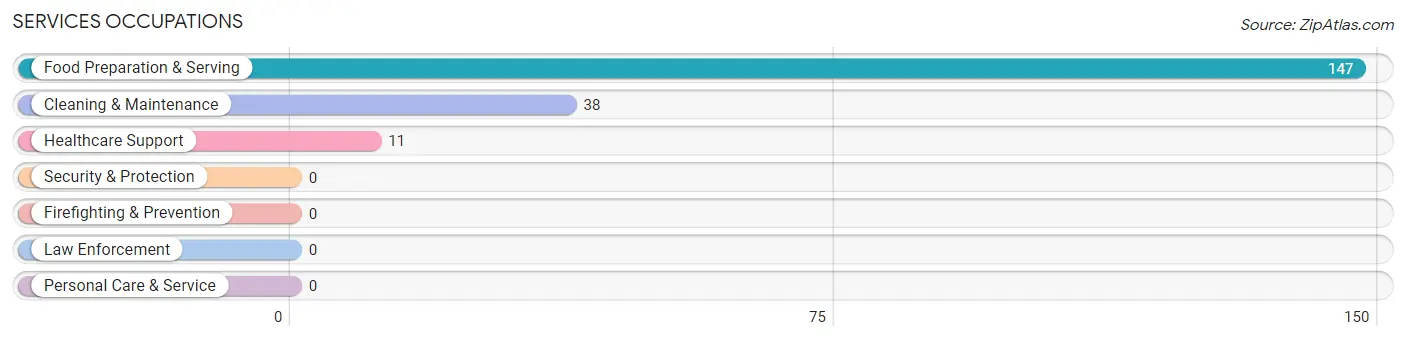
Services Occupations
The most common Services occupations in Denver are Food Preparation & Serving (147 | 10.4%), Cleaning & Maintenance (38 | 2.7%), and Healthcare Support (11 | 0.8%).
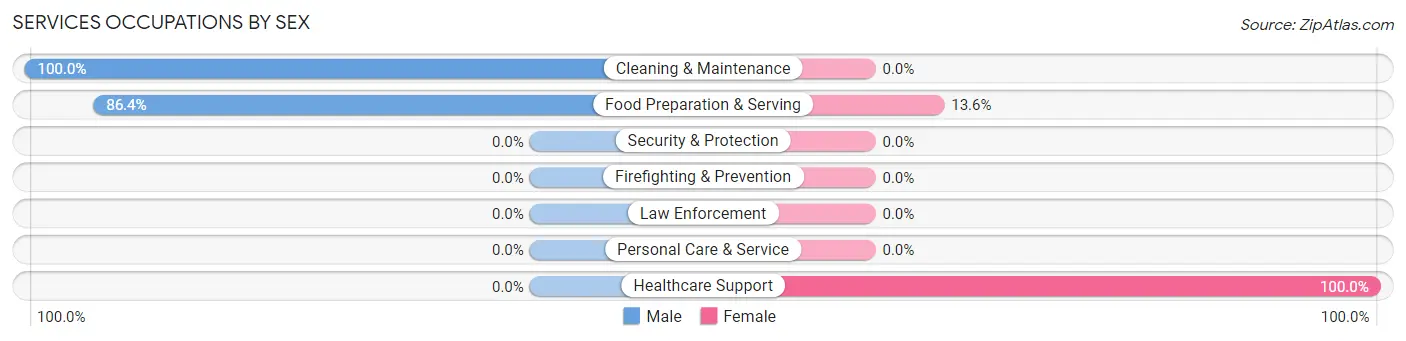
Services Occupations by Sex
Within the Services occupations in Denver, the most male-oriented occupations are Cleaning & Maintenance (100.0%), and Food Preparation & Serving (86.4%), while the most female-oriented occupations are Healthcare Support (100.0%), and Food Preparation & Serving (13.6%).
| Occupation | Male | Female |
| Healthcare Support | 0 (0.0%) | 11 (100.0%) |
| Security & Protection | 0 (0.0%) | 0 (0.0%) |
| Firefighting & Prevention | 0 (0.0%) | 0 (0.0%) |
| Law Enforcement | 0 (0.0%) | 0 (0.0%) |
| Food Preparation & Serving | 127 (86.4%) | 20 (13.6%) |
| Cleaning & Maintenance | 38 (100.0%) | 0 (0.0%) |
| Personal Care & Service | 0 (0.0%) | 0 (0.0%) |
| Total (Category) | 165 (84.2%) | 31 (15.8%) |
| Total (Overall) | 699 (49.4%) | 717 (50.6%) |
Sales and Office Occupations
The most common Sales and Office occupations in Denver are Sales & Related (219 | 15.5%), and Office & Administration (129 | 9.1%).

Sales and Office Occupations by Sex

| Occupation | Male | Female |
| Sales & Related | 151 (69.0%) | 68 (31.0%) |
| Office & Administration | 16 (12.4%) | 113 (87.6%) |
| Total (Category) | 167 (48.0%) | 181 (52.0%) |
| Total (Overall) | 699 (49.4%) | 717 (50.6%) |
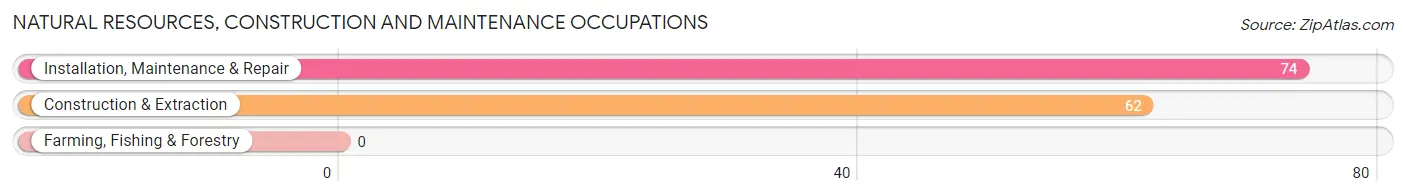
Natural Resources, Construction and Maintenance Occupations
The most common Natural Resources, Construction and Maintenance occupations in Denver are Installation, Maintenance & Repair (74 | 5.2%), and Construction & Extraction (62 | 4.4%).
Natural Resources, Construction and Maintenance Occupations by Sex
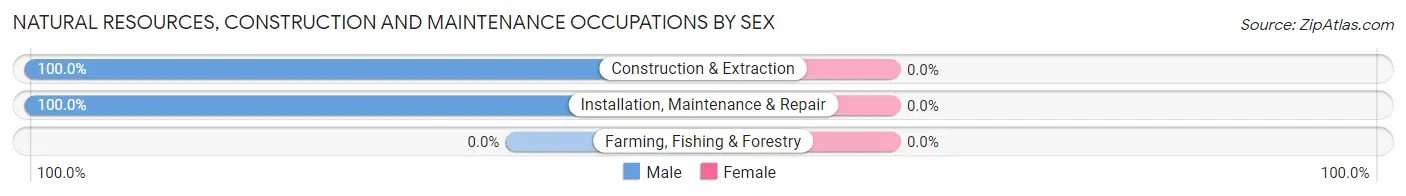
| Occupation | Male | Female |
| Farming, Fishing & Forestry | 0 (0.0%) | 0 (0.0%) |
| Construction & Extraction | 62 (100.0%) | 0 (0.0%) |
| Installation, Maintenance & Repair | 74 (100.0%) | 0 (0.0%) |
| Total (Category) | 136 (100.0%) | 0 (0.0%) |
| Total (Overall) | 699 (49.4%) | 717 (50.6%) |
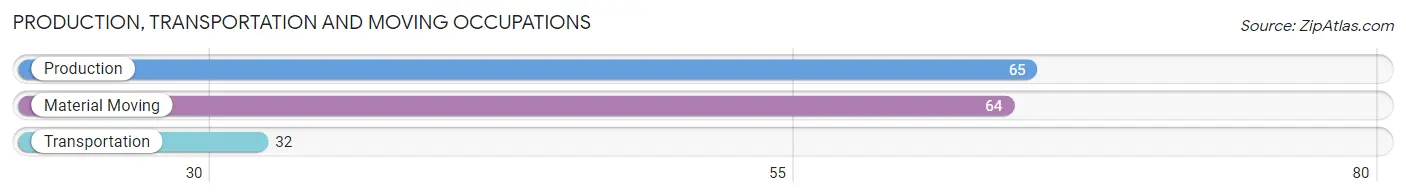
Production, Transportation and Moving Occupations
The most common Production, Transportation and Moving occupations in Denver are Production (65 | 4.6%), Material Moving (64 | 4.5%), and Transportation (32 | 2.3%).
Production, Transportation and Moving Occupations by Sex
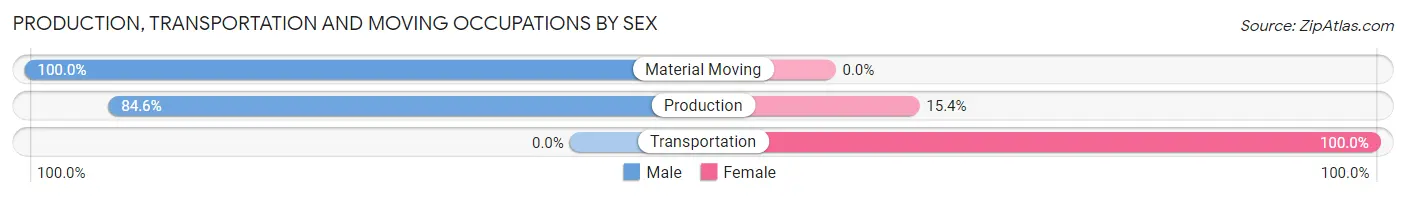
| Occupation | Male | Female |
| Production | 55 (84.6%) | 10 (15.4%) |
| Transportation | 0 (0.0%) | 32 (100.0%) |
| Material Moving | 64 (100.0%) | 0 (0.0%) |
| Total (Category) | 119 (73.9%) | 42 (26.1%) |
| Total (Overall) | 699 (49.4%) | 717 (50.6%) |
Employment Industries by Sex in Denver
Employment Industries in Denver
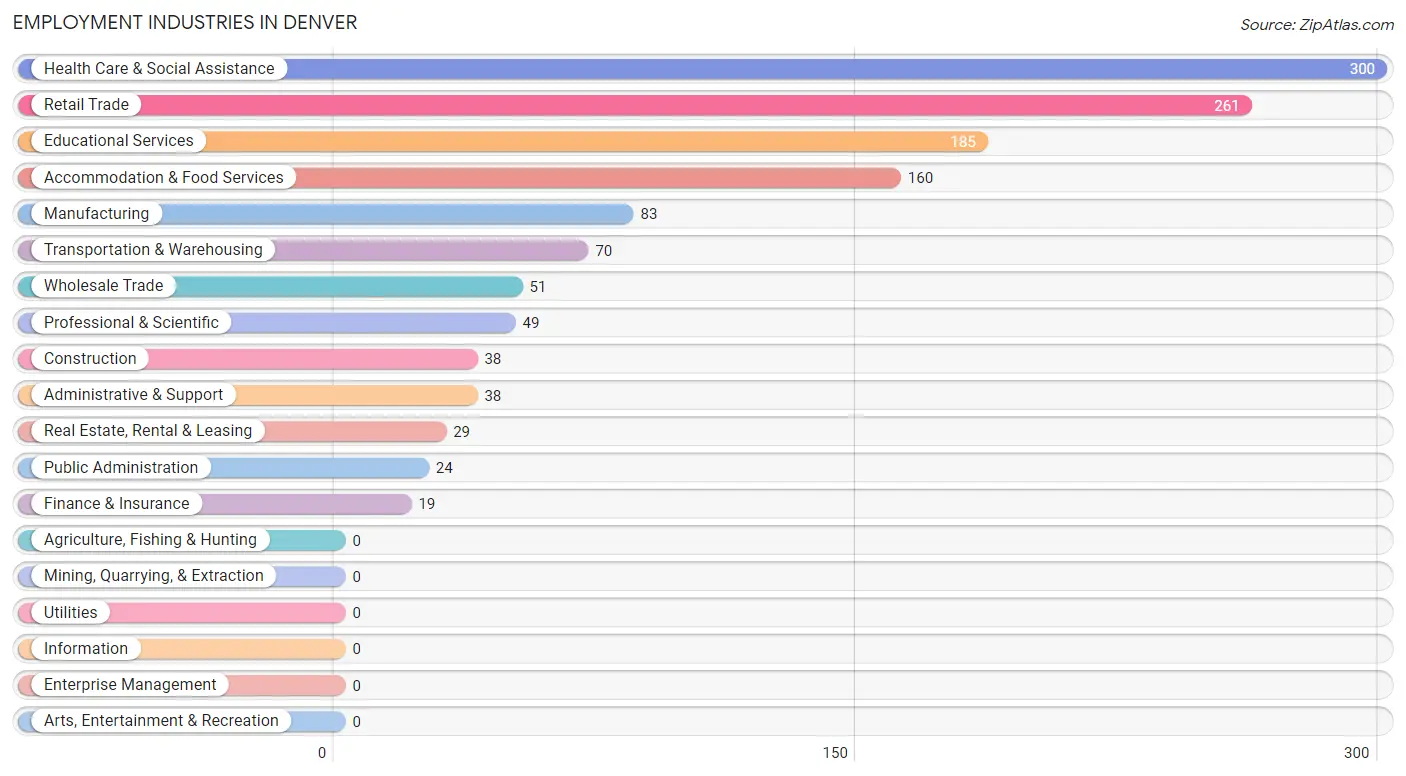
The major employment industries in Denver include Health Care & Social Assistance (300 | 21.2%), Retail Trade (261 | 18.4%), Educational Services (185 | 13.1%), Accommodation & Food Services (160 | 11.3%), and Manufacturing (83 | 5.9%).
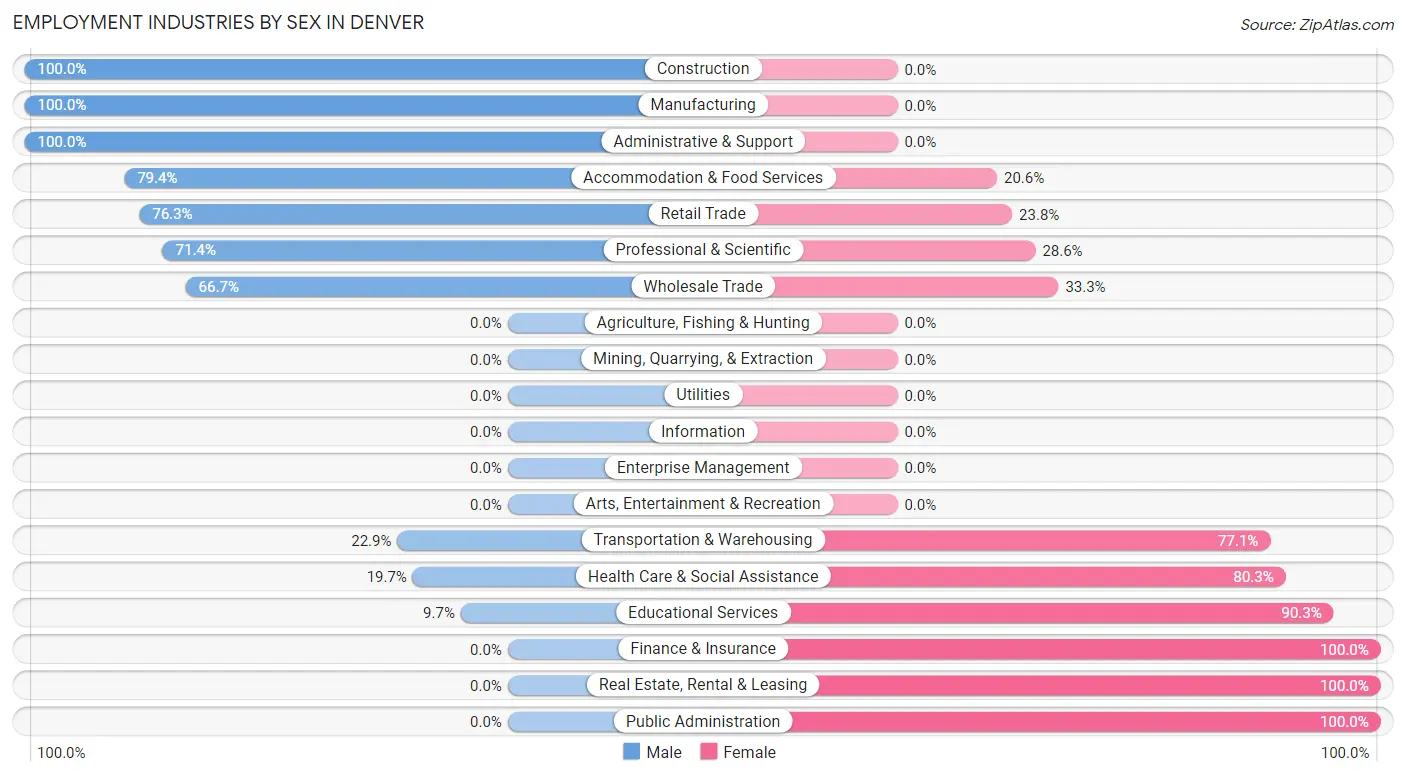
Employment Industries by Sex in Denver
The Denver industries that see more men than women are Construction (100.0%), Manufacturing (100.0%), and Administrative & Support (100.0%), whereas the industries that tend to have a higher number of women are Finance & Insurance (100.0%), Real Estate, Rental & Leasing (100.0%), and Public Administration (100.0%).
| Industry | Male | Female |
| Agriculture, Fishing & Hunting | 0 (0.0%) | 0 (0.0%) |
| Mining, Quarrying, & Extraction | 0 (0.0%) | 0 (0.0%) |
| Construction | 38 (100.0%) | 0 (0.0%) |
| Manufacturing | 83 (100.0%) | 0 (0.0%) |
| Wholesale Trade | 34 (66.7%) | 17 (33.3%) |
| Retail Trade | 199 (76.2%) | 62 (23.7%) |
| Transportation & Warehousing | 16 (22.9%) | 54 (77.1%) |
| Utilities | 0 (0.0%) | 0 (0.0%) |
| Information | 0 (0.0%) | 0 (0.0%) |
| Finance & Insurance | 0 (0.0%) | 19 (100.0%) |
| Real Estate, Rental & Leasing | 0 (0.0%) | 29 (100.0%) |
| Professional & Scientific | 35 (71.4%) | 14 (28.6%) |
| Enterprise Management | 0 (0.0%) | 0 (0.0%) |
| Administrative & Support | 38 (100.0%) | 0 (0.0%) |
| Educational Services | 18 (9.7%) | 167 (90.3%) |
| Health Care & Social Assistance | 59 (19.7%) | 241 (80.3%) |
| Arts, Entertainment & Recreation | 0 (0.0%) | 0 (0.0%) |
| Accommodation & Food Services | 127 (79.4%) | 33 (20.6%) |
| Public Administration | 0 (0.0%) | 24 (100.0%) |
| Total | 699 (49.4%) | 717 (50.6%) |
Education in Denver
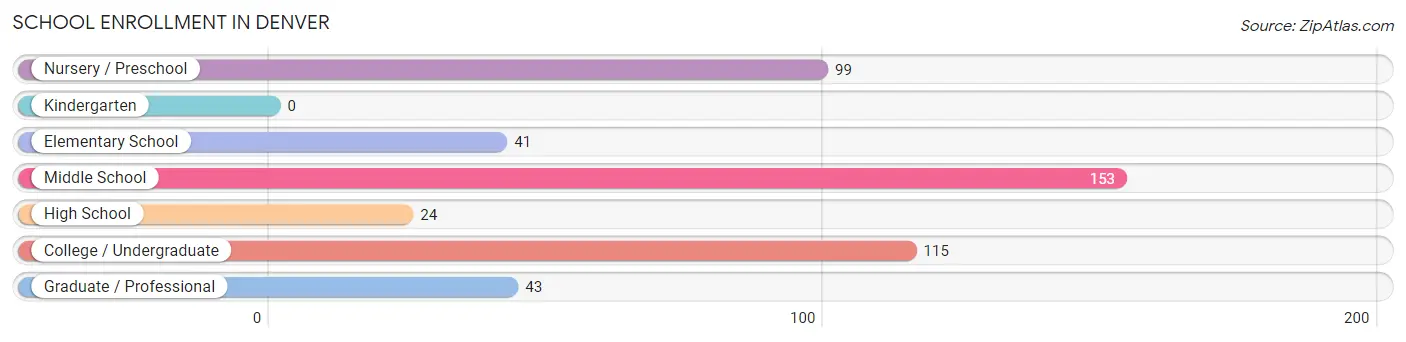
School Enrollment in Denver
The most common levels of schooling among the 475 students in Denver are middle school (153 | 32.2%), college / undergraduate (115 | 24.2%), and nursery / preschool (99 | 20.8%).
| School Level | # Students | % Students |
| Nursery / Preschool | 99 | 20.8% |
| Kindergarten | 0 | 0.0% |
| Elementary School | 41 | 8.6% |
| Middle School | 153 | 32.2% |
| High School | 24 | 5.1% |
| College / Undergraduate | 115 | 24.2% |
| Graduate / Professional | 43 | 9.0% |
| Total | 475 | 100.0% |
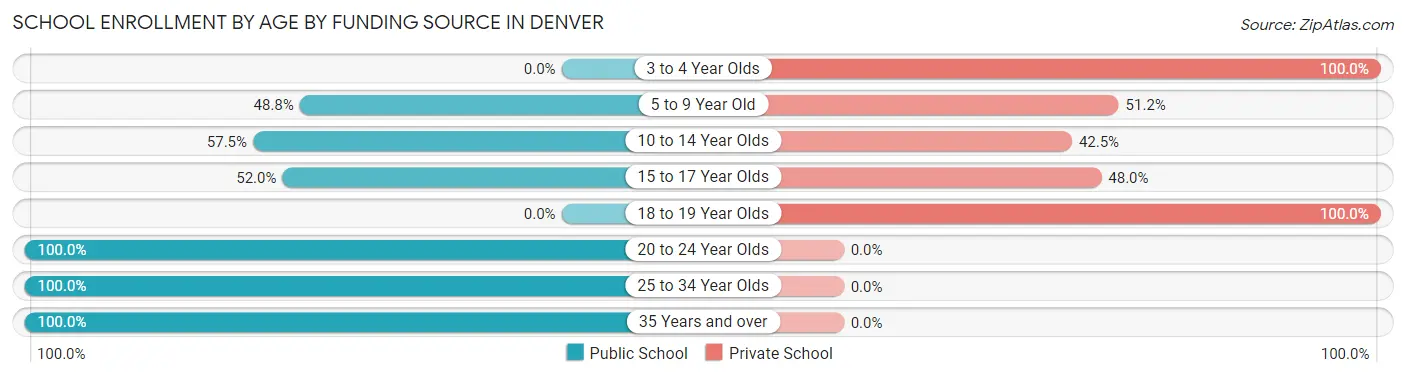
School Enrollment by Age by Funding Source in Denver
Out of a total of 475 students who are enrolled in schools in Denver, 217 (45.7%) attend a private institution, while the remaining 258 (54.3%) are enrolled in public schools. The age group of 3 to 4 year olds has the highest likelihood of being enrolled in private schools, with 99 (100.0% in the age bracket) enrolled. Conversely, the age group of 20 to 24 year olds has the lowest likelihood of being enrolled in a private school, with 80 (100.0% in the age bracket) attending a public institution.
| Age Bracket | Public School | Private School |
| 3 to 4 Year Olds | 0 (0.0%) | 99 (100.0%) |
| 5 to 9 Year Old | 20 (48.8%) | 21 (51.2%) |
| 10 to 14 Year Olds | 73 (57.5%) | 54 (42.5%) |
| 15 to 17 Year Olds | 26 (52.0%) | 24 (48.0%) |
| 18 to 19 Year Olds | 0 (0.0%) | 19 (100.0%) |
| 20 to 24 Year Olds | 80 (100.0%) | 0 (0.0%) |
| 25 to 34 Year Olds | 43 (100.0%) | 0 (0.0%) |
| 35 Years and over | 16 (100.0%) | 0 (0.0%) |
| Total | 258 (54.3%) | 217 (45.7%) |
Educational Attainment by Field of Study in Denver
Literature & languages (147 | 17.7%), science & technology (143 | 17.2%), business (116 | 14.0%), social sciences (105 | 12.6%), and bio, nature & agricultural (93 | 11.2%) are the most common fields of study among 831 individuals in Denver who have obtained a bachelor's degree or higher.
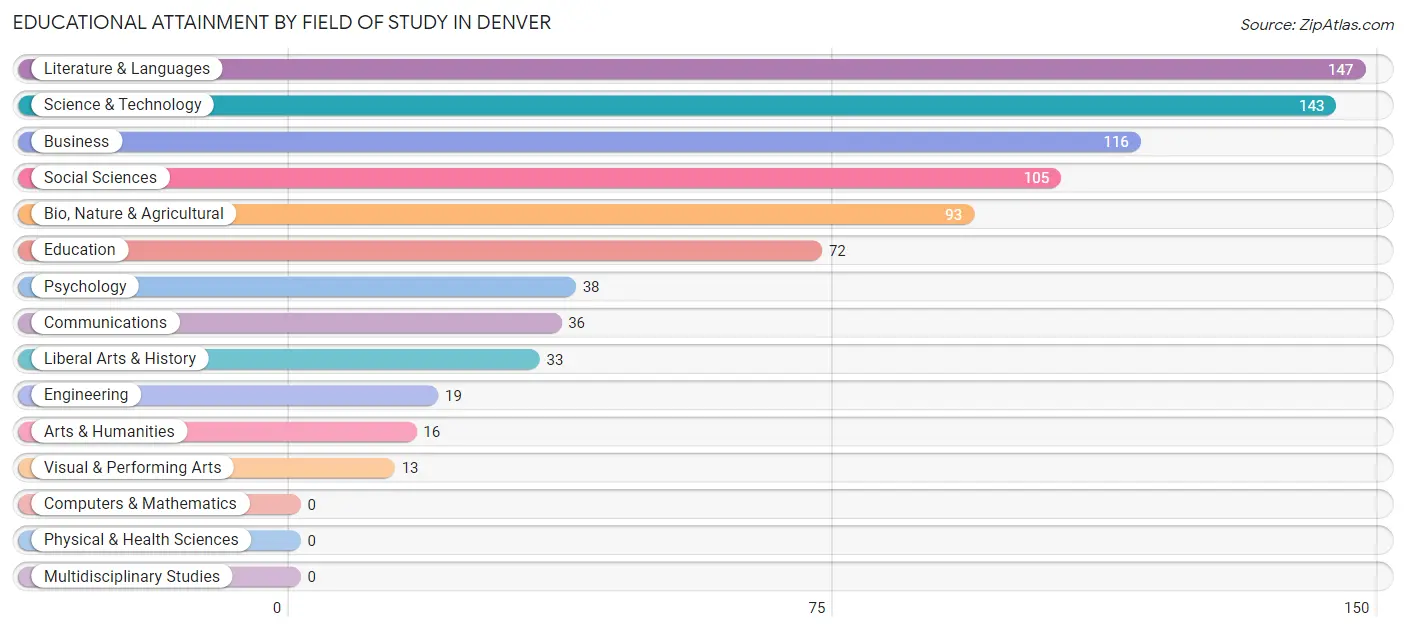
| Field of Study | # Graduates | % Graduates |
| Computers & Mathematics | 0 | 0.0% |
| Bio, Nature & Agricultural | 93 | 11.2% |
| Physical & Health Sciences | 0 | 0.0% |
| Psychology | 38 | 4.6% |
| Social Sciences | 105 | 12.6% |
| Engineering | 19 | 2.3% |
| Multidisciplinary Studies | 0 | 0.0% |
| Science & Technology | 143 | 17.2% |
| Business | 116 | 14.0% |
| Education | 72 | 8.7% |
| Literature & Languages | 147 | 17.7% |
| Liberal Arts & History | 33 | 4.0% |
| Visual & Performing Arts | 13 | 1.6% |
| Communications | 36 | 4.3% |
| Arts & Humanities | 16 | 1.9% |
| Total | 831 | 100.0% |
Transportation & Commute in Denver
Vehicle Availability by Sex in Denver
The most prevalent vehicle ownership categories in Denver are males with 3 vehicles (354, accounting for 51.1%) and females with 3 vehicles (229, making up 72.0%).
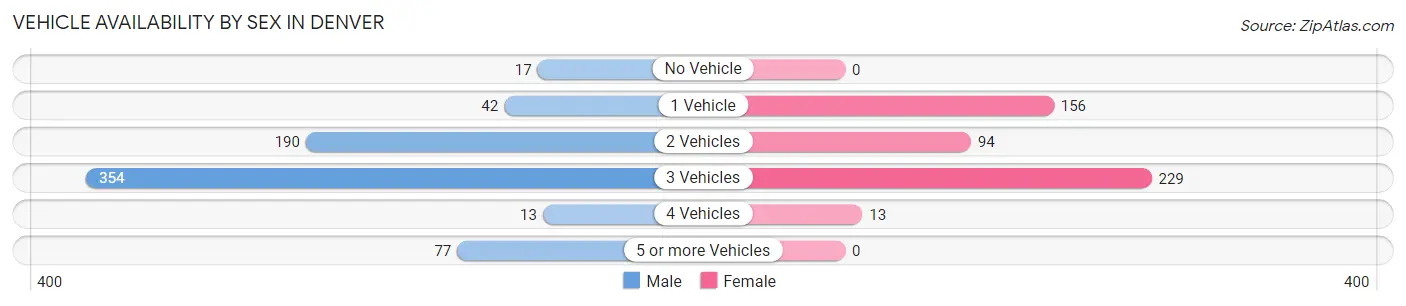
| Vehicles Available | Male | Female |
| No Vehicle | 17 (2.5%) | 0 (0.0%) |
| 1 Vehicle | 42 (6.1%) | 156 (31.7%) |
| 2 Vehicles | 190 (27.4%) | 94 (19.1%) |
| 3 Vehicles | 354 (51.1%) | 229 (46.5%) |
| 4 Vehicles | 13 (1.9%) | 13 (2.6%) |
| 5 or more Vehicles | 77 (11.1%) | 0 (0.0%) |
| Total | 693 (100.0%) | 492 (100.0%) |
Commute Time in Denver
The most frequently occuring commute durations in Denver are 45 to 59 minutes (241 commuters, 20.9%), 20 to 24 minutes (169 commuters, 14.6%), and 25 to 29 minutes (130 commuters, 11.3%).
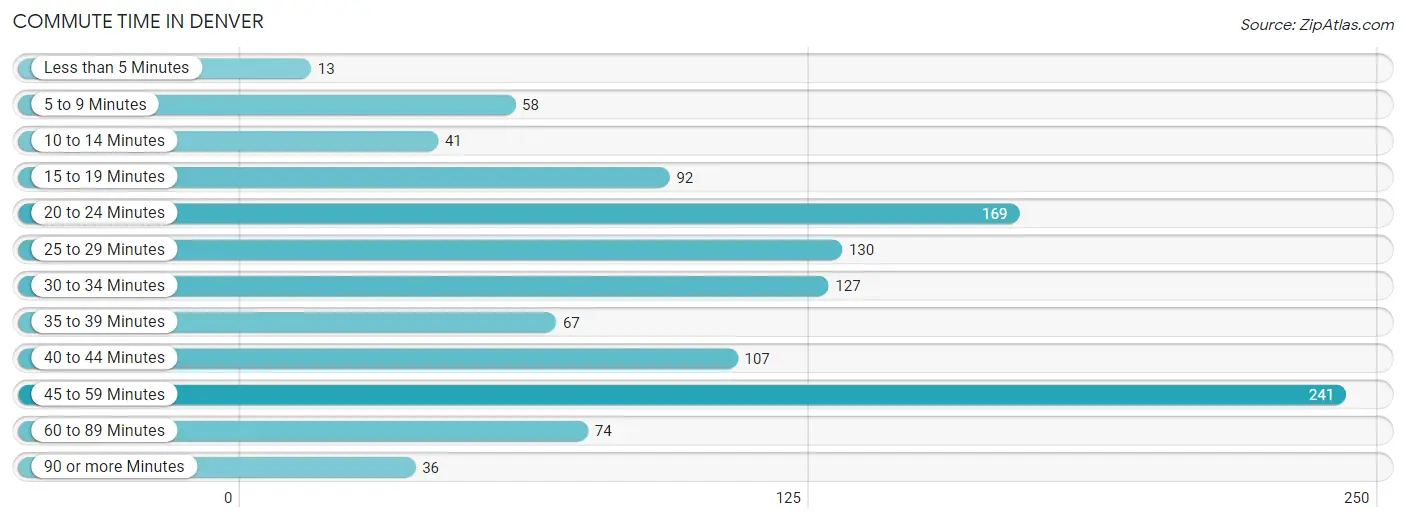
| Commute Time | # Commuters | % Commuters |
| Less than 5 Minutes | 13 | 1.1% |
| 5 to 9 Minutes | 58 | 5.0% |
| 10 to 14 Minutes | 41 | 3.5% |
| 15 to 19 Minutes | 92 | 8.0% |
| 20 to 24 Minutes | 169 | 14.6% |
| 25 to 29 Minutes | 130 | 11.3% |
| 30 to 34 Minutes | 127 | 11.0% |
| 35 to 39 Minutes | 67 | 5.8% |
| 40 to 44 Minutes | 107 | 9.3% |
| 45 to 59 Minutes | 241 | 20.9% |
| 60 to 89 Minutes | 74 | 6.4% |
| 90 or more Minutes | 36 | 3.1% |
Commute Time by Sex in Denver
The most common commute times in Denver are 20 to 24 minutes (155 commuters, 22.4%) for males and 45 to 59 minutes (146 commuters, 31.6%) for females.
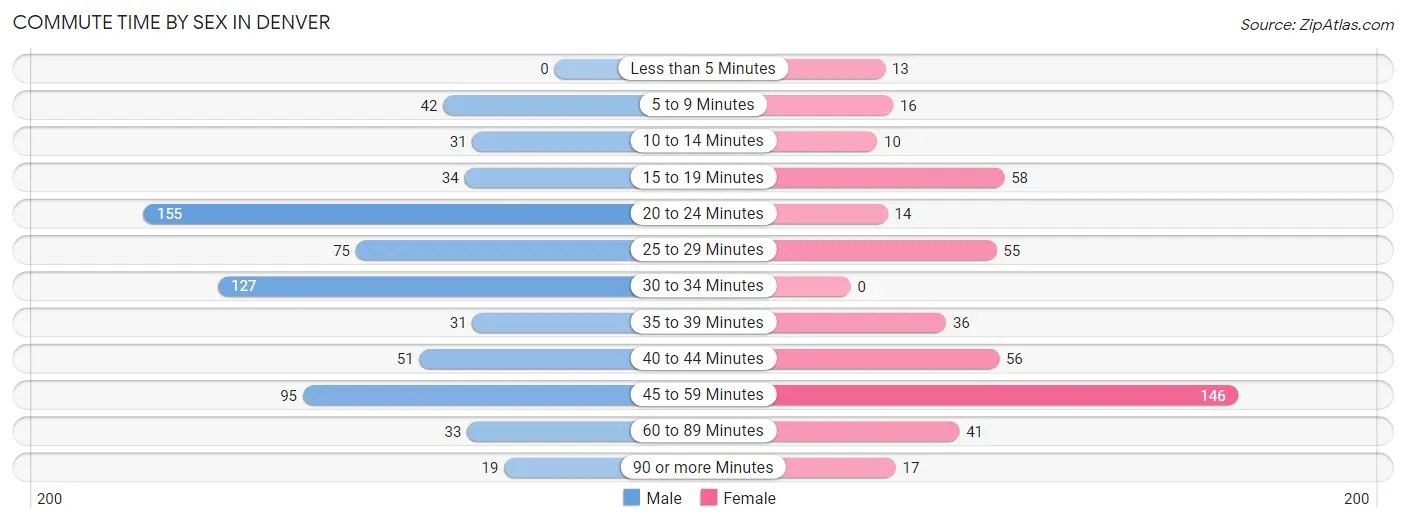
| Commute Time | Male | Female |
| Less than 5 Minutes | 0 (0.0%) | 13 (2.8%) |
| 5 to 9 Minutes | 42 (6.1%) | 16 (3.5%) |
| 10 to 14 Minutes | 31 (4.5%) | 10 (2.2%) |
| 15 to 19 Minutes | 34 (4.9%) | 58 (12.6%) |
| 20 to 24 Minutes | 155 (22.4%) | 14 (3.0%) |
| 25 to 29 Minutes | 75 (10.8%) | 55 (11.9%) |
| 30 to 34 Minutes | 127 (18.3%) | 0 (0.0%) |
| 35 to 39 Minutes | 31 (4.5%) | 36 (7.8%) |
| 40 to 44 Minutes | 51 (7.4%) | 56 (12.1%) |
| 45 to 59 Minutes | 95 (13.7%) | 146 (31.6%) |
| 60 to 89 Minutes | 33 (4.8%) | 41 (8.9%) |
| 90 or more Minutes | 19 (2.7%) | 17 (3.7%) |
Time of Departure to Work by Sex in Denver
The most frequent times of departure to work in Denver are 7:30 AM to 7:59 AM (95, 13.7%) for males and 7:00 AM to 7:29 AM (127, 27.5%) for females.
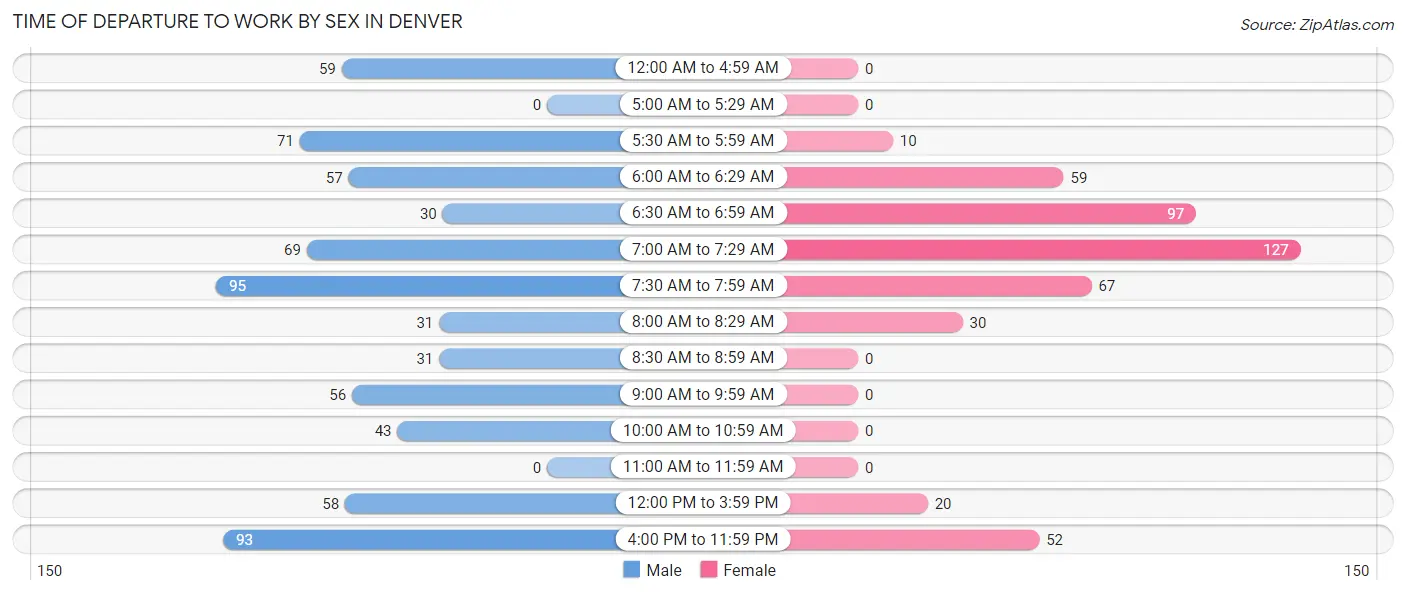
| Time of Departure | Male | Female |
| 12:00 AM to 4:59 AM | 59 (8.5%) | 0 (0.0%) |
| 5:00 AM to 5:29 AM | 0 (0.0%) | 0 (0.0%) |
| 5:30 AM to 5:59 AM | 71 (10.2%) | 10 (2.2%) |
| 6:00 AM to 6:29 AM | 57 (8.2%) | 59 (12.8%) |
| 6:30 AM to 6:59 AM | 30 (4.3%) | 97 (21.0%) |
| 7:00 AM to 7:29 AM | 69 (10.0%) | 127 (27.5%) |
| 7:30 AM to 7:59 AM | 95 (13.7%) | 67 (14.5%) |
| 8:00 AM to 8:29 AM | 31 (4.5%) | 30 (6.5%) |
| 8:30 AM to 8:59 AM | 31 (4.5%) | 0 (0.0%) |
| 9:00 AM to 9:59 AM | 56 (8.1%) | 0 (0.0%) |
| 10:00 AM to 10:59 AM | 43 (6.2%) | 0 (0.0%) |
| 11:00 AM to 11:59 AM | 0 (0.0%) | 0 (0.0%) |
| 12:00 PM to 3:59 PM | 58 (8.4%) | 20 (4.3%) |
| 4:00 PM to 11:59 PM | 93 (13.4%) | 52 (11.3%) |
| Total | 693 (100.0%) | 462 (100.0%) |
Housing Occupancy in Denver
Occupancy by Ownership in Denver
Of the total 1,138 dwellings in Denver, owner-occupied units account for 801 (70.4%), while renter-occupied units make up 337 (29.6%).
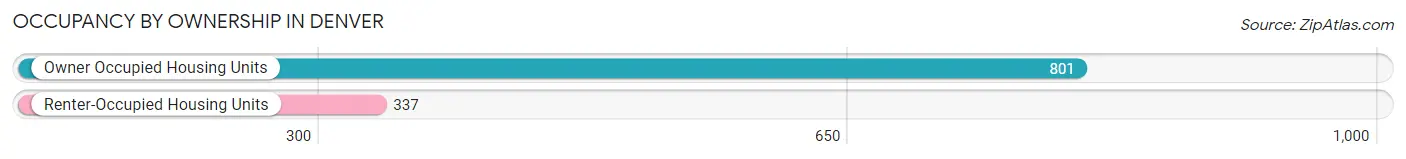
| Occupancy | # Housing Units | % Housing Units |
| Owner Occupied Housing Units | 801 | 70.4% |
| Renter-Occupied Housing Units | 337 | 29.6% |
| Total Occupied Housing Units | 1,138 | 100.0% |
Occupancy by Household Size in Denver
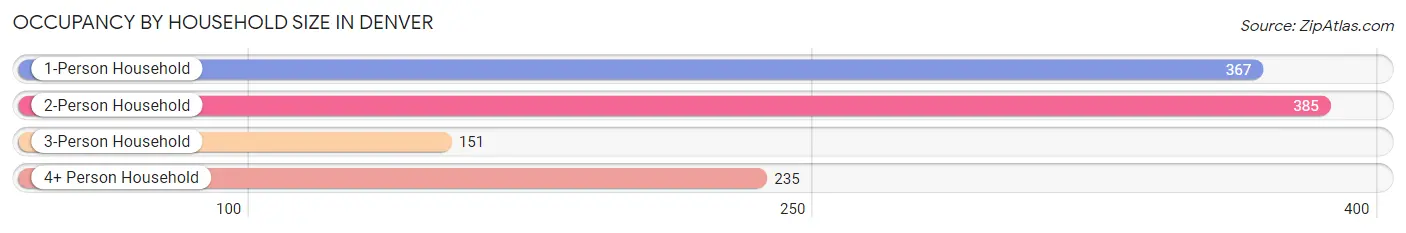
| Household Size | # Housing Units | % Housing Units |
| 1-Person Household | 367 | 32.3% |
| 2-Person Household | 385 | 33.8% |
| 3-Person Household | 151 | 13.3% |
| 4+ Person Household | 235 | 20.6% |
| Total Housing Units | 1,138 | 100.0% |
Occupancy by Ownership by Household Size in Denver
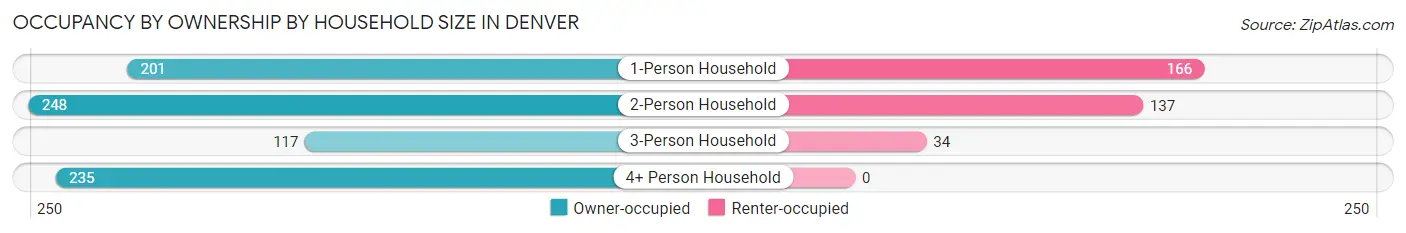
| Household Size | Owner-occupied | Renter-occupied |
| 1-Person Household | 201 (54.8%) | 166 (45.2%) |
| 2-Person Household | 248 (64.4%) | 137 (35.6%) |
| 3-Person Household | 117 (77.5%) | 34 (22.5%) |
| 4+ Person Household | 235 (100.0%) | 0 (0.0%) |
| Total Housing Units | 801 (70.4%) | 337 (29.6%) |
Occupancy by Educational Attainment in Denver
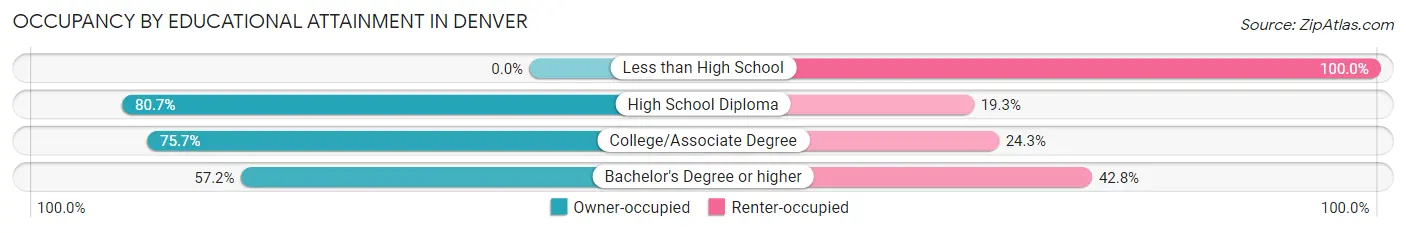
| Household Size | Owner-occupied | Renter-occupied |
| Less than High School | 0 (0.0%) | 14 (100.0%) |
| High School Diploma | 292 (80.7%) | 70 (19.3%) |
| College/Associate Degree | 299 (75.7%) | 96 (24.3%) |
| Bachelor's Degree or higher | 210 (57.2%) | 157 (42.8%) |
Occupancy by Age of Householder in Denver
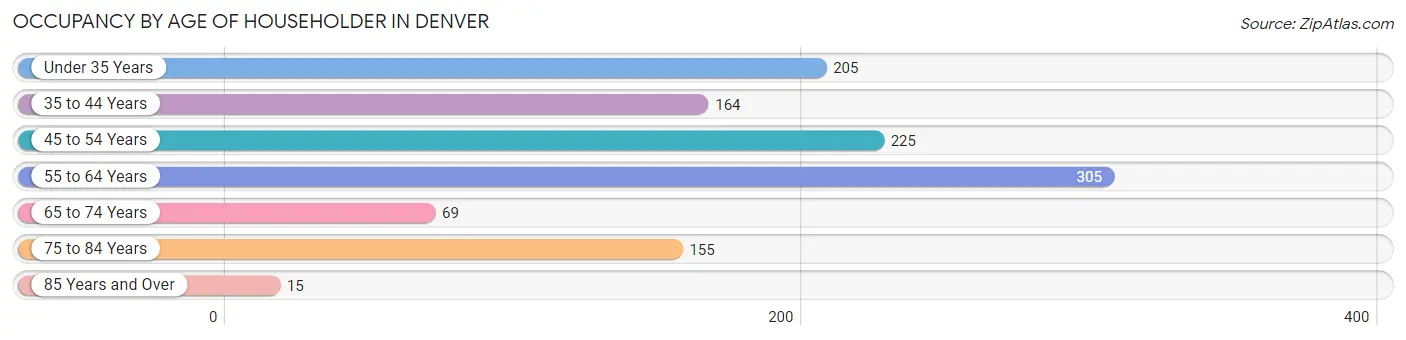
| Age Bracket | # Households | % Households |
| Under 35 Years | 205 | 18.0% |
| 35 to 44 Years | 164 | 14.4% |
| 45 to 54 Years | 225 | 19.8% |
| 55 to 64 Years | 305 | 26.8% |
| 65 to 74 Years | 69 | 6.1% |
| 75 to 84 Years | 155 | 13.6% |
| 85 Years and Over | 15 | 1.3% |
| Total | 1,138 | 100.0% |
Housing Finances in Denver
Median Income by Occupancy in Denver
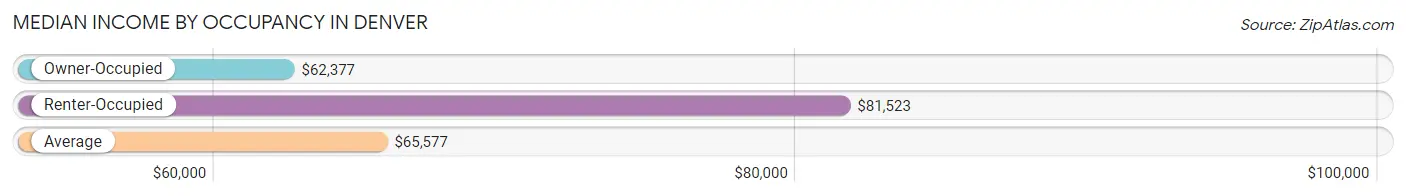
| Occupancy Type | # Households | Median Income |
| Owner-Occupied | 801 (70.4%) | $62,377 |
| Renter-Occupied | 337 (29.6%) | $81,523 |
| Average | 1,138 (100.0%) | $65,577 |
Occupancy by Householder Income Bracket in Denver
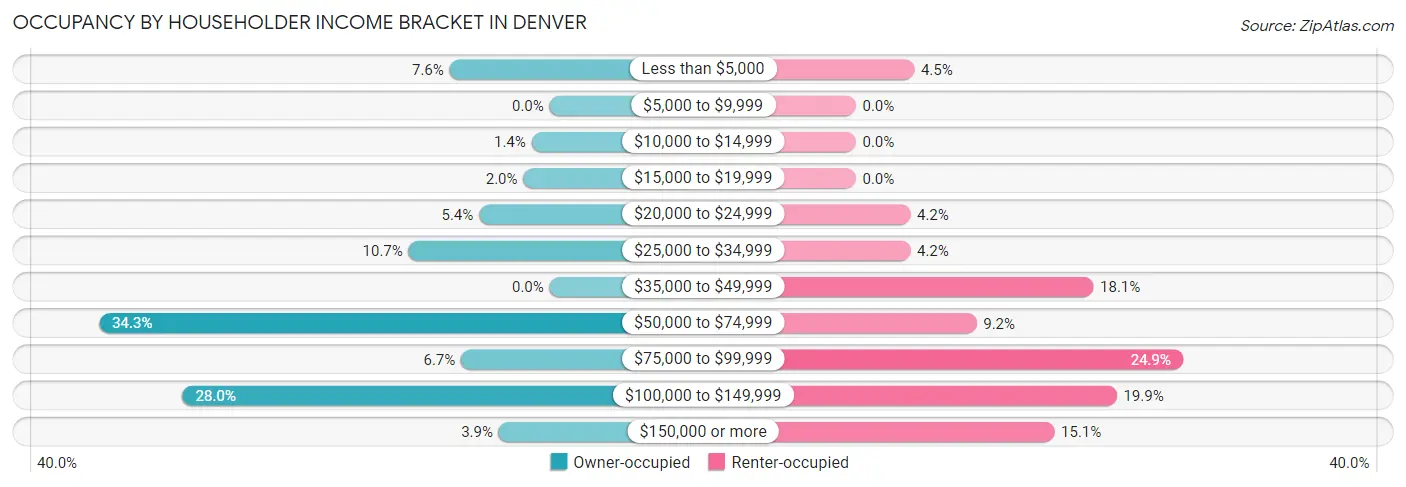
| Income Bracket | Owner-occupied | Renter-occupied |
| Less than $5,000 | 61 (7.6%) | 15 (4.4%) |
| $5,000 to $9,999 | 0 (0.0%) | 0 (0.0%) |
| $10,000 to $14,999 | 11 (1.4%) | 0 (0.0%) |
| $15,000 to $19,999 | 16 (2.0%) | 0 (0.0%) |
| $20,000 to $24,999 | 43 (5.4%) | 14 (4.2%) |
| $25,000 to $34,999 | 86 (10.7%) | 14 (4.2%) |
| $35,000 to $49,999 | 0 (0.0%) | 61 (18.1%) |
| $50,000 to $74,999 | 275 (34.3%) | 31 (9.2%) |
| $75,000 to $99,999 | 54 (6.7%) | 84 (24.9%) |
| $100,000 to $149,999 | 224 (28.0%) | 67 (19.9%) |
| $150,000 or more | 31 (3.9%) | 51 (15.1%) |
| Total | 801 (100.0%) | 337 (100.0%) |
Monthly Housing Cost Tiers in Denver
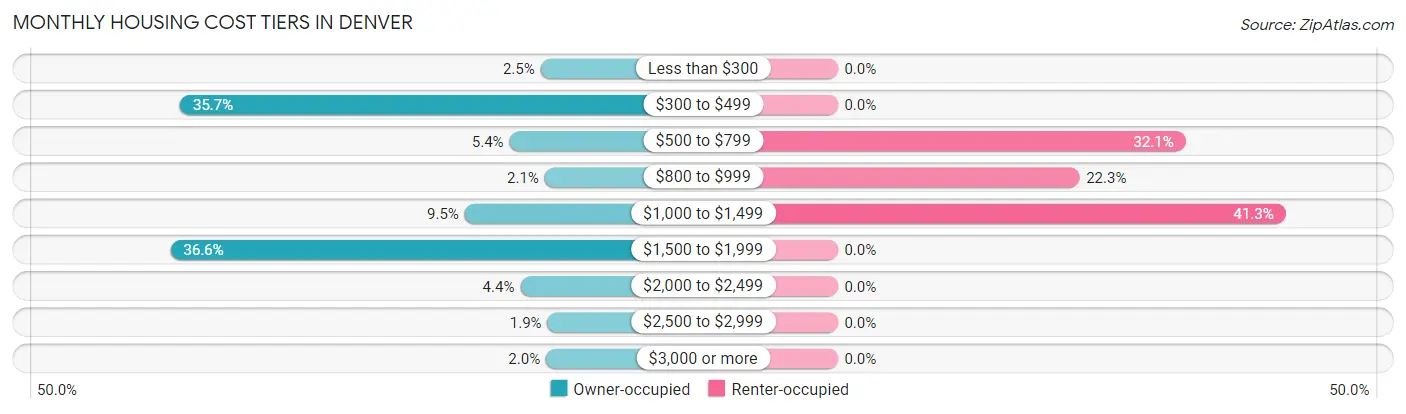
| Monthly Cost | Owner-occupied | Renter-occupied |
| Less than $300 | 20 (2.5%) | 0 (0.0%) |
| $300 to $499 | 286 (35.7%) | 0 (0.0%) |
| $500 to $799 | 43 (5.4%) | 108 (32.1%) |
| $800 to $999 | 17 (2.1%) | 75 (22.3%) |
| $1,000 to $1,499 | 76 (9.5%) | 139 (41.2%) |
| $1,500 to $1,999 | 293 (36.6%) | 0 (0.0%) |
| $2,000 to $2,499 | 35 (4.4%) | 0 (0.0%) |
| $2,500 to $2,999 | 15 (1.9%) | 0 (0.0%) |
| $3,000 or more | 16 (2.0%) | 0 (0.0%) |
| Total | 801 (100.0%) | 337 (100.0%) |
Physical Housing Characteristics in Denver
Housing Structures in Denver
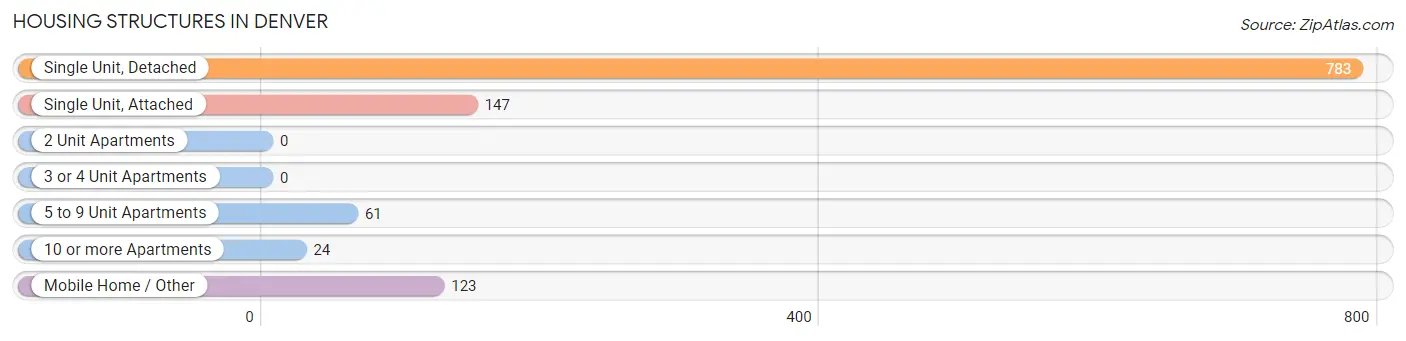
| Structure Type | # Housing Units | % Housing Units |
| Single Unit, Detached | 783 | 68.8% |
| Single Unit, Attached | 147 | 12.9% |
| 2 Unit Apartments | 0 | 0.0% |
| 3 or 4 Unit Apartments | 0 | 0.0% |
| 5 to 9 Unit Apartments | 61 | 5.4% |
| 10 or more Apartments | 24 | 2.1% |
| Mobile Home / Other | 123 | 10.8% |
| Total | 1,138 | 100.0% |
Housing Structures by Occupancy in Denver
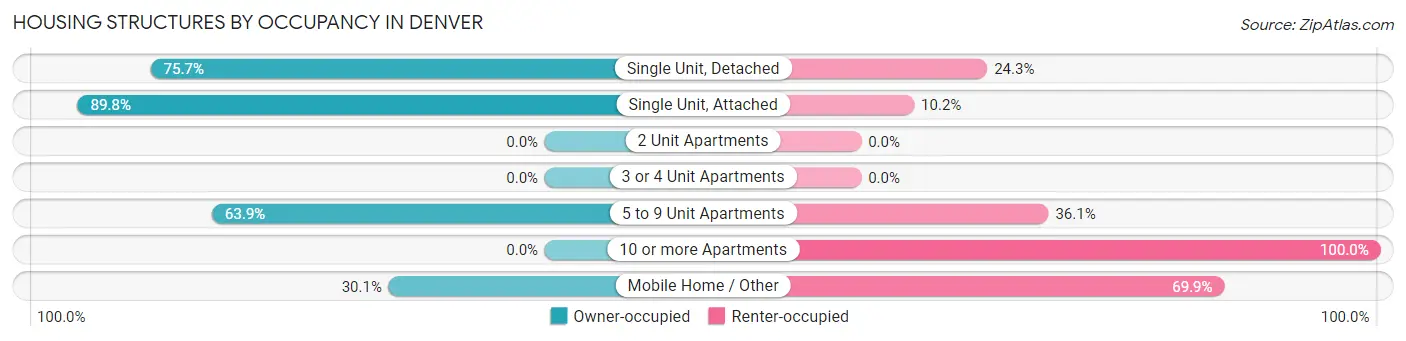
| Structure Type | Owner-occupied | Renter-occupied |
| Single Unit, Detached | 593 (75.7%) | 190 (24.3%) |
| Single Unit, Attached | 132 (89.8%) | 15 (10.2%) |
| 2 Unit Apartments | 0 (0.0%) | 0 (0.0%) |
| 3 or 4 Unit Apartments | 0 (0.0%) | 0 (0.0%) |
| 5 to 9 Unit Apartments | 39 (63.9%) | 22 (36.1%) |
| 10 or more Apartments | 0 (0.0%) | 24 (100.0%) |
| Mobile Home / Other | 37 (30.1%) | 86 (69.9%) |
| Total | 801 (70.4%) | 337 (29.6%) |
Housing Structures by Number of Rooms in Denver
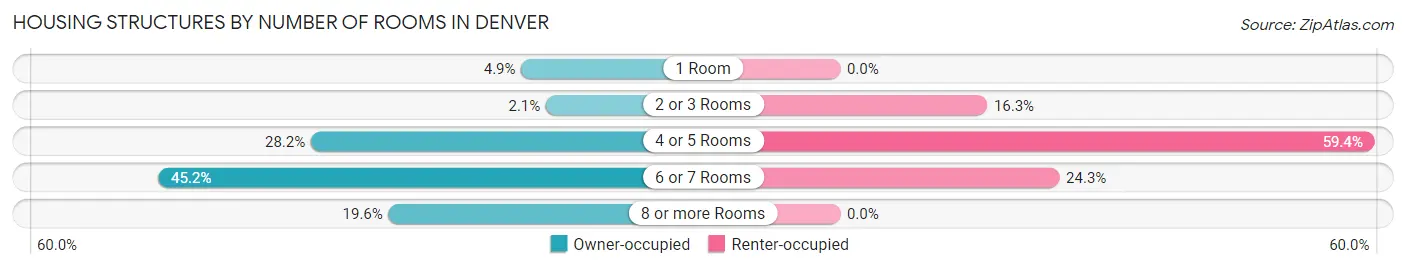
| Number of Rooms | Owner-occupied | Renter-occupied |
| 1 Room | 39 (4.9%) | 0 (0.0%) |
| 2 or 3 Rooms | 17 (2.1%) | 55 (16.3%) |
| 4 or 5 Rooms | 226 (28.2%) | 200 (59.4%) |
| 6 or 7 Rooms | 362 (45.2%) | 82 (24.3%) |
| 8 or more Rooms | 157 (19.6%) | 0 (0.0%) |
| Total | 801 (100.0%) | 337 (100.0%) |
Housing Structure by Heating Type in Denver
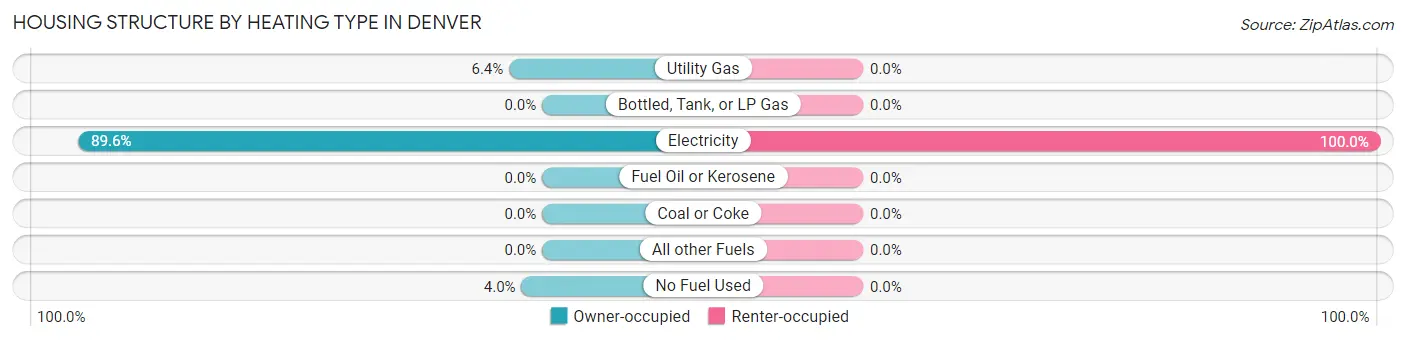
| Heating Type | Owner-occupied | Renter-occupied |
| Utility Gas | 51 (6.4%) | 0 (0.0%) |
| Bottled, Tank, or LP Gas | 0 (0.0%) | 0 (0.0%) |
| Electricity | 718 (89.6%) | 337 (100.0%) |
| Fuel Oil or Kerosene | 0 (0.0%) | 0 (0.0%) |
| Coal or Coke | 0 (0.0%) | 0 (0.0%) |
| All other Fuels | 0 (0.0%) | 0 (0.0%) |
| No Fuel Used | 32 (4.0%) | 0 (0.0%) |
| Total | 801 (100.0%) | 337 (100.0%) |
Household Vehicle Usage in Denver
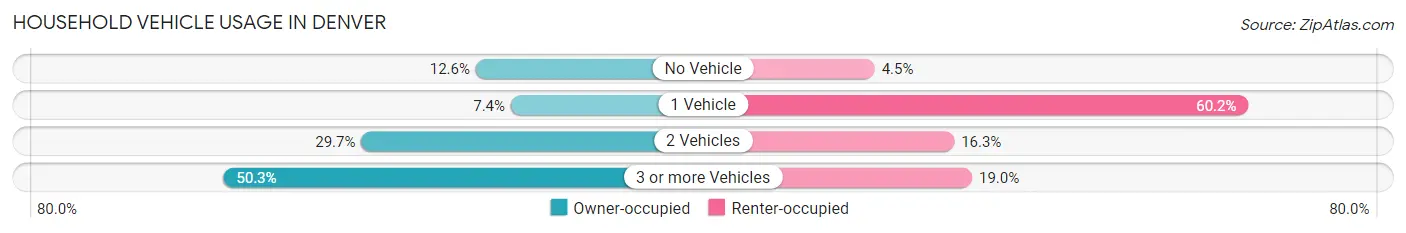
| Vehicles per Household | Owner-occupied | Renter-occupied |
| No Vehicle | 101 (12.6%) | 15 (4.4%) |
| 1 Vehicle | 59 (7.4%) | 203 (60.2%) |
| 2 Vehicles | 238 (29.7%) | 55 (16.3%) |
| 3 or more Vehicles | 403 (50.3%) | 64 (19.0%) |
| Total | 801 (100.0%) | 337 (100.0%) |
Real Estate & Mortgages in Denver
Real Estate and Mortgage Overview in Denver
| Characteristic | Without Mortgage | With Mortgage |
| Housing Units | 332 | 469 |
| Median Property Value | $215,100 | $282,800 |
| Median Household Income | - | - |
| Monthly Housing Costs | $379 | $16 |
| Real Estate Taxes | $1,303 | $0 |
Property Value by Mortgage Status in Denver
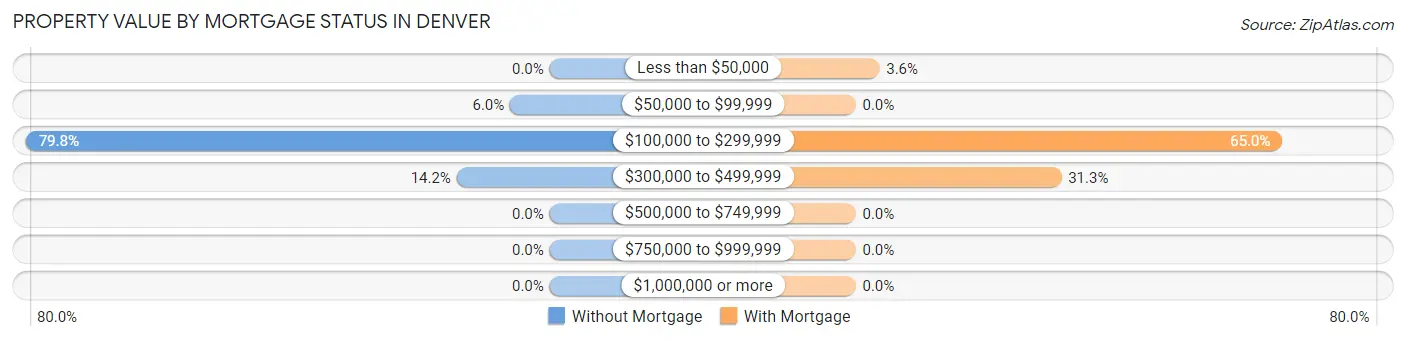
| Property Value | Without Mortgage | With Mortgage |
| Less than $50,000 | 0 (0.0%) | 17 (3.6%) |
| $50,000 to $99,999 | 20 (6.0%) | 0 (0.0%) |
| $100,000 to $299,999 | 265 (79.8%) | 305 (65.0%) |
| $300,000 to $499,999 | 47 (14.2%) | 147 (31.3%) |
| $500,000 to $749,999 | 0 (0.0%) | 0 (0.0%) |
| $750,000 to $999,999 | 0 (0.0%) | 0 (0.0%) |
| $1,000,000 or more | 0 (0.0%) | 0 (0.0%) |
| Total | 332 (100.0%) | 469 (100.0%) |
Household Income by Mortgage Status in Denver
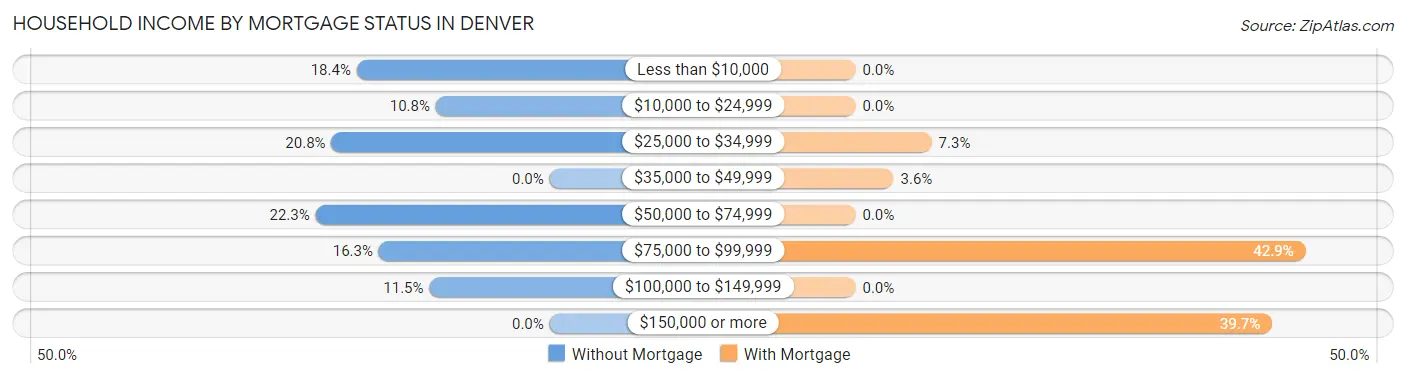
| Household Income | Without Mortgage | With Mortgage |
| Less than $10,000 | 61 (18.4%) | 0 (0.0%) |
| $10,000 to $24,999 | 36 (10.8%) | 0 (0.0%) |
| $25,000 to $34,999 | 69 (20.8%) | 34 (7.2%) |
| $35,000 to $49,999 | 0 (0.0%) | 17 (3.6%) |
| $50,000 to $74,999 | 74 (22.3%) | 0 (0.0%) |
| $75,000 to $99,999 | 54 (16.3%) | 201 (42.9%) |
| $100,000 to $149,999 | 38 (11.5%) | 0 (0.0%) |
| $150,000 or more | 0 (0.0%) | 186 (39.7%) |
| Total | 332 (100.0%) | 469 (100.0%) |
Property Value to Household Income Ratio in Denver
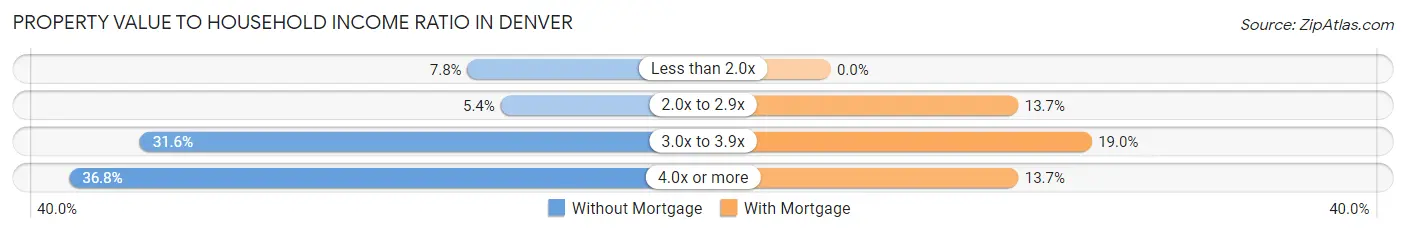
| Value-to-Income Ratio | Without Mortgage | With Mortgage |
| Less than 2.0x | 26 (7.8%) | 0 (0.0%) |
| 2.0x to 2.9x | 18 (5.4%) | 64 (13.7%) |
| 3.0x to 3.9x | 105 (31.6%) | 89 (19.0%) |
| 4.0x or more | 122 (36.7%) | 64 (13.7%) |
| Total | 332 (100.0%) | 469 (100.0%) |
Real Estate Taxes by Mortgage Status in Denver
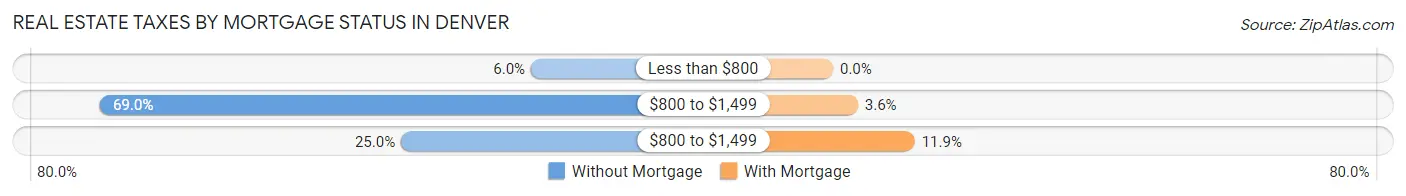
| Property Taxes | Without Mortgage | With Mortgage |
| Less than $800 | 20 (6.0%) | 0 (0.0%) |
| $800 to $1,499 | 229 (69.0%) | 17 (3.6%) |
| $800 to $1,499 | 83 (25.0%) | 56 (11.9%) |
| Total | 332 (100.0%) | 469 (100.0%) |
Health & Disability in Denver
Health Insurance Coverage by Age in Denver
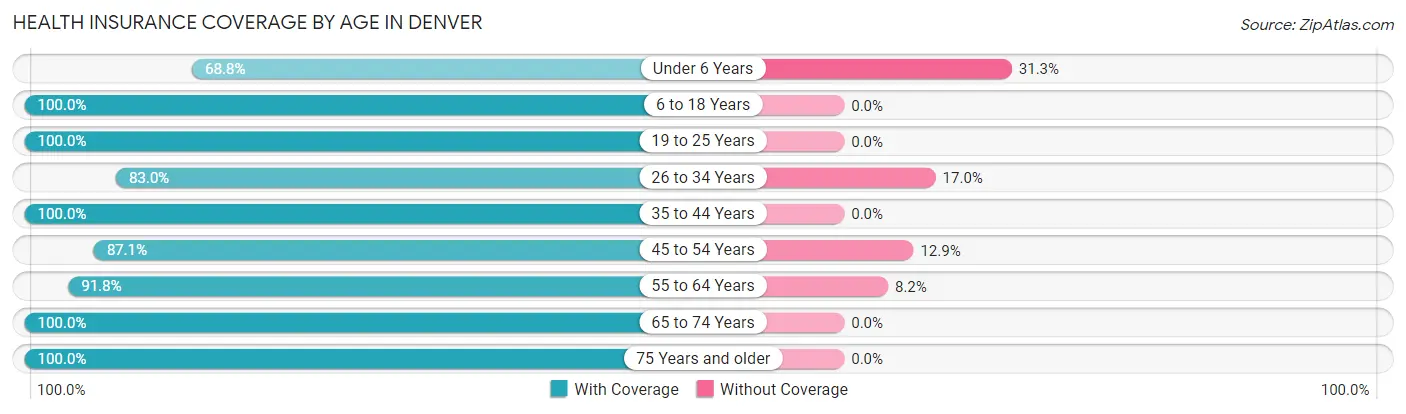
| Age Bracket | With Coverage | Without Coverage |
| Under 6 Years | 297 (68.8%) | 135 (31.2%) |
| 6 to 18 Years | 258 (100.0%) | 0 (0.0%) |
| 19 to 25 Years | 136 (100.0%) | 0 (0.0%) |
| 26 to 34 Years | 336 (83.0%) | 69 (17.0%) |
| 35 to 44 Years | 275 (100.0%) | 0 (0.0%) |
| 45 to 54 Years | 351 (87.1%) | 52 (12.9%) |
| 55 to 64 Years | 360 (91.8%) | 32 (8.2%) |
| 65 to 74 Years | 186 (100.0%) | 0 (0.0%) |
| 75 Years and older | 252 (100.0%) | 0 (0.0%) |
| Total | 2,451 (89.5%) | 288 (10.5%) |
Health Insurance Coverage by Citizenship Status in Denver
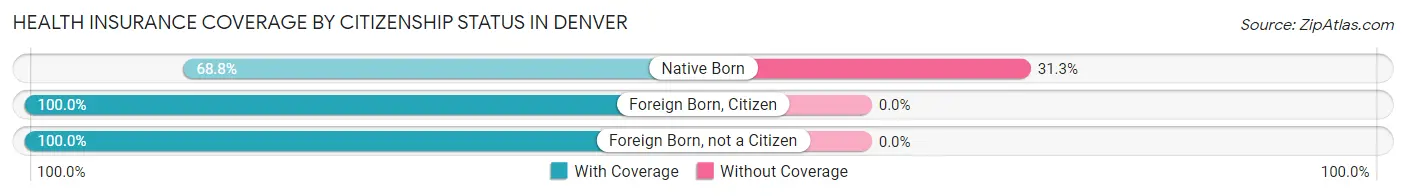
| Citizenship Status | With Coverage | Without Coverage |
| Native Born | 297 (68.8%) | 135 (31.2%) |
| Foreign Born, Citizen | 258 (100.0%) | 0 (0.0%) |
| Foreign Born, not a Citizen | 136 (100.0%) | 0 (0.0%) |
Health Insurance Coverage by Household Income in Denver
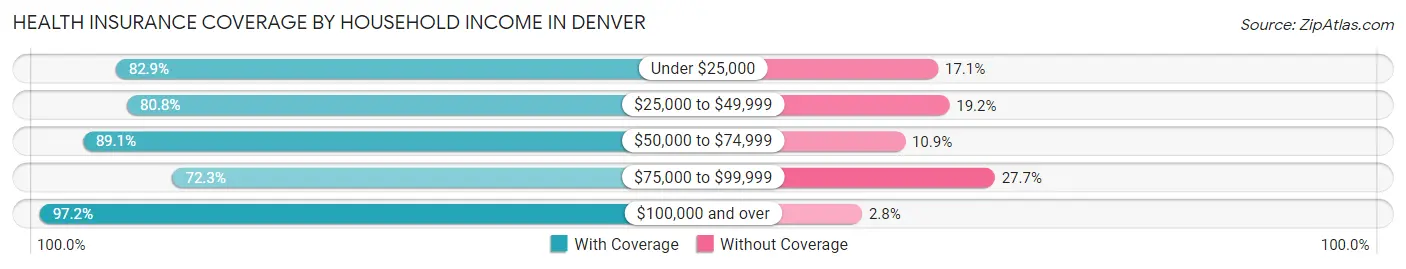
| Household Income | With Coverage | Without Coverage |
| Under $25,000 | 165 (82.9%) | 34 (17.1%) |
| $25,000 to $49,999 | 164 (80.8%) | 39 (19.2%) |
| $50,000 to $74,999 | 809 (89.1%) | 99 (10.9%) |
| $75,000 to $99,999 | 219 (72.3%) | 84 (27.7%) |
| $100,000 and over | 1,094 (97.2%) | 32 (2.8%) |
Public vs Private Health Insurance Coverage by Age in Denver
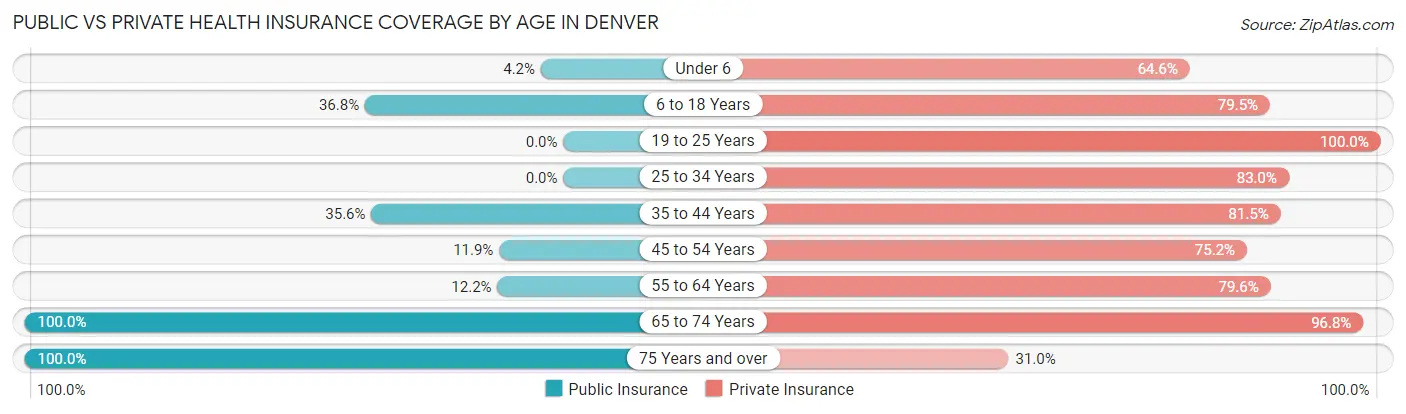
| Age Bracket | Public Insurance | Private Insurance |
| Under 6 | 18 (4.2%) | 279 (64.6%) |
| 6 to 18 Years | 95 (36.8%) | 205 (79.5%) |
| 19 to 25 Years | 0 (0.0%) | 136 (100.0%) |
| 25 to 34 Years | 0 (0.0%) | 336 (83.0%) |
| 35 to 44 Years | 98 (35.6%) | 224 (81.5%) |
| 45 to 54 Years | 48 (11.9%) | 303 (75.2%) |
| 55 to 64 Years | 48 (12.2%) | 312 (79.6%) |
| 65 to 74 Years | 186 (100.0%) | 180 (96.8%) |
| 75 Years and over | 252 (100.0%) | 78 (30.9%) |
| Total | 745 (27.2%) | 2,053 (75.0%) |
Disability Status by Sex by Age in Denver
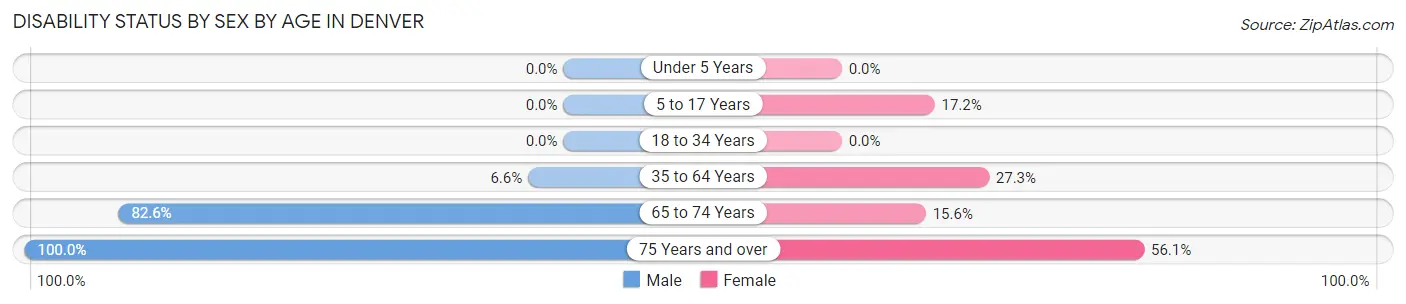
| Age Bracket | Male | Female |
| Under 5 Years | 0 (0.0%) | 0 (0.0%) |
| 5 to 17 Years | 0 (0.0%) | 21 (17.2%) |
| 18 to 34 Years | 0 (0.0%) | 0 (0.0%) |
| 35 to 64 Years | 31 (6.6%) | 163 (27.3%) |
| 65 to 74 Years | 90 (82.6%) | 12 (15.6%) |
| 75 Years and over | 47 (100.0%) | 115 (56.1%) |
Disability Class by Sex by Age in Denver
Disability Class: Hearing Difficulty
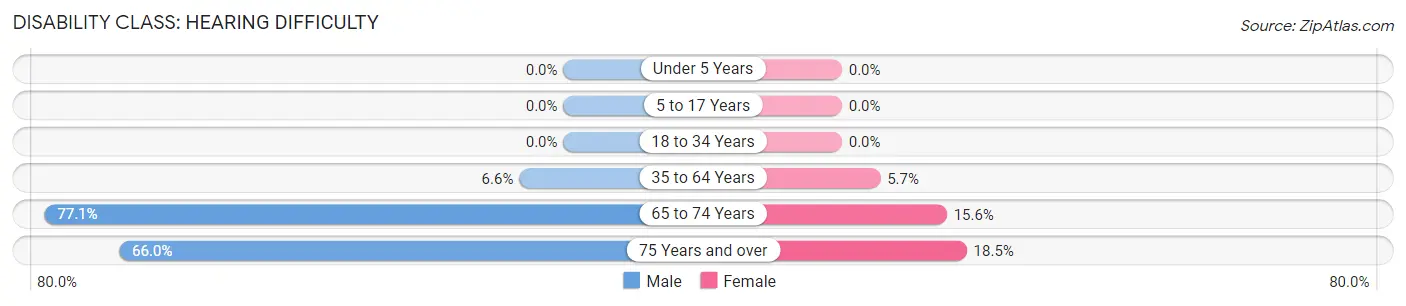
| Age Bracket | Male | Female |
| Under 5 Years | 0 (0.0%) | 0 (0.0%) |
| 5 to 17 Years | 0 (0.0%) | 0 (0.0%) |
| 18 to 34 Years | 0 (0.0%) | 0 (0.0%) |
| 35 to 64 Years | 31 (6.6%) | 34 (5.7%) |
| 65 to 74 Years | 84 (77.1%) | 12 (15.6%) |
| 75 Years and over | 31 (66.0%) | 38 (18.5%) |
Disability Class: Vision Difficulty
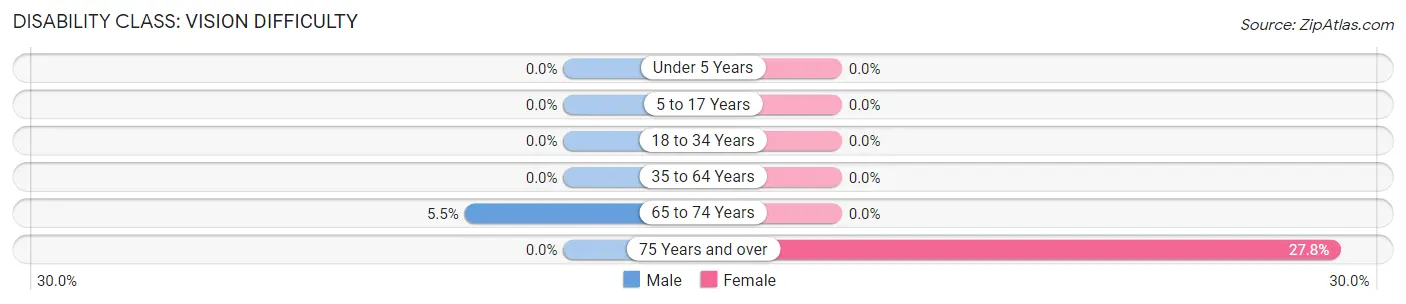
| Age Bracket | Male | Female |
| Under 5 Years | 0 (0.0%) | 0 (0.0%) |
| 5 to 17 Years | 0 (0.0%) | 0 (0.0%) |
| 18 to 34 Years | 0 (0.0%) | 0 (0.0%) |
| 35 to 64 Years | 0 (0.0%) | 0 (0.0%) |
| 65 to 74 Years | 6 (5.5%) | 0 (0.0%) |
| 75 Years and over | 0 (0.0%) | 57 (27.8%) |
Disability Class: Cognitive Difficulty
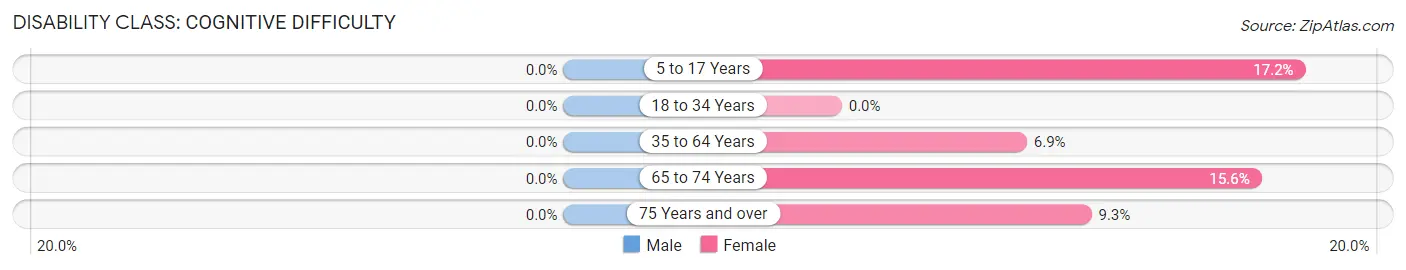
| Age Bracket | Male | Female |
| 5 to 17 Years | 0 (0.0%) | 21 (17.2%) |
| 18 to 34 Years | 0 (0.0%) | 0 (0.0%) |
| 35 to 64 Years | 0 (0.0%) | 41 (6.9%) |
| 65 to 74 Years | 0 (0.0%) | 12 (15.6%) |
| 75 Years and over | 0 (0.0%) | 19 (9.3%) |
Disability Class: Ambulatory Difficulty
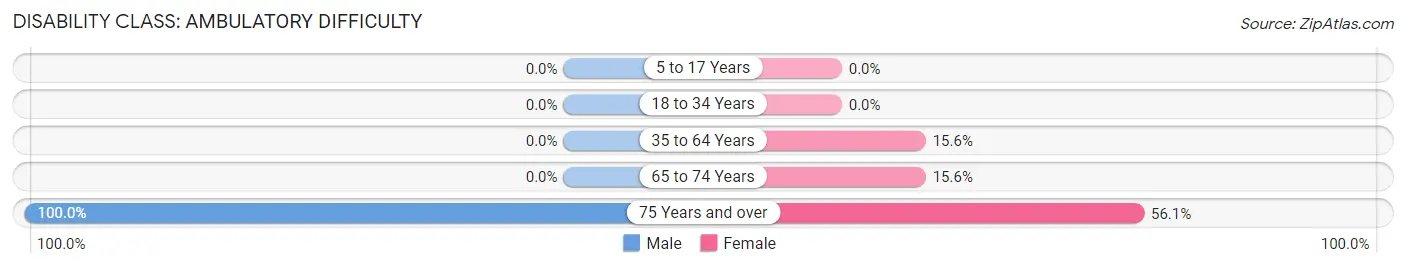
| Age Bracket | Male | Female |
| 5 to 17 Years | 0 (0.0%) | 0 (0.0%) |
| 18 to 34 Years | 0 (0.0%) | 0 (0.0%) |
| 35 to 64 Years | 0 (0.0%) | 93 (15.6%) |
| 65 to 74 Years | 0 (0.0%) | 12 (15.6%) |
| 75 Years and over | 47 (100.0%) | 115 (56.1%) |
Disability Class: Self-Care Difficulty
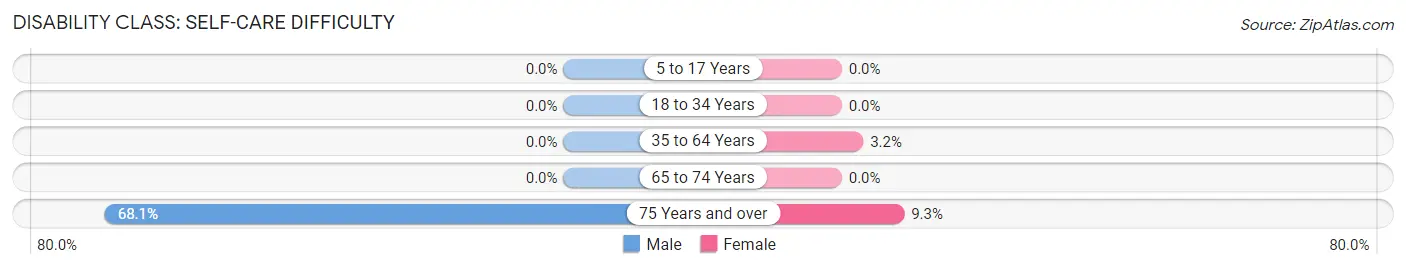
| Age Bracket | Male | Female |
| 5 to 17 Years | 0 (0.0%) | 0 (0.0%) |
| 18 to 34 Years | 0 (0.0%) | 0 (0.0%) |
| 35 to 64 Years | 0 (0.0%) | 19 (3.2%) |
| 65 to 74 Years | 0 (0.0%) | 0 (0.0%) |
| 75 Years and over | 32 (68.1%) | 19 (9.3%) |
Technology Access in Denver
Computing Device Access in Denver
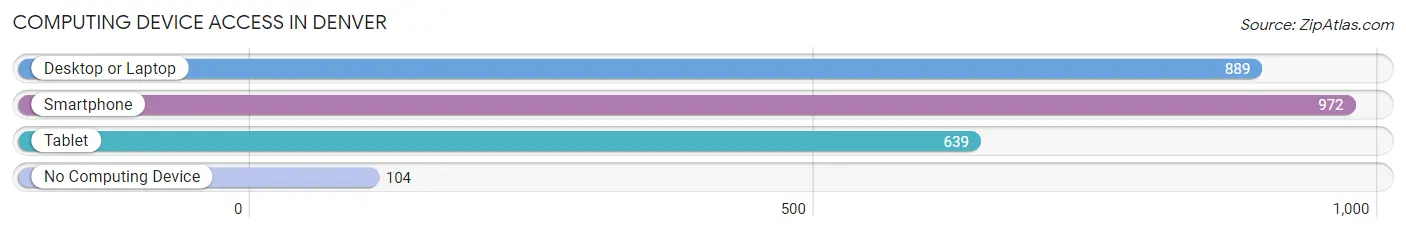
| Device Type | # Households | % Households |
| Desktop or Laptop | 889 | 78.1% |
| Smartphone | 972 | 85.4% |
| Tablet | 639 | 56.1% |
| No Computing Device | 104 | 9.1% |
| Total | 1,138 | 100.0% |
Internet Access in Denver
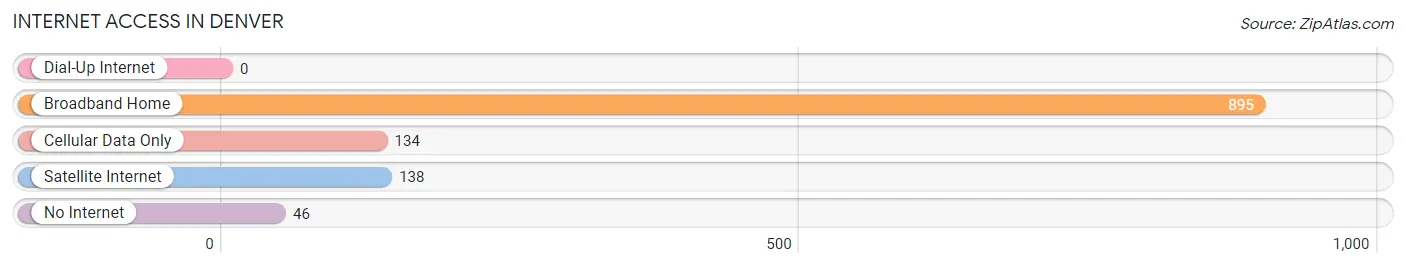
| Internet Type | # Households | % Households |
| Dial-Up Internet | 0 | 0.0% |
| Broadband Home | 895 | 78.6% |
| Cellular Data Only | 134 | 11.8% |
| Satellite Internet | 138 | 12.1% |
| No Internet | 46 | 4.0% |
| Total | 1,138 | 100.0% |
Denver Summary
Denver, North Carolina is a small town located in Lincoln County, North Carolina. It is situated in the foothills of the Blue Ridge Mountains, about 25 miles northwest of Charlotte. The town has a population of approximately 2,000 people and is part of the greater Charlotte metropolitan area.
Geography
Denver is located in the foothills of the Blue Ridge Mountains, about 25 miles northwest of Charlotte. The town is situated on the Catawba River, which is a major tributary of the Yadkin River. The town is surrounded by rolling hills and forests, and is home to several small lakes. The town is located at an elevation of 830 feet above sea level.
History
Denver was founded in 1891 by a group of settlers from the nearby town of Lincolnton. The town was named after the nearby Denver Station, which was a stop on the Charlotte and South Carolina Railroad. The town grew rapidly in the early 20th century, and by the 1920s it had become a popular tourist destination. The town was also home to several large textile mills, which provided employment for many of the town's residents.
In the late 20th century, the town's economy shifted away from manufacturing and towards tourism and retail. The town is now home to several small businesses, including restaurants, shops, and galleries.
Economy
Denver's economy is largely based on tourism and retail. The town is home to several small businesses, including restaurants, shops, and galleries. The town is also home to several large employers, including a manufacturing plant and a distribution center.
The town is also home to several large employers, including a manufacturing plant and a distribution center. The manufacturing plant produces automotive parts, while the distribution center is a major hub for the distribution of goods throughout the region.
Demographics
As of the 2010 census, the population of Denver was 2,068. The racial makeup of the town was 94.3% White, 2.3% African American, 0.3% Native American, 0.7% Asian, 0.1% Pacific Islander, 1.2% from other races, and 1.2% from two or more races. Hispanic or Latino of any race were 3.2% of the population.
The median household income in Denver was $41,944, and the median family income was $50,917. The per capita income for the town was $20,945. About 11.2% of families and 14.2% of the population were below the poverty line, including 19.2% of those under age 18 and 8.2% of those age 65 or over.
Conclusion
Denver, North Carolina is a small town located in Lincoln County, North Carolina. It is situated in the foothills of the Blue Ridge Mountains, about 25 miles northwest of Charlotte. The town has a population of approximately 2,000 people and is part of the greater Charlotte metropolitan area. The town's economy is largely based on tourism and retail, and it is home to several large employers, including a manufacturing plant and a distribution center. The town's population is predominantly White, with a small percentage of African American, Native American, Asian, and Pacific Islander residents. The median household income in Denver is $41,944, and the median family income is $50,917.
Common Questions
What is Per Capita Income in Denver?
Per Capita income in Denver is $35,642.
What is the Median Family Income in Denver?
Median Family Income in Denver is $98,625.
What is the Median Household income in Denver?
Median Household Income in Denver is $65,577.
What is Income or Wage Gap in Denver?
Income or Wage Gap in Denver is 24.8%.
Women in Denver earn 75.2 cents for every dollar earned by a man.
What is Inequality or Gini Index in Denver?
Inequality or Gini Index in Denver is 0.39.
What is the Total Population of Denver?
Total Population of Denver is 2,739.
What is the Total Male Population of Denver?
Total Male Population of Denver is 1,467.
What is the Total Female Population of Denver?
Total Female Population of Denver is 1,272.
What is the Ratio of Males per 100 Females in Denver?
There are 115.33 Males per 100 Females in Denver.
What is the Ratio of Females per 100 Males in Denver?
There are 86.71 Females per 100 Males in Denver.
What is the Median Population Age in Denver?
Median Population Age in Denver is 38.6 Years.
What is the Average Family Size in Denver
Average Family Size in Denver is 3.1 People.
What is the Average Household Size in Denver
Average Household Size in Denver is 2.4 People.
How Large is the Labor Force in Denver?
There are 1,471 People in the Labor Forcein in Denver.
What is the Percentage of People in the Labor Force in Denver?
70.0% of People are in the Labor Force in Denver.
What is the Unemployment Rate in Denver?
Unemployment Rate in Denver is 3.7%.