Southold, NY Map & Demographics
Southold Map

Southold Overview
$72,072
PER CAPITA INCOME
$163,661
AVG FAMILY INCOME
$103,832
AVG HOUSEHOLD INCOME
19.3%
WAGE / INCOME GAP [ % ]
80.7¢/ $1
WAGE / INCOME GAP [ $ ]
0.52
INEQUALITY / GINI INDEX
6,386
TOTAL POPULATION
3,312
MALE POPULATION
3,074
FEMALE POPULATION
107.74
MALES / 100 FEMALES
92.81
FEMALES / 100 MALES
50.6
MEDIAN AGE
2.9
AVG FAMILY SIZE
2.5
AVG HOUSEHOLD SIZE
2,872
LABOR FORCE [ PEOPLE ]
57.8%
PERCENT IN LABOR FORCE
8.5%
UNEMPLOYMENT RATE
Southold Zip Codes
Southold Area Codes
Income in Southold
Income Overview in Southold
Per Capita Income in Southold is $72,072, while median incomes of families and households are $163,661 and $103,832 respectively.
| Characteristic | Number | Measure |
| Per Capita Income | 6,386 | $72,072 |
| Median Family Income | 1,783 | $163,661 |
| Mean Family Income | 1,783 | $222,477 |
| Median Household Income | 2,569 | $103,832 |
| Mean Household Income | 2,569 | $183,951 |
| Income Deficit | 1,783 | $0 |
| Wage / Income Gap (%) | 6,386 | 19.26% |
| Wage / Income Gap ($) | 6,386 | 80.74¢ per $1 |
| Gini / Inequality Index | 6,386 | 0.52 |
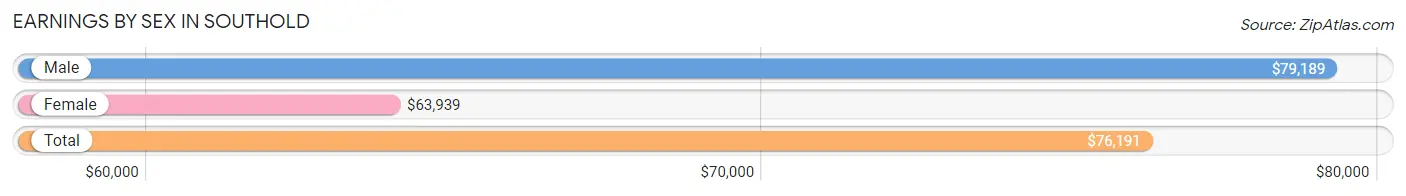
Earnings by Sex in Southold
Average Earnings in Southold are $76,191, $79,189 for men and $63,939 for women, a difference of 19.3%.
| Sex | Number | Average Earnings |
| Male | 1,765 (59.1%) | $79,189 |
| Female | 1,220 (40.9%) | $63,939 |
| Total | 2,985 (100.0%) | $76,191 |
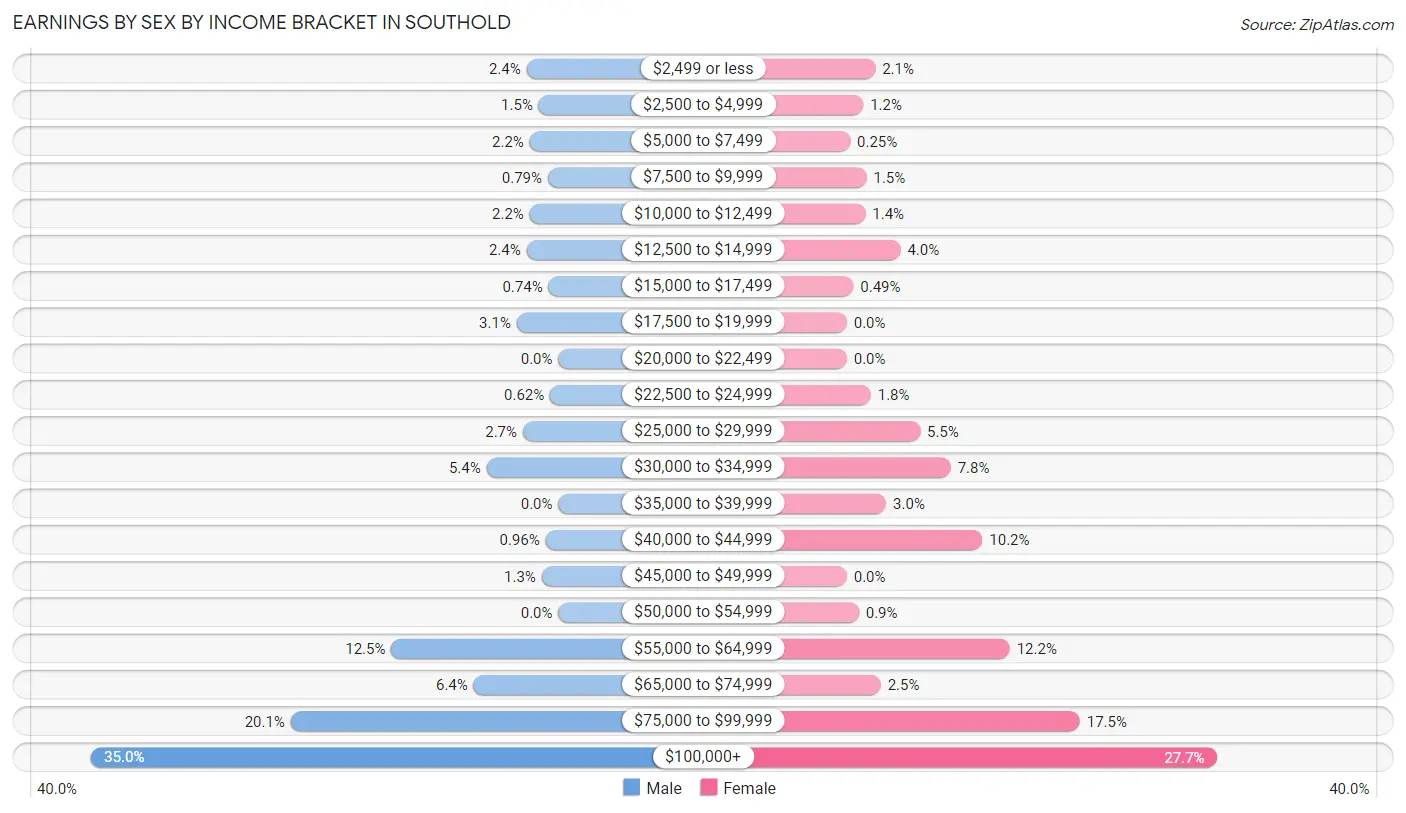
Earnings by Sex by Income Bracket in Southold
The most common earnings brackets in Southold are $100,000+ for men (618 | 35.0%) and $100,000+ for women (338 | 27.7%).
| Income | Male | Female |
| $2,499 or less | 42 (2.4%) | 26 (2.1%) |
| $2,500 to $4,999 | 26 (1.5%) | 15 (1.2%) |
| $5,000 to $7,499 | 38 (2.1%) | 3 (0.3%) |
| $7,500 to $9,999 | 14 (0.8%) | 18 (1.5%) |
| $10,000 to $12,499 | 38 (2.1%) | 17 (1.4%) |
| $12,500 to $14,999 | 42 (2.4%) | 49 (4.0%) |
| $15,000 to $17,499 | 13 (0.7%) | 6 (0.5%) |
| $17,500 to $19,999 | 55 (3.1%) | 0 (0.0%) |
| $20,000 to $22,499 | 0 (0.0%) | 0 (0.0%) |
| $22,500 to $24,999 | 11 (0.6%) | 22 (1.8%) |
| $25,000 to $29,999 | 47 (2.7%) | 67 (5.5%) |
| $30,000 to $34,999 | 95 (5.4%) | 95 (7.8%) |
| $35,000 to $39,999 | 0 (0.0%) | 36 (2.9%) |
| $40,000 to $44,999 | 17 (1.0%) | 124 (10.2%) |
| $45,000 to $49,999 | 22 (1.3%) | 0 (0.0%) |
| $50,000 to $54,999 | 0 (0.0%) | 11 (0.9%) |
| $55,000 to $64,999 | 221 (12.5%) | 149 (12.2%) |
| $65,000 to $74,999 | 112 (6.4%) | 31 (2.5%) |
| $75,000 to $99,999 | 354 (20.1%) | 213 (17.5%) |
| $100,000+ | 618 (35.0%) | 338 (27.7%) |
| Total | 1,765 (100.0%) | 1,220 (100.0%) |
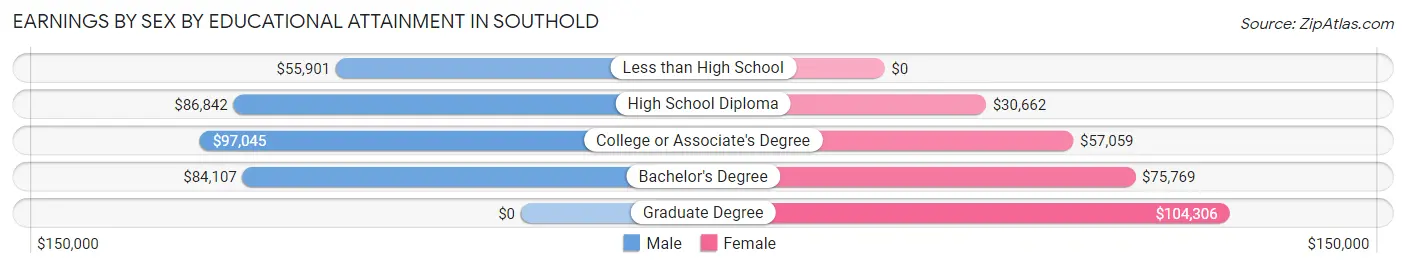
Earnings by Sex by Educational Attainment in Southold
Average earnings in Southold are $83,839 for men and $64,545 for women, a difference of 23.0%. Men with an educational attainment of college or associate's degree enjoy the highest average annual earnings of $97,045, while those with less than high school education earn the least with $55,901. Women with an educational attainment of graduate degree earn the most with the average annual earnings of $104,306, while those with high school diploma education have the smallest earnings of $30,662.
| Educational Attainment | Male Income | Female Income |
| Less than High School | $55,901 | $0 |
| High School Diploma | $86,842 | $30,662 |
| College or Associate's Degree | $97,045 | $57,059 |
| Bachelor's Degree | $84,107 | $75,769 |
| Graduate Degree | - | - |
| Total | $83,839 | $64,545 |
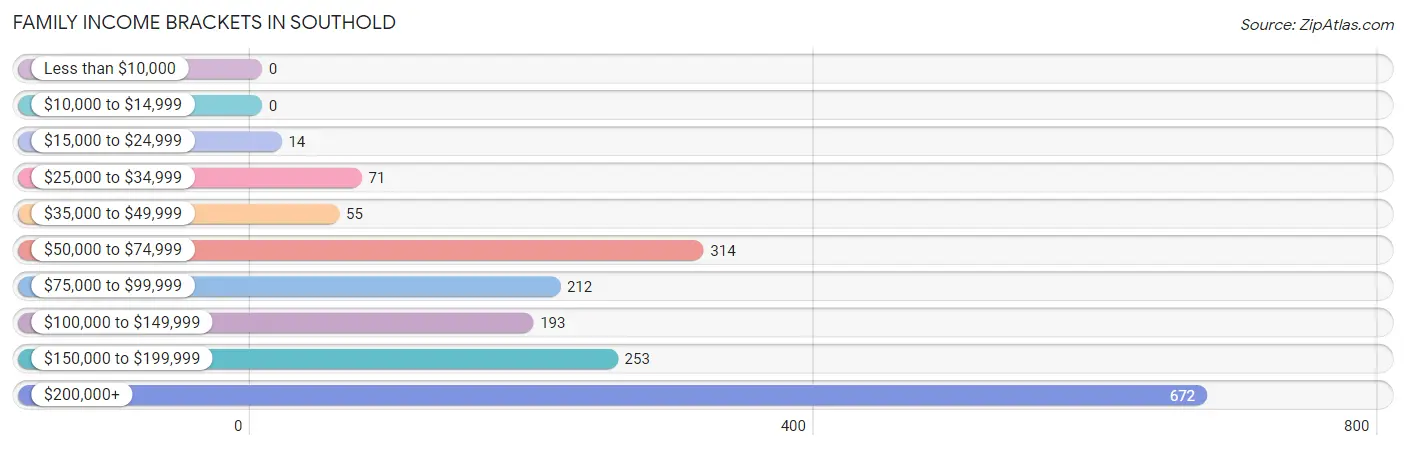
Family Income in Southold
Family Income Brackets in Southold
According to the Southold family income data, there are 672 families falling into the $200,000+ income range, which is the most common income bracket and makes up 37.7% of all families.
| Income Bracket | # Families | % Families |
| Less than $10,000 | 0 | 0.0% |
| $10,000 to $14,999 | 0 | 0.0% |
| $15,000 to $24,999 | 14 | 0.8% |
| $25,000 to $34,999 | 71 | 4.0% |
| $35,000 to $49,999 | 55 | 3.1% |
| $50,000 to $74,999 | 314 | 17.6% |
| $75,000 to $99,999 | 212 | 11.9% |
| $100,000 to $149,999 | 193 | 10.8% |
| $150,000 to $199,999 | 253 | 14.2% |
| $200,000+ | 672 | 37.7% |
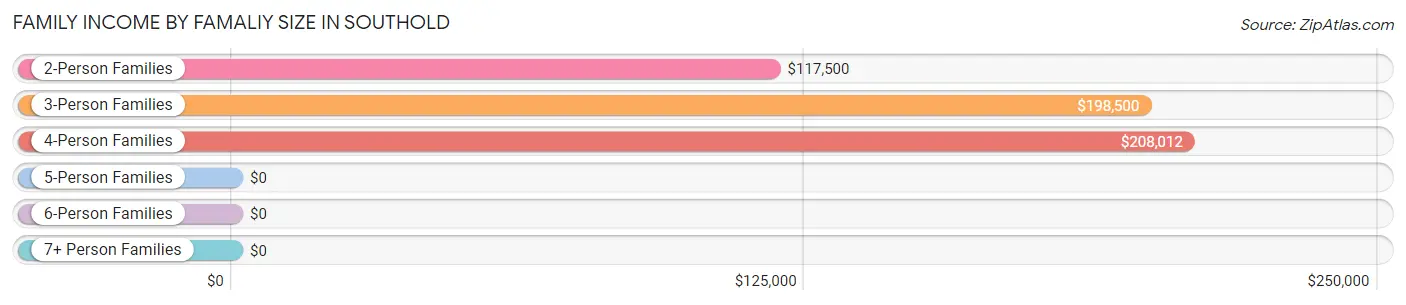
Family Income by Famaliy Size in Southold
4-person families (362 | 20.3%) account for the highest median family income in Southold with $208,012 per family, while 3-person families (210 | 11.8%) have the highest median income of $66,167 per family member.
| Income Bracket | # Families | Median Income |
| 2-Person Families | 1,008 (56.5%) | $117,500 |
| 3-Person Families | 210 (11.8%) | $198,500 |
| 4-Person Families | 362 (20.3%) | $208,012 |
| 5-Person Families | 188 (10.5%) | $0 |
| 6-Person Families | 0 (0.0%) | $0 |
| 7+ Person Families | 15 (0.8%) | $0 |
| Total | 1,783 (100.0%) | $163,661 |
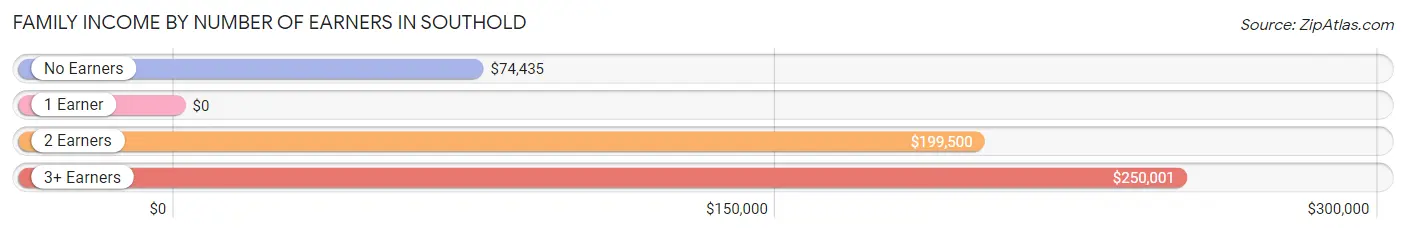
Family Income by Number of Earners in Southold
| Number of Earners | # Families | Median Income |
| No Earners | 309 (17.3%) | $74,435 |
| 1 Earner | 606 (34.0%) | $0 |
| 2 Earners | 774 (43.4%) | $199,500 |
| 3+ Earners | 94 (5.3%) | $250,001 |
| Total | 1,783 (100.0%) | $163,661 |
Household Income in Southold
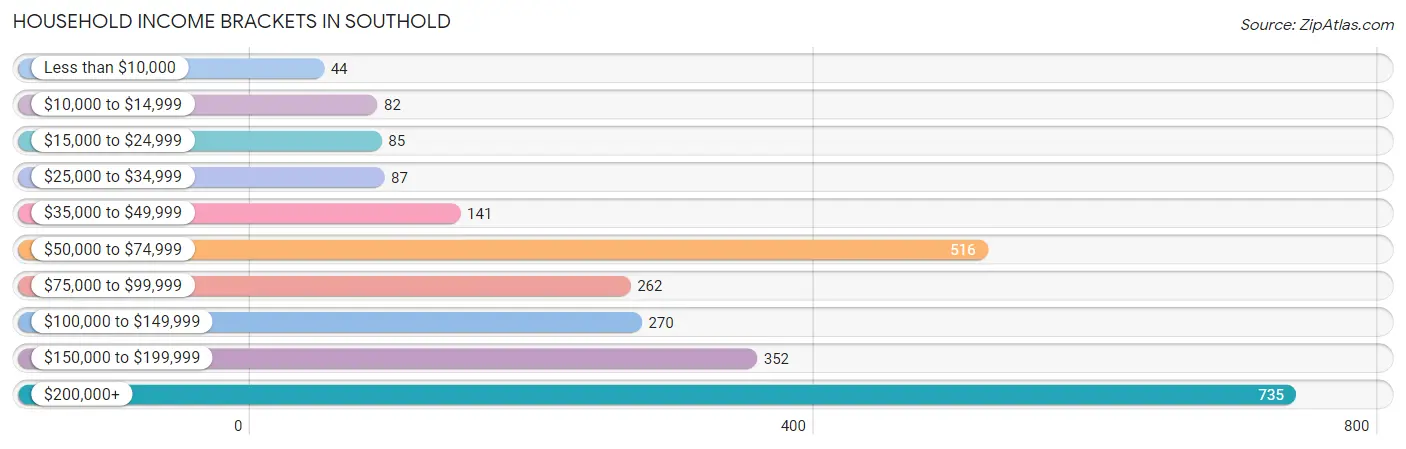
Household Income Brackets in Southold
With 735 households falling in the category, the $200,000+ income range is the most frequent in Southold, accounting for 28.6% of all households. In contrast, only 44 households (1.7%) fall into the less than $10,000 income bracket, making it the least populous group.
| Income Bracket | # Households | % Households |
| Less than $10,000 | 44 | 1.7% |
| $10,000 to $14,999 | 82 | 3.2% |
| $15,000 to $24,999 | 85 | 3.3% |
| $25,000 to $34,999 | 87 | 3.4% |
| $35,000 to $49,999 | 141 | 5.5% |
| $50,000 to $74,999 | 516 | 20.1% |
| $75,000 to $99,999 | 262 | 10.2% |
| $100,000 to $149,999 | 270 | 10.5% |
| $150,000 to $199,999 | 352 | 13.7% |
| $200,000+ | 735 | 28.6% |
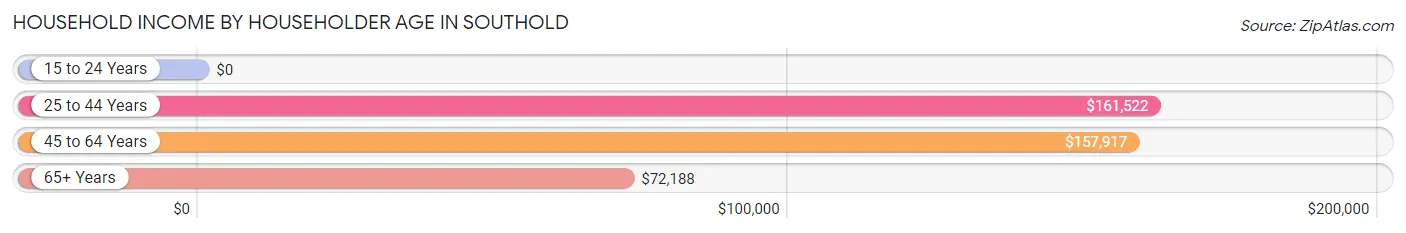
Household Income by Householder Age in Southold
The median household income in Southold is $103,832, with the highest median household income of $161,522 found in the 25 to 44 years age bracket for the primary householder. A total of 538 households (20.9%) fall into this category.
| Income Bracket | # Households | Median Income |
| 15 to 24 Years | 0 (0.0%) | $0 |
| 25 to 44 Years | 538 (20.9%) | $161,522 |
| 45 to 64 Years | 1,117 (43.5%) | $157,917 |
| 65+ Years | 914 (35.6%) | $72,188 |
| Total | 2,569 (100.0%) | $103,832 |
Poverty in Southold
Income Below Poverty by Sex and Age in Southold
With 4.0% poverty level for males and 3.6% for females among the residents of Southold, 45 to 54 year old males and 55 to 64 year old females are the most vulnerable to poverty, with 75 males (23.2%) and 43 females (7.2%) in their respective age groups living below the poverty level.
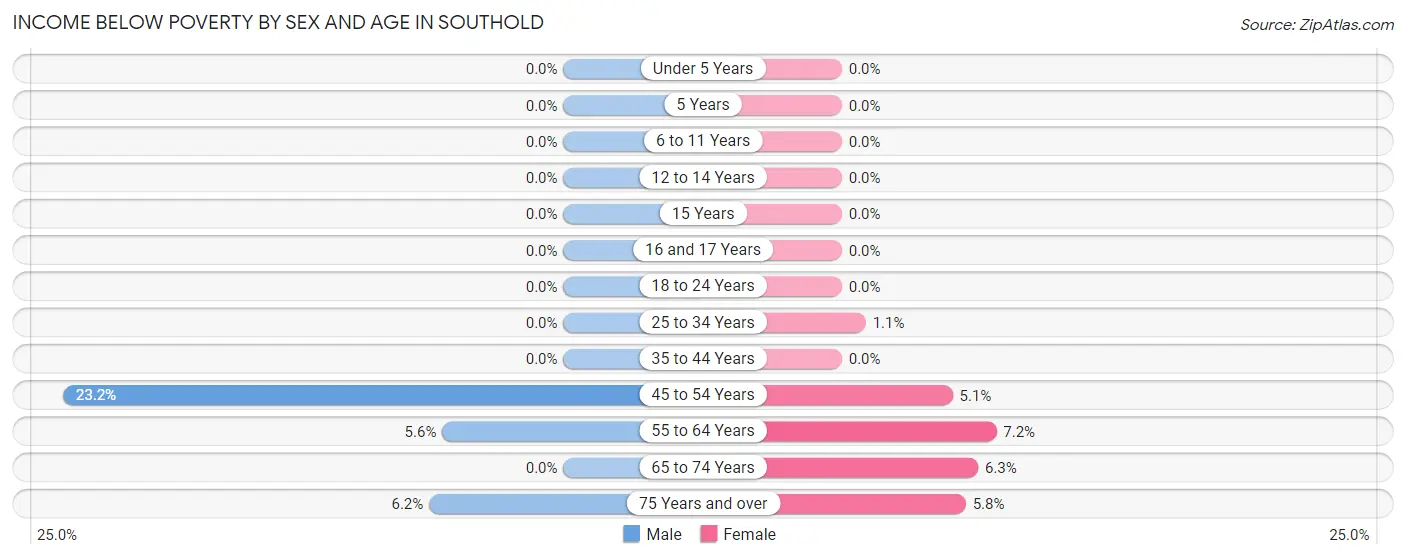
| Age Bracket | Male | Female |
| Under 5 Years | 0 (0.0%) | 0 (0.0%) |
| 5 Years | 0 (0.0%) | 0 (0.0%) |
| 6 to 11 Years | 0 (0.0%) | 0 (0.0%) |
| 12 to 14 Years | 0 (0.0%) | 0 (0.0%) |
| 15 Years | 0 (0.0%) | 0 (0.0%) |
| 16 and 17 Years | 0 (0.0%) | 0 (0.0%) |
| 18 to 24 Years | 0 (0.0%) | 0 (0.0%) |
| 25 to 34 Years | 0 (0.0%) | 3 (1.1%) |
| 35 to 44 Years | 0 (0.0%) | 0 (0.0%) |
| 45 to 54 Years | 75 (23.2%) | 16 (5.1%) |
| 55 to 64 Years | 40 (5.6%) | 43 (7.2%) |
| 65 to 74 Years | 0 (0.0%) | 30 (6.3%) |
| 75 Years and over | 17 (6.2%) | 18 (5.8%) |
| Total | 132 (4.0%) | 110 (3.6%) |
Income Above Poverty by Sex and Age in Southold
According to the poverty statistics in Southold, males aged under 5 years and females aged under 5 years are the age groups that are most secure financially, with 100.0% of males and 100.0% of females in these age groups living above the poverty line.
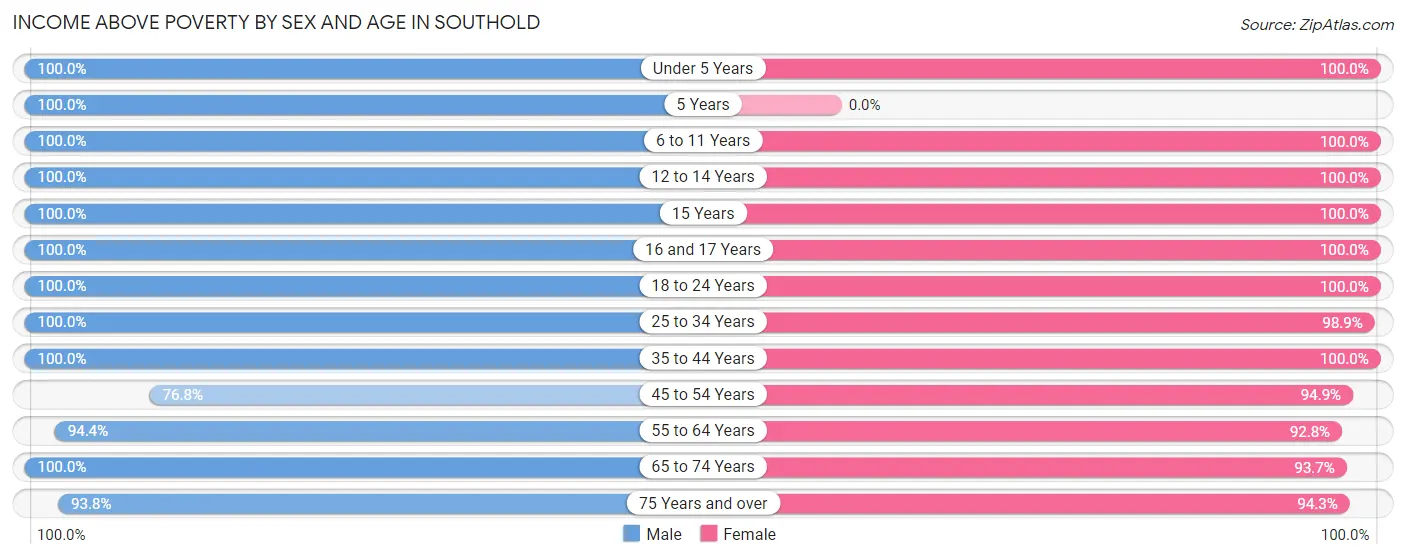
| Age Bracket | Male | Female |
| Under 5 Years | 144 (100.0%) | 179 (100.0%) |
| 5 Years | 37 (100.0%) | 0 (0.0%) |
| 6 to 11 Years | 331 (100.0%) | 294 (100.0%) |
| 12 to 14 Years | 209 (100.0%) | 134 (100.0%) |
| 15 Years | 37 (100.0%) | 11 (100.0%) |
| 16 and 17 Years | 33 (100.0%) | 33 (100.0%) |
| 18 to 24 Years | 67 (100.0%) | 28 (100.0%) |
| 25 to 34 Years | 309 (100.0%) | 268 (98.9%) |
| 35 to 44 Years | 310 (100.0%) | 383 (100.0%) |
| 45 to 54 Years | 248 (76.8%) | 295 (94.9%) |
| 55 to 64 Years | 672 (94.4%) | 557 (92.8%) |
| 65 to 74 Years | 527 (100.0%) | 445 (93.7%) |
| 75 Years and over | 256 (93.8%) | 295 (94.3%) |
| Total | 3,180 (96.0%) | 2,922 (96.4%) |
Income Below Poverty Among Married-Couple Families in Southold
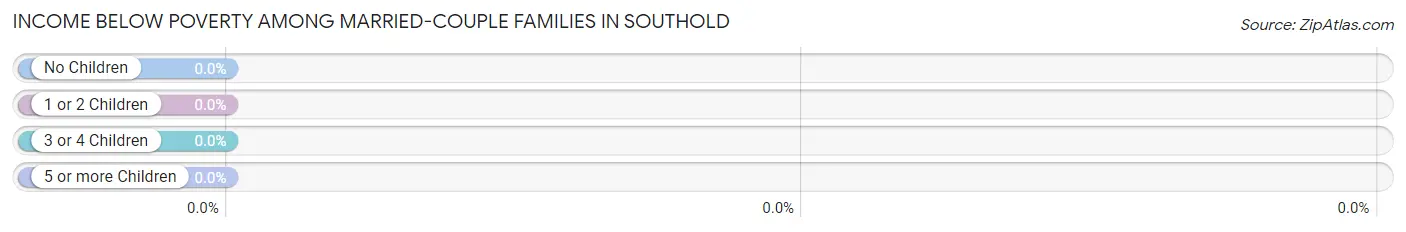
| Children | Above Poverty | Below Poverty |
| No Children | 1,017 (100.0%) | 0 (0.0%) |
| 1 or 2 Children | 377 (100.0%) | 0 (0.0%) |
| 3 or 4 Children | 168 (100.0%) | 0 (0.0%) |
| 5 or more Children | 0 (0.0%) | 0 (0.0%) |
| Total | 1,562 (100.0%) | 0 (0.0%) |
Income Below Poverty Among Single-Parent Households in Southold
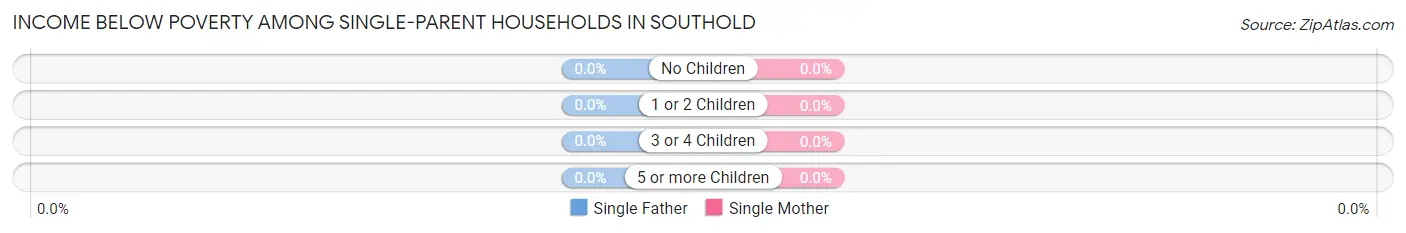
| Children | Single Father | Single Mother |
| No Children | 0 (0.0%) | 0 (0.0%) |
| 1 or 2 Children | 0 (0.0%) | 0 (0.0%) |
| 3 or 4 Children | 0 (0.0%) | 0 (0.0%) |
| 5 or more Children | 0 (0.0%) | 0 (0.0%) |
| Total | 0 (0.0%) | 0 (0.0%) |
Income Below Poverty Among Married-Couple vs Single-Parent Households in Southold
| Children | Married-Couple Families | Single-Parent Households |
| No Children | 0 (0.0%) | 0 (0.0%) |
| 1 or 2 Children | 0 (0.0%) | 0 (0.0%) |
| 3 or 4 Children | 0 (0.0%) | 0 (0.0%) |
| 5 or more Children | 0 (0.0%) | 0 (0.0%) |
| Total | 0 (0.0%) | 0 (0.0%) |
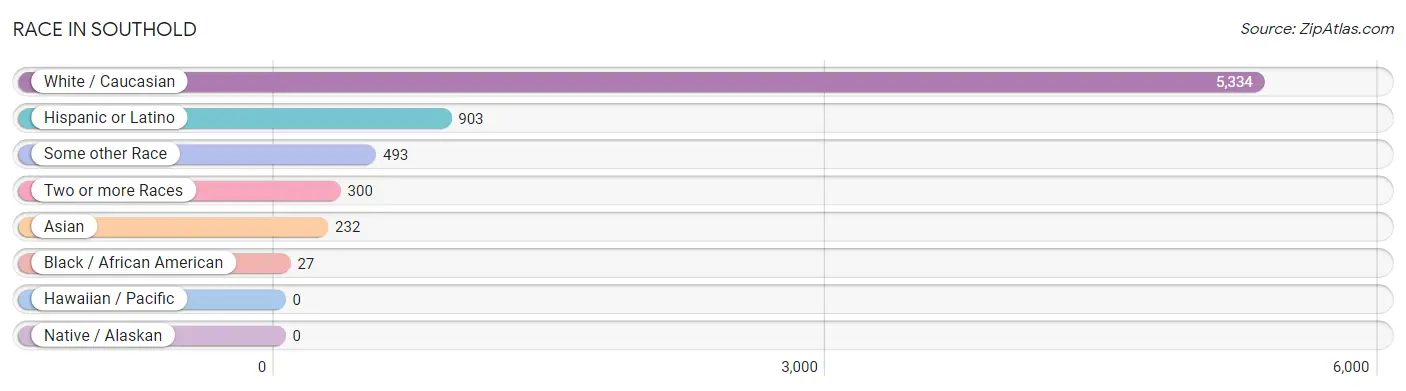
Race in Southold
The most populous races in Southold are White / Caucasian (5,334 | 83.5%), Hispanic or Latino (903 | 14.1%), and Some other Race (493 | 7.7%).
| Race | # Population | % Population |
| Asian | 232 | 3.6% |
| Black / African American | 27 | 0.4% |
| Hawaiian / Pacific | 0 | 0.0% |
| Hispanic or Latino | 903 | 14.1% |
| Native / Alaskan | 0 | 0.0% |
| White / Caucasian | 5,334 | 83.5% |
| Two or more Races | 300 | 4.7% |
| Some other Race | 493 | 7.7% |
| Total | 6,386 | 100.0% |
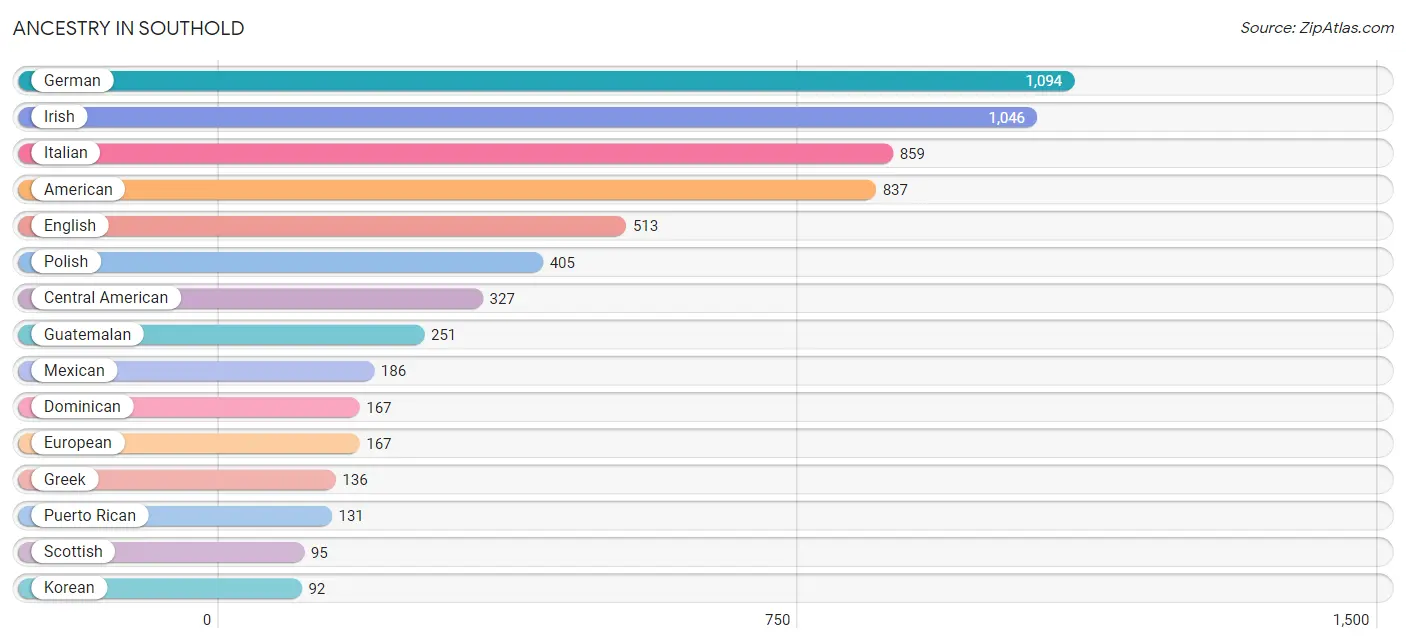
Ancestry in Southold
The most populous ancestries reported in Southold are German (1,094 | 17.1%), Irish (1,046 | 16.4%), Italian (859 | 13.5%), American (837 | 13.1%), and English (513 | 8.0%), together accounting for 68.1% of all Southold residents.
| Ancestry | # Population | % Population |
| American | 837 | 13.1% |
| Argentinean | 24 | 0.4% |
| Canadian | 79 | 1.2% |
| Central American | 327 | 5.1% |
| Croatian | 61 | 1.0% |
| Cypriot | 8 | 0.1% |
| Danish | 24 | 0.4% |
| Dominican | 167 | 2.6% |
| Dutch | 18 | 0.3% |
| Eastern European | 90 | 1.4% |
| Ecuadorian | 16 | 0.3% |
| English | 513 | 8.0% |
| European | 167 | 2.6% |
| Finnish | 18 | 0.3% |
| French | 72 | 1.1% |
| French Canadian | 11 | 0.2% |
| German | 1,094 | 17.1% |
| Greek | 136 | 2.1% |
| Guatemalan | 251 | 3.9% |
| Hungarian | 18 | 0.3% |
| Indian (Asian) | 88 | 1.4% |
| Irish | 1,046 | 16.4% |
| Italian | 859 | 13.5% |
| Korean | 92 | 1.4% |
| Lithuanian | 20 | 0.3% |
| Mexican | 186 | 2.9% |
| Mongolian | 16 | 0.3% |
| Norwegian | 50 | 0.8% |
| Polish | 405 | 6.3% |
| Puerto Rican | 131 | 2.1% |
| Russian | 22 | 0.3% |
| Salvadoran | 76 | 1.2% |
| Scotch-Irish | 18 | 0.3% |
| Scottish | 95 | 1.5% |
| Slovak | 34 | 0.5% |
| South American | 62 | 1.0% |
| Swedish | 14 | 0.2% |
| Swiss | 10 | 0.2% |
| Thai | 36 | 0.6% |
| Turkish | 33 | 0.5% |
| Ukrainian | 46 | 0.7% |
| Venezuelan | 22 | 0.3% |
| Welsh | 42 | 0.7% | View All 43 Rows |
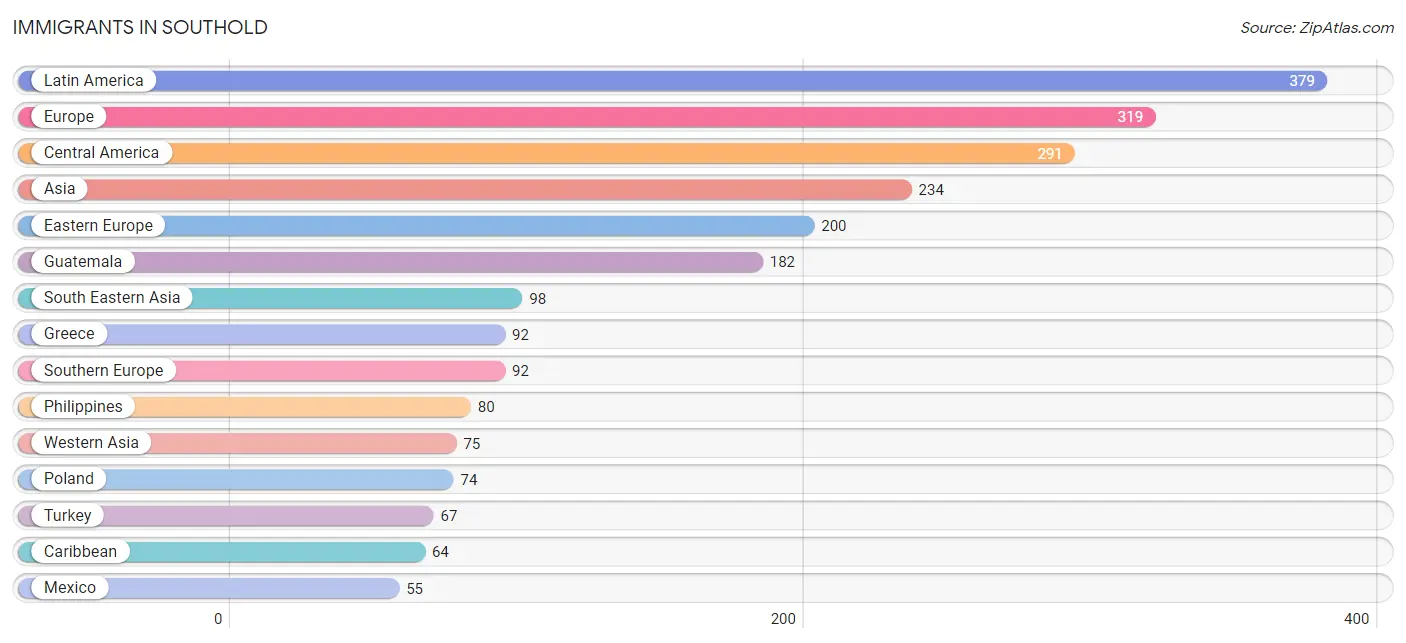
Immigrants in Southold
The most numerous immigrant groups reported in Southold came from Latin America (379 | 5.9%), Europe (319 | 5.0%), Central America (291 | 4.6%), Asia (234 | 3.7%), and Eastern Europe (200 | 3.1%), together accounting for 22.3% of all Southold residents.
| Immigration Origin | # Population | % Population |
| Argentina | 24 | 0.4% |
| Asia | 234 | 3.7% |
| Belarus | 43 | 0.7% |
| Canada | 41 | 0.6% |
| Caribbean | 64 | 1.0% |
| Central America | 291 | 4.6% |
| China | 25 | 0.4% |
| Croatia | 44 | 0.7% |
| Cuba | 15 | 0.2% |
| Czechoslovakia | 18 | 0.3% |
| Dominican Republic | 49 | 0.8% |
| Eastern Asia | 25 | 0.4% |
| Eastern Europe | 200 | 3.1% |
| El Salvador | 54 | 0.9% |
| Europe | 319 | 5.0% |
| Germany | 27 | 0.4% |
| Greece | 92 | 1.4% |
| Guatemala | 182 | 2.9% |
| India | 36 | 0.6% |
| Latin America | 379 | 5.9% |
| Malaysia | 16 | 0.3% |
| Mexico | 55 | 0.9% |
| Philippines | 80 | 1.3% |
| Poland | 74 | 1.2% |
| South America | 24 | 0.4% |
| South Central Asia | 36 | 0.6% |
| South Eastern Asia | 98 | 1.5% |
| Southern Europe | 92 | 1.4% |
| Turkey | 67 | 1.1% |
| Ukraine | 21 | 0.3% |
| Vietnam | 2 | 0.0% |
| Western Asia | 75 | 1.2% |
| Western Europe | 27 | 0.4% | View All 33 Rows |
Sex and Age in Southold
Sex and Age in Southold
The most populous age groups in Southold are 60 to 64 Years (400 | 12.1%) for men and 55 to 59 Years (327 | 10.6%) for women.
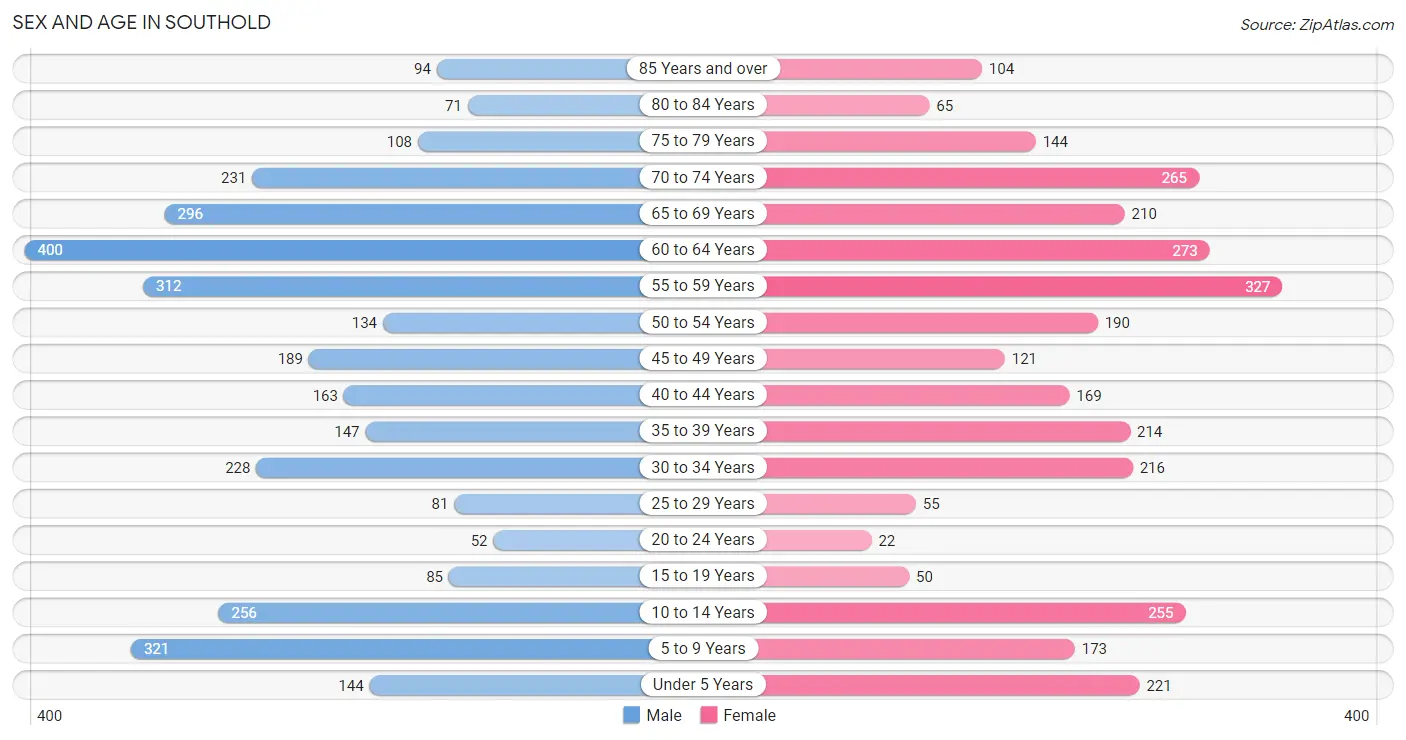
| Age Bracket | Male | Female |
| Under 5 Years | 144 (4.3%) | 221 (7.2%) |
| 5 to 9 Years | 321 (9.7%) | 173 (5.6%) |
| 10 to 14 Years | 256 (7.7%) | 255 (8.3%) |
| 15 to 19 Years | 85 (2.6%) | 50 (1.6%) |
| 20 to 24 Years | 52 (1.6%) | 22 (0.7%) |
| 25 to 29 Years | 81 (2.5%) | 55 (1.8%) |
| 30 to 34 Years | 228 (6.9%) | 216 (7.0%) |
| 35 to 39 Years | 147 (4.4%) | 214 (7.0%) |
| 40 to 44 Years | 163 (4.9%) | 169 (5.5%) |
| 45 to 49 Years | 189 (5.7%) | 121 (3.9%) |
| 50 to 54 Years | 134 (4.1%) | 190 (6.2%) |
| 55 to 59 Years | 312 (9.4%) | 327 (10.6%) |
| 60 to 64 Years | 400 (12.1%) | 273 (8.9%) |
| 65 to 69 Years | 296 (8.9%) | 210 (6.8%) |
| 70 to 74 Years | 231 (7.0%) | 265 (8.6%) |
| 75 to 79 Years | 108 (3.3%) | 144 (4.7%) |
| 80 to 84 Years | 71 (2.1%) | 65 (2.1%) |
| 85 Years and over | 94 (2.8%) | 104 (3.4%) |
| Total | 3,312 (100.0%) | 3,074 (100.0%) |
Families and Households in Southold
Median Family Size in Southold
The median family size in Southold is 2.93 persons per family, with single male/father families (53 | 3.0%) accounting for the largest median family size of 4.66 persons per family. On the other hand, single female/mother families (168 | 9.4%) represent the smallest median family size with 2.10 persons per family.
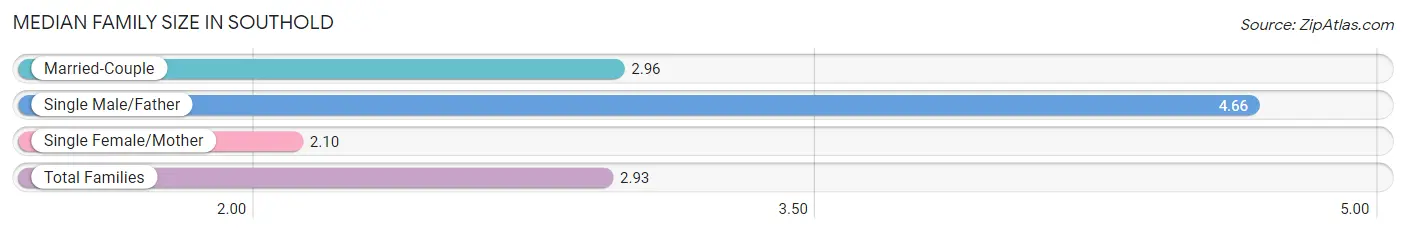
| Family Type | # Families | Family Size |
| Married-Couple | 1,562 (87.6%) | 2.96 |
| Single Male/Father | 53 (3.0%) | 4.66 |
| Single Female/Mother | 168 (9.4%) | 2.10 |
| Total Families | 1,783 (100.0%) | 2.93 |
Median Household Size in Southold
The median household size in Southold is 2.47 persons per household, with single male/father households (53 | 2.1%) accounting for the largest median household size of 5.21 persons per household. non-family households (786 | 30.6%) represent the smallest median household size with 1.26 persons per household.
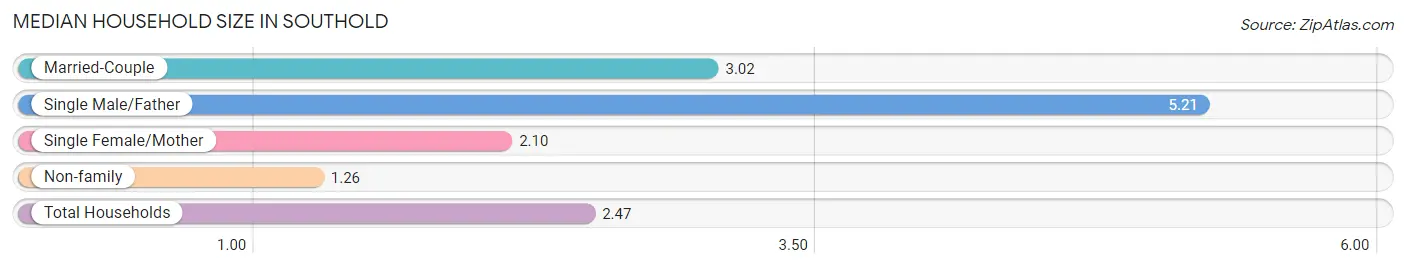
| Household Type | # Households | Household Size |
| Married-Couple | 1,562 (60.8%) | 3.02 |
| Single Male/Father | 53 (2.1%) | 5.21 |
| Single Female/Mother | 168 (6.5%) | 2.10 |
| Non-family | 786 (30.6%) | 1.26 |
| Total Households | 2,569 (100.0%) | 2.47 |
Household Size by Marriage Status in Southold
Out of a total of 2,569 households in Southold, 1,783 (69.4%) are family households, while 786 (30.6%) are nonfamily households. The most numerous type of family households are 2-person households, comprising 965, and the most common type of nonfamily households are 1-person households, comprising 592.
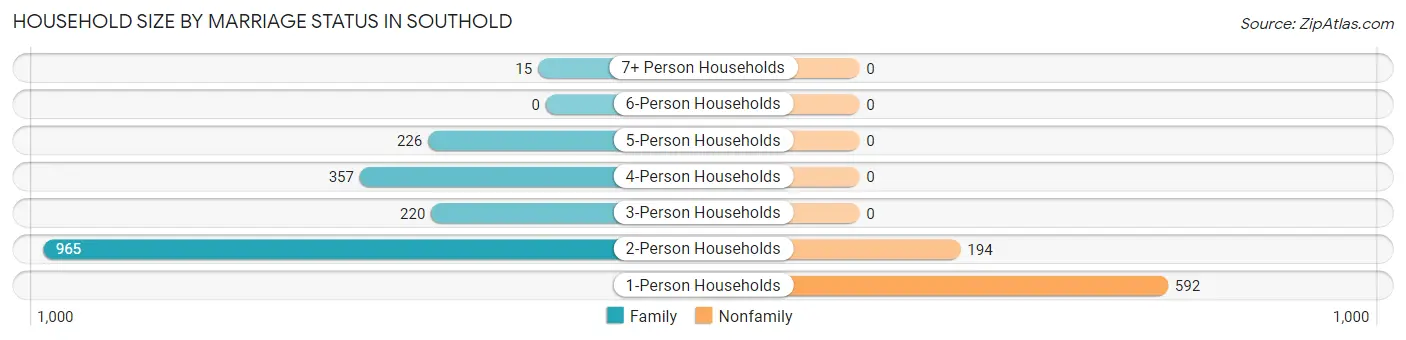
| Household Size | Family Households | Nonfamily Households |
| 1-Person Households | - | 592 (23.0%) |
| 2-Person Households | 965 (37.6%) | 194 (7.5%) |
| 3-Person Households | 220 (8.6%) | 0 (0.0%) |
| 4-Person Households | 357 (13.9%) | 0 (0.0%) |
| 5-Person Households | 226 (8.8%) | 0 (0.0%) |
| 6-Person Households | 0 (0.0%) | 0 (0.0%) |
| 7+ Person Households | 15 (0.6%) | 0 (0.0%) |
| Total | 1,783 (69.4%) | 786 (30.6%) |
Female Fertility in Southold
Fertility by Age in Southold
Average fertility rate in Southold is 78.0 births per 1,000 women. Women in the age bracket of 35 to 50 years have the highest fertility rate with 125.0 births per 1,000 women. Women in the age bracket of 35 to 50 years acount for 100.0% of all women with births.
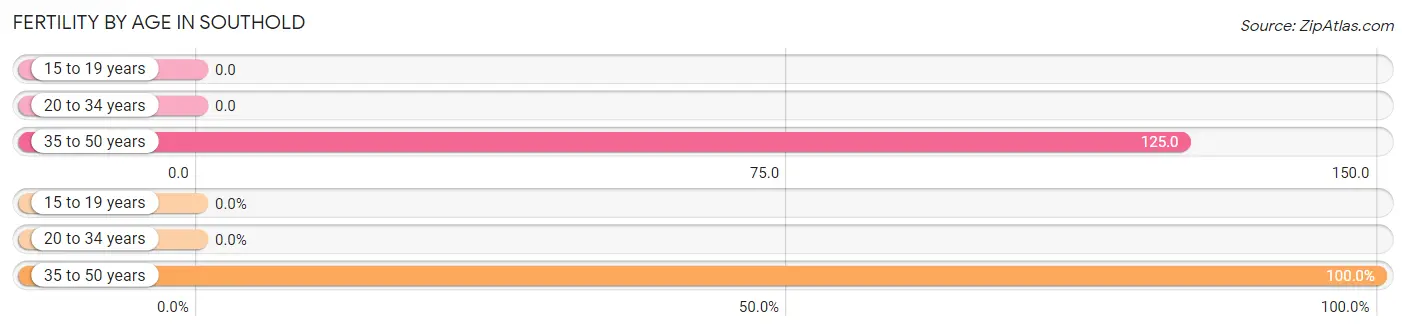
| Age Bracket | Women with Births | Births / 1,000 Women |
| 15 to 19 years | 0 (0.0%) | 0.0 |
| 20 to 34 years | 0 (0.0%) | 0.0 |
| 35 to 50 years | 70 (100.0%) | 125.0 |
| Total | 70 (100.0%) | 78.0 |
Fertility by Age by Marriage Status in Southold
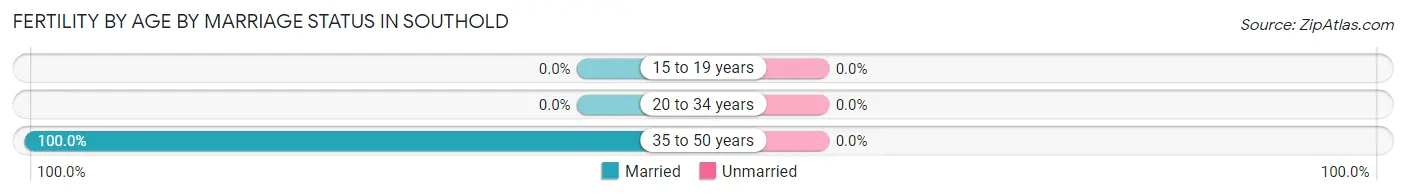
| Age Bracket | Married | Unmarried |
| 15 to 19 years | 0 (0.0%) | 0 (0.0%) |
| 20 to 34 years | 0 (0.0%) | 0 (0.0%) |
| 35 to 50 years | 70 (100.0%) | 0 (0.0%) |
| Total | 70 (100.0%) | 0 (0.0%) |
Fertility by Education in Southold
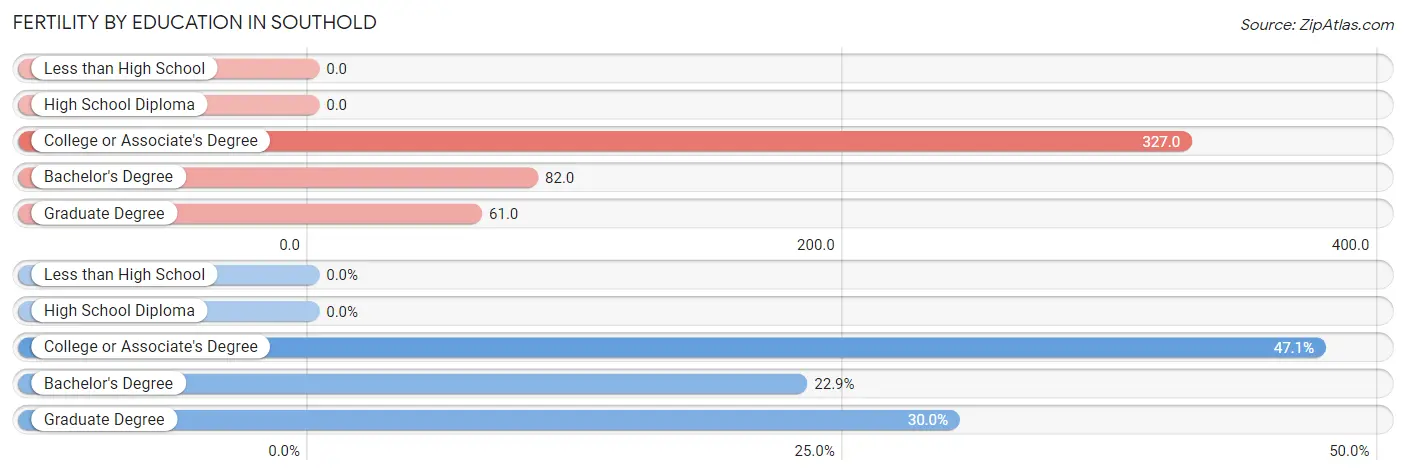
| Educational Attainment | Women with Births | Births / 1,000 Women |
| Less than High School | 0 (0.0%) | 0.0 |
| High School Diploma | 0 (0.0%) | 0.0 |
| College or Associate's Degree | 33 (47.1%) | 327.0 |
| Bachelor's Degree | 16 (22.9%) | 82.0 |
| Graduate Degree | 21 (30.0%) | 61.0 |
| Total | 70 (100.0%) | 78.0 |
Fertility by Education by Marriage Status in Southold
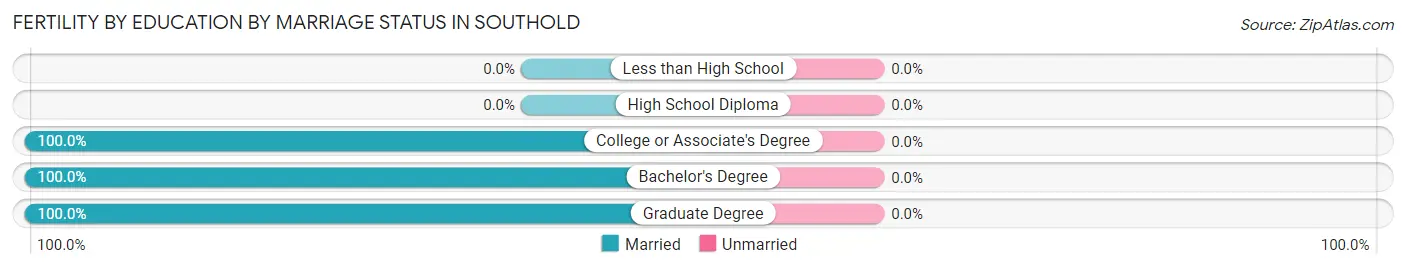
| Educational Attainment | Married | Unmarried |
| Less than High School | 0 (0.0%) | 0 (0.0%) |
| High School Diploma | 0 (0.0%) | 0 (0.0%) |
| College or Associate's Degree | 33 (100.0%) | 0 (0.0%) |
| Bachelor's Degree | 16 (100.0%) | 0 (0.0%) |
| Graduate Degree | 21 (100.0%) | 0 (0.0%) |
| Total | 70 (100.0%) | 0 (0.0%) |
Employment Characteristics in Southold
Employment by Class of Employer in Southold
Among the 2,579 employed individuals in Southold, private company employees (1,475 | 57.2%), self-employed (incorporated) (300 | 11.6%), and local government employees (266 | 10.3%) make up the most common classes of employment.
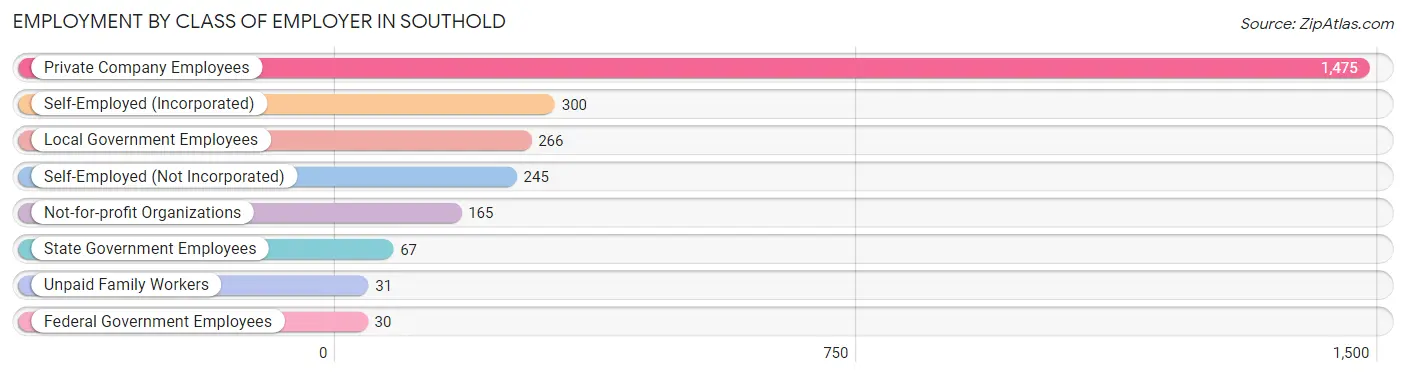
| Employer Class | # Employees | % Employees |
| Private Company Employees | 1,475 | 57.2% |
| Self-Employed (Incorporated) | 300 | 11.6% |
| Self-Employed (Not Incorporated) | 245 | 9.5% |
| Not-for-profit Organizations | 165 | 6.4% |
| Local Government Employees | 266 | 10.3% |
| State Government Employees | 67 | 2.6% |
| Federal Government Employees | 30 | 1.2% |
| Unpaid Family Workers | 31 | 1.2% |
| Total | 2,579 | 100.0% |
Employment Status by Age in Southold
According to the labor force statistics for Southold, out of the total population over 16 years of age (4,968), 57.8% or 2,872 individuals are in the labor force, with 8.5% or 244 of them unemployed. The age group with the highest labor force participation rate is 35 to 44 years, with 91.3% or 633 individuals in the labor force. Within the labor force, the 75 years and over age range has the highest percentage of unemployed individuals, with 21.8% or 24 of them being unemployed.
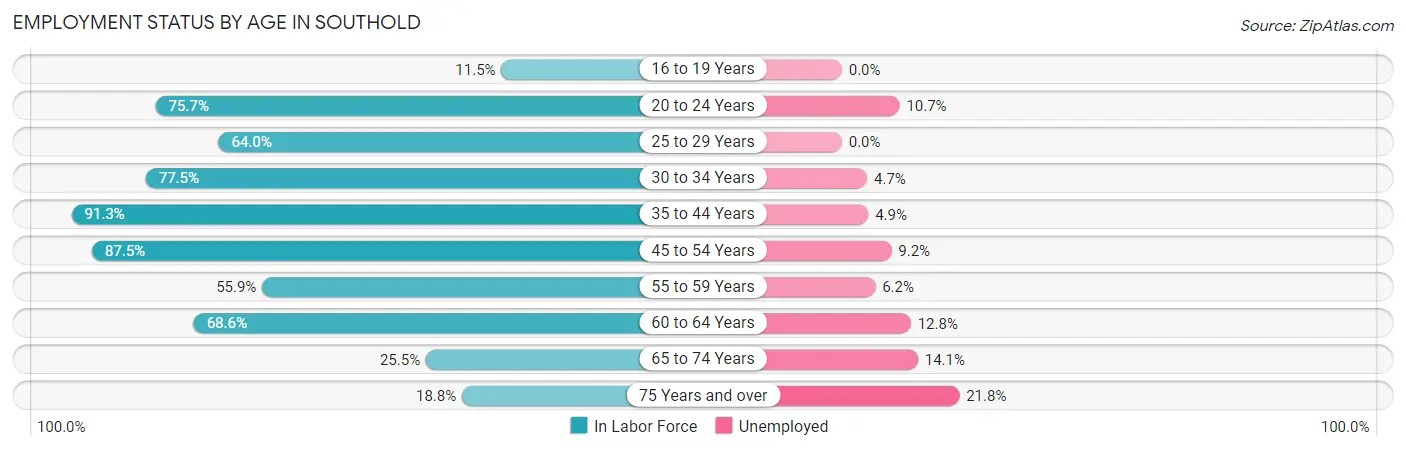
| Age Bracket | In Labor Force | Unemployed |
| 16 to 19 Years | 10 (11.5%) | 0 (0.0%) |
| 20 to 24 Years | 56 (75.7%) | 6 (10.7%) |
| 25 to 29 Years | 87 (64.0%) | 0 (0.0%) |
| 30 to 34 Years | 344 (77.5%) | 16 (4.7%) |
| 35 to 44 Years | 633 (91.3%) | 31 (4.9%) |
| 45 to 54 Years | 555 (87.5%) | 51 (9.2%) |
| 55 to 59 Years | 357 (55.9%) | 22 (6.2%) |
| 60 to 64 Years | 462 (68.6%) | 59 (12.8%) |
| 65 to 74 Years | 256 (25.5%) | 36 (14.1%) |
| 75 Years and over | 110 (18.8%) | 24 (21.8%) |
| Total | 2,872 (57.8%) | 244 (8.5%) |
Employment Status by Educational Attainment in Southold
According to labor force statistics for Southold, 75.7% of individuals (2,437) out of the total population between 25 and 64 years of age (3,219) are in the labor force, with 7.3% or 178 of them being unemployed. The group with the highest labor force participation rate are those with the educational attainment of college / associate degree, with 94.8% or 439 individuals in the labor force. Within the labor force, individuals with high school diploma education have the highest percentage of unemployment, with 19.7% or 74 of them being unemployed.
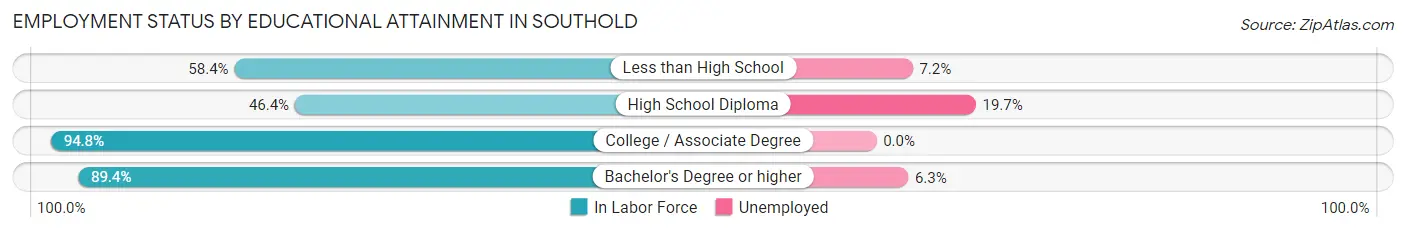
| Educational Attainment | In Labor Force | Unemployed |
| Less than High School | 222 (58.4%) | 27 (7.2%) |
| High School Diploma | 375 (46.4%) | 159 (19.7%) |
| College / Associate Degree | 439 (94.8%) | 0 (0.0%) |
| Bachelor's Degree or higher | 1,402 (89.4%) | 99 (6.3%) |
| Total | 2,437 (75.7%) | 235 (7.3%) |
Employment Occupations by Sex in Southold
Management, Business, Science and Arts Occupations
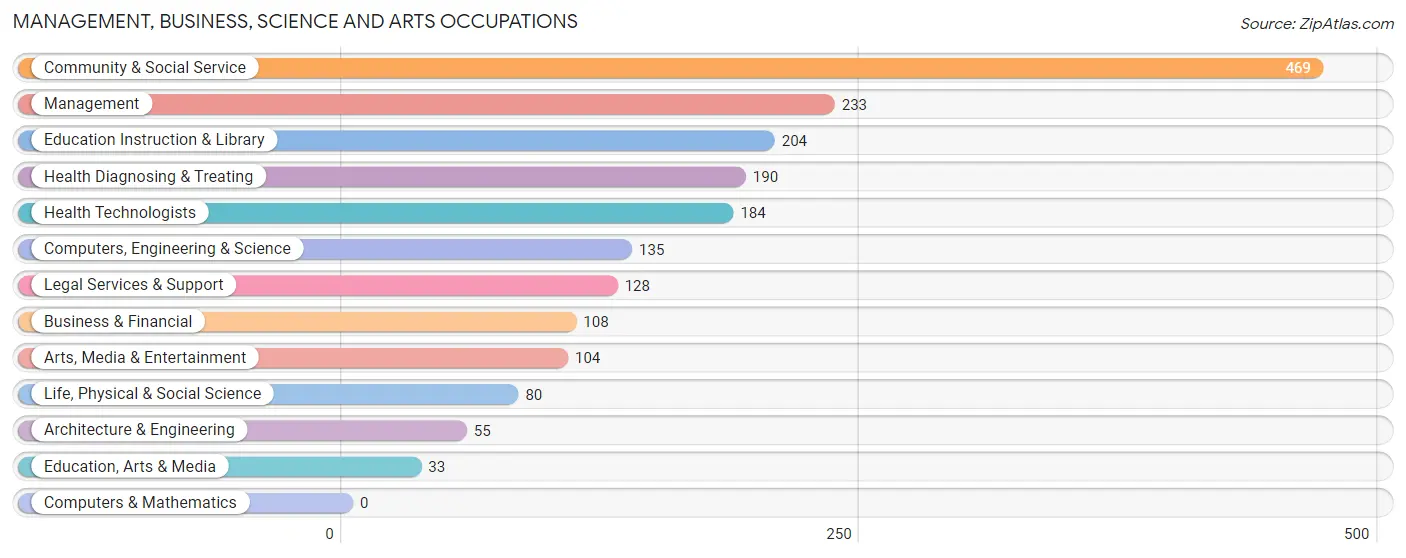
The most common Management, Business, Science and Arts occupations in Southold are Community & Social Service (469 | 17.9%), Management (233 | 8.9%), Education Instruction & Library (204 | 7.8%), Health Diagnosing & Treating (190 | 7.2%), and Health Technologists (184 | 7.0%).
Management, Business, Science and Arts Occupations by Sex
Within the Management, Business, Science and Arts occupations in Southold, the most male-oriented occupations are Architecture & Engineering (100.0%), Business & Financial (74.1%), and Management (51.1%), while the most female-oriented occupations are Education, Arts & Media (100.0%), Life, Physical & Social Science (91.2%), and Education Instruction & Library (66.2%).
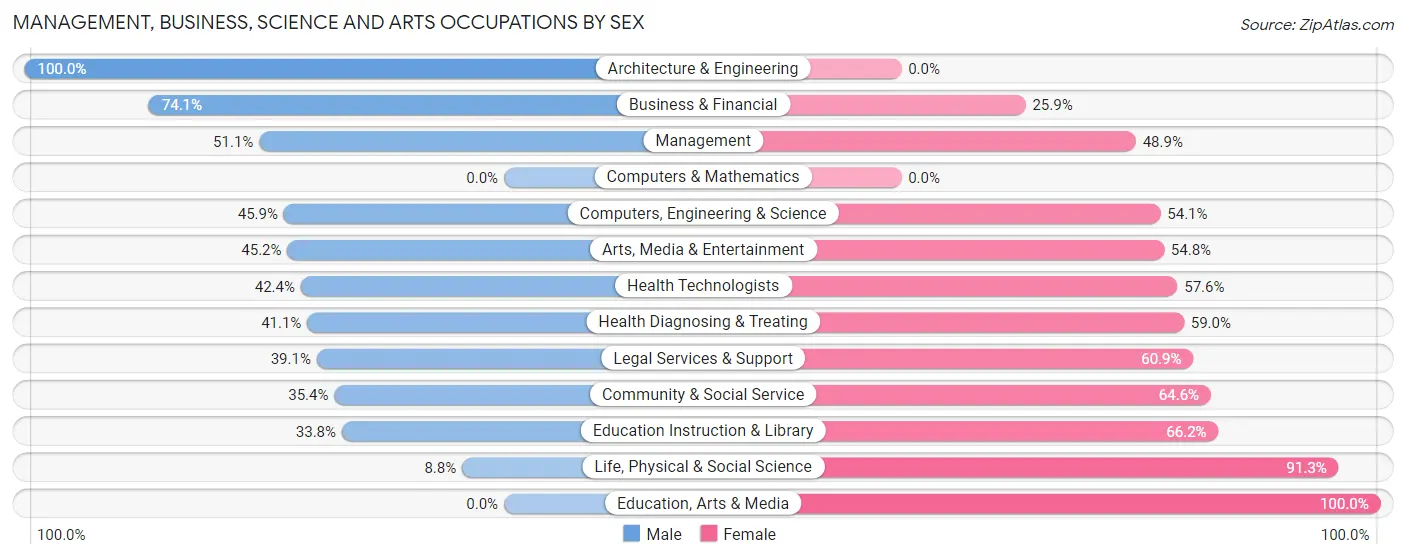
| Occupation | Male | Female |
| Management | 119 (51.1%) | 114 (48.9%) |
| Business & Financial | 80 (74.1%) | 28 (25.9%) |
| Computers, Engineering & Science | 62 (45.9%) | 73 (54.1%) |
| Computers & Mathematics | 0 (0.0%) | 0 (0.0%) |
| Architecture & Engineering | 55 (100.0%) | 0 (0.0%) |
| Life, Physical & Social Science | 7 (8.7%) | 73 (91.2%) |
| Community & Social Service | 166 (35.4%) | 303 (64.6%) |
| Education, Arts & Media | 0 (0.0%) | 33 (100.0%) |
| Legal Services & Support | 50 (39.1%) | 78 (60.9%) |
| Education Instruction & Library | 69 (33.8%) | 135 (66.2%) |
| Arts, Media & Entertainment | 47 (45.2%) | 57 (54.8%) |
| Health Diagnosing & Treating | 78 (41.0%) | 112 (59.0%) |
| Health Technologists | 78 (42.4%) | 106 (57.6%) |
| Total (Category) | 505 (44.5%) | 630 (55.5%) |
| Total (Overall) | 1,565 (59.6%) | 1,060 (40.4%) |
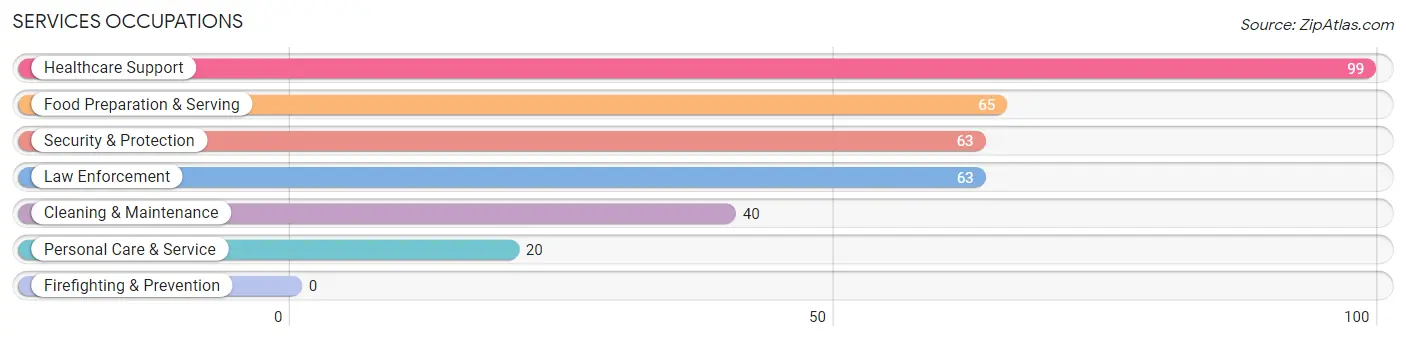
Services Occupations
The most common Services occupations in Southold are Healthcare Support (99 | 3.8%), Food Preparation & Serving (65 | 2.5%), Security & Protection (63 | 2.4%), Law Enforcement (63 | 2.4%), and Cleaning & Maintenance (40 | 1.5%).
Services Occupations by Sex
Within the Services occupations in Southold, the most male-oriented occupations are Security & Protection (100.0%), Law Enforcement (100.0%), and Food Preparation & Serving (100.0%), while the most female-oriented occupations are Cleaning & Maintenance (100.0%), Personal Care & Service (100.0%), and Healthcare Support (87.9%).
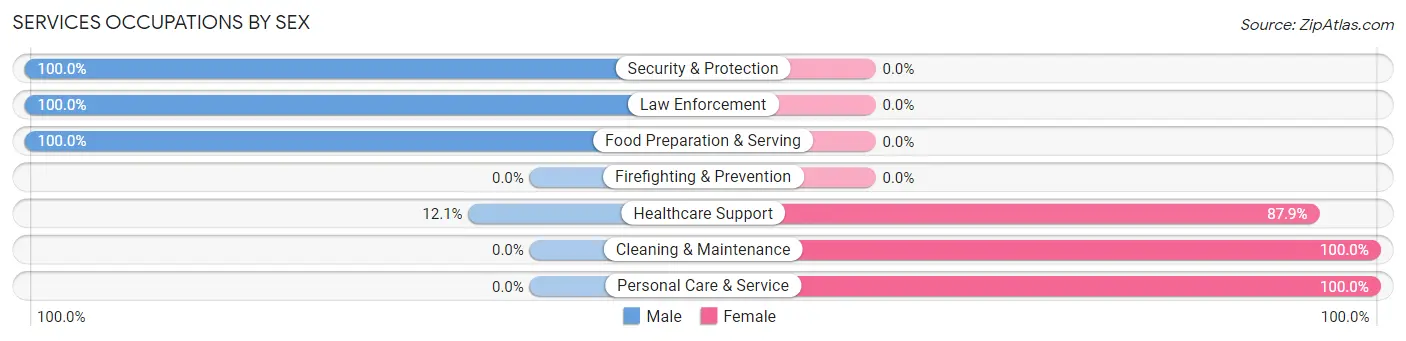
| Occupation | Male | Female |
| Healthcare Support | 12 (12.1%) | 87 (87.9%) |
| Security & Protection | 63 (100.0%) | 0 (0.0%) |
| Firefighting & Prevention | 0 (0.0%) | 0 (0.0%) |
| Law Enforcement | 63 (100.0%) | 0 (0.0%) |
| Food Preparation & Serving | 65 (100.0%) | 0 (0.0%) |
| Cleaning & Maintenance | 0 (0.0%) | 40 (100.0%) |
| Personal Care & Service | 0 (0.0%) | 20 (100.0%) |
| Total (Category) | 140 (48.8%) | 147 (51.2%) |
| Total (Overall) | 1,565 (59.6%) | 1,060 (40.4%) |
Sales and Office Occupations
The most common Sales and Office occupations in Southold are Sales & Related (427 | 16.3%), and Office & Administration (130 | 5.0%).
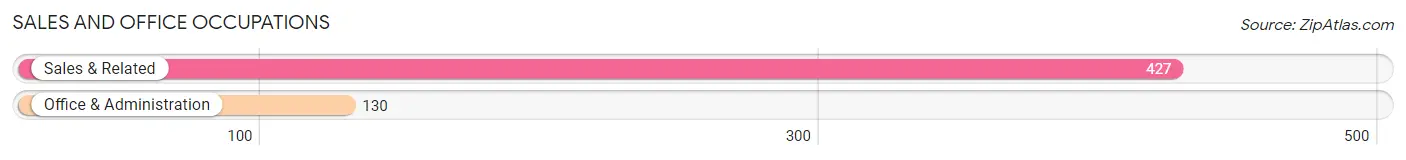
Sales and Office Occupations by Sex
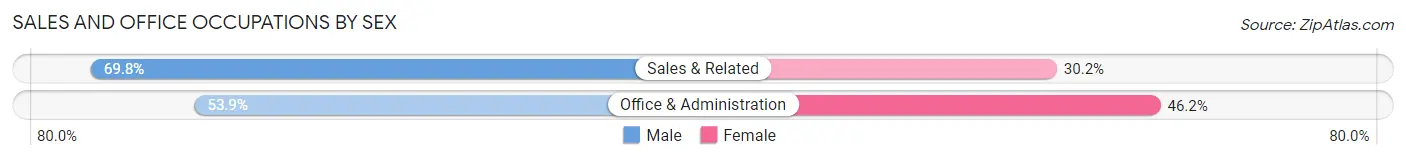
| Occupation | Male | Female |
| Sales & Related | 298 (69.8%) | 129 (30.2%) |
| Office & Administration | 70 (53.8%) | 60 (46.2%) |
| Total (Category) | 368 (66.1%) | 189 (33.9%) |
| Total (Overall) | 1,565 (59.6%) | 1,060 (40.4%) |
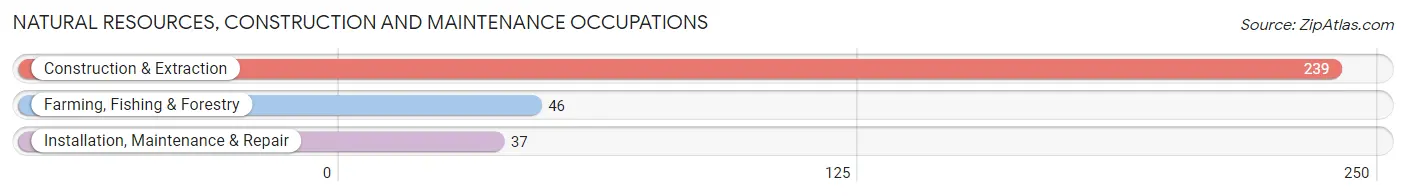
Natural Resources, Construction and Maintenance Occupations
The most common Natural Resources, Construction and Maintenance occupations in Southold are Construction & Extraction (239 | 9.1%), Farming, Fishing & Forestry (46 | 1.8%), and Installation, Maintenance & Repair (37 | 1.4%).
Natural Resources, Construction and Maintenance Occupations by Sex
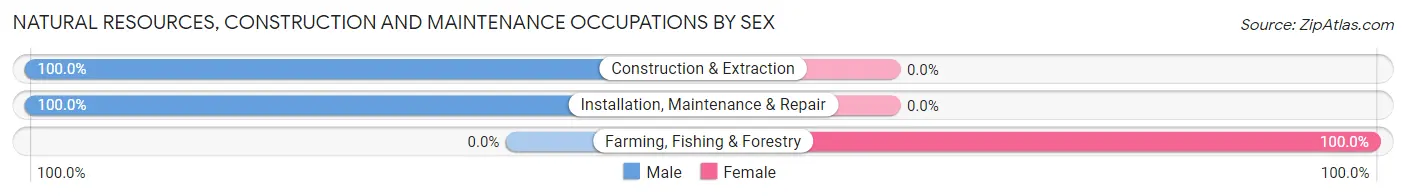
| Occupation | Male | Female |
| Farming, Fishing & Forestry | 0 (0.0%) | 46 (100.0%) |
| Construction & Extraction | 239 (100.0%) | 0 (0.0%) |
| Installation, Maintenance & Repair | 37 (100.0%) | 0 (0.0%) |
| Total (Category) | 276 (85.7%) | 46 (14.3%) |
| Total (Overall) | 1,565 (59.6%) | 1,060 (40.4%) |
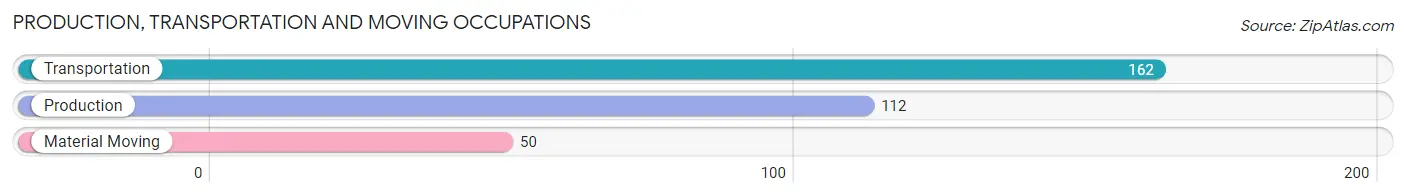
Production, Transportation and Moving Occupations
The most common Production, Transportation and Moving occupations in Southold are Transportation (162 | 6.2%), Production (112 | 4.3%), and Material Moving (50 | 1.9%).
Production, Transportation and Moving Occupations by Sex
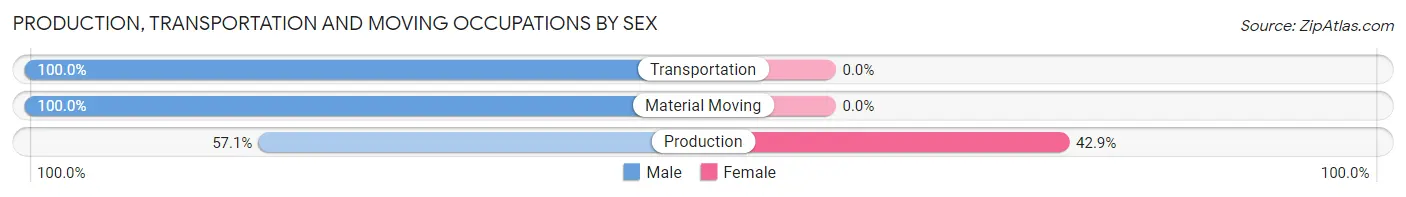
| Occupation | Male | Female |
| Production | 64 (57.1%) | 48 (42.9%) |
| Transportation | 162 (100.0%) | 0 (0.0%) |
| Material Moving | 50 (100.0%) | 0 (0.0%) |
| Total (Category) | 276 (85.2%) | 48 (14.8%) |
| Total (Overall) | 1,565 (59.6%) | 1,060 (40.4%) |
Employment Industries by Sex in Southold
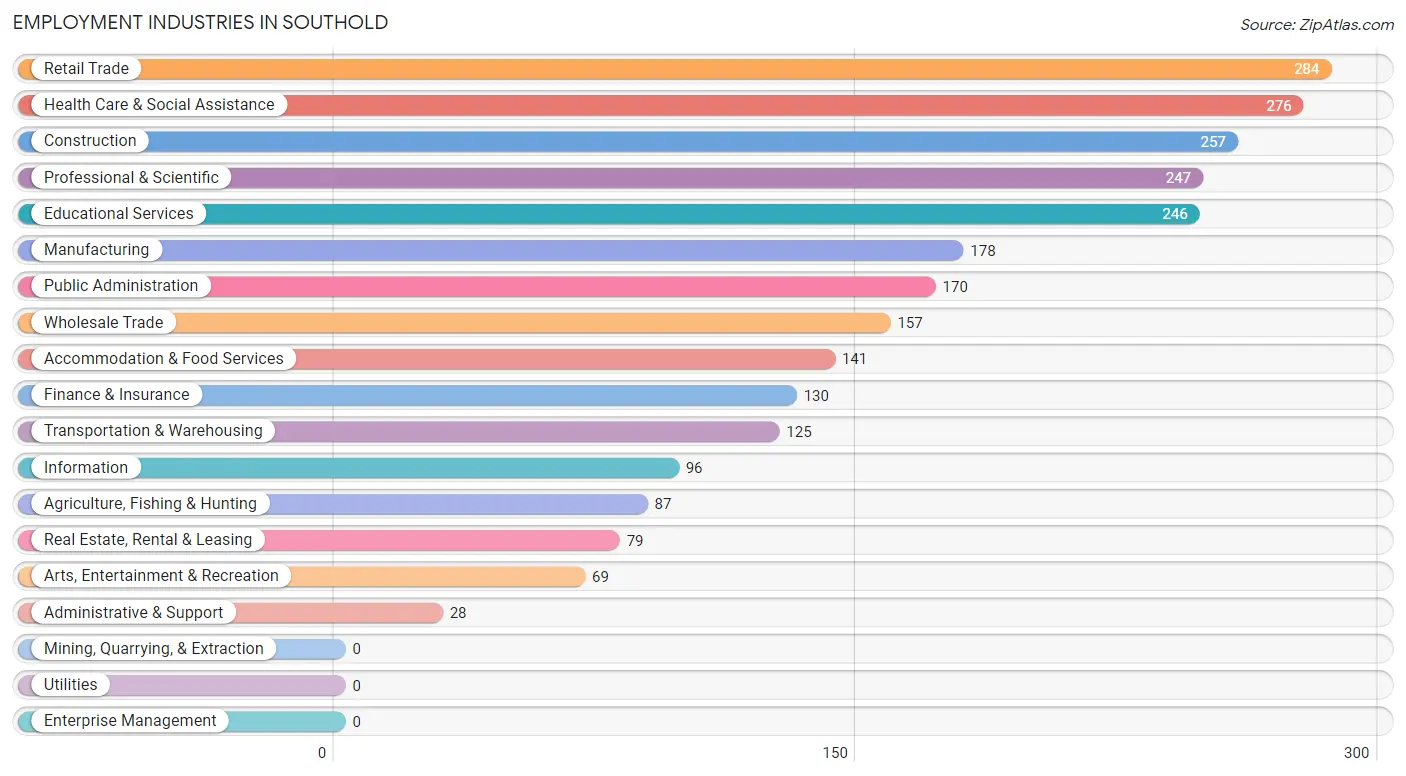
Employment Industries in Southold
The major employment industries in Southold include Retail Trade (284 | 10.8%), Health Care & Social Assistance (276 | 10.5%), Construction (257 | 9.8%), Professional & Scientific (247 | 9.4%), and Educational Services (246 | 9.4%).
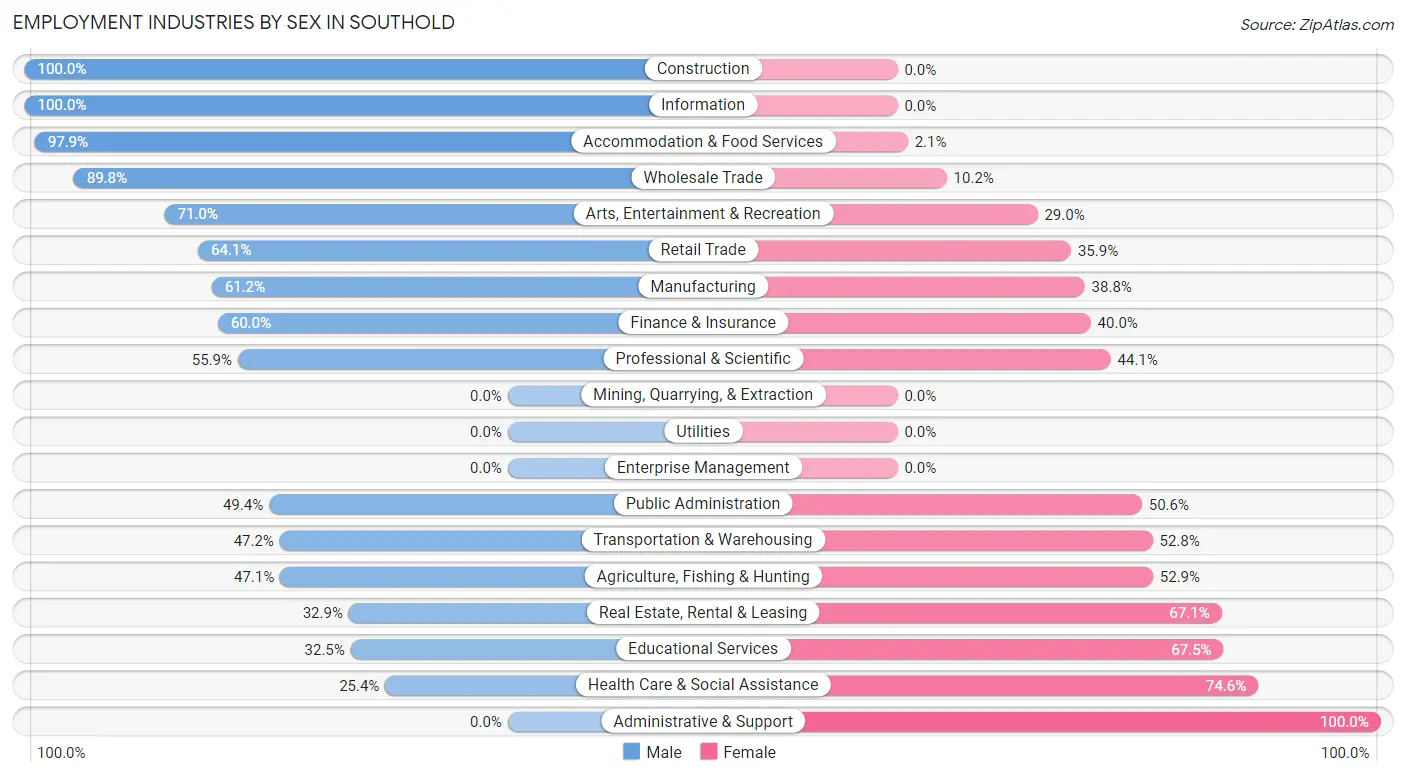
Employment Industries by Sex in Southold
The Southold industries that see more men than women are Construction (100.0%), Information (100.0%), and Accommodation & Food Services (97.9%), whereas the industries that tend to have a higher number of women are Administrative & Support (100.0%), Health Care & Social Assistance (74.6%), and Educational Services (67.5%).
| Industry | Male | Female |
| Agriculture, Fishing & Hunting | 41 (47.1%) | 46 (52.9%) |
| Mining, Quarrying, & Extraction | 0 (0.0%) | 0 (0.0%) |
| Construction | 257 (100.0%) | 0 (0.0%) |
| Manufacturing | 109 (61.2%) | 69 (38.8%) |
| Wholesale Trade | 141 (89.8%) | 16 (10.2%) |
| Retail Trade | 182 (64.1%) | 102 (35.9%) |
| Transportation & Warehousing | 59 (47.2%) | 66 (52.8%) |
| Utilities | 0 (0.0%) | 0 (0.0%) |
| Information | 96 (100.0%) | 0 (0.0%) |
| Finance & Insurance | 78 (60.0%) | 52 (40.0%) |
| Real Estate, Rental & Leasing | 26 (32.9%) | 53 (67.1%) |
| Professional & Scientific | 138 (55.9%) | 109 (44.1%) |
| Enterprise Management | 0 (0.0%) | 0 (0.0%) |
| Administrative & Support | 0 (0.0%) | 28 (100.0%) |
| Educational Services | 80 (32.5%) | 166 (67.5%) |
| Health Care & Social Assistance | 70 (25.4%) | 206 (74.6%) |
| Arts, Entertainment & Recreation | 49 (71.0%) | 20 (29.0%) |
| Accommodation & Food Services | 138 (97.9%) | 3 (2.1%) |
| Public Administration | 84 (49.4%) | 86 (50.6%) |
| Total | 1,565 (59.6%) | 1,060 (40.4%) |
Education in Southold
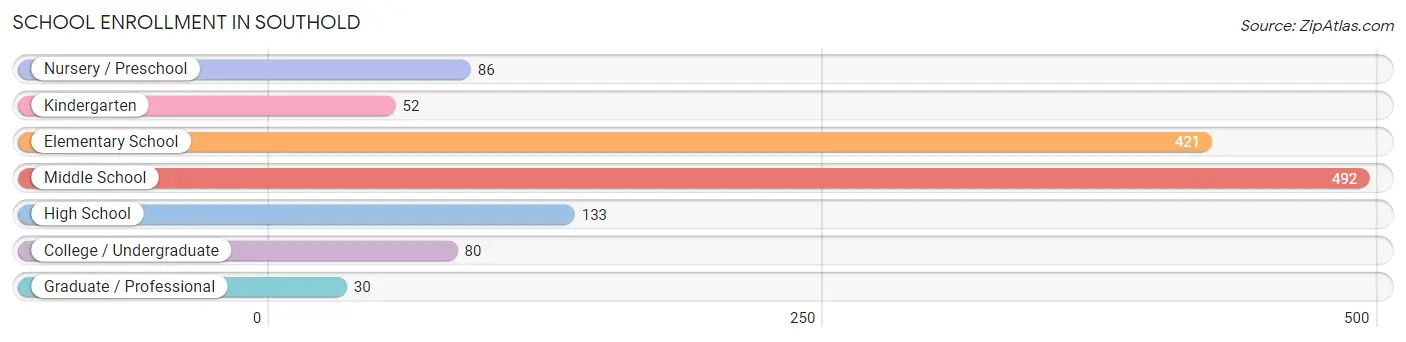
School Enrollment in Southold
The most common levels of schooling among the 1,294 students in Southold are middle school (492 | 38.0%), elementary school (421 | 32.5%), and high school (133 | 10.3%).
| School Level | # Students | % Students |
| Nursery / Preschool | 86 | 6.7% |
| Kindergarten | 52 | 4.0% |
| Elementary School | 421 | 32.5% |
| Middle School | 492 | 38.0% |
| High School | 133 | 10.3% |
| College / Undergraduate | 80 | 6.2% |
| Graduate / Professional | 30 | 2.3% |
| Total | 1,294 | 100.0% |
School Enrollment by Age by Funding Source in Southold
Out of a total of 1,294 students who are enrolled in schools in Southold, 164 (12.7%) attend a private institution, while the remaining 1,130 (87.3%) are enrolled in public schools. The age group of 3 to 4 year olds has the highest likelihood of being enrolled in private schools, with 23 (35.4% in the age bracket) enrolled. Conversely, the age group of 18 to 19 year olds has the lowest likelihood of being enrolled in a private school, with 21 (100.0% in the age bracket) attending a public institution.
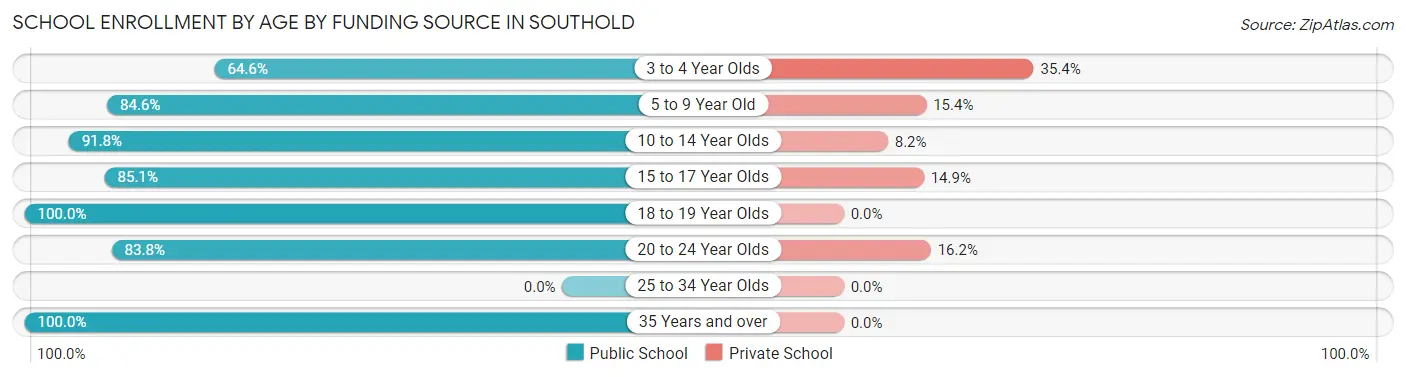
| Age Bracket | Public School | Private School |
| 3 to 4 Year Olds | 42 (64.6%) | 23 (35.4%) |
| 5 to 9 Year Old | 418 (84.6%) | 76 (15.4%) |
| 10 to 14 Year Olds | 469 (91.8%) | 42 (8.2%) |
| 15 to 17 Year Olds | 97 (85.1%) | 17 (14.9%) |
| 18 to 19 Year Olds | 21 (100.0%) | 0 (0.0%) |
| 20 to 24 Year Olds | 31 (83.8%) | 6 (16.2%) |
| 25 to 34 Year Olds | 0 (0.0%) | 0 (0.0%) |
| 35 Years and over | 52 (100.0%) | 0 (0.0%) |
| Total | 1,130 (87.3%) | 164 (12.7%) |
Educational Attainment by Field of Study in Southold
Business (451 | 18.5%), education (301 | 12.3%), social sciences (268 | 11.0%), liberal arts & history (259 | 10.6%), and bio, nature & agricultural (203 | 8.3%) are the most common fields of study among 2,443 individuals in Southold who have obtained a bachelor's degree or higher.
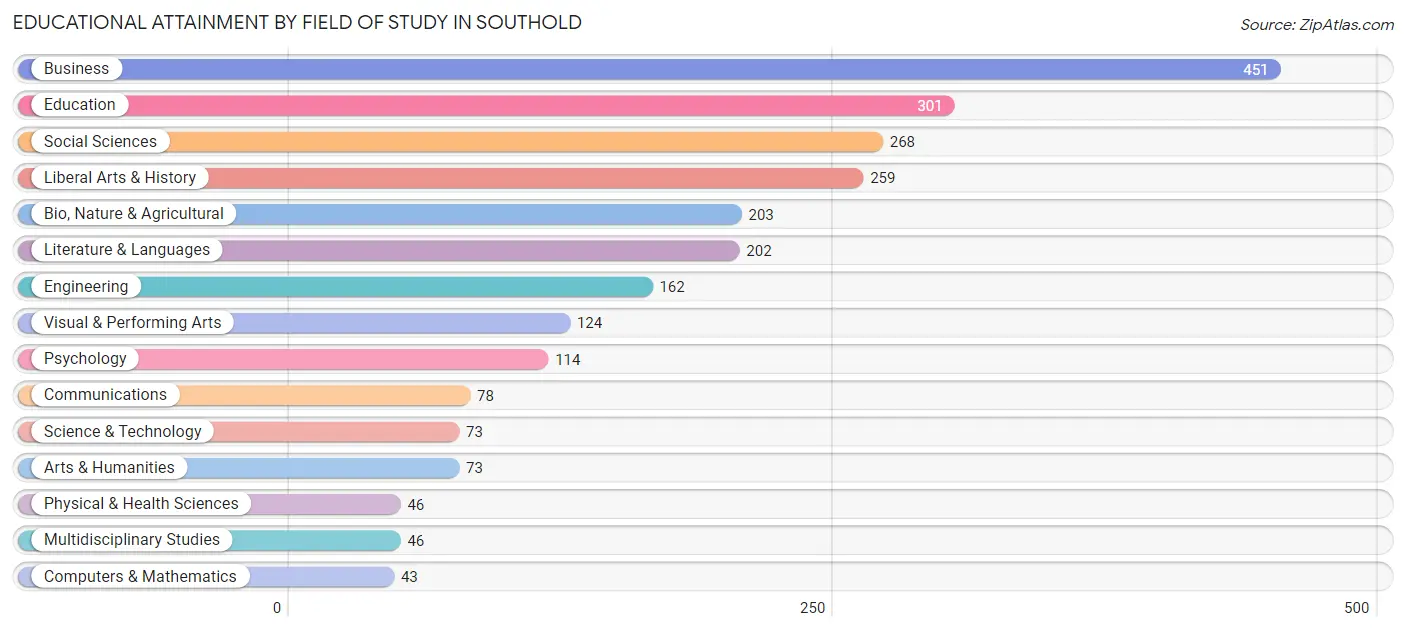
| Field of Study | # Graduates | % Graduates |
| Computers & Mathematics | 43 | 1.8% |
| Bio, Nature & Agricultural | 203 | 8.3% |
| Physical & Health Sciences | 46 | 1.9% |
| Psychology | 114 | 4.7% |
| Social Sciences | 268 | 11.0% |
| Engineering | 162 | 6.6% |
| Multidisciplinary Studies | 46 | 1.9% |
| Science & Technology | 73 | 3.0% |
| Business | 451 | 18.5% |
| Education | 301 | 12.3% |
| Literature & Languages | 202 | 8.3% |
| Liberal Arts & History | 259 | 10.6% |
| Visual & Performing Arts | 124 | 5.1% |
| Communications | 78 | 3.2% |
| Arts & Humanities | 73 | 3.0% |
| Total | 2,443 | 100.0% |
Transportation & Commute in Southold
Vehicle Availability by Sex in Southold
The most prevalent vehicle ownership categories in Southold are males with 2 vehicles (508, accounting for 32.7%) and females with 2 vehicles (400, making up 49.5%).
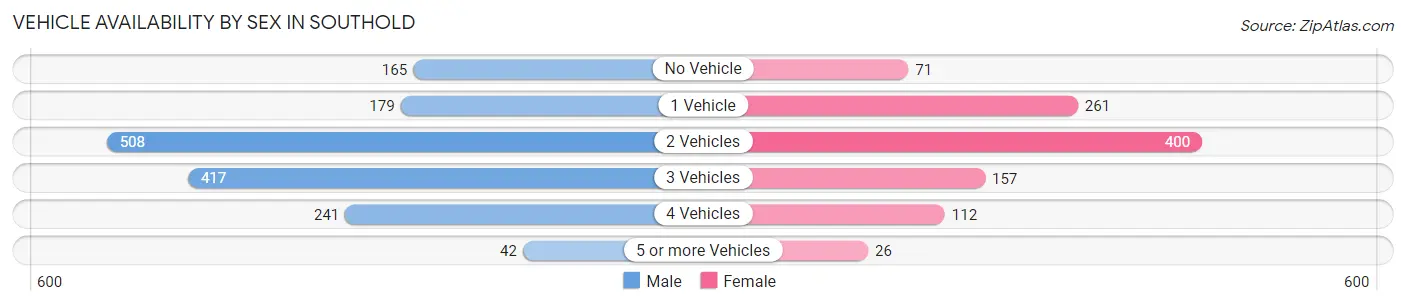
| Vehicles Available | Male | Female |
| No Vehicle | 165 (10.6%) | 71 (6.9%) |
| 1 Vehicle | 179 (11.5%) | 261 (25.4%) |
| 2 Vehicles | 508 (32.7%) | 400 (39.0%) |
| 3 Vehicles | 417 (26.9%) | 157 (15.3%) |
| 4 Vehicles | 241 (15.5%) | 112 (10.9%) |
| 5 or more Vehicles | 42 (2.7%) | 26 (2.5%) |
| Total | 1,552 (100.0%) | 1,027 (100.0%) |
Commute Time in Southold
The most frequently occuring commute durations in Southold are 10 to 14 minutes (422 commuters, 18.0%), 30 to 34 minutes (350 commuters, 14.9%), and 60 to 89 minutes (257 commuters, 11.0%).
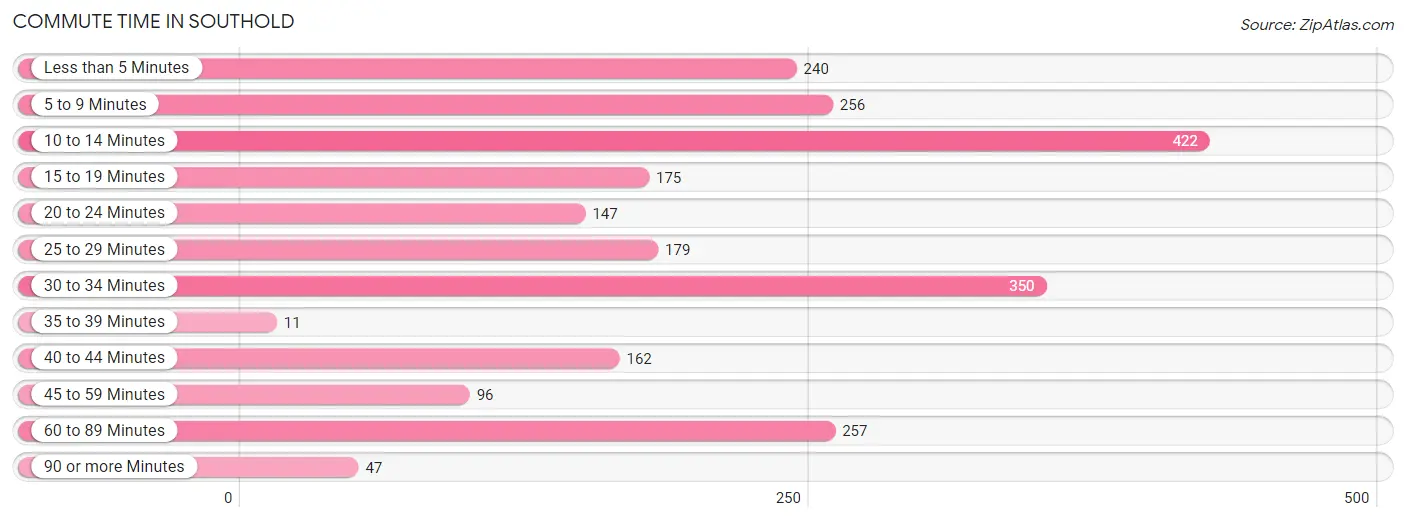
| Commute Time | # Commuters | % Commuters |
| Less than 5 Minutes | 240 | 10.2% |
| 5 to 9 Minutes | 256 | 10.9% |
| 10 to 14 Minutes | 422 | 18.0% |
| 15 to 19 Minutes | 175 | 7.5% |
| 20 to 24 Minutes | 147 | 6.3% |
| 25 to 29 Minutes | 179 | 7.6% |
| 30 to 34 Minutes | 350 | 14.9% |
| 35 to 39 Minutes | 11 | 0.5% |
| 40 to 44 Minutes | 162 | 6.9% |
| 45 to 59 Minutes | 96 | 4.1% |
| 60 to 89 Minutes | 257 | 11.0% |
| 90 or more Minutes | 47 | 2.0% |
Commute Time by Sex in Southold
The most common commute times in Southold are 10 to 14 minutes (321 commuters, 21.6%) for males and 30 to 34 minutes (156 commuters, 18.3%) for females.
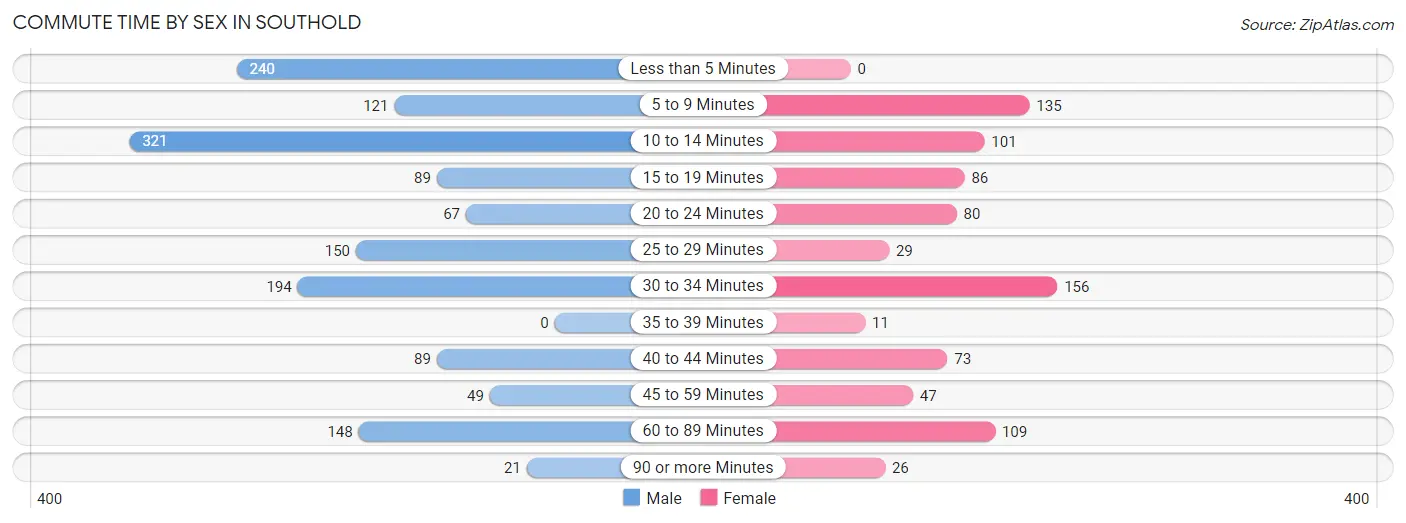
| Commute Time | Male | Female |
| Less than 5 Minutes | 240 (16.1%) | 0 (0.0%) |
| 5 to 9 Minutes | 121 (8.1%) | 135 (15.8%) |
| 10 to 14 Minutes | 321 (21.6%) | 101 (11.8%) |
| 15 to 19 Minutes | 89 (6.0%) | 86 (10.1%) |
| 20 to 24 Minutes | 67 (4.5%) | 80 (9.4%) |
| 25 to 29 Minutes | 150 (10.1%) | 29 (3.4%) |
| 30 to 34 Minutes | 194 (13.0%) | 156 (18.3%) |
| 35 to 39 Minutes | 0 (0.0%) | 11 (1.3%) |
| 40 to 44 Minutes | 89 (6.0%) | 73 (8.6%) |
| 45 to 59 Minutes | 49 (3.3%) | 47 (5.5%) |
| 60 to 89 Minutes | 148 (9.9%) | 109 (12.8%) |
| 90 or more Minutes | 21 (1.4%) | 26 (3.0%) |
Time of Departure to Work by Sex in Southold
The most frequent times of departure to work in Southold are 7:30 AM to 7:59 AM (383, 25.7%) for males and 8:30 AM to 8:59 AM (190, 22.3%) for females.
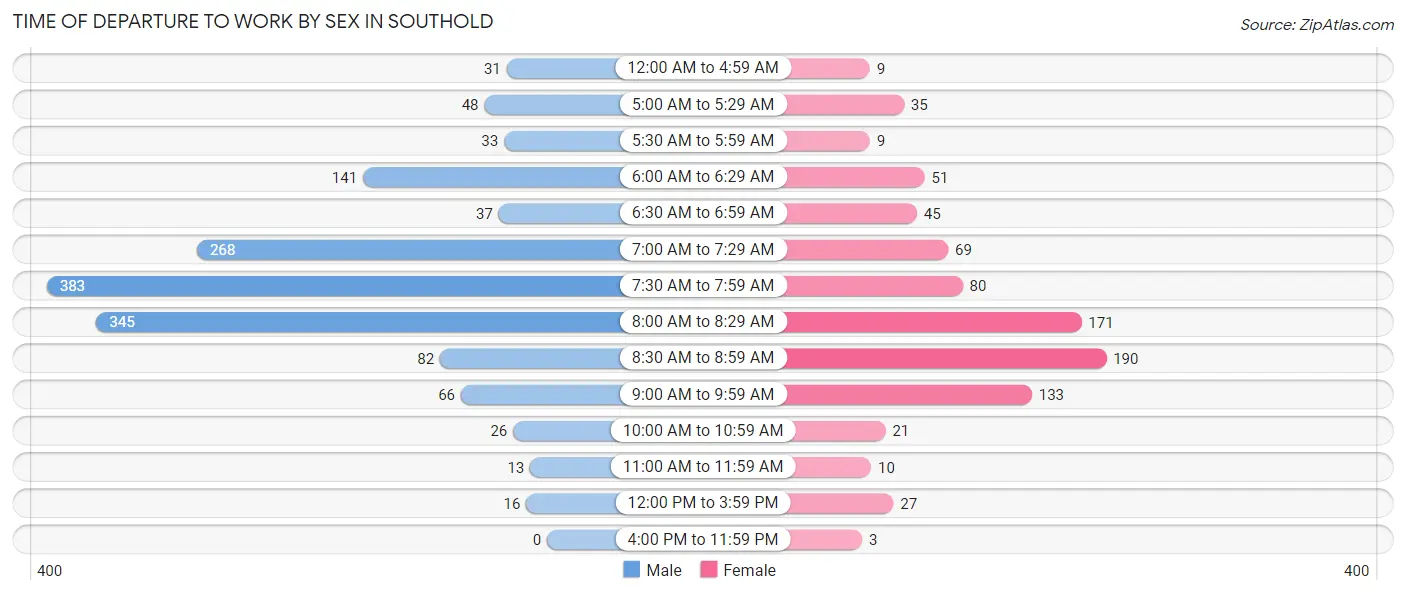
| Time of Departure | Male | Female |
| 12:00 AM to 4:59 AM | 31 (2.1%) | 9 (1.1%) |
| 5:00 AM to 5:29 AM | 48 (3.2%) | 35 (4.1%) |
| 5:30 AM to 5:59 AM | 33 (2.2%) | 9 (1.1%) |
| 6:00 AM to 6:29 AM | 141 (9.5%) | 51 (6.0%) |
| 6:30 AM to 6:59 AM | 37 (2.5%) | 45 (5.3%) |
| 7:00 AM to 7:29 AM | 268 (18.0%) | 69 (8.1%) |
| 7:30 AM to 7:59 AM | 383 (25.7%) | 80 (9.4%) |
| 8:00 AM to 8:29 AM | 345 (23.2%) | 171 (20.1%) |
| 8:30 AM to 8:59 AM | 82 (5.5%) | 190 (22.3%) |
| 9:00 AM to 9:59 AM | 66 (4.4%) | 133 (15.6%) |
| 10:00 AM to 10:59 AM | 26 (1.8%) | 21 (2.5%) |
| 11:00 AM to 11:59 AM | 13 (0.9%) | 10 (1.2%) |
| 12:00 PM to 3:59 PM | 16 (1.1%) | 27 (3.2%) |
| 4:00 PM to 11:59 PM | 0 (0.0%) | 3 (0.4%) |
| Total | 1,489 (100.0%) | 853 (100.0%) |
Housing Occupancy in Southold
Occupancy by Ownership in Southold
Of the total 2,569 dwellings in Southold, owner-occupied units account for 2,048 (79.7%), while renter-occupied units make up 521 (20.3%).
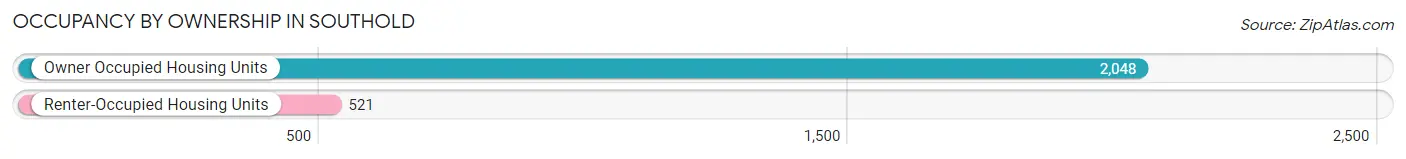
| Occupancy | # Housing Units | % Housing Units |
| Owner Occupied Housing Units | 2,048 | 79.7% |
| Renter-Occupied Housing Units | 521 | 20.3% |
| Total Occupied Housing Units | 2,569 | 100.0% |
Occupancy by Household Size in Southold
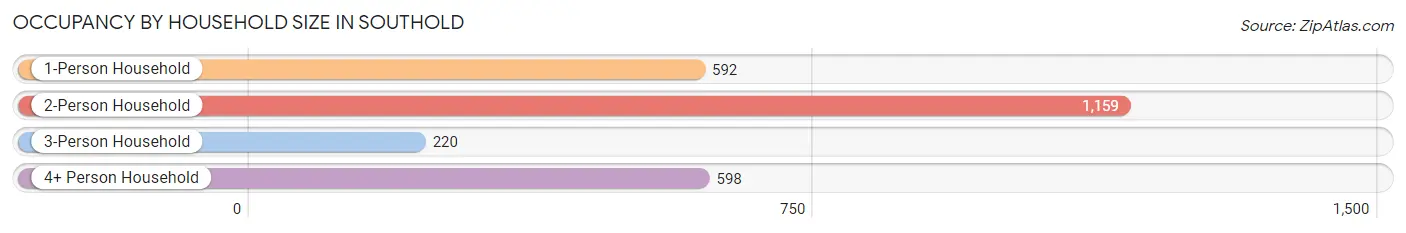
| Household Size | # Housing Units | % Housing Units |
| 1-Person Household | 592 | 23.0% |
| 2-Person Household | 1,159 | 45.1% |
| 3-Person Household | 220 | 8.6% |
| 4+ Person Household | 598 | 23.3% |
| Total Housing Units | 2,569 | 100.0% |
Occupancy by Ownership by Household Size in Southold
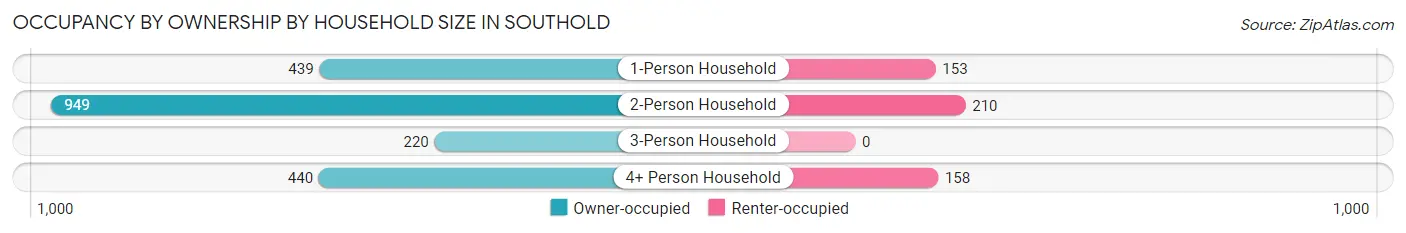
| Household Size | Owner-occupied | Renter-occupied |
| 1-Person Household | 439 (74.2%) | 153 (25.8%) |
| 2-Person Household | 949 (81.9%) | 210 (18.1%) |
| 3-Person Household | 220 (100.0%) | 0 (0.0%) |
| 4+ Person Household | 440 (73.6%) | 158 (26.4%) |
| Total Housing Units | 2,048 (79.7%) | 521 (20.3%) |
Occupancy by Educational Attainment in Southold
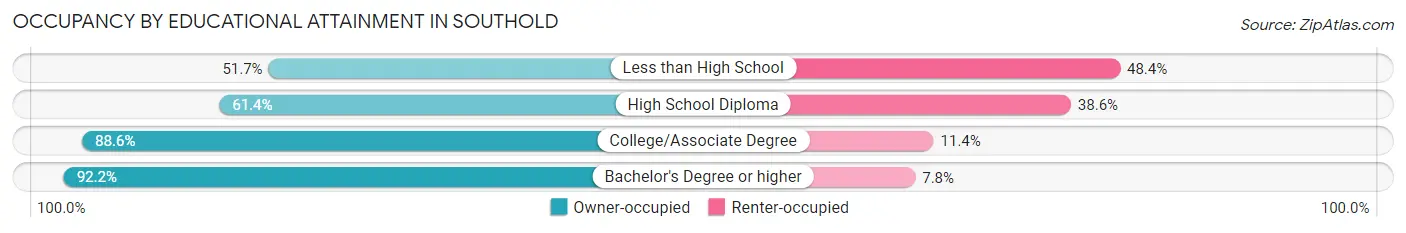
| Household Size | Owner-occupied | Renter-occupied |
| Less than High School | 203 (51.6%) | 190 (48.3%) |
| High School Diploma | 291 (61.4%) | 183 (38.6%) |
| College/Associate Degree | 389 (88.6%) | 50 (11.4%) |
| Bachelor's Degree or higher | 1,165 (92.2%) | 98 (7.8%) |
Occupancy by Age of Householder in Southold
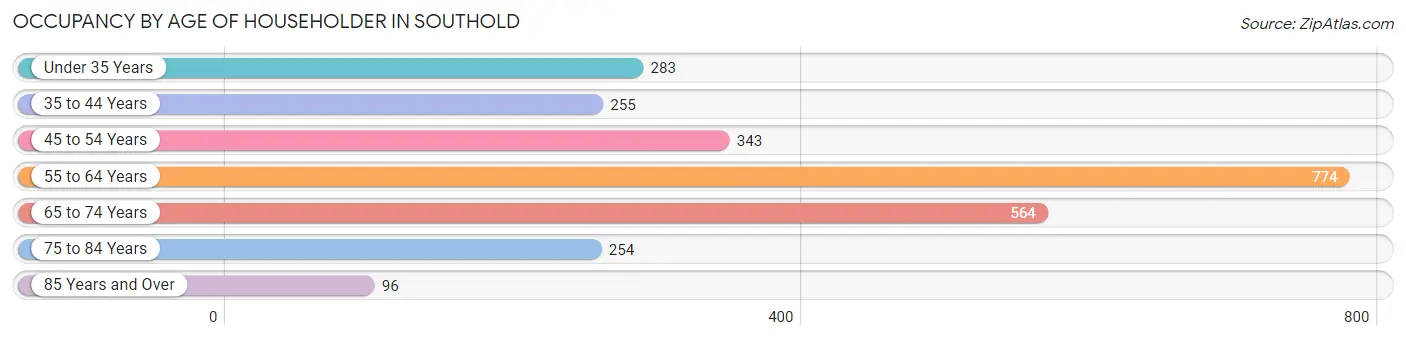
| Age Bracket | # Households | % Households |
| Under 35 Years | 283 | 11.0% |
| 35 to 44 Years | 255 | 9.9% |
| 45 to 54 Years | 343 | 13.4% |
| 55 to 64 Years | 774 | 30.1% |
| 65 to 74 Years | 564 | 22.0% |
| 75 to 84 Years | 254 | 9.9% |
| 85 Years and Over | 96 | 3.7% |
| Total | 2,569 | 100.0% |
Housing Finances in Southold
Median Income by Occupancy in Southold
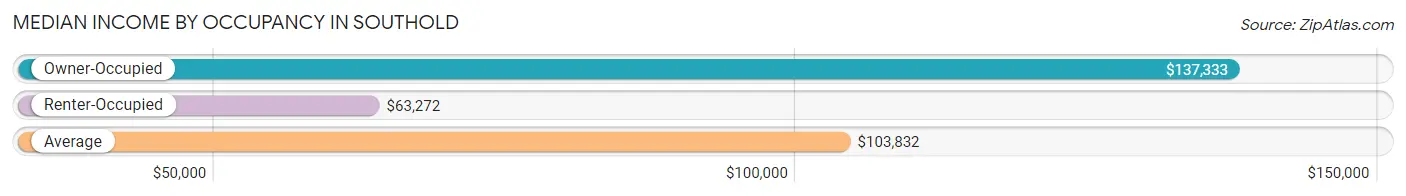
| Occupancy Type | # Households | Median Income |
| Owner-Occupied | 2,048 (79.7%) | $137,333 |
| Renter-Occupied | 521 (20.3%) | $63,272 |
| Average | 2,569 (100.0%) | $103,832 |
Occupancy by Householder Income Bracket in Southold
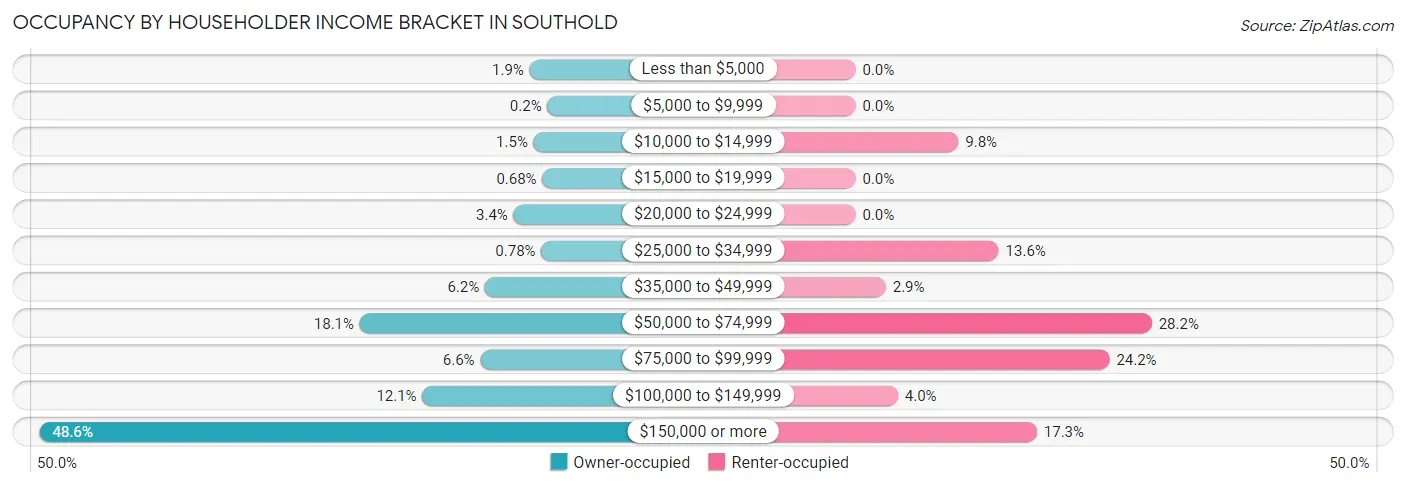
| Income Bracket | Owner-occupied | Renter-occupied |
| Less than $5,000 | 39 (1.9%) | 0 (0.0%) |
| $5,000 to $9,999 | 4 (0.2%) | 0 (0.0%) |
| $10,000 to $14,999 | 31 (1.5%) | 51 (9.8%) |
| $15,000 to $19,999 | 14 (0.7%) | 0 (0.0%) |
| $20,000 to $24,999 | 70 (3.4%) | 0 (0.0%) |
| $25,000 to $34,999 | 16 (0.8%) | 71 (13.6%) |
| $35,000 to $49,999 | 126 (6.1%) | 15 (2.9%) |
| $50,000 to $74,999 | 370 (18.1%) | 147 (28.2%) |
| $75,000 to $99,999 | 135 (6.6%) | 126 (24.2%) |
| $100,000 to $149,999 | 248 (12.1%) | 21 (4.0%) |
| $150,000 or more | 995 (48.6%) | 90 (17.3%) |
| Total | 2,048 (100.0%) | 521 (100.0%) |
Monthly Housing Cost Tiers in Southold
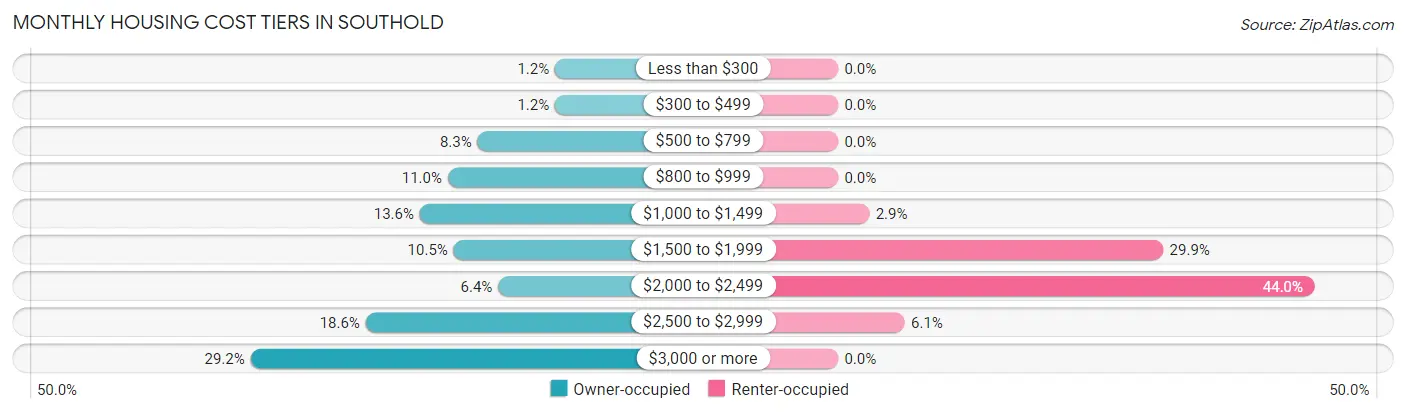
| Monthly Cost | Owner-occupied | Renter-occupied |
| Less than $300 | 24 (1.2%) | 0 (0.0%) |
| $300 to $499 | 24 (1.2%) | 0 (0.0%) |
| $500 to $799 | 170 (8.3%) | 0 (0.0%) |
| $800 to $999 | 226 (11.0%) | 0 (0.0%) |
| $1,000 to $1,499 | 279 (13.6%) | 15 (2.9%) |
| $1,500 to $1,999 | 215 (10.5%) | 156 (29.9%) |
| $2,000 to $2,499 | 131 (6.4%) | 229 (44.0%) |
| $2,500 to $2,999 | 381 (18.6%) | 32 (6.1%) |
| $3,000 or more | 598 (29.2%) | 0 (0.0%) |
| Total | 2,048 (100.0%) | 521 (100.0%) |
Physical Housing Characteristics in Southold
Housing Structures in Southold
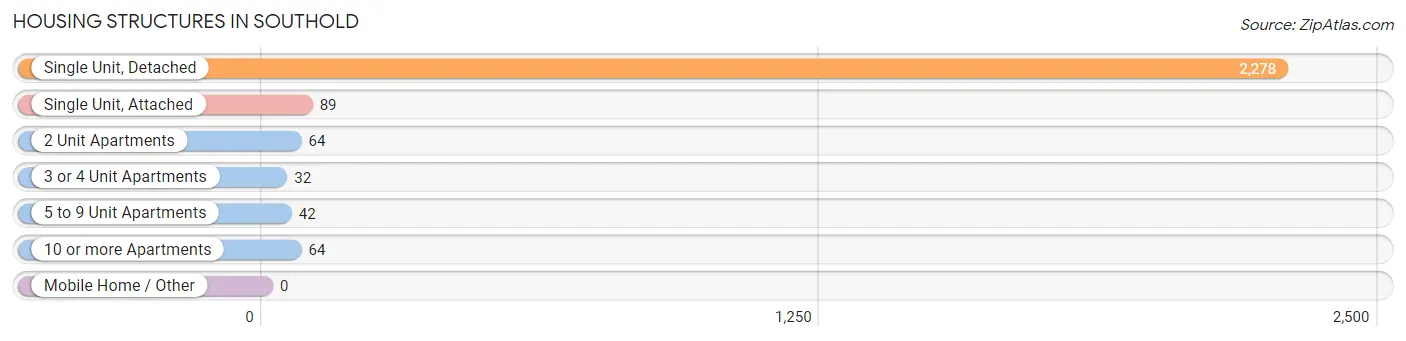
| Structure Type | # Housing Units | % Housing Units |
| Single Unit, Detached | 2,278 | 88.7% |
| Single Unit, Attached | 89 | 3.5% |
| 2 Unit Apartments | 64 | 2.5% |
| 3 or 4 Unit Apartments | 32 | 1.3% |
| 5 to 9 Unit Apartments | 42 | 1.6% |
| 10 or more Apartments | 64 | 2.5% |
| Mobile Home / Other | 0 | 0.0% |
| Total | 2,569 | 100.0% |
Housing Structures by Occupancy in Southold
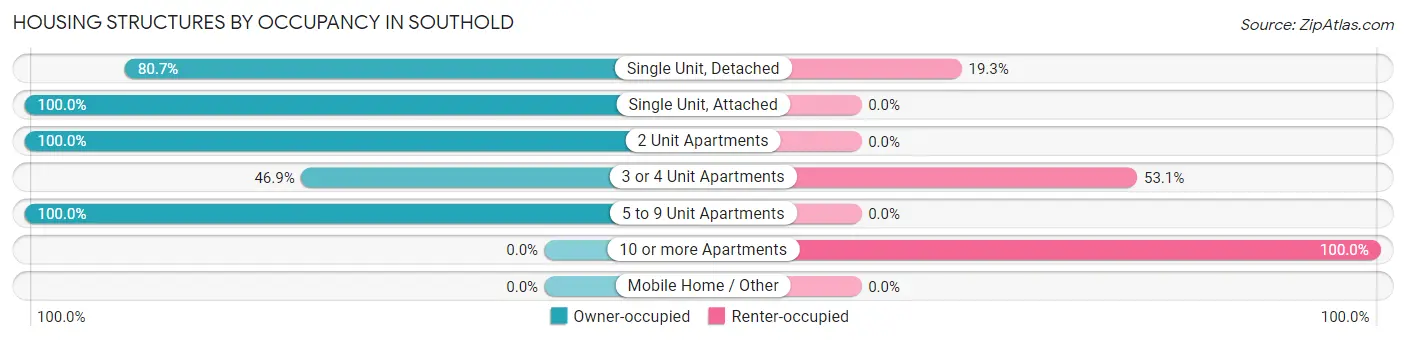
| Structure Type | Owner-occupied | Renter-occupied |
| Single Unit, Detached | 1,838 (80.7%) | 440 (19.3%) |
| Single Unit, Attached | 89 (100.0%) | 0 (0.0%) |
| 2 Unit Apartments | 64 (100.0%) | 0 (0.0%) |
| 3 or 4 Unit Apartments | 15 (46.9%) | 17 (53.1%) |
| 5 to 9 Unit Apartments | 42 (100.0%) | 0 (0.0%) |
| 10 or more Apartments | 0 (0.0%) | 64 (100.0%) |
| Mobile Home / Other | 0 (0.0%) | 0 (0.0%) |
| Total | 2,048 (79.7%) | 521 (20.3%) |
Housing Structures by Number of Rooms in Southold
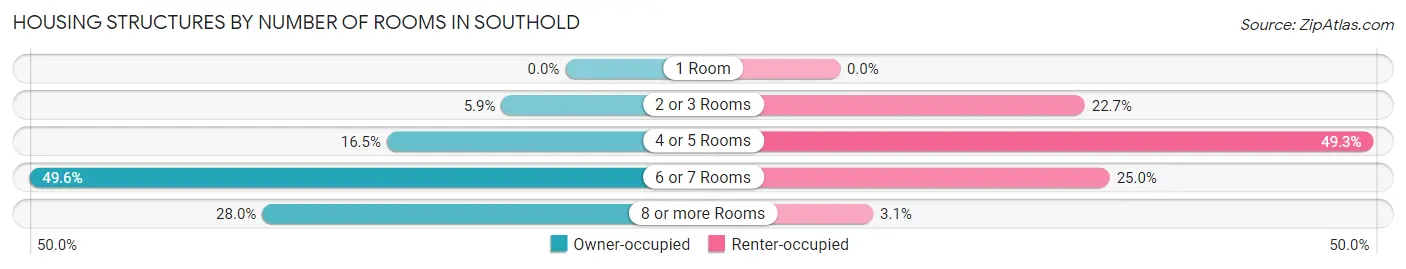
| Number of Rooms | Owner-occupied | Renter-occupied |
| 1 Room | 0 (0.0%) | 0 (0.0%) |
| 2 or 3 Rooms | 121 (5.9%) | 118 (22.7%) |
| 4 or 5 Rooms | 338 (16.5%) | 257 (49.3%) |
| 6 or 7 Rooms | 1,015 (49.6%) | 130 (24.9%) |
| 8 or more Rooms | 574 (28.0%) | 16 (3.1%) |
| Total | 2,048 (100.0%) | 521 (100.0%) |
Housing Structure by Heating Type in Southold
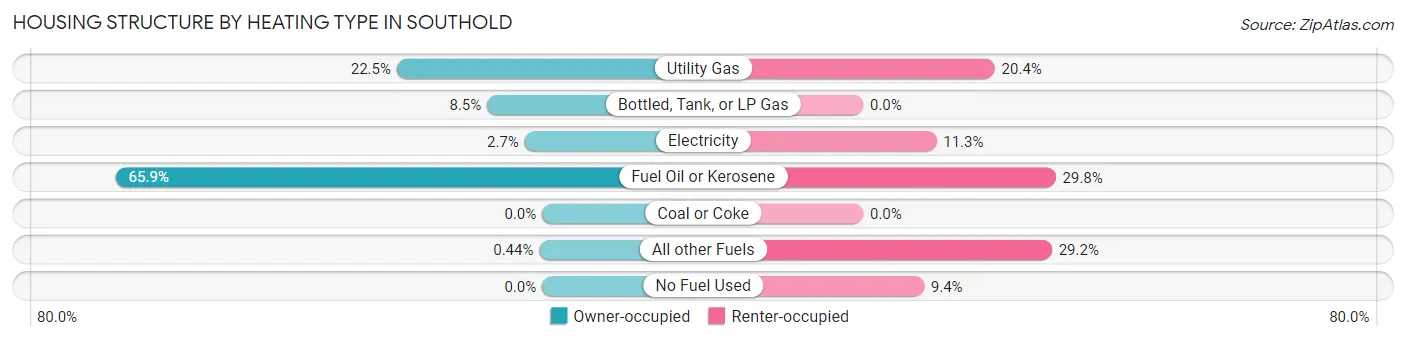
| Heating Type | Owner-occupied | Renter-occupied |
| Utility Gas | 460 (22.5%) | 106 (20.3%) |
| Bottled, Tank, or LP Gas | 174 (8.5%) | 0 (0.0%) |
| Electricity | 55 (2.7%) | 59 (11.3%) |
| Fuel Oil or Kerosene | 1,350 (65.9%) | 155 (29.7%) |
| Coal or Coke | 0 (0.0%) | 0 (0.0%) |
| All other Fuels | 9 (0.4%) | 152 (29.2%) |
| No Fuel Used | 0 (0.0%) | 49 (9.4%) |
| Total | 2,048 (100.0%) | 521 (100.0%) |
Household Vehicle Usage in Southold
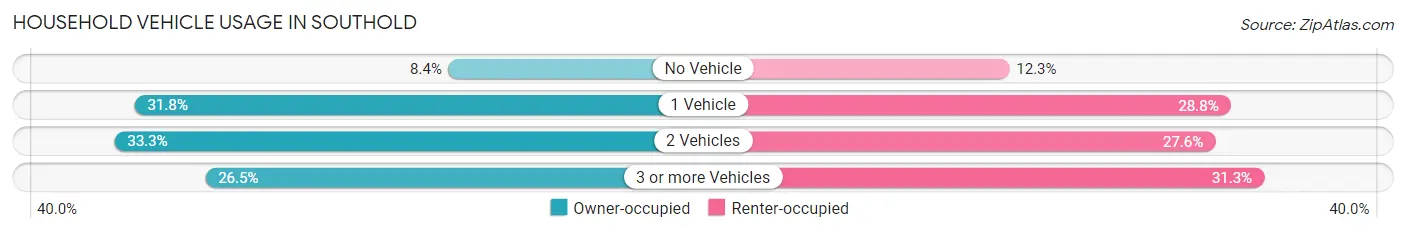
| Vehicles per Household | Owner-occupied | Renter-occupied |
| No Vehicle | 172 (8.4%) | 64 (12.3%) |
| 1 Vehicle | 651 (31.8%) | 150 (28.8%) |
| 2 Vehicles | 682 (33.3%) | 144 (27.6%) |
| 3 or more Vehicles | 543 (26.5%) | 163 (31.3%) |
| Total | 2,048 (100.0%) | 521 (100.0%) |
Real Estate & Mortgages in Southold
Real Estate and Mortgage Overview in Southold
| Characteristic | Without Mortgage | With Mortgage |
| Housing Units | 943 | 1,105 |
| Median Property Value | $667,100 | $722,900 |
| Median Household Income | $85,234 | $715 |
| Monthly Housing Costs | $1,035 | $584 |
| Real Estate Taxes | $6,438 | $0 |
Property Value by Mortgage Status in Southold
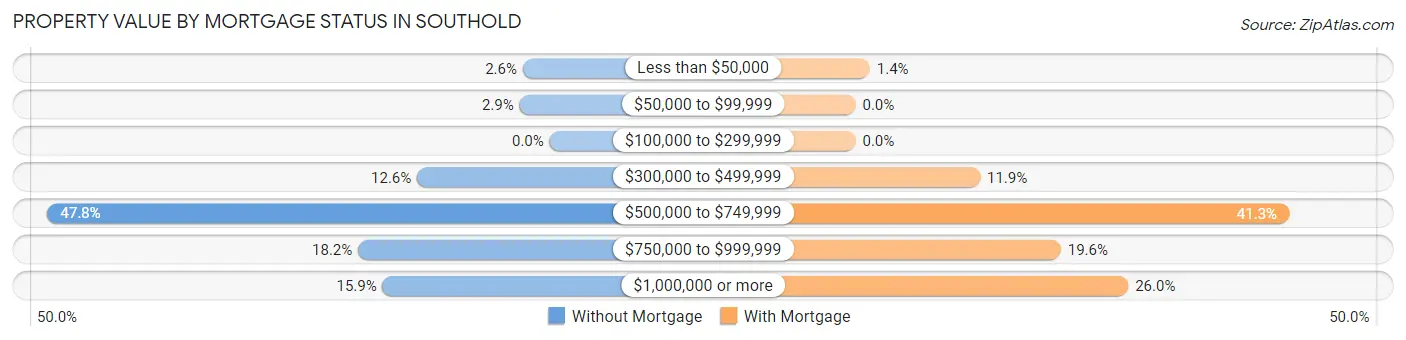
| Property Value | Without Mortgage | With Mortgage |
| Less than $50,000 | 24 (2.5%) | 15 (1.4%) |
| $50,000 to $99,999 | 27 (2.9%) | 0 (0.0%) |
| $100,000 to $299,999 | 0 (0.0%) | 0 (0.0%) |
| $300,000 to $499,999 | 119 (12.6%) | 131 (11.9%) |
| $500,000 to $749,999 | 451 (47.8%) | 456 (41.3%) |
| $750,000 to $999,999 | 172 (18.2%) | 216 (19.6%) |
| $1,000,000 or more | 150 (15.9%) | 287 (26.0%) |
| Total | 943 (100.0%) | 1,105 (100.0%) |
Household Income by Mortgage Status in Southold
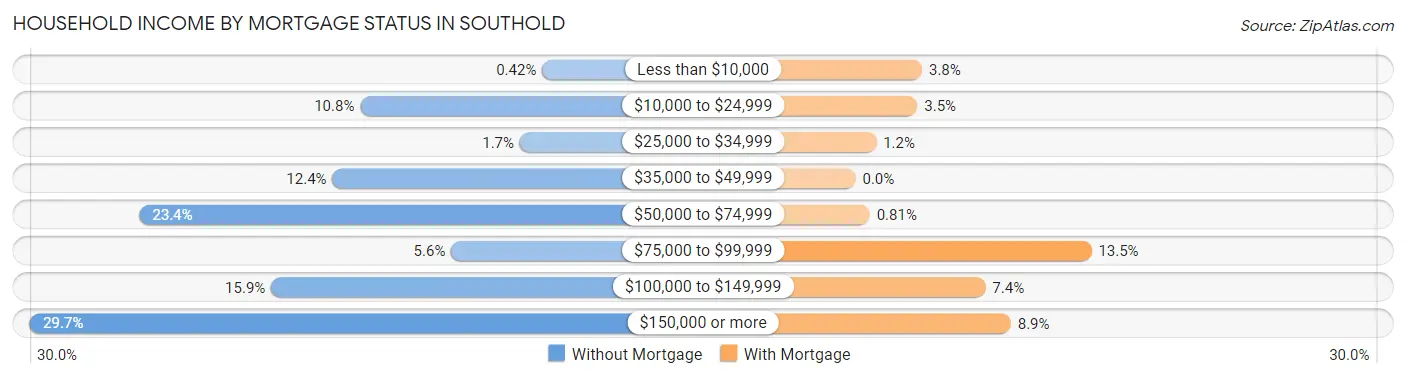
| Household Income | Without Mortgage | With Mortgage |
| Less than $10,000 | 4 (0.4%) | 42 (3.8%) |
| $10,000 to $24,999 | 102 (10.8%) | 39 (3.5%) |
| $25,000 to $34,999 | 16 (1.7%) | 13 (1.2%) |
| $35,000 to $49,999 | 117 (12.4%) | 0 (0.0%) |
| $50,000 to $74,999 | 221 (23.4%) | 9 (0.8%) |
| $75,000 to $99,999 | 53 (5.6%) | 149 (13.5%) |
| $100,000 to $149,999 | 150 (15.9%) | 82 (7.4%) |
| $150,000 or more | 280 (29.7%) | 98 (8.9%) |
| Total | 943 (100.0%) | 1,105 (100.0%) |
Property Value to Household Income Ratio in Southold
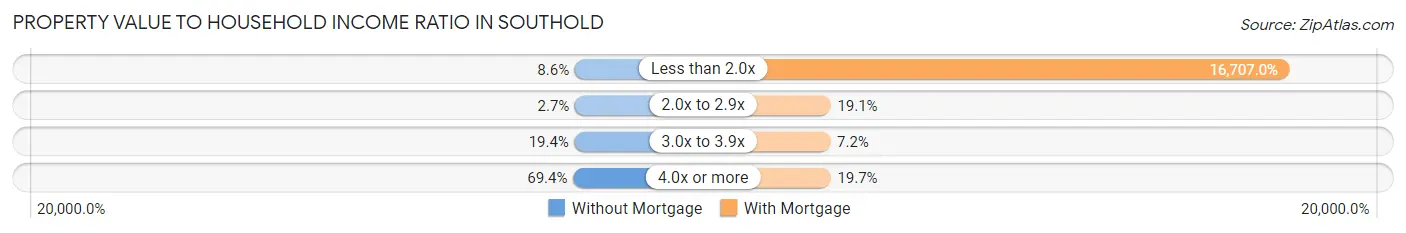
| Value-to-Income Ratio | Without Mortgage | With Mortgage |
| Less than 2.0x | 81 (8.6%) | 184,612 (16,707.0%) |
| 2.0x to 2.9x | 25 (2.6%) | 211 (19.1%) |
| 3.0x to 3.9x | 183 (19.4%) | 80 (7.2%) |
| 4.0x or more | 654 (69.4%) | 218 (19.7%) |
| Total | 943 (100.0%) | 1,105 (100.0%) |
Real Estate Taxes by Mortgage Status in Southold
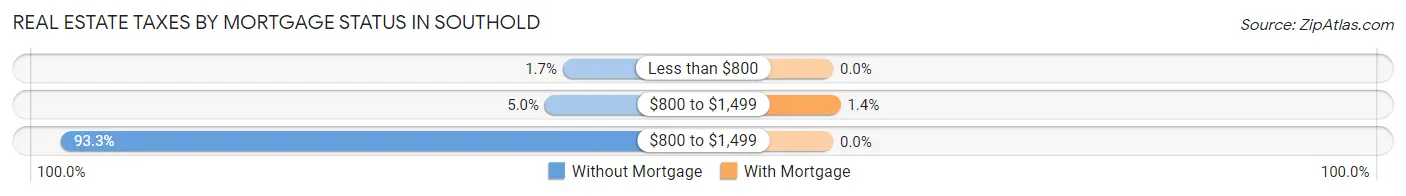
| Property Taxes | Without Mortgage | With Mortgage |
| Less than $800 | 16 (1.7%) | 0 (0.0%) |
| $800 to $1,499 | 47 (5.0%) | 15 (1.4%) |
| $800 to $1,499 | 880 (93.3%) | 0 (0.0%) |
| Total | 943 (100.0%) | 1,105 (100.0%) |
Health & Disability in Southold
Health Insurance Coverage by Age in Southold
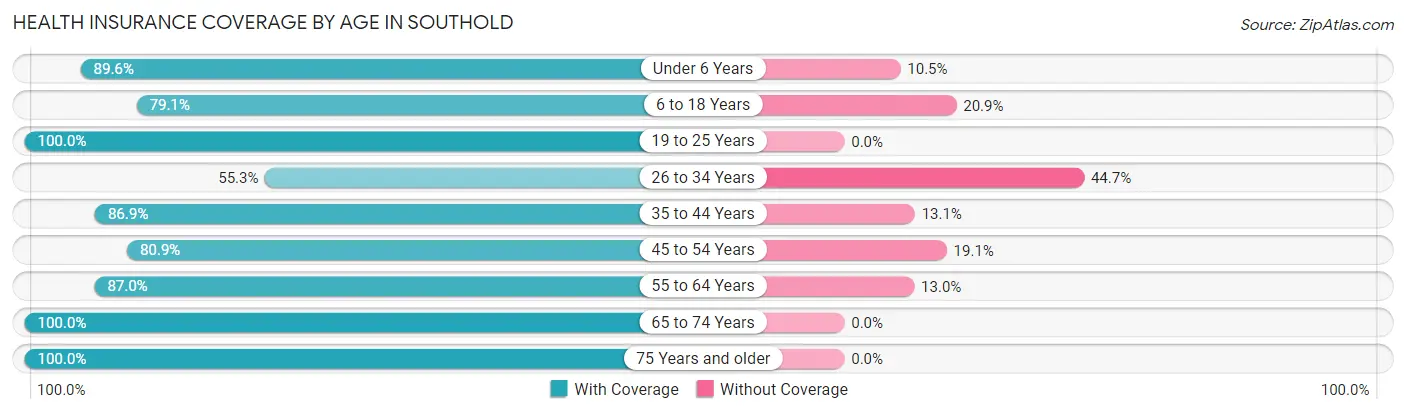
| Age Bracket | With Coverage | Without Coverage |
| Under 6 Years | 360 (89.5%) | 42 (10.4%) |
| 6 to 18 Years | 856 (79.1%) | 226 (20.9%) |
| 19 to 25 Years | 156 (100.0%) | 0 (0.0%) |
| 26 to 34 Years | 287 (55.3%) | 232 (44.7%) |
| 35 to 44 Years | 602 (86.9%) | 91 (13.1%) |
| 45 to 54 Years | 513 (80.9%) | 121 (19.1%) |
| 55 to 64 Years | 1,141 (87.0%) | 171 (13.0%) |
| 65 to 74 Years | 1,002 (100.0%) | 0 (0.0%) |
| 75 Years and older | 586 (100.0%) | 0 (0.0%) |
| Total | 5,503 (86.2%) | 883 (13.8%) |
Health Insurance Coverage by Citizenship Status in Southold
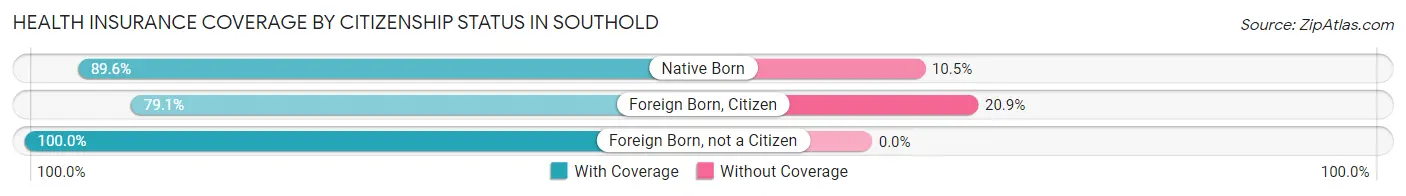
| Citizenship Status | With Coverage | Without Coverage |
| Native Born | 360 (89.5%) | 42 (10.4%) |
| Foreign Born, Citizen | 856 (79.1%) | 226 (20.9%) |
| Foreign Born, not a Citizen | 156 (100.0%) | 0 (0.0%) |
Health Insurance Coverage by Household Income in Southold
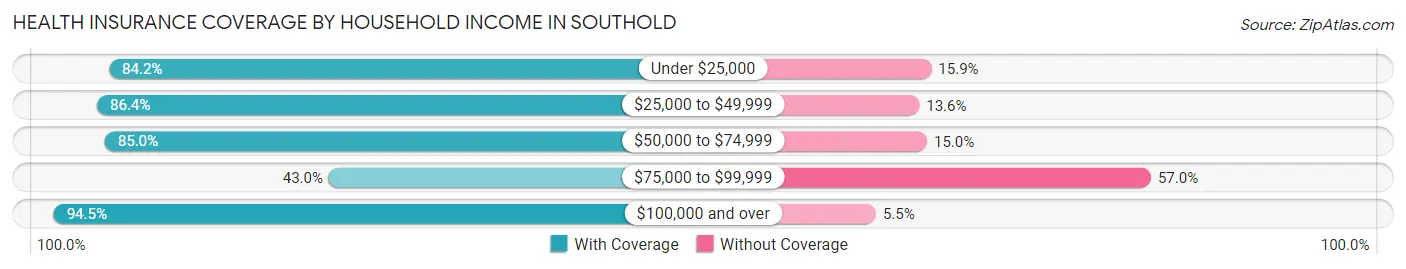
| Household Income | With Coverage | Without Coverage |
| Under $25,000 | 223 (84.2%) | 42 (15.9%) |
| $25,000 to $49,999 | 445 (86.4%) | 70 (13.6%) |
| $50,000 to $74,999 | 808 (85.0%) | 143 (15.0%) |
| $75,000 to $99,999 | 314 (43.0%) | 416 (57.0%) |
| $100,000 and over | 3,665 (94.5%) | 212 (5.5%) |
Public vs Private Health Insurance Coverage by Age in Southold
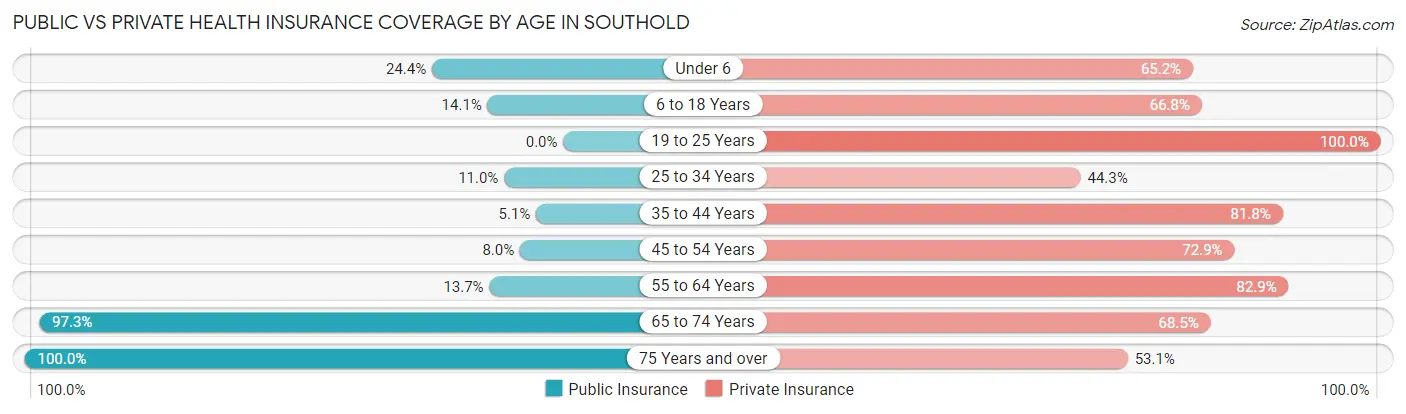
| Age Bracket | Public Insurance | Private Insurance |
| Under 6 | 98 (24.4%) | 262 (65.2%) |
| 6 to 18 Years | 152 (14.1%) | 723 (66.8%) |
| 19 to 25 Years | 0 (0.0%) | 156 (100.0%) |
| 25 to 34 Years | 57 (11.0%) | 230 (44.3%) |
| 35 to 44 Years | 35 (5.1%) | 567 (81.8%) |
| 45 to 54 Years | 51 (8.0%) | 462 (72.9%) |
| 55 to 64 Years | 180 (13.7%) | 1,088 (82.9%) |
| 65 to 74 Years | 975 (97.3%) | 686 (68.5%) |
| 75 Years and over | 586 (100.0%) | 311 (53.1%) |
| Total | 2,134 (33.4%) | 4,485 (70.2%) |
Disability Status by Sex by Age in Southold
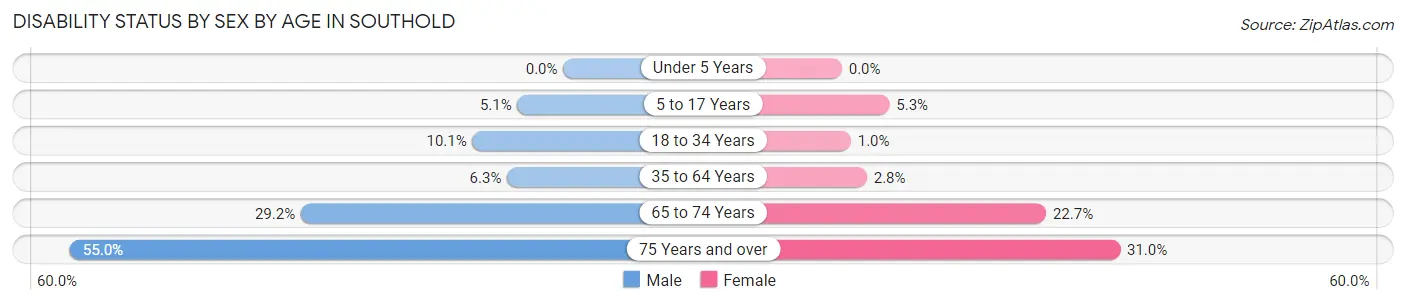
| Age Bracket | Male | Female |
| Under 5 Years | 0 (0.0%) | 0 (0.0%) |
| 5 to 17 Years | 33 (5.1%) | 25 (5.3%) |
| 18 to 34 Years | 38 (10.1%) | 3 (1.0%) |
| 35 to 64 Years | 84 (6.2%) | 36 (2.8%) |
| 65 to 74 Years | 154 (29.2%) | 108 (22.7%) |
| 75 Years and over | 150 (54.9%) | 97 (31.0%) |
Disability Class by Sex by Age in Southold
Disability Class: Hearing Difficulty
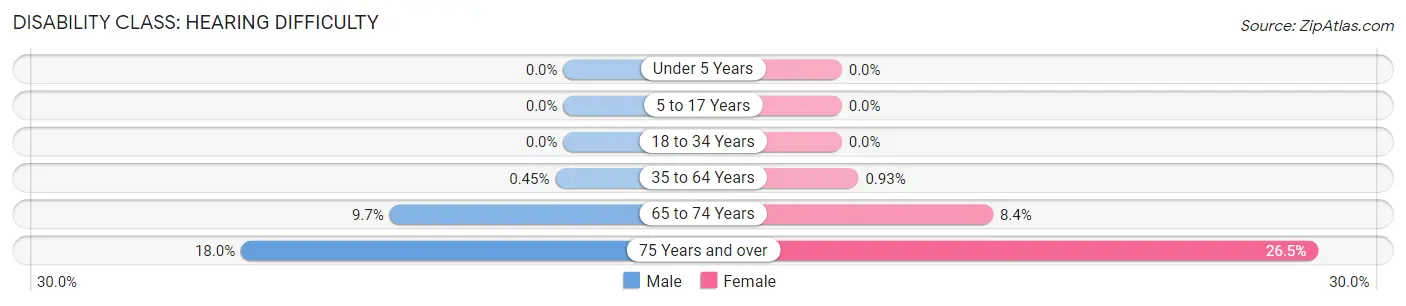
| Age Bracket | Male | Female |
| Under 5 Years | 0 (0.0%) | 0 (0.0%) |
| 5 to 17 Years | 0 (0.0%) | 0 (0.0%) |
| 18 to 34 Years | 0 (0.0%) | 0 (0.0%) |
| 35 to 64 Years | 6 (0.4%) | 12 (0.9%) |
| 65 to 74 Years | 51 (9.7%) | 40 (8.4%) |
| 75 Years and over | 49 (17.9%) | 83 (26.5%) |
Disability Class: Vision Difficulty
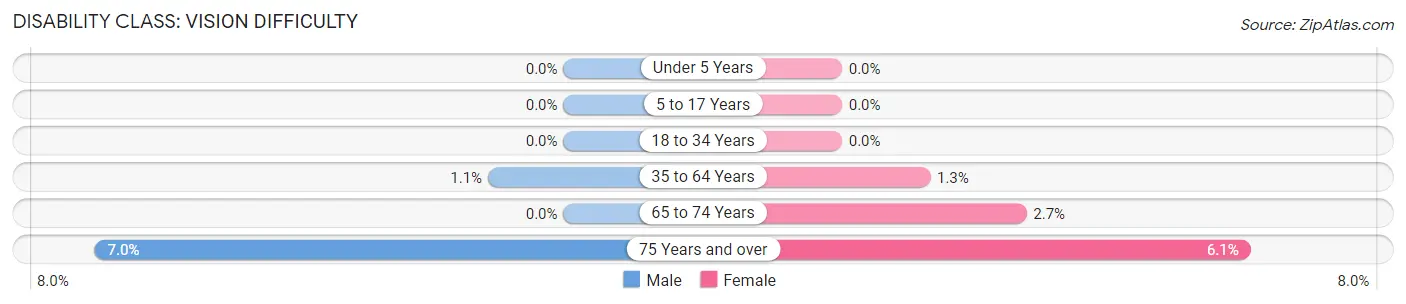
| Age Bracket | Male | Female |
| Under 5 Years | 0 (0.0%) | 0 (0.0%) |
| 5 to 17 Years | 0 (0.0%) | 0 (0.0%) |
| 18 to 34 Years | 0 (0.0%) | 0 (0.0%) |
| 35 to 64 Years | 15 (1.1%) | 17 (1.3%) |
| 65 to 74 Years | 0 (0.0%) | 13 (2.7%) |
| 75 Years and over | 19 (7.0%) | 19 (6.1%) |
Disability Class: Cognitive Difficulty
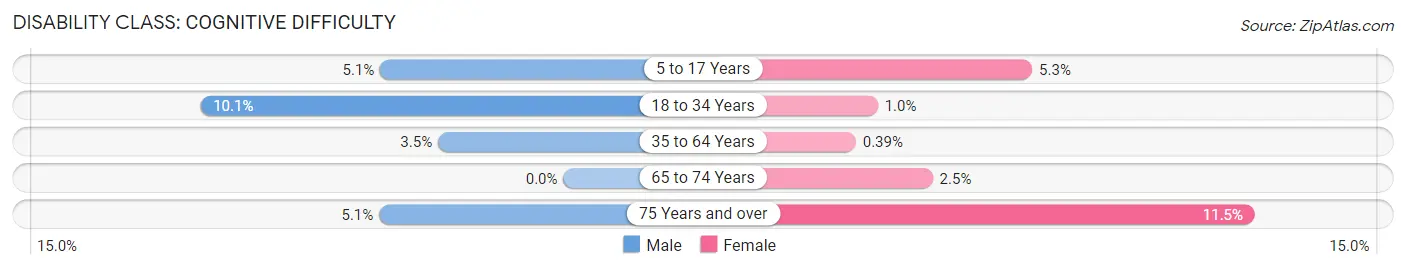
| Age Bracket | Male | Female |
| 5 to 17 Years | 33 (5.1%) | 25 (5.3%) |
| 18 to 34 Years | 38 (10.1%) | 3 (1.0%) |
| 35 to 64 Years | 47 (3.5%) | 5 (0.4%) |
| 65 to 74 Years | 0 (0.0%) | 12 (2.5%) |
| 75 Years and over | 14 (5.1%) | 36 (11.5%) |
Disability Class: Ambulatory Difficulty
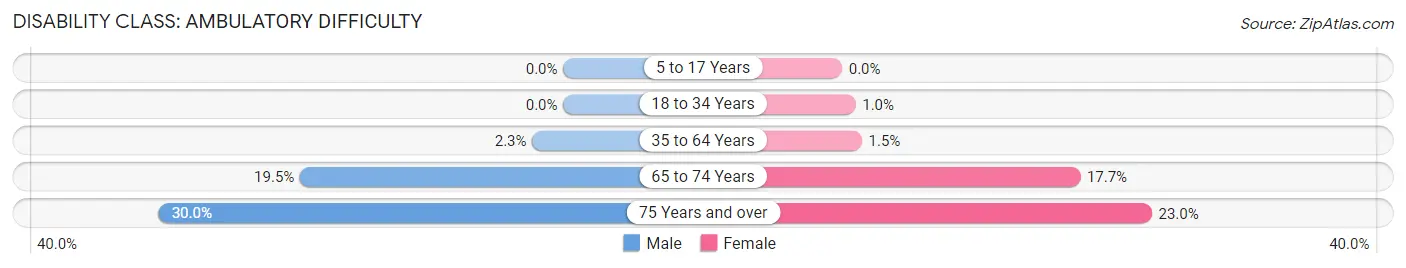
| Age Bracket | Male | Female |
| 5 to 17 Years | 0 (0.0%) | 0 (0.0%) |
| 18 to 34 Years | 0 (0.0%) | 3 (1.0%) |
| 35 to 64 Years | 31 (2.3%) | 19 (1.5%) |
| 65 to 74 Years | 103 (19.5%) | 84 (17.7%) |
| 75 Years and over | 82 (30.0%) | 72 (23.0%) |
Disability Class: Self-Care Difficulty

| Age Bracket | Male | Female |
| 5 to 17 Years | 0 (0.0%) | 0 (0.0%) |
| 18 to 34 Years | 5 (1.3%) | 3 (1.0%) |
| 35 to 64 Years | 0 (0.0%) | 31 (2.4%) |
| 65 to 74 Years | 90 (17.1%) | 25 (5.3%) |
| 75 Years and over | 48 (17.6%) | 26 (8.3%) |
Technology Access in Southold
Computing Device Access in Southold
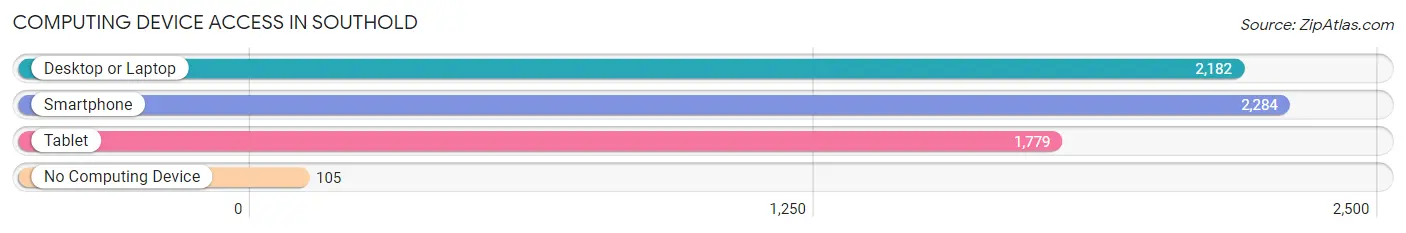
| Device Type | # Households | % Households |
| Desktop or Laptop | 2,182 | 84.9% |
| Smartphone | 2,284 | 88.9% |
| Tablet | 1,779 | 69.3% |
| No Computing Device | 105 | 4.1% |
| Total | 2,569 | 100.0% |
Internet Access in Southold
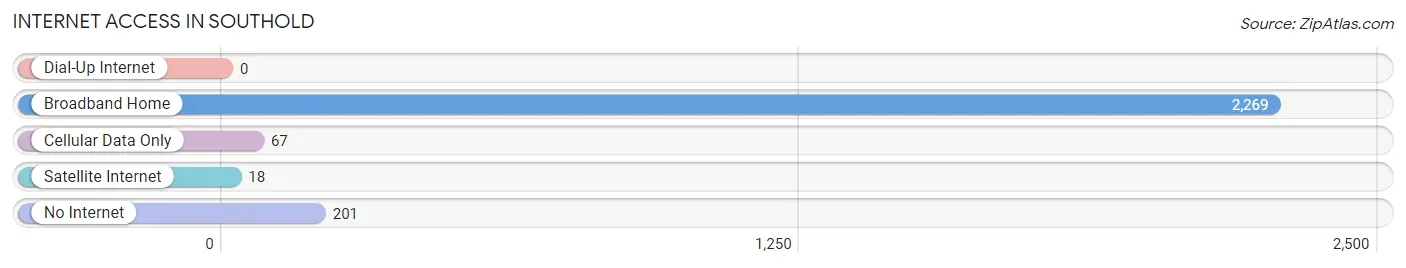
| Internet Type | # Households | % Households |
| Dial-Up Internet | 0 | 0.0% |
| Broadband Home | 2,269 | 88.3% |
| Cellular Data Only | 67 | 2.6% |
| Satellite Internet | 18 | 0.7% |
| No Internet | 201 | 7.8% |
| Total | 2,569 | 100.0% |
Southold Summary
History
The Town of Southold is located in Suffolk County, New York, on the eastern end of Long Island. It is the oldest English settlement in the state, having been founded in 1640 by a group of Puritans from New Haven, Connecticut. The town was named after Southwold, England, the hometown of the Puritans’ leader, Reverend John Youngs.
The town was initially a farming community, with the main crops being corn, wheat, and potatoes. In the late 19th century, the town began to develop a fishing industry, which is still a major part of the local economy today.
In the early 20th century, Southold became a popular summer destination for wealthy New Yorkers, who built large estates in the area. This influx of wealth helped to spur the development of the town, and it remains a popular destination for tourists today.
Geography
Southold is located on the eastern end of Long Island, approximately 70 miles east of New York City. It is bordered by the towns of Riverhead to the west, Shelter Island to the east, and Peconic Bay to the south. The town is divided into two parts, the North Fork and the South Fork, which are separated by the Peconic Bay.
The North Fork is the more rural part of the town, with rolling hills, farmland, and vineyards. The South Fork is more developed, with a number of small towns and villages, as well as a number of beaches and marinas.
Economy
The economy of Southold is largely based on tourism and agriculture. The town is home to a number of wineries, which attract visitors from all over the world. The town also has a thriving fishing industry, with a number of commercial fishing boats operating out of the local marinas.
In addition, the town is home to a number of small businesses, including restaurants, shops, and galleries. The town also has a number of small manufacturing companies, which produce a variety of products, including furniture, clothing, and electronics.
Demographics
As of the 2010 census, the population of Southold was 21,403. The town has a median household income of $76,817, and a median age of 46.7 years. The town is predominantly white (90.2%), with a small Hispanic population (4.2%) and a small African American population (2.2%).
The town is also home to a large number of seasonal residents, who come to the area to enjoy the beaches and other attractions. The town has a number of churches, including the Southold United Methodist Church, the Southold Presbyterian Church, and the Southold Congregational Church.
Conclusion
Southold is a small town located on the eastern end of Long Island, New York. It is the oldest English settlement in the state, and has a long history of farming and fishing. Today, the town is a popular tourist destination, with a thriving economy based on agriculture, fishing, and tourism. The town has a diverse population, with a median age of 46.7 years and a median household income of $76,817. Southold is a great place to visit, with its beautiful beaches, wineries, and other attractions.
Common Questions
What is Per Capita Income in Southold?
Per Capita income in Southold is $72,072.
What is the Median Family Income in Southold?
Median Family Income in Southold is $163,661.
What is the Median Household income in Southold?
Median Household Income in Southold is $103,832.
What is Income or Wage Gap in Southold?
Income or Wage Gap in Southold is 19.3%.
Women in Southold earn 80.7 cents for every dollar earned by a man.
What is Inequality or Gini Index in Southold?
Inequality or Gini Index in Southold is 0.52.
What is the Total Population of Southold?
Total Population of Southold is 6,386.
What is the Total Male Population of Southold?
Total Male Population of Southold is 3,312.
What is the Total Female Population of Southold?
Total Female Population of Southold is 3,074.
What is the Ratio of Males per 100 Females in Southold?
There are 107.74 Males per 100 Females in Southold.
What is the Ratio of Females per 100 Males in Southold?
There are 92.81 Females per 100 Males in Southold.
What is the Median Population Age in Southold?
Median Population Age in Southold is 50.6 Years.
What is the Average Family Size in Southold
Average Family Size in Southold is 2.9 People.
What is the Average Household Size in Southold
Average Household Size in Southold is 2.5 People.
How Large is the Labor Force in Southold?
There are 2,872 People in the Labor Forcein in Southold.
What is the Percentage of People in the Labor Force in Southold?
57.8% of People are in the Labor Force in Southold.
What is the Unemployment Rate in Southold?
Unemployment Rate in Southold is 8.5%.