St Michaels, MD Map & Demographics
St Michaels Map
St Michaels Overview
$55,877
PER CAPITA INCOME
$74,321
AVG FAMILY INCOME
$73,415
AVG HOUSEHOLD INCOME
24.7%
WAGE / INCOME GAP [ % ]
75.3¢/ $1
WAGE / INCOME GAP [ $ ]
0.53
INEQUALITY / GINI INDEX
1,523
TOTAL POPULATION
629
MALE POPULATION
894
FEMALE POPULATION
70.36
MALES / 100 FEMALES
142.13
FEMALES / 100 MALES
49.8
MEDIAN AGE
2.6
AVG FAMILY SIZE
2.3
AVG HOUSEHOLD SIZE
686
LABOR FORCE [ PEOPLE ]
53.1%
PERCENT IN LABOR FORCE
7.6%
UNEMPLOYMENT RATE
St Michaels Area Codes
Income in St Michaels
Income Overview in St Michaels
Per Capita Income in St Michaels is $55,877, while median incomes of families and households are $74,321 and $73,415 respectively.
| Characteristic | Number | Measure |
| Per Capita Income | 1,523 | $55,877 |
| Median Family Income | 483 | $74,321 |
| Mean Family Income | 483 | $141,067 |
| Median Household Income | 667 | $73,415 |
| Mean Household Income | 667 | $127,272 |
| Income Deficit | 483 | $0 |
| Wage / Income Gap (%) | 1,523 | 24.70% |
| Wage / Income Gap ($) | 1,523 | 75.30¢ per $1 |
| Gini / Inequality Index | 1,523 | 0.53 |
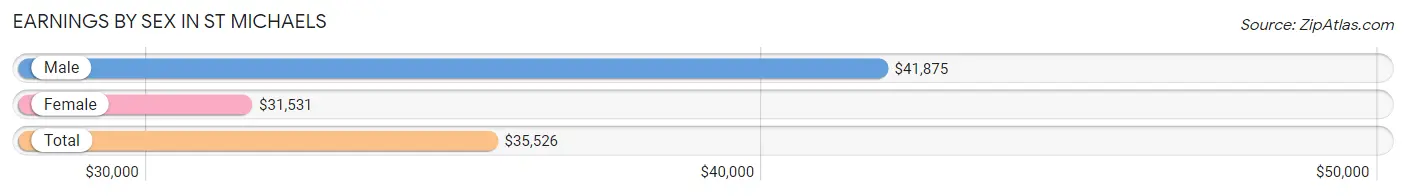
Earnings by Sex in St Michaels
Average Earnings in St Michaels are $35,526, $41,875 for men and $31,531 for women, a difference of 24.7%.
| Sex | Number | Average Earnings |
| Male | 345 (48.9%) | $41,875 |
| Female | 361 (51.1%) | $31,531 |
| Total | 706 (100.0%) | $35,526 |
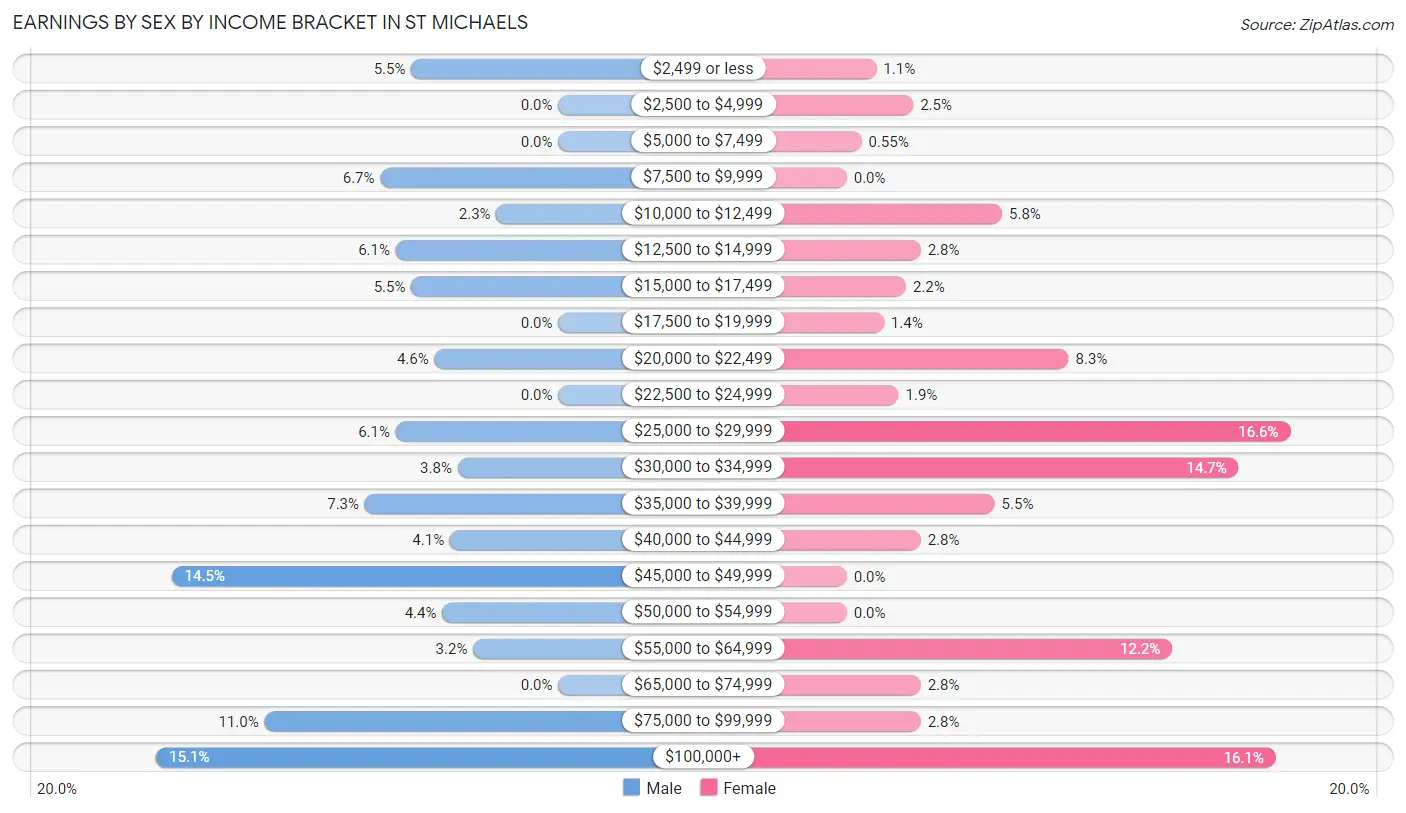
Earnings by Sex by Income Bracket in St Michaels
The most common earnings brackets in St Michaels are $100,000+ for men (52 | 15.1%) and $25,000 to $29,999 for women (60 | 16.6%).
| Income | Male | Female |
| $2,499 or less | 19 (5.5%) | 4 (1.1%) |
| $2,500 to $4,999 | 0 (0.0%) | 9 (2.5%) |
| $5,000 to $7,499 | 0 (0.0%) | 2 (0.5%) |
| $7,500 to $9,999 | 23 (6.7%) | 0 (0.0%) |
| $10,000 to $12,499 | 8 (2.3%) | 21 (5.8%) |
| $12,500 to $14,999 | 21 (6.1%) | 10 (2.8%) |
| $15,000 to $17,499 | 19 (5.5%) | 8 (2.2%) |
| $17,500 to $19,999 | 0 (0.0%) | 5 (1.4%) |
| $20,000 to $22,499 | 16 (4.6%) | 30 (8.3%) |
| $22,500 to $24,999 | 0 (0.0%) | 7 (1.9%) |
| $25,000 to $29,999 | 21 (6.1%) | 60 (16.6%) |
| $30,000 to $34,999 | 13 (3.8%) | 53 (14.7%) |
| $35,000 to $39,999 | 25 (7.2%) | 20 (5.5%) |
| $40,000 to $44,999 | 14 (4.1%) | 10 (2.8%) |
| $45,000 to $49,999 | 50 (14.5%) | 0 (0.0%) |
| $50,000 to $54,999 | 15 (4.3%) | 0 (0.0%) |
| $55,000 to $64,999 | 11 (3.2%) | 44 (12.2%) |
| $65,000 to $74,999 | 0 (0.0%) | 10 (2.8%) |
| $75,000 to $99,999 | 38 (11.0%) | 10 (2.8%) |
| $100,000+ | 52 (15.1%) | 58 (16.1%) |
| Total | 345 (100.0%) | 361 (100.0%) |
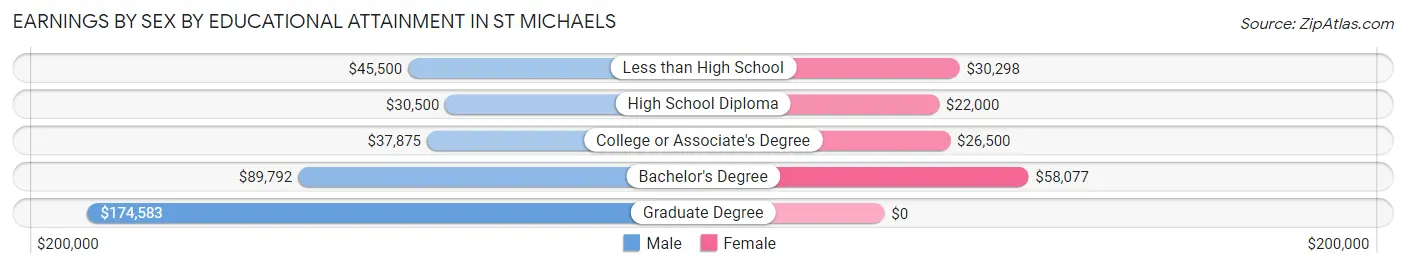
Earnings by Sex by Educational Attainment in St Michaels
Average earnings in St Michaels are $46,050 for men and $31,344 for women, a difference of 31.9%. Men with an educational attainment of graduate degree enjoy the highest average annual earnings of $174,583, while those with high school diploma education earn the least with $30,500. Women with an educational attainment of bachelor's degree earn the most with the average annual earnings of $58,077, while those with high school diploma education have the smallest earnings of $22,000.
| Educational Attainment | Male Income | Female Income |
| Less than High School | $45,500 | $30,298 |
| High School Diploma | $30,500 | $22,000 |
| College or Associate's Degree | $37,875 | $26,500 |
| Bachelor's Degree | $89,792 | $58,077 |
| Graduate Degree | $174,583 | $0 |
| Total | $46,050 | $31,344 |
Family Income in St Michaels
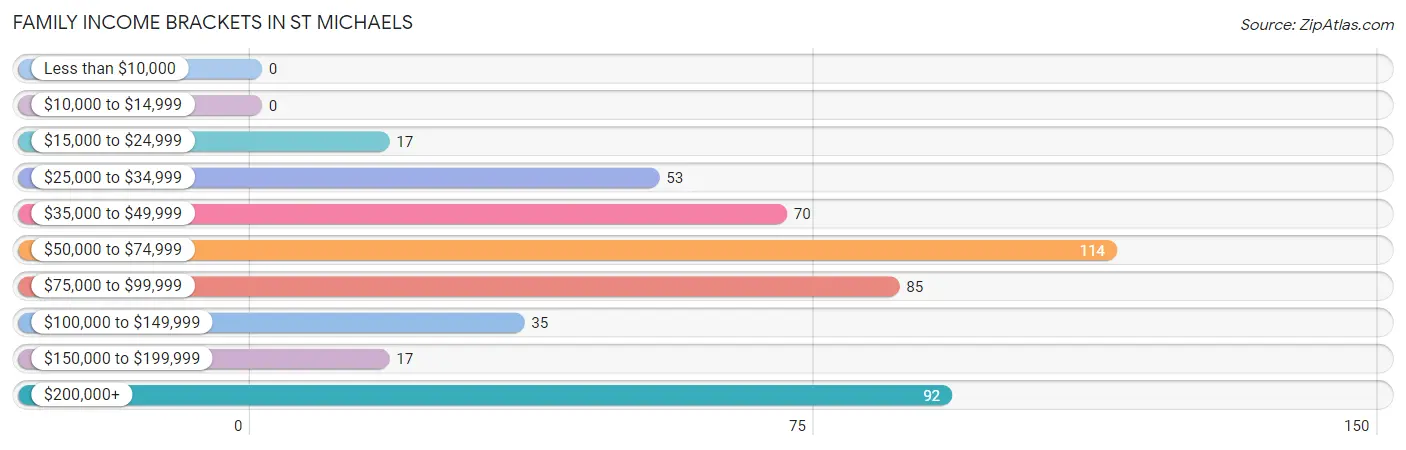
Family Income Brackets in St Michaels
According to the St Michaels family income data, there are 114 families falling into the $50,000 to $74,999 income range, which is the most common income bracket and makes up 23.6% of all families.
| Income Bracket | # Families | % Families |
| Less than $10,000 | 0 | 0.0% |
| $10,000 to $14,999 | 0 | 0.0% |
| $15,000 to $24,999 | 17 | 3.5% |
| $25,000 to $34,999 | 53 | 11.0% |
| $35,000 to $49,999 | 70 | 14.5% |
| $50,000 to $74,999 | 114 | 23.6% |
| $75,000 to $99,999 | 85 | 17.6% |
| $100,000 to $149,999 | 35 | 7.2% |
| $150,000 to $199,999 | 17 | 3.5% |
| $200,000+ | 92 | 19.0% |
Family Income by Famaliy Size in St Michaels
2-person families (259 | 53.6%) account for the highest median family income in St Michaels with $104,375 per family, while 2-person families (259 | 53.6%) have the highest median income of $52,188 per family member.
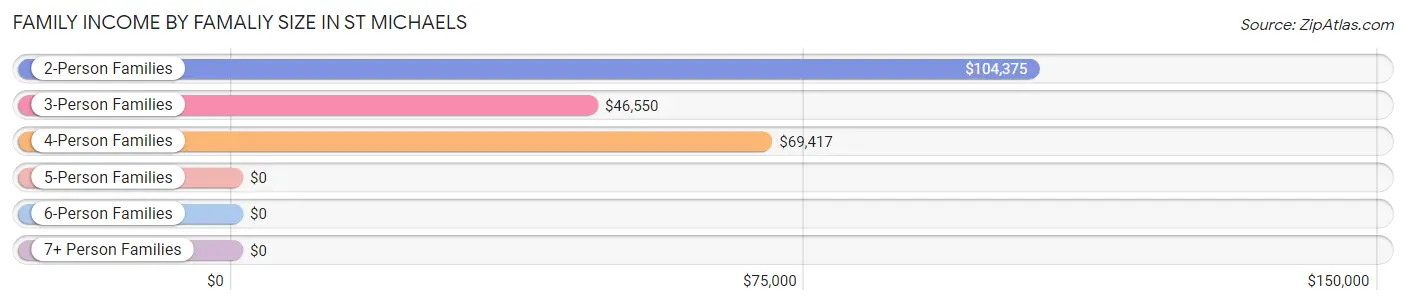
| Income Bracket | # Families | Median Income |
| 2-Person Families | 259 (53.6%) | $104,375 |
| 3-Person Families | 158 (32.7%) | $46,550 |
| 4-Person Families | 43 (8.9%) | $69,417 |
| 5-Person Families | 15 (3.1%) | $0 |
| 6-Person Families | 0 (0.0%) | $0 |
| 7+ Person Families | 8 (1.7%) | $0 |
| Total | 483 (100.0%) | $74,321 |
Family Income by Number of Earners in St Michaels
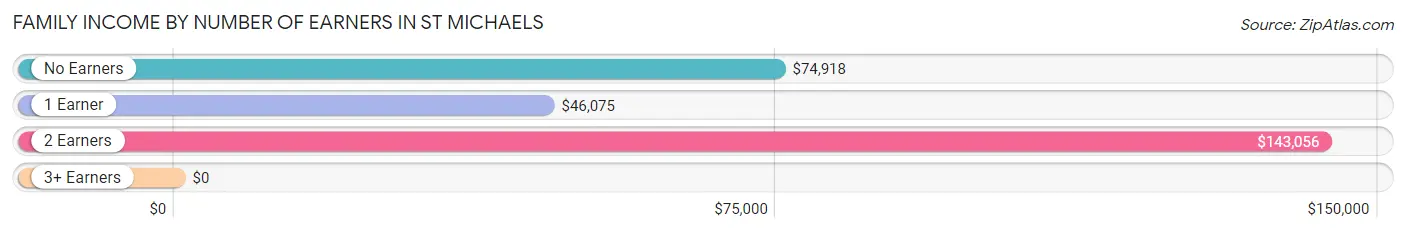
| Number of Earners | # Families | Median Income |
| No Earners | 131 (27.1%) | $74,918 |
| 1 Earner | 207 (42.9%) | $46,075 |
| 2 Earners | 130 (26.9%) | $143,056 |
| 3+ Earners | 15 (3.1%) | $0 |
| Total | 483 (100.0%) | $74,321 |
Household Income in St Michaels
Household Income Brackets in St Michaels
With 192 households falling in the category, the $50,000 to $74,999 income range is the most frequent in St Michaels, accounting for 28.8% of all households. In contrast, only 6 households (0.9%) fall into the $10,000 to $14,999 income bracket, making it the least populous group.
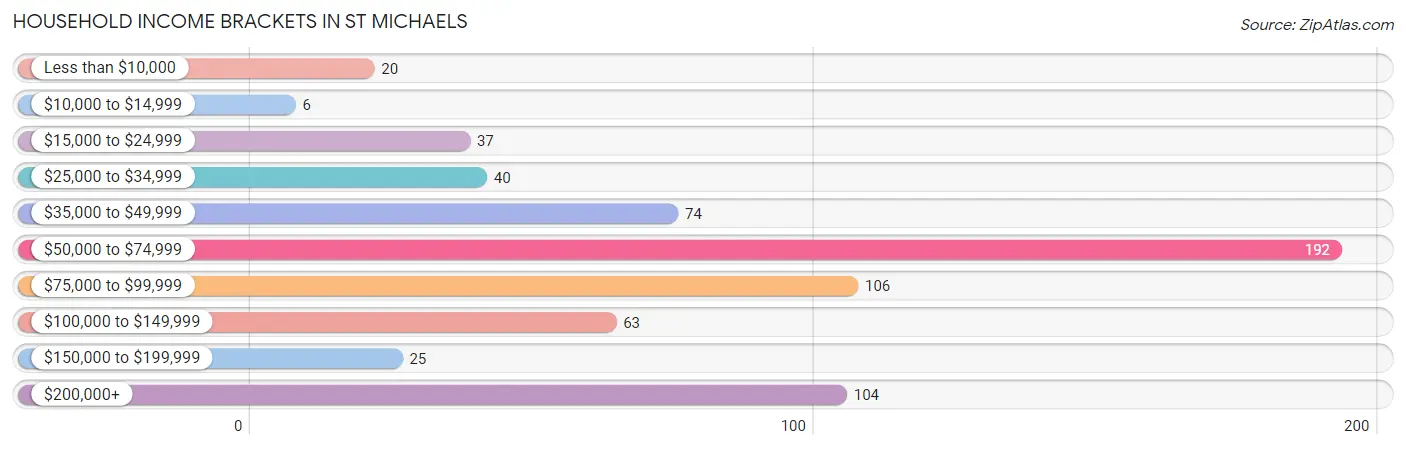
| Income Bracket | # Households | % Households |
| Less than $10,000 | 20 | 3.0% |
| $10,000 to $14,999 | 6 | 0.9% |
| $15,000 to $24,999 | 37 | 5.5% |
| $25,000 to $34,999 | 40 | 6.0% |
| $35,000 to $49,999 | 74 | 11.1% |
| $50,000 to $74,999 | 192 | 28.8% |
| $75,000 to $99,999 | 106 | 15.9% |
| $100,000 to $149,999 | 63 | 9.4% |
| $150,000 to $199,999 | 25 | 3.7% |
| $200,000+ | 104 | 15.6% |
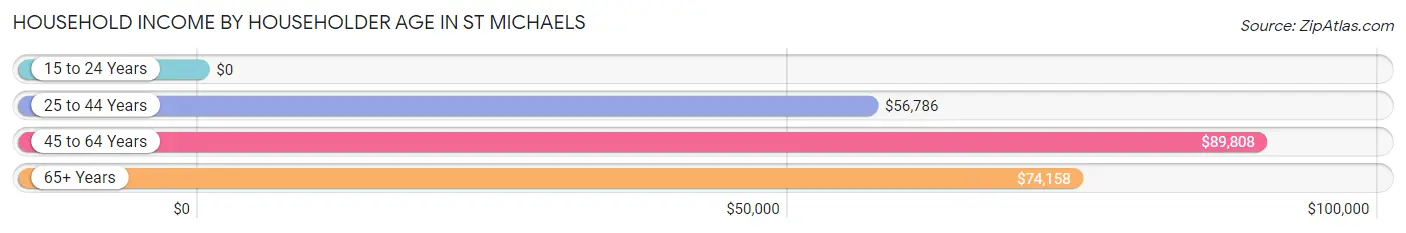
Household Income by Householder Age in St Michaels
The median household income in St Michaels is $73,415, with the highest median household income of $89,808 found in the 45 to 64 years age bracket for the primary householder. A total of 260 households (39.0%) fall into this category.
| Income Bracket | # Households | Median Income |
| 15 to 24 Years | 0 (0.0%) | $0 |
| 25 to 44 Years | 130 (19.5%) | $56,786 |
| 45 to 64 Years | 260 (39.0%) | $89,808 |
| 65+ Years | 277 (41.5%) | $74,158 |
| Total | 667 (100.0%) | $73,415 |
Poverty in St Michaels
Income Below Poverty by Sex and Age in St Michaels
With 1.4% poverty level for males and 6.8% for females among the residents of St Michaels, 35 to 44 year old males and 15 year old females are the most vulnerable to poverty, with 4 males (8.7%) and 9 females (100.0%) in their respective age groups living below the poverty level.
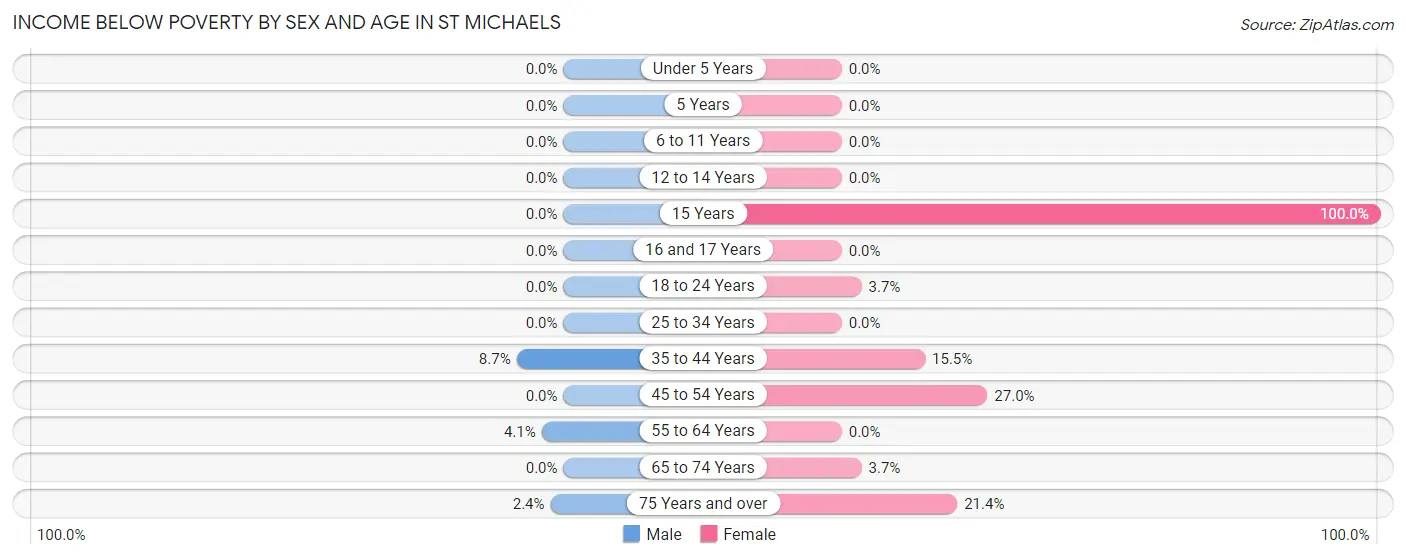
| Age Bracket | Male | Female |
| Under 5 Years | 0 (0.0%) | 0 (0.0%) |
| 5 Years | 0 (0.0%) | 0 (0.0%) |
| 6 to 11 Years | 0 (0.0%) | 0 (0.0%) |
| 12 to 14 Years | 0 (0.0%) | 0 (0.0%) |
| 15 Years | 0 (0.0%) | 9 (100.0%) |
| 16 and 17 Years | 0 (0.0%) | 0 (0.0%) |
| 18 to 24 Years | 0 (0.0%) | 6 (3.7%) |
| 25 to 34 Years | 0 (0.0%) | 0 (0.0%) |
| 35 to 44 Years | 4 (8.7%) | 15 (15.5%) |
| 45 to 54 Years | 0 (0.0%) | 10 (27.0%) |
| 55 to 64 Years | 3 (4.1%) | 0 (0.0%) |
| 65 to 74 Years | 0 (0.0%) | 6 (3.7%) |
| 75 Years and over | 2 (2.4%) | 15 (21.4%) |
| Total | 9 (1.4%) | 61 (6.8%) |
Income Above Poverty by Sex and Age in St Michaels
According to the poverty statistics in St Michaels, males aged under 5 years and females aged under 5 years are the age groups that are most secure financially, with 100.0% of males and 100.0% of females in these age groups living above the poverty line.
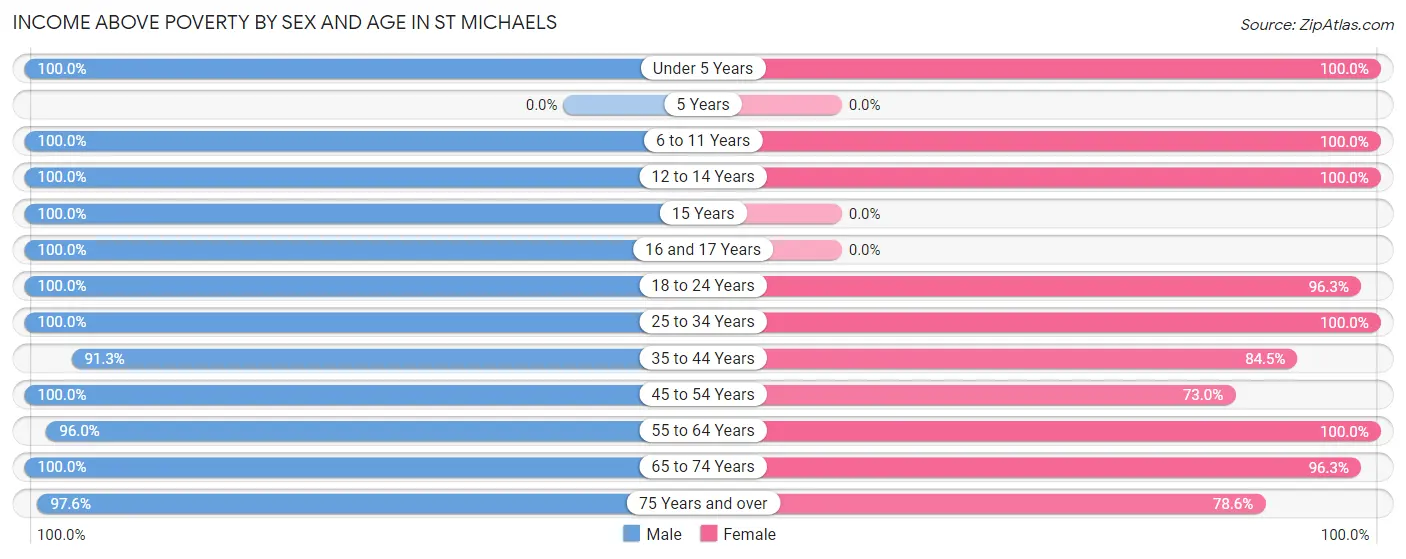
| Age Bracket | Male | Female |
| Under 5 Years | 3 (100.0%) | 25 (100.0%) |
| 5 Years | 0 (0.0%) | 0 (0.0%) |
| 6 to 11 Years | 33 (100.0%) | 66 (100.0%) |
| 12 to 14 Years | 32 (100.0%) | 53 (100.0%) |
| 15 Years | 11 (100.0%) | 0 (0.0%) |
| 16 and 17 Years | 36 (100.0%) | 0 (0.0%) |
| 18 to 24 Years | 28 (100.0%) | 157 (96.3%) |
| 25 to 34 Years | 32 (100.0%) | 53 (100.0%) |
| 35 to 44 Years | 42 (91.3%) | 82 (84.5%) |
| 45 to 54 Years | 111 (100.0%) | 27 (73.0%) |
| 55 to 64 Years | 71 (96.0%) | 158 (100.0%) |
| 65 to 74 Years | 140 (100.0%) | 157 (96.3%) |
| 75 Years and over | 81 (97.6%) | 55 (78.6%) |
| Total | 620 (98.6%) | 833 (93.2%) |
Income Below Poverty Among Married-Couple Families in St Michaels
The poverty statistics for married-couple families in St Michaels show that 0.6% or 2 of the total 331 families live below the poverty line. Families with no children have the highest poverty rate of 0.7%, comprising of 2 families. On the other hand, families with 1 or 2 children have the lowest poverty rate of 0.0%, which includes 0 families.
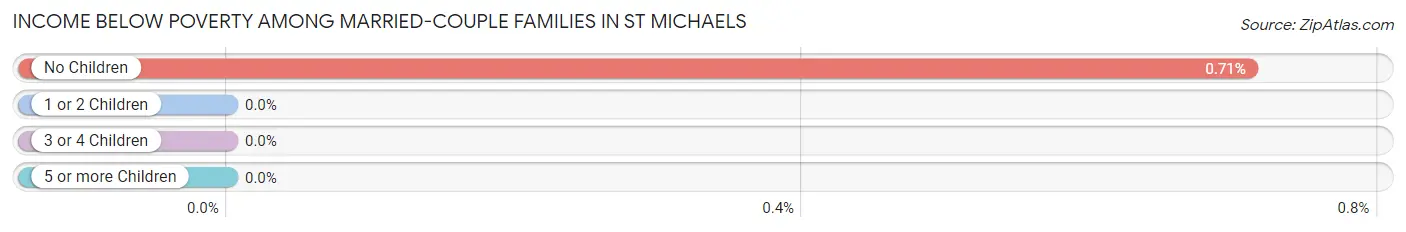
| Children | Above Poverty | Below Poverty |
| No Children | 280 (99.3%) | 2 (0.7%) |
| 1 or 2 Children | 41 (100.0%) | 0 (0.0%) |
| 3 or 4 Children | 8 (100.0%) | 0 (0.0%) |
| 5 or more Children | 0 (0.0%) | 0 (0.0%) |
| Total | 329 (99.4%) | 2 (0.6%) |
Income Below Poverty Among Single-Parent Households in St Michaels
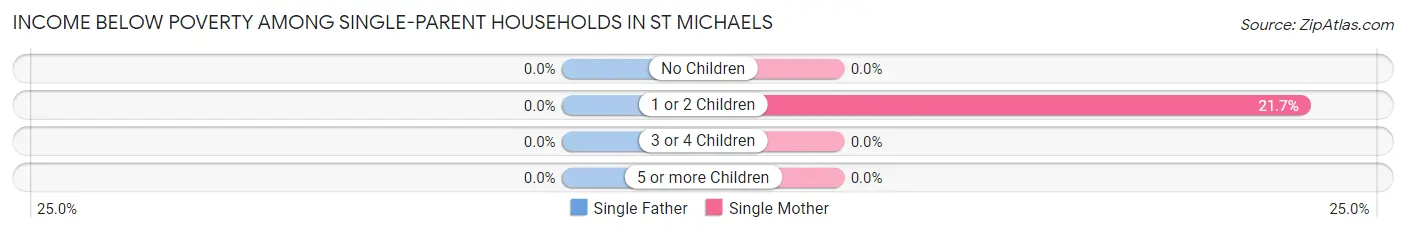
| Children | Single Father | Single Mother |
| No Children | 0 (0.0%) | 0 (0.0%) |
| 1 or 2 Children | 0 (0.0%) | 15 (21.7%) |
| 3 or 4 Children | 0 (0.0%) | 0 (0.0%) |
| 5 or more Children | 0 (0.0%) | 0 (0.0%) |
| Total | 0 (0.0%) | 15 (15.5%) |
Income Below Poverty Among Married-Couple vs Single-Parent Households in St Michaels
The poverty data for St Michaels shows that 2 of the married-couple family households (0.6%) and 15 of the single-parent households (9.9%) are living below the poverty level. Within the married-couple family households, those with no children have the highest poverty rate, with 2 households (0.7%) falling below the poverty line. Among the single-parent households, those with 1 or 2 children have the highest poverty rate, with 15 household (20.3%) living below poverty.
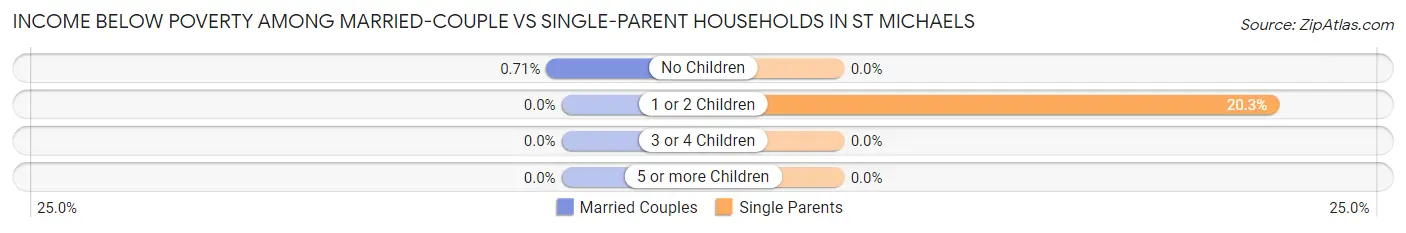
| Children | Married-Couple Families | Single-Parent Households |
| No Children | 2 (0.7%) | 0 (0.0%) |
| 1 or 2 Children | 0 (0.0%) | 15 (20.3%) |
| 3 or 4 Children | 0 (0.0%) | 0 (0.0%) |
| 5 or more Children | 0 (0.0%) | 0 (0.0%) |
| Total | 2 (0.6%) | 15 (9.9%) |
Race in St Michaels
The most populous races in St Michaels are White / Caucasian (1,015 | 66.6%), Black / African American (365 | 24.0%), and Two or more Races (137 | 9.0%).
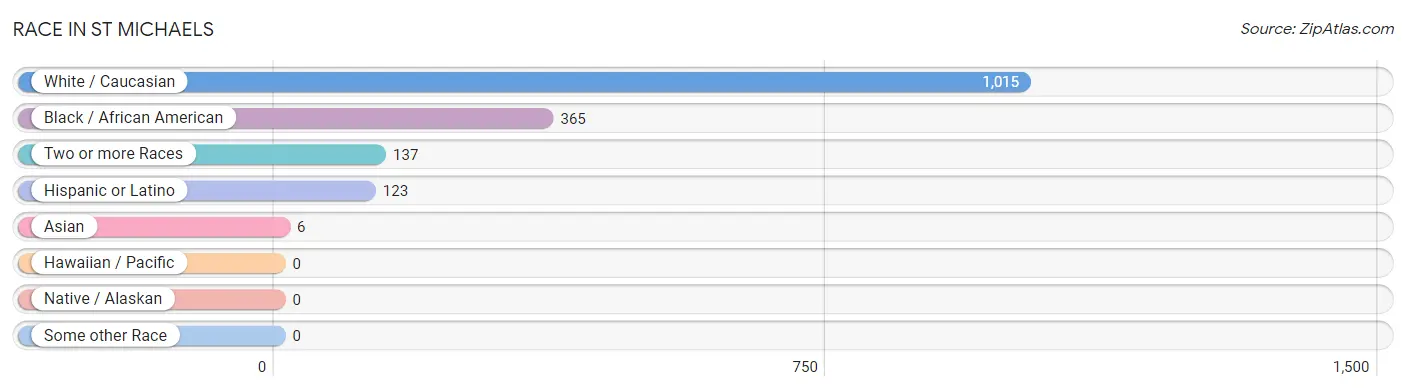
| Race | # Population | % Population |
| Asian | 6 | 0.4% |
| Black / African American | 365 | 24.0% |
| Hawaiian / Pacific | 0 | 0.0% |
| Hispanic or Latino | 123 | 8.1% |
| Native / Alaskan | 0 | 0.0% |
| White / Caucasian | 1,015 | 66.6% |
| Two or more Races | 137 | 9.0% |
| Some other Race | 0 | 0.0% |
| Total | 1,523 | 100.0% |
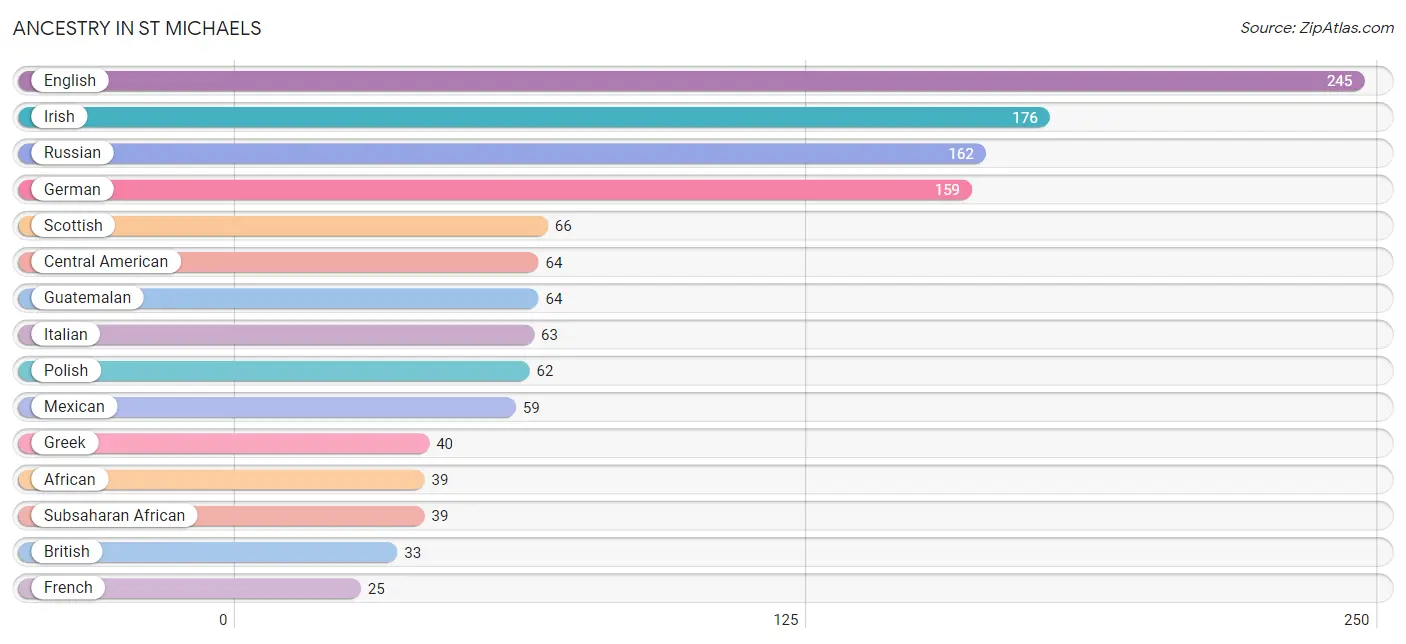
Ancestry in St Michaels
The most populous ancestries reported in St Michaels are English (245 | 16.1%), Irish (176 | 11.6%), Russian (162 | 10.6%), German (159 | 10.4%), and Scottish (66 | 4.3%), together accounting for 53.1% of all St Michaels residents.
| Ancestry | # Population | % Population |
| African | 39 | 2.6% |
| American | 13 | 0.9% |
| Armenian | 2 | 0.1% |
| Australian | 4 | 0.3% |
| British | 33 | 2.2% |
| Central American | 64 | 4.2% |
| Cherokee | 6 | 0.4% |
| Creek | 6 | 0.4% |
| Croatian | 7 | 0.5% |
| Dutch | 10 | 0.7% |
| Eastern European | 2 | 0.1% |
| English | 245 | 16.1% |
| European | 6 | 0.4% |
| Finnish | 12 | 0.8% |
| French | 25 | 1.6% |
| German | 159 | 10.4% |
| Greek | 40 | 2.6% |
| Guatemalan | 64 | 4.2% |
| Icelander | 9 | 0.6% |
| Irish | 176 | 11.6% |
| Italian | 63 | 4.1% |
| Mexican | 59 | 3.9% |
| Northern European | 6 | 0.4% |
| Norwegian | 8 | 0.5% |
| Pakistani | 6 | 0.4% |
| Polish | 62 | 4.1% |
| Portuguese | 8 | 0.5% |
| Russian | 162 | 10.6% |
| Scandinavian | 23 | 1.5% |
| Scotch-Irish | 12 | 0.8% |
| Scottish | 66 | 4.3% |
| Serbian | 7 | 0.5% |
| Subsaharan African | 39 | 2.6% |
| Swedish | 11 | 0.7% |
| Ukrainian | 3 | 0.2% |
| Welsh | 22 | 1.4% | View All 36 Rows |
Immigrants in St Michaels
The most numerous immigrant groups reported in St Michaels came from Europe (161 | 10.6%), Eastern Europe (153 | 10.1%), Russia (146 | 9.6%), Latin America (91 | 6.0%), and Central America (80 | 5.2%), together accounting for 41.4% of all St Michaels residents.
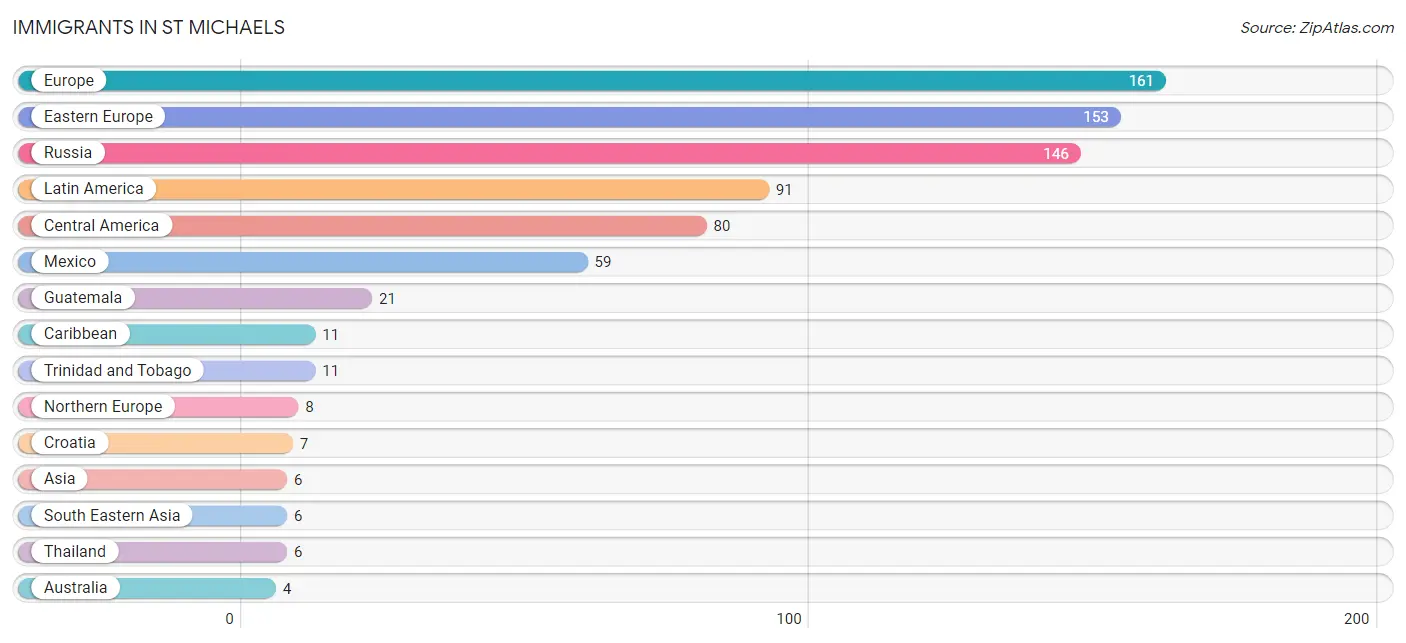
| Immigration Origin | # Population | % Population |
| Asia | 6 | 0.4% |
| Australia | 4 | 0.3% |
| Caribbean | 11 | 0.7% |
| Central America | 80 | 5.2% |
| Croatia | 7 | 0.5% |
| Eastern Europe | 153 | 10.1% |
| England | 2 | 0.1% |
| Europe | 161 | 10.6% |
| Guatemala | 21 | 1.4% |
| Latin America | 91 | 6.0% |
| Mexico | 59 | 3.9% |
| Northern Europe | 8 | 0.5% |
| Norway | 2 | 0.1% |
| Oceania | 4 | 0.3% |
| Russia | 146 | 9.6% |
| South Eastern Asia | 6 | 0.4% |
| Thailand | 6 | 0.4% |
| Trinidad and Tobago | 11 | 0.7% | View All 18 Rows |
Sex and Age in St Michaels
Sex and Age in St Michaels
The most populous age groups in St Michaels are 45 to 49 Years (83 | 13.2%) for men and 20 to 24 Years (158 | 17.7%) for women.
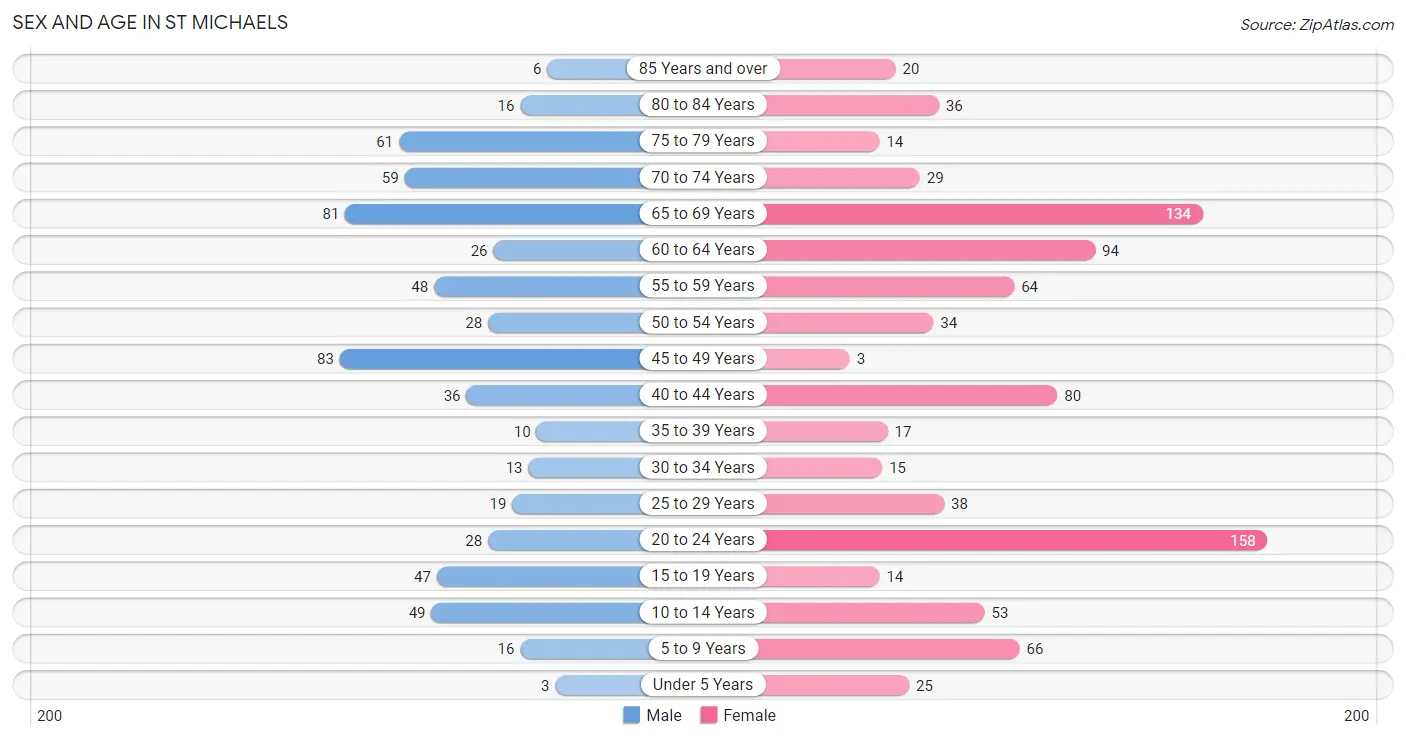
| Age Bracket | Male | Female |
| Under 5 Years | 3 (0.5%) | 25 (2.8%) |
| 5 to 9 Years | 16 (2.5%) | 66 (7.4%) |
| 10 to 14 Years | 49 (7.8%) | 53 (5.9%) |
| 15 to 19 Years | 47 (7.5%) | 14 (1.6%) |
| 20 to 24 Years | 28 (4.4%) | 158 (17.7%) |
| 25 to 29 Years | 19 (3.0%) | 38 (4.3%) |
| 30 to 34 Years | 13 (2.1%) | 15 (1.7%) |
| 35 to 39 Years | 10 (1.6%) | 17 (1.9%) |
| 40 to 44 Years | 36 (5.7%) | 80 (8.9%) |
| 45 to 49 Years | 83 (13.2%) | 3 (0.3%) |
| 50 to 54 Years | 28 (4.4%) | 34 (3.8%) |
| 55 to 59 Years | 48 (7.6%) | 64 (7.2%) |
| 60 to 64 Years | 26 (4.1%) | 94 (10.5%) |
| 65 to 69 Years | 81 (12.9%) | 134 (15.0%) |
| 70 to 74 Years | 59 (9.4%) | 29 (3.2%) |
| 75 to 79 Years | 61 (9.7%) | 14 (1.6%) |
| 80 to 84 Years | 16 (2.5%) | 36 (4.0%) |
| 85 Years and over | 6 (0.9%) | 20 (2.2%) |
| Total | 629 (100.0%) | 894 (100.0%) |
Families and Households in St Michaels
Median Family Size in St Michaels
The median family size in St Michaels is 2.63 persons per family, with single female/mother families (97 | 20.1%) accounting for the largest median family size of 3.49 persons per family. On the other hand, single male/father families (55 | 11.4%) represent the smallest median family size with 1.22 persons per family.
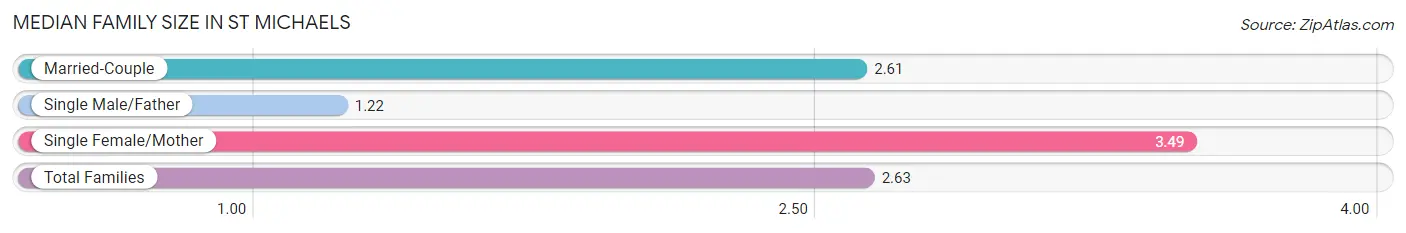
| Family Type | # Families | Family Size |
| Married-Couple | 331 (68.5%) | 2.61 |
| Single Male/Father | 55 (11.4%) | 1.22 |
| Single Female/Mother | 97 (20.1%) | 3.49 |
| Total Families | 483 (100.0%) | 2.63 |
Median Household Size in St Michaels
The median household size in St Michaels is 2.28 persons per household, with single female/mother households (97 | 14.5%) accounting for the largest median household size of 3.78 persons per household. non-family households (184 | 27.6%) represent the smallest median household size with 1.18 persons per household.
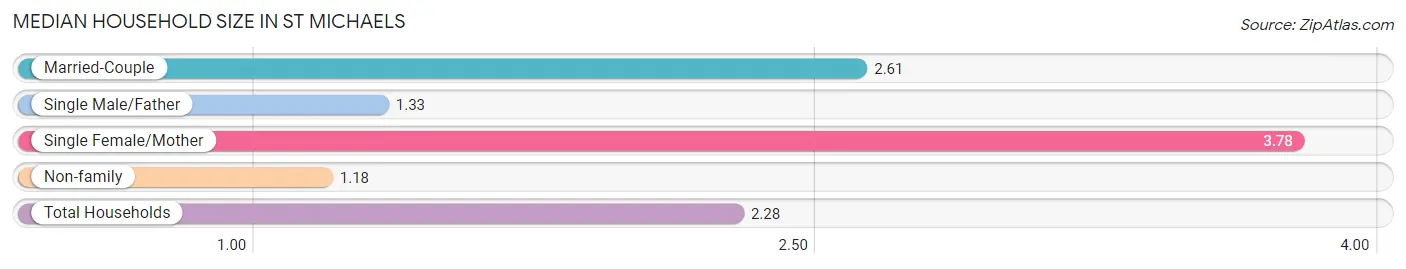
| Household Type | # Households | Household Size |
| Married-Couple | 331 (49.6%) | 2.61 |
| Single Male/Father | 55 (8.3%) | 1.33 |
| Single Female/Mother | 97 (14.5%) | 3.78 |
| Non-family | 184 (27.6%) | 1.18 |
| Total Households | 667 (100.0%) | 2.28 |
Household Size by Marriage Status in St Michaels
Out of a total of 667 households in St Michaels, 483 (72.4%) are family households, while 184 (27.6%) are nonfamily households. The most numerous type of family households are 2-person households, comprising 254, and the most common type of nonfamily households are 1-person households, comprising 162.
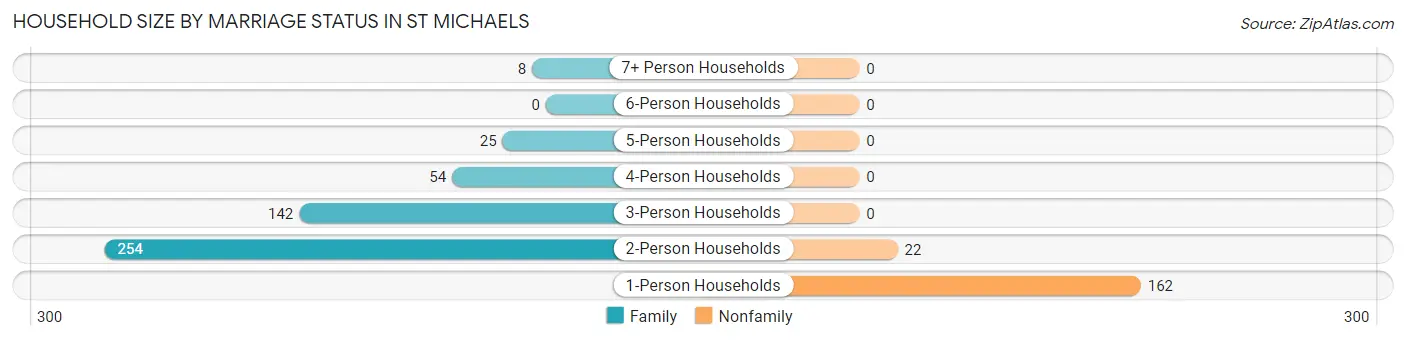
| Household Size | Family Households | Nonfamily Households |
| 1-Person Households | - | 162 (24.3%) |
| 2-Person Households | 254 (38.1%) | 22 (3.3%) |
| 3-Person Households | 142 (21.3%) | 0 (0.0%) |
| 4-Person Households | 54 (8.1%) | 0 (0.0%) |
| 5-Person Households | 25 (3.7%) | 0 (0.0%) |
| 6-Person Households | 0 (0.0%) | 0 (0.0%) |
| 7+ Person Households | 8 (1.2%) | 0 (0.0%) |
| Total | 483 (72.4%) | 184 (27.6%) |
Female Fertility in St Michaels
Fertility by Age in St Michaels
| Age Bracket | Women with Births | Births / 1,000 Women |
| 15 to 19 years | 0 (0.0%) | 0.0 |
| 20 to 34 years | 0 (0.0%) | 0.0 |
| 35 to 50 years | 0 (0.0%) | 0.0 |
| Total | 0 (0.0%) | 0.0 |
Fertility by Age by Marriage Status in St Michaels
| Age Bracket | Married | Unmarried |
| 15 to 19 years | 0 (0.0%) | 0 (0.0%) |
| 20 to 34 years | 0 (0.0%) | 0 (0.0%) |
| 35 to 50 years | 0 (0.0%) | 0 (0.0%) |
| Total | 0 (0.0%) | 0 (0.0%) |
Fertility by Education in St Michaels
| Educational Attainment | Women with Births | Births / 1,000 Women |
| Less than High School | 0 (0.0%) | 0.0 |
| High School Diploma | 0 (0.0%) | 0.0 |
| College or Associate's Degree | 0 (0.0%) | 0.0 |
| Bachelor's Degree | 0 (0.0%) | 0.0 |
| Graduate Degree | 0 (0.0%) | 0.0 |
| Total | 0 (0.0%) | 0.0 |
Fertility by Education by Marriage Status in St Michaels
| Educational Attainment | Married | Unmarried |
| Less than High School | 0 (0.0%) | 0 (0.0%) |
| High School Diploma | 0 (0.0%) | 0 (0.0%) |
| College or Associate's Degree | 0 (0.0%) | 0 (0.0%) |
| Bachelor's Degree | 0 (0.0%) | 0 (0.0%) |
| Graduate Degree | 0 (0.0%) | 0 (0.0%) |
| Total | 0 (0.0%) | 0 (0.0%) |
Employment Characteristics in St Michaels
Employment by Class of Employer in St Michaels
Among the 633 employed individuals in St Michaels, private company employees (275 | 43.4%), self-employed (not incorporated) (134 | 21.2%), and not-for-profit organizations (113 | 17.8%) make up the most common classes of employment.
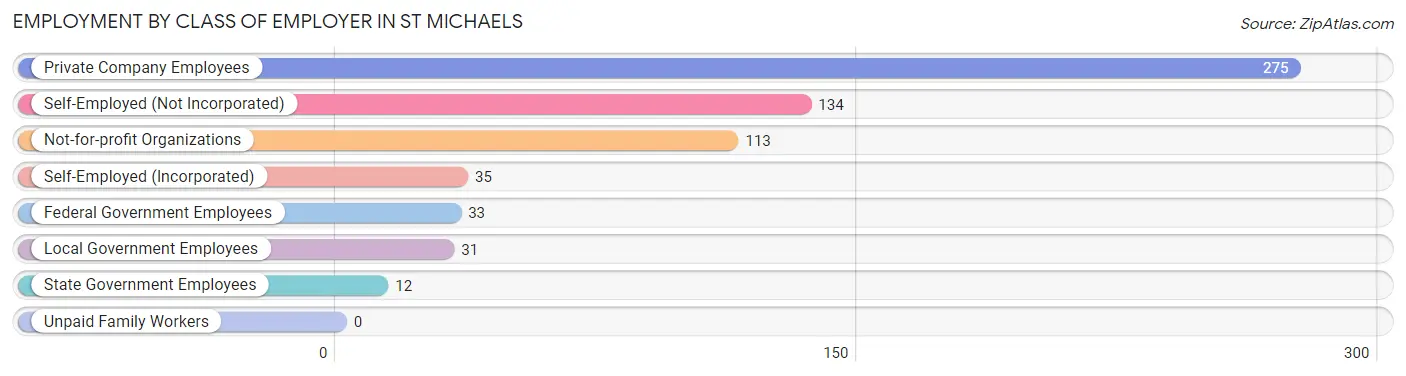
| Employer Class | # Employees | % Employees |
| Private Company Employees | 275 | 43.4% |
| Self-Employed (Incorporated) | 35 | 5.5% |
| Self-Employed (Not Incorporated) | 134 | 21.2% |
| Not-for-profit Organizations | 113 | 17.8% |
| Local Government Employees | 31 | 4.9% |
| State Government Employees | 12 | 1.9% |
| Federal Government Employees | 33 | 5.2% |
| Unpaid Family Workers | 0 | 0.0% |
| Total | 633 | 100.0% |
Employment Status by Age in St Michaels
According to the labor force statistics for St Michaels, out of the total population over 16 years of age (1,291), 53.1% or 686 individuals are in the labor force, with 7.6% or 52 of them unemployed. The age group with the highest labor force participation rate is 30 to 34 years, with 100.0% or 28 individuals in the labor force. Within the labor force, the 16 to 19 years age range has the highest percentage of unemployed individuals, with 41.7% or 15 of them being unemployed.
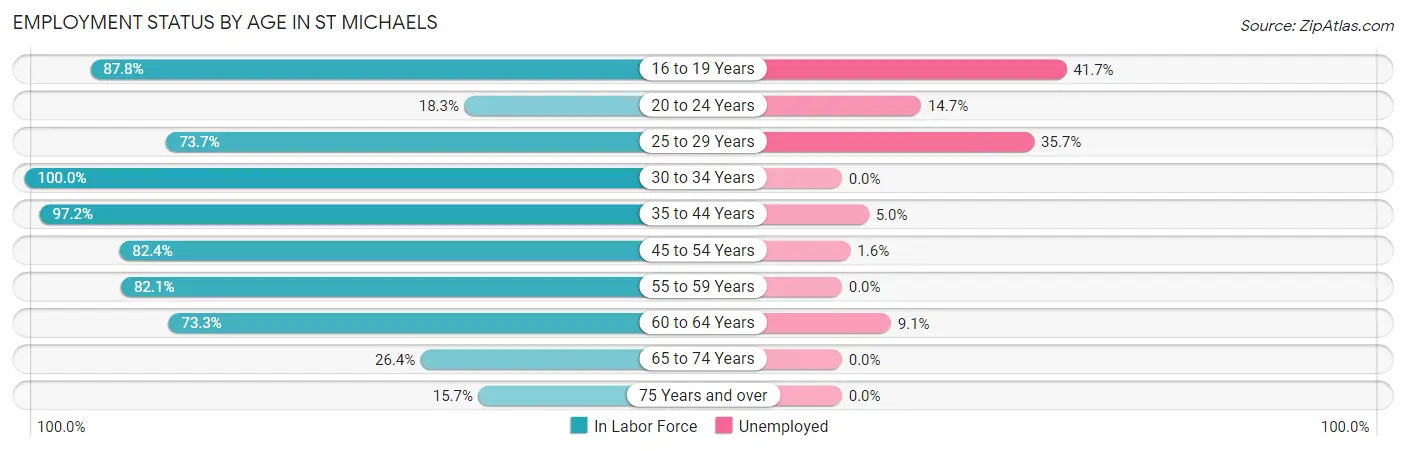
| Age Bracket | In Labor Force | Unemployed |
| 16 to 19 Years | 36 (87.8%) | 15 (41.7%) |
| 20 to 24 Years | 34 (18.3%) | 5 (14.7%) |
| 25 to 29 Years | 42 (73.7%) | 15 (35.7%) |
| 30 to 34 Years | 28 (100.0%) | 0 (0.0%) |
| 35 to 44 Years | 139 (97.2%) | 7 (5.0%) |
| 45 to 54 Years | 122 (82.4%) | 2 (1.6%) |
| 55 to 59 Years | 92 (82.1%) | 0 (0.0%) |
| 60 to 64 Years | 88 (73.3%) | 8 (9.1%) |
| 65 to 74 Years | 80 (26.4%) | 0 (0.0%) |
| 75 Years and over | 24 (15.7%) | 0 (0.0%) |
| Total | 686 (53.1%) | 52 (7.6%) |
Employment Status by Educational Attainment in St Michaels
According to labor force statistics for St Michaels, 84.0% of individuals (511) out of the total population between 25 and 64 years of age (608) are in the labor force, with 6.3% or 32 of them being unemployed. The group with the highest labor force participation rate are those with the educational attainment of less than high school, with 97.7% or 127 individuals in the labor force. Within the labor force, individuals with college / associate degree education have the highest percentage of unemployment, with 21.1% or 20 of them being unemployed.
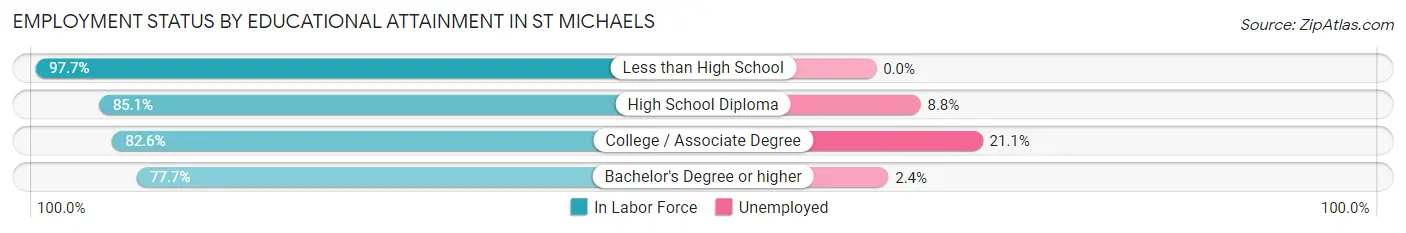
| Educational Attainment | In Labor Force | Unemployed |
| Less than High School | 127 (97.7%) | 0 (0.0%) |
| High School Diploma | 80 (85.1%) | 8 (8.8%) |
| College / Associate Degree | 95 (82.6%) | 24 (21.1%) |
| Bachelor's Degree or higher | 209 (77.7%) | 6 (2.4%) |
| Total | 511 (84.0%) | 38 (6.3%) |
Employment Occupations by Sex in St Michaels
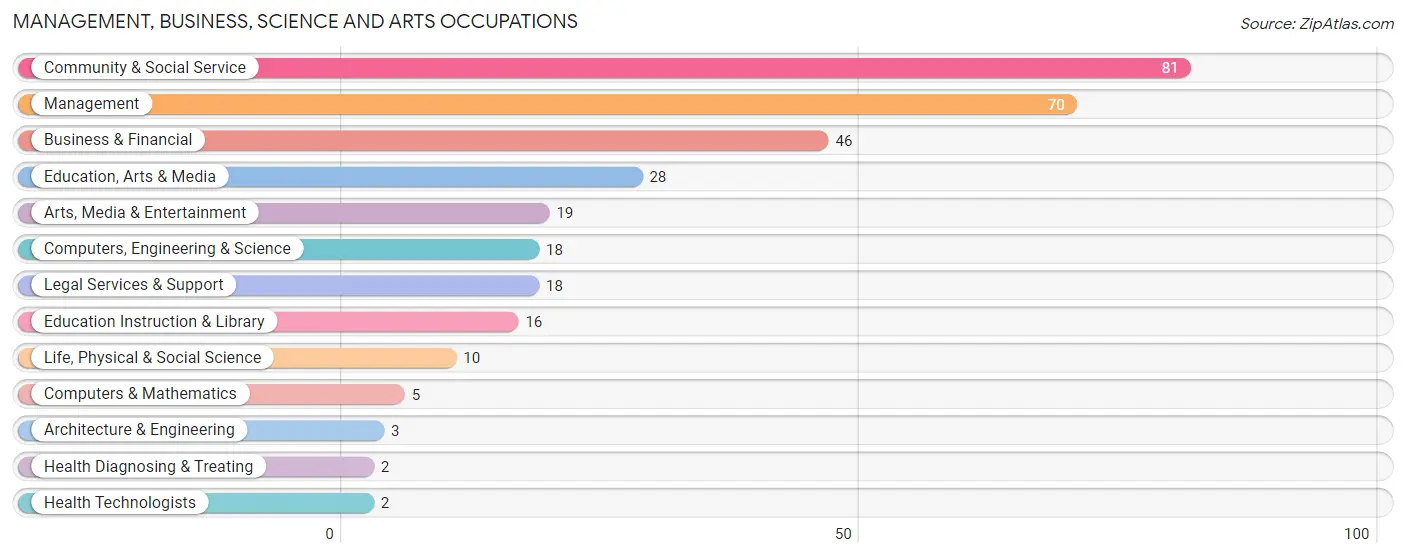
Management, Business, Science and Arts Occupations
The most common Management, Business, Science and Arts occupations in St Michaels are Community & Social Service (81 | 12.8%), Management (70 | 11.1%), Business & Financial (46 | 7.3%), Education, Arts & Media (28 | 4.4%), and Arts, Media & Entertainment (19 | 3.0%).
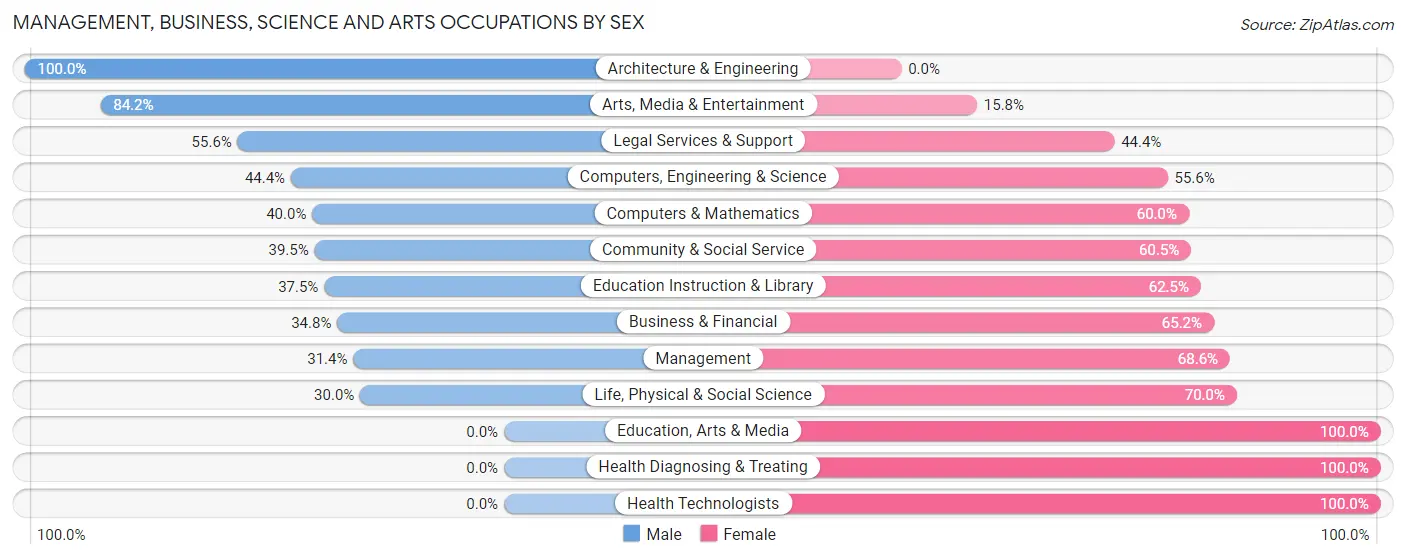
Management, Business, Science and Arts Occupations by Sex
Within the Management, Business, Science and Arts occupations in St Michaels, the most male-oriented occupations are Architecture & Engineering (100.0%), Arts, Media & Entertainment (84.2%), and Legal Services & Support (55.6%), while the most female-oriented occupations are Education, Arts & Media (100.0%), Health Diagnosing & Treating (100.0%), and Health Technologists (100.0%).
| Occupation | Male | Female |
| Management | 22 (31.4%) | 48 (68.6%) |
| Business & Financial | 16 (34.8%) | 30 (65.2%) |
| Computers, Engineering & Science | 8 (44.4%) | 10 (55.6%) |
| Computers & Mathematics | 2 (40.0%) | 3 (60.0%) |
| Architecture & Engineering | 3 (100.0%) | 0 (0.0%) |
| Life, Physical & Social Science | 3 (30.0%) | 7 (70.0%) |
| Community & Social Service | 32 (39.5%) | 49 (60.5%) |
| Education, Arts & Media | 0 (0.0%) | 28 (100.0%) |
| Legal Services & Support | 10 (55.6%) | 8 (44.4%) |
| Education Instruction & Library | 6 (37.5%) | 10 (62.5%) |
| Arts, Media & Entertainment | 16 (84.2%) | 3 (15.8%) |
| Health Diagnosing & Treating | 0 (0.0%) | 2 (100.0%) |
| Health Technologists | 0 (0.0%) | 2 (100.0%) |
| Total (Category) | 78 (35.9%) | 139 (64.1%) |
| Total (Overall) | 314 (49.6%) | 319 (50.4%) |
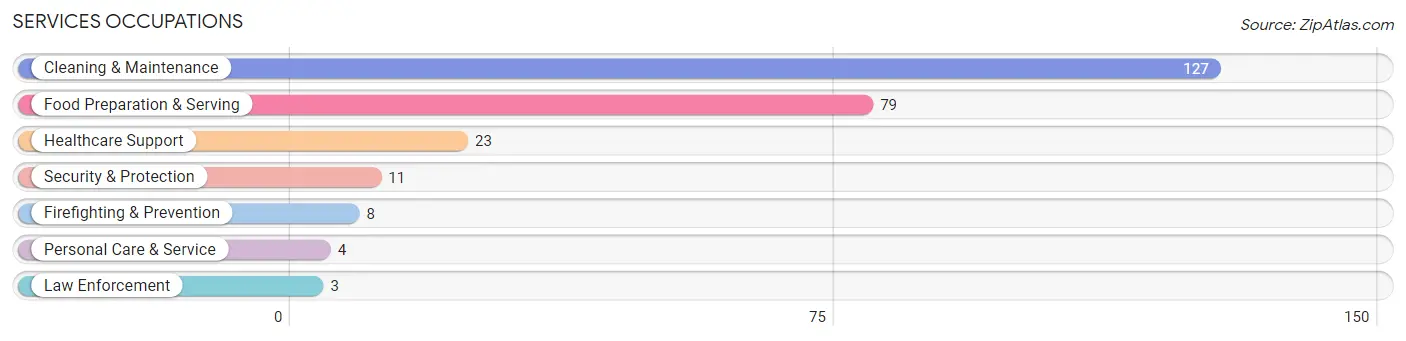
Services Occupations
The most common Services occupations in St Michaels are Cleaning & Maintenance (127 | 20.1%), Food Preparation & Serving (79 | 12.5%), Healthcare Support (23 | 3.6%), Security & Protection (11 | 1.7%), and Firefighting & Prevention (8 | 1.3%).
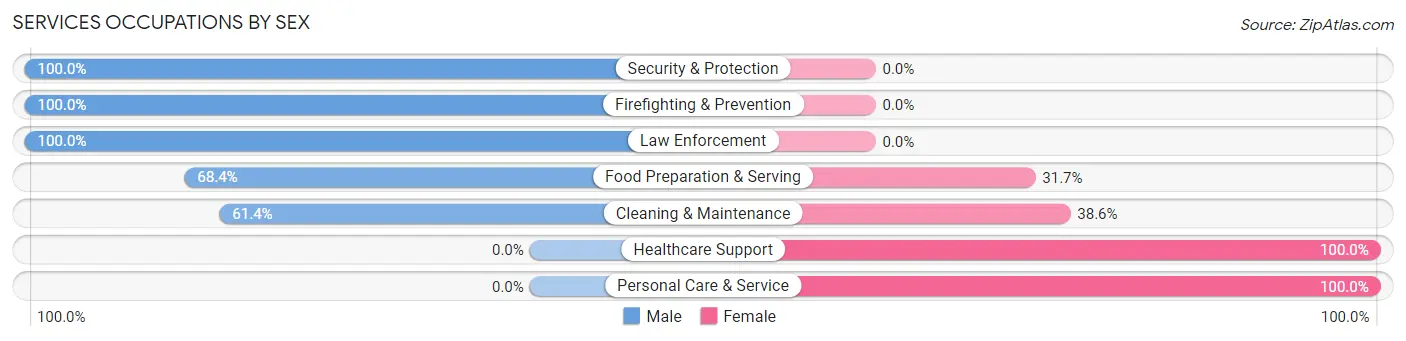
Services Occupations by Sex
Within the Services occupations in St Michaels, the most male-oriented occupations are Security & Protection (100.0%), Firefighting & Prevention (100.0%), and Law Enforcement (100.0%), while the most female-oriented occupations are Healthcare Support (100.0%), Personal Care & Service (100.0%), and Cleaning & Maintenance (38.6%).
| Occupation | Male | Female |
| Healthcare Support | 0 (0.0%) | 23 (100.0%) |
| Security & Protection | 11 (100.0%) | 0 (0.0%) |
| Firefighting & Prevention | 8 (100.0%) | 0 (0.0%) |
| Law Enforcement | 3 (100.0%) | 0 (0.0%) |
| Food Preparation & Serving | 54 (68.3%) | 25 (31.7%) |
| Cleaning & Maintenance | 78 (61.4%) | 49 (38.6%) |
| Personal Care & Service | 0 (0.0%) | 4 (100.0%) |
| Total (Category) | 143 (58.6%) | 101 (41.4%) |
| Total (Overall) | 314 (49.6%) | 319 (50.4%) |
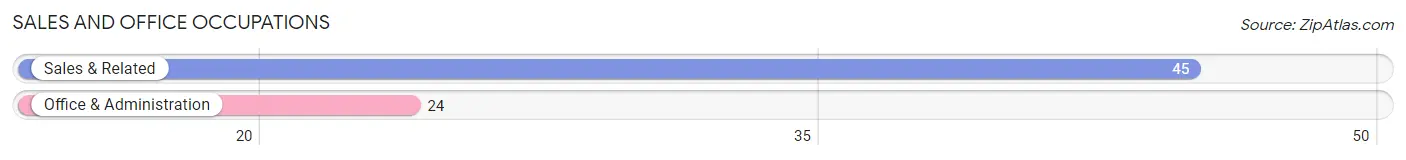
Sales and Office Occupations
The most common Sales and Office occupations in St Michaels are Sales & Related (45 | 7.1%), and Office & Administration (24 | 3.8%).
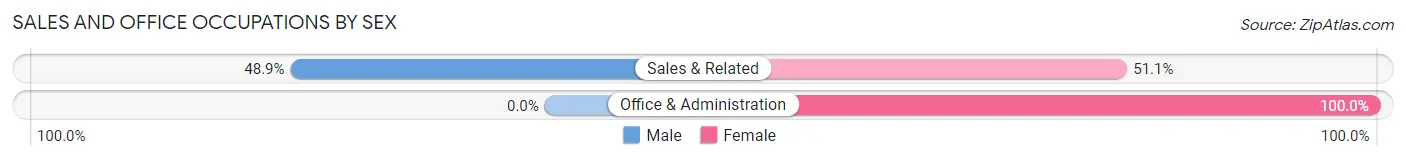
Sales and Office Occupations by Sex
| Occupation | Male | Female |
| Sales & Related | 22 (48.9%) | 23 (51.1%) |
| Office & Administration | 0 (0.0%) | 24 (100.0%) |
| Total (Category) | 22 (31.9%) | 47 (68.1%) |
| Total (Overall) | 314 (49.6%) | 319 (50.4%) |
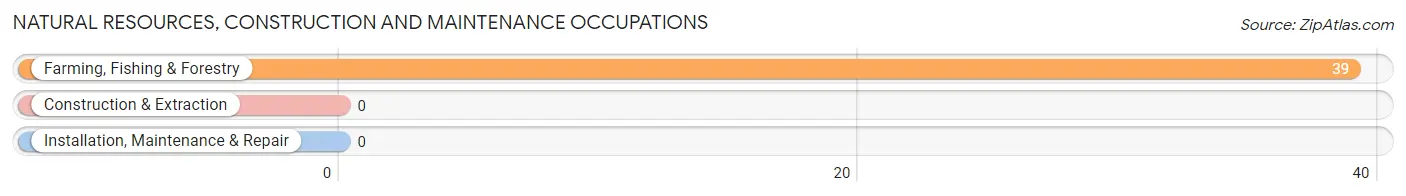
Natural Resources, Construction and Maintenance Occupations
The most common Natural Resources, Construction and Maintenance occupations in St Michaels are , and Farming, Fishing & Forestry (39 | 6.2%).
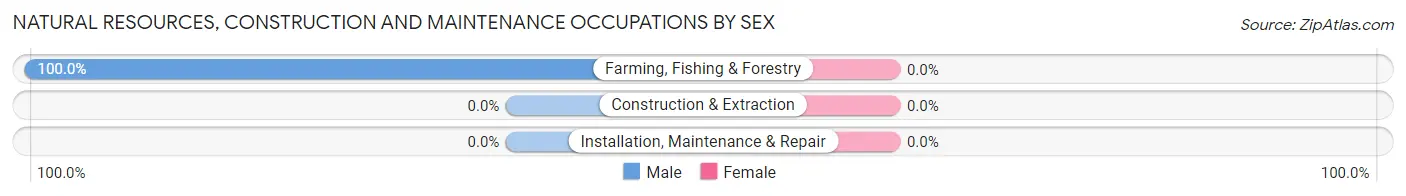
Natural Resources, Construction and Maintenance Occupations by Sex
| Occupation | Male | Female |
| Farming, Fishing & Forestry | 39 (100.0%) | 0 (0.0%) |
| Construction & Extraction | 0 (0.0%) | 0 (0.0%) |
| Installation, Maintenance & Repair | 0 (0.0%) | 0 (0.0%) |
| Total (Category) | 39 (100.0%) | 0 (0.0%) |
| Total (Overall) | 314 (49.6%) | 319 (50.4%) |
Production, Transportation and Moving Occupations
The most common Production, Transportation and Moving occupations in St Michaels are Production (45 | 7.1%), and Material Moving (19 | 3.0%).
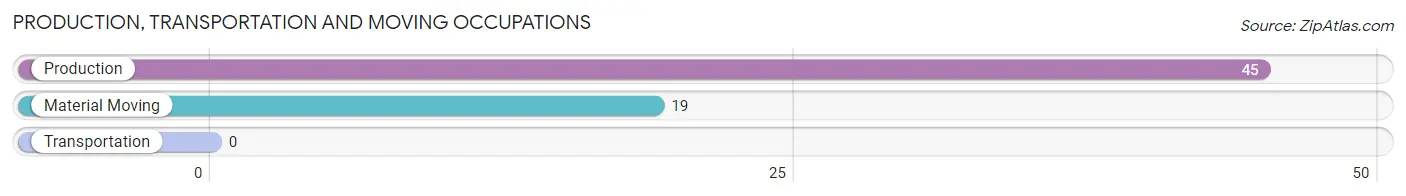
Production, Transportation and Moving Occupations by Sex
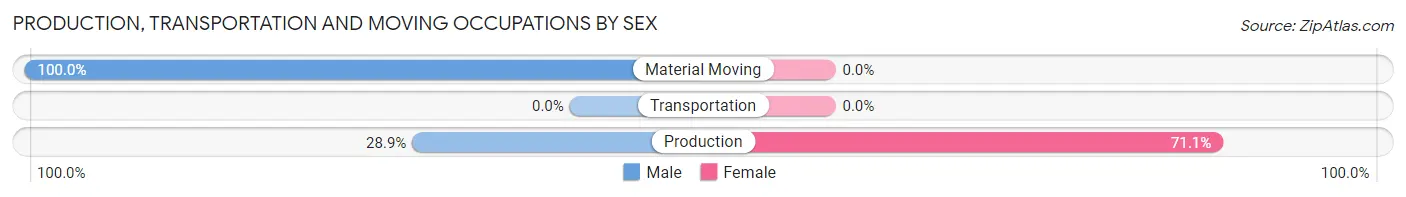
| Occupation | Male | Female |
| Production | 13 (28.9%) | 32 (71.1%) |
| Transportation | 0 (0.0%) | 0 (0.0%) |
| Material Moving | 19 (100.0%) | 0 (0.0%) |
| Total (Category) | 32 (50.0%) | 32 (50.0%) |
| Total (Overall) | 314 (49.6%) | 319 (50.4%) |
Employment Industries by Sex in St Michaels
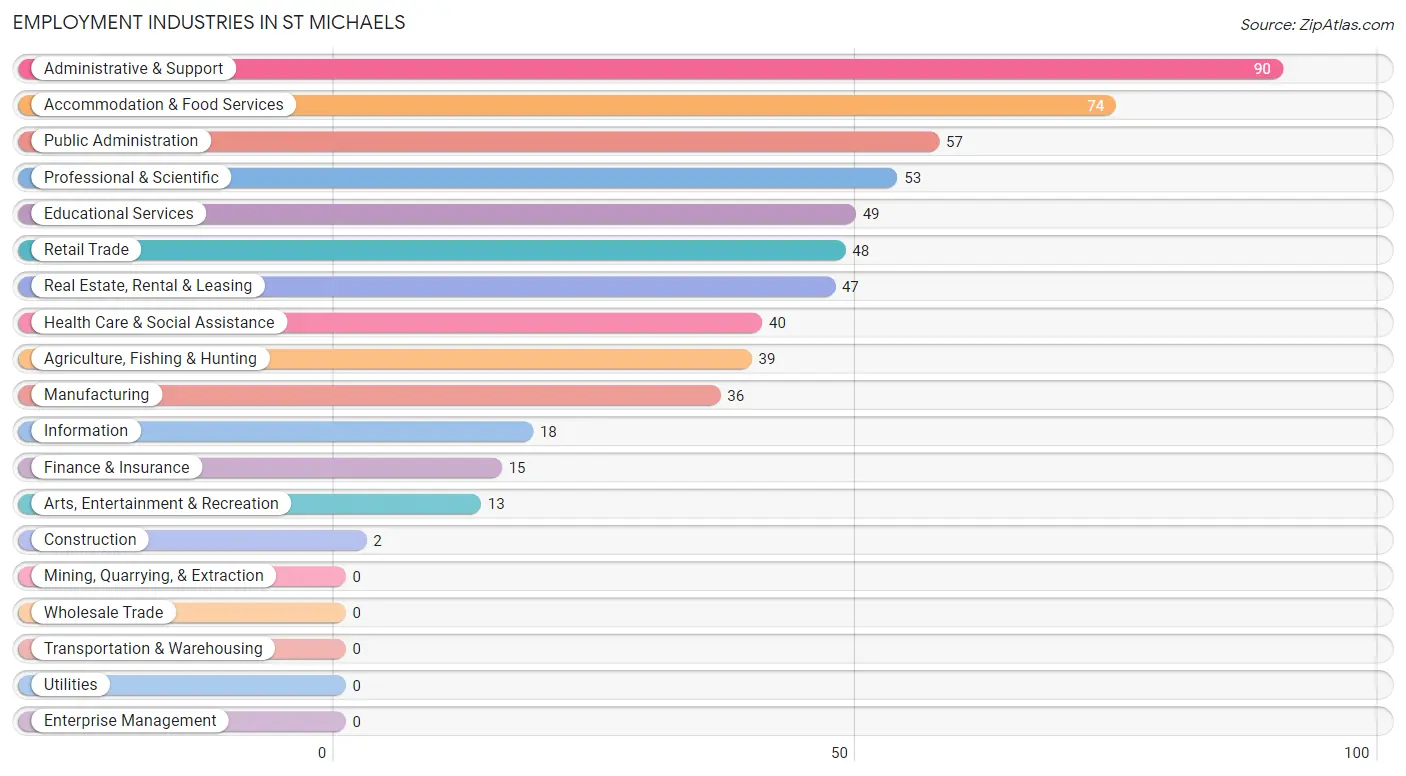
Employment Industries in St Michaels
The major employment industries in St Michaels include Administrative & Support (90 | 14.2%), Accommodation & Food Services (74 | 11.7%), Public Administration (57 | 9.0%), Professional & Scientific (53 | 8.4%), and Educational Services (49 | 7.7%).
Employment Industries by Sex in St Michaels
The St Michaels industries that see more men than women are Agriculture, Fishing & Hunting (100.0%), Administrative & Support (84.4%), and Information (83.3%), whereas the industries that tend to have a higher number of women are Construction (100.0%), Finance & Insurance (100.0%), and Arts, Entertainment & Recreation (100.0%).
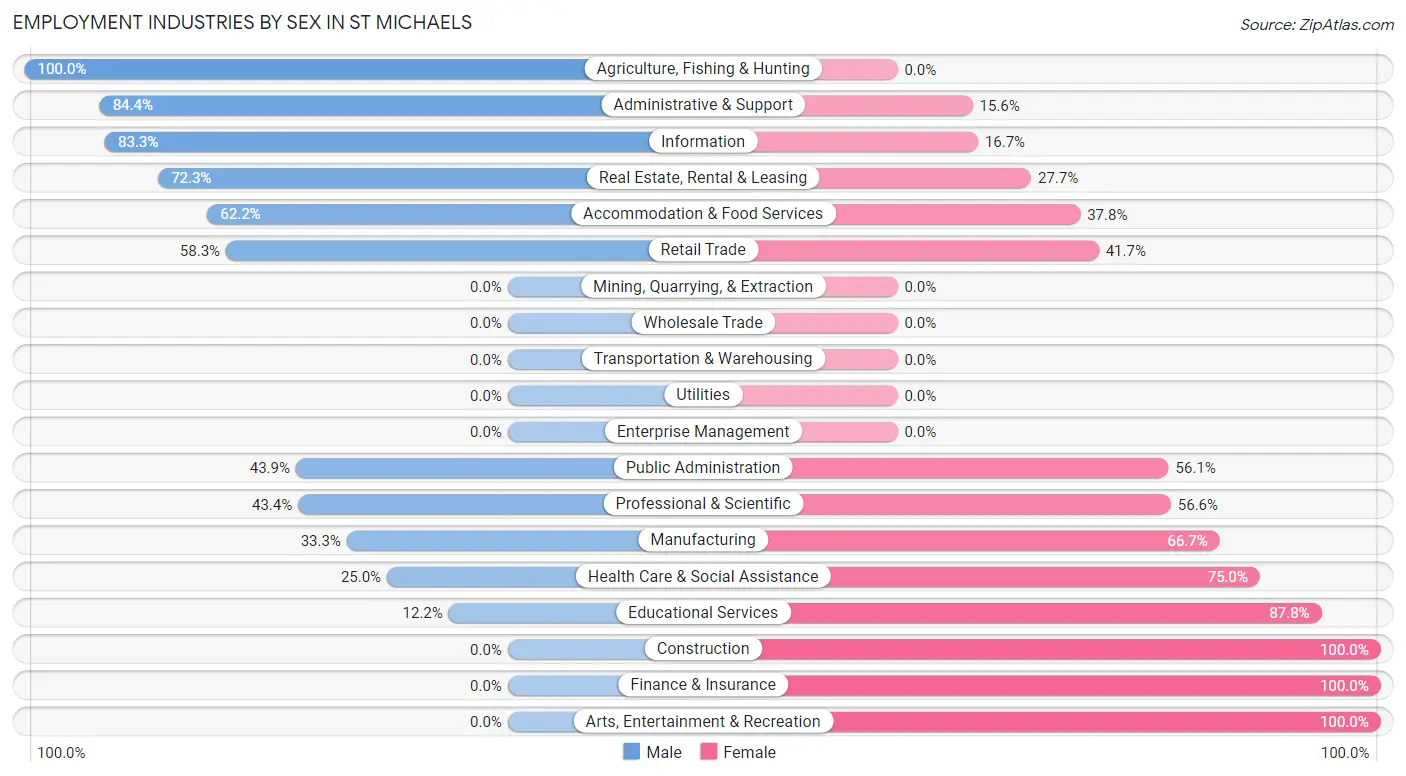
| Industry | Male | Female |
| Agriculture, Fishing & Hunting | 39 (100.0%) | 0 (0.0%) |
| Mining, Quarrying, & Extraction | 0 (0.0%) | 0 (0.0%) |
| Construction | 0 (0.0%) | 2 (100.0%) |
| Manufacturing | 12 (33.3%) | 24 (66.7%) |
| Wholesale Trade | 0 (0.0%) | 0 (0.0%) |
| Retail Trade | 28 (58.3%) | 20 (41.7%) |
| Transportation & Warehousing | 0 (0.0%) | 0 (0.0%) |
| Utilities | 0 (0.0%) | 0 (0.0%) |
| Information | 15 (83.3%) | 3 (16.7%) |
| Finance & Insurance | 0 (0.0%) | 15 (100.0%) |
| Real Estate, Rental & Leasing | 34 (72.3%) | 13 (27.7%) |
| Professional & Scientific | 23 (43.4%) | 30 (56.6%) |
| Enterprise Management | 0 (0.0%) | 0 (0.0%) |
| Administrative & Support | 76 (84.4%) | 14 (15.6%) |
| Educational Services | 6 (12.2%) | 43 (87.8%) |
| Health Care & Social Assistance | 10 (25.0%) | 30 (75.0%) |
| Arts, Entertainment & Recreation | 0 (0.0%) | 13 (100.0%) |
| Accommodation & Food Services | 46 (62.2%) | 28 (37.8%) |
| Public Administration | 25 (43.9%) | 32 (56.1%) |
| Total | 314 (49.6%) | 319 (50.4%) |
Education in St Michaels
School Enrollment in St Michaels
The most common levels of schooling among the 285 students in St Michaels are high school (106 | 37.2%), elementary school (93 | 32.6%), and middle school (45 | 15.8%).
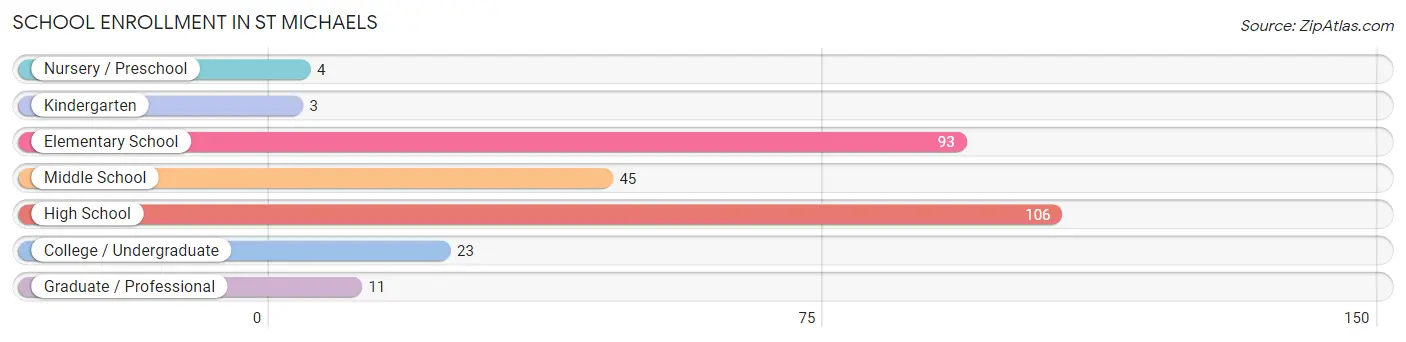
| School Level | # Students | % Students |
| Nursery / Preschool | 4 | 1.4% |
| Kindergarten | 3 | 1.1% |
| Elementary School | 93 | 32.6% |
| Middle School | 45 | 15.8% |
| High School | 106 | 37.2% |
| College / Undergraduate | 23 | 8.1% |
| Graduate / Professional | 11 | 3.9% |
| Total | 285 | 100.0% |
School Enrollment by Age by Funding Source in St Michaels
Out of a total of 285 students who are enrolled in schools in St Michaels, 37 (13.0%) attend a private institution, while the remaining 248 (87.0%) are enrolled in public schools. The age group of 20 to 24 year olds has the highest likelihood of being enrolled in private schools, with 6 (100.0% in the age bracket) enrolled. Conversely, the age group of 3 to 4 year olds has the lowest likelihood of being enrolled in a private school, with 4 (100.0% in the age bracket) attending a public institution.
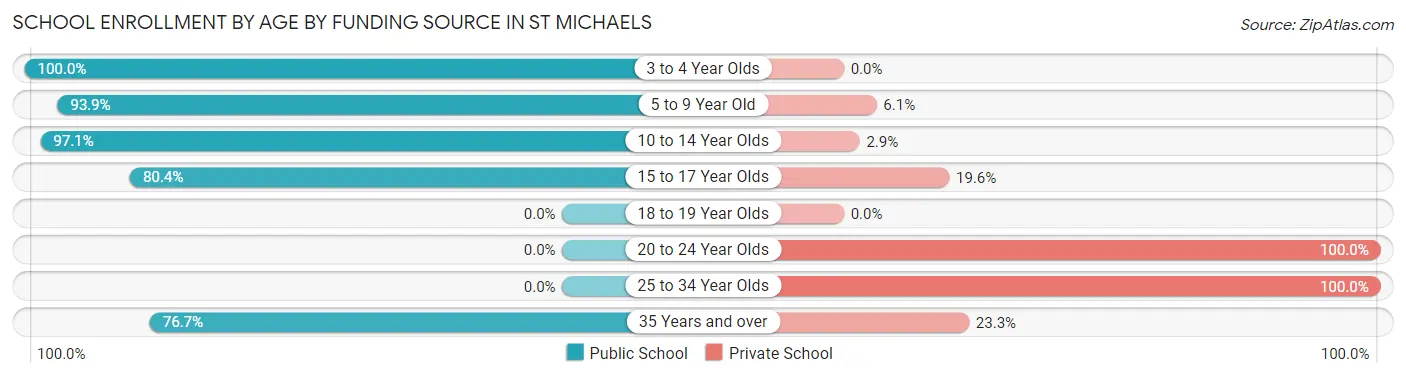
| Age Bracket | Public School | Private School |
| 3 to 4 Year Olds | 4 (100.0%) | 0 (0.0%) |
| 5 to 9 Year Old | 77 (93.9%) | 5 (6.1%) |
| 10 to 14 Year Olds | 99 (97.1%) | 3 (2.9%) |
| 15 to 17 Year Olds | 45 (80.4%) | 11 (19.6%) |
| 18 to 19 Year Olds | 0 (0.0%) | 0 (0.0%) |
| 20 to 24 Year Olds | 0 (0.0%) | 6 (100.0%) |
| 25 to 34 Year Olds | 0 (0.0%) | 5 (100.0%) |
| 35 Years and over | 23 (76.7%) | 7 (23.3%) |
| Total | 248 (87.0%) | 37 (13.0%) |
Educational Attainment by Field of Study in St Michaels
Social sciences (105 | 19.4%), liberal arts & history (78 | 14.4%), engineering (73 | 13.5%), business (67 | 12.4%), and literature & languages (52 | 9.6%) are the most common fields of study among 541 individuals in St Michaels who have obtained a bachelor's degree or higher.
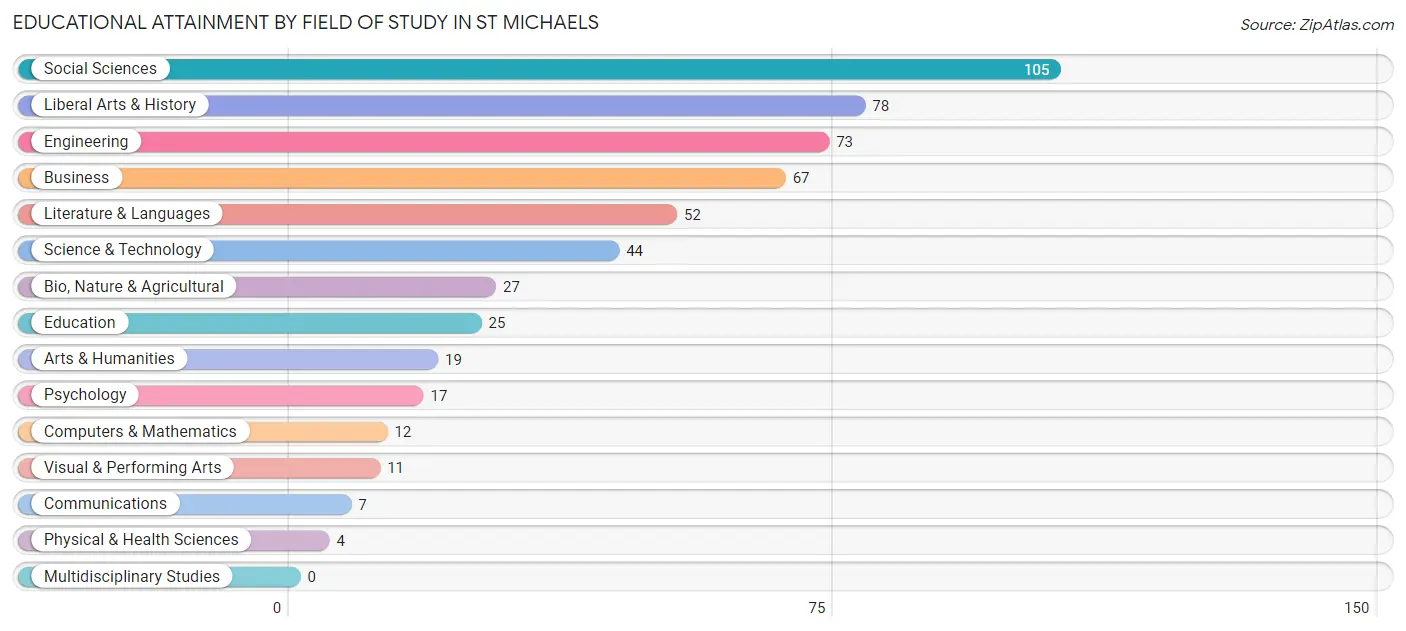
| Field of Study | # Graduates | % Graduates |
| Computers & Mathematics | 12 | 2.2% |
| Bio, Nature & Agricultural | 27 | 5.0% |
| Physical & Health Sciences | 4 | 0.7% |
| Psychology | 17 | 3.1% |
| Social Sciences | 105 | 19.4% |
| Engineering | 73 | 13.5% |
| Multidisciplinary Studies | 0 | 0.0% |
| Science & Technology | 44 | 8.1% |
| Business | 67 | 12.4% |
| Education | 25 | 4.6% |
| Literature & Languages | 52 | 9.6% |
| Liberal Arts & History | 78 | 14.4% |
| Visual & Performing Arts | 11 | 2.0% |
| Communications | 7 | 1.3% |
| Arts & Humanities | 19 | 3.5% |
| Total | 541 | 100.0% |
Transportation & Commute in St Michaels
Vehicle Availability by Sex in St Michaels
The most prevalent vehicle ownership categories in St Michaels are males with 2 vehicles (140, accounting for 44.6%) and females with 2 vehicles (117, making up 43.9%).
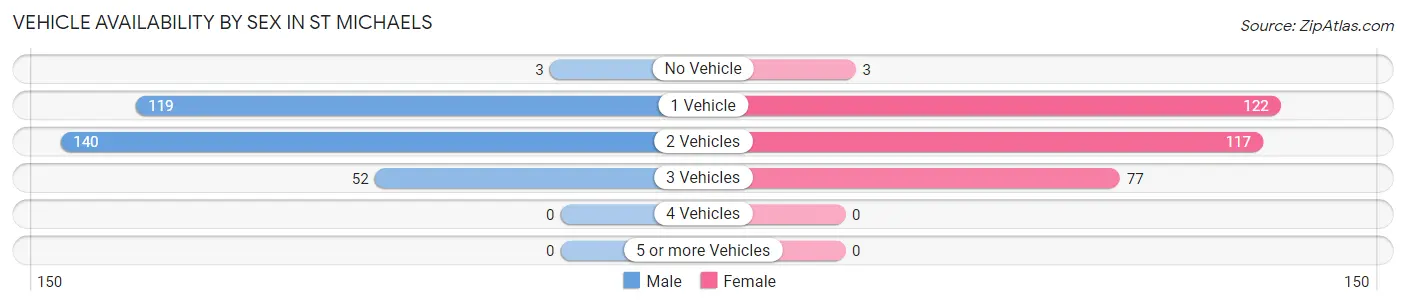
| Vehicles Available | Male | Female |
| No Vehicle | 3 (1.0%) | 3 (0.9%) |
| 1 Vehicle | 119 (37.9%) | 122 (38.2%) |
| 2 Vehicles | 140 (44.6%) | 117 (36.7%) |
| 3 Vehicles | 52 (16.6%) | 77 (24.1%) |
| 4 Vehicles | 0 (0.0%) | 0 (0.0%) |
| 5 or more Vehicles | 0 (0.0%) | 0 (0.0%) |
| Total | 314 (100.0%) | 319 (100.0%) |
Commute Time in St Michaels
The most frequently occuring commute durations in St Michaels are 5 to 9 minutes (122 commuters, 22.2%), 20 to 24 minutes (108 commuters, 19.7%), and 15 to 19 minutes (84 commuters, 15.3%).
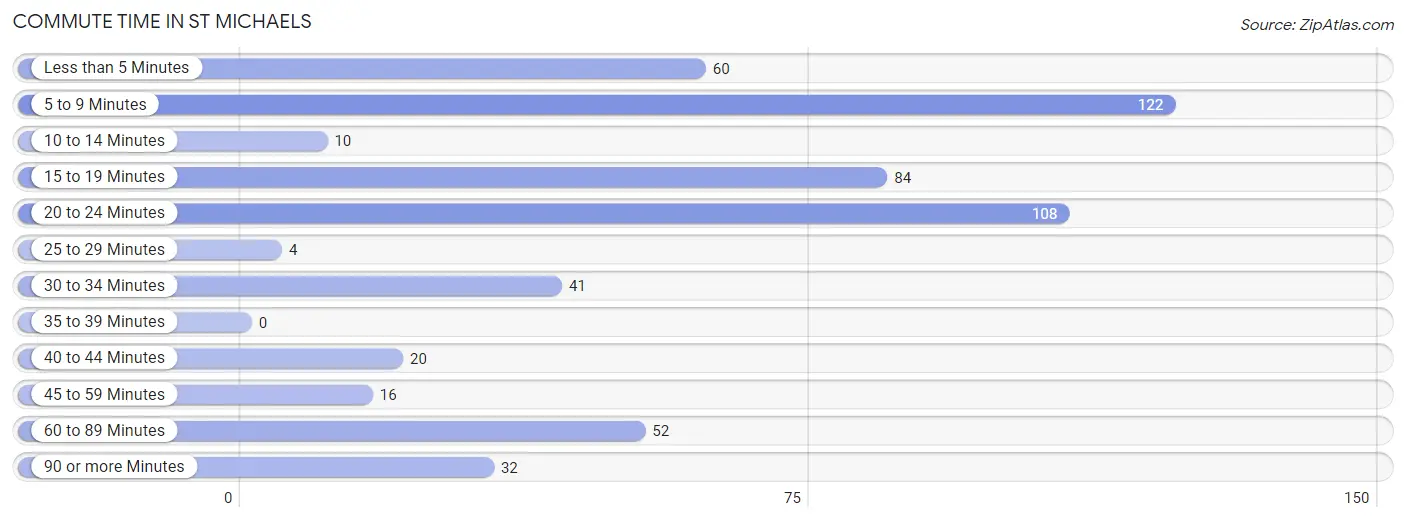
| Commute Time | # Commuters | % Commuters |
| Less than 5 Minutes | 60 | 10.9% |
| 5 to 9 Minutes | 122 | 22.2% |
| 10 to 14 Minutes | 10 | 1.8% |
| 15 to 19 Minutes | 84 | 15.3% |
| 20 to 24 Minutes | 108 | 19.7% |
| 25 to 29 Minutes | 4 | 0.7% |
| 30 to 34 Minutes | 41 | 7.5% |
| 35 to 39 Minutes | 0 | 0.0% |
| 40 to 44 Minutes | 20 | 3.6% |
| 45 to 59 Minutes | 16 | 2.9% |
| 60 to 89 Minutes | 52 | 9.5% |
| 90 or more Minutes | 32 | 5.8% |
Commute Time by Sex in St Michaels
The most common commute times in St Michaels are 5 to 9 minutes (91 commuters, 32.0%) for males and 20 to 24 minutes (93 commuters, 35.1%) for females.
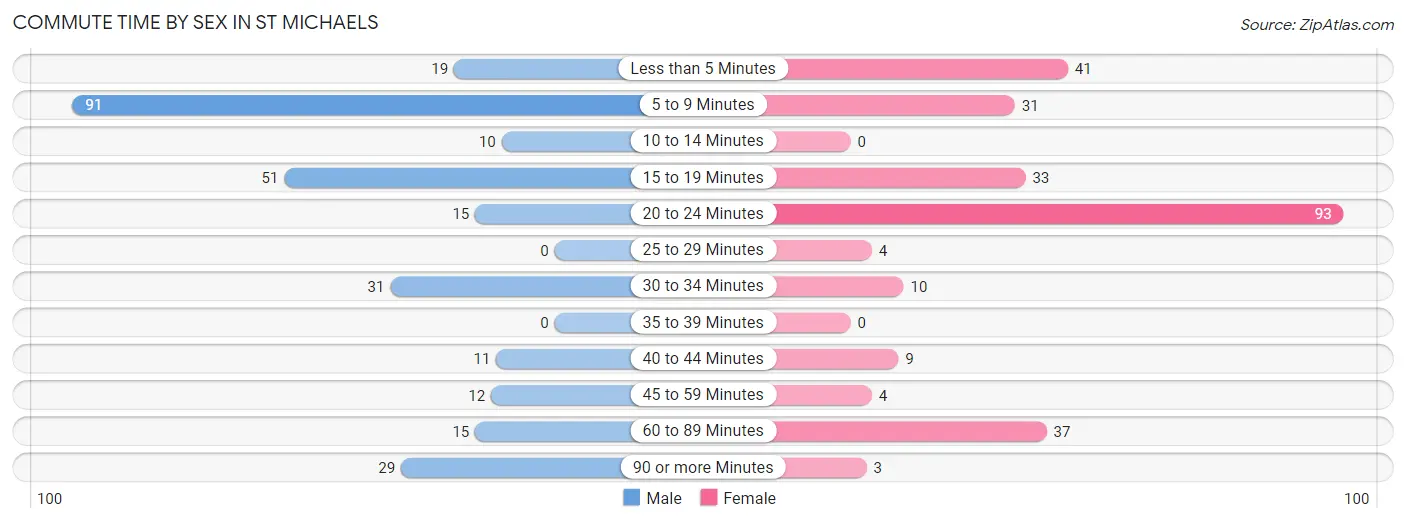
| Commute Time | Male | Female |
| Less than 5 Minutes | 19 (6.7%) | 41 (15.5%) |
| 5 to 9 Minutes | 91 (32.0%) | 31 (11.7%) |
| 10 to 14 Minutes | 10 (3.5%) | 0 (0.0%) |
| 15 to 19 Minutes | 51 (18.0%) | 33 (12.4%) |
| 20 to 24 Minutes | 15 (5.3%) | 93 (35.1%) |
| 25 to 29 Minutes | 0 (0.0%) | 4 (1.5%) |
| 30 to 34 Minutes | 31 (10.9%) | 10 (3.8%) |
| 35 to 39 Minutes | 0 (0.0%) | 0 (0.0%) |
| 40 to 44 Minutes | 11 (3.9%) | 9 (3.4%) |
| 45 to 59 Minutes | 12 (4.2%) | 4 (1.5%) |
| 60 to 89 Minutes | 15 (5.3%) | 37 (14.0%) |
| 90 or more Minutes | 29 (10.2%) | 3 (1.1%) |
Time of Departure to Work by Sex in St Michaels
The most frequent times of departure to work in St Michaels are 7:00 AM to 7:29 AM (73, 25.7%) for males and 7:00 AM to 7:29 AM (59, 22.3%) for females.
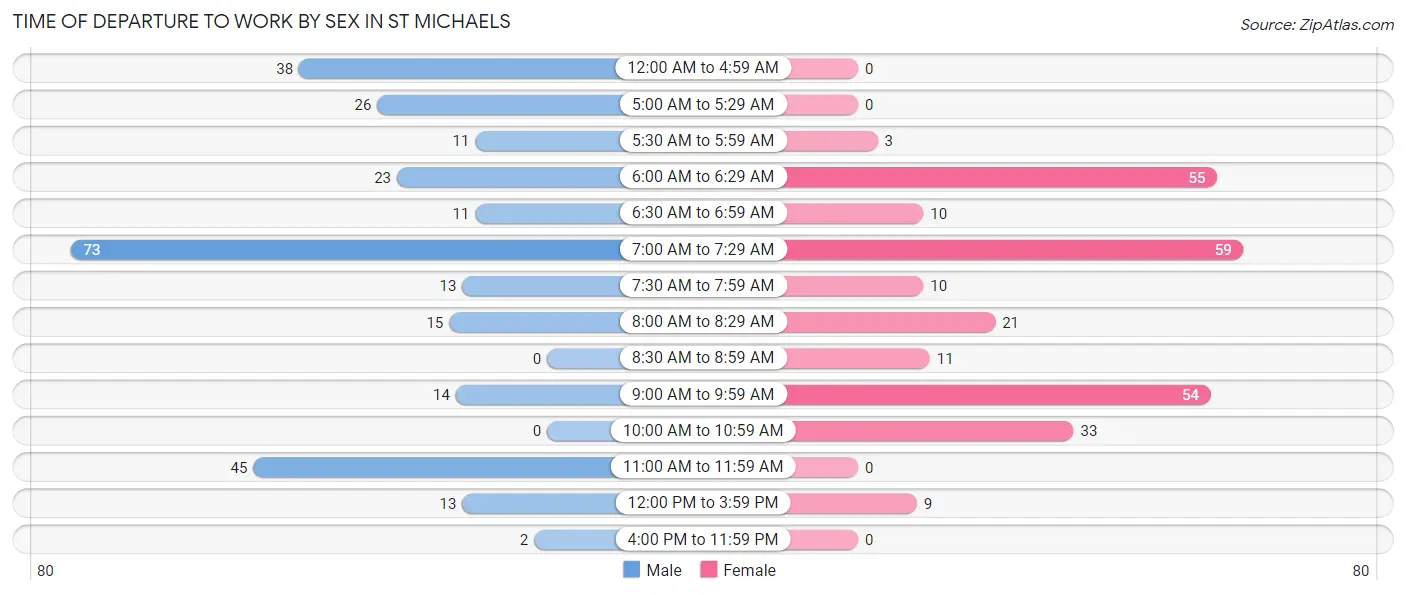
| Time of Departure | Male | Female |
| 12:00 AM to 4:59 AM | 38 (13.4%) | 0 (0.0%) |
| 5:00 AM to 5:29 AM | 26 (9.1%) | 0 (0.0%) |
| 5:30 AM to 5:59 AM | 11 (3.9%) | 3 (1.1%) |
| 6:00 AM to 6:29 AM | 23 (8.1%) | 55 (20.7%) |
| 6:30 AM to 6:59 AM | 11 (3.9%) | 10 (3.8%) |
| 7:00 AM to 7:29 AM | 73 (25.7%) | 59 (22.3%) |
| 7:30 AM to 7:59 AM | 13 (4.6%) | 10 (3.8%) |
| 8:00 AM to 8:29 AM | 15 (5.3%) | 21 (7.9%) |
| 8:30 AM to 8:59 AM | 0 (0.0%) | 11 (4.2%) |
| 9:00 AM to 9:59 AM | 14 (4.9%) | 54 (20.4%) |
| 10:00 AM to 10:59 AM | 0 (0.0%) | 33 (12.4%) |
| 11:00 AM to 11:59 AM | 45 (15.9%) | 0 (0.0%) |
| 12:00 PM to 3:59 PM | 13 (4.6%) | 9 (3.4%) |
| 4:00 PM to 11:59 PM | 2 (0.7%) | 0 (0.0%) |
| Total | 284 (100.0%) | 265 (100.0%) |
Housing Occupancy in St Michaels
Occupancy by Ownership in St Michaels
Of the total 667 dwellings in St Michaels, owner-occupied units account for 475 (71.2%), while renter-occupied units make up 192 (28.8%).
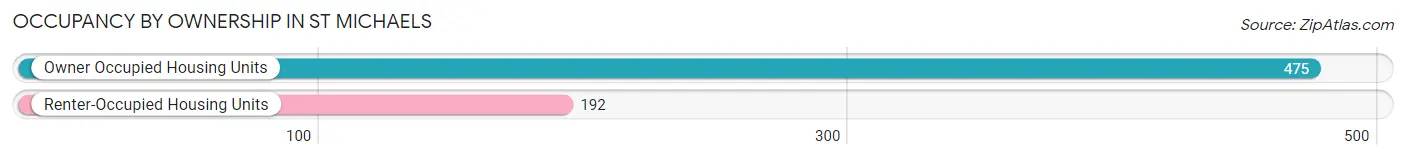
| Occupancy | # Housing Units | % Housing Units |
| Owner Occupied Housing Units | 475 | 71.2% |
| Renter-Occupied Housing Units | 192 | 28.8% |
| Total Occupied Housing Units | 667 | 100.0% |
Occupancy by Household Size in St Michaels
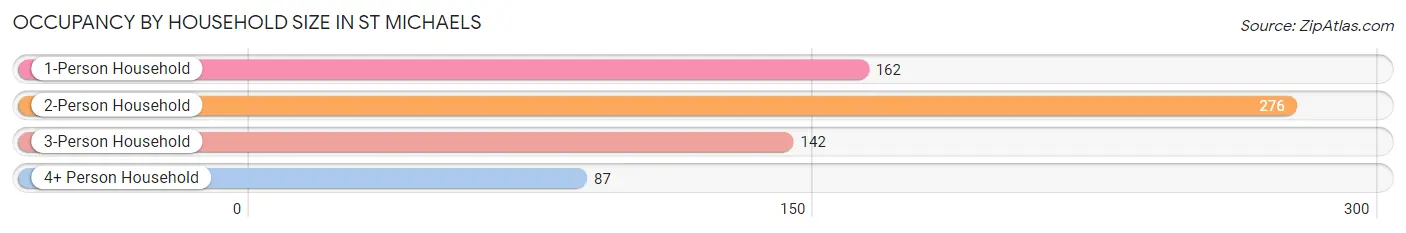
| Household Size | # Housing Units | % Housing Units |
| 1-Person Household | 162 | 24.3% |
| 2-Person Household | 276 | 41.4% |
| 3-Person Household | 142 | 21.3% |
| 4+ Person Household | 87 | 13.0% |
| Total Housing Units | 667 | 100.0% |
Occupancy by Ownership by Household Size in St Michaels
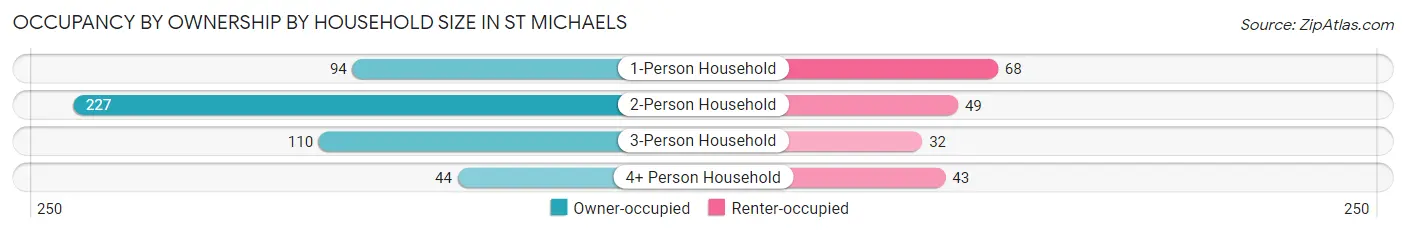
| Household Size | Owner-occupied | Renter-occupied |
| 1-Person Household | 94 (58.0%) | 68 (42.0%) |
| 2-Person Household | 227 (82.3%) | 49 (17.7%) |
| 3-Person Household | 110 (77.5%) | 32 (22.5%) |
| 4+ Person Household | 44 (50.6%) | 43 (49.4%) |
| Total Housing Units | 475 (71.2%) | 192 (28.8%) |
Occupancy by Educational Attainment in St Michaels
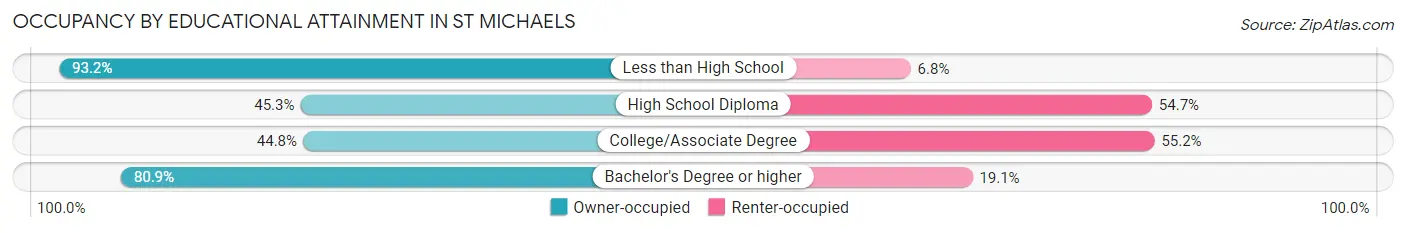
| Household Size | Owner-occupied | Renter-occupied |
| Less than High School | 109 (93.2%) | 8 (6.8%) |
| High School Diploma | 34 (45.3%) | 41 (54.7%) |
| College/Associate Degree | 65 (44.8%) | 80 (55.2%) |
| Bachelor's Degree or higher | 267 (80.9%) | 63 (19.1%) |
Occupancy by Age of Householder in St Michaels
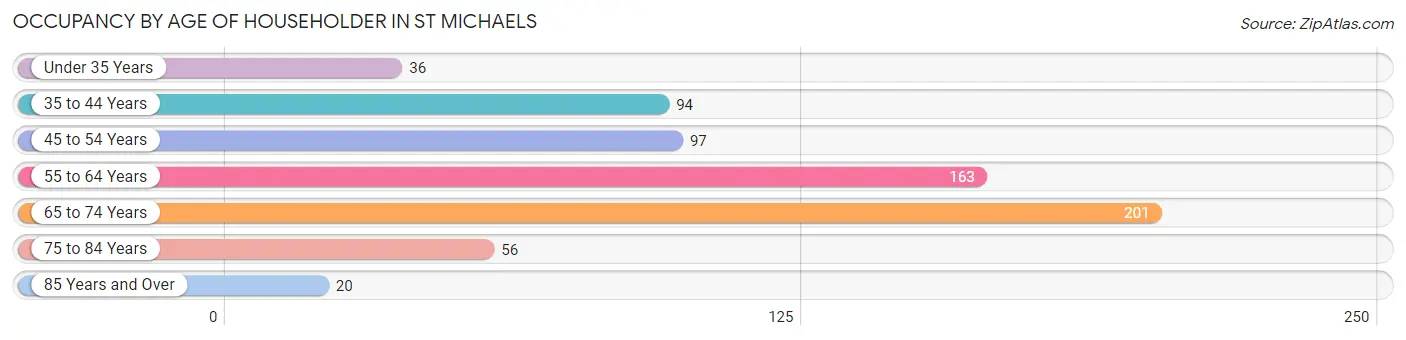
| Age Bracket | # Households | % Households |
| Under 35 Years | 36 | 5.4% |
| 35 to 44 Years | 94 | 14.1% |
| 45 to 54 Years | 97 | 14.5% |
| 55 to 64 Years | 163 | 24.4% |
| 65 to 74 Years | 201 | 30.1% |
| 75 to 84 Years | 56 | 8.4% |
| 85 Years and Over | 20 | 3.0% |
| Total | 667 | 100.0% |
Housing Finances in St Michaels
Median Income by Occupancy in St Michaels
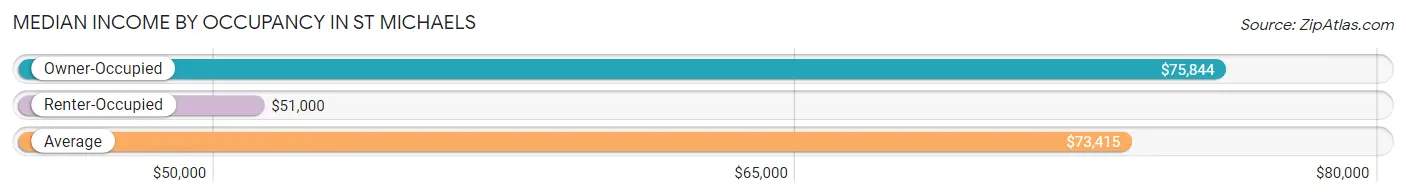
| Occupancy Type | # Households | Median Income |
| Owner-Occupied | 475 (71.2%) | $75,844 |
| Renter-Occupied | 192 (28.8%) | $51,000 |
| Average | 667 (100.0%) | $73,415 |
Occupancy by Householder Income Bracket in St Michaels
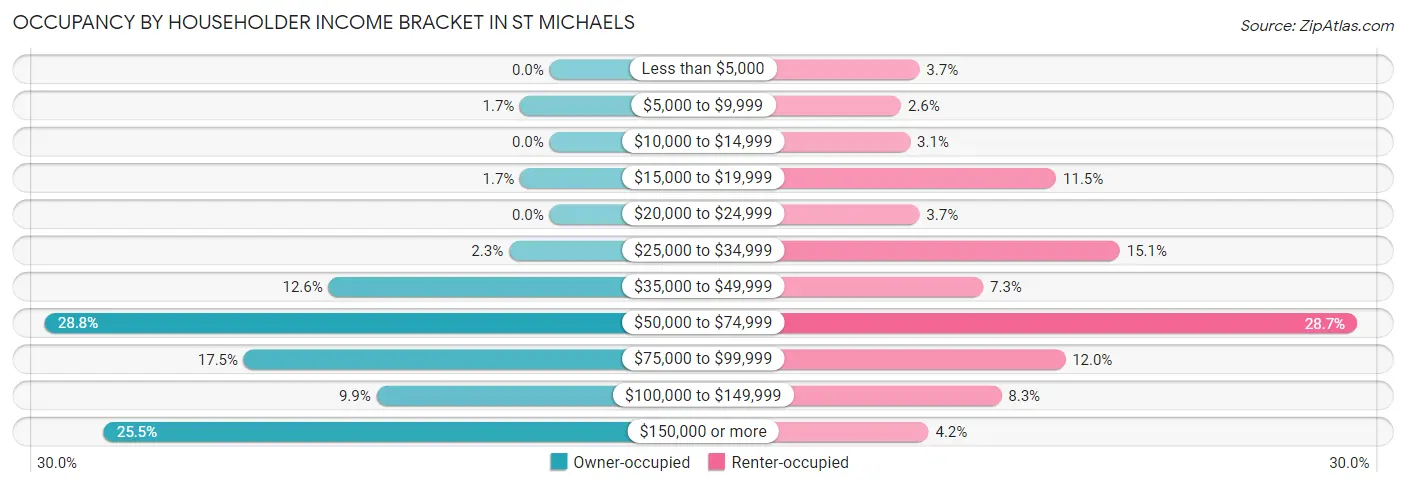
| Income Bracket | Owner-occupied | Renter-occupied |
| Less than $5,000 | 0 (0.0%) | 7 (3.6%) |
| $5,000 to $9,999 | 8 (1.7%) | 5 (2.6%) |
| $10,000 to $14,999 | 0 (0.0%) | 6 (3.1%) |
| $15,000 to $19,999 | 8 (1.7%) | 22 (11.5%) |
| $20,000 to $24,999 | 0 (0.0%) | 7 (3.6%) |
| $25,000 to $34,999 | 11 (2.3%) | 29 (15.1%) |
| $35,000 to $49,999 | 60 (12.6%) | 14 (7.3%) |
| $50,000 to $74,999 | 137 (28.8%) | 55 (28.6%) |
| $75,000 to $99,999 | 83 (17.5%) | 23 (12.0%) |
| $100,000 to $149,999 | 47 (9.9%) | 16 (8.3%) |
| $150,000 or more | 121 (25.5%) | 8 (4.2%) |
| Total | 475 (100.0%) | 192 (100.0%) |
Monthly Housing Cost Tiers in St Michaels
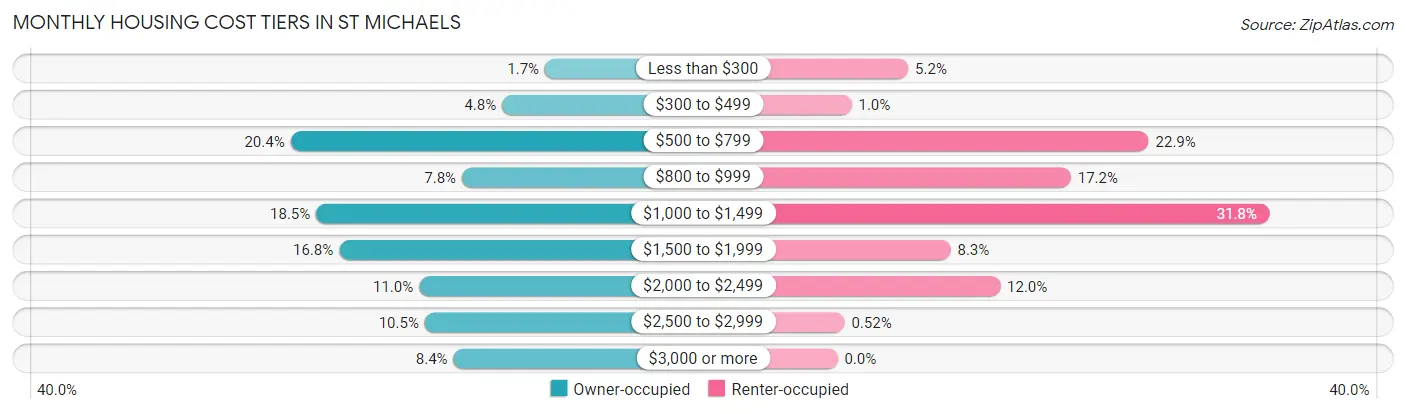
| Monthly Cost | Owner-occupied | Renter-occupied |
| Less than $300 | 8 (1.7%) | 10 (5.2%) |
| $300 to $499 | 23 (4.8%) | 2 (1.0%) |
| $500 to $799 | 97 (20.4%) | 44 (22.9%) |
| $800 to $999 | 37 (7.8%) | 33 (17.2%) |
| $1,000 to $1,499 | 88 (18.5%) | 61 (31.8%) |
| $1,500 to $1,999 | 80 (16.8%) | 16 (8.3%) |
| $2,000 to $2,499 | 52 (11.0%) | 23 (12.0%) |
| $2,500 to $2,999 | 50 (10.5%) | 1 (0.5%) |
| $3,000 or more | 40 (8.4%) | 0 (0.0%) |
| Total | 475 (100.0%) | 192 (100.0%) |
Physical Housing Characteristics in St Michaels
Housing Structures in St Michaels
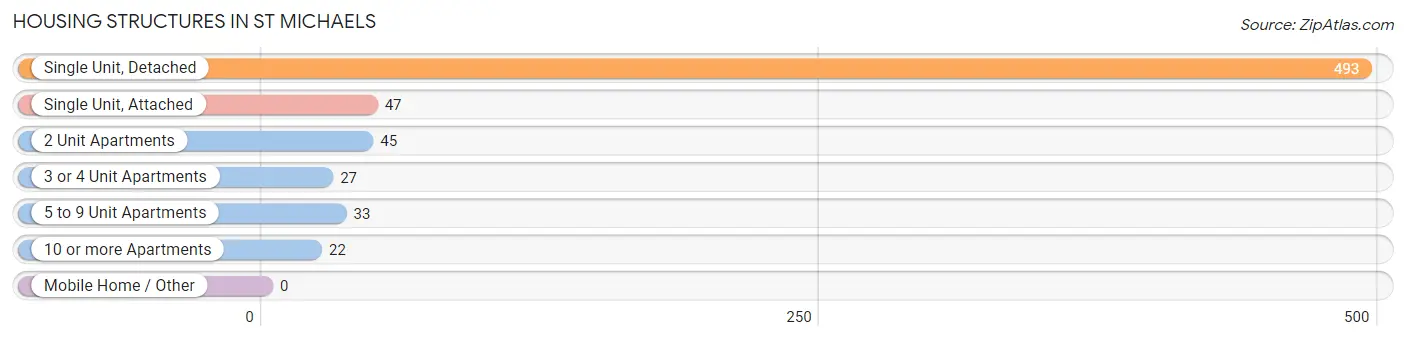
| Structure Type | # Housing Units | % Housing Units |
| Single Unit, Detached | 493 | 73.9% |
| Single Unit, Attached | 47 | 7.0% |
| 2 Unit Apartments | 45 | 6.8% |
| 3 or 4 Unit Apartments | 27 | 4.1% |
| 5 to 9 Unit Apartments | 33 | 5.0% |
| 10 or more Apartments | 22 | 3.3% |
| Mobile Home / Other | 0 | 0.0% |
| Total | 667 | 100.0% |
Housing Structures by Occupancy in St Michaels
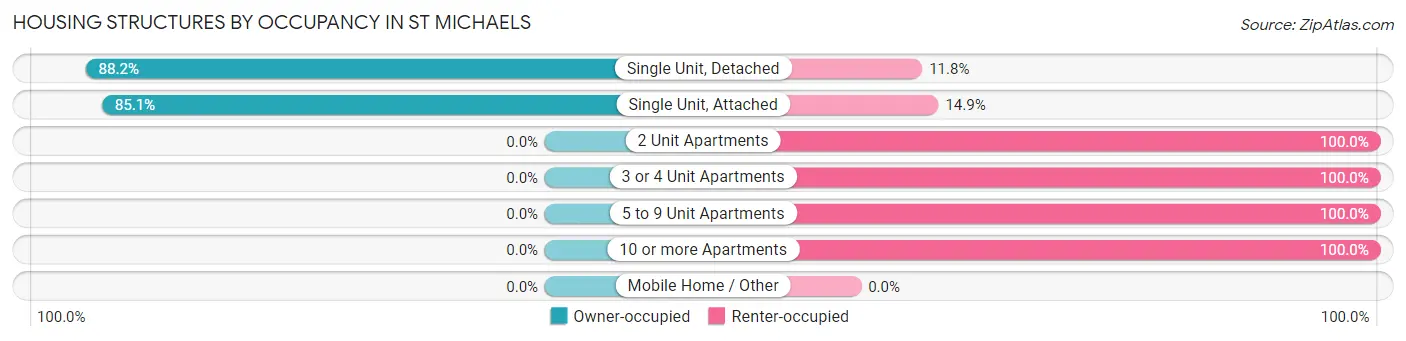
| Structure Type | Owner-occupied | Renter-occupied |
| Single Unit, Detached | 435 (88.2%) | 58 (11.8%) |
| Single Unit, Attached | 40 (85.1%) | 7 (14.9%) |
| 2 Unit Apartments | 0 (0.0%) | 45 (100.0%) |
| 3 or 4 Unit Apartments | 0 (0.0%) | 27 (100.0%) |
| 5 to 9 Unit Apartments | 0 (0.0%) | 33 (100.0%) |
| 10 or more Apartments | 0 (0.0%) | 22 (100.0%) |
| Mobile Home / Other | 0 (0.0%) | 0 (0.0%) |
| Total | 475 (71.2%) | 192 (28.8%) |
Housing Structures by Number of Rooms in St Michaels
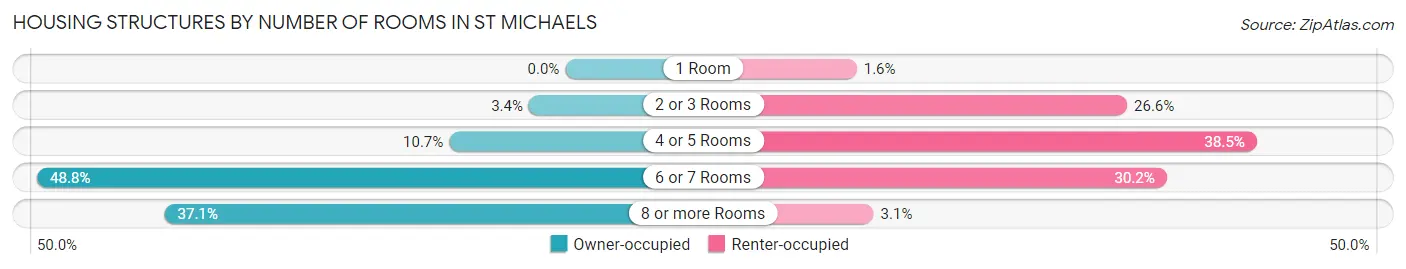
| Number of Rooms | Owner-occupied | Renter-occupied |
| 1 Room | 0 (0.0%) | 3 (1.6%) |
| 2 or 3 Rooms | 16 (3.4%) | 51 (26.6%) |
| 4 or 5 Rooms | 51 (10.7%) | 74 (38.5%) |
| 6 or 7 Rooms | 232 (48.8%) | 58 (30.2%) |
| 8 or more Rooms | 176 (37.0%) | 6 (3.1%) |
| Total | 475 (100.0%) | 192 (100.0%) |
Housing Structure by Heating Type in St Michaels
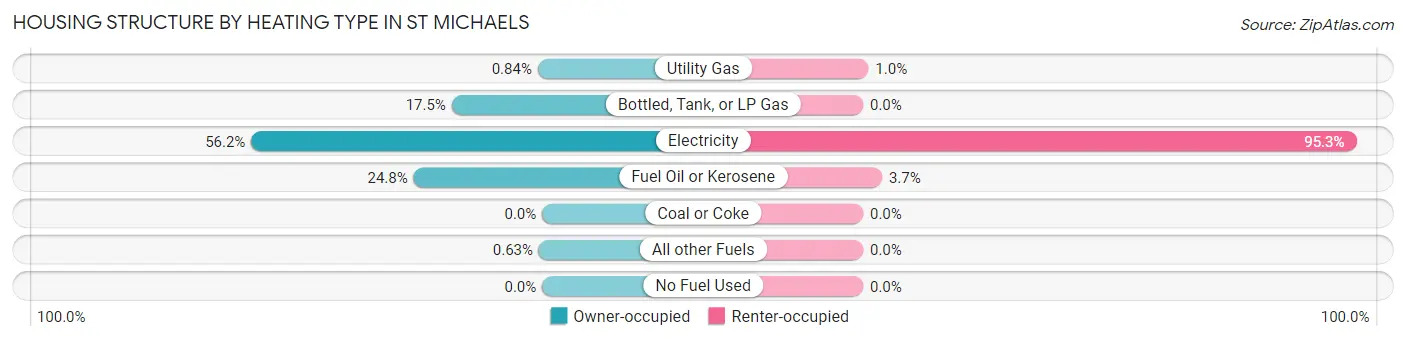
| Heating Type | Owner-occupied | Renter-occupied |
| Utility Gas | 4 (0.8%) | 2 (1.0%) |
| Bottled, Tank, or LP Gas | 83 (17.5%) | 0 (0.0%) |
| Electricity | 267 (56.2%) | 183 (95.3%) |
| Fuel Oil or Kerosene | 118 (24.8%) | 7 (3.6%) |
| Coal or Coke | 0 (0.0%) | 0 (0.0%) |
| All other Fuels | 3 (0.6%) | 0 (0.0%) |
| No Fuel Used | 0 (0.0%) | 0 (0.0%) |
| Total | 475 (100.0%) | 192 (100.0%) |
Household Vehicle Usage in St Michaels
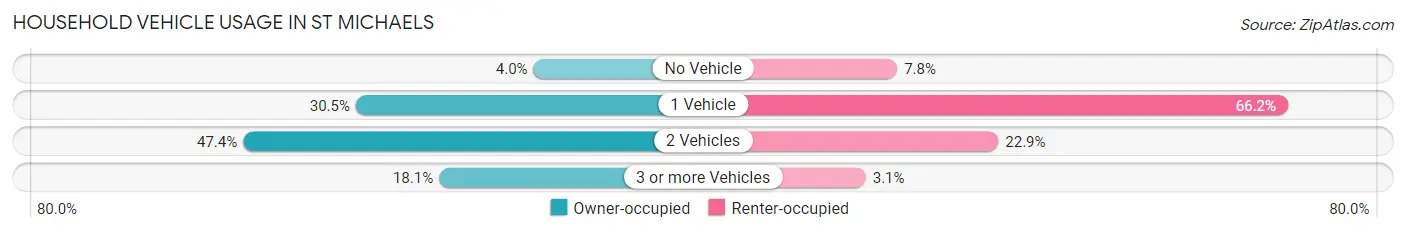
| Vehicles per Household | Owner-occupied | Renter-occupied |
| No Vehicle | 19 (4.0%) | 15 (7.8%) |
| 1 Vehicle | 145 (30.5%) | 127 (66.1%) |
| 2 Vehicles | 225 (47.4%) | 44 (22.9%) |
| 3 or more Vehicles | 86 (18.1%) | 6 (3.1%) |
| Total | 475 (100.0%) | 192 (100.0%) |
Real Estate & Mortgages in St Michaels
Real Estate and Mortgage Overview in St Michaels
| Characteristic | Without Mortgage | With Mortgage |
| Housing Units | 219 | 256 |
| Median Property Value | $618,600 | $440,900 |
| Median Household Income | $73,638 | $64 |
| Monthly Housing Costs | $839 | $40 |
| Real Estate Taxes | $4,342 | $0 |
Property Value by Mortgage Status in St Michaels
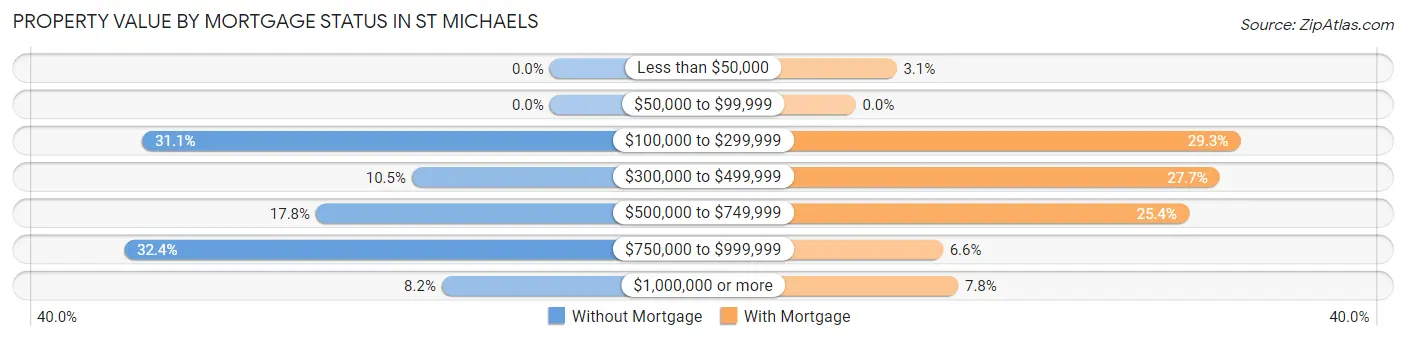
| Property Value | Without Mortgage | With Mortgage |
| Less than $50,000 | 0 (0.0%) | 8 (3.1%) |
| $50,000 to $99,999 | 0 (0.0%) | 0 (0.0%) |
| $100,000 to $299,999 | 68 (31.0%) | 75 (29.3%) |
| $300,000 to $499,999 | 23 (10.5%) | 71 (27.7%) |
| $500,000 to $749,999 | 39 (17.8%) | 65 (25.4%) |
| $750,000 to $999,999 | 71 (32.4%) | 17 (6.6%) |
| $1,000,000 or more | 18 (8.2%) | 20 (7.8%) |
| Total | 219 (100.0%) | 256 (100.0%) |
Household Income by Mortgage Status in St Michaels
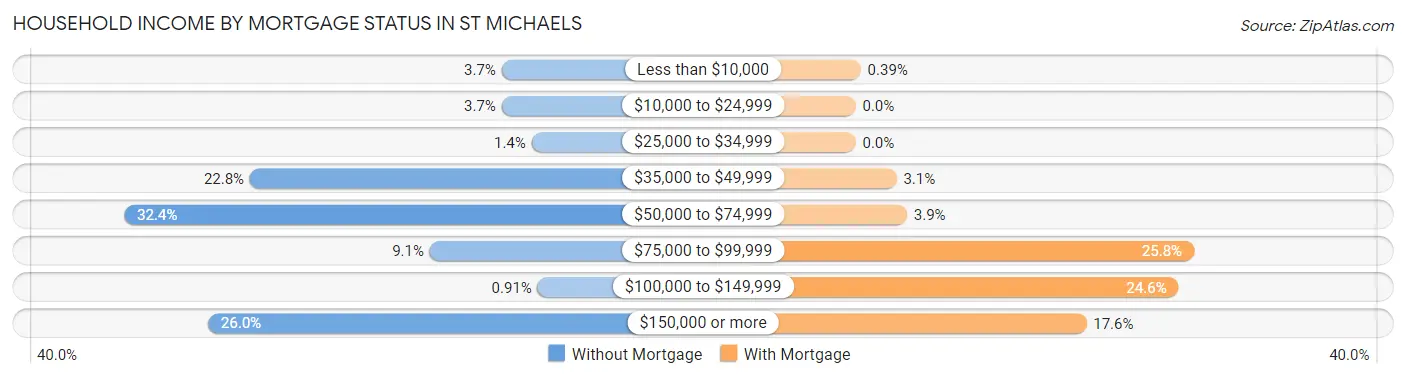
| Household Income | Without Mortgage | With Mortgage |
| Less than $10,000 | 8 (3.6%) | 1 (0.4%) |
| $10,000 to $24,999 | 8 (3.6%) | 0 (0.0%) |
| $25,000 to $34,999 | 3 (1.4%) | 0 (0.0%) |
| $35,000 to $49,999 | 50 (22.8%) | 8 (3.1%) |
| $50,000 to $74,999 | 71 (32.4%) | 10 (3.9%) |
| $75,000 to $99,999 | 20 (9.1%) | 66 (25.8%) |
| $100,000 to $149,999 | 2 (0.9%) | 63 (24.6%) |
| $150,000 or more | 57 (26.0%) | 45 (17.6%) |
| Total | 219 (100.0%) | 256 (100.0%) |
Property Value to Household Income Ratio in St Michaels
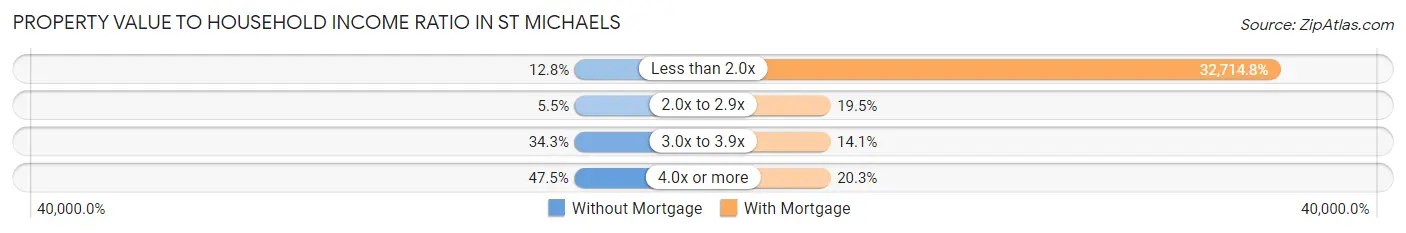
| Value-to-Income Ratio | Without Mortgage | With Mortgage |
| Less than 2.0x | 28 (12.8%) | 83,750 (32,714.8%) |
| 2.0x to 2.9x | 12 (5.5%) | 50 (19.5%) |
| 3.0x to 3.9x | 75 (34.3%) | 36 (14.1%) |
| 4.0x or more | 104 (47.5%) | 52 (20.3%) |
| Total | 219 (100.0%) | 256 (100.0%) |
Real Estate Taxes by Mortgage Status in St Michaels
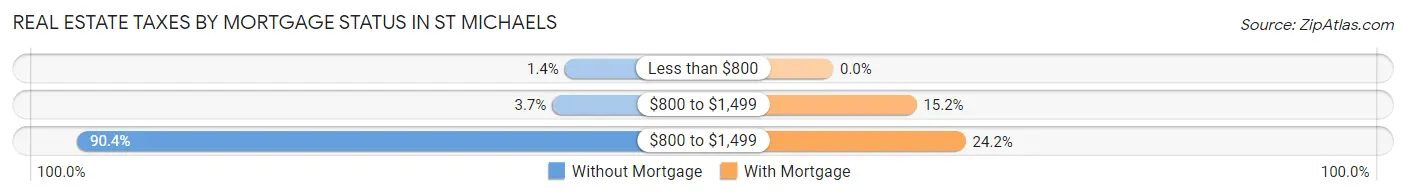
| Property Taxes | Without Mortgage | With Mortgage |
| Less than $800 | 3 (1.4%) | 0 (0.0%) |
| $800 to $1,499 | 8 (3.6%) | 39 (15.2%) |
| $800 to $1,499 | 198 (90.4%) | 62 (24.2%) |
| Total | 219 (100.0%) | 256 (100.0%) |
Health & Disability in St Michaels
Health Insurance Coverage by Age in St Michaels
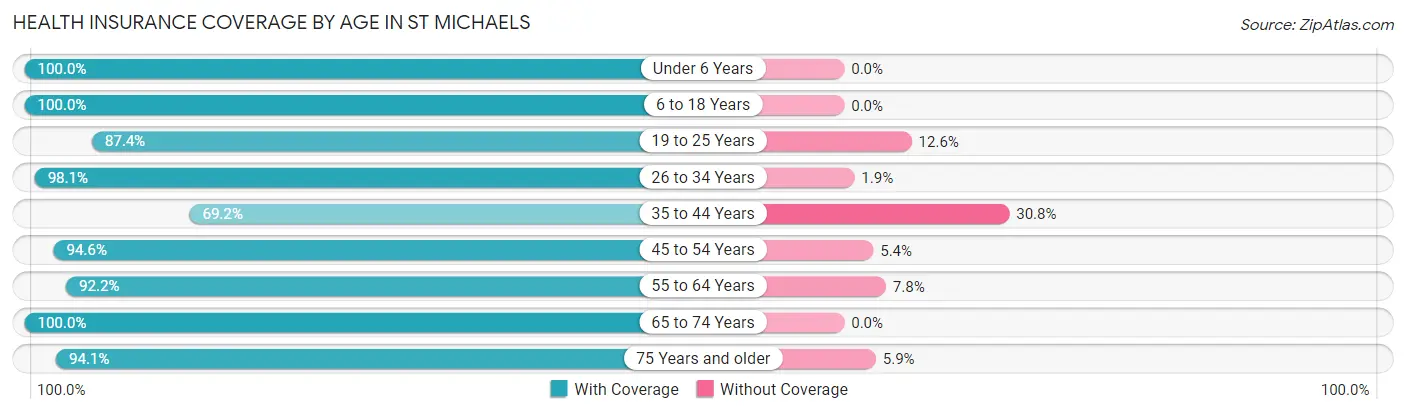
| Age Bracket | With Coverage | Without Coverage |
| Under 6 Years | 28 (100.0%) | 0 (0.0%) |
| 6 to 18 Years | 240 (100.0%) | 0 (0.0%) |
| 19 to 25 Years | 195 (87.4%) | 28 (12.6%) |
| 26 to 34 Years | 52 (98.1%) | 1 (1.9%) |
| 35 to 44 Years | 99 (69.2%) | 44 (30.8%) |
| 45 to 54 Years | 140 (94.6%) | 8 (5.4%) |
| 55 to 64 Years | 214 (92.2%) | 18 (7.8%) |
| 65 to 74 Years | 303 (100.0%) | 0 (0.0%) |
| 75 Years and older | 144 (94.1%) | 9 (5.9%) |
| Total | 1,415 (92.9%) | 108 (7.1%) |
Health Insurance Coverage by Citizenship Status in St Michaels
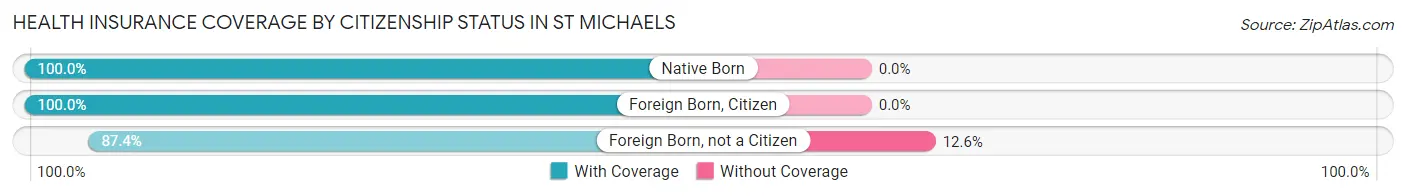
| Citizenship Status | With Coverage | Without Coverage |
| Native Born | 28 (100.0%) | 0 (0.0%) |
| Foreign Born, Citizen | 240 (100.0%) | 0 (0.0%) |
| Foreign Born, not a Citizen | 195 (87.4%) | 28 (12.6%) |
Health Insurance Coverage by Household Income in St Michaels
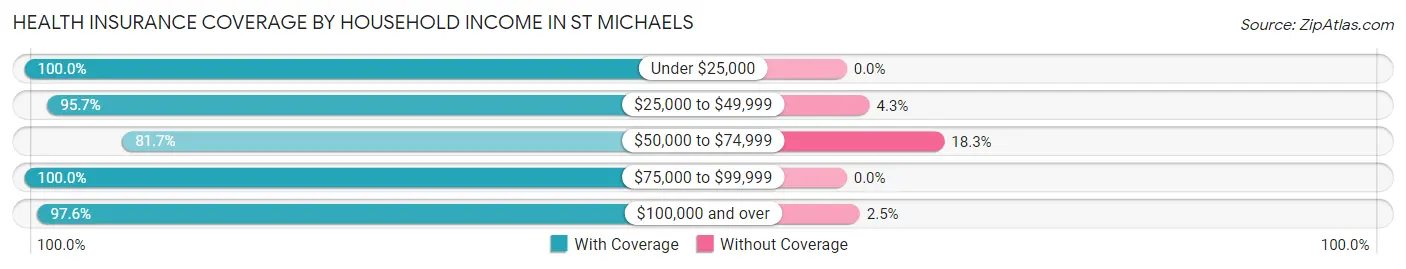
| Household Income | With Coverage | Without Coverage |
| Under $25,000 | 74 (100.0%) | 0 (0.0%) |
| $25,000 to $49,999 | 202 (95.7%) | 9 (4.3%) |
| $50,000 to $74,999 | 402 (81.7%) | 90 (18.3%) |
| $75,000 to $99,999 | 378 (100.0%) | 0 (0.0%) |
| $100,000 and over | 359 (97.6%) | 9 (2.5%) |
Public vs Private Health Insurance Coverage by Age in St Michaels
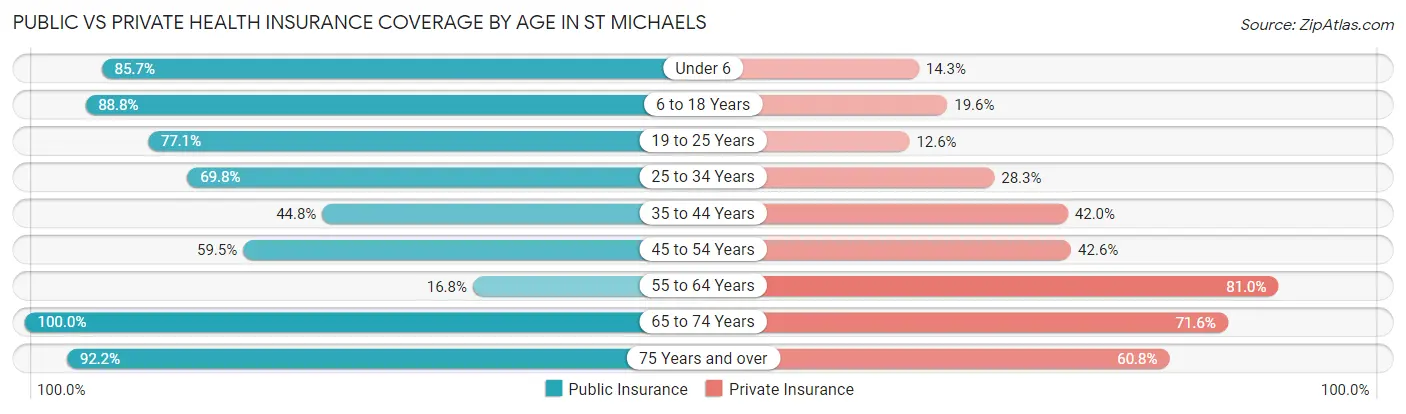
| Age Bracket | Public Insurance | Private Insurance |
| Under 6 | 24 (85.7%) | 4 (14.3%) |
| 6 to 18 Years | 213 (88.7%) | 47 (19.6%) |
| 19 to 25 Years | 172 (77.1%) | 28 (12.6%) |
| 25 to 34 Years | 37 (69.8%) | 15 (28.3%) |
| 35 to 44 Years | 64 (44.8%) | 60 (42.0%) |
| 45 to 54 Years | 88 (59.5%) | 63 (42.6%) |
| 55 to 64 Years | 39 (16.8%) | 188 (81.0%) |
| 65 to 74 Years | 303 (100.0%) | 217 (71.6%) |
| 75 Years and over | 141 (92.2%) | 93 (60.8%) |
| Total | 1,081 (71.0%) | 715 (46.9%) |
Disability Status by Sex by Age in St Michaels
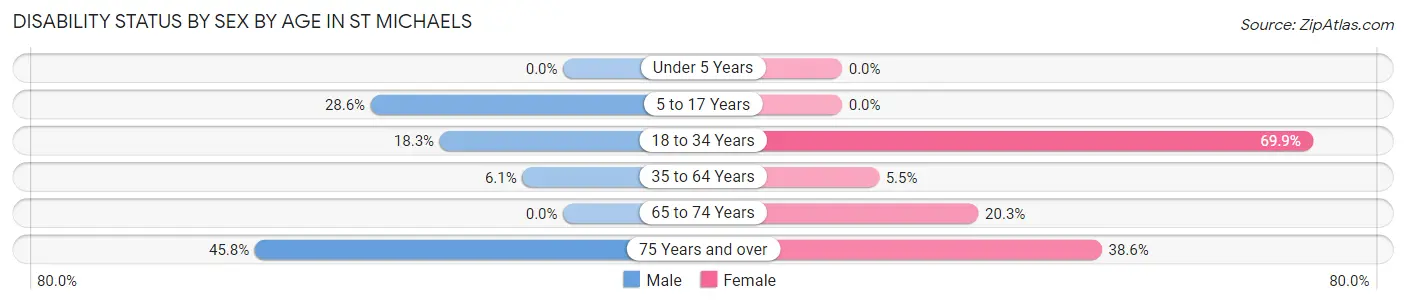
| Age Bracket | Male | Female |
| Under 5 Years | 0 (0.0%) | 0 (0.0%) |
| 5 to 17 Years | 32 (28.6%) | 0 (0.0%) |
| 18 to 34 Years | 11 (18.3%) | 151 (69.9%) |
| 35 to 64 Years | 14 (6.1%) | 16 (5.5%) |
| 65 to 74 Years | 0 (0.0%) | 33 (20.3%) |
| 75 Years and over | 38 (45.8%) | 27 (38.6%) |
Disability Class by Sex by Age in St Michaels
Disability Class: Hearing Difficulty
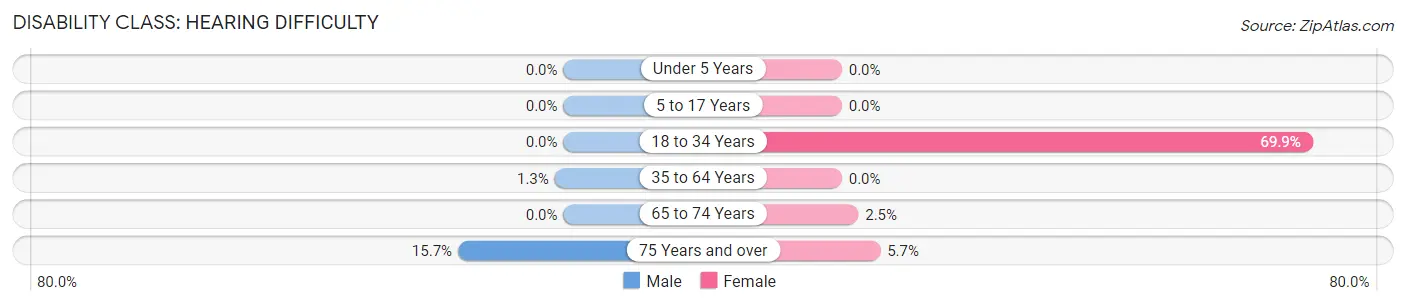
| Age Bracket | Male | Female |
| Under 5 Years | 0 (0.0%) | 0 (0.0%) |
| 5 to 17 Years | 0 (0.0%) | 0 (0.0%) |
| 18 to 34 Years | 0 (0.0%) | 151 (69.9%) |
| 35 to 64 Years | 3 (1.3%) | 0 (0.0%) |
| 65 to 74 Years | 0 (0.0%) | 4 (2.5%) |
| 75 Years and over | 13 (15.7%) | 4 (5.7%) |
Disability Class: Vision Difficulty
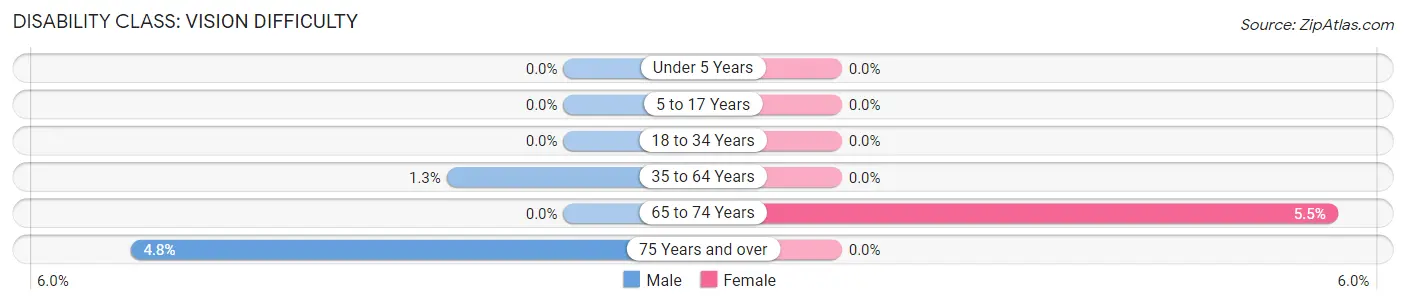
| Age Bracket | Male | Female |
| Under 5 Years | 0 (0.0%) | 0 (0.0%) |
| 5 to 17 Years | 0 (0.0%) | 0 (0.0%) |
| 18 to 34 Years | 0 (0.0%) | 0 (0.0%) |
| 35 to 64 Years | 3 (1.3%) | 0 (0.0%) |
| 65 to 74 Years | 0 (0.0%) | 9 (5.5%) |
| 75 Years and over | 4 (4.8%) | 0 (0.0%) |
Disability Class: Cognitive Difficulty
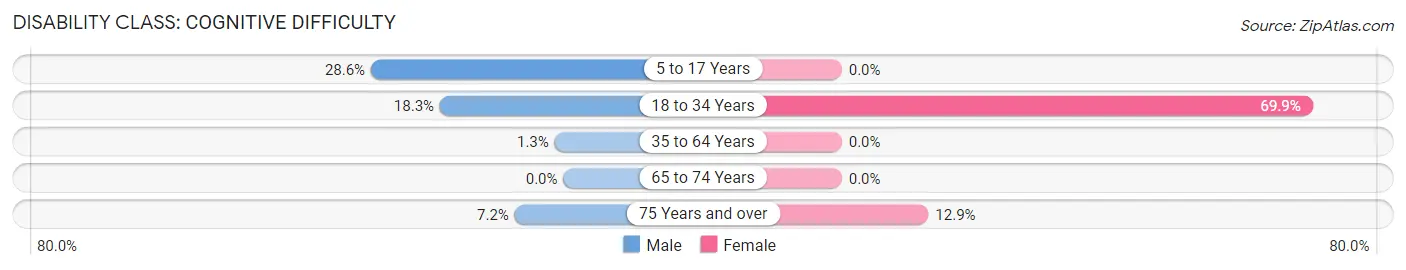
| Age Bracket | Male | Female |
| 5 to 17 Years | 32 (28.6%) | 0 (0.0%) |
| 18 to 34 Years | 11 (18.3%) | 151 (69.9%) |
| 35 to 64 Years | 3 (1.3%) | 0 (0.0%) |
| 65 to 74 Years | 0 (0.0%) | 0 (0.0%) |
| 75 Years and over | 6 (7.2%) | 9 (12.9%) |
Disability Class: Ambulatory Difficulty
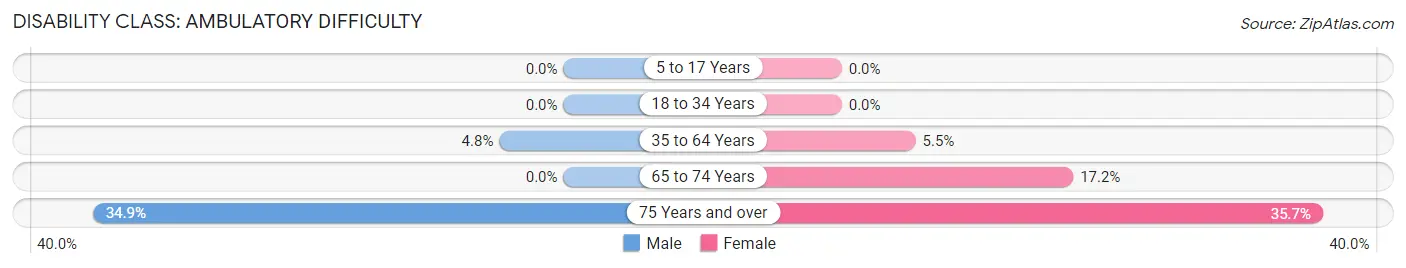
| Age Bracket | Male | Female |
| 5 to 17 Years | 0 (0.0%) | 0 (0.0%) |
| 18 to 34 Years | 0 (0.0%) | 0 (0.0%) |
| 35 to 64 Years | 11 (4.8%) | 16 (5.5%) |
| 65 to 74 Years | 0 (0.0%) | 28 (17.2%) |
| 75 Years and over | 29 (34.9%) | 25 (35.7%) |
Disability Class: Self-Care Difficulty
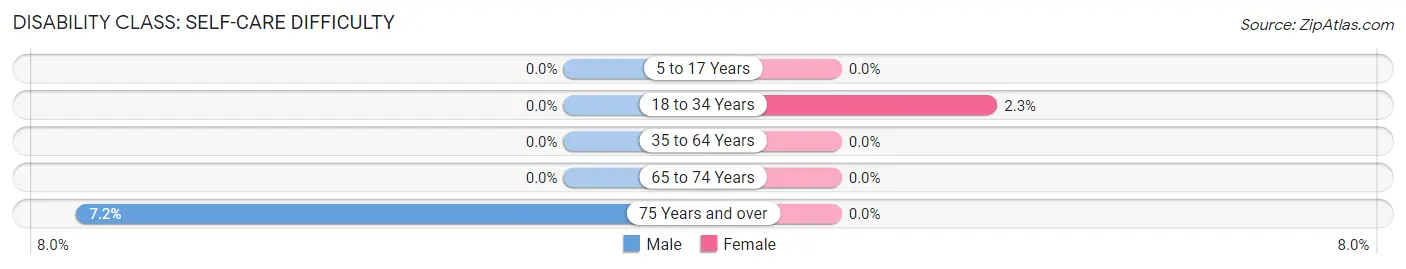
| Age Bracket | Male | Female |
| 5 to 17 Years | 0 (0.0%) | 0 (0.0%) |
| 18 to 34 Years | 0 (0.0%) | 5 (2.3%) |
| 35 to 64 Years | 0 (0.0%) | 0 (0.0%) |
| 65 to 74 Years | 0 (0.0%) | 0 (0.0%) |
| 75 Years and over | 6 (7.2%) | 0 (0.0%) |
Technology Access in St Michaels
Computing Device Access in St Michaels
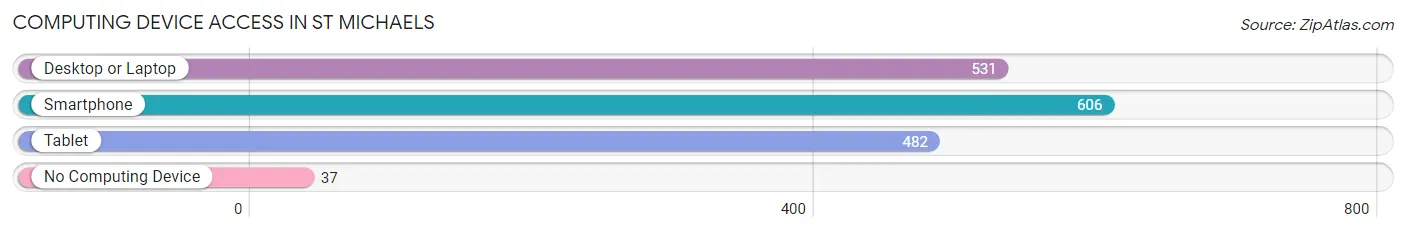
| Device Type | # Households | % Households |
| Desktop or Laptop | 531 | 79.6% |
| Smartphone | 606 | 90.8% |
| Tablet | 482 | 72.3% |
| No Computing Device | 37 | 5.6% |
| Total | 667 | 100.0% |
Internet Access in St Michaels
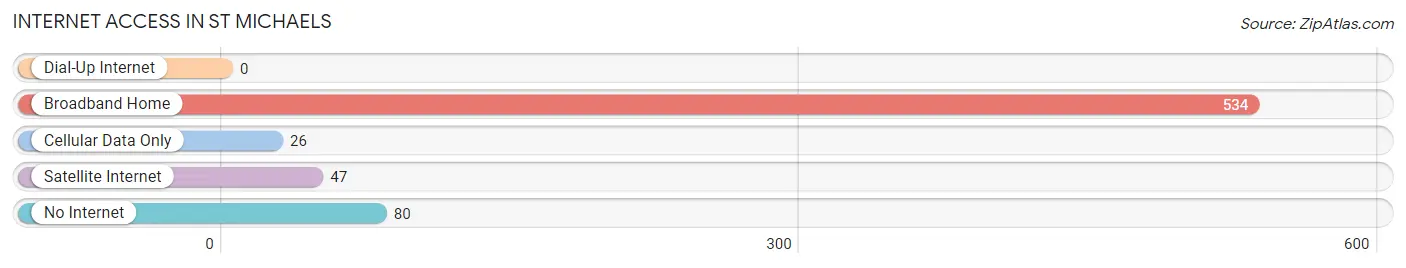
| Internet Type | # Households | % Households |
| Dial-Up Internet | 0 | 0.0% |
| Broadband Home | 534 | 80.1% |
| Cellular Data Only | 26 | 3.9% |
| Satellite Internet | 47 | 7.0% |
| No Internet | 80 | 12.0% |
| Total | 667 | 100.0% |
St Michaels Summary
St. Michaels, Maryland is a small town located on the Eastern Shore of Maryland, approximately 100 miles east of Washington, D.C. It is a popular tourist destination due to its picturesque waterfront, historic buildings, and charming atmosphere. The town is situated on the Miles River, which is part of the Chesapeake Bay. St. Michaels is known for its seafood, sailing, and maritime heritage.
History
St. Michaels was founded in 1677 by English settlers. The town was named after St. Michael the Archangel, and was originally a fishing and trading port. In the late 1700s, the town became a major shipbuilding center, and many of the ships built in St. Michaels were used in the War of 1812. The town was also home to the first naval academy in the United States, which was established in 1845.
In the late 1800s, St. Michaels became a popular tourist destination. The town was known for its seafood, sailing, and maritime heritage. In the early 1900s, the town was home to several large canneries, which processed seafood for export.
Geography
St. Michaels is located on the Eastern Shore of Maryland, approximately 100 miles east of Washington, D.C. The town is situated on the Miles River, which is part of the Chesapeake Bay. The town is surrounded by farmland and forests, and is home to several small islands.
The climate in St. Michaels is mild, with hot summers and cool winters. The average temperature in the summer is around 80 degrees Fahrenheit, and the average temperature in the winter is around 40 degrees Fahrenheit.
Economy
The economy of St. Michaels is largely based on tourism. The town is home to several marinas, restaurants, and shops, which attract visitors from all over the world. The town is also home to several boatyards, which build and repair boats.
The town is also home to several seafood processing plants, which process seafood for export. The town is also home to several wineries, which produce wine from local grapes.
Demographics
As of the 2010 census, the population of St. Michaels was 1,077. The median age of the population was 48.7 years, and the median household income was $50,000. The town is predominantly white, with a small African American population.
The town is home to several churches, including St. Michaels Catholic Church, St. Michaels Episcopal Church, and St. Michaels Lutheran Church. The town is also home to several schools, including St. Michaels Elementary School, St. Michaels Middle School, and St. Michaels High School.
Conclusion
St. Michaels, Maryland is a small town located on the Eastern Shore of Maryland, approximately 100 miles east of Washington, D.C. It is a popular tourist destination due to its picturesque waterfront, historic buildings, and charming atmosphere. The town is known for its seafood, sailing, and maritime heritage. The economy of St. Michaels is largely based on tourism, and the town is home to several marinas, restaurants, and shops. The population of St. Michaels is predominantly white, with a small African American population. The town is home to several churches and schools, and is a popular destination for visitors from all over the world.
Common Questions
What is Per Capita Income in St Michaels?
Per Capita income in St Michaels is $55,877.
What is the Median Family Income in St Michaels?
Median Family Income in St Michaels is $74,321.
What is the Median Household income in St Michaels?
Median Household Income in St Michaels is $73,415.
What is Income or Wage Gap in St Michaels?
Income or Wage Gap in St Michaels is 24.7%.
Women in St Michaels earn 75.3 cents for every dollar earned by a man.
What is Inequality or Gini Index in St Michaels?
Inequality or Gini Index in St Michaels is 0.53.
What is the Total Population of St Michaels?
Total Population of St Michaels is 1,523.
What is the Total Male Population of St Michaels?
Total Male Population of St Michaels is 629.
What is the Total Female Population of St Michaels?
Total Female Population of St Michaels is 894.
What is the Ratio of Males per 100 Females in St Michaels?
There are 70.36 Males per 100 Females in St Michaels.
What is the Ratio of Females per 100 Males in St Michaels?
There are 142.13 Females per 100 Males in St Michaels.
What is the Median Population Age in St Michaels?
Median Population Age in St Michaels is 49.8 Years.
What is the Average Family Size in St Michaels
Average Family Size in St Michaels is 2.6 People.
What is the Average Household Size in St Michaels
Average Household Size in St Michaels is 2.3 People.
How Large is the Labor Force in St Michaels?
There are 686 People in the Labor Forcein in St Michaels.
What is the Percentage of People in the Labor Force in St Michaels?
53.1% of People are in the Labor Force in St Michaels.
What is the Unemployment Rate in St Michaels?
Unemployment Rate in St Michaels is 7.6%.