South Bradenton, FL Map & Demographics
South Bradenton Map
South Bradenton Overview
$27,921
PER CAPITA INCOME
$52,511
AVG FAMILY INCOME
$44,347
AVG HOUSEHOLD INCOME
24.6%
WAGE / INCOME GAP [ % ]
75.4¢/ $1
WAGE / INCOME GAP [ $ ]
$9,567
FAMILY INCOME DEFICIT
0.45
INEQUALITY / GINI INDEX
25,471
TOTAL POPULATION
12,197
MALE POPULATION
13,274
FEMALE POPULATION
91.89
MALES / 100 FEMALES
108.83
FEMALES / 100 MALES
45.1
MEDIAN AGE
3.1
AVG FAMILY SIZE
2.3
AVG HOUSEHOLD SIZE
12,334
LABOR FORCE [ PEOPLE ]
56.8%
PERCENT IN LABOR FORCE
6.1%
UNEMPLOYMENT RATE
Income in South Bradenton
Income Overview in South Bradenton
Per Capita Income in South Bradenton is $27,921, while median incomes of families and households are $52,511 and $44,347 respectively.
| Characteristic | Number | Measure |
| Per Capita Income | 25,471 | $27,921 |
| Median Family Income | 5,969 | $52,511 |
| Mean Family Income | 5,969 | $67,247 |
| Median Household Income | 10,950 | $44,347 |
| Mean Household Income | 10,950 | $59,205 |
| Income Deficit | 5,969 | $9,567 |
| Wage / Income Gap (%) | 25,471 | 24.58% |
| Wage / Income Gap ($) | 25,471 | 75.42¢ per $1 |
| Gini / Inequality Index | 25,471 | 0.45 |
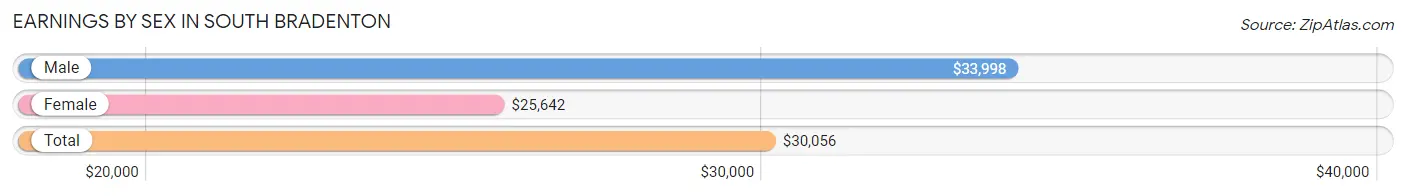
Earnings by Sex in South Bradenton
Average Earnings in South Bradenton are $30,056, $33,998 for men and $25,642 for women, a difference of 24.6%.
| Sex | Number | Average Earnings |
| Male | 6,561 (52.4%) | $33,998 |
| Female | 5,953 (47.6%) | $25,642 |
| Total | 12,514 (100.0%) | $30,056 |
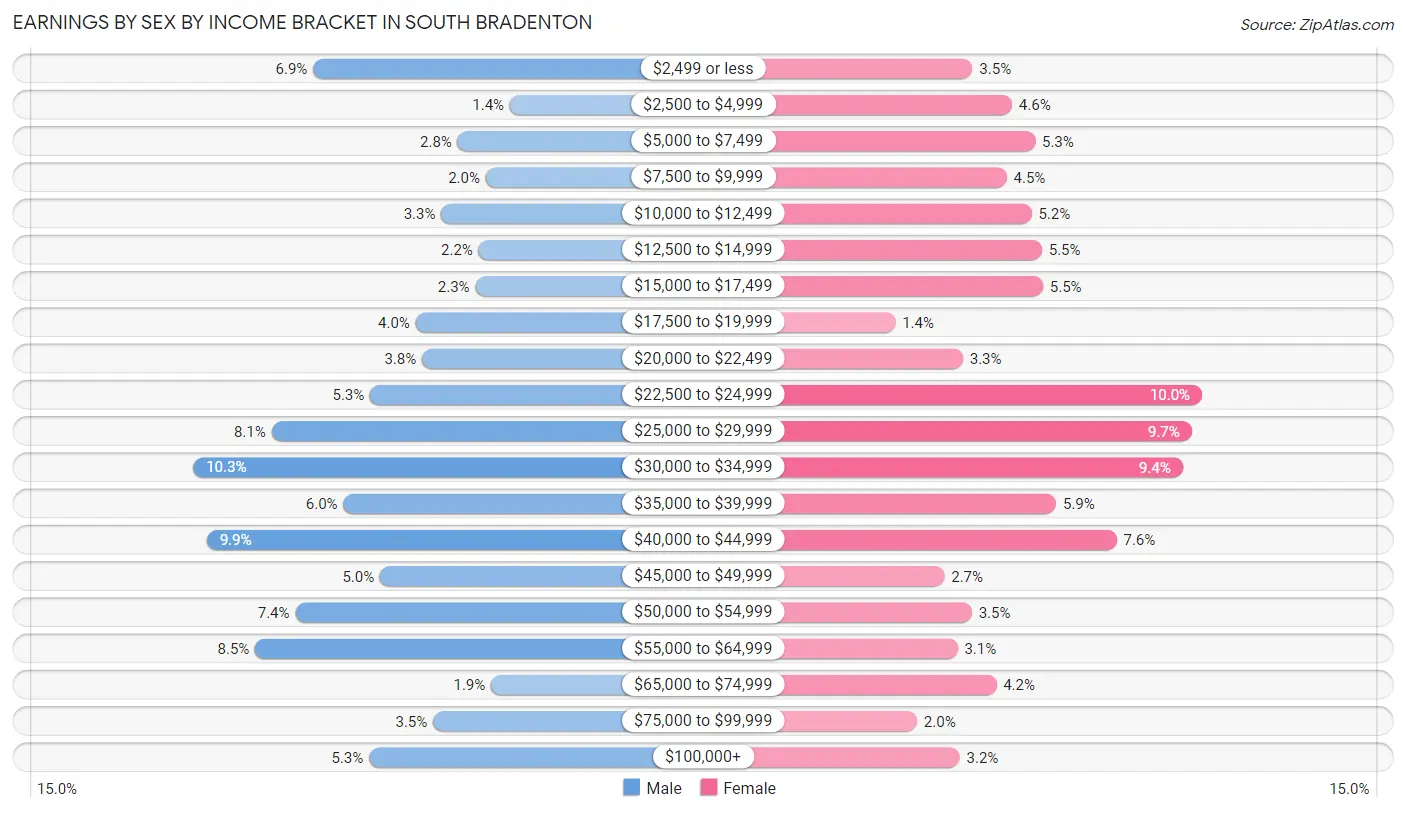
Earnings by Sex by Income Bracket in South Bradenton
The most common earnings brackets in South Bradenton are $30,000 to $34,999 for men (673 | 10.3%) and $22,500 to $24,999 for women (594 | 10.0%).
| Income | Male | Female |
| $2,499 or less | 452 (6.9%) | 210 (3.5%) |
| $2,500 to $4,999 | 89 (1.4%) | 276 (4.6%) |
| $5,000 to $7,499 | 186 (2.8%) | 315 (5.3%) |
| $7,500 to $9,999 | 134 (2.0%) | 267 (4.5%) |
| $10,000 to $12,499 | 216 (3.3%) | 309 (5.2%) |
| $12,500 to $14,999 | 147 (2.2%) | 326 (5.5%) |
| $15,000 to $17,499 | 153 (2.3%) | 328 (5.5%) |
| $17,500 to $19,999 | 263 (4.0%) | 81 (1.4%) |
| $20,000 to $22,499 | 251 (3.8%) | 194 (3.3%) |
| $22,500 to $24,999 | 347 (5.3%) | 594 (10.0%) |
| $25,000 to $29,999 | 529 (8.1%) | 577 (9.7%) |
| $30,000 to $34,999 | 673 (10.3%) | 562 (9.4%) |
| $35,000 to $39,999 | 396 (6.0%) | 350 (5.9%) |
| $40,000 to $44,999 | 648 (9.9%) | 451 (7.6%) |
| $45,000 to $49,999 | 329 (5.0%) | 163 (2.7%) |
| $50,000 to $54,999 | 485 (7.4%) | 209 (3.5%) |
| $55,000 to $64,999 | 559 (8.5%) | 185 (3.1%) |
| $65,000 to $74,999 | 124 (1.9%) | 250 (4.2%) |
| $75,000 to $99,999 | 231 (3.5%) | 117 (2.0%) |
| $100,000+ | 349 (5.3%) | 189 (3.2%) |
| Total | 6,561 (100.0%) | 5,953 (100.0%) |
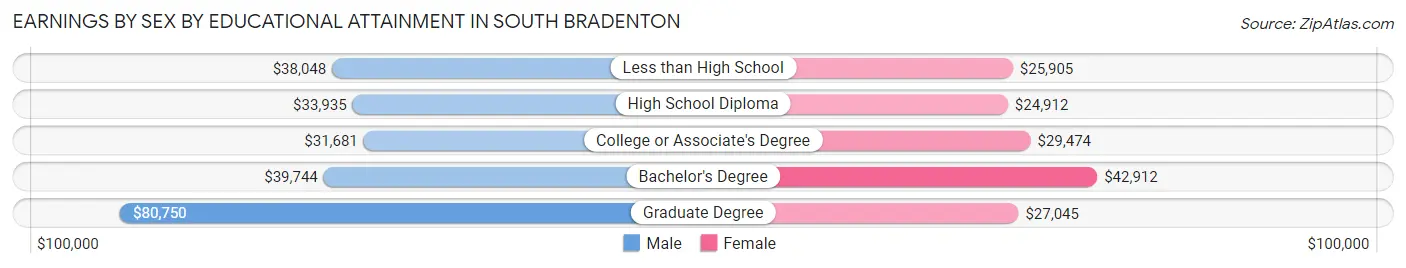
Earnings by Sex by Educational Attainment in South Bradenton
Average earnings in South Bradenton are $35,212 for men and $28,516 for women, a difference of 19.0%. Men with an educational attainment of graduate degree enjoy the highest average annual earnings of $80,750, while those with college or associate's degree education earn the least with $31,681. Women with an educational attainment of bachelor's degree earn the most with the average annual earnings of $42,912, while those with high school diploma education have the smallest earnings of $24,912.
| Educational Attainment | Male Income | Female Income |
| Less than High School | $38,048 | $25,905 |
| High School Diploma | $33,935 | $24,912 |
| College or Associate's Degree | $31,681 | $29,474 |
| Bachelor's Degree | $39,744 | $42,912 |
| Graduate Degree | $80,750 | $27,045 |
| Total | $35,212 | $28,516 |
Family Income in South Bradenton
Family Income Brackets in South Bradenton
According to the South Bradenton family income data, there are 1,719 families falling into the $50,000 to $74,999 income range, which is the most common income bracket and makes up 28.8% of all families. Conversely, the $150,000 to $199,999 income bracket is the least frequent group with only 137 families (2.3%) belonging to this category.
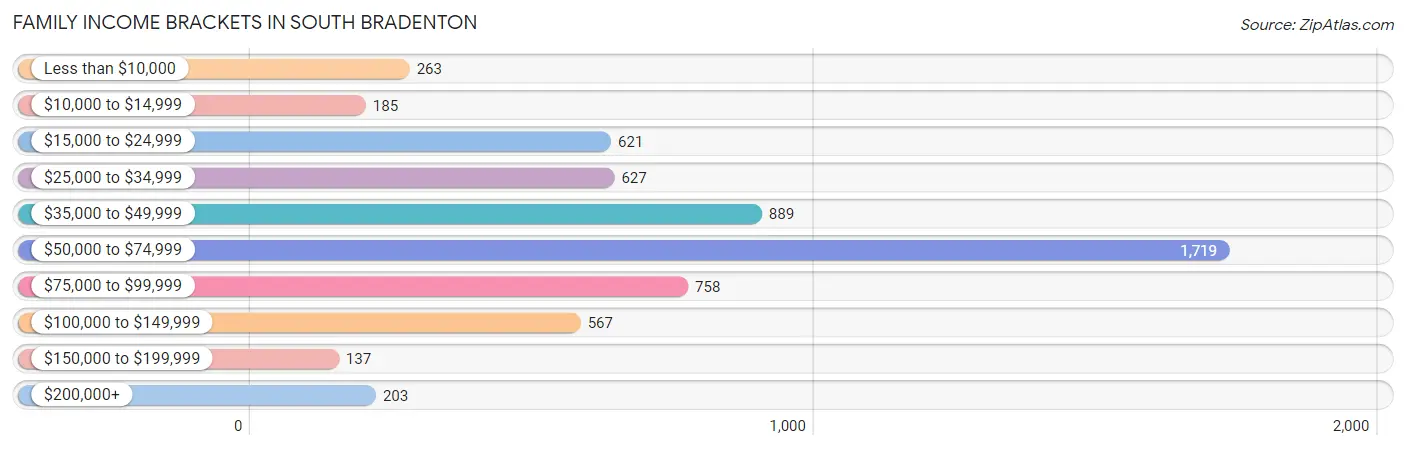
| Income Bracket | # Families | % Families |
| Less than $10,000 | 263 | 4.4% |
| $10,000 to $14,999 | 185 | 3.1% |
| $15,000 to $24,999 | 621 | 10.4% |
| $25,000 to $34,999 | 627 | 10.5% |
| $35,000 to $49,999 | 889 | 14.9% |
| $50,000 to $74,999 | 1,719 | 28.8% |
| $75,000 to $99,999 | 758 | 12.7% |
| $100,000 to $149,999 | 567 | 9.5% |
| $150,000 to $199,999 | 137 | 2.3% |
| $200,000+ | 203 | 3.4% |
Family Income by Famaliy Size in South Bradenton
5-person families (402 | 6.7%) account for the highest median family income in South Bradenton with $87,308 per family, while 2-person families (3,619 | 60.6%) have the highest median income of $25,402 per family member.
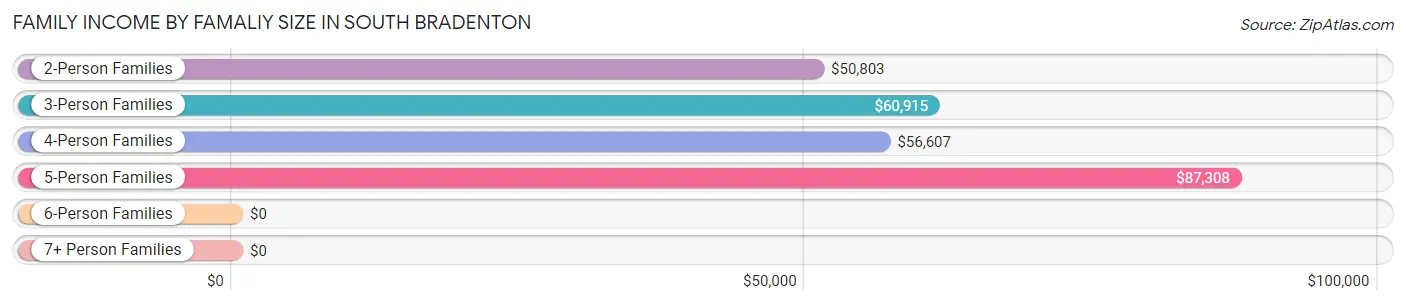
| Income Bracket | # Families | Median Income |
| 2-Person Families | 3,619 (60.6%) | $50,803 |
| 3-Person Families | 1,288 (21.6%) | $60,915 |
| 4-Person Families | 603 (10.1%) | $56,607 |
| 5-Person Families | 402 (6.7%) | $87,308 |
| 6-Person Families | 29 (0.5%) | $0 |
| 7+ Person Families | 28 (0.5%) | $0 |
| Total | 5,969 (100.0%) | $52,511 |
Family Income by Number of Earners in South Bradenton
The median family income in South Bradenton is $52,511, with families comprising 3+ earners (519) having the highest median family income of $91,827, while families with no earners (1,495) have the lowest median family income of $38,523, accounting for 8.7% and 25.1% of families, respectively.
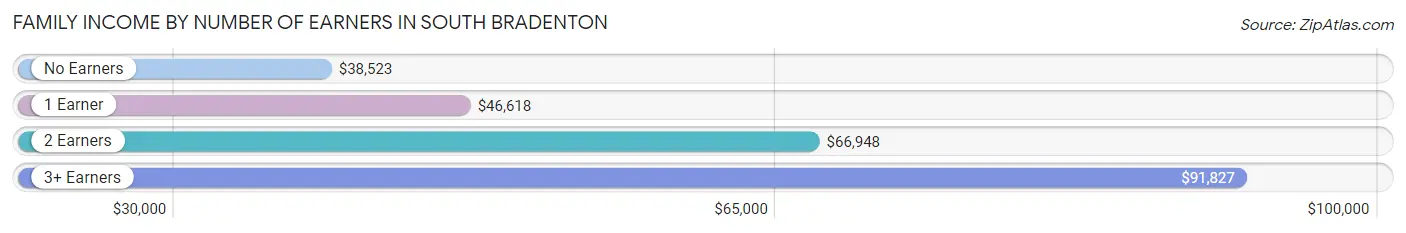
| Number of Earners | # Families | Median Income |
| No Earners | 1,495 (25.1%) | $38,523 |
| 1 Earner | 2,270 (38.0%) | $46,618 |
| 2 Earners | 1,685 (28.2%) | $66,948 |
| 3+ Earners | 519 (8.7%) | $91,827 |
| Total | 5,969 (100.0%) | $52,511 |
Household Income in South Bradenton
Household Income Brackets in South Bradenton
With 2,332 households falling in the category, the $50,000 to $74,999 income range is the most frequent in South Bradenton, accounting for 21.3% of all households. In contrast, only 197 households (1.8%) fall into the $150,000 to $199,999 income bracket, making it the least populous group.
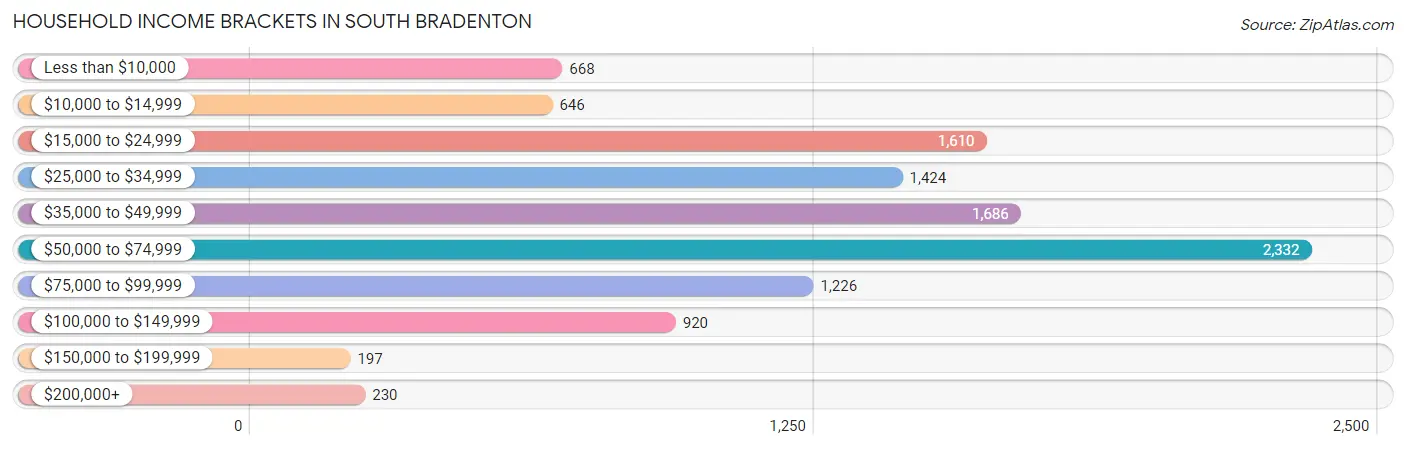
| Income Bracket | # Households | % Households |
| Less than $10,000 | 668 | 6.1% |
| $10,000 to $14,999 | 646 | 5.9% |
| $15,000 to $24,999 | 1,610 | 14.7% |
| $25,000 to $34,999 | 1,424 | 13.0% |
| $35,000 to $49,999 | 1,686 | 15.4% |
| $50,000 to $74,999 | 2,332 | 21.3% |
| $75,000 to $99,999 | 1,226 | 11.2% |
| $100,000 to $149,999 | 920 | 8.4% |
| $150,000 to $199,999 | 197 | 1.8% |
| $200,000+ | 230 | 2.1% |
Household Income by Householder Age in South Bradenton
The median household income in South Bradenton is $44,347, with the highest median household income of $49,221 found in the 45 to 64 years age bracket for the primary householder. A total of 3,648 households (33.3%) fall into this category. Meanwhile, the 65+ years age bracket for the primary householder has the lowest median household income of $39,871, with 4,249 households (38.8%) in this group.
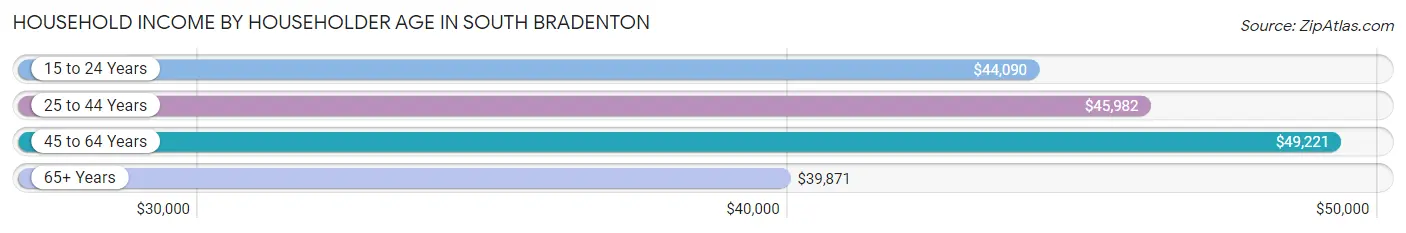
| Income Bracket | # Households | Median Income |
| 15 to 24 Years | 347 (3.2%) | $44,090 |
| 25 to 44 Years | 2,706 (24.7%) | $45,982 |
| 45 to 64 Years | 3,648 (33.3%) | $49,221 |
| 65+ Years | 4,249 (38.8%) | $39,871 |
| Total | 10,950 (100.0%) | $44,347 |
Poverty in South Bradenton
Income Below Poverty by Sex and Age in South Bradenton
With 15.8% poverty level for males and 15.8% for females among the residents of South Bradenton, 5 year old males and 15 year old females are the most vulnerable to poverty, with 22 males (68.8%) and 47 females (32.0%) in their respective age groups living below the poverty level.
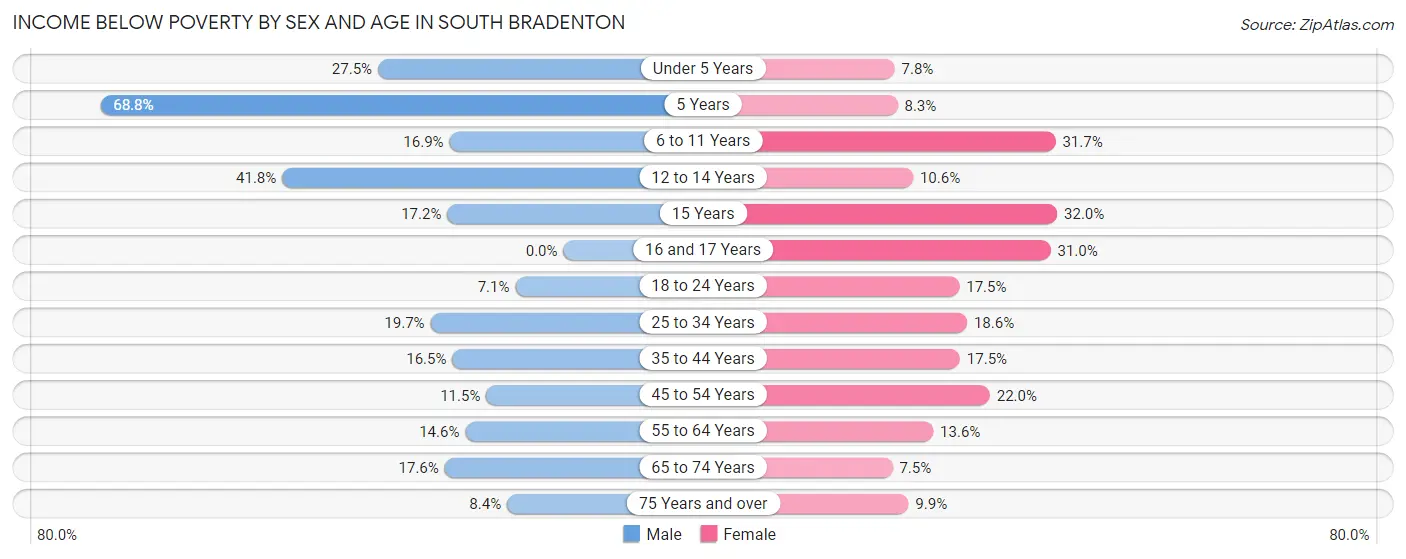
| Age Bracket | Male | Female |
| Under 5 Years | 130 (27.5%) | 59 (7.8%) |
| 5 Years | 22 (68.8%) | 13 (8.3%) |
| 6 to 11 Years | 124 (16.9%) | 237 (31.7%) |
| 12 to 14 Years | 157 (41.8%) | 28 (10.6%) |
| 15 Years | 10 (17.2%) | 47 (32.0%) |
| 16 and 17 Years | 0 (0.0%) | 84 (31.0%) |
| 18 to 24 Years | 81 (7.1%) | 218 (17.4%) |
| 25 to 34 Years | 388 (19.7%) | 341 (18.6%) |
| 35 to 44 Years | 190 (16.5%) | 217 (17.5%) |
| 45 to 54 Years | 198 (11.5%) | 288 (22.0%) |
| 55 to 64 Years | 236 (14.6%) | 251 (13.6%) |
| 65 to 74 Years | 271 (17.6%) | 120 (7.5%) |
| 75 Years and over | 101 (8.4%) | 175 (9.9%) |
| Total | 1,908 (15.8%) | 2,078 (15.8%) |
Income Above Poverty by Sex and Age in South Bradenton
According to the poverty statistics in South Bradenton, males aged 16 and 17 years and females aged 65 to 74 years are the age groups that are most secure financially, with 100.0% of males and 92.5% of females in these age groups living above the poverty line.
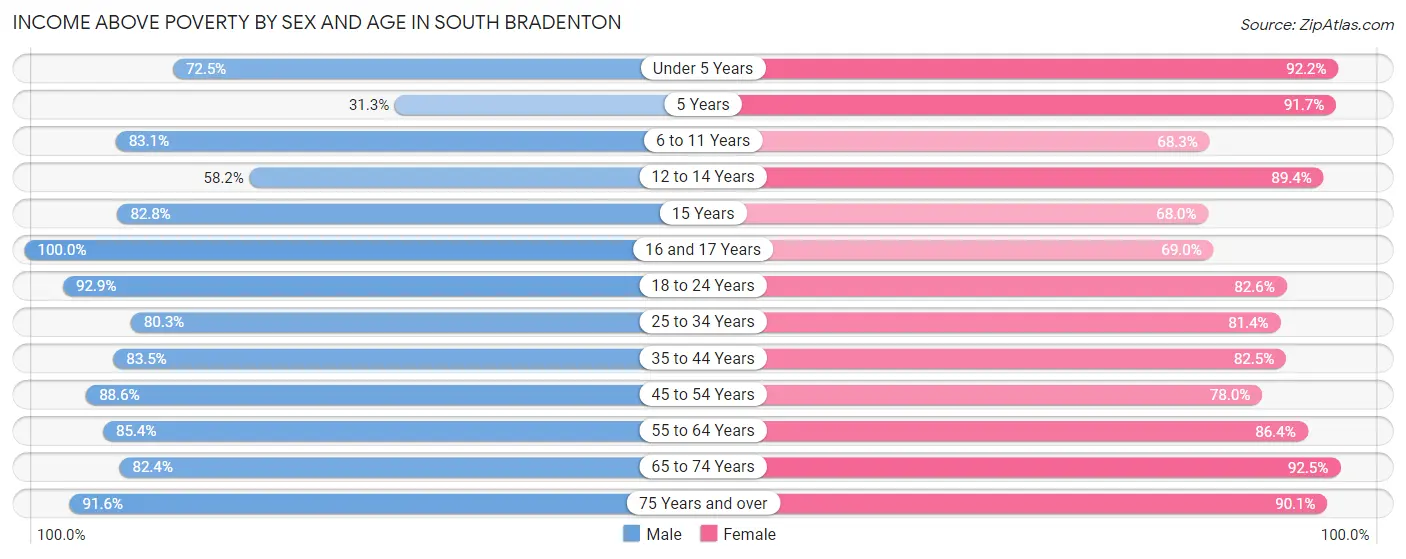
| Age Bracket | Male | Female |
| Under 5 Years | 342 (72.5%) | 694 (92.2%) |
| 5 Years | 10 (31.2%) | 144 (91.7%) |
| 6 to 11 Years | 609 (83.1%) | 510 (68.3%) |
| 12 to 14 Years | 219 (58.2%) | 237 (89.4%) |
| 15 Years | 48 (82.8%) | 100 (68.0%) |
| 16 and 17 Years | 96 (100.0%) | 187 (69.0%) |
| 18 to 24 Years | 1,054 (92.9%) | 1,031 (82.6%) |
| 25 to 34 Years | 1,578 (80.3%) | 1,493 (81.4%) |
| 35 to 44 Years | 962 (83.5%) | 1,020 (82.5%) |
| 45 to 54 Years | 1,532 (88.5%) | 1,022 (78.0%) |
| 55 to 64 Years | 1,384 (85.4%) | 1,599 (86.4%) |
| 65 to 74 Years | 1,266 (82.4%) | 1,475 (92.5%) |
| 75 Years and over | 1,106 (91.6%) | 1,595 (90.1%) |
| Total | 10,206 (84.3%) | 11,107 (84.2%) |
Income Below Poverty Among Married-Couple Families in South Bradenton
The poverty statistics for married-couple families in South Bradenton show that 9.8% or 366 of the total 3,742 families live below the poverty line. Families with 1 or 2 children have the highest poverty rate of 18.0%, comprising of 154 families. On the other hand, families with no children have the lowest poverty rate of 7.1%, which includes 200 families.
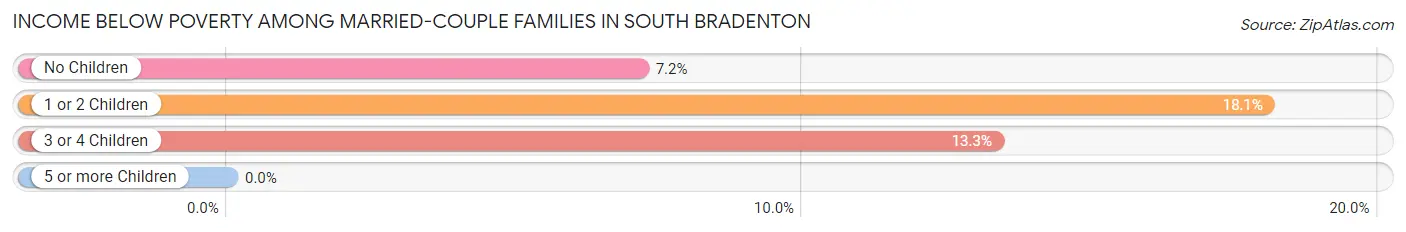
| Children | Above Poverty | Below Poverty |
| No Children | 2,599 (92.8%) | 200 (7.1%) |
| 1 or 2 Children | 699 (82.0%) | 154 (18.0%) |
| 3 or 4 Children | 78 (86.7%) | 12 (13.3%) |
| 5 or more Children | 0 (0.0%) | 0 (0.0%) |
| Total | 3,376 (90.2%) | 366 (9.8%) |
Income Below Poverty Among Single-Parent Households in South Bradenton
According to the poverty data in South Bradenton, 12.3% or 84 single-father households and 21.8% or 338 single-mother households are living below the poverty line. Among single-father households, those with no children have the highest poverty rate, with 84 households (19.8%) experiencing poverty. Likewise, among single-mother households, those with 1 or 2 children have the highest poverty rate, with 238 households (33.6%) falling below the poverty line.
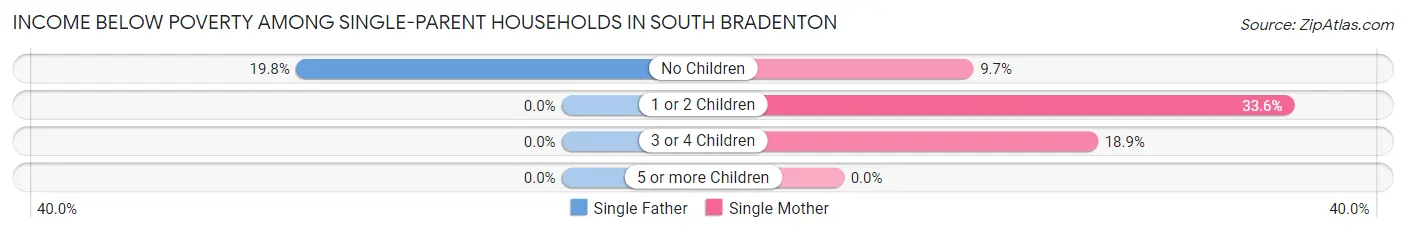
| Children | Single Father | Single Mother |
| No Children | 84 (19.8%) | 61 (9.7%) |
| 1 or 2 Children | 0 (0.0%) | 238 (33.6%) |
| 3 or 4 Children | 0 (0.0%) | 39 (18.9%) |
| 5 or more Children | 0 (0.0%) | 0 (0.0%) |
| Total | 84 (12.3%) | 338 (21.8%) |
Income Below Poverty Among Married-Couple vs Single-Parent Households in South Bradenton
The poverty data for South Bradenton shows that 366 of the married-couple family households (9.8%) and 422 of the single-parent households (19.0%) are living below the poverty level. Within the married-couple family households, those with 1 or 2 children have the highest poverty rate, with 154 households (18.0%) falling below the poverty line. Among the single-parent households, those with 1 or 2 children have the highest poverty rate, with 238 household (24.7%) living below poverty.
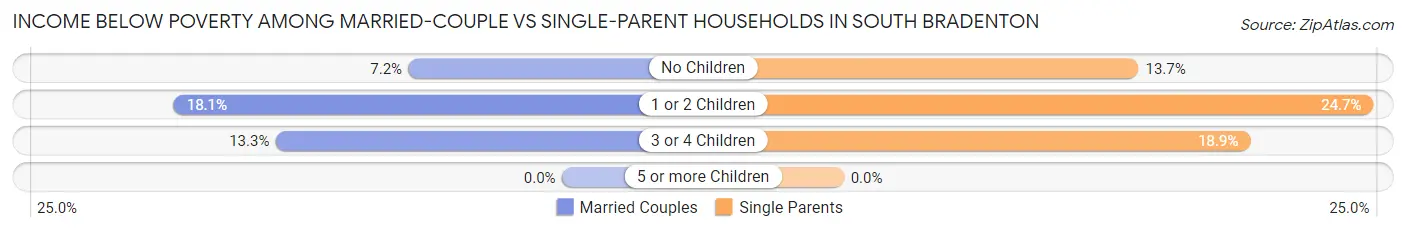
| Children | Married-Couple Families | Single-Parent Households |
| No Children | 200 (7.1%) | 145 (13.7%) |
| 1 or 2 Children | 154 (18.0%) | 238 (24.7%) |
| 3 or 4 Children | 12 (13.3%) | 39 (18.9%) |
| 5 or more Children | 0 (0.0%) | 0 (0.0%) |
| Total | 366 (9.8%) | 422 (19.0%) |
Race in South Bradenton
The most populous races in South Bradenton are White / Caucasian (18,413 | 72.3%), Hispanic or Latino (6,703 | 26.3%), and Black / African American (2,399 | 9.4%).
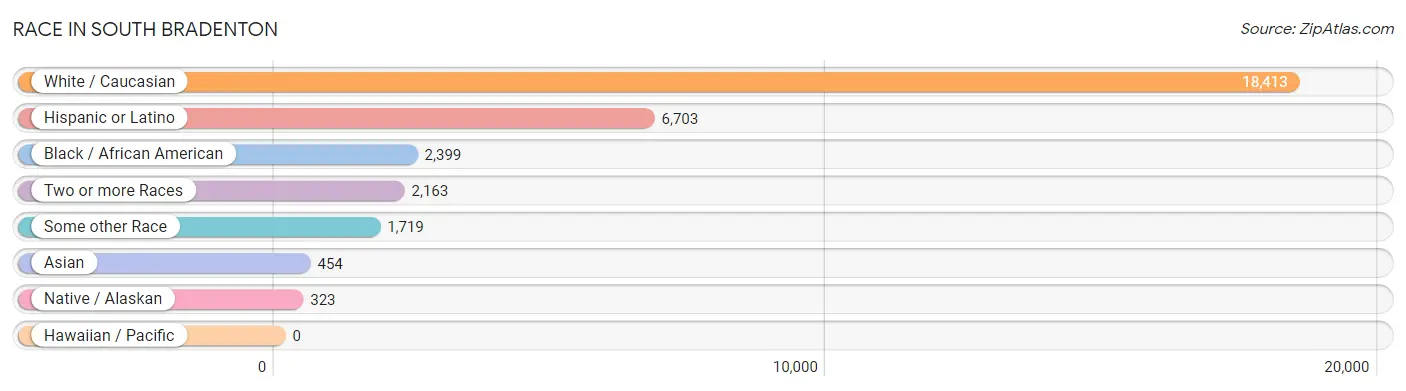
| Race | # Population | % Population |
| Asian | 454 | 1.8% |
| Black / African American | 2,399 | 9.4% |
| Hawaiian / Pacific | 0 | 0.0% |
| Hispanic or Latino | 6,703 | 26.3% |
| Native / Alaskan | 323 | 1.3% |
| White / Caucasian | 18,413 | 72.3% |
| Two or more Races | 2,163 | 8.5% |
| Some other Race | 1,719 | 6.8% |
| Total | 25,471 | 100.0% |
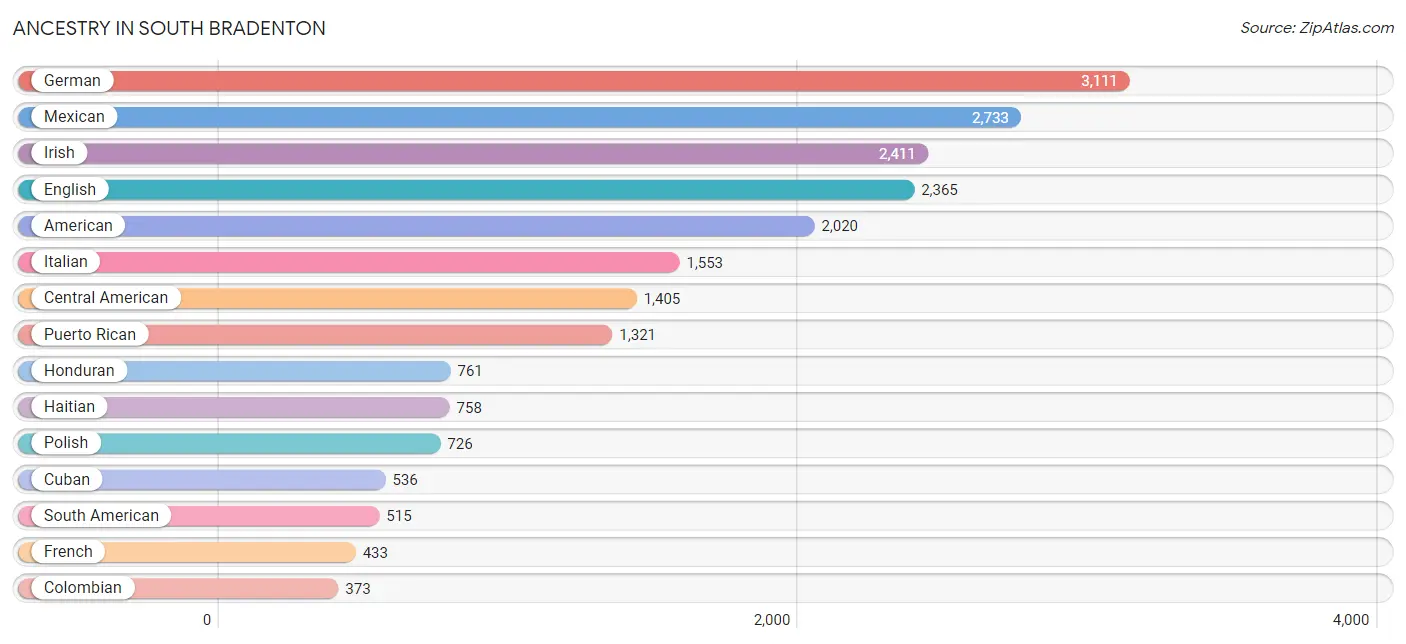
Ancestry in South Bradenton
The most populous ancestries reported in South Bradenton are German (3,111 | 12.2%), Mexican (2,733 | 10.7%), Irish (2,411 | 9.5%), English (2,365 | 9.3%), and American (2,020 | 7.9%), together accounting for 49.6% of all South Bradenton residents.
| Ancestry | # Population | % Population |
| African | 7 | 0.0% |
| American | 2,020 | 7.9% |
| Arab | 165 | 0.6% |
| Argentinean | 31 | 0.1% |
| Australian | 18 | 0.1% |
| Austrian | 93 | 0.4% |
| Belgian | 79 | 0.3% |
| Belizean | 5 | 0.0% |
| Bhutanese | 25 | 0.1% |
| Blackfeet | 3 | 0.0% |
| Brazilian | 82 | 0.3% |
| British | 167 | 0.7% |
| Burmese | 13 | 0.1% |
| Canadian | 153 | 0.6% |
| Celtic | 6 | 0.0% |
| Central American | 1,405 | 5.5% |
| Central American Indian | 251 | 1.0% |
| Cherokee | 81 | 0.3% |
| Colombian | 373 | 1.5% |
| Croatian | 111 | 0.4% |
| Cuban | 536 | 2.1% |
| Czech | 54 | 0.2% |
| Czechoslovakian | 38 | 0.2% |
| Dominican | 108 | 0.4% |
| Dutch | 367 | 1.4% |
| Eastern European | 16 | 0.1% |
| Ecuadorian | 25 | 0.1% |
| English | 2,365 | 9.3% |
| European | 167 | 0.7% |
| Finnish | 29 | 0.1% |
| French | 433 | 1.7% |
| French Canadian | 290 | 1.1% |
| German | 3,111 | 12.2% |
| Greek | 78 | 0.3% |
| Guatemalan | 269 | 1.1% |
| Guyanese | 8 | 0.0% |
| Haitian | 758 | 3.0% |
| Honduran | 761 | 3.0% |
| Hungarian | 108 | 0.4% |
| Indian (Asian) | 128 | 0.5% |
| Irish | 2,411 | 9.5% |
| Italian | 1,553 | 6.1% |
| Jamaican | 32 | 0.1% |
| Korean | 66 | 0.3% |
| Lebanese | 76 | 0.3% |
| Lithuanian | 68 | 0.3% |
| Mexican | 2,733 | 10.7% |
| Mexican American Indian | 72 | 0.3% |
| Nicaraguan | 177 | 0.7% |
| Nigerian | 71 | 0.3% |
| Northern European | 15 | 0.1% |
| Norwegian | 54 | 0.2% |
| Pakistani | 34 | 0.1% |
| Palestinian | 13 | 0.1% |
| Pennsylvania German | 45 | 0.2% |
| Peruvian | 69 | 0.3% |
| Polish | 726 | 2.9% |
| Portuguese | 158 | 0.6% |
| Puerto Rican | 1,321 | 5.2% |
| Russian | 263 | 1.0% |
| Salvadoran | 198 | 0.8% |
| Scandinavian | 7 | 0.0% |
| Scotch-Irish | 241 | 0.9% |
| Scottish | 355 | 1.4% |
| Seminole | 14 | 0.1% |
| Serbian | 111 | 0.4% |
| South African | 88 | 0.4% |
| South American | 515 | 2.0% |
| Spaniard | 25 | 0.1% |
| Spanish | 33 | 0.1% |
| Sri Lankan | 65 | 0.3% |
| Subsaharan African | 166 | 0.6% |
| Swedish | 199 | 0.8% |
| Swiss | 124 | 0.5% |
| Thai | 110 | 0.4% |
| Trinidadian and Tobagonian | 46 | 0.2% |
| Turkish | 18 | 0.1% |
| Ukrainian | 56 | 0.2% |
| Venezuelan | 17 | 0.1% |
| Vietnamese | 57 | 0.2% |
| Welsh | 268 | 1.1% |
| West Indian | 36 | 0.1% | View All 82 Rows |
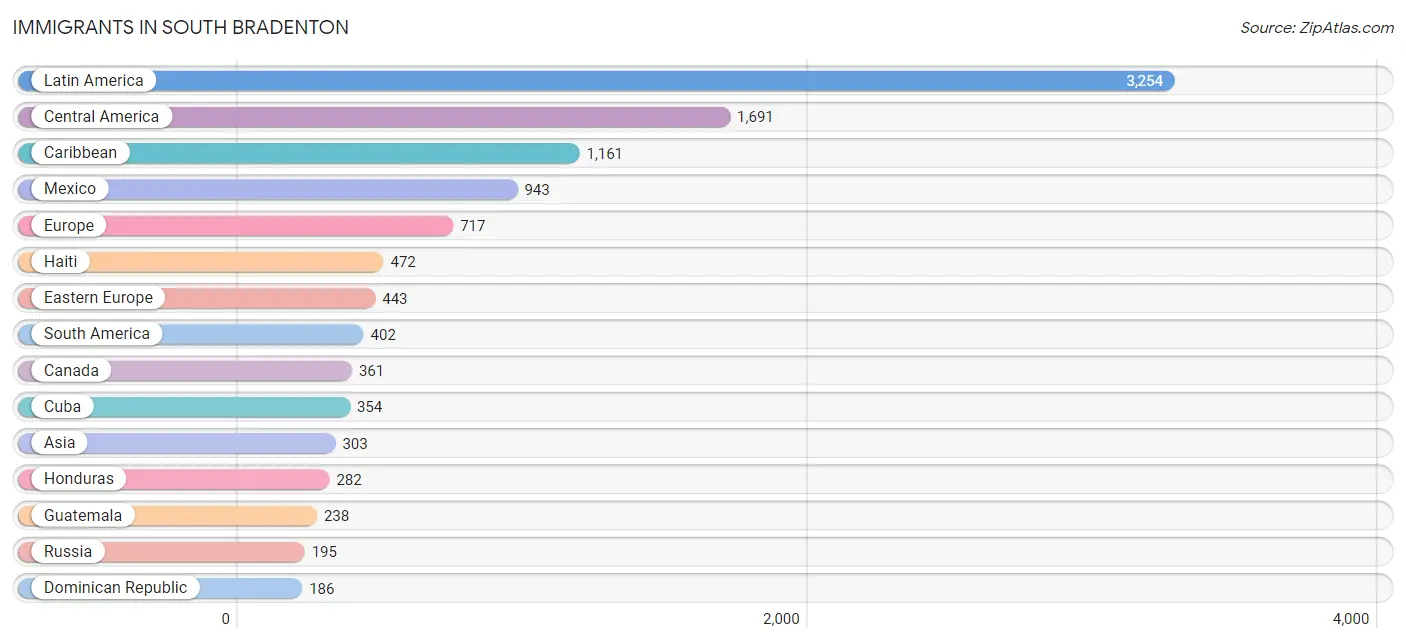
Immigrants in South Bradenton
The most numerous immigrant groups reported in South Bradenton came from Latin America (3,254 | 12.8%), Central America (1,691 | 6.6%), Caribbean (1,161 | 4.6%), Mexico (943 | 3.7%), and Europe (717 | 2.8%), together accounting for 30.5% of all South Bradenton residents.
| Immigration Origin | # Population | % Population |
| Africa | 87 | 0.3% |
| Argentina | 62 | 0.2% |
| Asia | 303 | 1.2% |
| Australia | 8 | 0.0% |
| Austria | 18 | 0.1% |
| Bangladesh | 47 | 0.2% |
| Belarus | 6 | 0.0% |
| Belize | 5 | 0.0% |
| Brazil | 102 | 0.4% |
| Cambodia | 27 | 0.1% |
| Canada | 361 | 1.4% |
| Caribbean | 1,161 | 4.6% |
| Central America | 1,691 | 6.6% |
| China | 72 | 0.3% |
| Colombia | 179 | 0.7% |
| Croatia | 111 | 0.4% |
| Cuba | 354 | 1.4% |
| Czechoslovakia | 11 | 0.0% |
| Dominican Republic | 186 | 0.7% |
| Eastern Asia | 100 | 0.4% |
| Eastern Europe | 443 | 1.7% |
| Ecuador | 10 | 0.0% |
| Egypt | 8 | 0.0% |
| El Salvador | 136 | 0.5% |
| England | 28 | 0.1% |
| Europe | 717 | 2.8% |
| France | 17 | 0.1% |
| Germany | 126 | 0.5% |
| Guatemala | 238 | 0.9% |
| Haiti | 472 | 1.8% |
| Honduras | 282 | 1.1% |
| Hong Kong | 64 | 0.3% |
| Hungary | 45 | 0.2% |
| India | 38 | 0.2% |
| Ireland | 36 | 0.1% |
| Italy | 15 | 0.1% |
| Jamaica | 32 | 0.1% |
| Japan | 25 | 0.1% |
| Korea | 3 | 0.0% |
| Kuwait | 13 | 0.1% |
| Latin America | 3,254 | 12.8% |
| Mexico | 943 | 3.7% |
| Moldova | 19 | 0.1% |
| Nicaragua | 87 | 0.3% |
| Northern Africa | 8 | 0.0% |
| Northern Europe | 79 | 0.3% |
| Oceania | 8 | 0.0% |
| Pakistan | 8 | 0.0% |
| Peru | 32 | 0.1% |
| Philippines | 16 | 0.1% |
| Portugal | 19 | 0.1% |
| Russia | 195 | 0.8% |
| South Africa | 79 | 0.3% |
| South America | 402 | 1.6% |
| South Central Asia | 93 | 0.4% |
| South Eastern Asia | 97 | 0.4% |
| Southern Europe | 34 | 0.1% |
| Thailand | 9 | 0.0% |
| Trinidad and Tobago | 117 | 0.5% |
| Ukraine | 56 | 0.2% |
| Venezuela | 17 | 0.1% |
| Vietnam | 45 | 0.2% |
| Western Asia | 13 | 0.1% |
| Western Europe | 161 | 0.6% | View All 64 Rows |
Sex and Age in South Bradenton
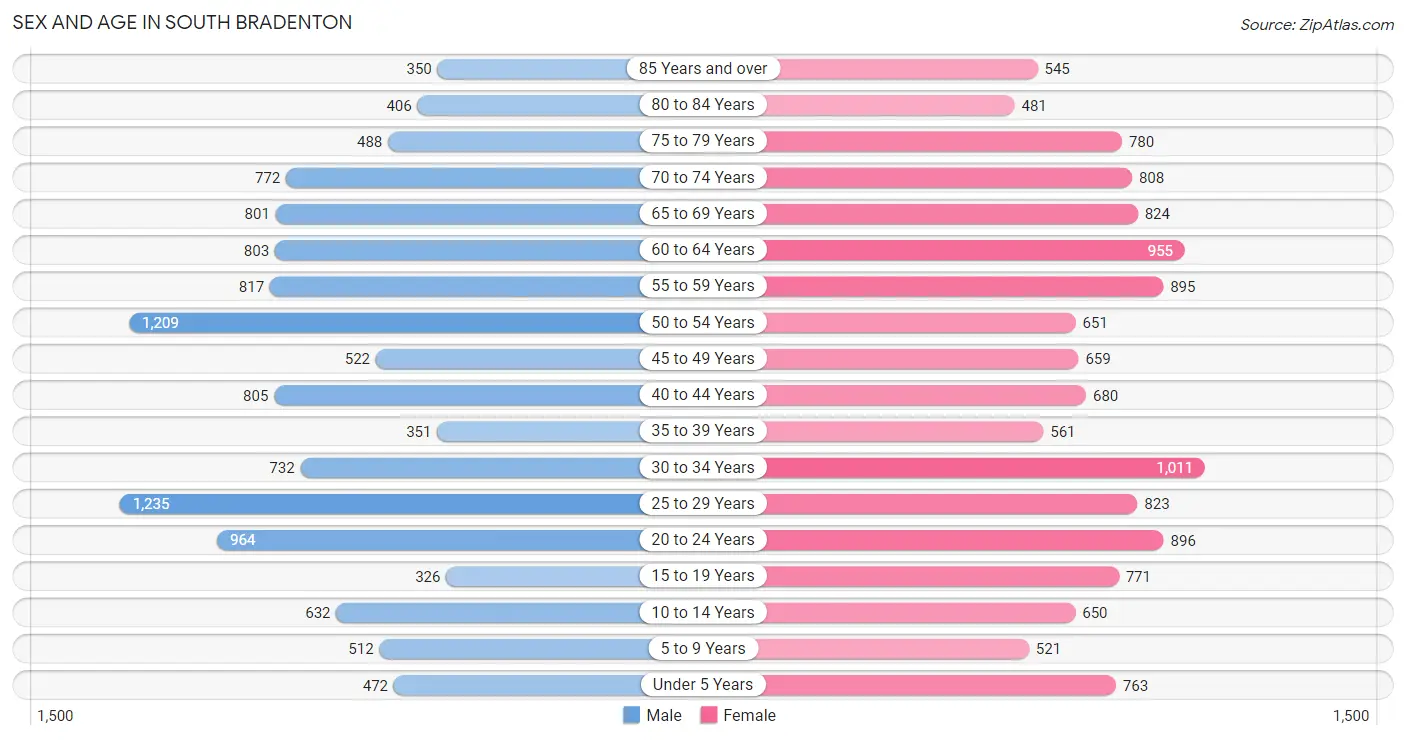
Sex and Age in South Bradenton
The most populous age groups in South Bradenton are 25 to 29 Years (1,235 | 10.1%) for men and 30 to 34 Years (1,011 | 7.6%) for women.
| Age Bracket | Male | Female |
| Under 5 Years | 472 (3.9%) | 763 (5.8%) |
| 5 to 9 Years | 512 (4.2%) | 521 (3.9%) |
| 10 to 14 Years | 632 (5.2%) | 650 (4.9%) |
| 15 to 19 Years | 326 (2.7%) | 771 (5.8%) |
| 20 to 24 Years | 964 (7.9%) | 896 (6.8%) |
| 25 to 29 Years | 1,235 (10.1%) | 823 (6.2%) |
| 30 to 34 Years | 732 (6.0%) | 1,011 (7.6%) |
| 35 to 39 Years | 351 (2.9%) | 561 (4.2%) |
| 40 to 44 Years | 805 (6.6%) | 680 (5.1%) |
| 45 to 49 Years | 522 (4.3%) | 659 (5.0%) |
| 50 to 54 Years | 1,209 (9.9%) | 651 (4.9%) |
| 55 to 59 Years | 817 (6.7%) | 895 (6.7%) |
| 60 to 64 Years | 803 (6.6%) | 955 (7.2%) |
| 65 to 69 Years | 801 (6.6%) | 824 (6.2%) |
| 70 to 74 Years | 772 (6.3%) | 808 (6.1%) |
| 75 to 79 Years | 488 (4.0%) | 780 (5.9%) |
| 80 to 84 Years | 406 (3.3%) | 481 (3.6%) |
| 85 Years and over | 350 (2.9%) | 545 (4.1%) |
| Total | 12,197 (100.0%) | 13,274 (100.0%) |
Families and Households in South Bradenton
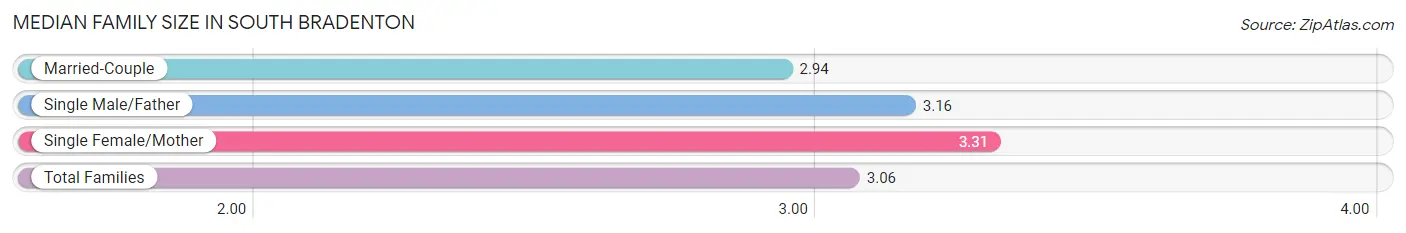
Median Family Size in South Bradenton
The median family size in South Bradenton is 3.06 persons per family, with single female/mother families (1,547 | 25.9%) accounting for the largest median family size of 3.31 persons per family. On the other hand, married-couple families (3,742 | 62.7%) represent the smallest median family size with 2.94 persons per family.
| Family Type | # Families | Family Size |
| Married-Couple | 3,742 (62.7%) | 2.94 |
| Single Male/Father | 680 (11.4%) | 3.16 |
| Single Female/Mother | 1,547 (25.9%) | 3.31 |
| Total Families | 5,969 (100.0%) | 3.06 |
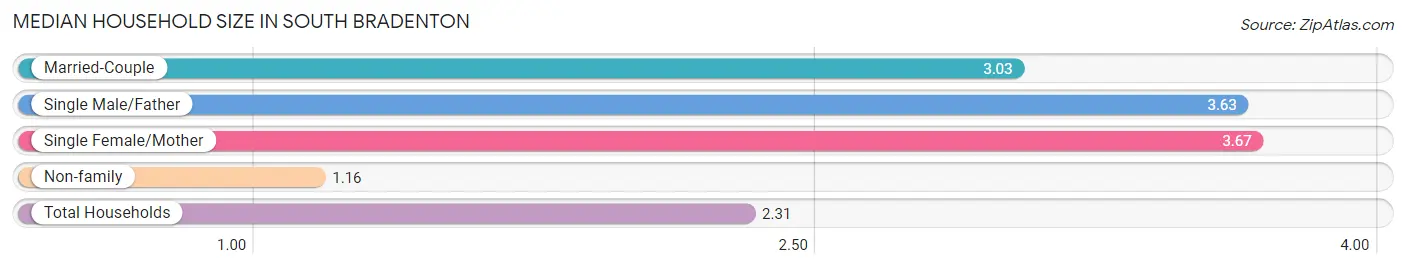
Median Household Size in South Bradenton
The median household size in South Bradenton is 2.31 persons per household, with single female/mother households (1,547 | 14.1%) accounting for the largest median household size of 3.67 persons per household. non-family households (4,981 | 45.5%) represent the smallest median household size with 1.16 persons per household.
| Household Type | # Households | Household Size |
| Married-Couple | 3,742 (34.2%) | 3.03 |
| Single Male/Father | 680 (6.2%) | 3.63 |
| Single Female/Mother | 1,547 (14.1%) | 3.67 |
| Non-family | 4,981 (45.5%) | 1.16 |
| Total Households | 10,950 (100.0%) | 2.31 |
Household Size by Marriage Status in South Bradenton
Out of a total of 10,950 households in South Bradenton, 5,969 (54.5%) are family households, while 4,981 (45.5%) are nonfamily households. The most numerous type of family households are 2-person households, comprising 3,277, and the most common type of nonfamily households are 1-person households, comprising 4,481.
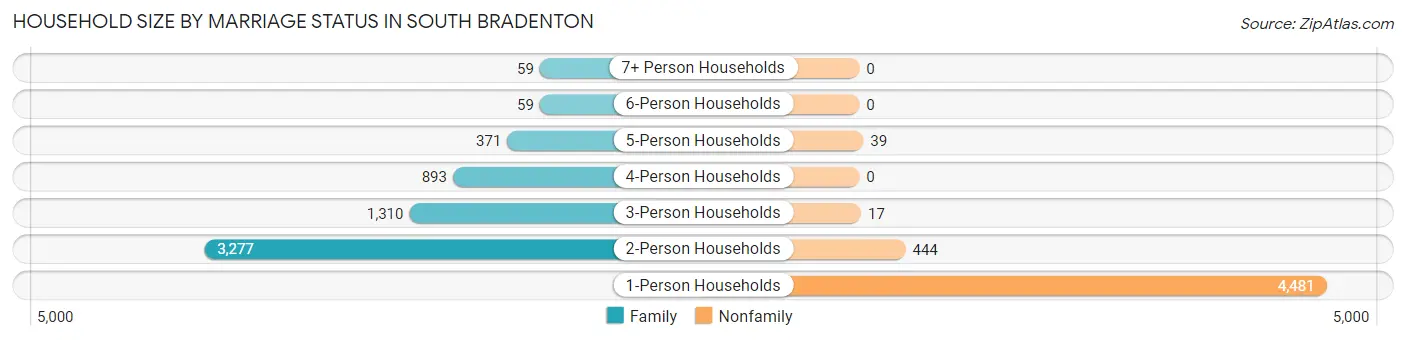
| Household Size | Family Households | Nonfamily Households |
| 1-Person Households | - | 4,481 (40.9%) |
| 2-Person Households | 3,277 (29.9%) | 444 (4.1%) |
| 3-Person Households | 1,310 (12.0%) | 17 (0.2%) |
| 4-Person Households | 893 (8.2%) | 0 (0.0%) |
| 5-Person Households | 371 (3.4%) | 39 (0.4%) |
| 6-Person Households | 59 (0.5%) | 0 (0.0%) |
| 7+ Person Households | 59 (0.5%) | 0 (0.0%) |
| Total | 5,969 (54.5%) | 4,981 (45.5%) |
Female Fertility in South Bradenton
Fertility by Age in South Bradenton
Average fertility rate in South Bradenton is 100.0 births per 1,000 women. Women in the age bracket of 20 to 34 years have the highest fertility rate with 174.0 births per 1,000 women. Women in the age bracket of 20 to 34 years acount for 86.7% of all women with births.
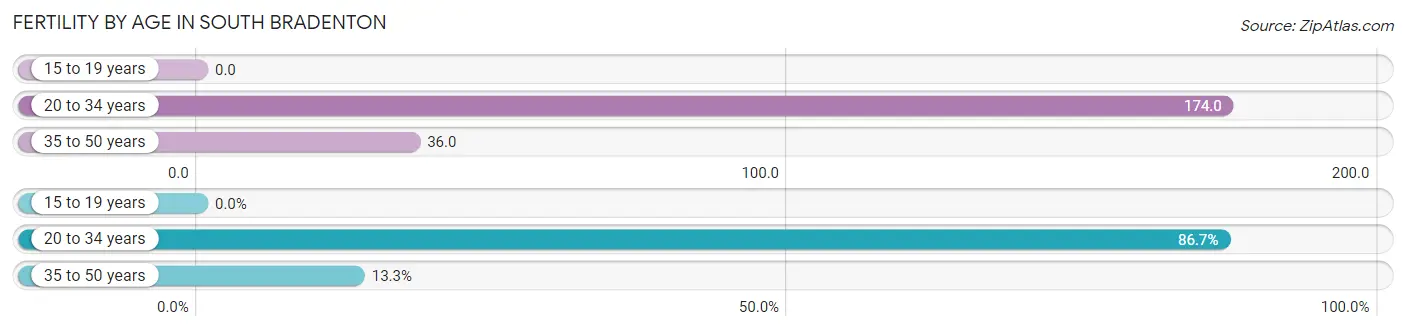
| Age Bracket | Women with Births | Births / 1,000 Women |
| 15 to 19 years | 0 (0.0%) | 0.0 |
| 20 to 34 years | 476 (86.7%) | 174.0 |
| 35 to 50 years | 73 (13.3%) | 36.0 |
| Total | 549 (100.0%) | 100.0 |
Fertility by Age by Marriage Status in South Bradenton
32.4% of women with births (549) in South Bradenton are married. The highest percentage of unmarried women with births falls into 35 to 50 years age bracket with 100.0% of them unmarried at the time of birth, while the lowest percentage of unmarried women with births belong to 20 to 34 years age bracket with 62.6% of them unmarried.
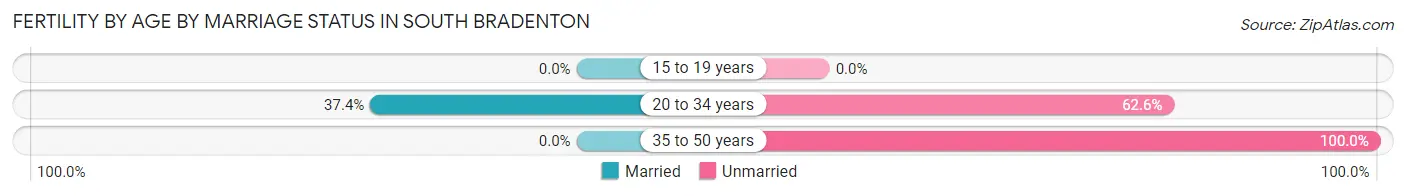
| Age Bracket | Married | Unmarried |
| 15 to 19 years | 0 (0.0%) | 0 (0.0%) |
| 20 to 34 years | 178 (37.4%) | 298 (62.6%) |
| 35 to 50 years | 0 (0.0%) | 73 (100.0%) |
| Total | 178 (32.4%) | 371 (67.6%) |
Fertility by Education in South Bradenton
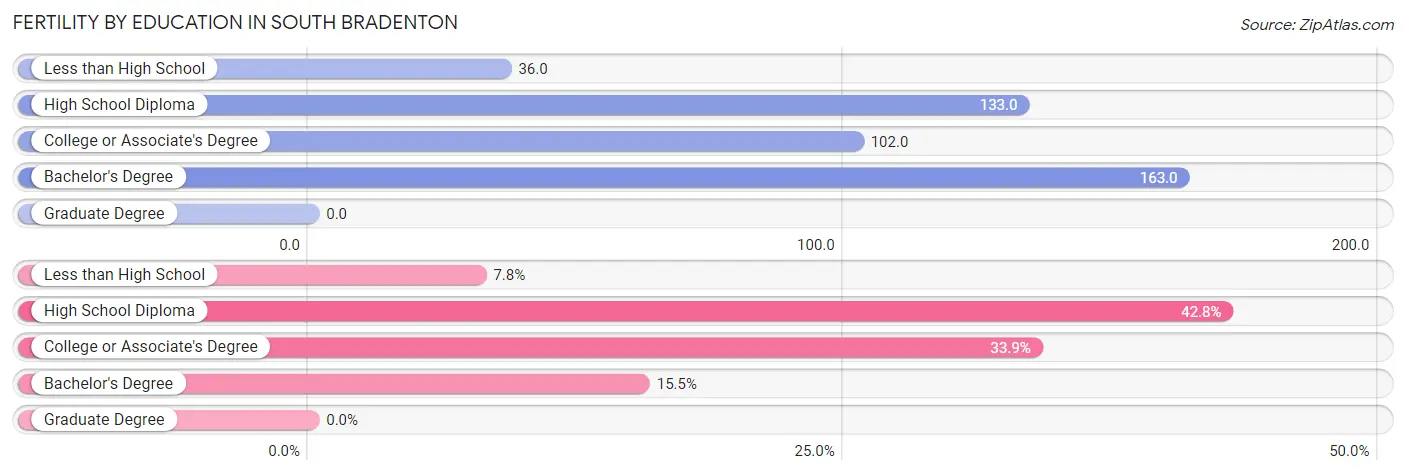
| Educational Attainment | Women with Births | Births / 1,000 Women |
| Less than High School | 43 (7.8%) | 36.0 |
| High School Diploma | 235 (42.8%) | 133.0 |
| College or Associate's Degree | 186 (33.9%) | 102.0 |
| Bachelor's Degree | 85 (15.5%) | 163.0 |
| Graduate Degree | 0 (0.0%) | 0.0 |
| Total | 549 (100.0%) | 100.0 |
Fertility by Education by Marriage Status in South Bradenton
67.6% of women with births in South Bradenton are unmarried. Women with the educational attainment of college or associate's degree are most likely to be married with 66.1% of them married at childbirth, while women with the educational attainment of high school diploma are least likely to be married with 100.0% of them unmarried at childbirth.
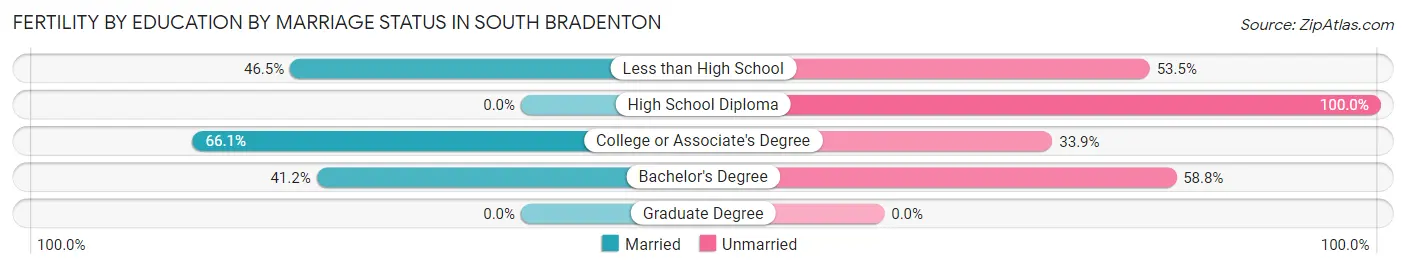
| Educational Attainment | Married | Unmarried |
| Less than High School | 20 (46.5%) | 23 (53.5%) |
| High School Diploma | 0 (0.0%) | 235 (100.0%) |
| College or Associate's Degree | 123 (66.1%) | 63 (33.9%) |
| Bachelor's Degree | 35 (41.2%) | 50 (58.8%) |
| Graduate Degree | 0 (0.0%) | 0 (0.0%) |
| Total | 178 (32.4%) | 371 (67.6%) |
Employment Characteristics in South Bradenton
Employment by Class of Employer in South Bradenton
Among the 11,387 employed individuals in South Bradenton, private company employees (8,618 | 75.7%), not-for-profit organizations (765 | 6.7%), and self-employed (not incorporated) (597 | 5.2%) make up the most common classes of employment.
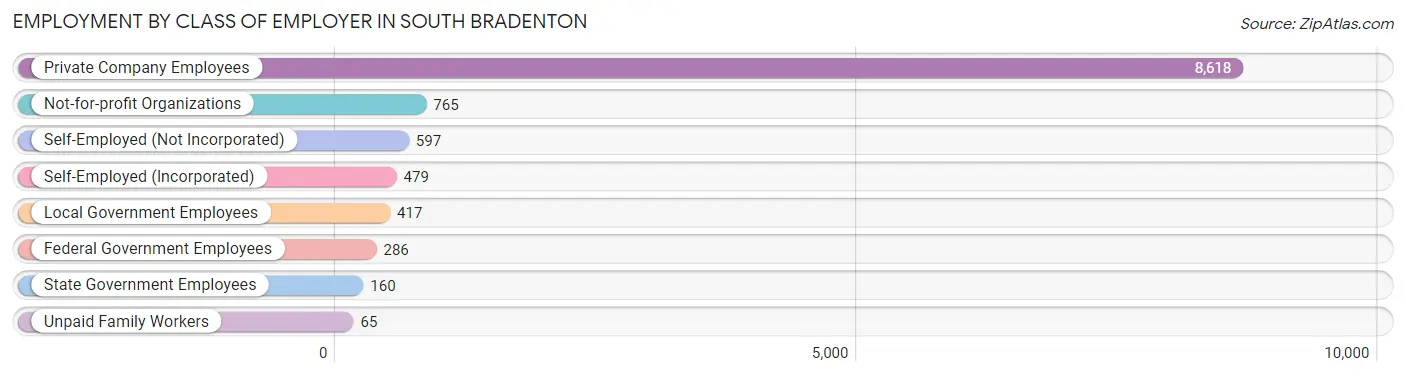
| Employer Class | # Employees | % Employees |
| Private Company Employees | 8,618 | 75.7% |
| Self-Employed (Incorporated) | 479 | 4.2% |
| Self-Employed (Not Incorporated) | 597 | 5.2% |
| Not-for-profit Organizations | 765 | 6.7% |
| Local Government Employees | 417 | 3.7% |
| State Government Employees | 160 | 1.4% |
| Federal Government Employees | 286 | 2.5% |
| Unpaid Family Workers | 65 | 0.6% |
| Total | 11,387 | 100.0% |
Employment Status by Age in South Bradenton
According to the labor force statistics for South Bradenton, out of the total population over 16 years of age (21,715), 56.8% or 12,334 individuals are in the labor force, with 6.1% or 752 of them unemployed. The age group with the highest labor force participation rate is 25 to 29 years, with 91.7% or 1,887 individuals in the labor force. Within the labor force, the 16 to 19 years age range has the highest percentage of unemployed individuals, with 18.6% or 88 of them being unemployed.
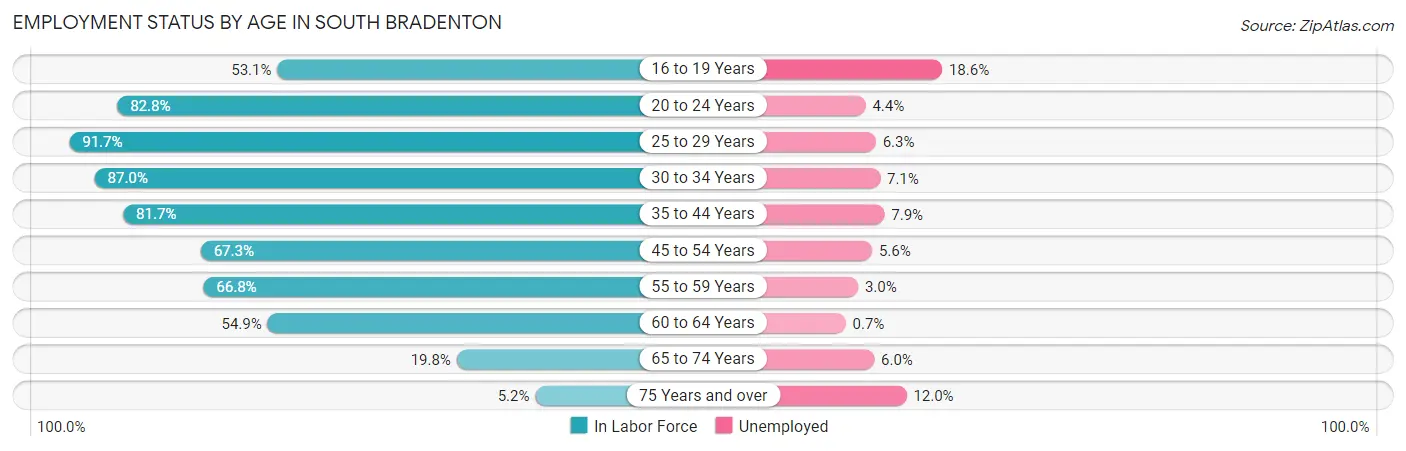
| Age Bracket | In Labor Force | Unemployed |
| 16 to 19 Years | 473 (53.1%) | 88 (18.6%) |
| 20 to 24 Years | 1,540 (82.8%) | 68 (4.4%) |
| 25 to 29 Years | 1,887 (91.7%) | 119 (6.3%) |
| 30 to 34 Years | 1,516 (87.0%) | 108 (7.1%) |
| 35 to 44 Years | 1,958 (81.7%) | 155 (7.9%) |
| 45 to 54 Years | 2,047 (67.3%) | 115 (5.6%) |
| 55 to 59 Years | 1,144 (66.8%) | 34 (3.0%) |
| 60 to 64 Years | 965 (54.9%) | 7 (0.7%) |
| 65 to 74 Years | 635 (19.8%) | 38 (6.0%) |
| 75 Years and over | 159 (5.2%) | 19 (12.0%) |
| Total | 12,334 (56.8%) | 752 (6.1%) |
Employment Status by Educational Attainment in South Bradenton
According to labor force statistics for South Bradenton, 74.9% of individuals (9,519) out of the total population between 25 and 64 years of age (12,709) are in the labor force, with 5.6% or 533 of them being unemployed. The group with the highest labor force participation rate are those with the educational attainment of bachelor's degree or higher, with 83.0% or 1,406 individuals in the labor force. Within the labor force, individuals with less than high school education have the highest percentage of unemployment, with 12.1% or 211 of them being unemployed.
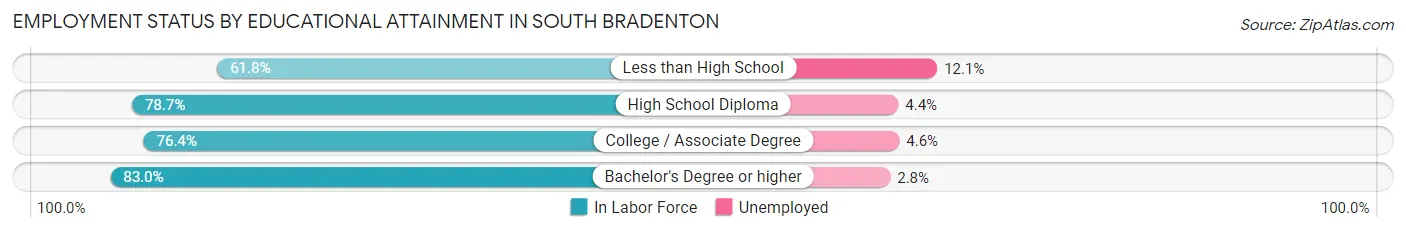
| Educational Attainment | In Labor Force | Unemployed |
| Less than High School | 1,742 (61.8%) | 341 (12.1%) |
| High School Diploma | 3,762 (78.7%) | 210 (4.4%) |
| College / Associate Degree | 2,610 (76.4%) | 157 (4.6%) |
| Bachelor's Degree or higher | 1,406 (83.0%) | 47 (2.8%) |
| Total | 9,519 (74.9%) | 712 (5.6%) |
Employment Occupations by Sex in South Bradenton
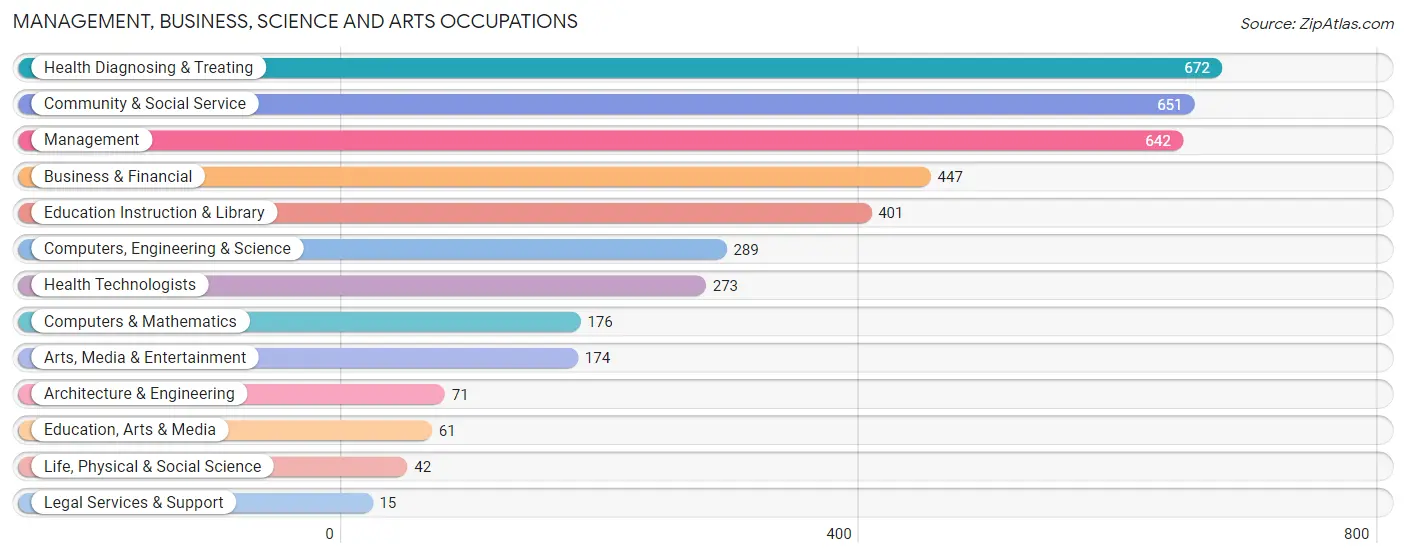
Management, Business, Science and Arts Occupations
The most common Management, Business, Science and Arts occupations in South Bradenton are Health Diagnosing & Treating (672 | 5.8%), Community & Social Service (651 | 5.6%), Management (642 | 5.6%), Business & Financial (447 | 3.9%), and Education Instruction & Library (401 | 3.5%).
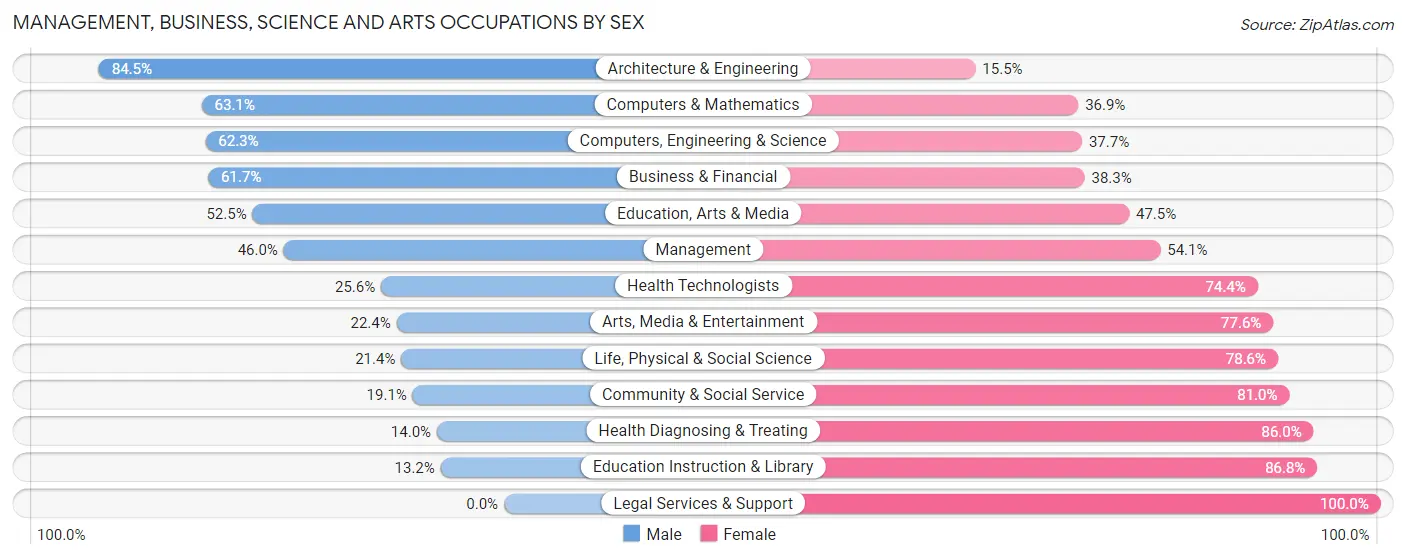
Management, Business, Science and Arts Occupations by Sex
Within the Management, Business, Science and Arts occupations in South Bradenton, the most male-oriented occupations are Architecture & Engineering (84.5%), Computers & Mathematics (63.1%), and Computers, Engineering & Science (62.3%), while the most female-oriented occupations are Legal Services & Support (100.0%), Education Instruction & Library (86.8%), and Health Diagnosing & Treating (86.0%).
| Occupation | Male | Female |
| Management | 295 (46.0%) | 347 (54.0%) |
| Business & Financial | 276 (61.7%) | 171 (38.3%) |
| Computers, Engineering & Science | 180 (62.3%) | 109 (37.7%) |
| Computers & Mathematics | 111 (63.1%) | 65 (36.9%) |
| Architecture & Engineering | 60 (84.5%) | 11 (15.5%) |
| Life, Physical & Social Science | 9 (21.4%) | 33 (78.6%) |
| Community & Social Service | 124 (19.1%) | 527 (80.9%) |
| Education, Arts & Media | 32 (52.5%) | 29 (47.5%) |
| Legal Services & Support | 0 (0.0%) | 15 (100.0%) |
| Education Instruction & Library | 53 (13.2%) | 348 (86.8%) |
| Arts, Media & Entertainment | 39 (22.4%) | 135 (77.6%) |
| Health Diagnosing & Treating | 94 (14.0%) | 578 (86.0%) |
| Health Technologists | 70 (25.6%) | 203 (74.4%) |
| Total (Category) | 969 (35.9%) | 1,732 (64.1%) |
| Total (Overall) | 6,045 (52.2%) | 5,530 (47.8%) |
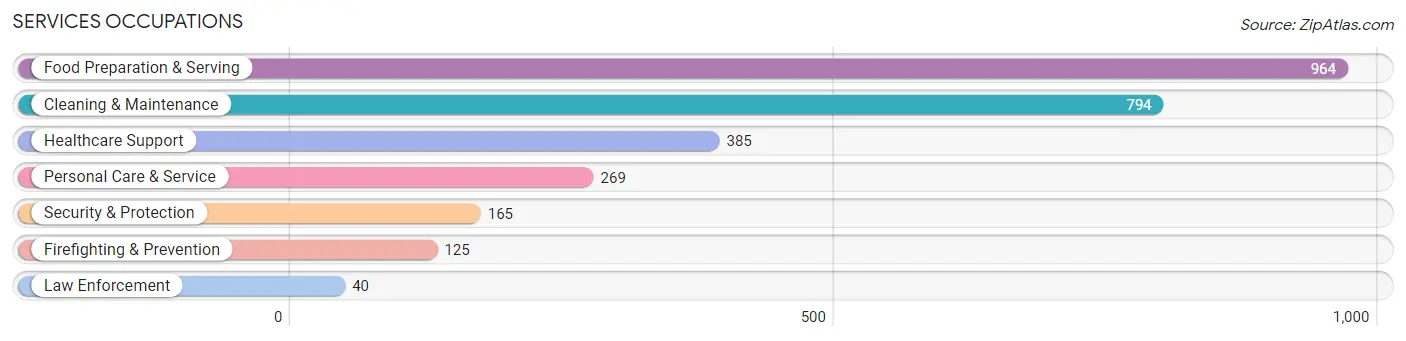
Services Occupations
The most common Services occupations in South Bradenton are Food Preparation & Serving (964 | 8.3%), Cleaning & Maintenance (794 | 6.9%), Healthcare Support (385 | 3.3%), Personal Care & Service (269 | 2.3%), and Security & Protection (165 | 1.4%).
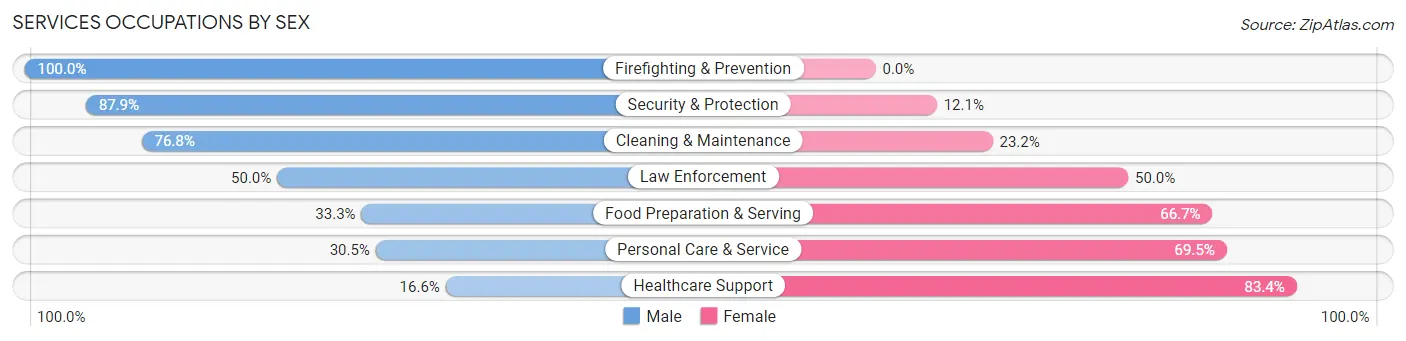
Services Occupations by Sex
Within the Services occupations in South Bradenton, the most male-oriented occupations are Firefighting & Prevention (100.0%), Security & Protection (87.9%), and Cleaning & Maintenance (76.8%), while the most female-oriented occupations are Healthcare Support (83.4%), Personal Care & Service (69.5%), and Food Preparation & Serving (66.7%).
| Occupation | Male | Female |
| Healthcare Support | 64 (16.6%) | 321 (83.4%) |
| Security & Protection | 145 (87.9%) | 20 (12.1%) |
| Firefighting & Prevention | 125 (100.0%) | 0 (0.0%) |
| Law Enforcement | 20 (50.0%) | 20 (50.0%) |
| Food Preparation & Serving | 321 (33.3%) | 643 (66.7%) |
| Cleaning & Maintenance | 610 (76.8%) | 184 (23.2%) |
| Personal Care & Service | 82 (30.5%) | 187 (69.5%) |
| Total (Category) | 1,222 (47.4%) | 1,355 (52.6%) |
| Total (Overall) | 6,045 (52.2%) | 5,530 (47.8%) |
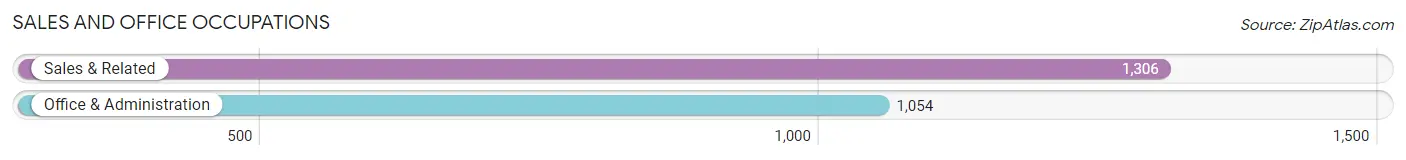
Sales and Office Occupations
The most common Sales and Office occupations in South Bradenton are Sales & Related (1,306 | 11.3%), and Office & Administration (1,054 | 9.1%).
Sales and Office Occupations by Sex
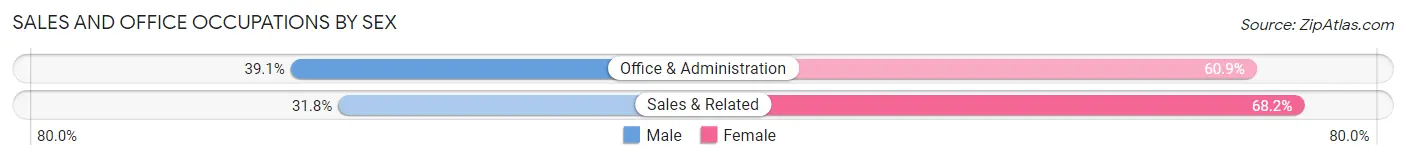
| Occupation | Male | Female |
| Sales & Related | 415 (31.8%) | 891 (68.2%) |
| Office & Administration | 412 (39.1%) | 642 (60.9%) |
| Total (Category) | 827 (35.0%) | 1,533 (65.0%) |
| Total (Overall) | 6,045 (52.2%) | 5,530 (47.8%) |
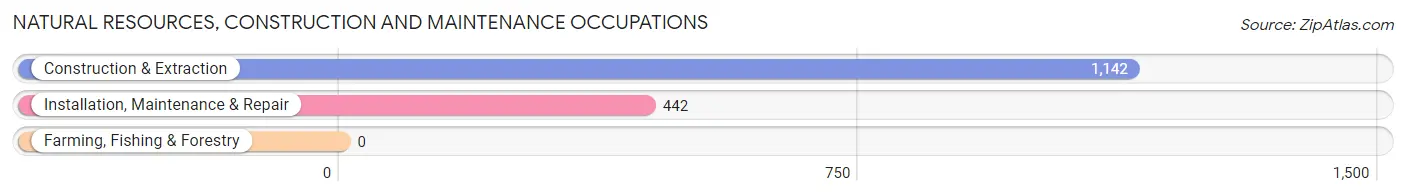
Natural Resources, Construction and Maintenance Occupations
The most common Natural Resources, Construction and Maintenance occupations in South Bradenton are Construction & Extraction (1,142 | 9.9%), and Installation, Maintenance & Repair (442 | 3.8%).
Natural Resources, Construction and Maintenance Occupations by Sex
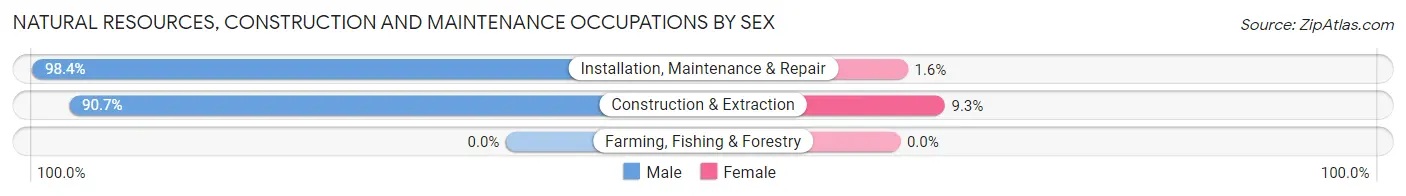
| Occupation | Male | Female |
| Farming, Fishing & Forestry | 0 (0.0%) | 0 (0.0%) |
| Construction & Extraction | 1,036 (90.7%) | 106 (9.3%) |
| Installation, Maintenance & Repair | 435 (98.4%) | 7 (1.6%) |
| Total (Category) | 1,471 (92.9%) | 113 (7.1%) |
| Total (Overall) | 6,045 (52.2%) | 5,530 (47.8%) |
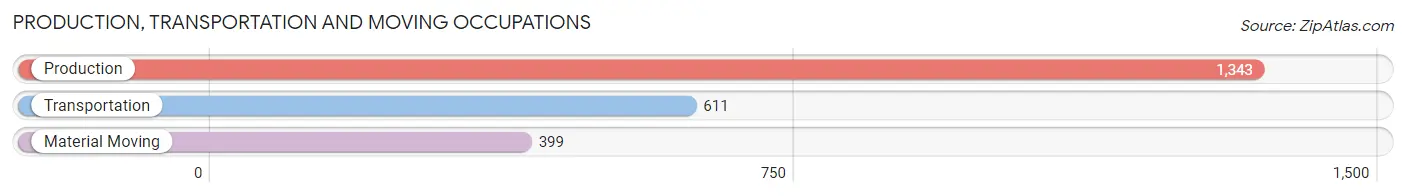
Production, Transportation and Moving Occupations
The most common Production, Transportation and Moving occupations in South Bradenton are Production (1,343 | 11.6%), Transportation (611 | 5.3%), and Material Moving (399 | 3.5%).
Production, Transportation and Moving Occupations by Sex
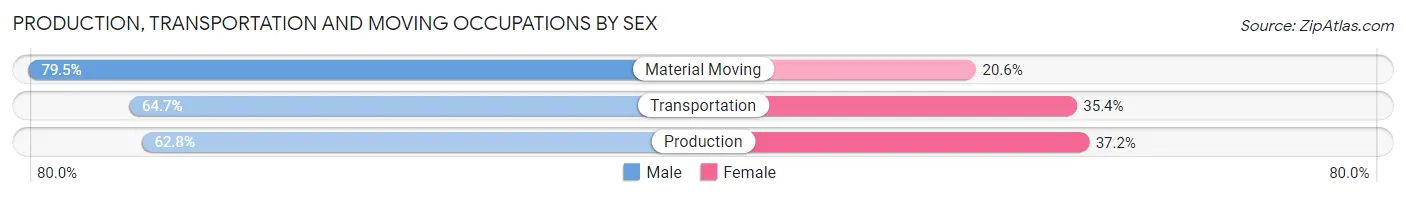
| Occupation | Male | Female |
| Production | 844 (62.8%) | 499 (37.2%) |
| Transportation | 395 (64.6%) | 216 (35.3%) |
| Material Moving | 317 (79.4%) | 82 (20.5%) |
| Total (Category) | 1,556 (66.1%) | 797 (33.9%) |
| Total (Overall) | 6,045 (52.2%) | 5,530 (47.8%) |
Employment Industries by Sex in South Bradenton
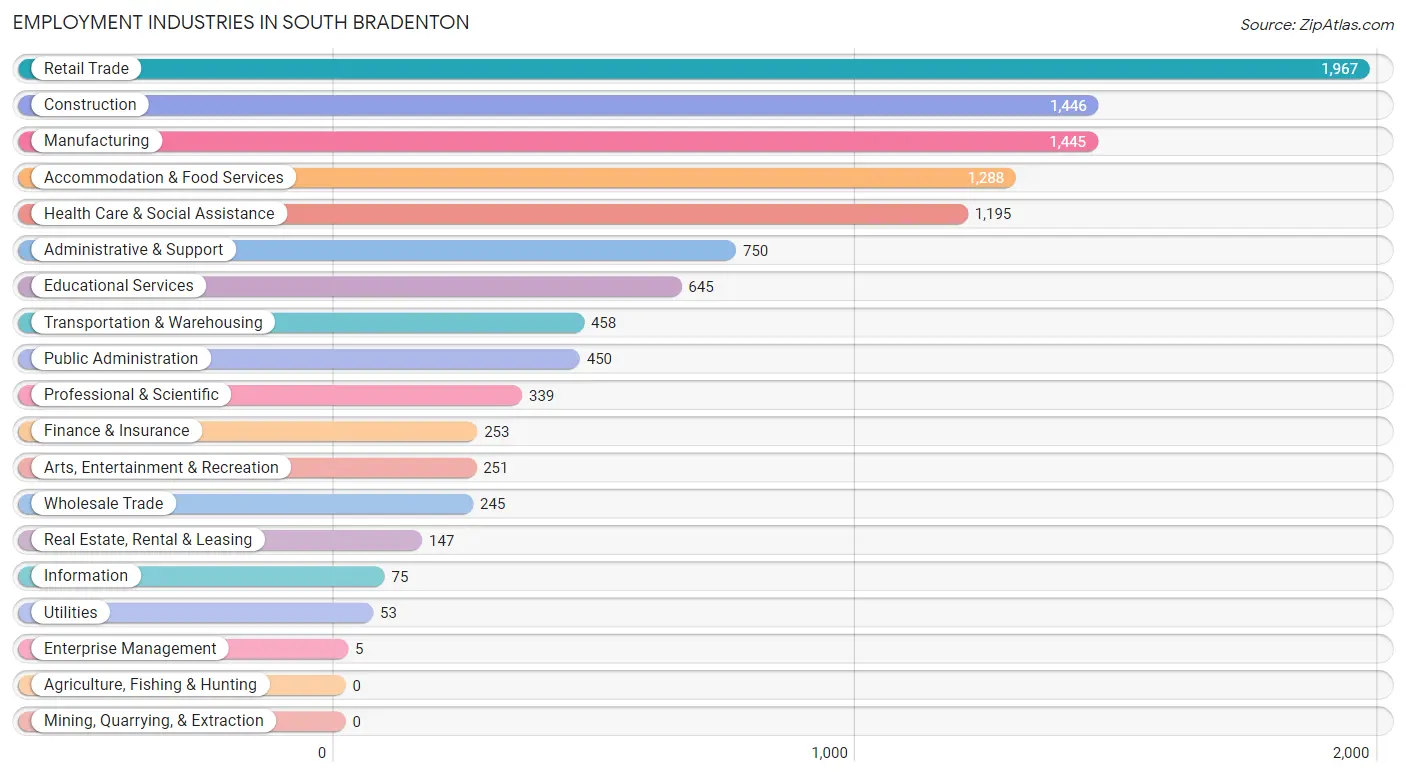
Employment Industries in South Bradenton
The major employment industries in South Bradenton include Retail Trade (1,967 | 17.0%), Construction (1,446 | 12.5%), Manufacturing (1,445 | 12.5%), Accommodation & Food Services (1,288 | 11.1%), and Health Care & Social Assistance (1,195 | 10.3%).
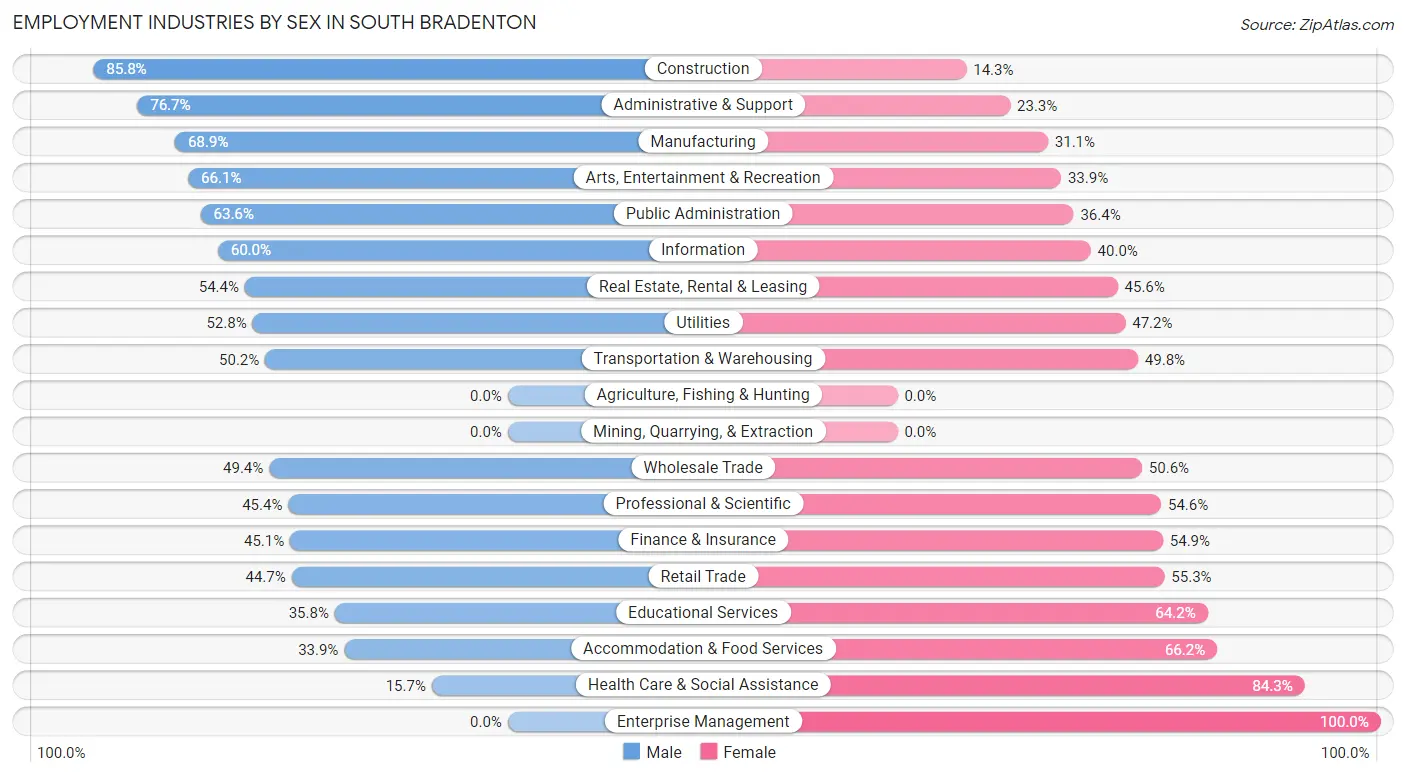
Employment Industries by Sex in South Bradenton
The South Bradenton industries that see more men than women are Construction (85.8%), Administrative & Support (76.7%), and Manufacturing (68.9%), whereas the industries that tend to have a higher number of women are Enterprise Management (100.0%), Health Care & Social Assistance (84.3%), and Accommodation & Food Services (66.1%).
| Industry | Male | Female |
| Agriculture, Fishing & Hunting | 0 (0.0%) | 0 (0.0%) |
| Mining, Quarrying, & Extraction | 0 (0.0%) | 0 (0.0%) |
| Construction | 1,240 (85.8%) | 206 (14.2%) |
| Manufacturing | 995 (68.9%) | 450 (31.1%) |
| Wholesale Trade | 121 (49.4%) | 124 (50.6%) |
| Retail Trade | 880 (44.7%) | 1,087 (55.3%) |
| Transportation & Warehousing | 230 (50.2%) | 228 (49.8%) |
| Utilities | 28 (52.8%) | 25 (47.2%) |
| Information | 45 (60.0%) | 30 (40.0%) |
| Finance & Insurance | 114 (45.1%) | 139 (54.9%) |
| Real Estate, Rental & Leasing | 80 (54.4%) | 67 (45.6%) |
| Professional & Scientific | 154 (45.4%) | 185 (54.6%) |
| Enterprise Management | 0 (0.0%) | 5 (100.0%) |
| Administrative & Support | 575 (76.7%) | 175 (23.3%) |
| Educational Services | 231 (35.8%) | 414 (64.2%) |
| Health Care & Social Assistance | 188 (15.7%) | 1,007 (84.3%) |
| Arts, Entertainment & Recreation | 166 (66.1%) | 85 (33.9%) |
| Accommodation & Food Services | 436 (33.9%) | 852 (66.1%) |
| Public Administration | 286 (63.6%) | 164 (36.4%) |
| Total | 6,045 (52.2%) | 5,530 (47.8%) |
Education in South Bradenton
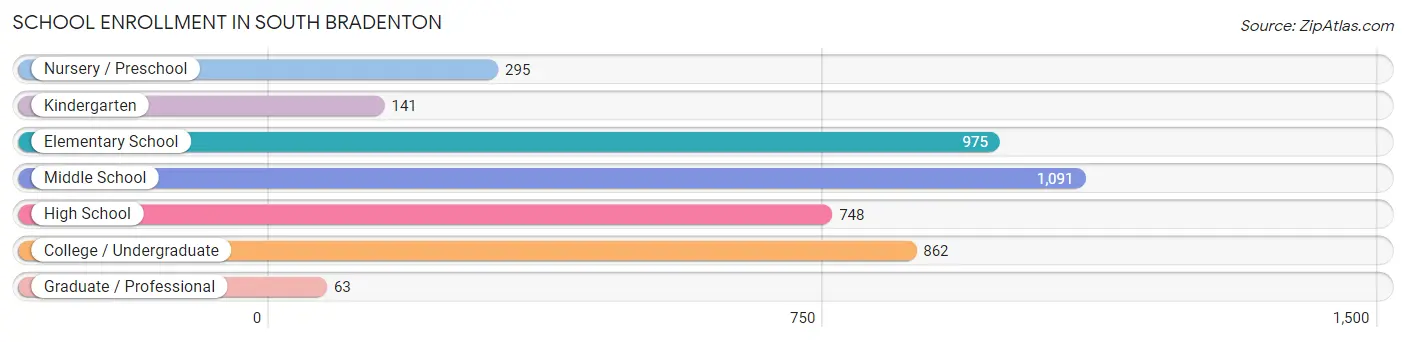
School Enrollment in South Bradenton
The most common levels of schooling among the 4,175 students in South Bradenton are middle school (1,091 | 26.1%), elementary school (975 | 23.4%), and college / undergraduate (862 | 20.6%).
| School Level | # Students | % Students |
| Nursery / Preschool | 295 | 7.1% |
| Kindergarten | 141 | 3.4% |
| Elementary School | 975 | 23.4% |
| Middle School | 1,091 | 26.1% |
| High School | 748 | 17.9% |
| College / Undergraduate | 862 | 20.6% |
| Graduate / Professional | 63 | 1.5% |
| Total | 4,175 | 100.0% |
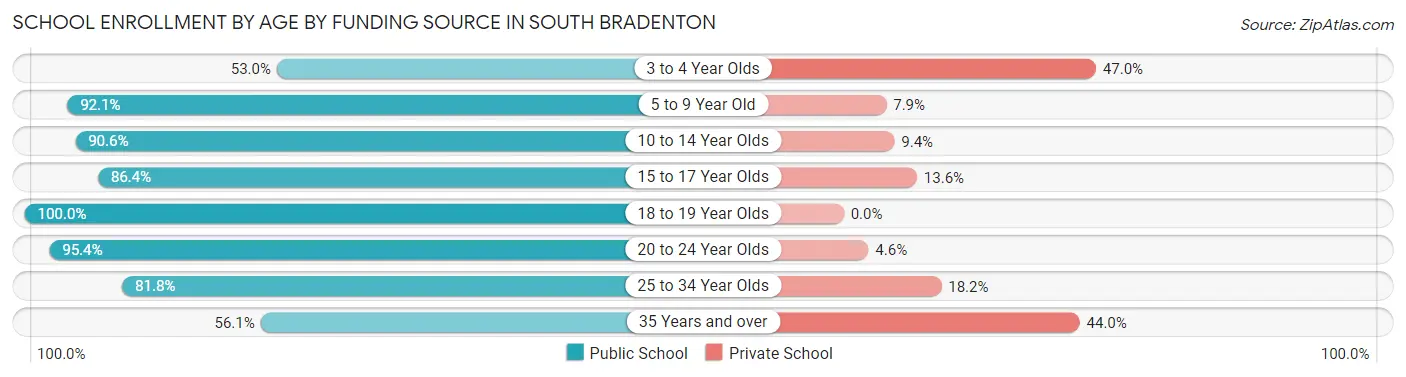
School Enrollment by Age by Funding Source in South Bradenton
Out of a total of 4,175 students who are enrolled in schools in South Bradenton, 505 (12.1%) attend a private institution, while the remaining 3,670 (87.9%) are enrolled in public schools. The age group of 3 to 4 year olds has the highest likelihood of being enrolled in private schools, with 101 (47.0% in the age bracket) enrolled. Conversely, the age group of 18 to 19 year olds has the lowest likelihood of being enrolled in a private school, with 277 (100.0% in the age bracket) attending a public institution.
| Age Bracket | Public School | Private School |
| 3 to 4 Year Olds | 114 (53.0%) | 101 (47.0%) |
| 5 to 9 Year Old | 951 (92.1%) | 82 (7.9%) |
| 10 to 14 Year Olds | 1,161 (90.6%) | 121 (9.4%) |
| 15 to 17 Year Olds | 481 (86.4%) | 76 (13.6%) |
| 18 to 19 Year Olds | 277 (100.0%) | 0 (0.0%) |
| 20 to 24 Year Olds | 435 (95.4%) | 21 (4.6%) |
| 25 to 34 Year Olds | 162 (81.8%) | 36 (18.2%) |
| 35 Years and over | 88 (56.0%) | 69 (44.0%) |
| Total | 3,670 (87.9%) | 505 (12.1%) |
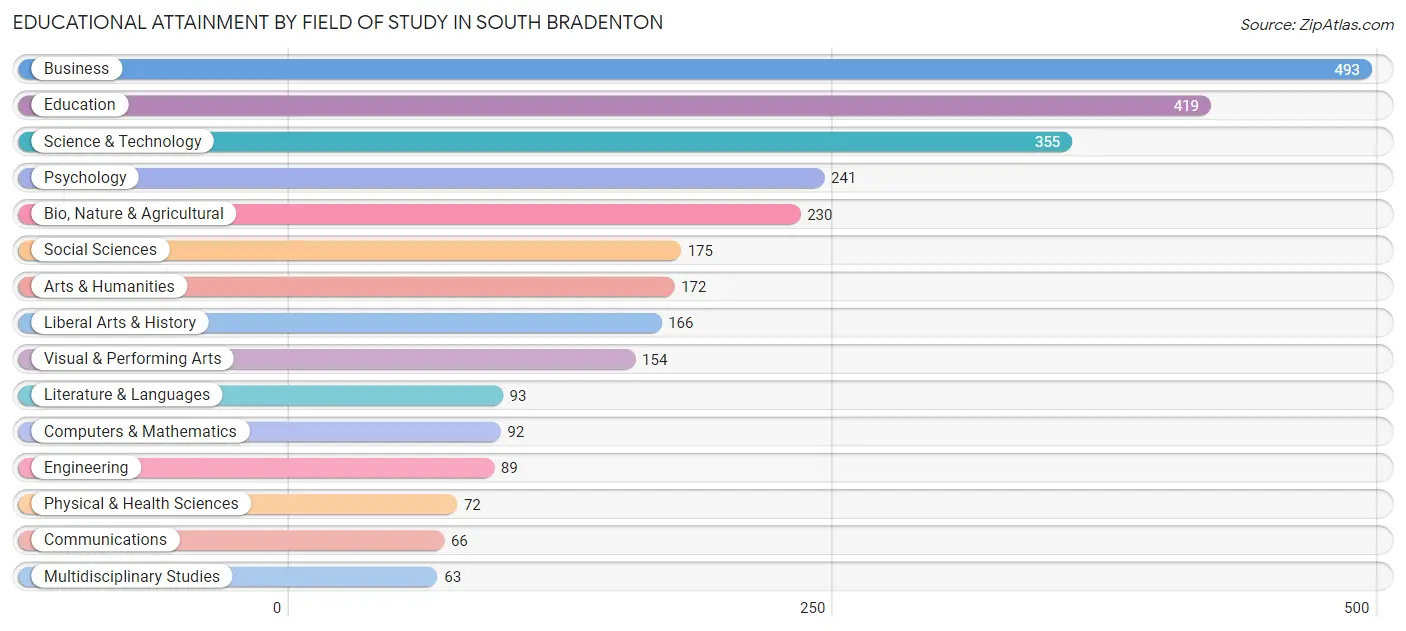
Educational Attainment by Field of Study in South Bradenton
Business (493 | 17.1%), education (419 | 14.5%), science & technology (355 | 12.3%), psychology (241 | 8.4%), and bio, nature & agricultural (230 | 8.0%) are the most common fields of study among 2,880 individuals in South Bradenton who have obtained a bachelor's degree or higher.
| Field of Study | # Graduates | % Graduates |
| Computers & Mathematics | 92 | 3.2% |
| Bio, Nature & Agricultural | 230 | 8.0% |
| Physical & Health Sciences | 72 | 2.5% |
| Psychology | 241 | 8.4% |
| Social Sciences | 175 | 6.1% |
| Engineering | 89 | 3.1% |
| Multidisciplinary Studies | 63 | 2.2% |
| Science & Technology | 355 | 12.3% |
| Business | 493 | 17.1% |
| Education | 419 | 14.5% |
| Literature & Languages | 93 | 3.2% |
| Liberal Arts & History | 166 | 5.8% |
| Visual & Performing Arts | 154 | 5.3% |
| Communications | 66 | 2.3% |
| Arts & Humanities | 172 | 6.0% |
| Total | 2,880 | 100.0% |
Transportation & Commute in South Bradenton
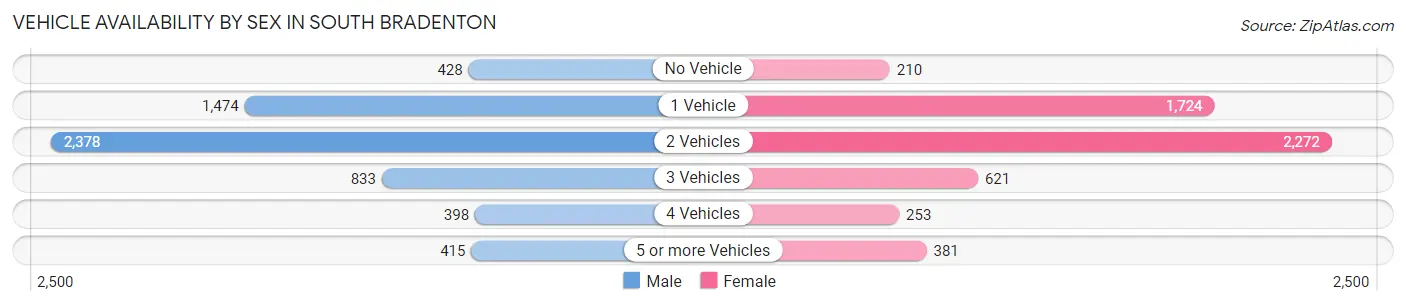
Vehicle Availability by Sex in South Bradenton
The most prevalent vehicle ownership categories in South Bradenton are males with 2 vehicles (2,378, accounting for 40.1%) and females with 2 vehicles (2,272, making up 43.5%).
| Vehicles Available | Male | Female |
| No Vehicle | 428 (7.2%) | 210 (3.8%) |
| 1 Vehicle | 1,474 (24.9%) | 1,724 (31.6%) |
| 2 Vehicles | 2,378 (40.1%) | 2,272 (41.6%) |
| 3 Vehicles | 833 (14.1%) | 621 (11.4%) |
| 4 Vehicles | 398 (6.7%) | 253 (4.6%) |
| 5 or more Vehicles | 415 (7.0%) | 381 (7.0%) |
| Total | 5,926 (100.0%) | 5,461 (100.0%) |
Commute Time in South Bradenton
The most frequently occuring commute durations in South Bradenton are 10 to 14 minutes (2,070 commuters, 18.8%), 15 to 19 minutes (2,017 commuters, 18.3%), and 20 to 24 minutes (1,647 commuters, 15.0%).
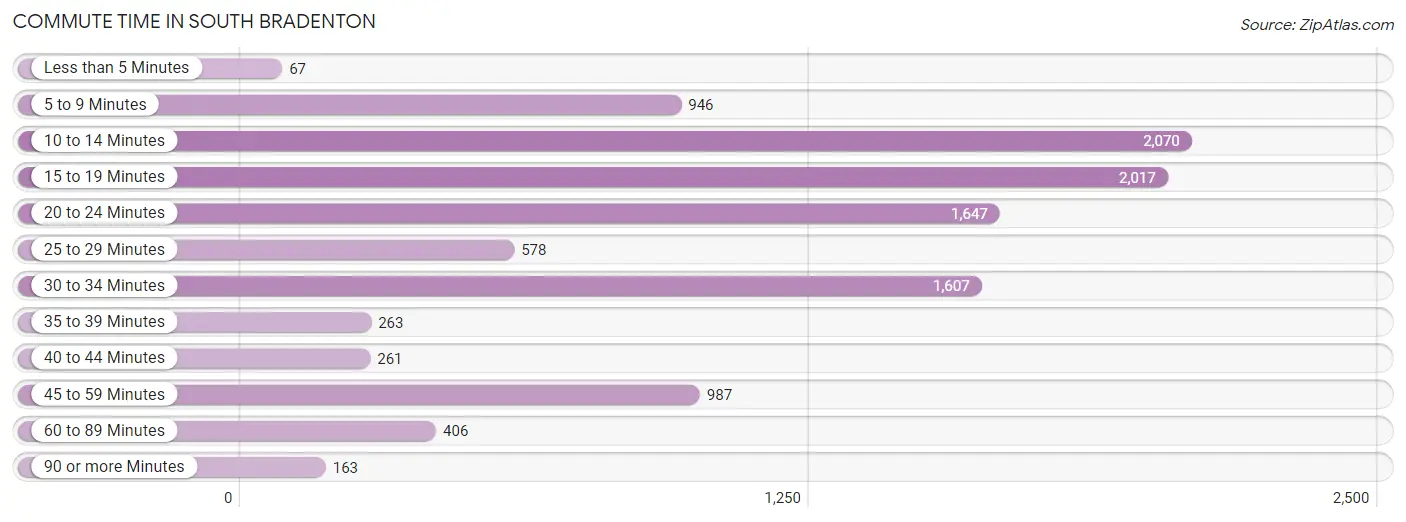
| Commute Time | # Commuters | % Commuters |
| Less than 5 Minutes | 67 | 0.6% |
| 5 to 9 Minutes | 946 | 8.6% |
| 10 to 14 Minutes | 2,070 | 18.8% |
| 15 to 19 Minutes | 2,017 | 18.3% |
| 20 to 24 Minutes | 1,647 | 15.0% |
| 25 to 29 Minutes | 578 | 5.2% |
| 30 to 34 Minutes | 1,607 | 14.6% |
| 35 to 39 Minutes | 263 | 2.4% |
| 40 to 44 Minutes | 261 | 2.4% |
| 45 to 59 Minutes | 987 | 9.0% |
| 60 to 89 Minutes | 406 | 3.7% |
| 90 or more Minutes | 163 | 1.5% |
Commute Time by Sex in South Bradenton
The most common commute times in South Bradenton are 20 to 24 minutes (986 commuters, 17.2%) for males and 10 to 14 minutes (1,145 commuters, 21.6%) for females.
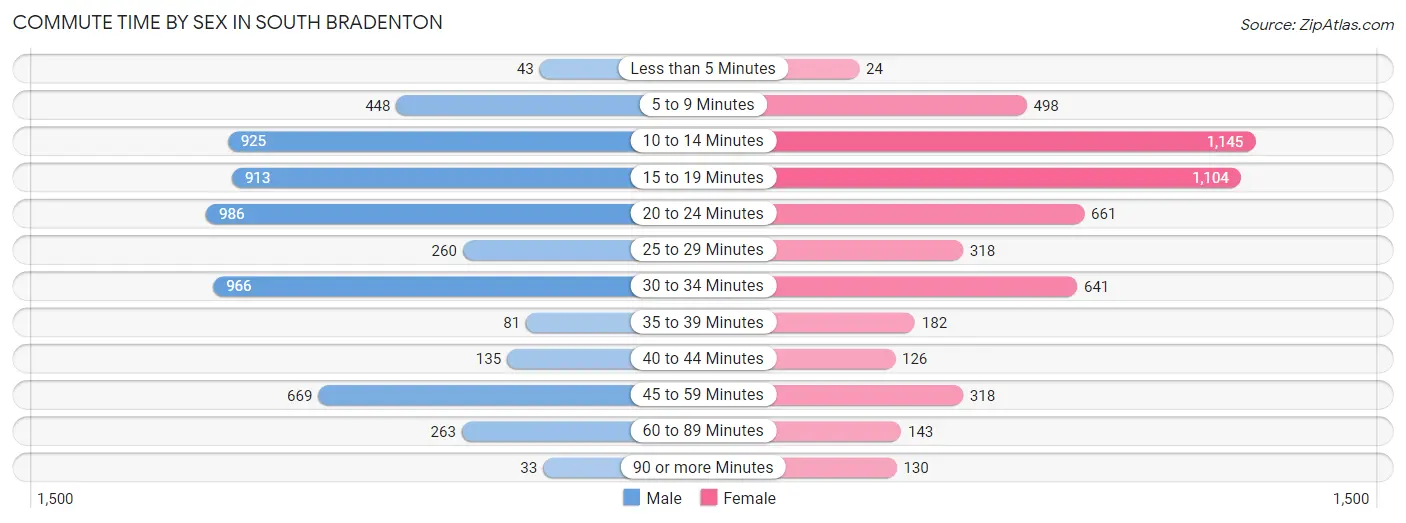
| Commute Time | Male | Female |
| Less than 5 Minutes | 43 (0.7%) | 24 (0.4%) |
| 5 to 9 Minutes | 448 (7.8%) | 498 (9.4%) |
| 10 to 14 Minutes | 925 (16.2%) | 1,145 (21.6%) |
| 15 to 19 Minutes | 913 (16.0%) | 1,104 (20.9%) |
| 20 to 24 Minutes | 986 (17.2%) | 661 (12.5%) |
| 25 to 29 Minutes | 260 (4.5%) | 318 (6.0%) |
| 30 to 34 Minutes | 966 (16.9%) | 641 (12.1%) |
| 35 to 39 Minutes | 81 (1.4%) | 182 (3.4%) |
| 40 to 44 Minutes | 135 (2.4%) | 126 (2.4%) |
| 45 to 59 Minutes | 669 (11.7%) | 318 (6.0%) |
| 60 to 89 Minutes | 263 (4.6%) | 143 (2.7%) |
| 90 or more Minutes | 33 (0.6%) | 130 (2.5%) |
Time of Departure to Work by Sex in South Bradenton
The most frequent times of departure to work in South Bradenton are 7:00 AM to 7:29 AM (1,156, 20.2%) for males and 7:00 AM to 7:29 AM (1,058, 20.0%) for females.
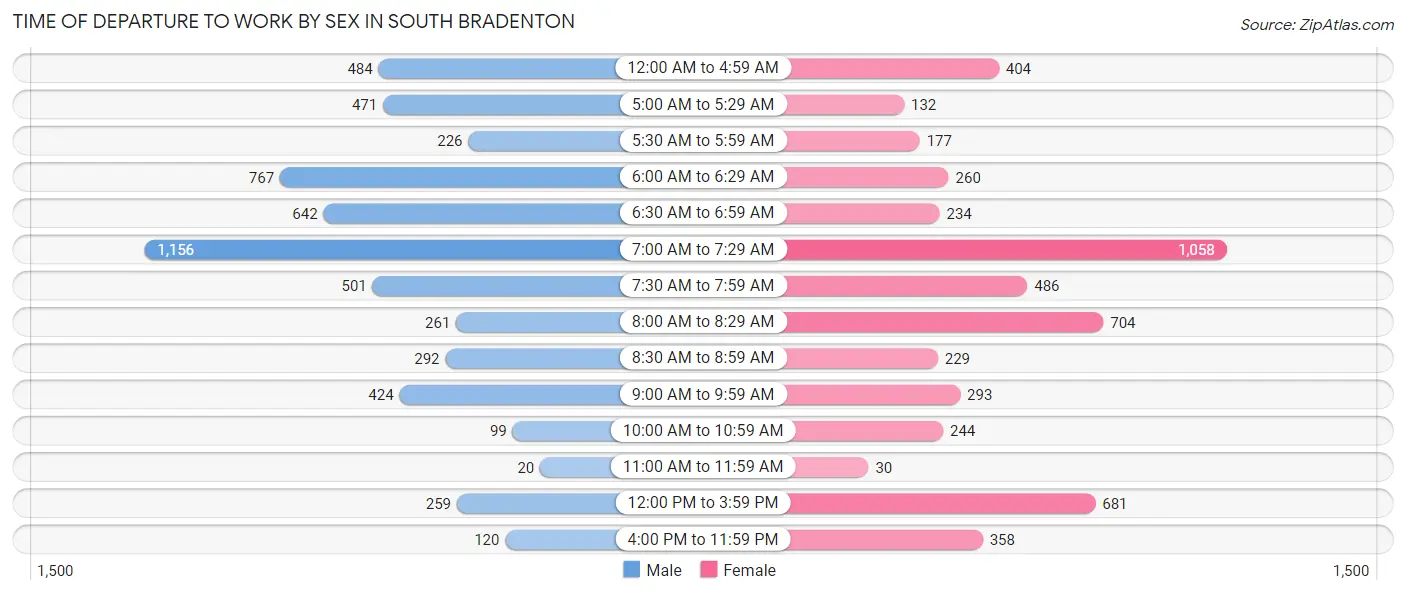
| Time of Departure | Male | Female |
| 12:00 AM to 4:59 AM | 484 (8.5%) | 404 (7.6%) |
| 5:00 AM to 5:29 AM | 471 (8.2%) | 132 (2.5%) |
| 5:30 AM to 5:59 AM | 226 (4.0%) | 177 (3.4%) |
| 6:00 AM to 6:29 AM | 767 (13.4%) | 260 (4.9%) |
| 6:30 AM to 6:59 AM | 642 (11.2%) | 234 (4.4%) |
| 7:00 AM to 7:29 AM | 1,156 (20.2%) | 1,058 (20.0%) |
| 7:30 AM to 7:59 AM | 501 (8.8%) | 486 (9.2%) |
| 8:00 AM to 8:29 AM | 261 (4.6%) | 704 (13.3%) |
| 8:30 AM to 8:59 AM | 292 (5.1%) | 229 (4.3%) |
| 9:00 AM to 9:59 AM | 424 (7.4%) | 293 (5.5%) |
| 10:00 AM to 10:59 AM | 99 (1.7%) | 244 (4.6%) |
| 11:00 AM to 11:59 AM | 20 (0.4%) | 30 (0.6%) |
| 12:00 PM to 3:59 PM | 259 (4.5%) | 681 (12.9%) |
| 4:00 PM to 11:59 PM | 120 (2.1%) | 358 (6.8%) |
| Total | 5,722 (100.0%) | 5,290 (100.0%) |
Housing Occupancy in South Bradenton
Occupancy by Ownership in South Bradenton
Of the total 10,950 dwellings in South Bradenton, owner-occupied units account for 5,989 (54.7%), while renter-occupied units make up 4,961 (45.3%).
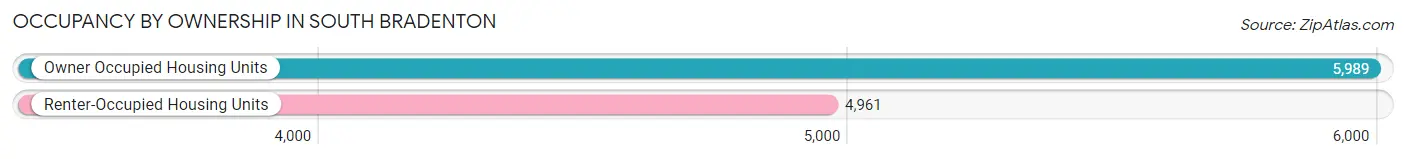
| Occupancy | # Housing Units | % Housing Units |
| Owner Occupied Housing Units | 5,989 | 54.7% |
| Renter-Occupied Housing Units | 4,961 | 45.3% |
| Total Occupied Housing Units | 10,950 | 100.0% |
Occupancy by Household Size in South Bradenton
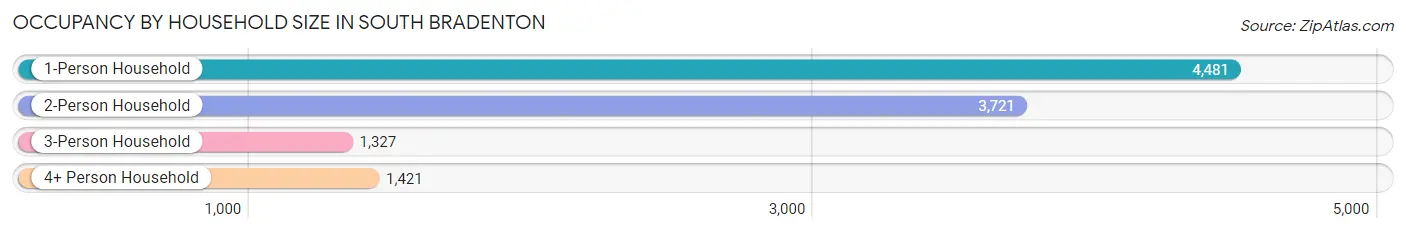
| Household Size | # Housing Units | % Housing Units |
| 1-Person Household | 4,481 | 40.9% |
| 2-Person Household | 3,721 | 34.0% |
| 3-Person Household | 1,327 | 12.1% |
| 4+ Person Household | 1,421 | 13.0% |
| Total Housing Units | 10,950 | 100.0% |
Occupancy by Ownership by Household Size in South Bradenton
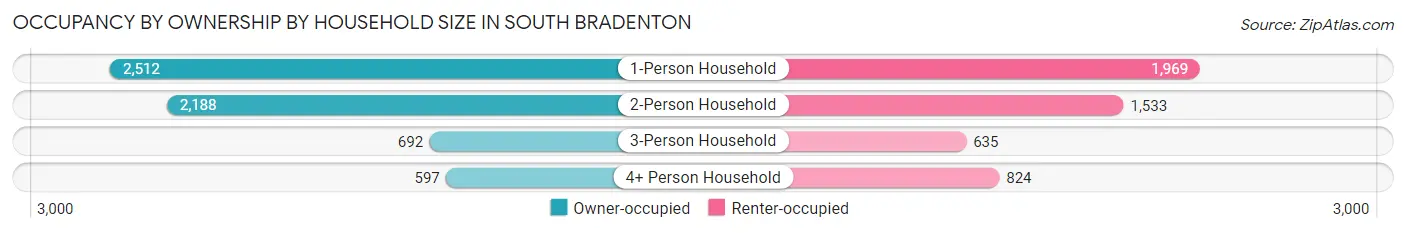
| Household Size | Owner-occupied | Renter-occupied |
| 1-Person Household | 2,512 (56.1%) | 1,969 (43.9%) |
| 2-Person Household | 2,188 (58.8%) | 1,533 (41.2%) |
| 3-Person Household | 692 (52.1%) | 635 (47.8%) |
| 4+ Person Household | 597 (42.0%) | 824 (58.0%) |
| Total Housing Units | 5,989 (54.7%) | 4,961 (45.3%) |
Occupancy by Educational Attainment in South Bradenton
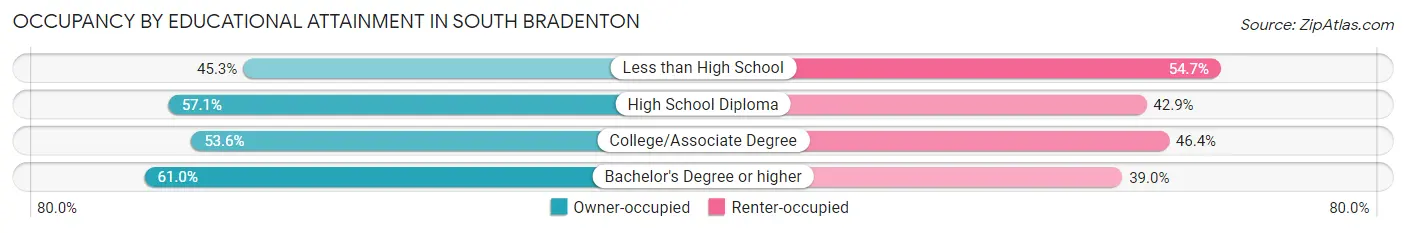
| Household Size | Owner-occupied | Renter-occupied |
| Less than High School | 789 (45.3%) | 951 (54.7%) |
| High School Diploma | 2,306 (57.1%) | 1,730 (42.9%) |
| College/Associate Degree | 1,885 (53.6%) | 1,634 (46.4%) |
| Bachelor's Degree or higher | 1,009 (61.0%) | 646 (39.0%) |
Occupancy by Age of Householder in South Bradenton
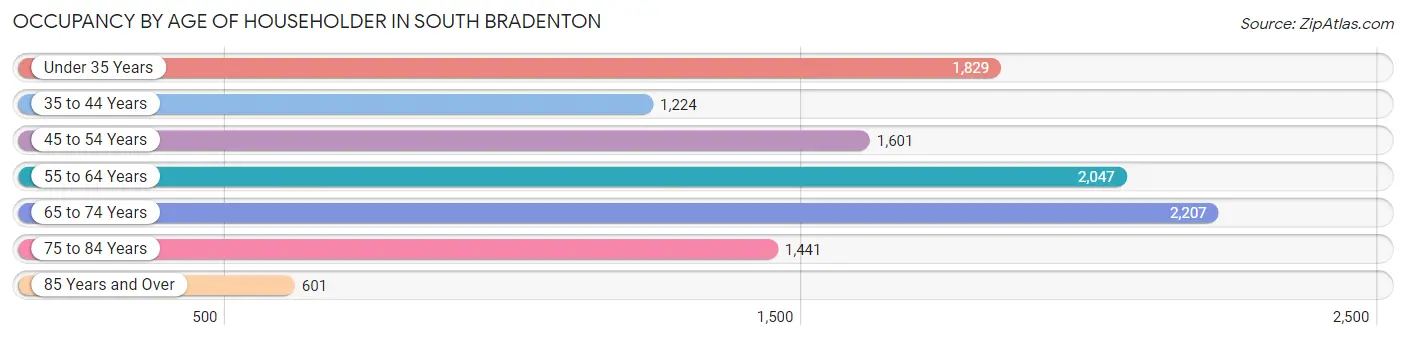
| Age Bracket | # Households | % Households |
| Under 35 Years | 1,829 | 16.7% |
| 35 to 44 Years | 1,224 | 11.2% |
| 45 to 54 Years | 1,601 | 14.6% |
| 55 to 64 Years | 2,047 | 18.7% |
| 65 to 74 Years | 2,207 | 20.2% |
| 75 to 84 Years | 1,441 | 13.2% |
| 85 Years and Over | 601 | 5.5% |
| Total | 10,950 | 100.0% |
Housing Finances in South Bradenton
Median Income by Occupancy in South Bradenton
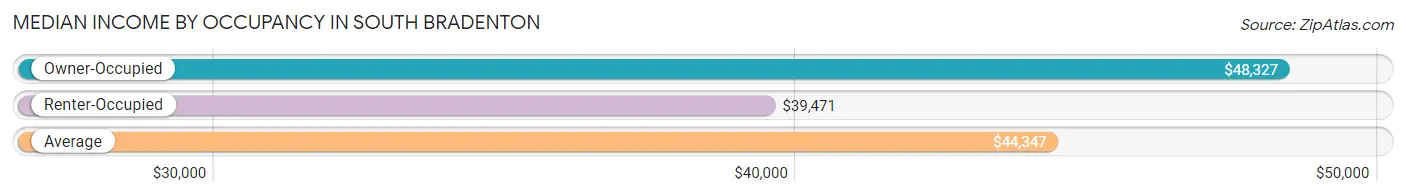
| Occupancy Type | # Households | Median Income |
| Owner-Occupied | 5,989 (54.7%) | $48,327 |
| Renter-Occupied | 4,961 (45.3%) | $39,471 |
| Average | 10,950 (100.0%) | $44,347 |
Occupancy by Householder Income Bracket in South Bradenton
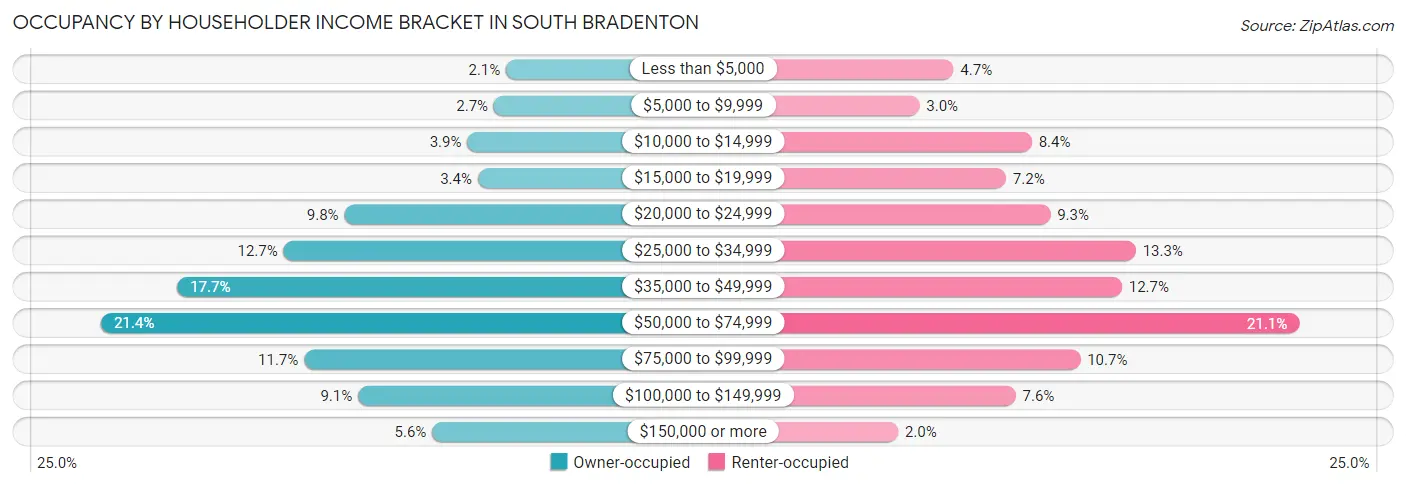
| Income Bracket | Owner-occupied | Renter-occupied |
| Less than $5,000 | 124 (2.1%) | 231 (4.7%) |
| $5,000 to $9,999 | 159 (2.6%) | 151 (3.0%) |
| $10,000 to $14,999 | 235 (3.9%) | 416 (8.4%) |
| $15,000 to $19,999 | 205 (3.4%) | 355 (7.2%) |
| $20,000 to $24,999 | 585 (9.8%) | 460 (9.3%) |
| $25,000 to $34,999 | 759 (12.7%) | 662 (13.3%) |
| $35,000 to $49,999 | 1,062 (17.7%) | 629 (12.7%) |
| $50,000 to $74,999 | 1,279 (21.4%) | 1,048 (21.1%) |
| $75,000 to $99,999 | 700 (11.7%) | 531 (10.7%) |
| $100,000 to $149,999 | 546 (9.1%) | 378 (7.6%) |
| $150,000 or more | 335 (5.6%) | 100 (2.0%) |
| Total | 5,989 (100.0%) | 4,961 (100.0%) |
Monthly Housing Cost Tiers in South Bradenton
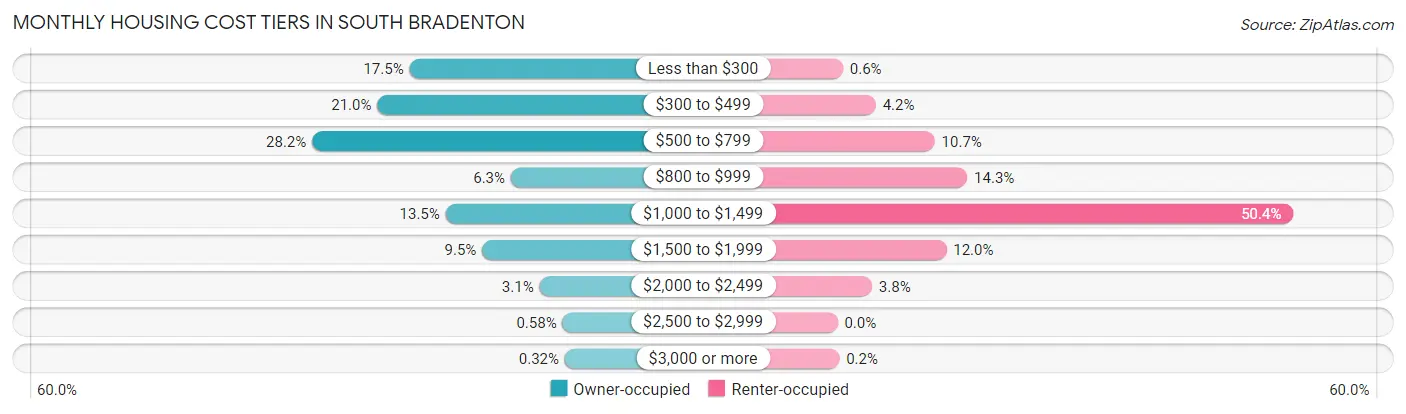
| Monthly Cost | Owner-occupied | Renter-occupied |
| Less than $300 | 1,047 (17.5%) | 30 (0.6%) |
| $300 to $499 | 1,260 (21.0%) | 210 (4.2%) |
| $500 to $799 | 1,691 (28.2%) | 533 (10.7%) |
| $800 to $999 | 376 (6.3%) | 711 (14.3%) |
| $1,000 to $1,499 | 808 (13.5%) | 2,498 (50.3%) |
| $1,500 to $1,999 | 566 (9.5%) | 597 (12.0%) |
| $2,000 to $2,499 | 187 (3.1%) | 189 (3.8%) |
| $2,500 to $2,999 | 35 (0.6%) | 0 (0.0%) |
| $3,000 or more | 19 (0.3%) | 10 (0.2%) |
| Total | 5,989 (100.0%) | 4,961 (100.0%) |
Physical Housing Characteristics in South Bradenton
Housing Structures in South Bradenton
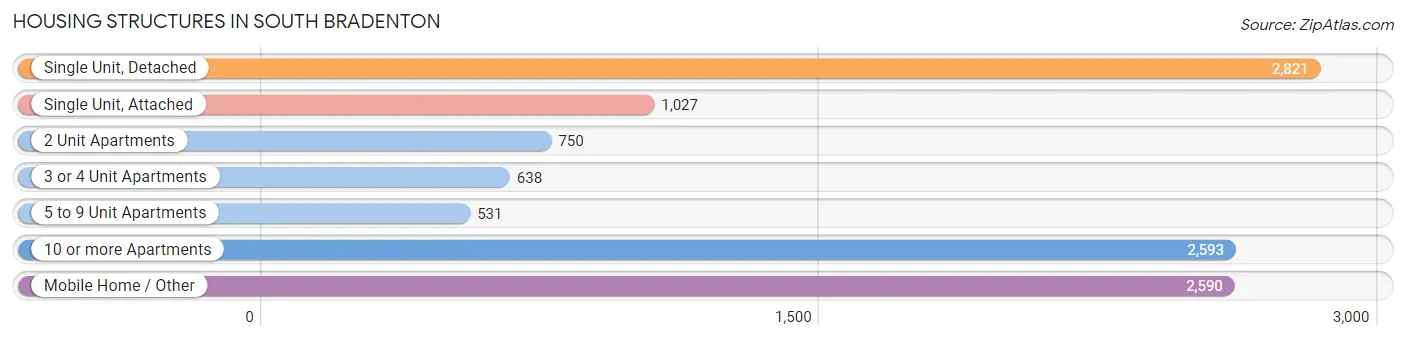
| Structure Type | # Housing Units | % Housing Units |
| Single Unit, Detached | 2,821 | 25.8% |
| Single Unit, Attached | 1,027 | 9.4% |
| 2 Unit Apartments | 750 | 6.9% |
| 3 or 4 Unit Apartments | 638 | 5.8% |
| 5 to 9 Unit Apartments | 531 | 4.9% |
| 10 or more Apartments | 2,593 | 23.7% |
| Mobile Home / Other | 2,590 | 23.6% |
| Total | 10,950 | 100.0% |
Housing Structures by Occupancy in South Bradenton
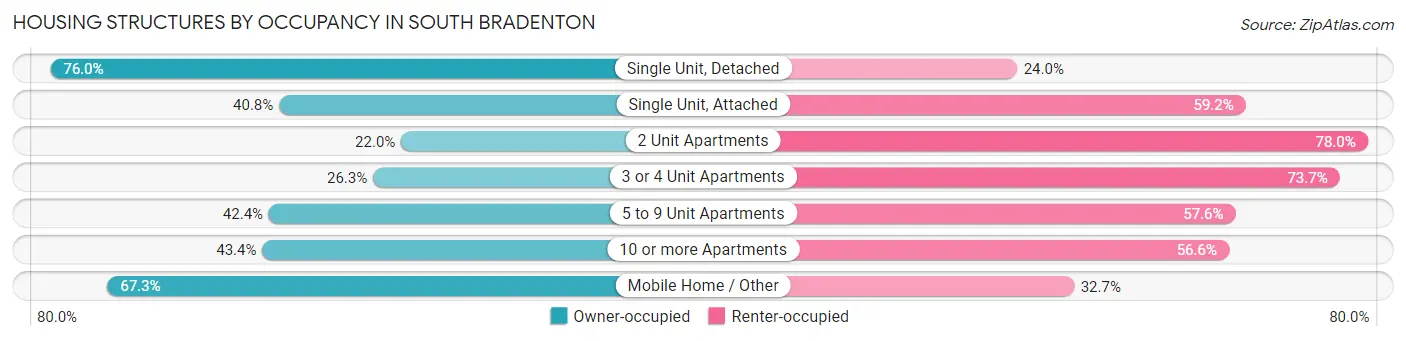
| Structure Type | Owner-occupied | Renter-occupied |
| Single Unit, Detached | 2,145 (76.0%) | 676 (24.0%) |
| Single Unit, Attached | 419 (40.8%) | 608 (59.2%) |
| 2 Unit Apartments | 165 (22.0%) | 585 (78.0%) |
| 3 or 4 Unit Apartments | 168 (26.3%) | 470 (73.7%) |
| 5 to 9 Unit Apartments | 225 (42.4%) | 306 (57.6%) |
| 10 or more Apartments | 1,125 (43.4%) | 1,468 (56.6%) |
| Mobile Home / Other | 1,742 (67.3%) | 848 (32.7%) |
| Total | 5,989 (54.7%) | 4,961 (45.3%) |
Housing Structures by Number of Rooms in South Bradenton
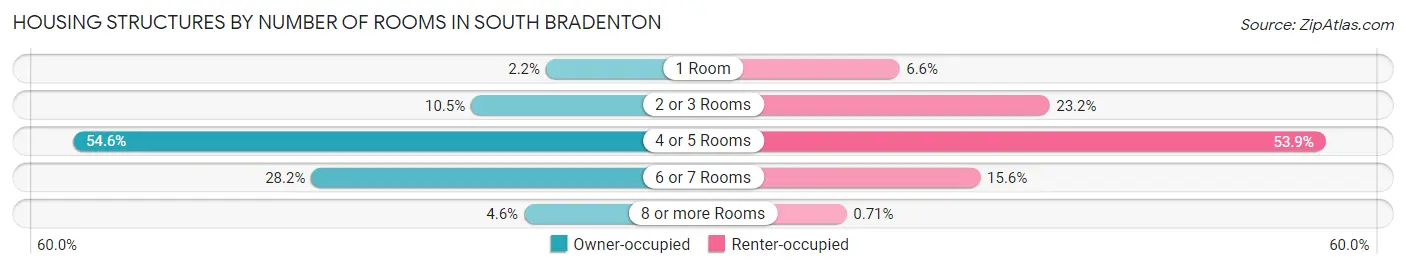
| Number of Rooms | Owner-occupied | Renter-occupied |
| 1 Room | 129 (2.1%) | 327 (6.6%) |
| 2 or 3 Rooms | 626 (10.4%) | 1,153 (23.2%) |
| 4 or 5 Rooms | 3,272 (54.6%) | 2,674 (53.9%) |
| 6 or 7 Rooms | 1,688 (28.2%) | 772 (15.6%) |
| 8 or more Rooms | 274 (4.6%) | 35 (0.7%) |
| Total | 5,989 (100.0%) | 4,961 (100.0%) |
Housing Structure by Heating Type in South Bradenton
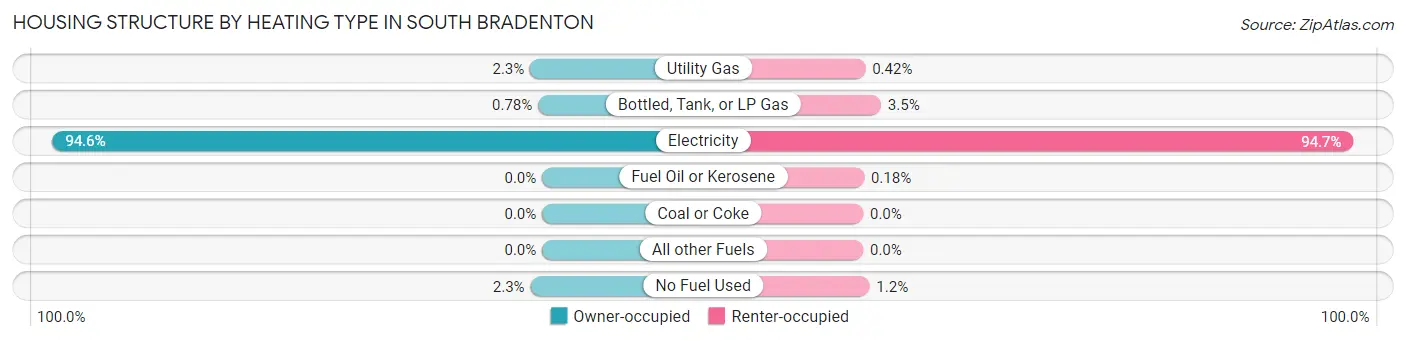
| Heating Type | Owner-occupied | Renter-occupied |
| Utility Gas | 139 (2.3%) | 21 (0.4%) |
| Bottled, Tank, or LP Gas | 47 (0.8%) | 171 (3.5%) |
| Electricity | 5,668 (94.6%) | 4,699 (94.7%) |
| Fuel Oil or Kerosene | 0 (0.0%) | 9 (0.2%) |
| Coal or Coke | 0 (0.0%) | 0 (0.0%) |
| All other Fuels | 0 (0.0%) | 0 (0.0%) |
| No Fuel Used | 135 (2.2%) | 61 (1.2%) |
| Total | 5,989 (100.0%) | 4,961 (100.0%) |
Household Vehicle Usage in South Bradenton
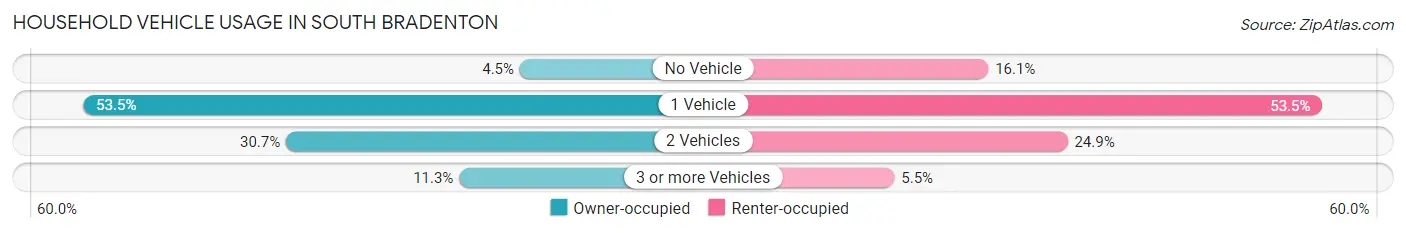
| Vehicles per Household | Owner-occupied | Renter-occupied |
| No Vehicle | 271 (4.5%) | 796 (16.1%) |
| 1 Vehicle | 3,201 (53.4%) | 2,653 (53.5%) |
| 2 Vehicles | 1,839 (30.7%) | 1,237 (24.9%) |
| 3 or more Vehicles | 678 (11.3%) | 275 (5.5%) |
| Total | 5,989 (100.0%) | 4,961 (100.0%) |
Real Estate & Mortgages in South Bradenton
Real Estate and Mortgage Overview in South Bradenton
| Characteristic | Without Mortgage | With Mortgage |
| Housing Units | 3,980 | 2,009 |
| Median Property Value | $95,600 | $208,100 |
| Median Household Income | $39,352 | $122 |
| Monthly Housing Costs | $449 | $9 |
| Real Estate Taxes | $791 | $64 |
Property Value by Mortgage Status in South Bradenton
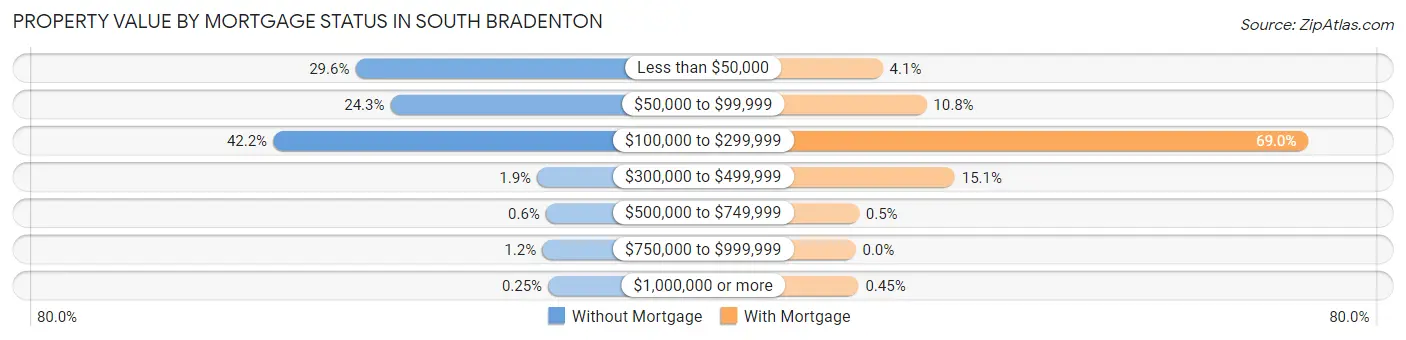
| Property Value | Without Mortgage | With Mortgage |
| Less than $50,000 | 1,179 (29.6%) | 83 (4.1%) |
| $50,000 to $99,999 | 966 (24.3%) | 217 (10.8%) |
| $100,000 to $299,999 | 1,678 (42.2%) | 1,386 (69.0%) |
| $300,000 to $499,999 | 77 (1.9%) | 304 (15.1%) |
| $500,000 to $749,999 | 24 (0.6%) | 10 (0.5%) |
| $750,000 to $999,999 | 46 (1.2%) | 0 (0.0%) |
| $1,000,000 or more | 10 (0.3%) | 9 (0.4%) |
| Total | 3,980 (100.0%) | 2,009 (100.0%) |
Household Income by Mortgage Status in South Bradenton
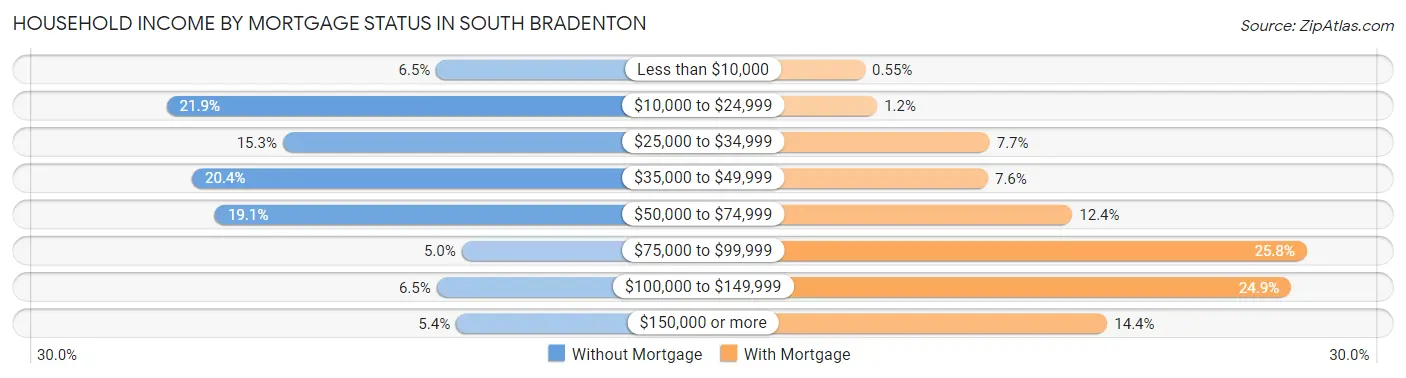
| Household Income | Without Mortgage | With Mortgage |
| Less than $10,000 | 258 (6.5%) | 11 (0.5%) |
| $10,000 to $24,999 | 871 (21.9%) | 25 (1.2%) |
| $25,000 to $34,999 | 607 (15.2%) | 154 (7.7%) |
| $35,000 to $49,999 | 813 (20.4%) | 152 (7.6%) |
| $50,000 to $74,999 | 761 (19.1%) | 249 (12.4%) |
| $75,000 to $99,999 | 200 (5.0%) | 518 (25.8%) |
| $100,000 to $149,999 | 257 (6.5%) | 500 (24.9%) |
| $150,000 or more | 213 (5.3%) | 289 (14.4%) |
| Total | 3,980 (100.0%) | 2,009 (100.0%) |
Property Value to Household Income Ratio in South Bradenton
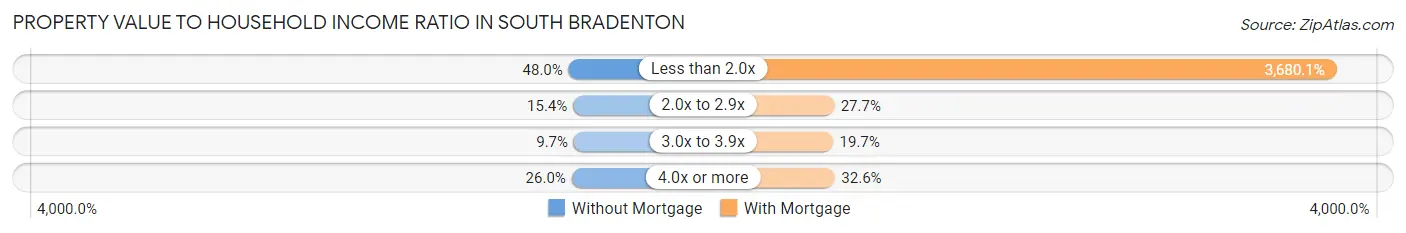
| Value-to-Income Ratio | Without Mortgage | With Mortgage |
| Less than 2.0x | 1,909 (48.0%) | 73,933 (3,680.1%) |
| 2.0x to 2.9x | 612 (15.4%) | 557 (27.7%) |
| 3.0x to 3.9x | 387 (9.7%) | 396 (19.7%) |
| 4.0x or more | 1,033 (26.0%) | 654 (32.6%) |
| Total | 3,980 (100.0%) | 2,009 (100.0%) |
Real Estate Taxes by Mortgage Status in South Bradenton
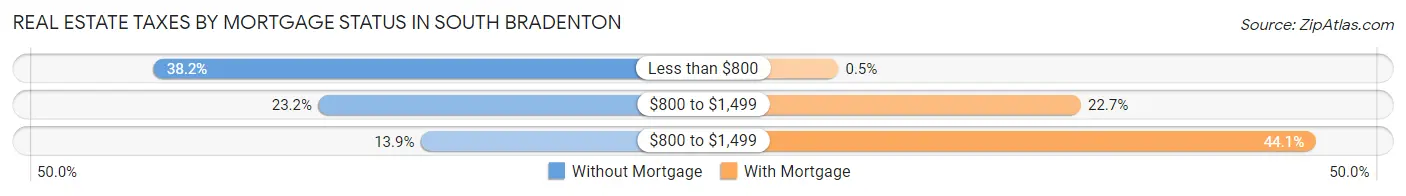
| Property Taxes | Without Mortgage | With Mortgage |
| Less than $800 | 1,520 (38.2%) | 10 (0.5%) |
| $800 to $1,499 | 924 (23.2%) | 455 (22.7%) |
| $800 to $1,499 | 552 (13.9%) | 886 (44.1%) |
| Total | 3,980 (100.0%) | 2,009 (100.0%) |
Health & Disability in South Bradenton
Health Insurance Coverage by Age in South Bradenton
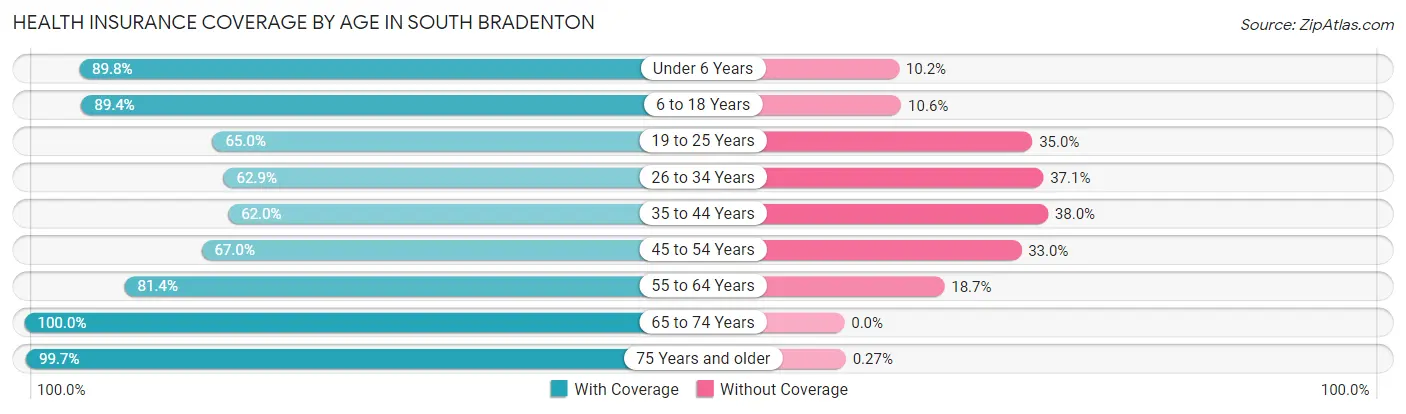
| Age Bracket | With Coverage | Without Coverage |
| Under 6 Years | 1,279 (89.8%) | 145 (10.2%) |
| 6 to 18 Years | 2,641 (89.4%) | 313 (10.6%) |
| 19 to 25 Years | 1,615 (65.0%) | 871 (35.0%) |
| 26 to 34 Years | 2,162 (62.9%) | 1,275 (37.1%) |
| 35 to 44 Years | 1,482 (62.0%) | 907 (38.0%) |
| 45 to 54 Years | 2,037 (67.0%) | 1,003 (33.0%) |
| 55 to 64 Years | 2,823 (81.4%) | 647 (18.6%) |
| 65 to 74 Years | 3,132 (100.0%) | 0 (0.0%) |
| 75 Years and older | 2,969 (99.7%) | 8 (0.3%) |
| Total | 20,140 (79.6%) | 5,169 (20.4%) |
Health Insurance Coverage by Citizenship Status in South Bradenton
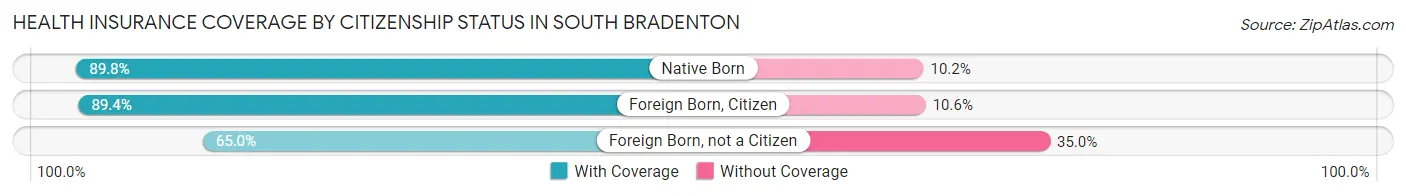
| Citizenship Status | With Coverage | Without Coverage |
| Native Born | 1,279 (89.8%) | 145 (10.2%) |
| Foreign Born, Citizen | 2,641 (89.4%) | 313 (10.6%) |
| Foreign Born, not a Citizen | 1,615 (65.0%) | 871 (35.0%) |
Health Insurance Coverage by Household Income in South Bradenton
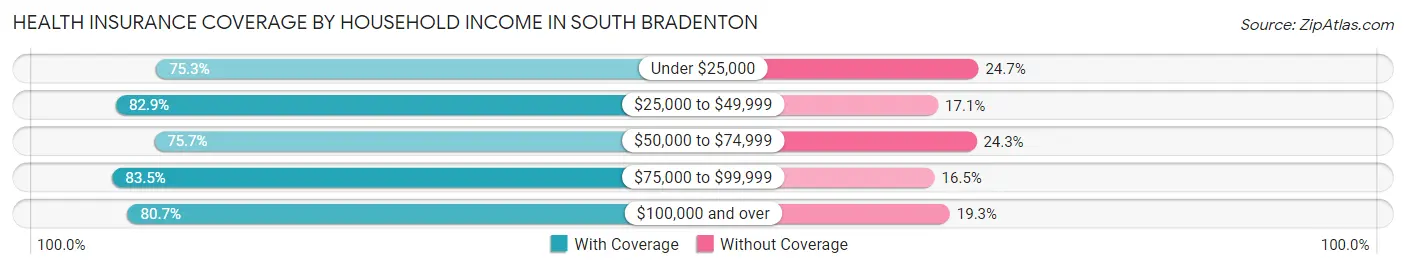
| Household Income | With Coverage | Without Coverage |
| Under $25,000 | 3,475 (75.3%) | 1,138 (24.7%) |
| $25,000 to $49,999 | 4,971 (82.9%) | 1,027 (17.1%) |
| $50,000 to $74,999 | 4,538 (75.7%) | 1,456 (24.3%) |
| $75,000 to $99,999 | 3,620 (83.5%) | 713 (16.5%) |
| $100,000 and over | 3,473 (80.7%) | 831 (19.3%) |
Public vs Private Health Insurance Coverage by Age in South Bradenton
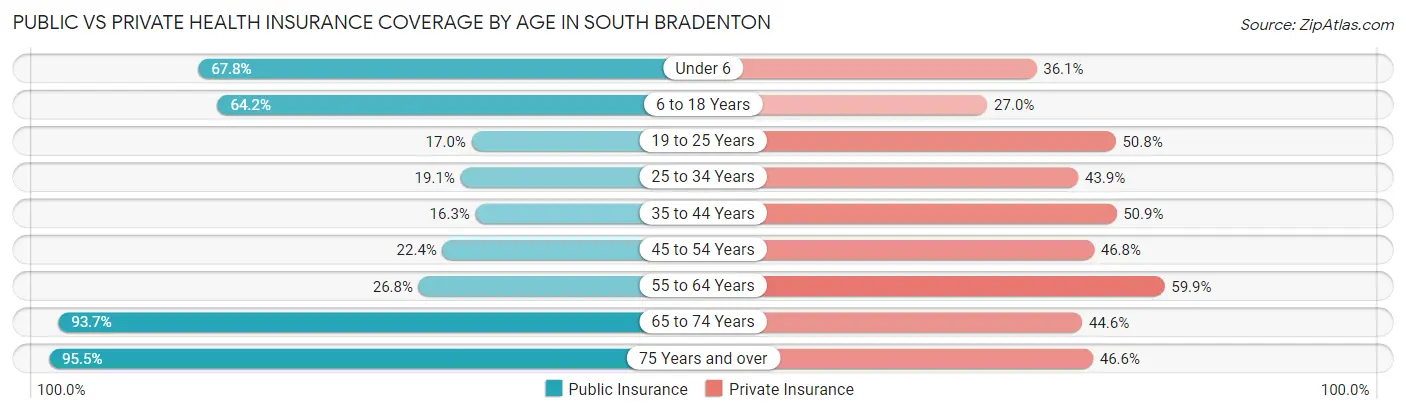
| Age Bracket | Public Insurance | Private Insurance |
| Under 6 | 965 (67.8%) | 514 (36.1%) |
| 6 to 18 Years | 1,896 (64.2%) | 797 (27.0%) |
| 19 to 25 Years | 423 (17.0%) | 1,263 (50.8%) |
| 25 to 34 Years | 655 (19.1%) | 1,507 (43.9%) |
| 35 to 44 Years | 389 (16.3%) | 1,217 (50.9%) |
| 45 to 54 Years | 681 (22.4%) | 1,422 (46.8%) |
| 55 to 64 Years | 931 (26.8%) | 2,077 (59.9%) |
| 65 to 74 Years | 2,936 (93.7%) | 1,397 (44.6%) |
| 75 Years and over | 2,842 (95.5%) | 1,387 (46.6%) |
| Total | 11,718 (46.3%) | 11,581 (45.8%) |
Disability Status by Sex by Age in South Bradenton
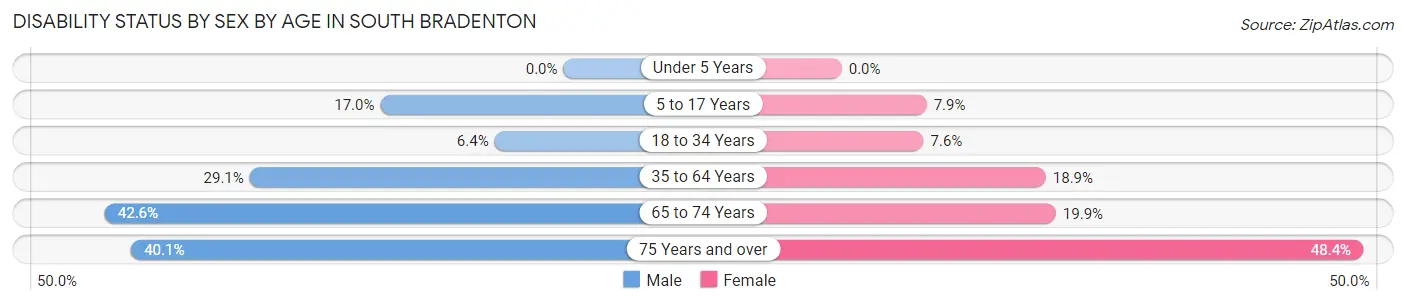
| Age Bracket | Male | Female |
| Under 5 Years | 0 (0.0%) | 0 (0.0%) |
| 5 to 17 Years | 220 (17.0%) | 125 (7.9%) |
| 18 to 34 Years | 198 (6.4%) | 234 (7.6%) |
| 35 to 64 Years | 1,311 (29.1%) | 833 (18.9%) |
| 65 to 74 Years | 654 (42.5%) | 317 (19.9%) |
| 75 Years and over | 484 (40.1%) | 856 (48.4%) |
Disability Class by Sex by Age in South Bradenton
Disability Class: Hearing Difficulty
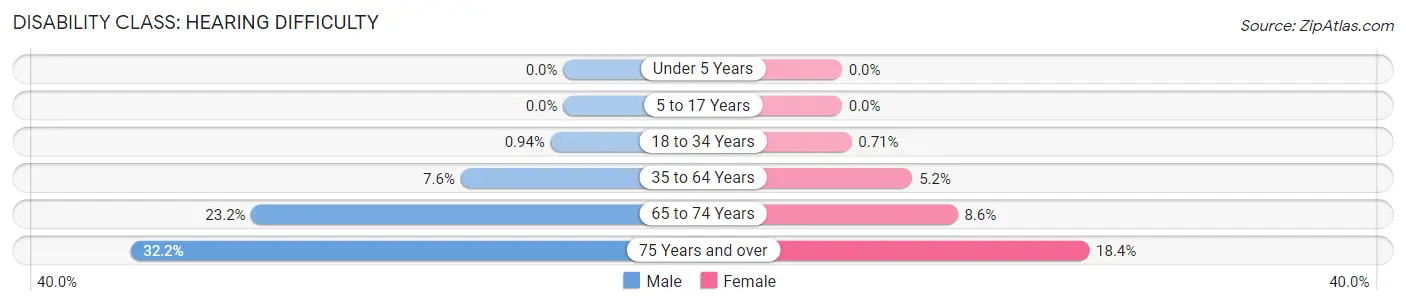
| Age Bracket | Male | Female |
| Under 5 Years | 0 (0.0%) | 0 (0.0%) |
| 5 to 17 Years | 0 (0.0%) | 0 (0.0%) |
| 18 to 34 Years | 29 (0.9%) | 22 (0.7%) |
| 35 to 64 Years | 343 (7.6%) | 230 (5.2%) |
| 65 to 74 Years | 356 (23.2%) | 137 (8.6%) |
| 75 Years and over | 388 (32.2%) | 325 (18.4%) |
Disability Class: Vision Difficulty
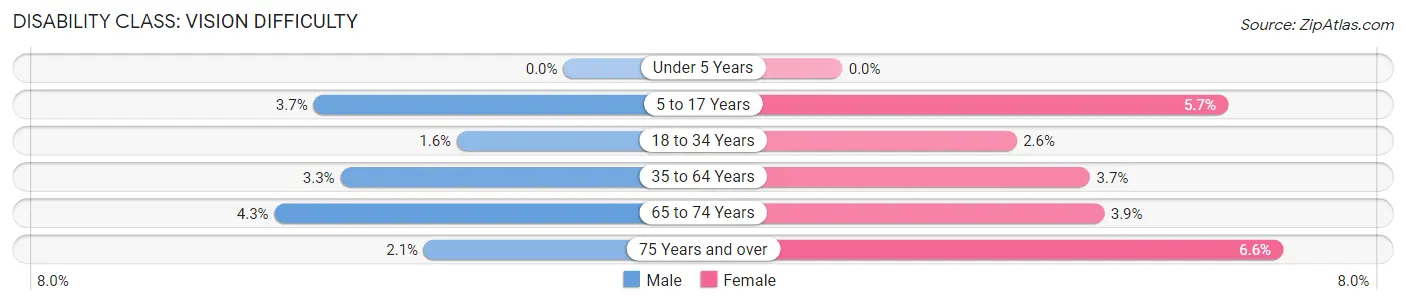
| Age Bracket | Male | Female |
| Under 5 Years | 0 (0.0%) | 0 (0.0%) |
| 5 to 17 Years | 48 (3.7%) | 91 (5.7%) |
| 18 to 34 Years | 49 (1.6%) | 80 (2.6%) |
| 35 to 64 Years | 149 (3.3%) | 162 (3.7%) |
| 65 to 74 Years | 66 (4.3%) | 62 (3.9%) |
| 75 Years and over | 25 (2.1%) | 116 (6.6%) |
Disability Class: Cognitive Difficulty
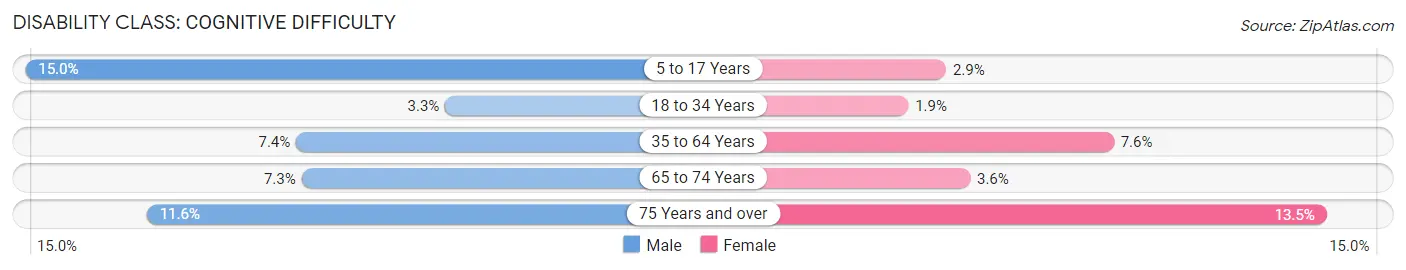
| Age Bracket | Male | Female |
| 5 to 17 Years | 194 (15.0%) | 46 (2.9%) |
| 18 to 34 Years | 102 (3.3%) | 57 (1.8%) |
| 35 to 64 Years | 335 (7.4%) | 333 (7.6%) |
| 65 to 74 Years | 112 (7.3%) | 57 (3.6%) |
| 75 Years and over | 140 (11.6%) | 239 (13.5%) |
Disability Class: Ambulatory Difficulty
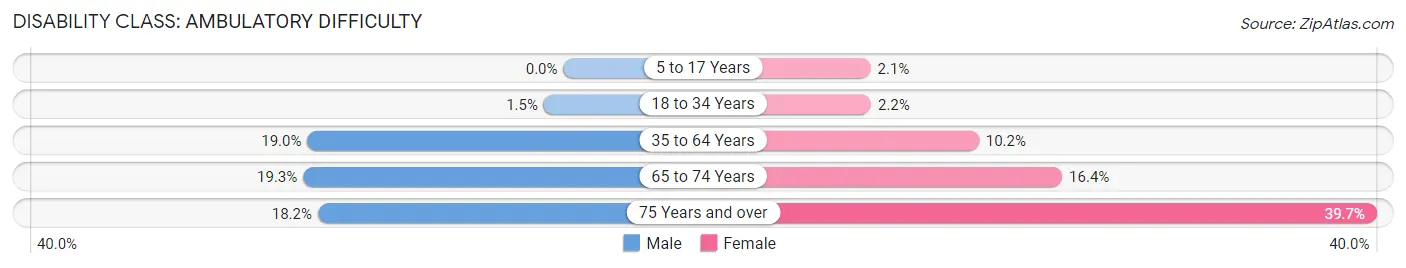
| Age Bracket | Male | Female |
| 5 to 17 Years | 0 (0.0%) | 34 (2.1%) |
| 18 to 34 Years | 45 (1.5%) | 67 (2.2%) |
| 35 to 64 Years | 856 (19.0%) | 447 (10.2%) |
| 65 to 74 Years | 297 (19.3%) | 261 (16.4%) |
| 75 Years and over | 220 (18.2%) | 703 (39.7%) |
Disability Class: Self-Care Difficulty
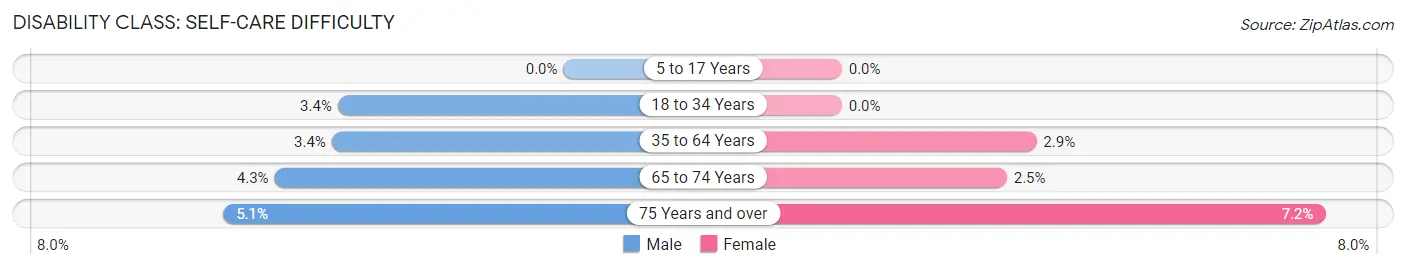
| Age Bracket | Male | Female |
| 5 to 17 Years | 0 (0.0%) | 0 (0.0%) |
| 18 to 34 Years | 104 (3.4%) | 0 (0.0%) |
| 35 to 64 Years | 155 (3.4%) | 127 (2.9%) |
| 65 to 74 Years | 66 (4.3%) | 39 (2.5%) |
| 75 Years and over | 61 (5.1%) | 127 (7.2%) |
Technology Access in South Bradenton
Computing Device Access in South Bradenton
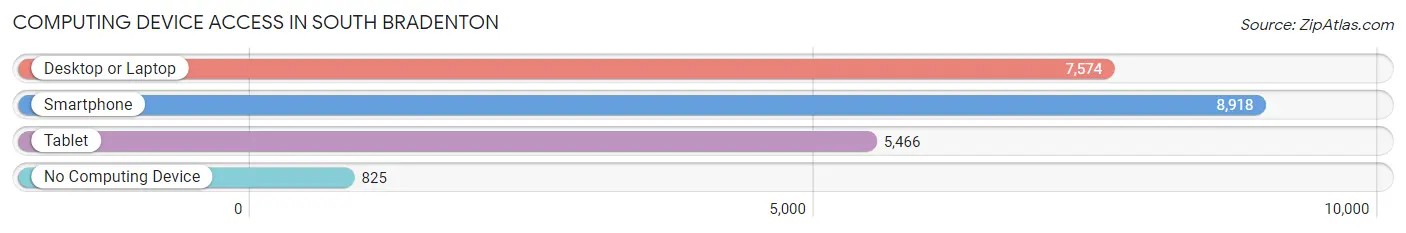
| Device Type | # Households | % Households |
| Desktop or Laptop | 7,574 | 69.2% |
| Smartphone | 8,918 | 81.4% |
| Tablet | 5,466 | 49.9% |
| No Computing Device | 825 | 7.5% |
| Total | 10,950 | 100.0% |
Internet Access in South Bradenton
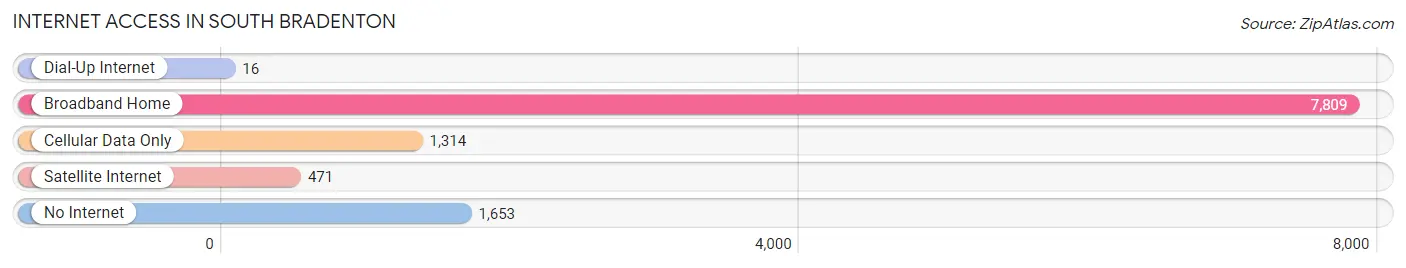
| Internet Type | # Households | % Households |
| Dial-Up Internet | 16 | 0.2% |
| Broadband Home | 7,809 | 71.3% |
| Cellular Data Only | 1,314 | 12.0% |
| Satellite Internet | 471 | 4.3% |
| No Internet | 1,653 | 15.1% |
| Total | 10,950 | 100.0% |
South Bradenton Summary
Bradenton, Florida is a city located in Manatee County, Florida, United States. It is the county seat of Manatee County and is located along the Manatee River, which flows into the Gulf of Mexico. The city is part of the Bradenton-Sarasota-Venice Metropolitan Statistical Area. As of the 2010 census, the city had a population of 49,546.
History
The area that is now Bradenton was first inhabited by the indigenous Tocobaga people. The first European contact was made in 1539 by Spanish explorer Hernando de Soto. The area was later settled by the Spanish in the late 1700s. The area was named after Dr. Joseph Braden, who was a settler in the area in the early 1800s.
In 1842, the area was incorporated as the Town of Manatee. In 1855, the town was renamed Bradentown. The city was officially incorporated in 1903.
Geography
Bradenton is located in Manatee County, Florida, on the Manatee River. It is located about 30 miles south of Tampa and about 50 miles north of Sarasota. The city has a total area of 24.2 square miles, of which 22.2 square miles is land and 2.0 square miles is water.
The city is located on the Gulf Coast of Florida and is bordered by the cities of Palmetto, Ellenton, and Anna Maria Island. The city is also located near the Myakka River, which flows into the Gulf of Mexico.
Economy
Bradenton is a major economic center in the region. The city is home to several major employers, including Tropicana Products, Champs Sports, and Bealls Department Stores. The city is also home to several major medical centers, including Manatee Memorial Hospital and Blake Medical Center.
The city is also home to several major shopping centers, including the DeSoto Square Mall and the Manatee Mall. The city is also home to several major tourist attractions, including the South Florida Museum, the Manatee Village Historical Park, and the Bradenton Riverwalk.
Demographics
As of the 2010 census, there were 49,546 people, 20,845 households, and 12,845 families residing in the city. The population density was 2,213.3 people per square mile. There were 23,845 housing units at an average density of 1,062.3 per square mile. The racial makeup of the city was 75.2% White, 15.3% African American, 0.4% Native American, 1.7% Asian, 0.1% Pacific Islander, 5.2% from other races, and 2.1% from two or more races. Hispanic or Latino of any race were 16.2% of the population.
There were 20,845 households, out of which 24.2% had children under the age of 18 living with them, 41.2% were married couples living together, 14.7% had a female householder with no husband present, and 39.3% were non-families. 32.2% of all households were made up of individuals, and 13.2% had someone living alone who was 65 years of age or older. The average household size was 2.35 and the average family size was 2.97.
In the city, the population was spread out, with 21.2% under the age of 18, 8.7% from 18 to 24, 25.2% from 25 to 44, 24.3% from 45 to 64, and 20.6% who were 65 years of age or older. The median age was 40 years. For every 100 females, there were 91.2 males. For every 100 females age 18 and over, there were 87.7 males.
The median income for a household in the city was $35,902, and the median income for a family was $44,837. Males had a median income of $31,945 versus $25,898 for females. The per capita income for the city was $20,945. About 11.2% of families and 14.7% of the population were below the poverty line, including 22.2% of those under age 18 and 8.2% of those age 65 or over.
Common Questions
What is Per Capita Income in South Bradenton?
Per Capita income in South Bradenton is $27,921.
What is the Median Family Income in South Bradenton?
Median Family Income in South Bradenton is $52,511.
What is the Median Household income in South Bradenton?
Median Household Income in South Bradenton is $44,347.
What is Income or Wage Gap in South Bradenton?
Income or Wage Gap in South Bradenton is 24.6%.
Women in South Bradenton earn 75.4 cents for every dollar earned by a man.
What is Family Income Deficit in South Bradenton?
Family Income Deficit in South Bradenton is $9,567.
Families that are below poverty line in South Bradenton earn $9,567 less on average than the poverty threshold level.
What is Inequality or Gini Index in South Bradenton?
Inequality or Gini Index in South Bradenton is 0.45.
What is the Total Population of South Bradenton?
Total Population of South Bradenton is 25,471.
What is the Total Male Population of South Bradenton?
Total Male Population of South Bradenton is 12,197.
What is the Total Female Population of South Bradenton?
Total Female Population of South Bradenton is 13,274.
What is the Ratio of Males per 100 Females in South Bradenton?
There are 91.89 Males per 100 Females in South Bradenton.
What is the Ratio of Females per 100 Males in South Bradenton?
There are 108.83 Females per 100 Males in South Bradenton.
What is the Median Population Age in South Bradenton?
Median Population Age in South Bradenton is 45.1 Years.
What is the Average Family Size in South Bradenton
Average Family Size in South Bradenton is 3.1 People.
What is the Average Household Size in South Bradenton
Average Household Size in South Bradenton is 2.3 People.
How Large is the Labor Force in South Bradenton?
There are 12,334 People in the Labor Forcein in South Bradenton.
What is the Percentage of People in the Labor Force in South Bradenton?
56.8% of People are in the Labor Force in South Bradenton.
What is the Unemployment Rate in South Bradenton?
Unemployment Rate in South Bradenton is 6.1%.