Irvington, NY Map & Demographics
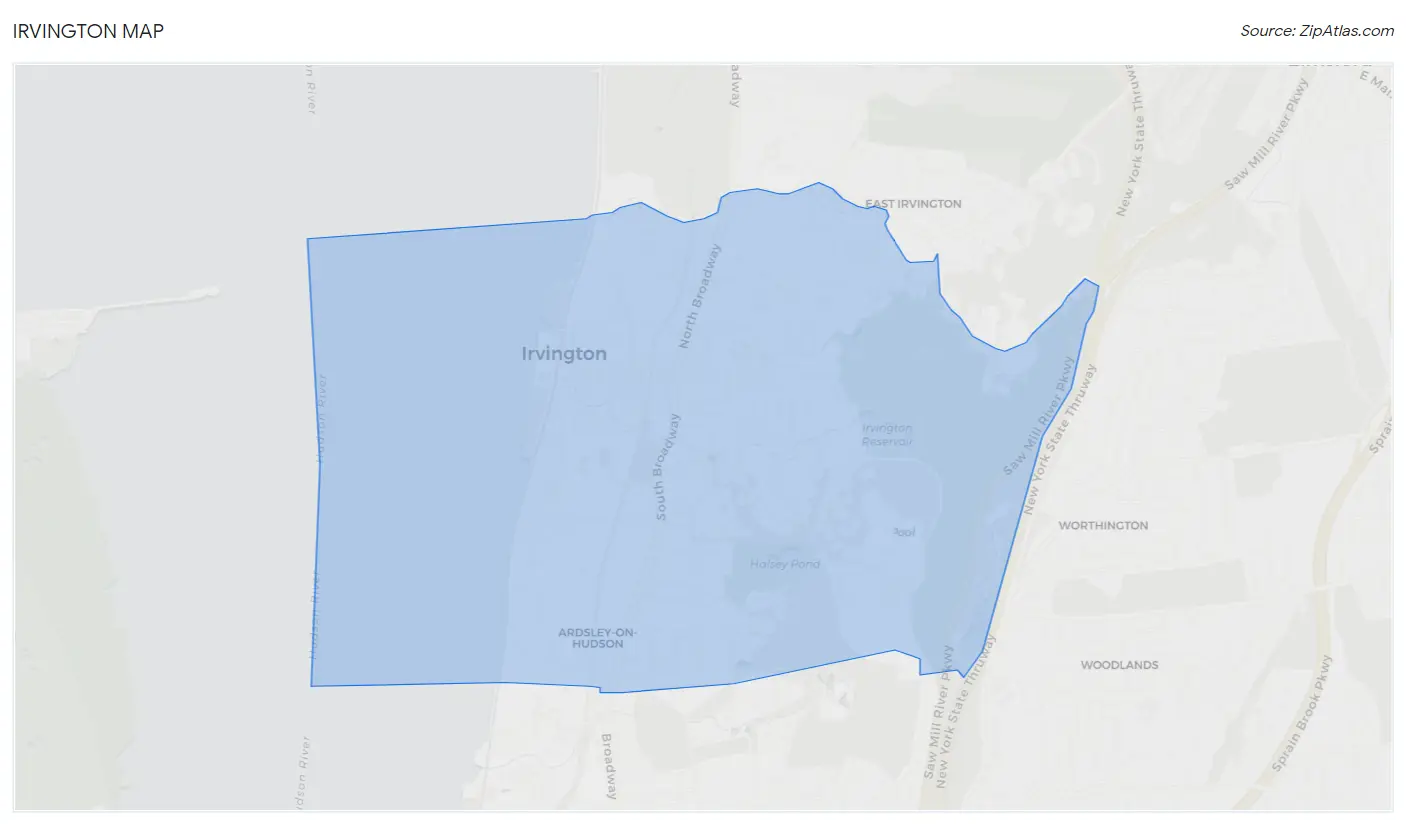
Irvington Map
Irvington Overview
$97,973
PER CAPITA INCOME
$230,741
AVG FAMILY INCOME
$184,569
AVG HOUSEHOLD INCOME
53.3%
WAGE / INCOME GAP [ % ]
46.7¢/ $1
WAGE / INCOME GAP [ $ ]
0.46
INEQUALITY / GINI INDEX
6,590
TOTAL POPULATION
3,268
MALE POPULATION
3,322
FEMALE POPULATION
98.37
MALES / 100 FEMALES
101.65
FEMALES / 100 MALES
41.1
MEDIAN AGE
3.2
AVG FAMILY SIZE
3.0
AVG HOUSEHOLD SIZE
3,511
LABOR FORCE [ PEOPLE ]
72.9%
PERCENT IN LABOR FORCE
3.1%
UNEMPLOYMENT RATE
Irvington Zip Codes
Irvington Area Codes
Income in Irvington
Income Overview in Irvington
Per Capita Income in Irvington is $97,973, while median incomes of families and households are $230,741 and $184,569 respectively.
| Characteristic | Number | Measure |
| Per Capita Income | 6,590 | $97,973 |
| Median Family Income | 1,870 | $230,741 |
| Mean Family Income | 1,870 | $325,882 |
| Median Household Income | 2,202 | $184,569 |
| Mean Household Income | 2,202 | $291,072 |
| Income Deficit | 1,870 | $0 |
| Wage / Income Gap (%) | 6,590 | 53.34% |
| Wage / Income Gap ($) | 6,590 | 46.66¢ per $1 |
| Gini / Inequality Index | 6,590 | 0.46 |
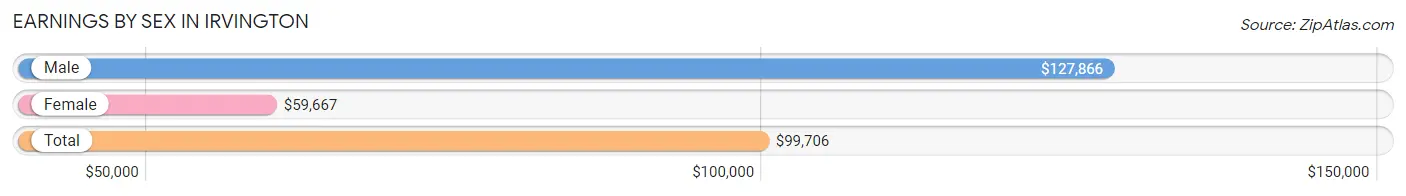
Earnings by Sex in Irvington
Average Earnings in Irvington are $99,706, $127,866 for men and $59,667 for women, a difference of 53.3%.
| Sex | Number | Average Earnings |
| Male | 1,968 (52.6%) | $127,866 |
| Female | 1,776 (47.4%) | $59,667 |
| Total | 3,744 (100.0%) | $99,706 |
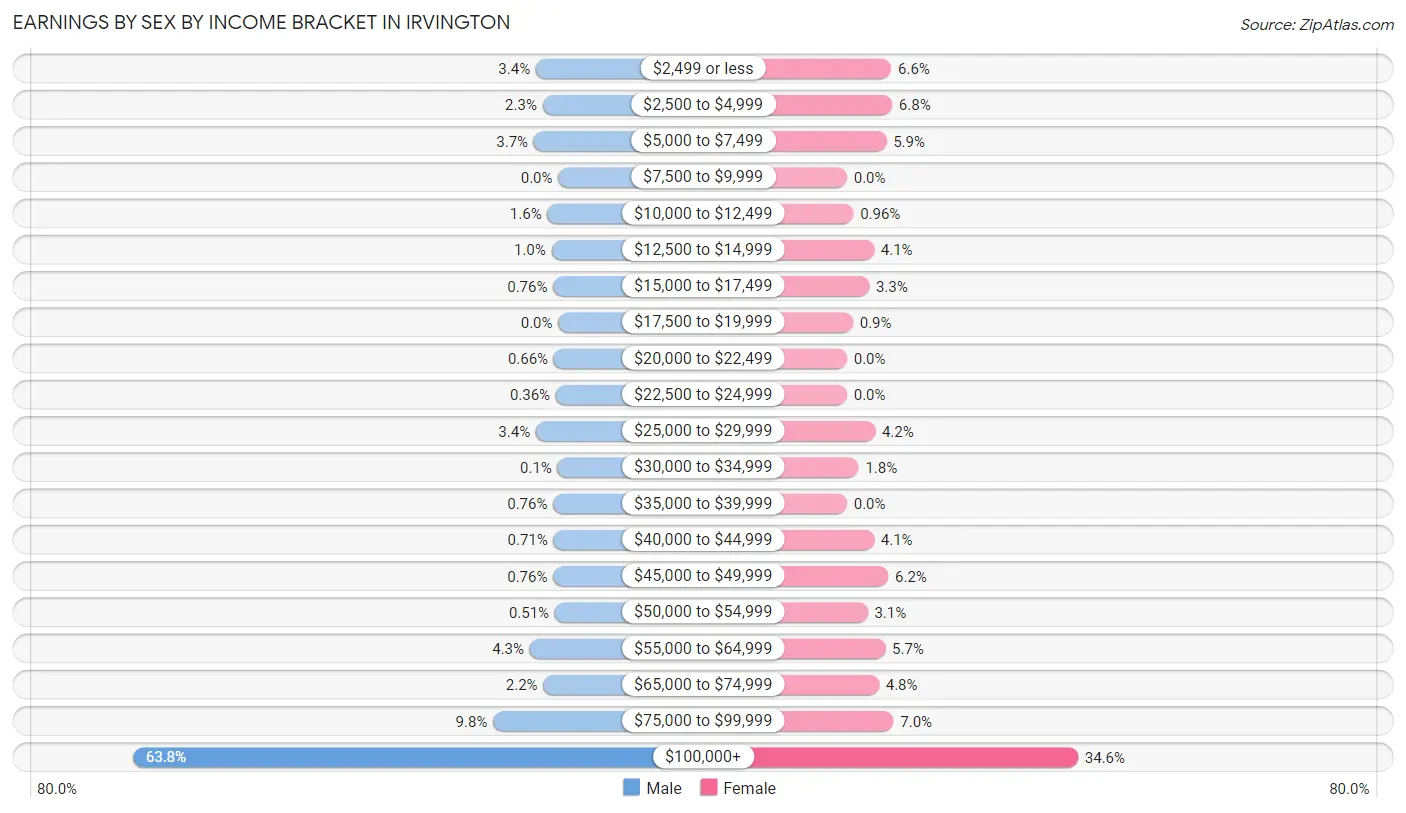
Earnings by Sex by Income Bracket in Irvington
The most common earnings brackets in Irvington are $100,000+ for men (1,255 | 63.8%) and $100,000+ for women (615 | 34.6%).
| Income | Male | Female |
| $2,499 or less | 66 (3.4%) | 118 (6.6%) |
| $2,500 to $4,999 | 46 (2.3%) | 120 (6.8%) |
| $5,000 to $7,499 | 72 (3.7%) | 105 (5.9%) |
| $7,500 to $9,999 | 0 (0.0%) | 0 (0.0%) |
| $10,000 to $12,499 | 32 (1.6%) | 17 (1.0%) |
| $12,500 to $14,999 | 20 (1.0%) | 72 (4.1%) |
| $15,000 to $17,499 | 15 (0.8%) | 59 (3.3%) |
| $17,500 to $19,999 | 0 (0.0%) | 16 (0.9%) |
| $20,000 to $22,499 | 13 (0.7%) | 0 (0.0%) |
| $22,500 to $24,999 | 7 (0.4%) | 0 (0.0%) |
| $25,000 to $29,999 | 66 (3.4%) | 75 (4.2%) |
| $30,000 to $34,999 | 2 (0.1%) | 31 (1.8%) |
| $35,000 to $39,999 | 15 (0.8%) | 0 (0.0%) |
| $40,000 to $44,999 | 14 (0.7%) | 72 (4.1%) |
| $45,000 to $49,999 | 15 (0.8%) | 110 (6.2%) |
| $50,000 to $54,999 | 10 (0.5%) | 55 (3.1%) |
| $55,000 to $64,999 | 84 (4.3%) | 102 (5.7%) |
| $65,000 to $74,999 | 44 (2.2%) | 85 (4.8%) |
| $75,000 to $99,999 | 192 (9.8%) | 124 (7.0%) |
| $100,000+ | 1,255 (63.8%) | 615 (34.6%) |
| Total | 1,968 (100.0%) | 1,776 (100.0%) |
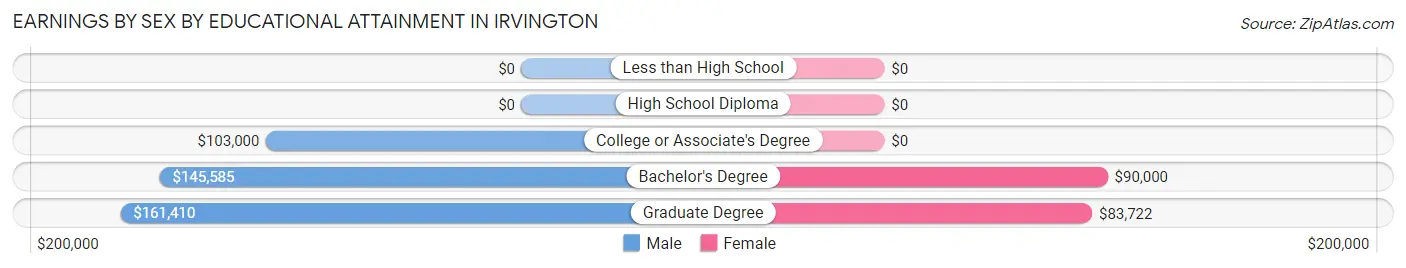
Earnings by Sex by Educational Attainment in Irvington
Average earnings in Irvington are $145,762 for men and $66,776 for women, a difference of 54.2%. Men with an educational attainment of graduate degree enjoy the highest average annual earnings of $161,410, while those with college or associate's degree education earn the least with $103,000. Women with an educational attainment of bachelor's degree earn the most with the average annual earnings of $90,000, while those with graduate degree education have the smallest earnings of $83,722.
| Educational Attainment | Male Income | Female Income |
| Less than High School | - | - |
| High School Diploma | - | - |
| College or Associate's Degree | $103,000 | $0 |
| Bachelor's Degree | $145,585 | $90,000 |
| Graduate Degree | $161,410 | $83,722 |
| Total | $145,762 | $66,776 |
Family Income in Irvington
Family Income Brackets in Irvington
According to the Irvington family income data, there are 1,036 families falling into the $200,000+ income range, which is the most common income bracket and makes up 55.4% of all families.
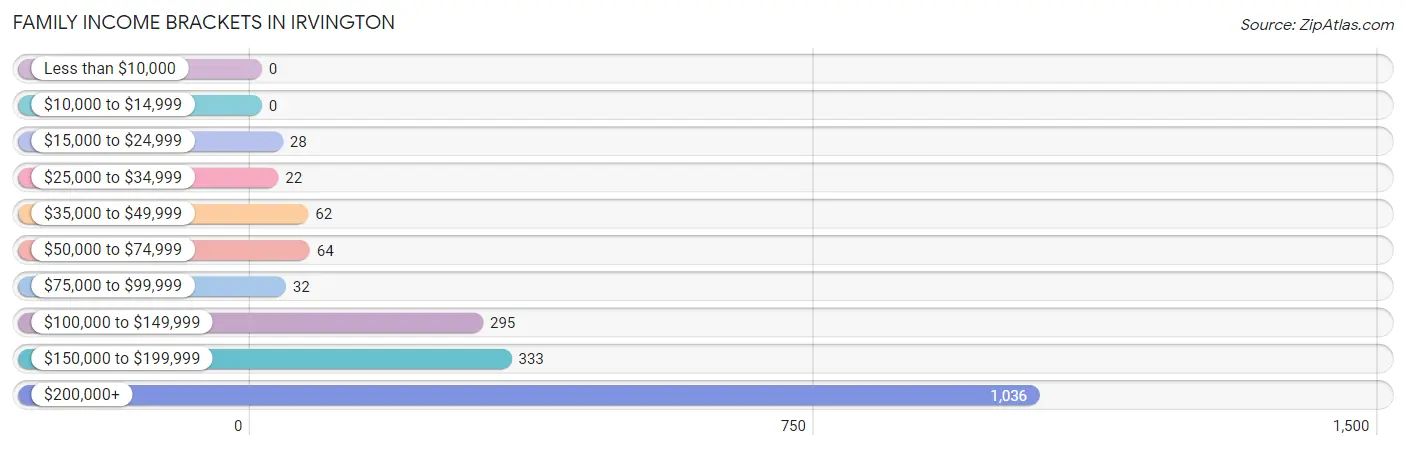
| Income Bracket | # Families | % Families |
| Less than $10,000 | 0 | 0.0% |
| $10,000 to $14,999 | 0 | 0.0% |
| $15,000 to $24,999 | 28 | 1.5% |
| $25,000 to $34,999 | 22 | 1.2% |
| $35,000 to $49,999 | 62 | 3.3% |
| $50,000 to $74,999 | 64 | 3.4% |
| $75,000 to $99,999 | 32 | 1.7% |
| $100,000 to $149,999 | 295 | 15.8% |
| $150,000 to $199,999 | 333 | 17.8% |
| $200,000+ | 1,036 | 55.4% |
Family Income by Famaliy Size in Irvington
3-person families (482 | 25.8%) account for the highest median family income in Irvington with $250,001 per family, while 2-person families (606 | 32.4%) have the highest median income of $85,547 per family member.
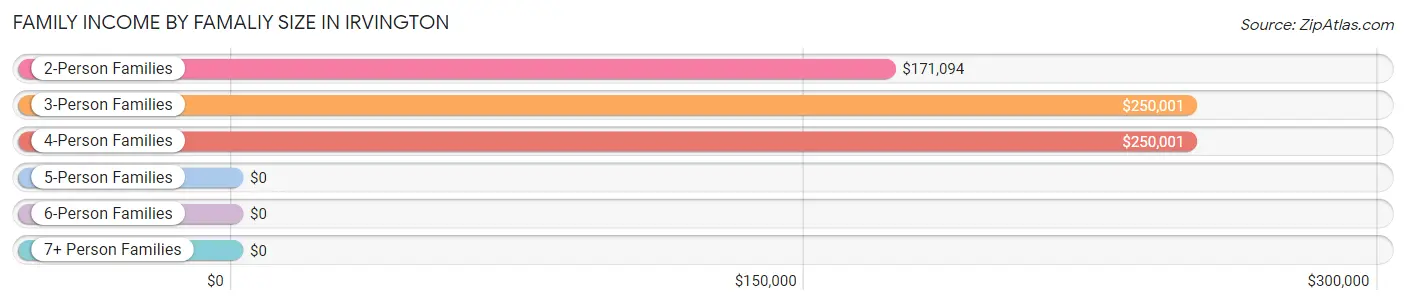
| Income Bracket | # Families | Median Income |
| 2-Person Families | 606 (32.4%) | $171,094 |
| 3-Person Families | 482 (25.8%) | $250,001 |
| 4-Person Families | 453 (24.2%) | $250,001 |
| 5-Person Families | 289 (15.4%) | $0 |
| 6-Person Families | 25 (1.3%) | $0 |
| 7+ Person Families | 15 (0.8%) | $0 |
| Total | 1,870 (100.0%) | $230,741 |
Family Income by Number of Earners in Irvington
The median family income in Irvington is $230,741, with families comprising 3+ earners (255) having the highest median family income of $250,001, while families with no earners (143) have the lowest median family income of $90,859, accounting for 13.6% and 7.6% of families, respectively.
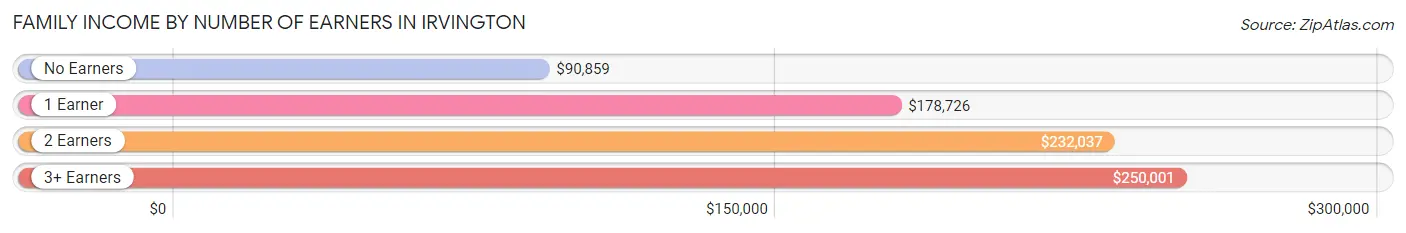
| Number of Earners | # Families | Median Income |
| No Earners | 143 (7.6%) | $90,859 |
| 1 Earner | 504 (27.0%) | $178,726 |
| 2 Earners | 968 (51.8%) | $232,037 |
| 3+ Earners | 255 (13.6%) | $250,001 |
| Total | 1,870 (100.0%) | $230,741 |
Household Income in Irvington
Household Income Brackets in Irvington
With 1,053 households falling in the category, the $200,000+ income range is the most frequent in Irvington, accounting for 47.8% of all households. In contrast, only 18 households (0.8%) fall into the $10,000 to $14,999 income bracket, making it the least populous group.
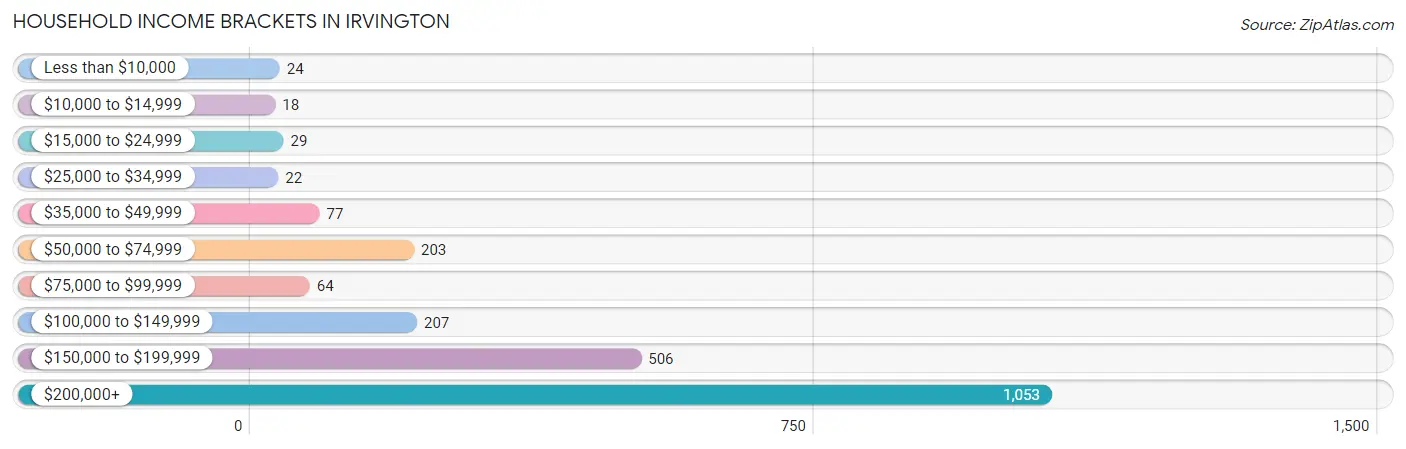
| Income Bracket | # Households | % Households |
| Less than $10,000 | 24 | 1.1% |
| $10,000 to $14,999 | 18 | 0.8% |
| $15,000 to $24,999 | 29 | 1.3% |
| $25,000 to $34,999 | 22 | 1.0% |
| $35,000 to $49,999 | 77 | 3.5% |
| $50,000 to $74,999 | 203 | 9.2% |
| $75,000 to $99,999 | 64 | 2.9% |
| $100,000 to $149,999 | 207 | 9.4% |
| $150,000 to $199,999 | 506 | 23.0% |
| $200,000+ | 1,053 | 47.8% |
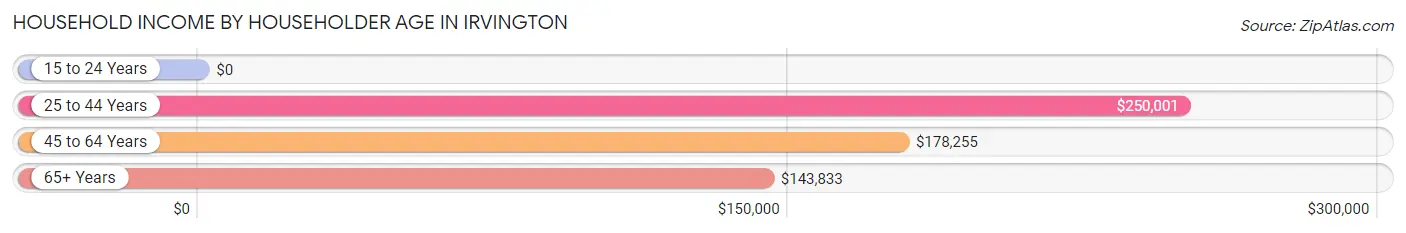
Household Income by Householder Age in Irvington
The median household income in Irvington is $184,569, with the highest median household income of $250,001 found in the 25 to 44 years age bracket for the primary householder. A total of 536 households (24.3%) fall into this category.
| Income Bracket | # Households | Median Income |
| 15 to 24 Years | 0 (0.0%) | $0 |
| 25 to 44 Years | 536 (24.3%) | $250,001 |
| 45 to 64 Years | 1,188 (53.9%) | $178,255 |
| 65+ Years | 478 (21.7%) | $143,833 |
| Total | 2,202 (100.0%) | $184,569 |
Poverty in Irvington
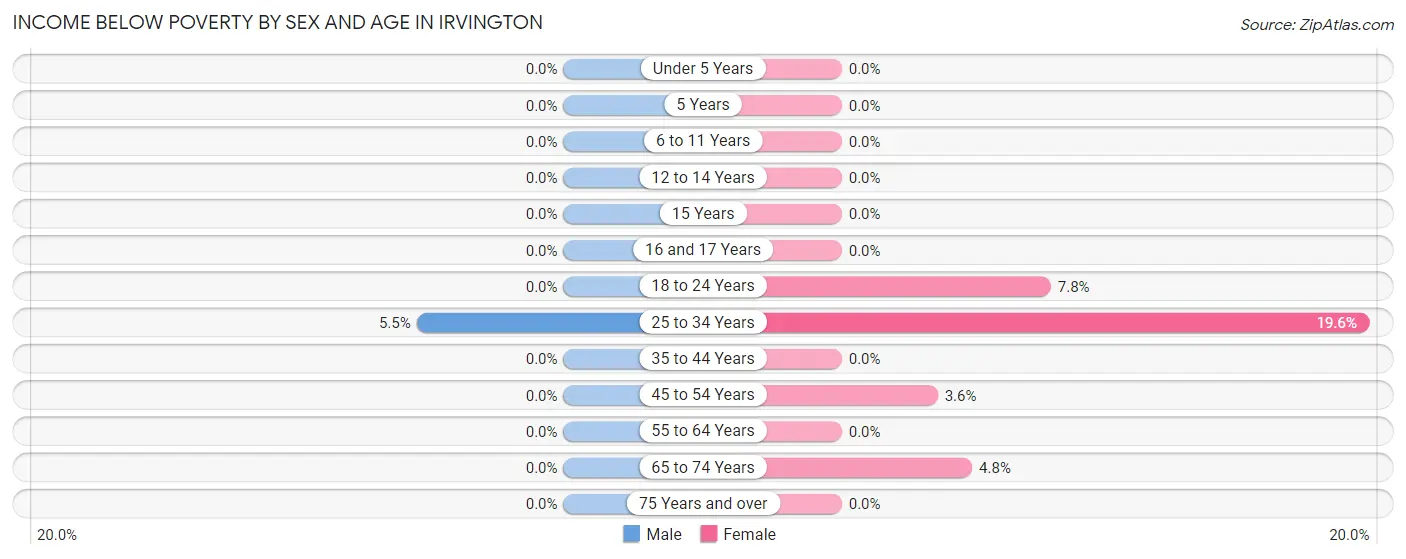
Income Below Poverty by Sex and Age in Irvington
With 0.4% poverty level for males and 3.1% for females among the residents of Irvington, 25 to 34 year old males and 25 to 34 year old females are the most vulnerable to poverty, with 14 males (5.4%) and 53 females (19.6%) in their respective age groups living below the poverty level.
| Age Bracket | Male | Female |
| Under 5 Years | 0 (0.0%) | 0 (0.0%) |
| 5 Years | 0 (0.0%) | 0 (0.0%) |
| 6 to 11 Years | 0 (0.0%) | 0 (0.0%) |
| 12 to 14 Years | 0 (0.0%) | 0 (0.0%) |
| 15 Years | 0 (0.0%) | 0 (0.0%) |
| 16 and 17 Years | 0 (0.0%) | 0 (0.0%) |
| 18 to 24 Years | 0 (0.0%) | 17 (7.8%) |
| 25 to 34 Years | 14 (5.4%) | 53 (19.6%) |
| 35 to 44 Years | 0 (0.0%) | 0 (0.0%) |
| 45 to 54 Years | 0 (0.0%) | 17 (3.6%) |
| 55 to 64 Years | 0 (0.0%) | 0 (0.0%) |
| 65 to 74 Years | 0 (0.0%) | 17 (4.8%) |
| 75 Years and over | 0 (0.0%) | 0 (0.0%) |
| Total | 14 (0.4%) | 104 (3.1%) |
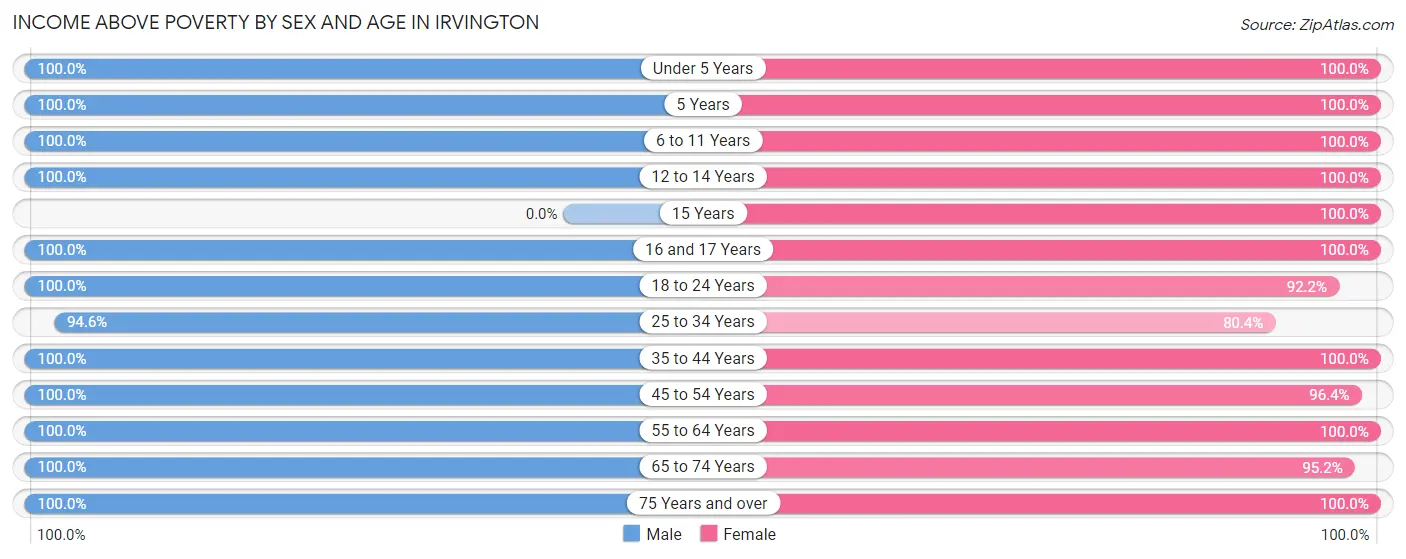
Income Above Poverty by Sex and Age in Irvington
According to the poverty statistics in Irvington, males aged under 5 years and females aged under 5 years are the age groups that are most secure financially, with 100.0% of males and 100.0% of females in these age groups living above the poverty line.
| Age Bracket | Male | Female |
| Under 5 Years | 394 (100.0%) | 134 (100.0%) |
| 5 Years | 18 (100.0%) | 19 (100.0%) |
| 6 to 11 Years | 459 (100.0%) | 473 (100.0%) |
| 12 to 14 Years | 104 (100.0%) | 145 (100.0%) |
| 15 Years | 0 (0.0%) | 28 (100.0%) |
| 16 and 17 Years | 70 (100.0%) | 72 (100.0%) |
| 18 to 24 Years | 155 (100.0%) | 202 (92.2%) |
| 25 to 34 Years | 243 (94.6%) | 218 (80.4%) |
| 35 to 44 Years | 306 (100.0%) | 507 (100.0%) |
| 45 to 54 Years | 544 (100.0%) | 461 (96.4%) |
| 55 to 64 Years | 556 (100.0%) | 512 (100.0%) |
| 65 to 74 Years | 285 (100.0%) | 334 (95.2%) |
| 75 Years and over | 102 (100.0%) | 113 (100.0%) |
| Total | 3,236 (99.6%) | 3,218 (96.9%) |
Income Below Poverty Among Married-Couple Families in Irvington
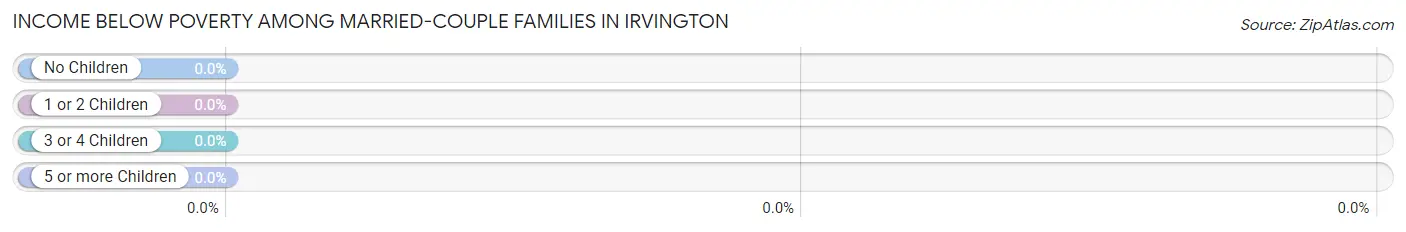
| Children | Above Poverty | Below Poverty |
| No Children | 777 (100.0%) | 0 (0.0%) |
| 1 or 2 Children | 616 (100.0%) | 0 (0.0%) |
| 3 or 4 Children | 269 (100.0%) | 0 (0.0%) |
| 5 or more Children | 0 (0.0%) | 0 (0.0%) |
| Total | 1,662 (100.0%) | 0 (0.0%) |
Income Below Poverty Among Single-Parent Households in Irvington
| Children | Single Father | Single Mother |
| No Children | 0 (0.0%) | 0 (0.0%) |
| 1 or 2 Children | 0 (0.0%) | 0 (0.0%) |
| 3 or 4 Children | 0 (0.0%) | 0 (0.0%) |
| 5 or more Children | 0 (0.0%) | 0 (0.0%) |
| Total | 0 (0.0%) | 0 (0.0%) |
Income Below Poverty Among Married-Couple vs Single-Parent Households in Irvington
| Children | Married-Couple Families | Single-Parent Households |
| No Children | 0 (0.0%) | 0 (0.0%) |
| 1 or 2 Children | 0 (0.0%) | 0 (0.0%) |
| 3 or 4 Children | 0 (0.0%) | 0 (0.0%) |
| 5 or more Children | 0 (0.0%) | 0 (0.0%) |
| Total | 0 (0.0%) | 0 (0.0%) |
Race in Irvington
The most populous races in Irvington are White / Caucasian (5,081 | 77.1%), Hispanic or Latino (691 | 10.5%), and Two or more Races (686 | 10.4%).
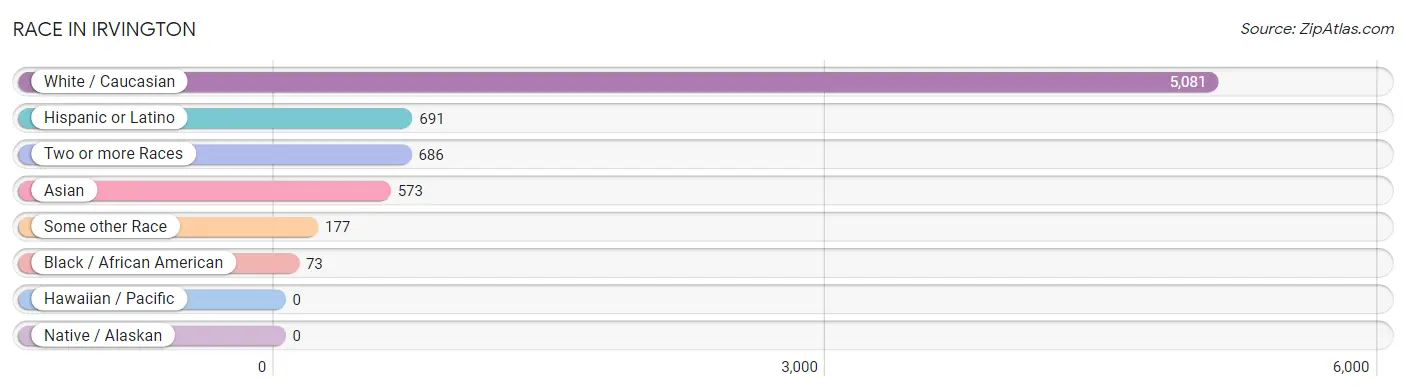
| Race | # Population | % Population |
| Asian | 573 | 8.7% |
| Black / African American | 73 | 1.1% |
| Hawaiian / Pacific | 0 | 0.0% |
| Hispanic or Latino | 691 | 10.5% |
| Native / Alaskan | 0 | 0.0% |
| White / Caucasian | 5,081 | 77.1% |
| Two or more Races | 686 | 10.4% |
| Some other Race | 177 | 2.7% |
| Total | 6,590 | 100.0% |
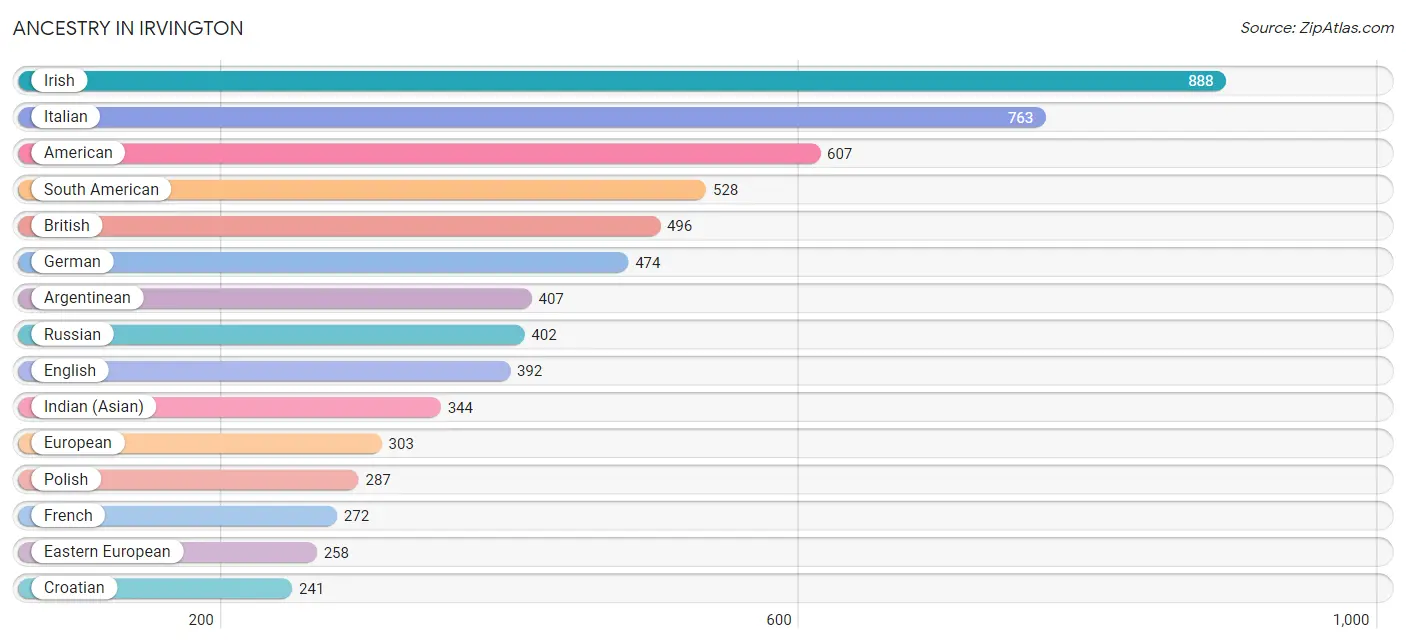
Ancestry in Irvington
The most populous ancestries reported in Irvington are Irish (888 | 13.5%), Italian (763 | 11.6%), American (607 | 9.2%), South American (528 | 8.0%), and British (496 | 7.5%), together accounting for 49.8% of all Irvington residents.
| Ancestry | # Population | % Population |
| Albanian | 78 | 1.2% |
| American | 607 | 9.2% |
| Arab | 32 | 0.5% |
| Argentinean | 407 | 6.2% |
| Australian | 30 | 0.5% |
| Austrian | 65 | 1.0% |
| Belgian | 16 | 0.2% |
| Bhutanese | 1 | 0.0% |
| British | 496 | 7.5% |
| Burmese | 85 | 1.3% |
| Central American | 40 | 0.6% |
| Colombian | 75 | 1.1% |
| Croatian | 241 | 3.7% |
| Cuban | 35 | 0.5% |
| Czech | 16 | 0.2% |
| Danish | 16 | 0.2% |
| Dominican | 24 | 0.4% |
| Dutch | 18 | 0.3% |
| Eastern European | 258 | 3.9% |
| English | 392 | 5.9% |
| European | 303 | 4.6% |
| Filipino | 219 | 3.3% |
| French | 272 | 4.1% |
| German | 474 | 7.2% |
| Greek | 113 | 1.7% |
| Hungarian | 90 | 1.4% |
| Indian (Asian) | 344 | 5.2% |
| Iranian | 15 | 0.2% |
| Irish | 888 | 13.5% |
| Italian | 763 | 11.6% |
| Korean | 3 | 0.1% |
| Lebanese | 17 | 0.3% |
| Lithuanian | 126 | 1.9% |
| Norwegian | 42 | 0.6% |
| Paraguayan | 46 | 0.7% |
| Polish | 287 | 4.4% |
| Portuguese | 117 | 1.8% |
| Puerto Rican | 57 | 0.9% |
| Romanian | 47 | 0.7% |
| Russian | 402 | 6.1% |
| Salvadoran | 40 | 0.6% |
| Scotch-Irish | 90 | 1.4% |
| Scottish | 128 | 1.9% |
| Serbian | 137 | 2.1% |
| Slovak | 75 | 1.1% |
| South American | 528 | 8.0% |
| Swedish | 30 | 0.5% |
| Thai | 203 | 3.1% |
| Welsh | 32 | 0.5% | View All 49 Rows |
Immigrants in Irvington
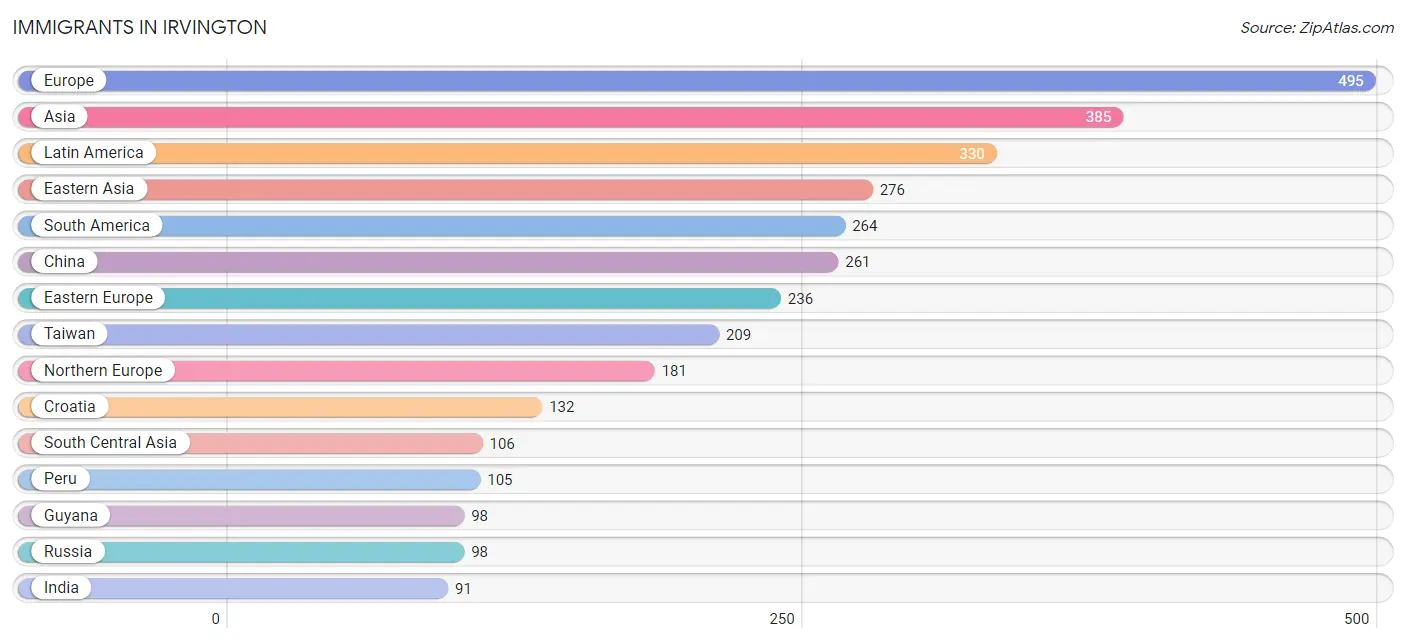
The most numerous immigrant groups reported in Irvington came from Europe (495 | 7.5%), Asia (385 | 5.8%), Latin America (330 | 5.0%), Eastern Asia (276 | 4.2%), and South America (264 | 4.0%), together accounting for 26.6% of all Irvington residents.
| Immigration Origin | # Population | % Population |
| Africa | 14 | 0.2% |
| Argentina | 44 | 0.7% |
| Asia | 385 | 5.8% |
| Australia | 30 | 0.5% |
| Austria | 41 | 0.6% |
| Belarus | 6 | 0.1% |
| Belgium | 16 | 0.2% |
| Canada | 58 | 0.9% |
| Caribbean | 26 | 0.4% |
| Central America | 40 | 0.6% |
| China | 261 | 4.0% |
| Colombia | 17 | 0.3% |
| Croatia | 132 | 2.0% |
| Cuba | 14 | 0.2% |
| Eastern Africa | 14 | 0.2% |
| Eastern Asia | 276 | 4.2% |
| Eastern Europe | 236 | 3.6% |
| El Salvador | 40 | 0.6% |
| England | 16 | 0.2% |
| Europe | 495 | 7.5% |
| France | 14 | 0.2% |
| Germany | 7 | 0.1% |
| Guyana | 98 | 1.5% |
| India | 91 | 1.4% |
| Iran | 15 | 0.2% |
| Japan | 1 | 0.0% |
| Korea | 14 | 0.2% |
| Latin America | 330 | 5.0% |
| Northern Europe | 181 | 2.8% |
| Oceania | 30 | 0.5% |
| Peru | 105 | 1.6% |
| Philippines | 3 | 0.1% |
| Russia | 98 | 1.5% |
| South America | 264 | 4.0% |
| South Central Asia | 106 | 1.6% |
| South Eastern Asia | 3 | 0.1% |
| Taiwan | 209 | 3.2% |
| Western Europe | 78 | 1.2% | View All 38 Rows |
Sex and Age in Irvington
Sex and Age in Irvington
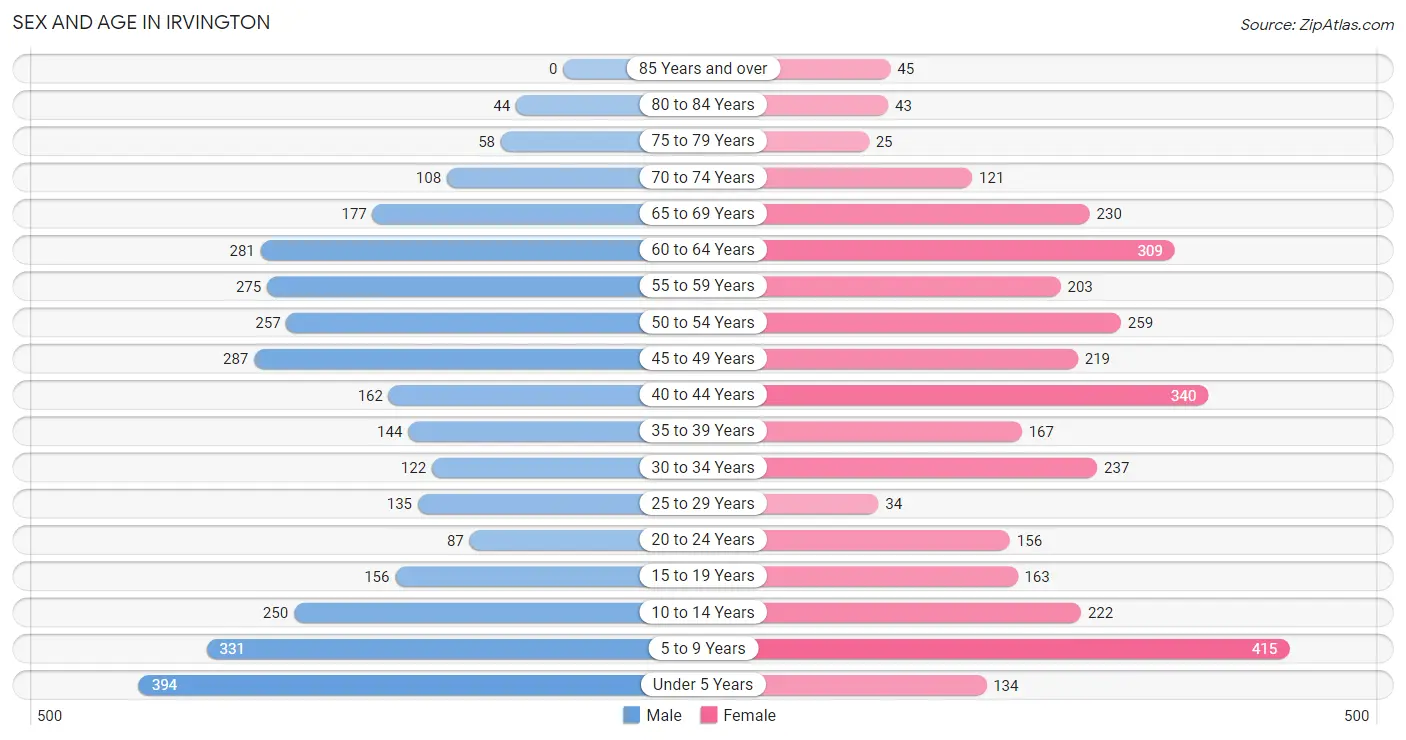
The most populous age groups in Irvington are Under 5 Years (394 | 12.1%) for men and 5 to 9 Years (415 | 12.5%) for women.
| Age Bracket | Male | Female |
| Under 5 Years | 394 (12.1%) | 134 (4.0%) |
| 5 to 9 Years | 331 (10.1%) | 415 (12.5%) |
| 10 to 14 Years | 250 (7.6%) | 222 (6.7%) |
| 15 to 19 Years | 156 (4.8%) | 163 (4.9%) |
| 20 to 24 Years | 87 (2.7%) | 156 (4.7%) |
| 25 to 29 Years | 135 (4.1%) | 34 (1.0%) |
| 30 to 34 Years | 122 (3.7%) | 237 (7.1%) |
| 35 to 39 Years | 144 (4.4%) | 167 (5.0%) |
| 40 to 44 Years | 162 (5.0%) | 340 (10.2%) |
| 45 to 49 Years | 287 (8.8%) | 219 (6.6%) |
| 50 to 54 Years | 257 (7.9%) | 259 (7.8%) |
| 55 to 59 Years | 275 (8.4%) | 203 (6.1%) |
| 60 to 64 Years | 281 (8.6%) | 309 (9.3%) |
| 65 to 69 Years | 177 (5.4%) | 230 (6.9%) |
| 70 to 74 Years | 108 (3.3%) | 121 (3.6%) |
| 75 to 79 Years | 58 (1.8%) | 25 (0.7%) |
| 80 to 84 Years | 44 (1.3%) | 43 (1.3%) |
| 85 Years and over | 0 (0.0%) | 45 (1.3%) |
| Total | 3,268 (100.0%) | 3,322 (100.0%) |
Families and Households in Irvington
Median Family Size in Irvington
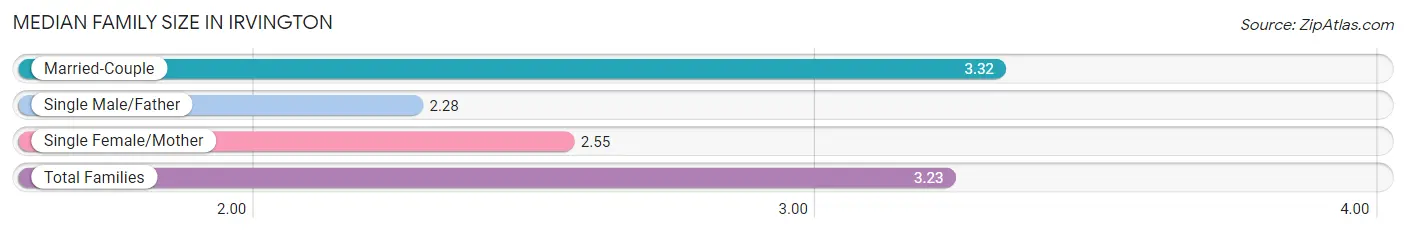
The median family size in Irvington is 3.23 persons per family, with married-couple families (1,662 | 88.9%) accounting for the largest median family size of 3.32 persons per family. On the other hand, single male/father families (43 | 2.3%) represent the smallest median family size with 2.28 persons per family.
| Family Type | # Families | Family Size |
| Married-Couple | 1,662 (88.9%) | 3.32 |
| Single Male/Father | 43 (2.3%) | 2.28 |
| Single Female/Mother | 165 (8.8%) | 2.55 |
| Total Families | 1,870 (100.0%) | 3.23 |
Median Household Size in Irvington
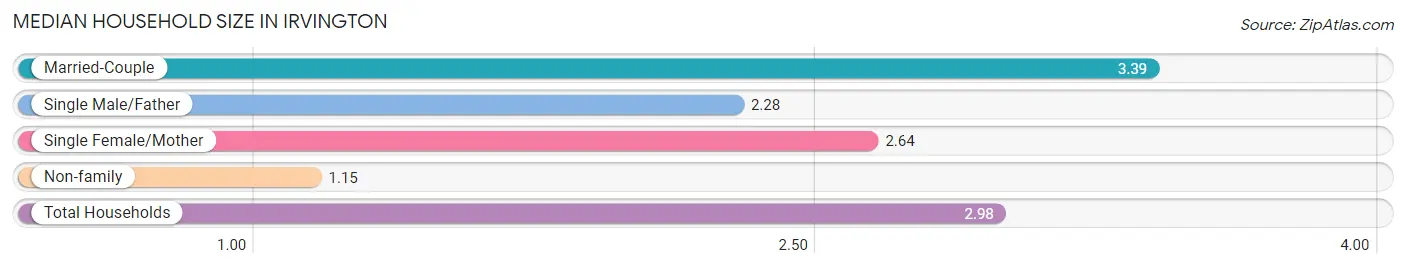
The median household size in Irvington is 2.98 persons per household, with married-couple households (1,662 | 75.5%) accounting for the largest median household size of 3.39 persons per household. non-family households (332 | 15.1%) represent the smallest median household size with 1.15 persons per household.
| Household Type | # Households | Household Size |
| Married-Couple | 1,662 (75.5%) | 3.39 |
| Single Male/Father | 43 (1.9%) | 2.28 |
| Single Female/Mother | 165 (7.5%) | 2.64 |
| Non-family | 332 (15.1%) | 1.15 |
| Total Households | 2,202 (100.0%) | 2.98 |
Household Size by Marriage Status in Irvington
Out of a total of 2,202 households in Irvington, 1,870 (84.9%) are family households, while 332 (15.1%) are nonfamily households. The most numerous type of family households are 2-person households, comprising 591, and the most common type of nonfamily households are 1-person households, comprising 279.
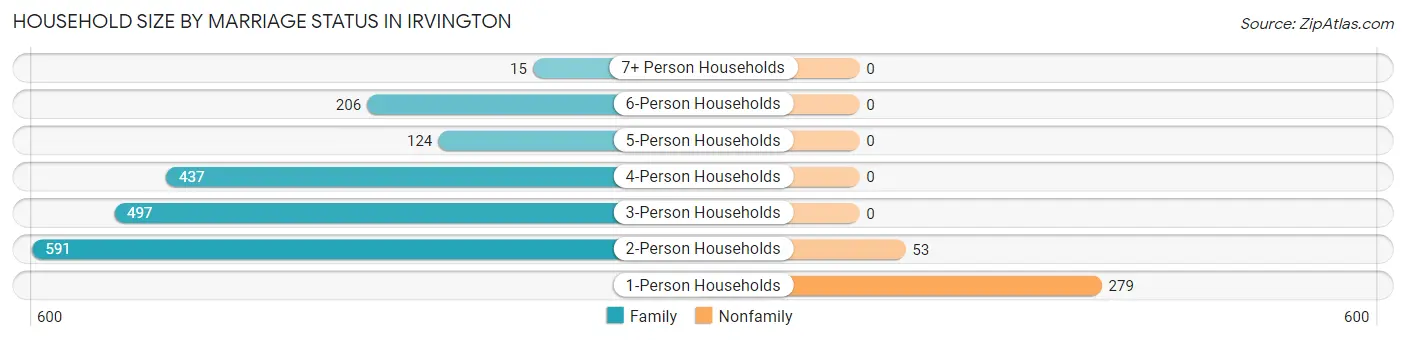
| Household Size | Family Households | Nonfamily Households |
| 1-Person Households | - | 279 (12.7%) |
| 2-Person Households | 591 (26.8%) | 53 (2.4%) |
| 3-Person Households | 497 (22.6%) | 0 (0.0%) |
| 4-Person Households | 437 (19.9%) | 0 (0.0%) |
| 5-Person Households | 124 (5.6%) | 0 (0.0%) |
| 6-Person Households | 206 (9.4%) | 0 (0.0%) |
| 7+ Person Households | 15 (0.7%) | 0 (0.0%) |
| Total | 1,870 (84.9%) | 332 (15.1%) |
Female Fertility in Irvington
Fertility by Age in Irvington
Average fertility rate in Irvington is 33.0 births per 1,000 women. Women in the age bracket of 20 to 34 years have the highest fertility rate with 40.0 births per 1,000 women. Women in the age bracket of 35 to 50 years acount for 63.8% of all women with births.
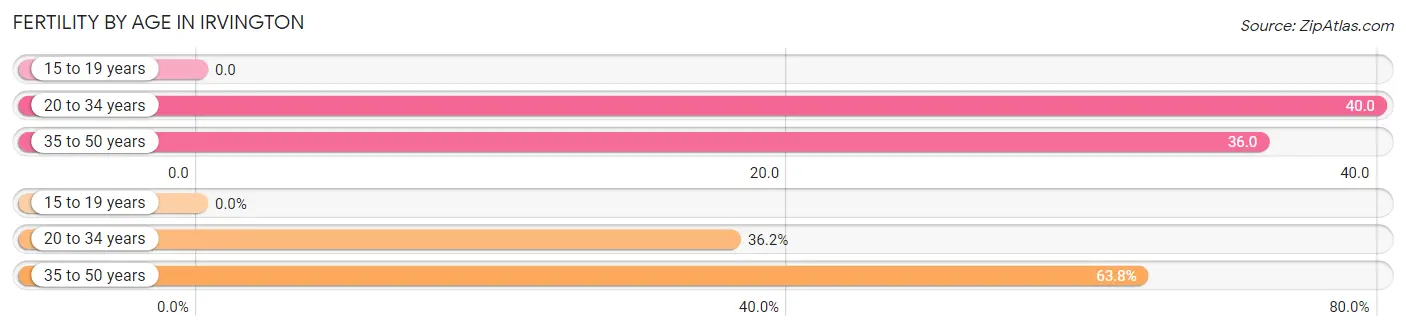
| Age Bracket | Women with Births | Births / 1,000 Women |
| 15 to 19 years | 0 (0.0%) | 0.0 |
| 20 to 34 years | 17 (36.2%) | 40.0 |
| 35 to 50 years | 30 (63.8%) | 36.0 |
| Total | 47 (100.0%) | 33.0 |
Fertility by Age by Marriage Status in Irvington
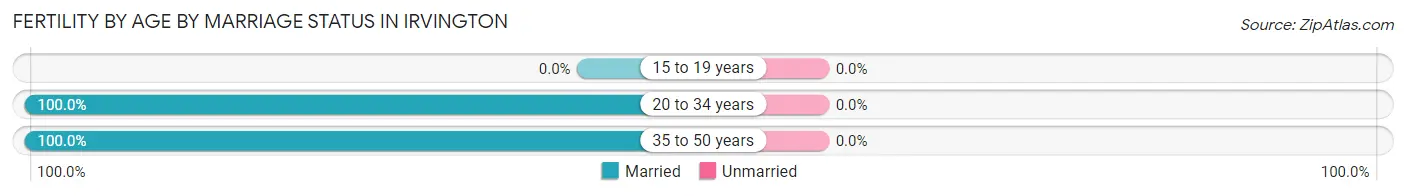
| Age Bracket | Married | Unmarried |
| 15 to 19 years | 0 (0.0%) | 0 (0.0%) |
| 20 to 34 years | 17 (100.0%) | 0 (0.0%) |
| 35 to 50 years | 30 (100.0%) | 0 (0.0%) |
| Total | 47 (100.0%) | 0 (0.0%) |
Fertility by Education in Irvington
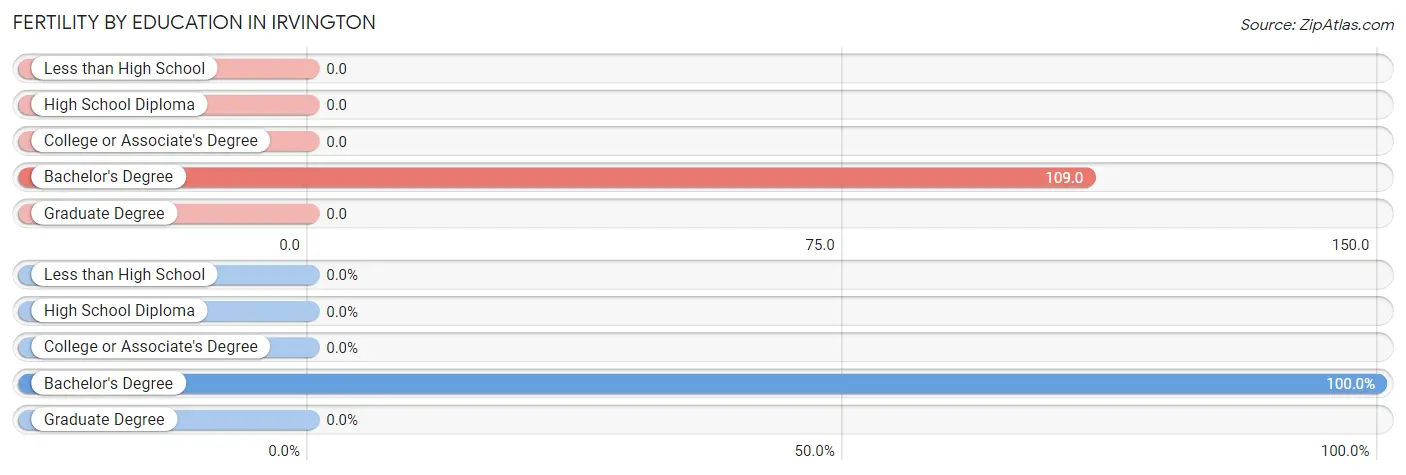
| Educational Attainment | Women with Births | Births / 1,000 Women |
| Less than High School | 0 (0.0%) | 0.0 |
| High School Diploma | 0 (0.0%) | 0.0 |
| College or Associate's Degree | 0 (0.0%) | 0.0 |
| Bachelor's Degree | 47 (100.0%) | 109.0 |
| Graduate Degree | 0 (0.0%) | 0.0 |
| Total | 47 (100.0%) | 33.0 |
Fertility by Education by Marriage Status in Irvington
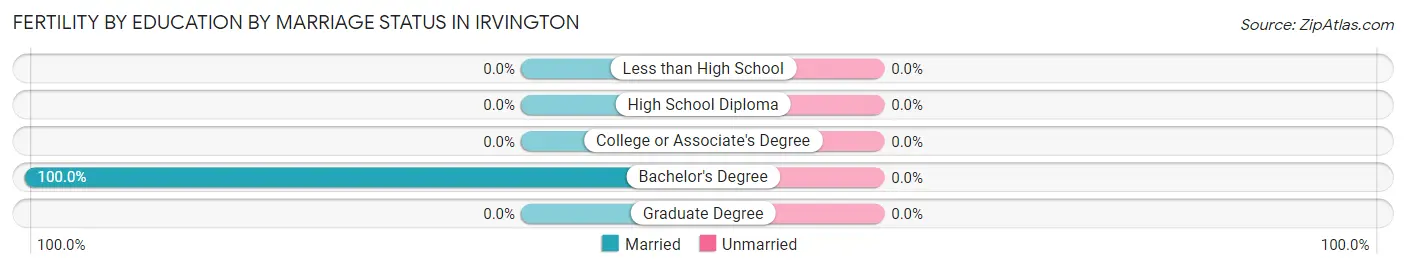
| Educational Attainment | Married | Unmarried |
| Less than High School | 0 (0.0%) | 0 (0.0%) |
| High School Diploma | 0 (0.0%) | 0 (0.0%) |
| College or Associate's Degree | 0 (0.0%) | 0 (0.0%) |
| Bachelor's Degree | 47 (100.0%) | 0 (0.0%) |
| Graduate Degree | 0 (0.0%) | 0 (0.0%) |
| Total | 47 (100.0%) | 0 (0.0%) |
Employment Characteristics in Irvington
Employment by Class of Employer in Irvington
Among the 3,363 employed individuals in Irvington, private company employees (1,611 | 47.9%), not-for-profit organizations (643 | 19.1%), and self-employed (not incorporated) (482 | 14.3%) make up the most common classes of employment.
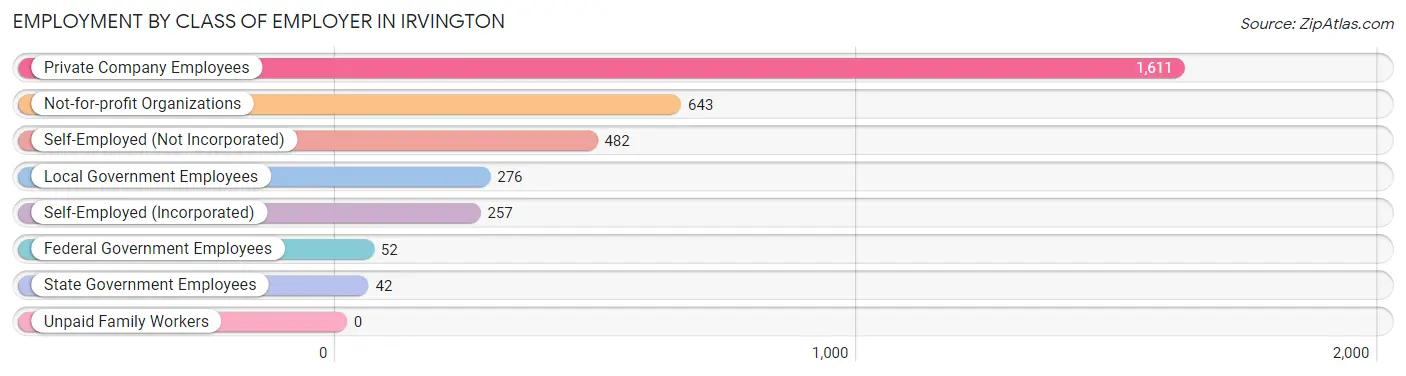
| Employer Class | # Employees | % Employees |
| Private Company Employees | 1,611 | 47.9% |
| Self-Employed (Incorporated) | 257 | 7.6% |
| Self-Employed (Not Incorporated) | 482 | 14.3% |
| Not-for-profit Organizations | 643 | 19.1% |
| Local Government Employees | 276 | 8.2% |
| State Government Employees | 42 | 1.3% |
| Federal Government Employees | 52 | 1.5% |
| Unpaid Family Workers | 0 | 0.0% |
| Total | 3,363 | 100.0% |
Employment Status by Age in Irvington
According to the labor force statistics for Irvington, out of the total population over 16 years of age (4,816), 72.9% or 3,511 individuals are in the labor force, with 3.1% or 109 of them unemployed. The age group with the highest labor force participation rate is 30 to 34 years, with 93.9% or 337 individuals in the labor force. Within the labor force, the 25 to 29 years age range has the highest percentage of unemployed individuals, with 13.7% or 20 of them being unemployed.
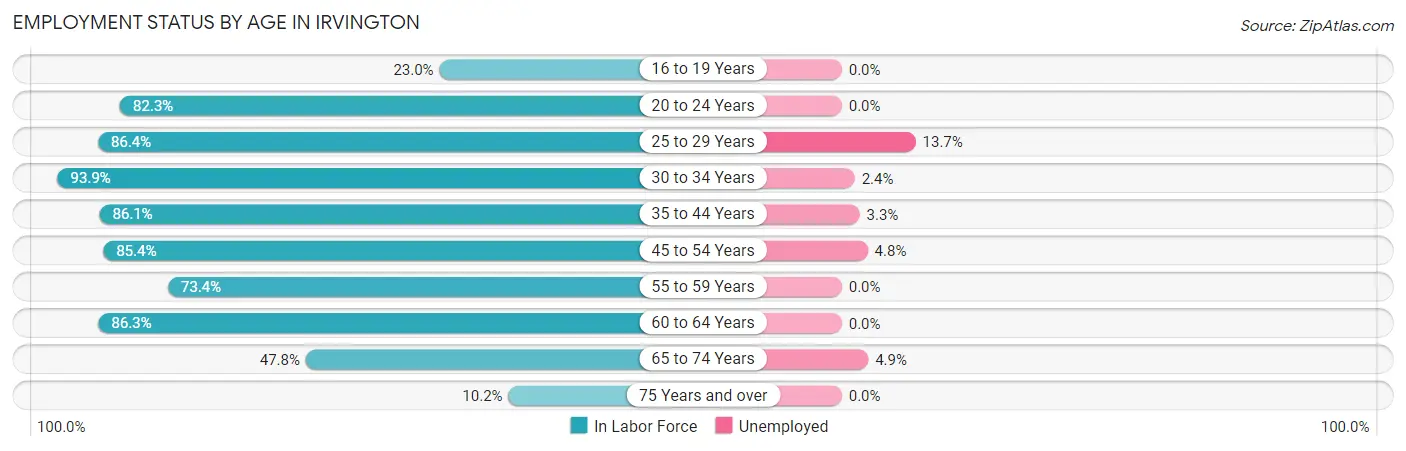
| Age Bracket | In Labor Force | Unemployed |
| 16 to 19 Years | 67 (23.0%) | 0 (0.0%) |
| 20 to 24 Years | 200 (82.3%) | 0 (0.0%) |
| 25 to 29 Years | 146 (86.4%) | 20 (13.7%) |
| 30 to 34 Years | 337 (93.9%) | 8 (2.4%) |
| 35 to 44 Years | 700 (86.1%) | 23 (3.3%) |
| 45 to 54 Years | 873 (85.4%) | 42 (4.8%) |
| 55 to 59 Years | 351 (73.4%) | 0 (0.0%) |
| 60 to 64 Years | 509 (86.3%) | 0 (0.0%) |
| 65 to 74 Years | 304 (47.8%) | 15 (4.9%) |
| 75 Years and over | 22 (10.2%) | 0 (0.0%) |
| Total | 3,511 (72.9%) | 109 (3.1%) |
Employment Status by Educational Attainment in Irvington
According to labor force statistics for Irvington, 85.0% of individuals (2,916) out of the total population between 25 and 64 years of age (3,431) are in the labor force, with 3.2% or 93 of them being unemployed. The group with the highest labor force participation rate are those with the educational attainment of less than high school, with 100.0% or 23 individuals in the labor force. Within the labor force, individuals with college / associate degree education have the highest percentage of unemployment, with 10.6% or 37 of them being unemployed.
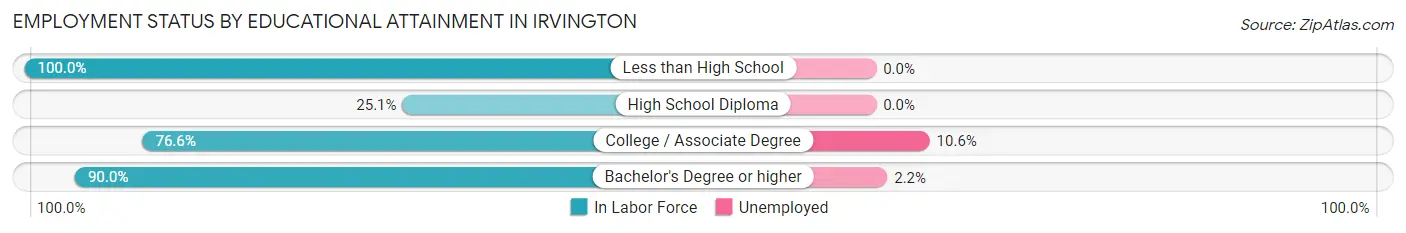
| Educational Attainment | In Labor Force | Unemployed |
| Less than High School | 23 (100.0%) | 0 (0.0%) |
| High School Diploma | 44 (25.1%) | 0 (0.0%) |
| College / Associate Degree | 350 (76.6%) | 48 (10.6%) |
| Bachelor's Degree or higher | 2,498 (90.0%) | 61 (2.2%) |
| Total | 2,916 (85.0%) | 110 (3.2%) |
Employment Occupations by Sex in Irvington
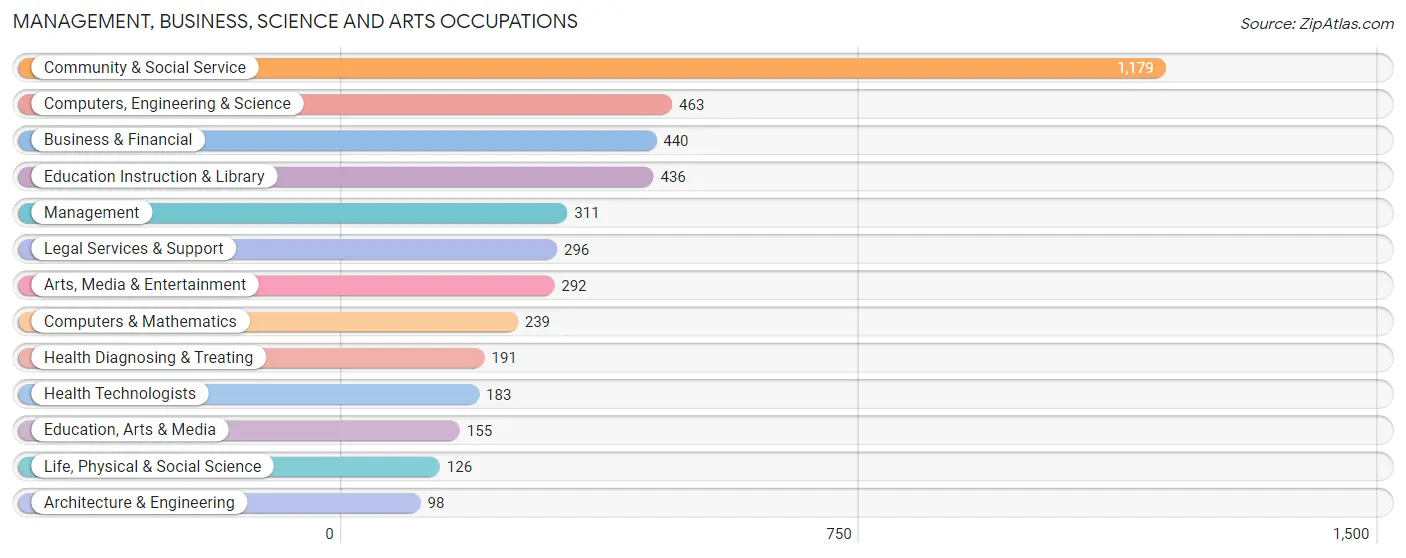
Management, Business, Science and Arts Occupations
The most common Management, Business, Science and Arts occupations in Irvington are Community & Social Service (1,179 | 34.7%), Computers, Engineering & Science (463 | 13.6%), Business & Financial (440 | 12.9%), Education Instruction & Library (436 | 12.8%), and Management (311 | 9.1%).
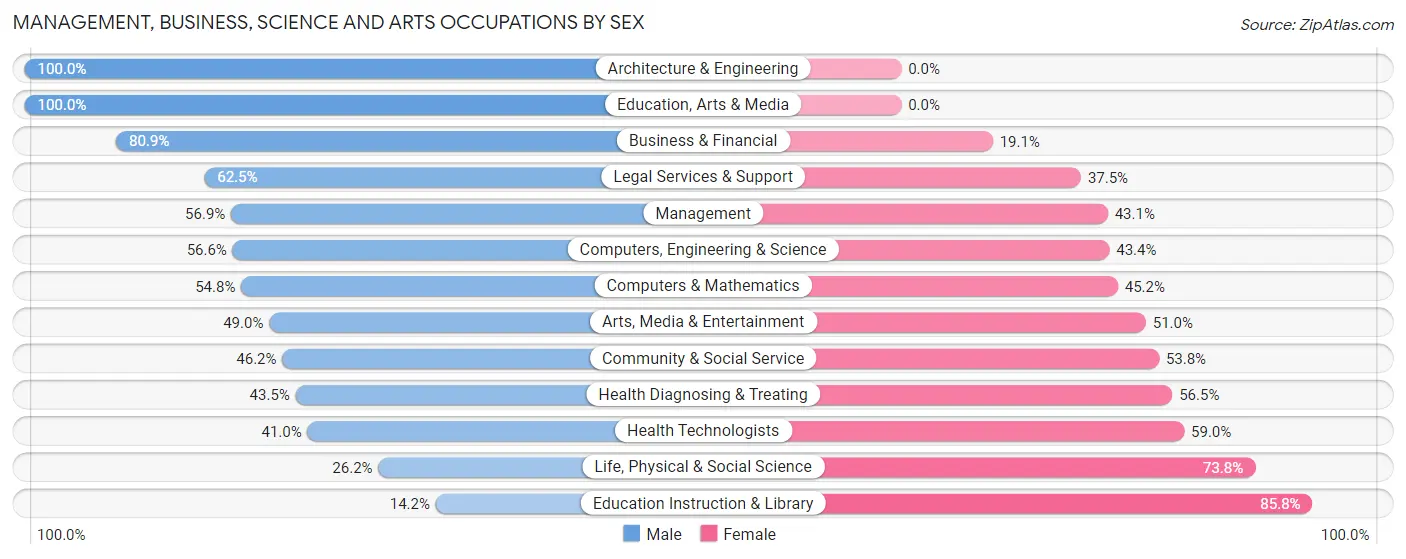
Management, Business, Science and Arts Occupations by Sex
Within the Management, Business, Science and Arts occupations in Irvington, the most male-oriented occupations are Architecture & Engineering (100.0%), Education, Arts & Media (100.0%), and Business & Financial (80.9%), while the most female-oriented occupations are Education Instruction & Library (85.8%), Life, Physical & Social Science (73.8%), and Health Technologists (59.0%).
| Occupation | Male | Female |
| Management | 177 (56.9%) | 134 (43.1%) |
| Business & Financial | 356 (80.9%) | 84 (19.1%) |
| Computers, Engineering & Science | 262 (56.6%) | 201 (43.4%) |
| Computers & Mathematics | 131 (54.8%) | 108 (45.2%) |
| Architecture & Engineering | 98 (100.0%) | 0 (0.0%) |
| Life, Physical & Social Science | 33 (26.2%) | 93 (73.8%) |
| Community & Social Service | 545 (46.2%) | 634 (53.8%) |
| Education, Arts & Media | 155 (100.0%) | 0 (0.0%) |
| Legal Services & Support | 185 (62.5%) | 111 (37.5%) |
| Education Instruction & Library | 62 (14.2%) | 374 (85.8%) |
| Arts, Media & Entertainment | 143 (49.0%) | 149 (51.0%) |
| Health Diagnosing & Treating | 83 (43.5%) | 108 (56.5%) |
| Health Technologists | 75 (41.0%) | 108 (59.0%) |
| Total (Category) | 1,423 (55.1%) | 1,161 (44.9%) |
| Total (Overall) | 1,786 (52.5%) | 1,615 (47.5%) |
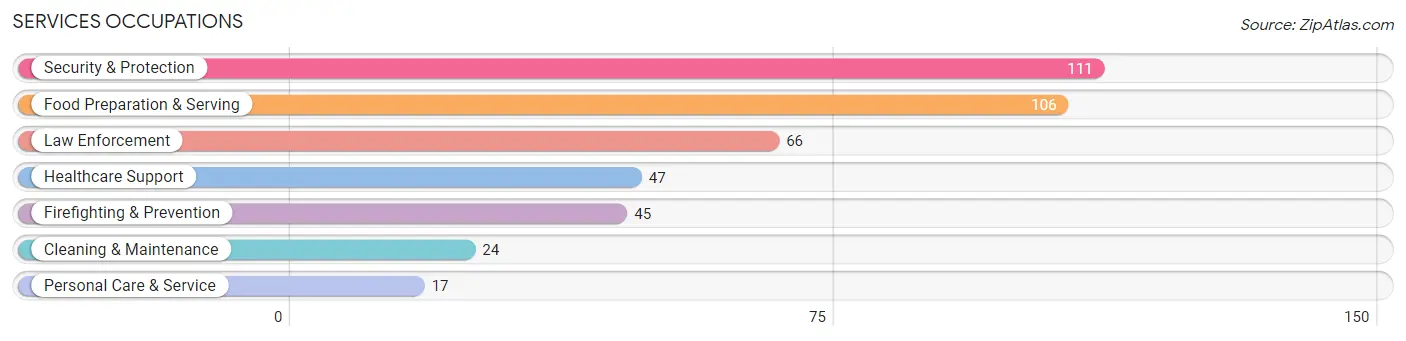
Services Occupations
The most common Services occupations in Irvington are Security & Protection (111 | 3.3%), Food Preparation & Serving (106 | 3.1%), Law Enforcement (66 | 1.9%), Healthcare Support (47 | 1.4%), and Firefighting & Prevention (45 | 1.3%).
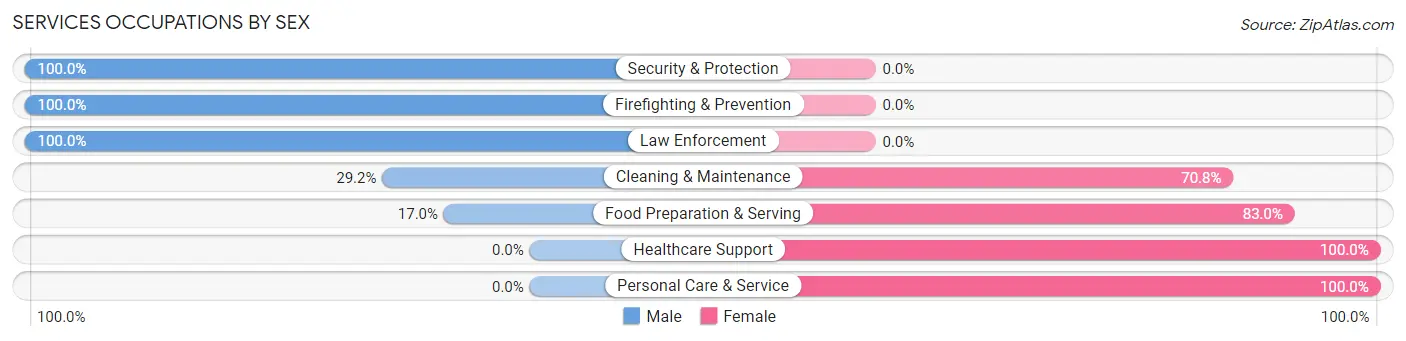
Services Occupations by Sex
Within the Services occupations in Irvington, the most male-oriented occupations are Security & Protection (100.0%), Firefighting & Prevention (100.0%), and Law Enforcement (100.0%), while the most female-oriented occupations are Healthcare Support (100.0%), Personal Care & Service (100.0%), and Food Preparation & Serving (83.0%).
| Occupation | Male | Female |
| Healthcare Support | 0 (0.0%) | 47 (100.0%) |
| Security & Protection | 111 (100.0%) | 0 (0.0%) |
| Firefighting & Prevention | 45 (100.0%) | 0 (0.0%) |
| Law Enforcement | 66 (100.0%) | 0 (0.0%) |
| Food Preparation & Serving | 18 (17.0%) | 88 (83.0%) |
| Cleaning & Maintenance | 7 (29.2%) | 17 (70.8%) |
| Personal Care & Service | 0 (0.0%) | 17 (100.0%) |
| Total (Category) | 136 (44.6%) | 169 (55.4%) |
| Total (Overall) | 1,786 (52.5%) | 1,615 (47.5%) |
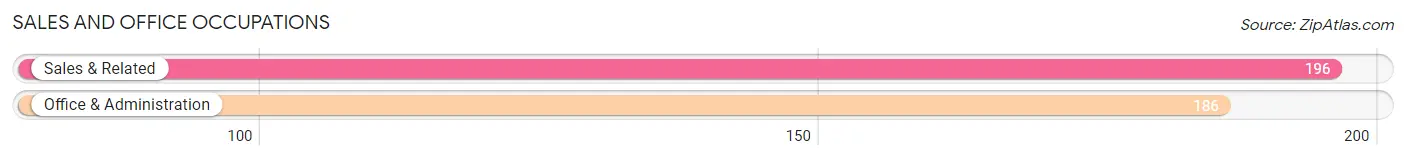
Sales and Office Occupations
The most common Sales and Office occupations in Irvington are Sales & Related (196 | 5.8%), and Office & Administration (186 | 5.5%).
Sales and Office Occupations by Sex
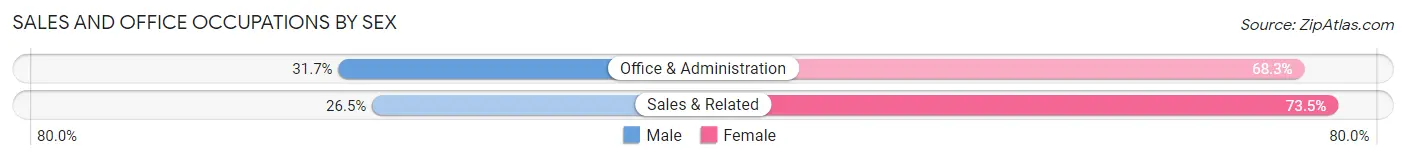
| Occupation | Male | Female |
| Sales & Related | 52 (26.5%) | 144 (73.5%) |
| Office & Administration | 59 (31.7%) | 127 (68.3%) |
| Total (Category) | 111 (29.1%) | 271 (70.9%) |
| Total (Overall) | 1,786 (52.5%) | 1,615 (47.5%) |
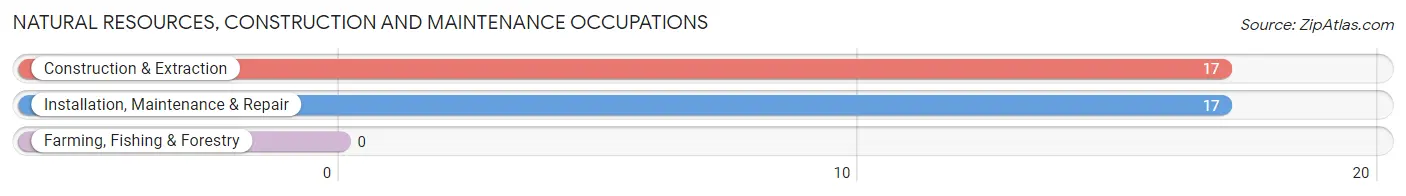
Natural Resources, Construction and Maintenance Occupations
The most common Natural Resources, Construction and Maintenance occupations in Irvington are Construction & Extraction (17 | 0.5%), and Installation, Maintenance & Repair (17 | 0.5%).
Natural Resources, Construction and Maintenance Occupations by Sex
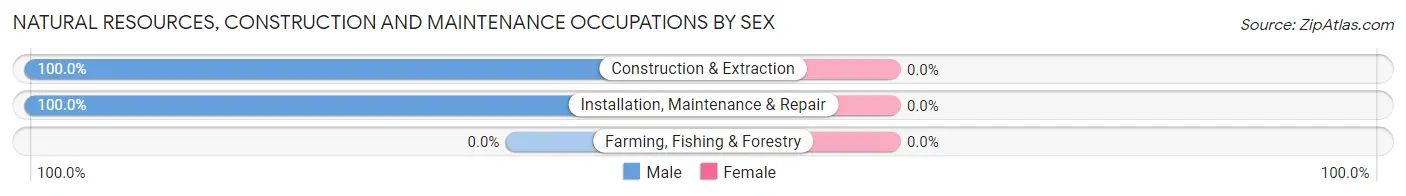
| Occupation | Male | Female |
| Farming, Fishing & Forestry | 0 (0.0%) | 0 (0.0%) |
| Construction & Extraction | 17 (100.0%) | 0 (0.0%) |
| Installation, Maintenance & Repair | 17 (100.0%) | 0 (0.0%) |
| Total (Category) | 34 (100.0%) | 0 (0.0%) |
| Total (Overall) | 1,786 (52.5%) | 1,615 (47.5%) |
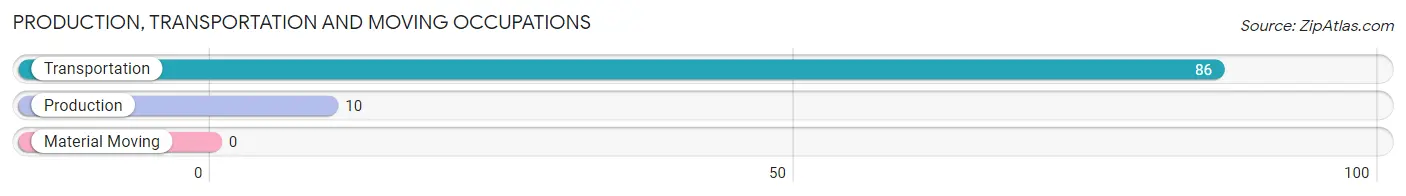
Production, Transportation and Moving Occupations
The most common Production, Transportation and Moving occupations in Irvington are Transportation (86 | 2.5%), and Production (10 | 0.3%).
Production, Transportation and Moving Occupations by Sex
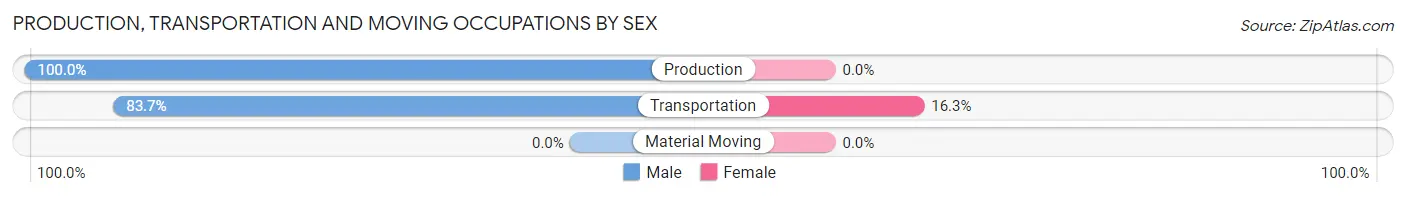
| Occupation | Male | Female |
| Production | 10 (100.0%) | 0 (0.0%) |
| Transportation | 72 (83.7%) | 14 (16.3%) |
| Material Moving | 0 (0.0%) | 0 (0.0%) |
| Total (Category) | 82 (85.4%) | 14 (14.6%) |
| Total (Overall) | 1,786 (52.5%) | 1,615 (47.5%) |
Employment Industries by Sex in Irvington
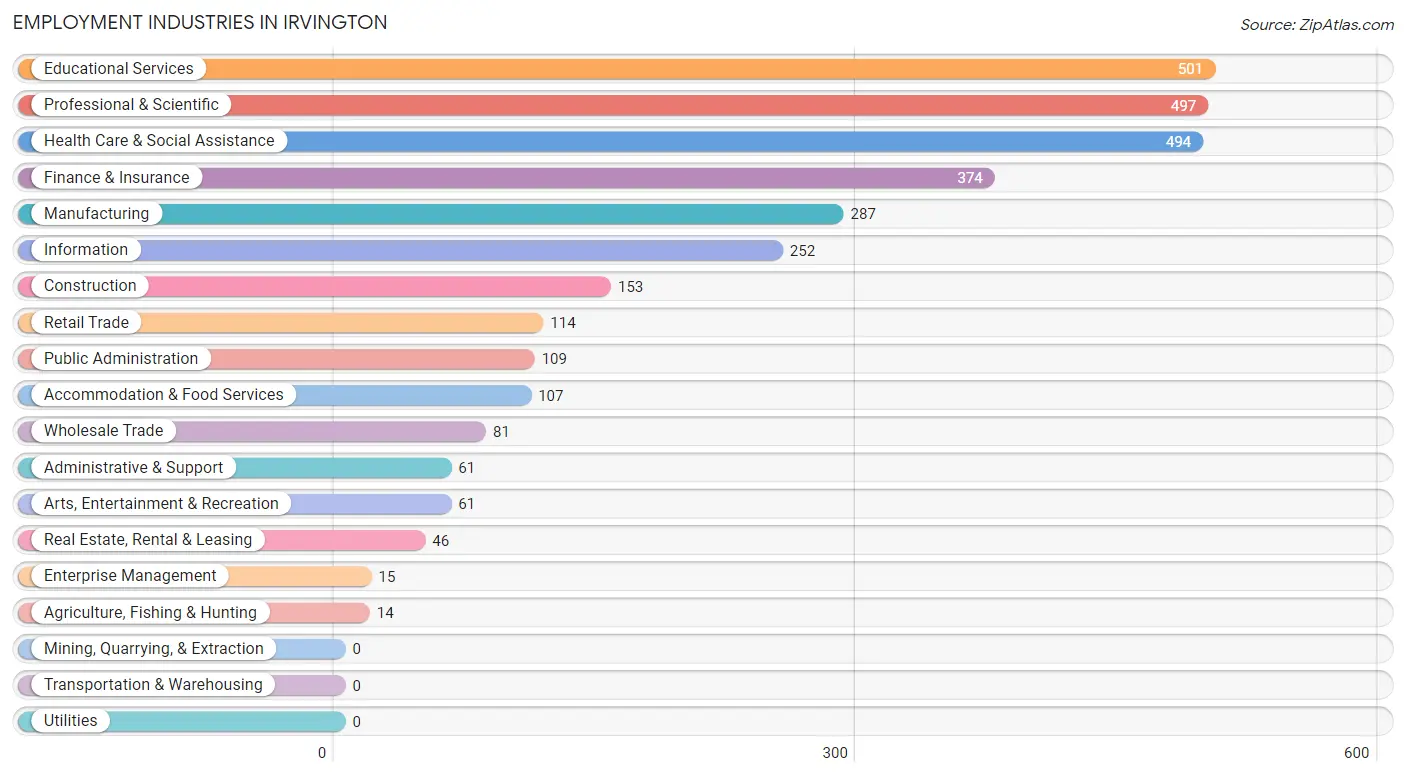
Employment Industries in Irvington
The major employment industries in Irvington include Educational Services (501 | 14.7%), Professional & Scientific (497 | 14.6%), Health Care & Social Assistance (494 | 14.5%), Finance & Insurance (374 | 11.0%), and Manufacturing (287 | 8.4%).
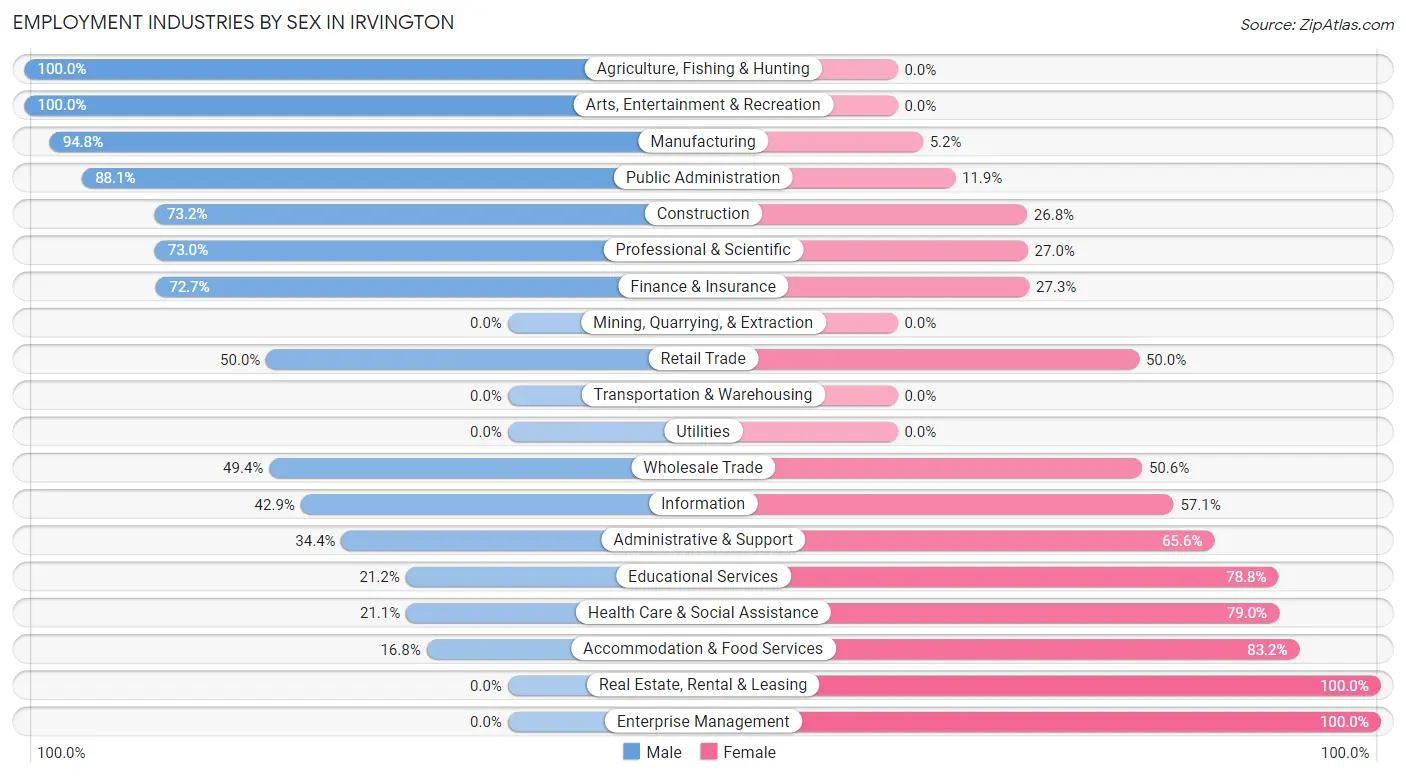
Employment Industries by Sex in Irvington
The Irvington industries that see more men than women are Agriculture, Fishing & Hunting (100.0%), Arts, Entertainment & Recreation (100.0%), and Manufacturing (94.8%), whereas the industries that tend to have a higher number of women are Real Estate, Rental & Leasing (100.0%), Enterprise Management (100.0%), and Accommodation & Food Services (83.2%).
| Industry | Male | Female |
| Agriculture, Fishing & Hunting | 14 (100.0%) | 0 (0.0%) |
| Mining, Quarrying, & Extraction | 0 (0.0%) | 0 (0.0%) |
| Construction | 112 (73.2%) | 41 (26.8%) |
| Manufacturing | 272 (94.8%) | 15 (5.2%) |
| Wholesale Trade | 40 (49.4%) | 41 (50.6%) |
| Retail Trade | 57 (50.0%) | 57 (50.0%) |
| Transportation & Warehousing | 0 (0.0%) | 0 (0.0%) |
| Utilities | 0 (0.0%) | 0 (0.0%) |
| Information | 108 (42.9%) | 144 (57.1%) |
| Finance & Insurance | 272 (72.7%) | 102 (27.3%) |
| Real Estate, Rental & Leasing | 0 (0.0%) | 46 (100.0%) |
| Professional & Scientific | 363 (73.0%) | 134 (27.0%) |
| Enterprise Management | 0 (0.0%) | 15 (100.0%) |
| Administrative & Support | 21 (34.4%) | 40 (65.6%) |
| Educational Services | 106 (21.2%) | 395 (78.8%) |
| Health Care & Social Assistance | 104 (21.0%) | 390 (78.9%) |
| Arts, Entertainment & Recreation | 61 (100.0%) | 0 (0.0%) |
| Accommodation & Food Services | 18 (16.8%) | 89 (83.2%) |
| Public Administration | 96 (88.1%) | 13 (11.9%) |
| Total | 1,786 (52.5%) | 1,615 (47.5%) |
Education in Irvington
School Enrollment in Irvington
The most common levels of schooling among the 2,025 students in Irvington are elementary school (679 | 33.5%), middle school (388 | 19.2%), and nursery / preschool (372 | 18.4%).
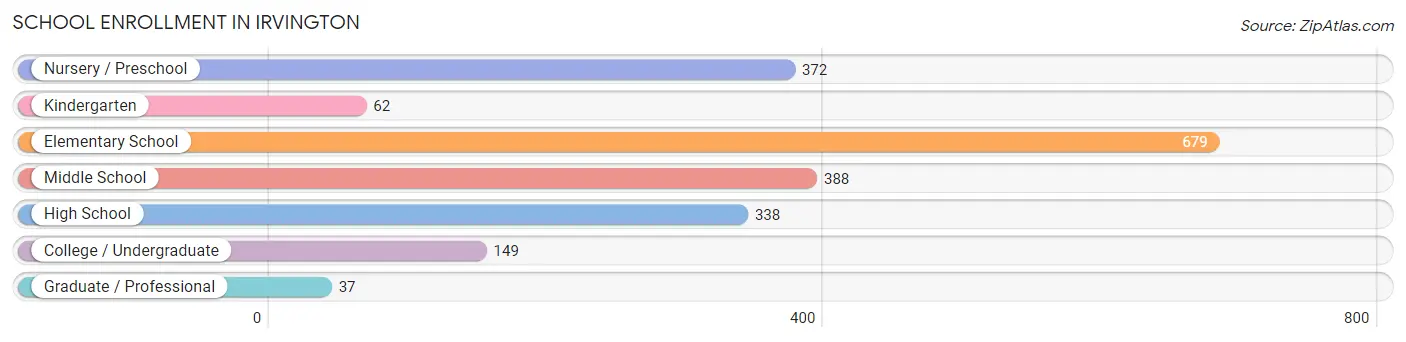
| School Level | # Students | % Students |
| Nursery / Preschool | 372 | 18.4% |
| Kindergarten | 62 | 3.1% |
| Elementary School | 679 | 33.5% |
| Middle School | 388 | 19.2% |
| High School | 338 | 16.7% |
| College / Undergraduate | 149 | 7.4% |
| Graduate / Professional | 37 | 1.8% |
| Total | 2,025 | 100.0% |
School Enrollment by Age by Funding Source in Irvington
Out of a total of 2,025 students who are enrolled in schools in Irvington, 565 (27.9%) attend a private institution, while the remaining 1,460 (72.1%) are enrolled in public schools. The age group of 35 years and over has the highest likelihood of being enrolled in private schools, with 13 (100.0% in the age bracket) enrolled. Conversely, the age group of 15 to 17 year olds has the lowest likelihood of being enrolled in a private school, with 172 (94.5% in the age bracket) attending a public institution.
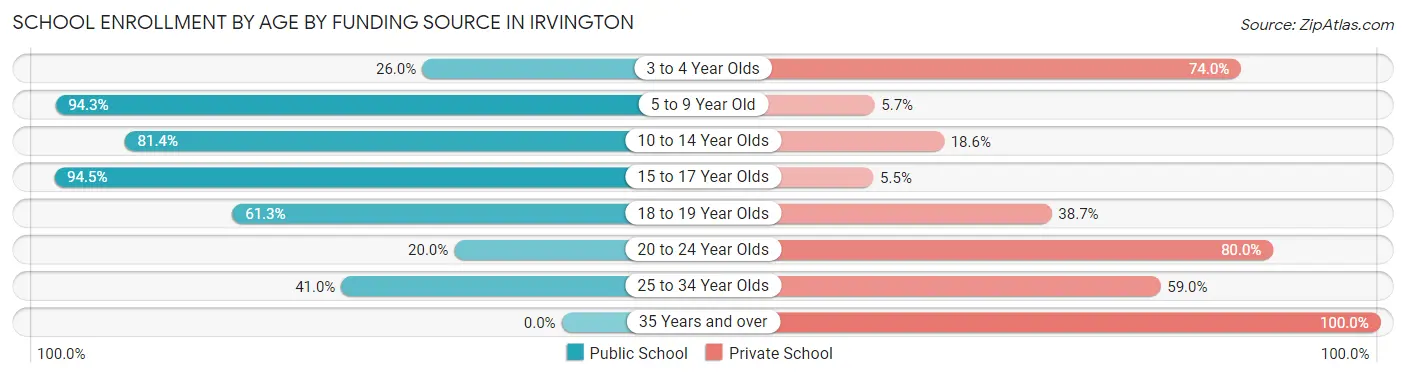
| Age Bracket | Public School | Private School |
| 3 to 4 Year Olds | 94 (26.0%) | 268 (74.0%) |
| 5 to 9 Year Old | 693 (94.3%) | 42 (5.7%) |
| 10 to 14 Year Olds | 384 (81.4%) | 88 (18.6%) |
| 15 to 17 Year Olds | 172 (94.5%) | 10 (5.5%) |
| 18 to 19 Year Olds | 84 (61.3%) | 53 (38.7%) |
| 20 to 24 Year Olds | 17 (20.0%) | 68 (80.0%) |
| 25 to 34 Year Olds | 16 (41.0%) | 23 (59.0%) |
| 35 Years and over | 0 (0.0%) | 13 (100.0%) |
| Total | 1,460 (72.1%) | 565 (27.9%) |
Educational Attainment by Field of Study in Irvington
Social sciences (497 | 13.3%), business (475 | 12.7%), visual & performing arts (381 | 10.2%), liberal arts & history (365 | 9.8%), and literature & languages (332 | 8.9%) are the most common fields of study among 3,733 individuals in Irvington who have obtained a bachelor's degree or higher.
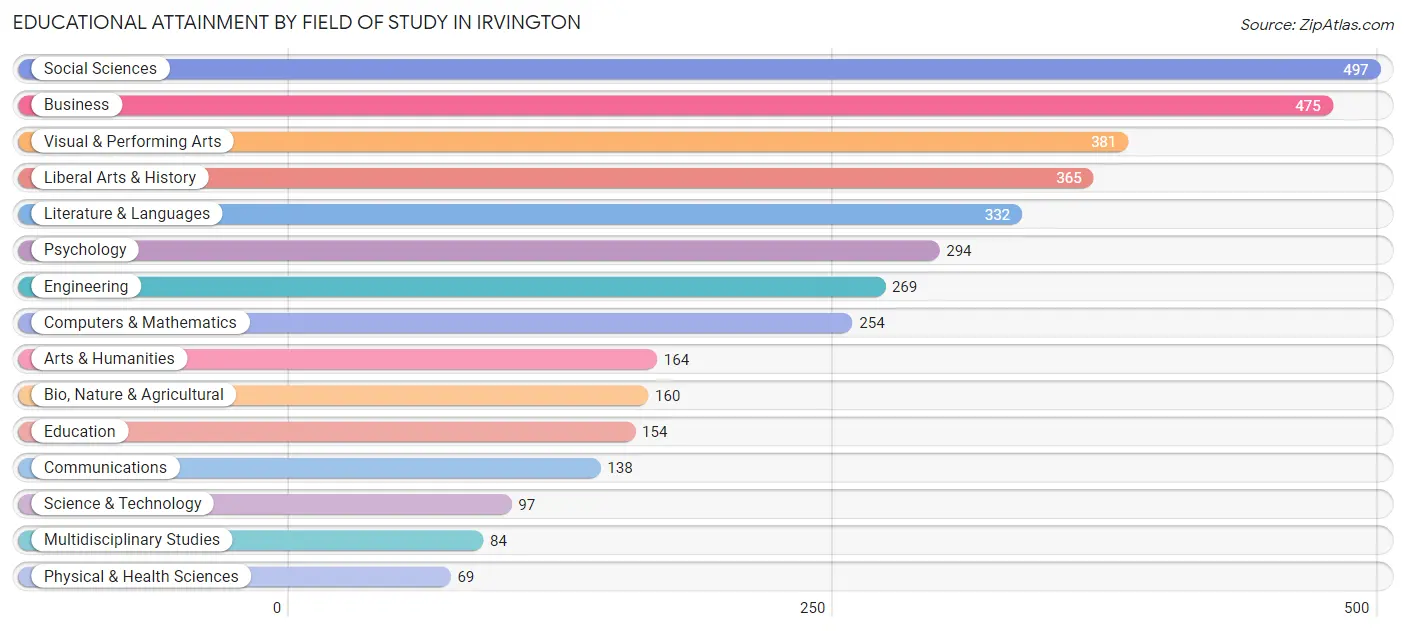
| Field of Study | # Graduates | % Graduates |
| Computers & Mathematics | 254 | 6.8% |
| Bio, Nature & Agricultural | 160 | 4.3% |
| Physical & Health Sciences | 69 | 1.8% |
| Psychology | 294 | 7.9% |
| Social Sciences | 497 | 13.3% |
| Engineering | 269 | 7.2% |
| Multidisciplinary Studies | 84 | 2.2% |
| Science & Technology | 97 | 2.6% |
| Business | 475 | 12.7% |
| Education | 154 | 4.1% |
| Literature & Languages | 332 | 8.9% |
| Liberal Arts & History | 365 | 9.8% |
| Visual & Performing Arts | 381 | 10.2% |
| Communications | 138 | 3.7% |
| Arts & Humanities | 164 | 4.4% |
| Total | 3,733 | 100.0% |
Transportation & Commute in Irvington
Vehicle Availability by Sex in Irvington
The most prevalent vehicle ownership categories in Irvington are males with 2 vehicles (1,031, accounting for 59.1%) and females with 2 vehicles (938, making up 64.2%).
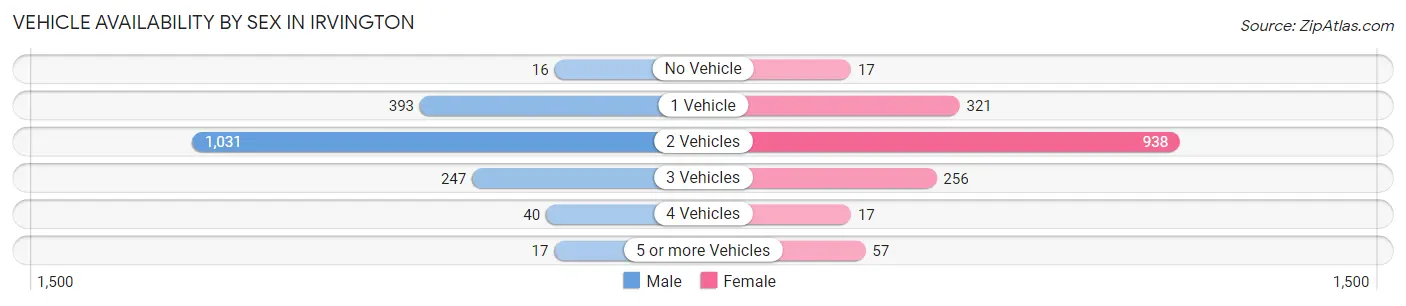
| Vehicles Available | Male | Female |
| No Vehicle | 16 (0.9%) | 17 (1.1%) |
| 1 Vehicle | 393 (22.5%) | 321 (20.0%) |
| 2 Vehicles | 1,031 (59.1%) | 938 (58.4%) |
| 3 Vehicles | 247 (14.2%) | 256 (15.9%) |
| 4 Vehicles | 40 (2.3%) | 17 (1.1%) |
| 5 or more Vehicles | 17 (1.0%) | 57 (3.5%) |
| Total | 1,744 (100.0%) | 1,606 (100.0%) |
Commute Time in Irvington
The most frequently occuring commute durations in Irvington are 60 to 89 minutes (556 commuters, 22.7%), 45 to 59 minutes (272 commuters, 11.1%), and 90 or more minutes (265 commuters, 10.8%).
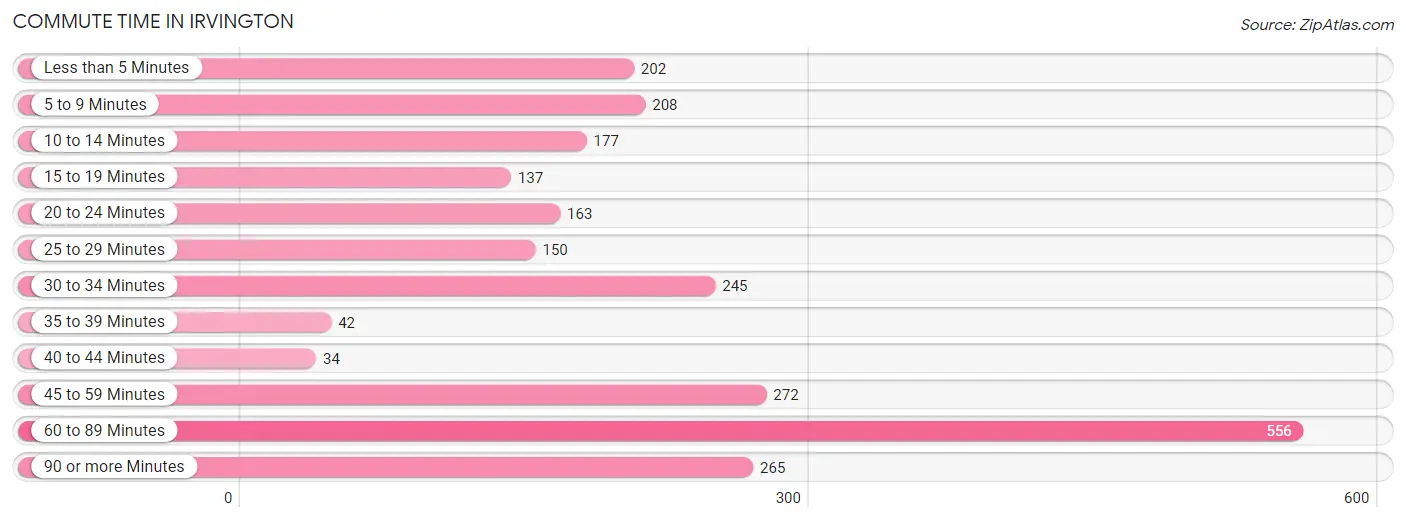
| Commute Time | # Commuters | % Commuters |
| Less than 5 Minutes | 202 | 8.2% |
| 5 to 9 Minutes | 208 | 8.5% |
| 10 to 14 Minutes | 177 | 7.2% |
| 15 to 19 Minutes | 137 | 5.6% |
| 20 to 24 Minutes | 163 | 6.7% |
| 25 to 29 Minutes | 150 | 6.1% |
| 30 to 34 Minutes | 245 | 10.0% |
| 35 to 39 Minutes | 42 | 1.7% |
| 40 to 44 Minutes | 34 | 1.4% |
| 45 to 59 Minutes | 272 | 11.1% |
| 60 to 89 Minutes | 556 | 22.7% |
| 90 or more Minutes | 265 | 10.8% |
Commute Time by Sex in Irvington
The most common commute times in Irvington are 60 to 89 minutes (347 commuters, 27.1%) for males and 60 to 89 minutes (209 commuters, 17.9%) for females.
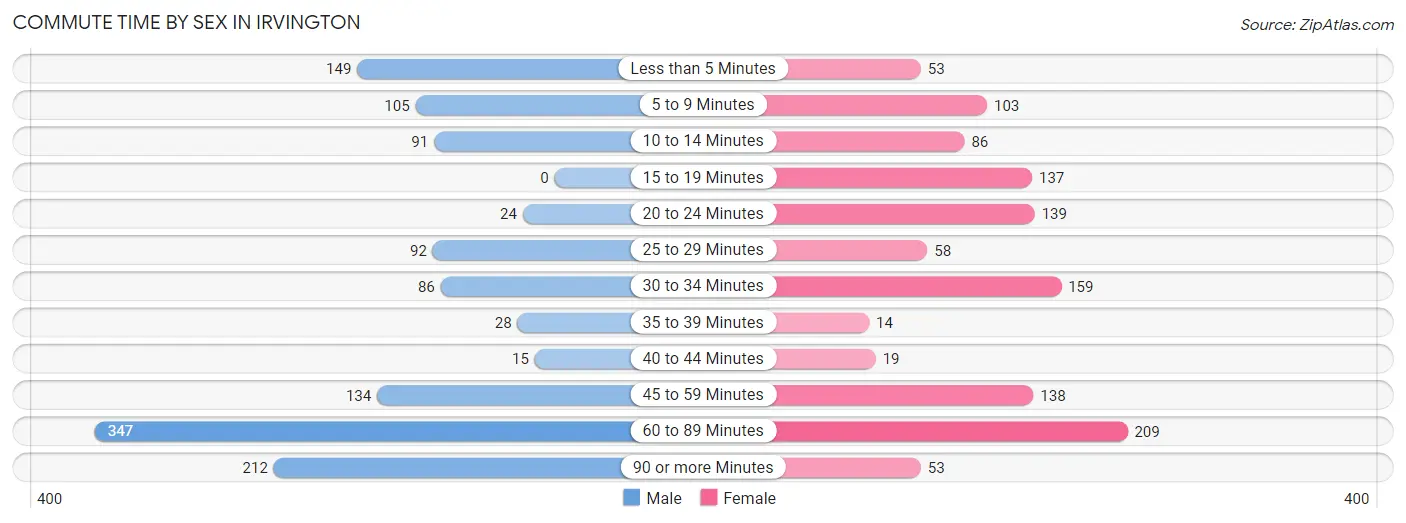
| Commute Time | Male | Female |
| Less than 5 Minutes | 149 (11.6%) | 53 (4.5%) |
| 5 to 9 Minutes | 105 (8.2%) | 103 (8.8%) |
| 10 to 14 Minutes | 91 (7.1%) | 86 (7.4%) |
| 15 to 19 Minutes | 0 (0.0%) | 137 (11.7%) |
| 20 to 24 Minutes | 24 (1.9%) | 139 (11.9%) |
| 25 to 29 Minutes | 92 (7.2%) | 58 (5.0%) |
| 30 to 34 Minutes | 86 (6.7%) | 159 (13.6%) |
| 35 to 39 Minutes | 28 (2.2%) | 14 (1.2%) |
| 40 to 44 Minutes | 15 (1.2%) | 19 (1.6%) |
| 45 to 59 Minutes | 134 (10.4%) | 138 (11.8%) |
| 60 to 89 Minutes | 347 (27.1%) | 209 (17.9%) |
| 90 or more Minutes | 212 (16.5%) | 53 (4.5%) |
Time of Departure to Work by Sex in Irvington
The most frequent times of departure to work in Irvington are 7:00 AM to 7:29 AM (276, 21.5%) for males and 7:30 AM to 7:59 AM (286, 24.5%) for females.
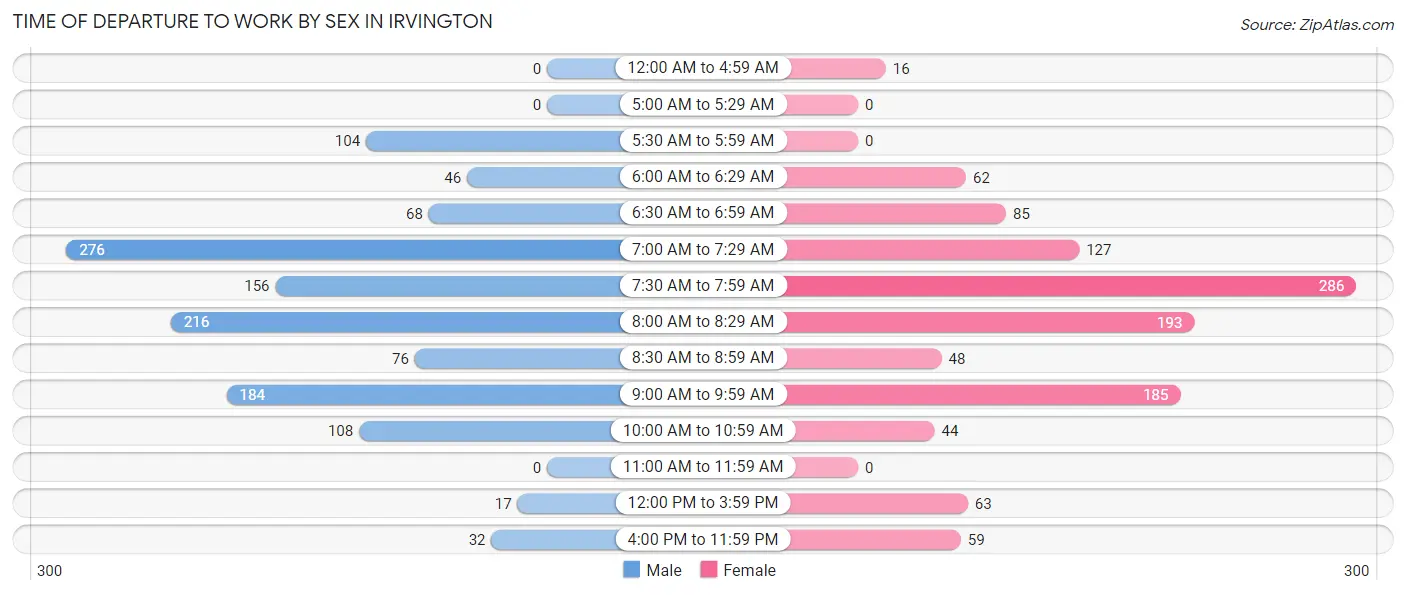
| Time of Departure | Male | Female |
| 12:00 AM to 4:59 AM | 0 (0.0%) | 16 (1.4%) |
| 5:00 AM to 5:29 AM | 0 (0.0%) | 0 (0.0%) |
| 5:30 AM to 5:59 AM | 104 (8.1%) | 0 (0.0%) |
| 6:00 AM to 6:29 AM | 46 (3.6%) | 62 (5.3%) |
| 6:30 AM to 6:59 AM | 68 (5.3%) | 85 (7.3%) |
| 7:00 AM to 7:29 AM | 276 (21.5%) | 127 (10.9%) |
| 7:30 AM to 7:59 AM | 156 (12.2%) | 286 (24.5%) |
| 8:00 AM to 8:29 AM | 216 (16.8%) | 193 (16.5%) |
| 8:30 AM to 8:59 AM | 76 (5.9%) | 48 (4.1%) |
| 9:00 AM to 9:59 AM | 184 (14.3%) | 185 (15.8%) |
| 10:00 AM to 10:59 AM | 108 (8.4%) | 44 (3.8%) |
| 11:00 AM to 11:59 AM | 0 (0.0%) | 0 (0.0%) |
| 12:00 PM to 3:59 PM | 17 (1.3%) | 63 (5.4%) |
| 4:00 PM to 11:59 PM | 32 (2.5%) | 59 (5.1%) |
| Total | 1,283 (100.0%) | 1,168 (100.0%) |
Housing Occupancy in Irvington
Occupancy by Ownership in Irvington
Of the total 2,202 dwellings in Irvington, owner-occupied units account for 1,724 (78.3%), while renter-occupied units make up 478 (21.7%).
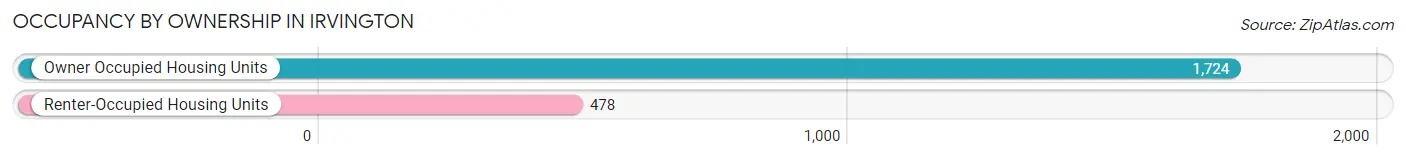
| Occupancy | # Housing Units | % Housing Units |
| Owner Occupied Housing Units | 1,724 | 78.3% |
| Renter-Occupied Housing Units | 478 | 21.7% |
| Total Occupied Housing Units | 2,202 | 100.0% |
Occupancy by Household Size in Irvington
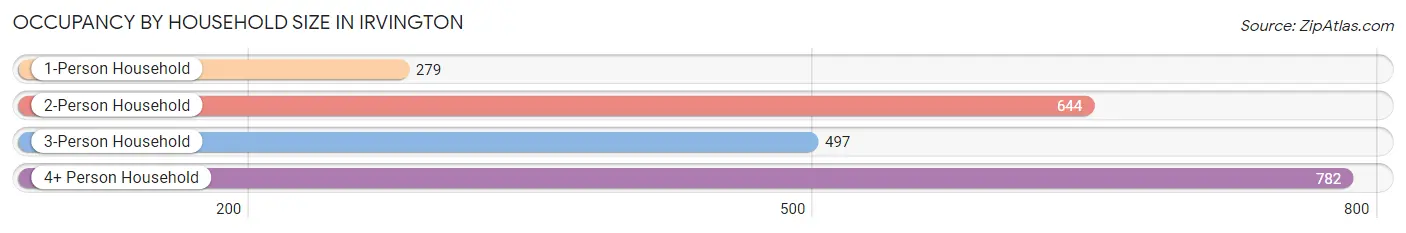
| Household Size | # Housing Units | % Housing Units |
| 1-Person Household | 279 | 12.7% |
| 2-Person Household | 644 | 29.2% |
| 3-Person Household | 497 | 22.6% |
| 4+ Person Household | 782 | 35.5% |
| Total Housing Units | 2,202 | 100.0% |
Occupancy by Ownership by Household Size in Irvington
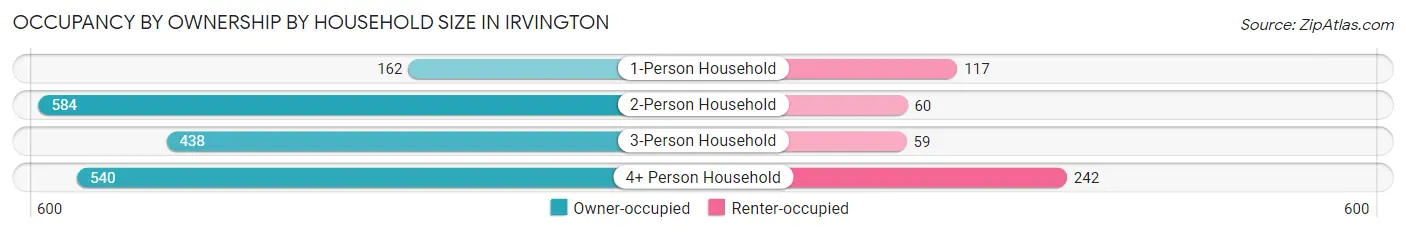
| Household Size | Owner-occupied | Renter-occupied |
| 1-Person Household | 162 (58.1%) | 117 (41.9%) |
| 2-Person Household | 584 (90.7%) | 60 (9.3%) |
| 3-Person Household | 438 (88.1%) | 59 (11.9%) |
| 4+ Person Household | 540 (69.1%) | 242 (30.9%) |
| Total Housing Units | 1,724 (78.3%) | 478 (21.7%) |
Occupancy by Educational Attainment in Irvington
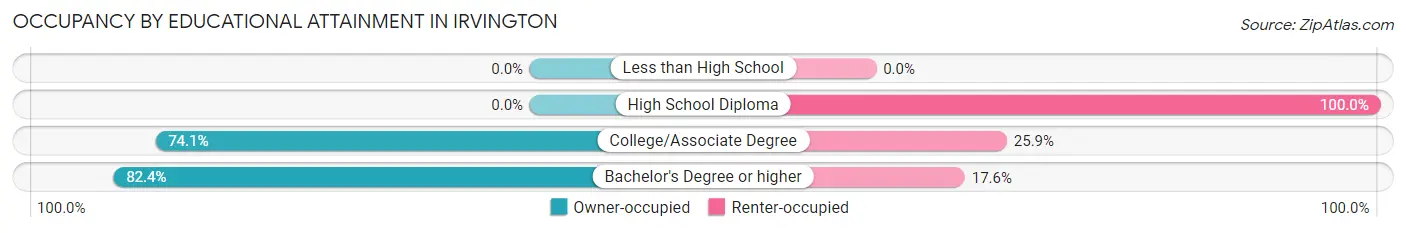
| Household Size | Owner-occupied | Renter-occupied |
| Less than High School | 0 (0.0%) | 0 (0.0%) |
| High School Diploma | 0 (0.0%) | 91 (100.0%) |
| College/Associate Degree | 143 (74.1%) | 50 (25.9%) |
| Bachelor's Degree or higher | 1,581 (82.4%) | 337 (17.6%) |
Occupancy by Age of Householder in Irvington
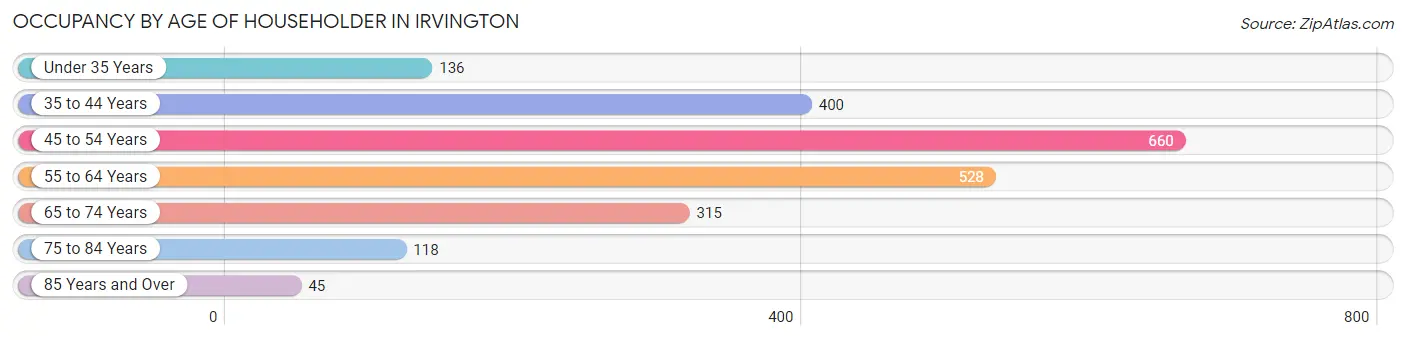
| Age Bracket | # Households | % Households |
| Under 35 Years | 136 | 6.2% |
| 35 to 44 Years | 400 | 18.2% |
| 45 to 54 Years | 660 | 30.0% |
| 55 to 64 Years | 528 | 24.0% |
| 65 to 74 Years | 315 | 14.3% |
| 75 to 84 Years | 118 | 5.4% |
| 85 Years and Over | 45 | 2.0% |
| Total | 2,202 | 100.0% |
Housing Finances in Irvington
Median Income by Occupancy in Irvington
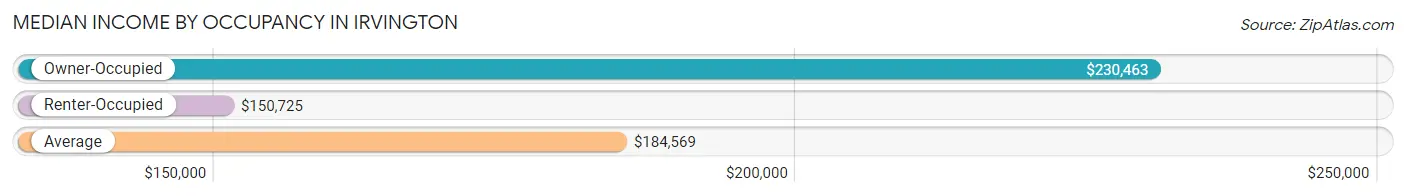
| Occupancy Type | # Households | Median Income |
| Owner-Occupied | 1,724 (78.3%) | $230,463 |
| Renter-Occupied | 478 (21.7%) | $150,725 |
| Average | 2,202 (100.0%) | $184,569 |
Occupancy by Householder Income Bracket in Irvington
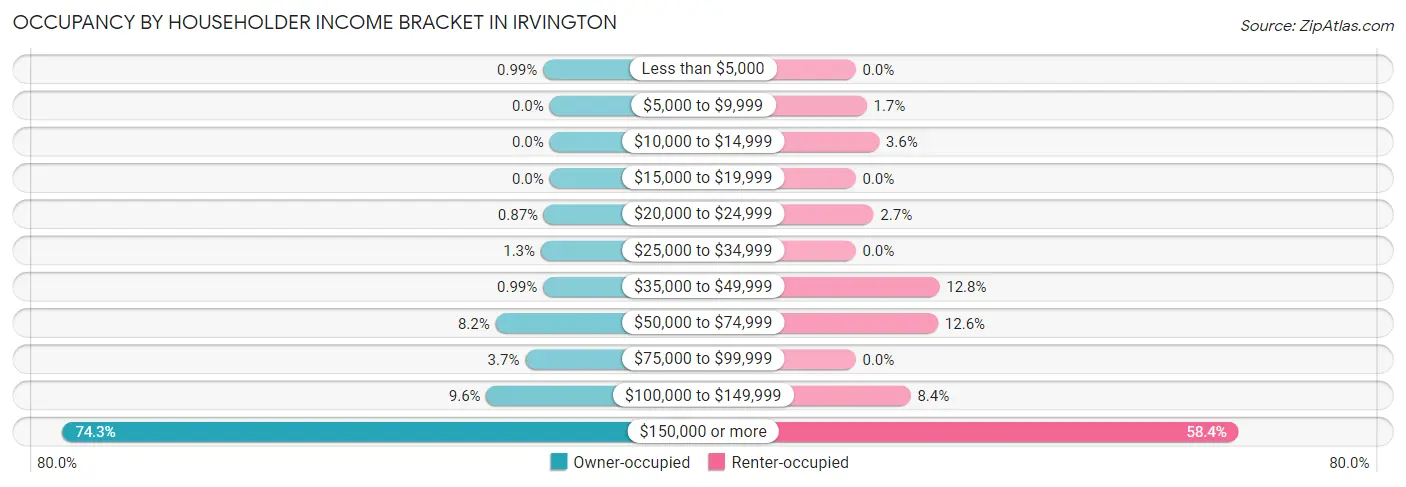
| Income Bracket | Owner-occupied | Renter-occupied |
| Less than $5,000 | 17 (1.0%) | 0 (0.0%) |
| $5,000 to $9,999 | 0 (0.0%) | 8 (1.7%) |
| $10,000 to $14,999 | 0 (0.0%) | 17 (3.6%) |
| $15,000 to $19,999 | 0 (0.0%) | 0 (0.0%) |
| $20,000 to $24,999 | 15 (0.9%) | 13 (2.7%) |
| $25,000 to $34,999 | 23 (1.3%) | 0 (0.0%) |
| $35,000 to $49,999 | 17 (1.0%) | 61 (12.8%) |
| $50,000 to $74,999 | 142 (8.2%) | 60 (12.6%) |
| $75,000 to $99,999 | 64 (3.7%) | 0 (0.0%) |
| $100,000 to $149,999 | 166 (9.6%) | 40 (8.4%) |
| $150,000 or more | 1,280 (74.3%) | 279 (58.4%) |
| Total | 1,724 (100.0%) | 478 (100.0%) |
Monthly Housing Cost Tiers in Irvington
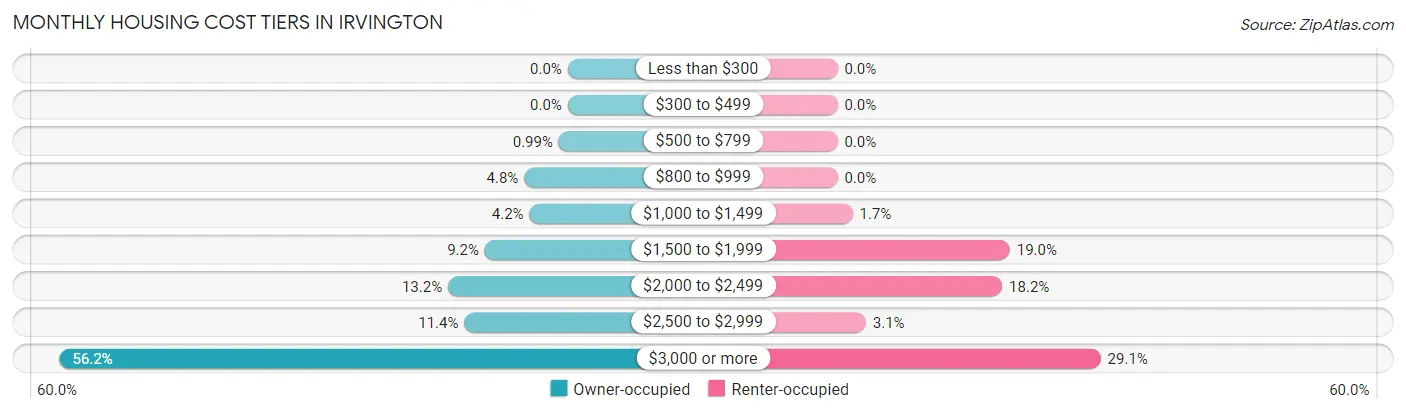
| Monthly Cost | Owner-occupied | Renter-occupied |
| Less than $300 | 0 (0.0%) | 0 (0.0%) |
| $300 to $499 | 0 (0.0%) | 0 (0.0%) |
| $500 to $799 | 17 (1.0%) | 0 (0.0%) |
| $800 to $999 | 83 (4.8%) | 0 (0.0%) |
| $1,000 to $1,499 | 73 (4.2%) | 8 (1.7%) |
| $1,500 to $1,999 | 158 (9.2%) | 91 (19.0%) |
| $2,000 to $2,499 | 228 (13.2%) | 87 (18.2%) |
| $2,500 to $2,999 | 197 (11.4%) | 15 (3.1%) |
| $3,000 or more | 968 (56.1%) | 139 (29.1%) |
| Total | 1,724 (100.0%) | 478 (100.0%) |
Physical Housing Characteristics in Irvington
Housing Structures in Irvington
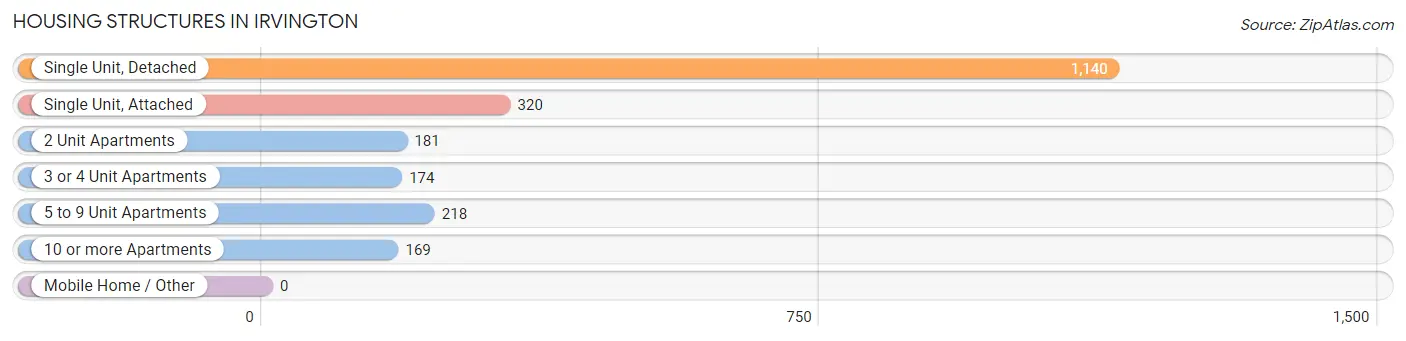
| Structure Type | # Housing Units | % Housing Units |
| Single Unit, Detached | 1,140 | 51.8% |
| Single Unit, Attached | 320 | 14.5% |
| 2 Unit Apartments | 181 | 8.2% |
| 3 or 4 Unit Apartments | 174 | 7.9% |
| 5 to 9 Unit Apartments | 218 | 9.9% |
| 10 or more Apartments | 169 | 7.7% |
| Mobile Home / Other | 0 | 0.0% |
| Total | 2,202 | 100.0% |
Housing Structures by Occupancy in Irvington
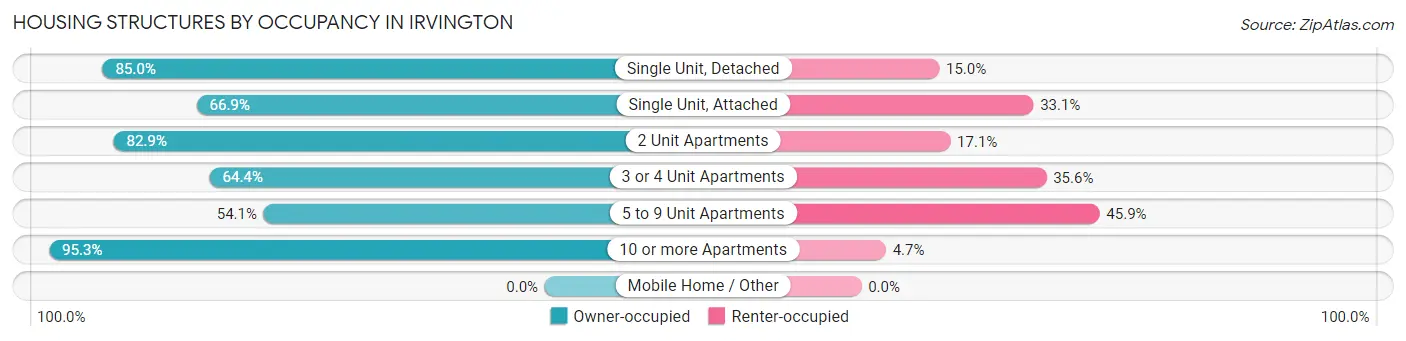
| Structure Type | Owner-occupied | Renter-occupied |
| Single Unit, Detached | 969 (85.0%) | 171 (15.0%) |
| Single Unit, Attached | 214 (66.9%) | 106 (33.1%) |
| 2 Unit Apartments | 150 (82.9%) | 31 (17.1%) |
| 3 or 4 Unit Apartments | 112 (64.4%) | 62 (35.6%) |
| 5 to 9 Unit Apartments | 118 (54.1%) | 100 (45.9%) |
| 10 or more Apartments | 161 (95.3%) | 8 (4.7%) |
| Mobile Home / Other | 0 (0.0%) | 0 (0.0%) |
| Total | 1,724 (78.3%) | 478 (21.7%) |
Housing Structures by Number of Rooms in Irvington
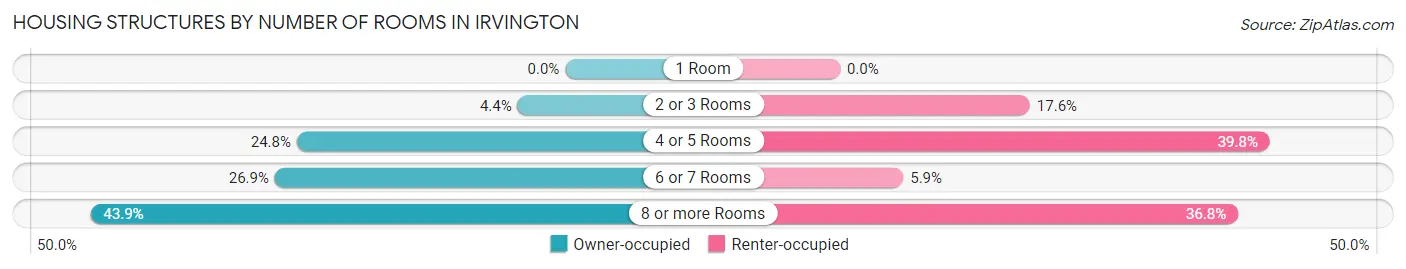
| Number of Rooms | Owner-occupied | Renter-occupied |
| 1 Room | 0 (0.0%) | 0 (0.0%) |
| 2 or 3 Rooms | 76 (4.4%) | 84 (17.6%) |
| 4 or 5 Rooms | 428 (24.8%) | 190 (39.8%) |
| 6 or 7 Rooms | 463 (26.9%) | 28 (5.9%) |
| 8 or more Rooms | 757 (43.9%) | 176 (36.8%) |
| Total | 1,724 (100.0%) | 478 (100.0%) |
Housing Structure by Heating Type in Irvington
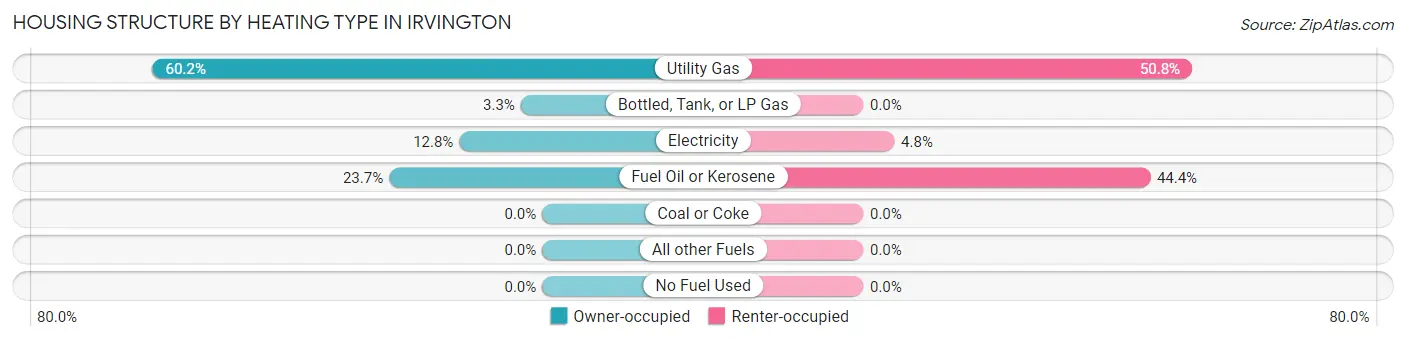
| Heating Type | Owner-occupied | Renter-occupied |
| Utility Gas | 1,038 (60.2%) | 243 (50.8%) |
| Bottled, Tank, or LP Gas | 57 (3.3%) | 0 (0.0%) |
| Electricity | 221 (12.8%) | 23 (4.8%) |
| Fuel Oil or Kerosene | 408 (23.7%) | 212 (44.4%) |
| Coal or Coke | 0 (0.0%) | 0 (0.0%) |
| All other Fuels | 0 (0.0%) | 0 (0.0%) |
| No Fuel Used | 0 (0.0%) | 0 (0.0%) |
| Total | 1,724 (100.0%) | 478 (100.0%) |
Household Vehicle Usage in Irvington
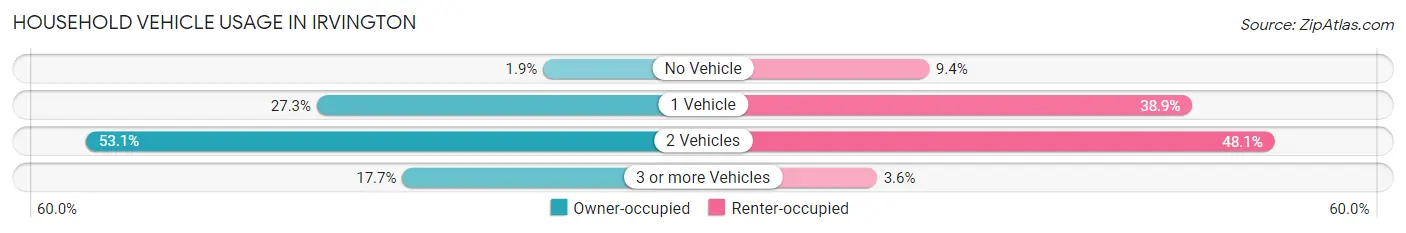
| Vehicles per Household | Owner-occupied | Renter-occupied |
| No Vehicle | 33 (1.9%) | 45 (9.4%) |
| 1 Vehicle | 470 (27.3%) | 186 (38.9%) |
| 2 Vehicles | 916 (53.1%) | 230 (48.1%) |
| 3 or more Vehicles | 305 (17.7%) | 17 (3.6%) |
| Total | 1,724 (100.0%) | 478 (100.0%) |
Real Estate & Mortgages in Irvington
Real Estate and Mortgage Overview in Irvington
| Characteristic | Without Mortgage | With Mortgage |
| Housing Units | 610 | 1,114 |
| Median Property Value | $1,025,000 | $787,400 |
| Median Household Income | $201,042 | $908 |
| Monthly Housing Costs | $1,501 | $702 |
| Real Estate Taxes | $10,001 | $211 |
Property Value by Mortgage Status in Irvington
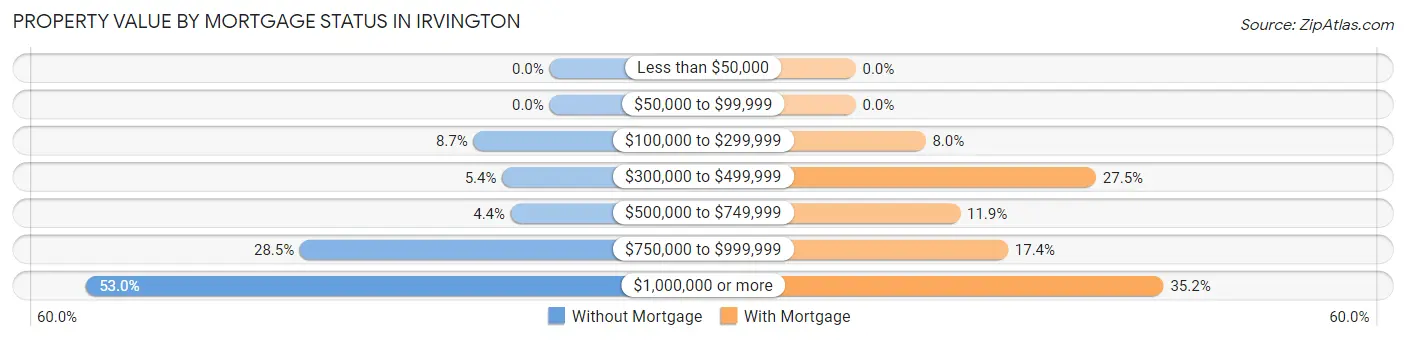
| Property Value | Without Mortgage | With Mortgage |
| Less than $50,000 | 0 (0.0%) | 0 (0.0%) |
| $50,000 to $99,999 | 0 (0.0%) | 0 (0.0%) |
| $100,000 to $299,999 | 53 (8.7%) | 89 (8.0%) |
| $300,000 to $499,999 | 33 (5.4%) | 306 (27.5%) |
| $500,000 to $749,999 | 27 (4.4%) | 133 (11.9%) |
| $750,000 to $999,999 | 174 (28.5%) | 194 (17.4%) |
| $1,000,000 or more | 323 (52.9%) | 392 (35.2%) |
| Total | 610 (100.0%) | 1,114 (100.0%) |
Household Income by Mortgage Status in Irvington
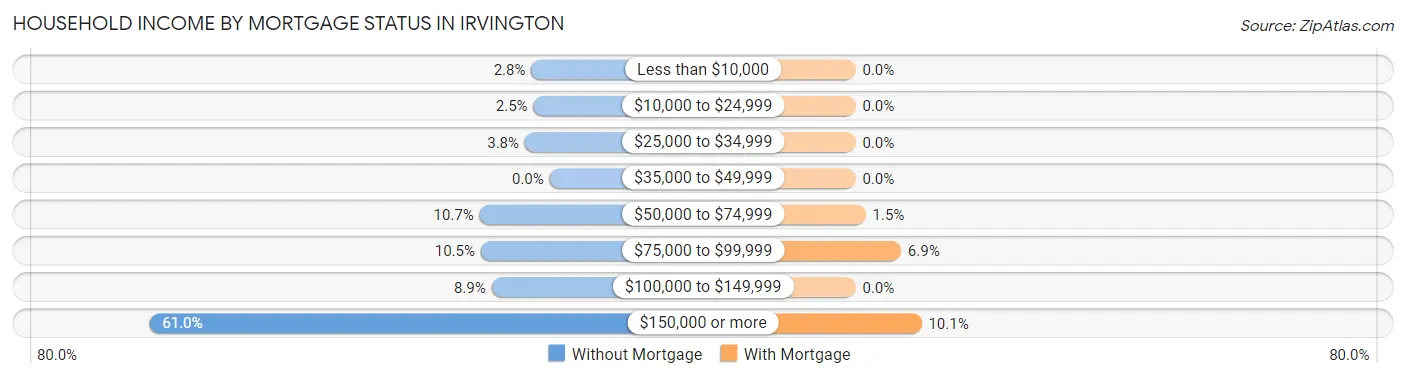
| Household Income | Without Mortgage | With Mortgage |
| Less than $10,000 | 17 (2.8%) | 0 (0.0%) |
| $10,000 to $24,999 | 15 (2.5%) | 0 (0.0%) |
| $25,000 to $34,999 | 23 (3.8%) | 0 (0.0%) |
| $35,000 to $49,999 | 0 (0.0%) | 0 (0.0%) |
| $50,000 to $74,999 | 65 (10.7%) | 17 (1.5%) |
| $75,000 to $99,999 | 64 (10.5%) | 77 (6.9%) |
| $100,000 to $149,999 | 54 (8.8%) | 0 (0.0%) |
| $150,000 or more | 372 (61.0%) | 112 (10.1%) |
| Total | 610 (100.0%) | 1,114 (100.0%) |
Property Value to Household Income Ratio in Irvington
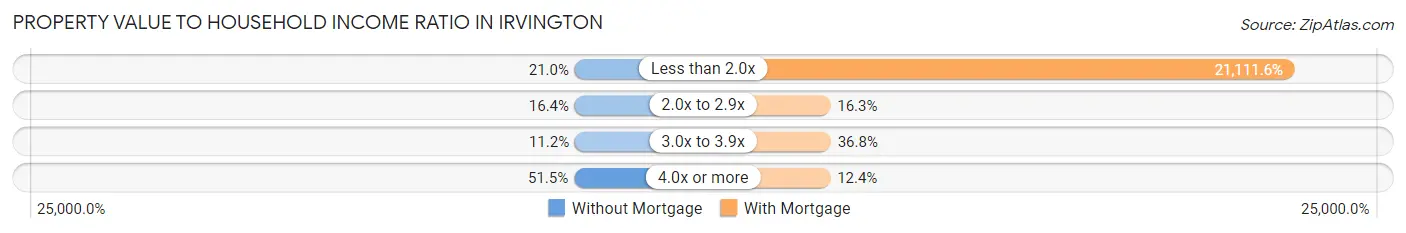
| Value-to-Income Ratio | Without Mortgage | With Mortgage |
| Less than 2.0x | 128 (21.0%) | 235,183 (21,111.6%) |
| 2.0x to 2.9x | 100 (16.4%) | 182 (16.3%) |
| 3.0x to 3.9x | 68 (11.2%) | 410 (36.8%) |
| 4.0x or more | 314 (51.5%) | 138 (12.4%) |
| Total | 610 (100.0%) | 1,114 (100.0%) |
Real Estate Taxes by Mortgage Status in Irvington
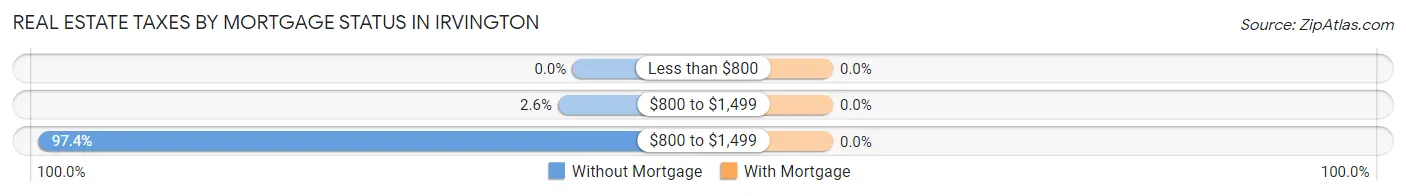
| Property Taxes | Without Mortgage | With Mortgage |
| Less than $800 | 0 (0.0%) | 0 (0.0%) |
| $800 to $1,499 | 16 (2.6%) | 0 (0.0%) |
| $800 to $1,499 | 594 (97.4%) | 0 (0.0%) |
| Total | 610 (100.0%) | 1,114 (100.0%) |
Health & Disability in Irvington
Health Insurance Coverage by Age in Irvington
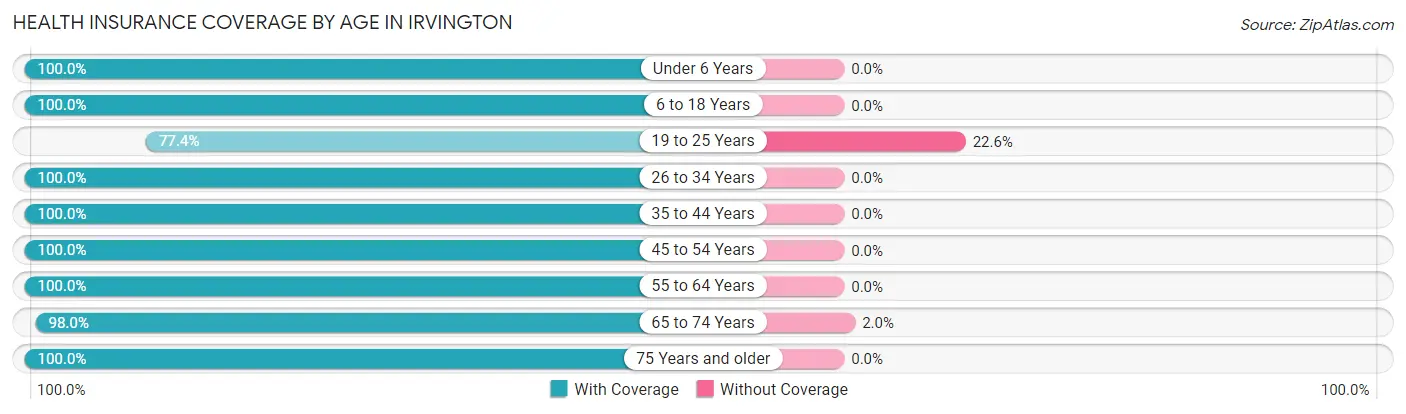
| Age Bracket | With Coverage | Without Coverage |
| Under 6 Years | 565 (100.0%) | 0 (0.0%) |
| 6 to 18 Years | 1,455 (100.0%) | 0 (0.0%) |
| 19 to 25 Years | 246 (77.4%) | 72 (22.6%) |
| 26 to 34 Years | 480 (100.0%) | 0 (0.0%) |
| 35 to 44 Years | 813 (100.0%) | 0 (0.0%) |
| 45 to 54 Years | 1,022 (100.0%) | 0 (0.0%) |
| 55 to 64 Years | 1,068 (100.0%) | 0 (0.0%) |
| 65 to 74 Years | 623 (98.0%) | 13 (2.0%) |
| 75 Years and older | 215 (100.0%) | 0 (0.0%) |
| Total | 6,487 (98.7%) | 85 (1.3%) |
Health Insurance Coverage by Citizenship Status in Irvington
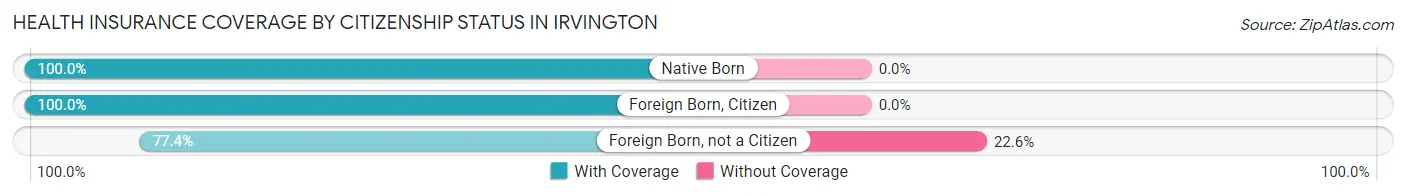
| Citizenship Status | With Coverage | Without Coverage |
| Native Born | 565 (100.0%) | 0 (0.0%) |
| Foreign Born, Citizen | 1,455 (100.0%) | 0 (0.0%) |
| Foreign Born, not a Citizen | 246 (77.4%) | 72 (22.6%) |
Health Insurance Coverage by Household Income in Irvington
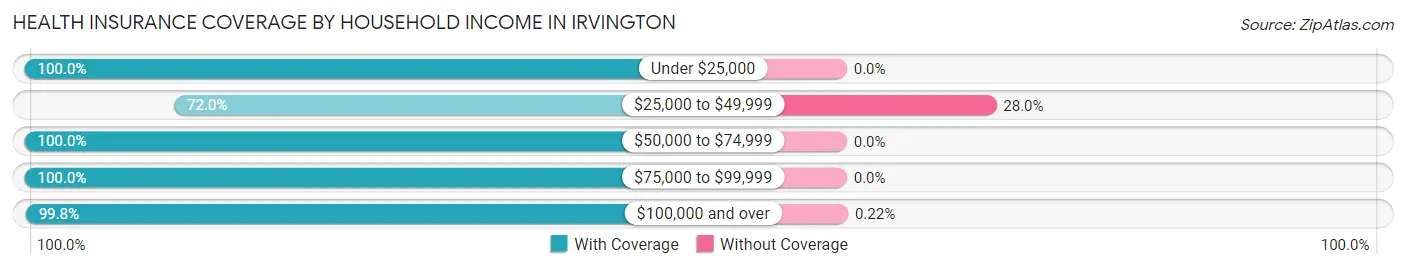
| Household Income | With Coverage | Without Coverage |
| Under $25,000 | 115 (100.0%) | 0 (0.0%) |
| $25,000 to $49,999 | 185 (72.0%) | 72 (28.0%) |
| $50,000 to $74,999 | 283 (100.0%) | 0 (0.0%) |
| $75,000 to $99,999 | 110 (100.0%) | 0 (0.0%) |
| $100,000 and over | 5,774 (99.8%) | 13 (0.2%) |
Public vs Private Health Insurance Coverage by Age in Irvington
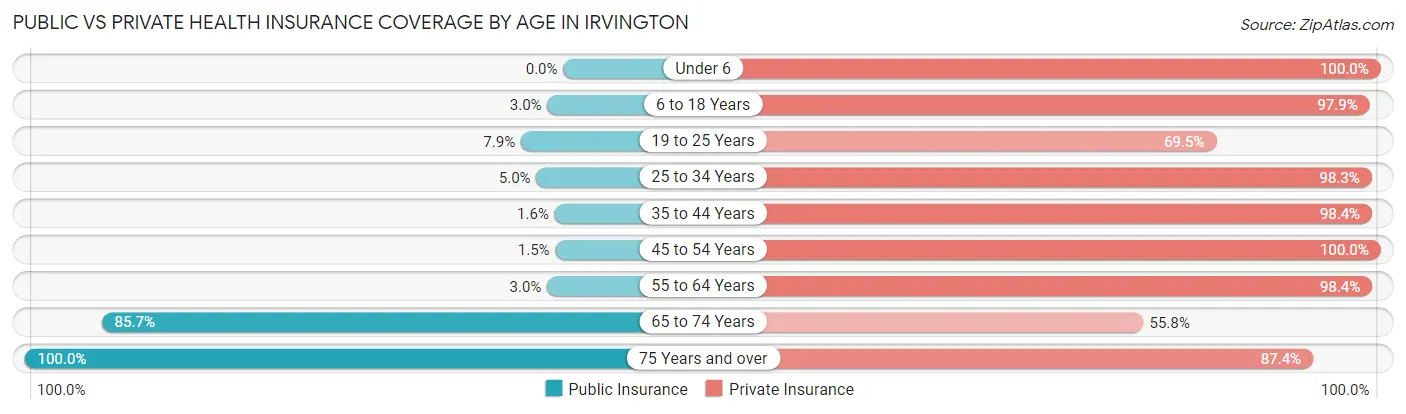
| Age Bracket | Public Insurance | Private Insurance |
| Under 6 | 0 (0.0%) | 565 (100.0%) |
| 6 to 18 Years | 43 (3.0%) | 1,425 (97.9%) |
| 19 to 25 Years | 25 (7.9%) | 221 (69.5%) |
| 25 to 34 Years | 24 (5.0%) | 472 (98.3%) |
| 35 to 44 Years | 13 (1.6%) | 800 (98.4%) |
| 45 to 54 Years | 15 (1.5%) | 1,022 (100.0%) |
| 55 to 64 Years | 32 (3.0%) | 1,051 (98.4%) |
| 65 to 74 Years | 545 (85.7%) | 355 (55.8%) |
| 75 Years and over | 215 (100.0%) | 188 (87.4%) |
| Total | 912 (13.9%) | 6,099 (92.8%) |
Disability Status by Sex by Age in Irvington
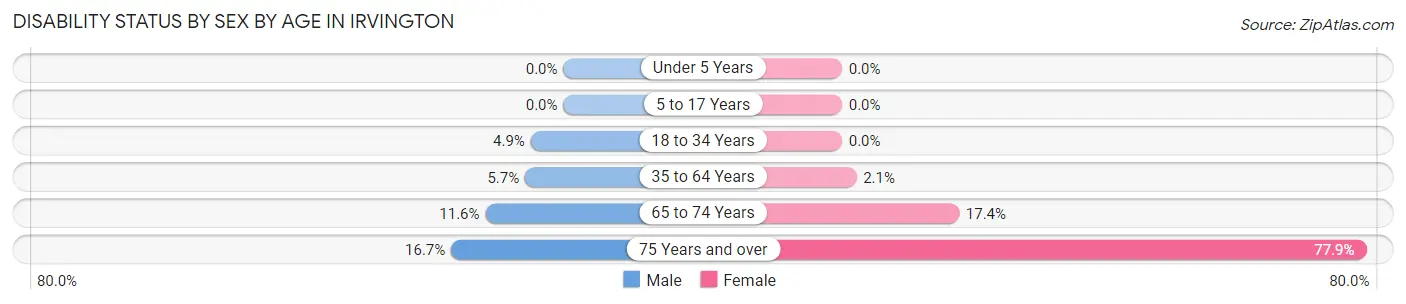
| Age Bracket | Male | Female |
| Under 5 Years | 0 (0.0%) | 0 (0.0%) |
| 5 to 17 Years | 0 (0.0%) | 0 (0.0%) |
| 18 to 34 Years | 20 (4.9%) | 0 (0.0%) |
| 35 to 64 Years | 80 (5.7%) | 32 (2.1%) |
| 65 to 74 Years | 33 (11.6%) | 61 (17.4%) |
| 75 Years and over | 17 (16.7%) | 88 (77.9%) |
Disability Class by Sex by Age in Irvington
Disability Class: Hearing Difficulty
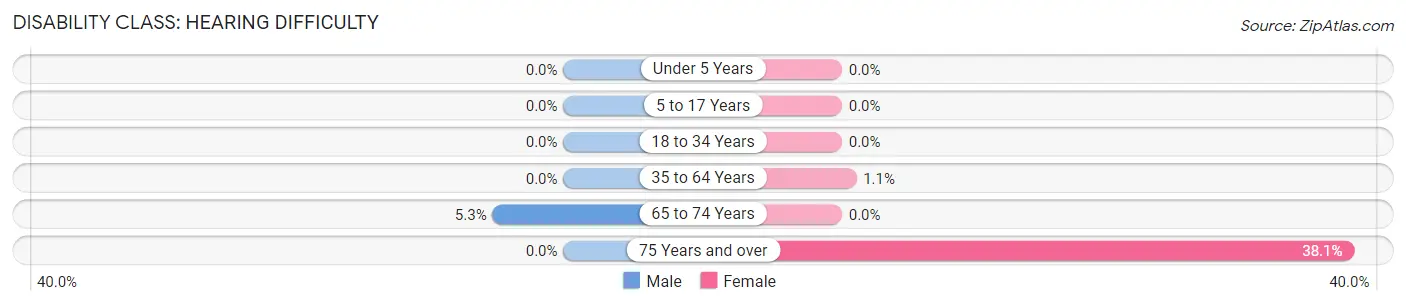
| Age Bracket | Male | Female |
| Under 5 Years | 0 (0.0%) | 0 (0.0%) |
| 5 to 17 Years | 0 (0.0%) | 0 (0.0%) |
| 18 to 34 Years | 0 (0.0%) | 0 (0.0%) |
| 35 to 64 Years | 0 (0.0%) | 16 (1.1%) |
| 65 to 74 Years | 15 (5.3%) | 0 (0.0%) |
| 75 Years and over | 0 (0.0%) | 43 (38.1%) |
Disability Class: Vision Difficulty
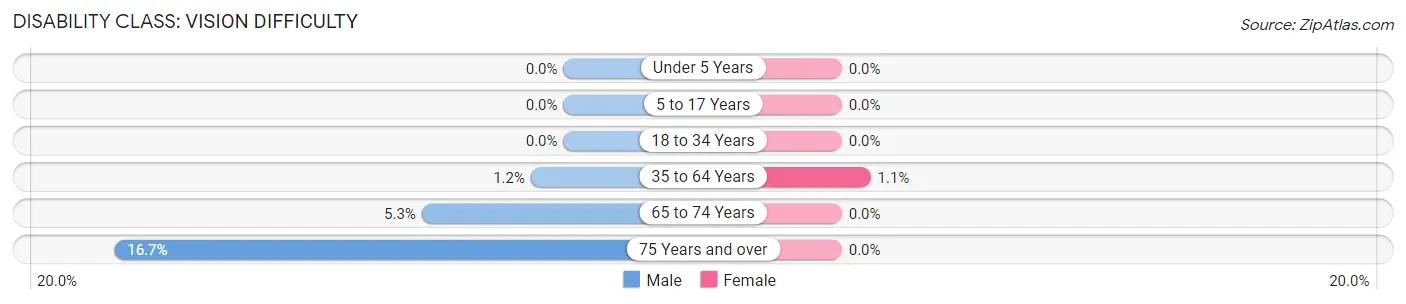
| Age Bracket | Male | Female |
| Under 5 Years | 0 (0.0%) | 0 (0.0%) |
| 5 to 17 Years | 0 (0.0%) | 0 (0.0%) |
| 18 to 34 Years | 0 (0.0%) | 0 (0.0%) |
| 35 to 64 Years | 17 (1.2%) | 16 (1.1%) |
| 65 to 74 Years | 15 (5.3%) | 0 (0.0%) |
| 75 Years and over | 17 (16.7%) | 0 (0.0%) |
Disability Class: Cognitive Difficulty
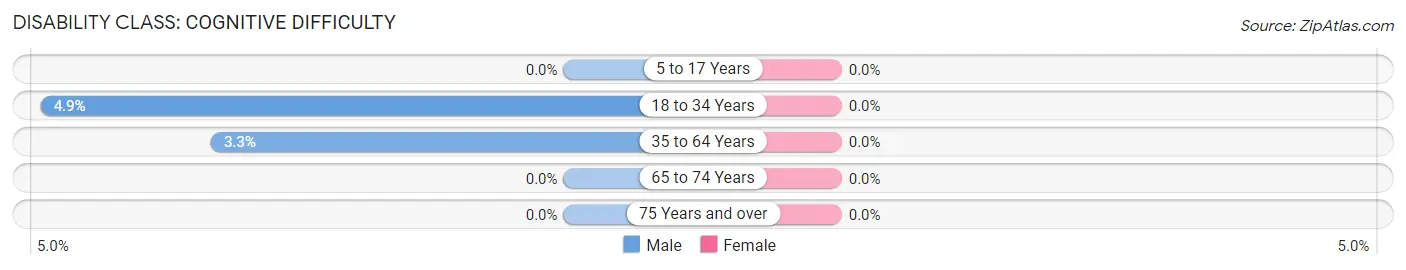
| Age Bracket | Male | Female |
| 5 to 17 Years | 0 (0.0%) | 0 (0.0%) |
| 18 to 34 Years | 20 (4.9%) | 0 (0.0%) |
| 35 to 64 Years | 46 (3.3%) | 0 (0.0%) |
| 65 to 74 Years | 0 (0.0%) | 0 (0.0%) |
| 75 Years and over | 0 (0.0%) | 0 (0.0%) |
Disability Class: Ambulatory Difficulty
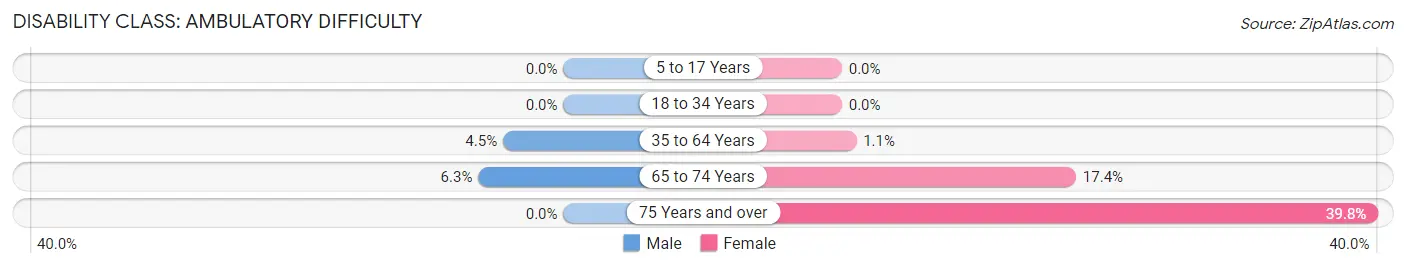
| Age Bracket | Male | Female |
| 5 to 17 Years | 0 (0.0%) | 0 (0.0%) |
| 18 to 34 Years | 0 (0.0%) | 0 (0.0%) |
| 35 to 64 Years | 63 (4.5%) | 16 (1.1%) |
| 65 to 74 Years | 18 (6.3%) | 61 (17.4%) |
| 75 Years and over | 0 (0.0%) | 45 (39.8%) |
Disability Class: Self-Care Difficulty
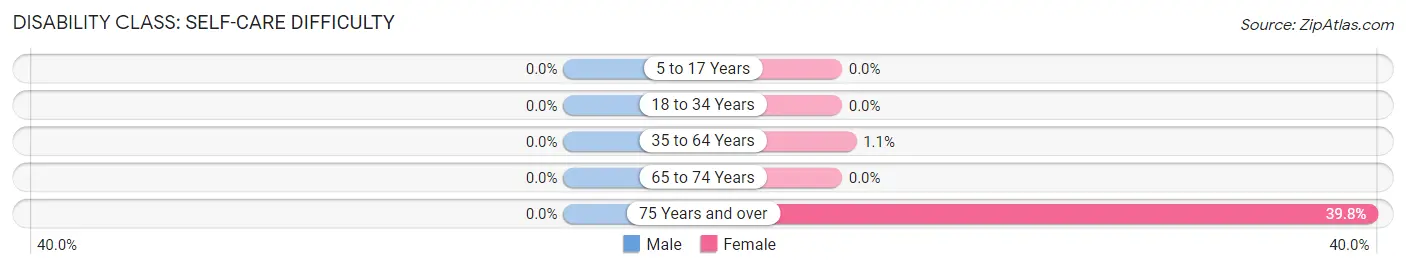
| Age Bracket | Male | Female |
| 5 to 17 Years | 0 (0.0%) | 0 (0.0%) |
| 18 to 34 Years | 0 (0.0%) | 0 (0.0%) |
| 35 to 64 Years | 0 (0.0%) | 16 (1.1%) |
| 65 to 74 Years | 0 (0.0%) | 0 (0.0%) |
| 75 Years and over | 0 (0.0%) | 45 (39.8%) |
Technology Access in Irvington
Computing Device Access in Irvington
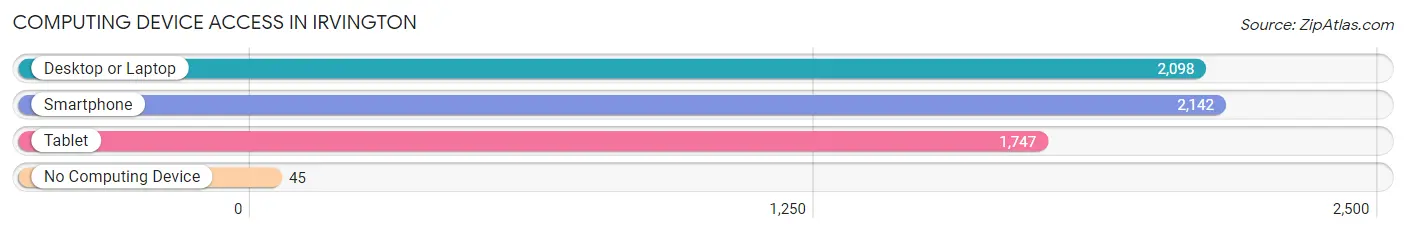
| Device Type | # Households | % Households |
| Desktop or Laptop | 2,098 | 95.3% |
| Smartphone | 2,142 | 97.3% |
| Tablet | 1,747 | 79.3% |
| No Computing Device | 45 | 2.0% |
| Total | 2,202 | 100.0% |
Internet Access in Irvington
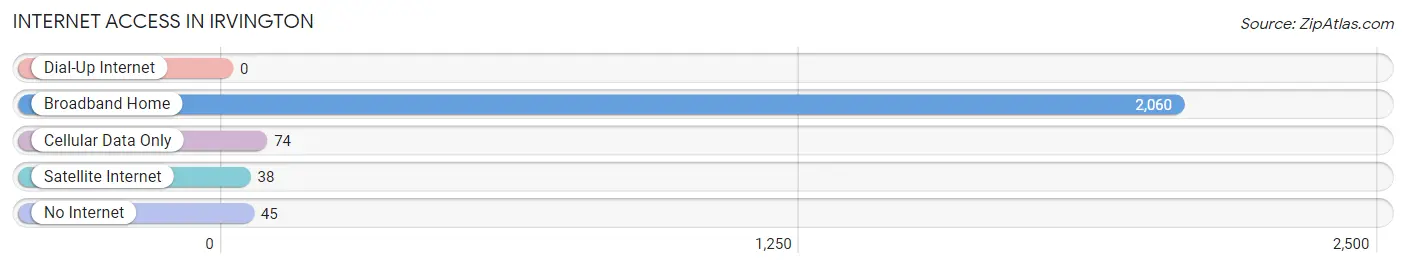
| Internet Type | # Households | % Households |
| Dial-Up Internet | 0 | 0.0% |
| Broadband Home | 2,060 | 93.5% |
| Cellular Data Only | 74 | 3.4% |
| Satellite Internet | 38 | 1.7% |
| No Internet | 45 | 2.0% |
| Total | 2,202 | 100.0% |
Irvington Summary
Irvington, New York is a village located in the town of Greenburgh in Westchester County, New York. It is situated on the eastern bank of the Hudson River, about 25 miles north of New York City. The village has a population of 6,420 as of the 2010 census.
History
The area that is now Irvington was originally inhabited by the Weckquaesgeek Native Americans. The first European settlers arrived in the area in the late 17th century. The village was originally known as “Irvington-on-Hudson” and was named after Washington Irving, the author of “The Legend of Sleepy Hollow” and “Rip Van Winkle”.
In the 19th century, Irvington was a popular summer resort for wealthy New Yorkers. The village was home to several grand estates, including the estate of Jay Gould, a prominent financier and railroad magnate. The village was incorporated in 1872.
Geography
Irvington is located at 41°4'25" North, 73°51'25" West (41.073611, -73.856944). The village has a total area of 1.2 square miles, all of which is land.
The village is bordered by the Hudson River to the west, the village of Tarrytown to the north, the village of Dobbs Ferry to the south, and the village of Ardsley to the east.
Economy
The economy of Irvington is largely based on tourism and retail. The village is home to several restaurants, shops, and galleries. The village is also home to several corporate offices, including the headquarters of the American Red Cross.
Demographics
As of the 2010 census, the population of Irvington was 6,420. The racial makeup of the village was 79.2% White, 8.2% African American, 0.2% Native American, 6.3% Asian, 0.1% Pacific Islander, 3.2% from other races, and 2.9% from two or more races. Hispanic or Latino of any race were 8.7% of the population.
The median household income in Irvington was $90,917, and the median family income was $106,917. The per capita income for the village was $45,917. About 4.2% of families and 5.7% of the population were below the poverty line, including 6.3% of those under age 18 and 4.2% of those age 65 or over.
Common Questions
What is Per Capita Income in Irvington?
Per Capita income in Irvington is $97,973.
What is the Median Family Income in Irvington?
Median Family Income in Irvington is $230,741.
What is the Median Household income in Irvington?
Median Household Income in Irvington is $184,569.
What is Income or Wage Gap in Irvington?
Income or Wage Gap in Irvington is 53.3%.
Women in Irvington earn 46.7 cents for every dollar earned by a man.
What is Inequality or Gini Index in Irvington?
Inequality or Gini Index in Irvington is 0.46.
What is the Total Population of Irvington?
Total Population of Irvington is 6,590.
What is the Total Male Population of Irvington?
Total Male Population of Irvington is 3,268.
What is the Total Female Population of Irvington?
Total Female Population of Irvington is 3,322.
What is the Ratio of Males per 100 Females in Irvington?
There are 98.37 Males per 100 Females in Irvington.
What is the Ratio of Females per 100 Males in Irvington?
There are 101.65 Females per 100 Males in Irvington.
What is the Median Population Age in Irvington?
Median Population Age in Irvington is 41.1 Years.
What is the Average Family Size in Irvington
Average Family Size in Irvington is 3.2 People.
What is the Average Household Size in Irvington
Average Household Size in Irvington is 3.0 People.
How Large is the Labor Force in Irvington?
There are 3,511 People in the Labor Forcein in Irvington.
What is the Percentage of People in the Labor Force in Irvington?
72.9% of People are in the Labor Force in Irvington.
What is the Unemployment Rate in Irvington?
Unemployment Rate in Irvington is 3.1%.