Mount Sterling, IL Map & Demographics
Mount Sterling Map
Mount Sterling Overview
$31,154
PER CAPITA INCOME
$72,593
AVG FAMILY INCOME
$55,000
AVG HOUSEHOLD INCOME
28.0%
WAGE / INCOME GAP [ % ]
72.0¢/ $1
WAGE / INCOME GAP [ $ ]
0.44
INEQUALITY / GINI INDEX
2,177
TOTAL POPULATION
1,159
MALE POPULATION
1,018
FEMALE POPULATION
113.85
MALES / 100 FEMALES
87.83
FEMALES / 100 MALES
34.2
MEDIAN AGE
2.8
AVG FAMILY SIZE
2.1
AVG HOUSEHOLD SIZE
1,145
LABOR FORCE [ PEOPLE ]
68.0%
PERCENT IN LABOR FORCE
3.1%
UNEMPLOYMENT RATE
Mount Sterling Zip Codes
Mount Sterling Area Codes
Income in Mount Sterling
Income Overview in Mount Sterling
Per Capita Income in Mount Sterling is $31,154, while median incomes of families and households are $72,593 and $55,000 respectively.
| Characteristic | Number | Measure |
| Per Capita Income | 2,177 | $31,154 |
| Median Family Income | 490 | $72,593 |
| Mean Family Income | 490 | $71,543 |
| Median Household Income | 1,006 | $55,000 |
| Mean Household Income | 1,006 | $70,049 |
| Income Deficit | 490 | $0 |
| Wage / Income Gap (%) | 2,177 | 27.99% |
| Wage / Income Gap ($) | 2,177 | 72.01¢ per $1 |
| Gini / Inequality Index | 2,177 | 0.44 |
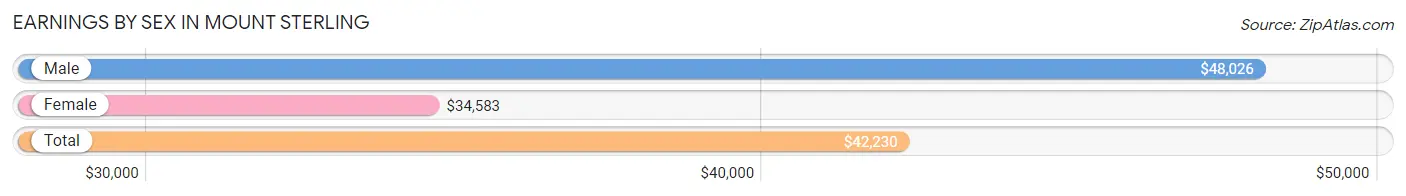
Earnings by Sex in Mount Sterling
Average Earnings in Mount Sterling are $42,230, $48,026 for men and $34,583 for women, a difference of 28.0%.
| Sex | Number | Average Earnings |
| Male | 626 (53.0%) | $48,026 |
| Female | 555 (47.0%) | $34,583 |
| Total | 1,181 (100.0%) | $42,230 |
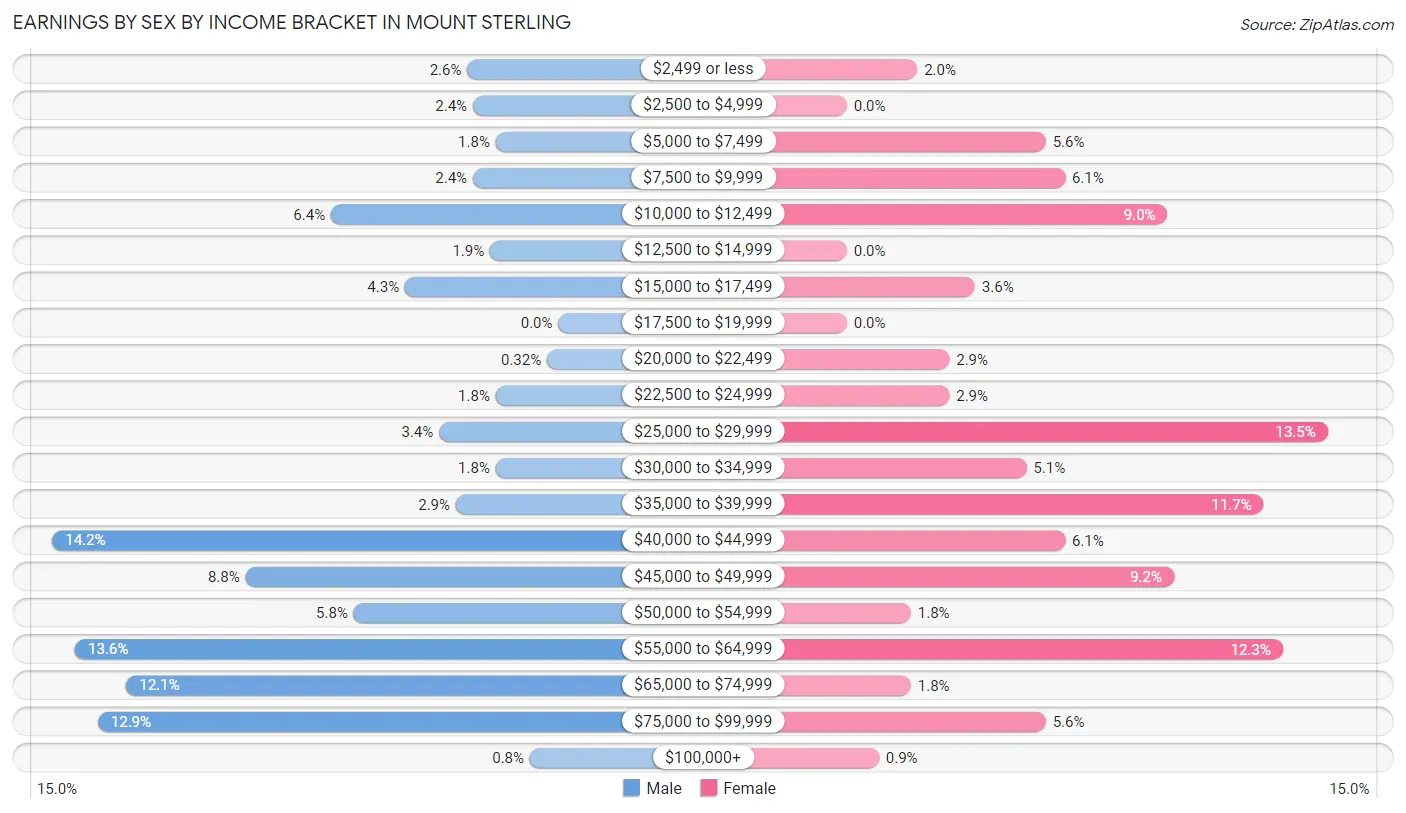
Earnings by Sex by Income Bracket in Mount Sterling
The most common earnings brackets in Mount Sterling are $40,000 to $44,999 for men (89 | 14.2%) and $25,000 to $29,999 for women (75 | 13.5%).
| Income | Male | Female |
| $2,499 or less | 16 (2.6%) | 11 (2.0%) |
| $2,500 to $4,999 | 15 (2.4%) | 0 (0.0%) |
| $5,000 to $7,499 | 11 (1.8%) | 31 (5.6%) |
| $7,500 to $9,999 | 15 (2.4%) | 34 (6.1%) |
| $10,000 to $12,499 | 40 (6.4%) | 50 (9.0%) |
| $12,500 to $14,999 | 12 (1.9%) | 0 (0.0%) |
| $15,000 to $17,499 | 27 (4.3%) | 20 (3.6%) |
| $17,500 to $19,999 | 0 (0.0%) | 0 (0.0%) |
| $20,000 to $22,499 | 2 (0.3%) | 16 (2.9%) |
| $22,500 to $24,999 | 11 (1.8%) | 16 (2.9%) |
| $25,000 to $29,999 | 21 (3.4%) | 75 (13.5%) |
| $30,000 to $34,999 | 11 (1.8%) | 28 (5.1%) |
| $35,000 to $39,999 | 18 (2.9%) | 65 (11.7%) |
| $40,000 to $44,999 | 89 (14.2%) | 34 (6.1%) |
| $45,000 to $49,999 | 55 (8.8%) | 51 (9.2%) |
| $50,000 to $54,999 | 36 (5.8%) | 10 (1.8%) |
| $55,000 to $64,999 | 85 (13.6%) | 68 (12.2%) |
| $65,000 to $74,999 | 76 (12.1%) | 10 (1.8%) |
| $75,000 to $99,999 | 81 (12.9%) | 31 (5.6%) |
| $100,000+ | 5 (0.8%) | 5 (0.9%) |
| Total | 626 (100.0%) | 555 (100.0%) |
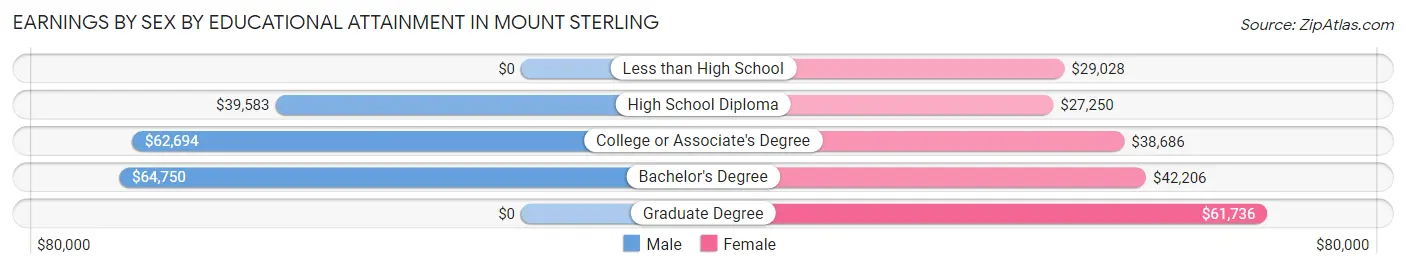
Earnings by Sex by Educational Attainment in Mount Sterling
Average earnings in Mount Sterling are $52,344 for men and $38,723 for women, a difference of 26.0%. Men with an educational attainment of bachelor's degree enjoy the highest average annual earnings of $64,750, while those with high school diploma education earn the least with $39,583. Women with an educational attainment of graduate degree earn the most with the average annual earnings of $61,736, while those with high school diploma education have the smallest earnings of $27,250.
| Educational Attainment | Male Income | Female Income |
| Less than High School | - | - |
| High School Diploma | $39,583 | $27,250 |
| College or Associate's Degree | $62,694 | $38,686 |
| Bachelor's Degree | $64,750 | $42,206 |
| Graduate Degree | - | - |
| Total | $52,344 | $38,723 |
Family Income in Mount Sterling
Family Income Brackets in Mount Sterling
According to the Mount Sterling family income data, there are 112 families falling into the $75,000 to $99,999 income range, which is the most common income bracket and makes up 22.9% of all families.
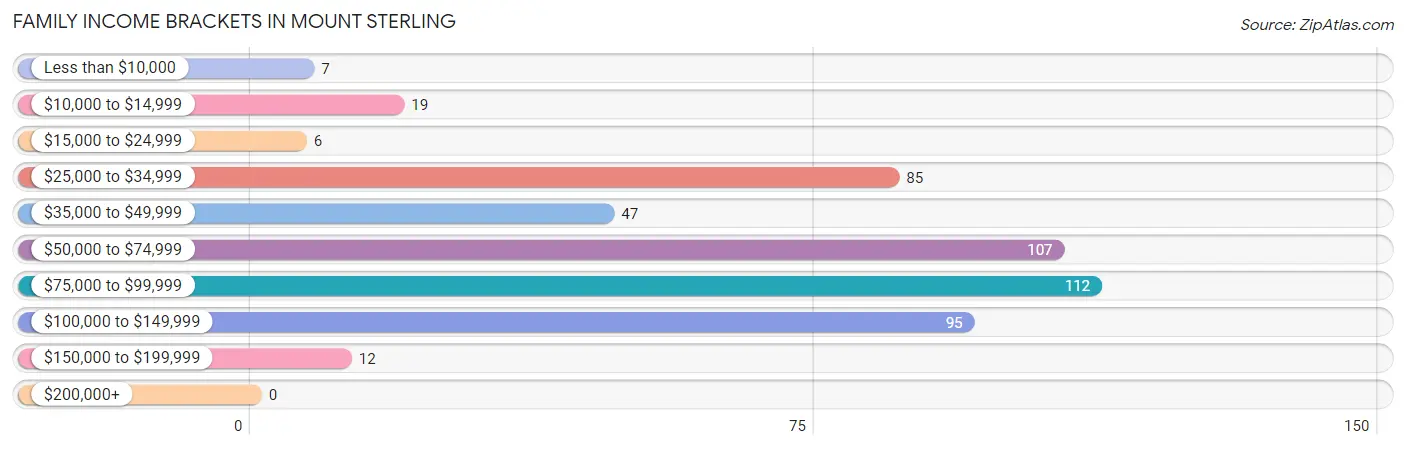
| Income Bracket | # Families | % Families |
| Less than $10,000 | 7 | 1.4% |
| $10,000 to $14,999 | 19 | 3.9% |
| $15,000 to $24,999 | 6 | 1.2% |
| $25,000 to $34,999 | 85 | 17.3% |
| $35,000 to $49,999 | 47 | 9.6% |
| $50,000 to $74,999 | 107 | 21.8% |
| $75,000 to $99,999 | 112 | 22.9% |
| $100,000 to $149,999 | 95 | 19.4% |
| $150,000 to $199,999 | 12 | 2.4% |
| $200,000+ | 0 | 0.0% |
Family Income by Famaliy Size in Mount Sterling
5-person families (25 | 5.1%) account for the highest median family income in Mount Sterling with $108,438 per family, while 2-person families (278 | 56.7%) have the highest median income of $36,806 per family member.
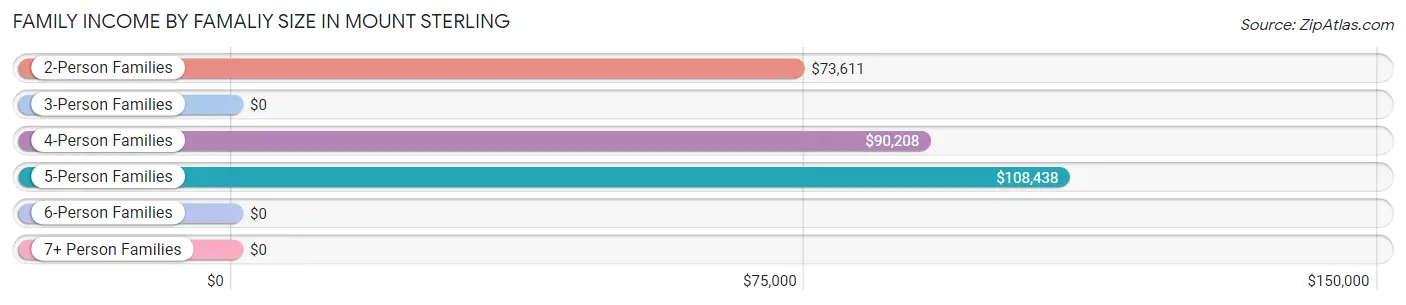
| Income Bracket | # Families | Median Income |
| 2-Person Families | 278 (56.7%) | $73,611 |
| 3-Person Families | 119 (24.3%) | $0 |
| 4-Person Families | 54 (11.0%) | $90,208 |
| 5-Person Families | 25 (5.1%) | $108,438 |
| 6-Person Families | 14 (2.9%) | $0 |
| 7+ Person Families | 0 (0.0%) | $0 |
| Total | 490 (100.0%) | $72,593 |
Family Income by Number of Earners in Mount Sterling
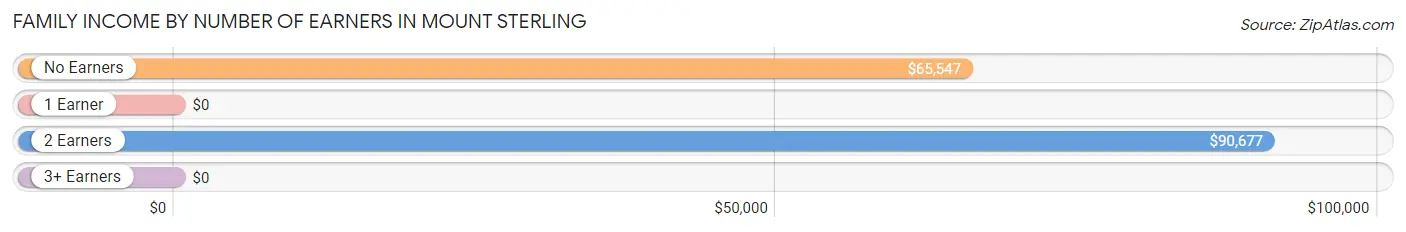
| Number of Earners | # Families | Median Income |
| No Earners | 45 (9.2%) | $65,547 |
| 1 Earner | 215 (43.9%) | $0 |
| 2 Earners | 217 (44.3%) | $90,677 |
| 3+ Earners | 13 (2.6%) | $0 |
| Total | 490 (100.0%) | $72,593 |
Household Income in Mount Sterling
Household Income Brackets in Mount Sterling
With 202 households falling in the category, the $50,000 to $74,999 income range is the most frequent in Mount Sterling, accounting for 20.1% of all households. In contrast, only 10 households (1.0%) fall into the $200,000+ income bracket, making it the least populous group.
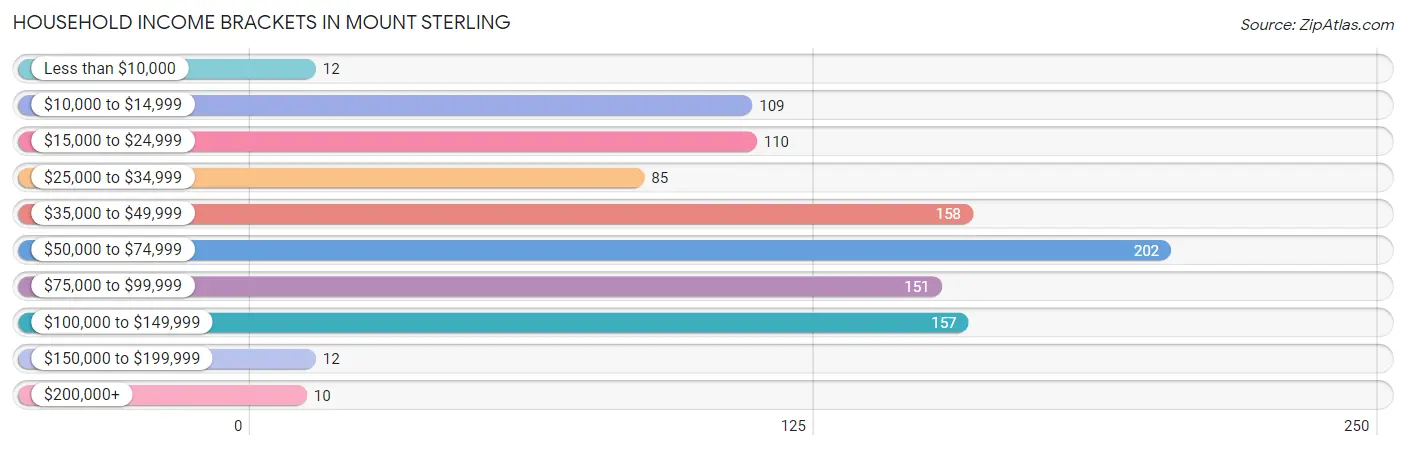
| Income Bracket | # Households | % Households |
| Less than $10,000 | 12 | 1.2% |
| $10,000 to $14,999 | 109 | 10.8% |
| $15,000 to $24,999 | 110 | 10.9% |
| $25,000 to $34,999 | 85 | 8.4% |
| $35,000 to $49,999 | 158 | 15.7% |
| $50,000 to $74,999 | 202 | 20.1% |
| $75,000 to $99,999 | 151 | 15.0% |
| $100,000 to $149,999 | 157 | 15.6% |
| $150,000 to $199,999 | 12 | 1.2% |
| $200,000+ | 10 | 1.0% |
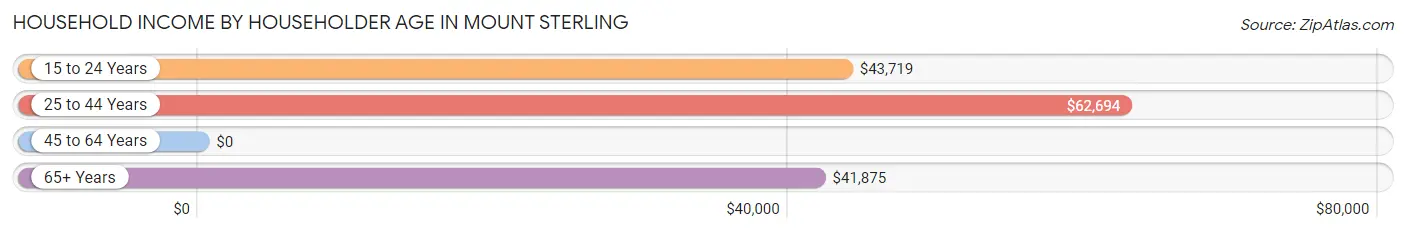
Household Income by Householder Age in Mount Sterling
The median household income in Mount Sterling is $55,000, with the highest median household income of $62,694 found in the 25 to 44 years age bracket for the primary householder. A total of 457 households (45.4%) fall into this category. Meanwhile, the 45 to 64 years age bracket for the primary householder has the lowest median household income of $0, with 297 households (29.5%) in this group.
| Income Bracket | # Households | Median Income |
| 15 to 24 Years | 99 (9.8%) | $43,719 |
| 25 to 44 Years | 457 (45.4%) | $62,694 |
| 45 to 64 Years | 297 (29.5%) | $0 |
| 65+ Years | 153 (15.2%) | $41,875 |
| Total | 1,006 (100.0%) | $55,000 |
Poverty in Mount Sterling
Income Below Poverty by Sex and Age in Mount Sterling
With 7.3% poverty level for males and 18.8% for females among the residents of Mount Sterling, 55 to 64 year old males and 16 and 17 year old females are the most vulnerable to poverty, with 33 males (35.9%) and 36 females (72.0%) in their respective age groups living below the poverty level.
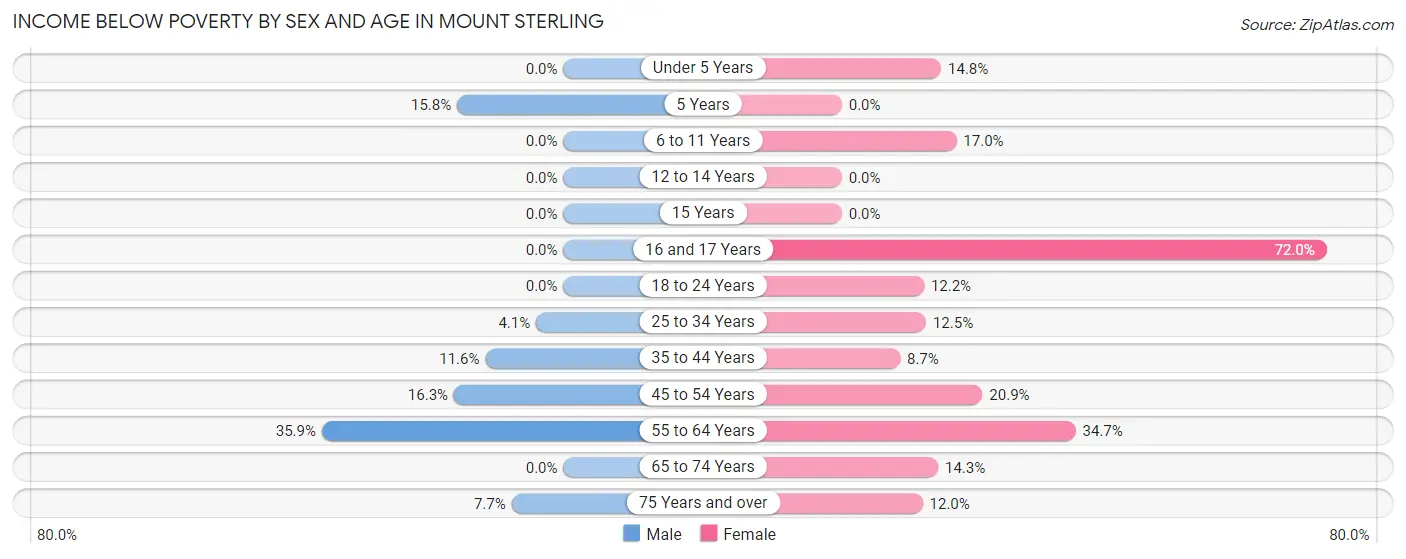
| Age Bracket | Male | Female |
| Under 5 Years | 0 (0.0%) | 9 (14.7%) |
| 5 Years | 3 (15.8%) | 0 (0.0%) |
| 6 to 11 Years | 0 (0.0%) | 8 (17.0%) |
| 12 to 14 Years | 0 (0.0%) | 0 (0.0%) |
| 15 Years | 0 (0.0%) | 0 (0.0%) |
| 16 and 17 Years | 0 (0.0%) | 36 (72.0%) |
| 18 to 24 Years | 0 (0.0%) | 10 (12.2%) |
| 25 to 34 Years | 9 (4.1%) | 18 (12.5%) |
| 35 to 44 Years | 19 (11.6%) | 16 (8.6%) |
| 45 to 54 Years | 13 (16.3%) | 19 (20.9%) |
| 55 to 64 Years | 33 (35.9%) | 50 (34.7%) |
| 65 to 74 Years | 0 (0.0%) | 6 (14.3%) |
| 75 Years and over | 4 (7.7%) | 12 (12.0%) |
| Total | 81 (7.3%) | 184 (18.8%) |
Income Above Poverty by Sex and Age in Mount Sterling
According to the poverty statistics in Mount Sterling, males aged under 5 years and females aged 5 years are the age groups that are most secure financially, with 100.0% of males and 100.0% of females in these age groups living above the poverty line.
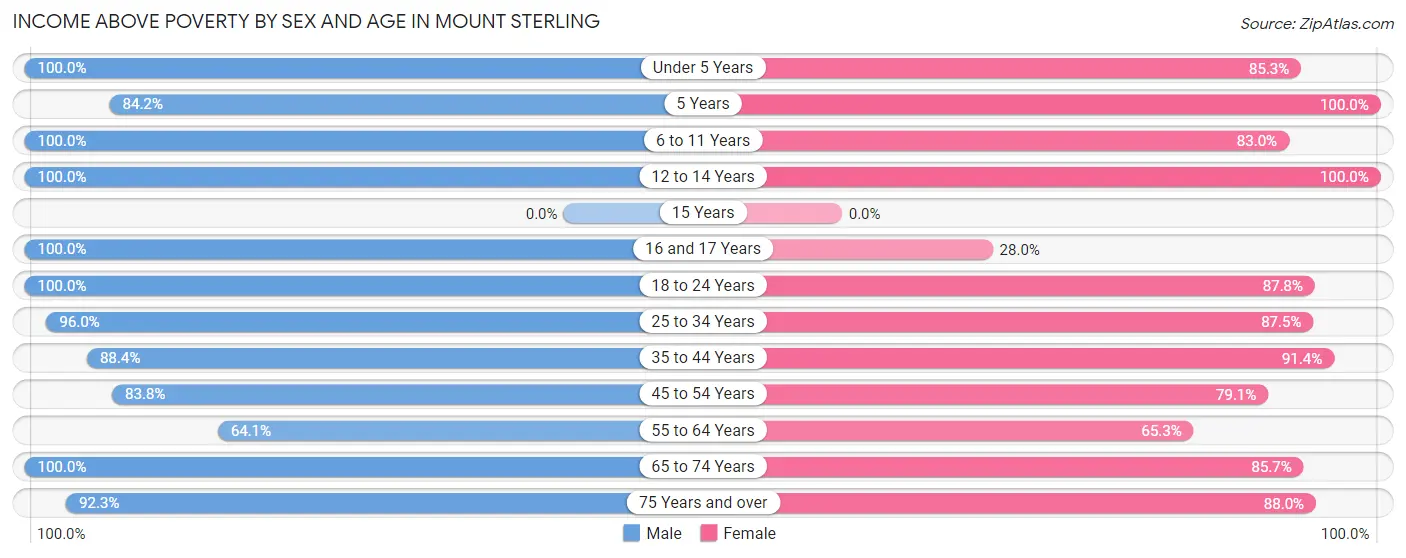
| Age Bracket | Male | Female |
| Under 5 Years | 105 (100.0%) | 52 (85.3%) |
| 5 Years | 16 (84.2%) | 16 (100.0%) |
| 6 to 11 Years | 170 (100.0%) | 39 (83.0%) |
| 12 to 14 Years | 44 (100.0%) | 19 (100.0%) |
| 15 Years | 0 (0.0%) | 0 (0.0%) |
| 16 and 17 Years | 22 (100.0%) | 14 (28.0%) |
| 18 to 24 Years | 113 (100.0%) | 72 (87.8%) |
| 25 to 34 Years | 213 (96.0%) | 126 (87.5%) |
| 35 to 44 Years | 145 (88.4%) | 169 (91.3%) |
| 45 to 54 Years | 67 (83.8%) | 72 (79.1%) |
| 55 to 64 Years | 59 (64.1%) | 94 (65.3%) |
| 65 to 74 Years | 27 (100.0%) | 36 (85.7%) |
| 75 Years and over | 48 (92.3%) | 88 (88.0%) |
| Total | 1,029 (92.7%) | 797 (81.2%) |
Income Below Poverty Among Married-Couple Families in Mount Sterling
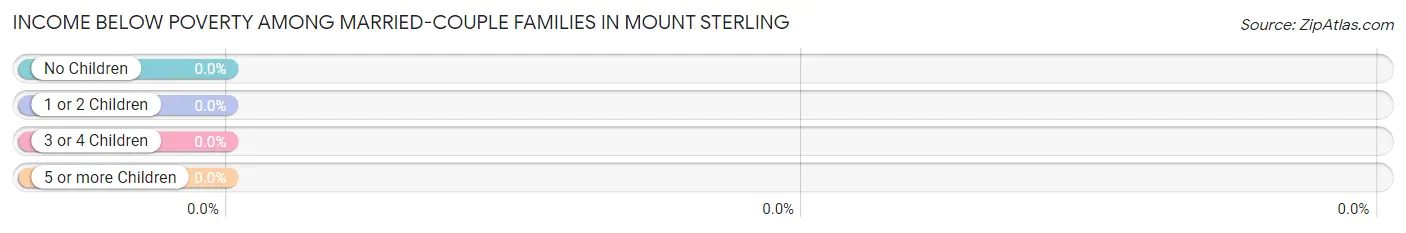
| Children | Above Poverty | Below Poverty |
| No Children | 167 (100.0%) | 0 (0.0%) |
| 1 or 2 Children | 88 (100.0%) | 0 (0.0%) |
| 3 or 4 Children | 22 (100.0%) | 0 (0.0%) |
| 5 or more Children | 0 (0.0%) | 0 (0.0%) |
| Total | 277 (100.0%) | 0 (0.0%) |
Income Below Poverty Among Single-Parent Households in Mount Sterling
According to the poverty data in Mount Sterling, 5.6% or 4 single-father households and 19.2% or 27 single-mother households are living below the poverty line. Among single-father households, those with 1 or 2 children have the highest poverty rate, with 4 households (5.8%) experiencing poverty. Likewise, among single-mother households, those with 5 or more children have the highest poverty rate, with 7 households (100.0%) falling below the poverty line.
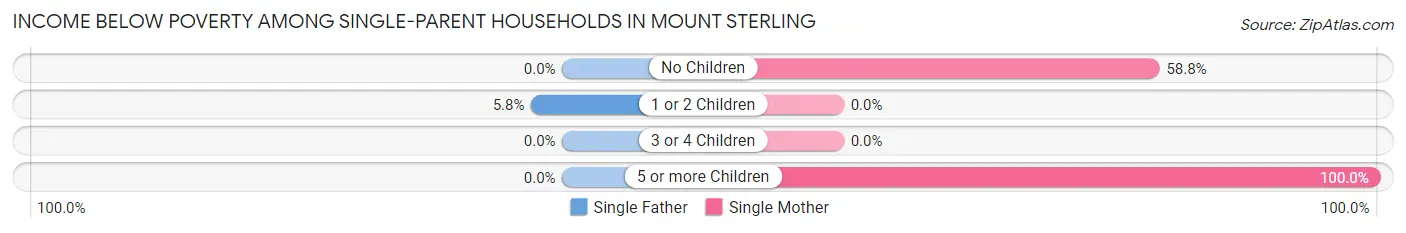
| Children | Single Father | Single Mother |
| No Children | 0 (0.0%) | 20 (58.8%) |
| 1 or 2 Children | 4 (5.8%) | 0 (0.0%) |
| 3 or 4 Children | 0 (0.0%) | 0 (0.0%) |
| 5 or more Children | 0 (0.0%) | 7 (100.0%) |
| Total | 4 (5.6%) | 27 (19.2%) |
Income Below Poverty Among Married-Couple vs Single-Parent Households in Mount Sterling
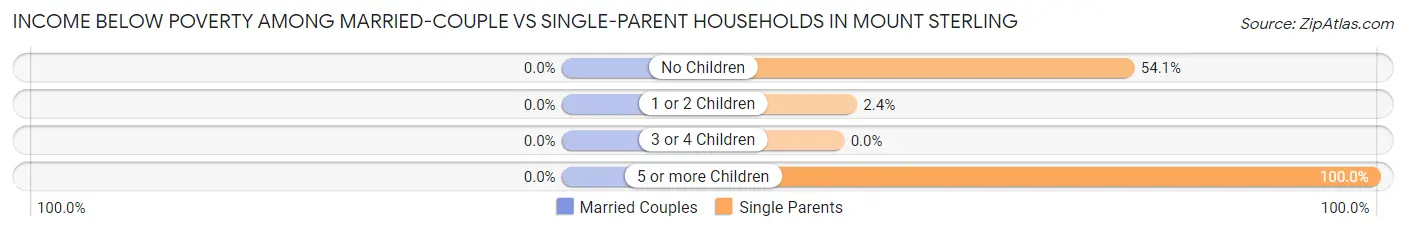
| Children | Married-Couple Families | Single-Parent Households |
| No Children | 0 (0.0%) | 20 (54.0%) |
| 1 or 2 Children | 0 (0.0%) | 4 (2.4%) |
| 3 or 4 Children | 0 (0.0%) | 0 (0.0%) |
| 5 or more Children | 0 (0.0%) | 7 (100.0%) |
| Total | 0 (0.0%) | 31 (14.5%) |
Race in Mount Sterling
The most populous races in Mount Sterling are White / Caucasian (2,115 | 97.2%), Hispanic or Latino (166 | 7.6%), and Some other Race (29 | 1.3%).
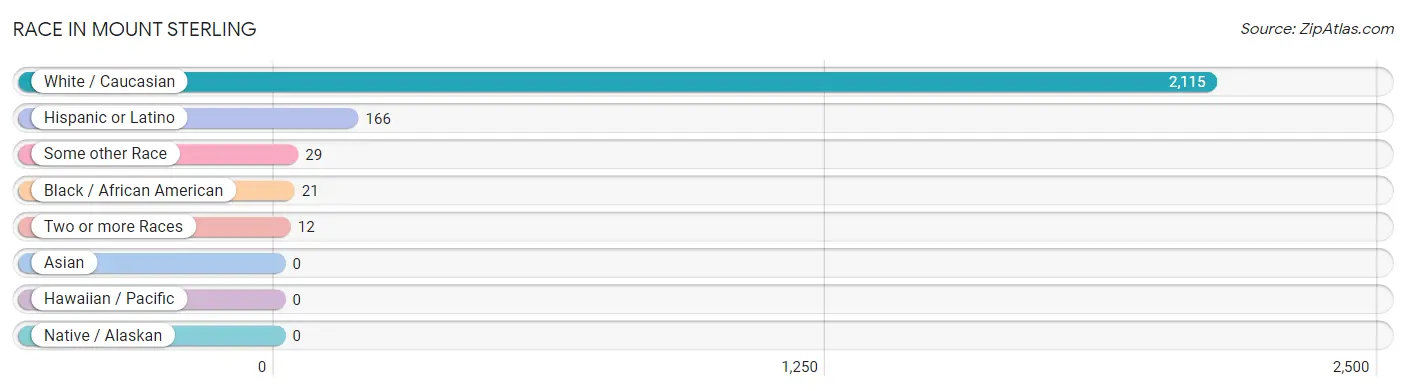
| Race | # Population | % Population |
| Asian | 0 | 0.0% |
| Black / African American | 21 | 1.0% |
| Hawaiian / Pacific | 0 | 0.0% |
| Hispanic or Latino | 166 | 7.6% |
| Native / Alaskan | 0 | 0.0% |
| White / Caucasian | 2,115 | 97.2% |
| Two or more Races | 12 | 0.5% |
| Some other Race | 29 | 1.3% |
| Total | 2,177 | 100.0% |
Ancestry in Mount Sterling
The most populous ancestries reported in Mount Sterling are German (435 | 20.0%), Irish (231 | 10.6%), English (218 | 10.0%), American (193 | 8.9%), and Mexican (137 | 6.3%), together accounting for 55.8% of all Mount Sterling residents.
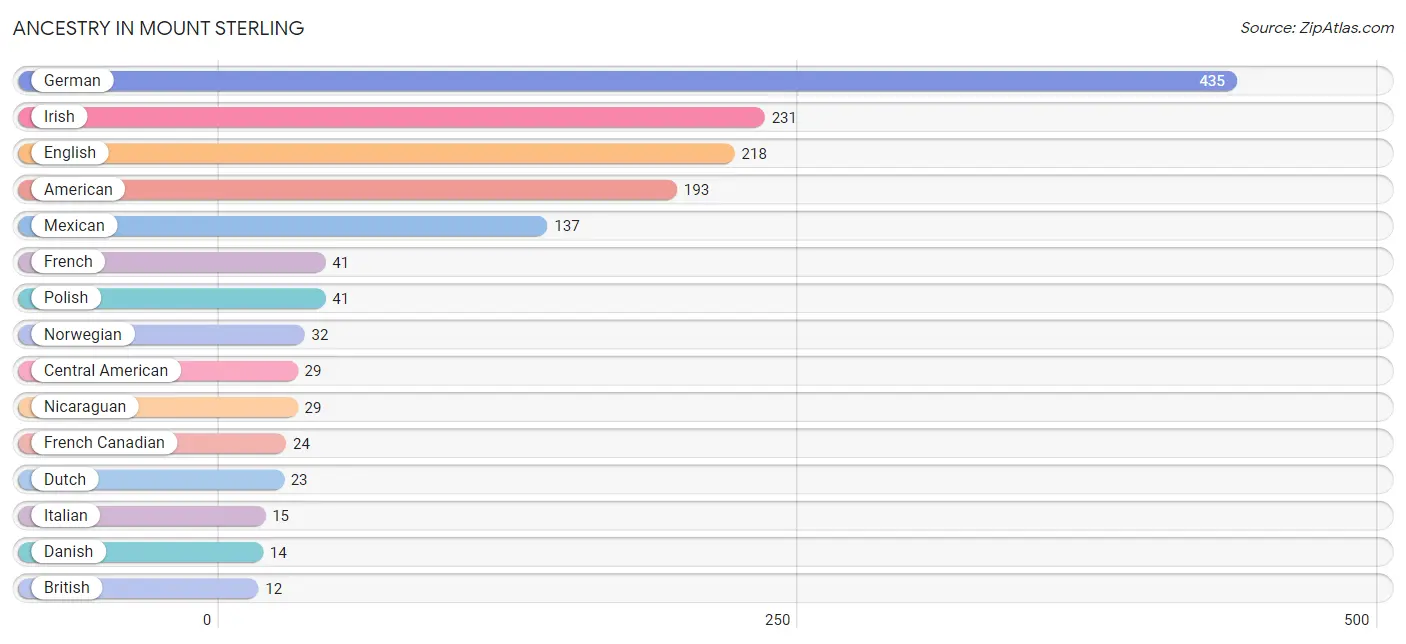
| Ancestry | # Population | % Population |
| American | 193 | 8.9% |
| Arab | 1 | 0.1% |
| British | 12 | 0.5% |
| Central American | 29 | 1.3% |
| Danish | 14 | 0.6% |
| Dutch | 23 | 1.1% |
| English | 218 | 10.0% |
| European | 9 | 0.4% |
| Finnish | 8 | 0.4% |
| French | 41 | 1.9% |
| French Canadian | 24 | 1.1% |
| German | 435 | 20.0% |
| Irish | 231 | 10.6% |
| Italian | 15 | 0.7% |
| Lebanese | 1 | 0.1% |
| Mexican | 137 | 6.3% |
| Nicaraguan | 29 | 1.3% |
| Norwegian | 32 | 1.5% |
| Polish | 41 | 1.9% |
| Russian | 7 | 0.3% |
| Scandinavian | 8 | 0.4% |
| Scottish | 3 | 0.1% |
| Serbian | 11 | 0.5% |
| Welsh | 11 | 0.5% | View All 24 Rows |
Immigrants in Mount Sterling
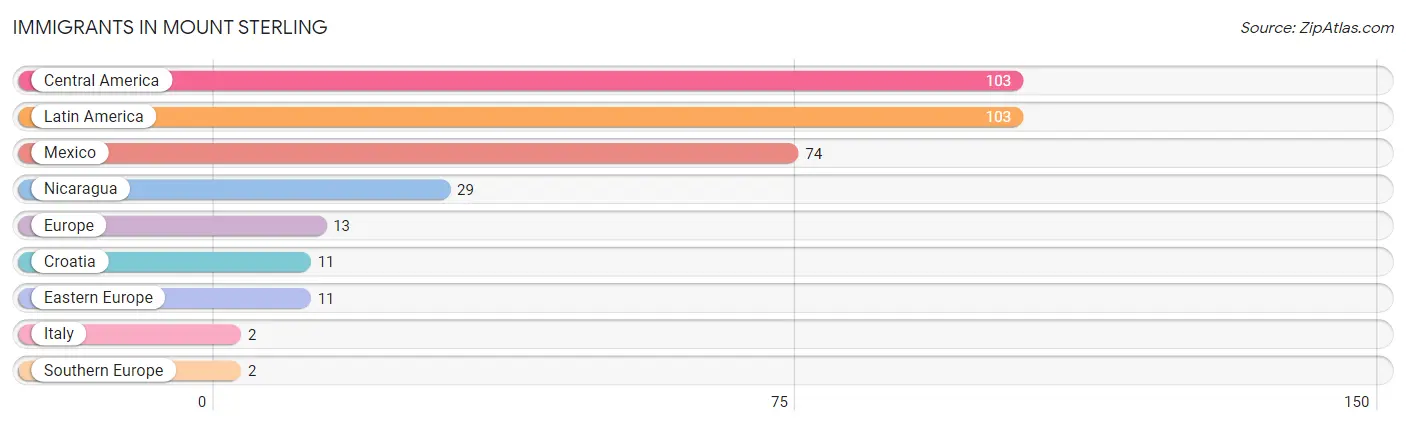
The most numerous immigrant groups reported in Mount Sterling came from Central America (103 | 4.7%), Latin America (103 | 4.7%), Mexico (74 | 3.4%), Nicaragua (29 | 1.3%), and Europe (13 | 0.6%), together accounting for 14.8% of all Mount Sterling residents.
| Immigration Origin | # Population | % Population |
| Central America | 103 | 4.7% |
| Croatia | 11 | 0.5% |
| Eastern Europe | 11 | 0.5% |
| Europe | 13 | 0.6% |
| Italy | 2 | 0.1% |
| Latin America | 103 | 4.7% |
| Mexico | 74 | 3.4% |
| Nicaragua | 29 | 1.3% |
| Southern Europe | 2 | 0.1% | View All 9 Rows |
Sex and Age in Mount Sterling
Sex and Age in Mount Sterling
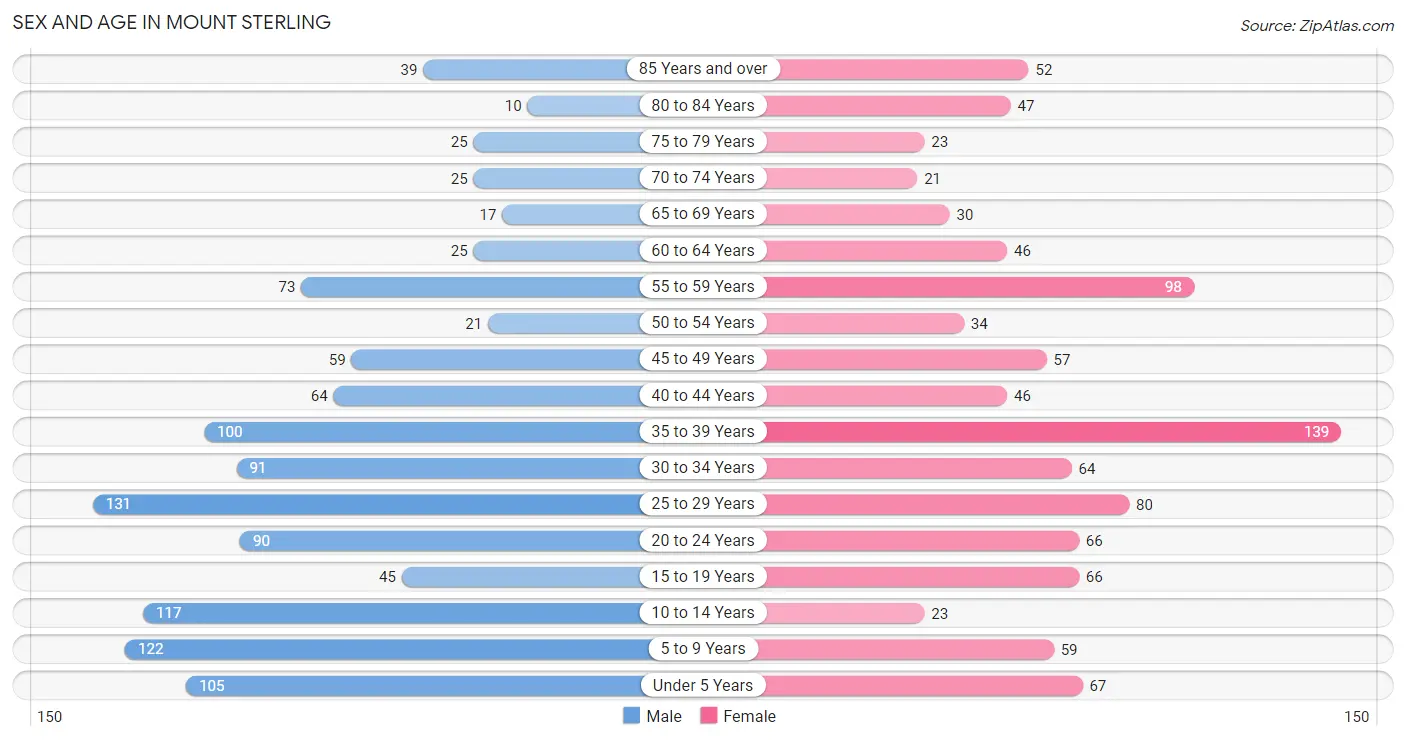
The most populous age groups in Mount Sterling are 25 to 29 Years (131 | 11.3%) for men and 35 to 39 Years (139 | 13.7%) for women.
| Age Bracket | Male | Female |
| Under 5 Years | 105 (9.1%) | 67 (6.6%) |
| 5 to 9 Years | 122 (10.5%) | 59 (5.8%) |
| 10 to 14 Years | 117 (10.1%) | 23 (2.3%) |
| 15 to 19 Years | 45 (3.9%) | 66 (6.5%) |
| 20 to 24 Years | 90 (7.8%) | 66 (6.5%) |
| 25 to 29 Years | 131 (11.3%) | 80 (7.9%) |
| 30 to 34 Years | 91 (7.9%) | 64 (6.3%) |
| 35 to 39 Years | 100 (8.6%) | 139 (13.7%) |
| 40 to 44 Years | 64 (5.5%) | 46 (4.5%) |
| 45 to 49 Years | 59 (5.1%) | 57 (5.6%) |
| 50 to 54 Years | 21 (1.8%) | 34 (3.3%) |
| 55 to 59 Years | 73 (6.3%) | 98 (9.6%) |
| 60 to 64 Years | 25 (2.2%) | 46 (4.5%) |
| 65 to 69 Years | 17 (1.5%) | 30 (2.9%) |
| 70 to 74 Years | 25 (2.2%) | 21 (2.1%) |
| 75 to 79 Years | 25 (2.2%) | 23 (2.3%) |
| 80 to 84 Years | 10 (0.9%) | 47 (4.6%) |
| 85 Years and over | 39 (3.4%) | 52 (5.1%) |
| Total | 1,159 (100.0%) | 1,018 (100.0%) |
Families and Households in Mount Sterling
Median Family Size in Mount Sterling
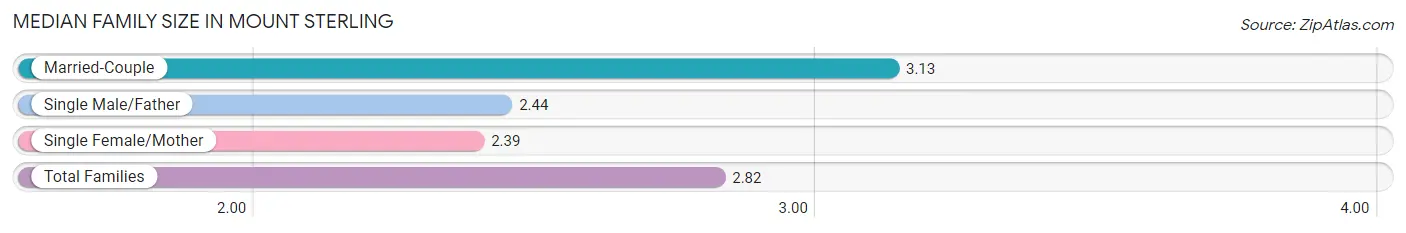
The median family size in Mount Sterling is 2.82 persons per family, with married-couple families (277 | 56.5%) accounting for the largest median family size of 3.13 persons per family. On the other hand, single female/mother families (141 | 28.8%) represent the smallest median family size with 2.39 persons per family.
| Family Type | # Families | Family Size |
| Married-Couple | 277 (56.5%) | 3.13 |
| Single Male/Father | 72 (14.7%) | 2.44 |
| Single Female/Mother | 141 (28.8%) | 2.39 |
| Total Families | 490 (100.0%) | 2.82 |
Median Household Size in Mount Sterling
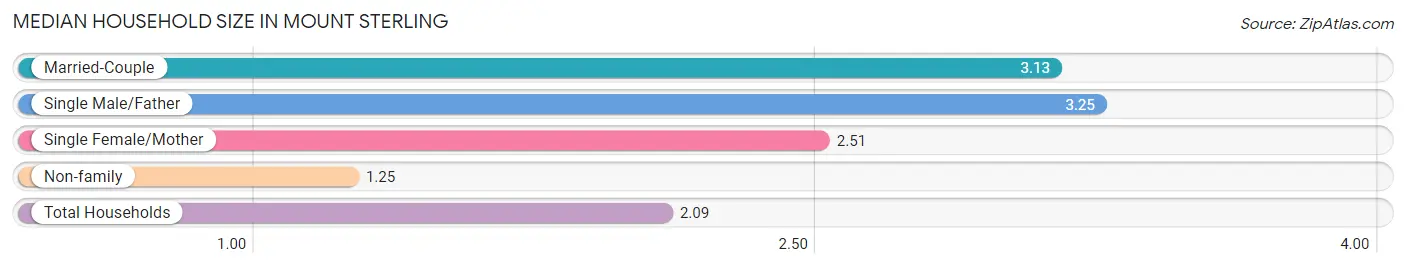
The median household size in Mount Sterling is 2.09 persons per household, with single male/father households (72 | 7.2%) accounting for the largest median household size of 3.25 persons per household. non-family households (516 | 51.3%) represent the smallest median household size with 1.25 persons per household.
| Household Type | # Households | Household Size |
| Married-Couple | 277 (27.5%) | 3.13 |
| Single Male/Father | 72 (7.2%) | 3.25 |
| Single Female/Mother | 141 (14.0%) | 2.51 |
| Non-family | 516 (51.3%) | 1.25 |
| Total Households | 1,006 (100.0%) | 2.09 |
Household Size by Marriage Status in Mount Sterling
Out of a total of 1,006 households in Mount Sterling, 490 (48.7%) are family households, while 516 (51.3%) are nonfamily households. The most numerous type of family households are 2-person households, comprising 249, and the most common type of nonfamily households are 1-person households, comprising 431.
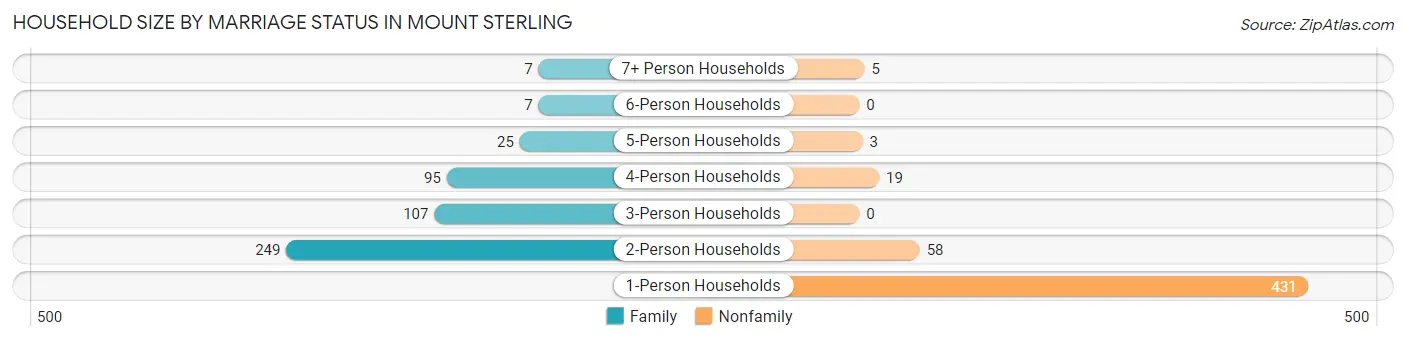
| Household Size | Family Households | Nonfamily Households |
| 1-Person Households | - | 431 (42.8%) |
| 2-Person Households | 249 (24.7%) | 58 (5.8%) |
| 3-Person Households | 107 (10.6%) | 0 (0.0%) |
| 4-Person Households | 95 (9.4%) | 19 (1.9%) |
| 5-Person Households | 25 (2.5%) | 3 (0.3%) |
| 6-Person Households | 7 (0.7%) | 0 (0.0%) |
| 7+ Person Households | 7 (0.7%) | 5 (0.5%) |
| Total | 490 (48.7%) | 516 (51.3%) |
Female Fertility in Mount Sterling
Fertility by Age in Mount Sterling
Average fertility rate in Mount Sterling is 142.0 births per 1,000 women. Women in the age bracket of 20 to 34 years have the highest fertility rate with 343.0 births per 1,000 women. Women in the age bracket of 20 to 34 years acount for 96.0% of all women with births.
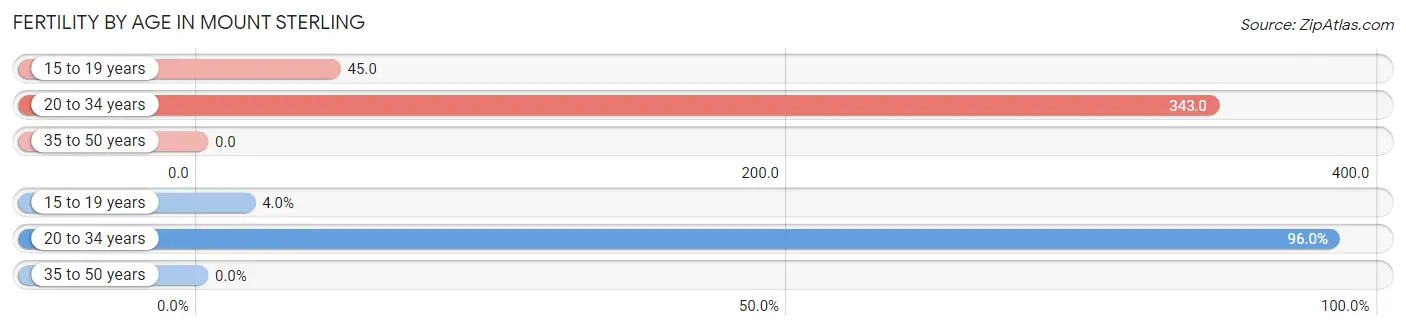
| Age Bracket | Women with Births | Births / 1,000 Women |
| 15 to 19 years | 3 (4.0%) | 45.0 |
| 20 to 34 years | 72 (96.0%) | 343.0 |
| 35 to 50 years | 0 (0.0%) | 0.0 |
| Total | 75 (100.0%) | 142.0 |
Fertility by Age by Marriage Status in Mount Sterling
25.3% of women with births (75) in Mount Sterling are married. The highest percentage of unmarried women with births falls into 15 to 19 years age bracket with 100.0% of them unmarried at the time of birth, while the lowest percentage of unmarried women with births belong to 20 to 34 years age bracket with 73.6% of them unmarried.
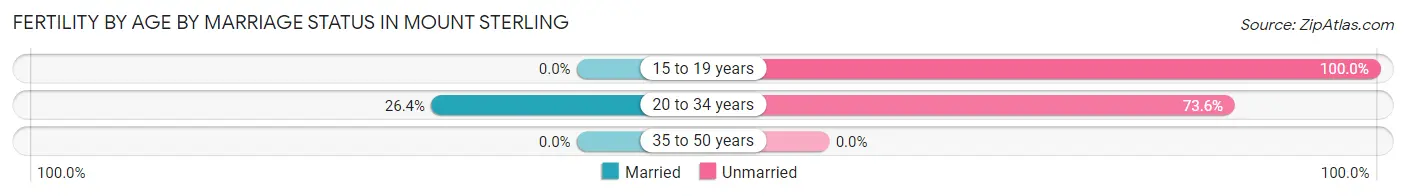
| Age Bracket | Married | Unmarried |
| 15 to 19 years | 0 (0.0%) | 3 (100.0%) |
| 20 to 34 years | 19 (26.4%) | 53 (73.6%) |
| 35 to 50 years | 0 (0.0%) | 0 (0.0%) |
| Total | 19 (25.3%) | 56 (74.7%) |
Fertility by Education in Mount Sterling
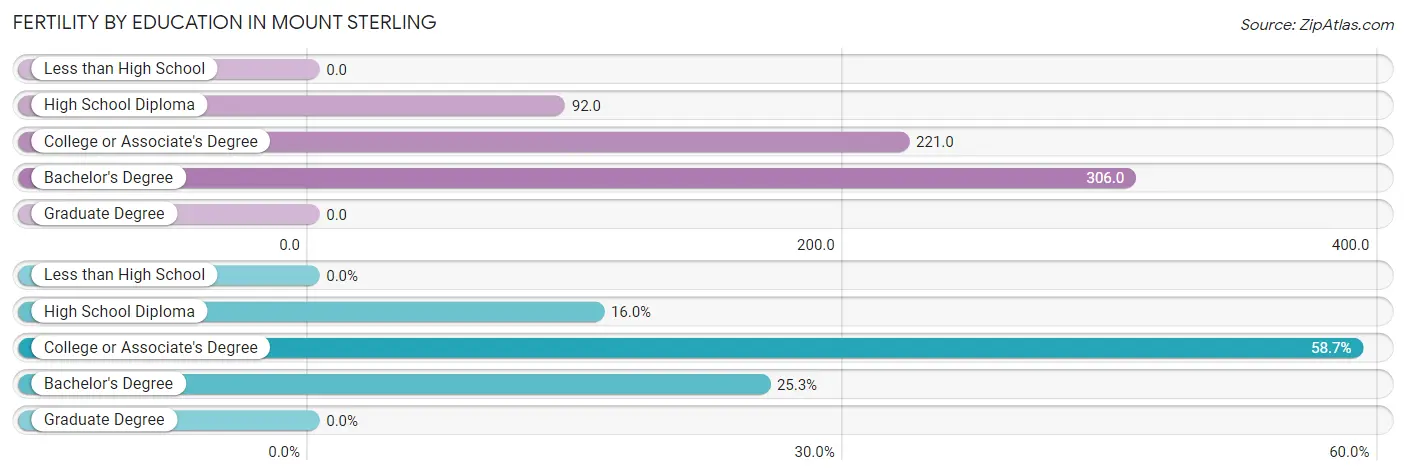
| Educational Attainment | Women with Births | Births / 1,000 Women |
| Less than High School | 0 (0.0%) | 0.0 |
| High School Diploma | 12 (16.0%) | 92.0 |
| College or Associate's Degree | 44 (58.7%) | 221.0 |
| Bachelor's Degree | 19 (25.3%) | 306.0 |
| Graduate Degree | 0 (0.0%) | 0.0 |
| Total | 75 (100.0%) | 142.0 |
Fertility by Education by Marriage Status in Mount Sterling
74.7% of women with births in Mount Sterling are unmarried. Women with the educational attainment of bachelor's degree are most likely to be married with 47.4% of them married at childbirth, while women with the educational attainment of high school diploma are least likely to be married with 100.0% of them unmarried at childbirth.
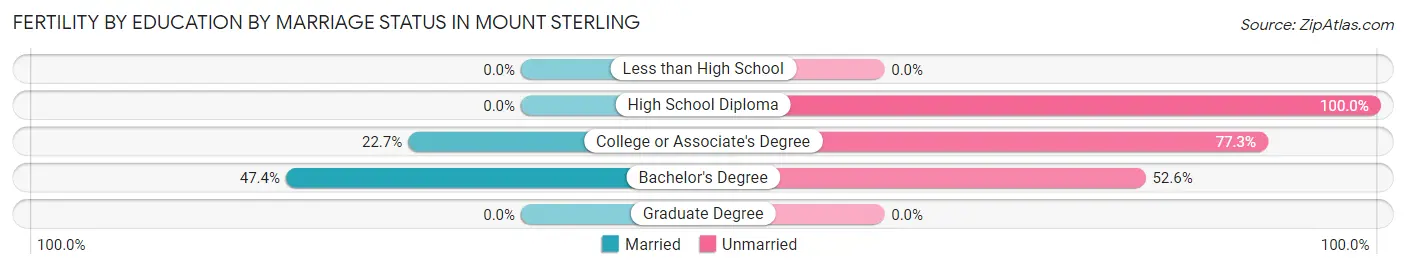
| Educational Attainment | Married | Unmarried |
| Less than High School | 0 (0.0%) | 0 (0.0%) |
| High School Diploma | 0 (0.0%) | 12 (100.0%) |
| College or Associate's Degree | 10 (22.7%) | 34 (77.3%) |
| Bachelor's Degree | 9 (47.4%) | 10 (52.6%) |
| Graduate Degree | 0 (0.0%) | 0 (0.0%) |
| Total | 19 (25.3%) | 56 (74.7%) |
Employment Characteristics in Mount Sterling
Employment by Class of Employer in Mount Sterling
Among the 1,095 employed individuals in Mount Sterling, private company employees (726 | 66.3%), not-for-profit organizations (161 | 14.7%), and state government employees (75 | 6.9%) make up the most common classes of employment.
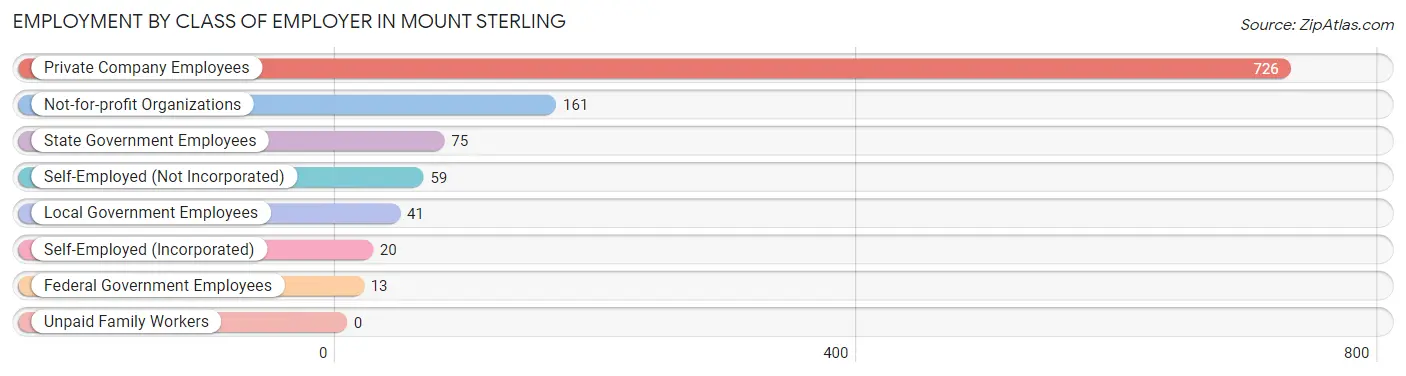
| Employer Class | # Employees | % Employees |
| Private Company Employees | 726 | 66.3% |
| Self-Employed (Incorporated) | 20 | 1.8% |
| Self-Employed (Not Incorporated) | 59 | 5.4% |
| Not-for-profit Organizations | 161 | 14.7% |
| Local Government Employees | 41 | 3.7% |
| State Government Employees | 75 | 6.9% |
| Federal Government Employees | 13 | 1.2% |
| Unpaid Family Workers | 0 | 0.0% |
| Total | 1,095 | 100.0% |
Employment Status by Age in Mount Sterling
According to the labor force statistics for Mount Sterling, out of the total population over 16 years of age (1,684), 68.0% or 1,145 individuals are in the labor force, with 3.1% or 35 of them unemployed. The age group with the highest labor force participation rate is 25 to 29 years, with 100.0% or 211 individuals in the labor force. Within the labor force, the 20 to 24 years age range has the highest percentage of unemployed individuals, with 17.5% or 25 of them being unemployed.
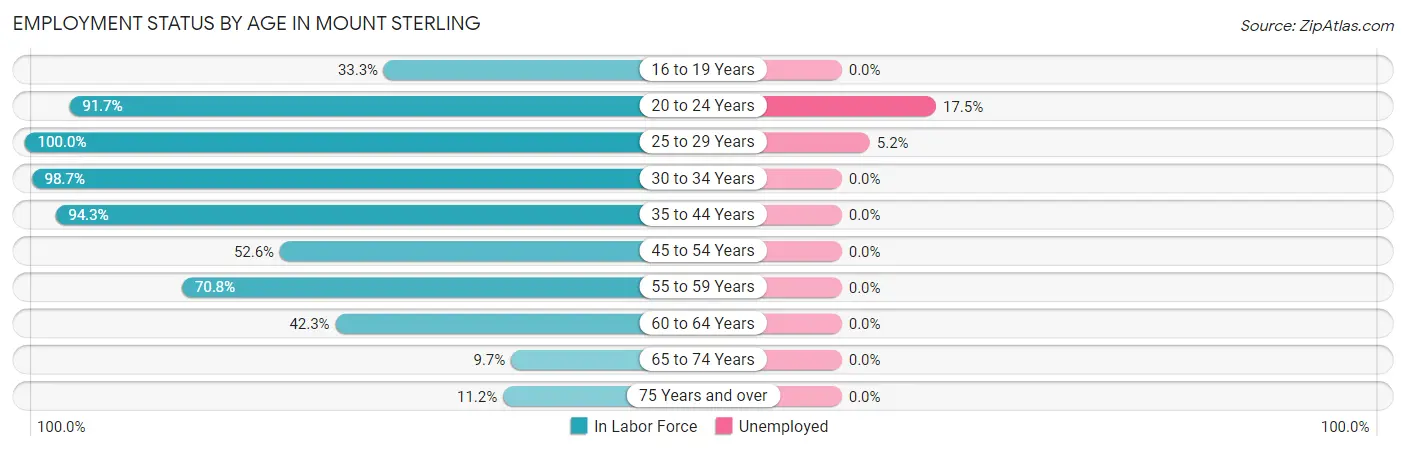
| Age Bracket | In Labor Force | Unemployed |
| 16 to 19 Years | 37 (33.3%) | 0 (0.0%) |
| 20 to 24 Years | 143 (91.7%) | 25 (17.5%) |
| 25 to 29 Years | 211 (100.0%) | 11 (5.2%) |
| 30 to 34 Years | 153 (98.7%) | 0 (0.0%) |
| 35 to 44 Years | 329 (94.3%) | 0 (0.0%) |
| 45 to 54 Years | 90 (52.6%) | 0 (0.0%) |
| 55 to 59 Years | 121 (70.8%) | 0 (0.0%) |
| 60 to 64 Years | 30 (42.3%) | 0 (0.0%) |
| 65 to 74 Years | 9 (9.7%) | 0 (0.0%) |
| 75 Years and over | 22 (11.2%) | 0 (0.0%) |
| Total | 1,145 (68.0%) | 35 (3.1%) |
Employment Status by Educational Attainment in Mount Sterling
According to labor force statistics for Mount Sterling, 82.8% of individuals (934) out of the total population between 25 and 64 years of age (1,128) are in the labor force, with 1.2% or 11 of them being unemployed. The group with the highest labor force participation rate are those with the educational attainment of bachelor's degree or higher, with 97.8% or 222 individuals in the labor force. Within the labor force, individuals with high school diploma education have the highest percentage of unemployment, with 3.5% or 11 of them being unemployed.
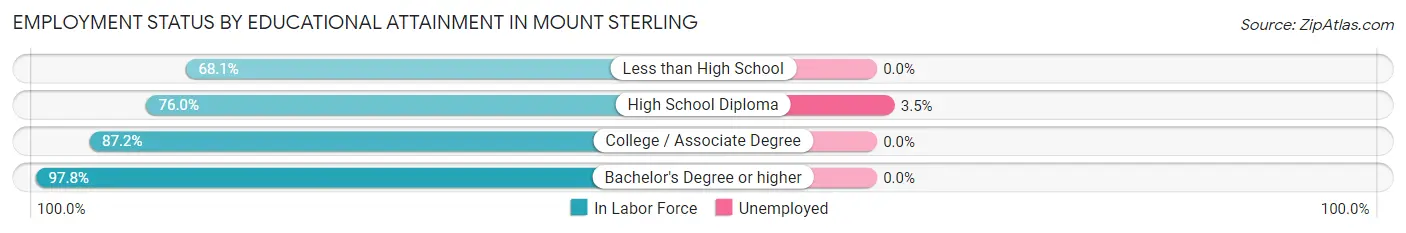
| Educational Attainment | In Labor Force | Unemployed |
| Less than High School | 98 (68.1%) | 0 (0.0%) |
| High School Diploma | 314 (76.0%) | 14 (3.5%) |
| College / Associate Degree | 300 (87.2%) | 0 (0.0%) |
| Bachelor's Degree or higher | 222 (97.8%) | 0 (0.0%) |
| Total | 934 (82.8%) | 14 (1.2%) |
Employment Occupations by Sex in Mount Sterling
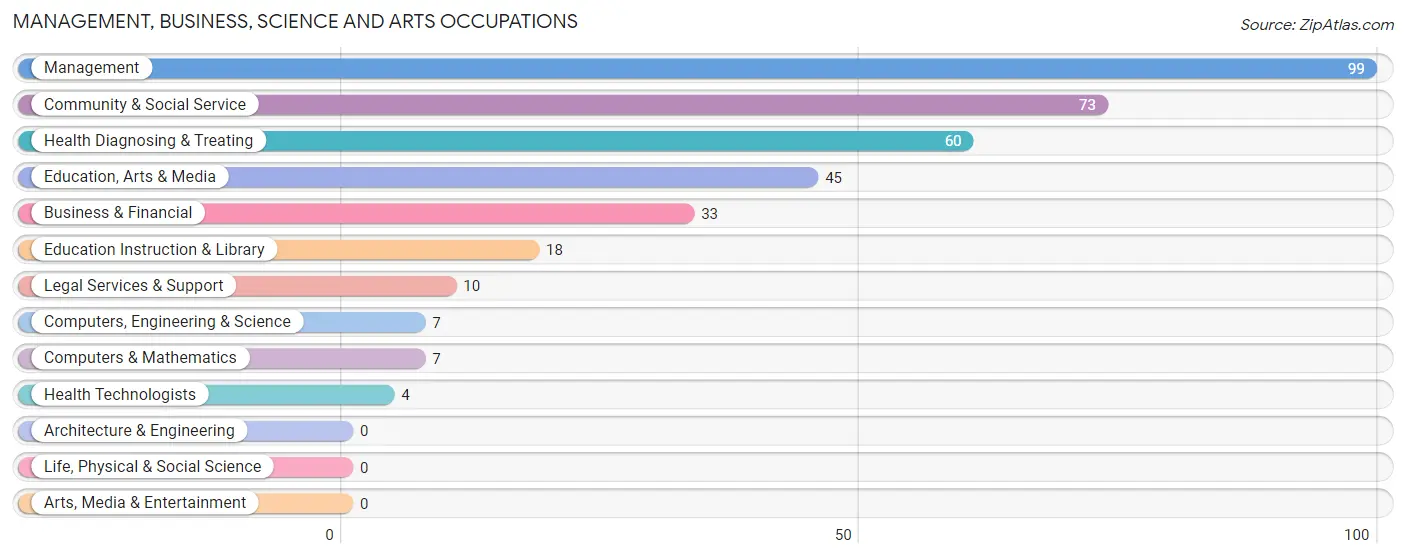
Management, Business, Science and Arts Occupations
The most common Management, Business, Science and Arts occupations in Mount Sterling are Management (99 | 8.9%), Community & Social Service (73 | 6.6%), Health Diagnosing & Treating (60 | 5.4%), Education, Arts & Media (45 | 4.1%), and Business & Financial (33 | 3.0%).
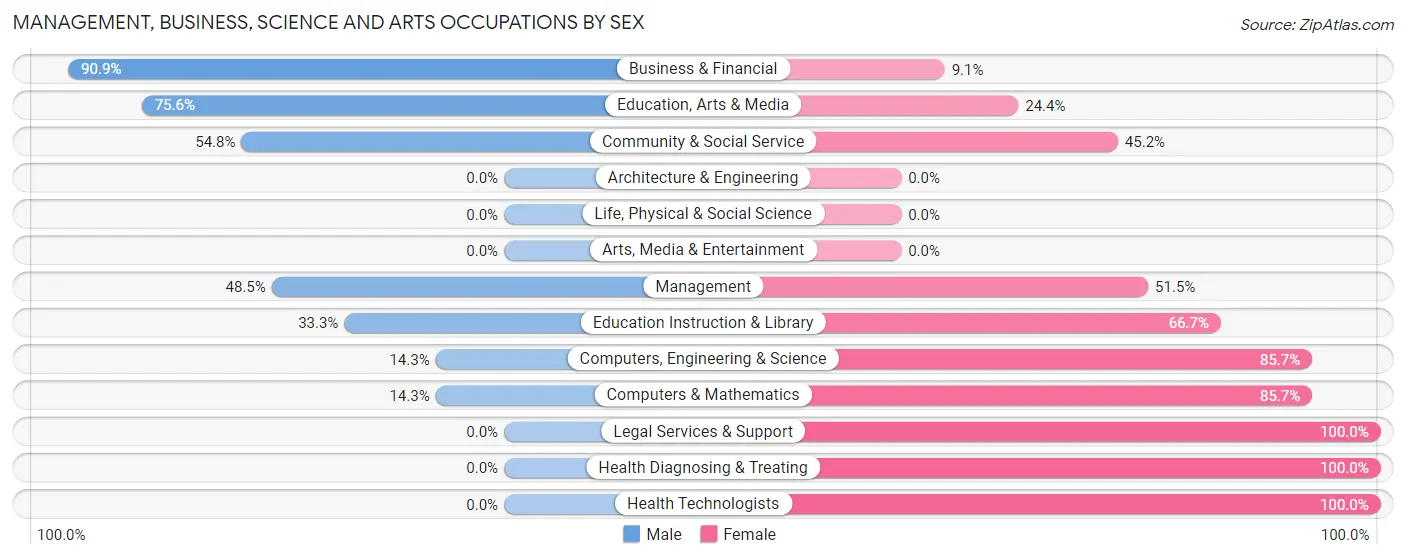
Management, Business, Science and Arts Occupations by Sex
Within the Management, Business, Science and Arts occupations in Mount Sterling, the most male-oriented occupations are Business & Financial (90.9%), Education, Arts & Media (75.6%), and Community & Social Service (54.8%), while the most female-oriented occupations are Legal Services & Support (100.0%), Health Diagnosing & Treating (100.0%), and Health Technologists (100.0%).
| Occupation | Male | Female |
| Management | 48 (48.5%) | 51 (51.5%) |
| Business & Financial | 30 (90.9%) | 3 (9.1%) |
| Computers, Engineering & Science | 1 (14.3%) | 6 (85.7%) |
| Computers & Mathematics | 1 (14.3%) | 6 (85.7%) |
| Architecture & Engineering | 0 (0.0%) | 0 (0.0%) |
| Life, Physical & Social Science | 0 (0.0%) | 0 (0.0%) |
| Community & Social Service | 40 (54.8%) | 33 (45.2%) |
| Education, Arts & Media | 34 (75.6%) | 11 (24.4%) |
| Legal Services & Support | 0 (0.0%) | 10 (100.0%) |
| Education Instruction & Library | 6 (33.3%) | 12 (66.7%) |
| Arts, Media & Entertainment | 0 (0.0%) | 0 (0.0%) |
| Health Diagnosing & Treating | 0 (0.0%) | 60 (100.0%) |
| Health Technologists | 0 (0.0%) | 4 (100.0%) |
| Total (Category) | 119 (43.8%) | 153 (56.2%) |
| Total (Overall) | 589 (53.1%) | 520 (46.9%) |
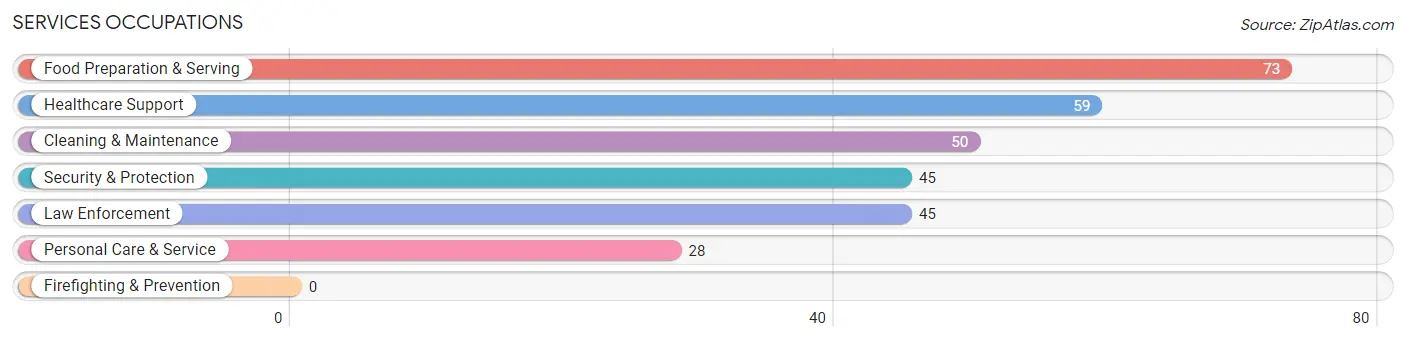
Services Occupations
The most common Services occupations in Mount Sterling are Food Preparation & Serving (73 | 6.6%), Healthcare Support (59 | 5.3%), Cleaning & Maintenance (50 | 4.5%), Security & Protection (45 | 4.1%), and Law Enforcement (45 | 4.1%).
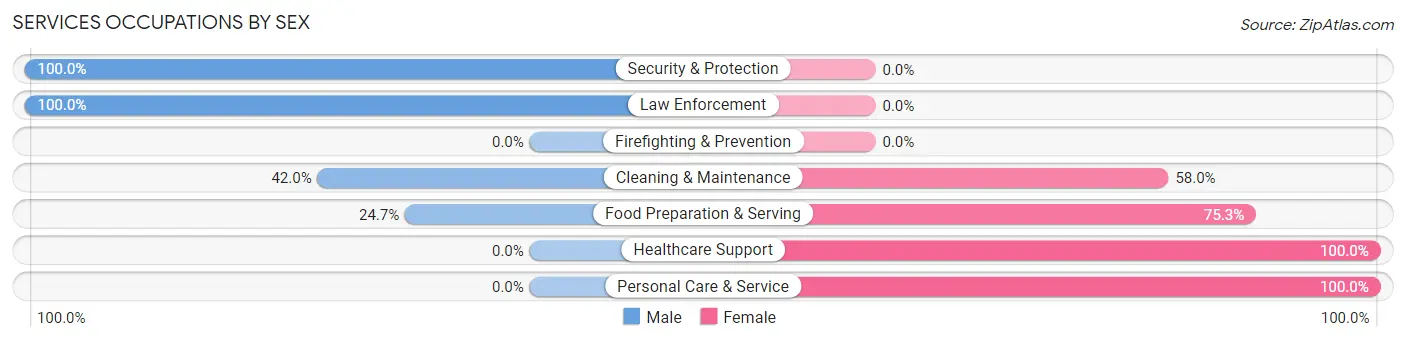
Services Occupations by Sex
Within the Services occupations in Mount Sterling, the most male-oriented occupations are Security & Protection (100.0%), Law Enforcement (100.0%), and Cleaning & Maintenance (42.0%), while the most female-oriented occupations are Healthcare Support (100.0%), Personal Care & Service (100.0%), and Food Preparation & Serving (75.3%).
| Occupation | Male | Female |
| Healthcare Support | 0 (0.0%) | 59 (100.0%) |
| Security & Protection | 45 (100.0%) | 0 (0.0%) |
| Firefighting & Prevention | 0 (0.0%) | 0 (0.0%) |
| Law Enforcement | 45 (100.0%) | 0 (0.0%) |
| Food Preparation & Serving | 18 (24.7%) | 55 (75.3%) |
| Cleaning & Maintenance | 21 (42.0%) | 29 (58.0%) |
| Personal Care & Service | 0 (0.0%) | 28 (100.0%) |
| Total (Category) | 84 (32.9%) | 171 (67.1%) |
| Total (Overall) | 589 (53.1%) | 520 (46.9%) |
Sales and Office Occupations
The most common Sales and Office occupations in Mount Sterling are Office & Administration (179 | 16.1%), and Sales & Related (68 | 6.1%).
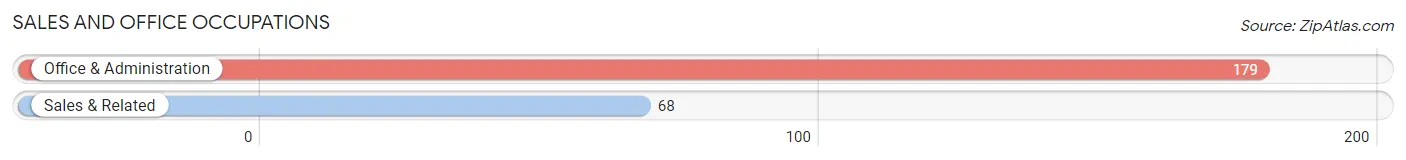
Sales and Office Occupations by Sex
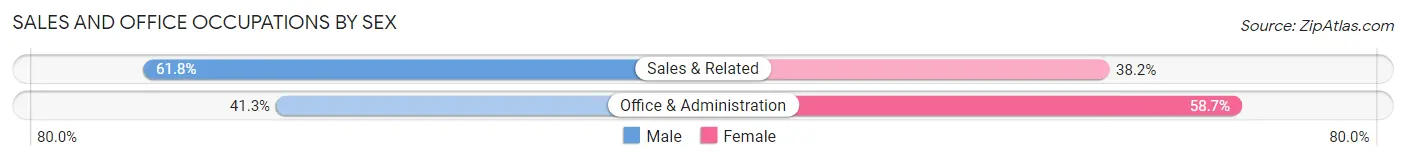
| Occupation | Male | Female |
| Sales & Related | 42 (61.8%) | 26 (38.2%) |
| Office & Administration | 74 (41.3%) | 105 (58.7%) |
| Total (Category) | 116 (47.0%) | 131 (53.0%) |
| Total (Overall) | 589 (53.1%) | 520 (46.9%) |
Natural Resources, Construction and Maintenance Occupations
The most common Natural Resources, Construction and Maintenance occupations in Mount Sterling are Construction & Extraction (91 | 8.2%), and Installation, Maintenance & Repair (64 | 5.8%).
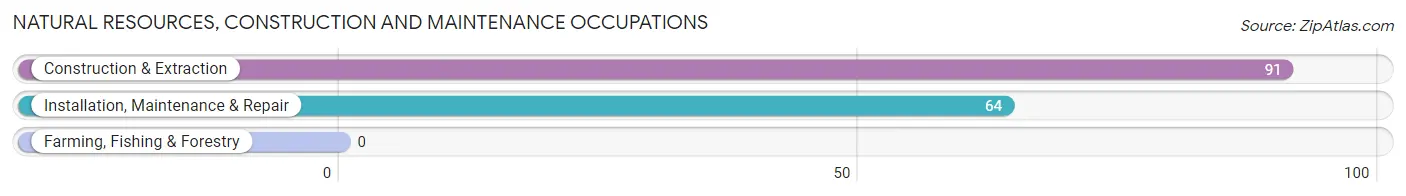
Natural Resources, Construction and Maintenance Occupations by Sex
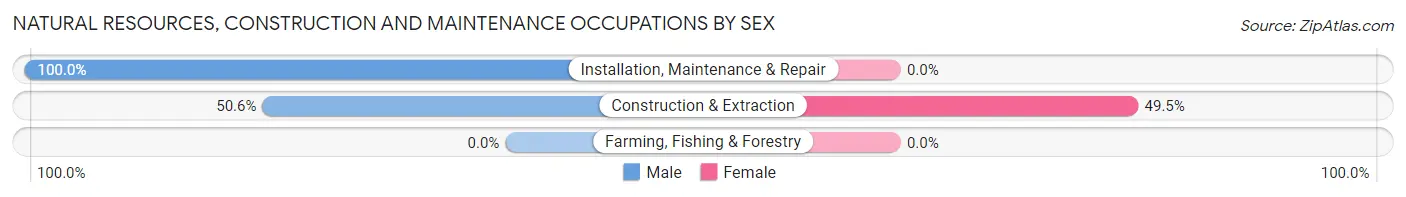
| Occupation | Male | Female |
| Farming, Fishing & Forestry | 0 (0.0%) | 0 (0.0%) |
| Construction & Extraction | 46 (50.5%) | 45 (49.4%) |
| Installation, Maintenance & Repair | 64 (100.0%) | 0 (0.0%) |
| Total (Category) | 110 (71.0%) | 45 (29.0%) |
| Total (Overall) | 589 (53.1%) | 520 (46.9%) |
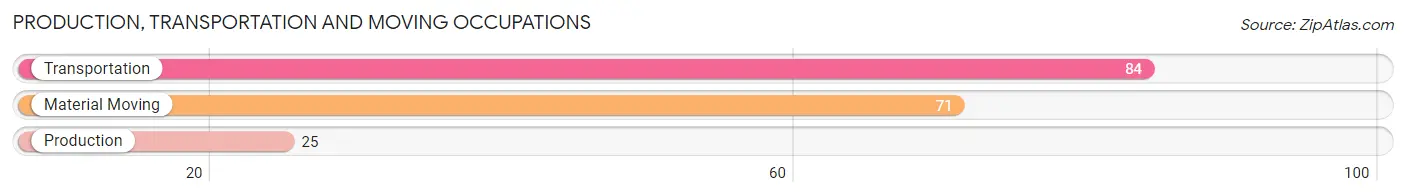
Production, Transportation and Moving Occupations
The most common Production, Transportation and Moving occupations in Mount Sterling are Transportation (84 | 7.6%), Material Moving (71 | 6.4%), and Production (25 | 2.2%).
Production, Transportation and Moving Occupations by Sex
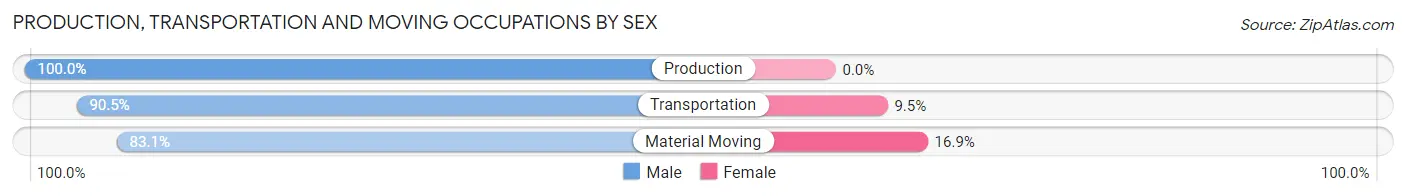
| Occupation | Male | Female |
| Production | 25 (100.0%) | 0 (0.0%) |
| Transportation | 76 (90.5%) | 8 (9.5%) |
| Material Moving | 59 (83.1%) | 12 (16.9%) |
| Total (Category) | 160 (88.9%) | 20 (11.1%) |
| Total (Overall) | 589 (53.1%) | 520 (46.9%) |
Employment Industries by Sex in Mount Sterling
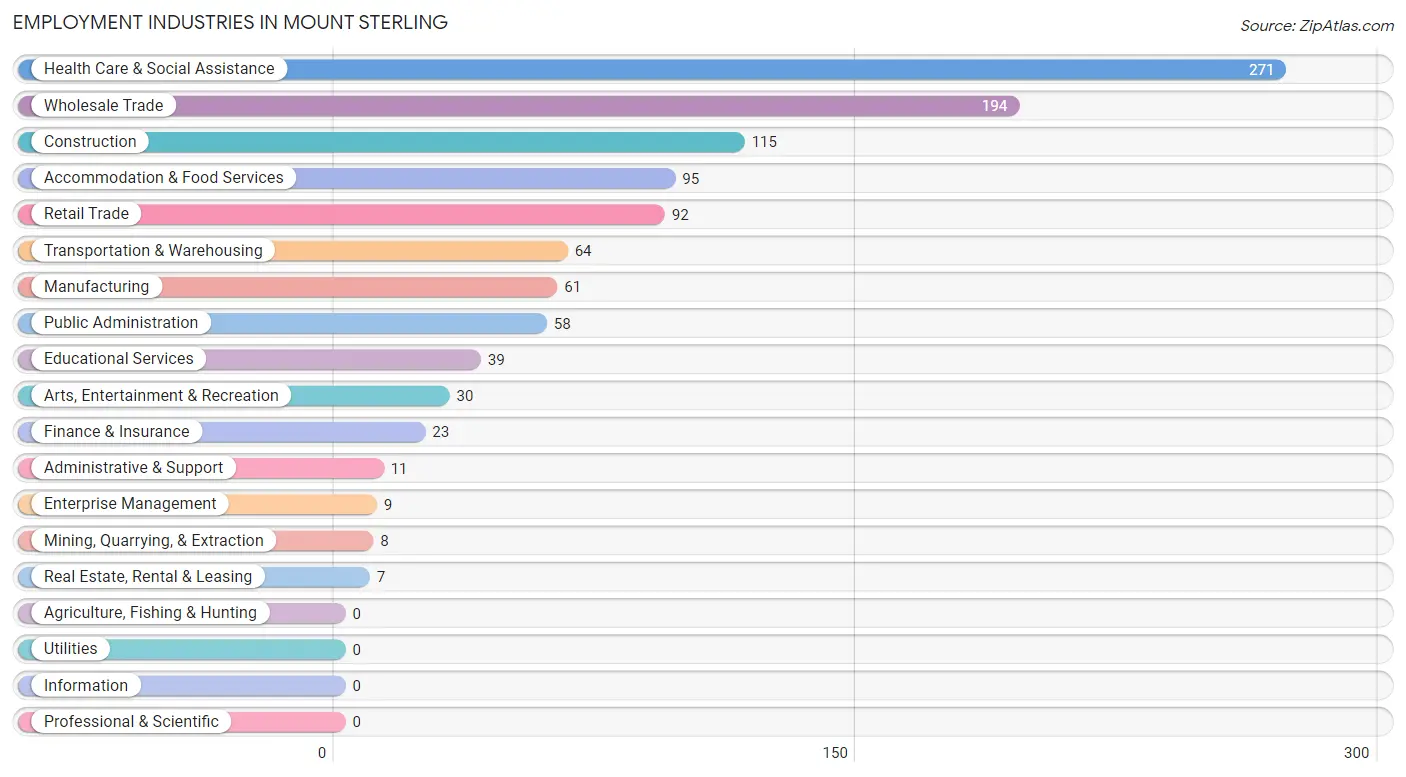
Employment Industries in Mount Sterling
The major employment industries in Mount Sterling include Health Care & Social Assistance (271 | 24.4%), Wholesale Trade (194 | 17.5%), Construction (115 | 10.4%), Accommodation & Food Services (95 | 8.6%), and Retail Trade (92 | 8.3%).
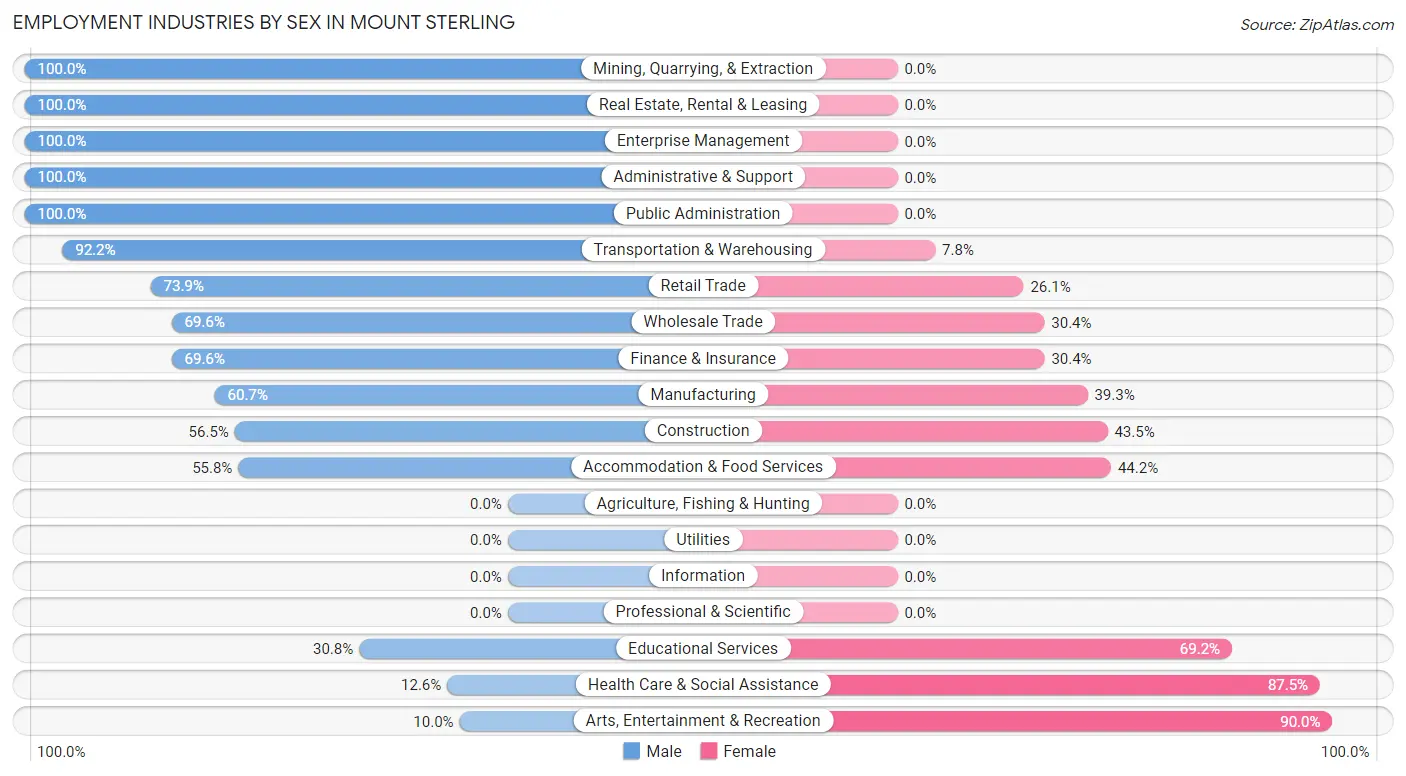
Employment Industries by Sex in Mount Sterling
The Mount Sterling industries that see more men than women are Mining, Quarrying, & Extraction (100.0%), Real Estate, Rental & Leasing (100.0%), and Enterprise Management (100.0%), whereas the industries that tend to have a higher number of women are Arts, Entertainment & Recreation (90.0%), Health Care & Social Assistance (87.5%), and Educational Services (69.2%).
| Industry | Male | Female |
| Agriculture, Fishing & Hunting | 0 (0.0%) | 0 (0.0%) |
| Mining, Quarrying, & Extraction | 8 (100.0%) | 0 (0.0%) |
| Construction | 65 (56.5%) | 50 (43.5%) |
| Manufacturing | 37 (60.7%) | 24 (39.3%) |
| Wholesale Trade | 135 (69.6%) | 59 (30.4%) |
| Retail Trade | 68 (73.9%) | 24 (26.1%) |
| Transportation & Warehousing | 59 (92.2%) | 5 (7.8%) |
| Utilities | 0 (0.0%) | 0 (0.0%) |
| Information | 0 (0.0%) | 0 (0.0%) |
| Finance & Insurance | 16 (69.6%) | 7 (30.4%) |
| Real Estate, Rental & Leasing | 7 (100.0%) | 0 (0.0%) |
| Professional & Scientific | 0 (0.0%) | 0 (0.0%) |
| Enterprise Management | 9 (100.0%) | 0 (0.0%) |
| Administrative & Support | 11 (100.0%) | 0 (0.0%) |
| Educational Services | 12 (30.8%) | 27 (69.2%) |
| Health Care & Social Assistance | 34 (12.6%) | 237 (87.5%) |
| Arts, Entertainment & Recreation | 3 (10.0%) | 27 (90.0%) |
| Accommodation & Food Services | 53 (55.8%) | 42 (44.2%) |
| Public Administration | 58 (100.0%) | 0 (0.0%) |
| Total | 589 (53.1%) | 520 (46.9%) |
Education in Mount Sterling
School Enrollment in Mount Sterling
The most common levels of schooling among the 492 students in Mount Sterling are elementary school (166 | 33.7%), high school (99 | 20.1%), and middle school (91 | 18.5%).
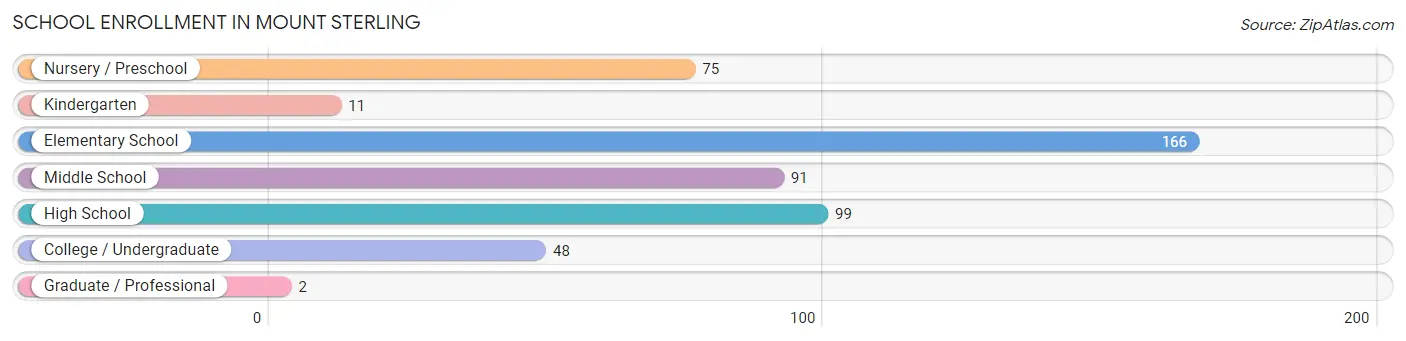
| School Level | # Students | % Students |
| Nursery / Preschool | 75 | 15.2% |
| Kindergarten | 11 | 2.2% |
| Elementary School | 166 | 33.7% |
| Middle School | 91 | 18.5% |
| High School | 99 | 20.1% |
| College / Undergraduate | 48 | 9.8% |
| Graduate / Professional | 2 | 0.4% |
| Total | 492 | 100.0% |
School Enrollment by Age by Funding Source in Mount Sterling
Out of a total of 492 students who are enrolled in schools in Mount Sterling, 19 (3.9%) attend a private institution, while the remaining 473 (96.1%) are enrolled in public schools. The age group of 20 to 24 year olds has the highest likelihood of being enrolled in private schools, with 7 (46.7% in the age bracket) enrolled. Conversely, the age group of 3 to 4 year olds has the lowest likelihood of being enrolled in a private school, with 43 (100.0% in the age bracket) attending a public institution.
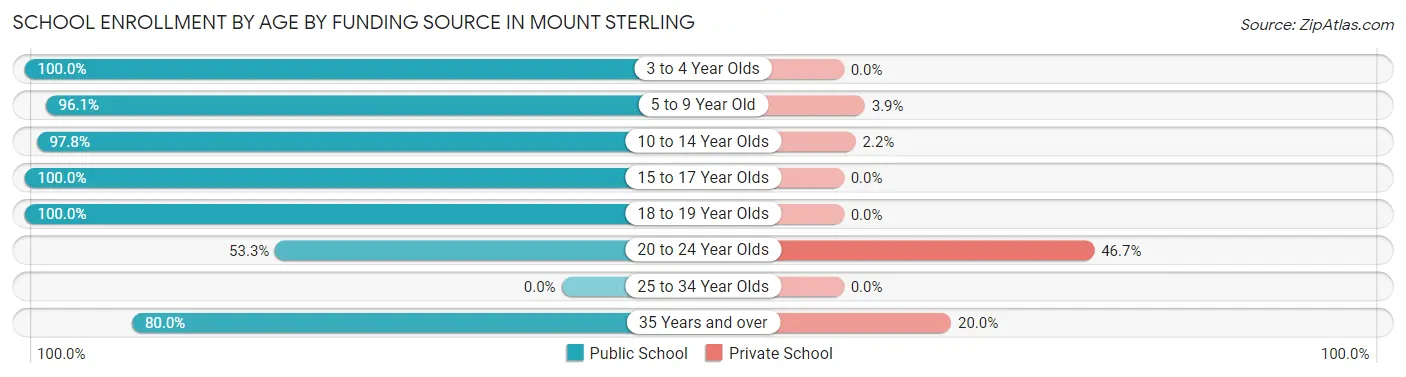
| Age Bracket | Public School | Private School |
| 3 to 4 Year Olds | 43 (100.0%) | 0 (0.0%) |
| 5 to 9 Year Old | 171 (96.1%) | 7 (3.9%) |
| 10 to 14 Year Olds | 132 (97.8%) | 3 (2.2%) |
| 15 to 17 Year Olds | 72 (100.0%) | 0 (0.0%) |
| 18 to 19 Year Olds | 39 (100.0%) | 0 (0.0%) |
| 20 to 24 Year Olds | 8 (53.3%) | 7 (46.7%) |
| 25 to 34 Year Olds | 0 (0.0%) | 0 (0.0%) |
| 35 Years and over | 8 (80.0%) | 2 (20.0%) |
| Total | 473 (96.1%) | 19 (3.9%) |
Educational Attainment by Field of Study in Mount Sterling
Business (98 | 31.7%), social sciences (71 | 23.0%), education (30 | 9.7%), arts & humanities (30 | 9.7%), and science & technology (21 | 6.8%) are the most common fields of study among 309 individuals in Mount Sterling who have obtained a bachelor's degree or higher.
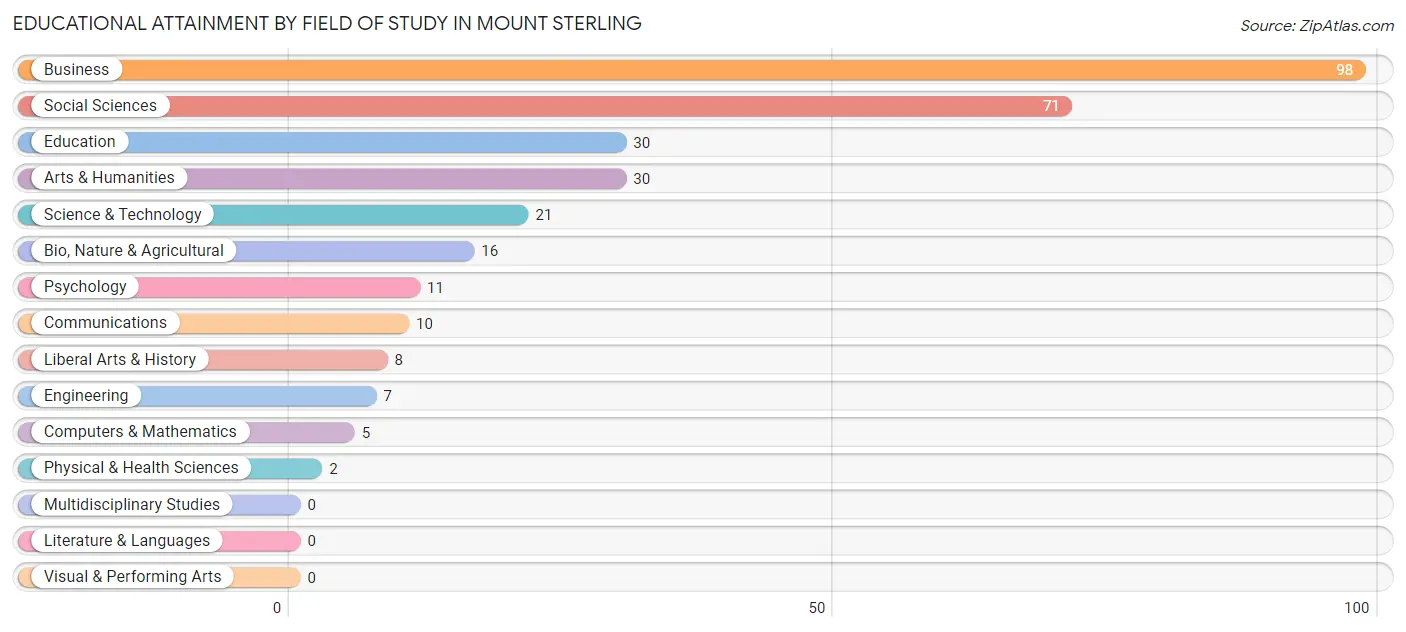
| Field of Study | # Graduates | % Graduates |
| Computers & Mathematics | 5 | 1.6% |
| Bio, Nature & Agricultural | 16 | 5.2% |
| Physical & Health Sciences | 2 | 0.6% |
| Psychology | 11 | 3.6% |
| Social Sciences | 71 | 23.0% |
| Engineering | 7 | 2.3% |
| Multidisciplinary Studies | 0 | 0.0% |
| Science & Technology | 21 | 6.8% |
| Business | 98 | 31.7% |
| Education | 30 | 9.7% |
| Literature & Languages | 0 | 0.0% |
| Liberal Arts & History | 8 | 2.6% |
| Visual & Performing Arts | 0 | 0.0% |
| Communications | 10 | 3.2% |
| Arts & Humanities | 30 | 9.7% |
| Total | 309 | 100.0% |
Transportation & Commute in Mount Sterling
Vehicle Availability by Sex in Mount Sterling
The most prevalent vehicle ownership categories in Mount Sterling are males with 2 vehicles (196, accounting for 34.1%) and females with 2 vehicles (156, making up 37.7%).
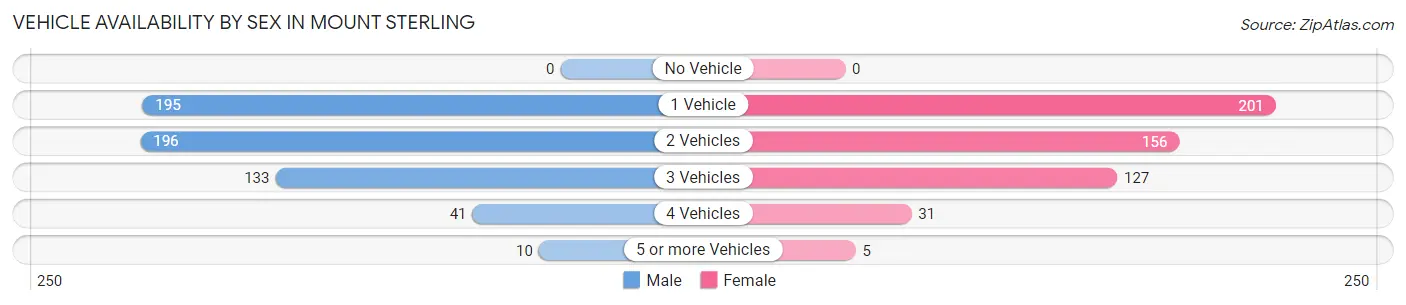
| Vehicles Available | Male | Female |
| No Vehicle | 0 (0.0%) | 0 (0.0%) |
| 1 Vehicle | 195 (33.9%) | 201 (38.7%) |
| 2 Vehicles | 196 (34.1%) | 156 (30.0%) |
| 3 Vehicles | 133 (23.1%) | 127 (24.4%) |
| 4 Vehicles | 41 (7.1%) | 31 (6.0%) |
| 5 or more Vehicles | 10 (1.7%) | 5 (1.0%) |
| Total | 575 (100.0%) | 520 (100.0%) |
Commute Time in Mount Sterling
The most frequently occuring commute durations in Mount Sterling are 5 to 9 minutes (406 commuters, 37.8%), less than 5 minutes (262 commuters, 24.4%), and 30 to 34 minutes (91 commuters, 8.5%).
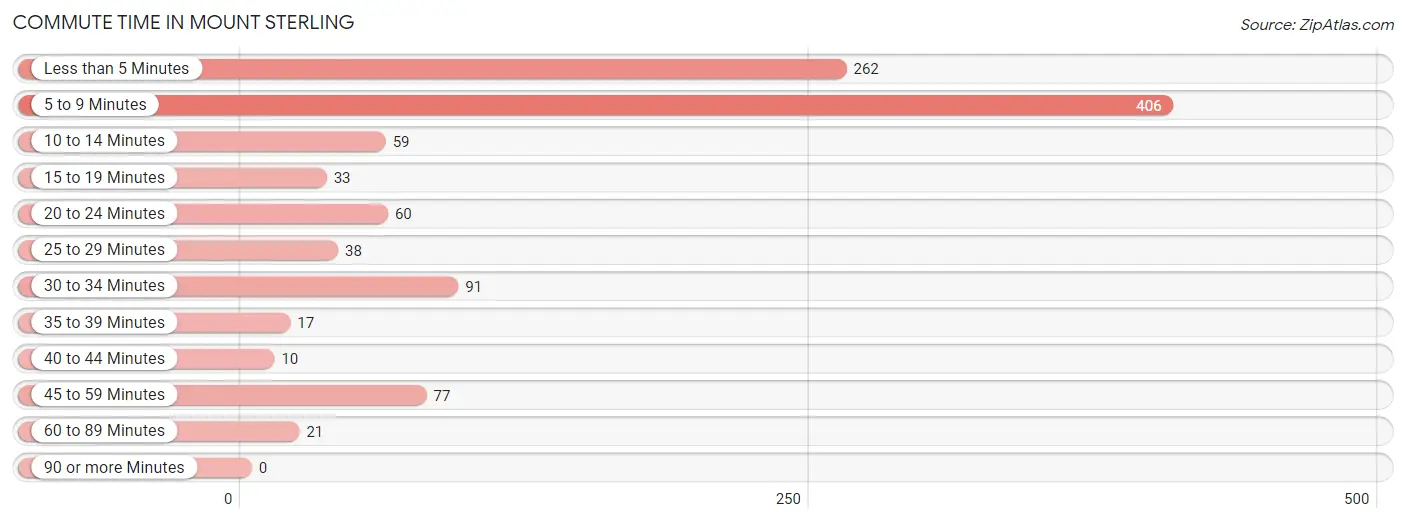
| Commute Time | # Commuters | % Commuters |
| Less than 5 Minutes | 262 | 24.4% |
| 5 to 9 Minutes | 406 | 37.8% |
| 10 to 14 Minutes | 59 | 5.5% |
| 15 to 19 Minutes | 33 | 3.1% |
| 20 to 24 Minutes | 60 | 5.6% |
| 25 to 29 Minutes | 38 | 3.5% |
| 30 to 34 Minutes | 91 | 8.5% |
| 35 to 39 Minutes | 17 | 1.6% |
| 40 to 44 Minutes | 10 | 0.9% |
| 45 to 59 Minutes | 77 | 7.2% |
| 60 to 89 Minutes | 21 | 2.0% |
| 90 or more Minutes | 0 | 0.0% |
Commute Time by Sex in Mount Sterling
The most common commute times in Mount Sterling are 5 to 9 minutes (242 commuters, 43.1%) for males and 5 to 9 minutes (164 commuters, 32.0%) for females.
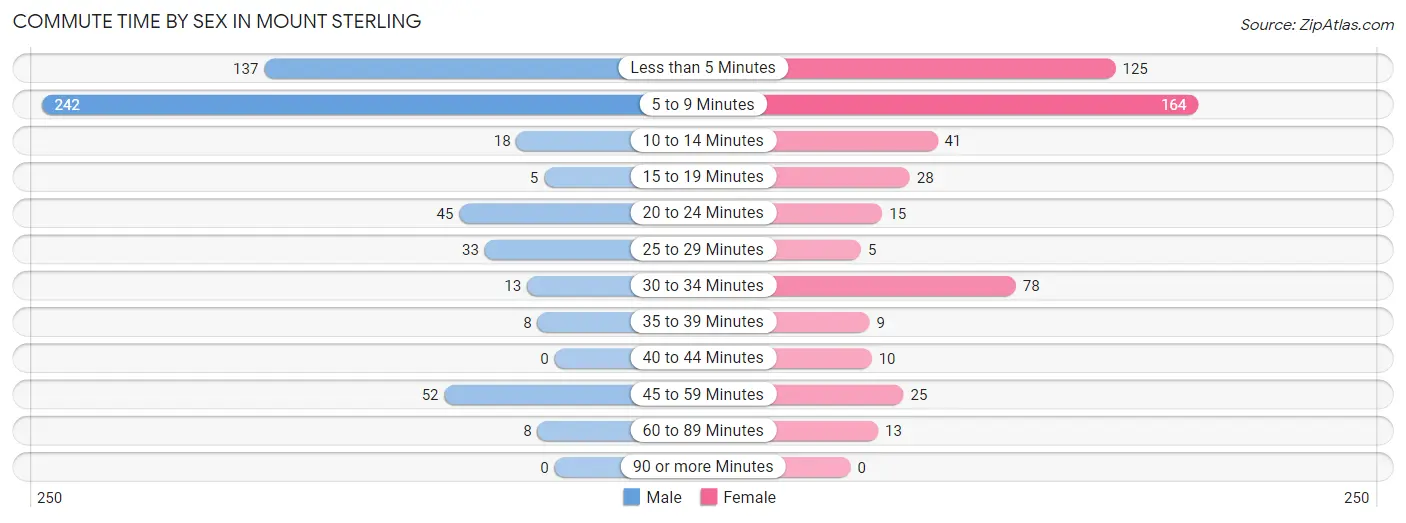
| Commute Time | Male | Female |
| Less than 5 Minutes | 137 (24.4%) | 125 (24.4%) |
| 5 to 9 Minutes | 242 (43.1%) | 164 (32.0%) |
| 10 to 14 Minutes | 18 (3.2%) | 41 (8.0%) |
| 15 to 19 Minutes | 5 (0.9%) | 28 (5.5%) |
| 20 to 24 Minutes | 45 (8.0%) | 15 (2.9%) |
| 25 to 29 Minutes | 33 (5.9%) | 5 (1.0%) |
| 30 to 34 Minutes | 13 (2.3%) | 78 (15.2%) |
| 35 to 39 Minutes | 8 (1.4%) | 9 (1.8%) |
| 40 to 44 Minutes | 0 (0.0%) | 10 (1.9%) |
| 45 to 59 Minutes | 52 (9.3%) | 25 (4.9%) |
| 60 to 89 Minutes | 8 (1.4%) | 13 (2.5%) |
| 90 or more Minutes | 0 (0.0%) | 0 (0.0%) |
Time of Departure to Work by Sex in Mount Sterling
The most frequent times of departure to work in Mount Sterling are 4:00 PM to 11:59 PM (182, 32.4%) for males and 7:00 AM to 7:29 AM (114, 22.2%) for females.
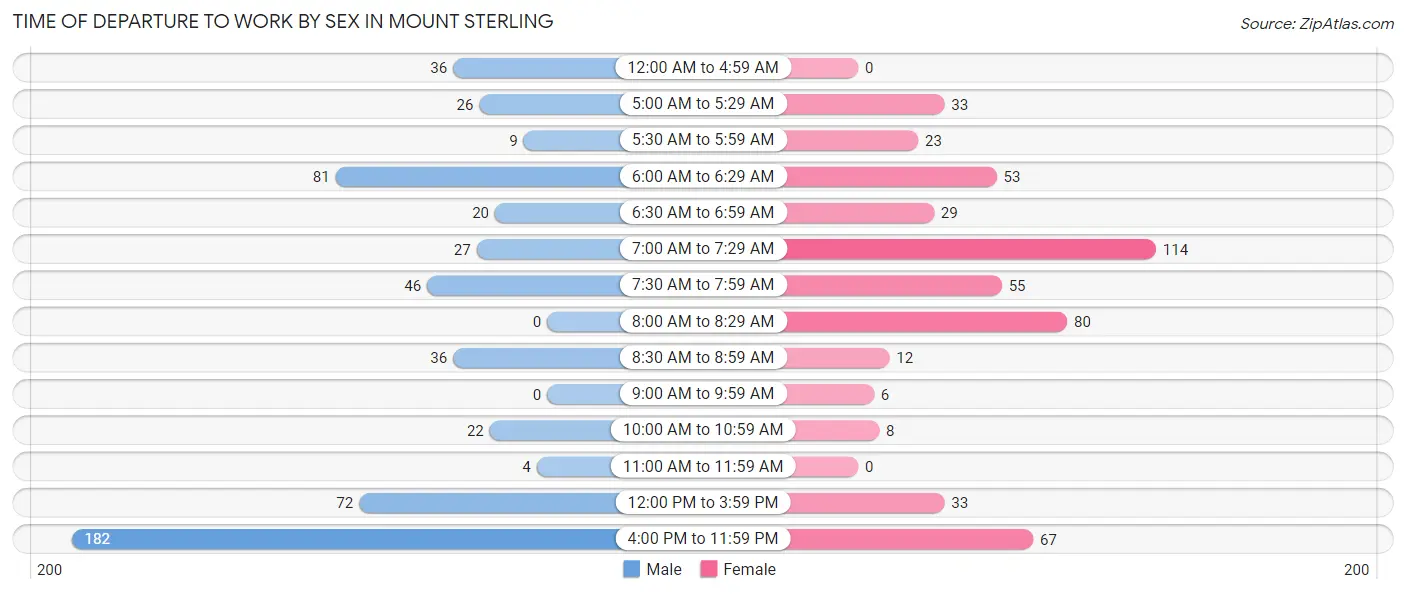
| Time of Departure | Male | Female |
| 12:00 AM to 4:59 AM | 36 (6.4%) | 0 (0.0%) |
| 5:00 AM to 5:29 AM | 26 (4.6%) | 33 (6.4%) |
| 5:30 AM to 5:59 AM | 9 (1.6%) | 23 (4.5%) |
| 6:00 AM to 6:29 AM | 81 (14.4%) | 53 (10.3%) |
| 6:30 AM to 6:59 AM | 20 (3.6%) | 29 (5.7%) |
| 7:00 AM to 7:29 AM | 27 (4.8%) | 114 (22.2%) |
| 7:30 AM to 7:59 AM | 46 (8.2%) | 55 (10.7%) |
| 8:00 AM to 8:29 AM | 0 (0.0%) | 80 (15.6%) |
| 8:30 AM to 8:59 AM | 36 (6.4%) | 12 (2.3%) |
| 9:00 AM to 9:59 AM | 0 (0.0%) | 6 (1.2%) |
| 10:00 AM to 10:59 AM | 22 (3.9%) | 8 (1.6%) |
| 11:00 AM to 11:59 AM | 4 (0.7%) | 0 (0.0%) |
| 12:00 PM to 3:59 PM | 72 (12.8%) | 33 (6.4%) |
| 4:00 PM to 11:59 PM | 182 (32.4%) | 67 (13.1%) |
| Total | 561 (100.0%) | 513 (100.0%) |
Housing Occupancy in Mount Sterling
Occupancy by Ownership in Mount Sterling
Of the total 1,006 dwellings in Mount Sterling, owner-occupied units account for 524 (52.1%), while renter-occupied units make up 482 (47.9%).
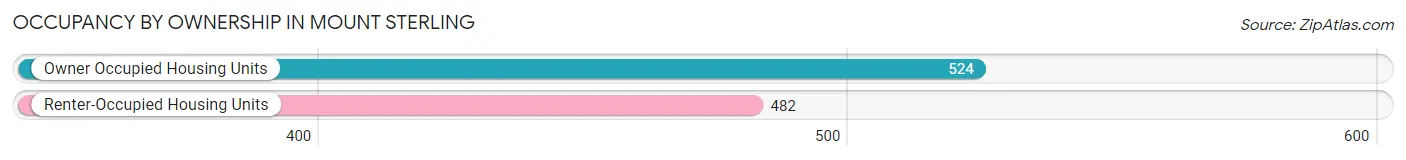
| Occupancy | # Housing Units | % Housing Units |
| Owner Occupied Housing Units | 524 | 52.1% |
| Renter-Occupied Housing Units | 482 | 47.9% |
| Total Occupied Housing Units | 1,006 | 100.0% |
Occupancy by Household Size in Mount Sterling
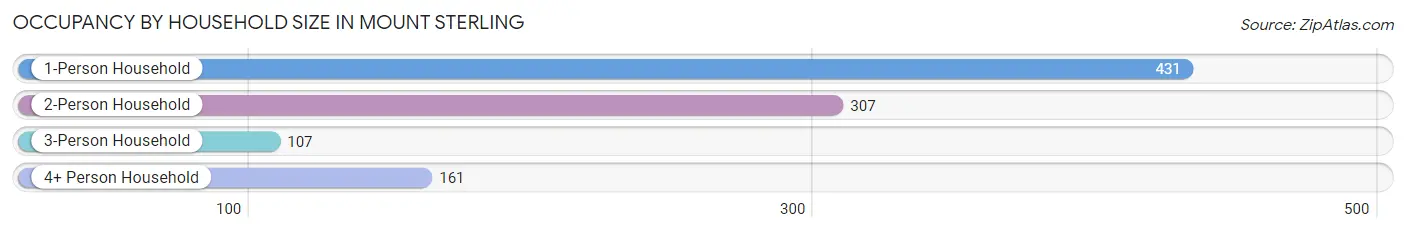
| Household Size | # Housing Units | % Housing Units |
| 1-Person Household | 431 | 42.8% |
| 2-Person Household | 307 | 30.5% |
| 3-Person Household | 107 | 10.6% |
| 4+ Person Household | 161 | 16.0% |
| Total Housing Units | 1,006 | 100.0% |
Occupancy by Ownership by Household Size in Mount Sterling
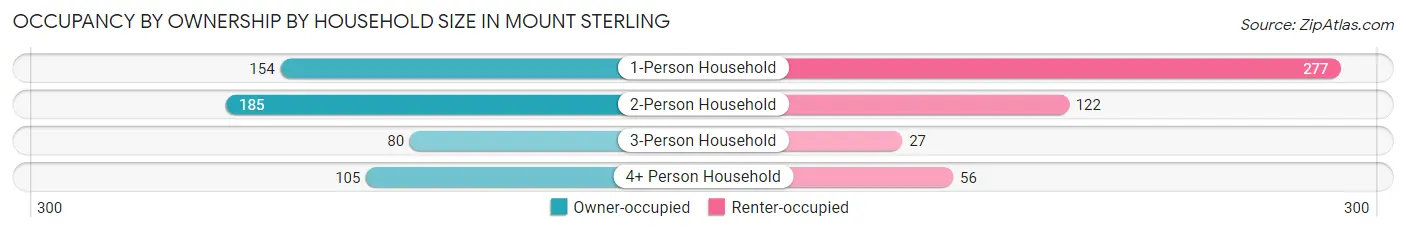
| Household Size | Owner-occupied | Renter-occupied |
| 1-Person Household | 154 (35.7%) | 277 (64.3%) |
| 2-Person Household | 185 (60.3%) | 122 (39.7%) |
| 3-Person Household | 80 (74.8%) | 27 (25.2%) |
| 4+ Person Household | 105 (65.2%) | 56 (34.8%) |
| Total Housing Units | 524 (52.1%) | 482 (47.9%) |
Occupancy by Educational Attainment in Mount Sterling
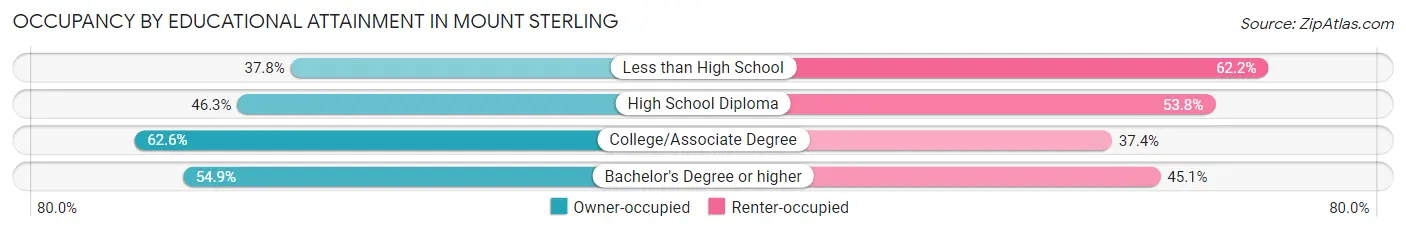
| Household Size | Owner-occupied | Renter-occupied |
| Less than High School | 59 (37.8%) | 97 (62.2%) |
| High School Diploma | 148 (46.3%) | 172 (53.7%) |
| College/Associate Degree | 211 (62.6%) | 126 (37.4%) |
| Bachelor's Degree or higher | 106 (54.9%) | 87 (45.1%) |
Occupancy by Age of Householder in Mount Sterling
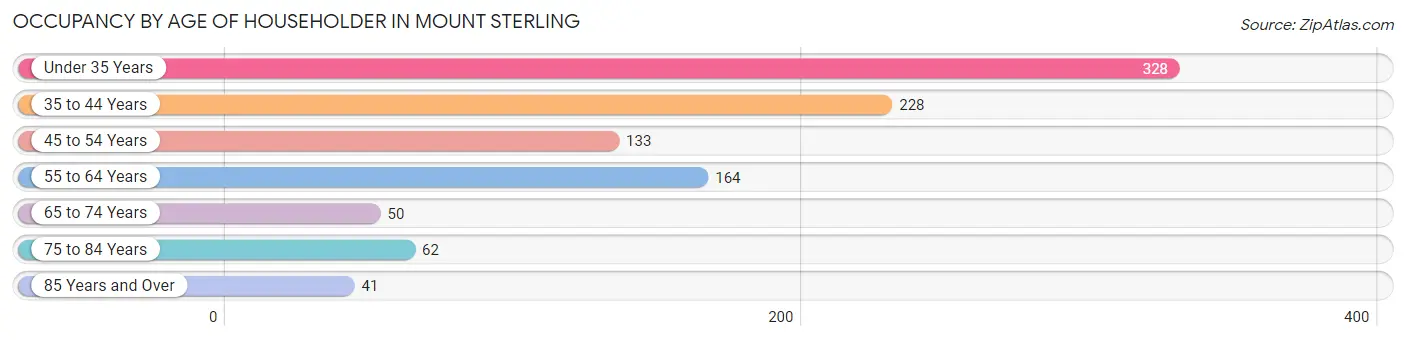
| Age Bracket | # Households | % Households |
| Under 35 Years | 328 | 32.6% |
| 35 to 44 Years | 228 | 22.7% |
| 45 to 54 Years | 133 | 13.2% |
| 55 to 64 Years | 164 | 16.3% |
| 65 to 74 Years | 50 | 5.0% |
| 75 to 84 Years | 62 | 6.2% |
| 85 Years and Over | 41 | 4.1% |
| Total | 1,006 | 100.0% |
Housing Finances in Mount Sterling
Median Income by Occupancy in Mount Sterling
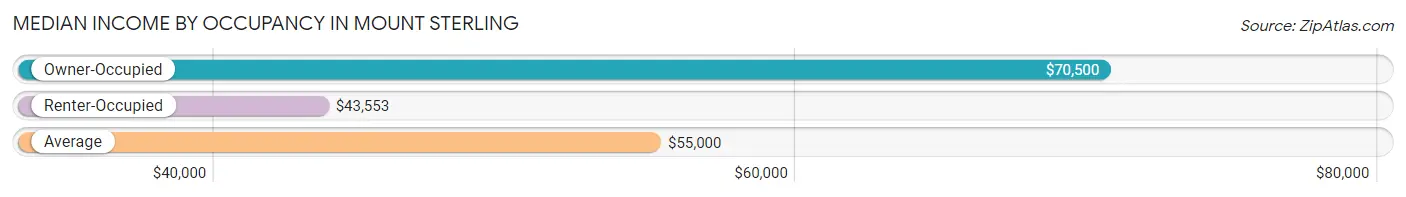
| Occupancy Type | # Households | Median Income |
| Owner-Occupied | 524 (52.1%) | $70,500 |
| Renter-Occupied | 482 (47.9%) | $43,553 |
| Average | 1,006 (100.0%) | $55,000 |
Occupancy by Householder Income Bracket in Mount Sterling
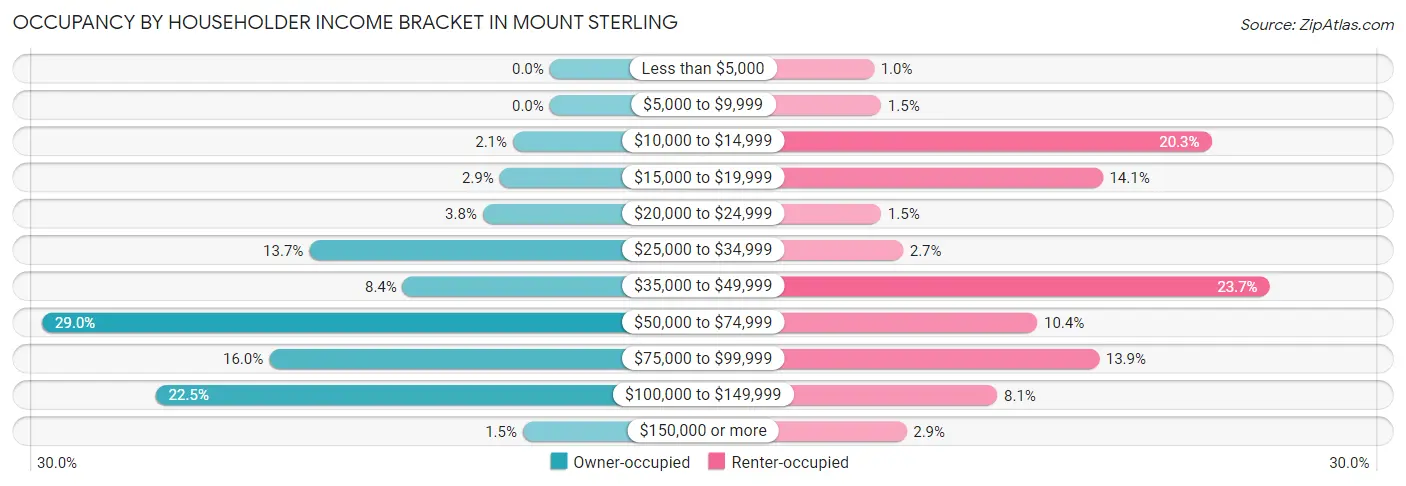
| Income Bracket | Owner-occupied | Renter-occupied |
| Less than $5,000 | 0 (0.0%) | 5 (1.0%) |
| $5,000 to $9,999 | 0 (0.0%) | 7 (1.5%) |
| $10,000 to $14,999 | 11 (2.1%) | 98 (20.3%) |
| $15,000 to $19,999 | 15 (2.9%) | 68 (14.1%) |
| $20,000 to $24,999 | 20 (3.8%) | 7 (1.5%) |
| $25,000 to $34,999 | 72 (13.7%) | 13 (2.7%) |
| $35,000 to $49,999 | 44 (8.4%) | 114 (23.6%) |
| $50,000 to $74,999 | 152 (29.0%) | 50 (10.4%) |
| $75,000 to $99,999 | 84 (16.0%) | 67 (13.9%) |
| $100,000 to $149,999 | 118 (22.5%) | 39 (8.1%) |
| $150,000 or more | 8 (1.5%) | 14 (2.9%) |
| Total | 524 (100.0%) | 482 (100.0%) |
Monthly Housing Cost Tiers in Mount Sterling
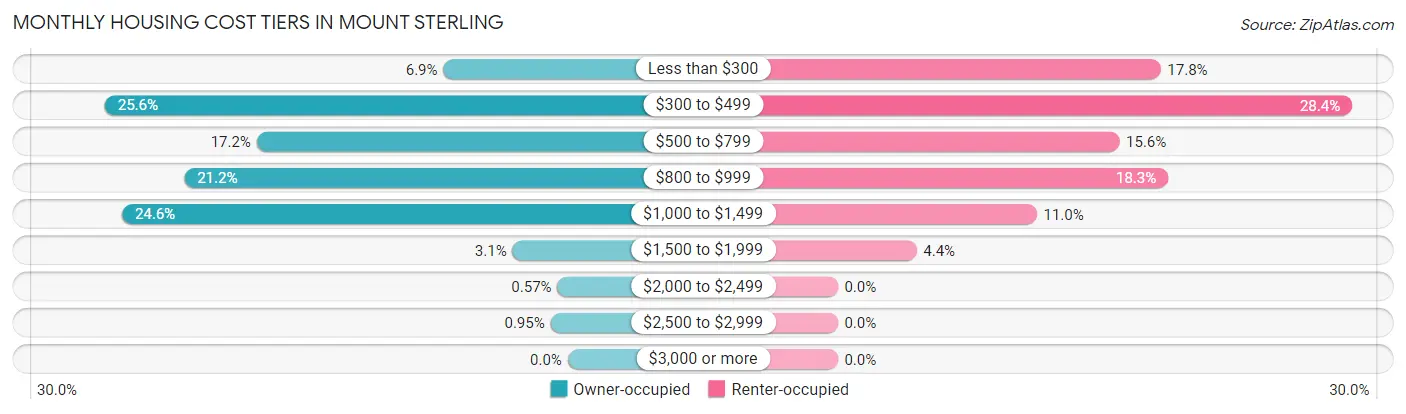
| Monthly Cost | Owner-occupied | Renter-occupied |
| Less than $300 | 36 (6.9%) | 86 (17.8%) |
| $300 to $499 | 134 (25.6%) | 137 (28.4%) |
| $500 to $799 | 90 (17.2%) | 75 (15.6%) |
| $800 to $999 | 111 (21.2%) | 88 (18.3%) |
| $1,000 to $1,499 | 129 (24.6%) | 53 (11.0%) |
| $1,500 to $1,999 | 16 (3.0%) | 21 (4.4%) |
| $2,000 to $2,499 | 3 (0.6%) | 0 (0.0%) |
| $2,500 to $2,999 | 5 (0.9%) | 0 (0.0%) |
| $3,000 or more | 0 (0.0%) | 0 (0.0%) |
| Total | 524 (100.0%) | 482 (100.0%) |
Physical Housing Characteristics in Mount Sterling
Housing Structures in Mount Sterling
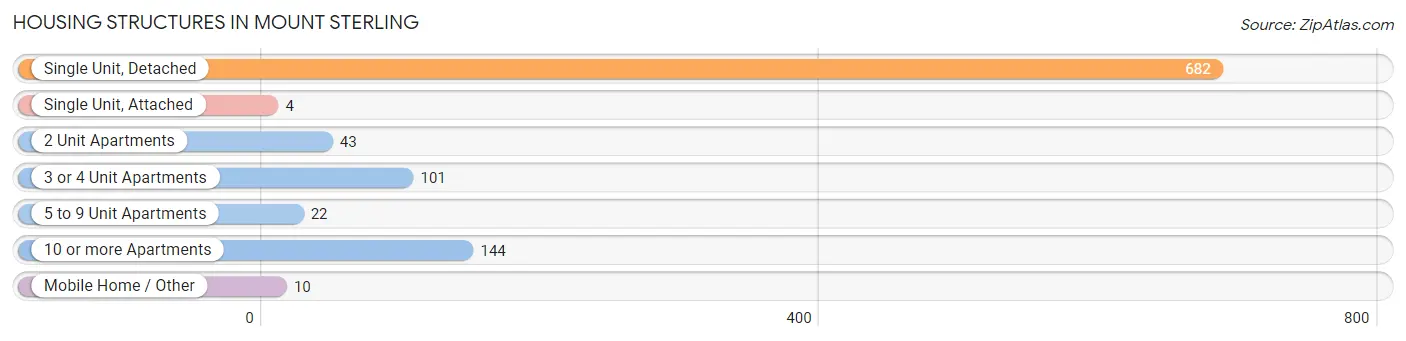
| Structure Type | # Housing Units | % Housing Units |
| Single Unit, Detached | 682 | 67.8% |
| Single Unit, Attached | 4 | 0.4% |
| 2 Unit Apartments | 43 | 4.3% |
| 3 or 4 Unit Apartments | 101 | 10.0% |
| 5 to 9 Unit Apartments | 22 | 2.2% |
| 10 or more Apartments | 144 | 14.3% |
| Mobile Home / Other | 10 | 1.0% |
| Total | 1,006 | 100.0% |
Housing Structures by Occupancy in Mount Sterling
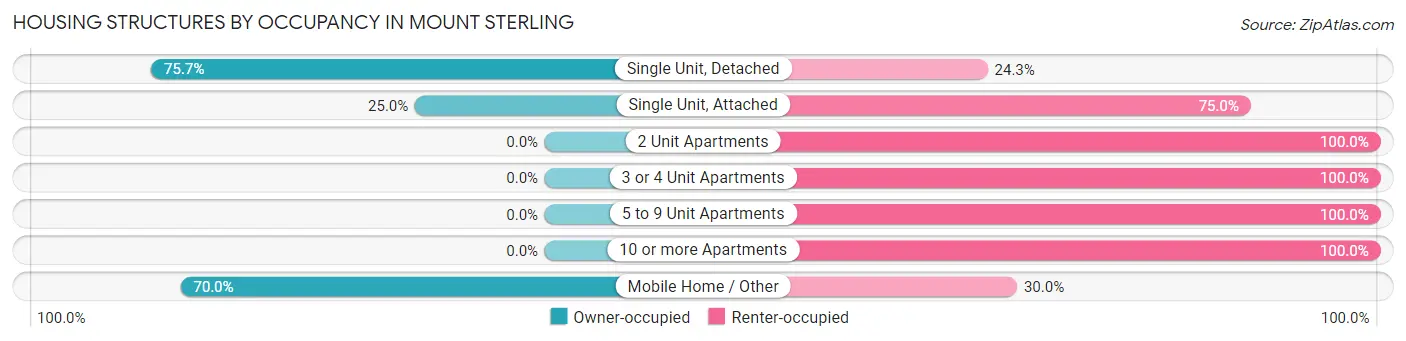
| Structure Type | Owner-occupied | Renter-occupied |
| Single Unit, Detached | 516 (75.7%) | 166 (24.3%) |
| Single Unit, Attached | 1 (25.0%) | 3 (75.0%) |
| 2 Unit Apartments | 0 (0.0%) | 43 (100.0%) |
| 3 or 4 Unit Apartments | 0 (0.0%) | 101 (100.0%) |
| 5 to 9 Unit Apartments | 0 (0.0%) | 22 (100.0%) |
| 10 or more Apartments | 0 (0.0%) | 144 (100.0%) |
| Mobile Home / Other | 7 (70.0%) | 3 (30.0%) |
| Total | 524 (52.1%) | 482 (47.9%) |
Housing Structures by Number of Rooms in Mount Sterling
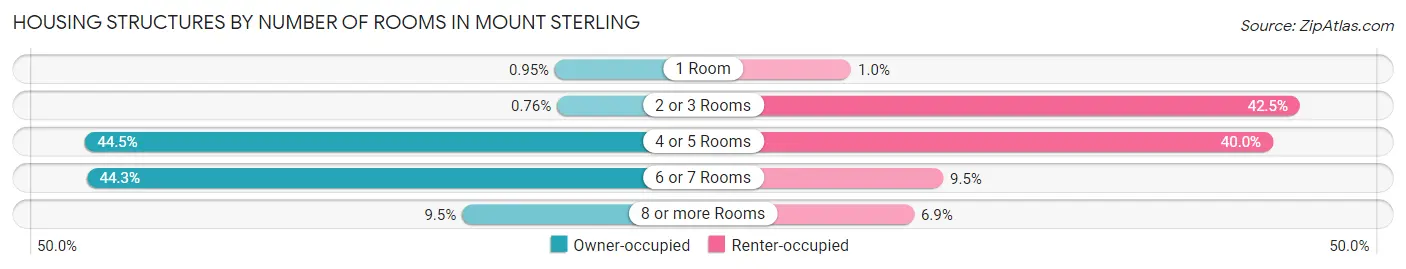
| Number of Rooms | Owner-occupied | Renter-occupied |
| 1 Room | 5 (0.9%) | 5 (1.0%) |
| 2 or 3 Rooms | 4 (0.8%) | 205 (42.5%) |
| 4 or 5 Rooms | 233 (44.5%) | 193 (40.0%) |
| 6 or 7 Rooms | 232 (44.3%) | 46 (9.5%) |
| 8 or more Rooms | 50 (9.5%) | 33 (6.9%) |
| Total | 524 (100.0%) | 482 (100.0%) |
Housing Structure by Heating Type in Mount Sterling
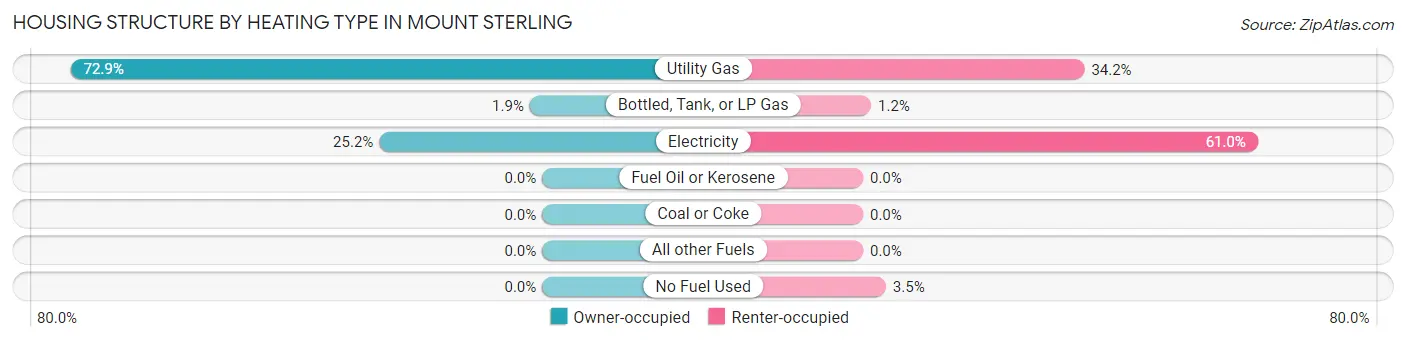
| Heating Type | Owner-occupied | Renter-occupied |
| Utility Gas | 382 (72.9%) | 165 (34.2%) |
| Bottled, Tank, or LP Gas | 10 (1.9%) | 6 (1.2%) |
| Electricity | 132 (25.2%) | 294 (61.0%) |
| Fuel Oil or Kerosene | 0 (0.0%) | 0 (0.0%) |
| Coal or Coke | 0 (0.0%) | 0 (0.0%) |
| All other Fuels | 0 (0.0%) | 0 (0.0%) |
| No Fuel Used | 0 (0.0%) | 17 (3.5%) |
| Total | 524 (100.0%) | 482 (100.0%) |
Household Vehicle Usage in Mount Sterling
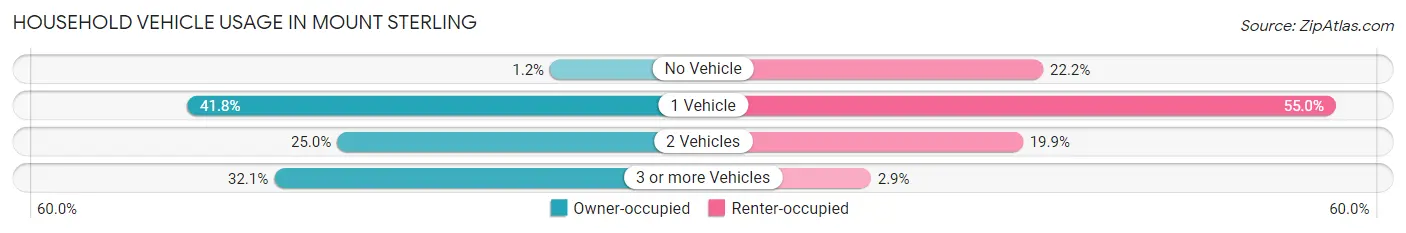
| Vehicles per Household | Owner-occupied | Renter-occupied |
| No Vehicle | 6 (1.1%) | 107 (22.2%) |
| 1 Vehicle | 219 (41.8%) | 265 (55.0%) |
| 2 Vehicles | 131 (25.0%) | 96 (19.9%) |
| 3 or more Vehicles | 168 (32.1%) | 14 (2.9%) |
| Total | 524 (100.0%) | 482 (100.0%) |
Real Estate & Mortgages in Mount Sterling
Real Estate and Mortgage Overview in Mount Sterling
| Characteristic | Without Mortgage | With Mortgage |
| Housing Units | 213 | 311 |
| Median Property Value | $67,200 | $109,300 |
| Median Household Income | $65,391 | $8 |
| Monthly Housing Costs | $365 | $0 |
| Real Estate Taxes | $1,342 | $8 |
Property Value by Mortgage Status in Mount Sterling
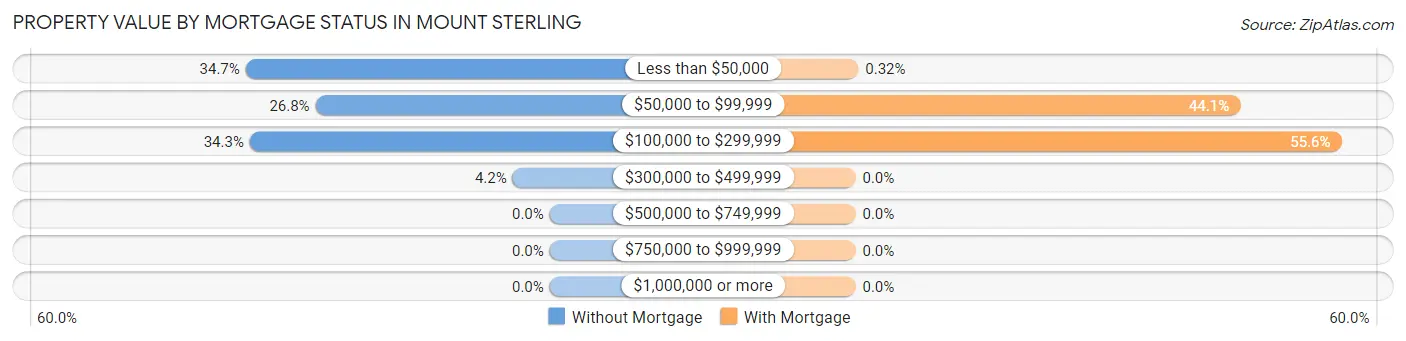
| Property Value | Without Mortgage | With Mortgage |
| Less than $50,000 | 74 (34.7%) | 1 (0.3%) |
| $50,000 to $99,999 | 57 (26.8%) | 137 (44.1%) |
| $100,000 to $299,999 | 73 (34.3%) | 173 (55.6%) |
| $300,000 to $499,999 | 9 (4.2%) | 0 (0.0%) |
| $500,000 to $749,999 | 0 (0.0%) | 0 (0.0%) |
| $750,000 to $999,999 | 0 (0.0%) | 0 (0.0%) |
| $1,000,000 or more | 0 (0.0%) | 0 (0.0%) |
| Total | 213 (100.0%) | 311 (100.0%) |
Household Income by Mortgage Status in Mount Sterling
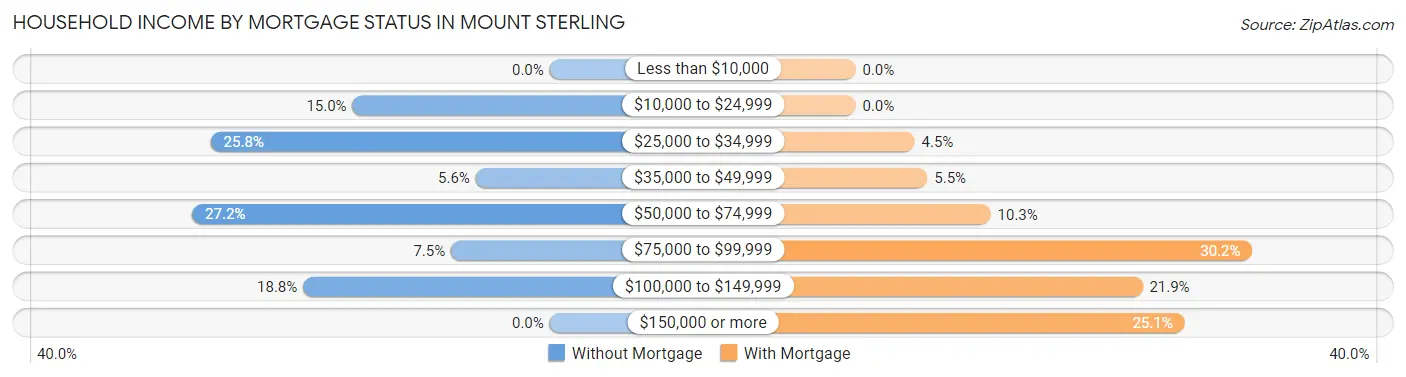
| Household Income | Without Mortgage | With Mortgage |
| Less than $10,000 | 0 (0.0%) | 0 (0.0%) |
| $10,000 to $24,999 | 32 (15.0%) | 0 (0.0%) |
| $25,000 to $34,999 | 55 (25.8%) | 14 (4.5%) |
| $35,000 to $49,999 | 12 (5.6%) | 17 (5.5%) |
| $50,000 to $74,999 | 58 (27.2%) | 32 (10.3%) |
| $75,000 to $99,999 | 16 (7.5%) | 94 (30.2%) |
| $100,000 to $149,999 | 40 (18.8%) | 68 (21.9%) |
| $150,000 or more | 0 (0.0%) | 78 (25.1%) |
| Total | 213 (100.0%) | 311 (100.0%) |
Property Value to Household Income Ratio in Mount Sterling
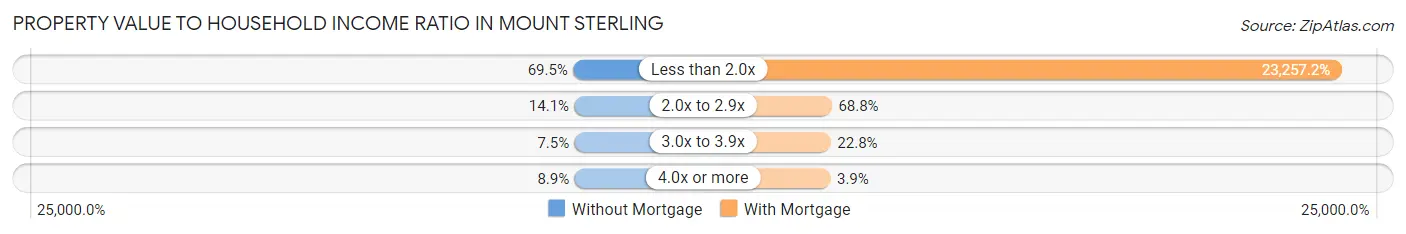
| Value-to-Income Ratio | Without Mortgage | With Mortgage |
| Less than 2.0x | 148 (69.5%) | 72,330 (23,257.2%) |
| 2.0x to 2.9x | 30 (14.1%) | 214 (68.8%) |
| 3.0x to 3.9x | 16 (7.5%) | 71 (22.8%) |
| 4.0x or more | 19 (8.9%) | 12 (3.9%) |
| Total | 213 (100.0%) | 311 (100.0%) |
Real Estate Taxes by Mortgage Status in Mount Sterling
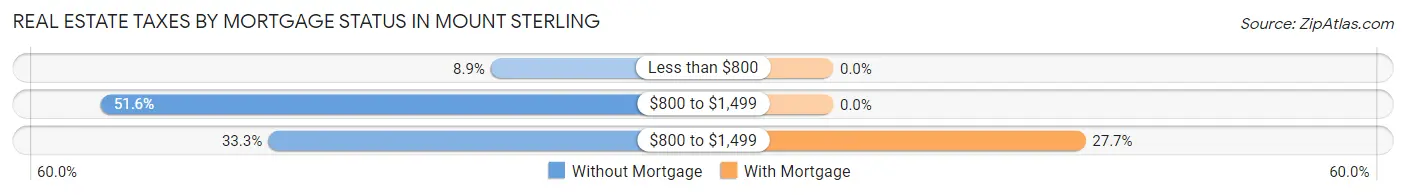
| Property Taxes | Without Mortgage | With Mortgage |
| Less than $800 | 19 (8.9%) | 0 (0.0%) |
| $800 to $1,499 | 110 (51.6%) | 0 (0.0%) |
| $800 to $1,499 | 71 (33.3%) | 86 (27.7%) |
| Total | 213 (100.0%) | 311 (100.0%) |
Health & Disability in Mount Sterling
Health Insurance Coverage by Age in Mount Sterling
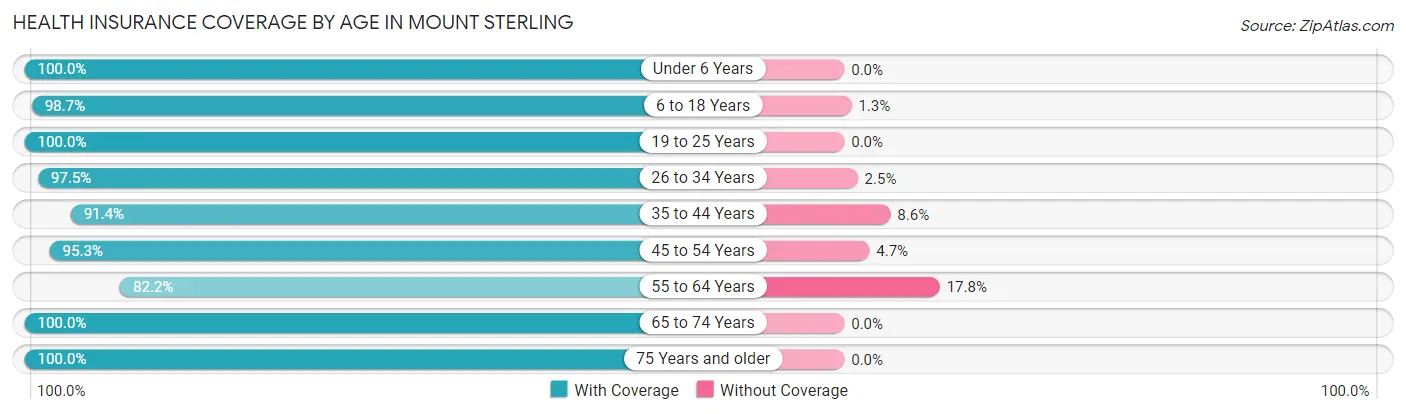
| Age Bracket | With Coverage | Without Coverage |
| Under 6 Years | 207 (100.0%) | 0 (0.0%) |
| 6 to 18 Years | 369 (98.7%) | 5 (1.3%) |
| 19 to 25 Years | 184 (100.0%) | 0 (0.0%) |
| 26 to 34 Years | 352 (97.5%) | 9 (2.5%) |
| 35 to 44 Years | 319 (91.4%) | 30 (8.6%) |
| 45 to 54 Years | 163 (95.3%) | 8 (4.7%) |
| 55 to 64 Years | 194 (82.2%) | 42 (17.8%) |
| 65 to 74 Years | 69 (100.0%) | 0 (0.0%) |
| 75 Years and older | 152 (100.0%) | 0 (0.0%) |
| Total | 2,009 (95.5%) | 94 (4.5%) |
Health Insurance Coverage by Citizenship Status in Mount Sterling
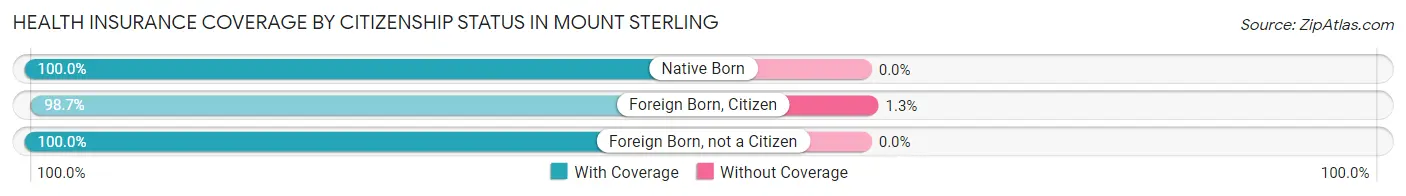
| Citizenship Status | With Coverage | Without Coverage |
| Native Born | 207 (100.0%) | 0 (0.0%) |
| Foreign Born, Citizen | 369 (98.7%) | 5 (1.3%) |
| Foreign Born, not a Citizen | 184 (100.0%) | 0 (0.0%) |
Health Insurance Coverage by Household Income in Mount Sterling
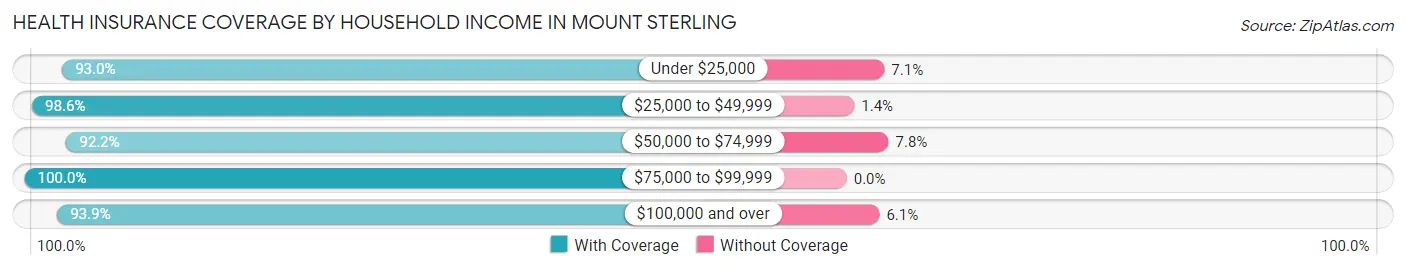
| Household Income | With Coverage | Without Coverage |
| Under $25,000 | 277 (92.9%) | 21 (7.0%) |
| $25,000 to $49,999 | 485 (98.6%) | 7 (1.4%) |
| $50,000 to $74,999 | 424 (92.2%) | 36 (7.8%) |
| $75,000 to $99,999 | 361 (100.0%) | 0 (0.0%) |
| $100,000 and over | 460 (93.9%) | 30 (6.1%) |
Public vs Private Health Insurance Coverage by Age in Mount Sterling
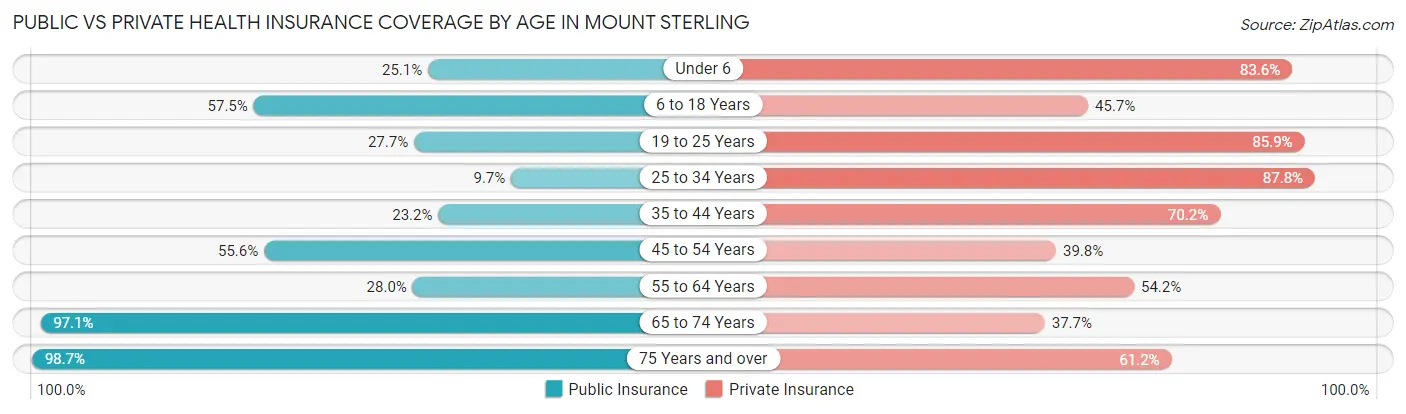
| Age Bracket | Public Insurance | Private Insurance |
| Under 6 | 52 (25.1%) | 173 (83.6%) |
| 6 to 18 Years | 215 (57.5%) | 171 (45.7%) |
| 19 to 25 Years | 51 (27.7%) | 158 (85.9%) |
| 25 to 34 Years | 35 (9.7%) | 317 (87.8%) |
| 35 to 44 Years | 81 (23.2%) | 245 (70.2%) |
| 45 to 54 Years | 95 (55.6%) | 68 (39.8%) |
| 55 to 64 Years | 66 (28.0%) | 128 (54.2%) |
| 65 to 74 Years | 67 (97.1%) | 26 (37.7%) |
| 75 Years and over | 150 (98.7%) | 93 (61.2%) |
| Total | 812 (38.6%) | 1,379 (65.6%) |
Disability Status by Sex by Age in Mount Sterling
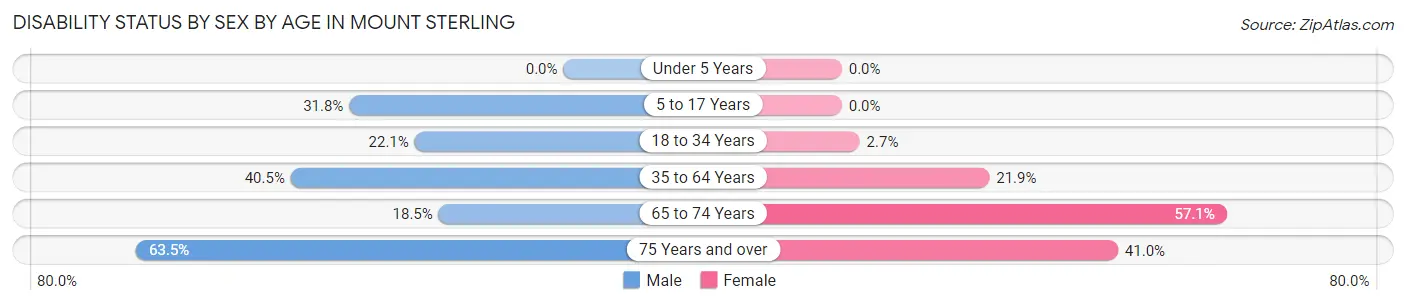
| Age Bracket | Male | Female |
| Under 5 Years | 0 (0.0%) | 0 (0.0%) |
| 5 to 17 Years | 83 (31.8%) | 0 (0.0%) |
| 18 to 34 Years | 74 (22.1%) | 6 (2.6%) |
| 35 to 64 Years | 136 (40.5%) | 92 (21.9%) |
| 65 to 74 Years | 5 (18.5%) | 24 (57.1%) |
| 75 Years and over | 33 (63.5%) | 41 (41.0%) |
Disability Class by Sex by Age in Mount Sterling
Disability Class: Hearing Difficulty
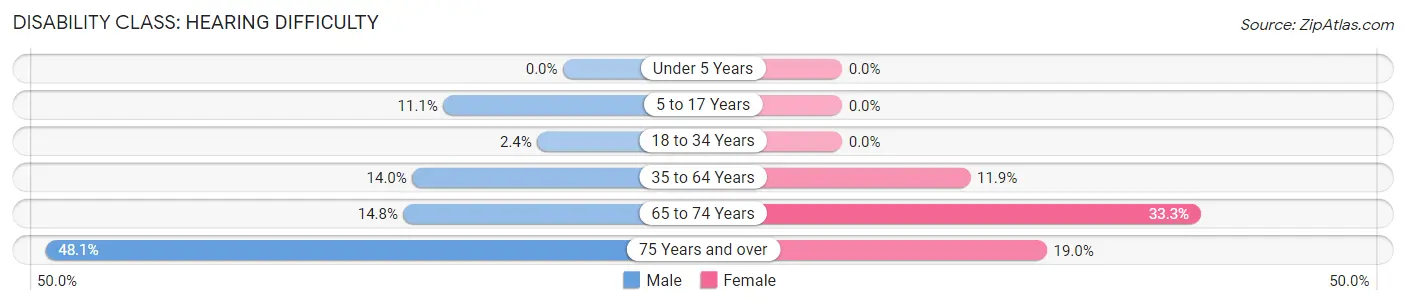
| Age Bracket | Male | Female |
| Under 5 Years | 0 (0.0%) | 0 (0.0%) |
| 5 to 17 Years | 29 (11.1%) | 0 (0.0%) |
| 18 to 34 Years | 8 (2.4%) | 0 (0.0%) |
| 35 to 64 Years | 47 (14.0%) | 50 (11.9%) |
| 65 to 74 Years | 4 (14.8%) | 14 (33.3%) |
| 75 Years and over | 25 (48.1%) | 19 (19.0%) |
Disability Class: Vision Difficulty
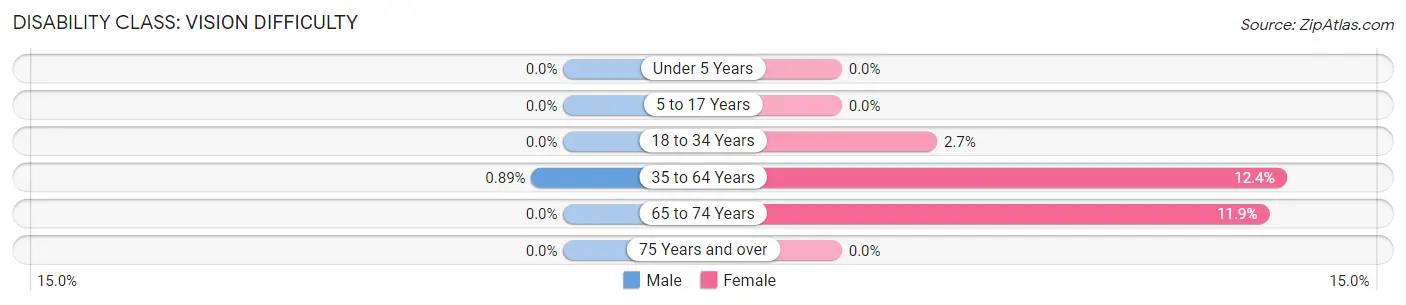
| Age Bracket | Male | Female |
| Under 5 Years | 0 (0.0%) | 0 (0.0%) |
| 5 to 17 Years | 0 (0.0%) | 0 (0.0%) |
| 18 to 34 Years | 0 (0.0%) | 6 (2.6%) |
| 35 to 64 Years | 3 (0.9%) | 52 (12.4%) |
| 65 to 74 Years | 0 (0.0%) | 5 (11.9%) |
| 75 Years and over | 0 (0.0%) | 0 (0.0%) |
Disability Class: Cognitive Difficulty
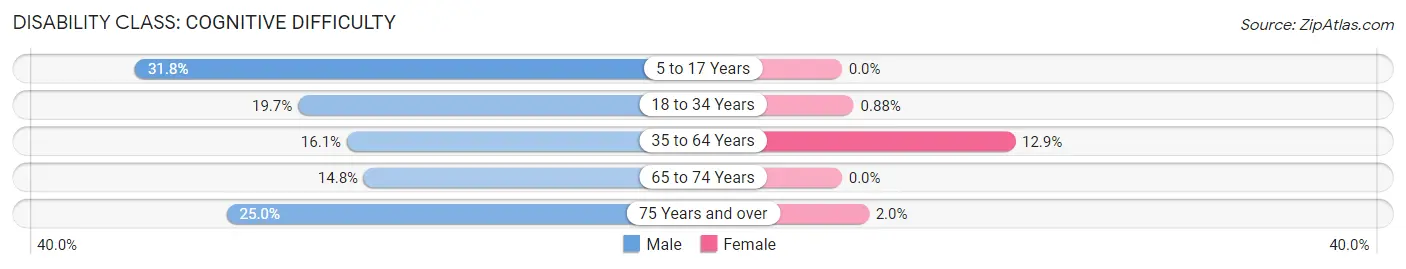
| Age Bracket | Male | Female |
| 5 to 17 Years | 83 (31.8%) | 0 (0.0%) |
| 18 to 34 Years | 66 (19.7%) | 2 (0.9%) |
| 35 to 64 Years | 54 (16.1%) | 54 (12.9%) |
| 65 to 74 Years | 4 (14.8%) | 0 (0.0%) |
| 75 Years and over | 13 (25.0%) | 2 (2.0%) |
Disability Class: Ambulatory Difficulty
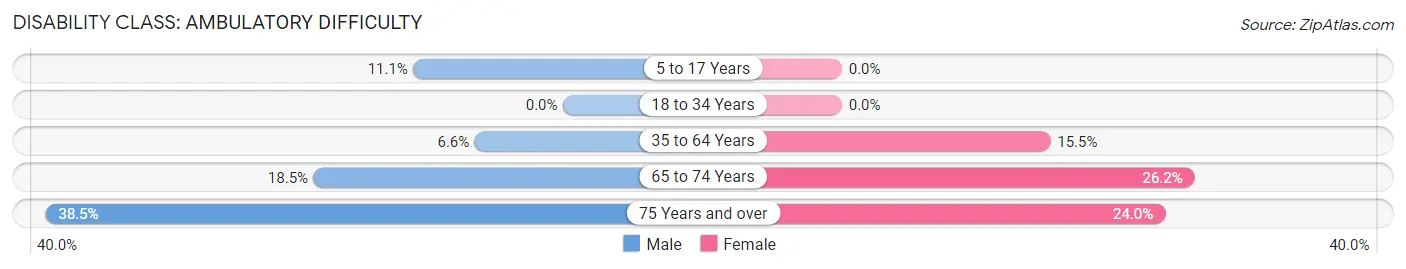
| Age Bracket | Male | Female |
| 5 to 17 Years | 29 (11.1%) | 0 (0.0%) |
| 18 to 34 Years | 0 (0.0%) | 0 (0.0%) |
| 35 to 64 Years | 22 (6.6%) | 65 (15.5%) |
| 65 to 74 Years | 5 (18.5%) | 11 (26.2%) |
| 75 Years and over | 20 (38.5%) | 24 (24.0%) |
Disability Class: Self-Care Difficulty
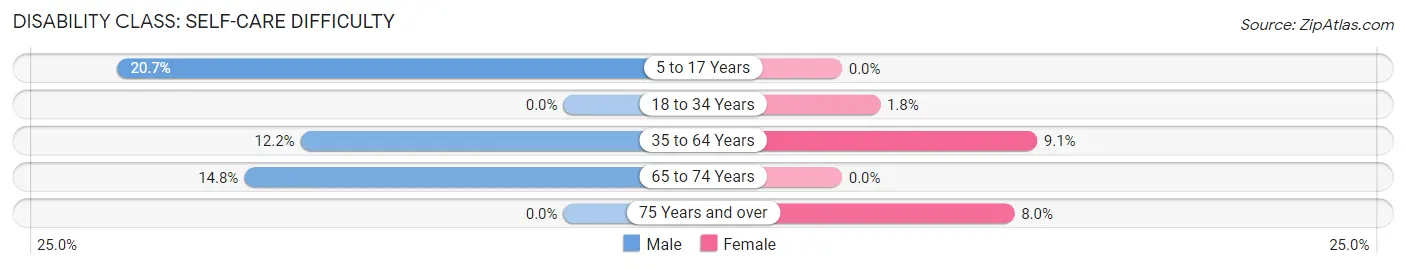
| Age Bracket | Male | Female |
| 5 to 17 Years | 54 (20.7%) | 0 (0.0%) |
| 18 to 34 Years | 0 (0.0%) | 4 (1.8%) |
| 35 to 64 Years | 41 (12.2%) | 38 (9.0%) |
| 65 to 74 Years | 4 (14.8%) | 0 (0.0%) |
| 75 Years and over | 0 (0.0%) | 8 (8.0%) |
Technology Access in Mount Sterling
Computing Device Access in Mount Sterling
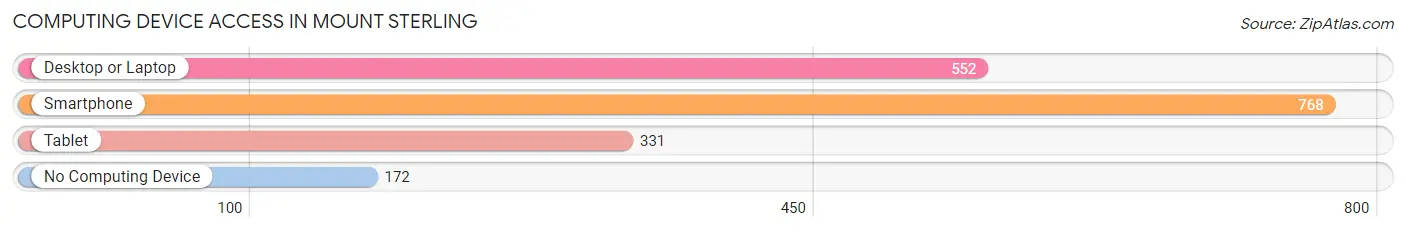
| Device Type | # Households | % Households |
| Desktop or Laptop | 552 | 54.9% |
| Smartphone | 768 | 76.3% |
| Tablet | 331 | 32.9% |
| No Computing Device | 172 | 17.1% |
| Total | 1,006 | 100.0% |
Internet Access in Mount Sterling
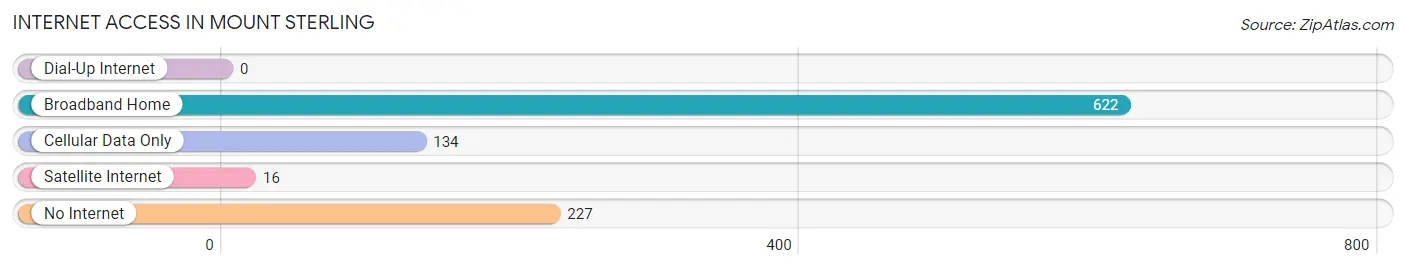
| Internet Type | # Households | % Households |
| Dial-Up Internet | 0 | 0.0% |
| Broadband Home | 622 | 61.8% |
| Cellular Data Only | 134 | 13.3% |
| Satellite Internet | 16 | 1.6% |
| No Internet | 227 | 22.6% |
| Total | 1,006 | 100.0% |
Mount Sterling Summary
History
Mount Sterling, Illinois is a small city located in Brown County, Illinois. It is the county seat of Brown County and is located about 40 miles west of Springfield, Illinois. The city was founded in 1825 and was named after the nearby Mount Sterling, which is the highest point in Brown County. The city was originally a trading post and was known as "The Crossroads" due to its location at the intersection of two major roads.
The city was officially incorporated in 1837 and was the first city in Brown County. The city was an important stop on the Underground Railroad and was home to many abolitionists. During the Civil War, the city was a major supply center for the Union Army. After the war, the city experienced a period of growth and prosperity.
In the late 19th century, the city was home to several industries, including a flour mill, a sawmill, a brickyard, and a furniture factory. The city also had a thriving agricultural industry, with many farmers growing corn, wheat, and other crops.
Geography
Mount Sterling is located in the western part of Brown County, Illinois. It is situated at the intersection of two major roads, US Route 24 and Illinois Route 99. The city is located about 40 miles west of Springfield, Illinois and about 80 miles south of Chicago.
The city is situated on the banks of the Little Wabash River and is surrounded by rolling hills and farmland. The city has a total area of 1.3 square miles, all of which is land. The city has a humid continental climate, with hot, humid summers and cold, snowy winters.
Economy
The economy of Mount Sterling is largely based on agriculture and manufacturing. The city is home to several large agricultural operations, including a grain elevator, a feed mill, and a dairy farm. The city is also home to several manufacturing companies, including a furniture factory, a plastics factory, and a metal fabrication plant.
The city is also home to several retail stores, restaurants, and other businesses. The city is served by several major highways, including US Route 24 and Illinois Route 99.
Demographics
As of the 2010 census, the population of Mount Sterling was 2,521. The racial makeup of the city was 97.2% White, 0.7% African American, 0.2% Native American, 0.3% Asian, 0.1% Pacific Islander, 0.5% from other races, and 1.1% from two or more races. Hispanic or Latino of any race were 1.7% of the population.
The median household income in Mount Sterling was $41,250, and the median family income was $50,000. The per capita income for the city was $20,845. About 11.2% of families and 14.2% of the population were below the poverty line, including 19.2% of those under age 18 and 8.2% of those age 65 or over.
Common Questions
What is Per Capita Income in Mount Sterling?
Per Capita income in Mount Sterling is $31,154.
What is the Median Family Income in Mount Sterling?
Median Family Income in Mount Sterling is $72,593.
What is the Median Household income in Mount Sterling?
Median Household Income in Mount Sterling is $55,000.
What is Income or Wage Gap in Mount Sterling?
Income or Wage Gap in Mount Sterling is 28.0%.
Women in Mount Sterling earn 72.0 cents for every dollar earned by a man.
What is Inequality or Gini Index in Mount Sterling?
Inequality or Gini Index in Mount Sterling is 0.44.
What is the Total Population of Mount Sterling?
Total Population of Mount Sterling is 2,177.
What is the Total Male Population of Mount Sterling?
Total Male Population of Mount Sterling is 1,159.
What is the Total Female Population of Mount Sterling?
Total Female Population of Mount Sterling is 1,018.
What is the Ratio of Males per 100 Females in Mount Sterling?
There are 113.85 Males per 100 Females in Mount Sterling.
What is the Ratio of Females per 100 Males in Mount Sterling?
There are 87.83 Females per 100 Males in Mount Sterling.
What is the Median Population Age in Mount Sterling?
Median Population Age in Mount Sterling is 34.2 Years.
What is the Average Family Size in Mount Sterling
Average Family Size in Mount Sterling is 2.8 People.
What is the Average Household Size in Mount Sterling
Average Household Size in Mount Sterling is 2.1 People.
How Large is the Labor Force in Mount Sterling?
There are 1,145 People in the Labor Forcein in Mount Sterling.
What is the Percentage of People in the Labor Force in Mount Sterling?
68.0% of People are in the Labor Force in Mount Sterling.
What is the Unemployment Rate in Mount Sterling?
Unemployment Rate in Mount Sterling is 3.1%.