High Ridge, MO Map & Demographics
High Ridge Map
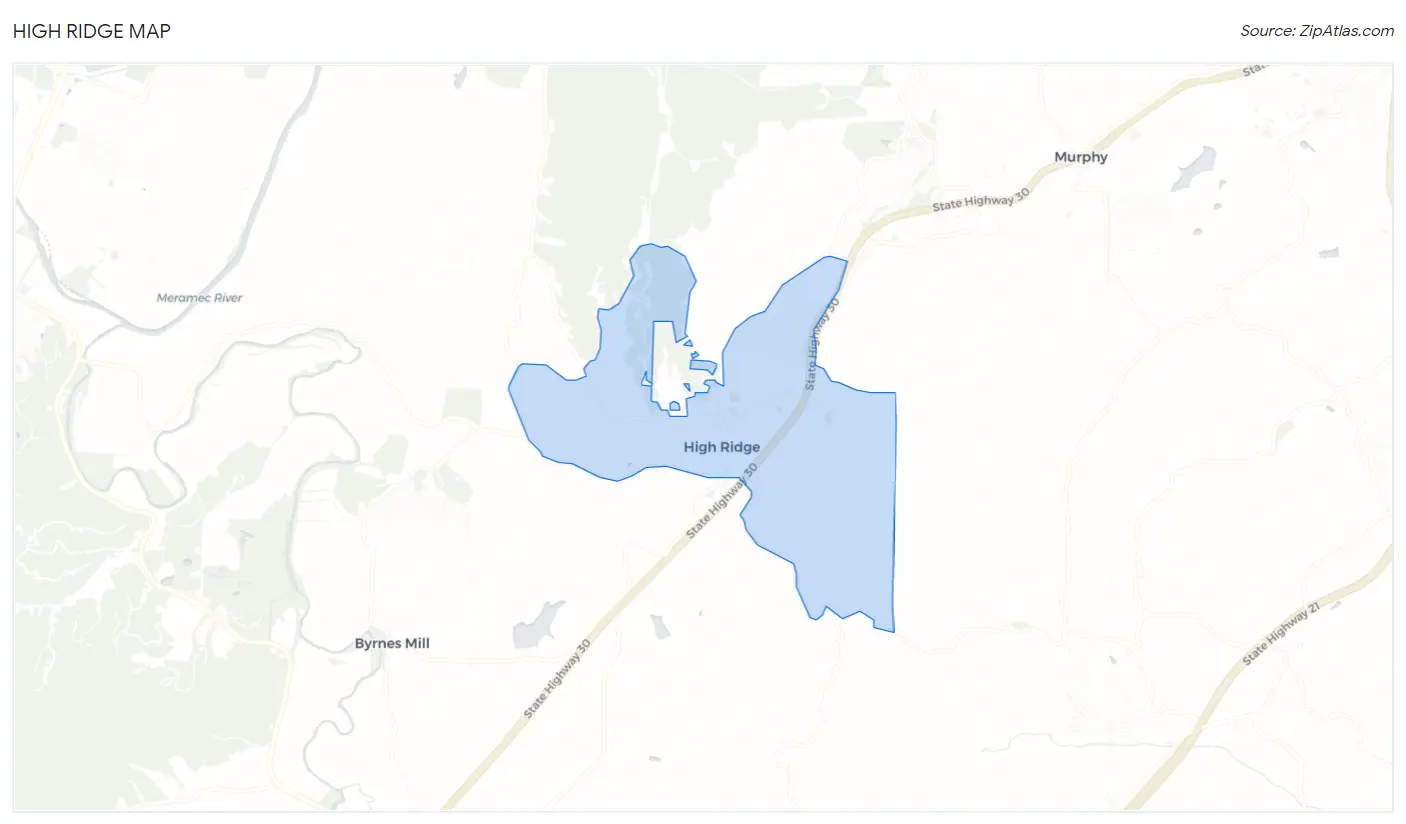
High Ridge Overview
$32,194
PER CAPITA INCOME
$83,507
AVG FAMILY INCOME
$70,333
AVG HOUSEHOLD INCOME
41.2%
WAGE / INCOME GAP [ % ]
58.8¢/ $1
WAGE / INCOME GAP [ $ ]
0.36
INEQUALITY / GINI INDEX
4,651
TOTAL POPULATION
2,257
MALE POPULATION
2,394
FEMALE POPULATION
94.28
MALES / 100 FEMALES
106.07
FEMALES / 100 MALES
45.0
MEDIAN AGE
3.2
AVG FAMILY SIZE
2.5
AVG HOUSEHOLD SIZE
2,591
LABOR FORCE [ PEOPLE ]
67.8%
PERCENT IN LABOR FORCE
3.7%
UNEMPLOYMENT RATE
High Ridge Zip Codes
High Ridge Area Codes
Income in High Ridge
Income Overview in High Ridge
Per Capita Income in High Ridge is $32,194, while median incomes of families and households are $83,507 and $70,333 respectively.
| Characteristic | Number | Measure |
| Per Capita Income | 4,651 | $32,194 |
| Median Family Income | 1,227 | $83,507 |
| Mean Family Income | 1,227 | $95,395 |
| Median Household Income | 1,828 | $70,333 |
| Mean Household Income | 1,828 | $78,564 |
| Income Deficit | 1,227 | $0 |
| Wage / Income Gap (%) | 4,651 | 41.16% |
| Wage / Income Gap ($) | 4,651 | 58.84¢ per $1 |
| Gini / Inequality Index | 4,651 | 0.36 |
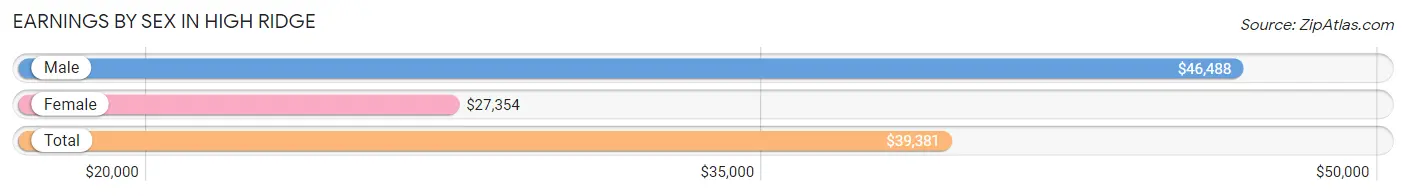
Earnings by Sex in High Ridge
Average Earnings in High Ridge are $39,381, $46,488 for men and $27,354 for women, a difference of 41.2%.
| Sex | Number | Average Earnings |
| Male | 1,319 (48.7%) | $46,488 |
| Female | 1,388 (51.3%) | $27,354 |
| Total | 2,707 (100.0%) | $39,381 |
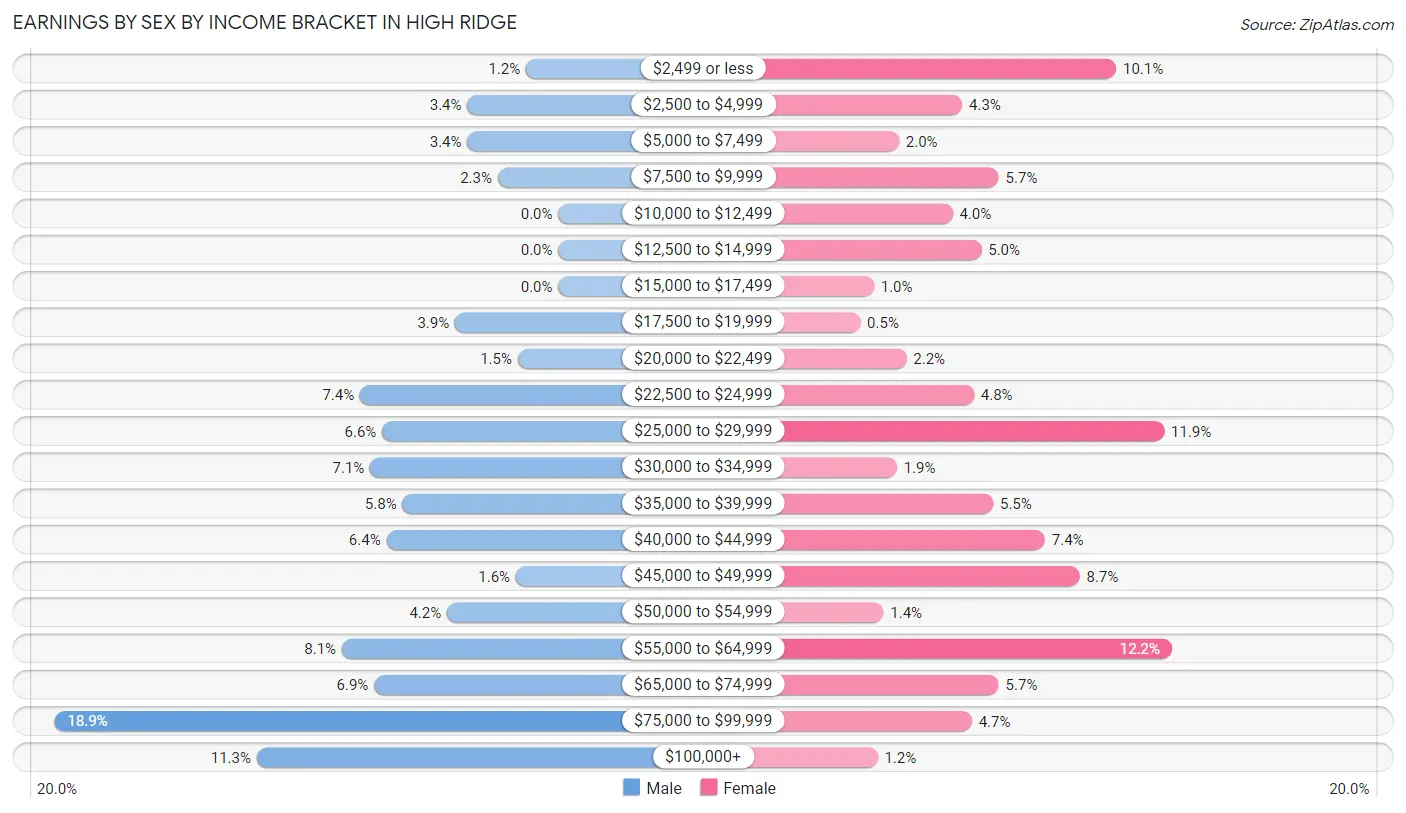
Earnings by Sex by Income Bracket in High Ridge
The most common earnings brackets in High Ridge are $75,000 to $99,999 for men (249 | 18.9%) and $55,000 to $64,999 for women (169 | 12.2%).
| Income | Male | Female |
| $2,499 or less | 16 (1.2%) | 140 (10.1%) |
| $2,500 to $4,999 | 45 (3.4%) | 60 (4.3%) |
| $5,000 to $7,499 | 45 (3.4%) | 27 (1.9%) |
| $7,500 to $9,999 | 30 (2.3%) | 79 (5.7%) |
| $10,000 to $12,499 | 0 (0.0%) | 55 (4.0%) |
| $12,500 to $14,999 | 0 (0.0%) | 70 (5.0%) |
| $15,000 to $17,499 | 0 (0.0%) | 14 (1.0%) |
| $17,500 to $19,999 | 51 (3.9%) | 7 (0.5%) |
| $20,000 to $22,499 | 20 (1.5%) | 31 (2.2%) |
| $22,500 to $24,999 | 98 (7.4%) | 66 (4.8%) |
| $25,000 to $29,999 | 87 (6.6%) | 165 (11.9%) |
| $30,000 to $34,999 | 93 (7.0%) | 26 (1.9%) |
| $35,000 to $39,999 | 77 (5.8%) | 76 (5.5%) |
| $40,000 to $44,999 | 85 (6.4%) | 103 (7.4%) |
| $45,000 to $49,999 | 21 (1.6%) | 121 (8.7%) |
| $50,000 to $54,999 | 55 (4.2%) | 19 (1.4%) |
| $55,000 to $64,999 | 107 (8.1%) | 169 (12.2%) |
| $65,000 to $74,999 | 91 (6.9%) | 79 (5.7%) |
| $75,000 to $99,999 | 249 (18.9%) | 65 (4.7%) |
| $100,000+ | 149 (11.3%) | 16 (1.1%) |
| Total | 1,319 (100.0%) | 1,388 (100.0%) |
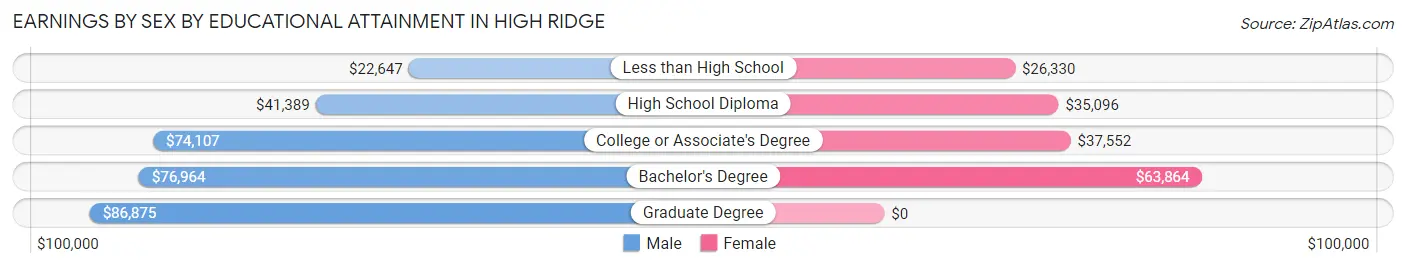
Earnings by Sex by Educational Attainment in High Ridge
Average earnings in High Ridge are $53,932 for men and $37,941 for women, a difference of 29.6%. Men with an educational attainment of graduate degree enjoy the highest average annual earnings of $86,875, while those with less than high school education earn the least with $22,647. Women with an educational attainment of bachelor's degree earn the most with the average annual earnings of $63,864, while those with less than high school education have the smallest earnings of $26,330.
| Educational Attainment | Male Income | Female Income |
| Less than High School | $22,647 | $26,330 |
| High School Diploma | $41,389 | $35,096 |
| College or Associate's Degree | $74,107 | $37,552 |
| Bachelor's Degree | $76,964 | $63,864 |
| Graduate Degree | $86,875 | $0 |
| Total | $53,932 | $37,941 |
Family Income in High Ridge
Family Income Brackets in High Ridge
According to the High Ridge family income data, there are 348 families falling into the $100,000 to $149,999 income range, which is the most common income bracket and makes up 28.4% of all families.
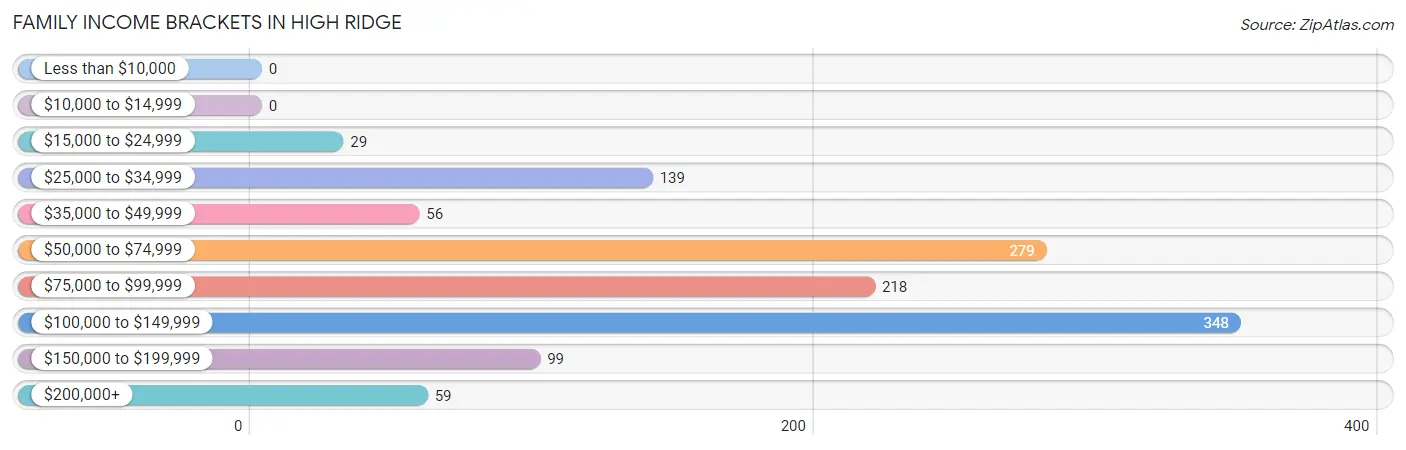
| Income Bracket | # Families | % Families |
| Less than $10,000 | 0 | 0.0% |
| $10,000 to $14,999 | 0 | 0.0% |
| $15,000 to $24,999 | 29 | 2.4% |
| $25,000 to $34,999 | 139 | 11.3% |
| $35,000 to $49,999 | 56 | 4.6% |
| $50,000 to $74,999 | 279 | 22.7% |
| $75,000 to $99,999 | 218 | 17.8% |
| $100,000 to $149,999 | 348 | 28.4% |
| $150,000 to $199,999 | 99 | 8.1% |
| $200,000+ | 59 | 4.8% |
Family Income by Famaliy Size in High Ridge
4-person families (253 | 20.6%) account for the highest median family income in High Ridge with $87,989 per family, while 2-person families (468 | 38.1%) have the highest median income of $41,442 per family member.

| Income Bracket | # Families | Median Income |
| 2-Person Families | 468 (38.1%) | $82,885 |
| 3-Person Families | 390 (31.8%) | $75,455 |
| 4-Person Families | 253 (20.6%) | $87,989 |
| 5-Person Families | 95 (7.7%) | $0 |
| 6-Person Families | 21 (1.7%) | $0 |
| 7+ Person Families | 0 (0.0%) | $0 |
| Total | 1,227 (100.0%) | $83,507 |
Family Income by Number of Earners in High Ridge
The median family income in High Ridge is $83,507, with families comprising 3+ earners (205) having the highest median family income of $146,797, while families with no earners (104) have the lowest median family income of $63,125, accounting for 16.7% and 8.5% of families, respectively.
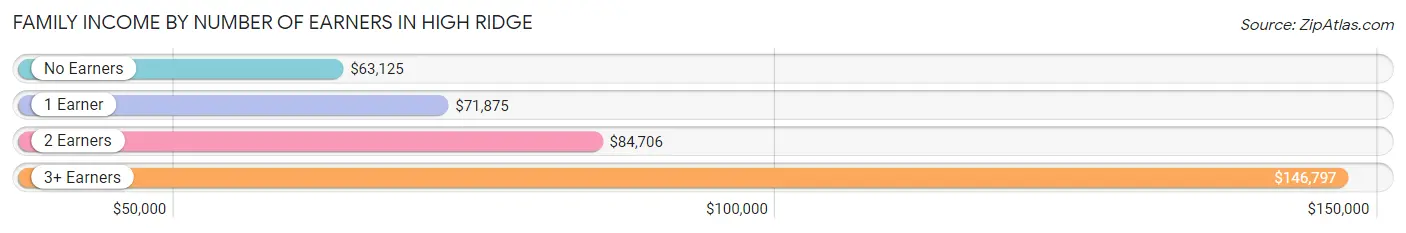
| Number of Earners | # Families | Median Income |
| No Earners | 104 (8.5%) | $63,125 |
| 1 Earner | 358 (29.2%) | $71,875 |
| 2 Earners | 560 (45.6%) | $84,706 |
| 3+ Earners | 205 (16.7%) | $146,797 |
| Total | 1,227 (100.0%) | $83,507 |
Household Income in High Ridge
Household Income Brackets in High Ridge
With 411 households falling in the category, the $50,000 to $74,999 income range is the most frequent in High Ridge, accounting for 22.5% of all households. In contrast, only 9 households (0.5%) fall into the $10,000 to $14,999 income bracket, making it the least populous group.
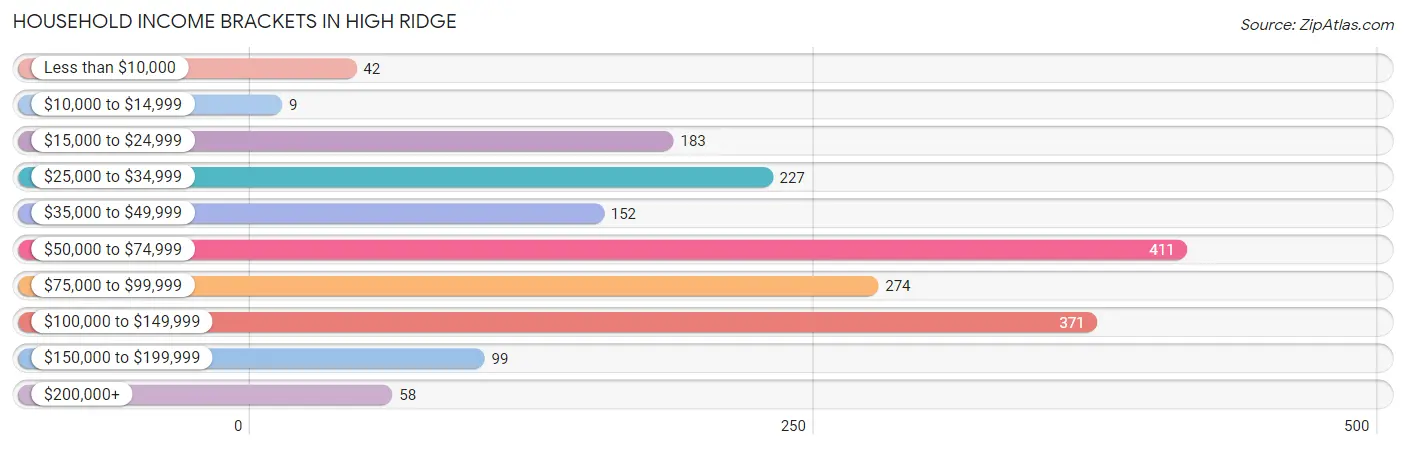
| Income Bracket | # Households | % Households |
| Less than $10,000 | 42 | 2.3% |
| $10,000 to $14,999 | 9 | 0.5% |
| $15,000 to $24,999 | 183 | 10.0% |
| $25,000 to $34,999 | 227 | 12.4% |
| $35,000 to $49,999 | 152 | 8.3% |
| $50,000 to $74,999 | 411 | 22.5% |
| $75,000 to $99,999 | 274 | 15.0% |
| $100,000 to $149,999 | 371 | 20.3% |
| $150,000 to $199,999 | 99 | 5.4% |
| $200,000+ | 58 | 3.2% |
Household Income by Householder Age in High Ridge
The median household income in High Ridge is $70,333, with the highest median household income of $84,050 found in the 45 to 64 years age bracket for the primary householder. A total of 783 households (42.8%) fall into this category. Meanwhile, the 15 to 24 years age bracket for the primary householder has the lowest median household income of $0, with 12 households (0.7%) in this group.
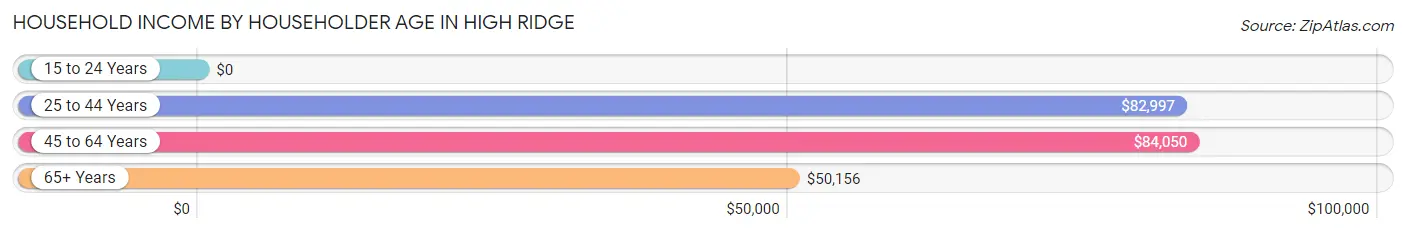
| Income Bracket | # Households | Median Income |
| 15 to 24 Years | 12 (0.7%) | $0 |
| 25 to 44 Years | 501 (27.4%) | $82,997 |
| 45 to 64 Years | 783 (42.8%) | $84,050 |
| 65+ Years | 532 (29.1%) | $50,156 |
| Total | 1,828 (100.0%) | $70,333 |
Poverty in High Ridge
Income Below Poverty by Sex and Age in High Ridge
With 1.4% poverty level for males and 4.4% for females among the residents of High Ridge, 75 year old and over males and 65 to 74 year old females are the most vulnerable to poverty, with 13 males (7.6%) and 37 females (17.3%) in their respective age groups living below the poverty level.
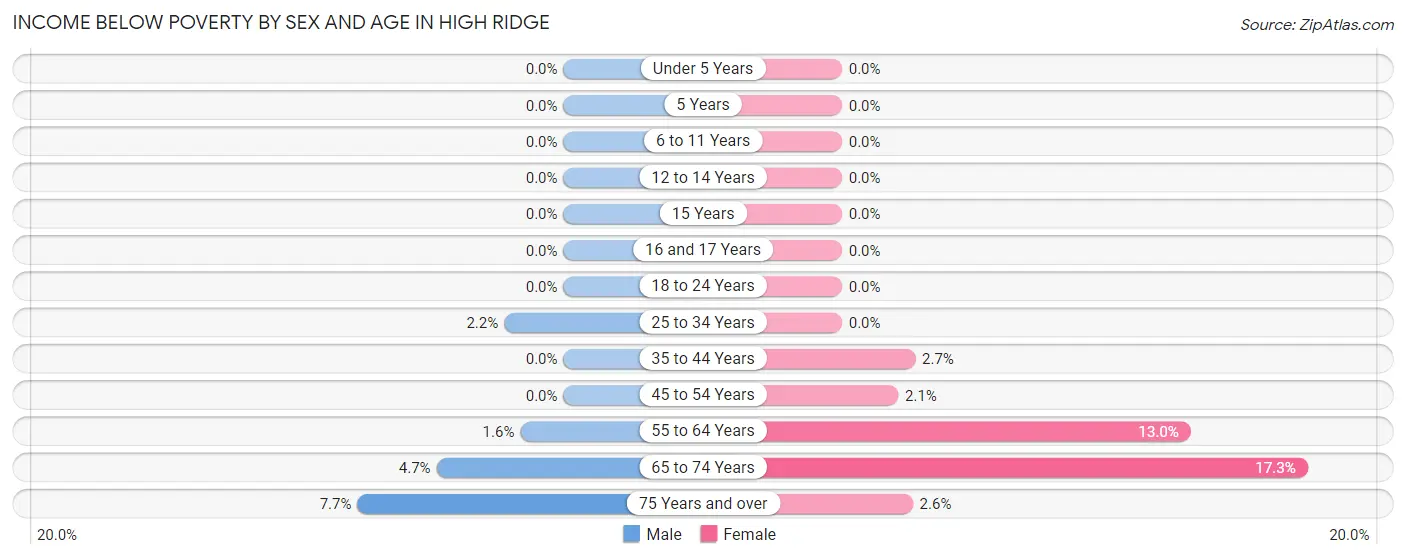
| Age Bracket | Male | Female |
| Under 5 Years | 0 (0.0%) | 0 (0.0%) |
| 5 Years | 0 (0.0%) | 0 (0.0%) |
| 6 to 11 Years | 0 (0.0%) | 0 (0.0%) |
| 12 to 14 Years | 0 (0.0%) | 0 (0.0%) |
| 15 Years | 0 (0.0%) | 0 (0.0%) |
| 16 and 17 Years | 0 (0.0%) | 0 (0.0%) |
| 18 to 24 Years | 0 (0.0%) | 0 (0.0%) |
| 25 to 34 Years | 5 (2.2%) | 0 (0.0%) |
| 35 to 44 Years | 0 (0.0%) | 10 (2.7%) |
| 45 to 54 Years | 0 (0.0%) | 9 (2.1%) |
| 55 to 64 Years | 5 (1.6%) | 43 (13.0%) |
| 65 to 74 Years | 8 (4.7%) | 37 (17.3%) |
| 75 Years and over | 13 (7.6%) | 7 (2.6%) |
| Total | 31 (1.4%) | 106 (4.4%) |
Income Above Poverty by Sex and Age in High Ridge
According to the poverty statistics in High Ridge, males aged under 5 years and females aged under 5 years are the age groups that are most secure financially, with 100.0% of males and 100.0% of females in these age groups living above the poverty line.
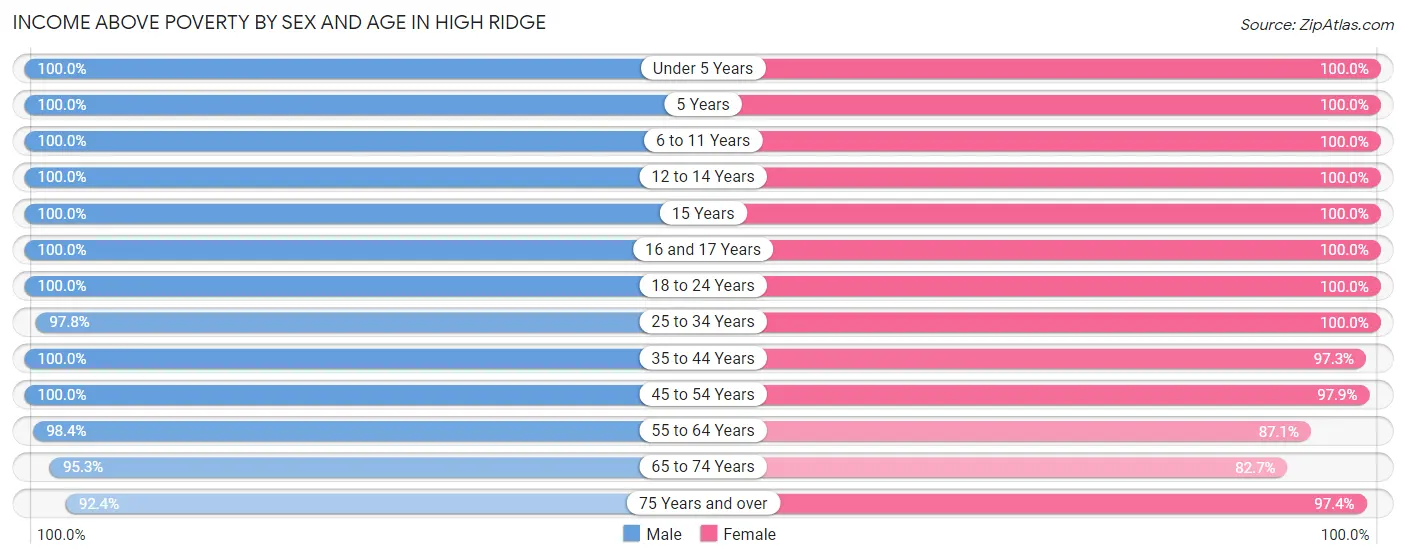
| Age Bracket | Male | Female |
| Under 5 Years | 27 (100.0%) | 165 (100.0%) |
| 5 Years | 23 (100.0%) | 26 (100.0%) |
| 6 to 11 Years | 205 (100.0%) | 141 (100.0%) |
| 12 to 14 Years | 179 (100.0%) | 36 (100.0%) |
| 15 Years | 9 (100.0%) | 19 (100.0%) |
| 16 and 17 Years | 54 (100.0%) | 85 (100.0%) |
| 18 to 24 Years | 174 (100.0%) | 152 (100.0%) |
| 25 to 34 Years | 222 (97.8%) | 159 (100.0%) |
| 35 to 44 Years | 278 (100.0%) | 358 (97.3%) |
| 45 to 54 Years | 429 (100.0%) | 422 (97.9%) |
| 55 to 64 Years | 307 (98.4%) | 289 (87.1%) |
| 65 to 74 Years | 162 (95.3%) | 177 (82.7%) |
| 75 Years and over | 157 (92.3%) | 259 (97.4%) |
| Total | 2,226 (98.6%) | 2,288 (95.6%) |
Income Below Poverty Among Married-Couple Families in High Ridge
| Children | Above Poverty | Below Poverty |
| No Children | 481 (100.0%) | 0 (0.0%) |
| 1 or 2 Children | 329 (100.0%) | 0 (0.0%) |
| 3 or 4 Children | 84 (100.0%) | 0 (0.0%) |
| 5 or more Children | 0 (0.0%) | 0 (0.0%) |
| Total | 894 (100.0%) | 0 (0.0%) |
Income Below Poverty Among Single-Parent Households in High Ridge
| Children | Single Father | Single Mother |
| No Children | 0 (0.0%) | 0 (0.0%) |
| 1 or 2 Children | 0 (0.0%) | 0 (0.0%) |
| 3 or 4 Children | 0 (0.0%) | 0 (0.0%) |
| 5 or more Children | 0 (0.0%) | 0 (0.0%) |
| Total | 0 (0.0%) | 0 (0.0%) |
Income Below Poverty Among Married-Couple vs Single-Parent Households in High Ridge
| Children | Married-Couple Families | Single-Parent Households |
| No Children | 0 (0.0%) | 0 (0.0%) |
| 1 or 2 Children | 0 (0.0%) | 0 (0.0%) |
| 3 or 4 Children | 0 (0.0%) | 0 (0.0%) |
| 5 or more Children | 0 (0.0%) | 0 (0.0%) |
| Total | 0 (0.0%) | 0 (0.0%) |
Race in High Ridge
The most populous races in High Ridge are White / Caucasian (4,243 | 91.2%), Two or more Races (287 | 6.2%), and Black / African American (90 | 1.9%).
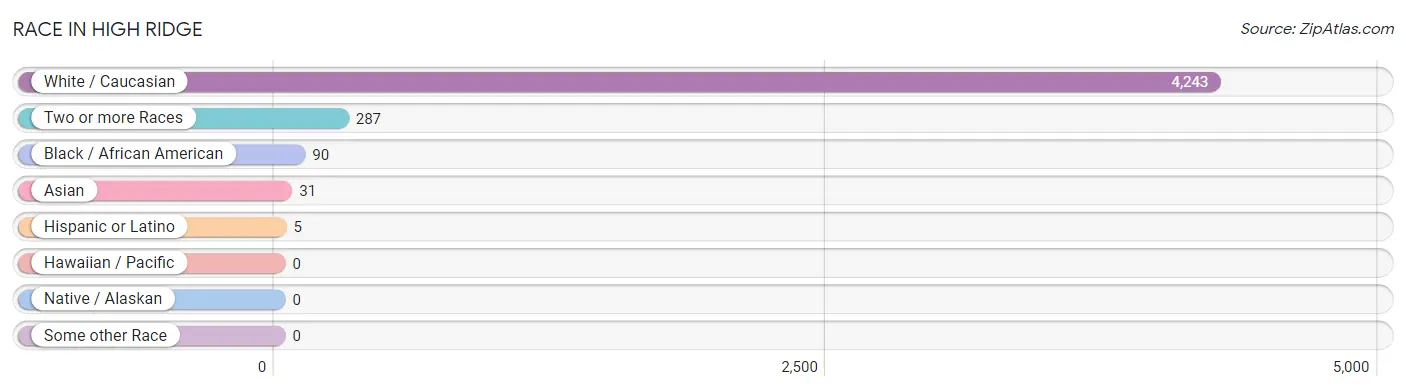
| Race | # Population | % Population |
| Asian | 31 | 0.7% |
| Black / African American | 90 | 1.9% |
| Hawaiian / Pacific | 0 | 0.0% |
| Hispanic or Latino | 5 | 0.1% |
| Native / Alaskan | 0 | 0.0% |
| White / Caucasian | 4,243 | 91.2% |
| Two or more Races | 287 | 6.2% |
| Some other Race | 0 | 0.0% |
| Total | 4,651 | 100.0% |
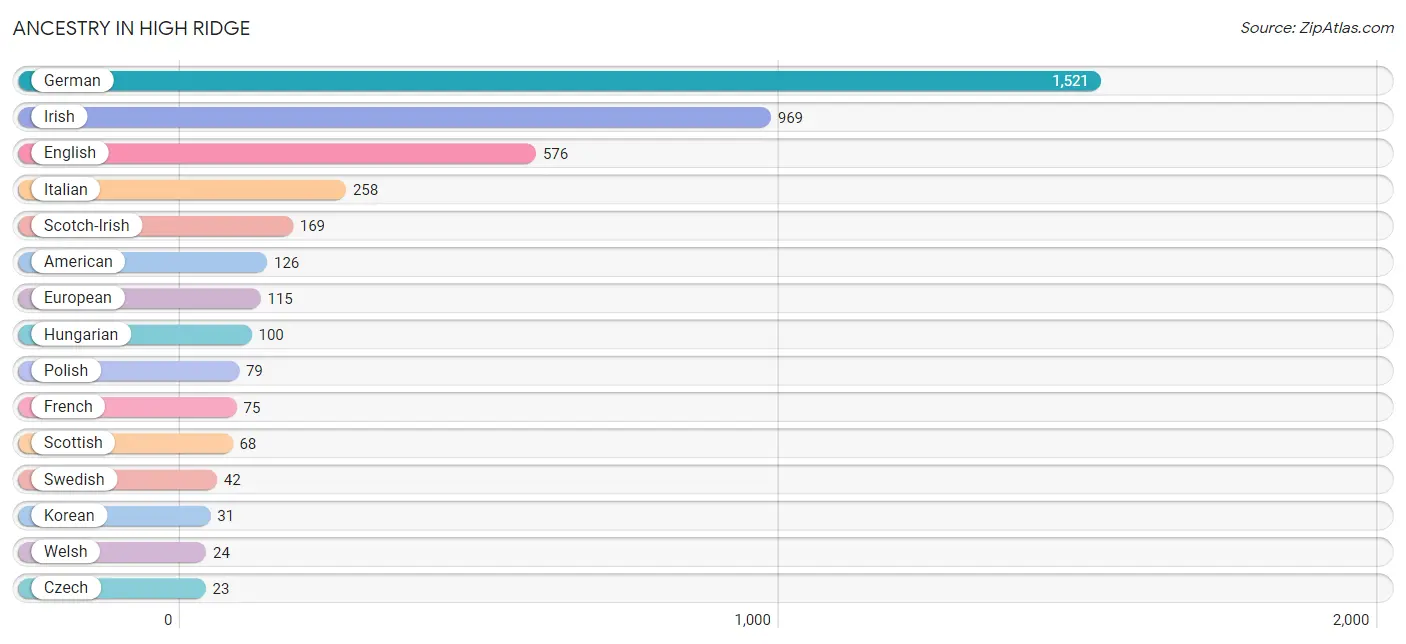
Ancestry in High Ridge
The most populous ancestries reported in High Ridge are German (1,521 | 32.7%), Irish (969 | 20.8%), English (576 | 12.4%), Italian (258 | 5.6%), and Scotch-Irish (169 | 3.6%), together accounting for 75.1% of all High Ridge residents.
| Ancestry | # Population | % Population |
| American | 126 | 2.7% |
| Arab | 19 | 0.4% |
| Austrian | 12 | 0.3% |
| British | 21 | 0.4% |
| Burmese | 14 | 0.3% |
| Croatian | 18 | 0.4% |
| Czech | 23 | 0.5% |
| Danish | 11 | 0.2% |
| Egyptian | 19 | 0.4% |
| English | 576 | 12.4% |
| European | 115 | 2.5% |
| French | 75 | 1.6% |
| German | 1,521 | 32.7% |
| Hungarian | 100 | 2.1% |
| Irish | 969 | 20.8% |
| Italian | 258 | 5.6% |
| Korean | 31 | 0.7% |
| Mexican | 5 | 0.1% |
| Norwegian | 11 | 0.2% |
| Polish | 79 | 1.7% |
| Scandinavian | 15 | 0.3% |
| Scotch-Irish | 169 | 3.6% |
| Scottish | 68 | 1.5% |
| Slovak | 11 | 0.2% |
| Swedish | 42 | 0.9% |
| Welsh | 24 | 0.5% | View All 26 Rows |
Immigrants in High Ridge
The most numerous immigrant groups reported in High Ridge came from Eastern Europe (47 | 1.0%), Europe (47 | 1.0%), Croatia (34 | 0.7%), Asia (31 | 0.7%), and Philippines (31 | 0.7%), together accounting for 4.1% of all High Ridge residents.
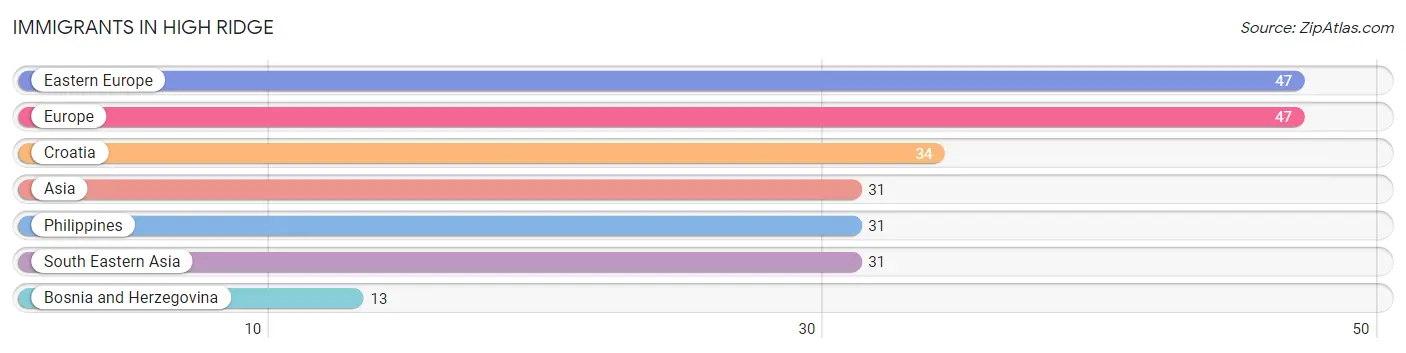
| Immigration Origin | # Population | % Population |
| Asia | 31 | 0.7% |
| Bosnia and Herzegovina | 13 | 0.3% |
| Croatia | 34 | 0.7% |
| Eastern Europe | 47 | 1.0% |
| Europe | 47 | 1.0% |
| Philippines | 31 | 0.7% |
| South Eastern Asia | 31 | 0.7% | View All 7 Rows |
Sex and Age in High Ridge
Sex and Age in High Ridge
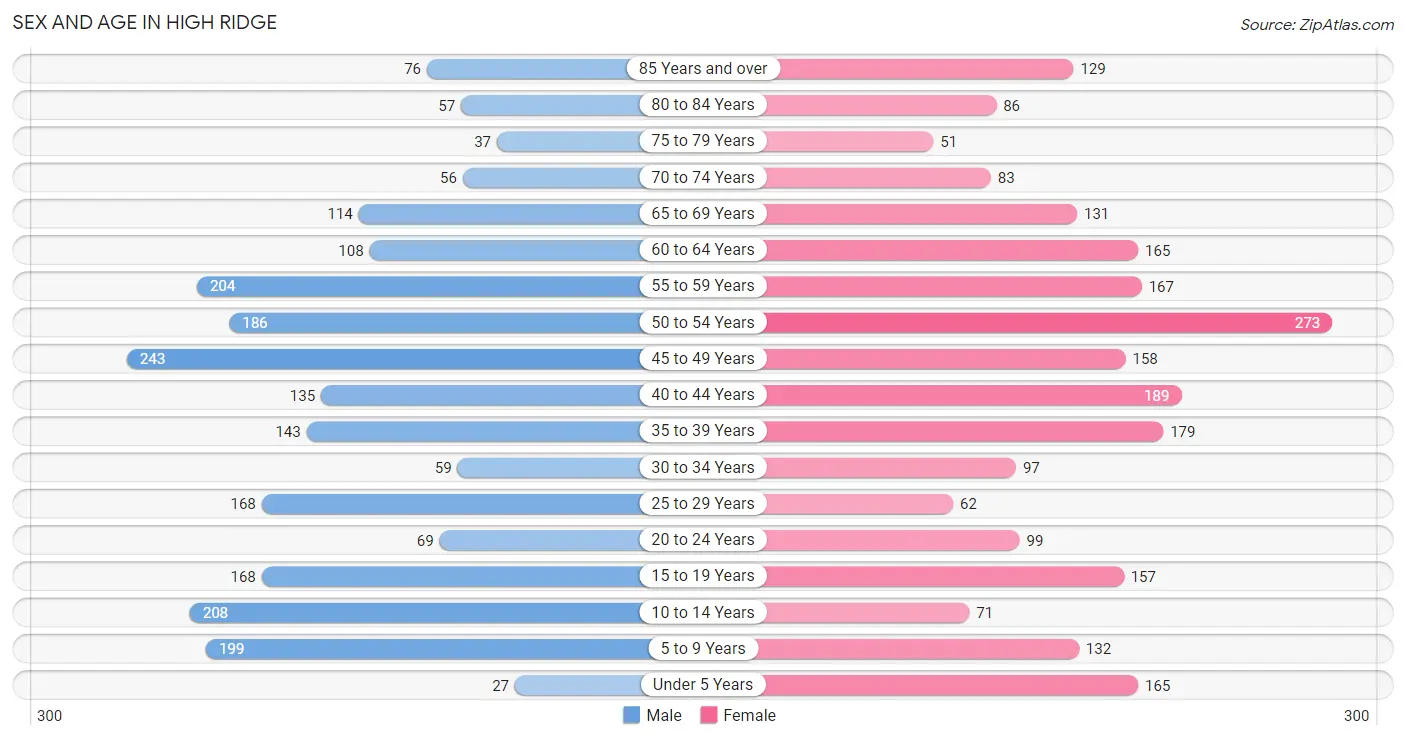
The most populous age groups in High Ridge are 45 to 49 Years (243 | 10.8%) for men and 50 to 54 Years (273 | 11.4%) for women.
| Age Bracket | Male | Female |
| Under 5 Years | 27 (1.2%) | 165 (6.9%) |
| 5 to 9 Years | 199 (8.8%) | 132 (5.5%) |
| 10 to 14 Years | 208 (9.2%) | 71 (3.0%) |
| 15 to 19 Years | 168 (7.4%) | 157 (6.6%) |
| 20 to 24 Years | 69 (3.1%) | 99 (4.1%) |
| 25 to 29 Years | 168 (7.4%) | 62 (2.6%) |
| 30 to 34 Years | 59 (2.6%) | 97 (4.1%) |
| 35 to 39 Years | 143 (6.3%) | 179 (7.5%) |
| 40 to 44 Years | 135 (6.0%) | 189 (7.9%) |
| 45 to 49 Years | 243 (10.8%) | 158 (6.6%) |
| 50 to 54 Years | 186 (8.2%) | 273 (11.4%) |
| 55 to 59 Years | 204 (9.0%) | 167 (7.0%) |
| 60 to 64 Years | 108 (4.8%) | 165 (6.9%) |
| 65 to 69 Years | 114 (5.1%) | 131 (5.5%) |
| 70 to 74 Years | 56 (2.5%) | 83 (3.5%) |
| 75 to 79 Years | 37 (1.6%) | 51 (2.1%) |
| 80 to 84 Years | 57 (2.5%) | 86 (3.6%) |
| 85 Years and over | 76 (3.4%) | 129 (5.4%) |
| Total | 2,257 (100.0%) | 2,394 (100.0%) |
Families and Households in High Ridge
Median Family Size in High Ridge
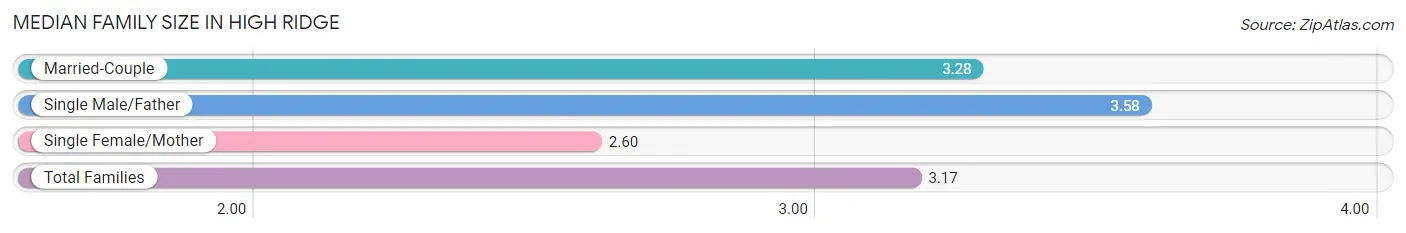
The median family size in High Ridge is 3.17 persons per family, with single male/father families (95 | 7.7%) accounting for the largest median family size of 3.58 persons per family. On the other hand, single female/mother families (238 | 19.4%) represent the smallest median family size with 2.60 persons per family.
| Family Type | # Families | Family Size |
| Married-Couple | 894 (72.9%) | 3.28 |
| Single Male/Father | 95 (7.7%) | 3.58 |
| Single Female/Mother | 238 (19.4%) | 2.60 |
| Total Families | 1,227 (100.0%) | 3.17 |
Median Household Size in High Ridge
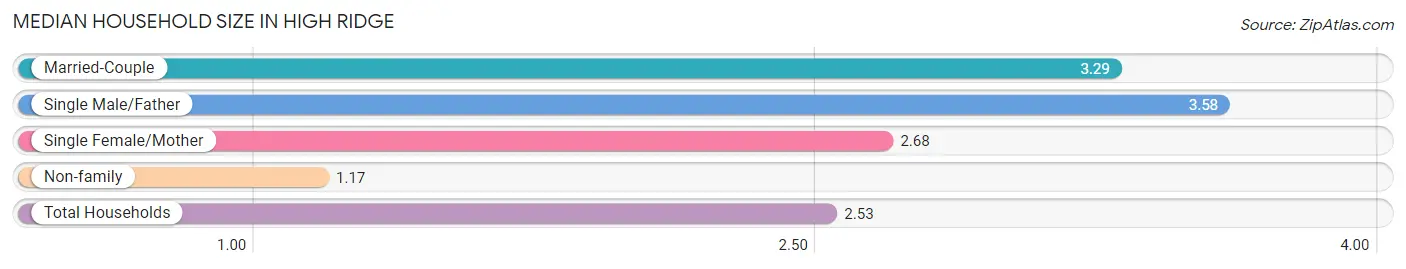
The median household size in High Ridge is 2.53 persons per household, with single male/father households (95 | 5.2%) accounting for the largest median household size of 3.58 persons per household. non-family households (601 | 32.9%) represent the smallest median household size with 1.17 persons per household.
| Household Type | # Households | Household Size |
| Married-Couple | 894 (48.9%) | 3.29 |
| Single Male/Father | 95 (5.2%) | 3.58 |
| Single Female/Mother | 238 (13.0%) | 2.68 |
| Non-family | 601 (32.9%) | 1.17 |
| Total Households | 1,828 (100.0%) | 2.53 |
Household Size by Marriage Status in High Ridge
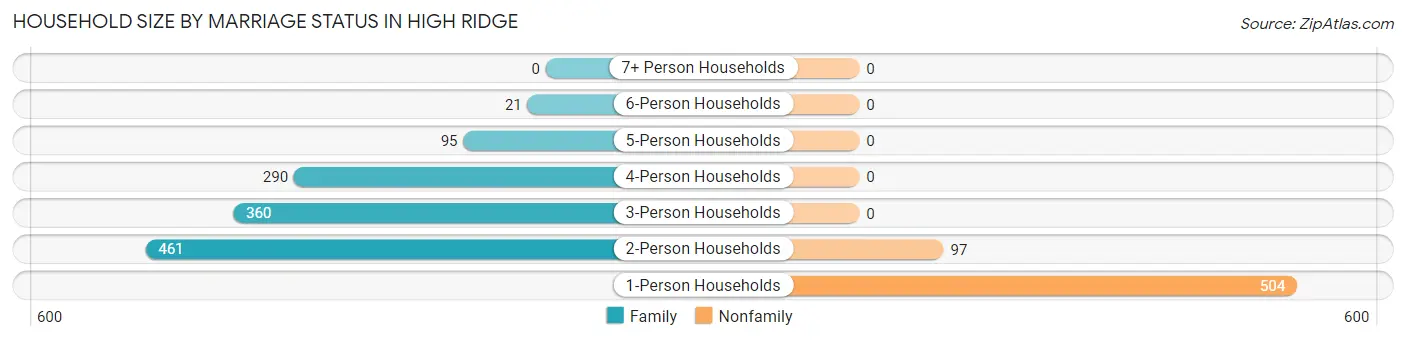
Out of a total of 1,828 households in High Ridge, 1,227 (67.1%) are family households, while 601 (32.9%) are nonfamily households. The most numerous type of family households are 2-person households, comprising 461, and the most common type of nonfamily households are 1-person households, comprising 504.
| Household Size | Family Households | Nonfamily Households |
| 1-Person Households | - | 504 (27.6%) |
| 2-Person Households | 461 (25.2%) | 97 (5.3%) |
| 3-Person Households | 360 (19.7%) | 0 (0.0%) |
| 4-Person Households | 290 (15.9%) | 0 (0.0%) |
| 5-Person Households | 95 (5.2%) | 0 (0.0%) |
| 6-Person Households | 21 (1.1%) | 0 (0.0%) |
| 7+ Person Households | 0 (0.0%) | 0 (0.0%) |
| Total | 1,227 (67.1%) | 601 (32.9%) |
Female Fertility in High Ridge
Fertility by Age in High Ridge
Average fertility rate in High Ridge is 37.0 births per 1,000 women. Women in the age bracket of 20 to 34 years have the highest fertility rate with 143.0 births per 1,000 women. Women in the age bracket of 20 to 34 years acount for 100.0% of all women with births.
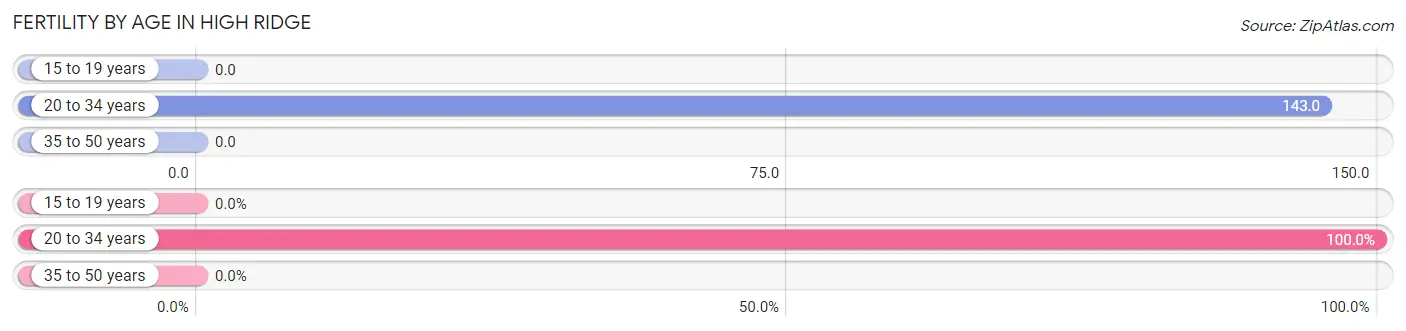
| Age Bracket | Women with Births | Births / 1,000 Women |
| 15 to 19 years | 0 (0.0%) | 0.0 |
| 20 to 34 years | 37 (100.0%) | 143.0 |
| 35 to 50 years | 0 (0.0%) | 0.0 |
| Total | 37 (100.0%) | 37.0 |
Fertility by Age by Marriage Status in High Ridge
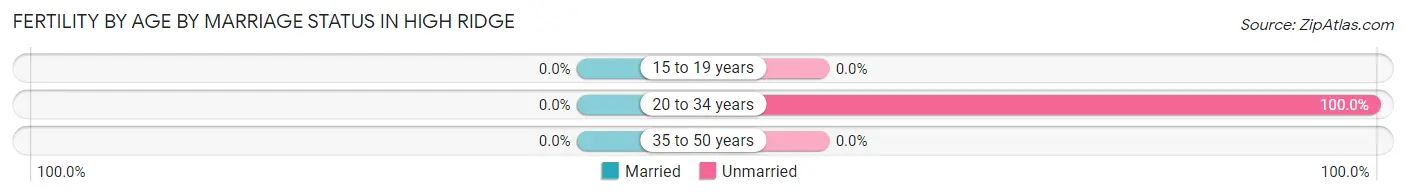
| Age Bracket | Married | Unmarried |
| 15 to 19 years | 0 (0.0%) | 0 (0.0%) |
| 20 to 34 years | 0 (0.0%) | 37 (100.0%) |
| 35 to 50 years | 0 (0.0%) | 0 (0.0%) |
| Total | 0 (0.0%) | 37 (100.0%) |
Fertility by Education in High Ridge
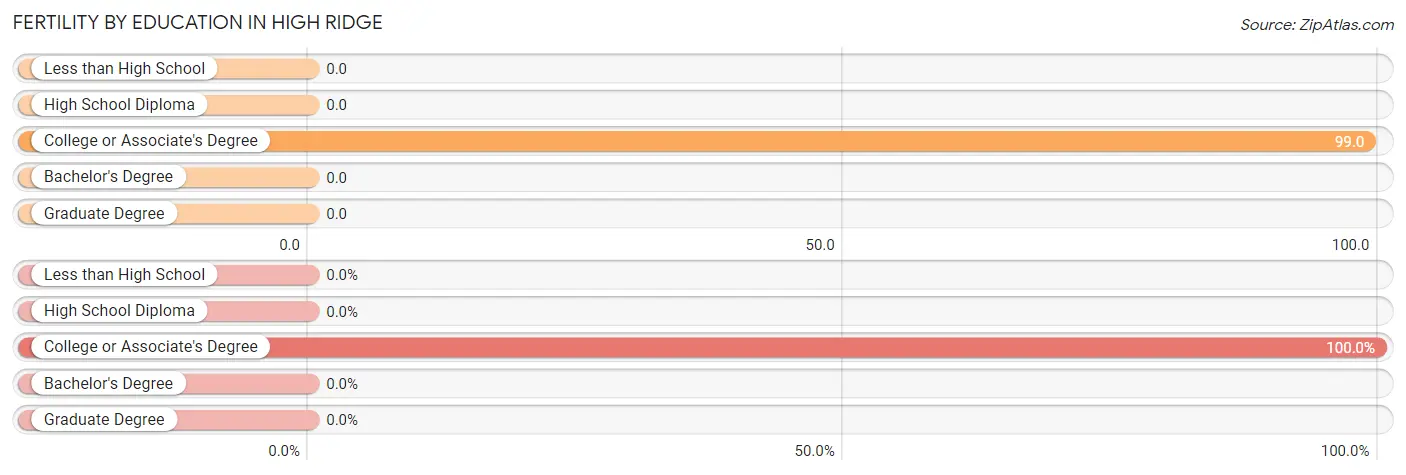
| Educational Attainment | Women with Births | Births / 1,000 Women |
| Less than High School | 0 (0.0%) | 0.0 |
| High School Diploma | 0 (0.0%) | 0.0 |
| College or Associate's Degree | 37 (100.0%) | 99.0 |
| Bachelor's Degree | 0 (0.0%) | 0.0 |
| Graduate Degree | 0 (0.0%) | 0.0 |
| Total | 37 (100.0%) | 37.0 |
Fertility by Education by Marriage Status in High Ridge
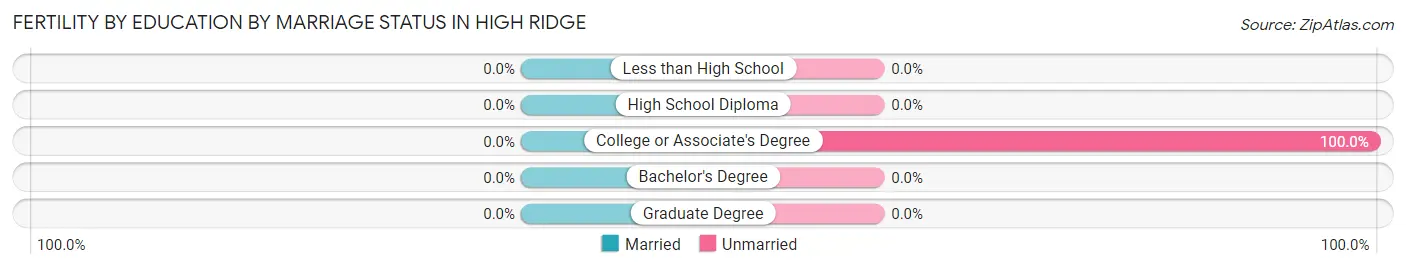
| Educational Attainment | Married | Unmarried |
| Less than High School | 0 (0.0%) | 0 (0.0%) |
| High School Diploma | 0 (0.0%) | 0 (0.0%) |
| College or Associate's Degree | 0 (0.0%) | 37 (100.0%) |
| Bachelor's Degree | 0 (0.0%) | 0 (0.0%) |
| Graduate Degree | 0 (0.0%) | 0 (0.0%) |
| Total | 0 (0.0%) | 37 (100.0%) |
Employment Characteristics in High Ridge
Employment by Class of Employer in High Ridge
Among the 2,445 employed individuals in High Ridge, private company employees (1,848 | 75.6%), not-for-profit organizations (255 | 10.4%), and self-employed (not incorporated) (133 | 5.4%) make up the most common classes of employment.
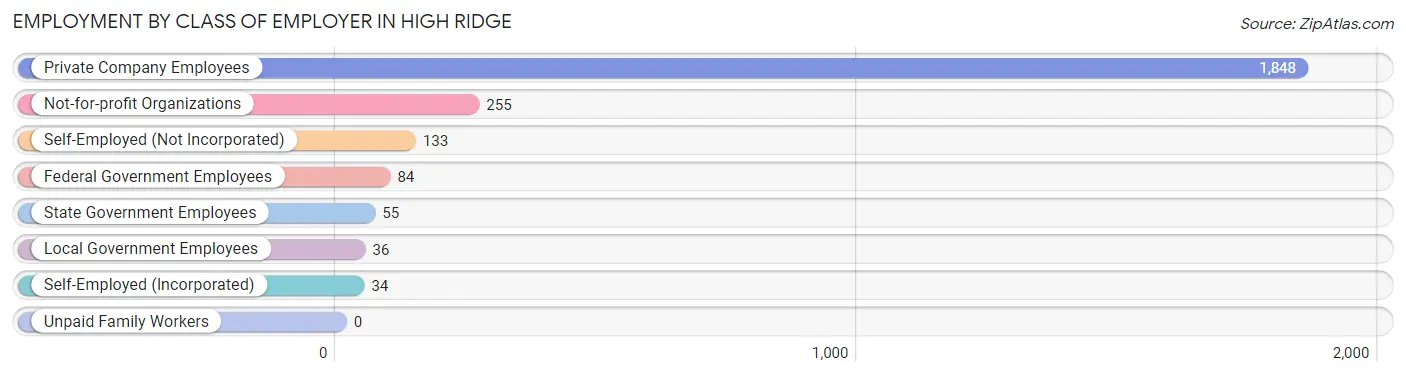
| Employer Class | # Employees | % Employees |
| Private Company Employees | 1,848 | 75.6% |
| Self-Employed (Incorporated) | 34 | 1.4% |
| Self-Employed (Not Incorporated) | 133 | 5.4% |
| Not-for-profit Organizations | 255 | 10.4% |
| Local Government Employees | 36 | 1.5% |
| State Government Employees | 55 | 2.2% |
| Federal Government Employees | 84 | 3.4% |
| Unpaid Family Workers | 0 | 0.0% |
| Total | 2,445 | 100.0% |
Employment Status by Age in High Ridge
According to the labor force statistics for High Ridge, out of the total population over 16 years of age (3,821), 67.8% or 2,591 individuals are in the labor force, with 3.7% or 96 of them unemployed. The age group with the highest labor force participation rate is 25 to 29 years, with 100.0% or 230 individuals in the labor force. Within the labor force, the 25 to 29 years age range has the highest percentage of unemployed individuals, with 21.7% or 50 of them being unemployed.
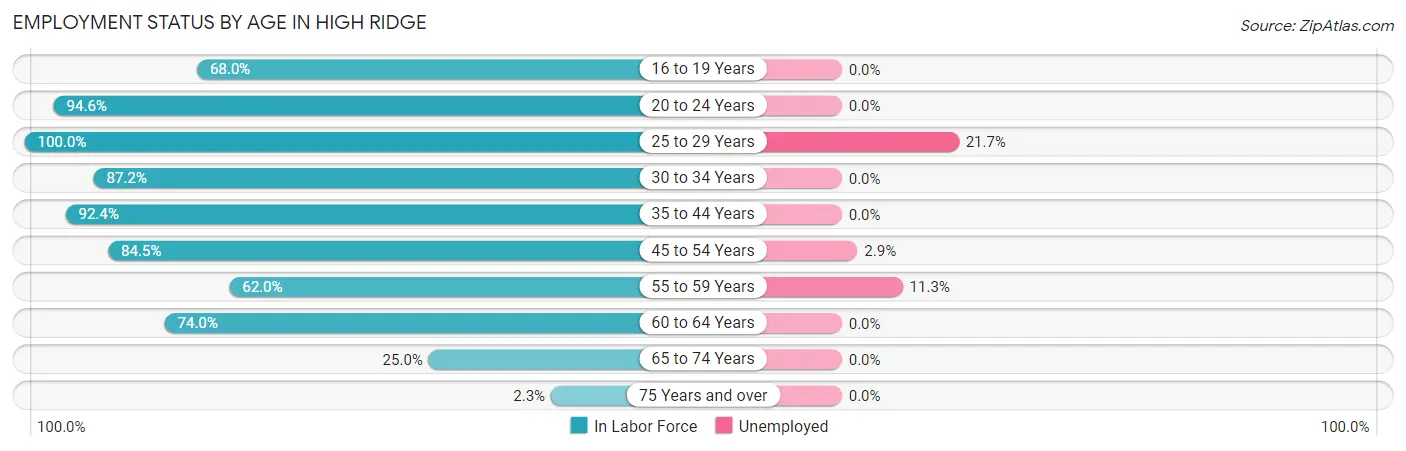
| Age Bracket | In Labor Force | Unemployed |
| 16 to 19 Years | 202 (68.0%) | 0 (0.0%) |
| 20 to 24 Years | 159 (94.6%) | 0 (0.0%) |
| 25 to 29 Years | 230 (100.0%) | 50 (21.7%) |
| 30 to 34 Years | 136 (87.2%) | 0 (0.0%) |
| 35 to 44 Years | 597 (92.4%) | 0 (0.0%) |
| 45 to 54 Years | 727 (84.5%) | 21 (2.9%) |
| 55 to 59 Years | 230 (62.0%) | 26 (11.3%) |
| 60 to 64 Years | 202 (74.0%) | 0 (0.0%) |
| 65 to 74 Years | 96 (25.0%) | 0 (0.0%) |
| 75 Years and over | 10 (2.3%) | 0 (0.0%) |
| Total | 2,591 (67.8%) | 96 (3.7%) |
Employment Status by Educational Attainment in High Ridge
According to labor force statistics for High Ridge, 83.7% of individuals (2,123) out of the total population between 25 and 64 years of age (2,536) are in the labor force, with 4.6% or 98 of them being unemployed. The group with the highest labor force participation rate are those with the educational attainment of college / associate degree, with 89.8% or 810 individuals in the labor force. Within the labor force, individuals with high school diploma education have the highest percentage of unemployment, with 11.9% or 97 of them being unemployed.
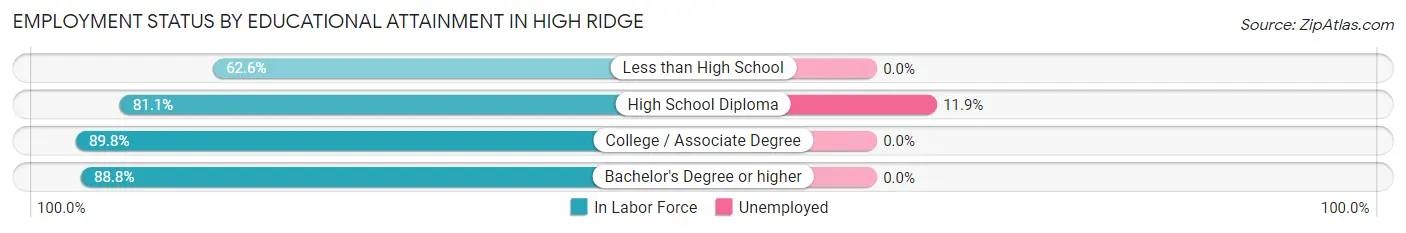
| Educational Attainment | In Labor Force | Unemployed |
| Less than High School | 147 (62.6%) | 0 (0.0%) |
| High School Diploma | 817 (81.1%) | 120 (11.9%) |
| College / Associate Degree | 810 (89.8%) | 0 (0.0%) |
| Bachelor's Degree or higher | 348 (88.8%) | 0 (0.0%) |
| Total | 2,123 (83.7%) | 117 (4.6%) |
Employment Occupations by Sex in High Ridge
Management, Business, Science and Arts Occupations
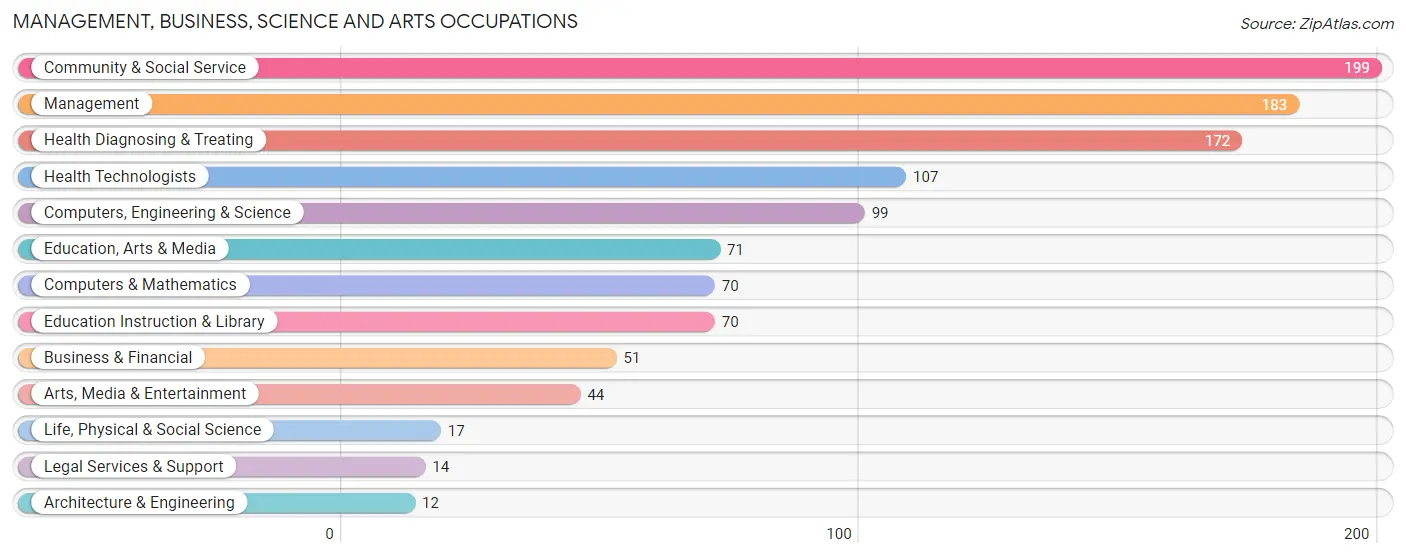
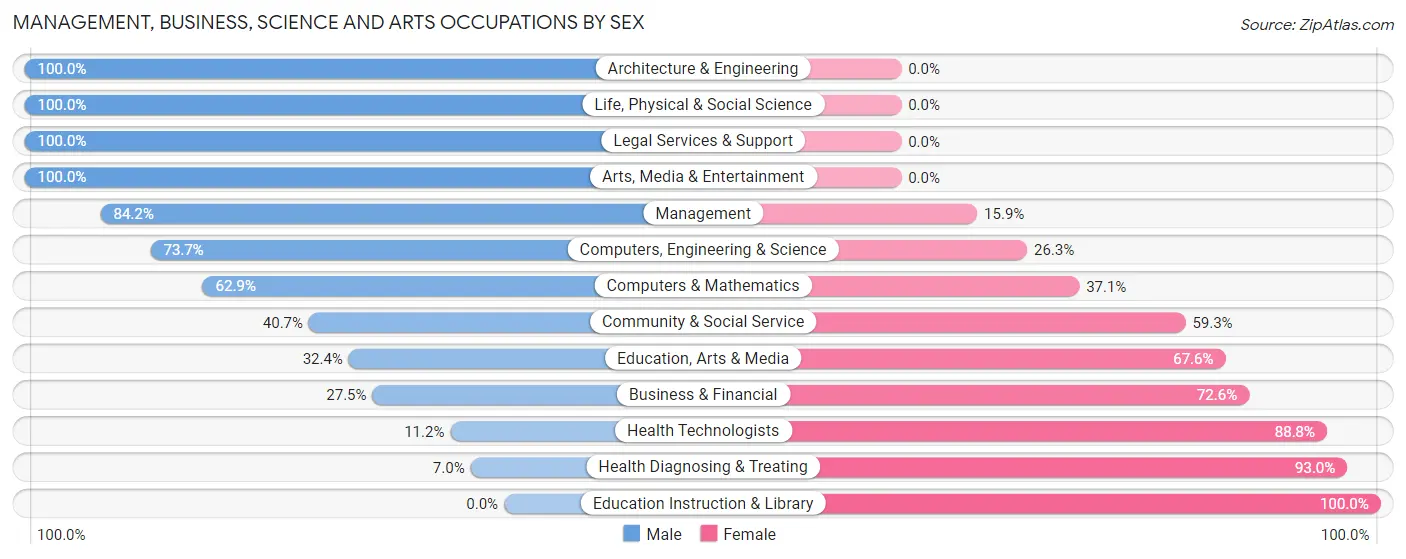
The most common Management, Business, Science and Arts occupations in High Ridge are Community & Social Service (199 | 8.0%), Management (183 | 7.3%), Health Diagnosing & Treating (172 | 6.9%), Health Technologists (107 | 4.3%), and Computers, Engineering & Science (99 | 4.0%).
Management, Business, Science and Arts Occupations by Sex
Within the Management, Business, Science and Arts occupations in High Ridge, the most male-oriented occupations are Architecture & Engineering (100.0%), Life, Physical & Social Science (100.0%), and Legal Services & Support (100.0%), while the most female-oriented occupations are Education Instruction & Library (100.0%), Health Diagnosing & Treating (93.0%), and Health Technologists (88.8%).
| Occupation | Male | Female |
| Management | 154 (84.2%) | 29 (15.9%) |
| Business & Financial | 14 (27.5%) | 37 (72.6%) |
| Computers, Engineering & Science | 73 (73.7%) | 26 (26.3%) |
| Computers & Mathematics | 44 (62.9%) | 26 (37.1%) |
| Architecture & Engineering | 12 (100.0%) | 0 (0.0%) |
| Life, Physical & Social Science | 17 (100.0%) | 0 (0.0%) |
| Community & Social Service | 81 (40.7%) | 118 (59.3%) |
| Education, Arts & Media | 23 (32.4%) | 48 (67.6%) |
| Legal Services & Support | 14 (100.0%) | 0 (0.0%) |
| Education Instruction & Library | 0 (0.0%) | 70 (100.0%) |
| Arts, Media & Entertainment | 44 (100.0%) | 0 (0.0%) |
| Health Diagnosing & Treating | 12 (7.0%) | 160 (93.0%) |
| Health Technologists | 12 (11.2%) | 95 (88.8%) |
| Total (Category) | 334 (47.4%) | 370 (52.6%) |
| Total (Overall) | 1,156 (46.4%) | 1,336 (53.6%) |
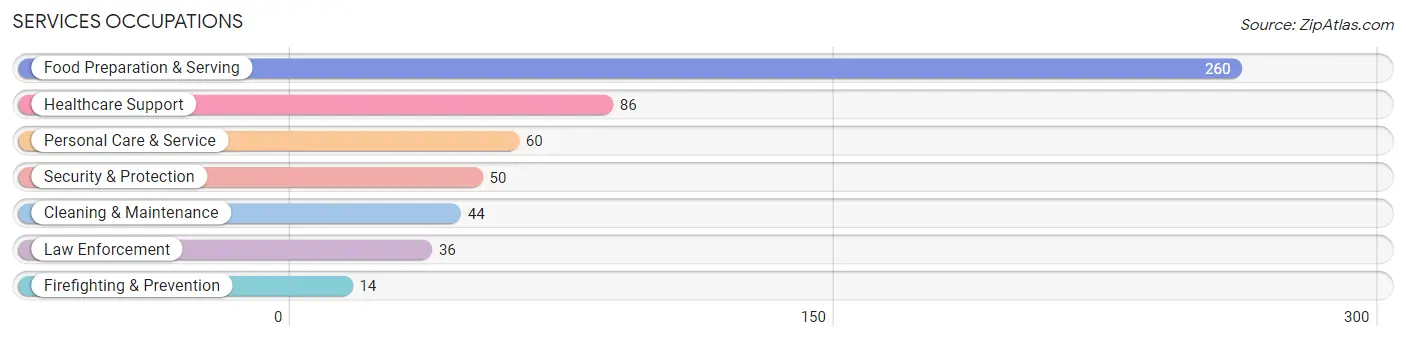
Services Occupations
The most common Services occupations in High Ridge are Food Preparation & Serving (260 | 10.4%), Healthcare Support (86 | 3.5%), Personal Care & Service (60 | 2.4%), Security & Protection (50 | 2.0%), and Cleaning & Maintenance (44 | 1.8%).
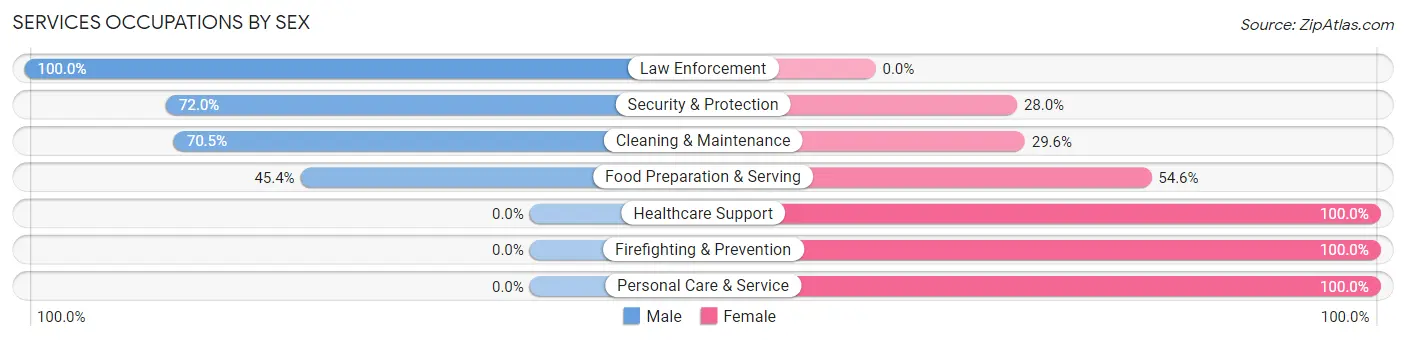
Services Occupations by Sex
Within the Services occupations in High Ridge, the most male-oriented occupations are Law Enforcement (100.0%), Security & Protection (72.0%), and Cleaning & Maintenance (70.5%), while the most female-oriented occupations are Healthcare Support (100.0%), Firefighting & Prevention (100.0%), and Personal Care & Service (100.0%).
| Occupation | Male | Female |
| Healthcare Support | 0 (0.0%) | 86 (100.0%) |
| Security & Protection | 36 (72.0%) | 14 (28.0%) |
| Firefighting & Prevention | 0 (0.0%) | 14 (100.0%) |
| Law Enforcement | 36 (100.0%) | 0 (0.0%) |
| Food Preparation & Serving | 118 (45.4%) | 142 (54.6%) |
| Cleaning & Maintenance | 31 (70.5%) | 13 (29.5%) |
| Personal Care & Service | 0 (0.0%) | 60 (100.0%) |
| Total (Category) | 185 (37.0%) | 315 (63.0%) |
| Total (Overall) | 1,156 (46.4%) | 1,336 (53.6%) |
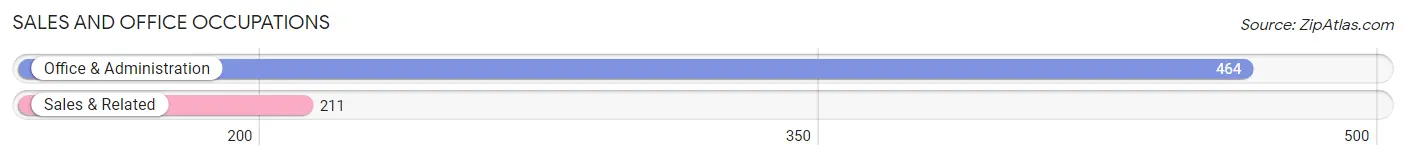
Sales and Office Occupations
The most common Sales and Office occupations in High Ridge are Office & Administration (464 | 18.6%), and Sales & Related (211 | 8.5%).
Sales and Office Occupations by Sex
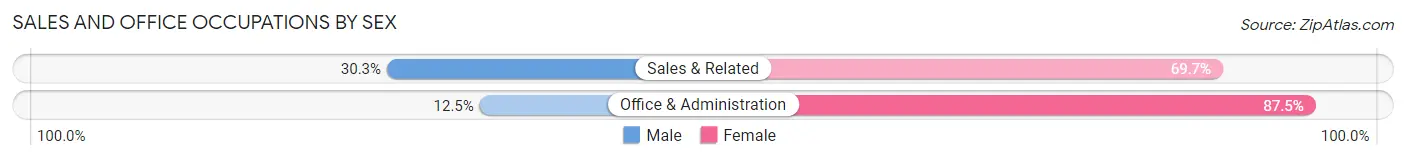
| Occupation | Male | Female |
| Sales & Related | 64 (30.3%) | 147 (69.7%) |
| Office & Administration | 58 (12.5%) | 406 (87.5%) |
| Total (Category) | 122 (18.1%) | 553 (81.9%) |
| Total (Overall) | 1,156 (46.4%) | 1,336 (53.6%) |
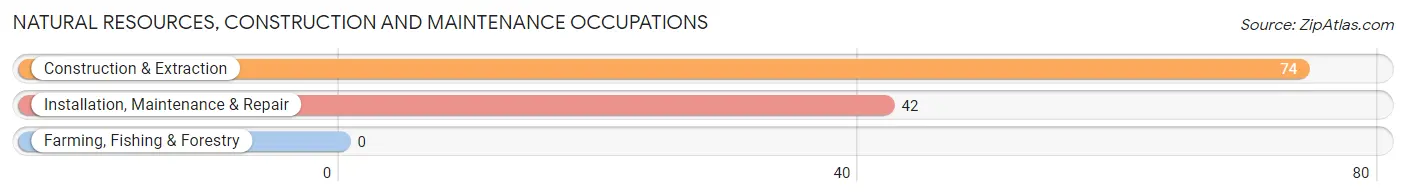
Natural Resources, Construction and Maintenance Occupations
The most common Natural Resources, Construction and Maintenance occupations in High Ridge are Construction & Extraction (74 | 3.0%), and Installation, Maintenance & Repair (42 | 1.7%).
Natural Resources, Construction and Maintenance Occupations by Sex
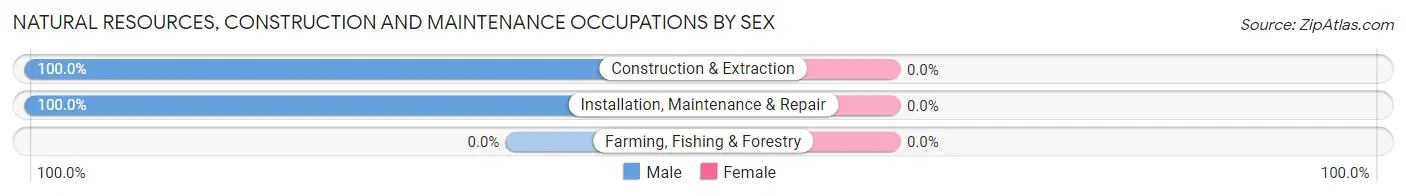
| Occupation | Male | Female |
| Farming, Fishing & Forestry | 0 (0.0%) | 0 (0.0%) |
| Construction & Extraction | 74 (100.0%) | 0 (0.0%) |
| Installation, Maintenance & Repair | 42 (100.0%) | 0 (0.0%) |
| Total (Category) | 116 (100.0%) | 0 (0.0%) |
| Total (Overall) | 1,156 (46.4%) | 1,336 (53.6%) |
Production, Transportation and Moving Occupations
The most common Production, Transportation and Moving occupations in High Ridge are Production (230 | 9.2%), Material Moving (149 | 6.0%), and Transportation (118 | 4.7%).
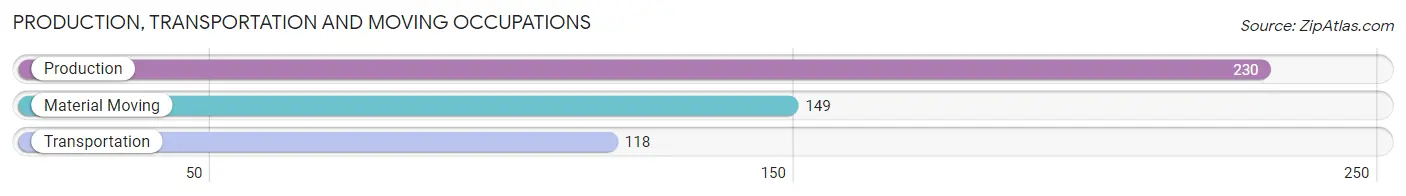
Production, Transportation and Moving Occupations by Sex
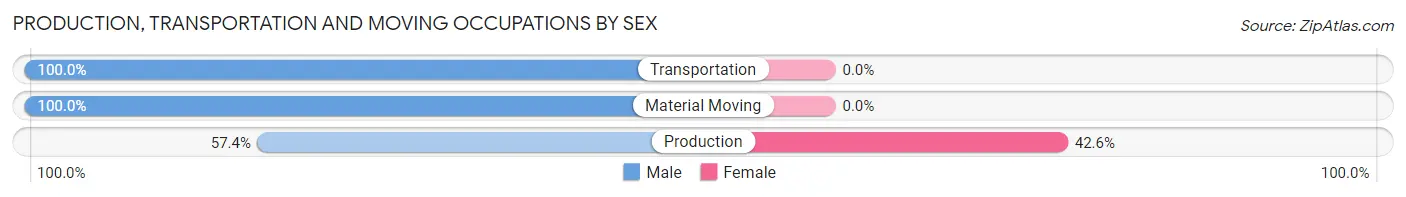
| Occupation | Male | Female |
| Production | 132 (57.4%) | 98 (42.6%) |
| Transportation | 118 (100.0%) | 0 (0.0%) |
| Material Moving | 149 (100.0%) | 0 (0.0%) |
| Total (Category) | 399 (80.3%) | 98 (19.7%) |
| Total (Overall) | 1,156 (46.4%) | 1,336 (53.6%) |
Employment Industries by Sex in High Ridge
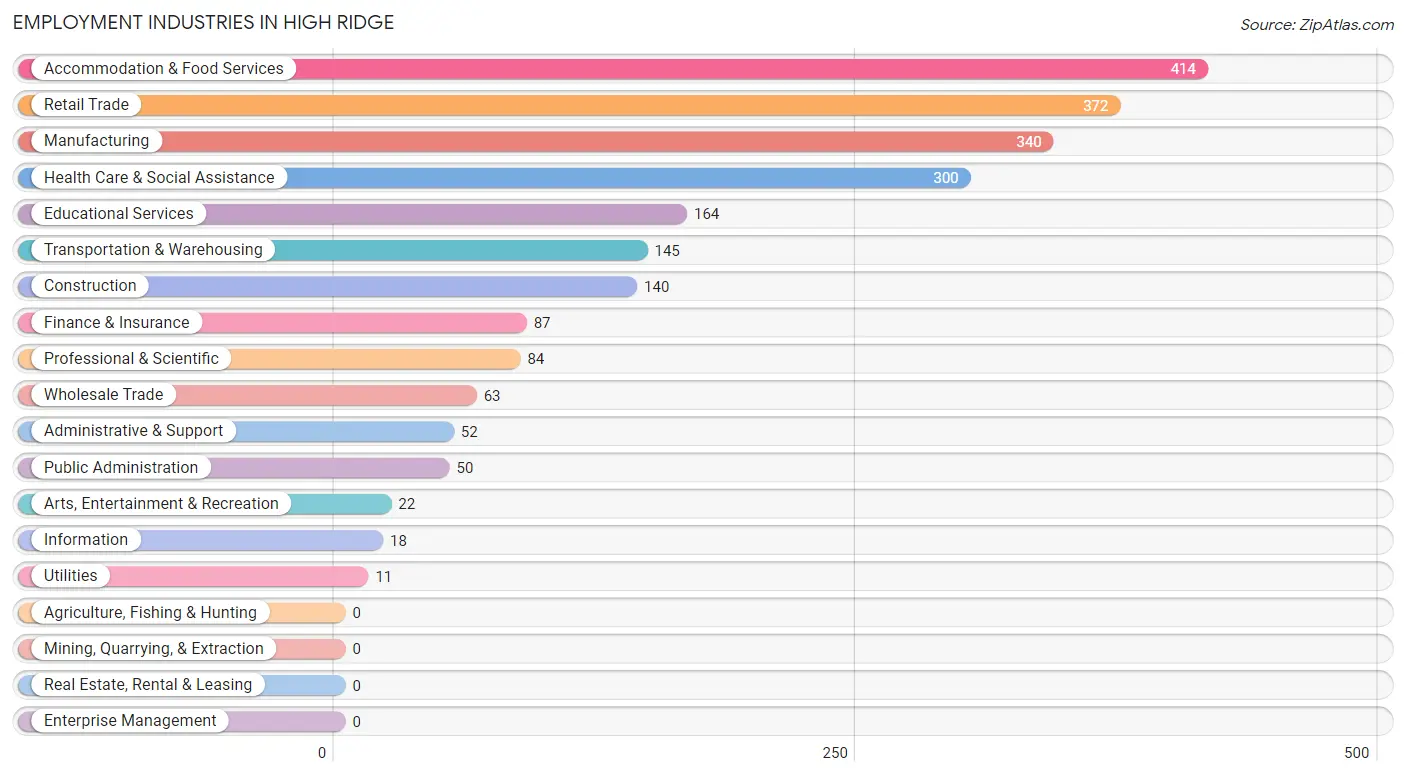
Employment Industries in High Ridge
The major employment industries in High Ridge include Accommodation & Food Services (414 | 16.6%), Retail Trade (372 | 14.9%), Manufacturing (340 | 13.6%), Health Care & Social Assistance (300 | 12.0%), and Educational Services (164 | 6.6%).
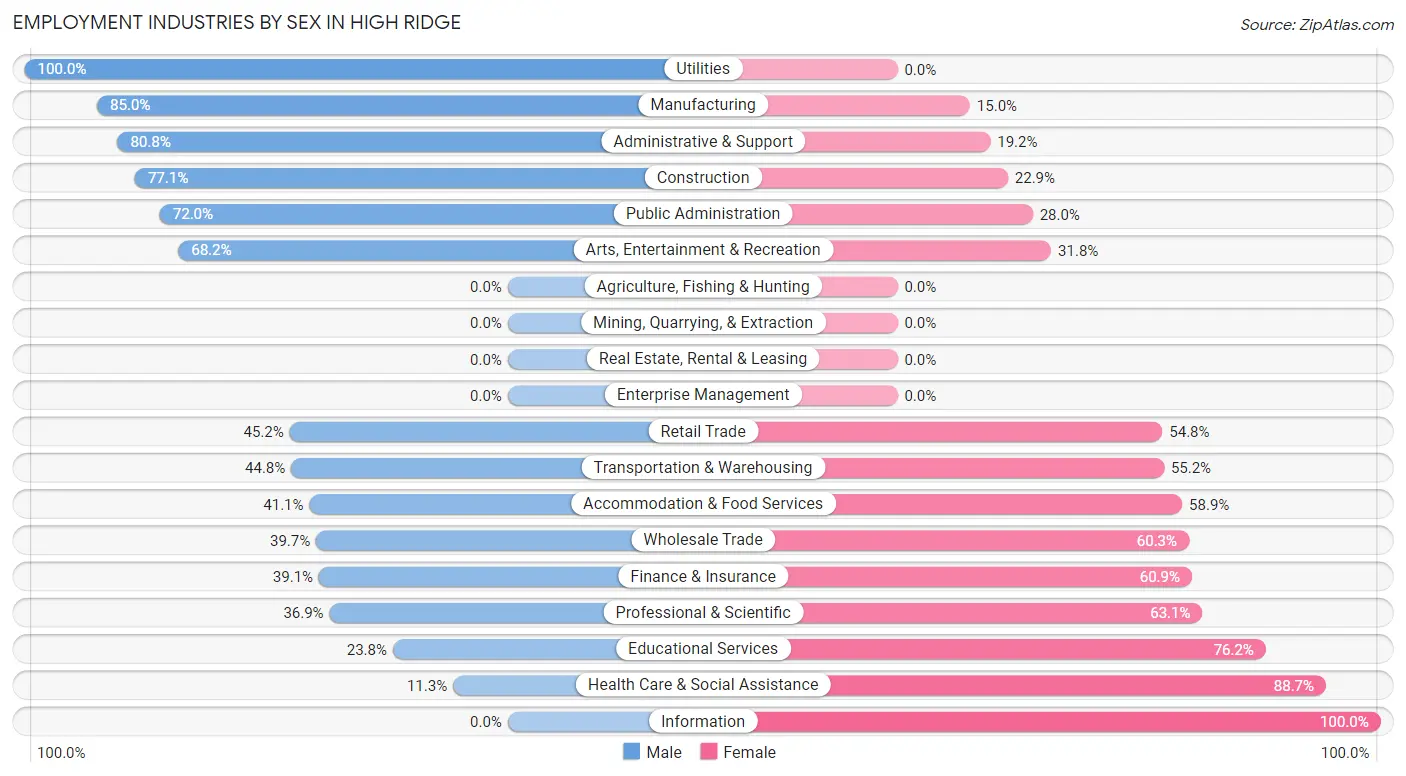
Employment Industries by Sex in High Ridge
The High Ridge industries that see more men than women are Utilities (100.0%), Manufacturing (85.0%), and Administrative & Support (80.8%), whereas the industries that tend to have a higher number of women are Information (100.0%), Health Care & Social Assistance (88.7%), and Educational Services (76.2%).
| Industry | Male | Female |
| Agriculture, Fishing & Hunting | 0 (0.0%) | 0 (0.0%) |
| Mining, Quarrying, & Extraction | 0 (0.0%) | 0 (0.0%) |
| Construction | 108 (77.1%) | 32 (22.9%) |
| Manufacturing | 289 (85.0%) | 51 (15.0%) |
| Wholesale Trade | 25 (39.7%) | 38 (60.3%) |
| Retail Trade | 168 (45.2%) | 204 (54.8%) |
| Transportation & Warehousing | 65 (44.8%) | 80 (55.2%) |
| Utilities | 11 (100.0%) | 0 (0.0%) |
| Information | 0 (0.0%) | 18 (100.0%) |
| Finance & Insurance | 34 (39.1%) | 53 (60.9%) |
| Real Estate, Rental & Leasing | 0 (0.0%) | 0 (0.0%) |
| Professional & Scientific | 31 (36.9%) | 53 (63.1%) |
| Enterprise Management | 0 (0.0%) | 0 (0.0%) |
| Administrative & Support | 42 (80.8%) | 10 (19.2%) |
| Educational Services | 39 (23.8%) | 125 (76.2%) |
| Health Care & Social Assistance | 34 (11.3%) | 266 (88.7%) |
| Arts, Entertainment & Recreation | 15 (68.2%) | 7 (31.8%) |
| Accommodation & Food Services | 170 (41.1%) | 244 (58.9%) |
| Public Administration | 36 (72.0%) | 14 (28.0%) |
| Total | 1,156 (46.4%) | 1,336 (53.6%) |
Education in High Ridge
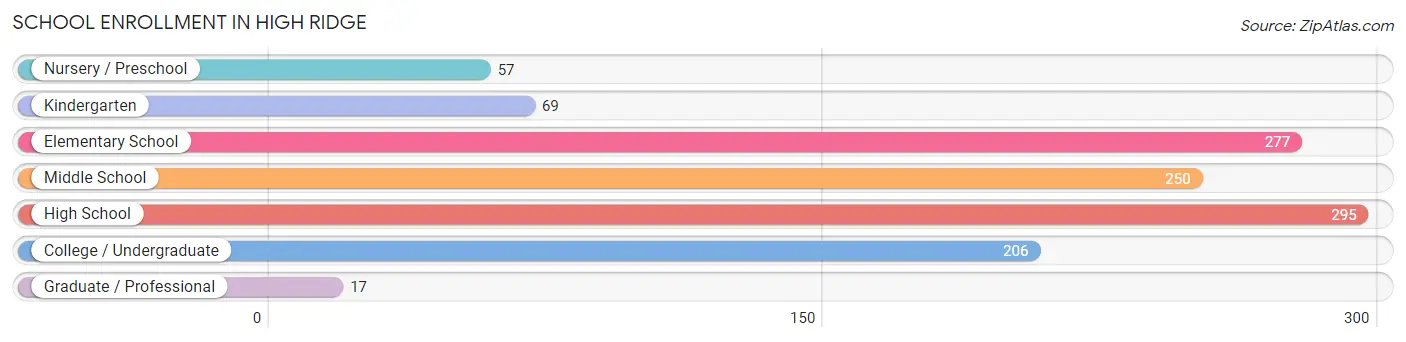
School Enrollment in High Ridge
The most common levels of schooling among the 1,171 students in High Ridge are high school (295 | 25.2%), elementary school (277 | 23.6%), and middle school (250 | 21.3%).
| School Level | # Students | % Students |
| Nursery / Preschool | 57 | 4.9% |
| Kindergarten | 69 | 5.9% |
| Elementary School | 277 | 23.6% |
| Middle School | 250 | 21.3% |
| High School | 295 | 25.2% |
| College / Undergraduate | 206 | 17.6% |
| Graduate / Professional | 17 | 1.5% |
| Total | 1,171 | 100.0% |
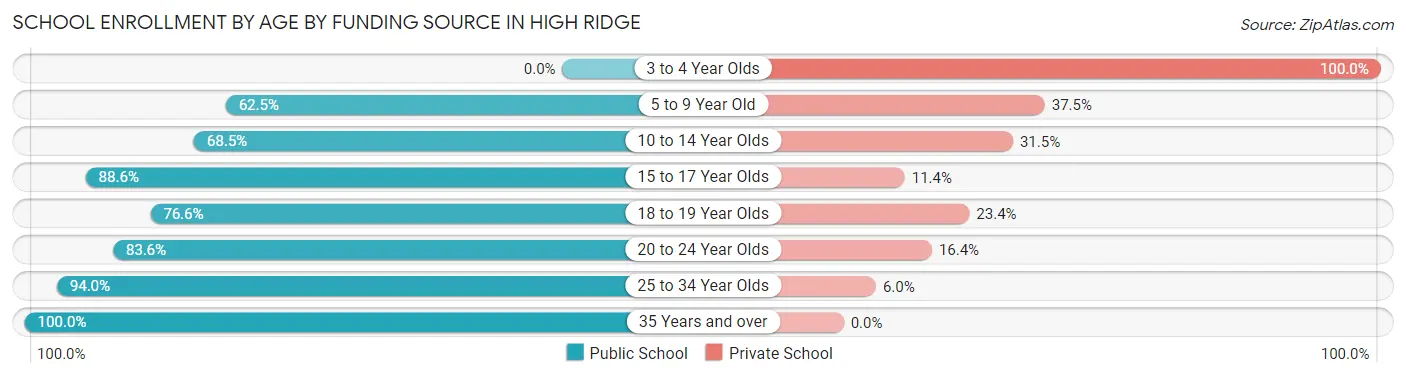
School Enrollment by Age by Funding Source in High Ridge
Out of a total of 1,171 students who are enrolled in schools in High Ridge, 342 (29.2%) attend a private institution, while the remaining 829 (70.8%) are enrolled in public schools. The age group of 3 to 4 year olds has the highest likelihood of being enrolled in private schools, with 57 (100.0% in the age bracket) enrolled. Conversely, the age group of 35 years and over has the lowest likelihood of being enrolled in a private school, with 23 (100.0% in the age bracket) attending a public institution.
| Age Bracket | Public School | Private School |
| 3 to 4 Year Olds | 0 (0.0%) | 57 (100.0%) |
| 5 to 9 Year Old | 207 (62.5%) | 124 (37.5%) |
| 10 to 14 Year Olds | 191 (68.5%) | 88 (31.5%) |
| 15 to 17 Year Olds | 148 (88.6%) | 19 (11.4%) |
| 18 to 19 Year Olds | 121 (76.6%) | 37 (23.4%) |
| 20 to 24 Year Olds | 61 (83.6%) | 12 (16.4%) |
| 25 to 34 Year Olds | 78 (94.0%) | 5 (6.0%) |
| 35 Years and over | 23 (100.0%) | 0 (0.0%) |
| Total | 829 (70.8%) | 342 (29.2%) |
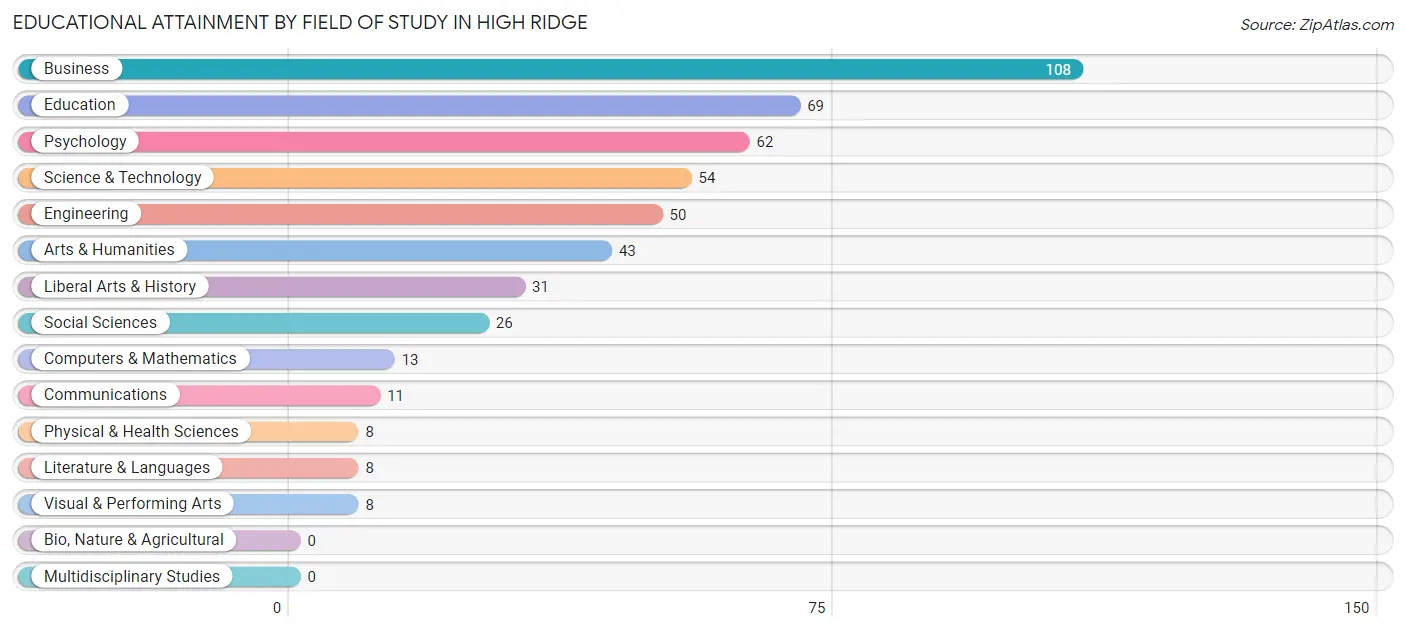
Educational Attainment by Field of Study in High Ridge
Business (108 | 22.0%), education (69 | 14.1%), psychology (62 | 12.6%), science & technology (54 | 11.0%), and engineering (50 | 10.2%) are the most common fields of study among 491 individuals in High Ridge who have obtained a bachelor's degree or higher.
| Field of Study | # Graduates | % Graduates |
| Computers & Mathematics | 13 | 2.6% |
| Bio, Nature & Agricultural | 0 | 0.0% |
| Physical & Health Sciences | 8 | 1.6% |
| Psychology | 62 | 12.6% |
| Social Sciences | 26 | 5.3% |
| Engineering | 50 | 10.2% |
| Multidisciplinary Studies | 0 | 0.0% |
| Science & Technology | 54 | 11.0% |
| Business | 108 | 22.0% |
| Education | 69 | 14.1% |
| Literature & Languages | 8 | 1.6% |
| Liberal Arts & History | 31 | 6.3% |
| Visual & Performing Arts | 8 | 1.6% |
| Communications | 11 | 2.2% |
| Arts & Humanities | 43 | 8.8% |
| Total | 491 | 100.0% |
Transportation & Commute in High Ridge
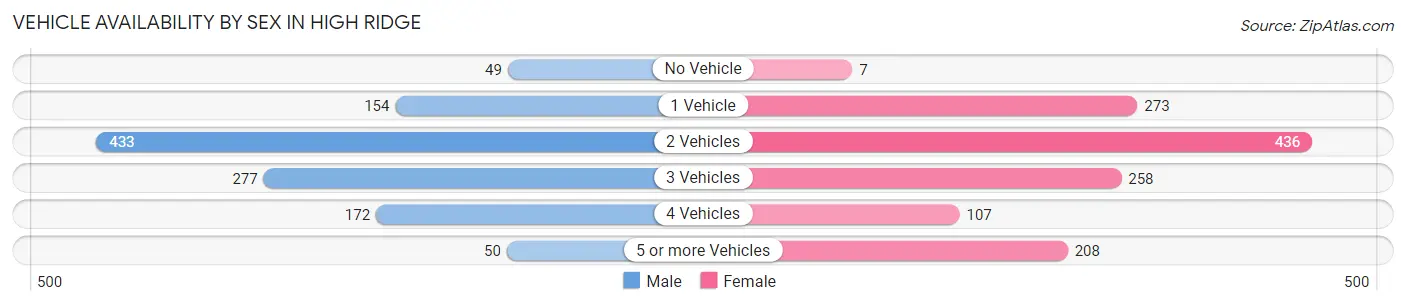
Vehicle Availability by Sex in High Ridge
The most prevalent vehicle ownership categories in High Ridge are males with 2 vehicles (433, accounting for 38.2%) and females with 2 vehicles (436, making up 33.6%).
| Vehicles Available | Male | Female |
| No Vehicle | 49 (4.3%) | 7 (0.5%) |
| 1 Vehicle | 154 (13.6%) | 273 (21.2%) |
| 2 Vehicles | 433 (38.2%) | 436 (33.8%) |
| 3 Vehicles | 277 (24.4%) | 258 (20.0%) |
| 4 Vehicles | 172 (15.1%) | 107 (8.3%) |
| 5 or more Vehicles | 50 (4.4%) | 208 (16.1%) |
| Total | 1,135 (100.0%) | 1,289 (100.0%) |
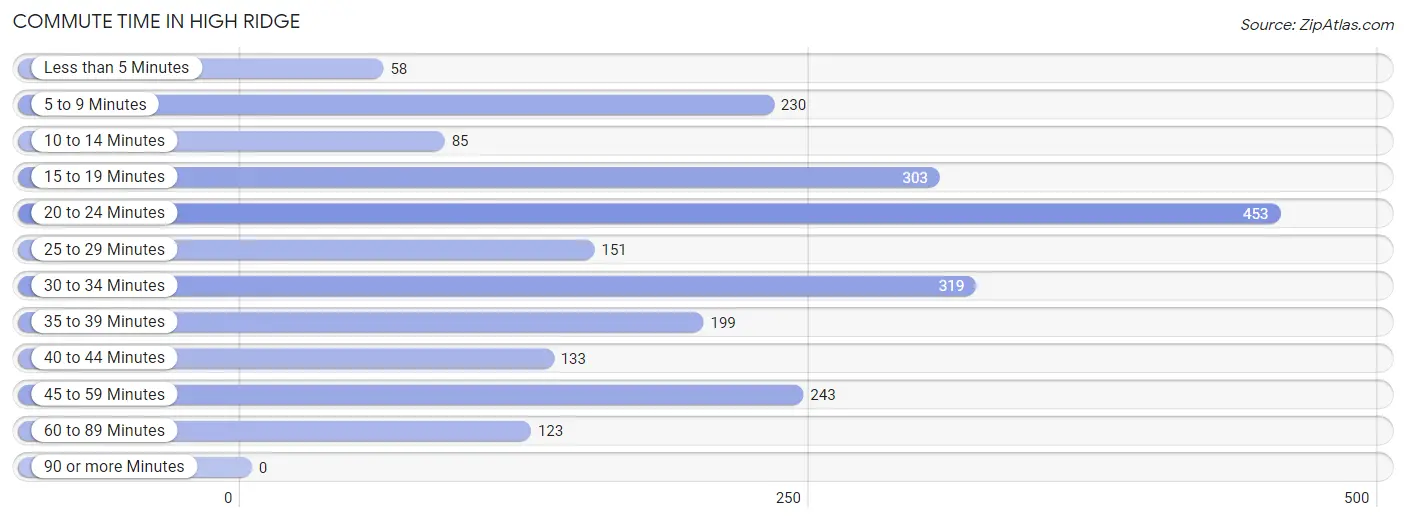
Commute Time in High Ridge
The most frequently occuring commute durations in High Ridge are 20 to 24 minutes (453 commuters, 19.7%), 30 to 34 minutes (319 commuters, 13.9%), and 15 to 19 minutes (303 commuters, 13.2%).
| Commute Time | # Commuters | % Commuters |
| Less than 5 Minutes | 58 | 2.5% |
| 5 to 9 Minutes | 230 | 10.0% |
| 10 to 14 Minutes | 85 | 3.7% |
| 15 to 19 Minutes | 303 | 13.2% |
| 20 to 24 Minutes | 453 | 19.7% |
| 25 to 29 Minutes | 151 | 6.6% |
| 30 to 34 Minutes | 319 | 13.9% |
| 35 to 39 Minutes | 199 | 8.7% |
| 40 to 44 Minutes | 133 | 5.8% |
| 45 to 59 Minutes | 243 | 10.6% |
| 60 to 89 Minutes | 123 | 5.3% |
| 90 or more Minutes | 0 | 0.0% |
Commute Time by Sex in High Ridge
The most common commute times in High Ridge are 20 to 24 minutes (228 commuters, 20.9%) for males and 15 to 19 minutes (260 commuters, 21.6%) for females.
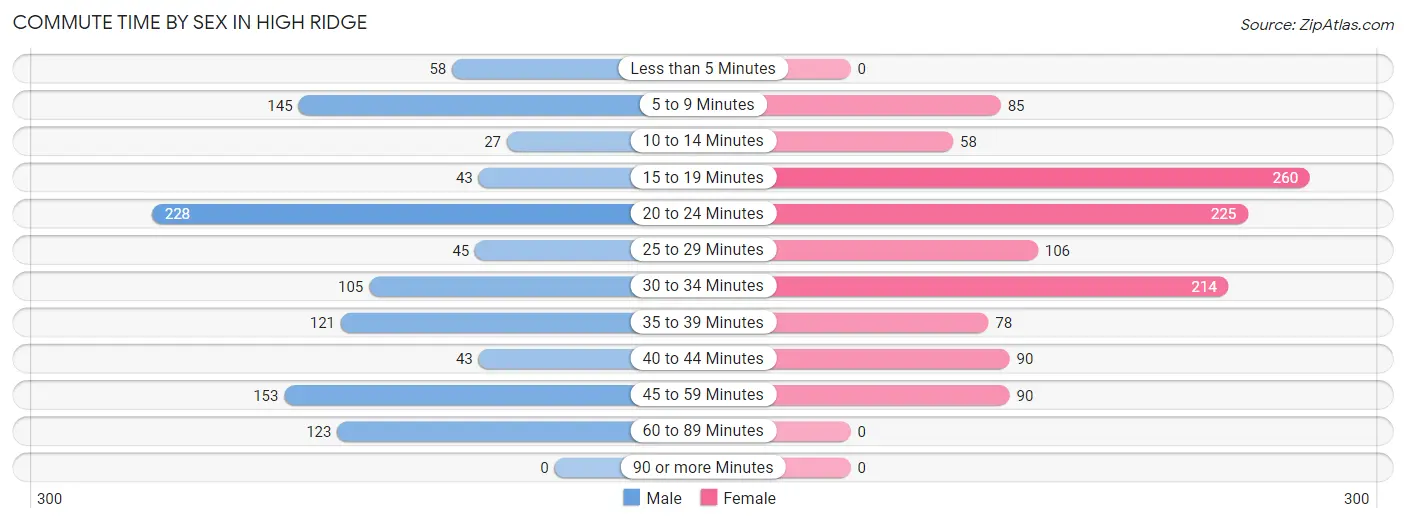
| Commute Time | Male | Female |
| Less than 5 Minutes | 58 (5.3%) | 0 (0.0%) |
| 5 to 9 Minutes | 145 (13.3%) | 85 (7.0%) |
| 10 to 14 Minutes | 27 (2.5%) | 58 (4.8%) |
| 15 to 19 Minutes | 43 (3.9%) | 260 (21.6%) |
| 20 to 24 Minutes | 228 (20.9%) | 225 (18.7%) |
| 25 to 29 Minutes | 45 (4.1%) | 106 (8.8%) |
| 30 to 34 Minutes | 105 (9.6%) | 214 (17.7%) |
| 35 to 39 Minutes | 121 (11.1%) | 78 (6.5%) |
| 40 to 44 Minutes | 43 (3.9%) | 90 (7.5%) |
| 45 to 59 Minutes | 153 (14.0%) | 90 (7.5%) |
| 60 to 89 Minutes | 123 (11.3%) | 0 (0.0%) |
| 90 or more Minutes | 0 (0.0%) | 0 (0.0%) |
Time of Departure to Work by Sex in High Ridge
The most frequent times of departure to work in High Ridge are 12:00 PM to 3:59 PM (204, 18.7%) for males and 7:00 AM to 7:29 AM (233, 19.3%) for females.
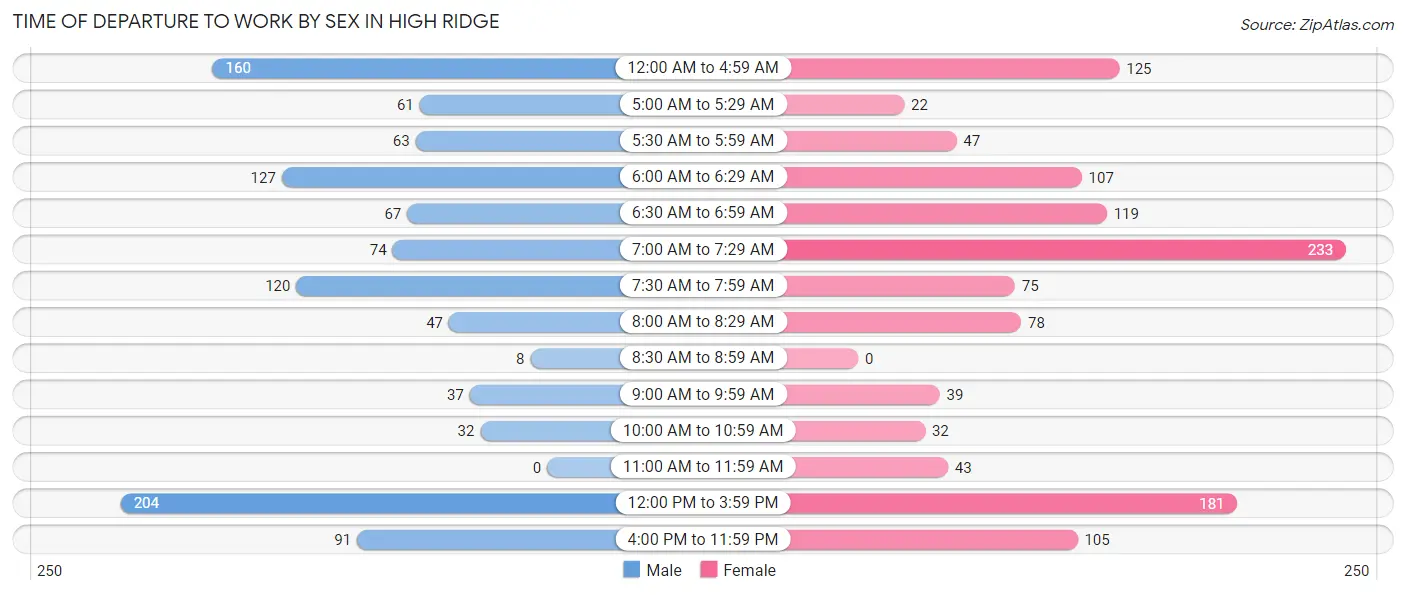
| Time of Departure | Male | Female |
| 12:00 AM to 4:59 AM | 160 (14.7%) | 125 (10.4%) |
| 5:00 AM to 5:29 AM | 61 (5.6%) | 22 (1.8%) |
| 5:30 AM to 5:59 AM | 63 (5.8%) | 47 (3.9%) |
| 6:00 AM to 6:29 AM | 127 (11.6%) | 107 (8.9%) |
| 6:30 AM to 6:59 AM | 67 (6.1%) | 119 (9.9%) |
| 7:00 AM to 7:29 AM | 74 (6.8%) | 233 (19.3%) |
| 7:30 AM to 7:59 AM | 120 (11.0%) | 75 (6.2%) |
| 8:00 AM to 8:29 AM | 47 (4.3%) | 78 (6.5%) |
| 8:30 AM to 8:59 AM | 8 (0.7%) | 0 (0.0%) |
| 9:00 AM to 9:59 AM | 37 (3.4%) | 39 (3.2%) |
| 10:00 AM to 10:59 AM | 32 (2.9%) | 32 (2.6%) |
| 11:00 AM to 11:59 AM | 0 (0.0%) | 43 (3.6%) |
| 12:00 PM to 3:59 PM | 204 (18.7%) | 181 (15.0%) |
| 4:00 PM to 11:59 PM | 91 (8.3%) | 105 (8.7%) |
| Total | 1,091 (100.0%) | 1,206 (100.0%) |
Housing Occupancy in High Ridge
Occupancy by Ownership in High Ridge
Of the total 1,828 dwellings in High Ridge, owner-occupied units account for 1,572 (86.0%), while renter-occupied units make up 256 (14.0%).
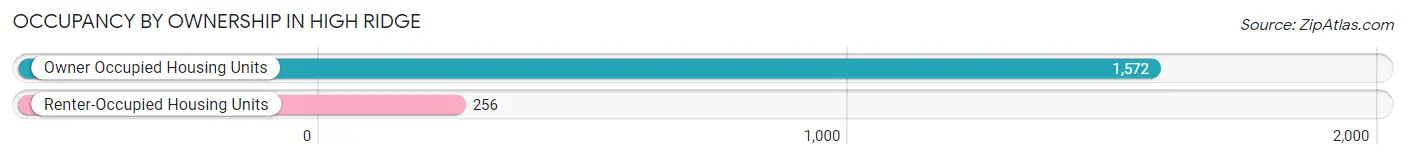
| Occupancy | # Housing Units | % Housing Units |
| Owner Occupied Housing Units | 1,572 | 86.0% |
| Renter-Occupied Housing Units | 256 | 14.0% |
| Total Occupied Housing Units | 1,828 | 100.0% |
Occupancy by Household Size in High Ridge
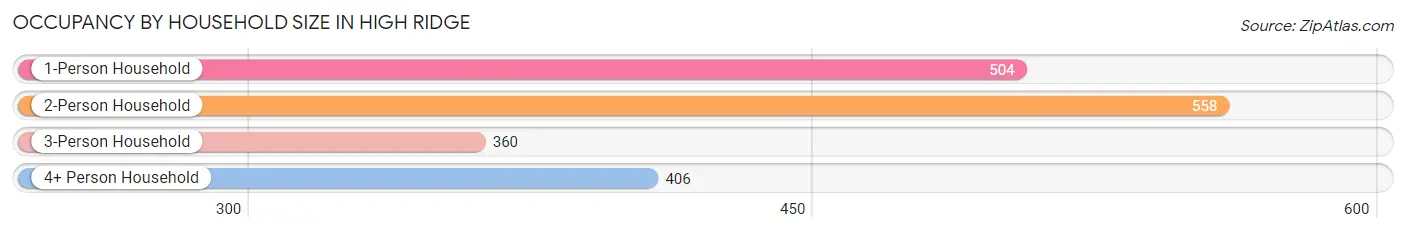
| Household Size | # Housing Units | % Housing Units |
| 1-Person Household | 504 | 27.6% |
| 2-Person Household | 558 | 30.5% |
| 3-Person Household | 360 | 19.7% |
| 4+ Person Household | 406 | 22.2% |
| Total Housing Units | 1,828 | 100.0% |
Occupancy by Ownership by Household Size in High Ridge
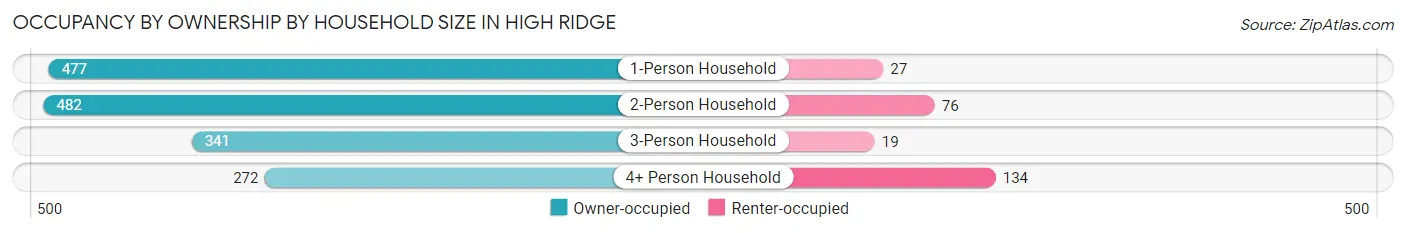
| Household Size | Owner-occupied | Renter-occupied |
| 1-Person Household | 477 (94.6%) | 27 (5.4%) |
| 2-Person Household | 482 (86.4%) | 76 (13.6%) |
| 3-Person Household | 341 (94.7%) | 19 (5.3%) |
| 4+ Person Household | 272 (67.0%) | 134 (33.0%) |
| Total Housing Units | 1,572 (86.0%) | 256 (14.0%) |
Occupancy by Educational Attainment in High Ridge
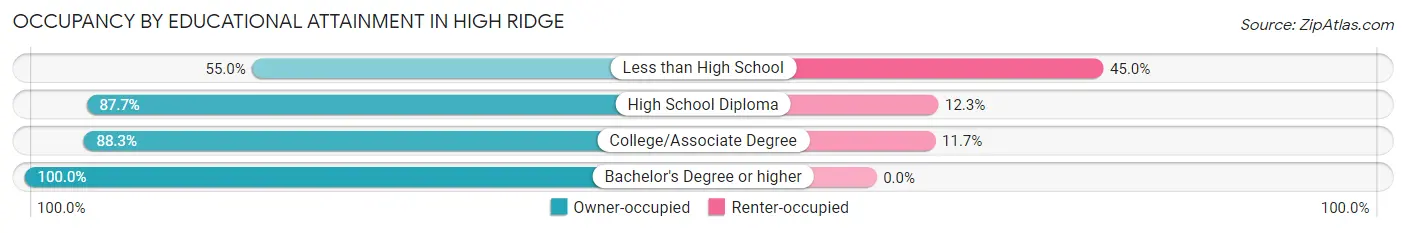
| Household Size | Owner-occupied | Renter-occupied |
| Less than High School | 121 (55.0%) | 99 (45.0%) |
| High School Diploma | 608 (87.7%) | 85 (12.3%) |
| College/Associate Degree | 544 (88.3%) | 72 (11.7%) |
| Bachelor's Degree or higher | 299 (100.0%) | 0 (0.0%) |
Occupancy by Age of Householder in High Ridge
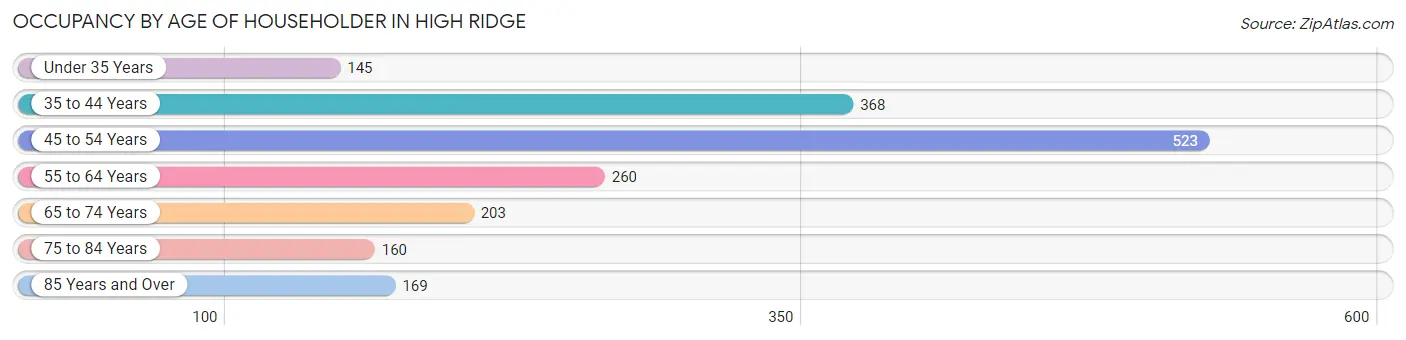
| Age Bracket | # Households | % Households |
| Under 35 Years | 145 | 7.9% |
| 35 to 44 Years | 368 | 20.1% |
| 45 to 54 Years | 523 | 28.6% |
| 55 to 64 Years | 260 | 14.2% |
| 65 to 74 Years | 203 | 11.1% |
| 75 to 84 Years | 160 | 8.7% |
| 85 Years and Over | 169 | 9.2% |
| Total | 1,828 | 100.0% |
Housing Finances in High Ridge
Median Income by Occupancy in High Ridge
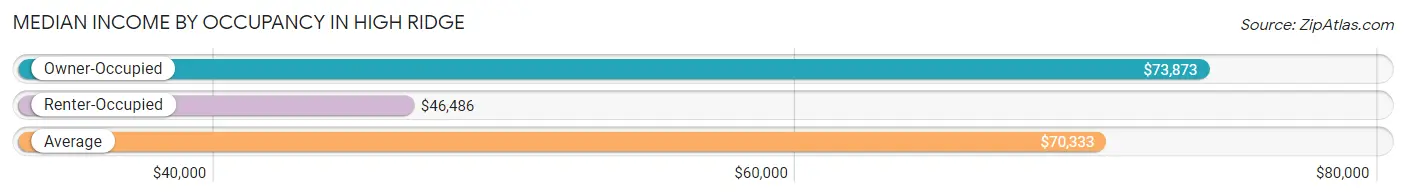
| Occupancy Type | # Households | Median Income |
| Owner-Occupied | 1,572 (86.0%) | $73,873 |
| Renter-Occupied | 256 (14.0%) | $46,486 |
| Average | 1,828 (100.0%) | $70,333 |
Occupancy by Householder Income Bracket in High Ridge
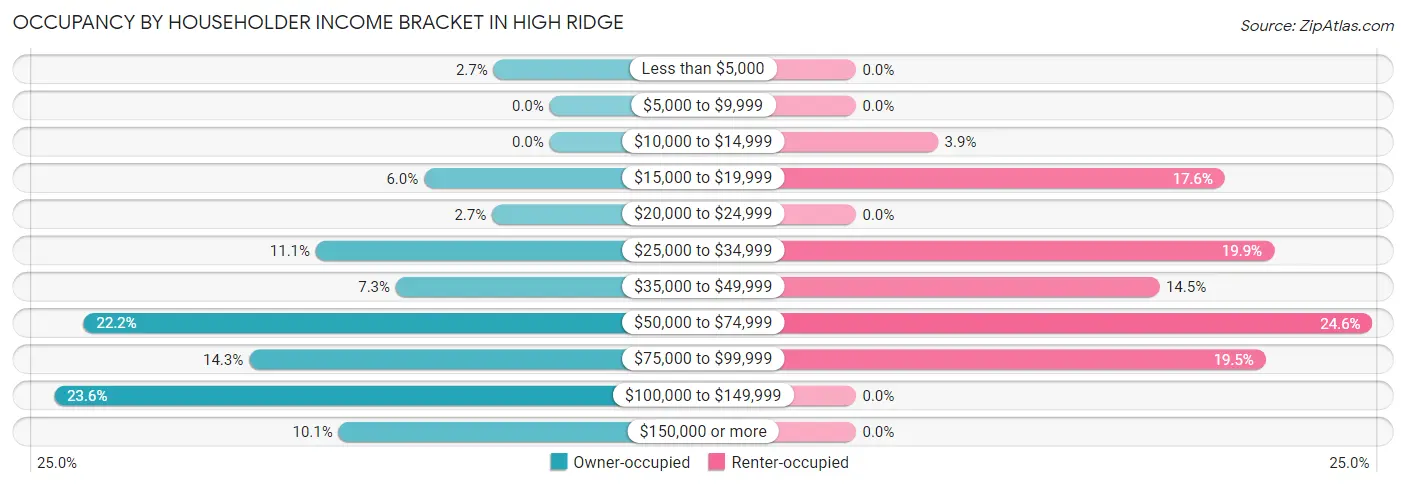
| Income Bracket | Owner-occupied | Renter-occupied |
| Less than $5,000 | 42 (2.7%) | 0 (0.0%) |
| $5,000 to $9,999 | 0 (0.0%) | 0 (0.0%) |
| $10,000 to $14,999 | 0 (0.0%) | 10 (3.9%) |
| $15,000 to $19,999 | 94 (6.0%) | 45 (17.6%) |
| $20,000 to $24,999 | 43 (2.7%) | 0 (0.0%) |
| $25,000 to $34,999 | 175 (11.1%) | 51 (19.9%) |
| $35,000 to $49,999 | 115 (7.3%) | 37 (14.4%) |
| $50,000 to $74,999 | 349 (22.2%) | 63 (24.6%) |
| $75,000 to $99,999 | 225 (14.3%) | 50 (19.5%) |
| $100,000 to $149,999 | 371 (23.6%) | 0 (0.0%) |
| $150,000 or more | 158 (10.1%) | 0 (0.0%) |
| Total | 1,572 (100.0%) | 256 (100.0%) |
Monthly Housing Cost Tiers in High Ridge
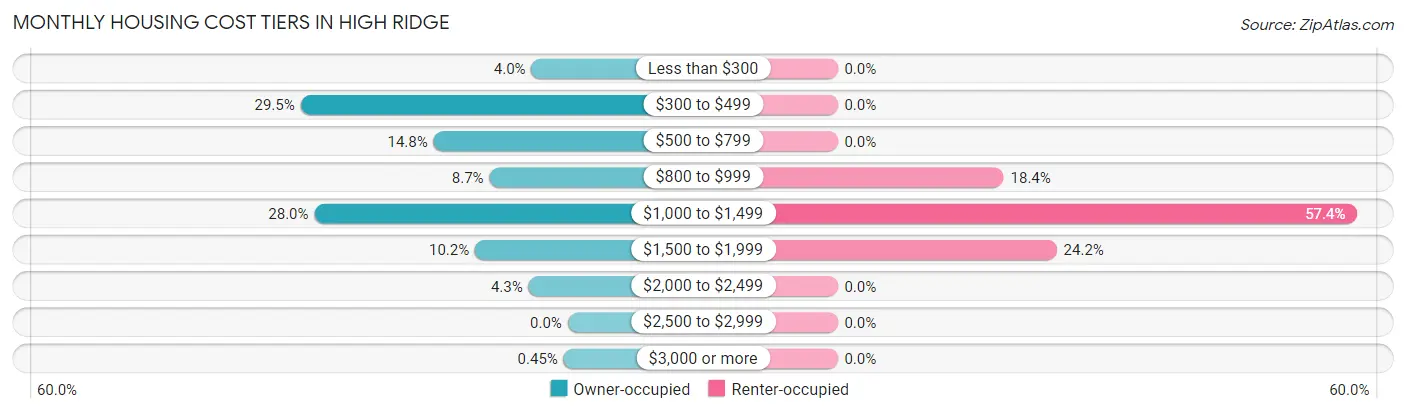
| Monthly Cost | Owner-occupied | Renter-occupied |
| Less than $300 | 63 (4.0%) | 0 (0.0%) |
| $300 to $499 | 464 (29.5%) | 0 (0.0%) |
| $500 to $799 | 233 (14.8%) | 0 (0.0%) |
| $800 to $999 | 136 (8.6%) | 47 (18.4%) |
| $1,000 to $1,499 | 440 (28.0%) | 147 (57.4%) |
| $1,500 to $1,999 | 161 (10.2%) | 62 (24.2%) |
| $2,000 to $2,499 | 68 (4.3%) | 0 (0.0%) |
| $2,500 to $2,999 | 0 (0.0%) | 0 (0.0%) |
| $3,000 or more | 7 (0.4%) | 0 (0.0%) |
| Total | 1,572 (100.0%) | 256 (100.0%) |
Physical Housing Characteristics in High Ridge
Housing Structures in High Ridge
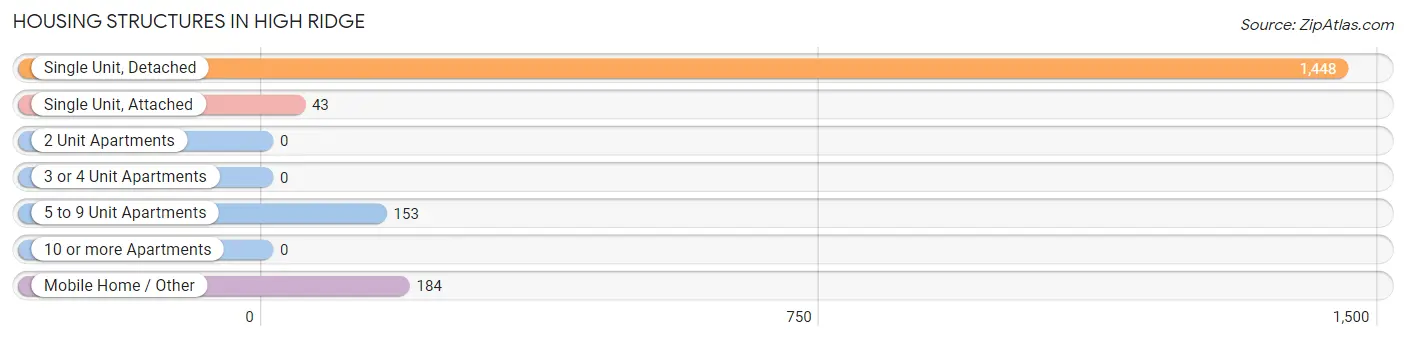
| Structure Type | # Housing Units | % Housing Units |
| Single Unit, Detached | 1,448 | 79.2% |
| Single Unit, Attached | 43 | 2.4% |
| 2 Unit Apartments | 0 | 0.0% |
| 3 or 4 Unit Apartments | 0 | 0.0% |
| 5 to 9 Unit Apartments | 153 | 8.4% |
| 10 or more Apartments | 0 | 0.0% |
| Mobile Home / Other | 184 | 10.1% |
| Total | 1,828 | 100.0% |
Housing Structures by Occupancy in High Ridge
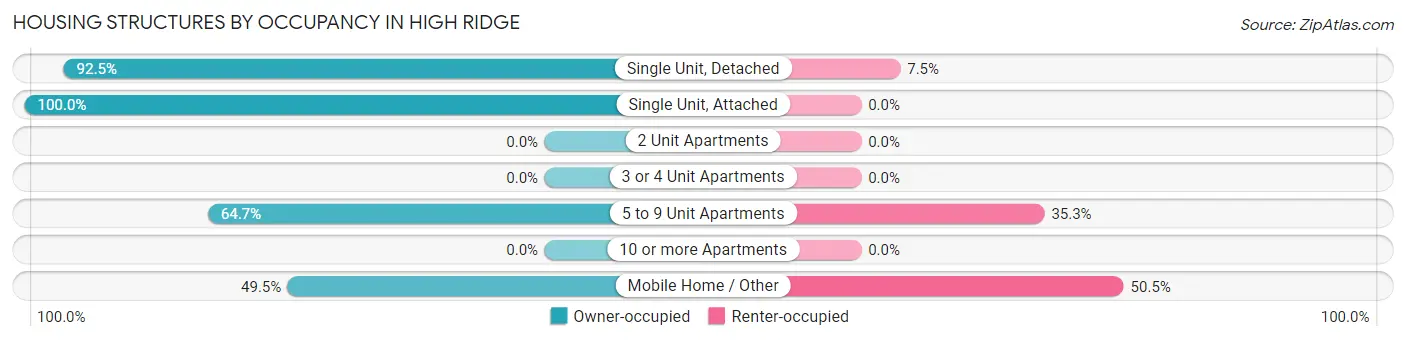
| Structure Type | Owner-occupied | Renter-occupied |
| Single Unit, Detached | 1,339 (92.5%) | 109 (7.5%) |
| Single Unit, Attached | 43 (100.0%) | 0 (0.0%) |
| 2 Unit Apartments | 0 (0.0%) | 0 (0.0%) |
| 3 or 4 Unit Apartments | 0 (0.0%) | 0 (0.0%) |
| 5 to 9 Unit Apartments | 99 (64.7%) | 54 (35.3%) |
| 10 or more Apartments | 0 (0.0%) | 0 (0.0%) |
| Mobile Home / Other | 91 (49.5%) | 93 (50.5%) |
| Total | 1,572 (86.0%) | 256 (14.0%) |
Housing Structures by Number of Rooms in High Ridge
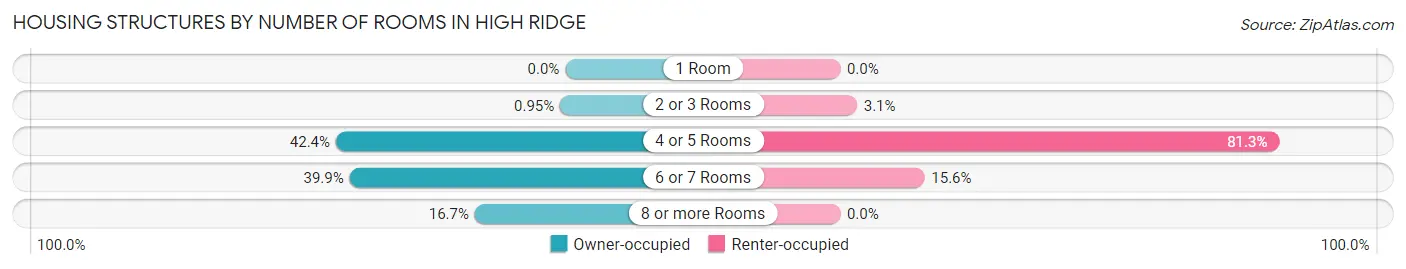
| Number of Rooms | Owner-occupied | Renter-occupied |
| 1 Room | 0 (0.0%) | 0 (0.0%) |
| 2 or 3 Rooms | 15 (0.9%) | 8 (3.1%) |
| 4 or 5 Rooms | 667 (42.4%) | 208 (81.2%) |
| 6 or 7 Rooms | 627 (39.9%) | 40 (15.6%) |
| 8 or more Rooms | 263 (16.7%) | 0 (0.0%) |
| Total | 1,572 (100.0%) | 256 (100.0%) |
Housing Structure by Heating Type in High Ridge

| Heating Type | Owner-occupied | Renter-occupied |
| Utility Gas | 480 (30.5%) | 75 (29.3%) |
| Bottled, Tank, or LP Gas | 171 (10.9%) | 8 (3.1%) |
| Electricity | 897 (57.1%) | 154 (60.2%) |
| Fuel Oil or Kerosene | 15 (0.9%) | 0 (0.0%) |
| Coal or Coke | 0 (0.0%) | 0 (0.0%) |
| All other Fuels | 9 (0.6%) | 19 (7.4%) |
| No Fuel Used | 0 (0.0%) | 0 (0.0%) |
| Total | 1,572 (100.0%) | 256 (100.0%) |
Household Vehicle Usage in High Ridge
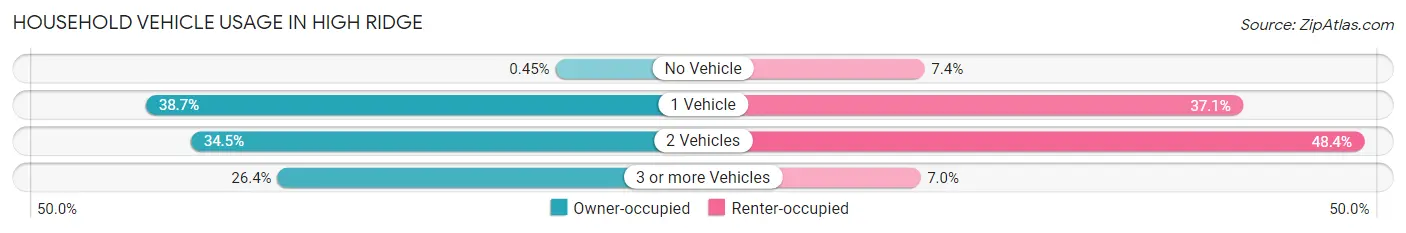
| Vehicles per Household | Owner-occupied | Renter-occupied |
| No Vehicle | 7 (0.4%) | 19 (7.4%) |
| 1 Vehicle | 608 (38.7%) | 95 (37.1%) |
| 2 Vehicles | 542 (34.5%) | 124 (48.4%) |
| 3 or more Vehicles | 415 (26.4%) | 18 (7.0%) |
| Total | 1,572 (100.0%) | 256 (100.0%) |
Real Estate & Mortgages in High Ridge
Real Estate and Mortgage Overview in High Ridge
| Characteristic | Without Mortgage | With Mortgage |
| Housing Units | 718 | 854 |
| Median Property Value | $143,900 | $164,700 |
| Median Household Income | $53,750 | $143 |
| Monthly Housing Costs | $416 | $7 |
| Real Estate Taxes | $1,363 | $0 |
Property Value by Mortgage Status in High Ridge
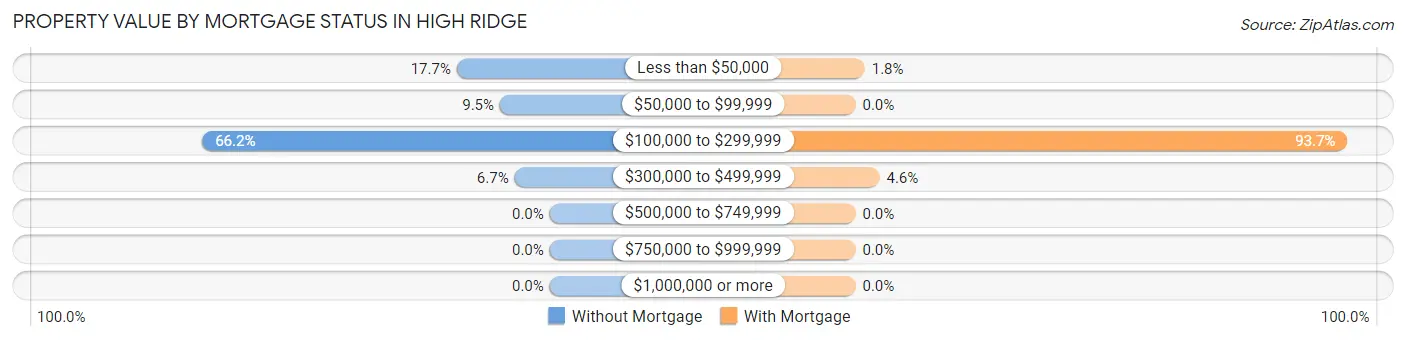
| Property Value | Without Mortgage | With Mortgage |
| Less than $50,000 | 127 (17.7%) | 15 (1.8%) |
| $50,000 to $99,999 | 68 (9.5%) | 0 (0.0%) |
| $100,000 to $299,999 | 475 (66.2%) | 800 (93.7%) |
| $300,000 to $499,999 | 48 (6.7%) | 39 (4.6%) |
| $500,000 to $749,999 | 0 (0.0%) | 0 (0.0%) |
| $750,000 to $999,999 | 0 (0.0%) | 0 (0.0%) |
| $1,000,000 or more | 0 (0.0%) | 0 (0.0%) |
| Total | 718 (100.0%) | 854 (100.0%) |
Household Income by Mortgage Status in High Ridge
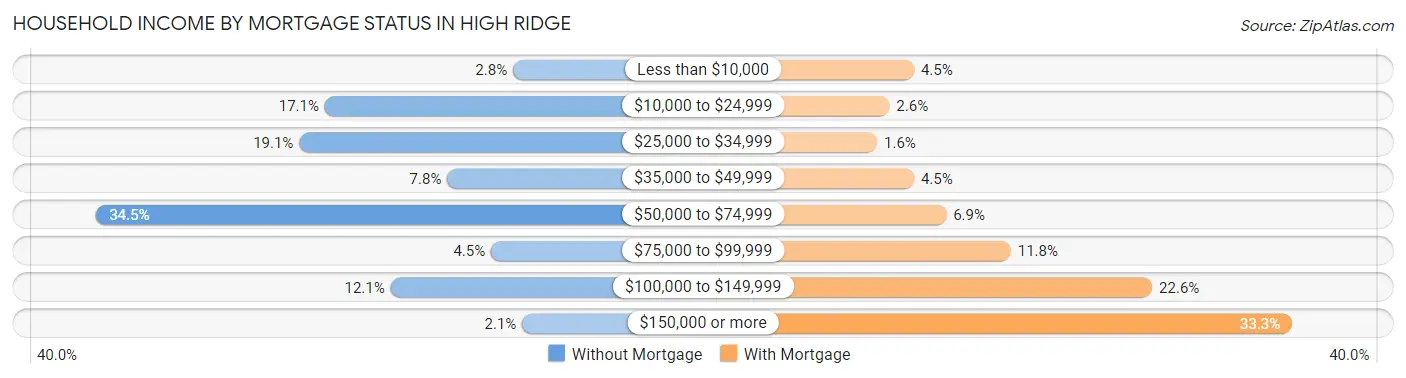
| Household Income | Without Mortgage | With Mortgage |
| Less than $10,000 | 20 (2.8%) | 38 (4.4%) |
| $10,000 to $24,999 | 123 (17.1%) | 22 (2.6%) |
| $25,000 to $34,999 | 137 (19.1%) | 14 (1.6%) |
| $35,000 to $49,999 | 56 (7.8%) | 38 (4.4%) |
| $50,000 to $74,999 | 248 (34.5%) | 59 (6.9%) |
| $75,000 to $99,999 | 32 (4.5%) | 101 (11.8%) |
| $100,000 to $149,999 | 87 (12.1%) | 193 (22.6%) |
| $150,000 or more | 15 (2.1%) | 284 (33.3%) |
| Total | 718 (100.0%) | 854 (100.0%) |
Property Value to Household Income Ratio in High Ridge
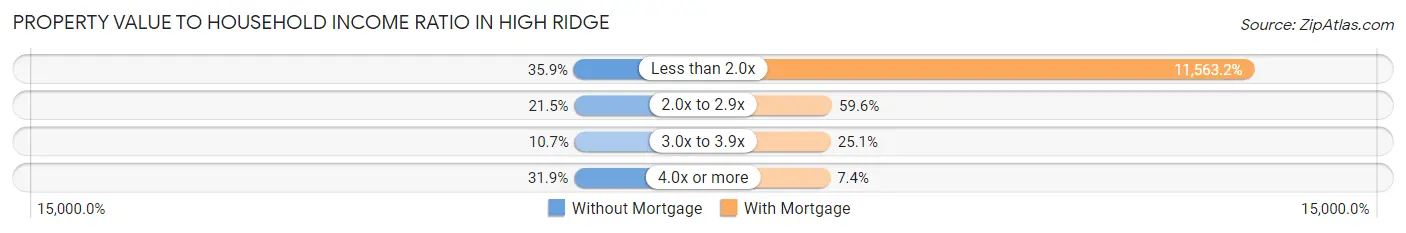
| Value-to-Income Ratio | Without Mortgage | With Mortgage |
| Less than 2.0x | 258 (35.9%) | 98,750 (11,563.2%) |
| 2.0x to 2.9x | 154 (21.4%) | 509 (59.6%) |
| 3.0x to 3.9x | 77 (10.7%) | 214 (25.1%) |
| 4.0x or more | 229 (31.9%) | 63 (7.4%) |
| Total | 718 (100.0%) | 854 (100.0%) |
Real Estate Taxes by Mortgage Status in High Ridge
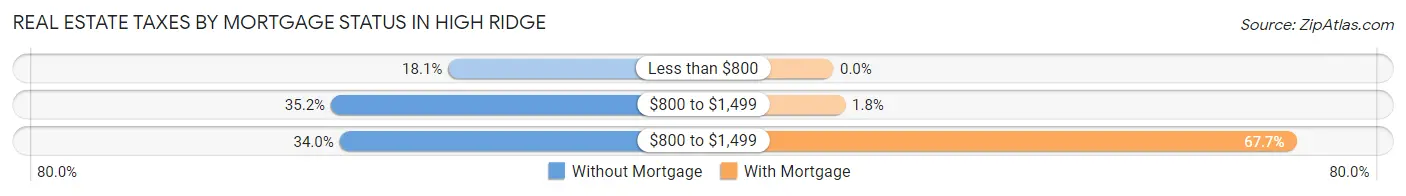
| Property Taxes | Without Mortgage | With Mortgage |
| Less than $800 | 130 (18.1%) | 0 (0.0%) |
| $800 to $1,499 | 253 (35.2%) | 15 (1.8%) |
| $800 to $1,499 | 244 (34.0%) | 578 (67.7%) |
| Total | 718 (100.0%) | 854 (100.0%) |
Health & Disability in High Ridge
Health Insurance Coverage by Age in High Ridge
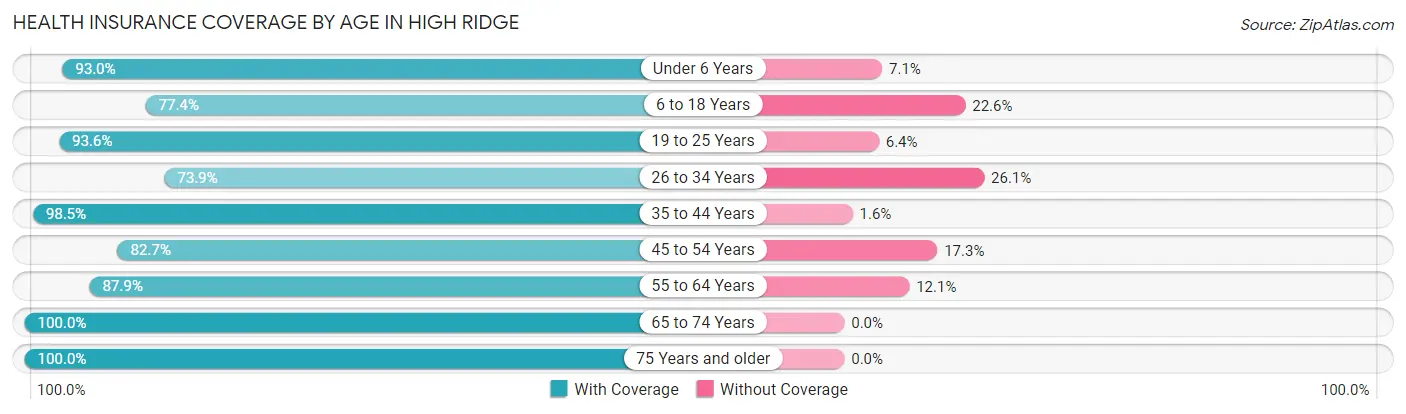
| Age Bracket | With Coverage | Without Coverage |
| Under 6 Years | 224 (92.9%) | 17 (7.0%) |
| 6 to 18 Years | 652 (77.4%) | 190 (22.6%) |
| 19 to 25 Years | 233 (93.6%) | 16 (6.4%) |
| 26 to 34 Years | 258 (73.9%) | 91 (26.1%) |
| 35 to 44 Years | 636 (98.5%) | 10 (1.5%) |
| 45 to 54 Years | 711 (82.7%) | 149 (17.3%) |
| 55 to 64 Years | 566 (87.9%) | 78 (12.1%) |
| 65 to 74 Years | 384 (100.0%) | 0 (0.0%) |
| 75 Years and older | 436 (100.0%) | 0 (0.0%) |
| Total | 4,100 (88.1%) | 551 (11.8%) |
Health Insurance Coverage by Citizenship Status in High Ridge
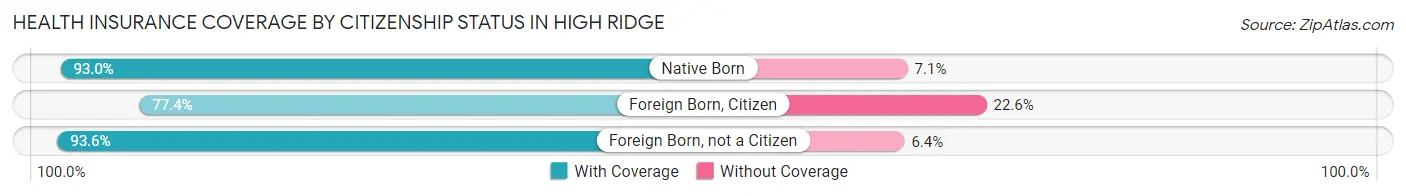
| Citizenship Status | With Coverage | Without Coverage |
| Native Born | 224 (92.9%) | 17 (7.0%) |
| Foreign Born, Citizen | 652 (77.4%) | 190 (22.6%) |
| Foreign Born, not a Citizen | 233 (93.6%) | 16 (6.4%) |
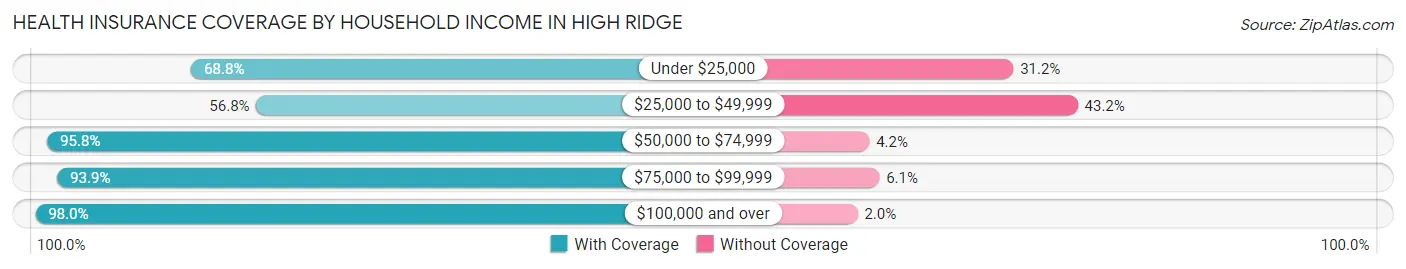
Health Insurance Coverage by Household Income in High Ridge
| Household Income | With Coverage | Without Coverage |
| Under $25,000 | 234 (68.8%) | 106 (31.2%) |
| $25,000 to $49,999 | 420 (56.8%) | 320 (43.2%) |
| $50,000 to $74,999 | 980 (95.8%) | 43 (4.2%) |
| $75,000 to $99,999 | 726 (93.9%) | 47 (6.1%) |
| $100,000 and over | 1,714 (98.0%) | 35 (2.0%) |
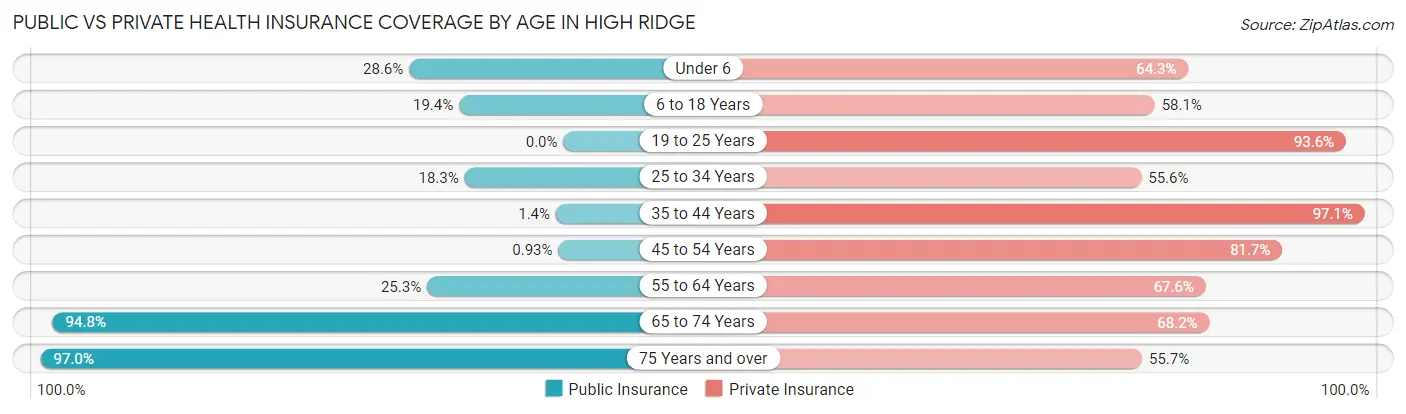
Public vs Private Health Insurance Coverage by Age in High Ridge
| Age Bracket | Public Insurance | Private Insurance |
| Under 6 | 69 (28.6%) | 155 (64.3%) |
| 6 to 18 Years | 163 (19.4%) | 489 (58.1%) |
| 19 to 25 Years | 0 (0.0%) | 233 (93.6%) |
| 25 to 34 Years | 64 (18.3%) | 194 (55.6%) |
| 35 to 44 Years | 9 (1.4%) | 627 (97.1%) |
| 45 to 54 Years | 8 (0.9%) | 703 (81.7%) |
| 55 to 64 Years | 163 (25.3%) | 435 (67.5%) |
| 65 to 74 Years | 364 (94.8%) | 262 (68.2%) |
| 75 Years and over | 423 (97.0%) | 243 (55.7%) |
| Total | 1,263 (27.2%) | 3,341 (71.8%) |
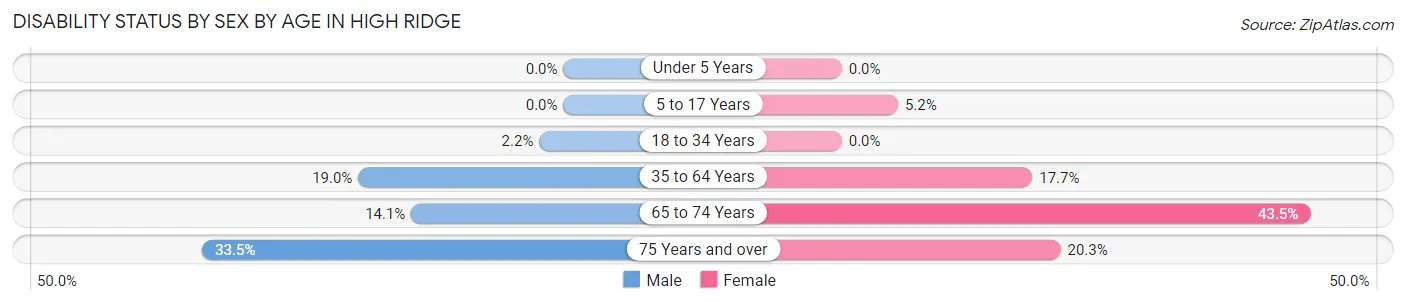
Disability Status by Sex by Age in High Ridge
| Age Bracket | Male | Female |
| Under 5 Years | 0 (0.0%) | 0 (0.0%) |
| 5 to 17 Years | 0 (0.0%) | 16 (5.2%) |
| 18 to 34 Years | 9 (2.2%) | 0 (0.0%) |
| 35 to 64 Years | 194 (19.0%) | 200 (17.7%) |
| 65 to 74 Years | 24 (14.1%) | 93 (43.5%) |
| 75 Years and over | 57 (33.5%) | 54 (20.3%) |
Disability Class by Sex by Age in High Ridge
Disability Class: Hearing Difficulty
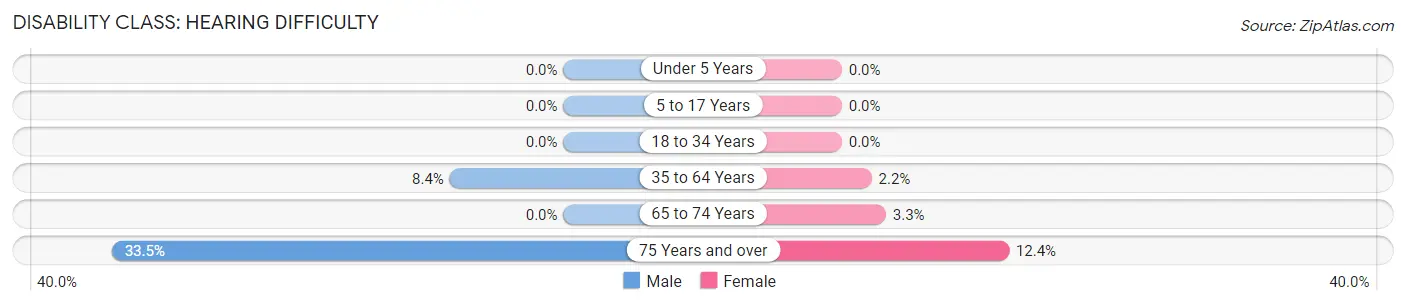
| Age Bracket | Male | Female |
| Under 5 Years | 0 (0.0%) | 0 (0.0%) |
| 5 to 17 Years | 0 (0.0%) | 0 (0.0%) |
| 18 to 34 Years | 0 (0.0%) | 0 (0.0%) |
| 35 to 64 Years | 86 (8.4%) | 25 (2.2%) |
| 65 to 74 Years | 0 (0.0%) | 7 (3.3%) |
| 75 Years and over | 57 (33.5%) | 33 (12.4%) |
Disability Class: Vision Difficulty
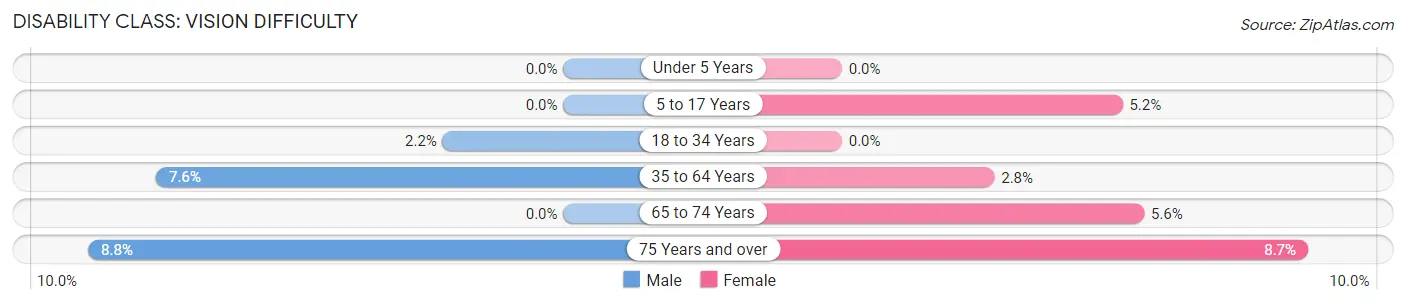
| Age Bracket | Male | Female |
| Under 5 Years | 0 (0.0%) | 0 (0.0%) |
| 5 to 17 Years | 0 (0.0%) | 16 (5.2%) |
| 18 to 34 Years | 9 (2.2%) | 0 (0.0%) |
| 35 to 64 Years | 77 (7.6%) | 32 (2.8%) |
| 65 to 74 Years | 0 (0.0%) | 12 (5.6%) |
| 75 Years and over | 15 (8.8%) | 23 (8.6%) |
Disability Class: Cognitive Difficulty
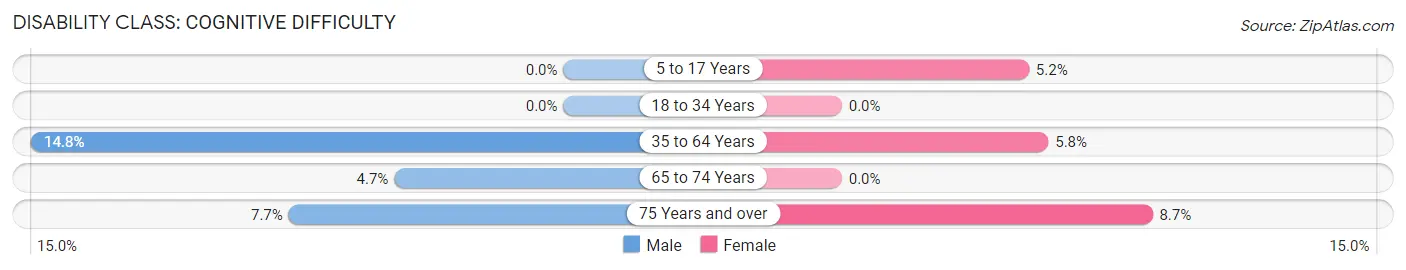
| Age Bracket | Male | Female |
| 5 to 17 Years | 0 (0.0%) | 16 (5.2%) |
| 18 to 34 Years | 0 (0.0%) | 0 (0.0%) |
| 35 to 64 Years | 151 (14.8%) | 65 (5.8%) |
| 65 to 74 Years | 8 (4.7%) | 0 (0.0%) |
| 75 Years and over | 13 (7.6%) | 23 (8.6%) |
Disability Class: Ambulatory Difficulty
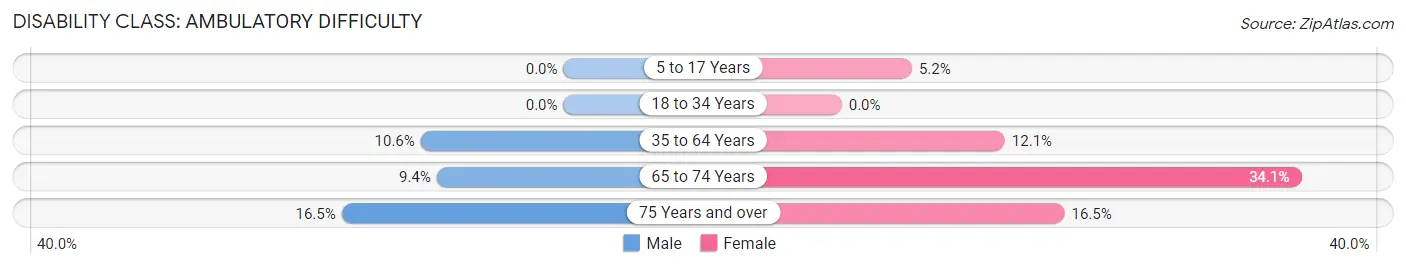
| Age Bracket | Male | Female |
| 5 to 17 Years | 0 (0.0%) | 16 (5.2%) |
| 18 to 34 Years | 0 (0.0%) | 0 (0.0%) |
| 35 to 64 Years | 108 (10.6%) | 137 (12.1%) |
| 65 to 74 Years | 16 (9.4%) | 73 (34.1%) |
| 75 Years and over | 28 (16.5%) | 44 (16.5%) |
Disability Class: Self-Care Difficulty
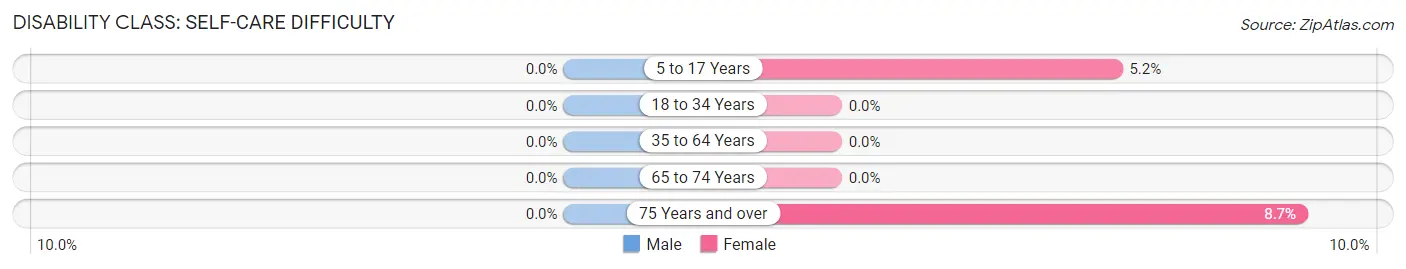
| Age Bracket | Male | Female |
| 5 to 17 Years | 0 (0.0%) | 16 (5.2%) |
| 18 to 34 Years | 0 (0.0%) | 0 (0.0%) |
| 35 to 64 Years | 0 (0.0%) | 0 (0.0%) |
| 65 to 74 Years | 0 (0.0%) | 0 (0.0%) |
| 75 Years and over | 0 (0.0%) | 23 (8.6%) |
Technology Access in High Ridge
Computing Device Access in High Ridge
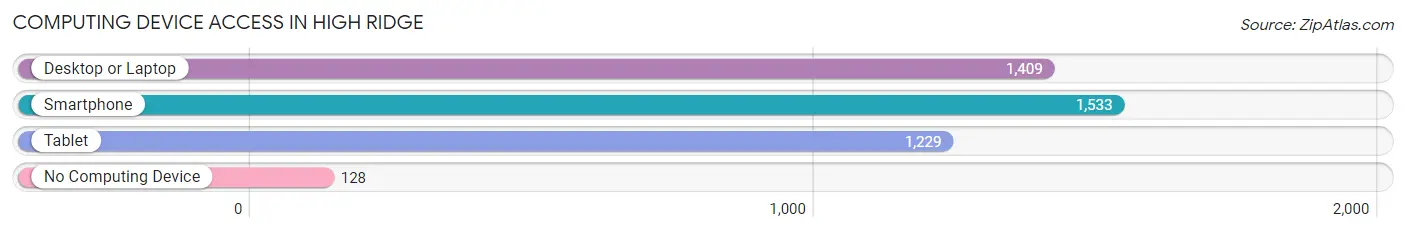
| Device Type | # Households | % Households |
| Desktop or Laptop | 1,409 | 77.1% |
| Smartphone | 1,533 | 83.9% |
| Tablet | 1,229 | 67.2% |
| No Computing Device | 128 | 7.0% |
| Total | 1,828 | 100.0% |
Internet Access in High Ridge
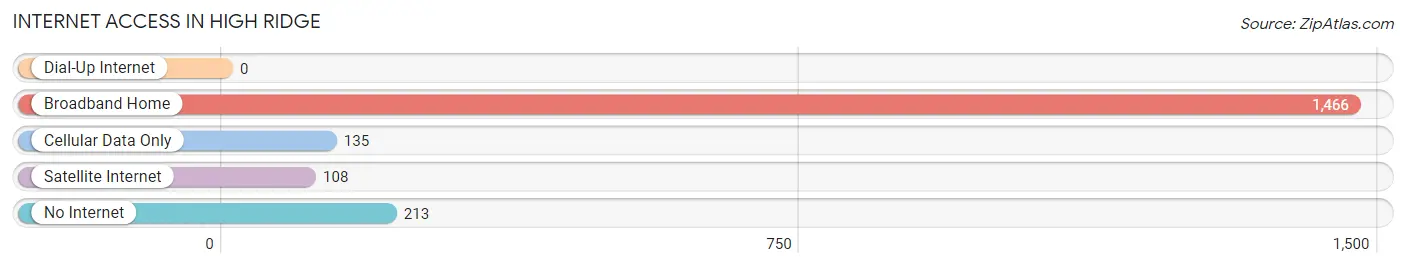
| Internet Type | # Households | % Households |
| Dial-Up Internet | 0 | 0.0% |
| Broadband Home | 1,466 | 80.2% |
| Cellular Data Only | 135 | 7.4% |
| Satellite Internet | 108 | 5.9% |
| No Internet | 213 | 11.7% |
| Total | 1,828 | 100.0% |
High Ridge Summary
High Ridge is a small city located in Jefferson County, Missouri, United States. It is situated in the foothills of the Ozark Mountains, approximately 25 miles southwest of St. Louis. The city has a population of approximately 8,000 people and is part of the Greater St. Louis metropolitan area.
History
High Ridge was founded in 1837 by a group of settlers from Kentucky and Tennessee. The city was named after the high ridge that runs through the area. The first settlers were attracted to the area due to its fertile soil and abundant natural resources. The city was incorporated in 1872 and has since grown to become a thriving community.
Geography
High Ridge is located in the foothills of the Ozark Mountains, approximately 25 miles southwest of St. Louis. The city is situated on the Meramec River and is surrounded by rolling hills and forests. The city has a total area of 4.2 square miles, all of which is land.
Economy
High Ridge is a small city with a diverse economy. The city is home to several manufacturing companies, including a steel mill, a plastics factory, and a paper mill. The city also has a thriving retail sector, with several stores and restaurants located in the downtown area. The city is also home to a number of small businesses, including a number of professional services firms.
Demographics
As of the 2010 census, High Ridge had a population of 8,000 people. The racial makeup of the city was 95.3% White, 1.2% African American, 0.3% Native American, 0.7% Asian, 0.1% Pacific Islander, 0.7% from other races, and 1.9% from two or more races. Hispanic or Latino of any race were 2.2% of the population.
The median income for a household in High Ridge was $45,000, and the median income for a family was $51,000. The per capita income for the city was $20,000. About 8.5% of families and 10.2% of the population were below the poverty line, including 14.2% of those under age 18 and 6.2% of those age 65 or over.
High Ridge is a small city with a rich history and a diverse economy. The city is home to a number of manufacturing companies, retail stores, and small businesses. The city has a population of 8,000 people, with a median income of $45,000. The city is also home to a number of cultural attractions, including a number of parks and recreational areas. High Ridge is a great place to live and work, and is a great place to call home.
Common Questions
What is Per Capita Income in High Ridge?
Per Capita income in High Ridge is $32,194.
What is the Median Family Income in High Ridge?
Median Family Income in High Ridge is $83,507.
What is the Median Household income in High Ridge?
Median Household Income in High Ridge is $70,333.
What is Income or Wage Gap in High Ridge?
Income or Wage Gap in High Ridge is 41.2%.
Women in High Ridge earn 58.8 cents for every dollar earned by a man.
What is Inequality or Gini Index in High Ridge?
Inequality or Gini Index in High Ridge is 0.36.
What is the Total Population of High Ridge?
Total Population of High Ridge is 4,651.
What is the Total Male Population of High Ridge?
Total Male Population of High Ridge is 2,257.
What is the Total Female Population of High Ridge?
Total Female Population of High Ridge is 2,394.
What is the Ratio of Males per 100 Females in High Ridge?
There are 94.28 Males per 100 Females in High Ridge.
What is the Ratio of Females per 100 Males in High Ridge?
There are 106.07 Females per 100 Males in High Ridge.
What is the Median Population Age in High Ridge?
Median Population Age in High Ridge is 45.0 Years.
What is the Average Family Size in High Ridge
Average Family Size in High Ridge is 3.2 People.
What is the Average Household Size in High Ridge
Average Household Size in High Ridge is 2.5 People.
How Large is the Labor Force in High Ridge?
There are 2,591 People in the Labor Forcein in High Ridge.
What is the Percentage of People in the Labor Force in High Ridge?
67.8% of People are in the Labor Force in High Ridge.
What is the Unemployment Rate in High Ridge?
Unemployment Rate in High Ridge is 3.7%.