Fairview borough, NJ Map & Demographics
Fairview borough Overview
$35,932
PER CAPITA INCOME
$66,701
AVG FAMILY INCOME
$59,359
AVG HOUSEHOLD INCOME
26.7%
WAGE / INCOME GAP [ % ]
73.3¢/ $1
WAGE / INCOME GAP [ $ ]
0.50
INEQUALITY / GINI INDEX
14,935
TOTAL POPULATION
7,803
MALE POPULATION
7,132
FEMALE POPULATION
109.41
MALES / 100 FEMALES
91.40
FEMALES / 100 MALES
40.2
MEDIAN AGE
3.3
AVG FAMILY SIZE
2.6
AVG HOUSEHOLD SIZE
8,521
LABOR FORCE [ PEOPLE ]
66.3%
PERCENT IN LABOR FORCE
6.5%
UNEMPLOYMENT RATE
Income in Fairview borough
Income Overview in Fairview borough
Per Capita Income in Fairview borough is $35,932, while median incomes of families and households are $66,701 and $59,359 respectively.
| Characteristic | Number | Measure |
| Per Capita Income | 14,935 | $35,932 |
| Median Family Income | 3,801 | $66,701 |
| Mean Family Income | 3,801 | $110,640 |
| Median Household Income | 5,823 | $59,359 |
| Mean Household Income | 5,823 | $90,600 |
| Income Deficit | 3,801 | $0 |
| Wage / Income Gap (%) | 14,935 | 26.66% |
| Wage / Income Gap ($) | 14,935 | 73.34¢ per $1 |
| Gini / Inequality Index | 14,935 | 0.50 |
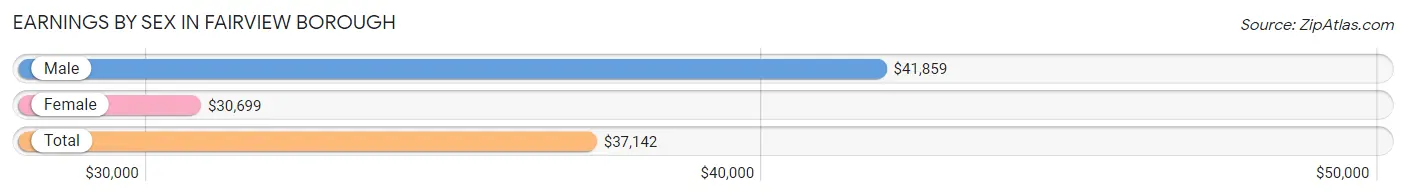
Earnings by Sex in Fairview borough
Average Earnings in Fairview borough are $37,142, $41,859 for men and $30,699 for women, a difference of 26.7%.
| Sex | Number | Average Earnings |
| Male | 5,058 (59.4%) | $41,859 |
| Female | 3,465 (40.6%) | $30,699 |
| Total | 8,523 (100.0%) | $37,142 |
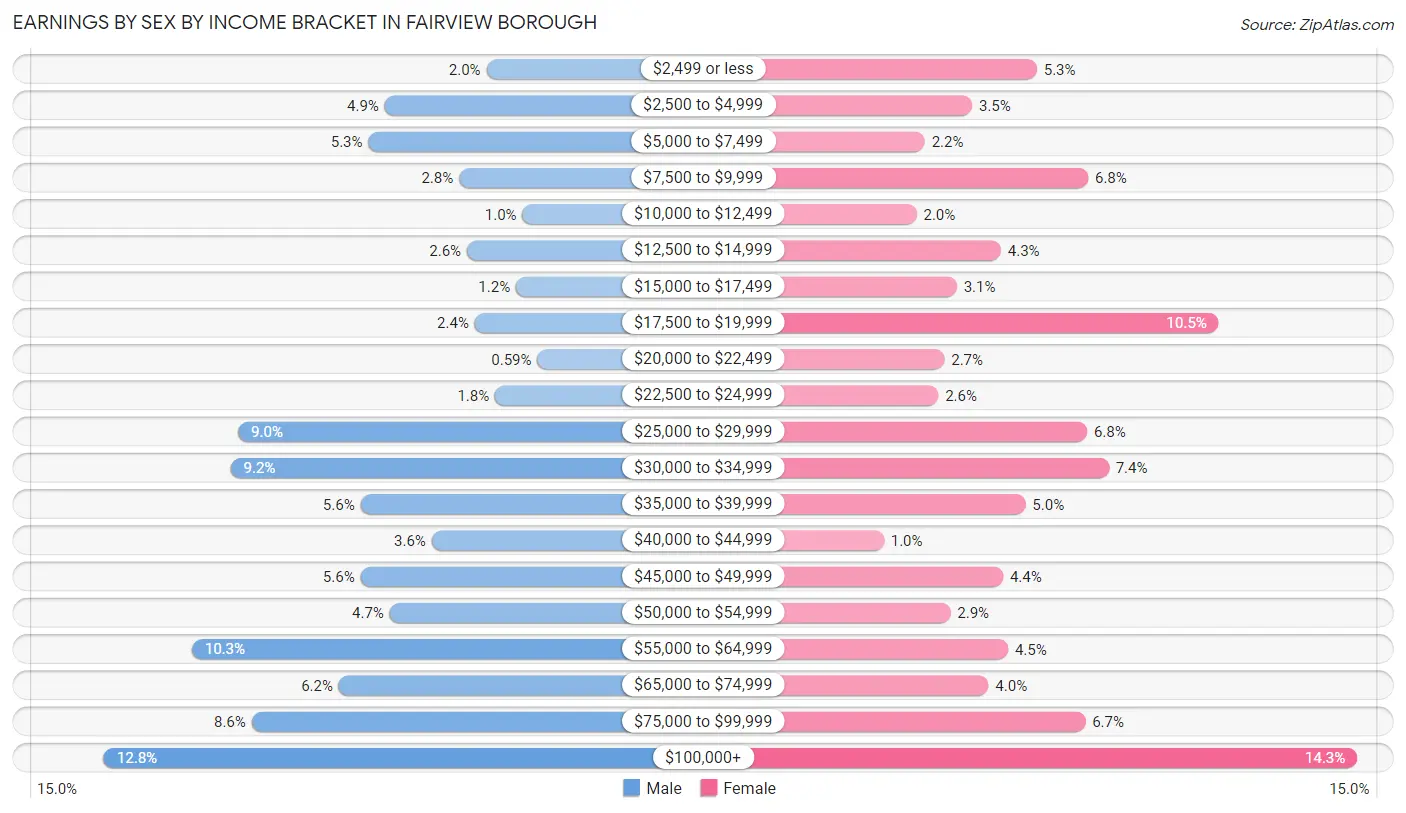
Earnings by Sex by Income Bracket in Fairview borough
The most common earnings brackets in Fairview borough are $100,000+ for men (646 | 12.8%) and $100,000+ for women (497 | 14.3%).
| Income | Male | Female |
| $2,499 or less | 102 (2.0%) | 185 (5.3%) |
| $2,500 to $4,999 | 247 (4.9%) | 122 (3.5%) |
| $5,000 to $7,499 | 270 (5.3%) | 76 (2.2%) |
| $7,500 to $9,999 | 141 (2.8%) | 235 (6.8%) |
| $10,000 to $12,499 | 51 (1.0%) | 68 (2.0%) |
| $12,500 to $14,999 | 130 (2.6%) | 150 (4.3%) |
| $15,000 to $17,499 | 60 (1.2%) | 107 (3.1%) |
| $17,500 to $19,999 | 119 (2.4%) | 362 (10.4%) |
| $20,000 to $22,499 | 30 (0.6%) | 95 (2.7%) |
| $22,500 to $24,999 | 90 (1.8%) | 89 (2.6%) |
| $25,000 to $29,999 | 455 (9.0%) | 234 (6.8%) |
| $30,000 to $34,999 | 466 (9.2%) | 255 (7.4%) |
| $35,000 to $39,999 | 281 (5.6%) | 174 (5.0%) |
| $40,000 to $44,999 | 180 (3.6%) | 36 (1.0%) |
| $45,000 to $49,999 | 281 (5.6%) | 152 (4.4%) |
| $50,000 to $54,999 | 240 (4.7%) | 101 (2.9%) |
| $55,000 to $64,999 | 521 (10.3%) | 157 (4.5%) |
| $65,000 to $74,999 | 312 (6.2%) | 138 (4.0%) |
| $75,000 to $99,999 | 436 (8.6%) | 232 (6.7%) |
| $100,000+ | 646 (12.8%) | 497 (14.3%) |
| Total | 5,058 (100.0%) | 3,465 (100.0%) |
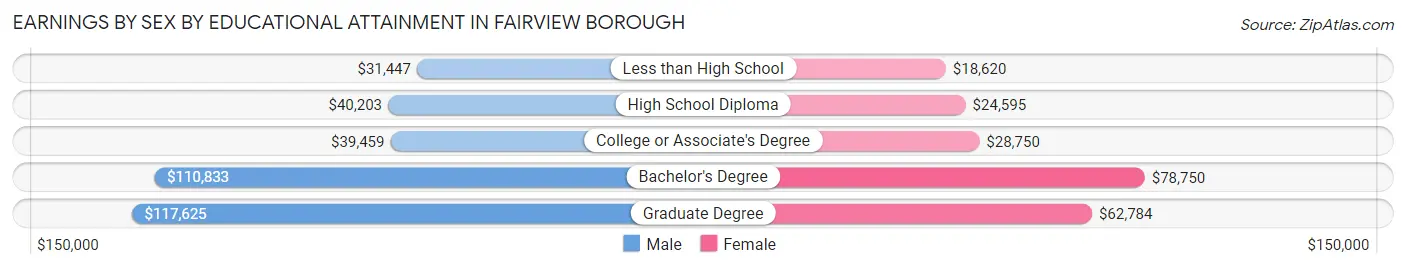
Earnings by Sex by Educational Attainment in Fairview borough
Average earnings in Fairview borough are $45,890 for men and $37,819 for women, a difference of 17.6%. Men with an educational attainment of graduate degree enjoy the highest average annual earnings of $117,625, while those with less than high school education earn the least with $31,447. Women with an educational attainment of bachelor's degree earn the most with the average annual earnings of $78,750, while those with less than high school education have the smallest earnings of $18,620.
| Educational Attainment | Male Income | Female Income |
| Less than High School | $31,447 | $18,620 |
| High School Diploma | $40,203 | $24,595 |
| College or Associate's Degree | $39,459 | $28,750 |
| Bachelor's Degree | $110,833 | $78,750 |
| Graduate Degree | $117,625 | $62,784 |
| Total | $45,890 | $37,819 |
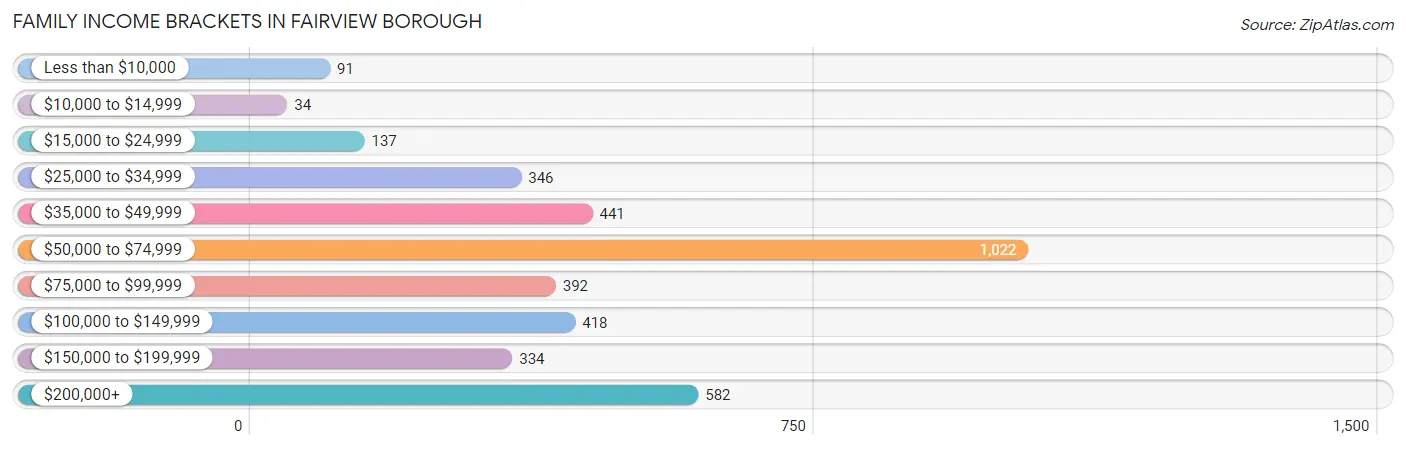
Family Income in Fairview borough
Family Income Brackets in Fairview borough
According to the Fairview borough family income data, there are 1,022 families falling into the $50,000 to $74,999 income range, which is the most common income bracket and makes up 26.9% of all families. Conversely, the $10,000 to $14,999 income bracket is the least frequent group with only 34 families (0.9%) belonging to this category.
| Income Bracket | # Families | % Families |
| Less than $10,000 | 91 | 2.4% |
| $10,000 to $14,999 | 34 | 0.9% |
| $15,000 to $24,999 | 137 | 3.6% |
| $25,000 to $34,999 | 346 | 9.1% |
| $35,000 to $49,999 | 441 | 11.6% |
| $50,000 to $74,999 | 1,022 | 26.9% |
| $75,000 to $99,999 | 392 | 10.3% |
| $100,000 to $149,999 | 418 | 11.0% |
| $150,000 to $199,999 | 334 | 8.8% |
| $200,000+ | 582 | 15.3% |
Family Income by Famaliy Size in Fairview borough
7+ person families (130 | 3.4%) account for the highest median family income in Fairview borough with $128,446 per family, while 2-person families (1,651 | 43.4%) have the highest median income of $38,166 per family member.
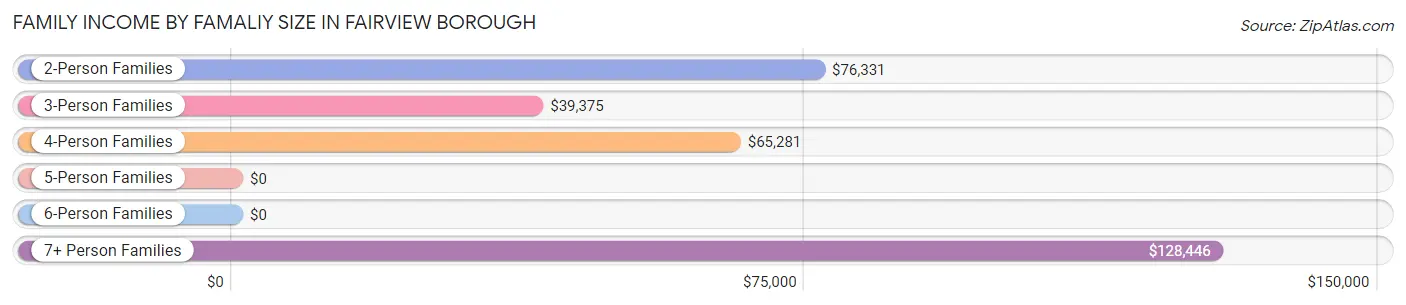
| Income Bracket | # Families | Median Income |
| 2-Person Families | 1,651 (43.4%) | $76,331 |
| 3-Person Families | 736 (19.4%) | $39,375 |
| 4-Person Families | 938 (24.7%) | $65,281 |
| 5-Person Families | 298 (7.8%) | $0 |
| 6-Person Families | 48 (1.3%) | $0 |
| 7+ Person Families | 130 (3.4%) | $128,446 |
| Total | 3,801 (100.0%) | $66,701 |
Family Income by Number of Earners in Fairview borough
The median family income in Fairview borough is $66,701, with families comprising 3+ earners (491) having the highest median family income of $150,844, while families with no earners (169) have the lowest median family income of $2,499, accounting for 12.9% and 4.4% of families, respectively.
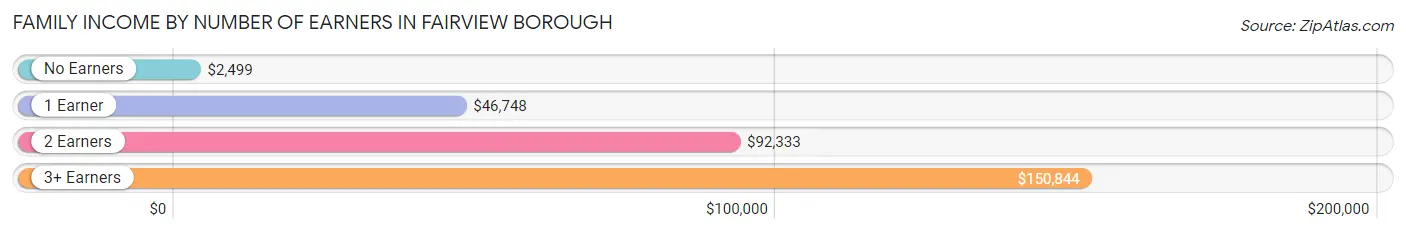
| Number of Earners | # Families | Median Income |
| No Earners | 169 (4.4%) | $2,499 |
| 1 Earner | 1,419 (37.3%) | $46,748 |
| 2 Earners | 1,722 (45.3%) | $92,333 |
| 3+ Earners | 491 (12.9%) | $150,844 |
| Total | 3,801 (100.0%) | $66,701 |
Household Income in Fairview borough
Household Income Brackets in Fairview borough
With 1,368 households falling in the category, the $50,000 to $74,999 income range is the most frequent in Fairview borough, accounting for 23.5% of all households. In contrast, only 262 households (4.5%) fall into the $10,000 to $14,999 income bracket, making it the least populous group.
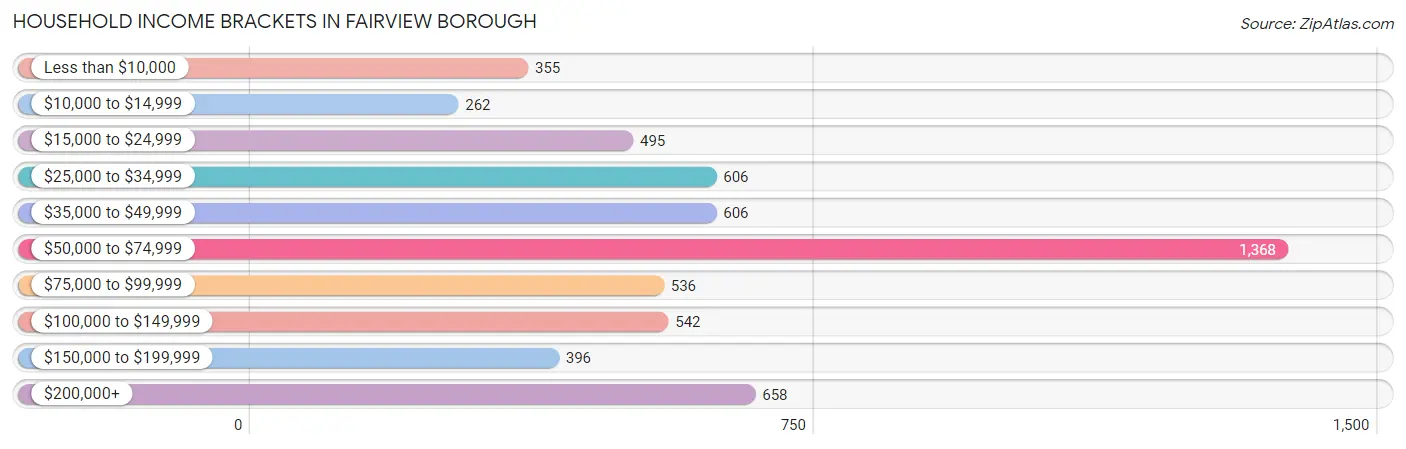
| Income Bracket | # Households | % Households |
| Less than $10,000 | 355 | 6.1% |
| $10,000 to $14,999 | 262 | 4.5% |
| $15,000 to $24,999 | 495 | 8.5% |
| $25,000 to $34,999 | 606 | 10.4% |
| $35,000 to $49,999 | 606 | 10.4% |
| $50,000 to $74,999 | 1,368 | 23.5% |
| $75,000 to $99,999 | 536 | 9.2% |
| $100,000 to $149,999 | 542 | 9.3% |
| $150,000 to $199,999 | 396 | 6.8% |
| $200,000+ | 658 | 11.3% |
Household Income by Householder Age in Fairview borough
The median household income in Fairview borough is $59,359, with the highest median household income of $70,166 found in the 45 to 64 years age bracket for the primary householder. A total of 2,309 households (39.7%) fall into this category. Meanwhile, the 15 to 24 years age bracket for the primary householder has the lowest median household income of $0, with 232 households (4.0%) in this group.
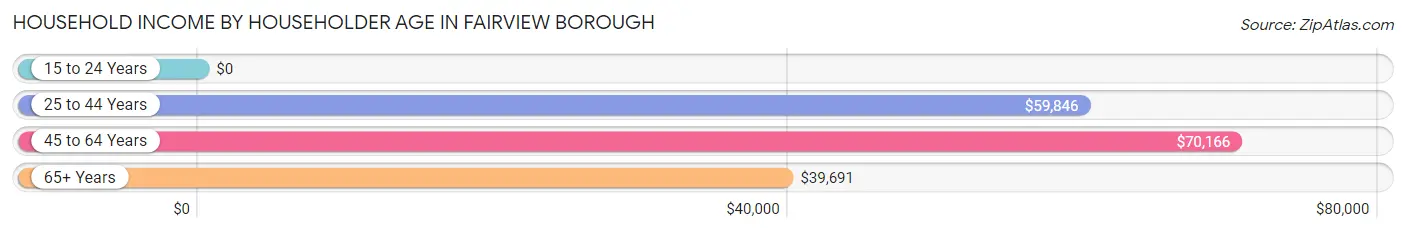
| Income Bracket | # Households | Median Income |
| 15 to 24 Years | 232 (4.0%) | $0 |
| 25 to 44 Years | 2,010 (34.5%) | $59,846 |
| 45 to 64 Years | 2,309 (39.7%) | $70,166 |
| 65+ Years | 1,272 (21.8%) | $39,691 |
| Total | 5,823 (100.0%) | $59,359 |
Poverty in Fairview borough
Income Below Poverty by Sex and Age in Fairview borough
With 14.8% poverty level for males and 19.0% for females among the residents of Fairview borough, 6 to 11 year old males and 12 to 14 year old females are the most vulnerable to poverty, with 184 males (45.0%) and 239 females (71.1%) in their respective age groups living below the poverty level.
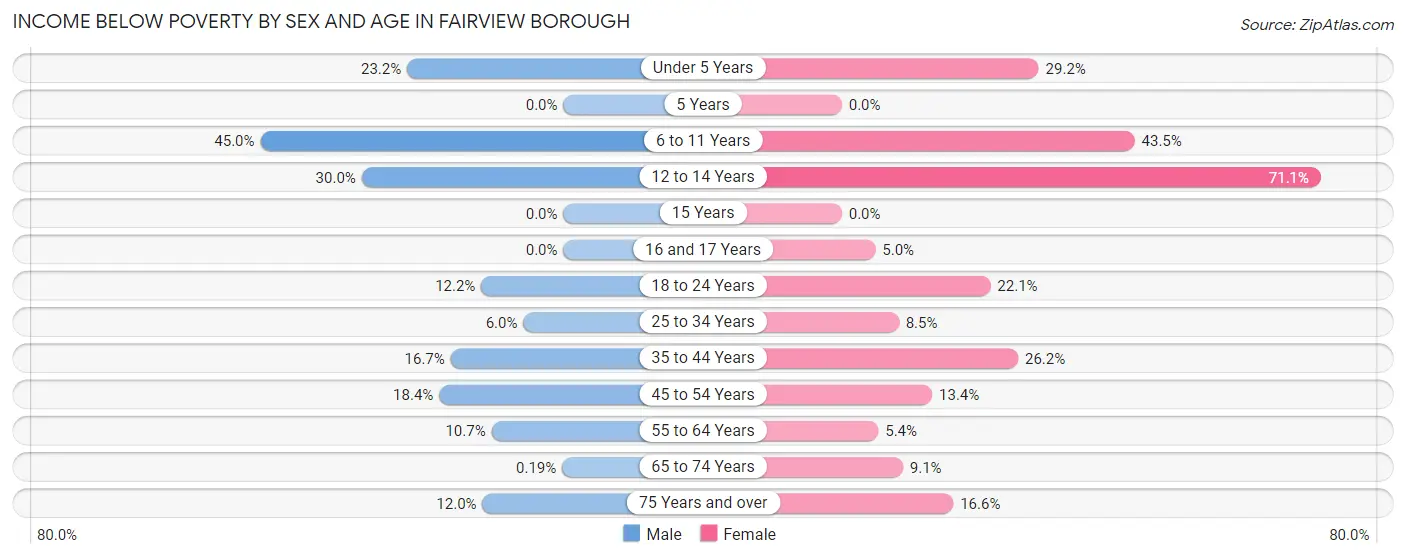
| Age Bracket | Male | Female |
| Under 5 Years | 110 (23.2%) | 76 (29.2%) |
| 5 Years | 0 (0.0%) | 0 (0.0%) |
| 6 to 11 Years | 184 (45.0%) | 130 (43.5%) |
| 12 to 14 Years | 62 (29.9%) | 239 (71.1%) |
| 15 Years | 0 (0.0%) | 0 (0.0%) |
| 16 and 17 Years | 0 (0.0%) | 12 (5.0%) |
| 18 to 24 Years | 105 (12.2%) | 205 (22.1%) |
| 25 to 34 Years | 71 (5.9%) | 59 (8.5%) |
| 35 to 44 Years | 270 (16.7%) | 247 (26.2%) |
| 45 to 54 Years | 206 (18.4%) | 160 (13.4%) |
| 55 to 64 Years | 99 (10.7%) | 47 (5.4%) |
| 65 to 74 Years | 1 (0.2%) | 41 (9.1%) |
| 75 Years and over | 44 (12.0%) | 138 (16.6%) |
| Total | 1,152 (14.8%) | 1,354 (19.0%) |
Income Above Poverty by Sex and Age in Fairview borough
According to the poverty statistics in Fairview borough, males aged 15 years and females aged 5 years are the age groups that are most secure financially, with 100.0% of males and 100.0% of females in these age groups living above the poverty line.
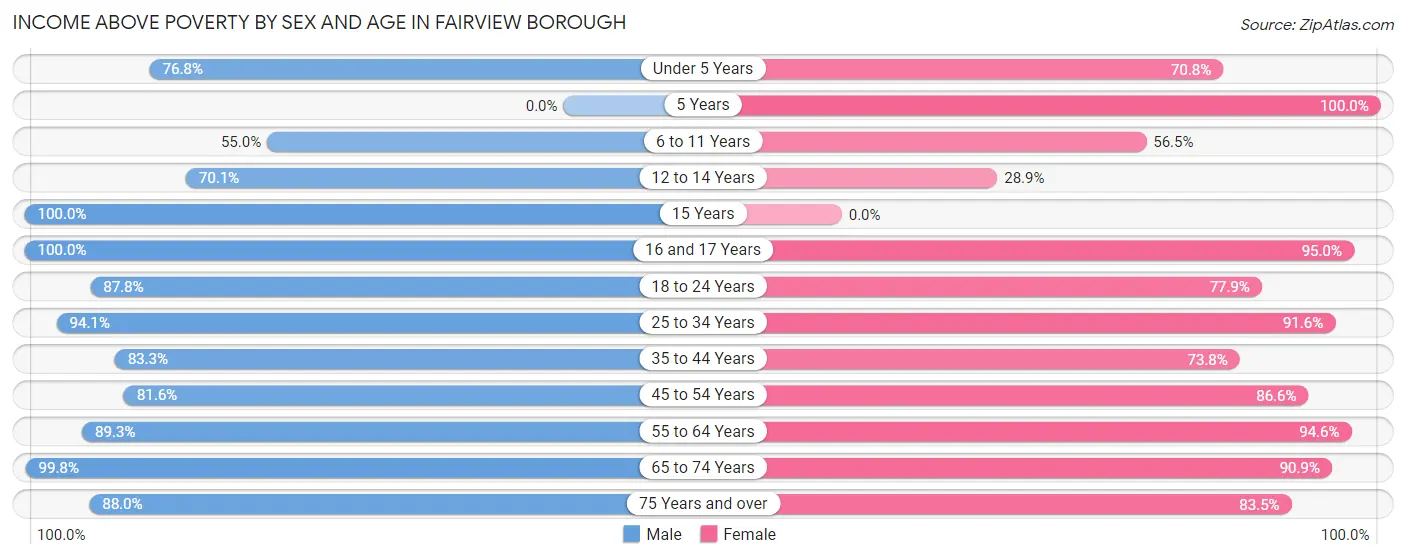
| Age Bracket | Male | Female |
| Under 5 Years | 364 (76.8%) | 184 (70.8%) |
| 5 Years | 0 (0.0%) | 79 (100.0%) |
| 6 to 11 Years | 225 (55.0%) | 169 (56.5%) |
| 12 to 14 Years | 145 (70.1%) | 97 (28.9%) |
| 15 Years | 17 (100.0%) | 0 (0.0%) |
| 16 and 17 Years | 86 (100.0%) | 229 (95.0%) |
| 18 to 24 Years | 756 (87.8%) | 724 (77.9%) |
| 25 to 34 Years | 1,123 (94.1%) | 639 (91.5%) |
| 35 to 44 Years | 1,343 (83.3%) | 697 (73.8%) |
| 45 to 54 Years | 911 (81.6%) | 1,033 (86.6%) |
| 55 to 64 Years | 829 (89.3%) | 820 (94.6%) |
| 65 to 74 Years | 528 (99.8%) | 411 (90.9%) |
| 75 Years and over | 322 (88.0%) | 696 (83.5%) |
| Total | 6,649 (85.2%) | 5,778 (81.0%) |
Income Below Poverty Among Married-Couple Families in Fairview borough
The poverty statistics for married-couple families in Fairview borough show that 8.9% or 211 of the total 2,358 families live below the poverty line. Families with 3 or 4 children have the highest poverty rate of 51.1%, comprising of 94 families. On the other hand, families with no children have the lowest poverty rate of 0.0%, which includes 0 families.
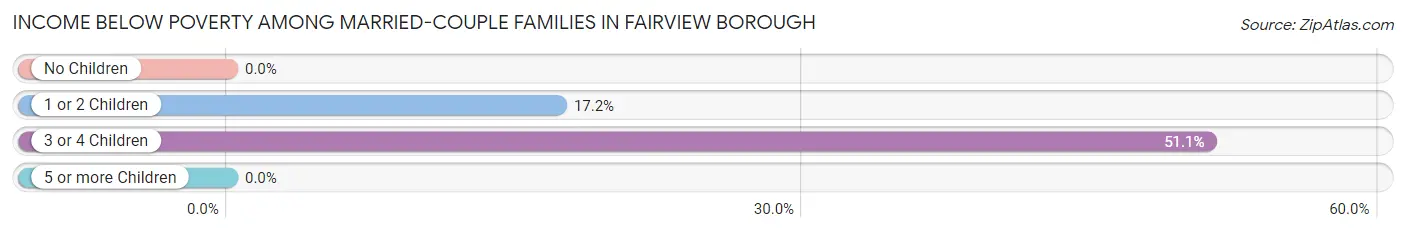
| Children | Above Poverty | Below Poverty |
| No Children | 1,493 (100.0%) | 0 (0.0%) |
| 1 or 2 Children | 564 (82.8%) | 117 (17.2%) |
| 3 or 4 Children | 90 (48.9%) | 94 (51.1%) |
| 5 or more Children | 0 (0.0%) | 0 (0.0%) |
| Total | 2,147 (91.0%) | 211 (8.9%) |
Income Below Poverty Among Single-Parent Households in Fairview borough
According to the poverty data in Fairview borough, 6.3% or 33 single-father households and 27.0% or 249 single-mother households are living below the poverty line. Among single-father households, those with 1 or 2 children have the highest poverty rate, with 33 households (27.1%) experiencing poverty. Likewise, among single-mother households, those with 1 or 2 children have the highest poverty rate, with 213 households (63.6%) falling below the poverty line.
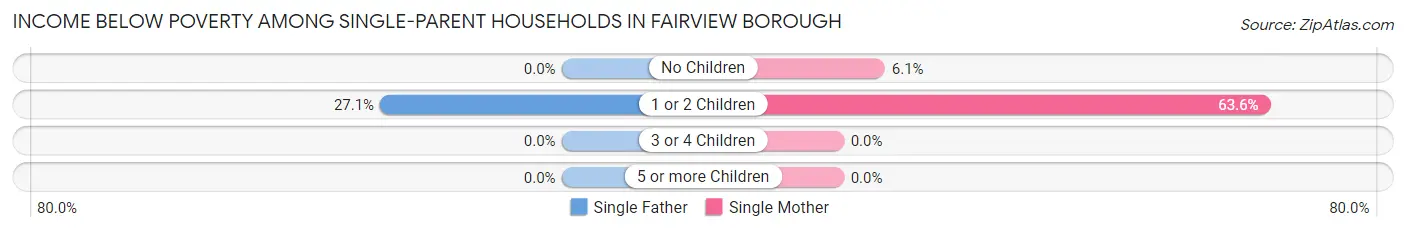
| Children | Single Father | Single Mother |
| No Children | 0 (0.0%) | 36 (6.1%) |
| 1 or 2 Children | 33 (27.1%) | 213 (63.6%) |
| 3 or 4 Children | 0 (0.0%) | 0 (0.0%) |
| 5 or more Children | 0 (0.0%) | 0 (0.0%) |
| Total | 33 (6.3%) | 249 (27.0%) |
Income Below Poverty Among Married-Couple vs Single-Parent Households in Fairview borough
The poverty data for Fairview borough shows that 211 of the married-couple family households (8.9%) and 282 of the single-parent households (19.5%) are living below the poverty level. Within the married-couple family households, those with 3 or 4 children have the highest poverty rate, with 94 households (51.1%) falling below the poverty line. Among the single-parent households, those with 1 or 2 children have the highest poverty rate, with 246 household (53.8%) living below poverty.
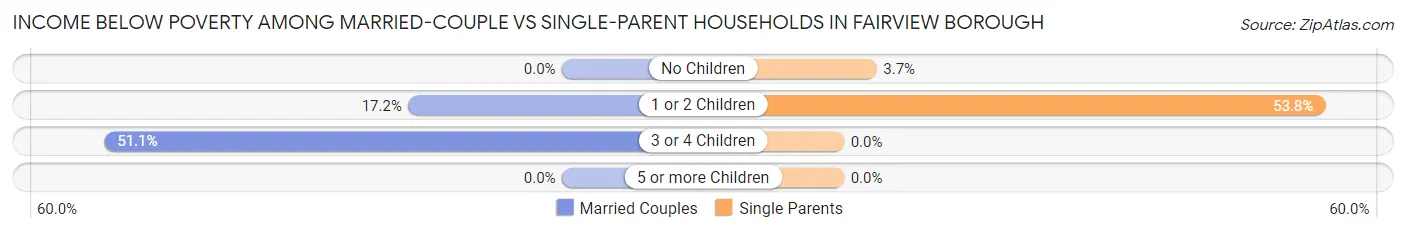
| Children | Married-Couple Families | Single-Parent Households |
| No Children | 0 (0.0%) | 36 (3.6%) |
| 1 or 2 Children | 117 (17.2%) | 246 (53.8%) |
| 3 or 4 Children | 94 (51.1%) | 0 (0.0%) |
| 5 or more Children | 0 (0.0%) | 0 (0.0%) |
| Total | 211 (8.9%) | 282 (19.5%) |
Race in Fairview borough
The most populous races in Fairview borough are White / Caucasian (8,644 | 57.9%), Hispanic or Latino (8,215 | 55.0%), and Some other Race (3,123 | 20.9%).
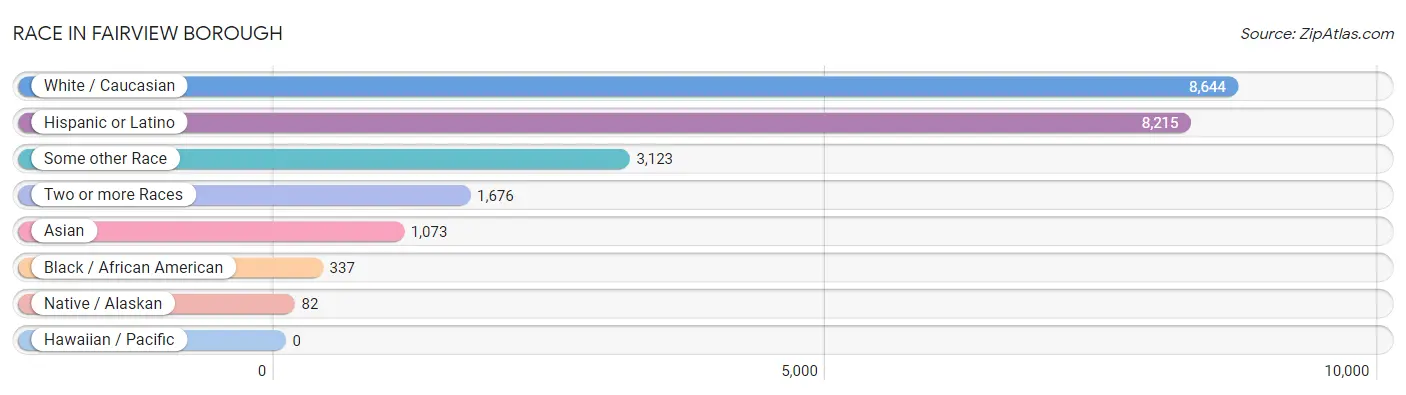
| Race | # Population | % Population |
| Asian | 1,073 | 7.2% |
| Black / African American | 337 | 2.3% |
| Hawaiian / Pacific | 0 | 0.0% |
| Hispanic or Latino | 8,215 | 55.0% |
| Native / Alaskan | 82 | 0.5% |
| White / Caucasian | 8,644 | 57.9% |
| Two or more Races | 1,676 | 11.2% |
| Some other Race | 3,123 | 20.9% |
| Total | 14,935 | 100.0% |
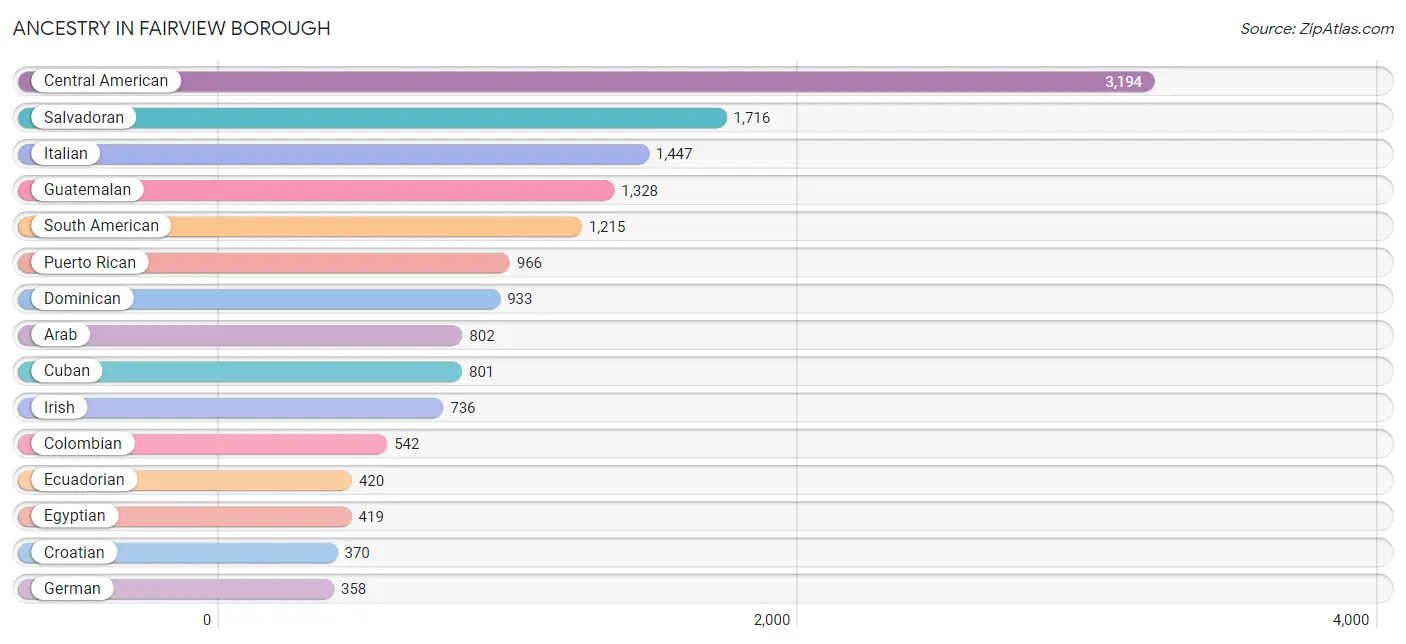
Ancestry in Fairview borough
The most populous ancestries reported in Fairview borough are Central American (3,194 | 21.4%), Salvadoran (1,716 | 11.5%), Italian (1,447 | 9.7%), Guatemalan (1,328 | 8.9%), and South American (1,215 | 8.1%), together accounting for 59.6% of all Fairview borough residents.
| Ancestry | # Population | % Population |
| Alaskan Athabascan | 5 | 0.0% |
| American | 183 | 1.2% |
| Arab | 802 | 5.4% |
| Armenian | 18 | 0.1% |
| Bhutanese | 13 | 0.1% |
| Blackfeet | 9 | 0.1% |
| Brazilian | 92 | 0.6% |
| British | 32 | 0.2% |
| Burmese | 269 | 1.8% |
| Central American | 3,194 | 21.4% |
| Central American Indian | 48 | 0.3% |
| Chilean | 24 | 0.2% |
| Colombian | 542 | 3.6% |
| Croatian | 370 | 2.5% |
| Cuban | 801 | 5.4% |
| Dominican | 933 | 6.2% |
| Dutch | 145 | 1.0% |
| Ecuadorian | 420 | 2.8% |
| Egyptian | 419 | 2.8% |
| English | 317 | 2.1% |
| European | 119 | 0.8% |
| French | 298 | 2.0% |
| German | 358 | 2.4% |
| Greek | 67 | 0.4% |
| Guatemalan | 1,328 | 8.9% |
| Honduran | 150 | 1.0% |
| Indian (Asian) | 152 | 1.0% |
| Irish | 736 | 4.9% |
| Italian | 1,447 | 9.7% |
| Korean | 90 | 0.6% |
| Lumbee | 15 | 0.1% |
| Mexican | 51 | 0.3% |
| Nigerian | 40 | 0.3% |
| Pakistani | 76 | 0.5% |
| Palestinian | 326 | 2.2% |
| Peruvian | 229 | 1.5% |
| Polish | 14 | 0.1% |
| Portuguese | 10 | 0.1% |
| Puerto Rican | 966 | 6.5% |
| Romanian | 92 | 0.6% |
| Salvadoran | 1,716 | 11.5% |
| South American | 1,215 | 8.1% |
| Spaniard | 244 | 1.6% |
| Sri Lankan | 1 | 0.0% |
| Subsaharan African | 40 | 0.3% |
| Syrian | 57 | 0.4% |
| Thai | 321 | 2.1% |
| Turkish | 98 | 0.7% |
| Vietnamese | 89 | 0.6% | View All 49 Rows |
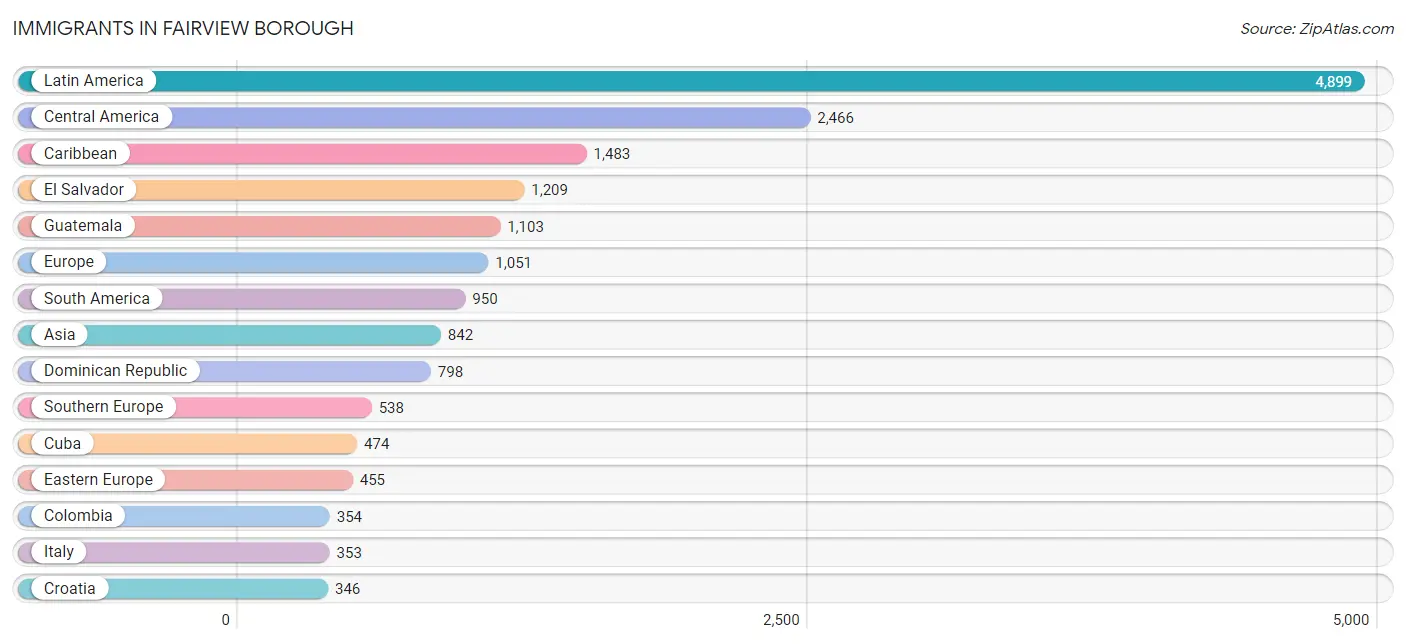
Immigrants in Fairview borough
The most numerous immigrant groups reported in Fairview borough came from Latin America (4,899 | 32.8%), Central America (2,466 | 16.5%), Caribbean (1,483 | 9.9%), El Salvador (1,209 | 8.1%), and Guatemala (1,103 | 7.4%), together accounting for 74.7% of all Fairview borough residents.
| Immigration Origin | # Population | % Population |
| Africa | 236 | 1.6% |
| Albania | 31 | 0.2% |
| Asia | 842 | 5.6% |
| Bangladesh | 89 | 0.6% |
| Brazil | 92 | 0.6% |
| Canada | 33 | 0.2% |
| Caribbean | 1,483 | 9.9% |
| Central America | 2,466 | 16.5% |
| Chile | 24 | 0.2% |
| Colombia | 354 | 2.4% |
| Croatia | 346 | 2.3% |
| Cuba | 474 | 3.2% |
| Dominican Republic | 798 | 5.3% |
| Eastern Asia | 215 | 1.4% |
| Eastern Europe | 455 | 3.0% |
| Ecuador | 244 | 1.6% |
| Egypt | 196 | 1.3% |
| El Salvador | 1,209 | 8.1% |
| Europe | 1,051 | 7.0% |
| Guatemala | 1,103 | 7.4% |
| Honduras | 103 | 0.7% |
| India | 43 | 0.3% |
| Ireland | 11 | 0.1% |
| Italy | 353 | 2.4% |
| Jamaica | 139 | 0.9% |
| Japan | 13 | 0.1% |
| Jordan | 8 | 0.1% |
| Korea | 202 | 1.3% |
| Latin America | 4,899 | 32.8% |
| Malaysia | 38 | 0.3% |
| Mexico | 51 | 0.3% |
| Nigeria | 40 | 0.3% |
| Northern Africa | 196 | 1.3% |
| Northern Europe | 58 | 0.4% |
| Peru | 220 | 1.5% |
| Philippines | 62 | 0.4% |
| Portugal | 43 | 0.3% |
| Romania | 44 | 0.3% |
| South America | 950 | 6.4% |
| South Central Asia | 249 | 1.7% |
| South Eastern Asia | 177 | 1.2% |
| Southern Europe | 538 | 3.6% |
| Spain | 142 | 0.9% |
| Sri Lanka | 117 | 0.8% |
| Syria | 48 | 0.3% |
| Thailand | 76 | 0.5% |
| Turkey | 98 | 0.7% |
| Ukraine | 34 | 0.2% |
| Uruguay | 16 | 0.1% |
| Vietnam | 1 | 0.0% |
| Western Africa | 40 | 0.3% |
| Western Asia | 163 | 1.1% | View All 52 Rows |
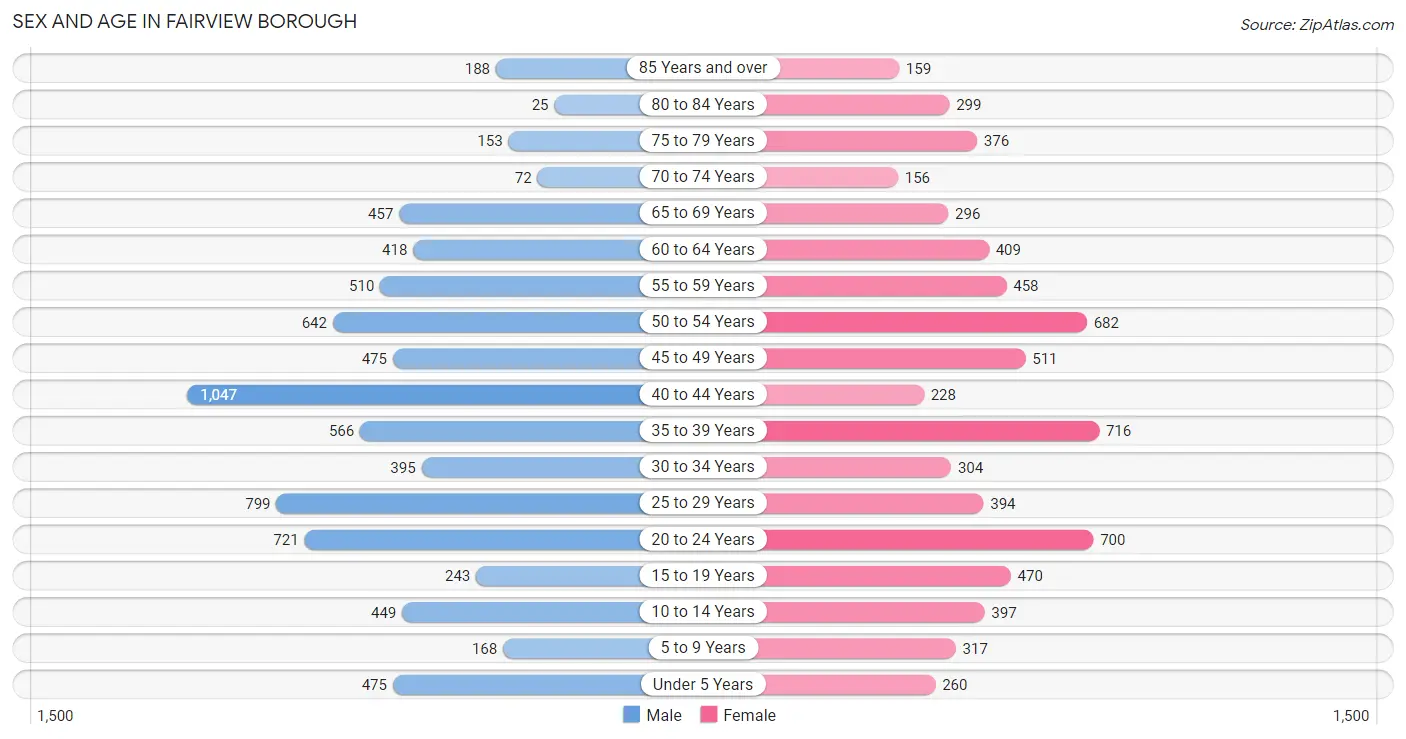
Sex and Age in Fairview borough
Sex and Age in Fairview borough
The most populous age groups in Fairview borough are 40 to 44 Years (1,047 | 13.4%) for men and 35 to 39 Years (716 | 10.0%) for women.
| Age Bracket | Male | Female |
| Under 5 Years | 475 (6.1%) | 260 (3.6%) |
| 5 to 9 Years | 168 (2.1%) | 317 (4.4%) |
| 10 to 14 Years | 449 (5.8%) | 397 (5.6%) |
| 15 to 19 Years | 243 (3.1%) | 470 (6.6%) |
| 20 to 24 Years | 721 (9.2%) | 700 (9.8%) |
| 25 to 29 Years | 799 (10.2%) | 394 (5.5%) |
| 30 to 34 Years | 395 (5.1%) | 304 (4.3%) |
| 35 to 39 Years | 566 (7.2%) | 716 (10.0%) |
| 40 to 44 Years | 1,047 (13.4%) | 228 (3.2%) |
| 45 to 49 Years | 475 (6.1%) | 511 (7.2%) |
| 50 to 54 Years | 642 (8.2%) | 682 (9.6%) |
| 55 to 59 Years | 510 (6.5%) | 458 (6.4%) |
| 60 to 64 Years | 418 (5.4%) | 409 (5.7%) |
| 65 to 69 Years | 457 (5.9%) | 296 (4.2%) |
| 70 to 74 Years | 72 (0.9%) | 156 (2.2%) |
| 75 to 79 Years | 153 (2.0%) | 376 (5.3%) |
| 80 to 84 Years | 25 (0.3%) | 299 (4.2%) |
| 85 Years and over | 188 (2.4%) | 159 (2.2%) |
| Total | 7,803 (100.0%) | 7,132 (100.0%) |
Families and Households in Fairview borough
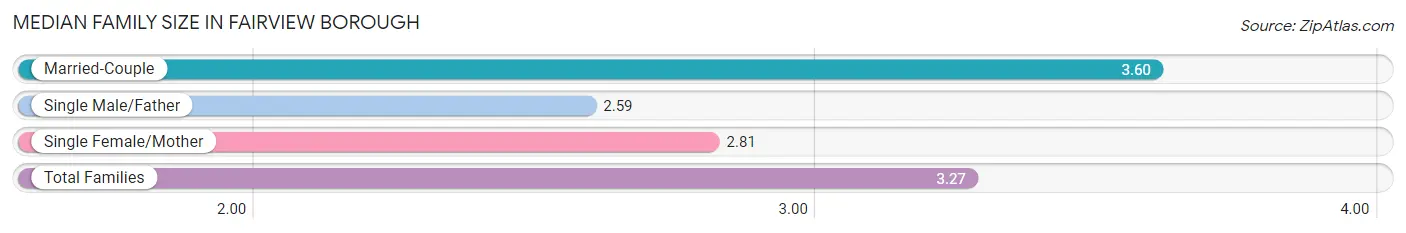
Median Family Size in Fairview borough
The median family size in Fairview borough is 3.27 persons per family, with married-couple families (2,358 | 62.0%) accounting for the largest median family size of 3.6 persons per family. On the other hand, single male/father families (521 | 13.7%) represent the smallest median family size with 2.59 persons per family.
| Family Type | # Families | Family Size |
| Married-Couple | 2,358 (62.0%) | 3.60 |
| Single Male/Father | 521 (13.7%) | 2.59 |
| Single Female/Mother | 922 (24.3%) | 2.81 |
| Total Families | 3,801 (100.0%) | 3.27 |
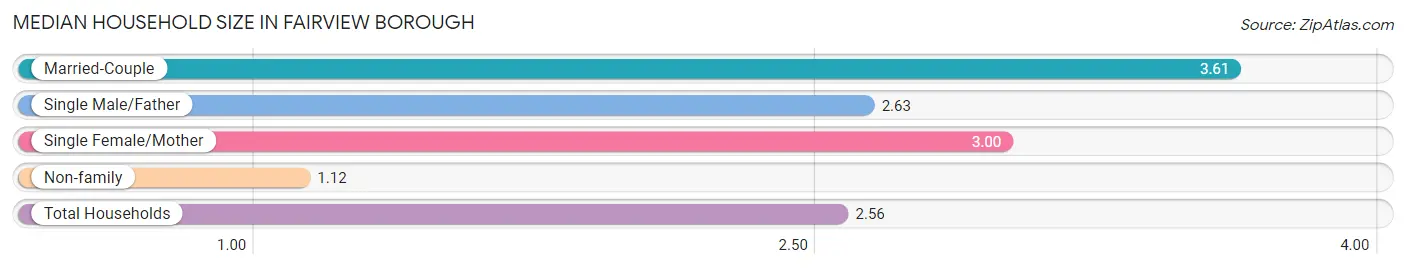
Median Household Size in Fairview borough
The median household size in Fairview borough is 2.56 persons per household, with married-couple households (2,358 | 40.5%) accounting for the largest median household size of 3.61 persons per household. non-family households (2,022 | 34.7%) represent the smallest median household size with 1.12 persons per household.
| Household Type | # Households | Household Size |
| Married-Couple | 2,358 (40.5%) | 3.61 |
| Single Male/Father | 521 (8.9%) | 2.63 |
| Single Female/Mother | 922 (15.8%) | 3.00 |
| Non-family | 2,022 (34.7%) | 1.12 |
| Total Households | 5,823 (100.0%) | 2.56 |
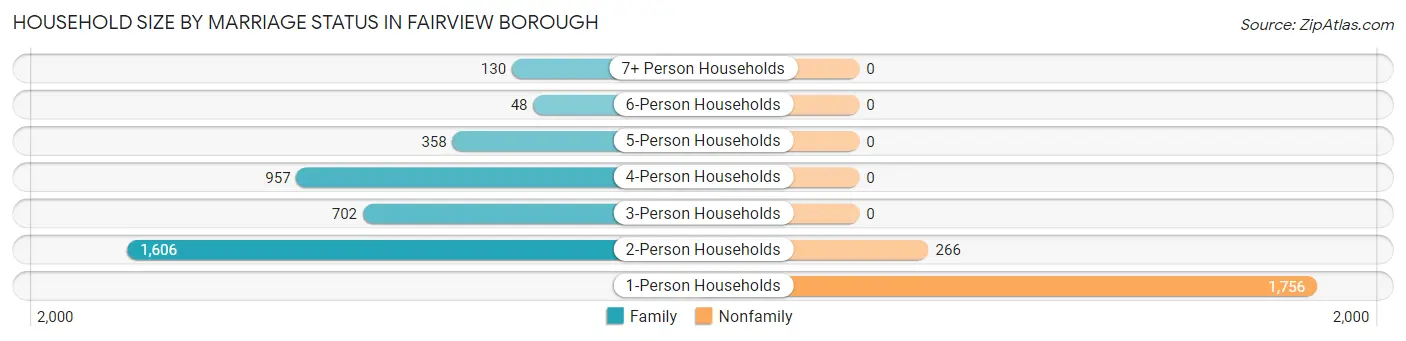
Household Size by Marriage Status in Fairview borough
Out of a total of 5,823 households in Fairview borough, 3,801 (65.3%) are family households, while 2,022 (34.7%) are nonfamily households. The most numerous type of family households are 2-person households, comprising 1,606, and the most common type of nonfamily households are 1-person households, comprising 1,756.
| Household Size | Family Households | Nonfamily Households |
| 1-Person Households | - | 1,756 (30.2%) |
| 2-Person Households | 1,606 (27.6%) | 266 (4.6%) |
| 3-Person Households | 702 (12.1%) | 0 (0.0%) |
| 4-Person Households | 957 (16.4%) | 0 (0.0%) |
| 5-Person Households | 358 (6.1%) | 0 (0.0%) |
| 6-Person Households | 48 (0.8%) | 0 (0.0%) |
| 7+ Person Households | 130 (2.2%) | 0 (0.0%) |
| Total | 3,801 (65.3%) | 2,022 (34.7%) |
Female Fertility in Fairview borough
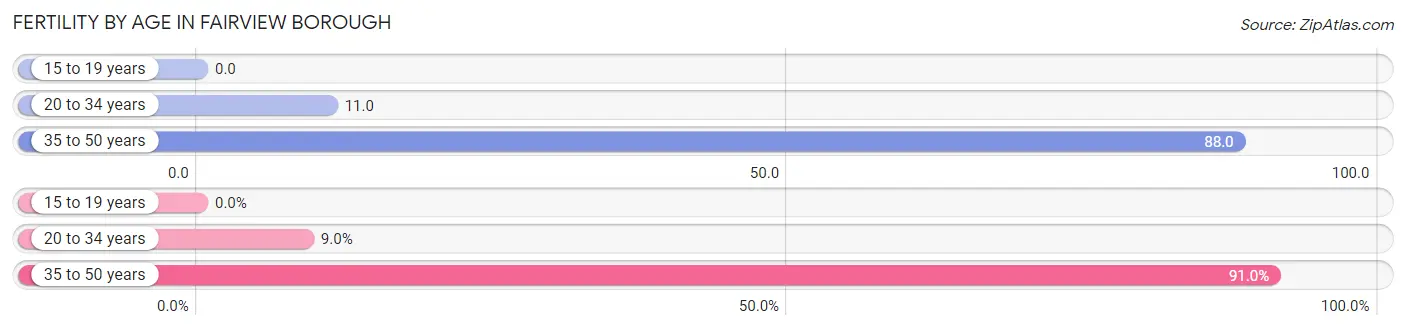
Fertility by Age in Fairview borough
Average fertility rate in Fairview borough is 46.0 births per 1,000 women. Women in the age bracket of 35 to 50 years have the highest fertility rate with 88.0 births per 1,000 women. Women in the age bracket of 35 to 50 years acount for 91.0% of all women with births.
| Age Bracket | Women with Births | Births / 1,000 Women |
| 15 to 19 years | 0 (0.0%) | 0.0 |
| 20 to 34 years | 15 (9.0%) | 11.0 |
| 35 to 50 years | 152 (91.0%) | 88.0 |
| Total | 167 (100.0%) | 46.0 |
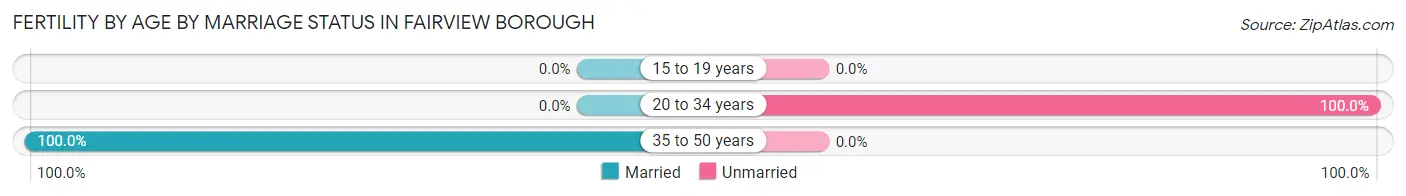
Fertility by Age by Marriage Status in Fairview borough
91.0% of women with births (167) in Fairview borough are married. The highest percentage of unmarried women with births falls into 20 to 34 years age bracket with 100.0% of them unmarried at the time of birth, while the lowest percentage of unmarried women with births belong to 35 to 50 years age bracket with 0.0% of them unmarried.
| Age Bracket | Married | Unmarried |
| 15 to 19 years | 0 (0.0%) | 0 (0.0%) |
| 20 to 34 years | 0 (0.0%) | 15 (100.0%) |
| 35 to 50 years | 152 (100.0%) | 0 (0.0%) |
| Total | 152 (91.0%) | 15 (9.0%) |
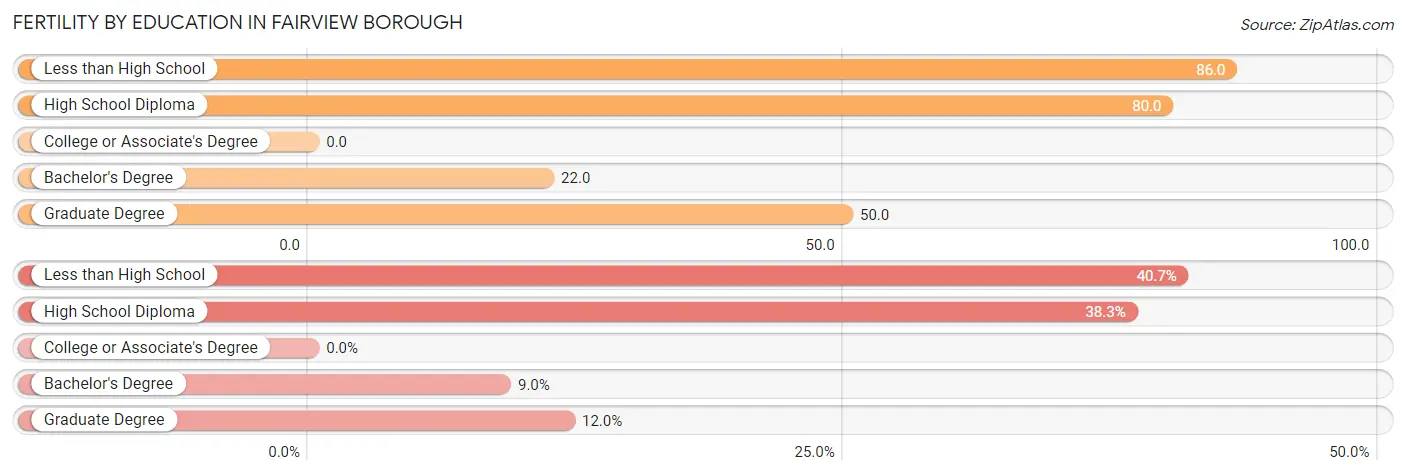
Fertility by Education in Fairview borough
| Educational Attainment | Women with Births | Births / 1,000 Women |
| Less than High School | 68 (40.7%) | 86.0 |
| High School Diploma | 64 (38.3%) | 80.0 |
| College or Associate's Degree | 0 (0.0%) | 0.0 |
| Bachelor's Degree | 15 (9.0%) | 22.0 |
| Graduate Degree | 20 (12.0%) | 50.0 |
| Total | 167 (100.0%) | 46.0 |
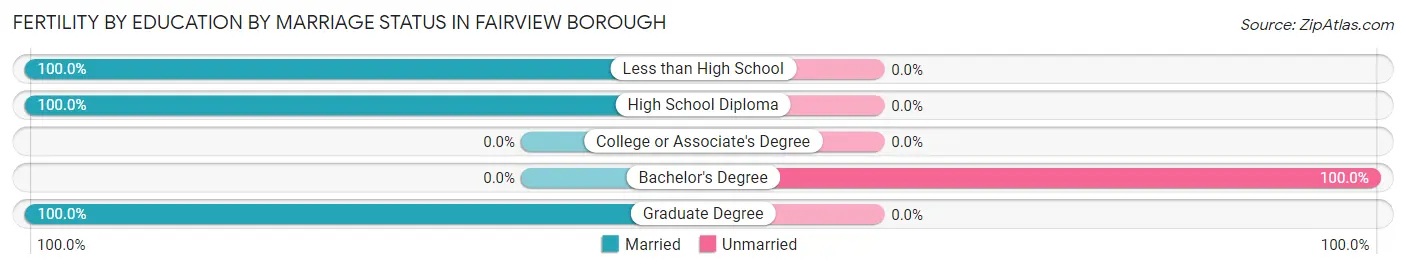
Fertility by Education by Marriage Status in Fairview borough
9.0% of women with births in Fairview borough are unmarried. Women with the educational attainment of less than high school are most likely to be married with 100.0% of them married at childbirth, while women with the educational attainment of bachelor's degree are least likely to be married with 100.0% of them unmarried at childbirth.
| Educational Attainment | Married | Unmarried |
| Less than High School | 68 (100.0%) | 0 (0.0%) |
| High School Diploma | 64 (100.0%) | 0 (0.0%) |
| College or Associate's Degree | 0 (0.0%) | 0 (0.0%) |
| Bachelor's Degree | 0 (0.0%) | 15 (100.0%) |
| Graduate Degree | 20 (100.0%) | 0 (0.0%) |
| Total | 152 (91.0%) | 15 (9.0%) |
Employment Characteristics in Fairview borough
Employment by Class of Employer in Fairview borough
Among the 7,818 employed individuals in Fairview borough, private company employees (6,065 | 77.6%), self-employed (not incorporated) (508 | 6.5%), and local government employees (466 | 6.0%) make up the most common classes of employment.
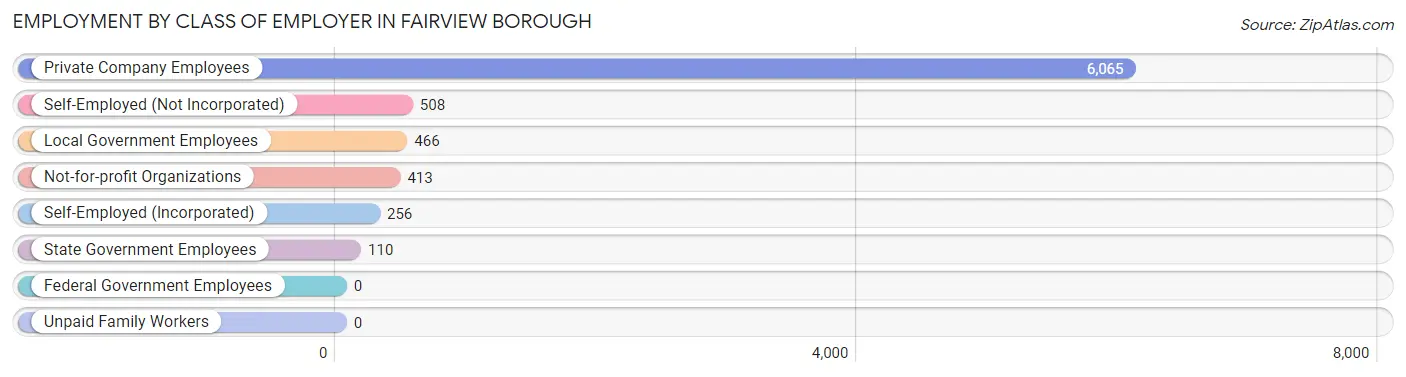
| Employer Class | # Employees | % Employees |
| Private Company Employees | 6,065 | 77.6% |
| Self-Employed (Incorporated) | 256 | 3.3% |
| Self-Employed (Not Incorporated) | 508 | 6.5% |
| Not-for-profit Organizations | 413 | 5.3% |
| Local Government Employees | 466 | 6.0% |
| State Government Employees | 110 | 1.4% |
| Federal Government Employees | 0 | 0.0% |
| Unpaid Family Workers | 0 | 0.0% |
| Total | 7,818 | 100.0% |
Employment Status by Age in Fairview borough
According to the labor force statistics for Fairview borough, out of the total population over 16 years of age (12,852), 66.3% or 8,521 individuals are in the labor force, with 6.5% or 554 of them unemployed. The age group with the highest labor force participation rate is 30 to 34 years, with 95.1% or 665 individuals in the labor force. Within the labor force, the 60 to 64 years age range has the highest percentage of unemployed individuals, with 12.8% or 80 of them being unemployed.
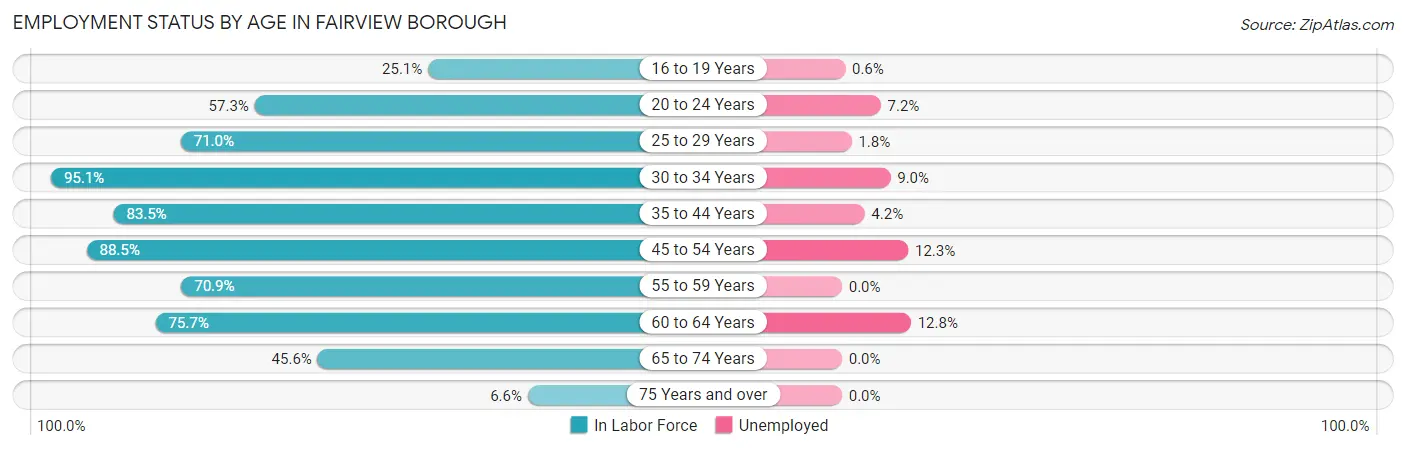
| Age Bracket | In Labor Force | Unemployed |
| 16 to 19 Years | 175 (25.1%) | 1 (0.6%) |
| 20 to 24 Years | 814 (57.3%) | 59 (7.2%) |
| 25 to 29 Years | 847 (71.0%) | 15 (1.8%) |
| 30 to 34 Years | 665 (95.1%) | 60 (9.0%) |
| 35 to 44 Years | 2,135 (83.5%) | 90 (4.2%) |
| 45 to 54 Years | 2,044 (88.5%) | 251 (12.3%) |
| 55 to 59 Years | 686 (70.9%) | 0 (0.0%) |
| 60 to 64 Years | 626 (75.7%) | 80 (12.8%) |
| 65 to 74 Years | 447 (45.6%) | 0 (0.0%) |
| 75 Years and over | 79 (6.6%) | 0 (0.0%) |
| Total | 8,521 (66.3%) | 554 (6.5%) |
Employment Status by Educational Attainment in Fairview borough
According to labor force statistics for Fairview borough, 81.9% of individuals (7,006) out of the total population between 25 and 64 years of age (8,554) are in the labor force, with 7.1% or 497 of them being unemployed. The group with the highest labor force participation rate are those with the educational attainment of college / associate degree, with 89.3% or 1,775 individuals in the labor force. Within the labor force, individuals with college / associate degree education have the highest percentage of unemployment, with 17.8% or 316 of them being unemployed.
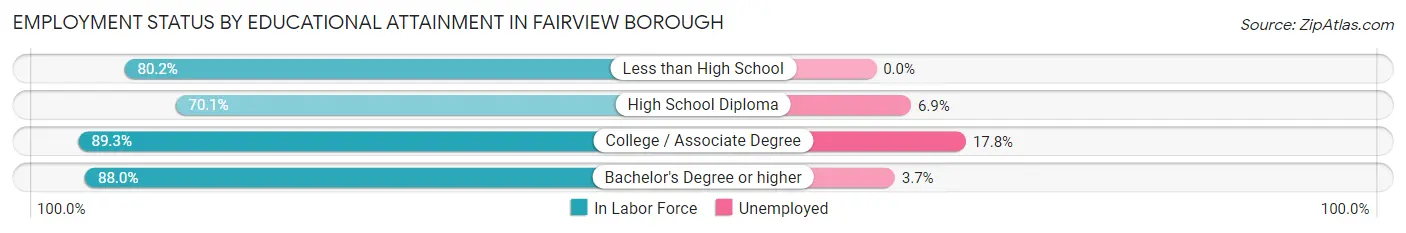
| Educational Attainment | In Labor Force | Unemployed |
| Less than High School | 1,711 (80.2%) | 0 (0.0%) |
| High School Diploma | 1,509 (70.1%) | 148 (6.9%) |
| College / Associate Degree | 1,775 (89.3%) | 354 (17.8%) |
| Bachelor's Degree or higher | 2,006 (88.0%) | 84 (3.7%) |
| Total | 7,006 (81.9%) | 607 (7.1%) |
Employment Occupations by Sex in Fairview borough
Management, Business, Science and Arts Occupations
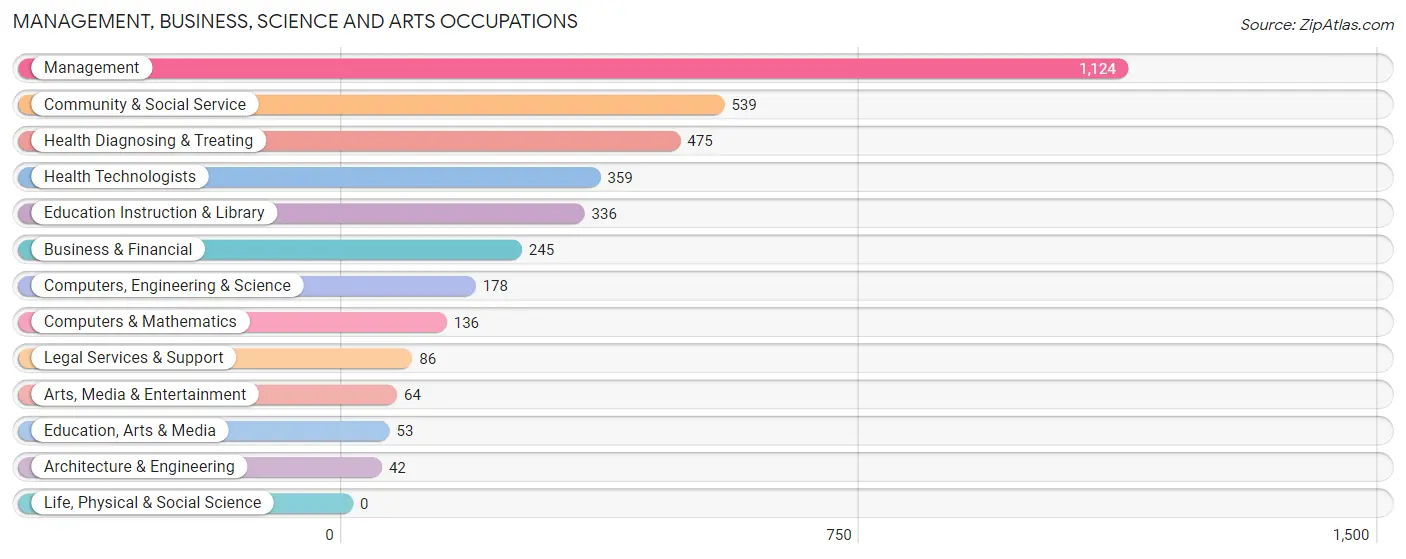
The most common Management, Business, Science and Arts occupations in Fairview borough are Management (1,124 | 14.1%), Community & Social Service (539 | 6.8%), Health Diagnosing & Treating (475 | 6.0%), Health Technologists (359 | 4.5%), and Education Instruction & Library (336 | 4.2%).
Management, Business, Science and Arts Occupations by Sex
Within the Management, Business, Science and Arts occupations in Fairview borough, the most male-oriented occupations are Computers & Mathematics (100.0%), Arts, Media & Entertainment (100.0%), and Computers, Engineering & Science (87.6%), while the most female-oriented occupations are Education, Arts & Media (96.2%), Health Technologists (93.6%), and Health Diagnosing & Treating (82.5%).
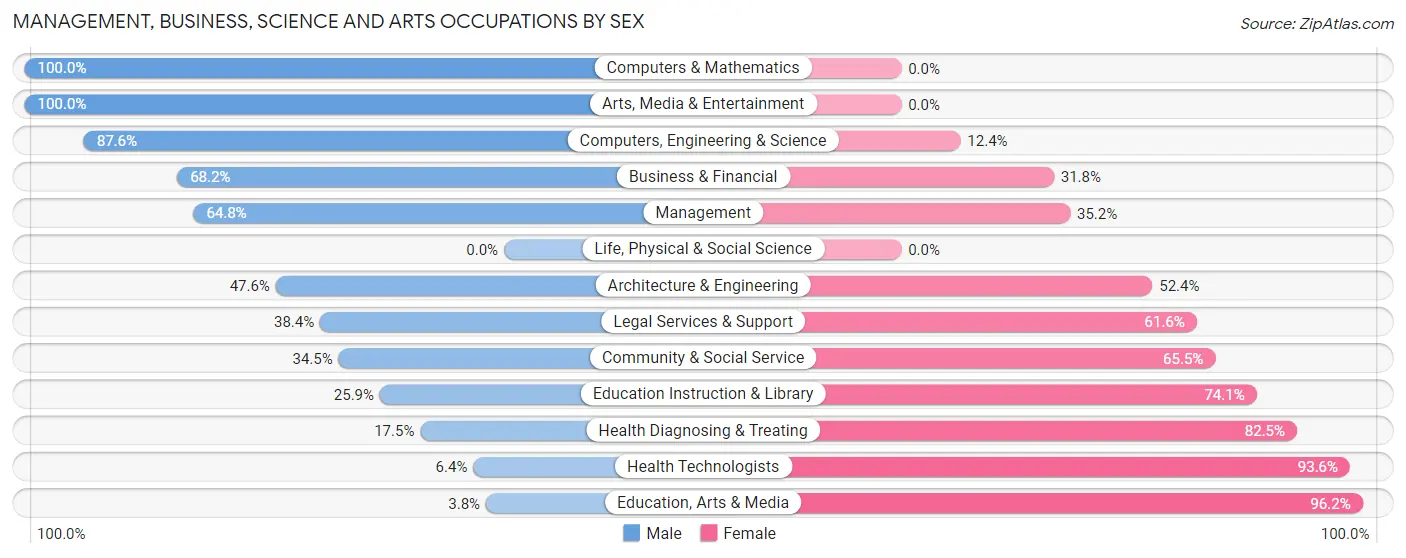
| Occupation | Male | Female |
| Management | 728 (64.8%) | 396 (35.2%) |
| Business & Financial | 167 (68.2%) | 78 (31.8%) |
| Computers, Engineering & Science | 156 (87.6%) | 22 (12.4%) |
| Computers & Mathematics | 136 (100.0%) | 0 (0.0%) |
| Architecture & Engineering | 20 (47.6%) | 22 (52.4%) |
| Life, Physical & Social Science | 0 (0.0%) | 0 (0.0%) |
| Community & Social Service | 186 (34.5%) | 353 (65.5%) |
| Education, Arts & Media | 2 (3.8%) | 51 (96.2%) |
| Legal Services & Support | 33 (38.4%) | 53 (61.6%) |
| Education Instruction & Library | 87 (25.9%) | 249 (74.1%) |
| Arts, Media & Entertainment | 64 (100.0%) | 0 (0.0%) |
| Health Diagnosing & Treating | 83 (17.5%) | 392 (82.5%) |
| Health Technologists | 23 (6.4%) | 336 (93.6%) |
| Total (Category) | 1,320 (51.5%) | 1,241 (48.5%) |
| Total (Overall) | 4,782 (60.1%) | 3,179 (39.9%) |
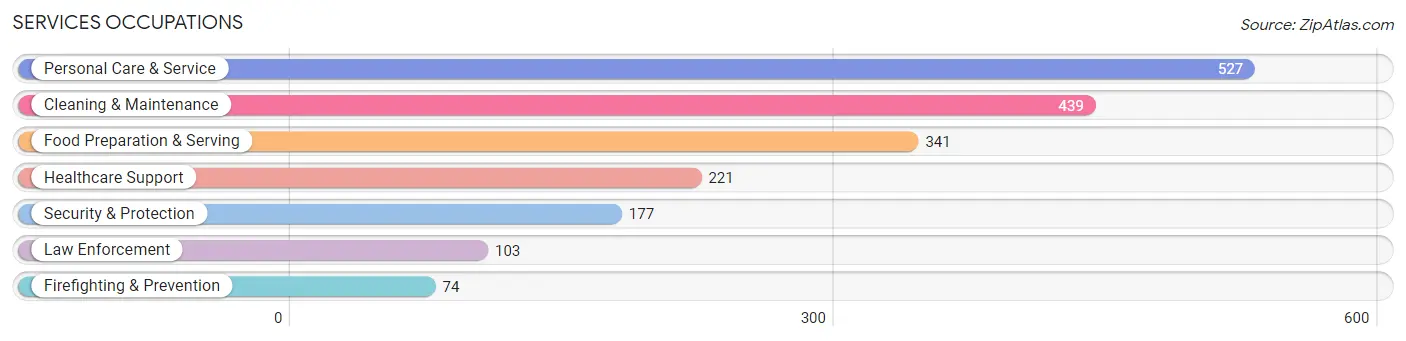
Services Occupations
The most common Services occupations in Fairview borough are Personal Care & Service (527 | 6.6%), Cleaning & Maintenance (439 | 5.5%), Food Preparation & Serving (341 | 4.3%), Healthcare Support (221 | 2.8%), and Security & Protection (177 | 2.2%).
Services Occupations by Sex
Within the Services occupations in Fairview borough, the most male-oriented occupations are Law Enforcement (100.0%), Food Preparation & Serving (90.9%), and Cleaning & Maintenance (70.8%), while the most female-oriented occupations are Firefighting & Prevention (100.0%), Healthcare Support (90.5%), and Personal Care & Service (74.4%).
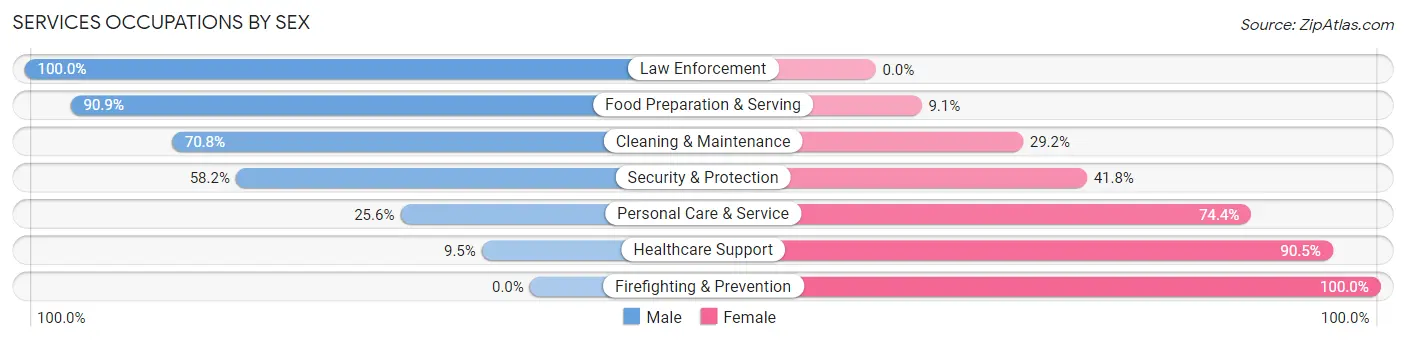
| Occupation | Male | Female |
| Healthcare Support | 21 (9.5%) | 200 (90.5%) |
| Security & Protection | 103 (58.2%) | 74 (41.8%) |
| Firefighting & Prevention | 0 (0.0%) | 74 (100.0%) |
| Law Enforcement | 103 (100.0%) | 0 (0.0%) |
| Food Preparation & Serving | 310 (90.9%) | 31 (9.1%) |
| Cleaning & Maintenance | 311 (70.8%) | 128 (29.2%) |
| Personal Care & Service | 135 (25.6%) | 392 (74.4%) |
| Total (Category) | 880 (51.6%) | 825 (48.4%) |
| Total (Overall) | 4,782 (60.1%) | 3,179 (39.9%) |
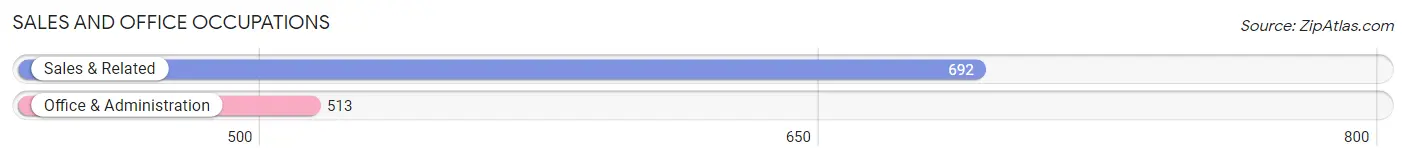
Sales and Office Occupations
The most common Sales and Office occupations in Fairview borough are Sales & Related (692 | 8.7%), and Office & Administration (513 | 6.4%).
Sales and Office Occupations by Sex

| Occupation | Male | Female |
| Sales & Related | 425 (61.4%) | 267 (38.6%) |
| Office & Administration | 77 (15.0%) | 436 (85.0%) |
| Total (Category) | 502 (41.7%) | 703 (58.3%) |
| Total (Overall) | 4,782 (60.1%) | 3,179 (39.9%) |
Natural Resources, Construction and Maintenance Occupations
The most common Natural Resources, Construction and Maintenance occupations in Fairview borough are Construction & Extraction (715 | 9.0%), and Installation, Maintenance & Repair (186 | 2.3%).
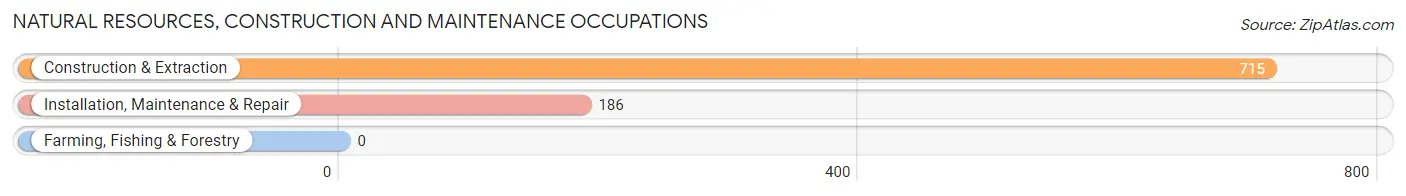
Natural Resources, Construction and Maintenance Occupations by Sex

| Occupation | Male | Female |
| Farming, Fishing & Forestry | 0 (0.0%) | 0 (0.0%) |
| Construction & Extraction | 715 (100.0%) | 0 (0.0%) |
| Installation, Maintenance & Repair | 186 (100.0%) | 0 (0.0%) |
| Total (Category) | 901 (100.0%) | 0 (0.0%) |
| Total (Overall) | 4,782 (60.1%) | 3,179 (39.9%) |
Production, Transportation and Moving Occupations
The most common Production, Transportation and Moving occupations in Fairview borough are Material Moving (594 | 7.5%), Transportation (507 | 6.4%), and Production (488 | 6.1%).
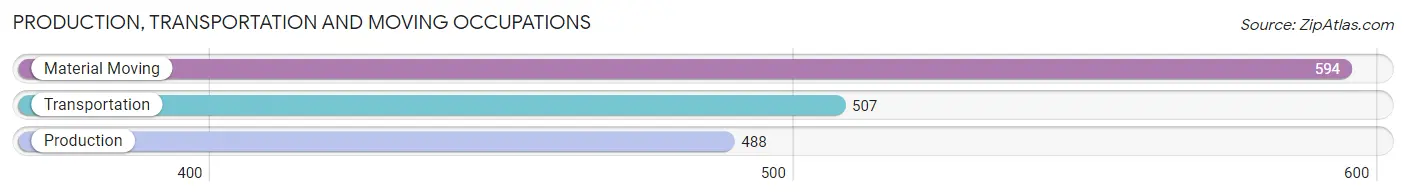
Production, Transportation and Moving Occupations by Sex
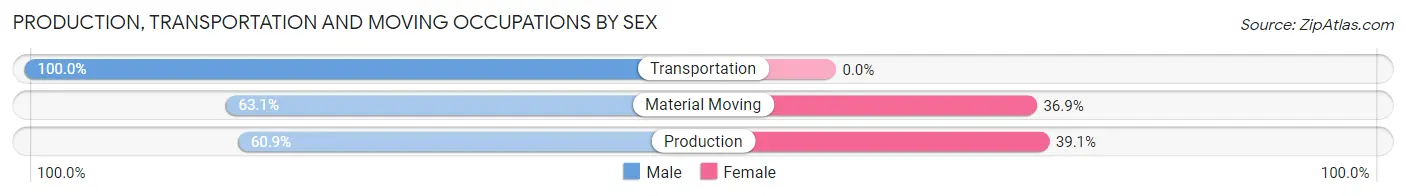
| Occupation | Male | Female |
| Production | 297 (60.9%) | 191 (39.1%) |
| Transportation | 507 (100.0%) | 0 (0.0%) |
| Material Moving | 375 (63.1%) | 219 (36.9%) |
| Total (Category) | 1,179 (74.2%) | 410 (25.8%) |
| Total (Overall) | 4,782 (60.1%) | 3,179 (39.9%) |
Employment Industries by Sex in Fairview borough
Employment Industries in Fairview borough
The major employment industries in Fairview borough include Retail Trade (1,118 | 14.0%), Health Care & Social Assistance (1,022 | 12.8%), Construction (912 | 11.5%), Manufacturing (870 | 10.9%), and Accommodation & Food Services (710 | 8.9%).
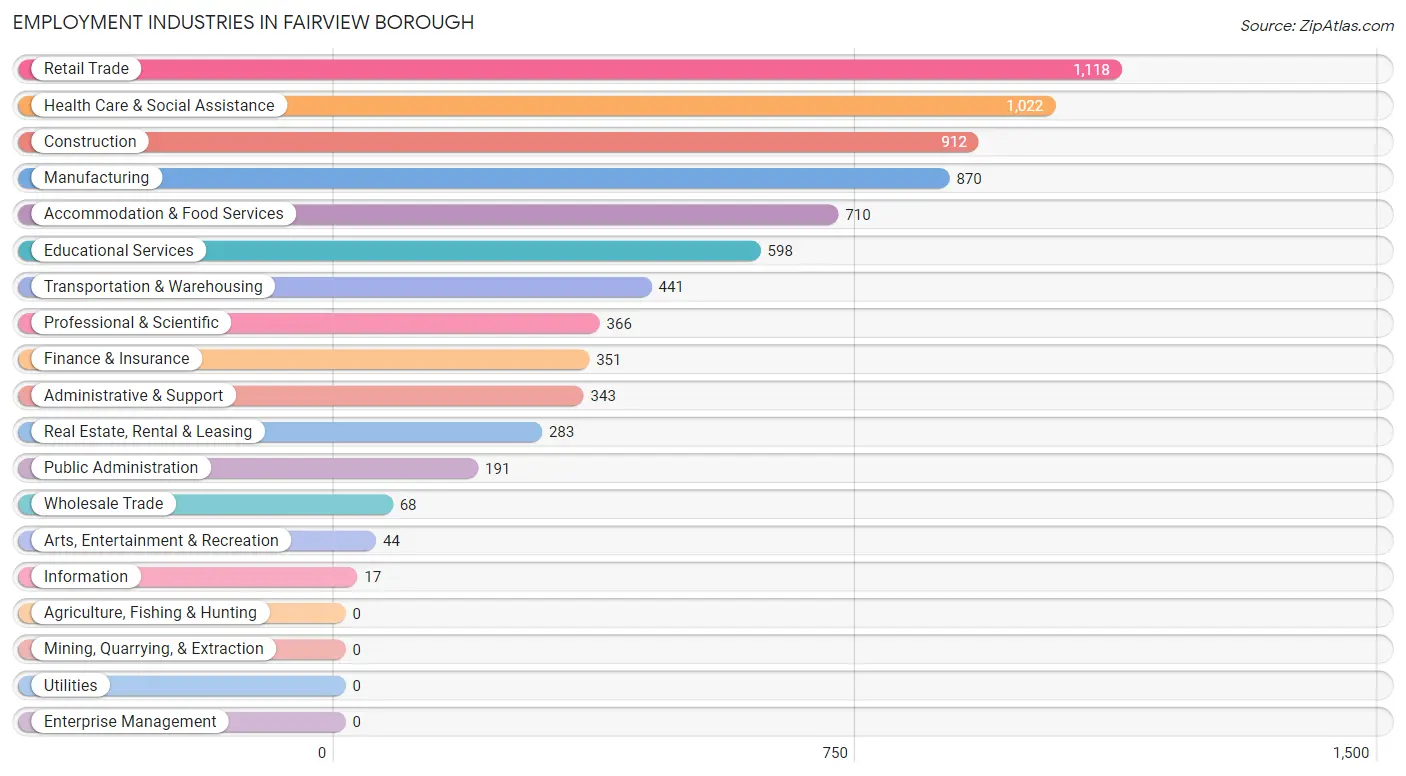
Employment Industries by Sex in Fairview borough
The Fairview borough industries that see more men than women are Information (100.0%), Construction (94.0%), and Transportation & Warehousing (81.6%), whereas the industries that tend to have a higher number of women are Arts, Entertainment & Recreation (100.0%), Health Care & Social Assistance (74.1%), and Wholesale Trade (70.6%).
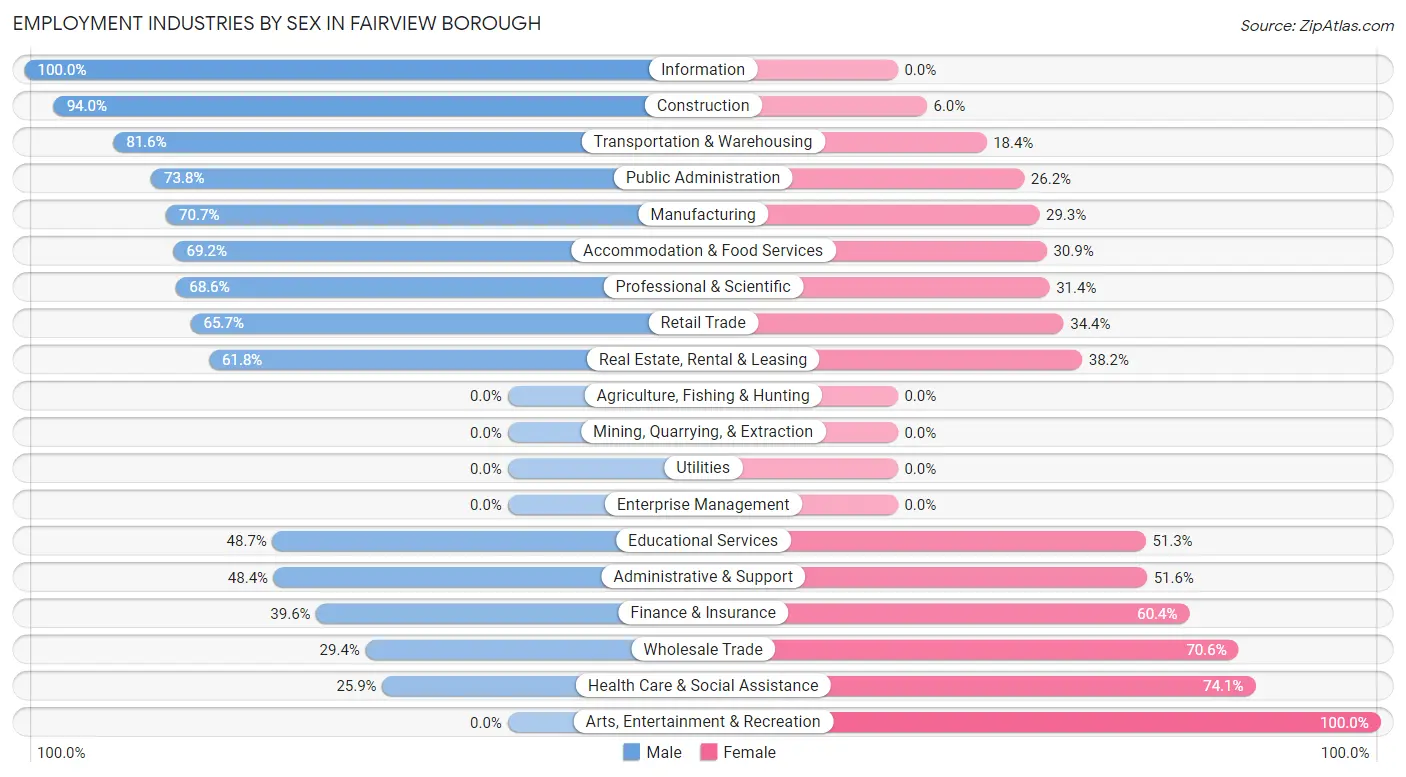
| Industry | Male | Female |
| Agriculture, Fishing & Hunting | 0 (0.0%) | 0 (0.0%) |
| Mining, Quarrying, & Extraction | 0 (0.0%) | 0 (0.0%) |
| Construction | 857 (94.0%) | 55 (6.0%) |
| Manufacturing | 615 (70.7%) | 255 (29.3%) |
| Wholesale Trade | 20 (29.4%) | 48 (70.6%) |
| Retail Trade | 734 (65.6%) | 384 (34.4%) |
| Transportation & Warehousing | 360 (81.6%) | 81 (18.4%) |
| Utilities | 0 (0.0%) | 0 (0.0%) |
| Information | 17 (100.0%) | 0 (0.0%) |
| Finance & Insurance | 139 (39.6%) | 212 (60.4%) |
| Real Estate, Rental & Leasing | 175 (61.8%) | 108 (38.2%) |
| Professional & Scientific | 251 (68.6%) | 115 (31.4%) |
| Enterprise Management | 0 (0.0%) | 0 (0.0%) |
| Administrative & Support | 166 (48.4%) | 177 (51.6%) |
| Educational Services | 291 (48.7%) | 307 (51.3%) |
| Health Care & Social Assistance | 265 (25.9%) | 757 (74.1%) |
| Arts, Entertainment & Recreation | 0 (0.0%) | 44 (100.0%) |
| Accommodation & Food Services | 491 (69.2%) | 219 (30.8%) |
| Public Administration | 141 (73.8%) | 50 (26.2%) |
| Total | 4,782 (60.1%) | 3,179 (39.9%) |
Education in Fairview borough
School Enrollment in Fairview borough
The most common levels of schooling among the 2,666 students in Fairview borough are middle school (731 | 27.4%), college / undergraduate (686 | 25.7%), and high school (575 | 21.6%).
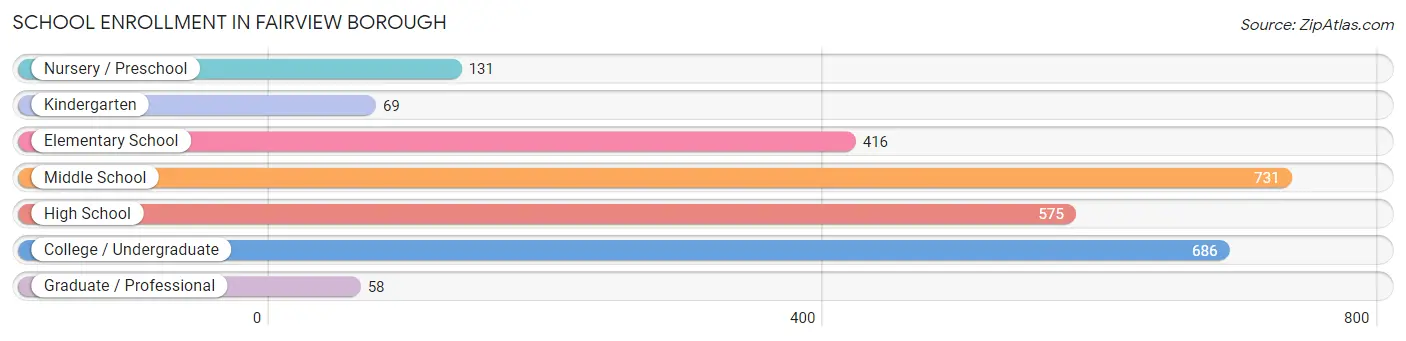
| School Level | # Students | % Students |
| Nursery / Preschool | 131 | 4.9% |
| Kindergarten | 69 | 2.6% |
| Elementary School | 416 | 15.6% |
| Middle School | 731 | 27.4% |
| High School | 575 | 21.6% |
| College / Undergraduate | 686 | 25.7% |
| Graduate / Professional | 58 | 2.2% |
| Total | 2,666 | 100.0% |
School Enrollment by Age by Funding Source in Fairview borough
Out of a total of 2,666 students who are enrolled in schools in Fairview borough, 360 (13.5%) attend a private institution, while the remaining 2,306 (86.5%) are enrolled in public schools. The age group of 3 to 4 year olds has the highest likelihood of being enrolled in private schools, with 24 (18.3% in the age bracket) enrolled. Conversely, the age group of 18 to 19 year olds has the lowest likelihood of being enrolled in a private school, with 295 (100.0% in the age bracket) attending a public institution.
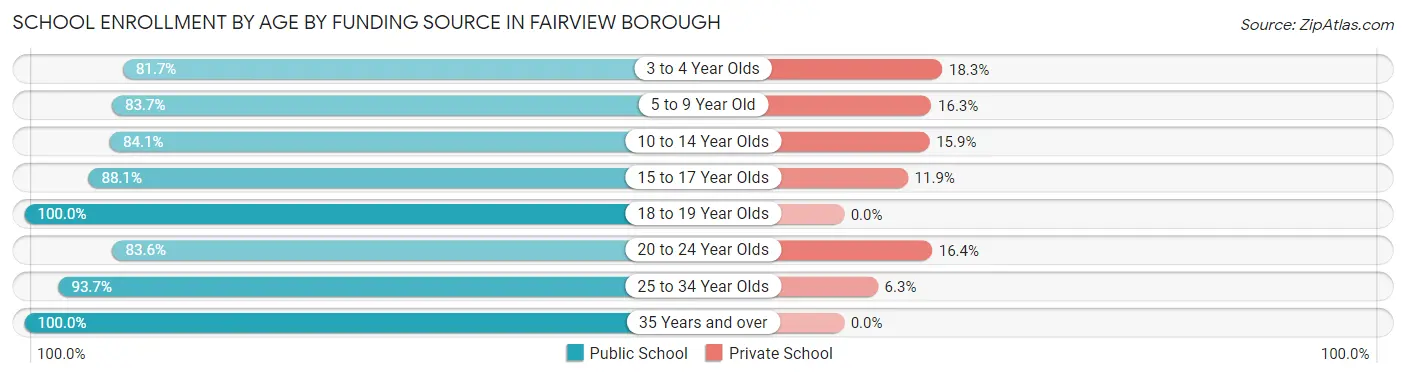
| Age Bracket | Public School | Private School |
| 3 to 4 Year Olds | 107 (81.7%) | 24 (18.3%) |
| 5 to 9 Year Old | 406 (83.7%) | 79 (16.3%) |
| 10 to 14 Year Olds | 659 (84.1%) | 125 (15.9%) |
| 15 to 17 Year Olds | 303 (88.1%) | 41 (11.9%) |
| 18 to 19 Year Olds | 295 (100.0%) | 0 (0.0%) |
| 20 to 24 Year Olds | 433 (83.6%) | 85 (16.4%) |
| 25 to 34 Year Olds | 74 (93.7%) | 5 (6.3%) |
| 35 Years and over | 30 (100.0%) | 0 (0.0%) |
| Total | 2,306 (86.5%) | 360 (13.5%) |
Educational Attainment by Field of Study in Fairview borough
Science & technology (687 | 24.2%), business (560 | 19.8%), education (291 | 10.3%), psychology (195 | 6.9%), and social sciences (165 | 5.8%) are the most common fields of study among 2,834 individuals in Fairview borough who have obtained a bachelor's degree or higher.
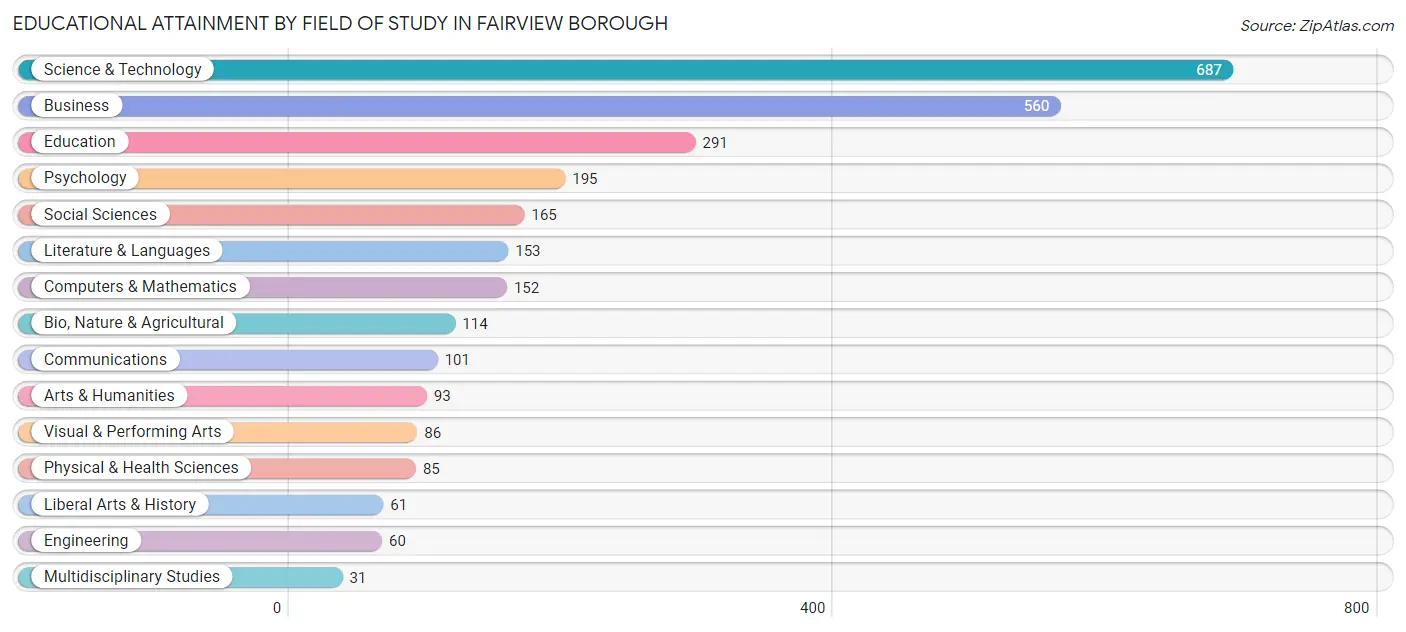
| Field of Study | # Graduates | % Graduates |
| Computers & Mathematics | 152 | 5.4% |
| Bio, Nature & Agricultural | 114 | 4.0% |
| Physical & Health Sciences | 85 | 3.0% |
| Psychology | 195 | 6.9% |
| Social Sciences | 165 | 5.8% |
| Engineering | 60 | 2.1% |
| Multidisciplinary Studies | 31 | 1.1% |
| Science & Technology | 687 | 24.2% |
| Business | 560 | 19.8% |
| Education | 291 | 10.3% |
| Literature & Languages | 153 | 5.4% |
| Liberal Arts & History | 61 | 2.1% |
| Visual & Performing Arts | 86 | 3.0% |
| Communications | 101 | 3.6% |
| Arts & Humanities | 93 | 3.3% |
| Total | 2,834 | 100.0% |
Transportation & Commute in Fairview borough
Vehicle Availability by Sex in Fairview borough
The most prevalent vehicle ownership categories in Fairview borough are males with 2 vehicles (1,760, accounting for 37.7%) and females with 2 vehicles (1,411, making up 55.8%).
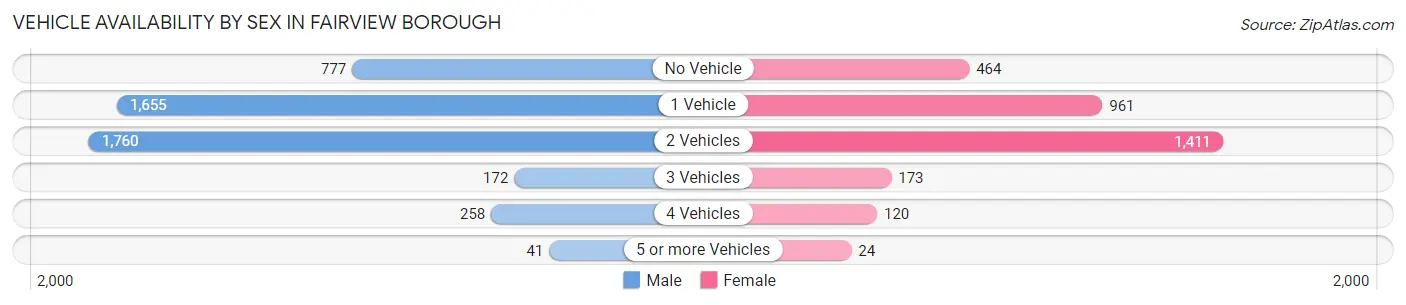
| Vehicles Available | Male | Female |
| No Vehicle | 777 (16.7%) | 464 (14.7%) |
| 1 Vehicle | 1,655 (35.5%) | 961 (30.5%) |
| 2 Vehicles | 1,760 (37.7%) | 1,411 (44.8%) |
| 3 Vehicles | 172 (3.7%) | 173 (5.5%) |
| 4 Vehicles | 258 (5.5%) | 120 (3.8%) |
| 5 or more Vehicles | 41 (0.9%) | 24 (0.8%) |
| Total | 4,663 (100.0%) | 3,153 (100.0%) |
Commute Time in Fairview borough
The most frequently occuring commute durations in Fairview borough are 45 to 59 minutes (1,234 commuters, 16.7%), 30 to 34 minutes (1,204 commuters, 16.3%), and 20 to 24 minutes (1,065 commuters, 14.4%).
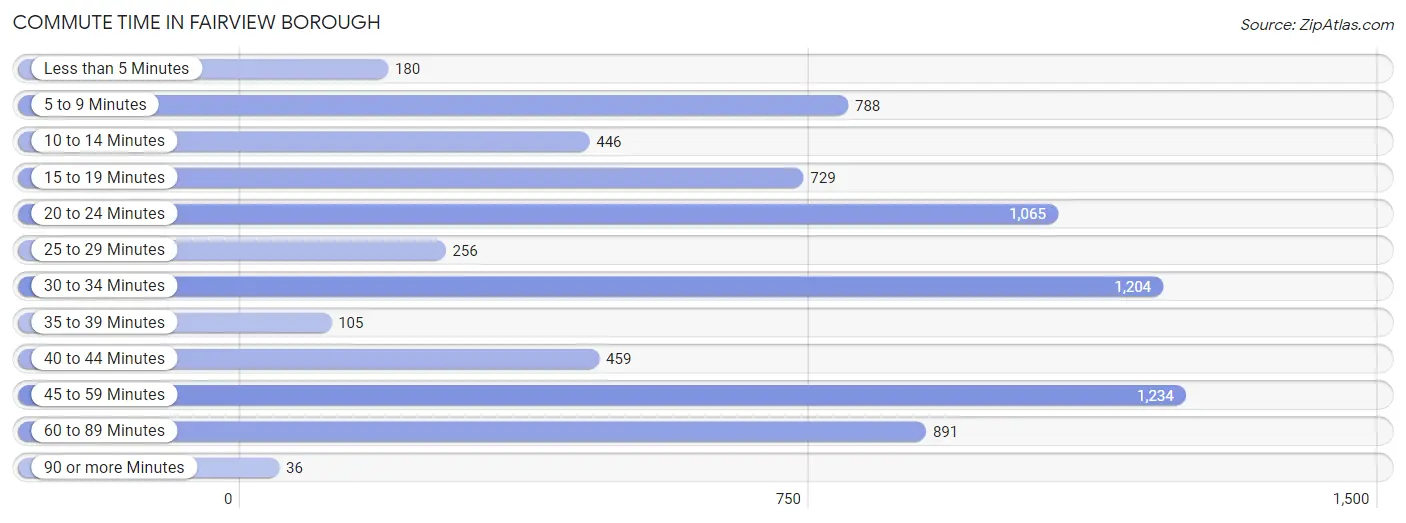
| Commute Time | # Commuters | % Commuters |
| Less than 5 Minutes | 180 | 2.4% |
| 5 to 9 Minutes | 788 | 10.7% |
| 10 to 14 Minutes | 446 | 6.0% |
| 15 to 19 Minutes | 729 | 9.9% |
| 20 to 24 Minutes | 1,065 | 14.4% |
| 25 to 29 Minutes | 256 | 3.5% |
| 30 to 34 Minutes | 1,204 | 16.3% |
| 35 to 39 Minutes | 105 | 1.4% |
| 40 to 44 Minutes | 459 | 6.2% |
| 45 to 59 Minutes | 1,234 | 16.7% |
| 60 to 89 Minutes | 891 | 12.0% |
| 90 or more Minutes | 36 | 0.5% |
Commute Time by Sex in Fairview borough
The most common commute times in Fairview borough are 45 to 59 minutes (943 commuters, 21.3%) for males and 30 to 34 minutes (576 commuters, 19.4%) for females.
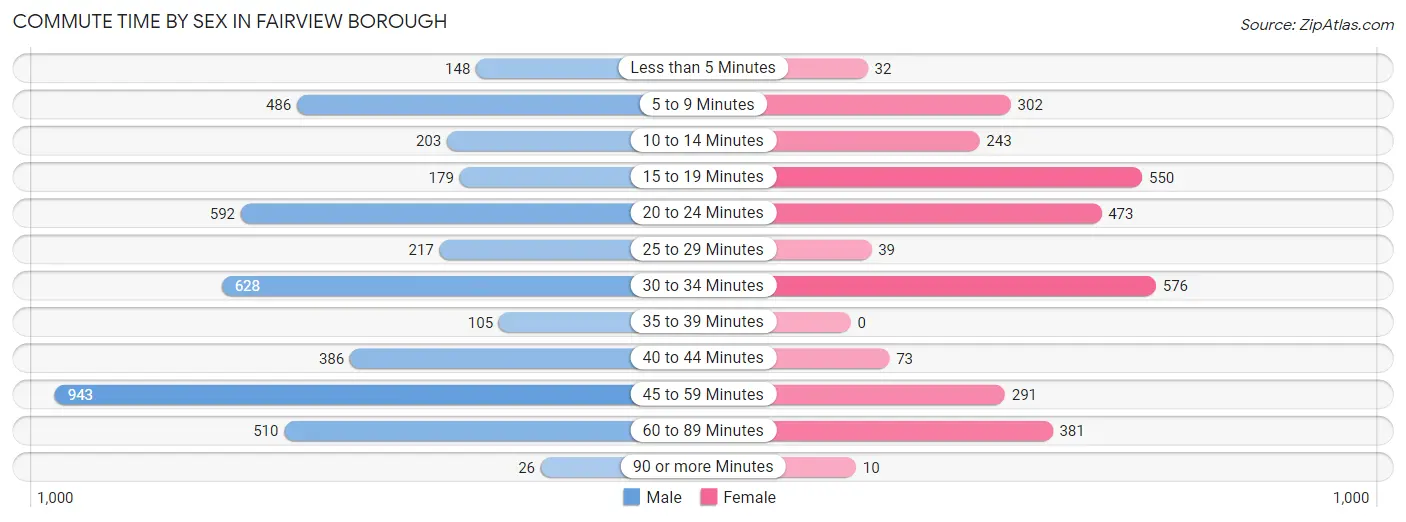
| Commute Time | Male | Female |
| Less than 5 Minutes | 148 (3.4%) | 32 (1.1%) |
| 5 to 9 Minutes | 486 (11.0%) | 302 (10.2%) |
| 10 to 14 Minutes | 203 (4.6%) | 243 (8.2%) |
| 15 to 19 Minutes | 179 (4.1%) | 550 (18.5%) |
| 20 to 24 Minutes | 592 (13.4%) | 473 (15.9%) |
| 25 to 29 Minutes | 217 (4.9%) | 39 (1.3%) |
| 30 to 34 Minutes | 628 (14.2%) | 576 (19.4%) |
| 35 to 39 Minutes | 105 (2.4%) | 0 (0.0%) |
| 40 to 44 Minutes | 386 (8.7%) | 73 (2.5%) |
| 45 to 59 Minutes | 943 (21.3%) | 291 (9.8%) |
| 60 to 89 Minutes | 510 (11.5%) | 381 (12.8%) |
| 90 or more Minutes | 26 (0.6%) | 10 (0.3%) |
Time of Departure to Work by Sex in Fairview borough
The most frequent times of departure to work in Fairview borough are 8:00 AM to 8:29 AM (827, 18.7%) for males and 8:00 AM to 8:29 AM (580, 19.5%) for females.
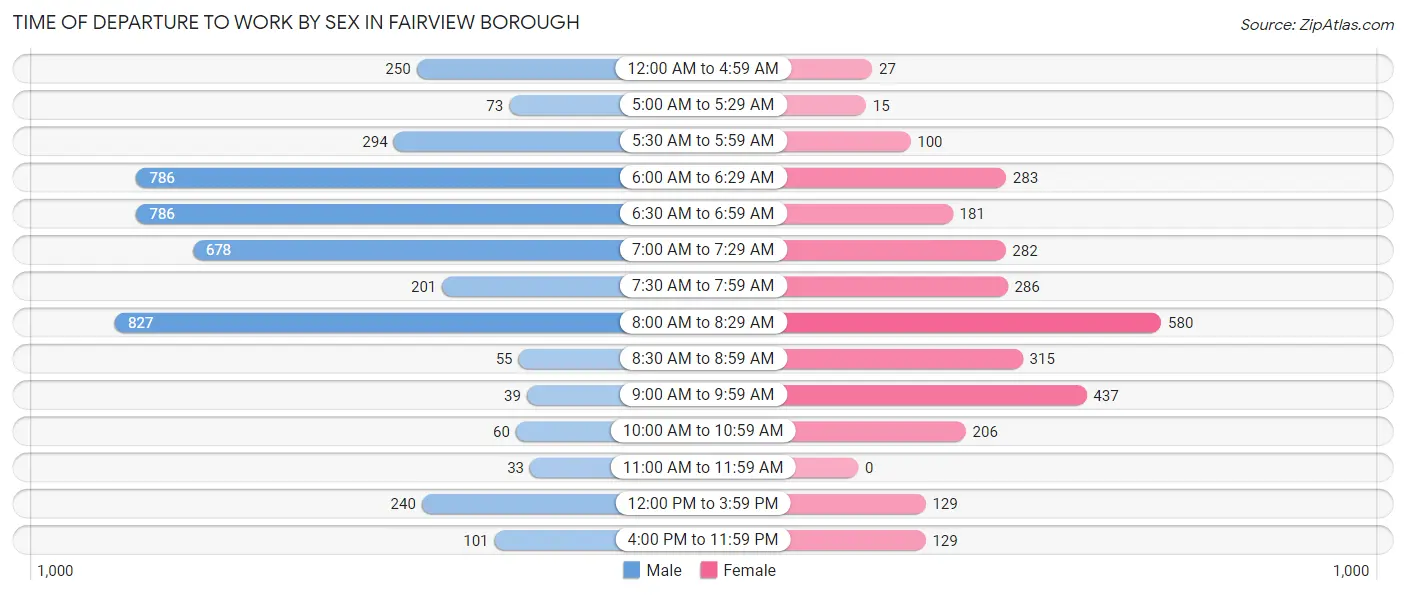
| Time of Departure | Male | Female |
| 12:00 AM to 4:59 AM | 250 (5.7%) | 27 (0.9%) |
| 5:00 AM to 5:29 AM | 73 (1.7%) | 15 (0.5%) |
| 5:30 AM to 5:59 AM | 294 (6.7%) | 100 (3.4%) |
| 6:00 AM to 6:29 AM | 786 (17.8%) | 283 (9.5%) |
| 6:30 AM to 6:59 AM | 786 (17.8%) | 181 (6.1%) |
| 7:00 AM to 7:29 AM | 678 (15.3%) | 282 (9.5%) |
| 7:30 AM to 7:59 AM | 201 (4.5%) | 286 (9.6%) |
| 8:00 AM to 8:29 AM | 827 (18.7%) | 580 (19.5%) |
| 8:30 AM to 8:59 AM | 55 (1.2%) | 315 (10.6%) |
| 9:00 AM to 9:59 AM | 39 (0.9%) | 437 (14.7%) |
| 10:00 AM to 10:59 AM | 60 (1.4%) | 206 (6.9%) |
| 11:00 AM to 11:59 AM | 33 (0.7%) | 0 (0.0%) |
| 12:00 PM to 3:59 PM | 240 (5.4%) | 129 (4.3%) |
| 4:00 PM to 11:59 PM | 101 (2.3%) | 129 (4.3%) |
| Total | 4,423 (100.0%) | 2,970 (100.0%) |
Housing Occupancy in Fairview borough
Occupancy by Ownership in Fairview borough
Of the total 5,823 dwellings in Fairview borough, owner-occupied units account for 1,895 (32.5%), while renter-occupied units make up 3,928 (67.5%).
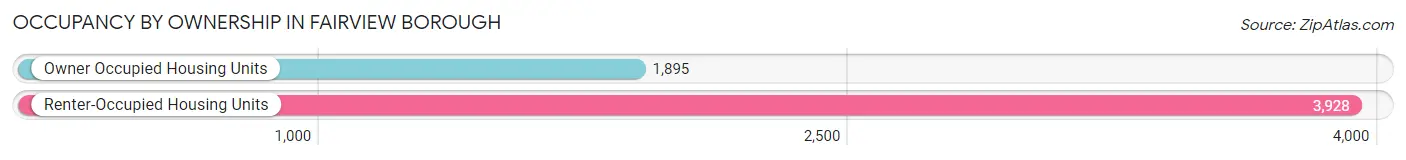
| Occupancy | # Housing Units | % Housing Units |
| Owner Occupied Housing Units | 1,895 | 32.5% |
| Renter-Occupied Housing Units | 3,928 | 67.5% |
| Total Occupied Housing Units | 5,823 | 100.0% |
Occupancy by Household Size in Fairview borough
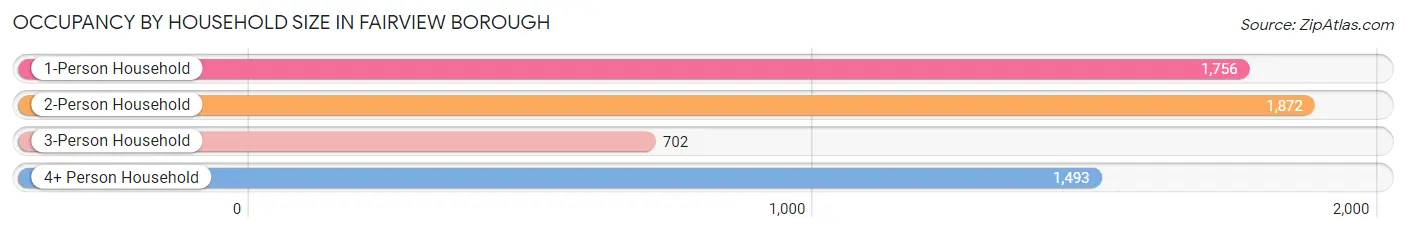
| Household Size | # Housing Units | % Housing Units |
| 1-Person Household | 1,756 | 30.2% |
| 2-Person Household | 1,872 | 32.2% |
| 3-Person Household | 702 | 12.1% |
| 4+ Person Household | 1,493 | 25.6% |
| Total Housing Units | 5,823 | 100.0% |
Occupancy by Ownership by Household Size in Fairview borough
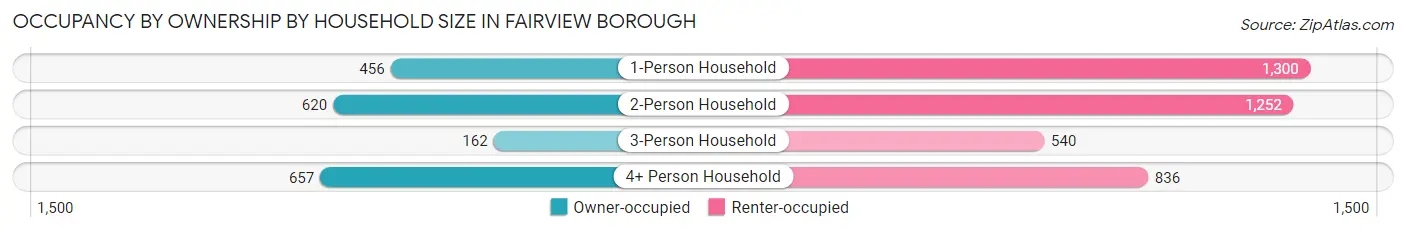
| Household Size | Owner-occupied | Renter-occupied |
| 1-Person Household | 456 (26.0%) | 1,300 (74.0%) |
| 2-Person Household | 620 (33.1%) | 1,252 (66.9%) |
| 3-Person Household | 162 (23.1%) | 540 (76.9%) |
| 4+ Person Household | 657 (44.0%) | 836 (56.0%) |
| Total Housing Units | 1,895 (32.5%) | 3,928 (67.5%) |
Occupancy by Educational Attainment in Fairview borough
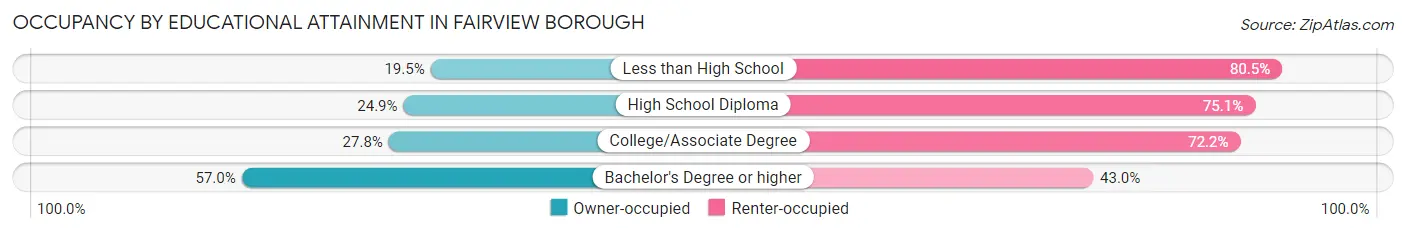
| Household Size | Owner-occupied | Renter-occupied |
| Less than High School | 288 (19.5%) | 1,187 (80.5%) |
| High School Diploma | 417 (24.9%) | 1,258 (75.1%) |
| College/Associate Degree | 318 (27.8%) | 825 (72.2%) |
| Bachelor's Degree or higher | 872 (57.0%) | 658 (43.0%) |
Occupancy by Age of Householder in Fairview borough
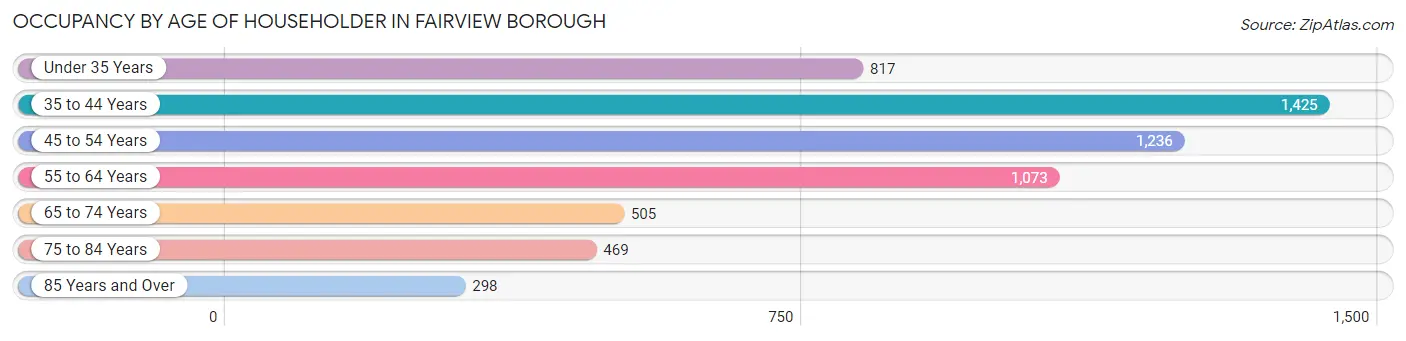
| Age Bracket | # Households | % Households |
| Under 35 Years | 817 | 14.0% |
| 35 to 44 Years | 1,425 | 24.5% |
| 45 to 54 Years | 1,236 | 21.2% |
| 55 to 64 Years | 1,073 | 18.4% |
| 65 to 74 Years | 505 | 8.7% |
| 75 to 84 Years | 469 | 8.1% |
| 85 Years and Over | 298 | 5.1% |
| Total | 5,823 | 100.0% |
Housing Finances in Fairview borough
Median Income by Occupancy in Fairview borough
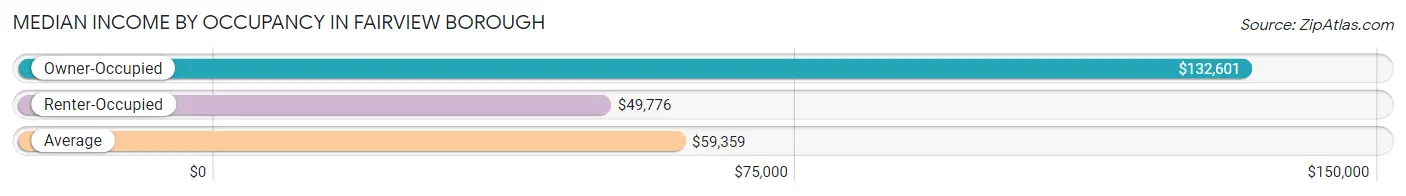
| Occupancy Type | # Households | Median Income |
| Owner-Occupied | 1,895 (32.5%) | $132,601 |
| Renter-Occupied | 3,928 (67.5%) | $49,776 |
| Average | 5,823 (100.0%) | $59,359 |
Occupancy by Householder Income Bracket in Fairview borough
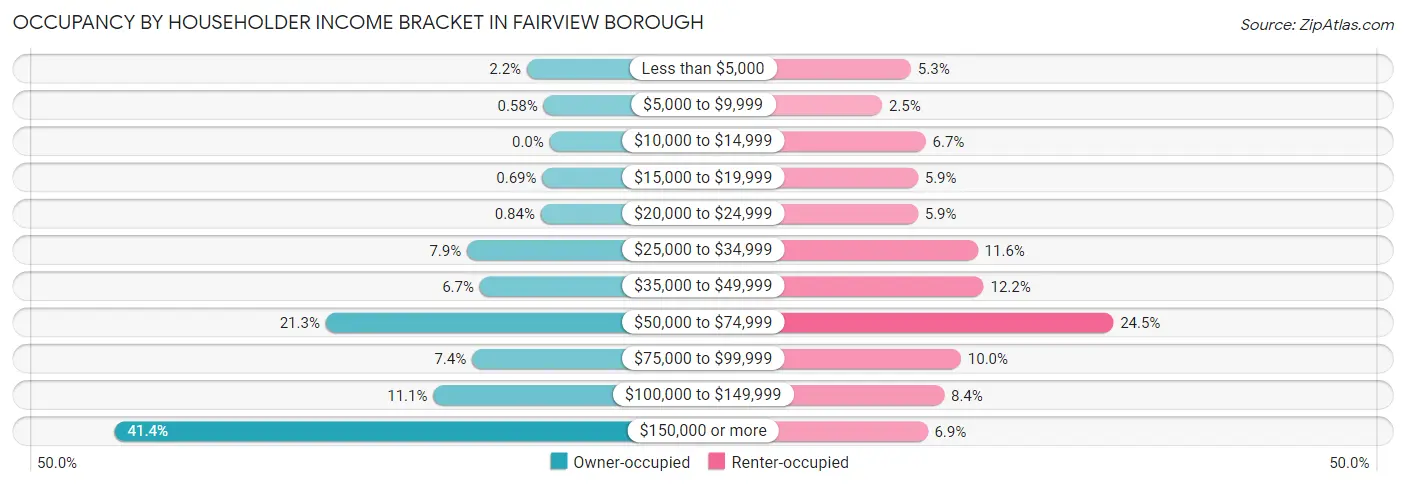
| Income Bracket | Owner-occupied | Renter-occupied |
| Less than $5,000 | 41 (2.2%) | 207 (5.3%) |
| $5,000 to $9,999 | 11 (0.6%) | 99 (2.5%) |
| $10,000 to $14,999 | 0 (0.0%) | 262 (6.7%) |
| $15,000 to $19,999 | 13 (0.7%) | 233 (5.9%) |
| $20,000 to $24,999 | 16 (0.8%) | 233 (5.9%) |
| $25,000 to $34,999 | 149 (7.9%) | 457 (11.6%) |
| $35,000 to $49,999 | 126 (6.7%) | 479 (12.2%) |
| $50,000 to $74,999 | 404 (21.3%) | 964 (24.5%) |
| $75,000 to $99,999 | 140 (7.4%) | 394 (10.0%) |
| $100,000 to $149,999 | 210 (11.1%) | 331 (8.4%) |
| $150,000 or more | 785 (41.4%) | 269 (6.9%) |
| Total | 1,895 (100.0%) | 3,928 (100.0%) |
Monthly Housing Cost Tiers in Fairview borough
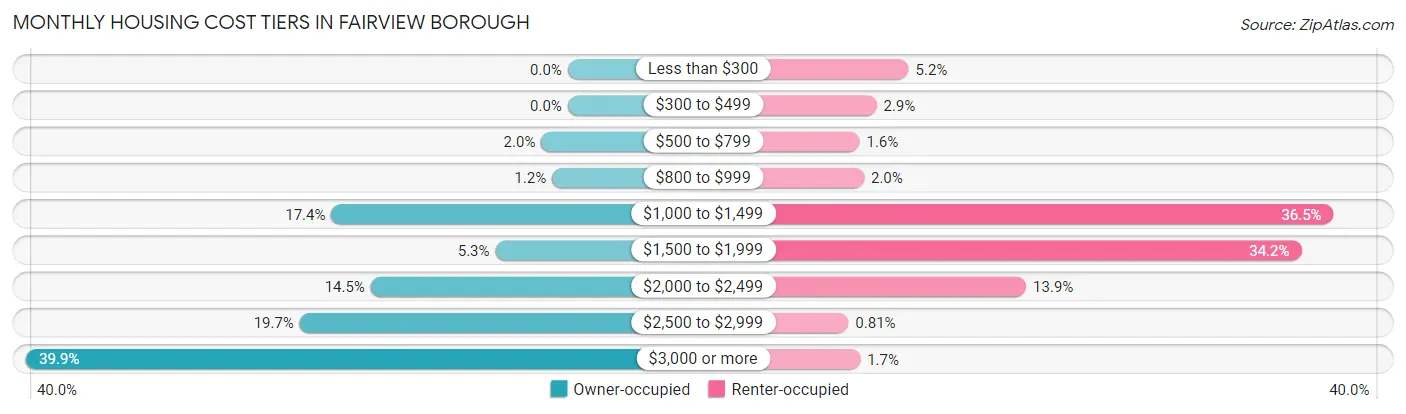
| Monthly Cost | Owner-occupied | Renter-occupied |
| Less than $300 | 0 (0.0%) | 206 (5.2%) |
| $300 to $499 | 0 (0.0%) | 113 (2.9%) |
| $500 to $799 | 37 (1.9%) | 64 (1.6%) |
| $800 to $999 | 22 (1.2%) | 77 (2.0%) |
| $1,000 to $1,499 | 330 (17.4%) | 1,435 (36.5%) |
| $1,500 to $1,999 | 101 (5.3%) | 1,342 (34.2%) |
| $2,000 to $2,499 | 275 (14.5%) | 546 (13.9%) |
| $2,500 to $2,999 | 374 (19.7%) | 32 (0.8%) |
| $3,000 or more | 756 (39.9%) | 66 (1.7%) |
| Total | 1,895 (100.0%) | 3,928 (100.0%) |
Physical Housing Characteristics in Fairview borough
Housing Structures in Fairview borough
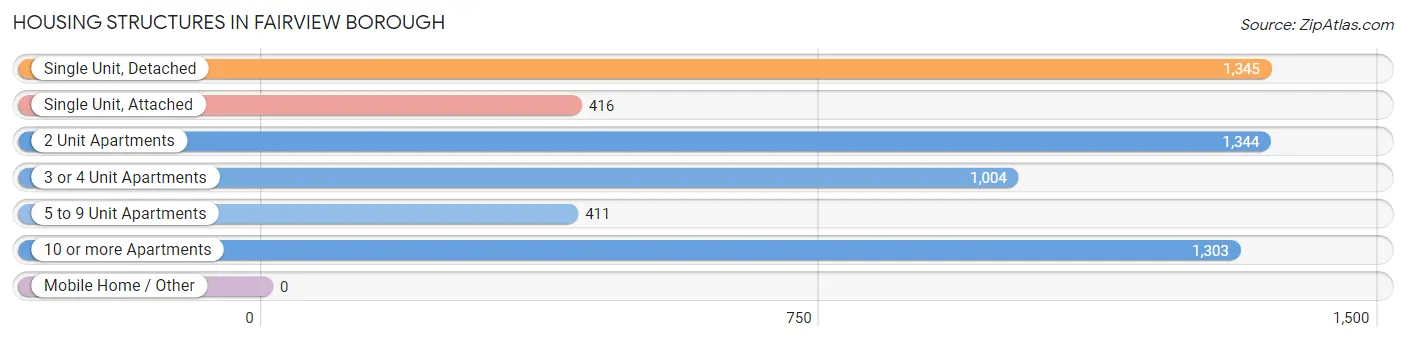
| Structure Type | # Housing Units | % Housing Units |
| Single Unit, Detached | 1,345 | 23.1% |
| Single Unit, Attached | 416 | 7.1% |
| 2 Unit Apartments | 1,344 | 23.1% |
| 3 or 4 Unit Apartments | 1,004 | 17.2% |
| 5 to 9 Unit Apartments | 411 | 7.1% |
| 10 or more Apartments | 1,303 | 22.4% |
| Mobile Home / Other | 0 | 0.0% |
| Total | 5,823 | 100.0% |
Housing Structures by Occupancy in Fairview borough
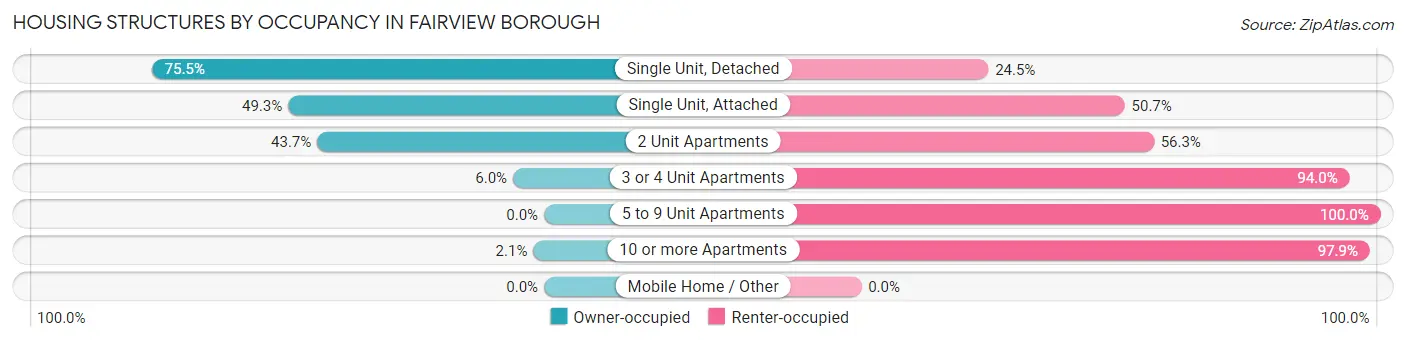
| Structure Type | Owner-occupied | Renter-occupied |
| Single Unit, Detached | 1,016 (75.5%) | 329 (24.5%) |
| Single Unit, Attached | 205 (49.3%) | 211 (50.7%) |
| 2 Unit Apartments | 587 (43.7%) | 757 (56.3%) |
| 3 or 4 Unit Apartments | 60 (6.0%) | 944 (94.0%) |
| 5 to 9 Unit Apartments | 0 (0.0%) | 411 (100.0%) |
| 10 or more Apartments | 27 (2.1%) | 1,276 (97.9%) |
| Mobile Home / Other | 0 (0.0%) | 0 (0.0%) |
| Total | 1,895 (32.5%) | 3,928 (67.5%) |
Housing Structures by Number of Rooms in Fairview borough
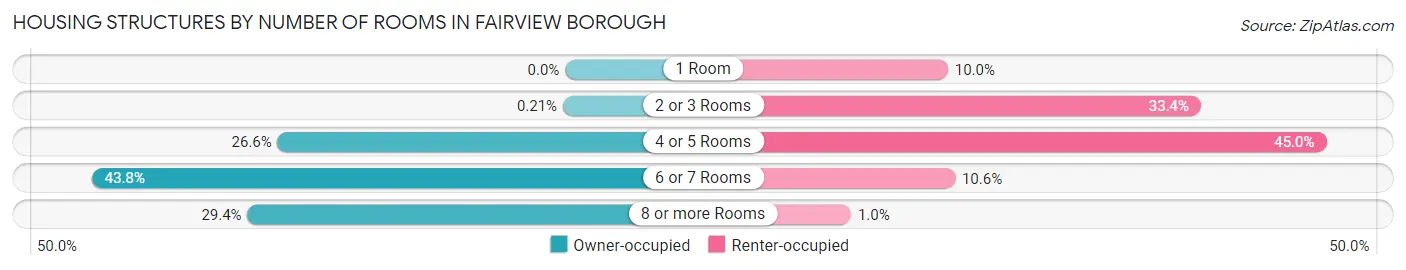
| Number of Rooms | Owner-occupied | Renter-occupied |
| 1 Room | 0 (0.0%) | 392 (10.0%) |
| 2 or 3 Rooms | 4 (0.2%) | 1,311 (33.4%) |
| 4 or 5 Rooms | 504 (26.6%) | 1,767 (45.0%) |
| 6 or 7 Rooms | 830 (43.8%) | 418 (10.6%) |
| 8 or more Rooms | 557 (29.4%) | 40 (1.0%) |
| Total | 1,895 (100.0%) | 3,928 (100.0%) |
Housing Structure by Heating Type in Fairview borough
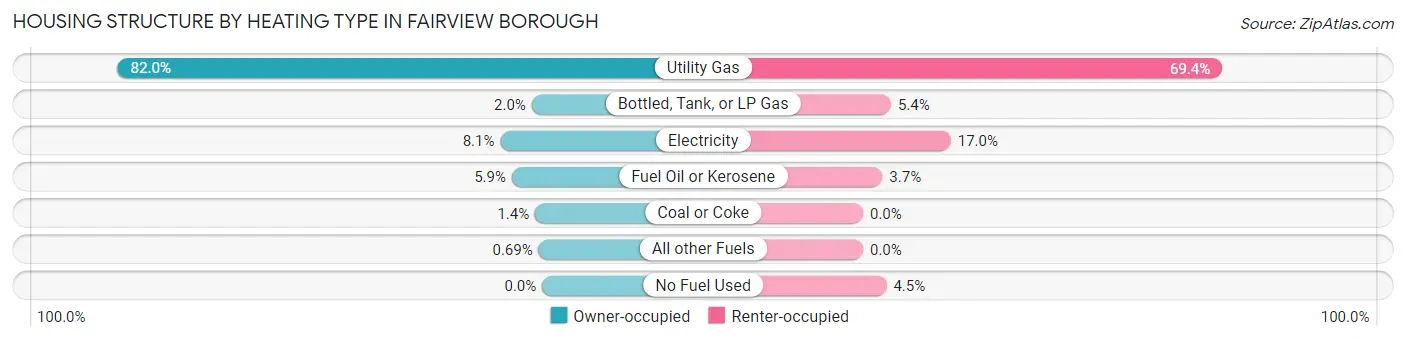
| Heating Type | Owner-occupied | Renter-occupied |
| Utility Gas | 1,554 (82.0%) | 2,725 (69.4%) |
| Bottled, Tank, or LP Gas | 38 (2.0%) | 212 (5.4%) |
| Electricity | 153 (8.1%) | 666 (17.0%) |
| Fuel Oil or Kerosene | 111 (5.9%) | 147 (3.7%) |
| Coal or Coke | 26 (1.4%) | 0 (0.0%) |
| All other Fuels | 13 (0.7%) | 0 (0.0%) |
| No Fuel Used | 0 (0.0%) | 178 (4.5%) |
| Total | 1,895 (100.0%) | 3,928 (100.0%) |
Household Vehicle Usage in Fairview borough
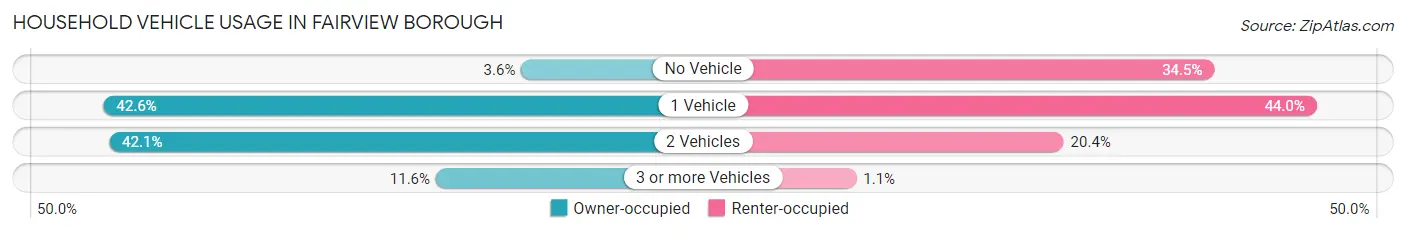
| Vehicles per Household | Owner-occupied | Renter-occupied |
| No Vehicle | 69 (3.6%) | 1,354 (34.5%) |
| 1 Vehicle | 808 (42.6%) | 1,730 (44.0%) |
| 2 Vehicles | 798 (42.1%) | 802 (20.4%) |
| 3 or more Vehicles | 220 (11.6%) | 42 (1.1%) |
| Total | 1,895 (100.0%) | 3,928 (100.0%) |
Real Estate & Mortgages in Fairview borough
Real Estate and Mortgage Overview in Fairview borough
| Characteristic | Without Mortgage | With Mortgage |
| Housing Units | 556 | 1,339 |
| Median Property Value | $433,800 | $487,600 |
| Median Household Income | $66,389 | $694 |
| Monthly Housing Costs | $1,160 | $756 |
| Real Estate Taxes | $9,946 | $25 |
Property Value by Mortgage Status in Fairview borough
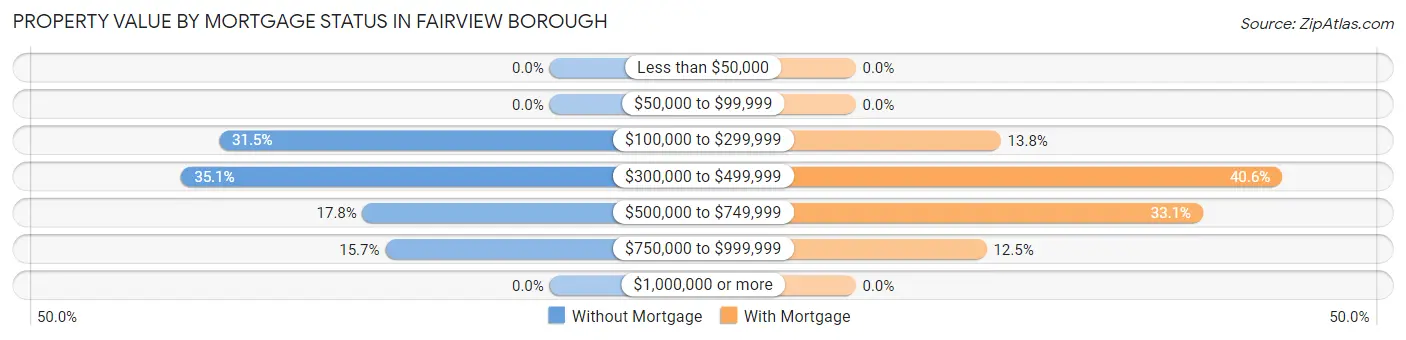
| Property Value | Without Mortgage | With Mortgage |
| Less than $50,000 | 0 (0.0%) | 0 (0.0%) |
| $50,000 to $99,999 | 0 (0.0%) | 0 (0.0%) |
| $100,000 to $299,999 | 175 (31.5%) | 185 (13.8%) |
| $300,000 to $499,999 | 195 (35.1%) | 544 (40.6%) |
| $500,000 to $749,999 | 99 (17.8%) | 443 (33.1%) |
| $750,000 to $999,999 | 87 (15.7%) | 167 (12.5%) |
| $1,000,000 or more | 0 (0.0%) | 0 (0.0%) |
| Total | 556 (100.0%) | 1,339 (100.0%) |
Household Income by Mortgage Status in Fairview borough
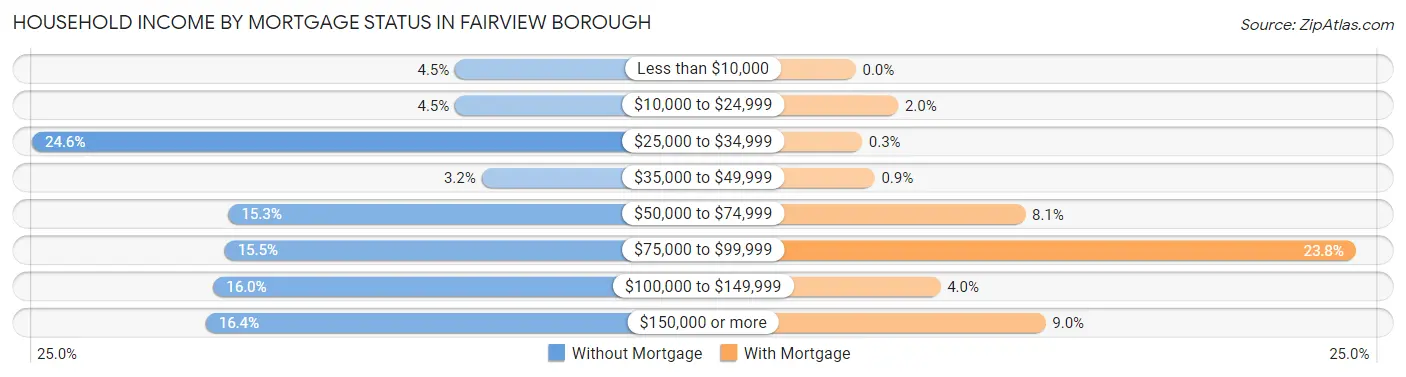
| Household Income | Without Mortgage | With Mortgage |
| Less than $10,000 | 25 (4.5%) | 0 (0.0%) |
| $10,000 to $24,999 | 25 (4.5%) | 27 (2.0%) |
| $25,000 to $34,999 | 137 (24.6%) | 4 (0.3%) |
| $35,000 to $49,999 | 18 (3.2%) | 12 (0.9%) |
| $50,000 to $74,999 | 85 (15.3%) | 108 (8.1%) |
| $75,000 to $99,999 | 86 (15.5%) | 319 (23.8%) |
| $100,000 to $149,999 | 89 (16.0%) | 54 (4.0%) |
| $150,000 or more | 91 (16.4%) | 121 (9.0%) |
| Total | 556 (100.0%) | 1,339 (100.0%) |
Property Value to Household Income Ratio in Fairview borough
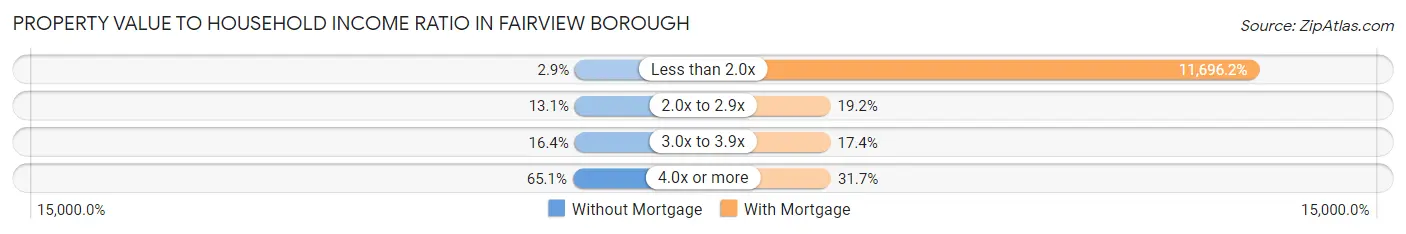
| Value-to-Income Ratio | Without Mortgage | With Mortgage |
| Less than 2.0x | 16 (2.9%) | 156,612 (11,696.2%) |
| 2.0x to 2.9x | 73 (13.1%) | 257 (19.2%) |
| 3.0x to 3.9x | 91 (16.4%) | 233 (17.4%) |
| 4.0x or more | 362 (65.1%) | 425 (31.7%) |
| Total | 556 (100.0%) | 1,339 (100.0%) |
Real Estate Taxes by Mortgage Status in Fairview borough
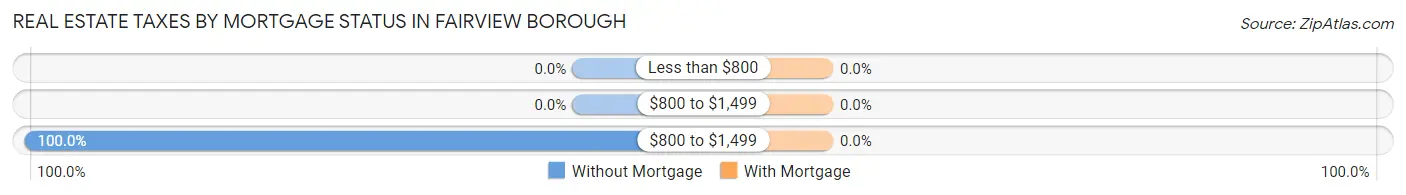
| Property Taxes | Without Mortgage | With Mortgage |
| Less than $800 | 0 (0.0%) | 0 (0.0%) |
| $800 to $1,499 | 0 (0.0%) | 0 (0.0%) |
| $800 to $1,499 | 556 (100.0%) | 0 (0.0%) |
| Total | 556 (100.0%) | 1,339 (100.0%) |
Health & Disability in Fairview borough
Health Insurance Coverage by Age in Fairview borough

| Age Bracket | With Coverage | Without Coverage |
| Under 6 Years | 610 (74.9%) | 204 (25.1%) |
| 6 to 18 Years | 1,546 (89.1%) | 189 (10.9%) |
| 19 to 25 Years | 1,384 (74.4%) | 477 (25.6%) |
| 26 to 34 Years | 910 (54.1%) | 772 (45.9%) |
| 35 to 44 Years | 2,014 (78.8%) | 543 (21.2%) |
| 45 to 54 Years | 1,875 (81.2%) | 435 (18.8%) |
| 55 to 64 Years | 1,593 (88.7%) | 202 (11.3%) |
| 65 to 74 Years | 901 (91.8%) | 80 (8.2%) |
| 75 Years and older | 1,200 (100.0%) | 0 (0.0%) |
| Total | 12,033 (80.6%) | 2,902 (19.4%) |
Health Insurance Coverage by Citizenship Status in Fairview borough
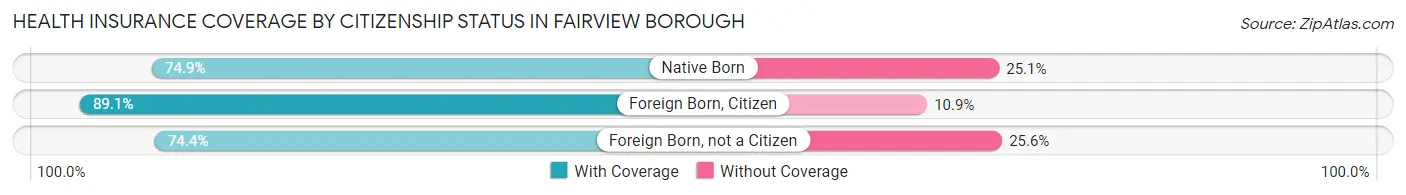
| Citizenship Status | With Coverage | Without Coverage |
| Native Born | 610 (74.9%) | 204 (25.1%) |
| Foreign Born, Citizen | 1,546 (89.1%) | 189 (10.9%) |
| Foreign Born, not a Citizen | 1,384 (74.4%) | 477 (25.6%) |
Health Insurance Coverage by Household Income in Fairview borough
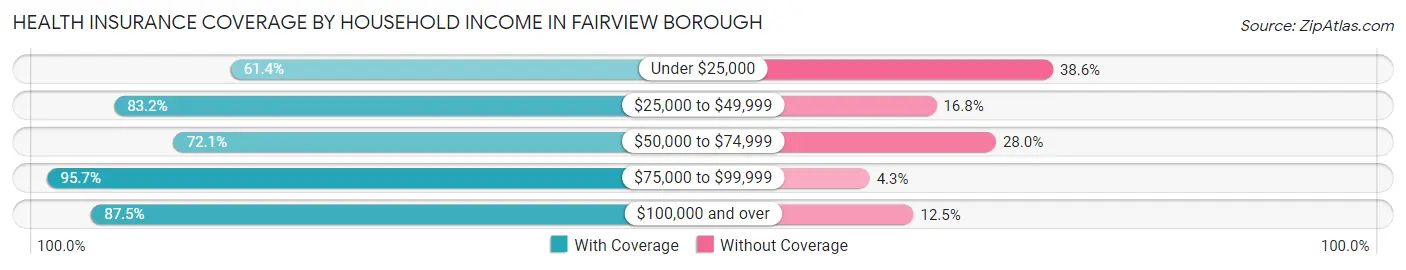
| Household Income | With Coverage | Without Coverage |
| Under $25,000 | 1,068 (61.4%) | 672 (38.6%) |
| $25,000 to $49,999 | 2,723 (83.2%) | 550 (16.8%) |
| $50,000 to $74,999 | 2,500 (72.1%) | 970 (28.0%) |
| $75,000 to $99,999 | 1,113 (95.7%) | 50 (4.3%) |
| $100,000 and over | 4,621 (87.5%) | 660 (12.5%) |
Public vs Private Health Insurance Coverage by Age in Fairview borough
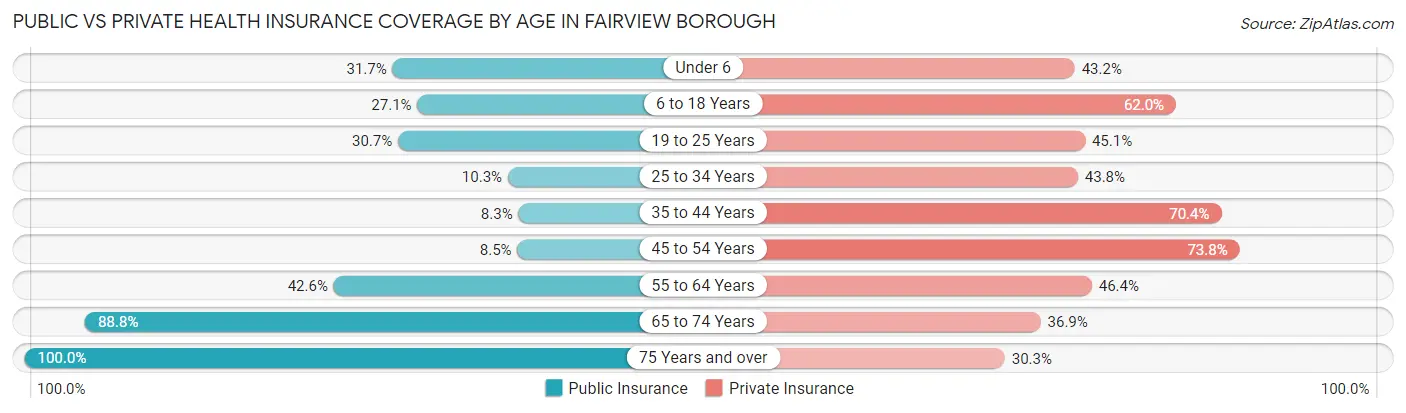
| Age Bracket | Public Insurance | Private Insurance |
| Under 6 | 258 (31.7%) | 352 (43.2%) |
| 6 to 18 Years | 470 (27.1%) | 1,076 (62.0%) |
| 19 to 25 Years | 571 (30.7%) | 840 (45.1%) |
| 25 to 34 Years | 173 (10.3%) | 737 (43.8%) |
| 35 to 44 Years | 213 (8.3%) | 1,801 (70.4%) |
| 45 to 54 Years | 197 (8.5%) | 1,705 (73.8%) |
| 55 to 64 Years | 765 (42.6%) | 833 (46.4%) |
| 65 to 74 Years | 871 (88.8%) | 362 (36.9%) |
| 75 Years and over | 1,200 (100.0%) | 363 (30.2%) |
| Total | 4,718 (31.6%) | 8,069 (54.0%) |
Disability Status by Sex by Age in Fairview borough
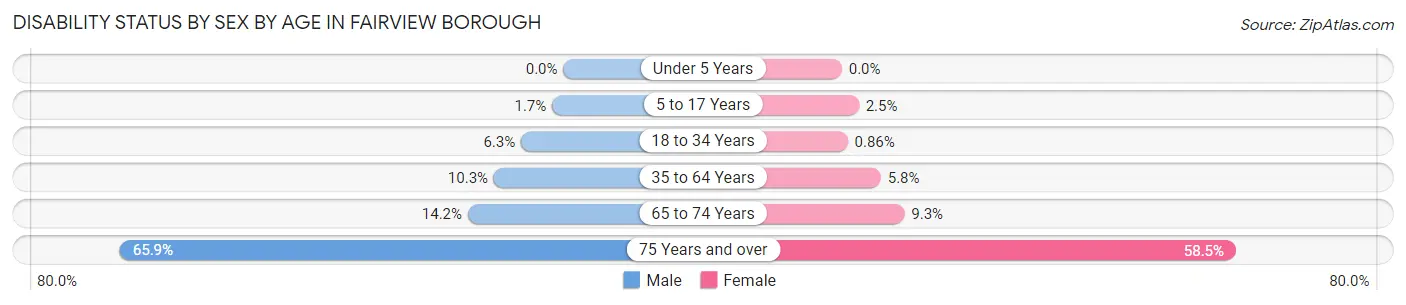
| Age Bracket | Male | Female |
| Under 5 Years | 0 (0.0%) | 0 (0.0%) |
| 5 to 17 Years | 12 (1.7%) | 24 (2.5%) |
| 18 to 34 Years | 129 (6.3%) | 14 (0.9%) |
| 35 to 64 Years | 377 (10.3%) | 174 (5.8%) |
| 65 to 74 Years | 75 (14.2%) | 42 (9.3%) |
| 75 Years and over | 241 (65.8%) | 488 (58.5%) |
Disability Class by Sex by Age in Fairview borough
Disability Class: Hearing Difficulty
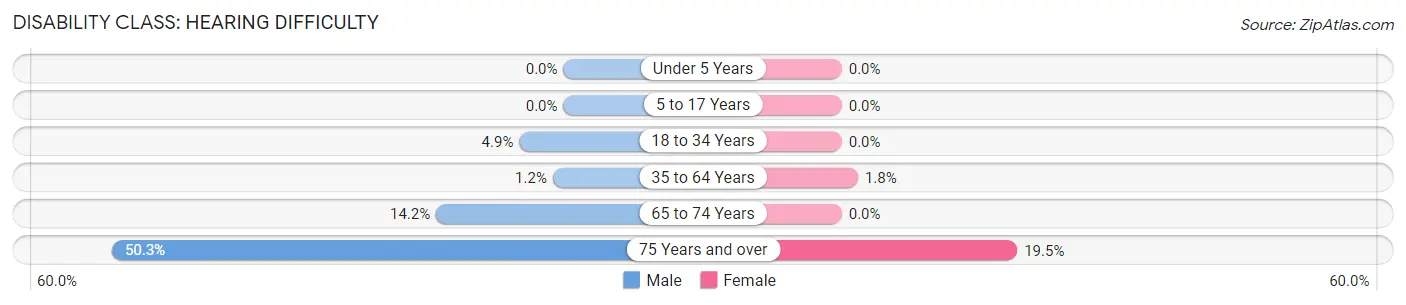
| Age Bracket | Male | Female |
| Under 5 Years | 0 (0.0%) | 0 (0.0%) |
| 5 to 17 Years | 0 (0.0%) | 0 (0.0%) |
| 18 to 34 Years | 101 (4.9%) | 0 (0.0%) |
| 35 to 64 Years | 43 (1.2%) | 54 (1.8%) |
| 65 to 74 Years | 75 (14.2%) | 0 (0.0%) |
| 75 Years and over | 184 (50.3%) | 163 (19.5%) |
Disability Class: Vision Difficulty
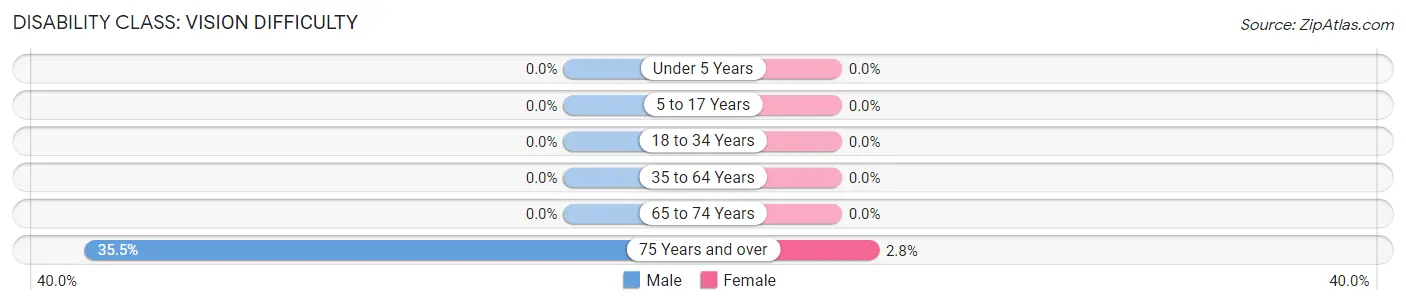
| Age Bracket | Male | Female |
| Under 5 Years | 0 (0.0%) | 0 (0.0%) |
| 5 to 17 Years | 0 (0.0%) | 0 (0.0%) |
| 18 to 34 Years | 0 (0.0%) | 0 (0.0%) |
| 35 to 64 Years | 0 (0.0%) | 0 (0.0%) |
| 65 to 74 Years | 0 (0.0%) | 0 (0.0%) |
| 75 Years and over | 130 (35.5%) | 23 (2.8%) |
Disability Class: Cognitive Difficulty

| Age Bracket | Male | Female |
| 5 to 17 Years | 12 (1.7%) | 24 (2.5%) |
| 18 to 34 Years | 28 (1.4%) | 0 (0.0%) |
| 35 to 64 Years | 98 (2.7%) | 57 (1.9%) |
| 65 to 74 Years | 0 (0.0%) | 0 (0.0%) |
| 75 Years and over | 114 (31.1%) | 169 (20.3%) |
Disability Class: Ambulatory Difficulty
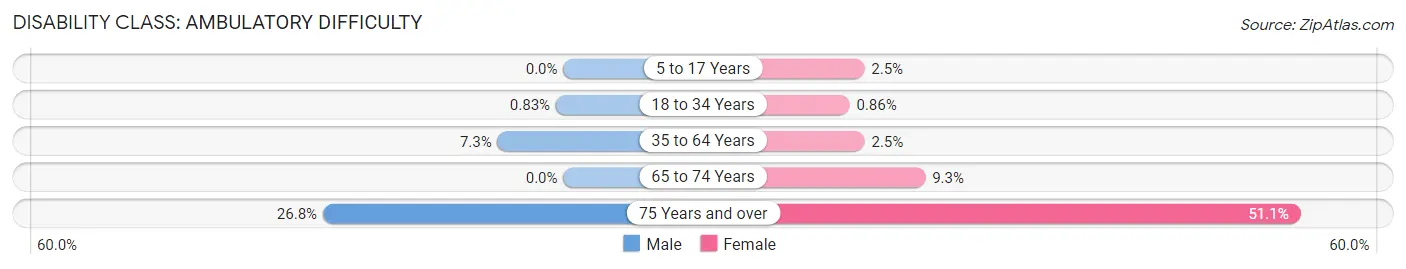
| Age Bracket | Male | Female |
| 5 to 17 Years | 0 (0.0%) | 24 (2.5%) |
| 18 to 34 Years | 17 (0.8%) | 14 (0.9%) |
| 35 to 64 Years | 268 (7.3%) | 76 (2.5%) |
| 65 to 74 Years | 0 (0.0%) | 42 (9.3%) |
| 75 Years and over | 98 (26.8%) | 426 (51.1%) |
Disability Class: Self-Care Difficulty
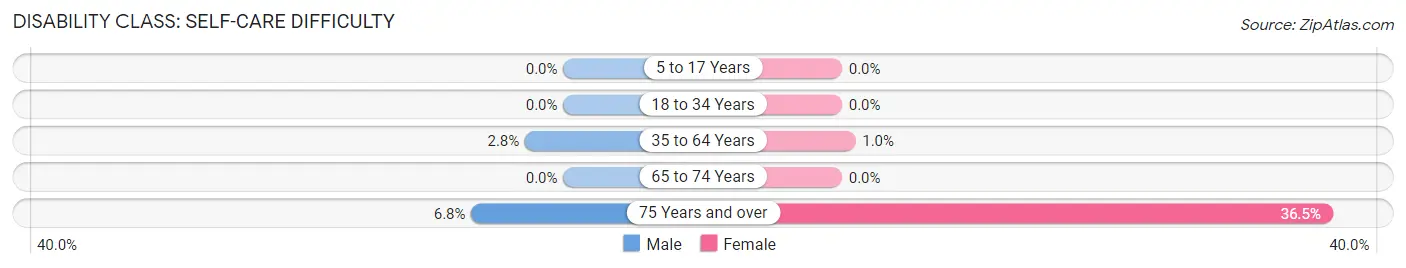
| Age Bracket | Male | Female |
| 5 to 17 Years | 0 (0.0%) | 0 (0.0%) |
| 18 to 34 Years | 0 (0.0%) | 0 (0.0%) |
| 35 to 64 Years | 104 (2.8%) | 30 (1.0%) |
| 65 to 74 Years | 0 (0.0%) | 0 (0.0%) |
| 75 Years and over | 25 (6.8%) | 304 (36.4%) |
Technology Access in Fairview borough
Computing Device Access in Fairview borough
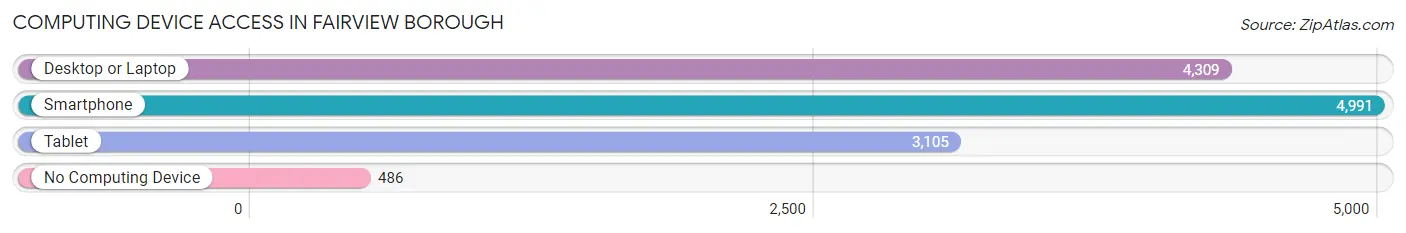
| Device Type | # Households | % Households |
| Desktop or Laptop | 4,309 | 74.0% |
| Smartphone | 4,991 | 85.7% |
| Tablet | 3,105 | 53.3% |
| No Computing Device | 486 | 8.4% |
| Total | 5,823 | 100.0% |
Internet Access in Fairview borough
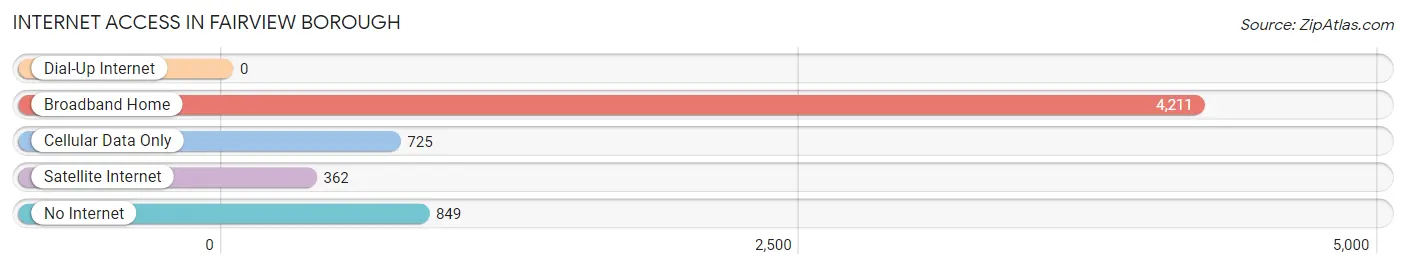
| Internet Type | # Households | % Households |
| Dial-Up Internet | 0 | 0.0% |
| Broadband Home | 4,211 | 72.3% |
| Cellular Data Only | 725 | 12.4% |
| Satellite Internet | 362 | 6.2% |
| No Internet | 849 | 14.6% |
| Total | 5,823 | 100.0% |
Fairview borough Summary
Introduction
Fairview Borough is a small borough located in Bergen County, New Jersey. It is situated on the Hudson River, just north of the George Washington Bridge. The borough is home to a population of approximately 8,000 people and is known for its small-town charm and close-knit community.
History
Fairview Borough was originally part of the Township of Ridgefield, which was established in 1871. In 1894, the area was incorporated as the Borough of Fairview. The name was chosen to reflect the beautiful views of the Hudson River and the Palisades.
The borough was originally a farming community, but it quickly developed into a residential area. In the early 1900s, the borough was home to a number of factories, including a silk mill, a paper mill, and a brickyard. These factories provided employment for many of the borough’s residents.
In the 1950s, the borough began to experience a period of growth and development. The population increased from 4,000 in 1950 to 8,000 in 2000. This growth was largely due to the construction of the George Washington Bridge, which provided easy access to New York City.
Geography
Fairview Borough is located in Bergen County, New Jersey. It is situated on the Hudson River, just north of the George Washington Bridge. The borough is bordered by the boroughs of Ridgefield, Palisades Park, and Fort Lee.
The borough has a total area of 1.2 square miles, all of which is land. The borough is located at an elevation of approximately 50 feet above sea level.
Economy
Fairview Borough has a diverse economy. The borough is home to a number of small businesses, including restaurants, retail stores, and professional services. The borough is also home to a number of large corporations, including the pharmaceutical company Pfizer and the financial services company UBS.
The borough is also home to a number of educational institutions, including Fairview High School and Fairview College.
Demographics
As of the 2010 census, the population of Fairview Borough was 8,000. The racial makeup of the borough was 79.3% White, 8.2% African American, 0.3% Native American, 5.2% Asian, and 6.9% from other races. Hispanic or Latino of any race were 15.2% of the population.
The median household income in Fairview Borough was $68,000, and the median family income was $76,000. The per capita income was $30,000.
Conclusion
Fairview Borough is a small borough located in Bergen County, New Jersey. It is situated on the Hudson River, just north of the George Washington Bridge. The borough is home to a population of approximately 8,000 people and is known for its small-town charm and close-knit community. The borough has a diverse economy and is home to a number of small businesses, large corporations, and educational institutions. The population of Fairview Borough is predominantly White, with a significant Hispanic or Latino population. The median household income in Fairview Borough is $68,000, and the median family income is $76,000.
Common Questions
What is Per Capita Income in Fairview borough?
Per Capita income in Fairview borough is $35,932.
What is the Median Family Income in Fairview borough?
Median Family Income in Fairview borough is $66,701.
What is the Median Household income in Fairview borough?
Median Household Income in Fairview borough is $59,359.
What is Income or Wage Gap in Fairview borough?
Income or Wage Gap in Fairview borough is 26.7%.
Women in Fairview borough earn 73.3 cents for every dollar earned by a man.
What is Inequality or Gini Index in Fairview borough?
Inequality or Gini Index in Fairview borough is 0.50.
What is the Total Population of Fairview borough?
Total Population of Fairview borough is 14,935.
What is the Total Male Population of Fairview borough?
Total Male Population of Fairview borough is 7,803.
What is the Total Female Population of Fairview borough?
Total Female Population of Fairview borough is 7,132.
What is the Ratio of Males per 100 Females in Fairview borough?
There are 109.41 Males per 100 Females in Fairview borough.
What is the Ratio of Females per 100 Males in Fairview borough?
There are 91.40 Females per 100 Males in Fairview borough.
What is the Median Population Age in Fairview borough?
Median Population Age in Fairview borough is 40.2 Years.
What is the Average Family Size in Fairview borough
Average Family Size in Fairview borough is 3.3 People.
What is the Average Household Size in Fairview borough
Average Household Size in Fairview borough is 2.6 People.
How Large is the Labor Force in Fairview borough?
There are 8,521 People in the Labor Forcein in Fairview borough.
What is the Percentage of People in the Labor Force in Fairview borough?
66.3% of People are in the Labor Force in Fairview borough.
What is the Unemployment Rate in Fairview borough?
Unemployment Rate in Fairview borough is 6.5%.