Dryden, NY Map & Demographics
Dryden Map
Dryden Overview
$37,834
PER CAPITA INCOME
$72,083
AVG FAMILY INCOME
$59,420
AVG HOUSEHOLD INCOME
36.1%
WAGE / INCOME GAP [ % ]
63.9¢/ $1
WAGE / INCOME GAP [ $ ]
0.46
INEQUALITY / GINI INDEX
1,838
TOTAL POPULATION
799
MALE POPULATION
1,039
FEMALE POPULATION
76.90
MALES / 100 FEMALES
130.04
FEMALES / 100 MALES
46.8
MEDIAN AGE
2.6
AVG FAMILY SIZE
2.0
AVG HOUSEHOLD SIZE
868
LABOR FORCE [ PEOPLE ]
56.8%
PERCENT IN LABOR FORCE
5.4%
UNEMPLOYMENT RATE
Dryden Zip Codes
Dryden Area Codes
Income in Dryden
Income Overview in Dryden
Per Capita Income in Dryden is $37,834, while median incomes of families and households are $72,083 and $59,420 respectively.
| Characteristic | Number | Measure |
| Per Capita Income | 1,838 | $37,834 |
| Median Family Income | 502 | $72,083 |
| Mean Family Income | 502 | $89,682 |
| Median Household Income | 911 | $59,420 |
| Mean Household Income | 911 | $77,316 |
| Income Deficit | 502 | $0 |
| Wage / Income Gap (%) | 1,838 | 36.06% |
| Wage / Income Gap ($) | 1,838 | 63.94¢ per $1 |
| Gini / Inequality Index | 1,838 | 0.46 |
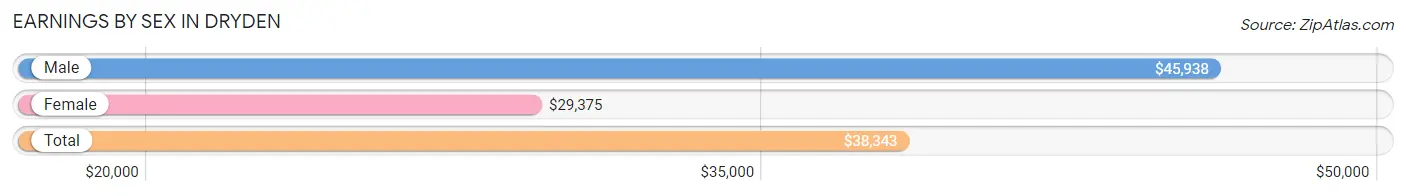
Earnings by Sex in Dryden
Average Earnings in Dryden are $38,343, $45,938 for men and $29,375 for women, a difference of 36.1%.
| Sex | Number | Average Earnings |
| Male | 487 (53.0%) | $45,938 |
| Female | 432 (47.0%) | $29,375 |
| Total | 919 (100.0%) | $38,343 |
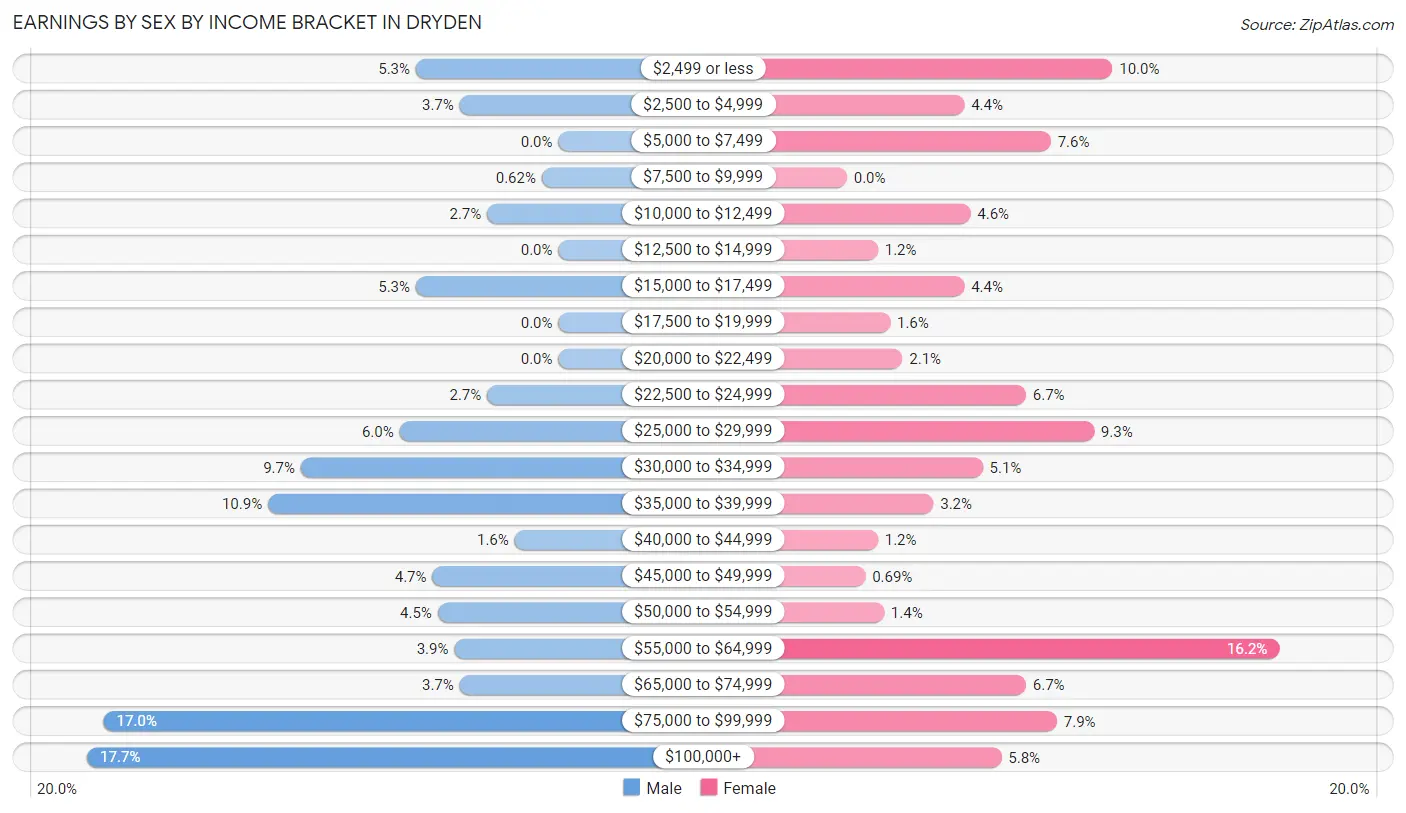
Earnings by Sex by Income Bracket in Dryden
The most common earnings brackets in Dryden are $100,000+ for men (86 | 17.7%) and $55,000 to $64,999 for women (70 | 16.2%).
| Income | Male | Female |
| $2,499 or less | 26 (5.3%) | 43 (10.0%) |
| $2,500 to $4,999 | 18 (3.7%) | 19 (4.4%) |
| $5,000 to $7,499 | 0 (0.0%) | 33 (7.6%) |
| $7,500 to $9,999 | 3 (0.6%) | 0 (0.0%) |
| $10,000 to $12,499 | 13 (2.7%) | 20 (4.6%) |
| $12,500 to $14,999 | 0 (0.0%) | 5 (1.2%) |
| $15,000 to $17,499 | 26 (5.3%) | 19 (4.4%) |
| $17,500 to $19,999 | 0 (0.0%) | 7 (1.6%) |
| $20,000 to $22,499 | 0 (0.0%) | 9 (2.1%) |
| $22,500 to $24,999 | 13 (2.7%) | 29 (6.7%) |
| $25,000 to $29,999 | 29 (5.9%) | 40 (9.3%) |
| $30,000 to $34,999 | 47 (9.7%) | 22 (5.1%) |
| $35,000 to $39,999 | 53 (10.9%) | 14 (3.2%) |
| $40,000 to $44,999 | 8 (1.6%) | 5 (1.2%) |
| $45,000 to $49,999 | 23 (4.7%) | 3 (0.7%) |
| $50,000 to $54,999 | 22 (4.5%) | 6 (1.4%) |
| $55,000 to $64,999 | 19 (3.9%) | 70 (16.2%) |
| $65,000 to $74,999 | 18 (3.7%) | 29 (6.7%) |
| $75,000 to $99,999 | 83 (17.0%) | 34 (7.9%) |
| $100,000+ | 86 (17.7%) | 25 (5.8%) |
| Total | 487 (100.0%) | 432 (100.0%) |
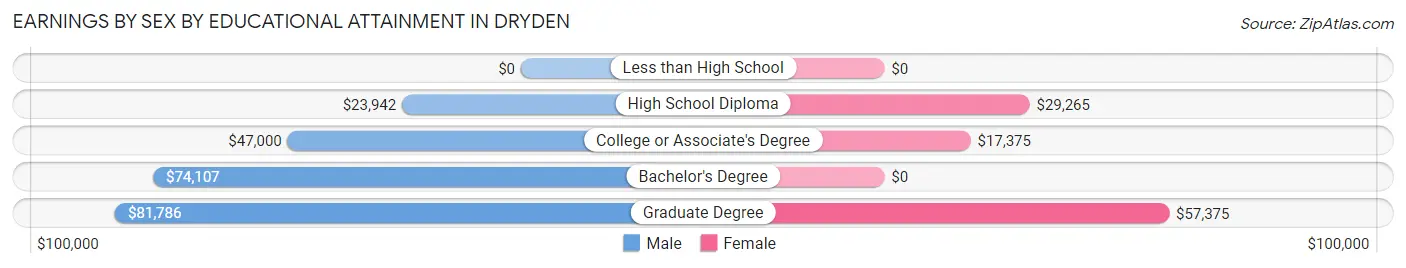
Earnings by Sex by Educational Attainment in Dryden
Average earnings in Dryden are $52,386 for men and $34,688 for women, a difference of 33.8%. Men with an educational attainment of graduate degree enjoy the highest average annual earnings of $81,786, while those with high school diploma education earn the least with $23,942. Women with an educational attainment of graduate degree earn the most with the average annual earnings of $57,375, while those with college or associate's degree education have the smallest earnings of $17,375.
| Educational Attainment | Male Income | Female Income |
| Less than High School | - | - |
| High School Diploma | $23,942 | $29,265 |
| College or Associate's Degree | $47,000 | $17,375 |
| Bachelor's Degree | $74,107 | $0 |
| Graduate Degree | $81,786 | $57,375 |
| Total | $52,386 | $34,688 |
Family Income in Dryden
Family Income Brackets in Dryden
According to the Dryden family income data, there are 112 families falling into the $100,000 to $149,999 income range, which is the most common income bracket and makes up 22.3% of all families. Conversely, the $200,000+ income bracket is the least frequent group with only 18 families (3.6%) belonging to this category.
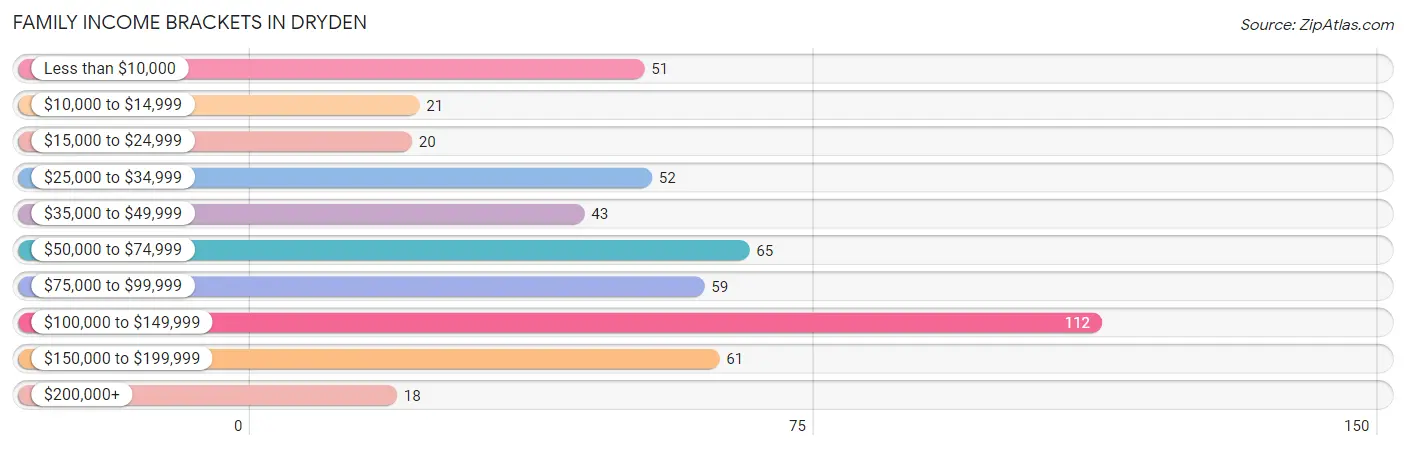
| Income Bracket | # Families | % Families |
| Less than $10,000 | 51 | 10.2% |
| $10,000 to $14,999 | 21 | 4.2% |
| $15,000 to $24,999 | 20 | 4.0% |
| $25,000 to $34,999 | 52 | 10.4% |
| $35,000 to $49,999 | 43 | 8.6% |
| $50,000 to $74,999 | 65 | 12.9% |
| $75,000 to $99,999 | 59 | 11.8% |
| $100,000 to $149,999 | 112 | 22.3% |
| $150,000 to $199,999 | 61 | 12.2% |
| $200,000+ | 18 | 3.6% |
Family Income by Famaliy Size in Dryden
4-person families (41 | 8.2%) account for the highest median family income in Dryden with $130,956 per family, while 4-person families (41 | 8.2%) have the highest median income of $32,739 per family member.
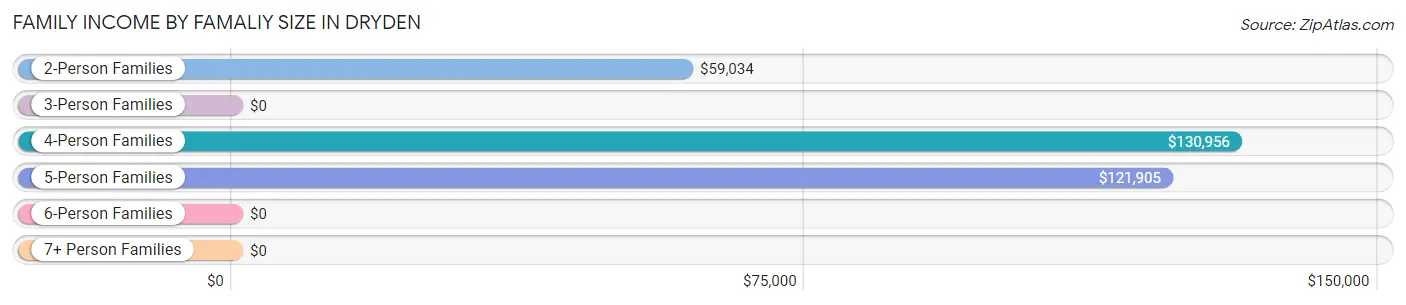
| Income Bracket | # Families | Median Income |
| 2-Person Families | 307 (61.2%) | $59,034 |
| 3-Person Families | 102 (20.3%) | $0 |
| 4-Person Families | 41 (8.2%) | $130,956 |
| 5-Person Families | 32 (6.4%) | $121,905 |
| 6-Person Families | 20 (4.0%) | $0 |
| 7+ Person Families | 0 (0.0%) | $0 |
| Total | 502 (100.0%) | $72,083 |
Family Income by Number of Earners in Dryden
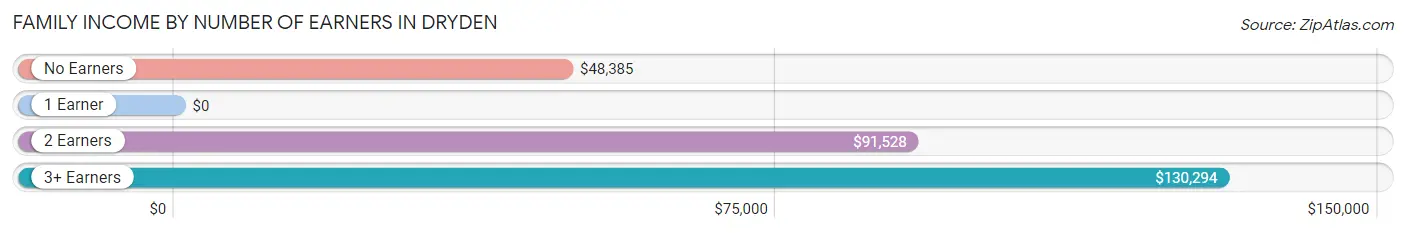
| Number of Earners | # Families | Median Income |
| No Earners | 149 (29.7%) | $48,385 |
| 1 Earner | 123 (24.5%) | $0 |
| 2 Earners | 178 (35.5%) | $91,528 |
| 3+ Earners | 52 (10.4%) | $130,294 |
| Total | 502 (100.0%) | $72,083 |
Household Income in Dryden
Household Income Brackets in Dryden
With 179 households falling in the category, the $100,000 to $149,999 income range is the most frequent in Dryden, accounting for 19.7% of all households. In contrast, only 23 households (2.5%) fall into the $200,000+ income bracket, making it the least populous group.
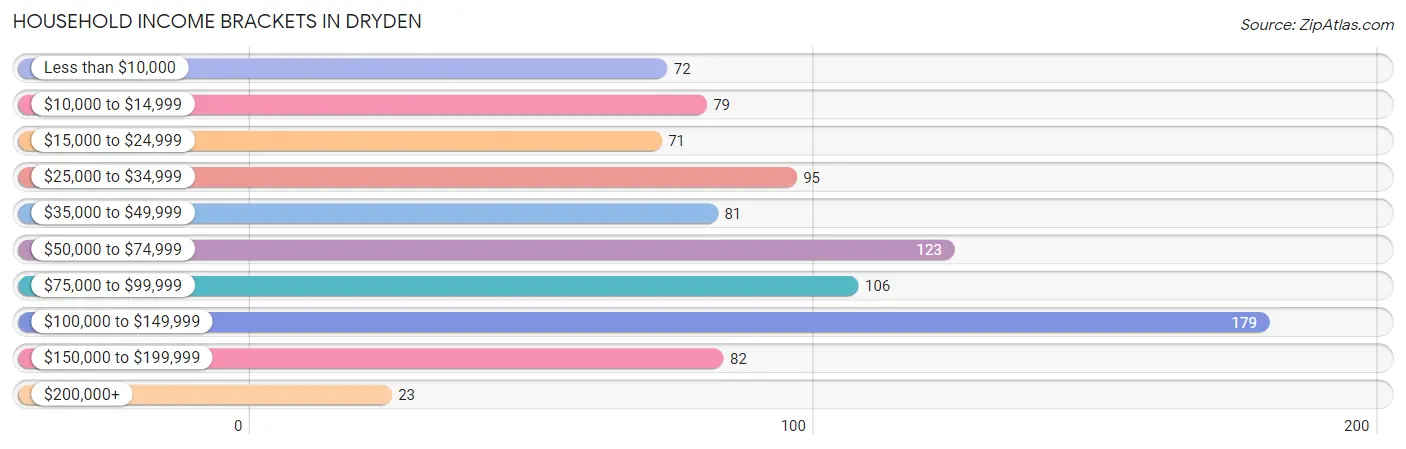
| Income Bracket | # Households | % Households |
| Less than $10,000 | 72 | 7.9% |
| $10,000 to $14,999 | 79 | 8.7% |
| $15,000 to $24,999 | 71 | 7.8% |
| $25,000 to $34,999 | 95 | 10.4% |
| $35,000 to $49,999 | 81 | 8.9% |
| $50,000 to $74,999 | 123 | 13.5% |
| $75,000 to $99,999 | 106 | 11.6% |
| $100,000 to $149,999 | 179 | 19.6% |
| $150,000 to $199,999 | 82 | 9.0% |
| $200,000+ | 23 | 2.5% |
Household Income by Householder Age in Dryden
The median household income in Dryden is $59,420, with the highest median household income of $88,864 found in the 45 to 64 years age bracket for the primary householder. A total of 286 households (31.4%) fall into this category. Meanwhile, the 15 to 24 years age bracket for the primary householder has the lowest median household income of $28,289, with 44 households (4.8%) in this group.
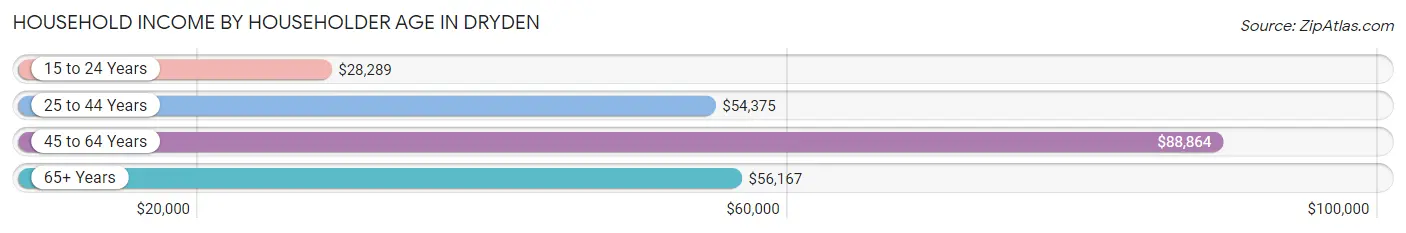
| Income Bracket | # Households | Median Income |
| 15 to 24 Years | 44 (4.8%) | $28,289 |
| 25 to 44 Years | 233 (25.6%) | $54,375 |
| 45 to 64 Years | 286 (31.4%) | $88,864 |
| 65+ Years | 348 (38.2%) | $56,167 |
| Total | 911 (100.0%) | $59,420 |
Poverty in Dryden
Income Below Poverty by Sex and Age in Dryden
With 17.2% poverty level for males and 27.1% for females among the residents of Dryden, 5 year old males and 15 year old females are the most vulnerable to poverty, with 5 males (100.0%) and 3 females (100.0%) in their respective age groups living below the poverty level.
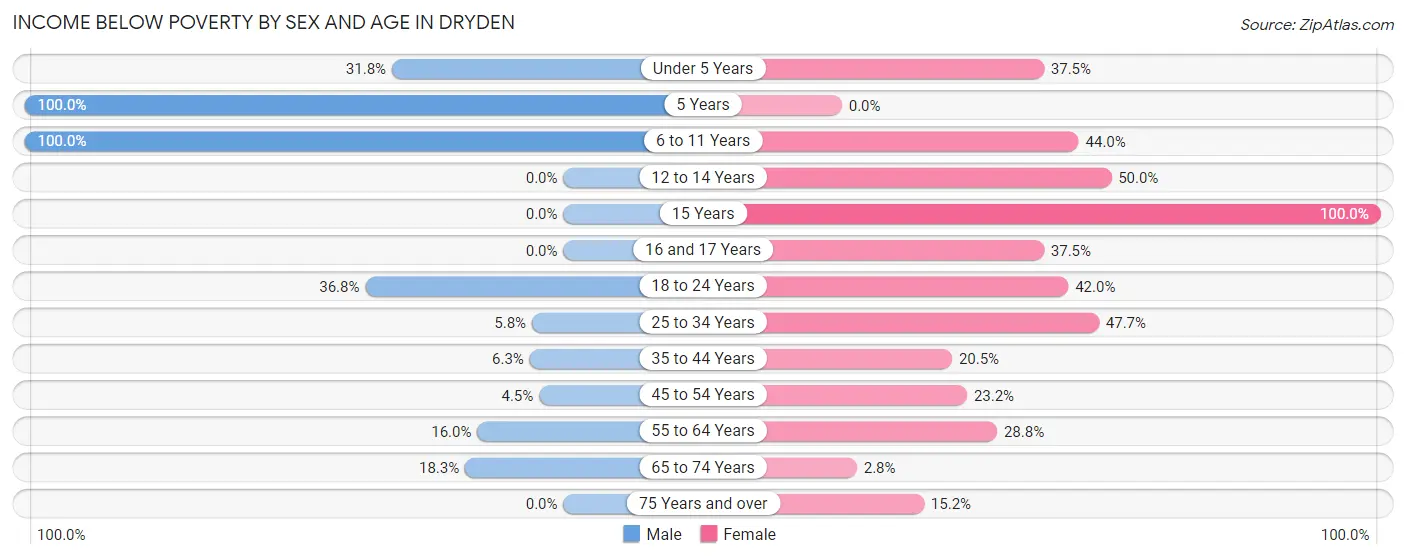
| Age Bracket | Male | Female |
| Under 5 Years | 14 (31.8%) | 27 (37.5%) |
| 5 Years | 5 (100.0%) | 0 (0.0%) |
| 6 to 11 Years | 33 (100.0%) | 40 (44.0%) |
| 12 to 14 Years | 0 (0.0%) | 14 (50.0%) |
| 15 Years | 0 (0.0%) | 3 (100.0%) |
| 16 and 17 Years | 0 (0.0%) | 6 (37.5%) |
| 18 to 24 Years | 25 (36.8%) | 29 (42.0%) |
| 25 to 34 Years | 6 (5.8%) | 52 (47.7%) |
| 35 to 44 Years | 5 (6.2%) | 18 (20.4%) |
| 45 to 54 Years | 5 (4.5%) | 36 (23.2%) |
| 55 to 64 Years | 19 (16.0%) | 34 (28.8%) |
| 65 to 74 Years | 25 (18.2%) | 5 (2.8%) |
| 75 Years and over | 0 (0.0%) | 16 (15.2%) |
| Total | 137 (17.2%) | 280 (27.1%) |
Income Above Poverty by Sex and Age in Dryden
According to the poverty statistics in Dryden, males aged 12 to 14 years and females aged 65 to 74 years are the age groups that are most secure financially, with 100.0% of males and 97.2% of females in these age groups living above the poverty line.
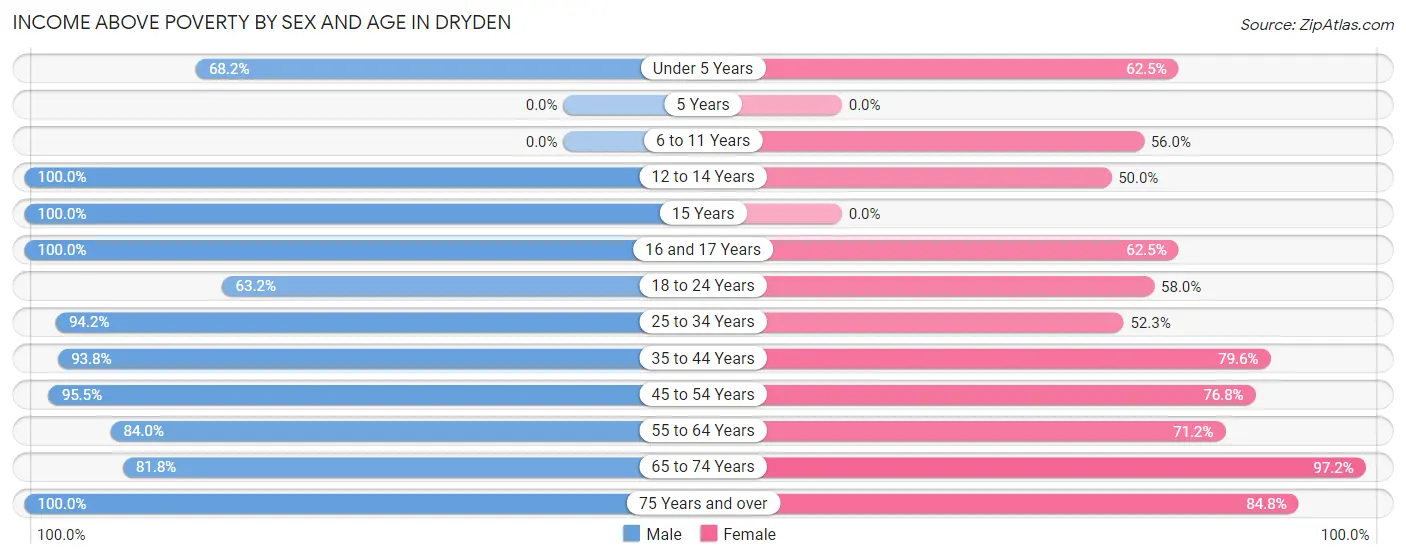
| Age Bracket | Male | Female |
| Under 5 Years | 30 (68.2%) | 45 (62.5%) |
| 5 Years | 0 (0.0%) | 0 (0.0%) |
| 6 to 11 Years | 0 (0.0%) | 51 (56.0%) |
| 12 to 14 Years | 17 (100.0%) | 14 (50.0%) |
| 15 Years | 12 (100.0%) | 0 (0.0%) |
| 16 and 17 Years | 23 (100.0%) | 10 (62.5%) |
| 18 to 24 Years | 43 (63.2%) | 40 (58.0%) |
| 25 to 34 Years | 97 (94.2%) | 57 (52.3%) |
| 35 to 44 Years | 75 (93.8%) | 70 (79.5%) |
| 45 to 54 Years | 106 (95.5%) | 119 (76.8%) |
| 55 to 64 Years | 100 (84.0%) | 84 (71.2%) |
| 65 to 74 Years | 112 (81.8%) | 175 (97.2%) |
| 75 Years and over | 47 (100.0%) | 89 (84.8%) |
| Total | 662 (82.9%) | 754 (72.9%) |
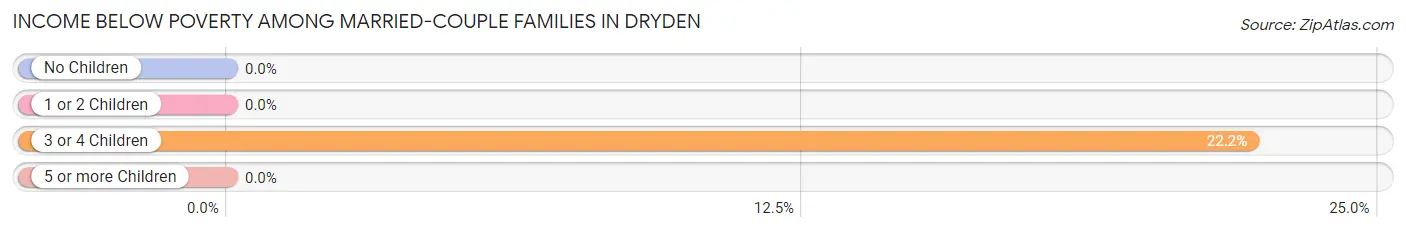
Income Below Poverty Among Married-Couple Families in Dryden
The poverty statistics for married-couple families in Dryden show that 1.7% or 6 of the total 352 families live below the poverty line. Families with 3 or 4 children have the highest poverty rate of 22.2%, comprising of 6 families. On the other hand, families with no children have the lowest poverty rate of 0.0%, which includes 0 families.
| Children | Above Poverty | Below Poverty |
| No Children | 244 (100.0%) | 0 (0.0%) |
| 1 or 2 Children | 81 (100.0%) | 0 (0.0%) |
| 3 or 4 Children | 21 (77.8%) | 6 (22.2%) |
| 5 or more Children | 0 (0.0%) | 0 (0.0%) |
| Total | 346 (98.3%) | 6 (1.7%) |
Income Below Poverty Among Single-Parent Households in Dryden
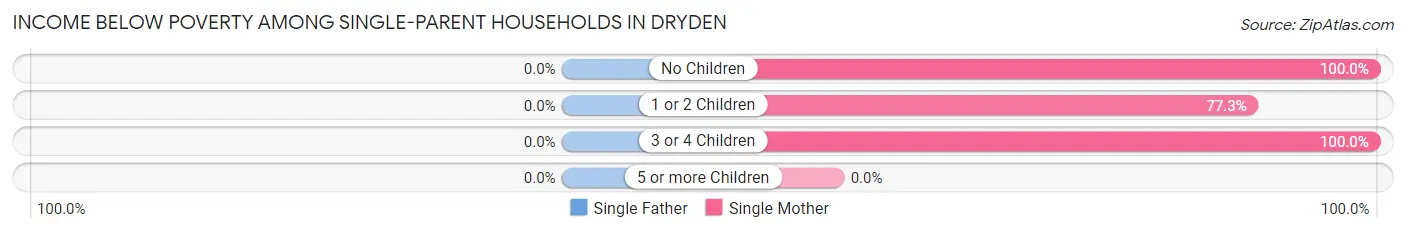
| Children | Single Father | Single Mother |
| No Children | 0 (0.0%) | 7 (100.0%) |
| 1 or 2 Children | 0 (0.0%) | 51 (77.3%) |
| 3 or 4 Children | 0 (0.0%) | 14 (100.0%) |
| 5 or more Children | 0 (0.0%) | 0 (0.0%) |
| Total | 0 (0.0%) | 72 (82.8%) |
Income Below Poverty Among Married-Couple vs Single-Parent Households in Dryden
The poverty data for Dryden shows that 6 of the married-couple family households (1.7%) and 72 of the single-parent households (48.0%) are living below the poverty level. Within the married-couple family households, those with 3 or 4 children have the highest poverty rate, with 6 households (22.2%) falling below the poverty line. Among the single-parent households, those with 3 or 4 children have the highest poverty rate, with 14 household (100.0%) living below poverty.
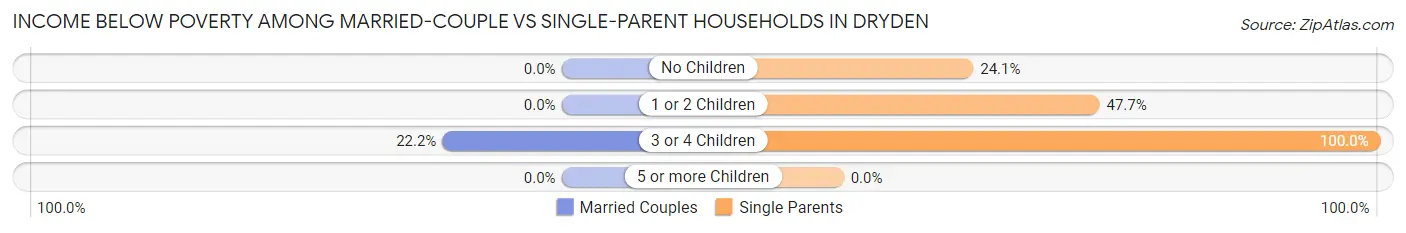
| Children | Married-Couple Families | Single-Parent Households |
| No Children | 0 (0.0%) | 7 (24.1%) |
| 1 or 2 Children | 0 (0.0%) | 51 (47.7%) |
| 3 or 4 Children | 6 (22.2%) | 14 (100.0%) |
| 5 or more Children | 0 (0.0%) | 0 (0.0%) |
| Total | 6 (1.7%) | 72 (48.0%) |
Race in Dryden
The most populous races in Dryden are White / Caucasian (1,675 | 91.1%), Hispanic or Latino (106 | 5.8%), and Two or more Races (64 | 3.5%).
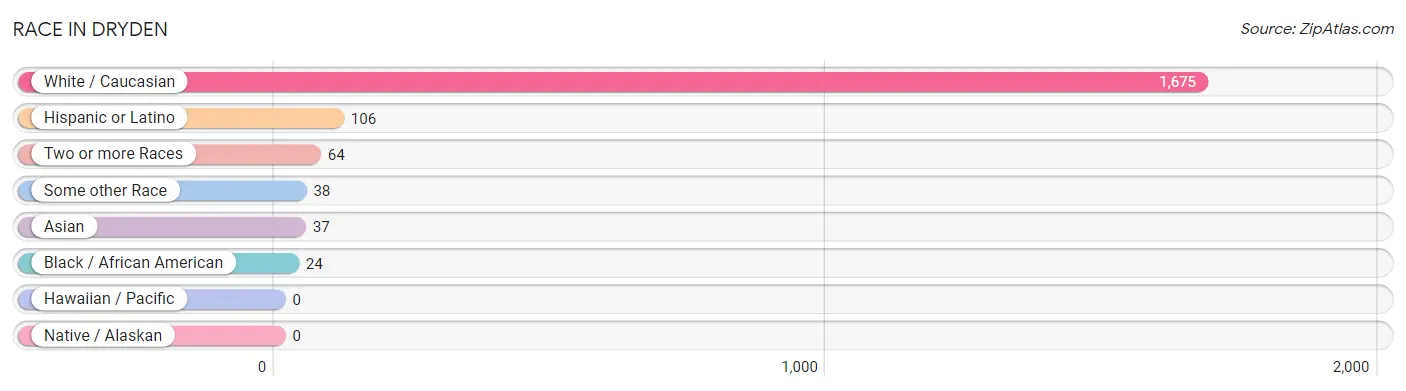
| Race | # Population | % Population |
| Asian | 37 | 2.0% |
| Black / African American | 24 | 1.3% |
| Hawaiian / Pacific | 0 | 0.0% |
| Hispanic or Latino | 106 | 5.8% |
| Native / Alaskan | 0 | 0.0% |
| White / Caucasian | 1,675 | 91.1% |
| Two or more Races | 64 | 3.5% |
| Some other Race | 38 | 2.1% |
| Total | 1,838 | 100.0% |
Ancestry in Dryden
The most populous ancestries reported in Dryden are Irish (436 | 23.7%), German (371 | 20.2%), English (276 | 15.0%), Scottish (110 | 6.0%), and Italian (101 | 5.5%), together accounting for 70.4% of all Dryden residents.
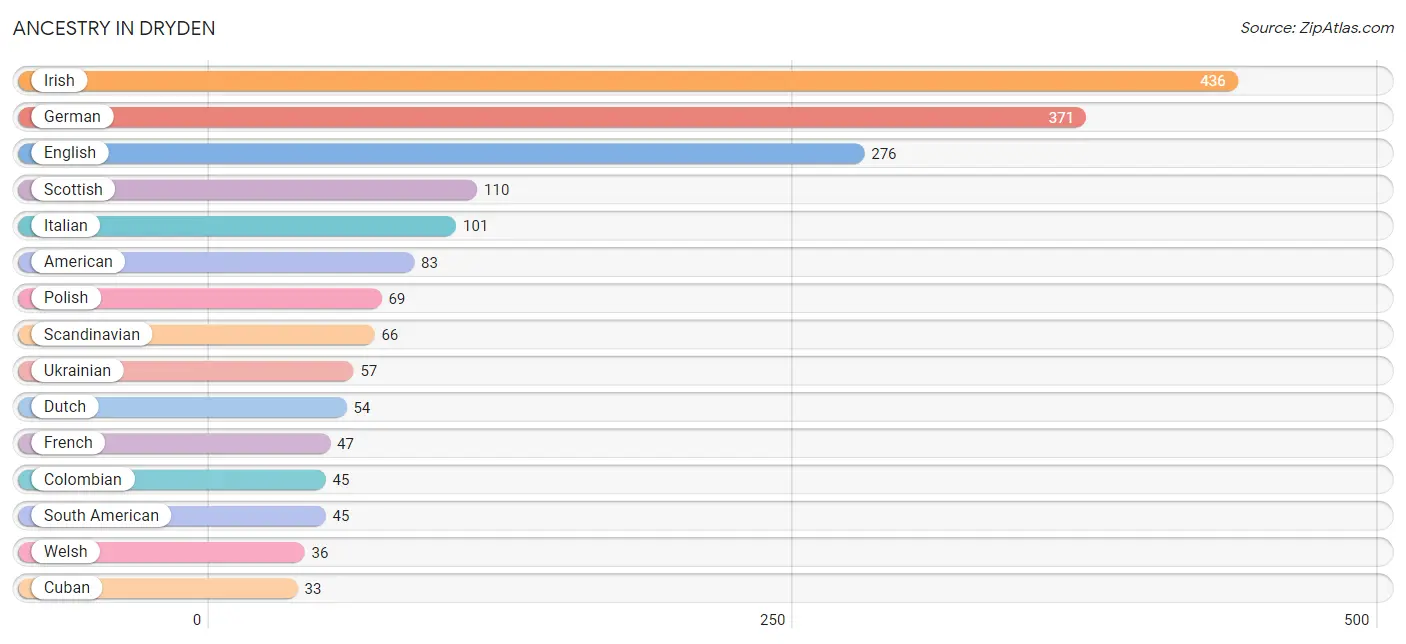
| Ancestry | # Population | % Population |
| American | 83 | 4.5% |
| Bhutanese | 1 | 0.1% |
| Blackfeet | 6 | 0.3% |
| British | 30 | 1.6% |
| Burmese | 18 | 1.0% |
| Canadian | 29 | 1.6% |
| Colombian | 45 | 2.5% |
| Croatian | 29 | 1.6% |
| Cuban | 33 | 1.8% |
| Czech | 8 | 0.4% |
| Dutch | 54 | 2.9% |
| English | 276 | 15.0% |
| European | 25 | 1.4% |
| Finnish | 9 | 0.5% |
| French | 47 | 2.6% |
| French American Indian | 4 | 0.2% |
| French Canadian | 18 | 1.0% |
| German | 371 | 20.2% |
| Greek | 17 | 0.9% |
| Hungarian | 26 | 1.4% |
| Icelander | 16 | 0.9% |
| Indian (Asian) | 19 | 1.0% |
| Irish | 436 | 23.7% |
| Israeli | 5 | 0.3% |
| Italian | 101 | 5.5% |
| Norwegian | 7 | 0.4% |
| Polish | 69 | 3.7% |
| Portuguese | 4 | 0.2% |
| Puerto Rican | 28 | 1.5% |
| Russian | 26 | 1.4% |
| Scandinavian | 66 | 3.6% |
| Scotch-Irish | 33 | 1.8% |
| Scottish | 110 | 6.0% |
| Slovene | 14 | 0.8% |
| South American | 45 | 2.5% |
| Swedish | 33 | 1.8% |
| Swiss | 12 | 0.6% |
| Trinidadian and Tobagonian | 6 | 0.3% |
| Ukrainian | 57 | 3.1% |
| Welsh | 36 | 2.0% | View All 40 Rows |
Immigrants in Dryden
The most numerous immigrant groups reported in Dryden came from Europe (52 | 2.8%), Northern Europe (28 | 1.5%), Canada (18 | 1.0%), Eastern Europe (18 | 1.0%), and Croatia (14 | 0.8%), together accounting for 7.1% of all Dryden residents.
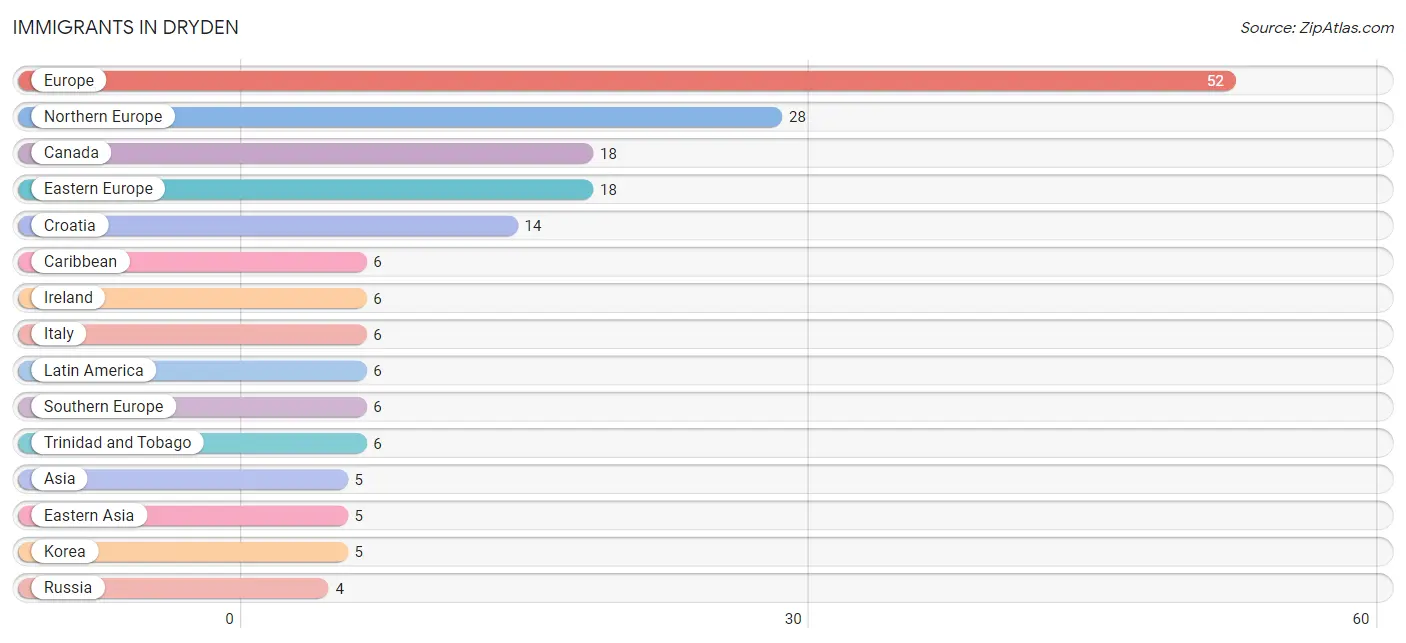
| Immigration Origin | # Population | % Population |
| Asia | 5 | 0.3% |
| Canada | 18 | 1.0% |
| Caribbean | 6 | 0.3% |
| Croatia | 14 | 0.8% |
| Eastern Asia | 5 | 0.3% |
| Eastern Europe | 18 | 1.0% |
| Europe | 52 | 2.8% |
| Ireland | 6 | 0.3% |
| Italy | 6 | 0.3% |
| Korea | 5 | 0.3% |
| Latin America | 6 | 0.3% |
| Northern Europe | 28 | 1.5% |
| Russia | 4 | 0.2% |
| Southern Europe | 6 | 0.3% |
| Trinidad and Tobago | 6 | 0.3% | View All 15 Rows |
Sex and Age in Dryden
Sex and Age in Dryden
The most populous age groups in Dryden are 60 to 64 Years (85 | 10.6%) for men and 65 to 69 Years (97 | 9.3%) for women.
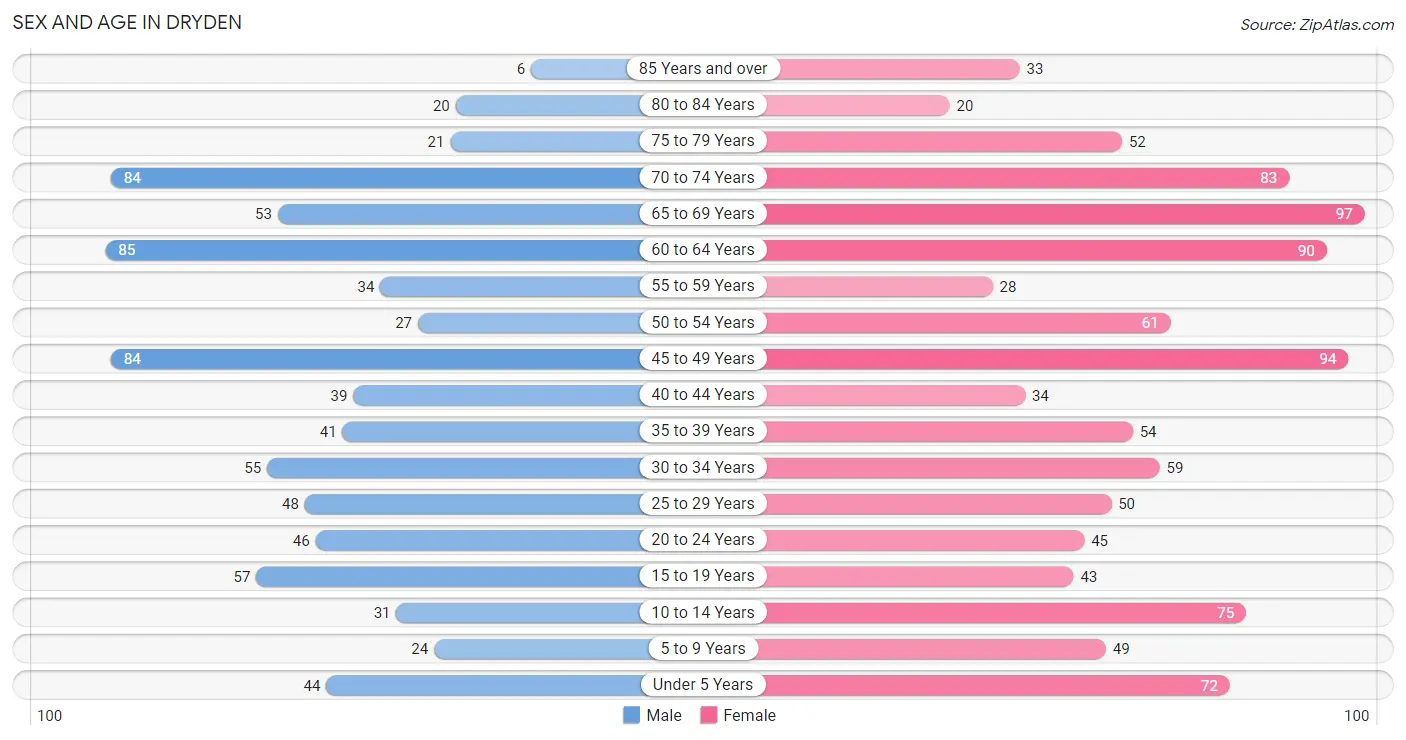
| Age Bracket | Male | Female |
| Under 5 Years | 44 (5.5%) | 72 (6.9%) |
| 5 to 9 Years | 24 (3.0%) | 49 (4.7%) |
| 10 to 14 Years | 31 (3.9%) | 75 (7.2%) |
| 15 to 19 Years | 57 (7.1%) | 43 (4.1%) |
| 20 to 24 Years | 46 (5.8%) | 45 (4.3%) |
| 25 to 29 Years | 48 (6.0%) | 50 (4.8%) |
| 30 to 34 Years | 55 (6.9%) | 59 (5.7%) |
| 35 to 39 Years | 41 (5.1%) | 54 (5.2%) |
| 40 to 44 Years | 39 (4.9%) | 34 (3.3%) |
| 45 to 49 Years | 84 (10.5%) | 94 (9.0%) |
| 50 to 54 Years | 27 (3.4%) | 61 (5.9%) |
| 55 to 59 Years | 34 (4.3%) | 28 (2.7%) |
| 60 to 64 Years | 85 (10.6%) | 90 (8.7%) |
| 65 to 69 Years | 53 (6.6%) | 97 (9.3%) |
| 70 to 74 Years | 84 (10.5%) | 83 (8.0%) |
| 75 to 79 Years | 21 (2.6%) | 52 (5.0%) |
| 80 to 84 Years | 20 (2.5%) | 20 (1.9%) |
| 85 Years and over | 6 (0.7%) | 33 (3.2%) |
| Total | 799 (100.0%) | 1,039 (100.0%) |
Families and Households in Dryden
Median Family Size in Dryden
The median family size in Dryden is 2.57 persons per family, with single female/mother families (87 | 17.3%) accounting for the largest median family size of 2.99 persons per family. On the other hand, single male/father families (63 | 12.6%) represent the smallest median family size with 1.87 persons per family.
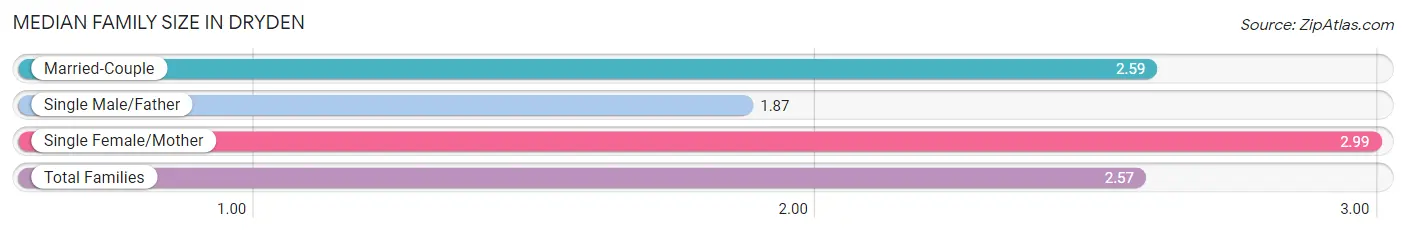
| Family Type | # Families | Family Size |
| Married-Couple | 352 (70.1%) | 2.59 |
| Single Male/Father | 63 (12.6%) | 1.87 |
| Single Female/Mother | 87 (17.3%) | 2.99 |
| Total Families | 502 (100.0%) | 2.57 |
Median Household Size in Dryden
The median household size in Dryden is 1.99 persons per household, with single female/mother households (87 | 9.6%) accounting for the largest median household size of 3.25 persons per household. non-family households (409 | 44.9%) represent the smallest median household size with 1.14 persons per household.
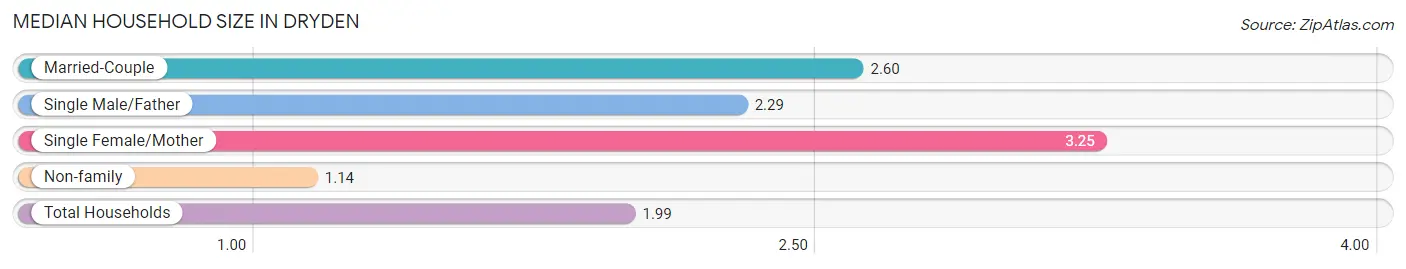
| Household Type | # Households | Household Size |
| Married-Couple | 352 (38.6%) | 2.60 |
| Single Male/Father | 63 (6.9%) | 2.29 |
| Single Female/Mother | 87 (9.6%) | 3.25 |
| Non-family | 409 (44.9%) | 1.14 |
| Total Households | 911 (100.0%) | 1.99 |
Household Size by Marriage Status in Dryden
Out of a total of 911 households in Dryden, 502 (55.1%) are family households, while 409 (44.9%) are nonfamily households. The most numerous type of family households are 2-person households, comprising 273, and the most common type of nonfamily households are 1-person households, comprising 348.
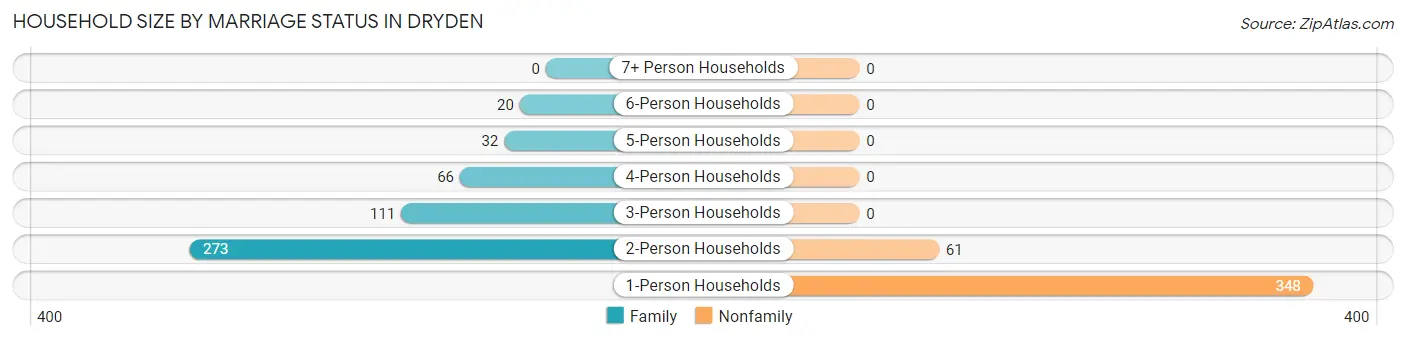
| Household Size | Family Households | Nonfamily Households |
| 1-Person Households | - | 348 (38.2%) |
| 2-Person Households | 273 (30.0%) | 61 (6.7%) |
| 3-Person Households | 111 (12.2%) | 0 (0.0%) |
| 4-Person Households | 66 (7.2%) | 0 (0.0%) |
| 5-Person Households | 32 (3.5%) | 0 (0.0%) |
| 6-Person Households | 20 (2.2%) | 0 (0.0%) |
| 7+ Person Households | 0 (0.0%) | 0 (0.0%) |
| Total | 502 (55.1%) | 409 (44.9%) |
Female Fertility in Dryden
Fertility by Age in Dryden
Average fertility rate in Dryden is 34.0 births per 1,000 women. Women in the age bracket of 20 to 34 years have the highest fertility rate with 91.0 births per 1,000 women. Women in the age bracket of 20 to 34 years acount for 100.0% of all women with births.
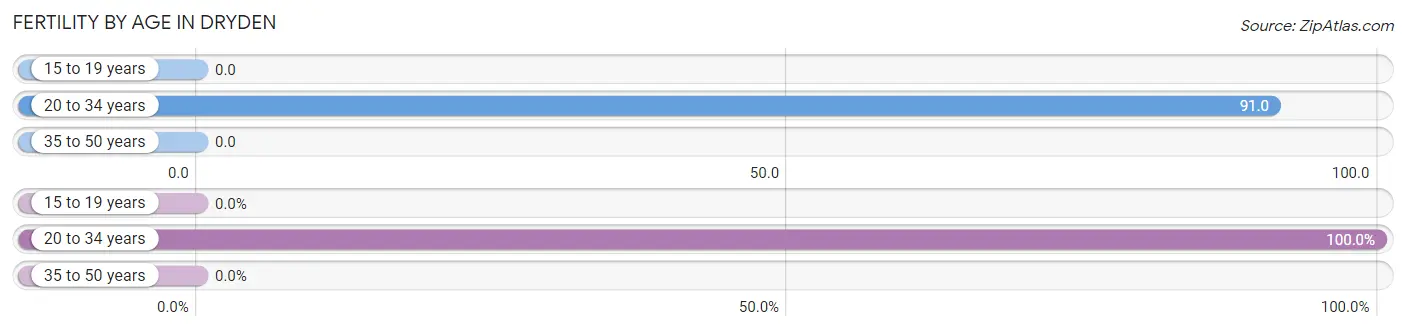
| Age Bracket | Women with Births | Births / 1,000 Women |
| 15 to 19 years | 0 (0.0%) | 0.0 |
| 20 to 34 years | 14 (100.0%) | 91.0 |
| 35 to 50 years | 0 (0.0%) | 0.0 |
| Total | 14 (100.0%) | 34.0 |
Fertility by Age by Marriage Status in Dryden
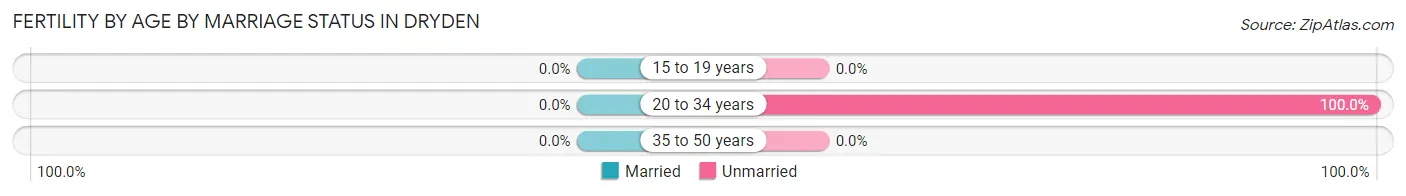
| Age Bracket | Married | Unmarried |
| 15 to 19 years | 0 (0.0%) | 0 (0.0%) |
| 20 to 34 years | 0 (0.0%) | 14 (100.0%) |
| 35 to 50 years | 0 (0.0%) | 0 (0.0%) |
| Total | 0 (0.0%) | 14 (100.0%) |
Fertility by Education in Dryden
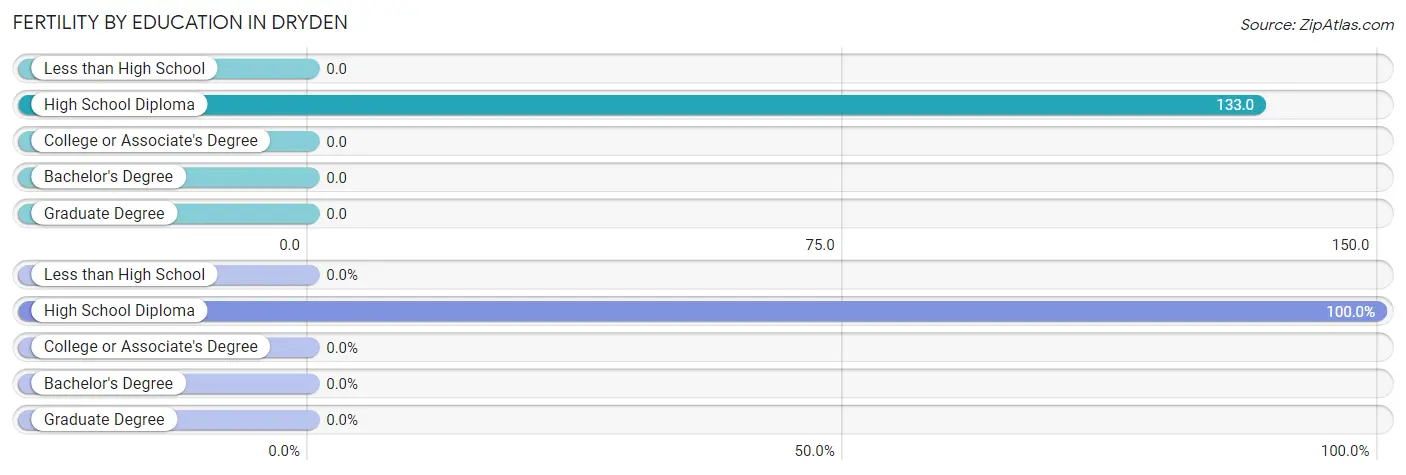
| Educational Attainment | Women with Births | Births / 1,000 Women |
| Less than High School | 0 (0.0%) | 0.0 |
| High School Diploma | 14 (100.0%) | 133.0 |
| College or Associate's Degree | 0 (0.0%) | 0.0 |
| Bachelor's Degree | 0 (0.0%) | 0.0 |
| Graduate Degree | 0 (0.0%) | 0.0 |
| Total | 14 (100.0%) | 34.0 |
Fertility by Education by Marriage Status in Dryden
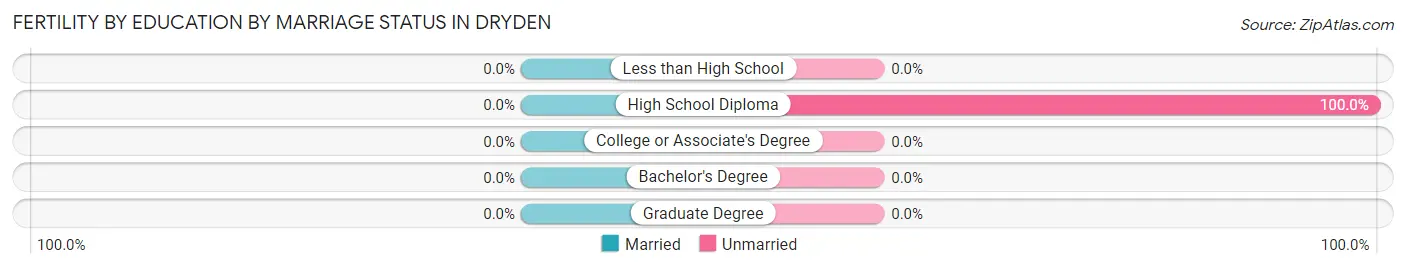
| Educational Attainment | Married | Unmarried |
| Less than High School | 0 (0.0%) | 0 (0.0%) |
| High School Diploma | 0 (0.0%) | 14 (100.0%) |
| College or Associate's Degree | 0 (0.0%) | 0 (0.0%) |
| Bachelor's Degree | 0 (0.0%) | 0 (0.0%) |
| Graduate Degree | 0 (0.0%) | 0 (0.0%) |
| Total | 0 (0.0%) | 14 (100.0%) |
Employment Characteristics in Dryden
Employment by Class of Employer in Dryden
Among the 802 employed individuals in Dryden, private company employees (411 | 51.2%), not-for-profit organizations (174 | 21.7%), and self-employed (incorporated) (59 | 7.4%) make up the most common classes of employment.
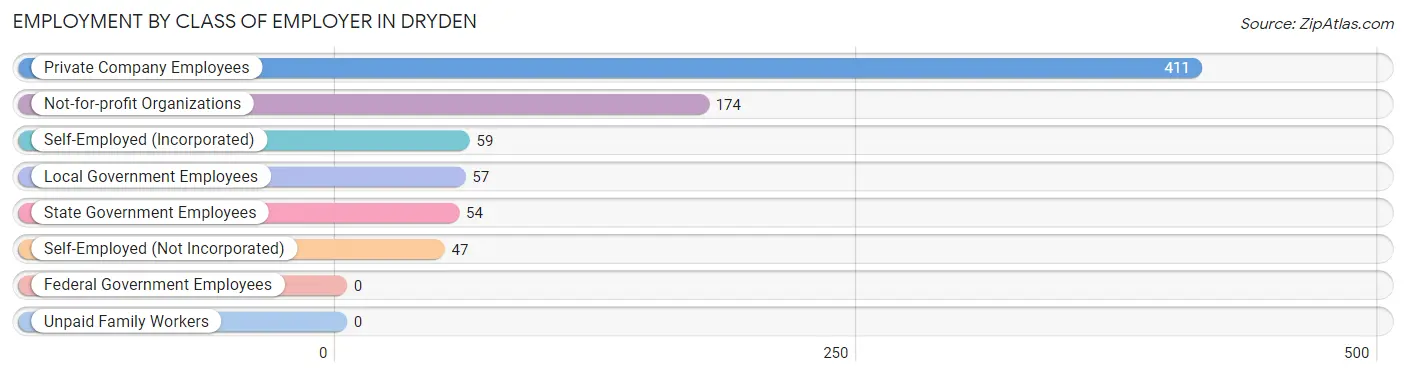
| Employer Class | # Employees | % Employees |
| Private Company Employees | 411 | 51.2% |
| Self-Employed (Incorporated) | 59 | 7.4% |
| Self-Employed (Not Incorporated) | 47 | 5.9% |
| Not-for-profit Organizations | 174 | 21.7% |
| Local Government Employees | 57 | 7.1% |
| State Government Employees | 54 | 6.7% |
| Federal Government Employees | 0 | 0.0% |
| Unpaid Family Workers | 0 | 0.0% |
| Total | 802 | 100.0% |
Employment Status by Age in Dryden
According to the labor force statistics for Dryden, out of the total population over 16 years of age (1,528), 56.8% or 868 individuals are in the labor force, with 5.4% or 47 of them unemployed. The age group with the highest labor force participation rate is 35 to 44 years, with 88.7% or 149 individuals in the labor force. Within the labor force, the 20 to 24 years age range has the highest percentage of unemployed individuals, with 17.9% or 14 of them being unemployed.
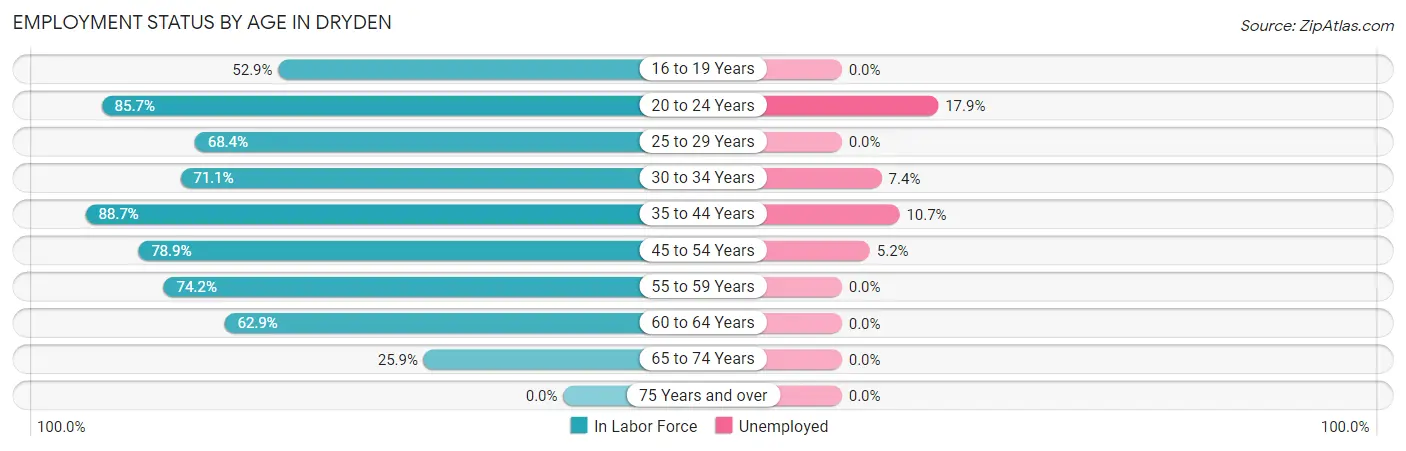
| Age Bracket | In Labor Force | Unemployed |
| 16 to 19 Years | 45 (52.9%) | 0 (0.0%) |
| 20 to 24 Years | 78 (85.7%) | 14 (17.9%) |
| 25 to 29 Years | 67 (68.4%) | 0 (0.0%) |
| 30 to 34 Years | 81 (71.1%) | 6 (7.4%) |
| 35 to 44 Years | 149 (88.7%) | 16 (10.7%) |
| 45 to 54 Years | 210 (78.9%) | 11 (5.2%) |
| 55 to 59 Years | 46 (74.2%) | 0 (0.0%) |
| 60 to 64 Years | 110 (62.9%) | 0 (0.0%) |
| 65 to 74 Years | 82 (25.9%) | 0 (0.0%) |
| 75 Years and over | 0 (0.0%) | 0 (0.0%) |
| Total | 868 (56.8%) | 47 (5.4%) |
Employment Status by Educational Attainment in Dryden
According to labor force statistics for Dryden, 75.1% of individuals (663) out of the total population between 25 and 64 years of age (883) are in the labor force, with 5.0% or 33 of them being unemployed. The group with the highest labor force participation rate are those with the educational attainment of bachelor's degree or higher, with 84.4% or 379 individuals in the labor force. Within the labor force, individuals with college / associate degree education have the highest percentage of unemployment, with 9.5% or 19 of them being unemployed.
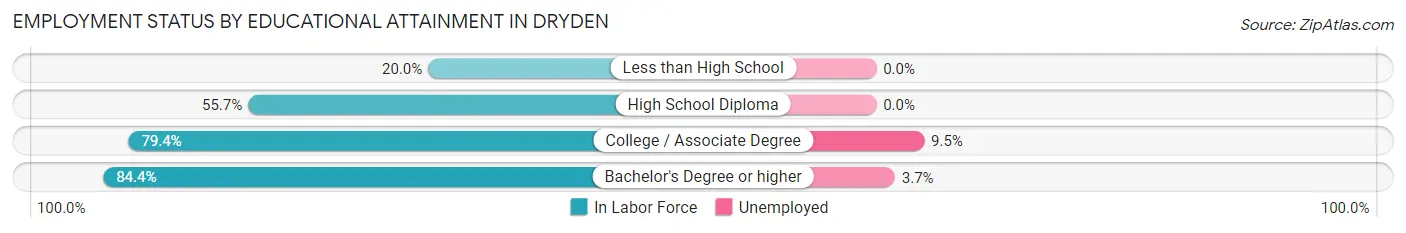
| Educational Attainment | In Labor Force | Unemployed |
| Less than High School | 10 (20.0%) | 0 (0.0%) |
| High School Diploma | 73 (55.7%) | 0 (0.0%) |
| College / Associate Degree | 201 (79.4%) | 24 (9.5%) |
| Bachelor's Degree or higher | 379 (84.4%) | 17 (3.7%) |
| Total | 663 (75.1%) | 44 (5.0%) |
Employment Occupations by Sex in Dryden
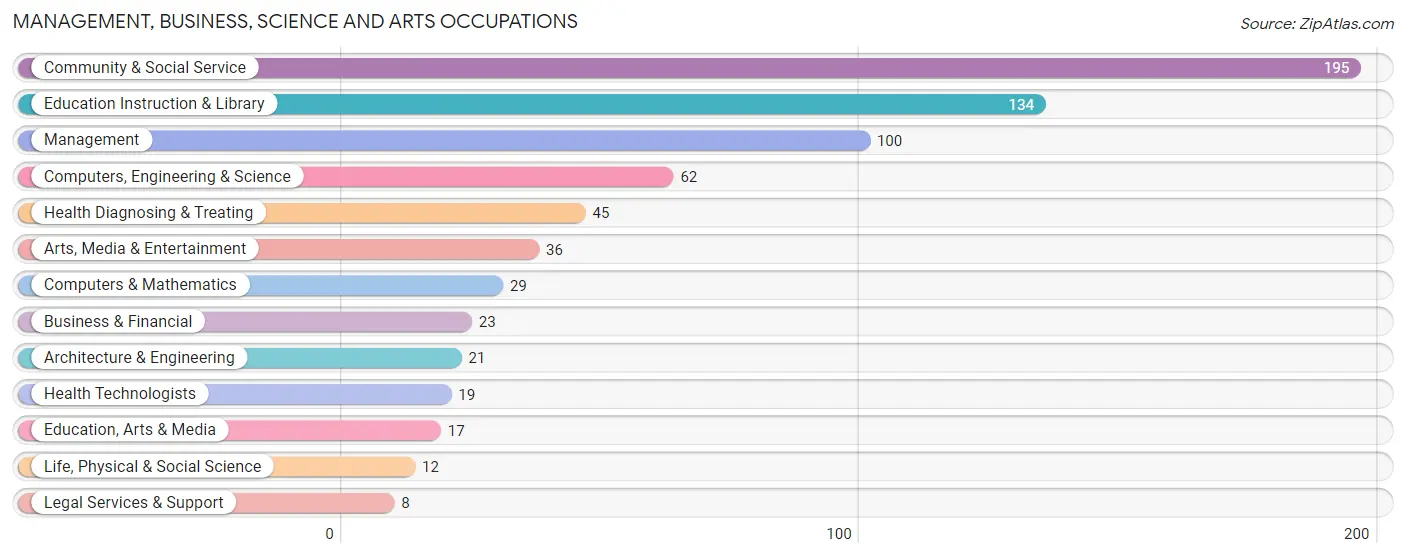
Management, Business, Science and Arts Occupations
The most common Management, Business, Science and Arts occupations in Dryden are Community & Social Service (195 | 23.7%), Education Instruction & Library (134 | 16.3%), Management (100 | 12.2%), Computers, Engineering & Science (62 | 7.5%), and Health Diagnosing & Treating (45 | 5.5%).
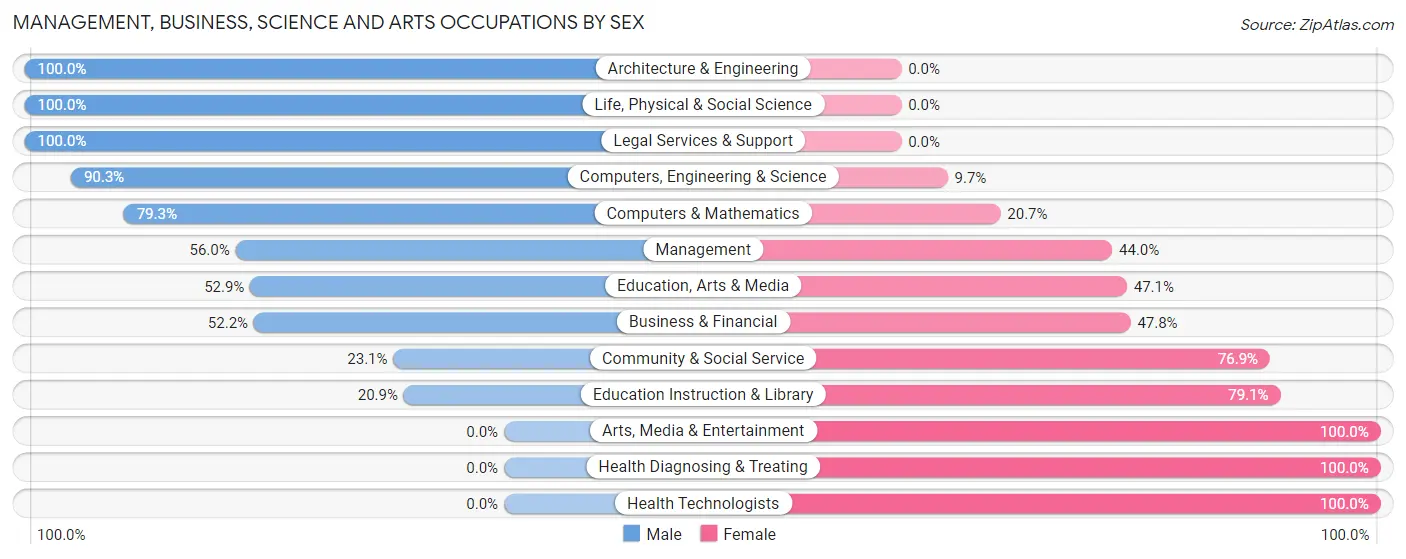
Management, Business, Science and Arts Occupations by Sex
Within the Management, Business, Science and Arts occupations in Dryden, the most male-oriented occupations are Architecture & Engineering (100.0%), Life, Physical & Social Science (100.0%), and Legal Services & Support (100.0%), while the most female-oriented occupations are Arts, Media & Entertainment (100.0%), Health Diagnosing & Treating (100.0%), and Health Technologists (100.0%).
| Occupation | Male | Female |
| Management | 56 (56.0%) | 44 (44.0%) |
| Business & Financial | 12 (52.2%) | 11 (47.8%) |
| Computers, Engineering & Science | 56 (90.3%) | 6 (9.7%) |
| Computers & Mathematics | 23 (79.3%) | 6 (20.7%) |
| Architecture & Engineering | 21 (100.0%) | 0 (0.0%) |
| Life, Physical & Social Science | 12 (100.0%) | 0 (0.0%) |
| Community & Social Service | 45 (23.1%) | 150 (76.9%) |
| Education, Arts & Media | 9 (52.9%) | 8 (47.1%) |
| Legal Services & Support | 8 (100.0%) | 0 (0.0%) |
| Education Instruction & Library | 28 (20.9%) | 106 (79.1%) |
| Arts, Media & Entertainment | 0 (0.0%) | 36 (100.0%) |
| Health Diagnosing & Treating | 0 (0.0%) | 45 (100.0%) |
| Health Technologists | 0 (0.0%) | 19 (100.0%) |
| Total (Category) | 169 (39.8%) | 256 (60.2%) |
| Total (Overall) | 428 (52.1%) | 393 (47.9%) |
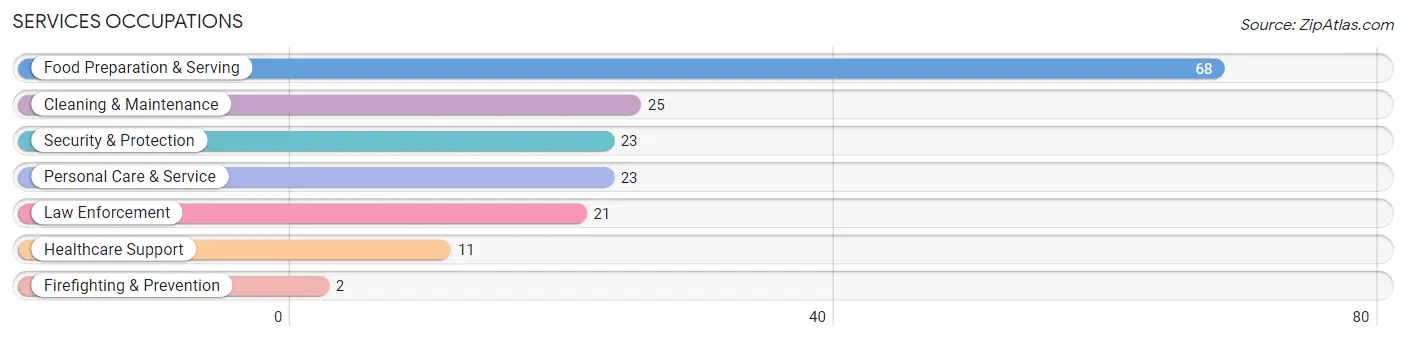
Services Occupations
The most common Services occupations in Dryden are Food Preparation & Serving (68 | 8.3%), Cleaning & Maintenance (25 | 3.0%), Security & Protection (23 | 2.8%), Personal Care & Service (23 | 2.8%), and Law Enforcement (21 | 2.6%).
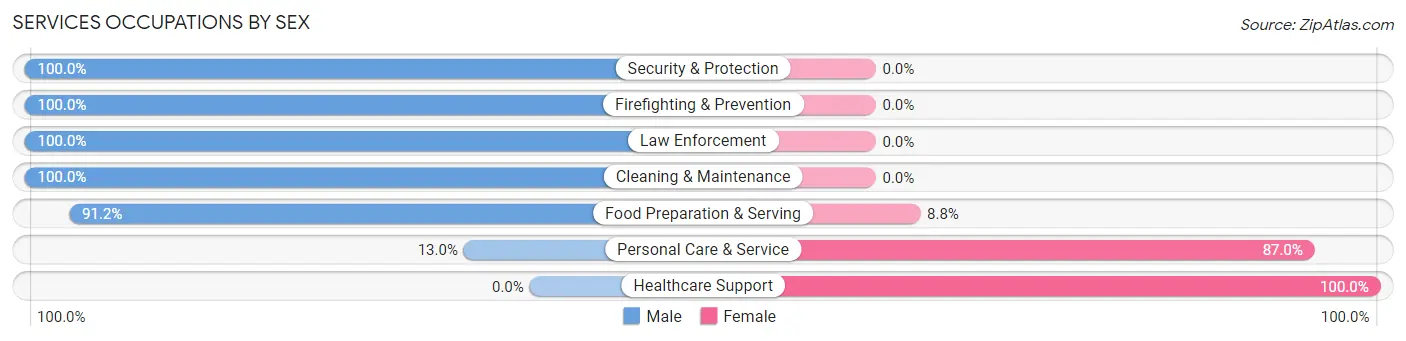
Services Occupations by Sex
Within the Services occupations in Dryden, the most male-oriented occupations are Security & Protection (100.0%), Firefighting & Prevention (100.0%), and Law Enforcement (100.0%), while the most female-oriented occupations are Healthcare Support (100.0%), Personal Care & Service (87.0%), and Food Preparation & Serving (8.8%).
| Occupation | Male | Female |
| Healthcare Support | 0 (0.0%) | 11 (100.0%) |
| Security & Protection | 23 (100.0%) | 0 (0.0%) |
| Firefighting & Prevention | 2 (100.0%) | 0 (0.0%) |
| Law Enforcement | 21 (100.0%) | 0 (0.0%) |
| Food Preparation & Serving | 62 (91.2%) | 6 (8.8%) |
| Cleaning & Maintenance | 25 (100.0%) | 0 (0.0%) |
| Personal Care & Service | 3 (13.0%) | 20 (87.0%) |
| Total (Category) | 113 (75.3%) | 37 (24.7%) |
| Total (Overall) | 428 (52.1%) | 393 (47.9%) |
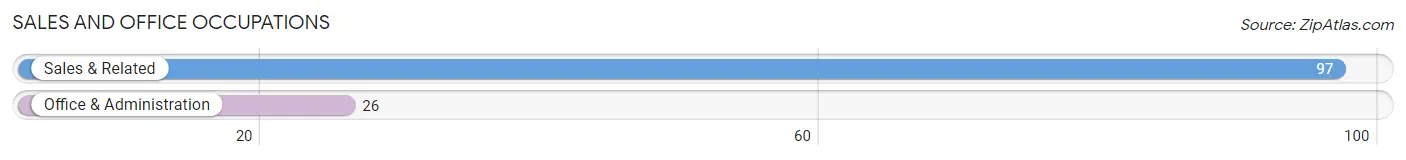
Sales and Office Occupations
The most common Sales and Office occupations in Dryden are Sales & Related (97 | 11.8%), and Office & Administration (26 | 3.2%).
Sales and Office Occupations by Sex
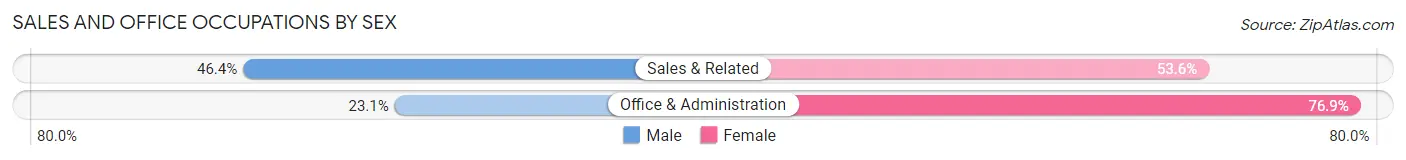
| Occupation | Male | Female |
| Sales & Related | 45 (46.4%) | 52 (53.6%) |
| Office & Administration | 6 (23.1%) | 20 (76.9%) |
| Total (Category) | 51 (41.5%) | 72 (58.5%) |
| Total (Overall) | 428 (52.1%) | 393 (47.9%) |
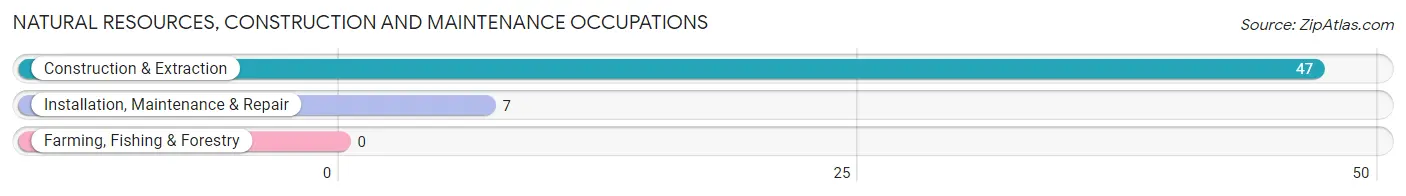
Natural Resources, Construction and Maintenance Occupations
The most common Natural Resources, Construction and Maintenance occupations in Dryden are Construction & Extraction (47 | 5.7%), and Installation, Maintenance & Repair (7 | 0.9%).
Natural Resources, Construction and Maintenance Occupations by Sex
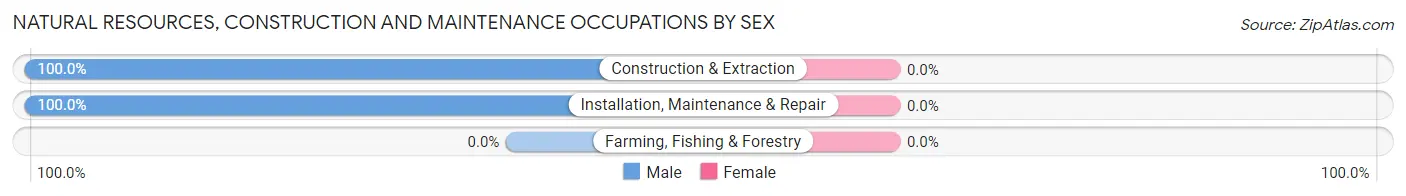
| Occupation | Male | Female |
| Farming, Fishing & Forestry | 0 (0.0%) | 0 (0.0%) |
| Construction & Extraction | 47 (100.0%) | 0 (0.0%) |
| Installation, Maintenance & Repair | 7 (100.0%) | 0 (0.0%) |
| Total (Category) | 54 (100.0%) | 0 (0.0%) |
| Total (Overall) | 428 (52.1%) | 393 (47.9%) |
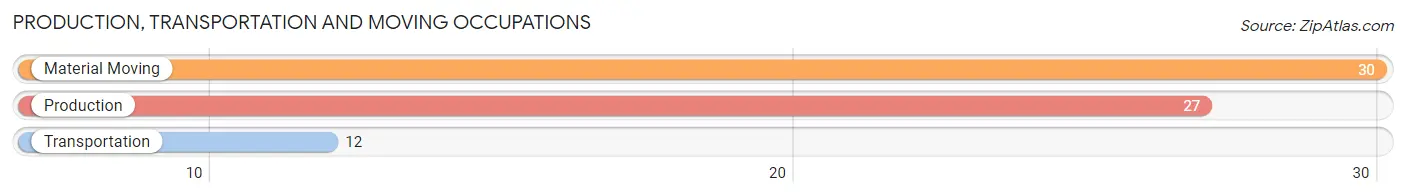
Production, Transportation and Moving Occupations
The most common Production, Transportation and Moving occupations in Dryden are Material Moving (30 | 3.6%), Production (27 | 3.3%), and Transportation (12 | 1.5%).
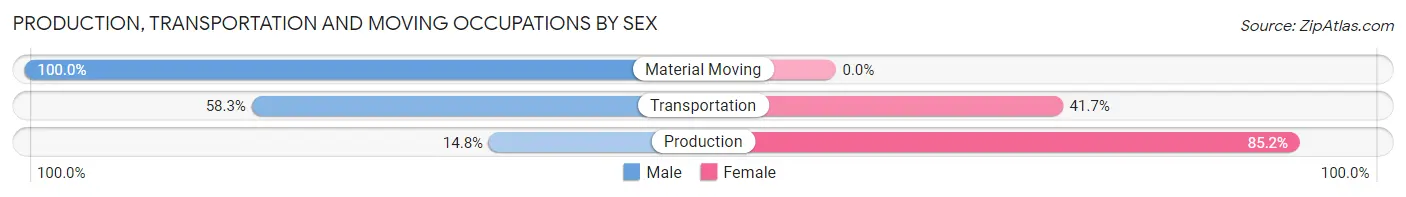
Production, Transportation and Moving Occupations by Sex
| Occupation | Male | Female |
| Production | 4 (14.8%) | 23 (85.2%) |
| Transportation | 7 (58.3%) | 5 (41.7%) |
| Material Moving | 30 (100.0%) | 0 (0.0%) |
| Total (Category) | 41 (59.4%) | 28 (40.6%) |
| Total (Overall) | 428 (52.1%) | 393 (47.9%) |
Employment Industries by Sex in Dryden
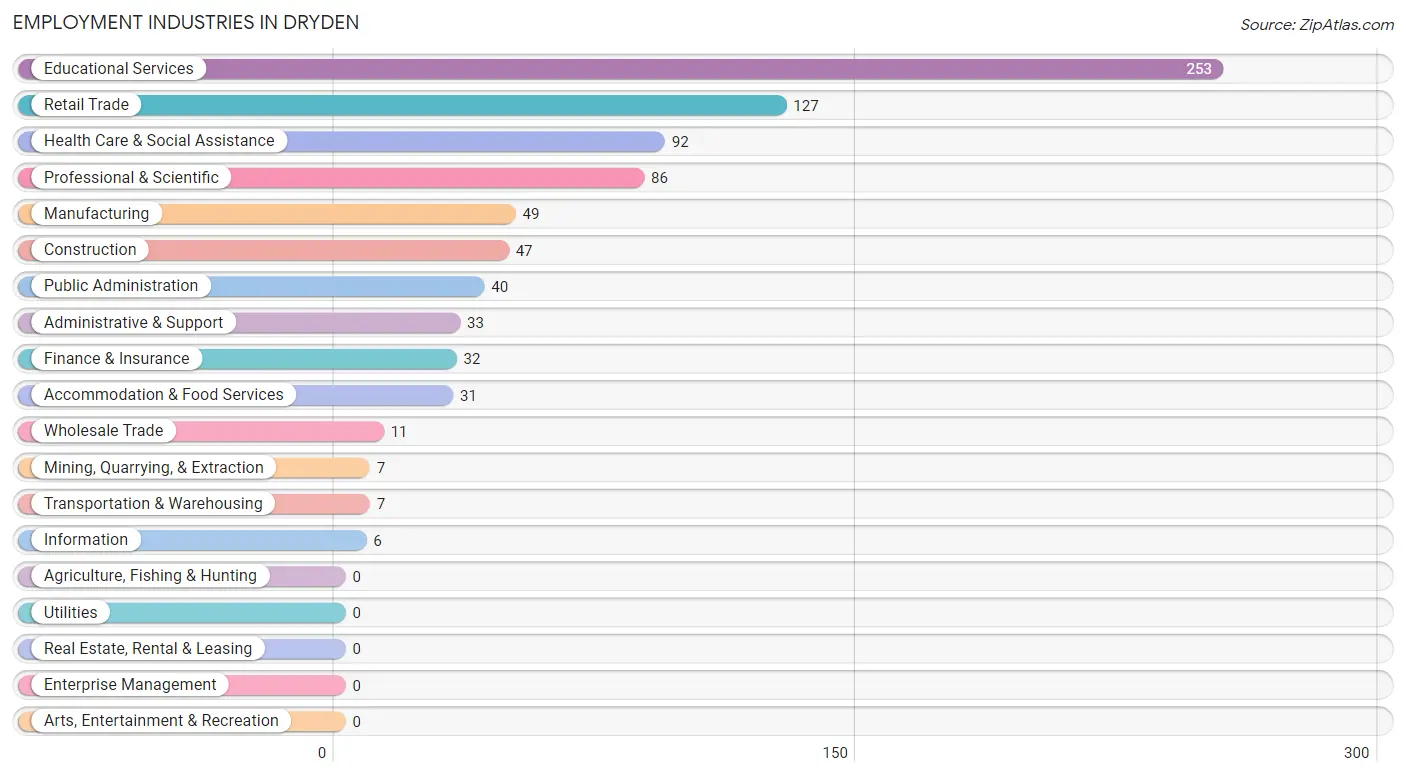
Employment Industries in Dryden
The major employment industries in Dryden include Educational Services (253 | 30.8%), Retail Trade (127 | 15.5%), Health Care & Social Assistance (92 | 11.2%), Professional & Scientific (86 | 10.5%), and Manufacturing (49 | 6.0%).
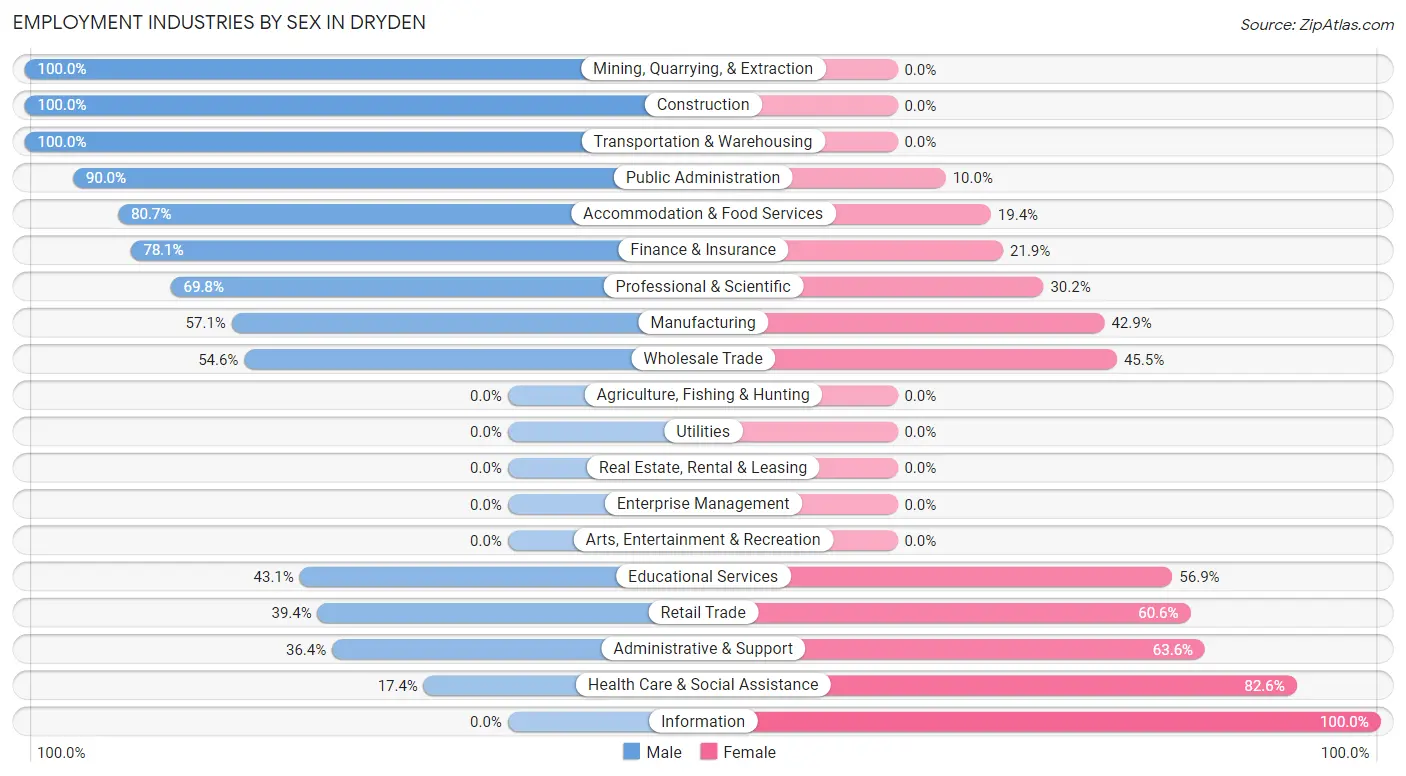
Employment Industries by Sex in Dryden
The Dryden industries that see more men than women are Mining, Quarrying, & Extraction (100.0%), Construction (100.0%), and Transportation & Warehousing (100.0%), whereas the industries that tend to have a higher number of women are Information (100.0%), Health Care & Social Assistance (82.6%), and Administrative & Support (63.6%).
| Industry | Male | Female |
| Agriculture, Fishing & Hunting | 0 (0.0%) | 0 (0.0%) |
| Mining, Quarrying, & Extraction | 7 (100.0%) | 0 (0.0%) |
| Construction | 47 (100.0%) | 0 (0.0%) |
| Manufacturing | 28 (57.1%) | 21 (42.9%) |
| Wholesale Trade | 6 (54.5%) | 5 (45.5%) |
| Retail Trade | 50 (39.4%) | 77 (60.6%) |
| Transportation & Warehousing | 7 (100.0%) | 0 (0.0%) |
| Utilities | 0 (0.0%) | 0 (0.0%) |
| Information | 0 (0.0%) | 6 (100.0%) |
| Finance & Insurance | 25 (78.1%) | 7 (21.9%) |
| Real Estate, Rental & Leasing | 0 (0.0%) | 0 (0.0%) |
| Professional & Scientific | 60 (69.8%) | 26 (30.2%) |
| Enterprise Management | 0 (0.0%) | 0 (0.0%) |
| Administrative & Support | 12 (36.4%) | 21 (63.6%) |
| Educational Services | 109 (43.1%) | 144 (56.9%) |
| Health Care & Social Assistance | 16 (17.4%) | 76 (82.6%) |
| Arts, Entertainment & Recreation | 0 (0.0%) | 0 (0.0%) |
| Accommodation & Food Services | 25 (80.6%) | 6 (19.4%) |
| Public Administration | 36 (90.0%) | 4 (10.0%) |
| Total | 428 (52.1%) | 393 (47.9%) |
Education in Dryden
School Enrollment in Dryden
The most common levels of schooling among the 363 students in Dryden are middle school (90 | 24.8%), college / undergraduate (90 | 24.8%), and high school (82 | 22.6%).
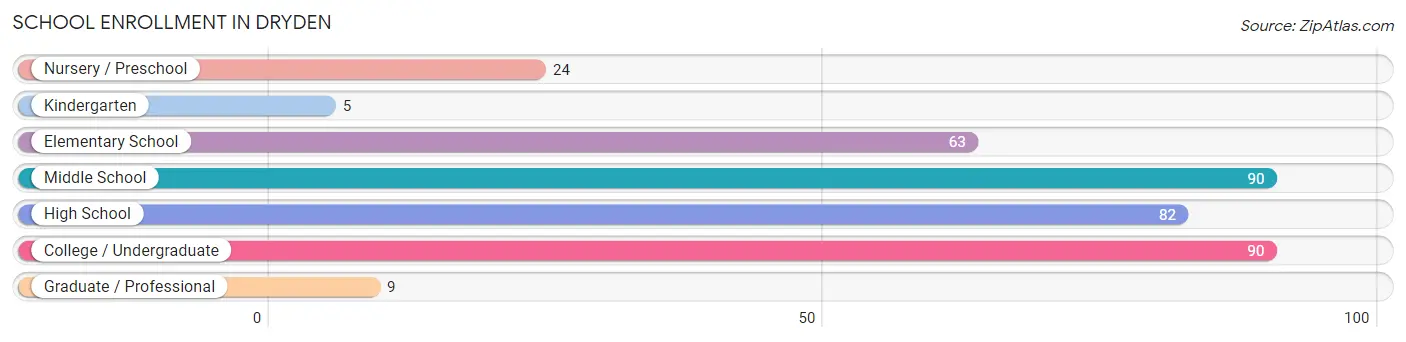
| School Level | # Students | % Students |
| Nursery / Preschool | 24 | 6.6% |
| Kindergarten | 5 | 1.4% |
| Elementary School | 63 | 17.4% |
| Middle School | 90 | 24.8% |
| High School | 82 | 22.6% |
| College / Undergraduate | 90 | 24.8% |
| Graduate / Professional | 9 | 2.5% |
| Total | 363 | 100.0% |
School Enrollment by Age by Funding Source in Dryden
Out of a total of 363 students who are enrolled in schools in Dryden, 31 (8.5%) attend a private institution, while the remaining 332 (91.5%) are enrolled in public schools. The age group of 35 years and over has the highest likelihood of being enrolled in private schools, with 10 (38.5% in the age bracket) enrolled. Conversely, the age group of 3 to 4 year olds has the lowest likelihood of being enrolled in a private school, with 24 (100.0% in the age bracket) attending a public institution.
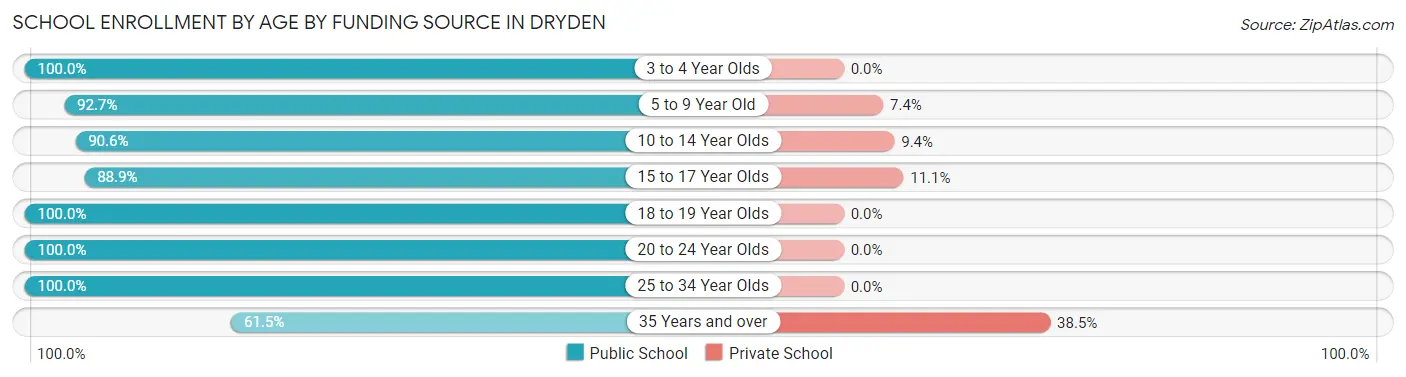
| Age Bracket | Public School | Private School |
| 3 to 4 Year Olds | 24 (100.0%) | 0 (0.0%) |
| 5 to 9 Year Old | 63 (92.6%) | 5 (7.3%) |
| 10 to 14 Year Olds | 96 (90.6%) | 10 (9.4%) |
| 15 to 17 Year Olds | 48 (88.9%) | 6 (11.1%) |
| 18 to 19 Year Olds | 39 (100.0%) | 0 (0.0%) |
| 20 to 24 Year Olds | 30 (100.0%) | 0 (0.0%) |
| 25 to 34 Year Olds | 16 (100.0%) | 0 (0.0%) |
| 35 Years and over | 16 (61.5%) | 10 (38.5%) |
| Total | 332 (91.5%) | 31 (8.5%) |
Educational Attainment by Field of Study in Dryden
Visual & performing arts (100 | 15.2%), arts & humanities (70 | 10.6%), science & technology (67 | 10.2%), business (62 | 9.4%), and education (61 | 9.3%) are the most common fields of study among 657 individuals in Dryden who have obtained a bachelor's degree or higher.
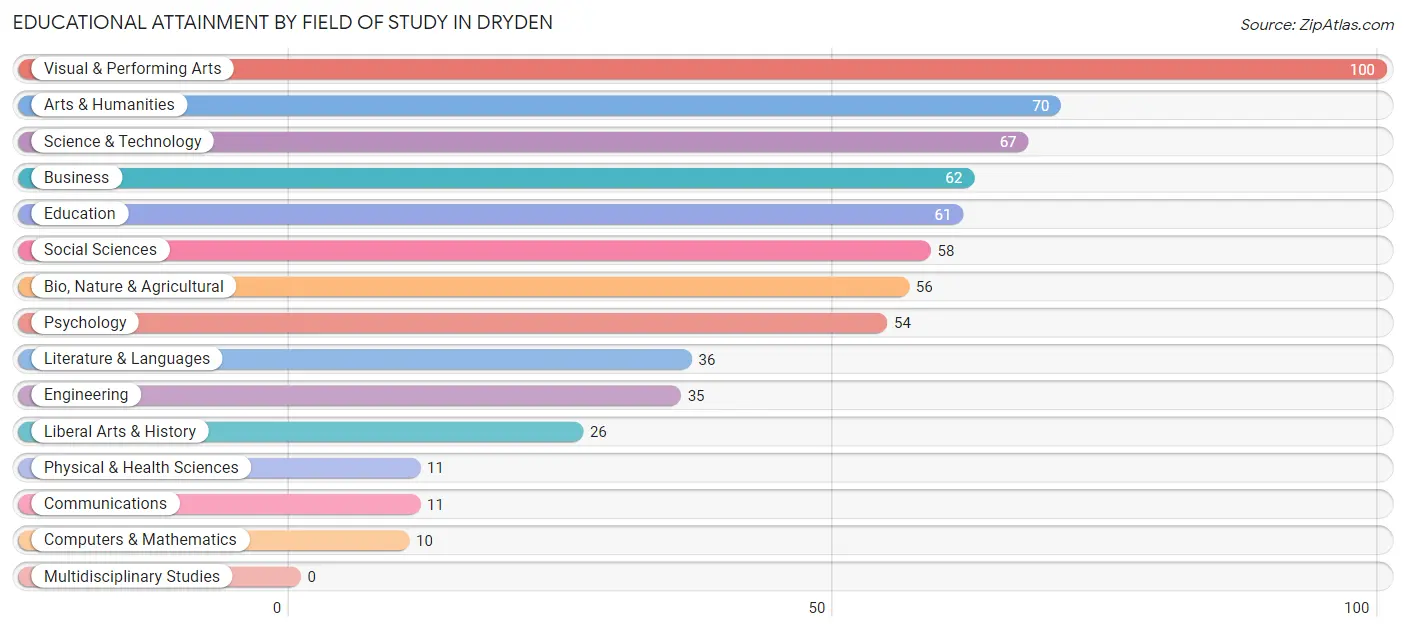
| Field of Study | # Graduates | % Graduates |
| Computers & Mathematics | 10 | 1.5% |
| Bio, Nature & Agricultural | 56 | 8.5% |
| Physical & Health Sciences | 11 | 1.7% |
| Psychology | 54 | 8.2% |
| Social Sciences | 58 | 8.8% |
| Engineering | 35 | 5.3% |
| Multidisciplinary Studies | 0 | 0.0% |
| Science & Technology | 67 | 10.2% |
| Business | 62 | 9.4% |
| Education | 61 | 9.3% |
| Literature & Languages | 36 | 5.5% |
| Liberal Arts & History | 26 | 4.0% |
| Visual & Performing Arts | 100 | 15.2% |
| Communications | 11 | 1.7% |
| Arts & Humanities | 70 | 10.6% |
| Total | 657 | 100.0% |
Transportation & Commute in Dryden
Vehicle Availability by Sex in Dryden
The most prevalent vehicle ownership categories in Dryden are males with 2 vehicles (197, accounting for 46.0%) and females with 2 vehicles (180, making up 52.7%).
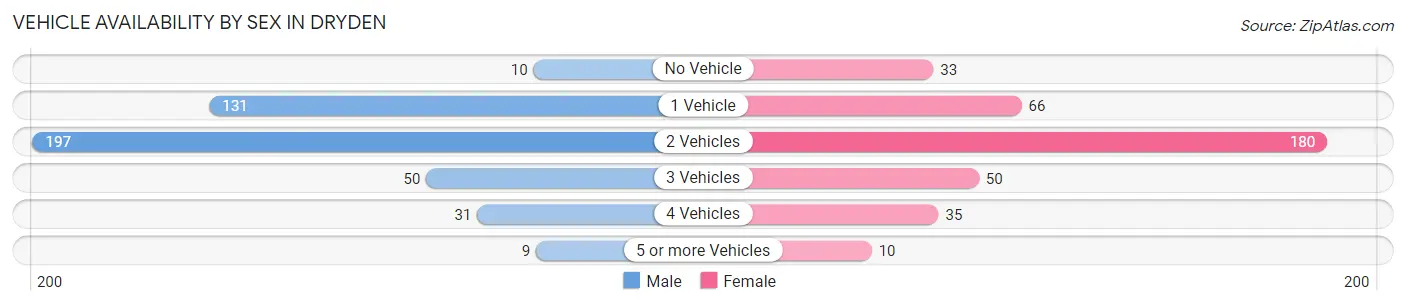
| Vehicles Available | Male | Female |
| No Vehicle | 10 (2.3%) | 33 (8.8%) |
| 1 Vehicle | 131 (30.6%) | 66 (17.6%) |
| 2 Vehicles | 197 (46.0%) | 180 (48.1%) |
| 3 Vehicles | 50 (11.7%) | 50 (13.4%) |
| 4 Vehicles | 31 (7.2%) | 35 (9.4%) |
| 5 or more Vehicles | 9 (2.1%) | 10 (2.7%) |
| Total | 428 (100.0%) | 374 (100.0%) |
Commute Time in Dryden
The most frequently occuring commute durations in Dryden are 20 to 24 minutes (168 commuters, 24.7%), 15 to 19 minutes (114 commuters, 16.8%), and 30 to 34 minutes (106 commuters, 15.6%).
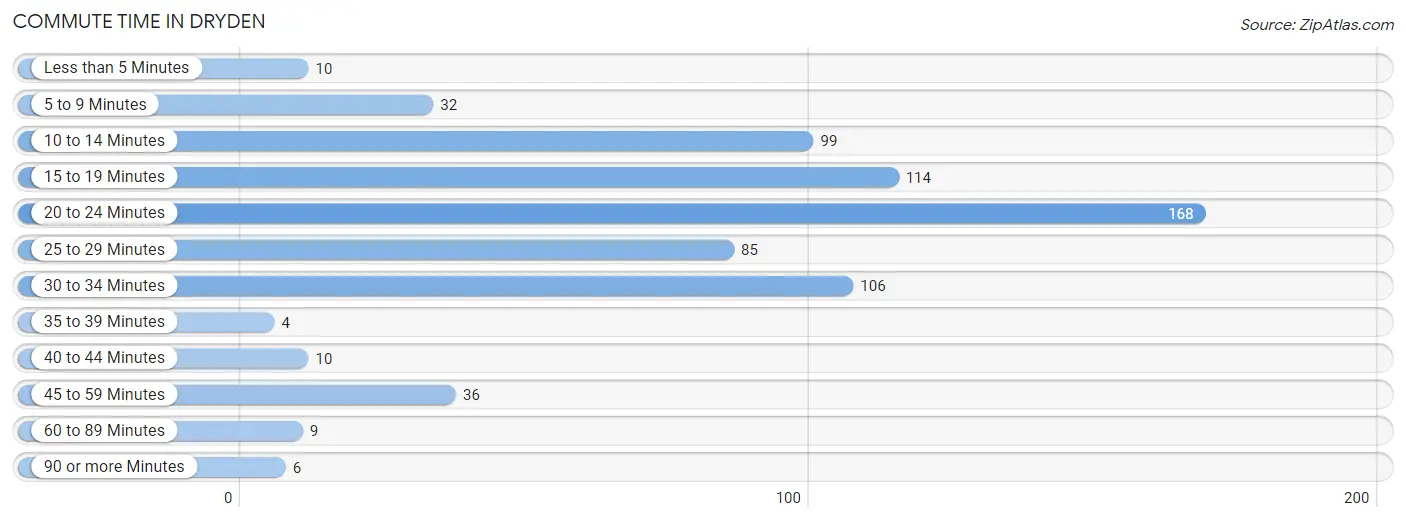
| Commute Time | # Commuters | % Commuters |
| Less than 5 Minutes | 10 | 1.5% |
| 5 to 9 Minutes | 32 | 4.7% |
| 10 to 14 Minutes | 99 | 14.6% |
| 15 to 19 Minutes | 114 | 16.8% |
| 20 to 24 Minutes | 168 | 24.7% |
| 25 to 29 Minutes | 85 | 12.5% |
| 30 to 34 Minutes | 106 | 15.6% |
| 35 to 39 Minutes | 4 | 0.6% |
| 40 to 44 Minutes | 10 | 1.5% |
| 45 to 59 Minutes | 36 | 5.3% |
| 60 to 89 Minutes | 9 | 1.3% |
| 90 or more Minutes | 6 | 0.9% |
Commute Time by Sex in Dryden
The most common commute times in Dryden are 20 to 24 minutes (83 commuters, 23.3%) for males and 20 to 24 minutes (85 commuters, 26.4%) for females.
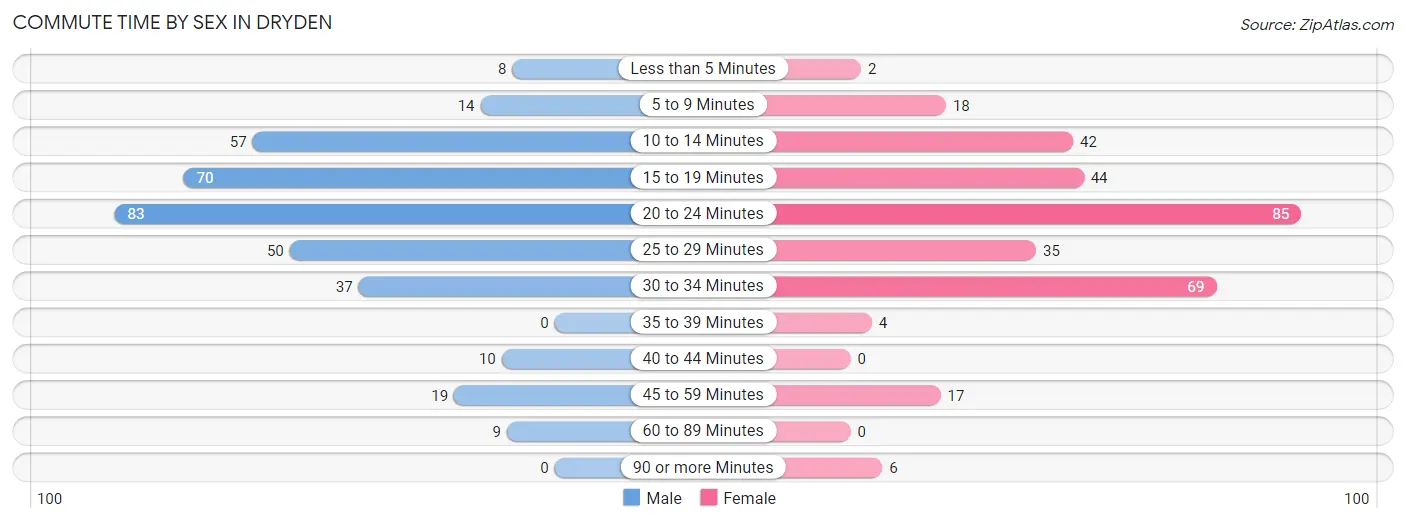
| Commute Time | Male | Female |
| Less than 5 Minutes | 8 (2.2%) | 2 (0.6%) |
| 5 to 9 Minutes | 14 (3.9%) | 18 (5.6%) |
| 10 to 14 Minutes | 57 (16.0%) | 42 (13.0%) |
| 15 to 19 Minutes | 70 (19.6%) | 44 (13.7%) |
| 20 to 24 Minutes | 83 (23.3%) | 85 (26.4%) |
| 25 to 29 Minutes | 50 (14.0%) | 35 (10.9%) |
| 30 to 34 Minutes | 37 (10.4%) | 69 (21.4%) |
| 35 to 39 Minutes | 0 (0.0%) | 4 (1.2%) |
| 40 to 44 Minutes | 10 (2.8%) | 0 (0.0%) |
| 45 to 59 Minutes | 19 (5.3%) | 17 (5.3%) |
| 60 to 89 Minutes | 9 (2.5%) | 0 (0.0%) |
| 90 or more Minutes | 0 (0.0%) | 6 (1.9%) |
Time of Departure to Work by Sex in Dryden
The most frequent times of departure to work in Dryden are 7:30 AM to 7:59 AM (89, 24.9%) for males and 8:00 AM to 8:29 AM (78, 24.2%) for females.
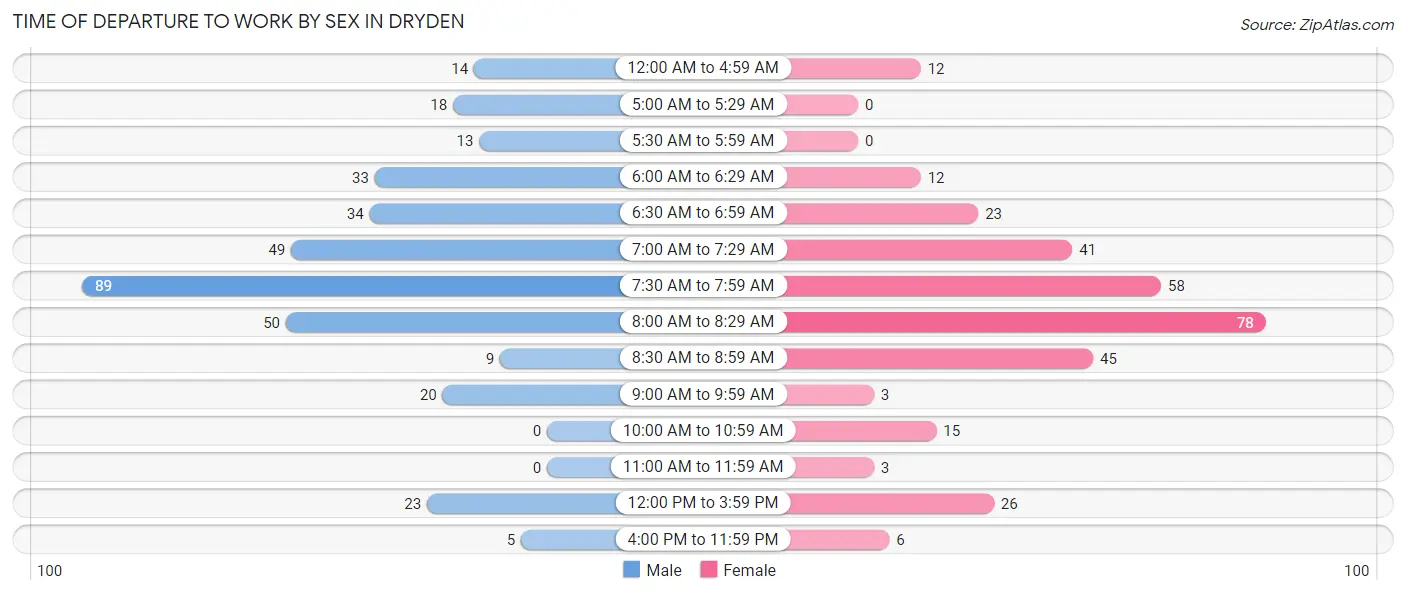
| Time of Departure | Male | Female |
| 12:00 AM to 4:59 AM | 14 (3.9%) | 12 (3.7%) |
| 5:00 AM to 5:29 AM | 18 (5.0%) | 0 (0.0%) |
| 5:30 AM to 5:59 AM | 13 (3.6%) | 0 (0.0%) |
| 6:00 AM to 6:29 AM | 33 (9.2%) | 12 (3.7%) |
| 6:30 AM to 6:59 AM | 34 (9.5%) | 23 (7.1%) |
| 7:00 AM to 7:29 AM | 49 (13.7%) | 41 (12.7%) |
| 7:30 AM to 7:59 AM | 89 (24.9%) | 58 (18.0%) |
| 8:00 AM to 8:29 AM | 50 (14.0%) | 78 (24.2%) |
| 8:30 AM to 8:59 AM | 9 (2.5%) | 45 (14.0%) |
| 9:00 AM to 9:59 AM | 20 (5.6%) | 3 (0.9%) |
| 10:00 AM to 10:59 AM | 0 (0.0%) | 15 (4.7%) |
| 11:00 AM to 11:59 AM | 0 (0.0%) | 3 (0.9%) |
| 12:00 PM to 3:59 PM | 23 (6.4%) | 26 (8.1%) |
| 4:00 PM to 11:59 PM | 5 (1.4%) | 6 (1.9%) |
| Total | 357 (100.0%) | 322 (100.0%) |
Housing Occupancy in Dryden
Occupancy by Ownership in Dryden
Of the total 911 dwellings in Dryden, owner-occupied units account for 523 (57.4%), while renter-occupied units make up 388 (42.6%).
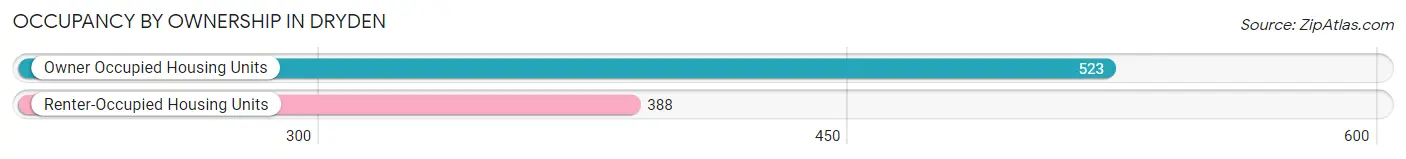
| Occupancy | # Housing Units | % Housing Units |
| Owner Occupied Housing Units | 523 | 57.4% |
| Renter-Occupied Housing Units | 388 | 42.6% |
| Total Occupied Housing Units | 911 | 100.0% |
Occupancy by Household Size in Dryden
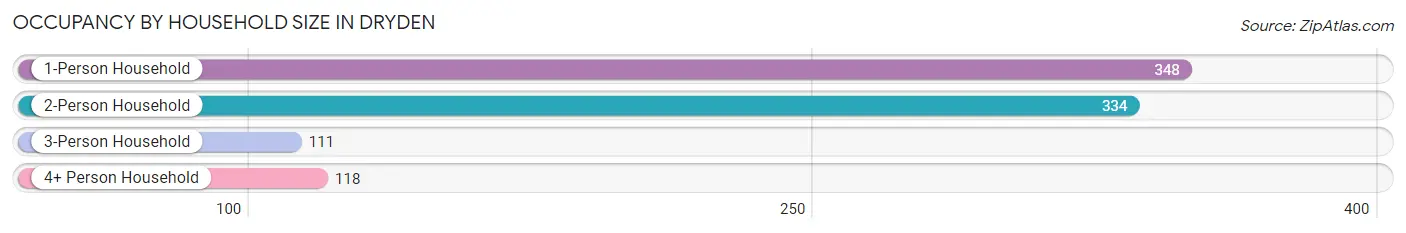
| Household Size | # Housing Units | % Housing Units |
| 1-Person Household | 348 | 38.2% |
| 2-Person Household | 334 | 36.7% |
| 3-Person Household | 111 | 12.2% |
| 4+ Person Household | 118 | 13.0% |
| Total Housing Units | 911 | 100.0% |
Occupancy by Ownership by Household Size in Dryden
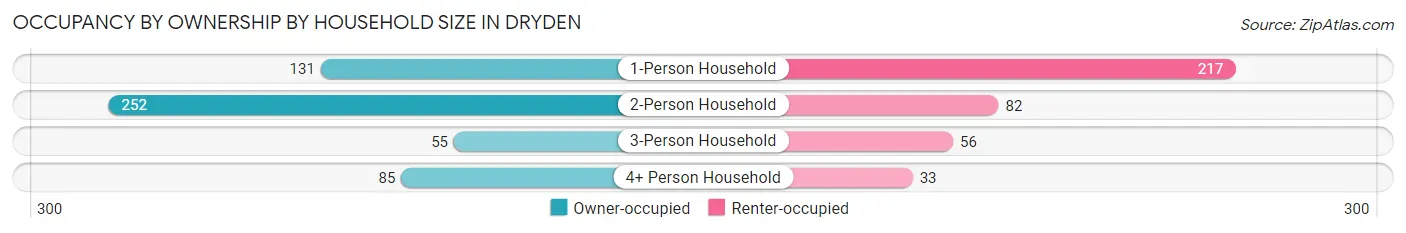
| Household Size | Owner-occupied | Renter-occupied |
| 1-Person Household | 131 (37.6%) | 217 (62.4%) |
| 2-Person Household | 252 (75.4%) | 82 (24.5%) |
| 3-Person Household | 55 (49.5%) | 56 (50.4%) |
| 4+ Person Household | 85 (72.0%) | 33 (28.0%) |
| Total Housing Units | 523 (57.4%) | 388 (42.6%) |
Occupancy by Educational Attainment in Dryden
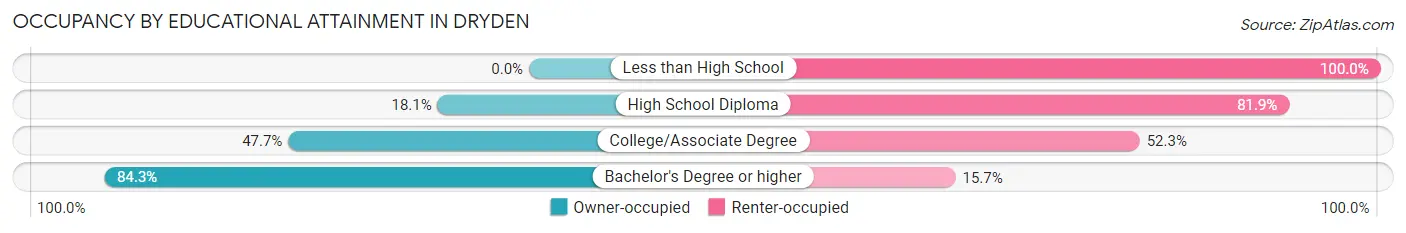
| Household Size | Owner-occupied | Renter-occupied |
| Less than High School | 0 (0.0%) | 39 (100.0%) |
| High School Diploma | 27 (18.1%) | 122 (81.9%) |
| College/Associate Degree | 148 (47.7%) | 162 (52.3%) |
| Bachelor's Degree or higher | 348 (84.3%) | 65 (15.7%) |
Occupancy by Age of Householder in Dryden
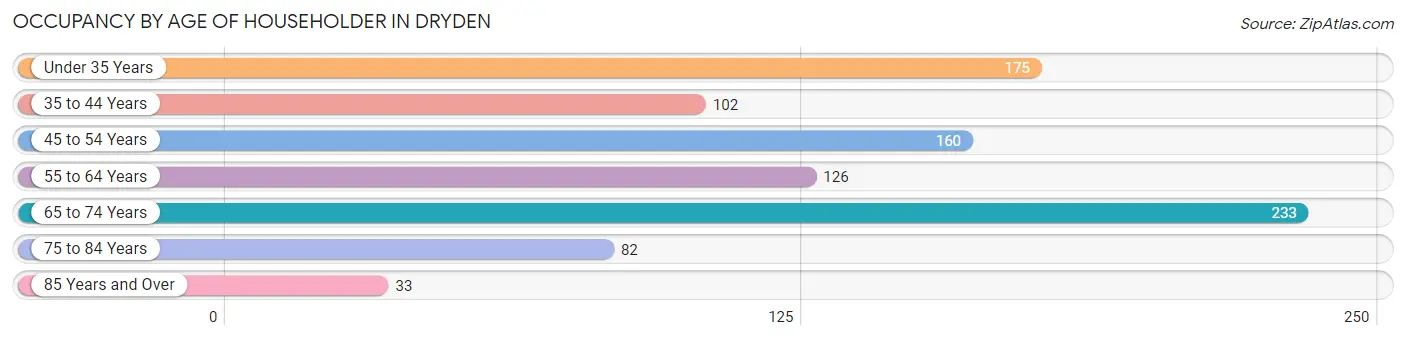
| Age Bracket | # Households | % Households |
| Under 35 Years | 175 | 19.2% |
| 35 to 44 Years | 102 | 11.2% |
| 45 to 54 Years | 160 | 17.6% |
| 55 to 64 Years | 126 | 13.8% |
| 65 to 74 Years | 233 | 25.6% |
| 75 to 84 Years | 82 | 9.0% |
| 85 Years and Over | 33 | 3.6% |
| Total | 911 | 100.0% |
Housing Finances in Dryden
Median Income by Occupancy in Dryden
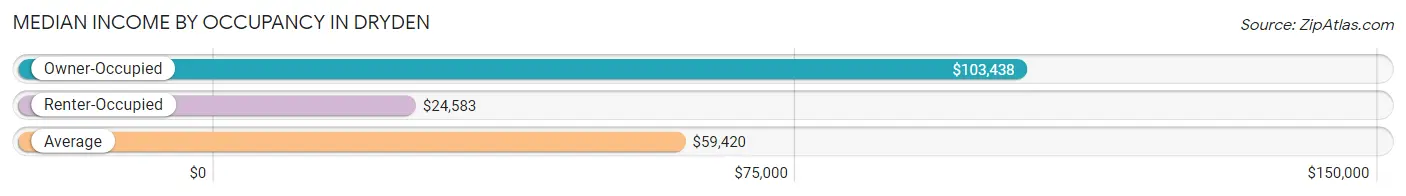
| Occupancy Type | # Households | Median Income |
| Owner-Occupied | 523 (57.4%) | $103,438 |
| Renter-Occupied | 388 (42.6%) | $24,583 |
| Average | 911 (100.0%) | $59,420 |
Occupancy by Householder Income Bracket in Dryden
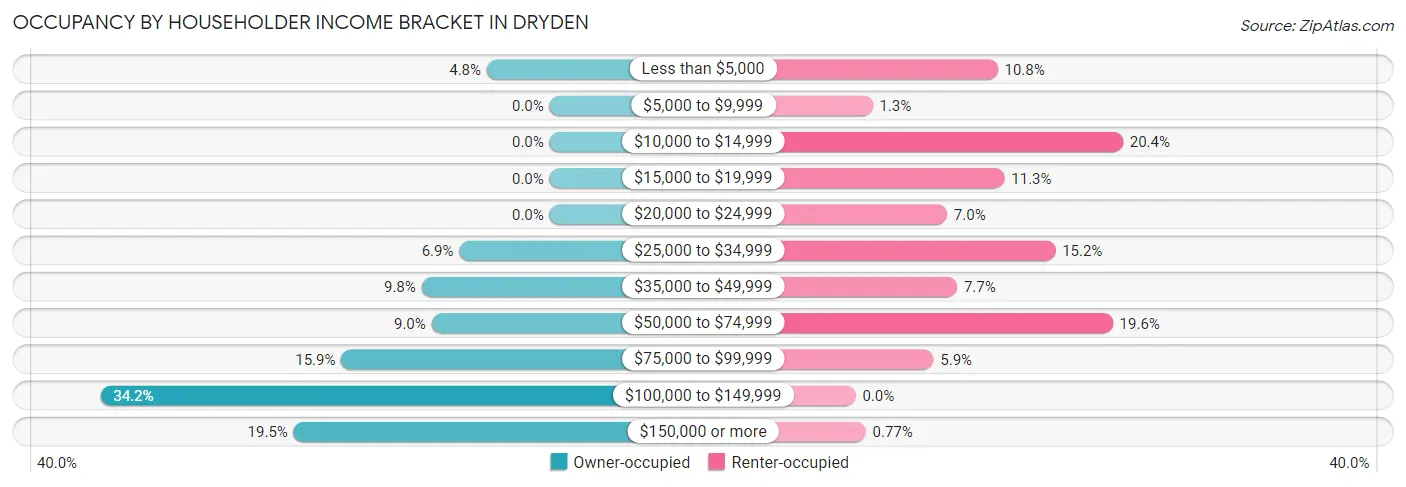
| Income Bracket | Owner-occupied | Renter-occupied |
| Less than $5,000 | 25 (4.8%) | 42 (10.8%) |
| $5,000 to $9,999 | 0 (0.0%) | 5 (1.3%) |
| $10,000 to $14,999 | 0 (0.0%) | 79 (20.4%) |
| $15,000 to $19,999 | 0 (0.0%) | 44 (11.3%) |
| $20,000 to $24,999 | 0 (0.0%) | 27 (7.0%) |
| $25,000 to $34,999 | 36 (6.9%) | 59 (15.2%) |
| $35,000 to $49,999 | 51 (9.8%) | 30 (7.7%) |
| $50,000 to $74,999 | 47 (9.0%) | 76 (19.6%) |
| $75,000 to $99,999 | 83 (15.9%) | 23 (5.9%) |
| $100,000 to $149,999 | 179 (34.2%) | 0 (0.0%) |
| $150,000 or more | 102 (19.5%) | 3 (0.8%) |
| Total | 523 (100.0%) | 388 (100.0%) |
Monthly Housing Cost Tiers in Dryden
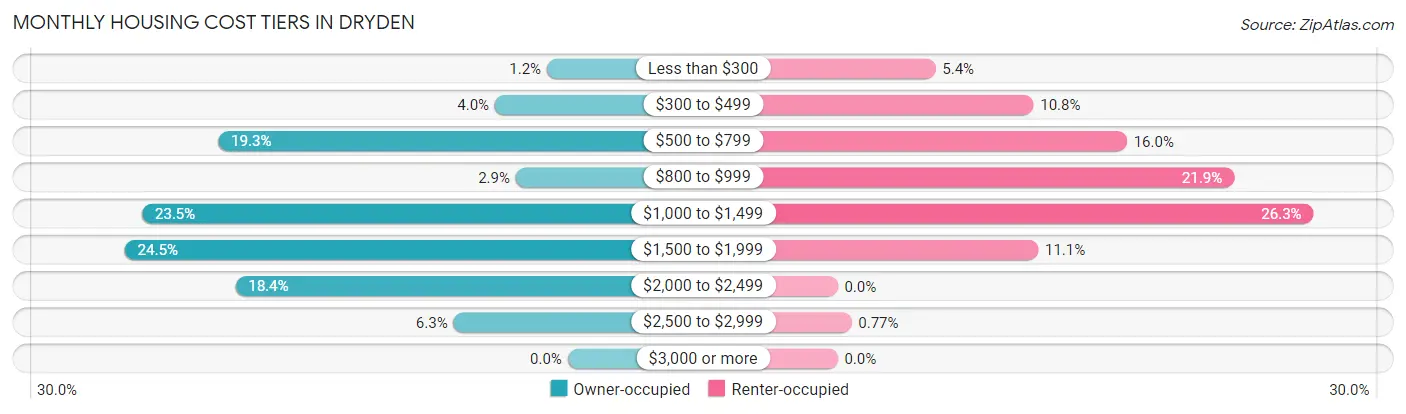
| Monthly Cost | Owner-occupied | Renter-occupied |
| Less than $300 | 6 (1.1%) | 21 (5.4%) |
| $300 to $499 | 21 (4.0%) | 42 (10.8%) |
| $500 to $799 | 101 (19.3%) | 62 (16.0%) |
| $800 to $999 | 15 (2.9%) | 85 (21.9%) |
| $1,000 to $1,499 | 123 (23.5%) | 102 (26.3%) |
| $1,500 to $1,999 | 128 (24.5%) | 43 (11.1%) |
| $2,000 to $2,499 | 96 (18.4%) | 0 (0.0%) |
| $2,500 to $2,999 | 33 (6.3%) | 3 (0.8%) |
| $3,000 or more | 0 (0.0%) | 0 (0.0%) |
| Total | 523 (100.0%) | 388 (100.0%) |
Physical Housing Characteristics in Dryden
Housing Structures in Dryden
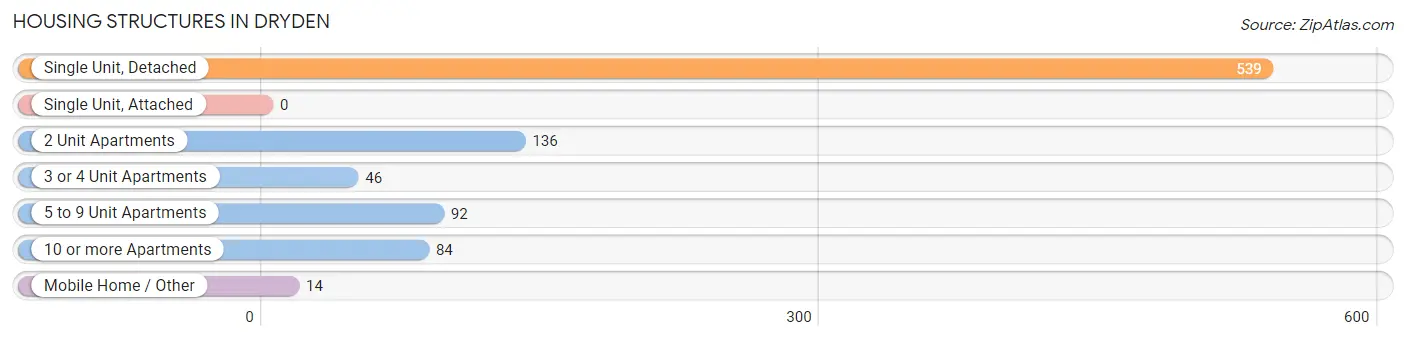
| Structure Type | # Housing Units | % Housing Units |
| Single Unit, Detached | 539 | 59.2% |
| Single Unit, Attached | 0 | 0.0% |
| 2 Unit Apartments | 136 | 14.9% |
| 3 or 4 Unit Apartments | 46 | 5.1% |
| 5 to 9 Unit Apartments | 92 | 10.1% |
| 10 or more Apartments | 84 | 9.2% |
| Mobile Home / Other | 14 | 1.5% |
| Total | 911 | 100.0% |
Housing Structures by Occupancy in Dryden
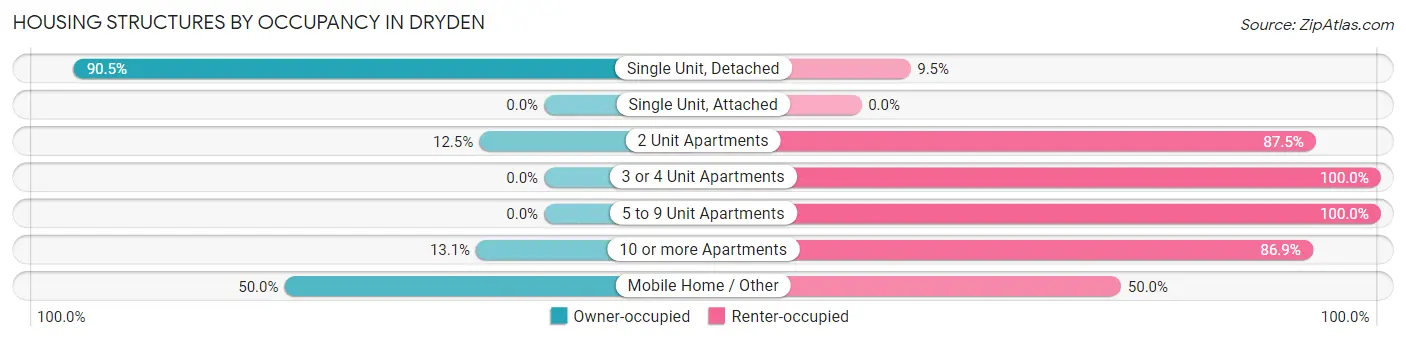
| Structure Type | Owner-occupied | Renter-occupied |
| Single Unit, Detached | 488 (90.5%) | 51 (9.5%) |
| Single Unit, Attached | 0 (0.0%) | 0 (0.0%) |
| 2 Unit Apartments | 17 (12.5%) | 119 (87.5%) |
| 3 or 4 Unit Apartments | 0 (0.0%) | 46 (100.0%) |
| 5 to 9 Unit Apartments | 0 (0.0%) | 92 (100.0%) |
| 10 or more Apartments | 11 (13.1%) | 73 (86.9%) |
| Mobile Home / Other | 7 (50.0%) | 7 (50.0%) |
| Total | 523 (57.4%) | 388 (42.6%) |
Housing Structures by Number of Rooms in Dryden
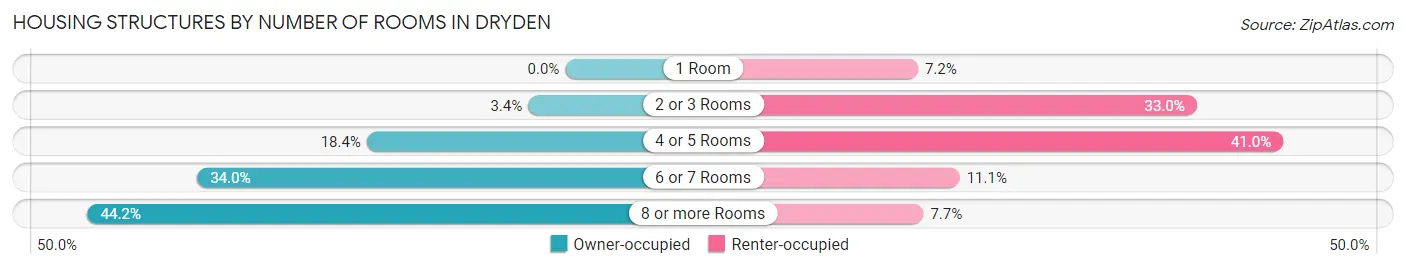
| Number of Rooms | Owner-occupied | Renter-occupied |
| 1 Room | 0 (0.0%) | 28 (7.2%) |
| 2 or 3 Rooms | 18 (3.4%) | 128 (33.0%) |
| 4 or 5 Rooms | 96 (18.4%) | 159 (41.0%) |
| 6 or 7 Rooms | 178 (34.0%) | 43 (11.1%) |
| 8 or more Rooms | 231 (44.2%) | 30 (7.7%) |
| Total | 523 (100.0%) | 388 (100.0%) |
Housing Structure by Heating Type in Dryden
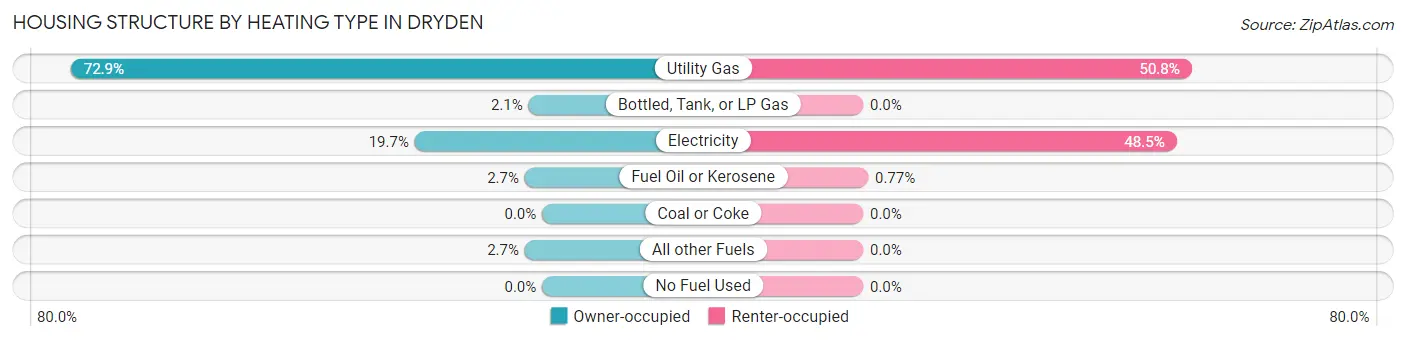
| Heating Type | Owner-occupied | Renter-occupied |
| Utility Gas | 381 (72.9%) | 197 (50.8%) |
| Bottled, Tank, or LP Gas | 11 (2.1%) | 0 (0.0%) |
| Electricity | 103 (19.7%) | 188 (48.4%) |
| Fuel Oil or Kerosene | 14 (2.7%) | 3 (0.8%) |
| Coal or Coke | 0 (0.0%) | 0 (0.0%) |
| All other Fuels | 14 (2.7%) | 0 (0.0%) |
| No Fuel Used | 0 (0.0%) | 0 (0.0%) |
| Total | 523 (100.0%) | 388 (100.0%) |
Household Vehicle Usage in Dryden
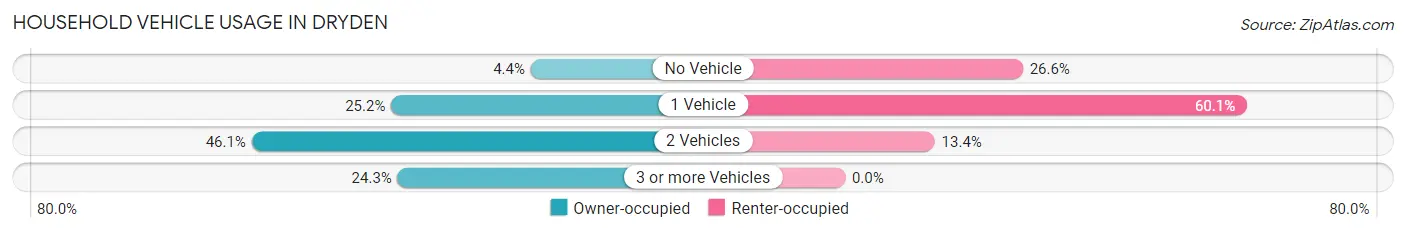
| Vehicles per Household | Owner-occupied | Renter-occupied |
| No Vehicle | 23 (4.4%) | 103 (26.6%) |
| 1 Vehicle | 132 (25.2%) | 233 (60.1%) |
| 2 Vehicles | 241 (46.1%) | 52 (13.4%) |
| 3 or more Vehicles | 127 (24.3%) | 0 (0.0%) |
| Total | 523 (100.0%) | 388 (100.0%) |
Real Estate & Mortgages in Dryden
Real Estate and Mortgage Overview in Dryden
| Characteristic | Without Mortgage | With Mortgage |
| Housing Units | 199 | 324 |
| Median Property Value | $195,800 | $219,800 |
| Median Household Income | $92,813 | $62 |
| Monthly Housing Costs | $711 | $0 |
| Real Estate Taxes | $5,727 | $0 |
Property Value by Mortgage Status in Dryden
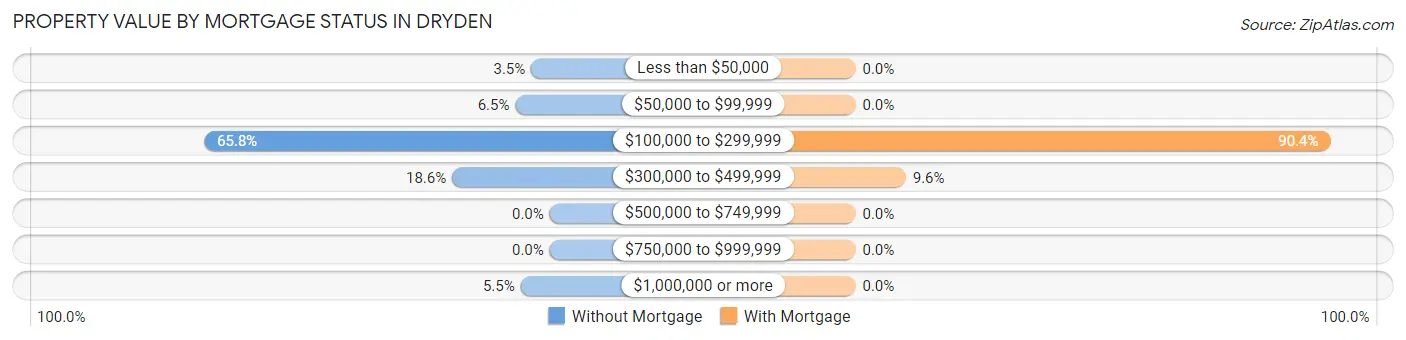
| Property Value | Without Mortgage | With Mortgage |
| Less than $50,000 | 7 (3.5%) | 0 (0.0%) |
| $50,000 to $99,999 | 13 (6.5%) | 0 (0.0%) |
| $100,000 to $299,999 | 131 (65.8%) | 293 (90.4%) |
| $300,000 to $499,999 | 37 (18.6%) | 31 (9.6%) |
| $500,000 to $749,999 | 0 (0.0%) | 0 (0.0%) |
| $750,000 to $999,999 | 0 (0.0%) | 0 (0.0%) |
| $1,000,000 or more | 11 (5.5%) | 0 (0.0%) |
| Total | 199 (100.0%) | 324 (100.0%) |
Household Income by Mortgage Status in Dryden
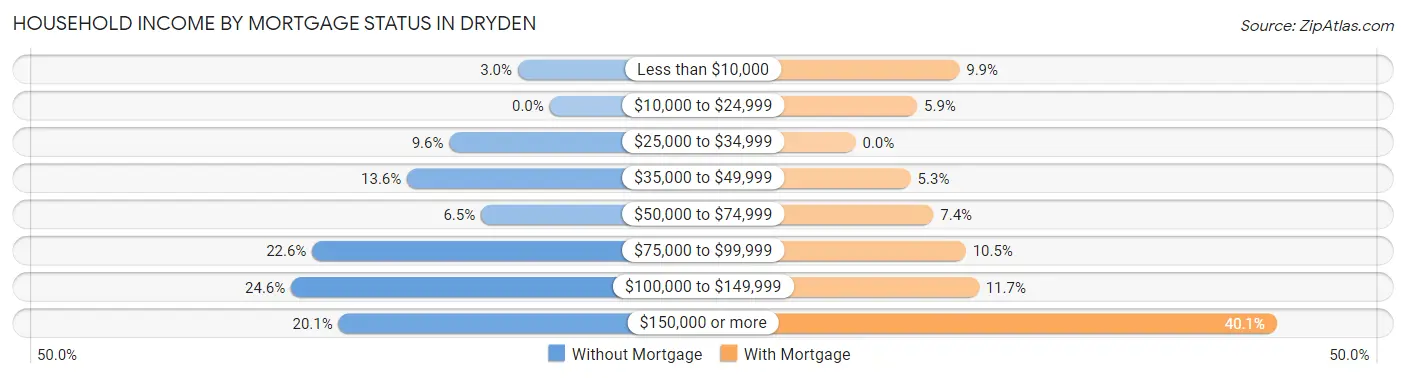
| Household Income | Without Mortgage | With Mortgage |
| Less than $10,000 | 6 (3.0%) | 32 (9.9%) |
| $10,000 to $24,999 | 0 (0.0%) | 19 (5.9%) |
| $25,000 to $34,999 | 19 (9.6%) | 0 (0.0%) |
| $35,000 to $49,999 | 27 (13.6%) | 17 (5.2%) |
| $50,000 to $74,999 | 13 (6.5%) | 24 (7.4%) |
| $75,000 to $99,999 | 45 (22.6%) | 34 (10.5%) |
| $100,000 to $149,999 | 49 (24.6%) | 38 (11.7%) |
| $150,000 or more | 40 (20.1%) | 130 (40.1%) |
| Total | 199 (100.0%) | 324 (100.0%) |
Property Value to Household Income Ratio in Dryden
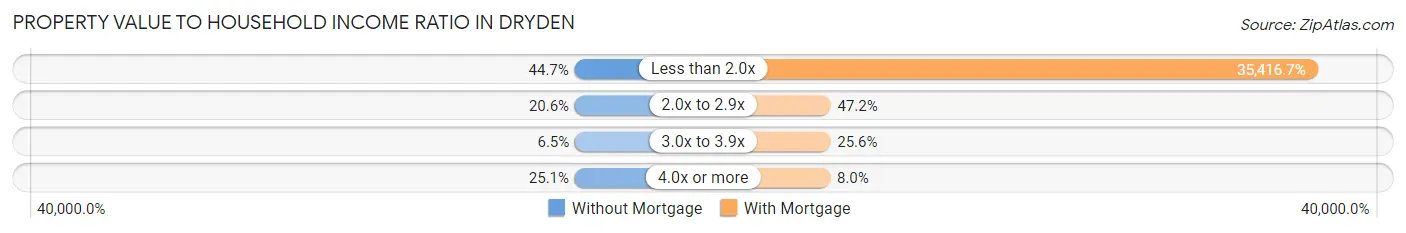
| Value-to-Income Ratio | Without Mortgage | With Mortgage |
| Less than 2.0x | 89 (44.7%) | 114,750 (35,416.7%) |
| 2.0x to 2.9x | 41 (20.6%) | 153 (47.2%) |
| 3.0x to 3.9x | 13 (6.5%) | 83 (25.6%) |
| 4.0x or more | 50 (25.1%) | 26 (8.0%) |
| Total | 199 (100.0%) | 324 (100.0%) |
Real Estate Taxes by Mortgage Status in Dryden
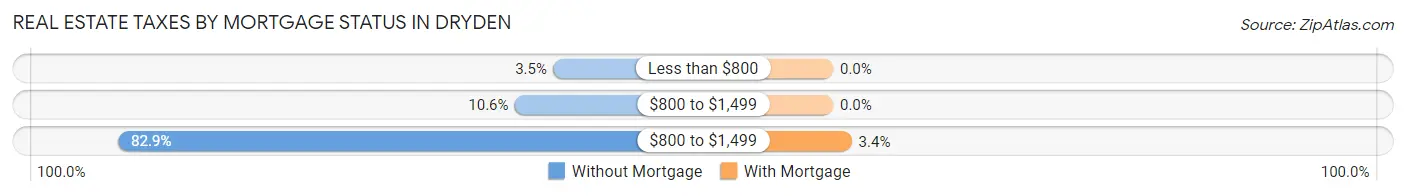
| Property Taxes | Without Mortgage | With Mortgage |
| Less than $800 | 7 (3.5%) | 0 (0.0%) |
| $800 to $1,499 | 21 (10.5%) | 0 (0.0%) |
| $800 to $1,499 | 165 (82.9%) | 11 (3.4%) |
| Total | 199 (100.0%) | 324 (100.0%) |
Health & Disability in Dryden
Health Insurance Coverage by Age in Dryden
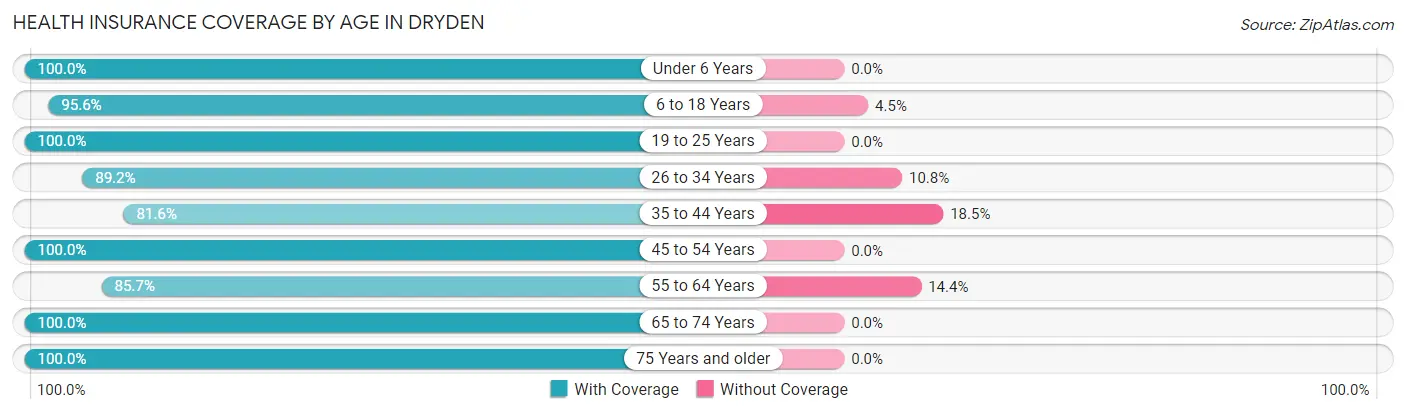
| Age Bracket | With Coverage | Without Coverage |
| Under 6 Years | 121 (100.0%) | 0 (0.0%) |
| 6 to 18 Years | 236 (95.6%) | 11 (4.4%) |
| 19 to 25 Years | 135 (100.0%) | 0 (0.0%) |
| 26 to 34 Years | 174 (89.2%) | 21 (10.8%) |
| 35 to 44 Years | 137 (81.6%) | 31 (18.4%) |
| 45 to 54 Years | 266 (100.0%) | 0 (0.0%) |
| 55 to 64 Years | 203 (85.7%) | 34 (14.3%) |
| 65 to 74 Years | 317 (100.0%) | 0 (0.0%) |
| 75 Years and older | 152 (100.0%) | 0 (0.0%) |
| Total | 1,741 (94.7%) | 97 (5.3%) |
Health Insurance Coverage by Citizenship Status in Dryden
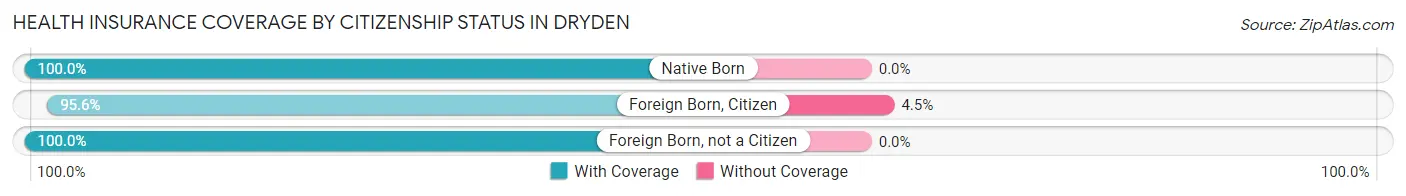
| Citizenship Status | With Coverage | Without Coverage |
| Native Born | 121 (100.0%) | 0 (0.0%) |
| Foreign Born, Citizen | 236 (95.6%) | 11 (4.4%) |
| Foreign Born, not a Citizen | 135 (100.0%) | 0 (0.0%) |
Health Insurance Coverage by Household Income in Dryden
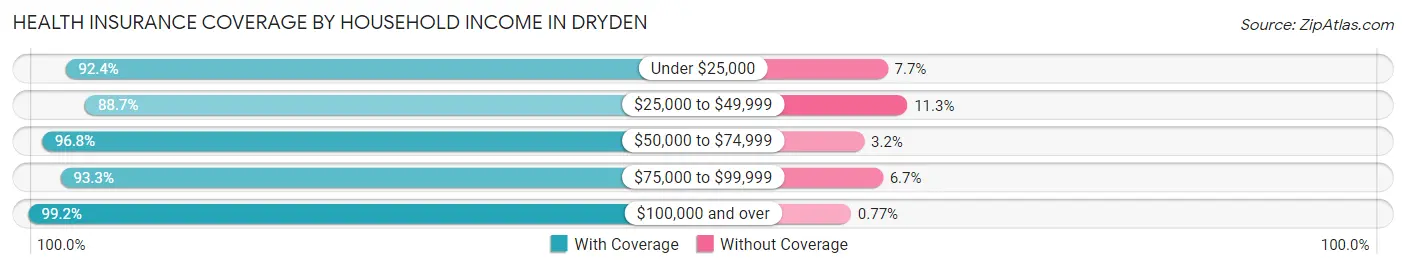
| Household Income | With Coverage | Without Coverage |
| Under $25,000 | 350 (92.3%) | 29 (7.6%) |
| $25,000 to $49,999 | 329 (88.7%) | 42 (11.3%) |
| $50,000 to $74,999 | 179 (96.8%) | 6 (3.2%) |
| $75,000 to $99,999 | 208 (93.3%) | 15 (6.7%) |
| $100,000 and over | 646 (99.2%) | 5 (0.8%) |
Public vs Private Health Insurance Coverage by Age in Dryden
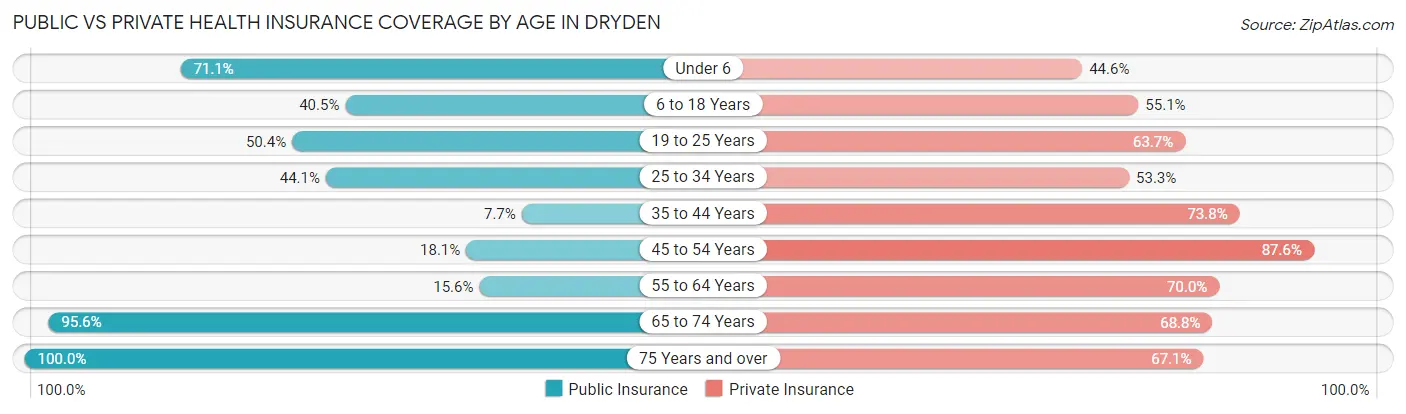
| Age Bracket | Public Insurance | Private Insurance |
| Under 6 | 86 (71.1%) | 54 (44.6%) |
| 6 to 18 Years | 100 (40.5%) | 136 (55.1%) |
| 19 to 25 Years | 68 (50.4%) | 86 (63.7%) |
| 25 to 34 Years | 86 (44.1%) | 104 (53.3%) |
| 35 to 44 Years | 13 (7.7%) | 124 (73.8%) |
| 45 to 54 Years | 48 (18.0%) | 233 (87.6%) |
| 55 to 64 Years | 37 (15.6%) | 166 (70.0%) |
| 65 to 74 Years | 303 (95.6%) | 218 (68.8%) |
| 75 Years and over | 152 (100.0%) | 102 (67.1%) |
| Total | 893 (48.6%) | 1,223 (66.5%) |
Disability Status by Sex by Age in Dryden
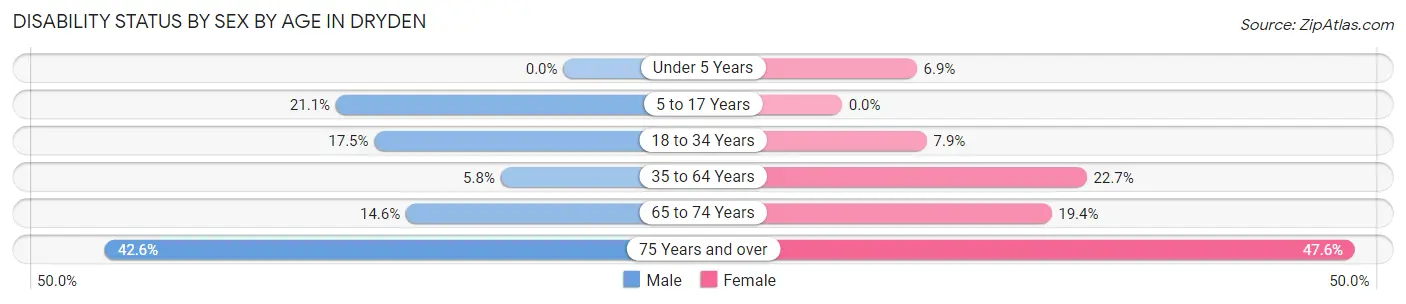
| Age Bracket | Male | Female |
| Under 5 Years | 0 (0.0%) | 5 (6.9%) |
| 5 to 17 Years | 19 (21.1%) | 0 (0.0%) |
| 18 to 34 Years | 30 (17.5%) | 14 (7.9%) |
| 35 to 64 Years | 18 (5.8%) | 82 (22.7%) |
| 65 to 74 Years | 20 (14.6%) | 35 (19.4%) |
| 75 Years and over | 20 (42.5%) | 50 (47.6%) |
Disability Class by Sex by Age in Dryden
Disability Class: Hearing Difficulty
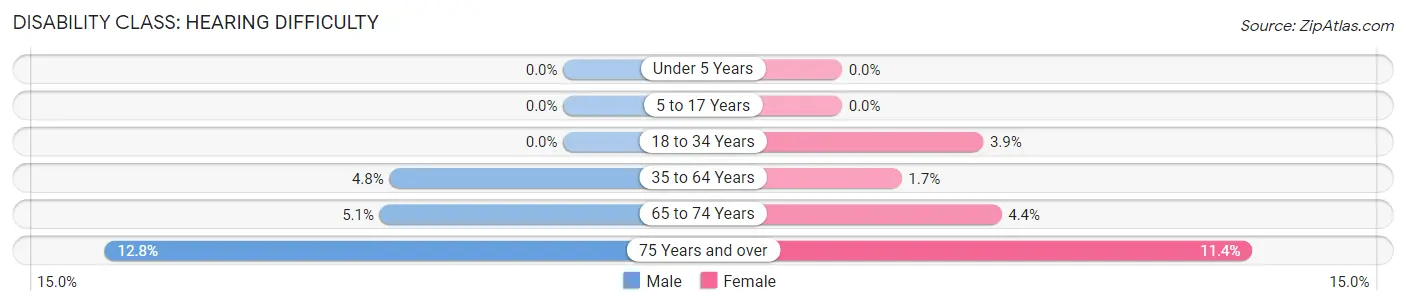
| Age Bracket | Male | Female |
| Under 5 Years | 0 (0.0%) | 0 (0.0%) |
| 5 to 17 Years | 0 (0.0%) | 0 (0.0%) |
| 18 to 34 Years | 0 (0.0%) | 7 (3.9%) |
| 35 to 64 Years | 15 (4.8%) | 6 (1.7%) |
| 65 to 74 Years | 7 (5.1%) | 8 (4.4%) |
| 75 Years and over | 6 (12.8%) | 12 (11.4%) |
Disability Class: Vision Difficulty
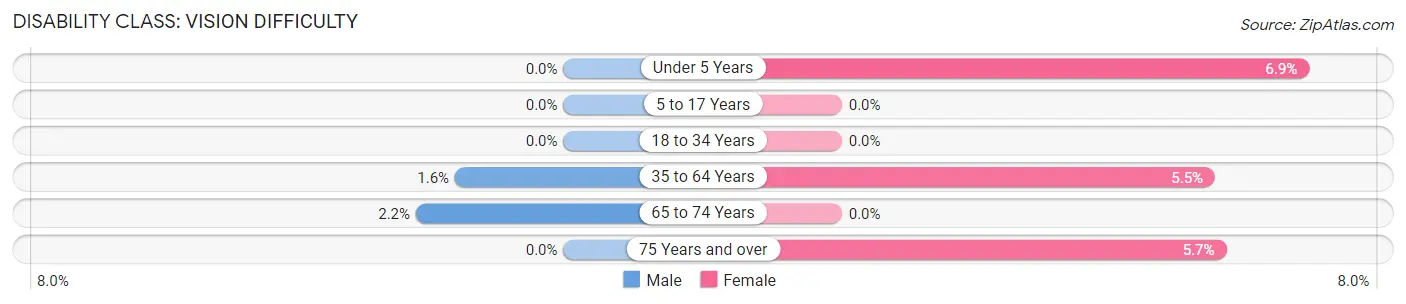
| Age Bracket | Male | Female |
| Under 5 Years | 0 (0.0%) | 5 (6.9%) |
| 5 to 17 Years | 0 (0.0%) | 0 (0.0%) |
| 18 to 34 Years | 0 (0.0%) | 0 (0.0%) |
| 35 to 64 Years | 5 (1.6%) | 20 (5.5%) |
| 65 to 74 Years | 3 (2.2%) | 0 (0.0%) |
| 75 Years and over | 0 (0.0%) | 6 (5.7%) |
Disability Class: Cognitive Difficulty
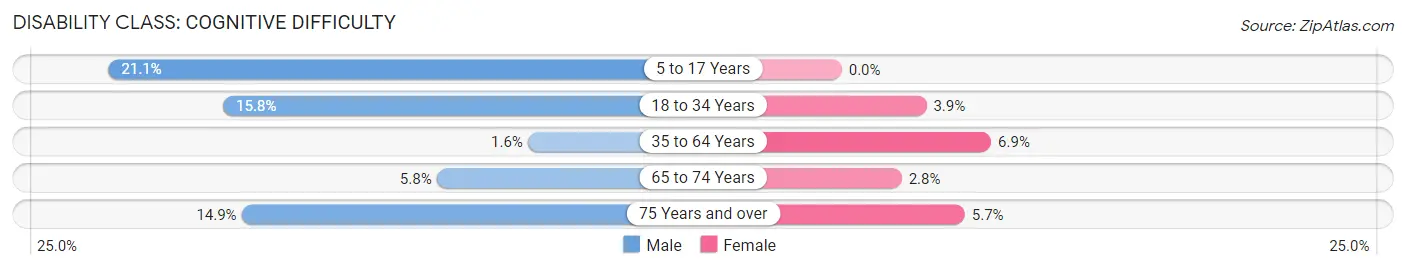
| Age Bracket | Male | Female |
| 5 to 17 Years | 19 (21.1%) | 0 (0.0%) |
| 18 to 34 Years | 27 (15.8%) | 7 (3.9%) |
| 35 to 64 Years | 5 (1.6%) | 25 (6.9%) |
| 65 to 74 Years | 8 (5.8%) | 5 (2.8%) |
| 75 Years and over | 7 (14.9%) | 6 (5.7%) |
Disability Class: Ambulatory Difficulty
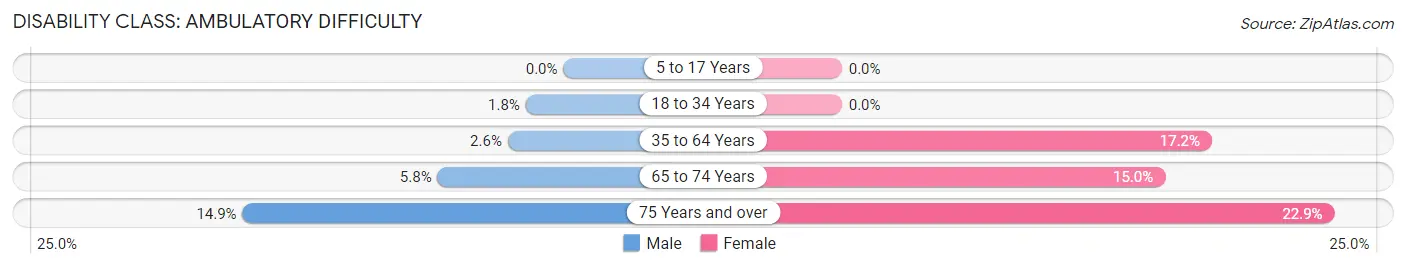
| Age Bracket | Male | Female |
| 5 to 17 Years | 0 (0.0%) | 0 (0.0%) |
| 18 to 34 Years | 3 (1.8%) | 0 (0.0%) |
| 35 to 64 Years | 8 (2.6%) | 62 (17.2%) |
| 65 to 74 Years | 8 (5.8%) | 27 (15.0%) |
| 75 Years and over | 7 (14.9%) | 24 (22.9%) |
Disability Class: Self-Care Difficulty
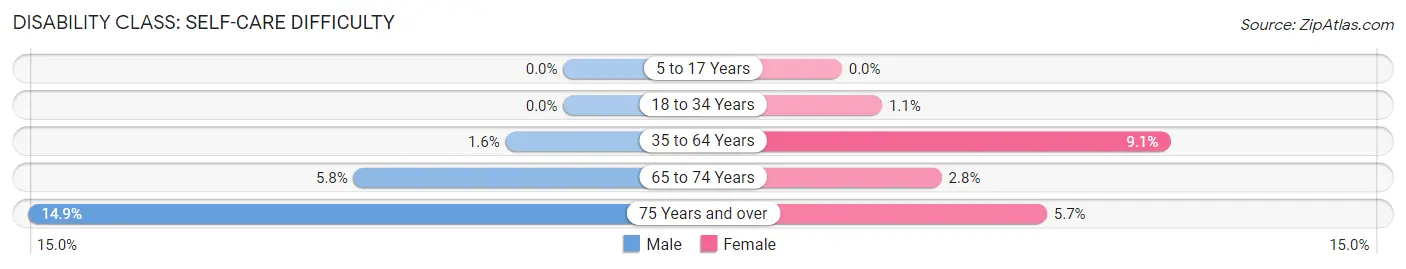
| Age Bracket | Male | Female |
| 5 to 17 Years | 0 (0.0%) | 0 (0.0%) |
| 18 to 34 Years | 0 (0.0%) | 2 (1.1%) |
| 35 to 64 Years | 5 (1.6%) | 33 (9.1%) |
| 65 to 74 Years | 8 (5.8%) | 5 (2.8%) |
| 75 Years and over | 7 (14.9%) | 6 (5.7%) |
Technology Access in Dryden
Computing Device Access in Dryden
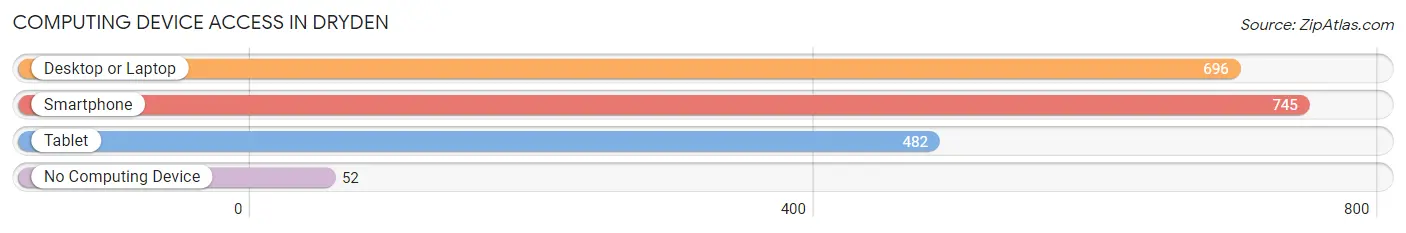
| Device Type | # Households | % Households |
| Desktop or Laptop | 696 | 76.4% |
| Smartphone | 745 | 81.8% |
| Tablet | 482 | 52.9% |
| No Computing Device | 52 | 5.7% |
| Total | 911 | 100.0% |
Internet Access in Dryden
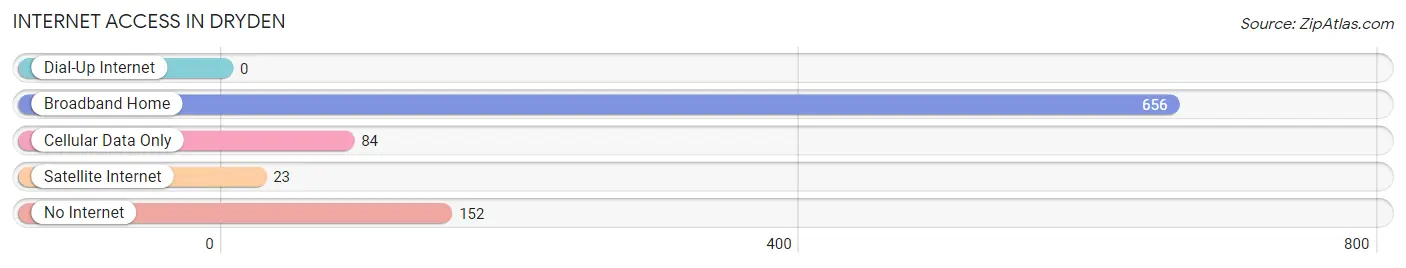
| Internet Type | # Households | % Households |
| Dial-Up Internet | 0 | 0.0% |
| Broadband Home | 656 | 72.0% |
| Cellular Data Only | 84 | 9.2% |
| Satellite Internet | 23 | 2.5% |
| No Internet | 152 | 16.7% |
| Total | 911 | 100.0% |
Dryden Summary
Dryden is a town located in Tompkins County, New York, United States. It is situated in the Finger Lakes region of the state, and is bordered by the towns of Groton, Lansing, Freeville, and Ithaca. The town was named after the English poet John Dryden. As of the 2010 census, the town had a population of 14,435.
Geography
Dryden is located in the Finger Lakes region of New York, and is bordered by the towns of Groton, Lansing, Freeville, and Ithaca. The town has a total area of 39.2 square miles, of which 38.9 square miles is land and 0.3 square miles is water. The town is located in the Finger Lakes region of New York, and is bordered by the towns of Groton, Lansing, Freeville, and Ithaca. The town is located in the Finger Lakes region of New York, and is bordered by the towns of Groton, Lansing, Freeville, and Ithaca.
The town is located in the Finger Lakes region of New York, and is bordered by the towns of Groton, Lansing, Freeville, and Ithaca. The town is located in the Finger Lakes region of New York, and is bordered by the towns of Groton, Lansing, Freeville, and Ithaca. The town is located in the Finger Lakes region of New York, and is bordered by the towns of Groton, Lansing, Freeville, and Ithaca.
The town is located in the Finger Lakes region of New York, and is bordered by the towns of Groton, Lansing, Freeville, and Ithaca. The town is located in the Finger Lakes region of New York, and is bordered by the towns of Groton, Lansing, Freeville, and Ithaca. The town is located in the Finger Lakes region of New York, and is bordered by the towns of Groton, Lansing, Freeville, and Ithaca.
The town is located in the Finger Lakes region of New York, and is bordered by the towns of Groton, Lansing, Freeville, and Ithaca. The town is located in the Finger Lakes region of New York, and is bordered by the towns of Groton, Lansing, Freeville, and Ithaca. The town is located in the Finger Lakes region of New York, and is bordered by the towns of Groton, Lansing, Freeville, and Ithaca.
The town is located in the Finger Lakes region of New York, and is bordered by the towns of Groton, Lansing, Freeville, and Ithaca. The town is located in the Finger Lakes region of New York, and is bordered by the towns of Groton, Lansing, Freeville, and Ithaca. The town is located in the Finger Lakes region of New York, and is bordered by the towns of Groton, Lansing, Freeville, and Ithaca.
The town is located in the Finger Lakes region of New York, and is bordered by the towns of Groton, Lansing, Freeville, and Ithaca. The town is located in the Finger Lakes region of New York, and is bordered by the towns of Groton, Lansing, Freeville, and Ithaca. The town is located in the Finger Lakes region of New York, and is bordered by the towns of Groton, Lansing, Freeville, and Ithaca.
History
The area that is now Dryden was first settled in 1791 by a group of settlers from Connecticut. The town was officially established in 1794, and was named after the English poet John Dryden. The town was originally part of the Central New York Military Tract, which was set aside by the state of New York to compensate veterans of the Revolutionary War.
In the early 19th century, the town was a center of the abolitionist movement, and was home to several prominent abolitionists, including Gerrit Smith and William Seward. The town was also the site of the first women's rights convention in the United States, which was held in 1848.
Economy
Dryden's economy is largely based on agriculture and tourism. The town is home to several wineries, and is a popular destination for wine tours. The town is also home to several farms, which produce a variety of fruits and vegetables.
The town is also home to several small businesses, including restaurants, retail stores, and professional services. The town is also home to several educational institutions, including Cornell University and Ithaca College.
Demographics
As of the 2010 census, the town had a population of 14,435. The racial makeup of the town was 94.3% White, 1.7% African American, 0.3% Native American, 1.2% Asian, 0.1% Pacific Islander, 0.7% from other races, and 1.9% from two or more races. Hispanic or Latino of any race were 3.2% of the population.
The median household income in the town was $50,945, and the median family income was $62,917. The per capita income for the town was $25,945. About 5.3% of families and 8.2% of the population were below the poverty line, including 10.2% of those under age 18 and 5.2% of those age 65 or over.
Common Questions
What is Per Capita Income in Dryden?
Per Capita income in Dryden is $37,834.
What is the Median Family Income in Dryden?
Median Family Income in Dryden is $72,083.
What is the Median Household income in Dryden?
Median Household Income in Dryden is $59,420.
What is Income or Wage Gap in Dryden?
Income or Wage Gap in Dryden is 36.1%.
Women in Dryden earn 63.9 cents for every dollar earned by a man.
What is Inequality or Gini Index in Dryden?
Inequality or Gini Index in Dryden is 0.46.
What is the Total Population of Dryden?
Total Population of Dryden is 1,838.
What is the Total Male Population of Dryden?
Total Male Population of Dryden is 799.
What is the Total Female Population of Dryden?
Total Female Population of Dryden is 1,039.
What is the Ratio of Males per 100 Females in Dryden?
There are 76.90 Males per 100 Females in Dryden.
What is the Ratio of Females per 100 Males in Dryden?
There are 130.04 Females per 100 Males in Dryden.
What is the Median Population Age in Dryden?
Median Population Age in Dryden is 46.8 Years.
What is the Average Family Size in Dryden
Average Family Size in Dryden is 2.6 People.
What is the Average Household Size in Dryden
Average Household Size in Dryden is 2.0 People.
How Large is the Labor Force in Dryden?
There are 868 People in the Labor Forcein in Dryden.
What is the Percentage of People in the Labor Force in Dryden?
56.8% of People are in the Labor Force in Dryden.
What is the Unemployment Rate in Dryden?
Unemployment Rate in Dryden is 5.4%.