Dobbs Ferry, NY Map & Demographics
Dobbs Ferry Map
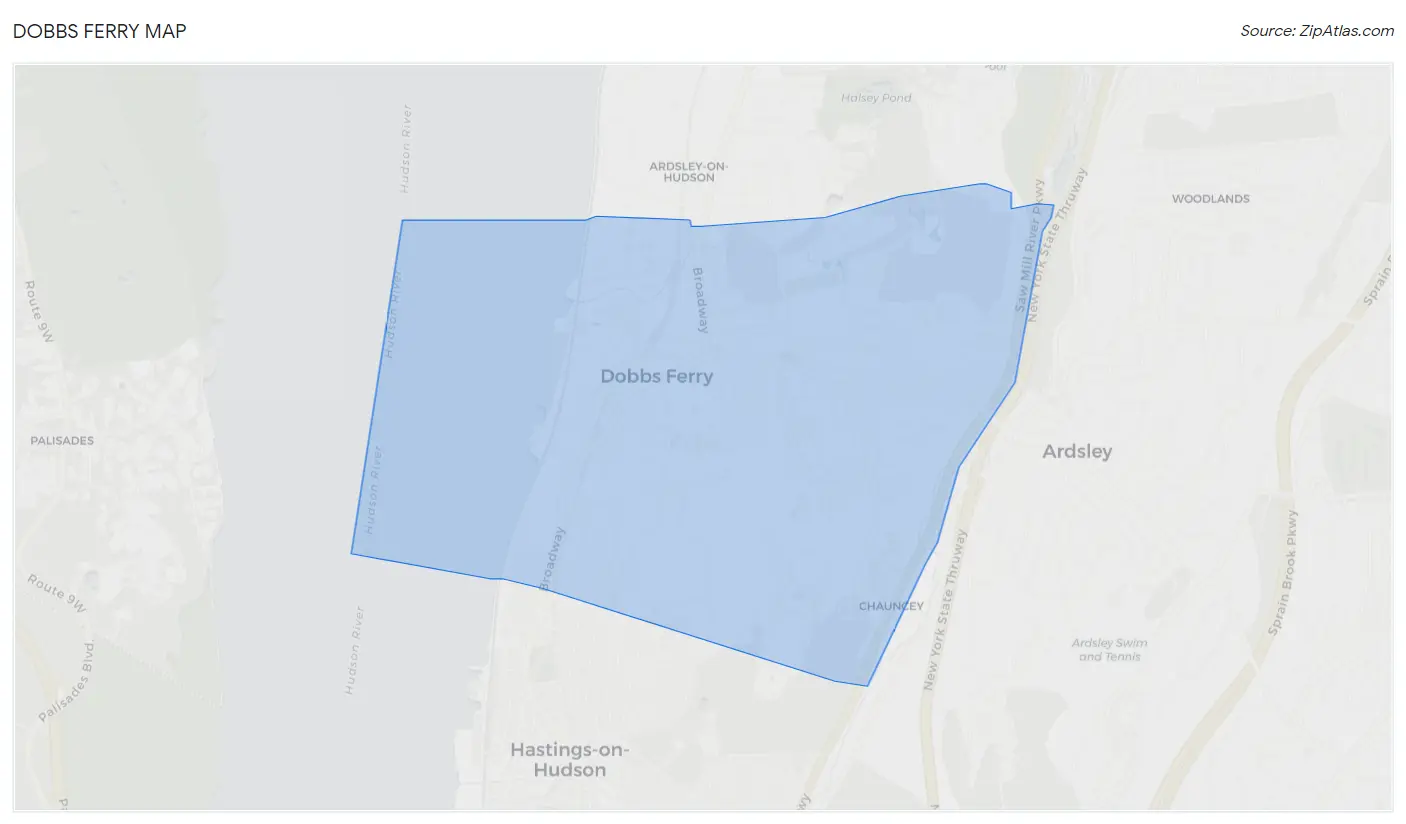
Dobbs Ferry Overview
$69,682
PER CAPITA INCOME
$174,527
AVG FAMILY INCOME
$144,000
AVG HOUSEHOLD INCOME
28.0%
WAGE / INCOME GAP [ % ]
72.0¢/ $1
WAGE / INCOME GAP [ $ ]
0.48
INEQUALITY / GINI INDEX
11,431
TOTAL POPULATION
5,765
MALE POPULATION
5,666
FEMALE POPULATION
101.75
MALES / 100 FEMALES
98.28
FEMALES / 100 MALES
39.0
MEDIAN AGE
3.2
AVG FAMILY SIZE
2.8
AVG HOUSEHOLD SIZE
6,239
LABOR FORCE [ PEOPLE ]
69.2%
PERCENT IN LABOR FORCE
5.8%
UNEMPLOYMENT RATE
Dobbs Ferry Zip Codes
Dobbs Ferry Area Codes
Income in Dobbs Ferry
Income Overview in Dobbs Ferry
Per Capita Income in Dobbs Ferry is $69,682, while median incomes of families and households are $174,527 and $144,000 respectively.
| Characteristic | Number | Measure |
| Per Capita Income | 11,431 | $69,682 |
| Median Family Income | 2,898 | $174,527 |
| Mean Family Income | 2,898 | $235,957 |
| Median Household Income | 3,794 | $144,000 |
| Mean Household Income | 3,794 | $201,975 |
| Income Deficit | 2,898 | $0 |
| Wage / Income Gap (%) | 11,431 | 28.03% |
| Wage / Income Gap ($) | 11,431 | 71.97¢ per $1 |
| Gini / Inequality Index | 11,431 | 0.48 |
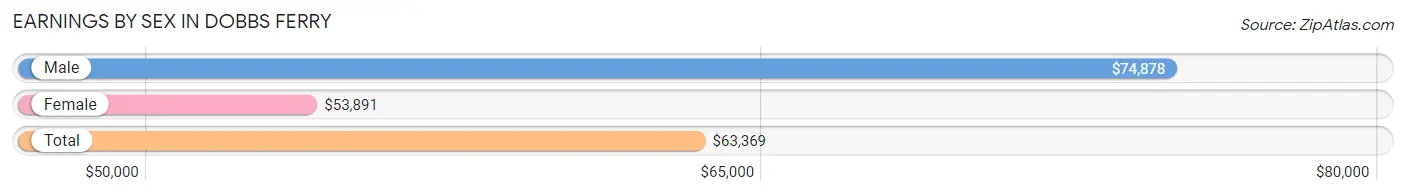
Earnings by Sex in Dobbs Ferry
Average Earnings in Dobbs Ferry are $63,369, $74,878 for men and $53,891 for women, a difference of 28.0%.
| Sex | Number | Average Earnings |
| Male | 3,216 (49.1%) | $74,878 |
| Female | 3,337 (50.9%) | $53,891 |
| Total | 6,553 (100.0%) | $63,369 |
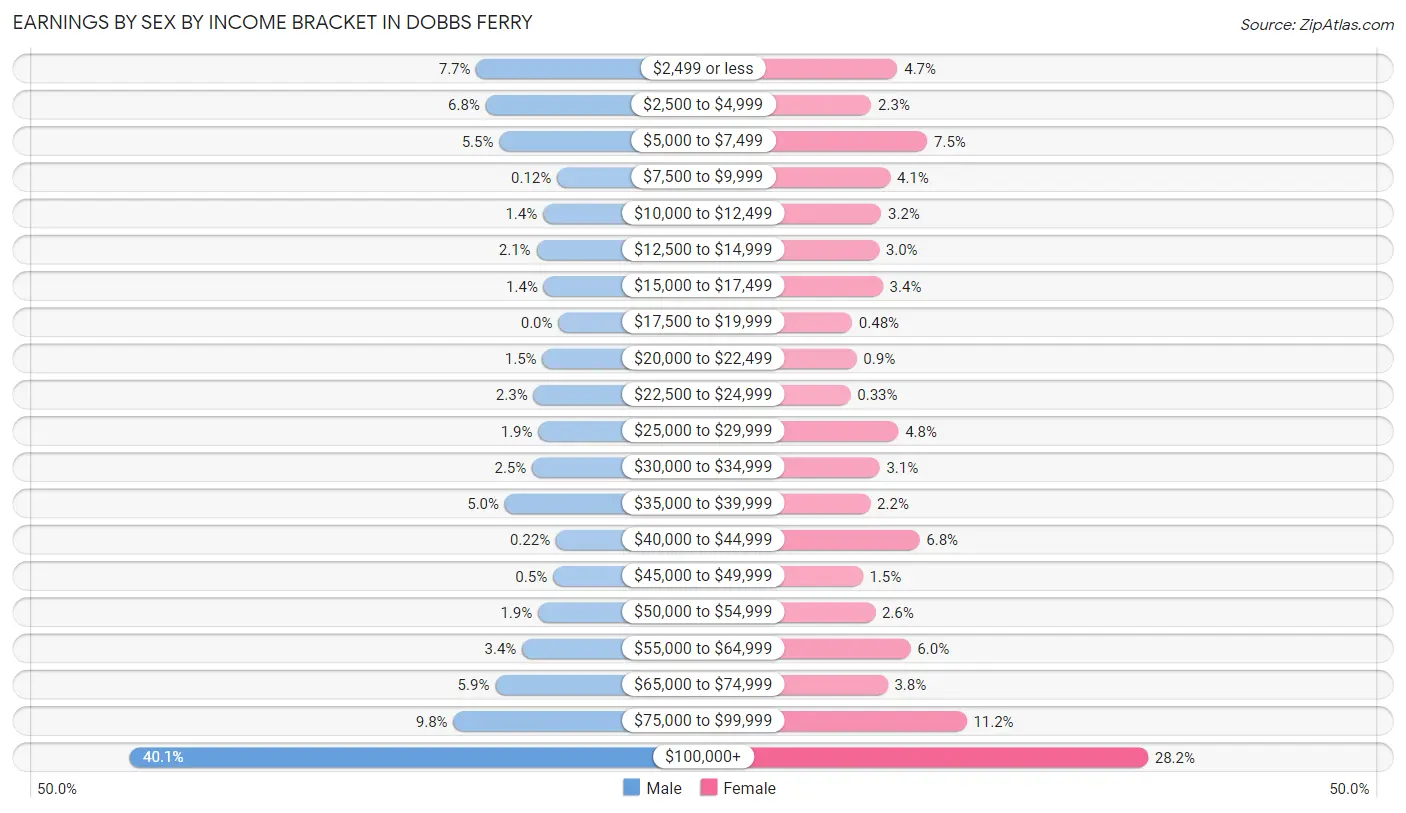
Earnings by Sex by Income Bracket in Dobbs Ferry
The most common earnings brackets in Dobbs Ferry are $100,000+ for men (1,290 | 40.1%) and $100,000+ for women (941 | 28.2%).
| Income | Male | Female |
| $2,499 or less | 247 (7.7%) | 158 (4.7%) |
| $2,500 to $4,999 | 219 (6.8%) | 76 (2.3%) |
| $5,000 to $7,499 | 178 (5.5%) | 251 (7.5%) |
| $7,500 to $9,999 | 4 (0.1%) | 135 (4.1%) |
| $10,000 to $12,499 | 46 (1.4%) | 107 (3.2%) |
| $12,500 to $14,999 | 66 (2.1%) | 100 (3.0%) |
| $15,000 to $17,499 | 44 (1.4%) | 112 (3.4%) |
| $17,500 to $19,999 | 0 (0.0%) | 16 (0.5%) |
| $20,000 to $22,499 | 48 (1.5%) | 30 (0.9%) |
| $22,500 to $24,999 | 75 (2.3%) | 11 (0.3%) |
| $25,000 to $29,999 | 60 (1.9%) | 161 (4.8%) |
| $30,000 to $34,999 | 79 (2.5%) | 102 (3.1%) |
| $35,000 to $39,999 | 161 (5.0%) | 73 (2.2%) |
| $40,000 to $44,999 | 7 (0.2%) | 227 (6.8%) |
| $45,000 to $49,999 | 16 (0.5%) | 49 (1.5%) |
| $50,000 to $54,999 | 61 (1.9%) | 88 (2.6%) |
| $55,000 to $64,999 | 109 (3.4%) | 199 (6.0%) |
| $65,000 to $74,999 | 190 (5.9%) | 127 (3.8%) |
| $75,000 to $99,999 | 316 (9.8%) | 374 (11.2%) |
| $100,000+ | 1,290 (40.1%) | 941 (28.2%) |
| Total | 3,216 (100.0%) | 3,337 (100.0%) |
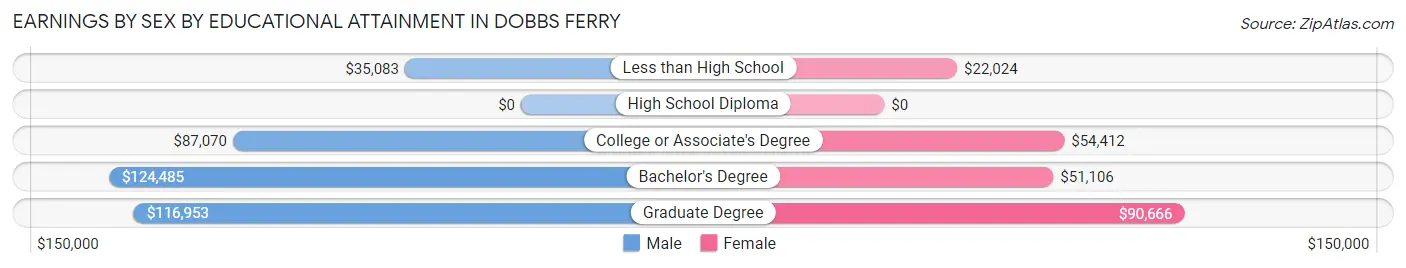
Earnings by Sex by Educational Attainment in Dobbs Ferry
Average earnings in Dobbs Ferry are $89,208 for men and $71,309 for women, a difference of 20.1%. Men with an educational attainment of bachelor's degree enjoy the highest average annual earnings of $124,485, while those with less than high school education earn the least with $35,083. Women with an educational attainment of graduate degree earn the most with the average annual earnings of $90,666, while those with less than high school education have the smallest earnings of $22,024.
| Educational Attainment | Male Income | Female Income |
| Less than High School | $35,083 | $22,024 |
| High School Diploma | - | - |
| College or Associate's Degree | $87,070 | $54,412 |
| Bachelor's Degree | $124,485 | $51,106 |
| Graduate Degree | $116,953 | $90,666 |
| Total | $89,208 | $71,309 |
Family Income in Dobbs Ferry
Family Income Brackets in Dobbs Ferry
According to the Dobbs Ferry family income data, there are 1,179 families falling into the $200,000+ income range, which is the most common income bracket and makes up 40.7% of all families.
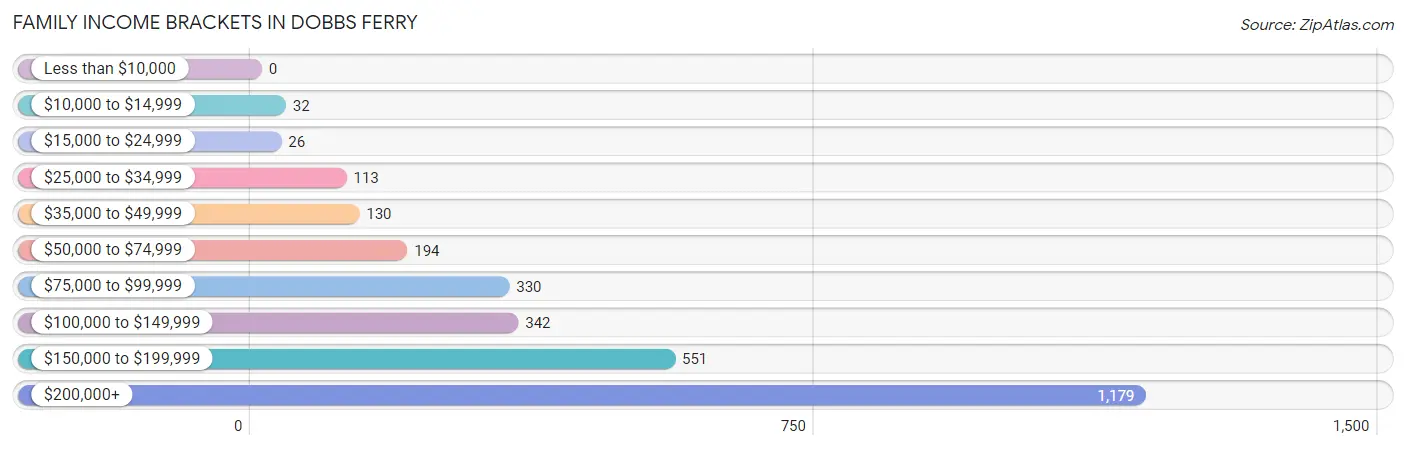
| Income Bracket | # Families | % Families |
| Less than $10,000 | 0 | 0.0% |
| $10,000 to $14,999 | 32 | 1.1% |
| $15,000 to $24,999 | 26 | 0.9% |
| $25,000 to $34,999 | 113 | 3.9% |
| $35,000 to $49,999 | 130 | 4.5% |
| $50,000 to $74,999 | 194 | 6.7% |
| $75,000 to $99,999 | 330 | 11.4% |
| $100,000 to $149,999 | 342 | 11.8% |
| $150,000 to $199,999 | 551 | 19.0% |
| $200,000+ | 1,179 | 40.7% |
Family Income by Famaliy Size in Dobbs Ferry
3-person families (688 | 23.7%) account for the highest median family income in Dobbs Ferry with $192,125 per family, while 2-person families (1,098 | 37.9%) have the highest median income of $80,893 per family member.
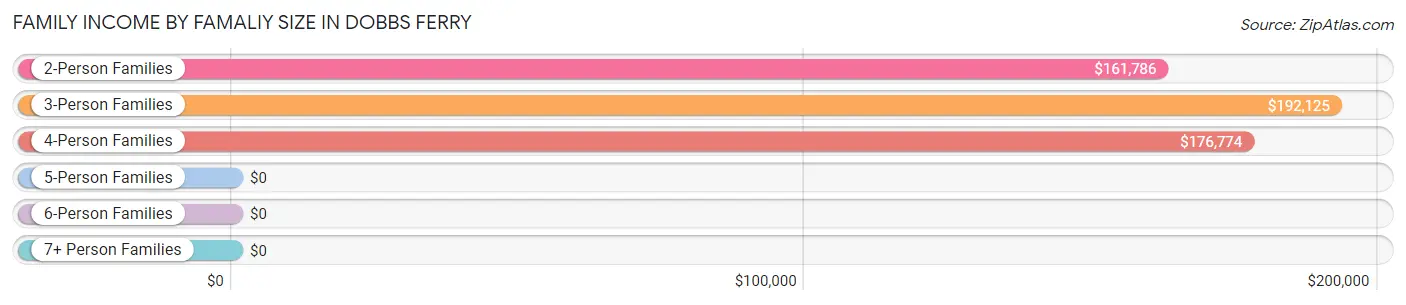
| Income Bracket | # Families | Median Income |
| 2-Person Families | 1,098 (37.9%) | $161,786 |
| 3-Person Families | 688 (23.7%) | $192,125 |
| 4-Person Families | 808 (27.9%) | $176,774 |
| 5-Person Families | 261 (9.0%) | $0 |
| 6-Person Families | 27 (0.9%) | $0 |
| 7+ Person Families | 16 (0.5%) | $0 |
| Total | 2,898 (100.0%) | $174,527 |
Family Income by Number of Earners in Dobbs Ferry
The median family income in Dobbs Ferry is $174,527, with families comprising 3+ earners (380) having the highest median family income of $206,042, while families with no earners (186) have the lowest median family income of $95,735, accounting for 13.1% and 6.4% of families, respectively.
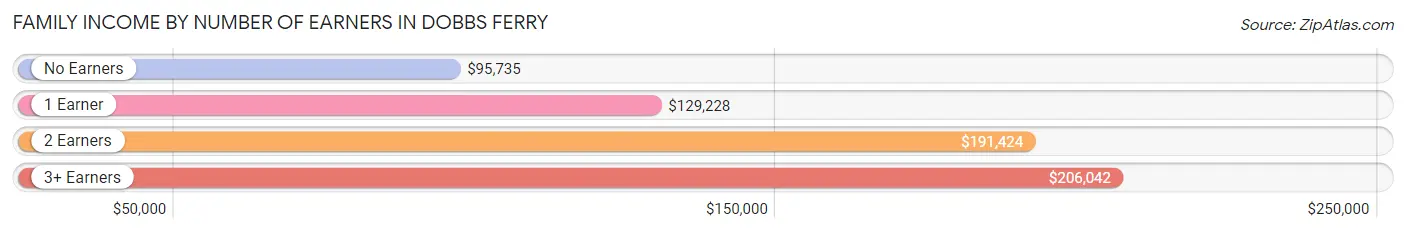
| Number of Earners | # Families | Median Income |
| No Earners | 186 (6.4%) | $95,735 |
| 1 Earner | 841 (29.0%) | $129,228 |
| 2 Earners | 1,491 (51.4%) | $191,424 |
| 3+ Earners | 380 (13.1%) | $206,042 |
| Total | 2,898 (100.0%) | $174,527 |
Household Income in Dobbs Ferry
Household Income Brackets in Dobbs Ferry
With 1,275 households falling in the category, the $200,000+ income range is the most frequent in Dobbs Ferry, accounting for 33.6% of all households. In contrast, only 34 households (0.9%) fall into the $10,000 to $14,999 income bracket, making it the least populous group.
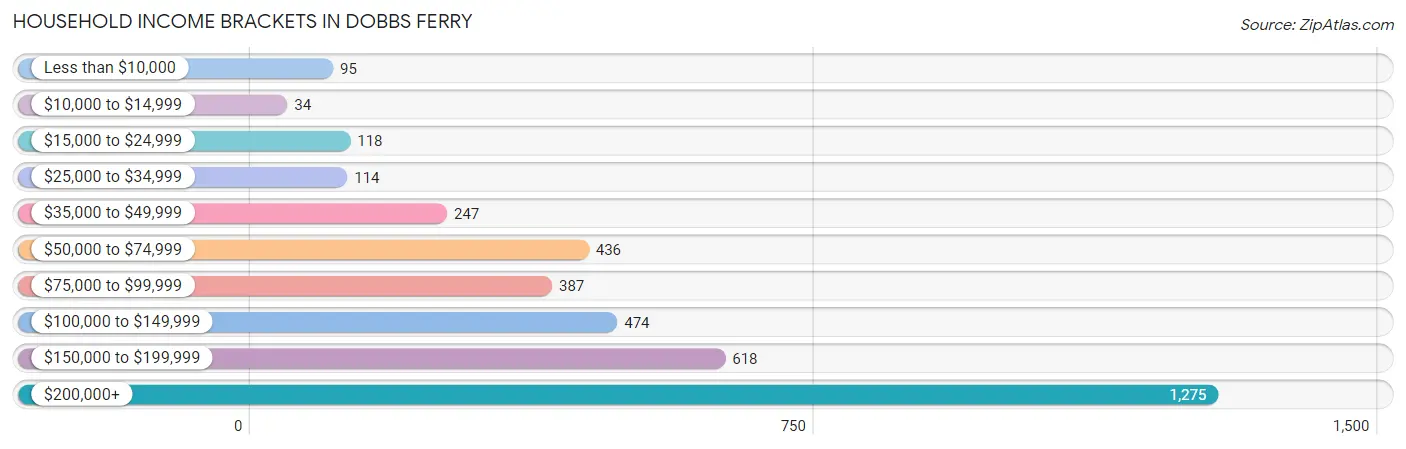
| Income Bracket | # Households | % Households |
| Less than $10,000 | 95 | 2.5% |
| $10,000 to $14,999 | 34 | 0.9% |
| $15,000 to $24,999 | 118 | 3.1% |
| $25,000 to $34,999 | 114 | 3.0% |
| $35,000 to $49,999 | 247 | 6.5% |
| $50,000 to $74,999 | 436 | 11.5% |
| $75,000 to $99,999 | 387 | 10.2% |
| $100,000 to $149,999 | 474 | 12.5% |
| $150,000 to $199,999 | 618 | 16.3% |
| $200,000+ | 1,275 | 33.6% |
Household Income by Householder Age in Dobbs Ferry
The median household income in Dobbs Ferry is $144,000, with the highest median household income of $171,050 found in the 45 to 64 years age bracket for the primary householder. A total of 1,649 households (43.5%) fall into this category. Meanwhile, the 15 to 24 years age bracket for the primary householder has the lowest median household income of $16,250, with 98 households (2.6%) in this group.
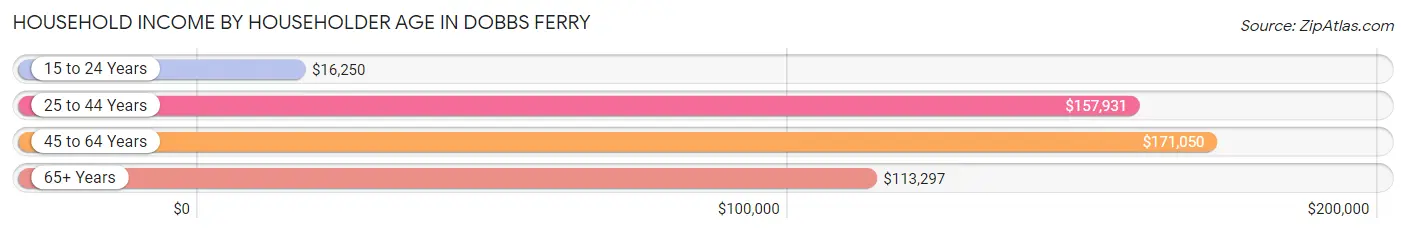
| Income Bracket | # Households | Median Income |
| 15 to 24 Years | 98 (2.6%) | $16,250 |
| 25 to 44 Years | 1,032 (27.2%) | $157,931 |
| 45 to 64 Years | 1,649 (43.5%) | $171,050 |
| 65+ Years | 1,015 (26.8%) | $113,297 |
| Total | 3,794 (100.0%) | $144,000 |
Poverty in Dobbs Ferry
Income Below Poverty by Sex and Age in Dobbs Ferry
With 5.1% poverty level for males and 5.8% for females among the residents of Dobbs Ferry, 18 to 24 year old males and 15 year old females are the most vulnerable to poverty, with 147 males (27.0%) and 31 females (34.8%) in their respective age groups living below the poverty level.
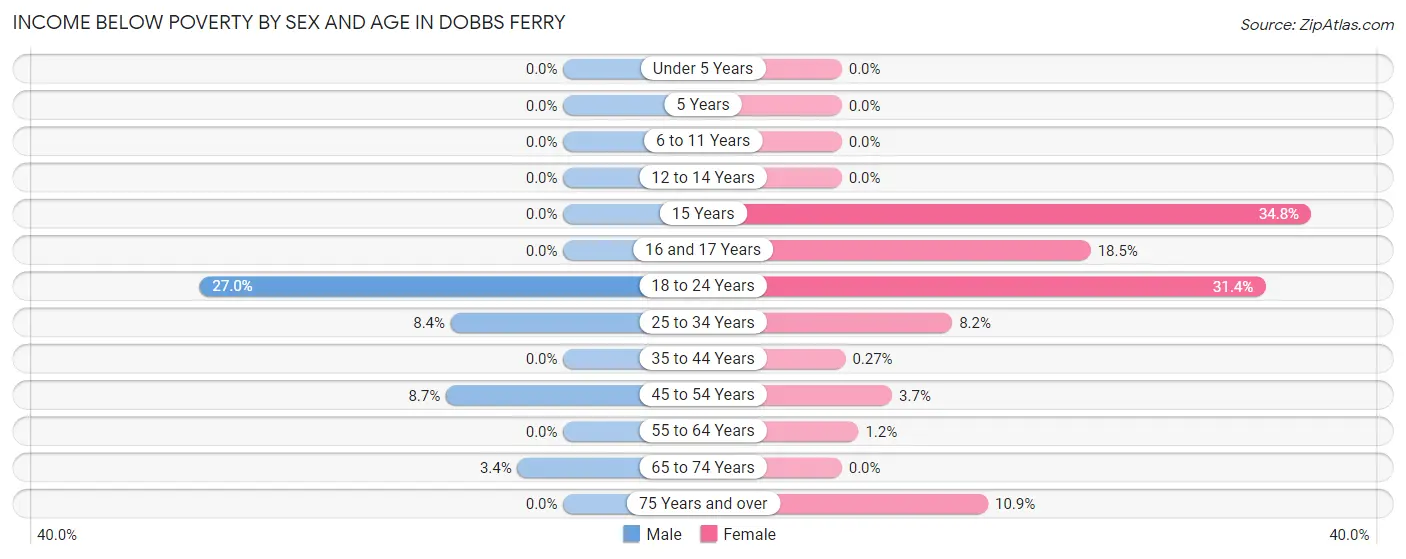
| Age Bracket | Male | Female |
| Under 5 Years | 0 (0.0%) | 0 (0.0%) |
| 5 Years | 0 (0.0%) | 0 (0.0%) |
| 6 to 11 Years | 0 (0.0%) | 0 (0.0%) |
| 12 to 14 Years | 0 (0.0%) | 0 (0.0%) |
| 15 Years | 0 (0.0%) | 31 (34.8%) |
| 16 and 17 Years | 0 (0.0%) | 17 (18.5%) |
| 18 to 24 Years | 147 (27.0%) | 143 (31.4%) |
| 25 to 34 Years | 44 (8.4%) | 50 (8.2%) |
| 35 to 44 Years | 0 (0.0%) | 2 (0.3%) |
| 45 to 54 Years | 63 (8.7%) | 27 (3.7%) |
| 55 to 64 Years | 0 (0.0%) | 11 (1.2%) |
| 65 to 74 Years | 21 (3.4%) | 0 (0.0%) |
| 75 Years and over | 0 (0.0%) | 24 (10.9%) |
| Total | 275 (5.1%) | 305 (5.8%) |
Income Above Poverty by Sex and Age in Dobbs Ferry
According to the poverty statistics in Dobbs Ferry, males aged under 5 years and females aged under 5 years are the age groups that are most secure financially, with 100.0% of males and 100.0% of females in these age groups living above the poverty line.
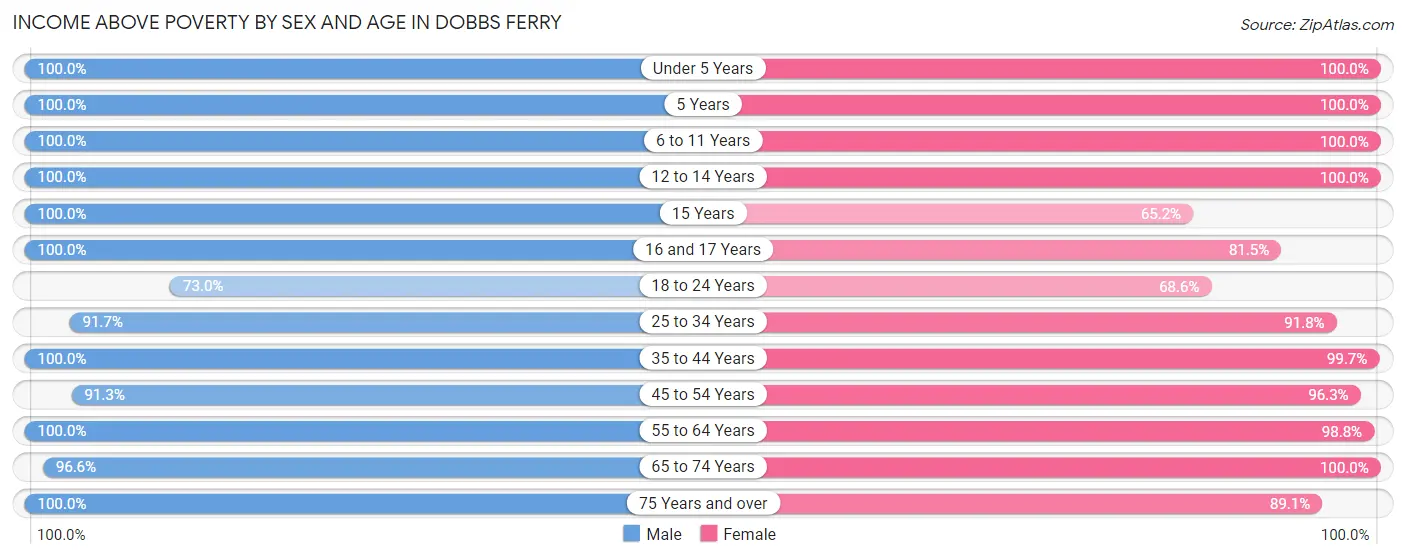
| Age Bracket | Male | Female |
| Under 5 Years | 286 (100.0%) | 306 (100.0%) |
| 5 Years | 37 (100.0%) | 87 (100.0%) |
| 6 to 11 Years | 372 (100.0%) | 332 (100.0%) |
| 12 to 14 Years | 402 (100.0%) | 203 (100.0%) |
| 15 Years | 164 (100.0%) | 58 (65.2%) |
| 16 and 17 Years | 141 (100.0%) | 75 (81.5%) |
| 18 to 24 Years | 397 (73.0%) | 312 (68.6%) |
| 25 to 34 Years | 483 (91.6%) | 560 (91.8%) |
| 35 to 44 Years | 673 (100.0%) | 740 (99.7%) |
| 45 to 54 Years | 660 (91.3%) | 695 (96.3%) |
| 55 to 64 Years | 641 (100.0%) | 878 (98.8%) |
| 65 to 74 Years | 597 (96.6%) | 526 (100.0%) |
| 75 Years and over | 256 (100.0%) | 197 (89.1%) |
| Total | 5,109 (94.9%) | 4,969 (94.2%) |
Income Below Poverty Among Married-Couple Families in Dobbs Ferry
The poverty statistics for married-couple families in Dobbs Ferry show that 1.3% or 29 of the total 2,328 families live below the poverty line. Families with 1 or 2 children have the highest poverty rate of 1.9%, comprising of 18 families. On the other hand, families with 3 or 4 children have the lowest poverty rate of 0.0%, which includes 0 families.
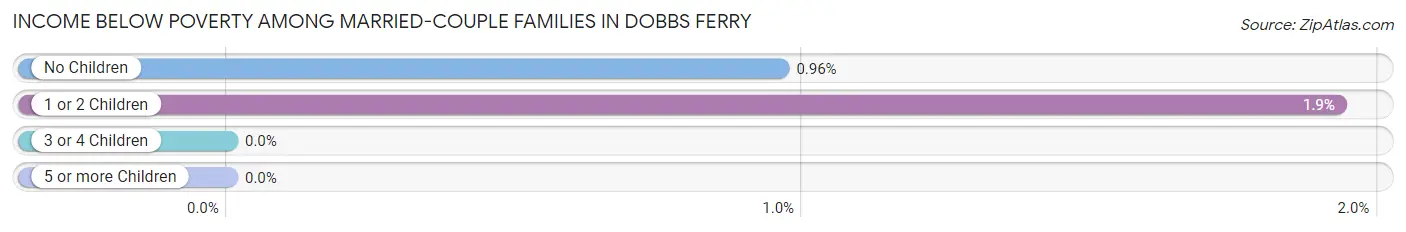
| Children | Above Poverty | Below Poverty |
| No Children | 1,137 (99.0%) | 11 (1.0%) |
| 1 or 2 Children | 913 (98.1%) | 18 (1.9%) |
| 3 or 4 Children | 249 (100.0%) | 0 (0.0%) |
| 5 or more Children | 0 (0.0%) | 0 (0.0%) |
| Total | 2,299 (98.8%) | 29 (1.3%) |
Income Below Poverty Among Single-Parent Households in Dobbs Ferry
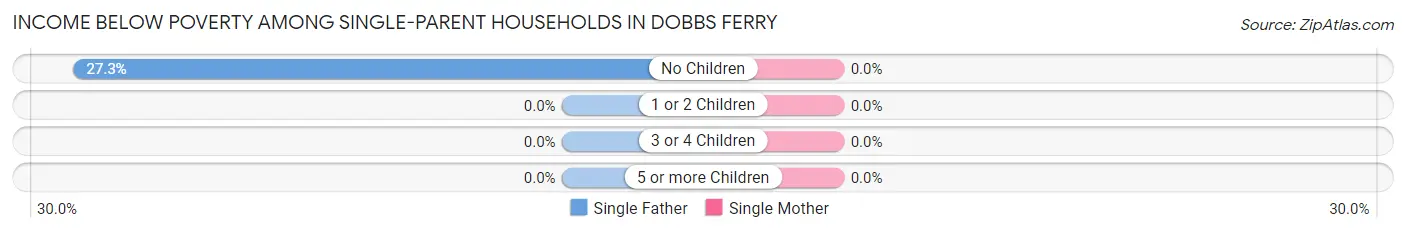
| Children | Single Father | Single Mother |
| No Children | 15 (27.3%) | 0 (0.0%) |
| 1 or 2 Children | 0 (0.0%) | 0 (0.0%) |
| 3 or 4 Children | 0 (0.0%) | 0 (0.0%) |
| 5 or more Children | 0 (0.0%) | 0 (0.0%) |
| Total | 15 (17.1%) | 0 (0.0%) |
Income Below Poverty Among Married-Couple vs Single-Parent Households in Dobbs Ferry
The poverty data for Dobbs Ferry shows that 29 of the married-couple family households (1.3%) and 15 of the single-parent households (2.6%) are living below the poverty level. Within the married-couple family households, those with 1 or 2 children have the highest poverty rate, with 18 households (1.9%) falling below the poverty line. Among the single-parent households, those with no children have the highest poverty rate, with 15 household (8.9%) living below poverty.
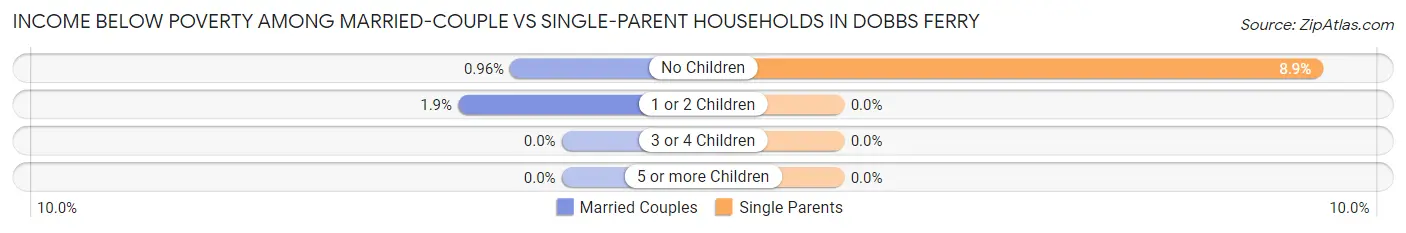
| Children | Married-Couple Families | Single-Parent Households |
| No Children | 11 (1.0%) | 15 (8.9%) |
| 1 or 2 Children | 18 (1.9%) | 0 (0.0%) |
| 3 or 4 Children | 0 (0.0%) | 0 (0.0%) |
| 5 or more Children | 0 (0.0%) | 0 (0.0%) |
| Total | 29 (1.3%) | 15 (2.6%) |
Race in Dobbs Ferry
The most populous races in Dobbs Ferry are White / Caucasian (8,197 | 71.7%), Hispanic or Latino (1,493 | 13.1%), and Asian (1,380 | 12.1%).
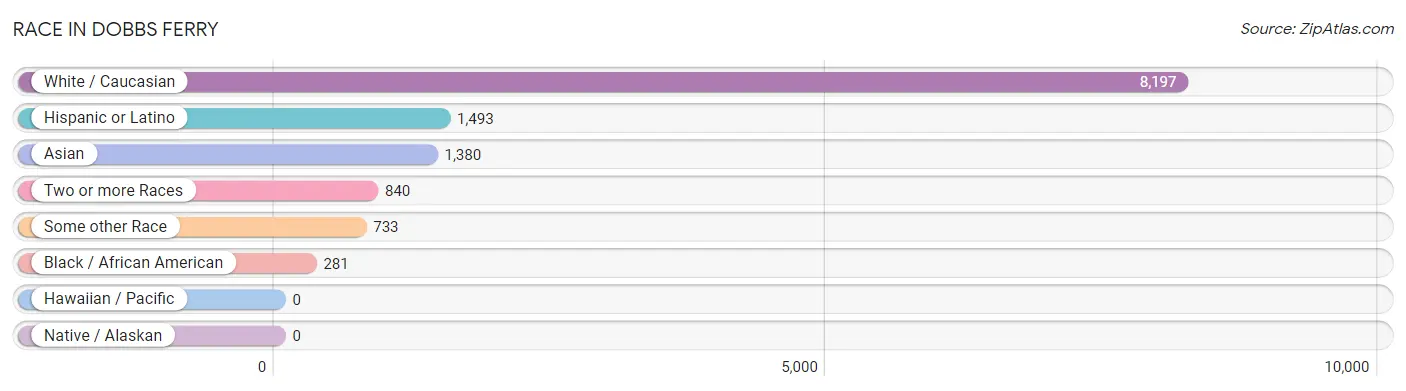
| Race | # Population | % Population |
| Asian | 1,380 | 12.1% |
| Black / African American | 281 | 2.5% |
| Hawaiian / Pacific | 0 | 0.0% |
| Hispanic or Latino | 1,493 | 13.1% |
| Native / Alaskan | 0 | 0.0% |
| White / Caucasian | 8,197 | 71.7% |
| Two or more Races | 840 | 7.3% |
| Some other Race | 733 | 6.4% |
| Total | 11,431 | 100.0% |
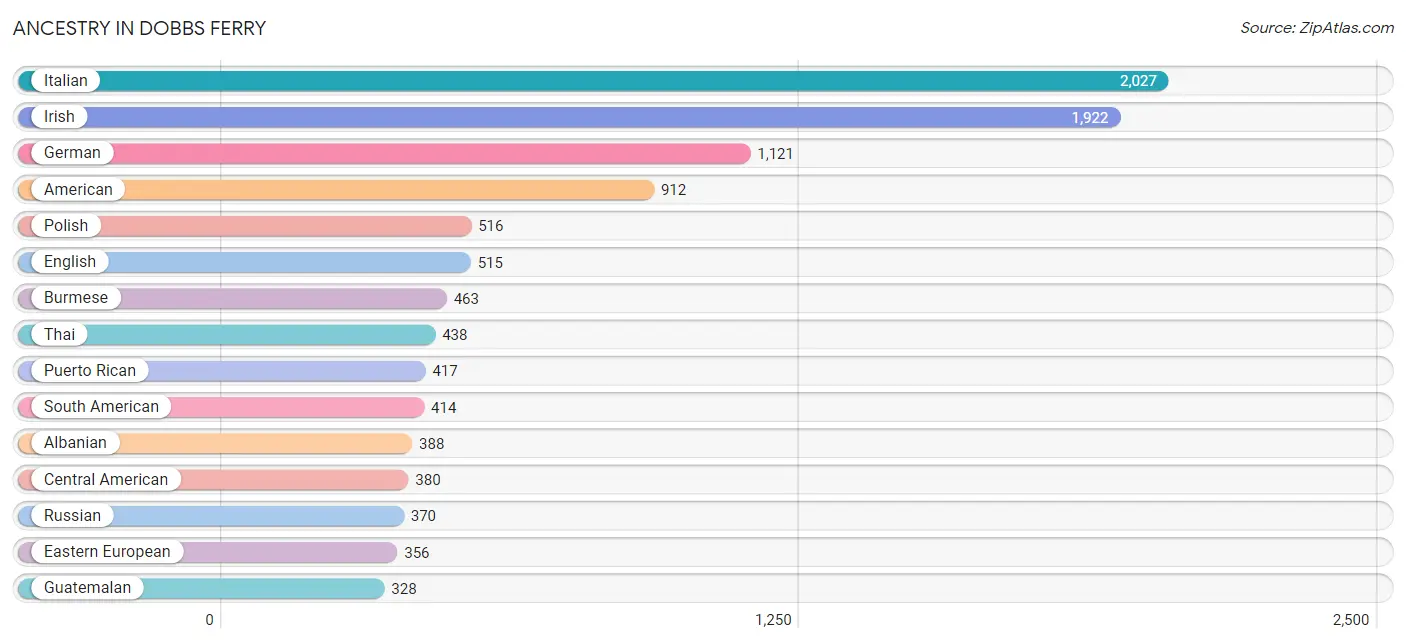
Ancestry in Dobbs Ferry
The most populous ancestries reported in Dobbs Ferry are Italian (2,027 | 17.7%), Irish (1,922 | 16.8%), German (1,121 | 9.8%), American (912 | 8.0%), and Polish (516 | 4.5%), together accounting for 56.8% of all Dobbs Ferry residents.
| Ancestry | # Population | % Population |
| Afghan | 45 | 0.4% |
| Albanian | 388 | 3.4% |
| American | 912 | 8.0% |
| Arab | 89 | 0.8% |
| Argentinean | 122 | 1.1% |
| Armenian | 11 | 0.1% |
| Australian | 23 | 0.2% |
| Austrian | 30 | 0.3% |
| Belgian | 40 | 0.4% |
| Belizean | 47 | 0.4% |
| Bhutanese | 265 | 2.3% |
| British | 19 | 0.2% |
| Bulgarian | 29 | 0.3% |
| Burmese | 463 | 4.1% |
| Canadian | 17 | 0.2% |
| Central American | 380 | 3.3% |
| Central American Indian | 20 | 0.2% |
| Cherokee | 33 | 0.3% |
| Croatian | 93 | 0.8% |
| Cuban | 37 | 0.3% |
| Czech | 23 | 0.2% |
| Czechoslovakian | 3 | 0.0% |
| Danish | 14 | 0.1% |
| Dominican | 115 | 1.0% |
| Dutch | 81 | 0.7% |
| Eastern European | 356 | 3.1% |
| Ecuadorian | 184 | 1.6% |
| Egyptian | 36 | 0.3% |
| English | 515 | 4.5% |
| European | 120 | 1.1% |
| French | 67 | 0.6% |
| French Canadian | 7 | 0.1% |
| German | 1,121 | 9.8% |
| Ghanaian | 6 | 0.1% |
| Greek | 143 | 1.3% |
| Guatemalan | 328 | 2.9% |
| Haitian | 39 | 0.3% |
| Hungarian | 4 | 0.0% |
| Indian (Asian) | 201 | 1.8% |
| Iranian | 28 | 0.2% |
| Irish | 1,922 | 16.8% |
| Israeli | 24 | 0.2% |
| Italian | 2,027 | 17.7% |
| Jamaican | 13 | 0.1% |
| Korean | 164 | 1.4% |
| Lithuanian | 11 | 0.1% |
| Mexican | 41 | 0.4% |
| New Zealander | 7 | 0.1% |
| Nigerian | 10 | 0.1% |
| Norwegian | 19 | 0.2% |
| Pakistani | 1 | 0.0% |
| Palestinian | 27 | 0.2% |
| Pennsylvania German | 10 | 0.1% |
| Peruvian | 80 | 0.7% |
| Polish | 516 | 4.5% |
| Portuguese | 61 | 0.5% |
| Puerto Rican | 417 | 3.6% |
| Romanian | 10 | 0.1% |
| Russian | 370 | 3.2% |
| Salvadoran | 5 | 0.0% |
| Scottish | 59 | 0.5% |
| Serbian | 2 | 0.0% |
| Slovak | 36 | 0.3% |
| South African | 68 | 0.6% |
| South American | 414 | 3.6% |
| Soviet Union | 6 | 0.1% |
| Spaniard | 18 | 0.2% |
| Subsaharan African | 84 | 0.7% |
| Swedish | 38 | 0.3% |
| Swiss | 28 | 0.2% |
| Thai | 438 | 3.8% |
| Ukrainian | 188 | 1.6% |
| Venezuelan | 28 | 0.2% |
| Welsh | 81 | 0.7% | View All 74 Rows |
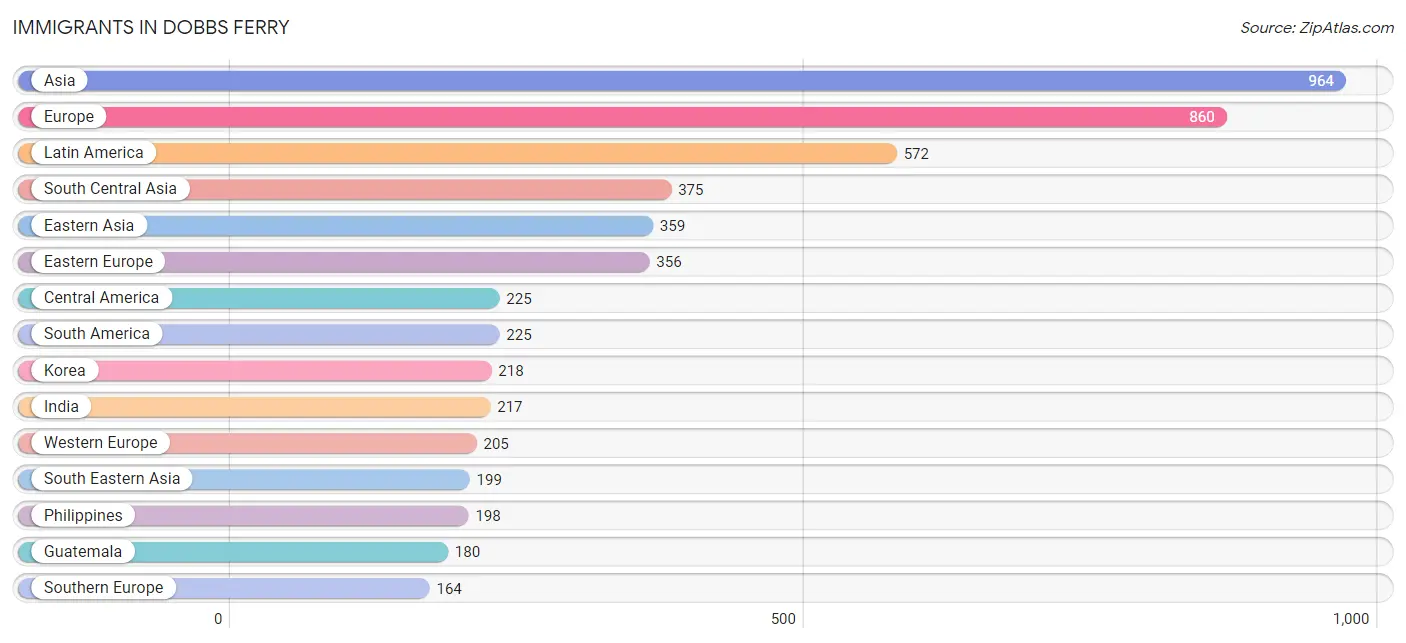
Immigrants in Dobbs Ferry
The most numerous immigrant groups reported in Dobbs Ferry came from Asia (964 | 8.4%), Europe (860 | 7.5%), Latin America (572 | 5.0%), South Central Asia (375 | 3.3%), and Eastern Asia (359 | 3.1%), together accounting for 27.4% of all Dobbs Ferry residents.
| Immigration Origin | # Population | % Population |
| Afghanistan | 45 | 0.4% |
| Africa | 141 | 1.2% |
| Albania | 72 | 0.6% |
| Argentina | 122 | 1.1% |
| Asia | 964 | 8.4% |
| Australia | 23 | 0.2% |
| Bangladesh | 104 | 0.9% |
| Belize | 24 | 0.2% |
| Bosnia and Herzegovina | 2 | 0.0% |
| Brazil | 23 | 0.2% |
| Bulgaria | 9 | 0.1% |
| Canada | 89 | 0.8% |
| Caribbean | 122 | 1.1% |
| Central America | 225 | 2.0% |
| China | 84 | 0.7% |
| Croatia | 89 | 0.8% |
| Cuba | 24 | 0.2% |
| Dominican Republic | 86 | 0.7% |
| Eastern Africa | 15 | 0.1% |
| Eastern Asia | 359 | 3.1% |
| Eastern Europe | 356 | 3.1% |
| Ecuador | 64 | 0.6% |
| Egypt | 36 | 0.3% |
| England | 23 | 0.2% |
| Europe | 860 | 7.5% |
| France | 56 | 0.5% |
| Germany | 93 | 0.8% |
| Guatemala | 180 | 1.6% |
| India | 217 | 1.9% |
| Ireland | 59 | 0.5% |
| Israel | 24 | 0.2% |
| Italy | 155 | 1.4% |
| Jamaica | 12 | 0.1% |
| Japan | 57 | 0.5% |
| Kenya | 15 | 0.1% |
| Korea | 218 | 1.9% |
| Kuwait | 4 | 0.0% |
| Latin America | 572 | 5.0% |
| Mexico | 21 | 0.2% |
| Nepal | 9 | 0.1% |
| Netherlands | 56 | 0.5% |
| Nigeria | 5 | 0.0% |
| Northern Africa | 36 | 0.3% |
| Northern Europe | 135 | 1.2% |
| Norway | 19 | 0.2% |
| Oceania | 23 | 0.2% |
| Philippines | 198 | 1.7% |
| Portugal | 9 | 0.1% |
| Romania | 19 | 0.2% |
| Russia | 73 | 0.6% |
| Serbia | 79 | 0.7% |
| South Africa | 85 | 0.7% |
| South America | 225 | 2.0% |
| South Central Asia | 375 | 3.3% |
| South Eastern Asia | 199 | 1.7% |
| Southern Europe | 164 | 1.4% |
| Taiwan | 8 | 0.1% |
| Thailand | 1 | 0.0% |
| Ukraine | 7 | 0.1% |
| Venezuela | 16 | 0.1% |
| Western Africa | 5 | 0.0% |
| Western Asia | 28 | 0.2% |
| Western Europe | 205 | 1.8% | View All 63 Rows |
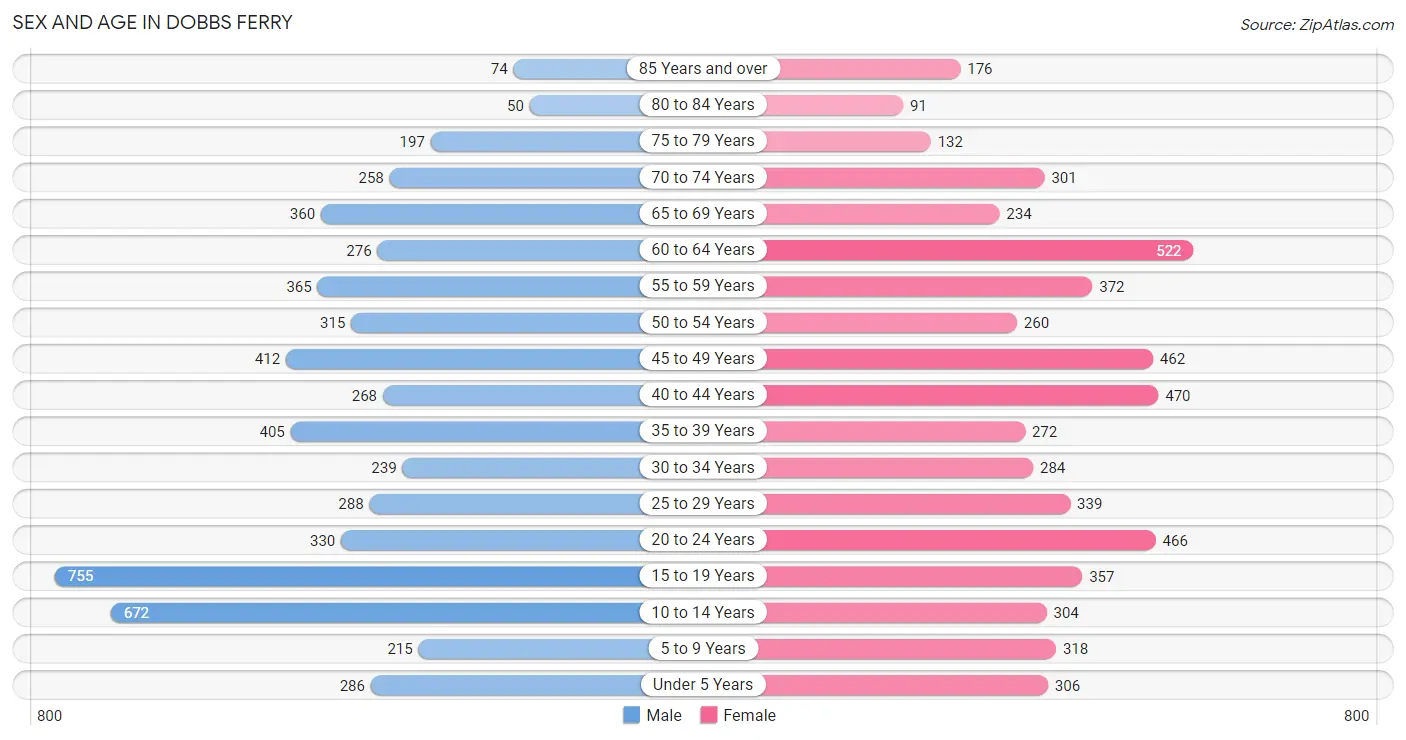
Sex and Age in Dobbs Ferry
Sex and Age in Dobbs Ferry
The most populous age groups in Dobbs Ferry are 15 to 19 Years (755 | 13.1%) for men and 60 to 64 Years (522 | 9.2%) for women.
| Age Bracket | Male | Female |
| Under 5 Years | 286 (5.0%) | 306 (5.4%) |
| 5 to 9 Years | 215 (3.7%) | 318 (5.6%) |
| 10 to 14 Years | 672 (11.7%) | 304 (5.4%) |
| 15 to 19 Years | 755 (13.1%) | 357 (6.3%) |
| 20 to 24 Years | 330 (5.7%) | 466 (8.2%) |
| 25 to 29 Years | 288 (5.0%) | 339 (6.0%) |
| 30 to 34 Years | 239 (4.2%) | 284 (5.0%) |
| 35 to 39 Years | 405 (7.0%) | 272 (4.8%) |
| 40 to 44 Years | 268 (4.6%) | 470 (8.3%) |
| 45 to 49 Years | 412 (7.1%) | 462 (8.2%) |
| 50 to 54 Years | 315 (5.5%) | 260 (4.6%) |
| 55 to 59 Years | 365 (6.3%) | 372 (6.6%) |
| 60 to 64 Years | 276 (4.8%) | 522 (9.2%) |
| 65 to 69 Years | 360 (6.2%) | 234 (4.1%) |
| 70 to 74 Years | 258 (4.5%) | 301 (5.3%) |
| 75 to 79 Years | 197 (3.4%) | 132 (2.3%) |
| 80 to 84 Years | 50 (0.9%) | 91 (1.6%) |
| 85 Years and over | 74 (1.3%) | 176 (3.1%) |
| Total | 5,765 (100.0%) | 5,666 (100.0%) |
Families and Households in Dobbs Ferry
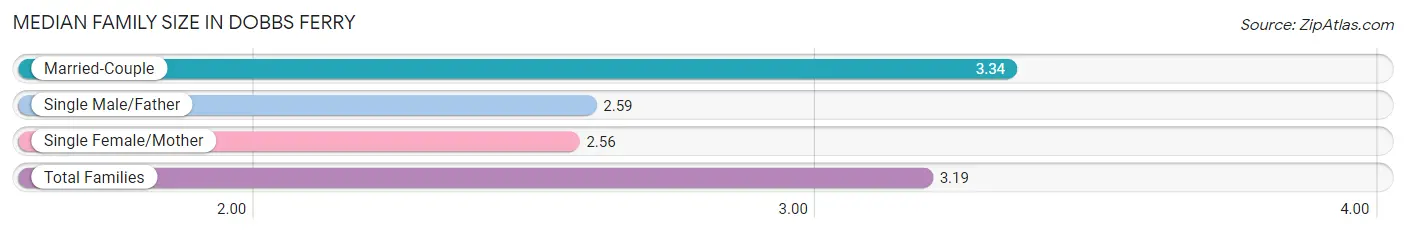
Median Family Size in Dobbs Ferry
The median family size in Dobbs Ferry is 3.19 persons per family, with married-couple families (2,328 | 80.3%) accounting for the largest median family size of 3.34 persons per family. On the other hand, single female/mother families (482 | 16.6%) represent the smallest median family size with 2.56 persons per family.
| Family Type | # Families | Family Size |
| Married-Couple | 2,328 (80.3%) | 3.34 |
| Single Male/Father | 88 (3.0%) | 2.59 |
| Single Female/Mother | 482 (16.6%) | 2.56 |
| Total Families | 2,898 (100.0%) | 3.19 |
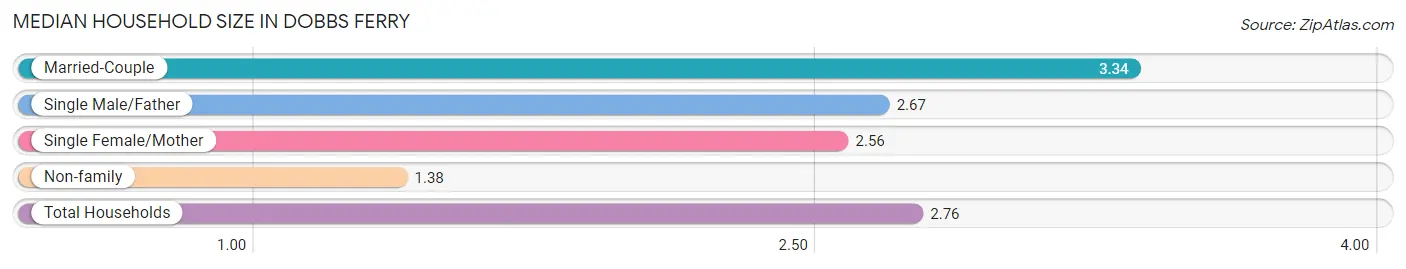
Median Household Size in Dobbs Ferry
The median household size in Dobbs Ferry is 2.76 persons per household, with married-couple households (2,328 | 61.4%) accounting for the largest median household size of 3.34 persons per household. non-family households (896 | 23.6%) represent the smallest median household size with 1.38 persons per household.
| Household Type | # Households | Household Size |
| Married-Couple | 2,328 (61.4%) | 3.34 |
| Single Male/Father | 88 (2.3%) | 2.67 |
| Single Female/Mother | 482 (12.7%) | 2.56 |
| Non-family | 896 (23.6%) | 1.38 |
| Total Households | 3,794 (100.0%) | 2.76 |
Household Size by Marriage Status in Dobbs Ferry
Out of a total of 3,794 households in Dobbs Ferry, 2,898 (76.4%) are family households, while 896 (23.6%) are nonfamily households. The most numerous type of family households are 2-person households, comprising 1,075, and the most common type of nonfamily households are 1-person households, comprising 750.
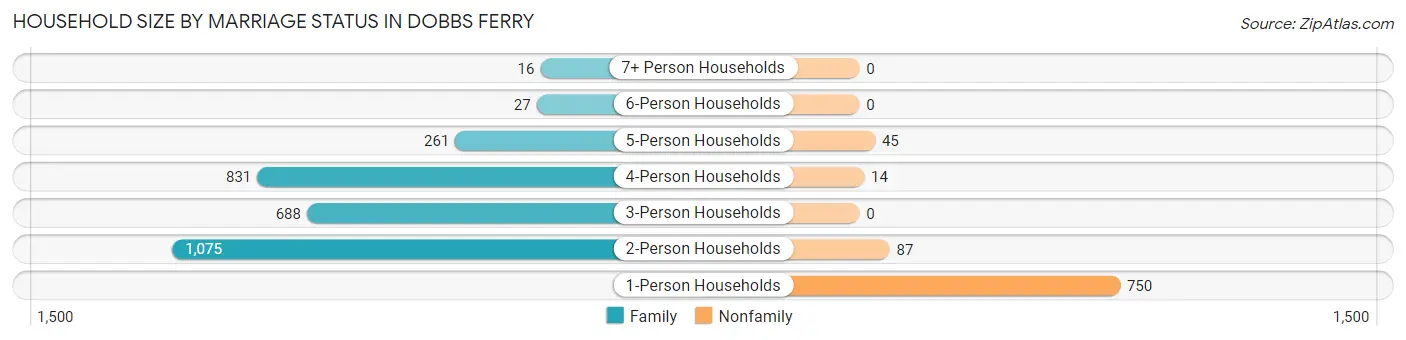
| Household Size | Family Households | Nonfamily Households |
| 1-Person Households | - | 750 (19.8%) |
| 2-Person Households | 1,075 (28.3%) | 87 (2.3%) |
| 3-Person Households | 688 (18.1%) | 0 (0.0%) |
| 4-Person Households | 831 (21.9%) | 14 (0.4%) |
| 5-Person Households | 261 (6.9%) | 45 (1.2%) |
| 6-Person Households | 27 (0.7%) | 0 (0.0%) |
| 7+ Person Households | 16 (0.4%) | 0 (0.0%) |
| Total | 2,898 (76.4%) | 896 (23.6%) |
Female Fertility in Dobbs Ferry
Fertility by Age in Dobbs Ferry
Average fertility rate in Dobbs Ferry is 28.0 births per 1,000 women. Women in the age bracket of 20 to 34 years have the highest fertility rate with 56.0 births per 1,000 women. Women in the age bracket of 20 to 34 years acount for 79.2% of all women with births.
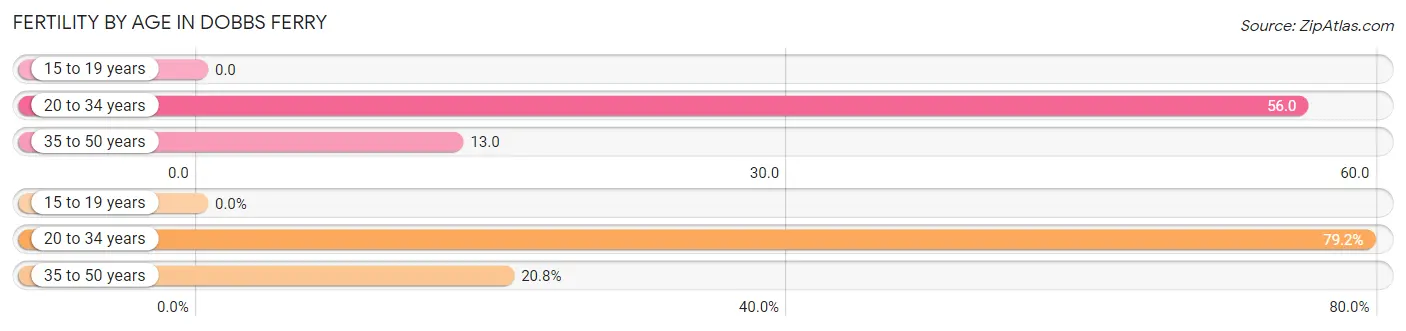
| Age Bracket | Women with Births | Births / 1,000 Women |
| 15 to 19 years | 0 (0.0%) | 0.0 |
| 20 to 34 years | 61 (79.2%) | 56.0 |
| 35 to 50 years | 16 (20.8%) | 13.0 |
| Total | 77 (100.0%) | 28.0 |
Fertility by Age by Marriage Status in Dobbs Ferry
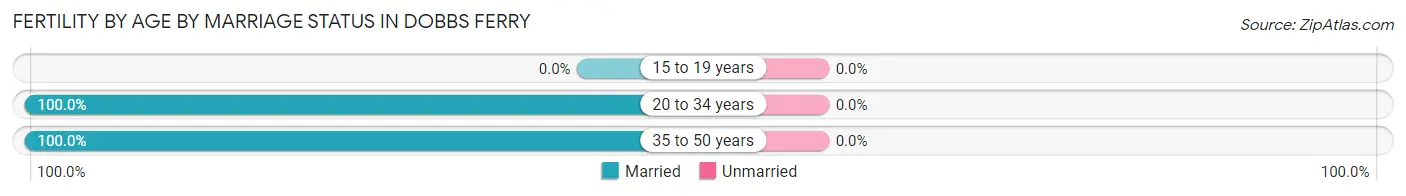
| Age Bracket | Married | Unmarried |
| 15 to 19 years | 0 (0.0%) | 0 (0.0%) |
| 20 to 34 years | 61 (100.0%) | 0 (0.0%) |
| 35 to 50 years | 16 (100.0%) | 0 (0.0%) |
| Total | 77 (100.0%) | 0 (0.0%) |
Fertility by Education in Dobbs Ferry
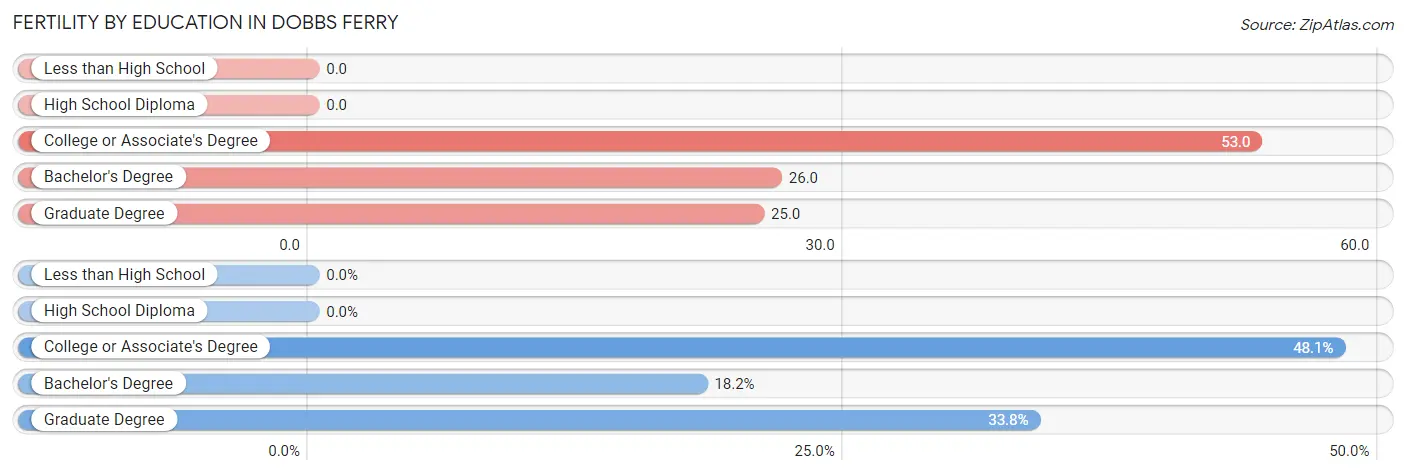
| Educational Attainment | Women with Births | Births / 1,000 Women |
| Less than High School | 0 (0.0%) | 0.0 |
| High School Diploma | 0 (0.0%) | 0.0 |
| College or Associate's Degree | 37 (48.0%) | 53.0 |
| Bachelor's Degree | 14 (18.2%) | 26.0 |
| Graduate Degree | 26 (33.8%) | 25.0 |
| Total | 77 (100.0%) | 28.0 |
Fertility by Education by Marriage Status in Dobbs Ferry
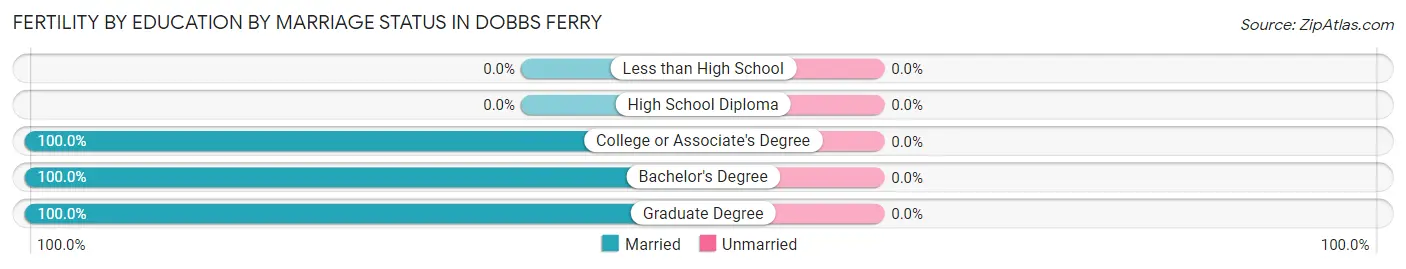
| Educational Attainment | Married | Unmarried |
| Less than High School | 0 (0.0%) | 0 (0.0%) |
| High School Diploma | 0 (0.0%) | 0 (0.0%) |
| College or Associate's Degree | 37 (100.0%) | 0 (0.0%) |
| Bachelor's Degree | 14 (100.0%) | 0 (0.0%) |
| Graduate Degree | 26 (100.0%) | 0 (0.0%) |
| Total | 77 (100.0%) | 0 (0.0%) |
Employment Characteristics in Dobbs Ferry
Employment by Class of Employer in Dobbs Ferry
Among the 5,767 employed individuals in Dobbs Ferry, private company employees (3,433 | 59.5%), not-for-profit organizations (798 | 13.8%), and local government employees (550 | 9.5%) make up the most common classes of employment.
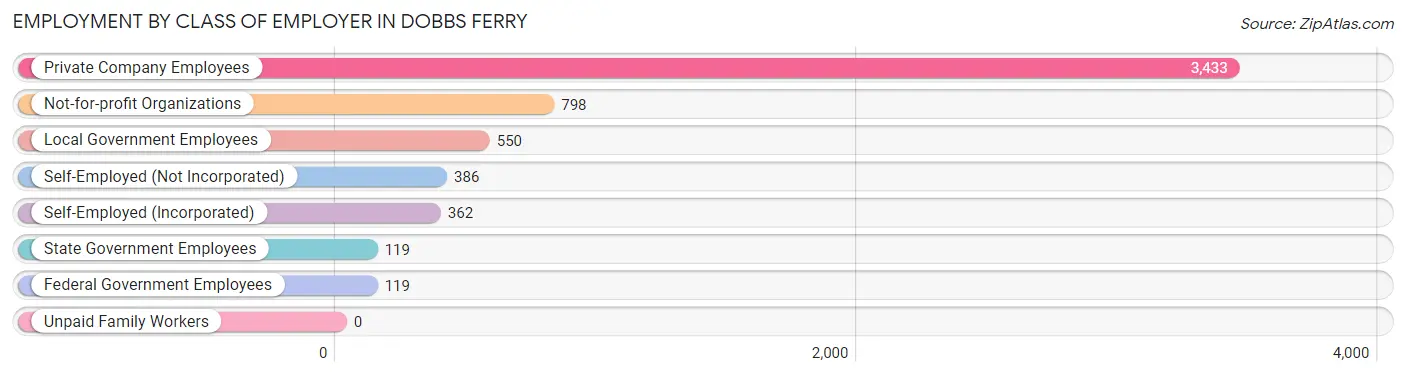
| Employer Class | # Employees | % Employees |
| Private Company Employees | 3,433 | 59.5% |
| Self-Employed (Incorporated) | 362 | 6.3% |
| Self-Employed (Not Incorporated) | 386 | 6.7% |
| Not-for-profit Organizations | 798 | 13.8% |
| Local Government Employees | 550 | 9.5% |
| State Government Employees | 119 | 2.1% |
| Federal Government Employees | 119 | 2.1% |
| Unpaid Family Workers | 0 | 0.0% |
| Total | 5,767 | 100.0% |
Employment Status by Age in Dobbs Ferry
According to the labor force statistics for Dobbs Ferry, out of the total population over 16 years of age (9,016), 69.2% or 6,239 individuals are in the labor force, with 5.8% or 362 of them unemployed. The age group with the highest labor force participation rate is 30 to 34 years, with 96.6% or 505 individuals in the labor force. Within the labor force, the 20 to 24 years age range has the highest percentage of unemployed individuals, with 13.6% or 88 of them being unemployed.
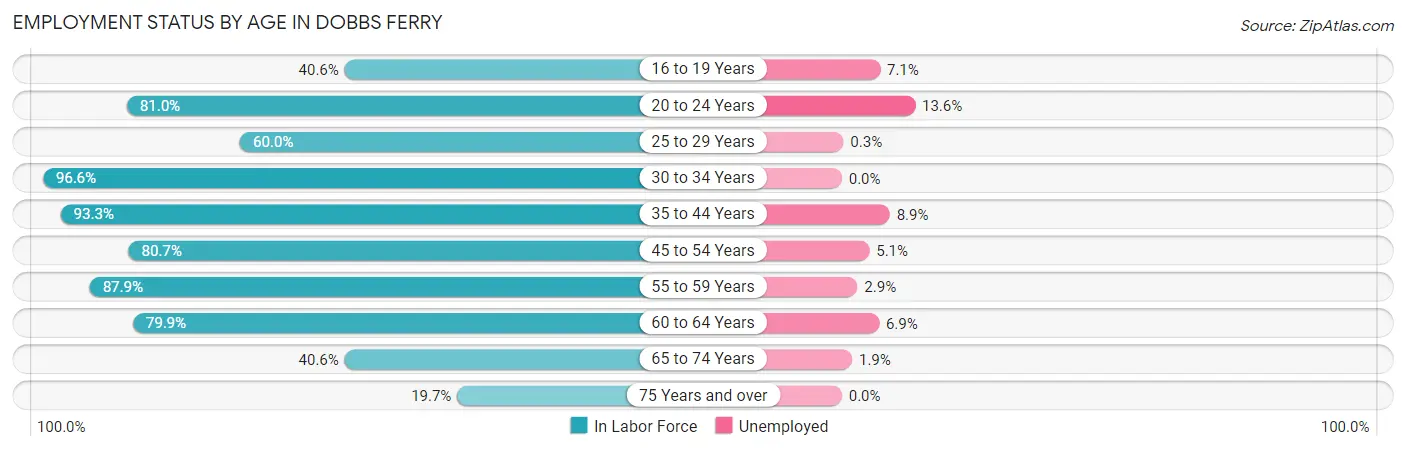
| Age Bracket | In Labor Force | Unemployed |
| 16 to 19 Years | 324 (40.6%) | 23 (7.1%) |
| 20 to 24 Years | 645 (81.0%) | 88 (13.6%) |
| 25 to 29 Years | 376 (60.0%) | 1 (0.3%) |
| 30 to 34 Years | 505 (96.6%) | 0 (0.0%) |
| 35 to 44 Years | 1,320 (93.3%) | 117 (8.9%) |
| 45 to 54 Years | 1,169 (80.7%) | 60 (5.1%) |
| 55 to 59 Years | 648 (87.9%) | 19 (2.9%) |
| 60 to 64 Years | 638 (79.9%) | 44 (6.9%) |
| 65 to 74 Years | 468 (40.6%) | 9 (1.9%) |
| 75 Years and over | 142 (19.7%) | 0 (0.0%) |
| Total | 6,239 (69.2%) | 362 (5.8%) |
Employment Status by Educational Attainment in Dobbs Ferry
According to labor force statistics for Dobbs Ferry, 83.9% of individuals (4,656) out of the total population between 25 and 64 years of age (5,549) are in the labor force, with 5.2% or 242 of them being unemployed. The group with the highest labor force participation rate are those with the educational attainment of bachelor's degree or higher, with 87.8% or 3,534 individuals in the labor force. Within the labor force, individuals with less than high school education have the highest percentage of unemployment, with 16.0% or 32 of them being unemployed.
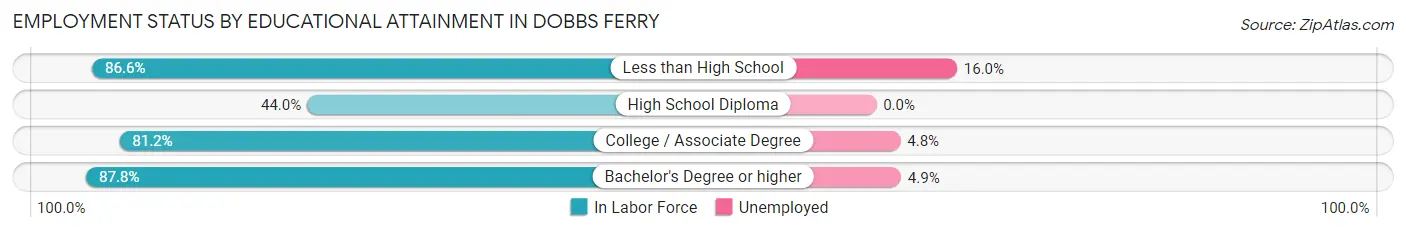
| Educational Attainment | In Labor Force | Unemployed |
| Less than High School | 200 (86.6%) | 37 (16.0%) |
| High School Diploma | 150 (44.0%) | 0 (0.0%) |
| College / Associate Degree | 773 (81.2%) | 46 (4.8%) |
| Bachelor's Degree or higher | 3,534 (87.8%) | 197 (4.9%) |
| Total | 4,656 (83.9%) | 289 (5.2%) |
Employment Occupations by Sex in Dobbs Ferry
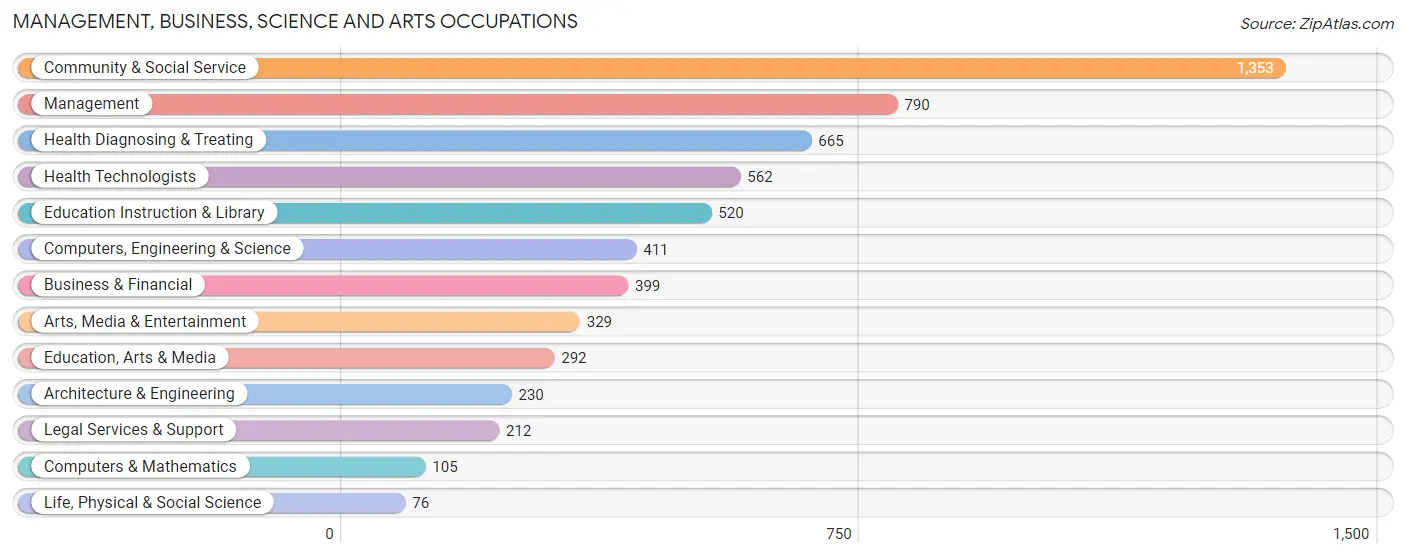
Management, Business, Science and Arts Occupations
The most common Management, Business, Science and Arts occupations in Dobbs Ferry are Community & Social Service (1,353 | 23.0%), Management (790 | 13.5%), Health Diagnosing & Treating (665 | 11.3%), Health Technologists (562 | 9.6%), and Education Instruction & Library (520 | 8.8%).
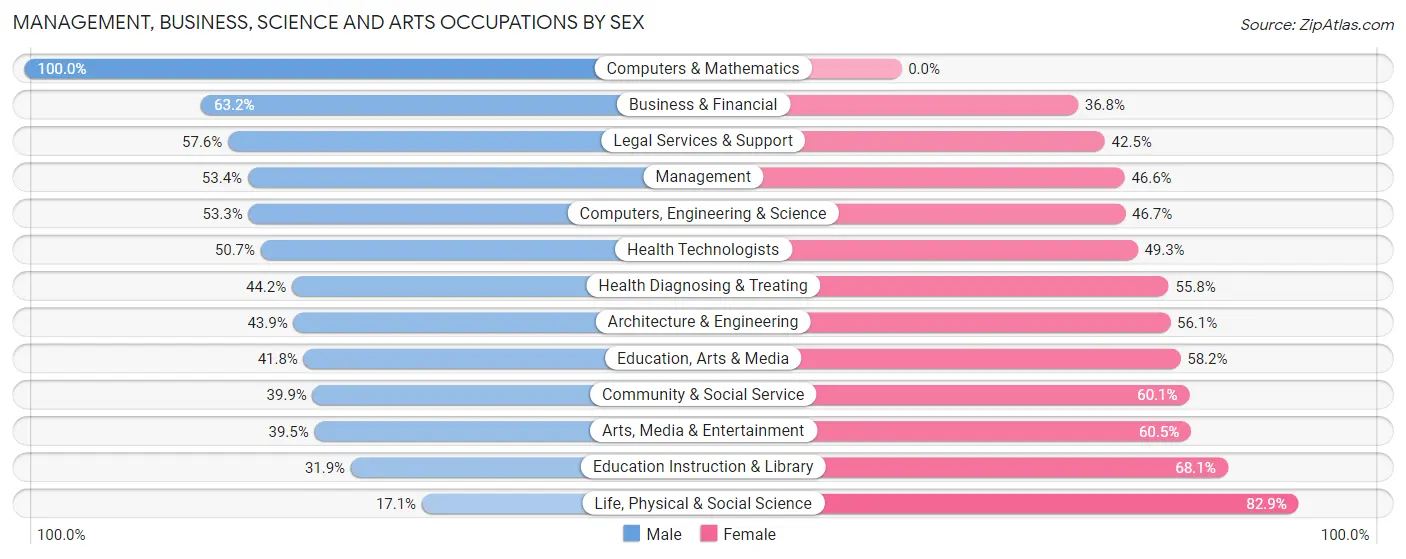
Management, Business, Science and Arts Occupations by Sex
Within the Management, Business, Science and Arts occupations in Dobbs Ferry, the most male-oriented occupations are Computers & Mathematics (100.0%), Business & Financial (63.2%), and Legal Services & Support (57.6%), while the most female-oriented occupations are Life, Physical & Social Science (82.9%), Education Instruction & Library (68.1%), and Arts, Media & Entertainment (60.5%).
| Occupation | Male | Female |
| Management | 422 (53.4%) | 368 (46.6%) |
| Business & Financial | 252 (63.2%) | 147 (36.8%) |
| Computers, Engineering & Science | 219 (53.3%) | 192 (46.7%) |
| Computers & Mathematics | 105 (100.0%) | 0 (0.0%) |
| Architecture & Engineering | 101 (43.9%) | 129 (56.1%) |
| Life, Physical & Social Science | 13 (17.1%) | 63 (82.9%) |
| Community & Social Service | 540 (39.9%) | 813 (60.1%) |
| Education, Arts & Media | 122 (41.8%) | 170 (58.2%) |
| Legal Services & Support | 122 (57.6%) | 90 (42.4%) |
| Education Instruction & Library | 166 (31.9%) | 354 (68.1%) |
| Arts, Media & Entertainment | 130 (39.5%) | 199 (60.5%) |
| Health Diagnosing & Treating | 294 (44.2%) | 371 (55.8%) |
| Health Technologists | 285 (50.7%) | 277 (49.3%) |
| Total (Category) | 1,727 (47.7%) | 1,891 (52.3%) |
| Total (Overall) | 2,746 (46.8%) | 3,128 (53.2%) |
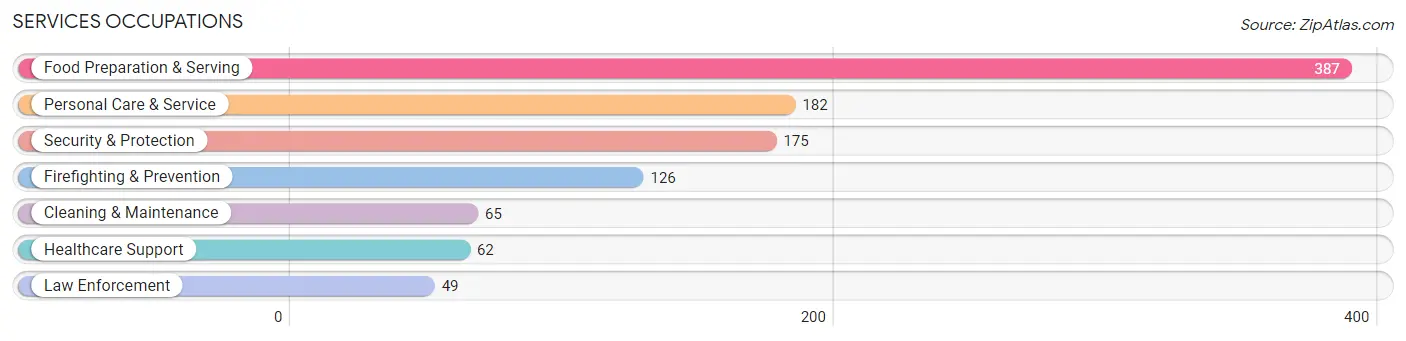
Services Occupations
The most common Services occupations in Dobbs Ferry are Food Preparation & Serving (387 | 6.6%), Personal Care & Service (182 | 3.1%), Security & Protection (175 | 3.0%), Firefighting & Prevention (126 | 2.1%), and Cleaning & Maintenance (65 | 1.1%).
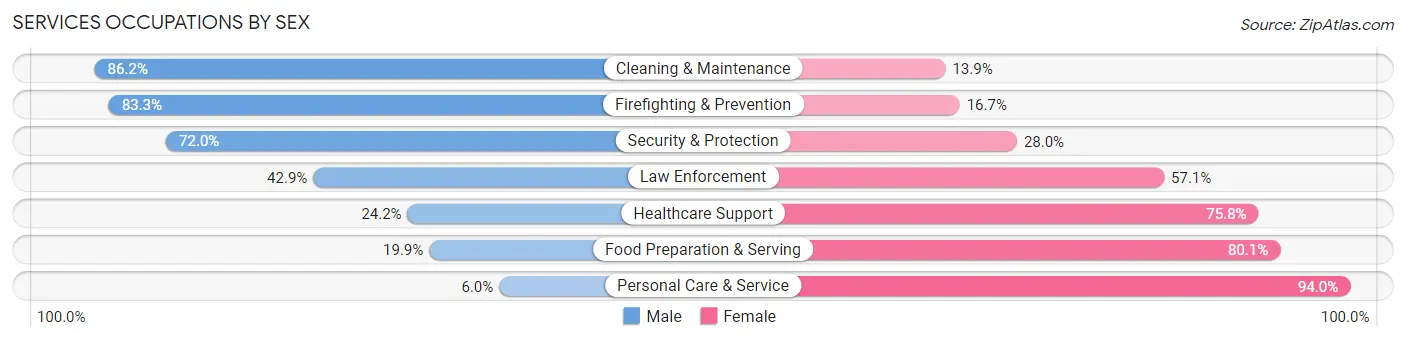
Services Occupations by Sex
Within the Services occupations in Dobbs Ferry, the most male-oriented occupations are Cleaning & Maintenance (86.2%), Firefighting & Prevention (83.3%), and Security & Protection (72.0%), while the most female-oriented occupations are Personal Care & Service (94.0%), Food Preparation & Serving (80.1%), and Healthcare Support (75.8%).
| Occupation | Male | Female |
| Healthcare Support | 15 (24.2%) | 47 (75.8%) |
| Security & Protection | 126 (72.0%) | 49 (28.0%) |
| Firefighting & Prevention | 105 (83.3%) | 21 (16.7%) |
| Law Enforcement | 21 (42.9%) | 28 (57.1%) |
| Food Preparation & Serving | 77 (19.9%) | 310 (80.1%) |
| Cleaning & Maintenance | 56 (86.2%) | 9 (13.9%) |
| Personal Care & Service | 11 (6.0%) | 171 (94.0%) |
| Total (Category) | 285 (32.7%) | 586 (67.3%) |
| Total (Overall) | 2,746 (46.8%) | 3,128 (53.2%) |
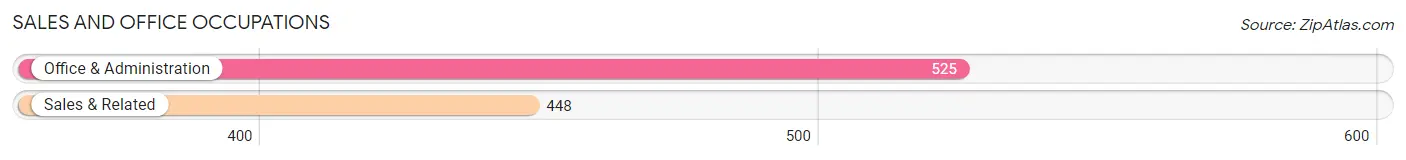
Sales and Office Occupations
The most common Sales and Office occupations in Dobbs Ferry are Office & Administration (525 | 8.9%), and Sales & Related (448 | 7.6%).
Sales and Office Occupations by Sex
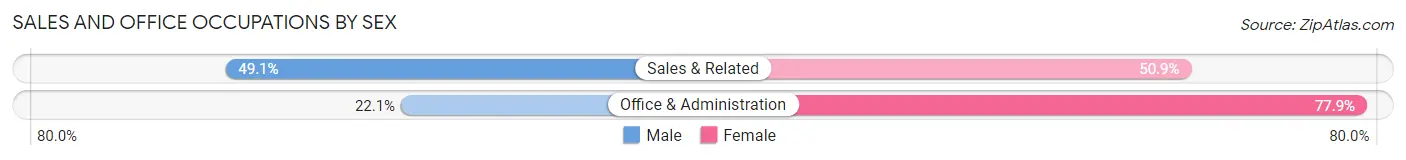
| Occupation | Male | Female |
| Sales & Related | 220 (49.1%) | 228 (50.9%) |
| Office & Administration | 116 (22.1%) | 409 (77.9%) |
| Total (Category) | 336 (34.5%) | 637 (65.5%) |
| Total (Overall) | 2,746 (46.8%) | 3,128 (53.2%) |
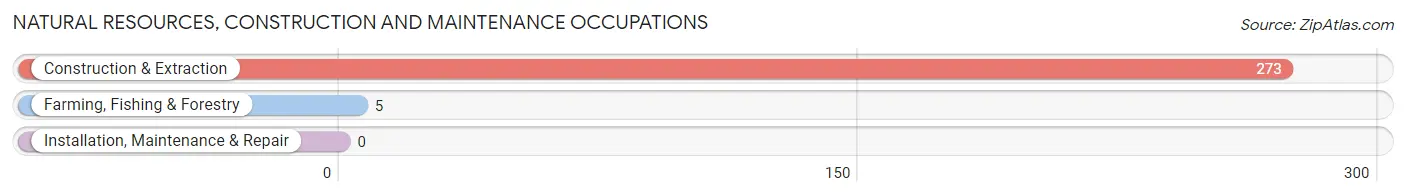
Natural Resources, Construction and Maintenance Occupations
The most common Natural Resources, Construction and Maintenance occupations in Dobbs Ferry are Construction & Extraction (273 | 4.6%), and Farming, Fishing & Forestry (5 | 0.1%).
Natural Resources, Construction and Maintenance Occupations by Sex
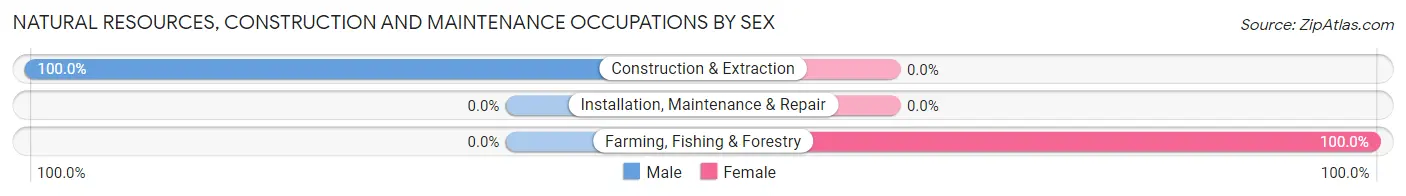
| Occupation | Male | Female |
| Farming, Fishing & Forestry | 0 (0.0%) | 5 (100.0%) |
| Construction & Extraction | 273 (100.0%) | 0 (0.0%) |
| Installation, Maintenance & Repair | 0 (0.0%) | 0 (0.0%) |
| Total (Category) | 273 (98.2%) | 5 (1.8%) |
| Total (Overall) | 2,746 (46.8%) | 3,128 (53.2%) |
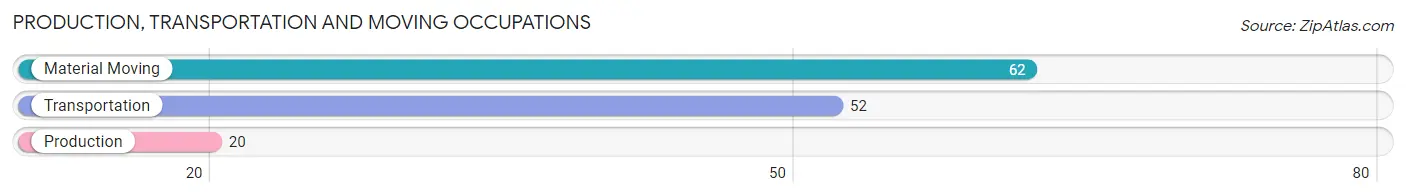
Production, Transportation and Moving Occupations
The most common Production, Transportation and Moving occupations in Dobbs Ferry are Material Moving (62 | 1.1%), Transportation (52 | 0.9%), and Production (20 | 0.3%).
Production, Transportation and Moving Occupations by Sex
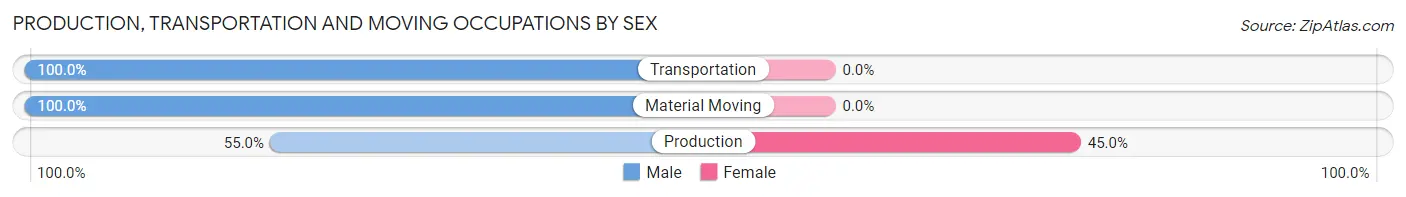
| Occupation | Male | Female |
| Production | 11 (55.0%) | 9 (45.0%) |
| Transportation | 52 (100.0%) | 0 (0.0%) |
| Material Moving | 62 (100.0%) | 0 (0.0%) |
| Total (Category) | 125 (93.3%) | 9 (6.7%) |
| Total (Overall) | 2,746 (46.8%) | 3,128 (53.2%) |
Employment Industries by Sex in Dobbs Ferry
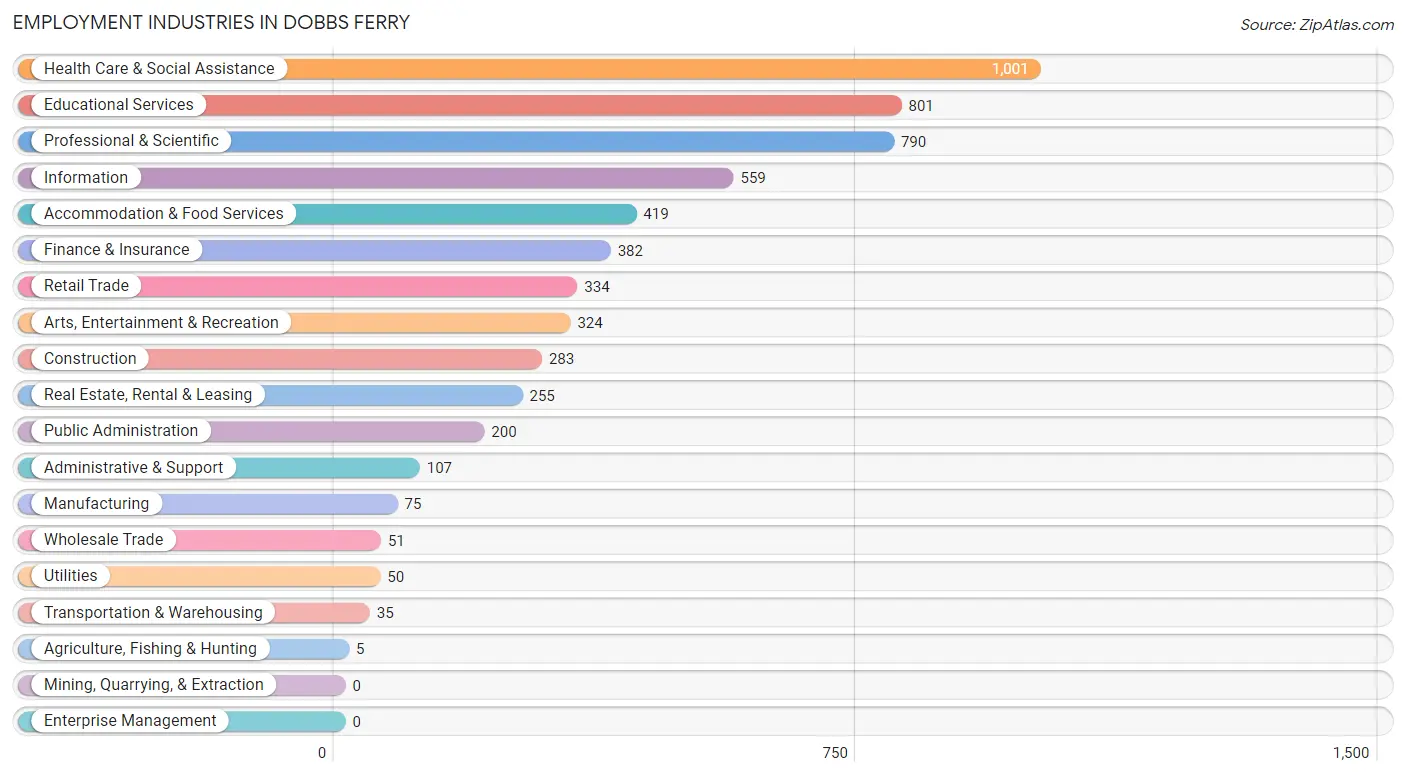
Employment Industries in Dobbs Ferry
The major employment industries in Dobbs Ferry include Health Care & Social Assistance (1,001 | 17.0%), Educational Services (801 | 13.6%), Professional & Scientific (790 | 13.5%), Information (559 | 9.5%), and Accommodation & Food Services (419 | 7.1%).
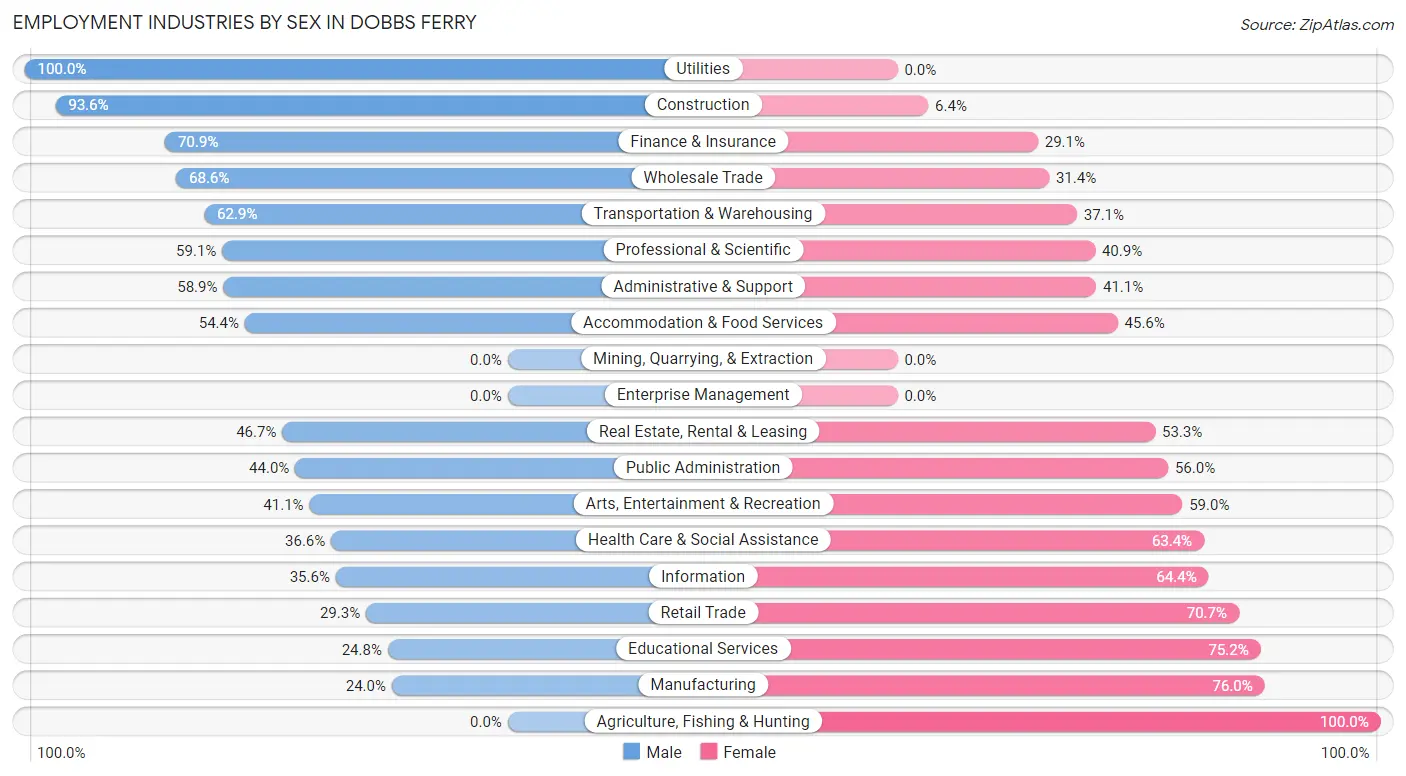
Employment Industries by Sex in Dobbs Ferry
The Dobbs Ferry industries that see more men than women are Utilities (100.0%), Construction (93.6%), and Finance & Insurance (70.9%), whereas the industries that tend to have a higher number of women are Agriculture, Fishing & Hunting (100.0%), Manufacturing (76.0%), and Educational Services (75.2%).
| Industry | Male | Female |
| Agriculture, Fishing & Hunting | 0 (0.0%) | 5 (100.0%) |
| Mining, Quarrying, & Extraction | 0 (0.0%) | 0 (0.0%) |
| Construction | 265 (93.6%) | 18 (6.4%) |
| Manufacturing | 18 (24.0%) | 57 (76.0%) |
| Wholesale Trade | 35 (68.6%) | 16 (31.4%) |
| Retail Trade | 98 (29.3%) | 236 (70.7%) |
| Transportation & Warehousing | 22 (62.9%) | 13 (37.1%) |
| Utilities | 50 (100.0%) | 0 (0.0%) |
| Information | 199 (35.6%) | 360 (64.4%) |
| Finance & Insurance | 271 (70.9%) | 111 (29.1%) |
| Real Estate, Rental & Leasing | 119 (46.7%) | 136 (53.3%) |
| Professional & Scientific | 467 (59.1%) | 323 (40.9%) |
| Enterprise Management | 0 (0.0%) | 0 (0.0%) |
| Administrative & Support | 63 (58.9%) | 44 (41.1%) |
| Educational Services | 199 (24.8%) | 602 (75.2%) |
| Health Care & Social Assistance | 366 (36.6%) | 635 (63.4%) |
| Arts, Entertainment & Recreation | 133 (41.0%) | 191 (59.0%) |
| Accommodation & Food Services | 228 (54.4%) | 191 (45.6%) |
| Public Administration | 88 (44.0%) | 112 (56.0%) |
| Total | 2,746 (46.8%) | 3,128 (53.2%) |
Education in Dobbs Ferry
School Enrollment in Dobbs Ferry
The most common levels of schooling among the 3,496 students in Dobbs Ferry are college / undergraduate (850 | 24.3%), high school (798 | 22.8%), and middle school (752 | 21.5%).
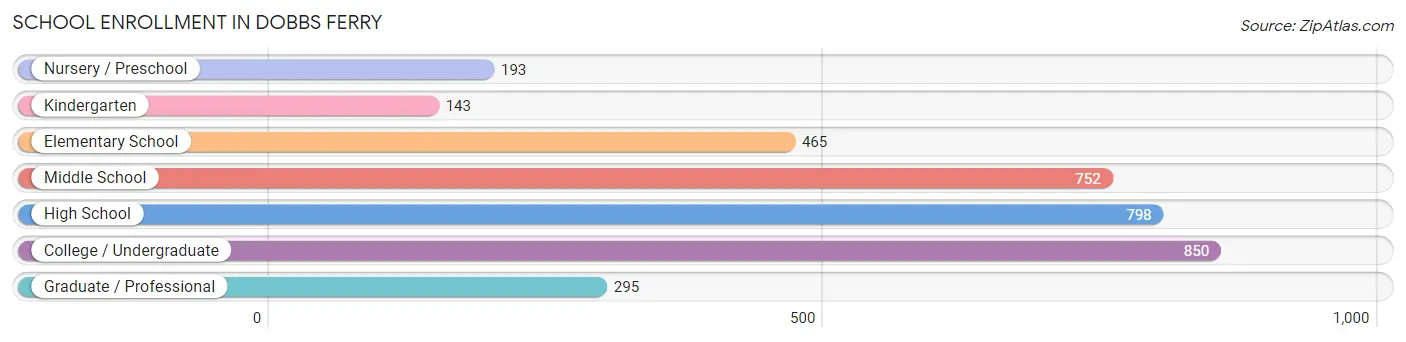
| School Level | # Students | % Students |
| Nursery / Preschool | 193 | 5.5% |
| Kindergarten | 143 | 4.1% |
| Elementary School | 465 | 13.3% |
| Middle School | 752 | 21.5% |
| High School | 798 | 22.8% |
| College / Undergraduate | 850 | 24.3% |
| Graduate / Professional | 295 | 8.4% |
| Total | 3,496 | 100.0% |
School Enrollment by Age by Funding Source in Dobbs Ferry
Out of a total of 3,496 students who are enrolled in schools in Dobbs Ferry, 1,031 (29.5%) attend a private institution, while the remaining 2,465 (70.5%) are enrolled in public schools. The age group of 35 years and over has the highest likelihood of being enrolled in private schools, with 68 (77.3% in the age bracket) enrolled. Conversely, the age group of 10 to 14 year olds has the lowest likelihood of being enrolled in a private school, with 900 (92.2% in the age bracket) attending a public institution.
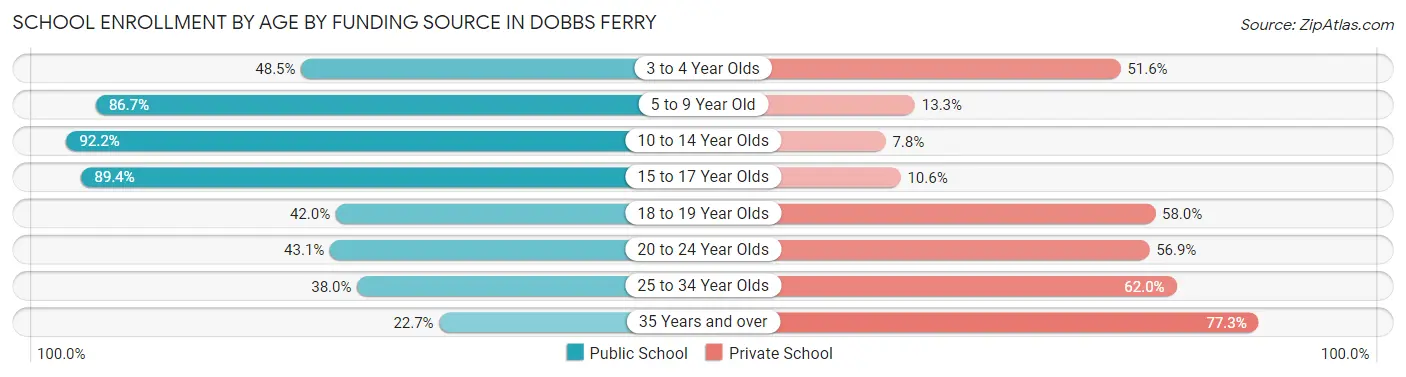
| Age Bracket | Public School | Private School |
| 3 to 4 Year Olds | 94 (48.4%) | 100 (51.5%) |
| 5 to 9 Year Old | 458 (86.7%) | 70 (13.3%) |
| 10 to 14 Year Olds | 900 (92.2%) | 76 (7.8%) |
| 15 to 17 Year Olds | 524 (89.4%) | 62 (10.6%) |
| 18 to 19 Year Olds | 176 (42.0%) | 243 (58.0%) |
| 20 to 24 Year Olds | 212 (43.1%) | 280 (56.9%) |
| 25 to 34 Year Olds | 81 (38.0%) | 132 (62.0%) |
| 35 Years and over | 20 (22.7%) | 68 (77.3%) |
| Total | 2,465 (70.5%) | 1,031 (29.5%) |
Educational Attainment by Field of Study in Dobbs Ferry
Social sciences (687 | 12.5%), business (619 | 11.2%), literature & languages (583 | 10.6%), science & technology (547 | 9.9%), and visual & performing arts (520 | 9.4%) are the most common fields of study among 5,510 individuals in Dobbs Ferry who have obtained a bachelor's degree or higher.
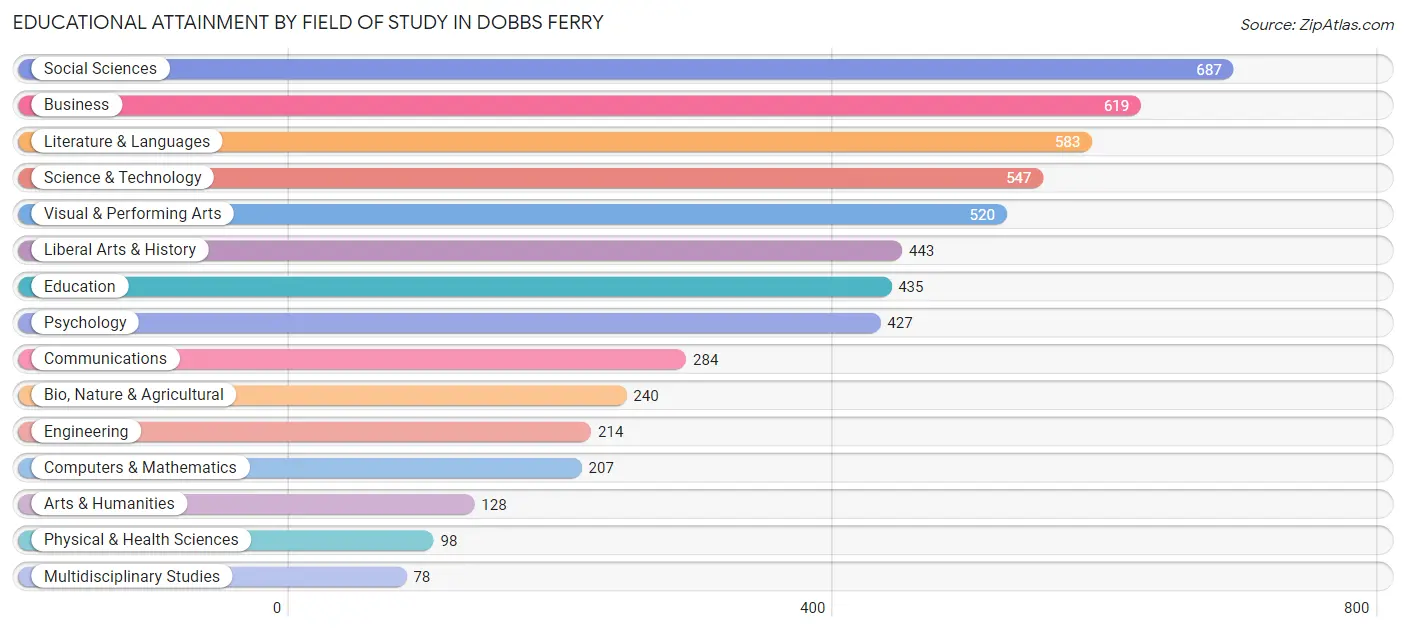
| Field of Study | # Graduates | % Graduates |
| Computers & Mathematics | 207 | 3.8% |
| Bio, Nature & Agricultural | 240 | 4.4% |
| Physical & Health Sciences | 98 | 1.8% |
| Psychology | 427 | 7.7% |
| Social Sciences | 687 | 12.5% |
| Engineering | 214 | 3.9% |
| Multidisciplinary Studies | 78 | 1.4% |
| Science & Technology | 547 | 9.9% |
| Business | 619 | 11.2% |
| Education | 435 | 7.9% |
| Literature & Languages | 583 | 10.6% |
| Liberal Arts & History | 443 | 8.0% |
| Visual & Performing Arts | 520 | 9.4% |
| Communications | 284 | 5.1% |
| Arts & Humanities | 128 | 2.3% |
| Total | 5,510 | 100.0% |
Transportation & Commute in Dobbs Ferry
Vehicle Availability by Sex in Dobbs Ferry
The most prevalent vehicle ownership categories in Dobbs Ferry are males with 2 vehicles (1,300, accounting for 50.4%) and females with 2 vehicles (1,304, making up 45.5%).
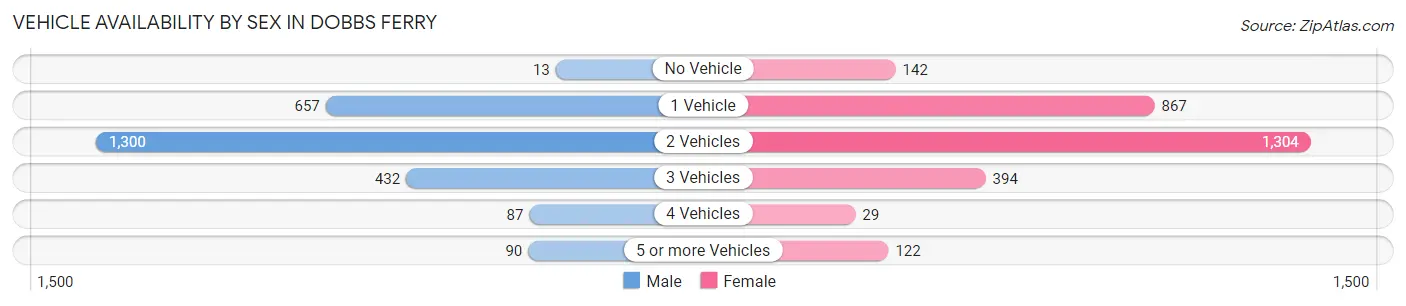
| Vehicles Available | Male | Female |
| No Vehicle | 13 (0.5%) | 142 (5.0%) |
| 1 Vehicle | 657 (25.5%) | 867 (30.3%) |
| 2 Vehicles | 1,300 (50.4%) | 1,304 (45.6%) |
| 3 Vehicles | 432 (16.8%) | 394 (13.8%) |
| 4 Vehicles | 87 (3.4%) | 29 (1.0%) |
| 5 or more Vehicles | 90 (3.5%) | 122 (4.3%) |
| Total | 2,579 (100.0%) | 2,858 (100.0%) |
Commute Time in Dobbs Ferry
The most frequently occuring commute durations in Dobbs Ferry are 60 to 89 minutes (1,160 commuters, 25.1%), 5 to 9 minutes (525 commuters, 11.3%), and 15 to 19 minutes (504 commuters, 10.9%).
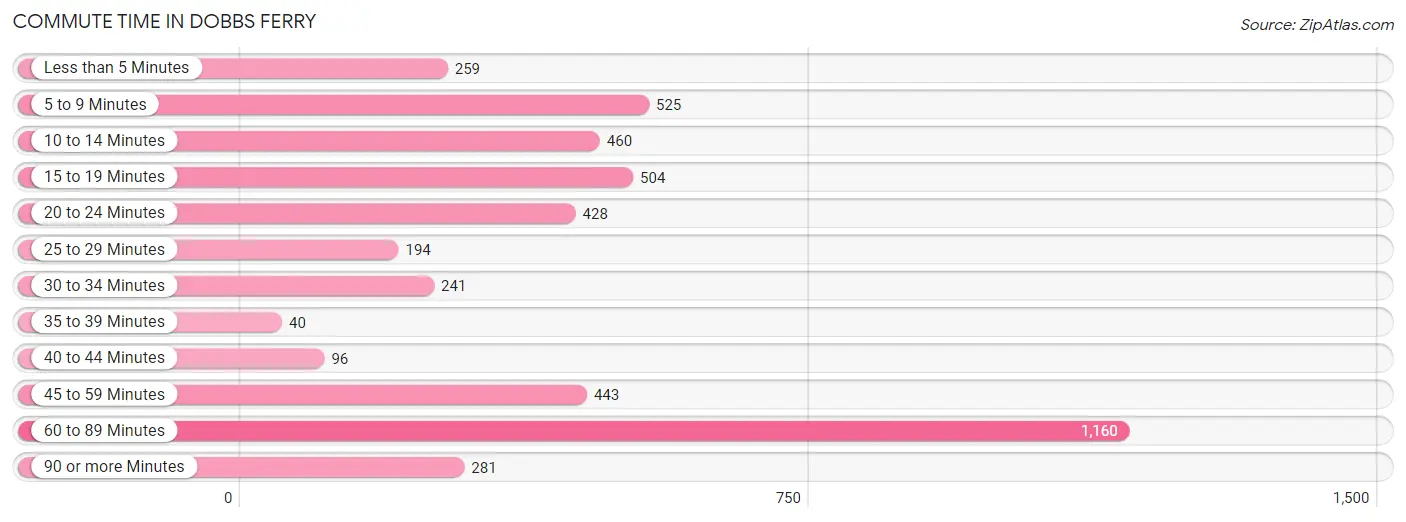
| Commute Time | # Commuters | % Commuters |
| Less than 5 Minutes | 259 | 5.6% |
| 5 to 9 Minutes | 525 | 11.3% |
| 10 to 14 Minutes | 460 | 9.9% |
| 15 to 19 Minutes | 504 | 10.9% |
| 20 to 24 Minutes | 428 | 9.2% |
| 25 to 29 Minutes | 194 | 4.2% |
| 30 to 34 Minutes | 241 | 5.2% |
| 35 to 39 Minutes | 40 | 0.9% |
| 40 to 44 Minutes | 96 | 2.1% |
| 45 to 59 Minutes | 443 | 9.6% |
| 60 to 89 Minutes | 1,160 | 25.1% |
| 90 or more Minutes | 281 | 6.1% |
Commute Time by Sex in Dobbs Ferry
The most common commute times in Dobbs Ferry are 60 to 89 minutes (511 commuters, 23.7%) for males and 60 to 89 minutes (649 commuters, 26.2%) for females.
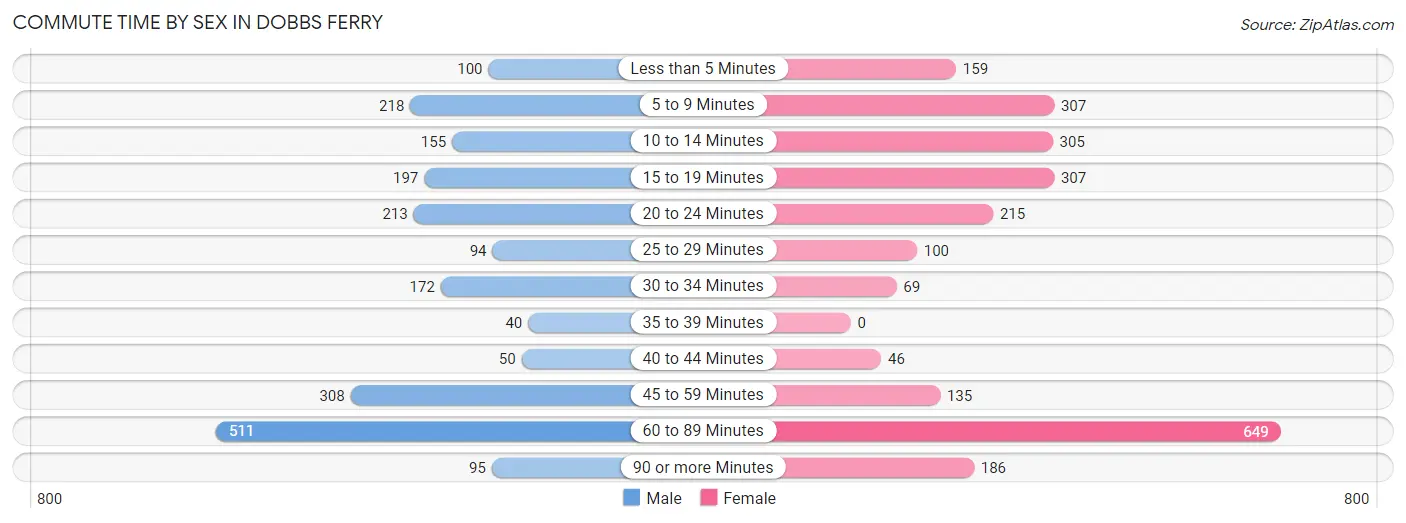
| Commute Time | Male | Female |
| Less than 5 Minutes | 100 (4.6%) | 159 (6.4%) |
| 5 to 9 Minutes | 218 (10.1%) | 307 (12.4%) |
| 10 to 14 Minutes | 155 (7.2%) | 305 (12.3%) |
| 15 to 19 Minutes | 197 (9.1%) | 307 (12.4%) |
| 20 to 24 Minutes | 213 (9.9%) | 215 (8.7%) |
| 25 to 29 Minutes | 94 (4.4%) | 100 (4.0%) |
| 30 to 34 Minutes | 172 (8.0%) | 69 (2.8%) |
| 35 to 39 Minutes | 40 (1.9%) | 0 (0.0%) |
| 40 to 44 Minutes | 50 (2.3%) | 46 (1.9%) |
| 45 to 59 Minutes | 308 (14.3%) | 135 (5.4%) |
| 60 to 89 Minutes | 511 (23.7%) | 649 (26.2%) |
| 90 or more Minutes | 95 (4.4%) | 186 (7.5%) |
Time of Departure to Work by Sex in Dobbs Ferry
The most frequent times of departure to work in Dobbs Ferry are 8:00 AM to 8:29 AM (382, 17.7%) for males and 8:00 AM to 8:29 AM (597, 24.1%) for females.
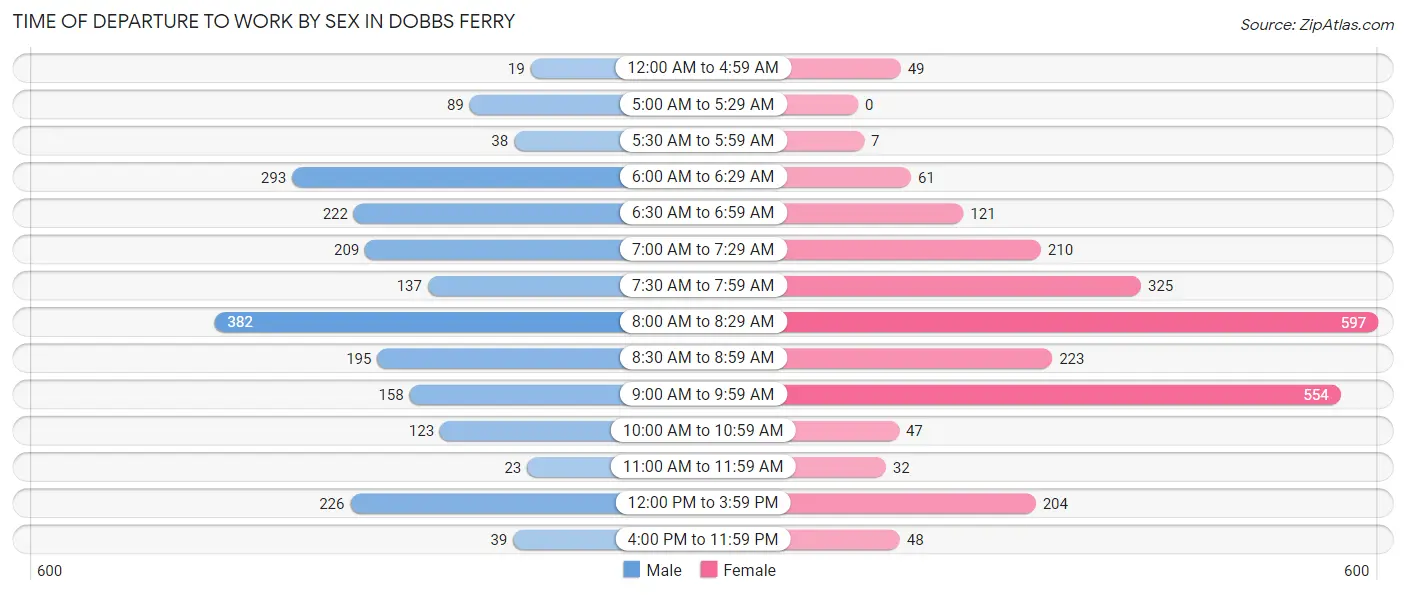
| Time of Departure | Male | Female |
| 12:00 AM to 4:59 AM | 19 (0.9%) | 49 (2.0%) |
| 5:00 AM to 5:29 AM | 89 (4.1%) | 0 (0.0%) |
| 5:30 AM to 5:59 AM | 38 (1.8%) | 7 (0.3%) |
| 6:00 AM to 6:29 AM | 293 (13.6%) | 61 (2.5%) |
| 6:30 AM to 6:59 AM | 222 (10.3%) | 121 (4.9%) |
| 7:00 AM to 7:29 AM | 209 (9.7%) | 210 (8.5%) |
| 7:30 AM to 7:59 AM | 137 (6.4%) | 325 (13.1%) |
| 8:00 AM to 8:29 AM | 382 (17.7%) | 597 (24.1%) |
| 8:30 AM to 8:59 AM | 195 (9.1%) | 223 (9.0%) |
| 9:00 AM to 9:59 AM | 158 (7.3%) | 554 (22.4%) |
| 10:00 AM to 10:59 AM | 123 (5.7%) | 47 (1.9%) |
| 11:00 AM to 11:59 AM | 23 (1.1%) | 32 (1.3%) |
| 12:00 PM to 3:59 PM | 226 (10.5%) | 204 (8.2%) |
| 4:00 PM to 11:59 PM | 39 (1.8%) | 48 (1.9%) |
| Total | 2,153 (100.0%) | 2,478 (100.0%) |
Housing Occupancy in Dobbs Ferry
Occupancy by Ownership in Dobbs Ferry
Of the total 3,794 dwellings in Dobbs Ferry, owner-occupied units account for 2,363 (62.3%), while renter-occupied units make up 1,431 (37.7%).
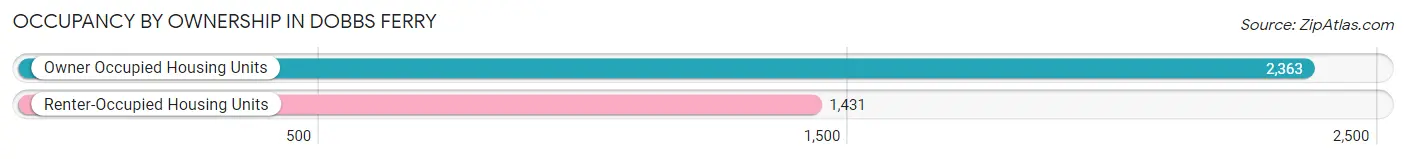
| Occupancy | # Housing Units | % Housing Units |
| Owner Occupied Housing Units | 2,363 | 62.3% |
| Renter-Occupied Housing Units | 1,431 | 37.7% |
| Total Occupied Housing Units | 3,794 | 100.0% |
Occupancy by Household Size in Dobbs Ferry
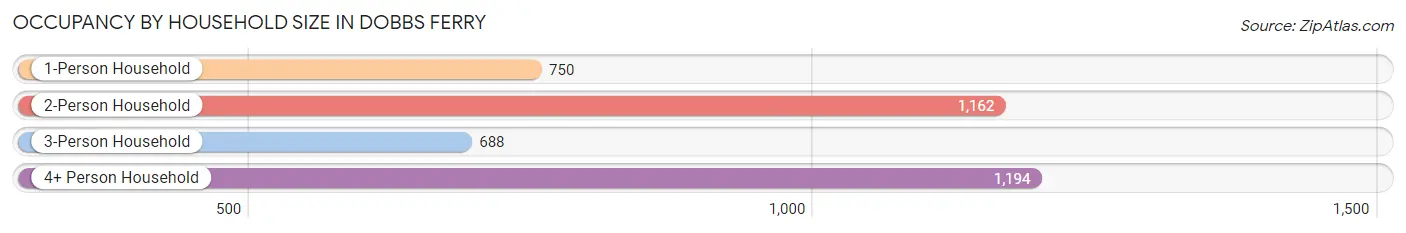
| Household Size | # Housing Units | % Housing Units |
| 1-Person Household | 750 | 19.8% |
| 2-Person Household | 1,162 | 30.6% |
| 3-Person Household | 688 | 18.1% |
| 4+ Person Household | 1,194 | 31.5% |
| Total Housing Units | 3,794 | 100.0% |
Occupancy by Ownership by Household Size in Dobbs Ferry
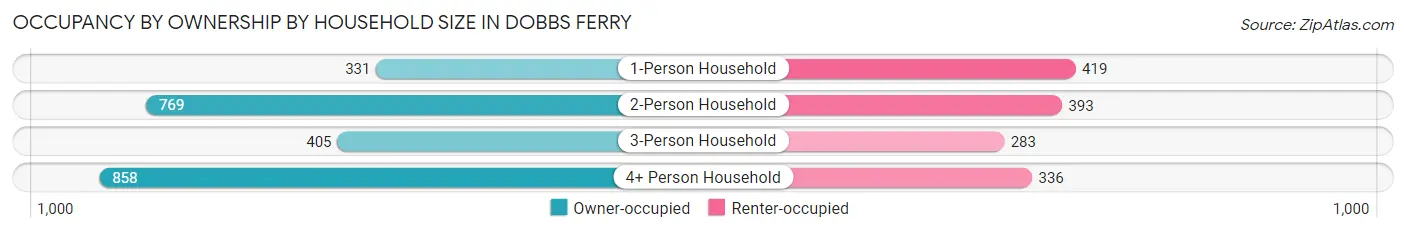
| Household Size | Owner-occupied | Renter-occupied |
| 1-Person Household | 331 (44.1%) | 419 (55.9%) |
| 2-Person Household | 769 (66.2%) | 393 (33.8%) |
| 3-Person Household | 405 (58.9%) | 283 (41.1%) |
| 4+ Person Household | 858 (71.9%) | 336 (28.1%) |
| Total Housing Units | 2,363 (62.3%) | 1,431 (37.7%) |
Occupancy by Educational Attainment in Dobbs Ferry
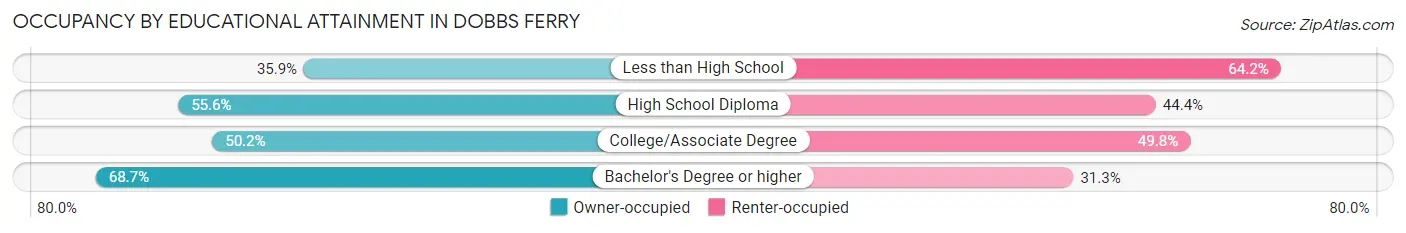
| Household Size | Owner-occupied | Renter-occupied |
| Less than High School | 38 (35.8%) | 68 (64.1%) |
| High School Diploma | 158 (55.6%) | 126 (44.4%) |
| College/Associate Degree | 466 (50.2%) | 462 (49.8%) |
| Bachelor's Degree or higher | 1,701 (68.7%) | 775 (31.3%) |
Occupancy by Age of Householder in Dobbs Ferry
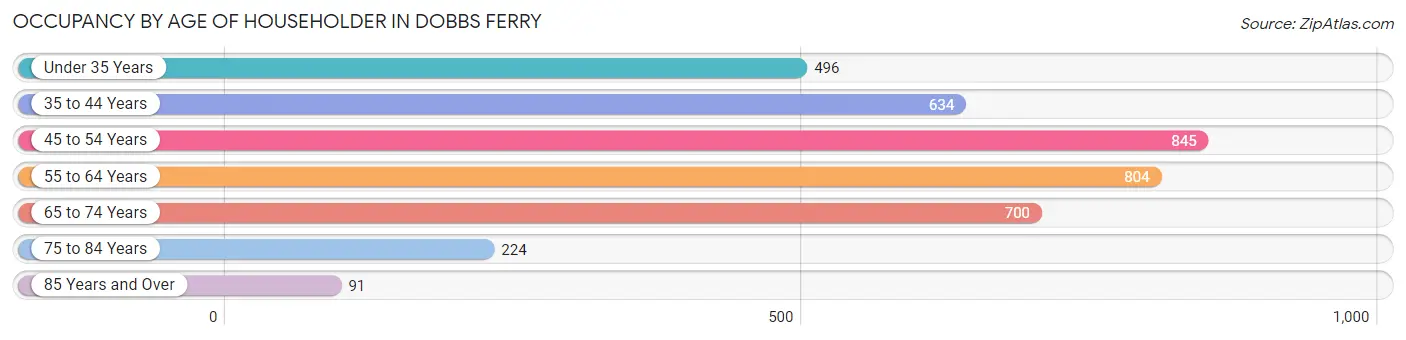
| Age Bracket | # Households | % Households |
| Under 35 Years | 496 | 13.1% |
| 35 to 44 Years | 634 | 16.7% |
| 45 to 54 Years | 845 | 22.3% |
| 55 to 64 Years | 804 | 21.2% |
| 65 to 74 Years | 700 | 18.4% |
| 75 to 84 Years | 224 | 5.9% |
| 85 Years and Over | 91 | 2.4% |
| Total | 3,794 | 100.0% |
Housing Finances in Dobbs Ferry
Median Income by Occupancy in Dobbs Ferry
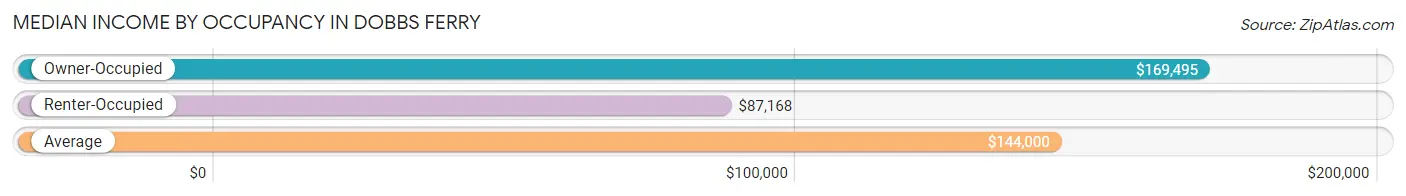
| Occupancy Type | # Households | Median Income |
| Owner-Occupied | 2,363 (62.3%) | $169,495 |
| Renter-Occupied | 1,431 (37.7%) | $87,168 |
| Average | 3,794 (100.0%) | $144,000 |
Occupancy by Householder Income Bracket in Dobbs Ferry
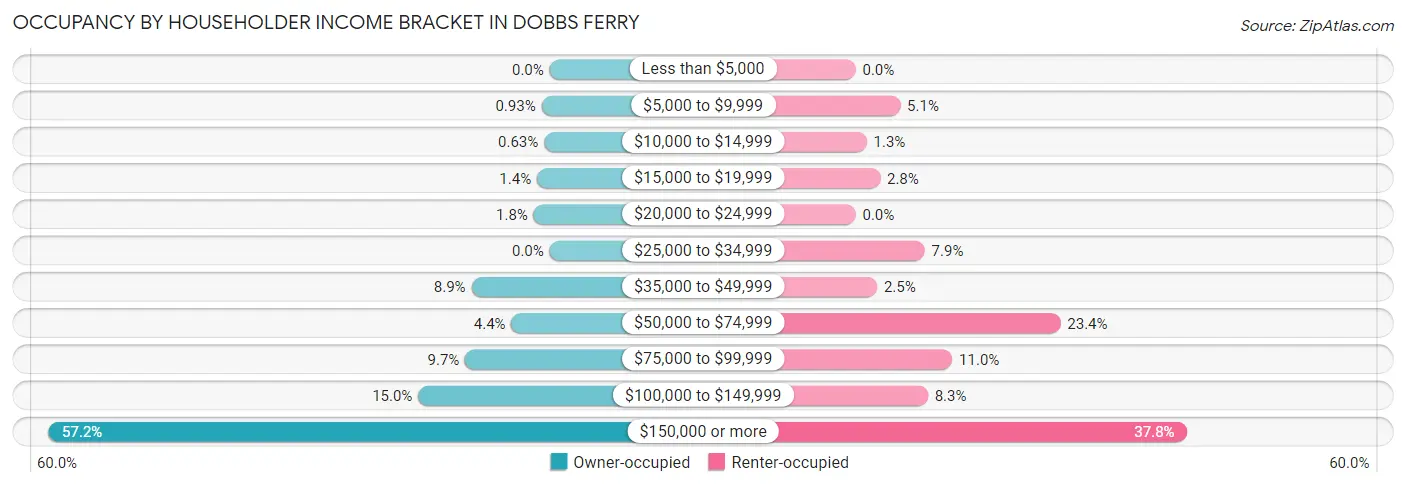
| Income Bracket | Owner-occupied | Renter-occupied |
| Less than $5,000 | 0 (0.0%) | 0 (0.0%) |
| $5,000 to $9,999 | 22 (0.9%) | 73 (5.1%) |
| $10,000 to $14,999 | 15 (0.6%) | 18 (1.3%) |
| $15,000 to $19,999 | 34 (1.4%) | 40 (2.8%) |
| $20,000 to $24,999 | 43 (1.8%) | 0 (0.0%) |
| $25,000 to $34,999 | 0 (0.0%) | 113 (7.9%) |
| $35,000 to $49,999 | 211 (8.9%) | 35 (2.5%) |
| $50,000 to $74,999 | 103 (4.4%) | 335 (23.4%) |
| $75,000 to $99,999 | 228 (9.7%) | 158 (11.0%) |
| $100,000 to $149,999 | 355 (15.0%) | 118 (8.3%) |
| $150,000 or more | 1,352 (57.2%) | 541 (37.8%) |
| Total | 2,363 (100.0%) | 1,431 (100.0%) |
Monthly Housing Cost Tiers in Dobbs Ferry
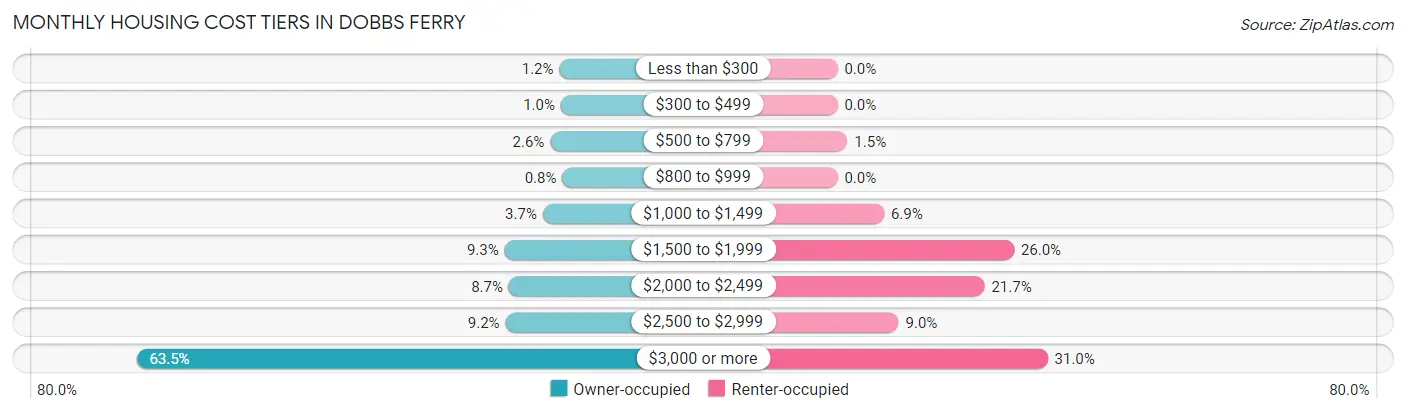
| Monthly Cost | Owner-occupied | Renter-occupied |
| Less than $300 | 29 (1.2%) | 0 (0.0%) |
| $300 to $499 | 24 (1.0%) | 0 (0.0%) |
| $500 to $799 | 61 (2.6%) | 21 (1.5%) |
| $800 to $999 | 19 (0.8%) | 0 (0.0%) |
| $1,000 to $1,499 | 87 (3.7%) | 98 (6.9%) |
| $1,500 to $1,999 | 220 (9.3%) | 372 (26.0%) |
| $2,000 to $2,499 | 205 (8.7%) | 310 (21.7%) |
| $2,500 to $2,999 | 217 (9.2%) | 129 (9.0%) |
| $3,000 or more | 1,501 (63.5%) | 443 (31.0%) |
| Total | 2,363 (100.0%) | 1,431 (100.0%) |
Physical Housing Characteristics in Dobbs Ferry
Housing Structures in Dobbs Ferry
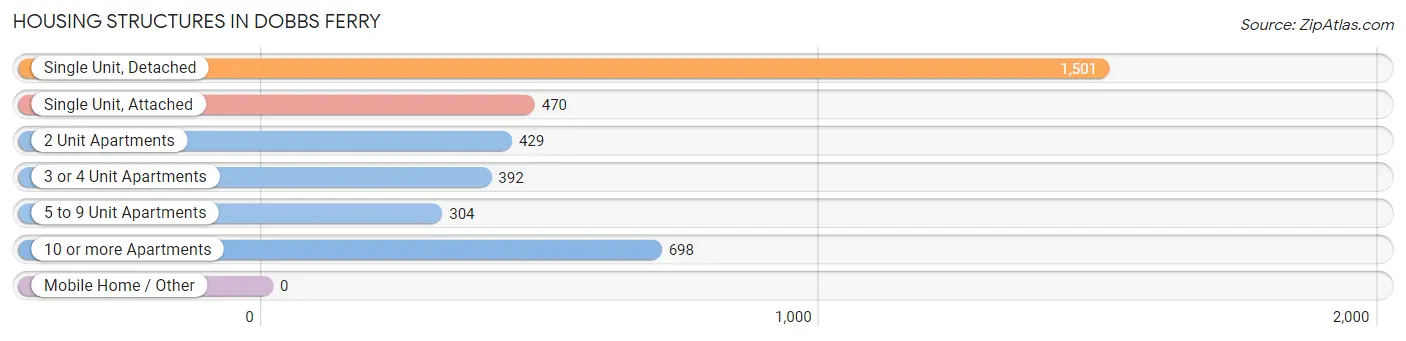
| Structure Type | # Housing Units | % Housing Units |
| Single Unit, Detached | 1,501 | 39.6% |
| Single Unit, Attached | 470 | 12.4% |
| 2 Unit Apartments | 429 | 11.3% |
| 3 or 4 Unit Apartments | 392 | 10.3% |
| 5 to 9 Unit Apartments | 304 | 8.0% |
| 10 or more Apartments | 698 | 18.4% |
| Mobile Home / Other | 0 | 0.0% |
| Total | 3,794 | 100.0% |
Housing Structures by Occupancy in Dobbs Ferry
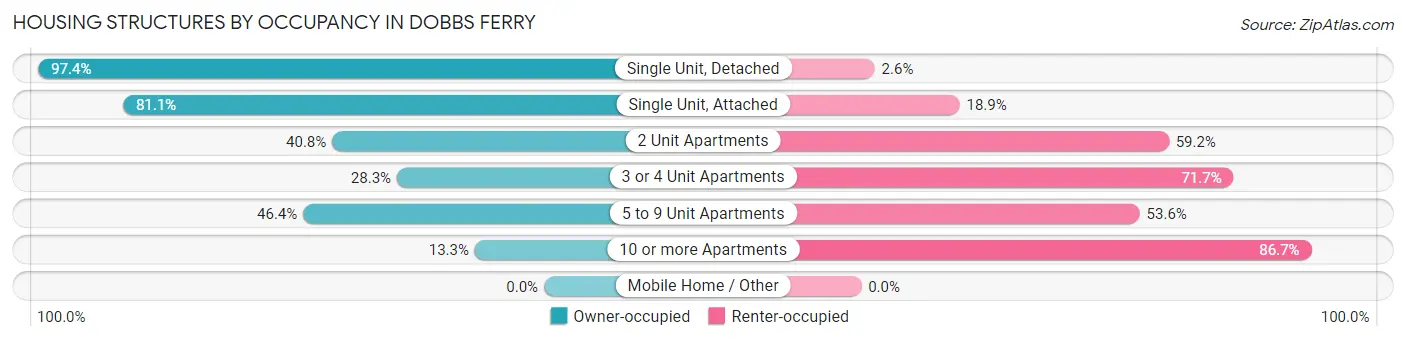
| Structure Type | Owner-occupied | Renter-occupied |
| Single Unit, Detached | 1,462 (97.4%) | 39 (2.6%) |
| Single Unit, Attached | 381 (81.1%) | 89 (18.9%) |
| 2 Unit Apartments | 175 (40.8%) | 254 (59.2%) |
| 3 or 4 Unit Apartments | 111 (28.3%) | 281 (71.7%) |
| 5 to 9 Unit Apartments | 141 (46.4%) | 163 (53.6%) |
| 10 or more Apartments | 93 (13.3%) | 605 (86.7%) |
| Mobile Home / Other | 0 (0.0%) | 0 (0.0%) |
| Total | 2,363 (62.3%) | 1,431 (37.7%) |
Housing Structures by Number of Rooms in Dobbs Ferry
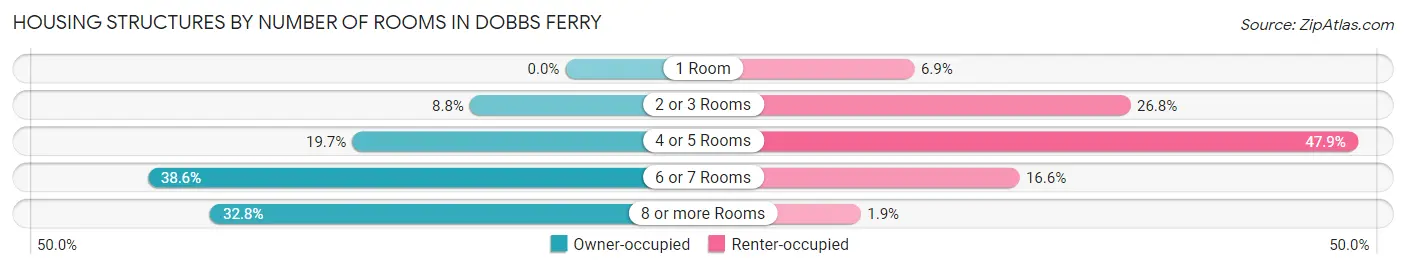
| Number of Rooms | Owner-occupied | Renter-occupied |
| 1 Room | 0 (0.0%) | 98 (6.9%) |
| 2 or 3 Rooms | 209 (8.8%) | 384 (26.8%) |
| 4 or 5 Rooms | 466 (19.7%) | 685 (47.9%) |
| 6 or 7 Rooms | 912 (38.6%) | 237 (16.6%) |
| 8 or more Rooms | 776 (32.8%) | 27 (1.9%) |
| Total | 2,363 (100.0%) | 1,431 (100.0%) |
Housing Structure by Heating Type in Dobbs Ferry
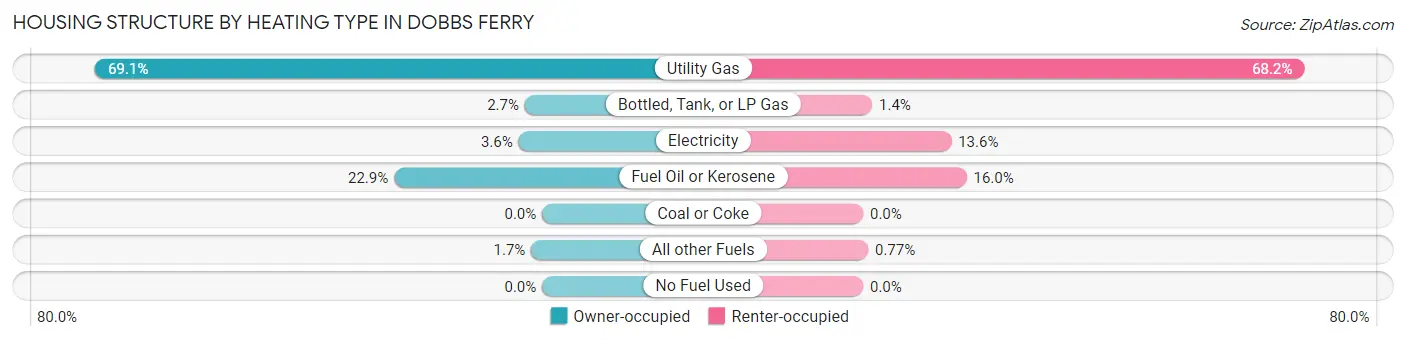
| Heating Type | Owner-occupied | Renter-occupied |
| Utility Gas | 1,633 (69.1%) | 976 (68.2%) |
| Bottled, Tank, or LP Gas | 63 (2.7%) | 20 (1.4%) |
| Electricity | 86 (3.6%) | 195 (13.6%) |
| Fuel Oil or Kerosene | 541 (22.9%) | 229 (16.0%) |
| Coal or Coke | 0 (0.0%) | 0 (0.0%) |
| All other Fuels | 40 (1.7%) | 11 (0.8%) |
| No Fuel Used | 0 (0.0%) | 0 (0.0%) |
| Total | 2,363 (100.0%) | 1,431 (100.0%) |
Household Vehicle Usage in Dobbs Ferry
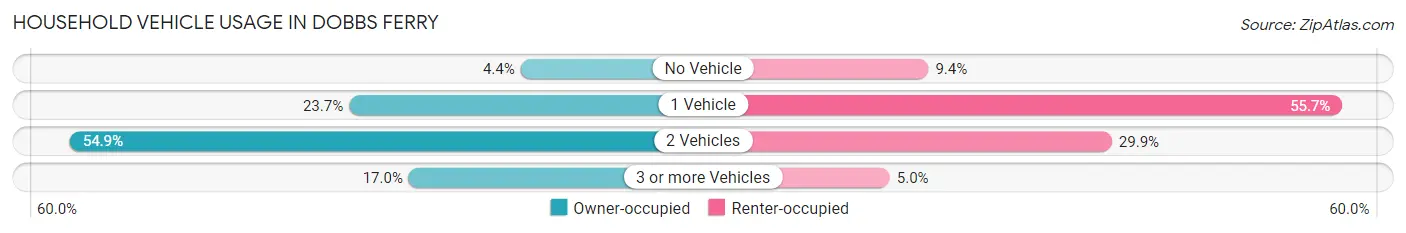
| Vehicles per Household | Owner-occupied | Renter-occupied |
| No Vehicle | 105 (4.4%) | 134 (9.4%) |
| 1 Vehicle | 559 (23.7%) | 797 (55.7%) |
| 2 Vehicles | 1,298 (54.9%) | 428 (29.9%) |
| 3 or more Vehicles | 401 (17.0%) | 72 (5.0%) |
| Total | 2,363 (100.0%) | 1,431 (100.0%) |
Real Estate & Mortgages in Dobbs Ferry
Real Estate and Mortgage Overview in Dobbs Ferry
| Characteristic | Without Mortgage | With Mortgage |
| Housing Units | 794 | 1,569 |
| Median Property Value | $618,700 | $759,900 |
| Median Household Income | $120,972 | $1,010 |
| Monthly Housing Costs | $1,501 | $1,367 |
| Real Estate Taxes | $10,001 | $128 |
Property Value by Mortgage Status in Dobbs Ferry
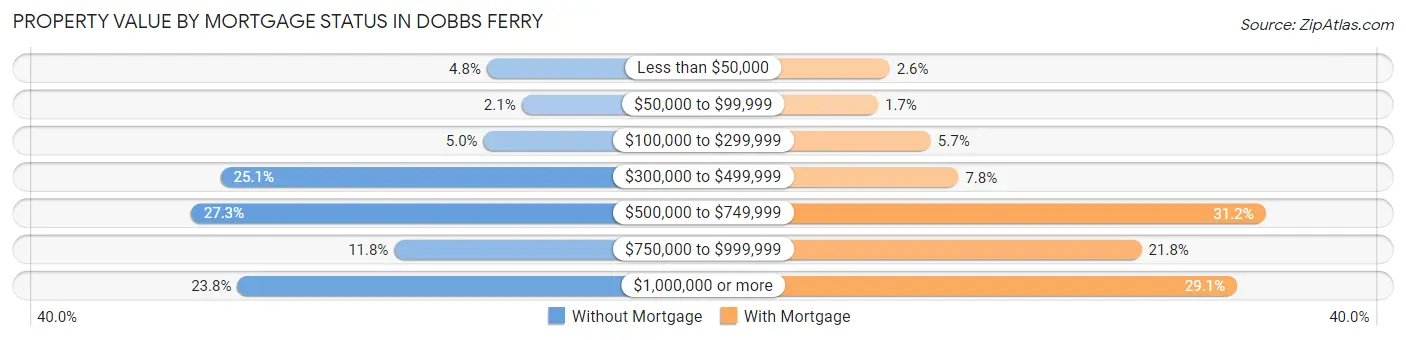
| Property Value | Without Mortgage | With Mortgage |
| Less than $50,000 | 38 (4.8%) | 41 (2.6%) |
| $50,000 to $99,999 | 17 (2.1%) | 27 (1.7%) |
| $100,000 to $299,999 | 40 (5.0%) | 90 (5.7%) |
| $300,000 to $499,999 | 199 (25.1%) | 123 (7.8%) |
| $500,000 to $749,999 | 217 (27.3%) | 490 (31.2%) |
| $750,000 to $999,999 | 94 (11.8%) | 342 (21.8%) |
| $1,000,000 or more | 189 (23.8%) | 456 (29.1%) |
| Total | 794 (100.0%) | 1,569 (100.0%) |
Household Income by Mortgage Status in Dobbs Ferry
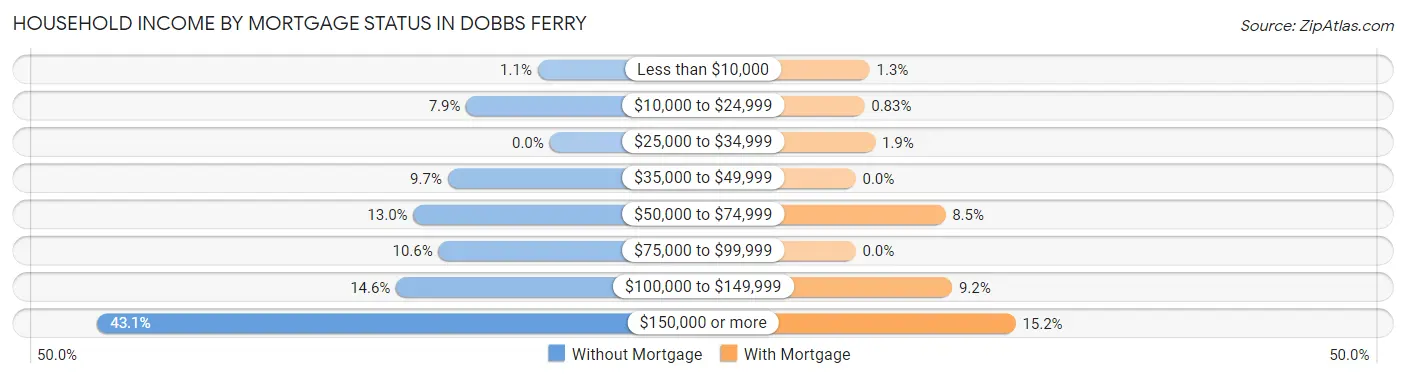
| Household Income | Without Mortgage | With Mortgage |
| Less than $10,000 | 9 (1.1%) | 21 (1.3%) |
| $10,000 to $24,999 | 63 (7.9%) | 13 (0.8%) |
| $25,000 to $34,999 | 0 (0.0%) | 29 (1.8%) |
| $35,000 to $49,999 | 77 (9.7%) | 0 (0.0%) |
| $50,000 to $74,999 | 103 (13.0%) | 134 (8.5%) |
| $75,000 to $99,999 | 84 (10.6%) | 0 (0.0%) |
| $100,000 to $149,999 | 116 (14.6%) | 144 (9.2%) |
| $150,000 or more | 342 (43.1%) | 239 (15.2%) |
| Total | 794 (100.0%) | 1,569 (100.0%) |
Property Value to Household Income Ratio in Dobbs Ferry
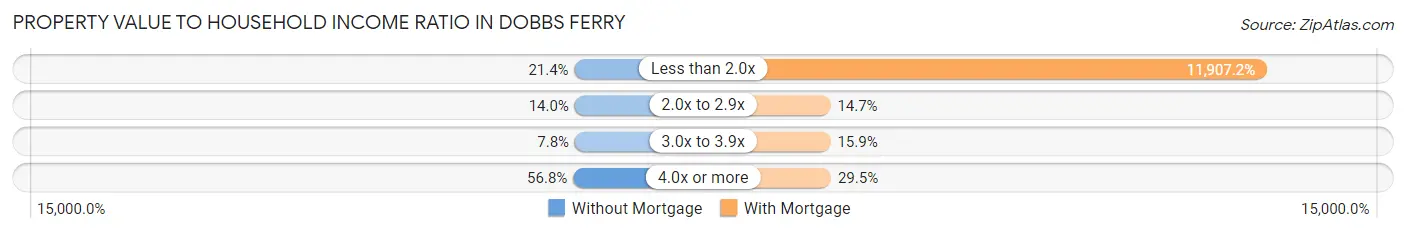
| Value-to-Income Ratio | Without Mortgage | With Mortgage |
| Less than 2.0x | 170 (21.4%) | 186,824 (11,907.2%) |
| 2.0x to 2.9x | 111 (14.0%) | 231 (14.7%) |
| 3.0x to 3.9x | 62 (7.8%) | 250 (15.9%) |
| 4.0x or more | 451 (56.8%) | 462 (29.4%) |
| Total | 794 (100.0%) | 1,569 (100.0%) |
Real Estate Taxes by Mortgage Status in Dobbs Ferry
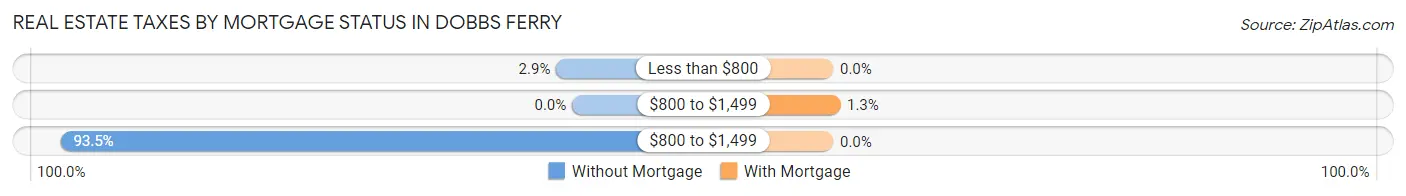
| Property Taxes | Without Mortgage | With Mortgage |
| Less than $800 | 23 (2.9%) | 0 (0.0%) |
| $800 to $1,499 | 0 (0.0%) | 20 (1.3%) |
| $800 to $1,499 | 742 (93.4%) | 0 (0.0%) |
| Total | 794 (100.0%) | 1,569 (100.0%) |
Health & Disability in Dobbs Ferry
Health Insurance Coverage by Age in Dobbs Ferry
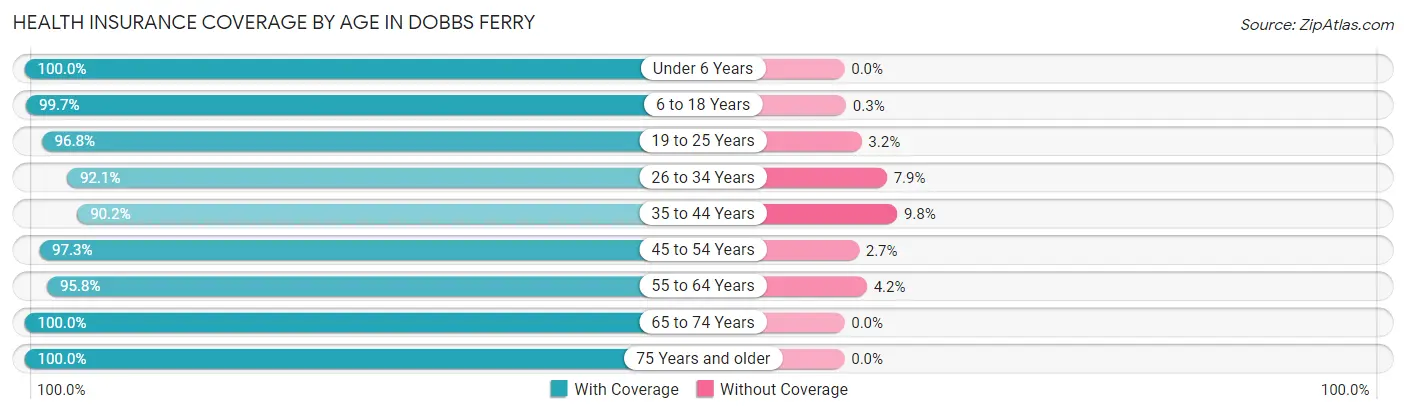
| Age Bracket | With Coverage | Without Coverage |
| Under 6 Years | 716 (100.0%) | 0 (0.0%) |
| 6 to 18 Years | 2,025 (99.7%) | 6 (0.3%) |
| 19 to 25 Years | 1,031 (96.8%) | 34 (3.2%) |
| 26 to 34 Years | 1,059 (92.1%) | 91 (7.9%) |
| 35 to 44 Years | 1,276 (90.2%) | 139 (9.8%) |
| 45 to 54 Years | 1,406 (97.3%) | 39 (2.7%) |
| 55 to 64 Years | 1,466 (95.8%) | 64 (4.2%) |
| 65 to 74 Years | 1,144 (100.0%) | 0 (0.0%) |
| 75 Years and older | 477 (100.0%) | 0 (0.0%) |
| Total | 10,600 (96.6%) | 373 (3.4%) |
Health Insurance Coverage by Citizenship Status in Dobbs Ferry
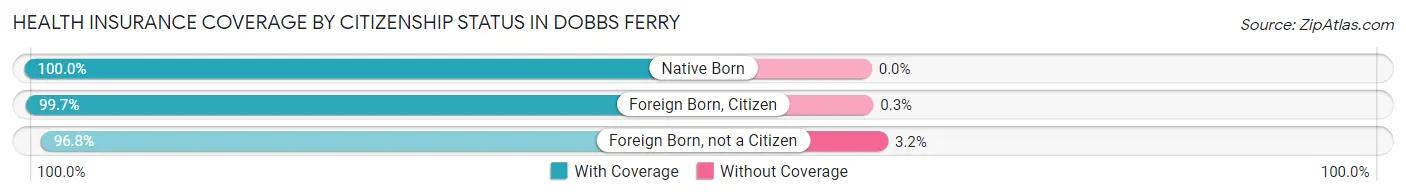
| Citizenship Status | With Coverage | Without Coverage |
| Native Born | 716 (100.0%) | 0 (0.0%) |
| Foreign Born, Citizen | 2,025 (99.7%) | 6 (0.3%) |
| Foreign Born, not a Citizen | 1,031 (96.8%) | 34 (3.2%) |
Health Insurance Coverage by Household Income in Dobbs Ferry
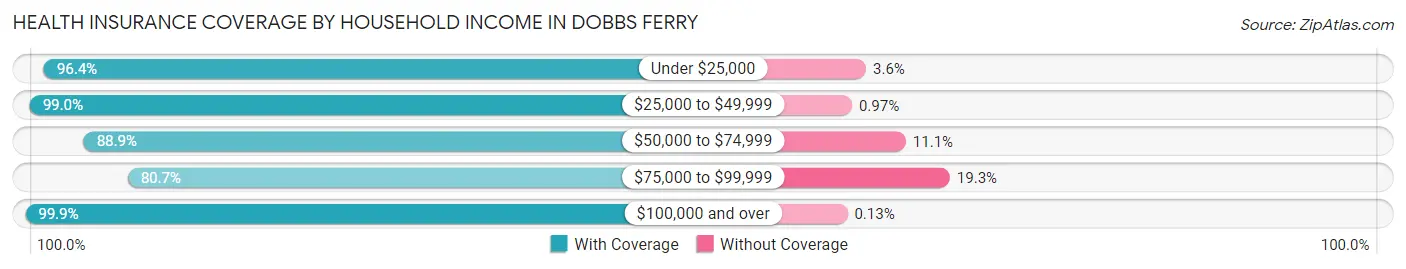
| Household Income | With Coverage | Without Coverage |
| Under $25,000 | 399 (96.4%) | 15 (3.6%) |
| $25,000 to $49,999 | 820 (99.0%) | 8 (1.0%) |
| $50,000 to $74,999 | 843 (88.9%) | 105 (11.1%) |
| $75,000 to $99,999 | 881 (80.7%) | 211 (19.3%) |
| $100,000 and over | 7,187 (99.9%) | 9 (0.1%) |
Public vs Private Health Insurance Coverage by Age in Dobbs Ferry
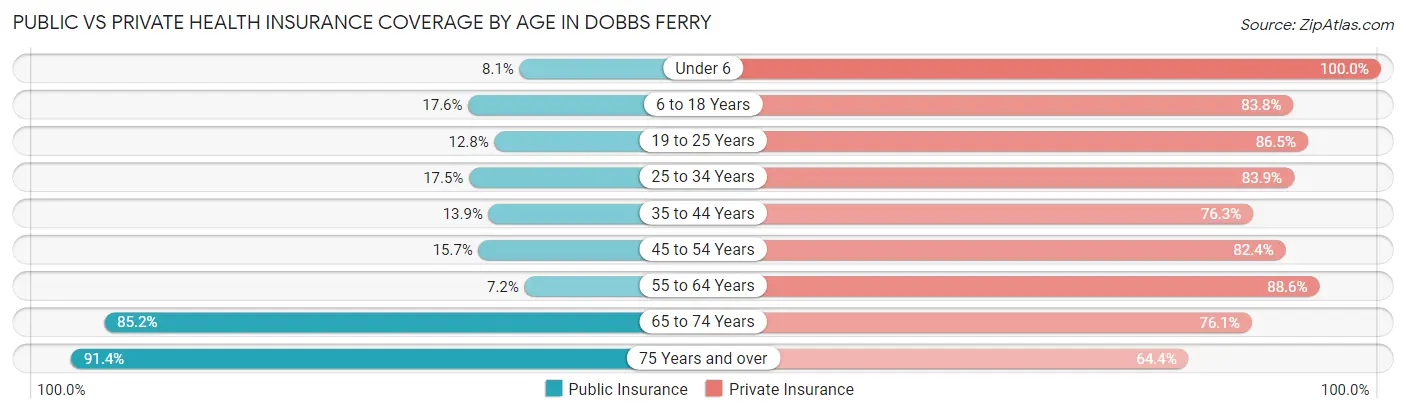
| Age Bracket | Public Insurance | Private Insurance |
| Under 6 | 58 (8.1%) | 716 (100.0%) |
| 6 to 18 Years | 358 (17.6%) | 1,702 (83.8%) |
| 19 to 25 Years | 136 (12.8%) | 921 (86.5%) |
| 25 to 34 Years | 201 (17.5%) | 965 (83.9%) |
| 35 to 44 Years | 196 (13.9%) | 1,080 (76.3%) |
| 45 to 54 Years | 227 (15.7%) | 1,190 (82.4%) |
| 55 to 64 Years | 110 (7.2%) | 1,356 (88.6%) |
| 65 to 74 Years | 975 (85.2%) | 870 (76.0%) |
| 75 Years and over | 436 (91.4%) | 307 (64.4%) |
| Total | 2,697 (24.6%) | 9,107 (83.0%) |
Disability Status by Sex by Age in Dobbs Ferry
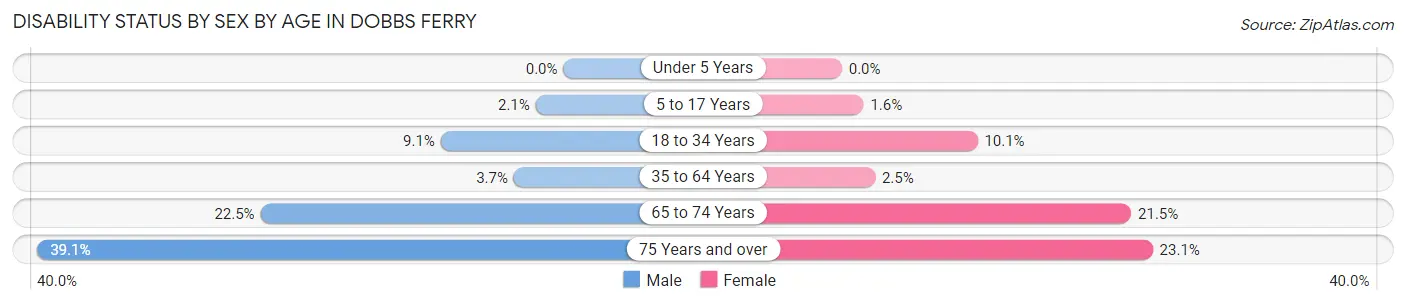
| Age Bracket | Male | Female |
| Under 5 Years | 0 (0.0%) | 0 (0.0%) |
| 5 to 17 Years | 23 (2.1%) | 13 (1.6%) |
| 18 to 34 Years | 108 (9.1%) | 127 (10.1%) |
| 35 to 64 Years | 75 (3.7%) | 58 (2.5%) |
| 65 to 74 Years | 139 (22.5%) | 113 (21.5%) |
| 75 Years and over | 100 (39.1%) | 51 (23.1%) |
Disability Class by Sex by Age in Dobbs Ferry
Disability Class: Hearing Difficulty
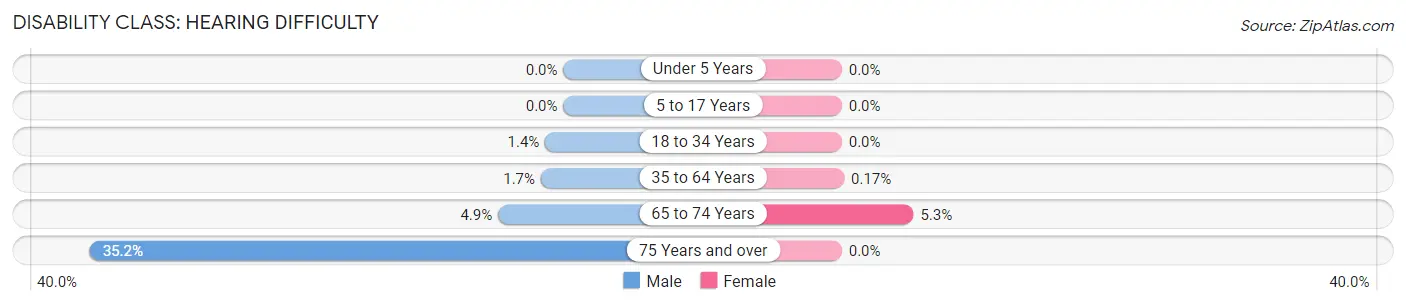
| Age Bracket | Male | Female |
| Under 5 Years | 0 (0.0%) | 0 (0.0%) |
| 5 to 17 Years | 0 (0.0%) | 0 (0.0%) |
| 18 to 34 Years | 16 (1.3%) | 0 (0.0%) |
| 35 to 64 Years | 34 (1.7%) | 4 (0.2%) |
| 65 to 74 Years | 30 (4.9%) | 28 (5.3%) |
| 75 Years and over | 90 (35.2%) | 0 (0.0%) |
Disability Class: Vision Difficulty
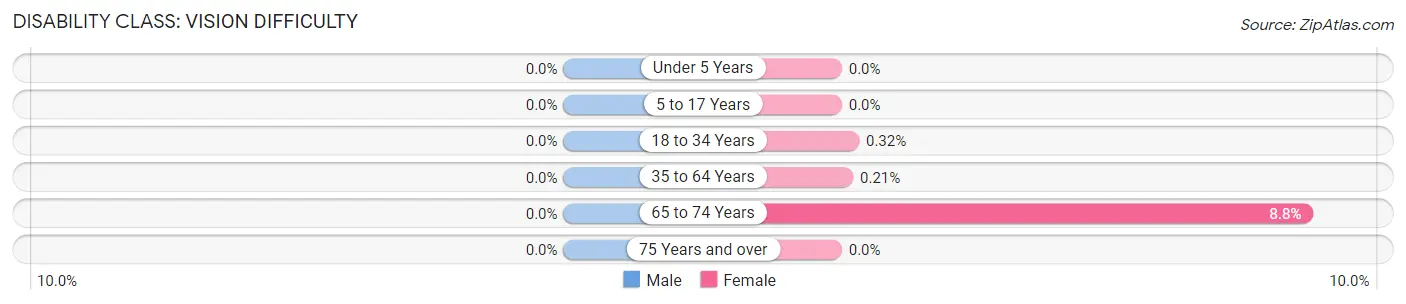
| Age Bracket | Male | Female |
| Under 5 Years | 0 (0.0%) | 0 (0.0%) |
| 5 to 17 Years | 0 (0.0%) | 0 (0.0%) |
| 18 to 34 Years | 0 (0.0%) | 4 (0.3%) |
| 35 to 64 Years | 0 (0.0%) | 5 (0.2%) |
| 65 to 74 Years | 0 (0.0%) | 46 (8.7%) |
| 75 Years and over | 0 (0.0%) | 0 (0.0%) |
Disability Class: Cognitive Difficulty
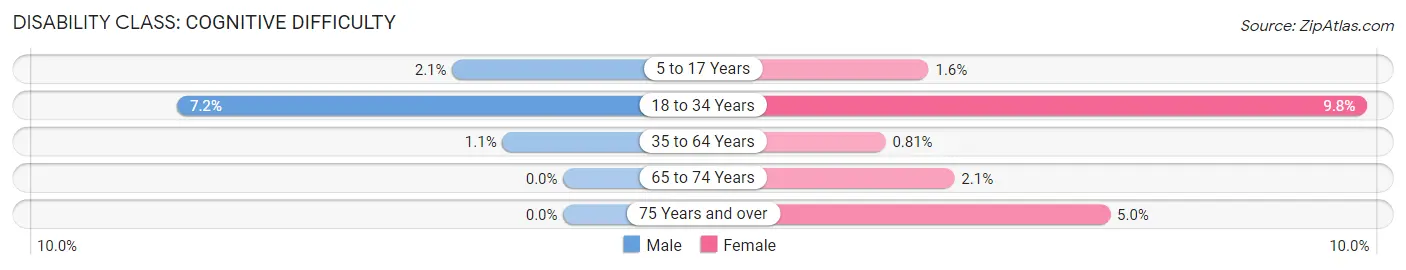
| Age Bracket | Male | Female |
| 5 to 17 Years | 23 (2.1%) | 13 (1.6%) |
| 18 to 34 Years | 85 (7.2%) | 123 (9.8%) |
| 35 to 64 Years | 23 (1.1%) | 19 (0.8%) |
| 65 to 74 Years | 0 (0.0%) | 11 (2.1%) |
| 75 Years and over | 0 (0.0%) | 11 (5.0%) |
Disability Class: Ambulatory Difficulty
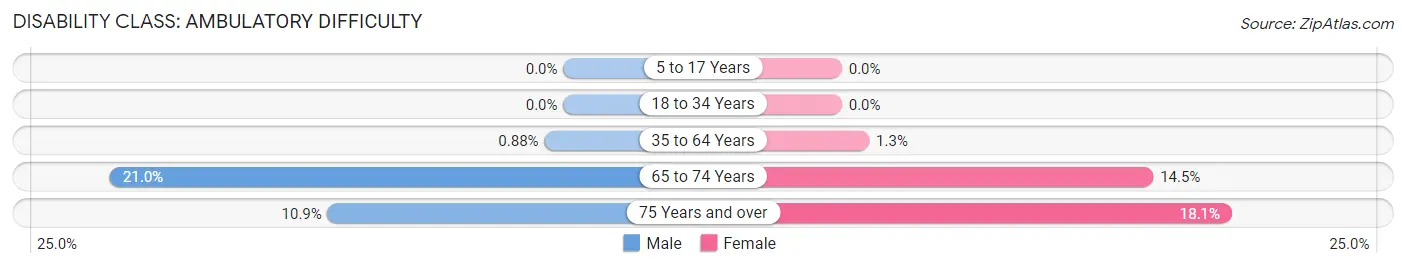
| Age Bracket | Male | Female |
| 5 to 17 Years | 0 (0.0%) | 0 (0.0%) |
| 18 to 34 Years | 0 (0.0%) | 0 (0.0%) |
| 35 to 64 Years | 18 (0.9%) | 30 (1.3%) |
| 65 to 74 Years | 130 (21.0%) | 76 (14.4%) |
| 75 Years and over | 28 (10.9%) | 40 (18.1%) |
Disability Class: Self-Care Difficulty
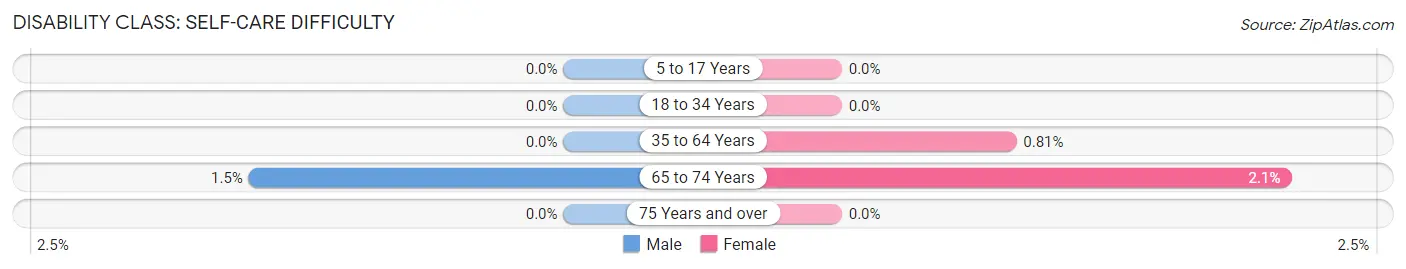
| Age Bracket | Male | Female |
| 5 to 17 Years | 0 (0.0%) | 0 (0.0%) |
| 18 to 34 Years | 0 (0.0%) | 0 (0.0%) |
| 35 to 64 Years | 0 (0.0%) | 19 (0.8%) |
| 65 to 74 Years | 9 (1.5%) | 11 (2.1%) |
| 75 Years and over | 0 (0.0%) | 0 (0.0%) |
Technology Access in Dobbs Ferry
Computing Device Access in Dobbs Ferry
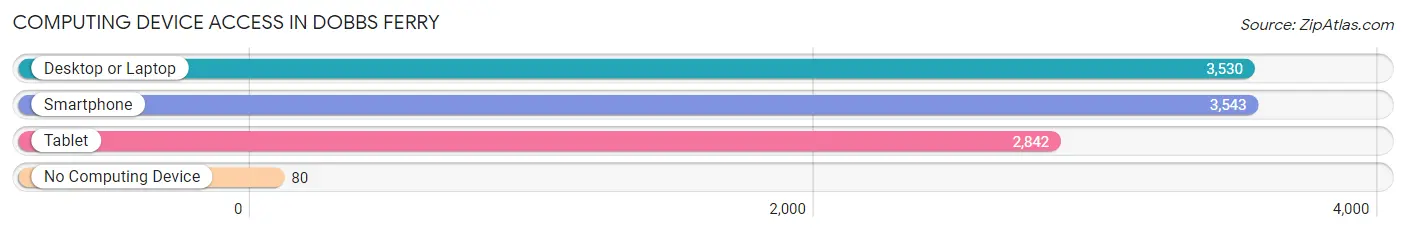
| Device Type | # Households | % Households |
| Desktop or Laptop | 3,530 | 93.0% |
| Smartphone | 3,543 | 93.4% |
| Tablet | 2,842 | 74.9% |
| No Computing Device | 80 | 2.1% |
| Total | 3,794 | 100.0% |
Internet Access in Dobbs Ferry
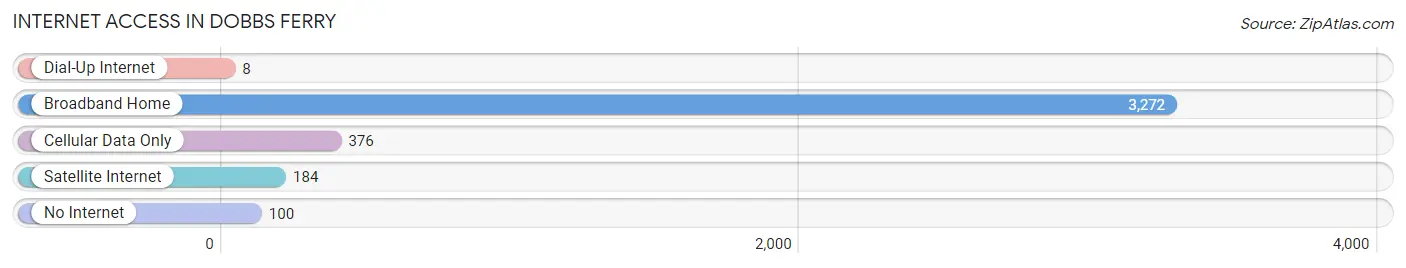
| Internet Type | # Households | % Households |
| Dial-Up Internet | 8 | 0.2% |
| Broadband Home | 3,272 | 86.2% |
| Cellular Data Only | 376 | 9.9% |
| Satellite Internet | 184 | 4.9% |
| No Internet | 100 | 2.6% |
| Total | 3,794 | 100.0% |
Dobbs Ferry Summary
Dobbs Ferry is a village located in Westchester County, New York, United States. It is situated on the eastern bank of the Hudson River, about 20 miles north of New York City. The village is part of the town of Greenburgh and is bordered by the villages of Irvington and Hastings-on-Hudson. As of the 2010 census, the village had a population of 10,875.
History
The area that is now Dobbs Ferry was originally inhabited by the Siwanoy, a Native American tribe of the Wappinger Confederacy. The first recorded European settler of the area was Jeremiah Dobbs, who arrived in 1698 and established a ferry service across the Hudson River. The village was officially incorporated in 1873 and was named after Dobbs.
In the 19th century, Dobbs Ferry became a popular summer resort for wealthy New Yorkers. The village was home to several large estates, including the estate of William Rockefeller, which is now the campus of Mercy College.
Geography
Dobbs Ferry is located at 41°02'N 73°51'W (41.037, -73.851). According to the United States Census Bureau, the village has a total area of 2.2 square miles (5.7 km2), of which 1.9 square miles (4.9 km2) is land and 0.3 square miles (0.8 km2) is water.
The village is located on the eastern bank of the Hudson River, about 20 miles north of New York City. It is bordered by the villages of Irvington and Hastings-on-Hudson.
Economy
Dobbs Ferry is a primarily residential community, with a small commercial district. The village is home to several small businesses, including restaurants, shops, and professional services. The village is also home to Mercy College, a private four-year college.
Demographics
As of the 2010 census, there were 10,875 people, 4,072 households, and 2,619 families residing in the village. The population density was 5,717.3 people per square mile (2,213.2/km2). There were 4,307 housing units at an average density of 2,269.2 per square mile (876.2/km2). The racial makeup of the village was 79.2% White, 8.3% African American, 0.2% Native American, 7.3% Asian, 0.1% Pacific Islander, 2.3% from other races, and 2.6% from two or more races. Hispanic or Latino of any race were 8.7% of the population.
There were 4,072 households, out of which 33.2% had children under the age of 18 living with them, 51.2% were married couples living together, 10.7% had a female householder with no husband present, and 34.2% were non-families. 28.2% of all households were made up of individuals, and 11.2% had someone living alone who was 65 years of age or older. The average household size was 2.60 and the average family size was 3.22.
In the village, the population was spread out, with 25.2% under the age of 18, 8.2% from 18 to 24, 28.2% from 25 to 44, 24.2% from 45 to 64, and 14.2% who were 65 years of age or older. The median age was 37 years. For every 100 females, there were 91.2 males. For every 100 females age 18 and over, there were 87.2 males.
The median income for a household in the village was $76,843, and the median income for a family was $95,817. Males had a median income of $60,938 versus $45,964 for females. The per capita income for the village was $37,945. About 3.2% of families and 5.2% of the population were below the poverty line, including 5.7% of those under age 18 and 5.2% of those age 65 or over.
Common Questions
What is Per Capita Income in Dobbs Ferry?
Per Capita income in Dobbs Ferry is $69,682.
What is the Median Family Income in Dobbs Ferry?
Median Family Income in Dobbs Ferry is $174,527.
What is the Median Household income in Dobbs Ferry?
Median Household Income in Dobbs Ferry is $144,000.
What is Income or Wage Gap in Dobbs Ferry?
Income or Wage Gap in Dobbs Ferry is 28.0%.
Women in Dobbs Ferry earn 72.0 cents for every dollar earned by a man.
What is Inequality or Gini Index in Dobbs Ferry?
Inequality or Gini Index in Dobbs Ferry is 0.48.
What is the Total Population of Dobbs Ferry?
Total Population of Dobbs Ferry is 11,431.
What is the Total Male Population of Dobbs Ferry?
Total Male Population of Dobbs Ferry is 5,765.
What is the Total Female Population of Dobbs Ferry?
Total Female Population of Dobbs Ferry is 5,666.
What is the Ratio of Males per 100 Females in Dobbs Ferry?
There are 101.75 Males per 100 Females in Dobbs Ferry.
What is the Ratio of Females per 100 Males in Dobbs Ferry?
There are 98.28 Females per 100 Males in Dobbs Ferry.
What is the Median Population Age in Dobbs Ferry?
Median Population Age in Dobbs Ferry is 39.0 Years.
What is the Average Family Size in Dobbs Ferry
Average Family Size in Dobbs Ferry is 3.2 People.
What is the Average Household Size in Dobbs Ferry
Average Household Size in Dobbs Ferry is 2.8 People.
How Large is the Labor Force in Dobbs Ferry?
There are 6,239 People in the Labor Forcein in Dobbs Ferry.
What is the Percentage of People in the Labor Force in Dobbs Ferry?
69.2% of People are in the Labor Force in Dobbs Ferry.
What is the Unemployment Rate in Dobbs Ferry?
Unemployment Rate in Dobbs Ferry is 5.8%.