Portage Des Sioux, MO Map & Demographics
Portage Des Sioux Map
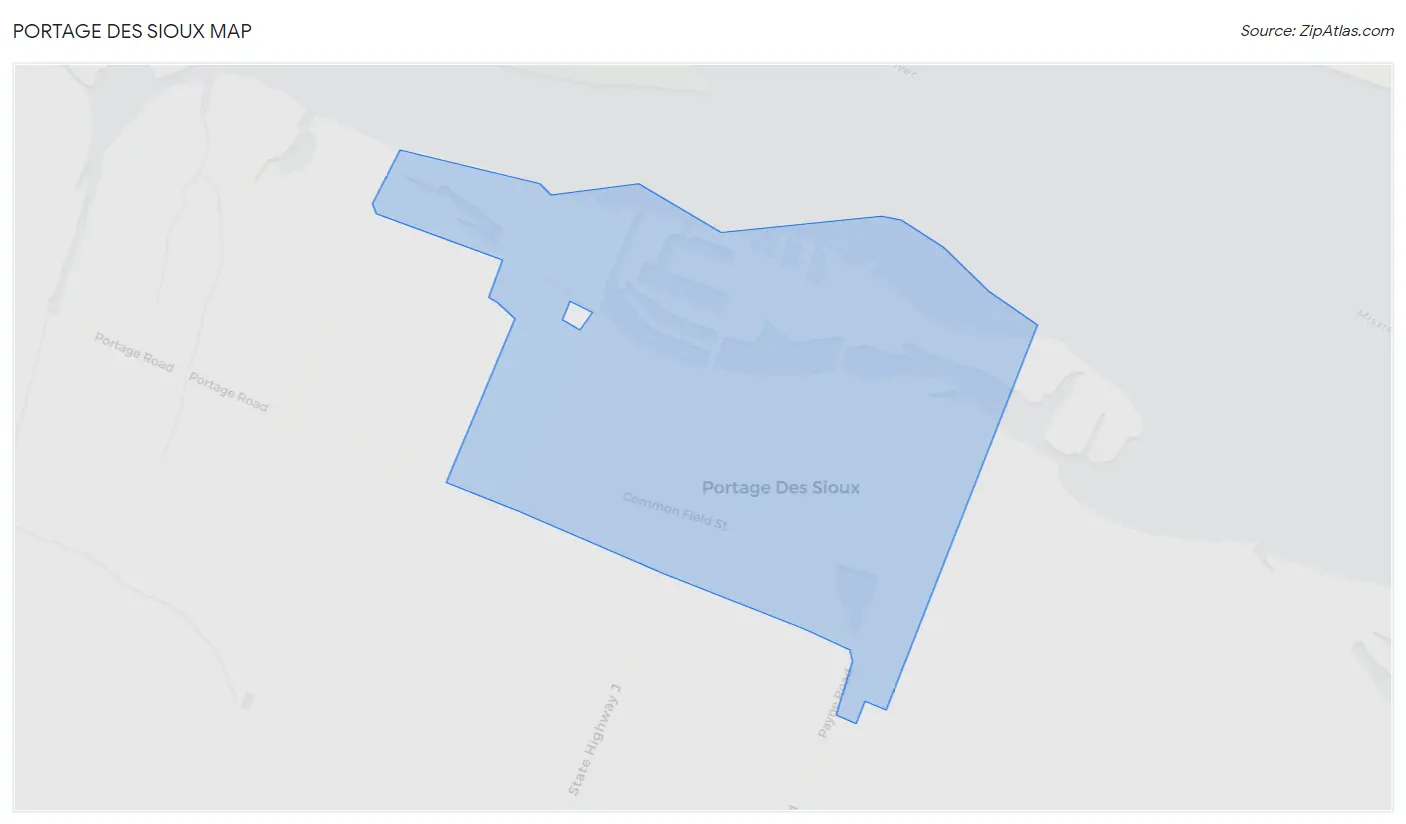
Portage Des Sioux Overview
$27,950
PER CAPITA INCOME
$71,875
AVG FAMILY INCOME
$65,000
AVG HOUSEHOLD INCOME
26.3%
WAGE / INCOME GAP [ % ]
73.7¢/ $1
WAGE / INCOME GAP [ $ ]
0.36
INEQUALITY / GINI INDEX
330
TOTAL POPULATION
170
MALE POPULATION
160
FEMALE POPULATION
106.25
MALES / 100 FEMALES
94.12
FEMALES / 100 MALES
40.5
MEDIAN AGE
2.8
AVG FAMILY SIZE
2.5
AVG HOUSEHOLD SIZE
176
LABOR FORCE [ PEOPLE ]
64.7%
PERCENT IN LABOR FORCE
3.4%
UNEMPLOYMENT RATE
Portage Des Sioux Zip Codes
Portage Des Sioux Area Codes
Income in Portage Des Sioux
Income Overview in Portage Des Sioux
Per Capita Income in Portage Des Sioux is $27,950, while median incomes of families and households are $71,875 and $65,000 respectively.
| Characteristic | Number | Measure |
| Per Capita Income | 330 | $27,950 |
| Median Family Income | 95 | $71,875 |
| Mean Family Income | 95 | $80,316 |
| Median Household Income | 130 | $65,000 |
| Mean Household Income | 130 | $72,154 |
| Income Deficit | 95 | $0 |
| Wage / Income Gap (%) | 330 | 26.32% |
| Wage / Income Gap ($) | 330 | 73.68¢ per $1 |
| Gini / Inequality Index | 330 | 0.36 |
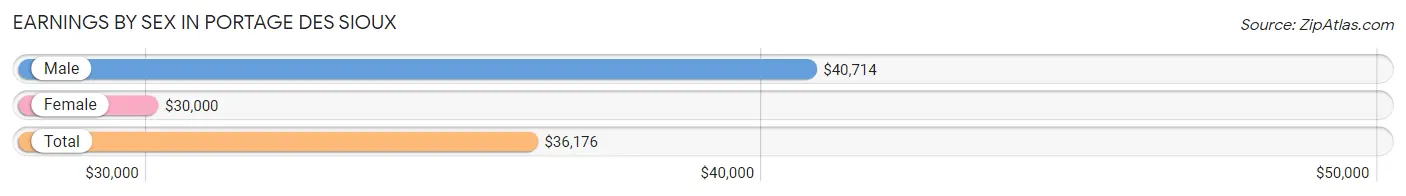
Earnings by Sex in Portage Des Sioux
Average Earnings in Portage Des Sioux are $36,176, $40,714 for men and $30,000 for women, a difference of 26.3%.
| Sex | Number | Average Earnings |
| Male | 100 (55.6%) | $40,714 |
| Female | 80 (44.4%) | $30,000 |
| Total | 180 (100.0%) | $36,176 |
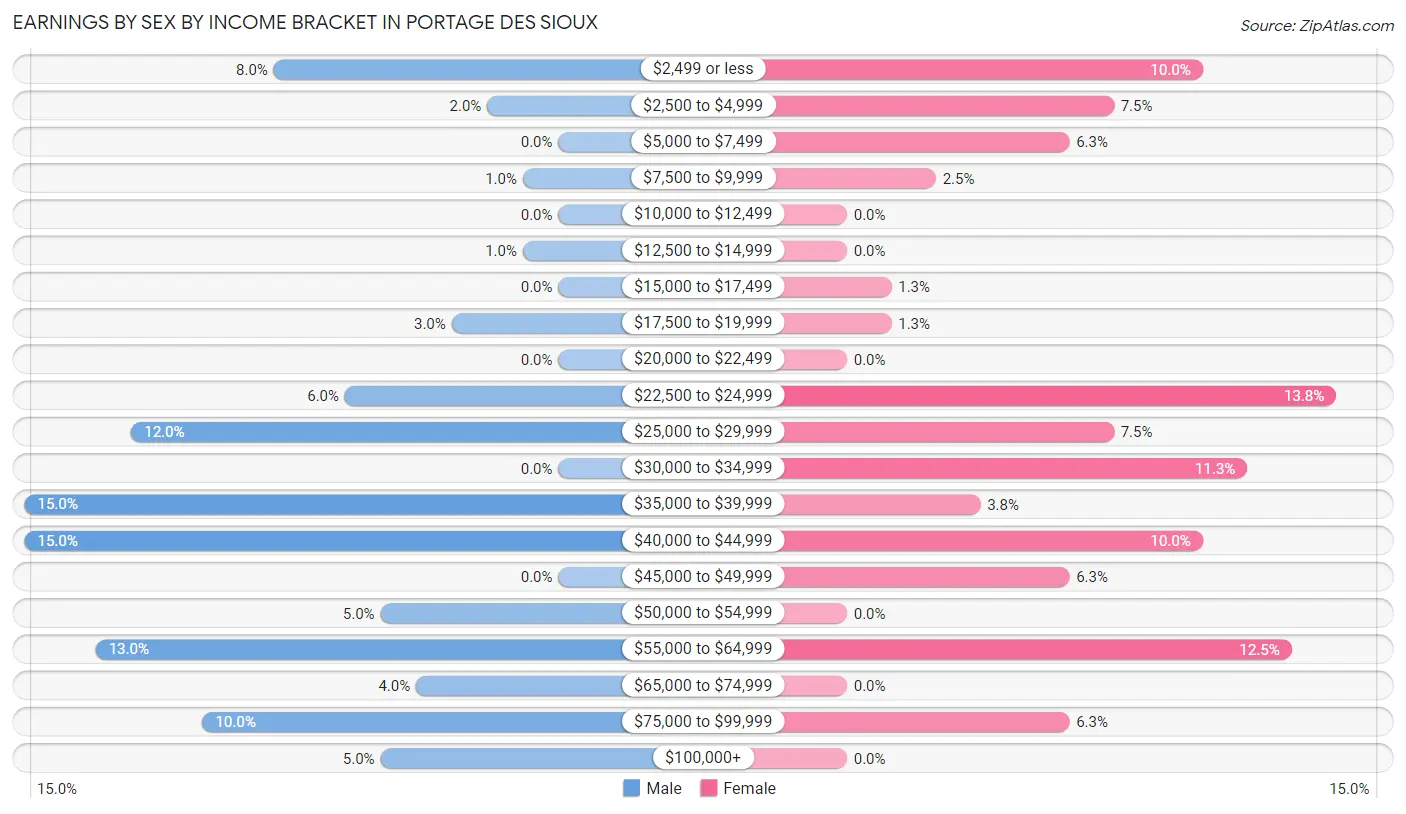
Earnings by Sex by Income Bracket in Portage Des Sioux
The most common earnings brackets in Portage Des Sioux are $35,000 to $39,999 for men (15 | 15.0%) and $22,500 to $24,999 for women (11 | 13.8%).
| Income | Male | Female |
| $2,499 or less | 8 (8.0%) | 8 (10.0%) |
| $2,500 to $4,999 | 2 (2.0%) | 6 (7.5%) |
| $5,000 to $7,499 | 0 (0.0%) | 5 (6.2%) |
| $7,500 to $9,999 | 1 (1.0%) | 2 (2.5%) |
| $10,000 to $12,499 | 0 (0.0%) | 0 (0.0%) |
| $12,500 to $14,999 | 1 (1.0%) | 0 (0.0%) |
| $15,000 to $17,499 | 0 (0.0%) | 1 (1.3%) |
| $17,500 to $19,999 | 3 (3.0%) | 1 (1.3%) |
| $20,000 to $22,499 | 0 (0.0%) | 0 (0.0%) |
| $22,500 to $24,999 | 6 (6.0%) | 11 (13.8%) |
| $25,000 to $29,999 | 12 (12.0%) | 6 (7.5%) |
| $30,000 to $34,999 | 0 (0.0%) | 9 (11.3%) |
| $35,000 to $39,999 | 15 (15.0%) | 3 (3.7%) |
| $40,000 to $44,999 | 15 (15.0%) | 8 (10.0%) |
| $45,000 to $49,999 | 0 (0.0%) | 5 (6.2%) |
| $50,000 to $54,999 | 5 (5.0%) | 0 (0.0%) |
| $55,000 to $64,999 | 13 (13.0%) | 10 (12.5%) |
| $65,000 to $74,999 | 4 (4.0%) | 0 (0.0%) |
| $75,000 to $99,999 | 10 (10.0%) | 5 (6.2%) |
| $100,000+ | 5 (5.0%) | 0 (0.0%) |
| Total | 100 (100.0%) | 80 (100.0%) |
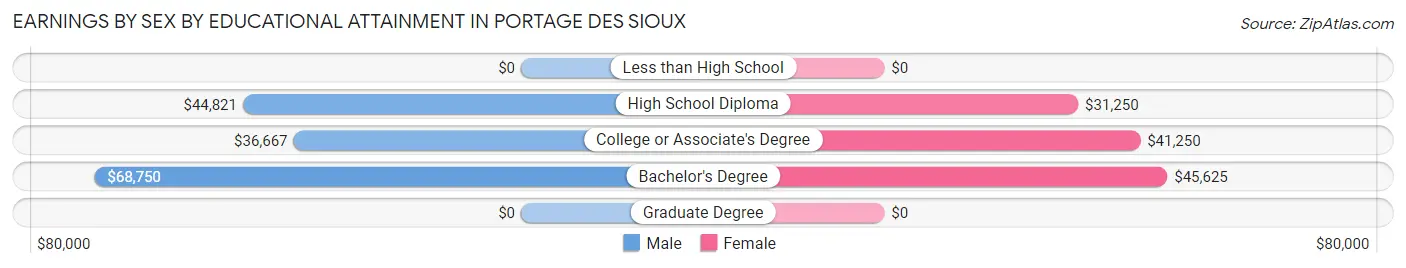
Earnings by Sex by Educational Attainment in Portage Des Sioux
Average earnings in Portage Des Sioux are $44,219 for men and $35,625 for women, a difference of 19.4%. Men with an educational attainment of bachelor's degree enjoy the highest average annual earnings of $68,750, while those with college or associate's degree education earn the least with $36,667. Women with an educational attainment of bachelor's degree earn the most with the average annual earnings of $45,625, while those with high school diploma education have the smallest earnings of $31,250.
| Educational Attainment | Male Income | Female Income |
| Less than High School | - | - |
| High School Diploma | $44,821 | $31,250 |
| College or Associate's Degree | $36,667 | $41,250 |
| Bachelor's Degree | $68,750 | $45,625 |
| Graduate Degree | - | - |
| Total | $44,219 | $35,625 |
Family Income in Portage Des Sioux
Family Income Brackets in Portage Des Sioux
According to the Portage Des Sioux family income data, there are 25 families falling into the $100,000 to $149,999 income range, which is the most common income bracket and makes up 26.3% of all families. Conversely, the $15,000 to $24,999 income bracket is the least frequent group with only 1 families (1.1%) belonging to this category.
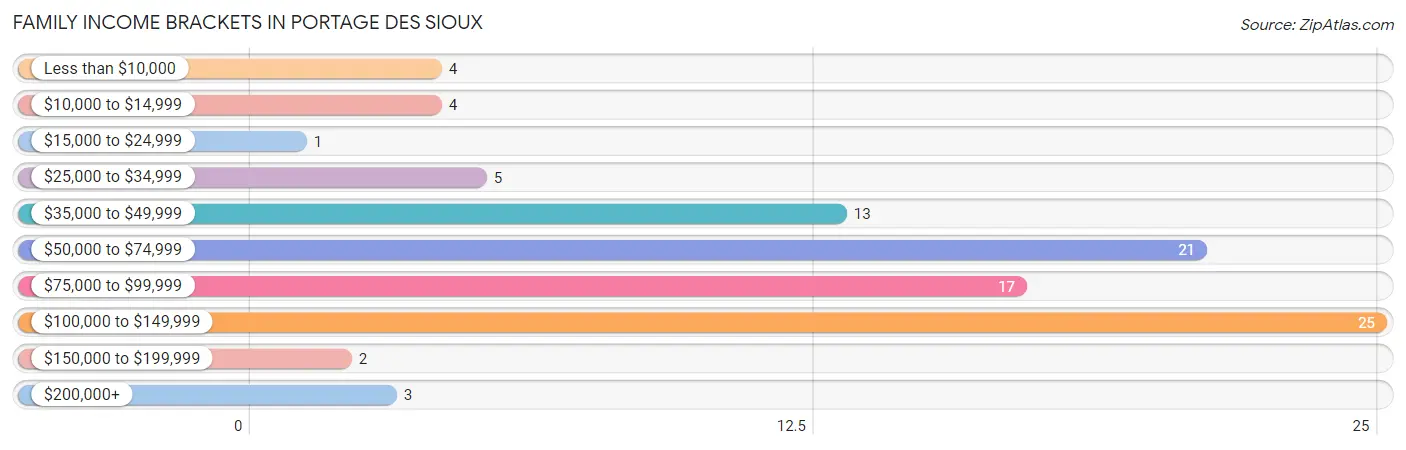
| Income Bracket | # Families | % Families |
| Less than $10,000 | 4 | 4.2% |
| $10,000 to $14,999 | 4 | 4.2% |
| $15,000 to $24,999 | 1 | 1.1% |
| $25,000 to $34,999 | 5 | 5.3% |
| $35,000 to $49,999 | 13 | 13.7% |
| $50,000 to $74,999 | 21 | 22.1% |
| $75,000 to $99,999 | 17 | 17.9% |
| $100,000 to $149,999 | 25 | 26.3% |
| $150,000 to $199,999 | 2 | 2.1% |
| $200,000+ | 3 | 3.2% |
Family Income by Famaliy Size in Portage Des Sioux
4-person families (10 | 10.5%) account for the highest median family income in Portage Des Sioux with $96,875 per family, while 2-person families (45 | 47.4%) have the highest median income of $35,938 per family member.
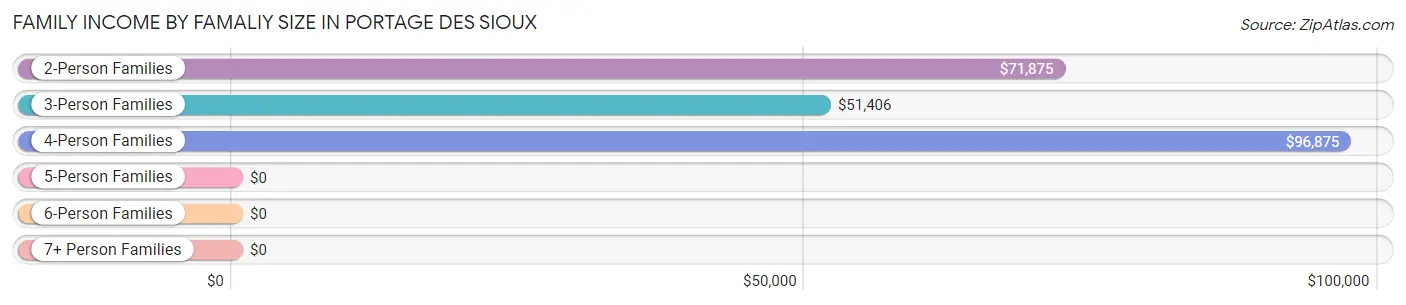
| Income Bracket | # Families | Median Income |
| 2-Person Families | 45 (47.4%) | $71,875 |
| 3-Person Families | 33 (34.7%) | $51,406 |
| 4-Person Families | 10 (10.5%) | $96,875 |
| 5-Person Families | 7 (7.4%) | $0 |
| 6-Person Families | 0 (0.0%) | $0 |
| 7+ Person Families | 0 (0.0%) | $0 |
| Total | 95 (100.0%) | $71,875 |
Family Income by Number of Earners in Portage Des Sioux
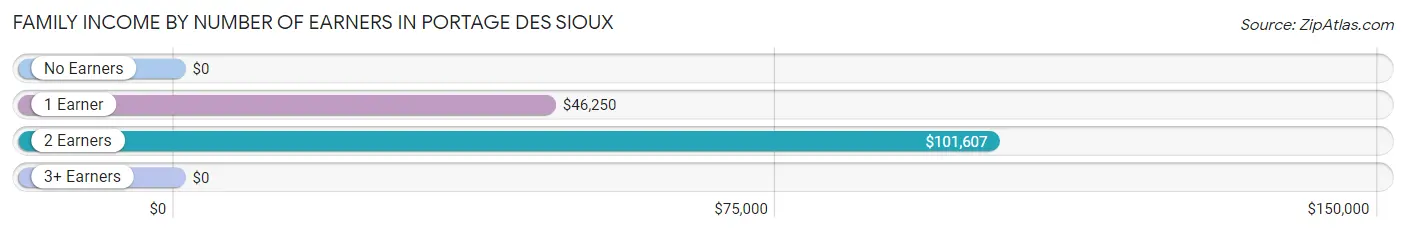
| Number of Earners | # Families | Median Income |
| No Earners | 14 (14.7%) | $0 |
| 1 Earner | 24 (25.3%) | $46,250 |
| 2 Earners | 51 (53.7%) | $101,607 |
| 3+ Earners | 6 (6.3%) | $0 |
| Total | 95 (100.0%) | $71,875 |
Household Income in Portage Des Sioux
Household Income Brackets in Portage Des Sioux
With 27 households falling in the category, the $75,000 to $99,999 income range is the most frequent in Portage Des Sioux, accounting for 20.8% of all households. In contrast, only 2 households (1.5%) fall into the $150,000 to $199,999 income bracket, making it the least populous group.
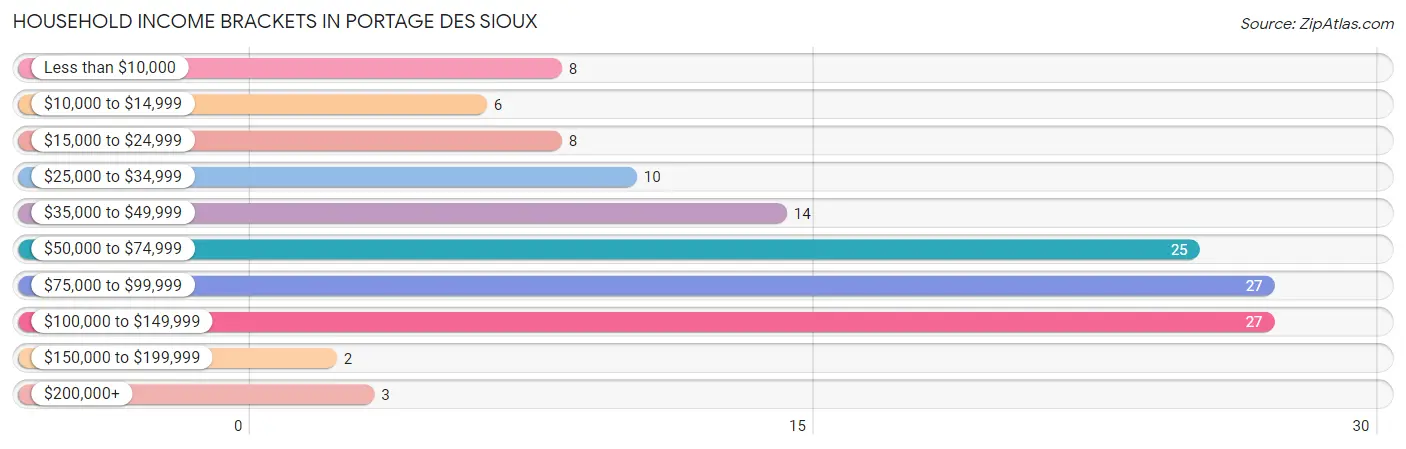
| Income Bracket | # Households | % Households |
| Less than $10,000 | 8 | 6.2% |
| $10,000 to $14,999 | 6 | 4.6% |
| $15,000 to $24,999 | 8 | 6.2% |
| $25,000 to $34,999 | 10 | 7.7% |
| $35,000 to $49,999 | 14 | 10.8% |
| $50,000 to $74,999 | 25 | 19.2% |
| $75,000 to $99,999 | 27 | 20.8% |
| $100,000 to $149,999 | 27 | 20.8% |
| $150,000 to $199,999 | 2 | 1.5% |
| $200,000+ | 3 | 2.3% |
Household Income by Householder Age in Portage Des Sioux
The median household income in Portage Des Sioux is $65,000, with the highest median household income of $93,750 found in the 25 to 44 years age bracket for the primary householder. A total of 44 households (33.9%) fall into this category. Meanwhile, the 15 to 24 years age bracket for the primary householder has the lowest median household income of $0, with 8 households (6.1%) in this group.
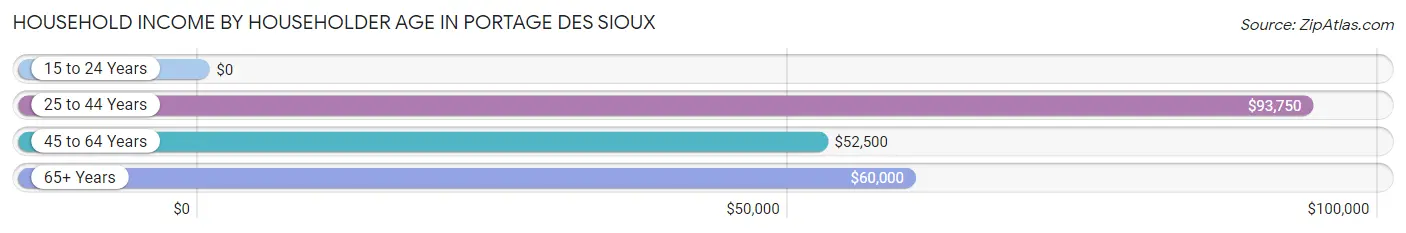
| Income Bracket | # Households | Median Income |
| 15 to 24 Years | 8 (6.1%) | $0 |
| 25 to 44 Years | 44 (33.9%) | $93,750 |
| 45 to 64 Years | 48 (36.9%) | $52,500 |
| 65+ Years | 30 (23.1%) | $60,000 |
| Total | 130 (100.0%) | $65,000 |
Poverty in Portage Des Sioux
Income Below Poverty by Sex and Age in Portage Des Sioux
With 12.9% poverty level for males and 13.1% for females among the residents of Portage Des Sioux, 16 and 17 year old males and 12 to 14 year old females are the most vulnerable to poverty, with 2 males (100.0%) and 4 females (100.0%) in their respective age groups living below the poverty level.
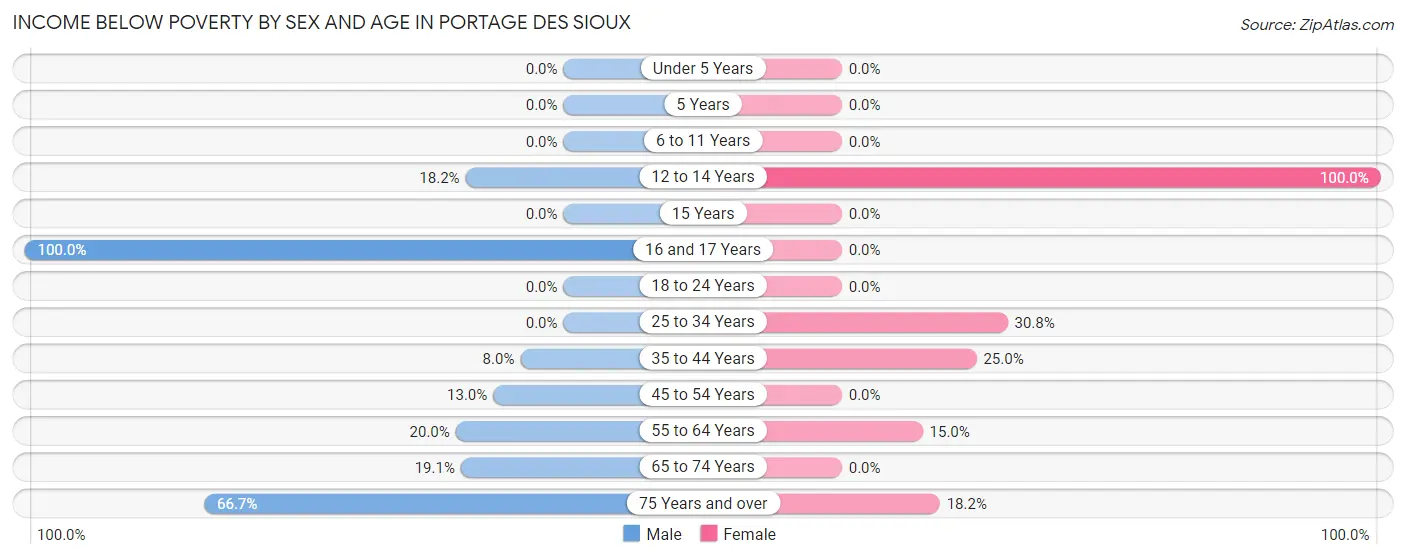
| Age Bracket | Male | Female |
| Under 5 Years | 0 (0.0%) | 0 (0.0%) |
| 5 Years | 0 (0.0%) | 0 (0.0%) |
| 6 to 11 Years | 0 (0.0%) | 0 (0.0%) |
| 12 to 14 Years | 2 (18.2%) | 4 (100.0%) |
| 15 Years | 0 (0.0%) | 0 (0.0%) |
| 16 and 17 Years | 2 (100.0%) | 0 (0.0%) |
| 18 to 24 Years | 0 (0.0%) | 0 (0.0%) |
| 25 to 34 Years | 0 (0.0%) | 4 (30.8%) |
| 35 to 44 Years | 2 (8.0%) | 8 (25.0%) |
| 45 to 54 Years | 3 (13.0%) | 0 (0.0%) |
| 55 to 64 Years | 7 (20.0%) | 3 (15.0%) |
| 65 to 74 Years | 4 (19.1%) | 0 (0.0%) |
| 75 Years and over | 2 (66.7%) | 2 (18.2%) |
| Total | 22 (12.9%) | 21 (13.1%) |
Income Above Poverty by Sex and Age in Portage Des Sioux
According to the poverty statistics in Portage Des Sioux, males aged under 5 years and females aged under 5 years are the age groups that are most secure financially, with 100.0% of males and 100.0% of females in these age groups living above the poverty line.
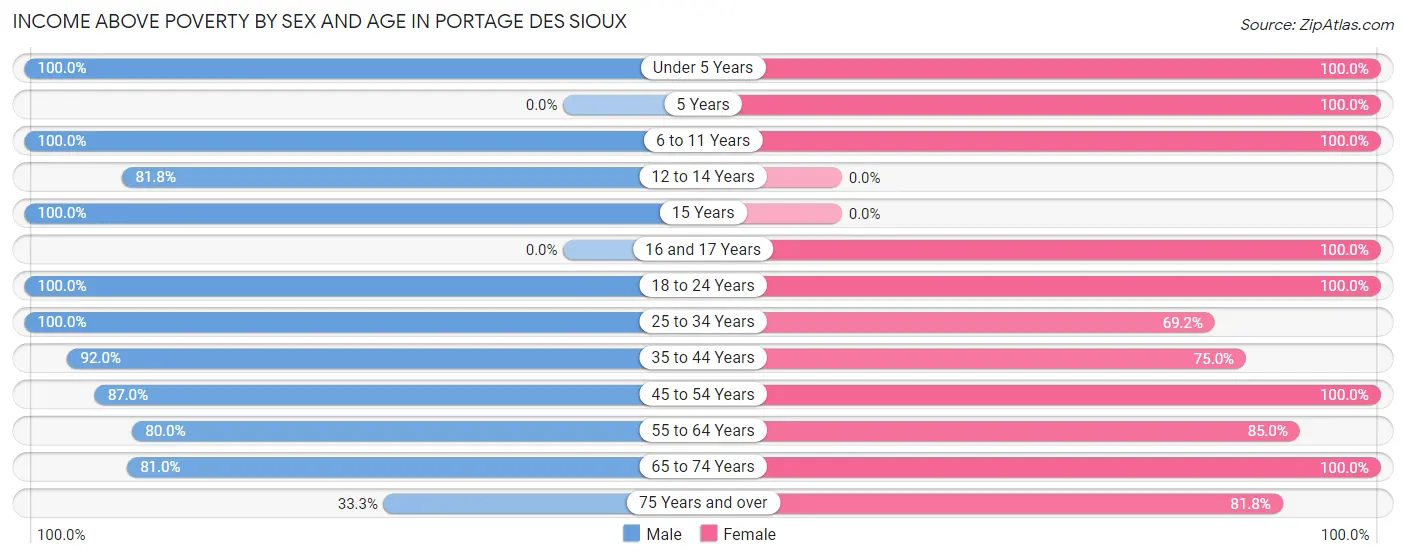
| Age Bracket | Male | Female |
| Under 5 Years | 7 (100.0%) | 8 (100.0%) |
| 5 Years | 0 (0.0%) | 4 (100.0%) |
| 6 to 11 Years | 6 (100.0%) | 16 (100.0%) |
| 12 to 14 Years | 9 (81.8%) | 0 (0.0%) |
| 15 Years | 2 (100.0%) | 0 (0.0%) |
| 16 and 17 Years | 0 (0.0%) | 4 (100.0%) |
| 18 to 24 Years | 27 (100.0%) | 15 (100.0%) |
| 25 to 34 Years | 8 (100.0%) | 9 (69.2%) |
| 35 to 44 Years | 23 (92.0%) | 24 (75.0%) |
| 45 to 54 Years | 20 (87.0%) | 12 (100.0%) |
| 55 to 64 Years | 28 (80.0%) | 17 (85.0%) |
| 65 to 74 Years | 17 (80.9%) | 21 (100.0%) |
| 75 Years and over | 1 (33.3%) | 9 (81.8%) |
| Total | 148 (87.1%) | 139 (86.9%) |
Income Below Poverty Among Married-Couple Families in Portage Des Sioux
The poverty statistics for married-couple families in Portage Des Sioux show that 2.7% or 2 of the total 73 families live below the poverty line. Families with no children have the highest poverty rate of 4.8%, comprising of 2 families. On the other hand, families with 1 or 2 children have the lowest poverty rate of 0.0%, which includes 0 families.
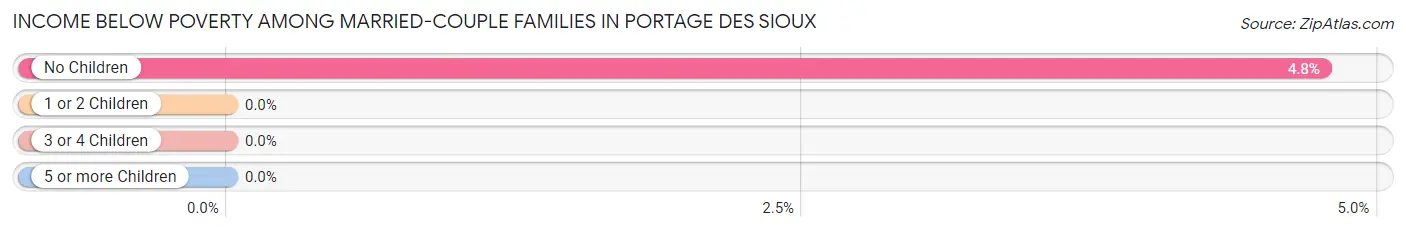
| Children | Above Poverty | Below Poverty |
| No Children | 40 (95.2%) | 2 (4.8%) |
| 1 or 2 Children | 24 (100.0%) | 0 (0.0%) |
| 3 or 4 Children | 7 (100.0%) | 0 (0.0%) |
| 5 or more Children | 0 (0.0%) | 0 (0.0%) |
| Total | 71 (97.3%) | 2 (2.7%) |
Income Below Poverty Among Single-Parent Households in Portage Des Sioux
According to the poverty data in Portage Des Sioux, 11.1% or 1 single-father households and 46.2% or 6 single-mother households are living below the poverty line. Among single-father households, those with no children have the highest poverty rate, with 1 households (16.7%) experiencing poverty. Likewise, among single-mother households, those with 1 or 2 children have the highest poverty rate, with 6 households (66.7%) falling below the poverty line.
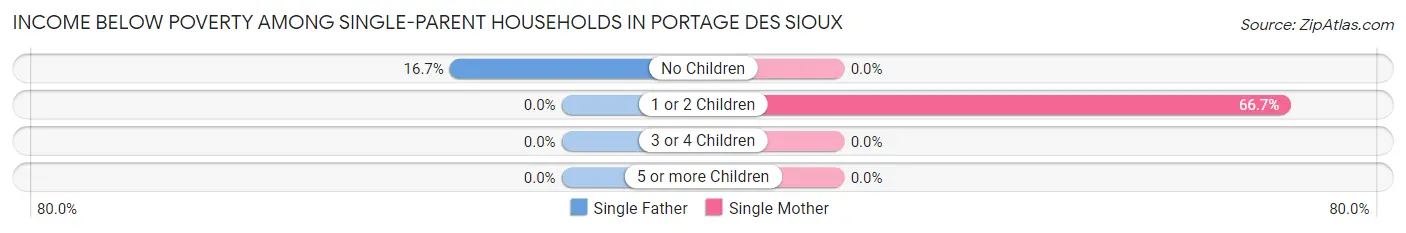
| Children | Single Father | Single Mother |
| No Children | 1 (16.7%) | 0 (0.0%) |
| 1 or 2 Children | 0 (0.0%) | 6 (66.7%) |
| 3 or 4 Children | 0 (0.0%) | 0 (0.0%) |
| 5 or more Children | 0 (0.0%) | 0 (0.0%) |
| Total | 1 (11.1%) | 6 (46.2%) |
Income Below Poverty Among Married-Couple vs Single-Parent Households in Portage Des Sioux
The poverty data for Portage Des Sioux shows that 2 of the married-couple family households (2.7%) and 7 of the single-parent households (31.8%) are living below the poverty level. Within the married-couple family households, those with no children have the highest poverty rate, with 2 households (4.8%) falling below the poverty line. Among the single-parent households, those with 1 or 2 children have the highest poverty rate, with 6 household (50.0%) living below poverty.
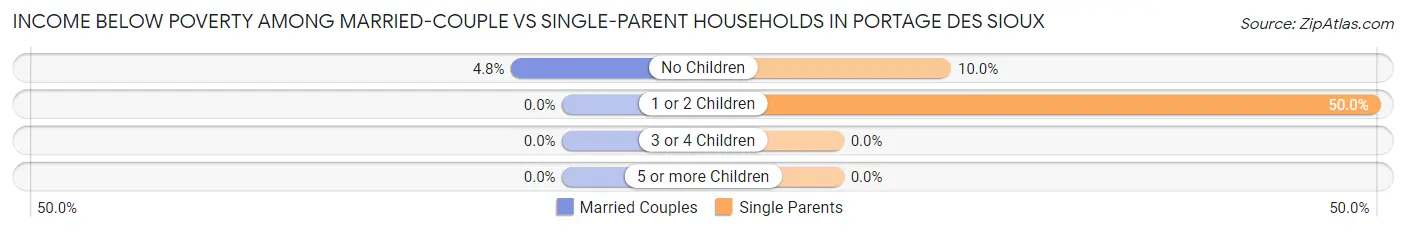
| Children | Married-Couple Families | Single-Parent Households |
| No Children | 2 (4.8%) | 1 (10.0%) |
| 1 or 2 Children | 0 (0.0%) | 6 (50.0%) |
| 3 or 4 Children | 0 (0.0%) | 0 (0.0%) |
| 5 or more Children | 0 (0.0%) | 0 (0.0%) |
| Total | 2 (2.7%) | 7 (31.8%) |
Race in Portage Des Sioux
The most populous races in Portage Des Sioux are White / Caucasian (291 | 88.2%), Two or more Races (29 | 8.8%), and Hispanic or Latino (27 | 8.2%).
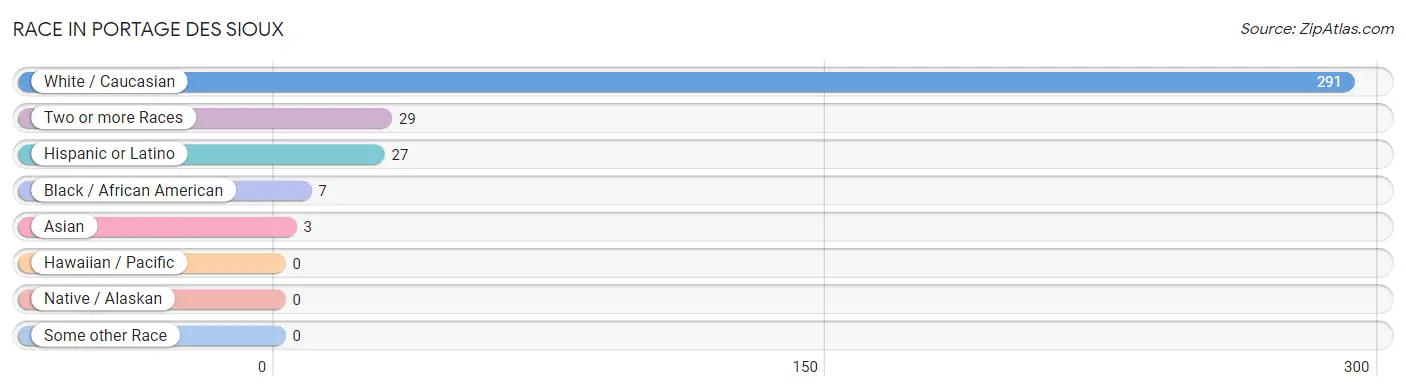
| Race | # Population | % Population |
| Asian | 3 | 0.9% |
| Black / African American | 7 | 2.1% |
| Hawaiian / Pacific | 0 | 0.0% |
| Hispanic or Latino | 27 | 8.2% |
| Native / Alaskan | 0 | 0.0% |
| White / Caucasian | 291 | 88.2% |
| Two or more Races | 29 | 8.8% |
| Some other Race | 0 | 0.0% |
| Total | 330 | 100.0% |
Ancestry in Portage Des Sioux
The most populous ancestries reported in Portage Des Sioux are German (116 | 35.1%), Irish (50 | 15.1%), Mexican (27 | 8.2%), English (18 | 5.4%), and Dutch (17 | 5.1%), together accounting for 69.1% of all Portage Des Sioux residents.
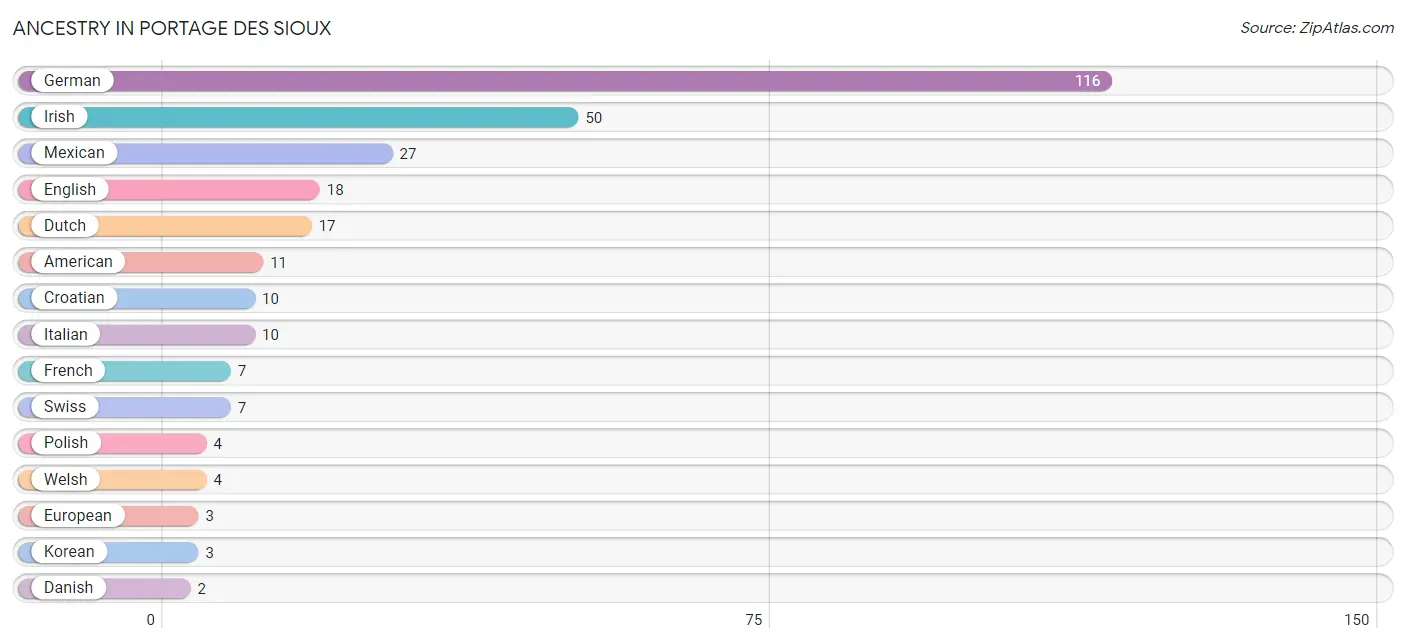
| Ancestry | # Population | % Population |
| American | 11 | 3.3% |
| Arab | 1 | 0.3% |
| Croatian | 10 | 3.0% |
| Danish | 2 | 0.6% |
| Dutch | 17 | 5.1% |
| Eastern European | 1 | 0.3% |
| English | 18 | 5.4% |
| European | 3 | 0.9% |
| French | 7 | 2.1% |
| French Canadian | 2 | 0.6% |
| German | 116 | 35.1% |
| Greek | 2 | 0.6% |
| Irish | 50 | 15.1% |
| Italian | 10 | 3.0% |
| Korean | 3 | 0.9% |
| Lebanese | 1 | 0.3% |
| Mexican | 27 | 8.2% |
| Polish | 4 | 1.2% |
| Swiss | 7 | 2.1% |
| Welsh | 4 | 1.2% | View All 20 Rows |
Immigrants in Portage Des Sioux
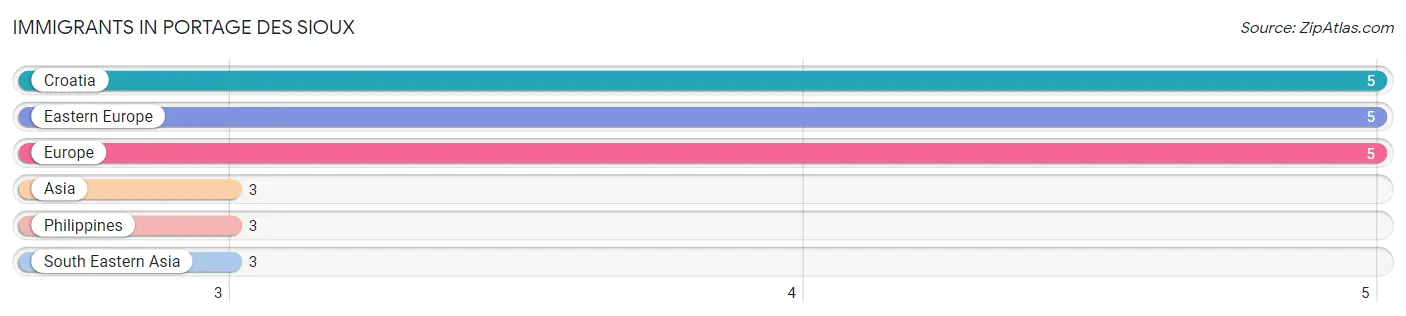
The most numerous immigrant groups reported in Portage Des Sioux came from Croatia (5 | 1.5%), Eastern Europe (5 | 1.5%), Europe (5 | 1.5%), Asia (3 | 0.9%), and Philippines (3 | 0.9%), together accounting for 6.4% of all Portage Des Sioux residents.
| Immigration Origin | # Population | % Population |
| Asia | 3 | 0.9% |
| Croatia | 5 | 1.5% |
| Eastern Europe | 5 | 1.5% |
| Europe | 5 | 1.5% |
| Philippines | 3 | 0.9% |
| South Eastern Asia | 3 | 0.9% | View All 6 Rows |
Sex and Age in Portage Des Sioux
Sex and Age in Portage Des Sioux
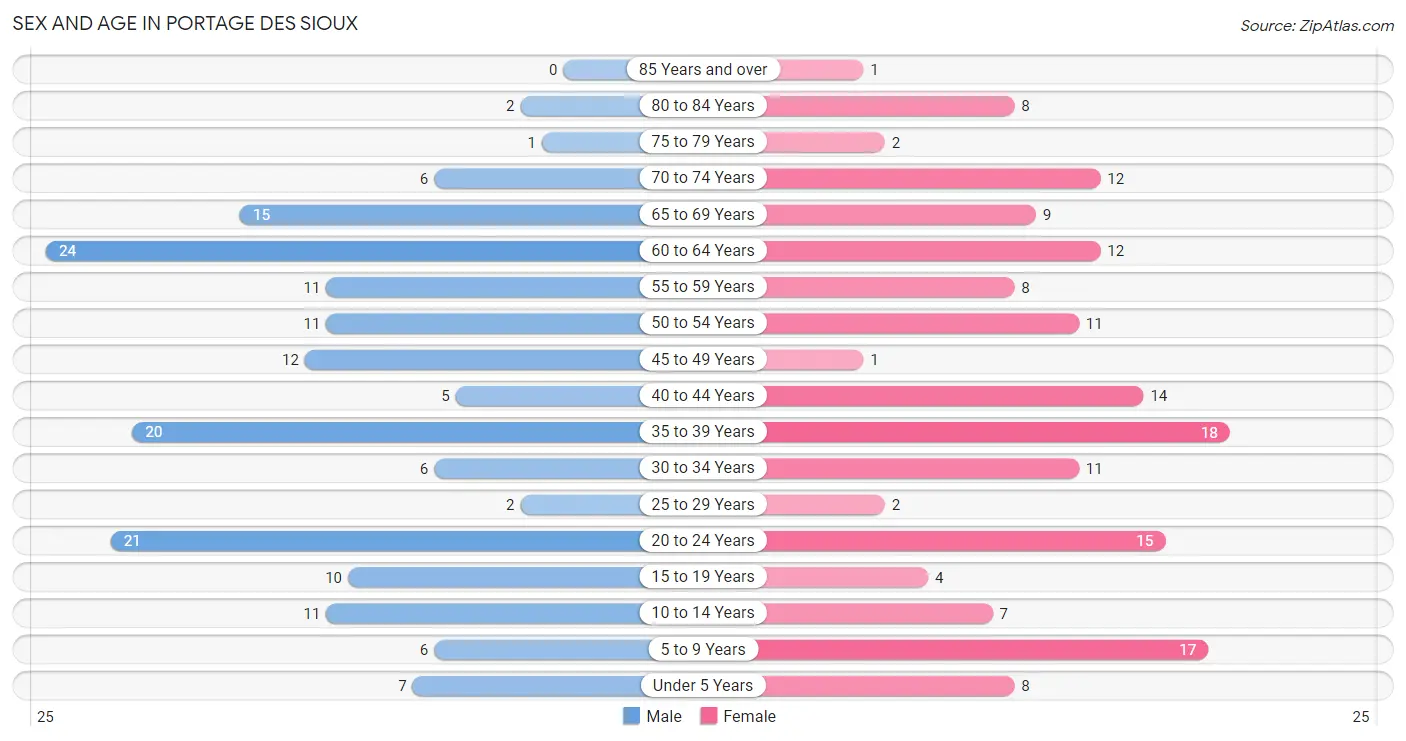
The most populous age groups in Portage Des Sioux are 60 to 64 Years (24 | 14.1%) for men and 35 to 39 Years (18 | 11.3%) for women.
| Age Bracket | Male | Female |
| Under 5 Years | 7 (4.1%) | 8 (5.0%) |
| 5 to 9 Years | 6 (3.5%) | 17 (10.6%) |
| 10 to 14 Years | 11 (6.5%) | 7 (4.4%) |
| 15 to 19 Years | 10 (5.9%) | 4 (2.5%) |
| 20 to 24 Years | 21 (12.3%) | 15 (9.4%) |
| 25 to 29 Years | 2 (1.2%) | 2 (1.3%) |
| 30 to 34 Years | 6 (3.5%) | 11 (6.9%) |
| 35 to 39 Years | 20 (11.8%) | 18 (11.3%) |
| 40 to 44 Years | 5 (2.9%) | 14 (8.7%) |
| 45 to 49 Years | 12 (7.1%) | 1 (0.6%) |
| 50 to 54 Years | 11 (6.5%) | 11 (6.9%) |
| 55 to 59 Years | 11 (6.5%) | 8 (5.0%) |
| 60 to 64 Years | 24 (14.1%) | 12 (7.5%) |
| 65 to 69 Years | 15 (8.8%) | 9 (5.6%) |
| 70 to 74 Years | 6 (3.5%) | 12 (7.5%) |
| 75 to 79 Years | 1 (0.6%) | 2 (1.3%) |
| 80 to 84 Years | 2 (1.2%) | 8 (5.0%) |
| 85 Years and over | 0 (0.0%) | 1 (0.6%) |
| Total | 170 (100.0%) | 160 (100.0%) |
Families and Households in Portage Des Sioux
Median Family Size in Portage Des Sioux
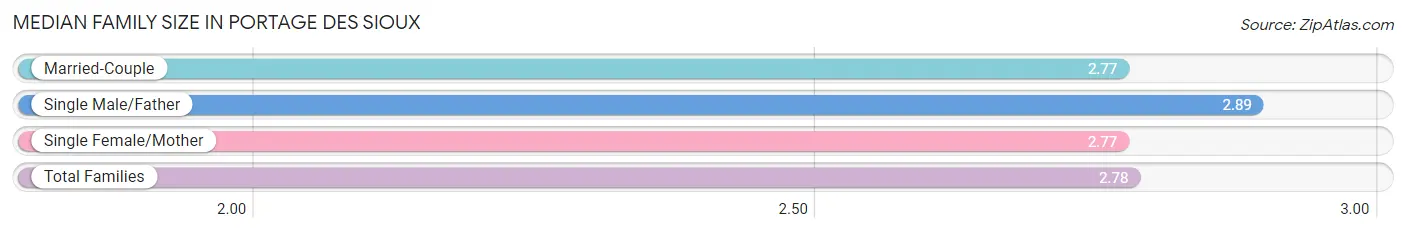
The median family size in Portage Des Sioux is 2.78 persons per family, with single male/father families (9 | 9.5%) accounting for the largest median family size of 2.89 persons per family. On the other hand, married-couple families (73 | 76.8%) represent the smallest median family size with 2.77 persons per family.
| Family Type | # Families | Family Size |
| Married-Couple | 73 (76.8%) | 2.77 |
| Single Male/Father | 9 (9.5%) | 2.89 |
| Single Female/Mother | 13 (13.7%) | 2.77 |
| Total Families | 95 (100.0%) | 2.78 |
Median Household Size in Portage Des Sioux
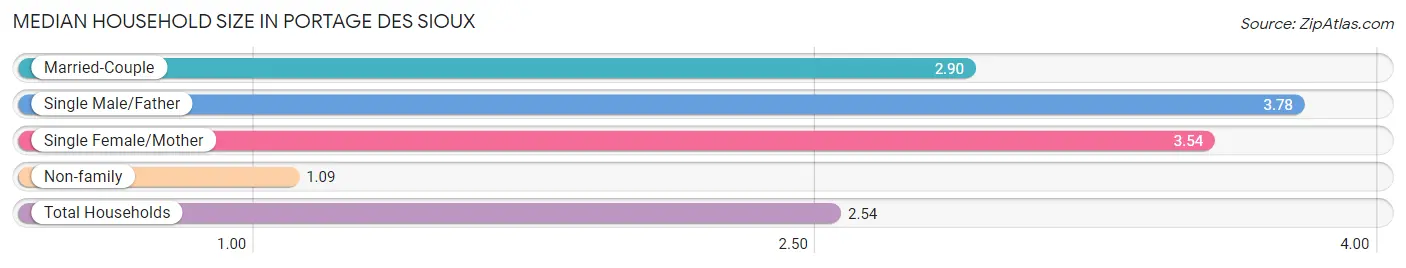
The median household size in Portage Des Sioux is 2.54 persons per household, with single male/father households (9 | 6.9%) accounting for the largest median household size of 3.78 persons per household. non-family households (35 | 26.9%) represent the smallest median household size with 1.09 persons per household.
| Household Type | # Households | Household Size |
| Married-Couple | 73 (56.1%) | 2.90 |
| Single Male/Father | 9 (6.9%) | 3.78 |
| Single Female/Mother | 13 (10.0%) | 3.54 |
| Non-family | 35 (26.9%) | 1.09 |
| Total Households | 130 (100.0%) | 2.54 |
Household Size by Marriage Status in Portage Des Sioux
Out of a total of 130 households in Portage Des Sioux, 95 (73.1%) are family households, while 35 (26.9%) are nonfamily households. The most numerous type of family households are 2-person households, comprising 41, and the most common type of nonfamily households are 1-person households, comprising 31.
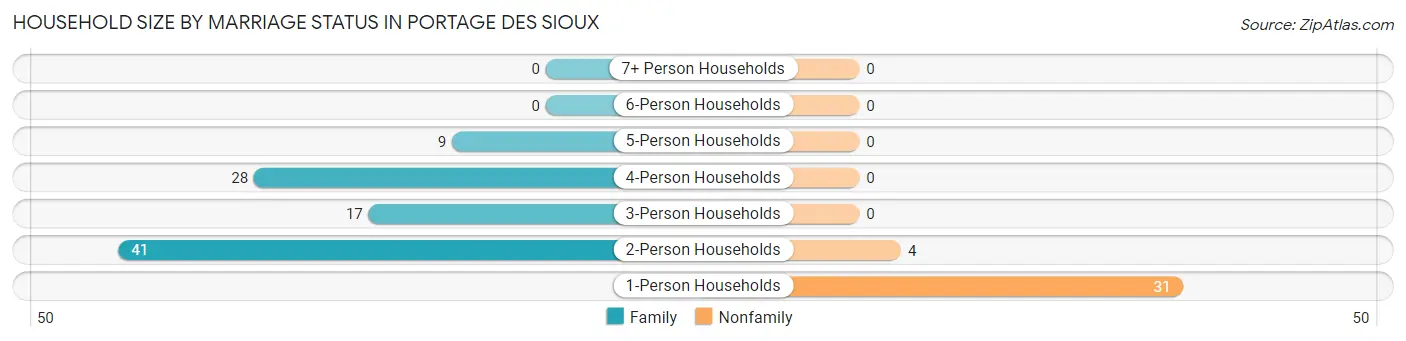
| Household Size | Family Households | Nonfamily Households |
| 1-Person Households | - | 31 (23.8%) |
| 2-Person Households | 41 (31.5%) | 4 (3.1%) |
| 3-Person Households | 17 (13.1%) | 0 (0.0%) |
| 4-Person Households | 28 (21.5%) | 0 (0.0%) |
| 5-Person Households | 9 (6.9%) | 0 (0.0%) |
| 6-Person Households | 0 (0.0%) | 0 (0.0%) |
| 7+ Person Households | 0 (0.0%) | 0 (0.0%) |
| Total | 95 (73.1%) | 35 (26.9%) |
Female Fertility in Portage Des Sioux
Fertility by Age in Portage Des Sioux
Average fertility rate in Portage Des Sioux is 121.0 births per 1,000 women. Women in the age bracket of 20 to 34 years have the highest fertility rate with 286.0 births per 1,000 women. Women in the age bracket of 20 to 34 years acount for 100.0% of all women with births.
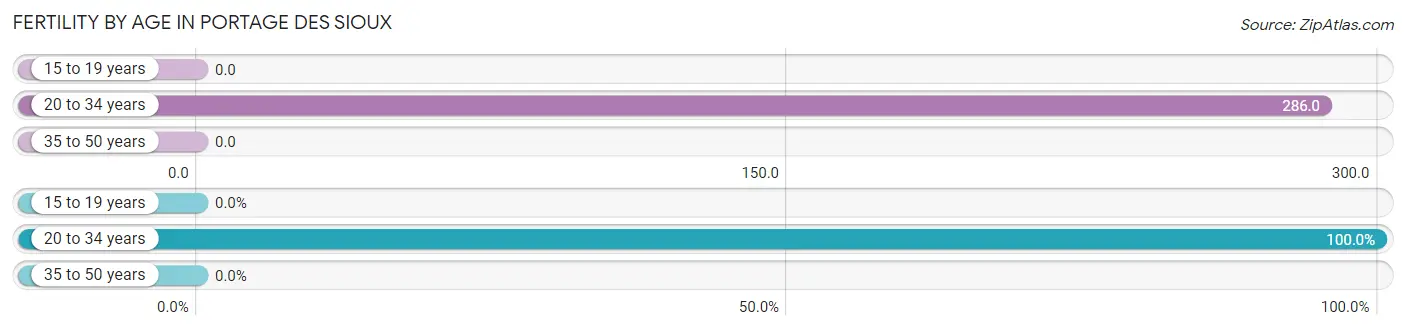
| Age Bracket | Women with Births | Births / 1,000 Women |
| 15 to 19 years | 0 (0.0%) | 0.0 |
| 20 to 34 years | 8 (100.0%) | 286.0 |
| 35 to 50 years | 0 (0.0%) | 0.0 |
| Total | 8 (100.0%) | 121.0 |
Fertility by Age by Marriage Status in Portage Des Sioux
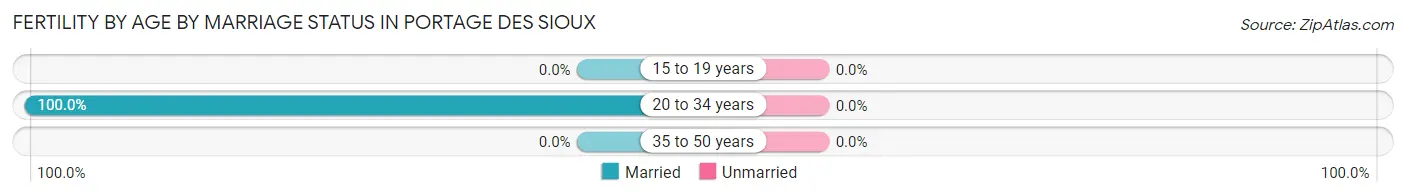
| Age Bracket | Married | Unmarried |
| 15 to 19 years | 0 (0.0%) | 0 (0.0%) |
| 20 to 34 years | 8 (100.0%) | 0 (0.0%) |
| 35 to 50 years | 0 (0.0%) | 0 (0.0%) |
| Total | 8 (100.0%) | 0 (0.0%) |
Fertility by Education in Portage Des Sioux
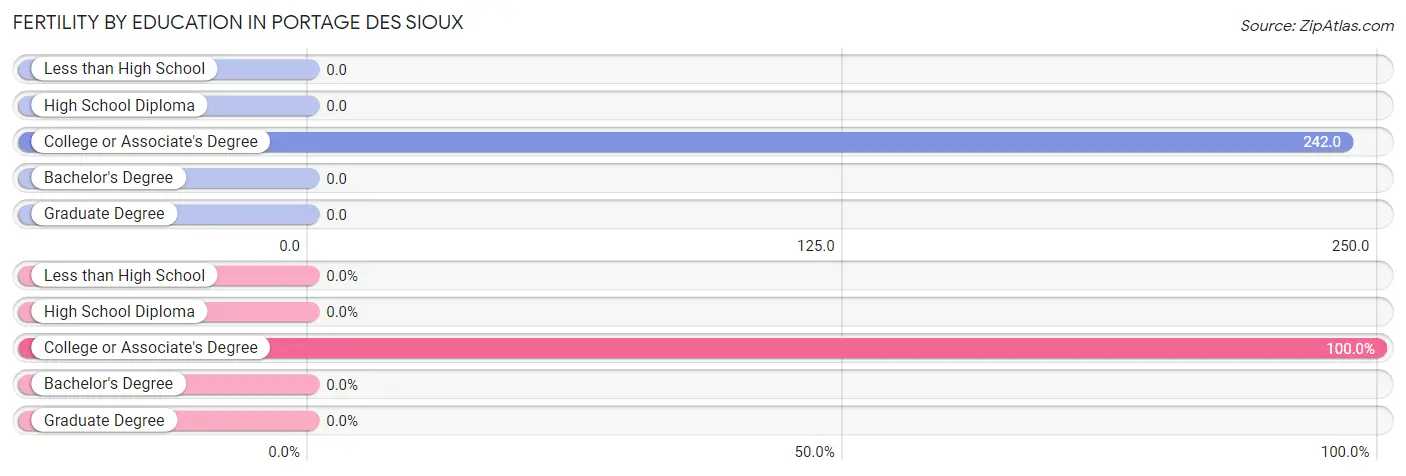
| Educational Attainment | Women with Births | Births / 1,000 Women |
| Less than High School | 0 (0.0%) | 0.0 |
| High School Diploma | 0 (0.0%) | 0.0 |
| College or Associate's Degree | 8 (100.0%) | 242.0 |
| Bachelor's Degree | 0 (0.0%) | 0.0 |
| Graduate Degree | 0 (0.0%) | 0.0 |
| Total | 8 (100.0%) | 121.0 |
Fertility by Education by Marriage Status in Portage Des Sioux
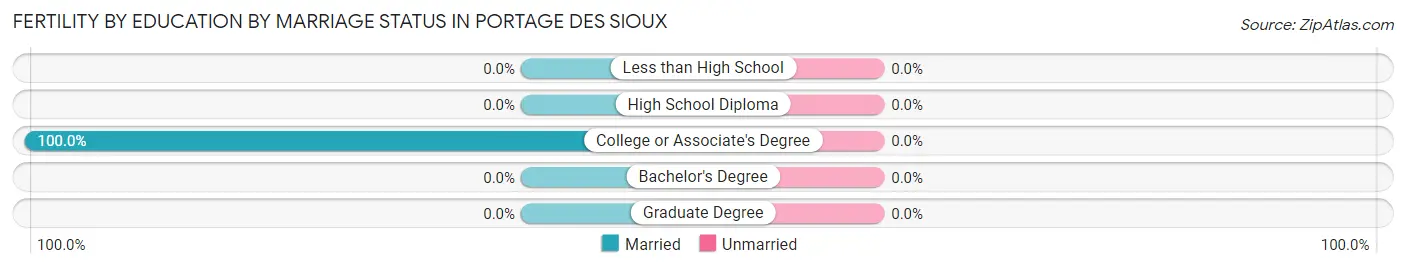
| Educational Attainment | Married | Unmarried |
| Less than High School | 0 (0.0%) | 0 (0.0%) |
| High School Diploma | 0 (0.0%) | 0 (0.0%) |
| College or Associate's Degree | 8 (100.0%) | 0 (0.0%) |
| Bachelor's Degree | 0 (0.0%) | 0 (0.0%) |
| Graduate Degree | 0 (0.0%) | 0 (0.0%) |
| Total | 8 (100.0%) | 0 (0.0%) |
Employment Characteristics in Portage Des Sioux
Employment by Class of Employer in Portage Des Sioux
Among the 169 employed individuals in Portage Des Sioux, private company employees (119 | 70.4%), local government employees (15 | 8.9%), and self-employed (not incorporated) (13 | 7.7%) make up the most common classes of employment.
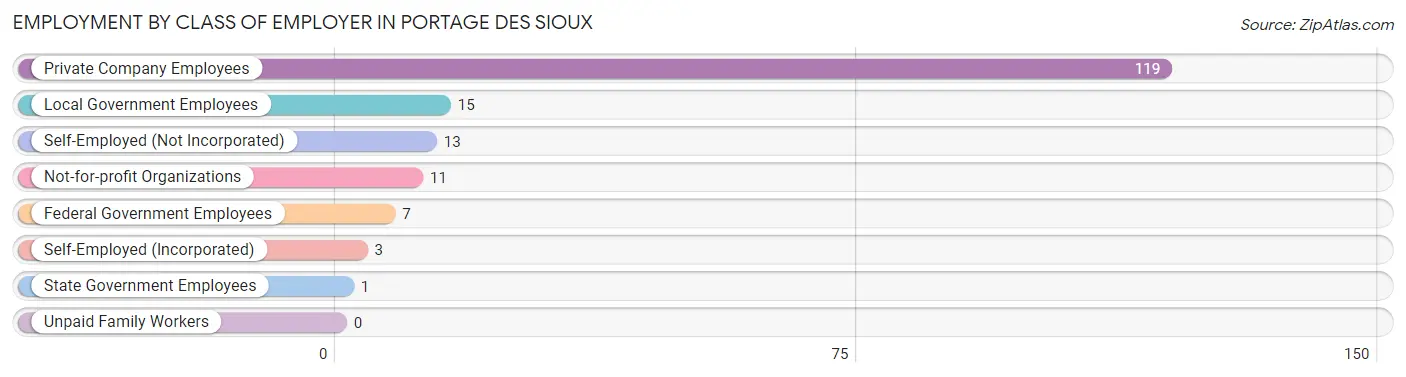
| Employer Class | # Employees | % Employees |
| Private Company Employees | 119 | 70.4% |
| Self-Employed (Incorporated) | 3 | 1.8% |
| Self-Employed (Not Incorporated) | 13 | 7.7% |
| Not-for-profit Organizations | 11 | 6.5% |
| Local Government Employees | 15 | 8.9% |
| State Government Employees | 1 | 0.6% |
| Federal Government Employees | 7 | 4.1% |
| Unpaid Family Workers | 0 | 0.0% |
| Total | 169 | 100.0% |
Employment Status by Age in Portage Des Sioux
According to the labor force statistics for Portage Des Sioux, out of the total population over 16 years of age (272), 64.7% or 176 individuals are in the labor force, with 3.4% or 6 of them unemployed. The age group with the highest labor force participation rate is 20 to 24 years, with 100.0% or 36 individuals in the labor force. Within the labor force, the 16 to 19 years age range has the highest percentage of unemployed individuals, with 100.0% or 6 of them being unemployed.
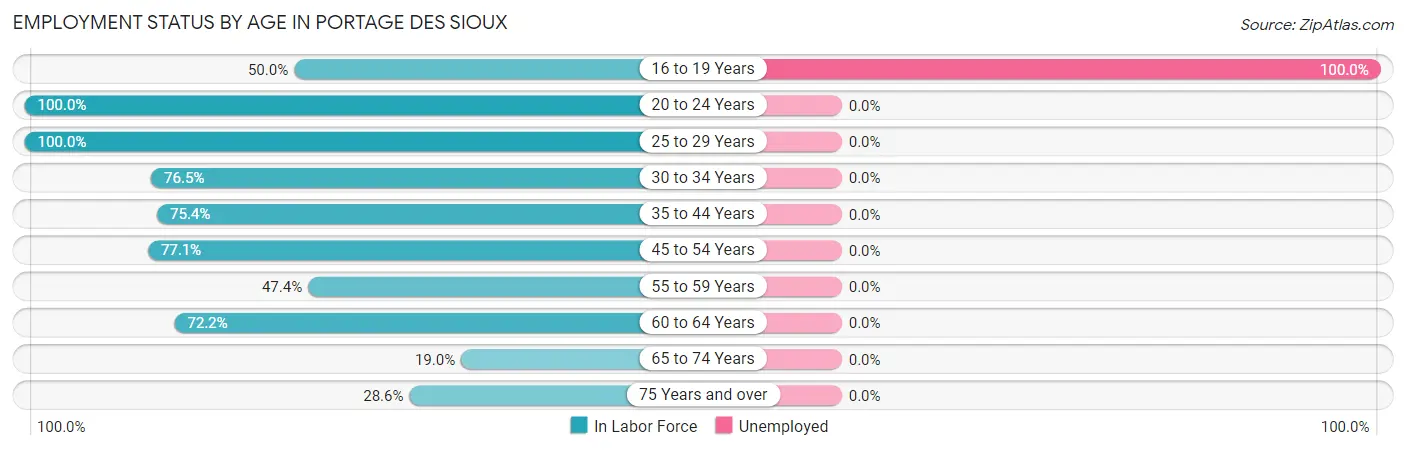
| Age Bracket | In Labor Force | Unemployed |
| 16 to 19 Years | 6 (50.0%) | 6 (100.0%) |
| 20 to 24 Years | 36 (100.0%) | 0 (0.0%) |
| 25 to 29 Years | 4 (100.0%) | 0 (0.0%) |
| 30 to 34 Years | 13 (76.5%) | 0 (0.0%) |
| 35 to 44 Years | 43 (75.4%) | 0 (0.0%) |
| 45 to 54 Years | 27 (77.1%) | 0 (0.0%) |
| 55 to 59 Years | 9 (47.4%) | 0 (0.0%) |
| 60 to 64 Years | 26 (72.2%) | 0 (0.0%) |
| 65 to 74 Years | 8 (19.0%) | 0 (0.0%) |
| 75 Years and over | 4 (28.6%) | 0 (0.0%) |
| Total | 176 (64.7%) | 6 (3.4%) |
Employment Status by Educational Attainment in Portage Des Sioux
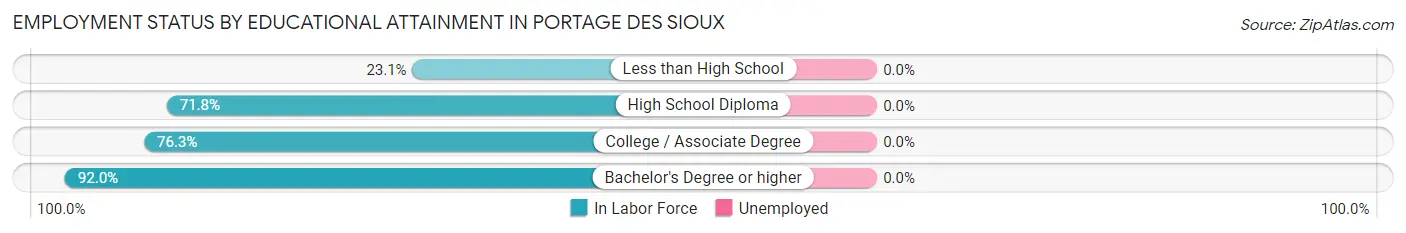
| Educational Attainment | In Labor Force | Unemployed |
| Less than High School | 3 (23.1%) | 0 (0.0%) |
| High School Diploma | 51 (71.8%) | 0 (0.0%) |
| College / Associate Degree | 45 (76.3%) | 0 (0.0%) |
| Bachelor's Degree or higher | 23 (92.0%) | 0 (0.0%) |
| Total | 122 (72.6%) | 0 (0.0%) |
Employment Occupations by Sex in Portage Des Sioux
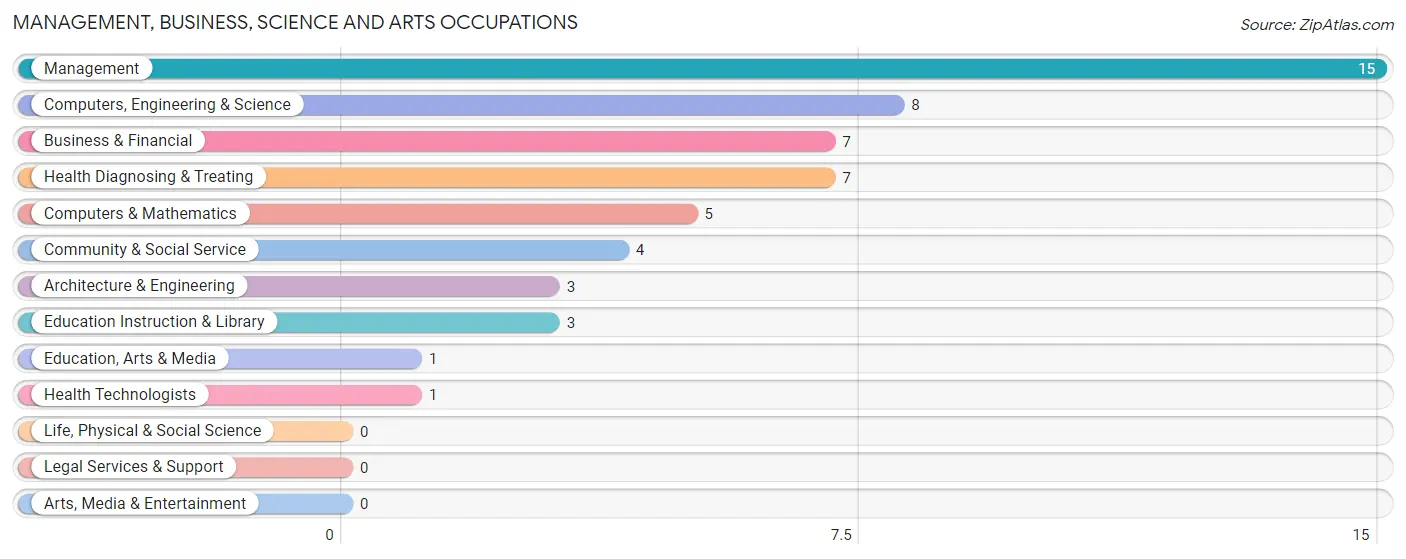
Management, Business, Science and Arts Occupations
The most common Management, Business, Science and Arts occupations in Portage Des Sioux are Management (15 | 8.8%), Computers, Engineering & Science (8 | 4.7%), Business & Financial (7 | 4.1%), Health Diagnosing & Treating (7 | 4.1%), and Computers & Mathematics (5 | 2.9%).
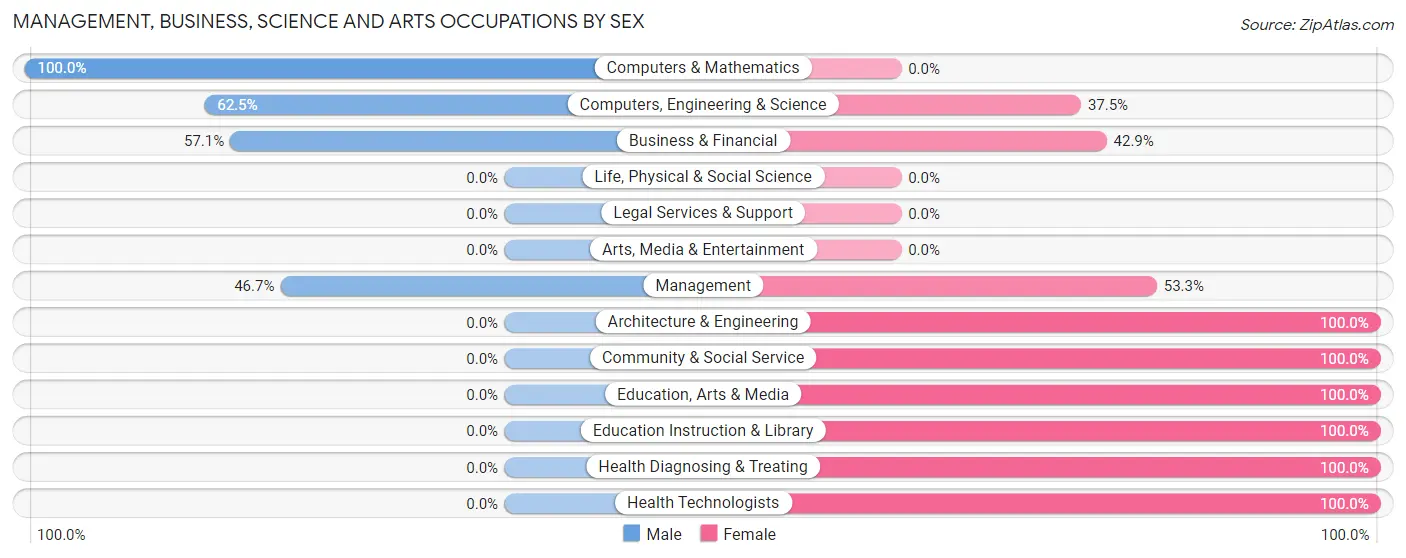
Management, Business, Science and Arts Occupations by Sex
Within the Management, Business, Science and Arts occupations in Portage Des Sioux, the most male-oriented occupations are Computers & Mathematics (100.0%), Computers, Engineering & Science (62.5%), and Business & Financial (57.1%), while the most female-oriented occupations are Architecture & Engineering (100.0%), Community & Social Service (100.0%), and Education, Arts & Media (100.0%).
| Occupation | Male | Female |
| Management | 7 (46.7%) | 8 (53.3%) |
| Business & Financial | 4 (57.1%) | 3 (42.9%) |
| Computers, Engineering & Science | 5 (62.5%) | 3 (37.5%) |
| Computers & Mathematics | 5 (100.0%) | 0 (0.0%) |
| Architecture & Engineering | 0 (0.0%) | 3 (100.0%) |
| Life, Physical & Social Science | 0 (0.0%) | 0 (0.0%) |
| Community & Social Service | 0 (0.0%) | 4 (100.0%) |
| Education, Arts & Media | 0 (0.0%) | 1 (100.0%) |
| Legal Services & Support | 0 (0.0%) | 0 (0.0%) |
| Education Instruction & Library | 0 (0.0%) | 3 (100.0%) |
| Arts, Media & Entertainment | 0 (0.0%) | 0 (0.0%) |
| Health Diagnosing & Treating | 0 (0.0%) | 7 (100.0%) |
| Health Technologists | 0 (0.0%) | 1 (100.0%) |
| Total (Category) | 16 (39.0%) | 25 (61.0%) |
| Total (Overall) | 94 (55.3%) | 76 (44.7%) |
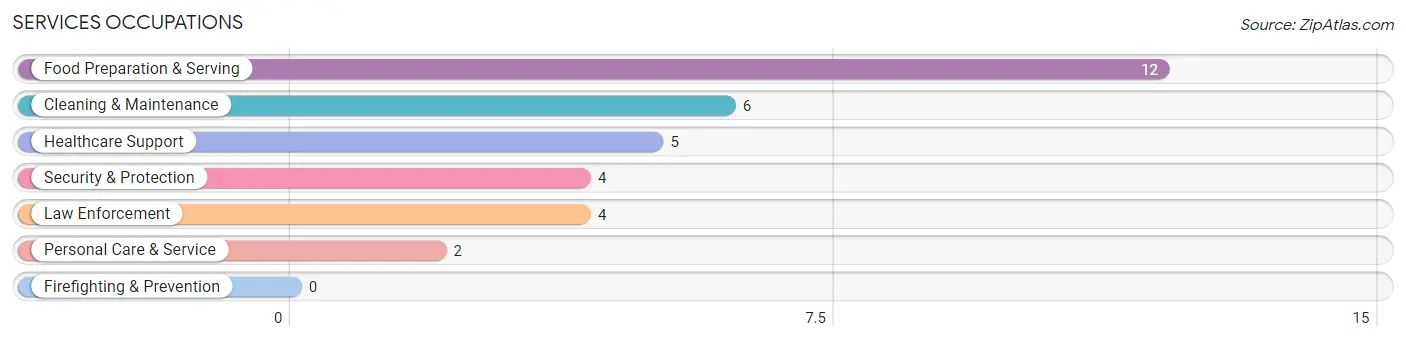
Services Occupations
The most common Services occupations in Portage Des Sioux are Food Preparation & Serving (12 | 7.1%), Cleaning & Maintenance (6 | 3.5%), Healthcare Support (5 | 2.9%), Security & Protection (4 | 2.4%), and Law Enforcement (4 | 2.4%).
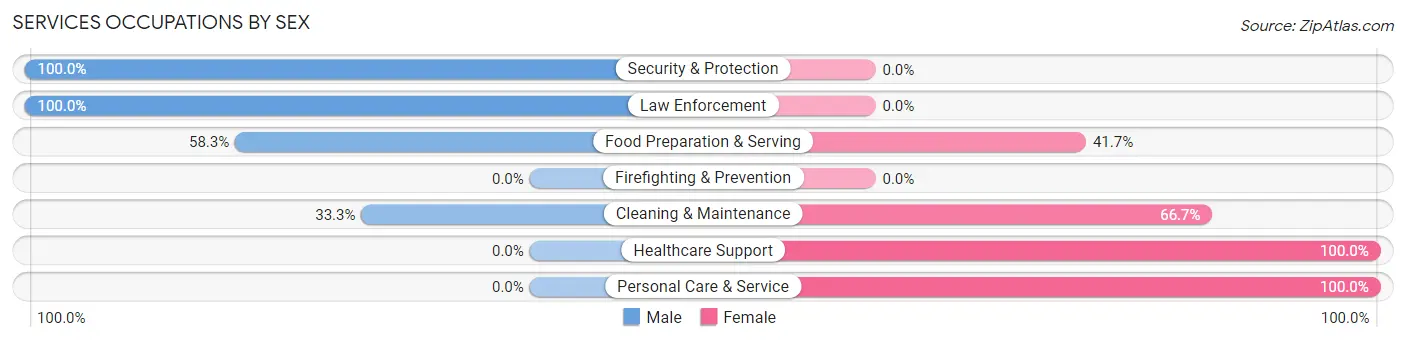
Services Occupations by Sex
Within the Services occupations in Portage Des Sioux, the most male-oriented occupations are Security & Protection (100.0%), Law Enforcement (100.0%), and Food Preparation & Serving (58.3%), while the most female-oriented occupations are Healthcare Support (100.0%), Personal Care & Service (100.0%), and Cleaning & Maintenance (66.7%).
| Occupation | Male | Female |
| Healthcare Support | 0 (0.0%) | 5 (100.0%) |
| Security & Protection | 4 (100.0%) | 0 (0.0%) |
| Firefighting & Prevention | 0 (0.0%) | 0 (0.0%) |
| Law Enforcement | 4 (100.0%) | 0 (0.0%) |
| Food Preparation & Serving | 7 (58.3%) | 5 (41.7%) |
| Cleaning & Maintenance | 2 (33.3%) | 4 (66.7%) |
| Personal Care & Service | 0 (0.0%) | 2 (100.0%) |
| Total (Category) | 13 (44.8%) | 16 (55.2%) |
| Total (Overall) | 94 (55.3%) | 76 (44.7%) |
Sales and Office Occupations
The most common Sales and Office occupations in Portage Des Sioux are Sales & Related (13 | 7.6%), and Office & Administration (10 | 5.9%).
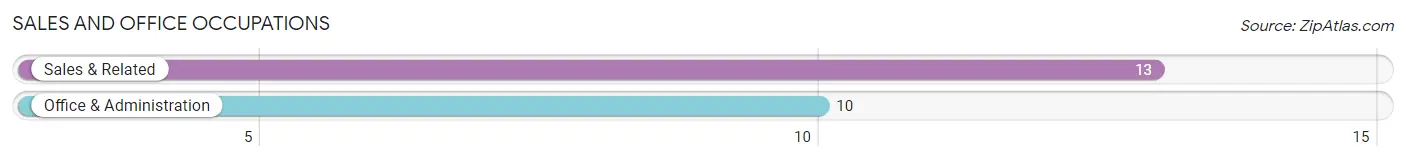
Sales and Office Occupations by Sex
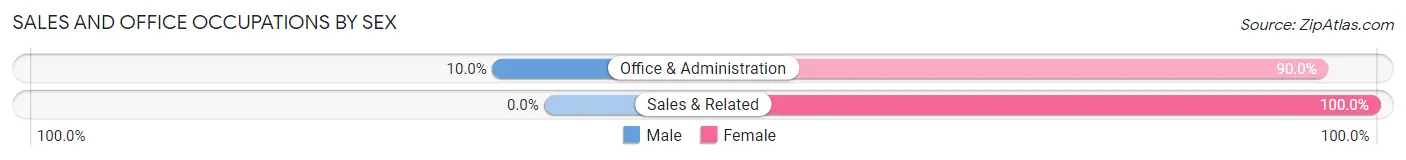
| Occupation | Male | Female |
| Sales & Related | 0 (0.0%) | 13 (100.0%) |
| Office & Administration | 1 (10.0%) | 9 (90.0%) |
| Total (Category) | 1 (4.3%) | 22 (95.7%) |
| Total (Overall) | 94 (55.3%) | 76 (44.7%) |
Natural Resources, Construction and Maintenance Occupations
The most common Natural Resources, Construction and Maintenance occupations in Portage Des Sioux are Construction & Extraction (19 | 11.2%), and Installation, Maintenance & Repair (17 | 10.0%).
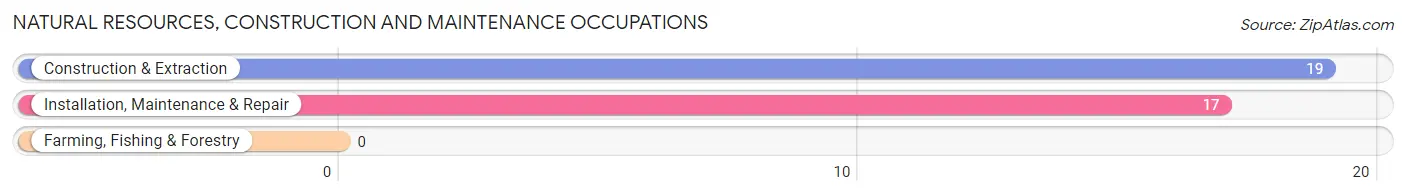
Natural Resources, Construction and Maintenance Occupations by Sex
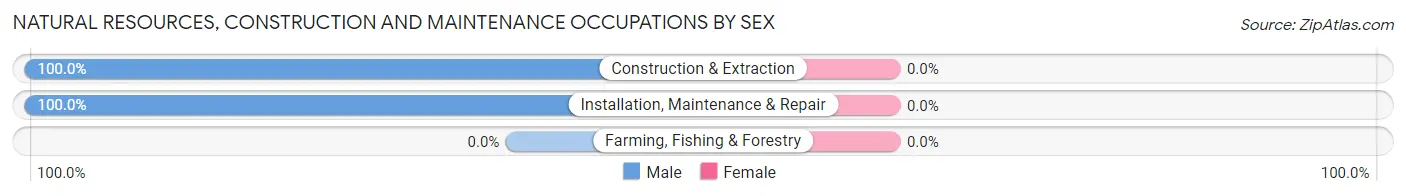
| Occupation | Male | Female |
| Farming, Fishing & Forestry | 0 (0.0%) | 0 (0.0%) |
| Construction & Extraction | 19 (100.0%) | 0 (0.0%) |
| Installation, Maintenance & Repair | 17 (100.0%) | 0 (0.0%) |
| Total (Category) | 36 (100.0%) | 0 (0.0%) |
| Total (Overall) | 94 (55.3%) | 76 (44.7%) |
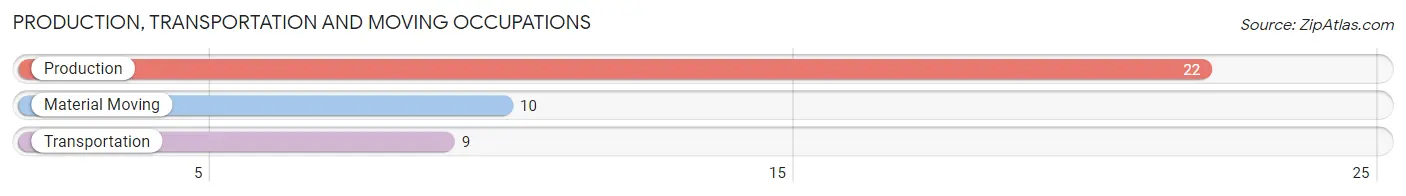
Production, Transportation and Moving Occupations
The most common Production, Transportation and Moving occupations in Portage Des Sioux are Production (22 | 12.9%), Material Moving (10 | 5.9%), and Transportation (9 | 5.3%).
Production, Transportation and Moving Occupations by Sex
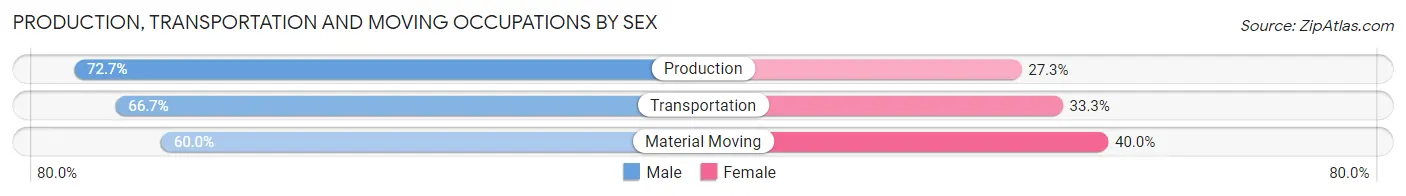
| Occupation | Male | Female |
| Production | 16 (72.7%) | 6 (27.3%) |
| Transportation | 6 (66.7%) | 3 (33.3%) |
| Material Moving | 6 (60.0%) | 4 (40.0%) |
| Total (Category) | 28 (68.3%) | 13 (31.7%) |
| Total (Overall) | 94 (55.3%) | 76 (44.7%) |
Employment Industries by Sex in Portage Des Sioux
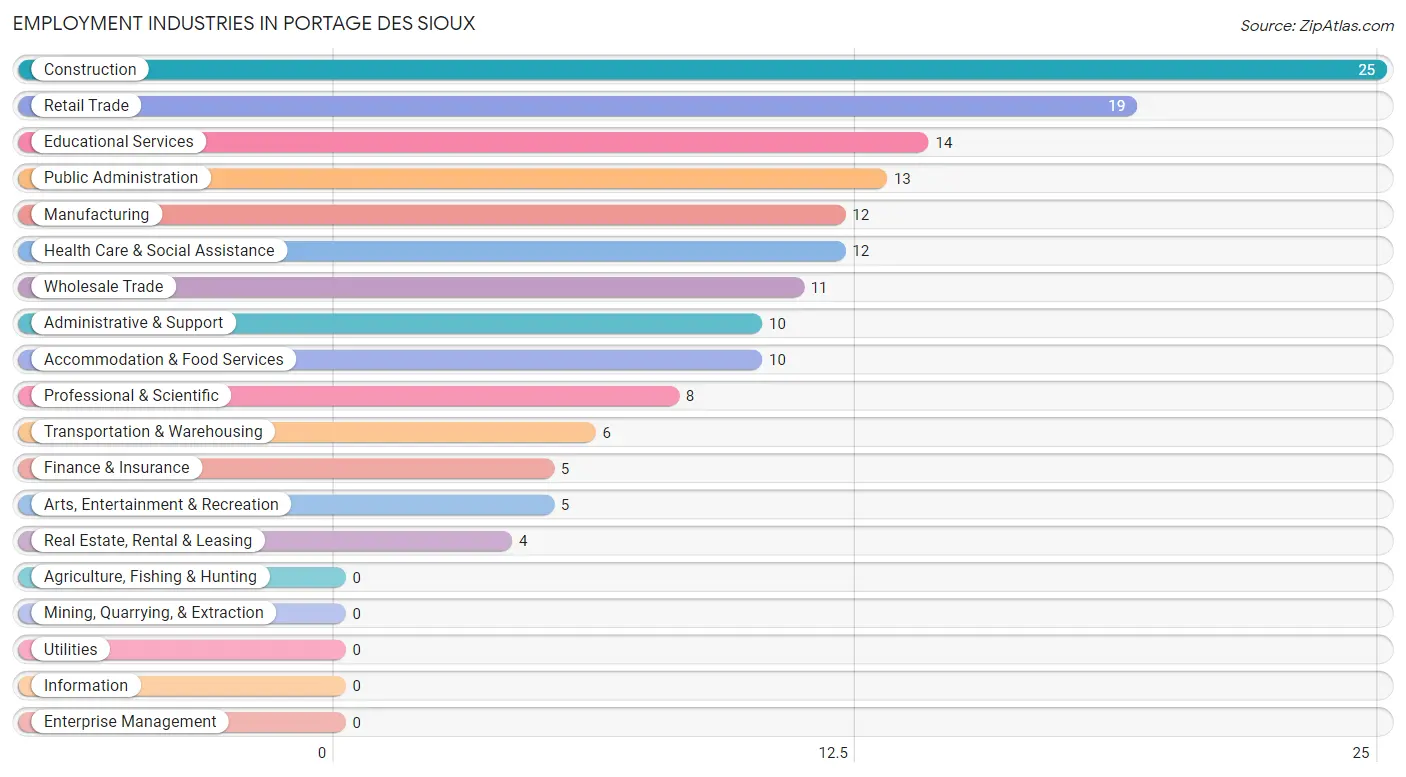
Employment Industries in Portage Des Sioux
The major employment industries in Portage Des Sioux include Construction (25 | 14.7%), Retail Trade (19 | 11.2%), Educational Services (14 | 8.2%), Public Administration (13 | 7.6%), and Manufacturing (12 | 7.1%).
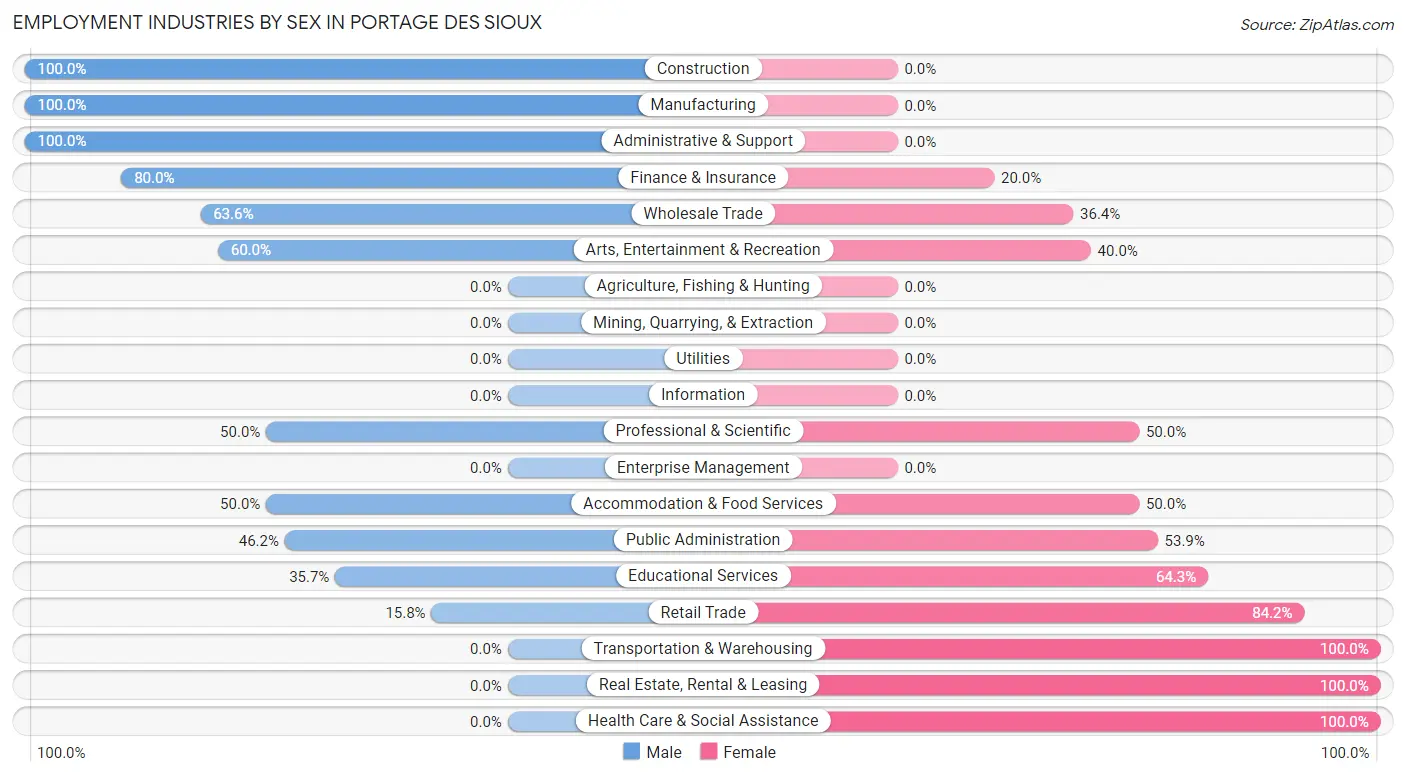
Employment Industries by Sex in Portage Des Sioux
The Portage Des Sioux industries that see more men than women are Construction (100.0%), Manufacturing (100.0%), and Administrative & Support (100.0%), whereas the industries that tend to have a higher number of women are Transportation & Warehousing (100.0%), Real Estate, Rental & Leasing (100.0%), and Health Care & Social Assistance (100.0%).
| Industry | Male | Female |
| Agriculture, Fishing & Hunting | 0 (0.0%) | 0 (0.0%) |
| Mining, Quarrying, & Extraction | 0 (0.0%) | 0 (0.0%) |
| Construction | 25 (100.0%) | 0 (0.0%) |
| Manufacturing | 12 (100.0%) | 0 (0.0%) |
| Wholesale Trade | 7 (63.6%) | 4 (36.4%) |
| Retail Trade | 3 (15.8%) | 16 (84.2%) |
| Transportation & Warehousing | 0 (0.0%) | 6 (100.0%) |
| Utilities | 0 (0.0%) | 0 (0.0%) |
| Information | 0 (0.0%) | 0 (0.0%) |
| Finance & Insurance | 4 (80.0%) | 1 (20.0%) |
| Real Estate, Rental & Leasing | 0 (0.0%) | 4 (100.0%) |
| Professional & Scientific | 4 (50.0%) | 4 (50.0%) |
| Enterprise Management | 0 (0.0%) | 0 (0.0%) |
| Administrative & Support | 10 (100.0%) | 0 (0.0%) |
| Educational Services | 5 (35.7%) | 9 (64.3%) |
| Health Care & Social Assistance | 0 (0.0%) | 12 (100.0%) |
| Arts, Entertainment & Recreation | 3 (60.0%) | 2 (40.0%) |
| Accommodation & Food Services | 5 (50.0%) | 5 (50.0%) |
| Public Administration | 6 (46.2%) | 7 (53.8%) |
| Total | 94 (55.3%) | 76 (44.7%) |
Education in Portage Des Sioux
School Enrollment in Portage Des Sioux
The most common levels of schooling among the 56 students in Portage Des Sioux are elementary school (19 | 33.9%), middle school (14 | 25.0%), and high school (12 | 21.4%).
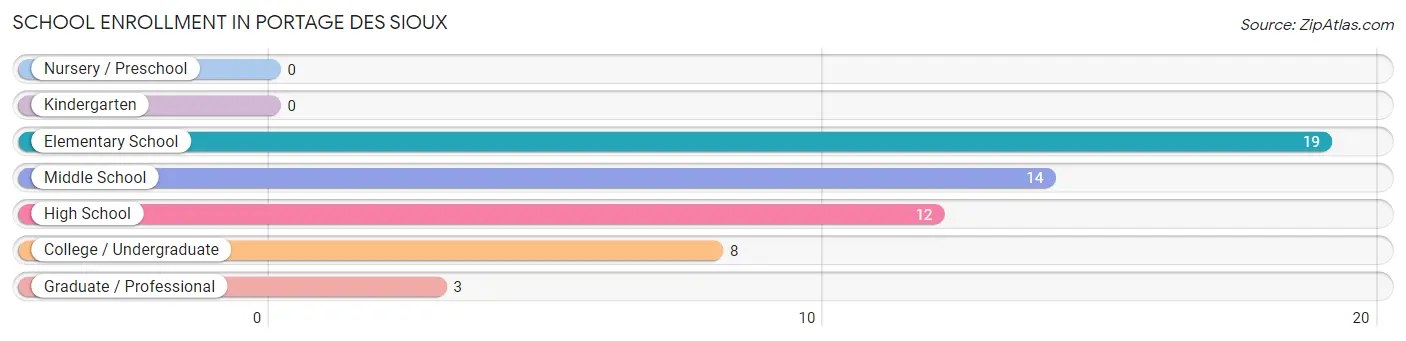
| School Level | # Students | % Students |
| Nursery / Preschool | 0 | 0.0% |
| Kindergarten | 0 | 0.0% |
| Elementary School | 19 | 33.9% |
| Middle School | 14 | 25.0% |
| High School | 12 | 21.4% |
| College / Undergraduate | 8 | 14.3% |
| Graduate / Professional | 3 | 5.4% |
| Total | 56 | 100.0% |
School Enrollment by Age by Funding Source in Portage Des Sioux
Out of a total of 56 students who are enrolled in schools in Portage Des Sioux, 2 (3.6%) attend a private institution, while the remaining 54 (96.4%) are enrolled in public schools. The age group of 20 to 24 year olds has the highest likelihood of being enrolled in private schools, with 2 (25.0% in the age bracket) enrolled. Conversely, the age group of 5 to 9 year old has the lowest likelihood of being enrolled in a private school, with 19 (100.0% in the age bracket) attending a public institution.
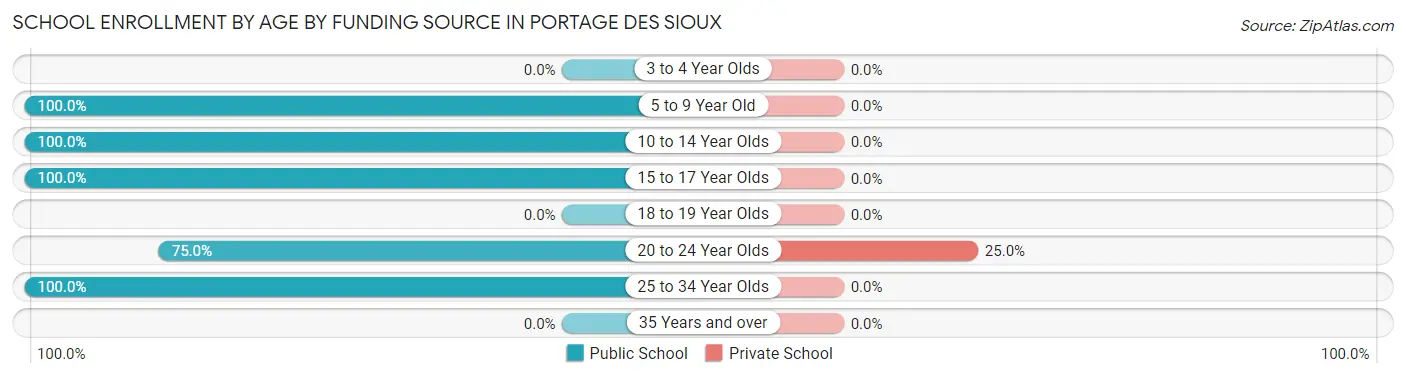
| Age Bracket | Public School | Private School |
| 3 to 4 Year Olds | 0 (0.0%) | 0 (0.0%) |
| 5 to 9 Year Old | 19 (100.0%) | 0 (0.0%) |
| 10 to 14 Year Olds | 18 (100.0%) | 0 (0.0%) |
| 15 to 17 Year Olds | 8 (100.0%) | 0 (0.0%) |
| 18 to 19 Year Olds | 0 (0.0%) | 0 (0.0%) |
| 20 to 24 Year Olds | 6 (75.0%) | 2 (25.0%) |
| 25 to 34 Year Olds | 3 (100.0%) | 0 (0.0%) |
| 35 Years and over | 0 (0.0%) | 0 (0.0%) |
| Total | 54 (96.4%) | 2 (3.6%) |
Educational Attainment by Field of Study in Portage Des Sioux
Business (7 | 28.0%), social sciences (4 | 16.0%), education (3 | 12.0%), visual & performing arts (3 | 12.0%), and computers & mathematics (2 | 8.0%) are the most common fields of study among 25 individuals in Portage Des Sioux who have obtained a bachelor's degree or higher.
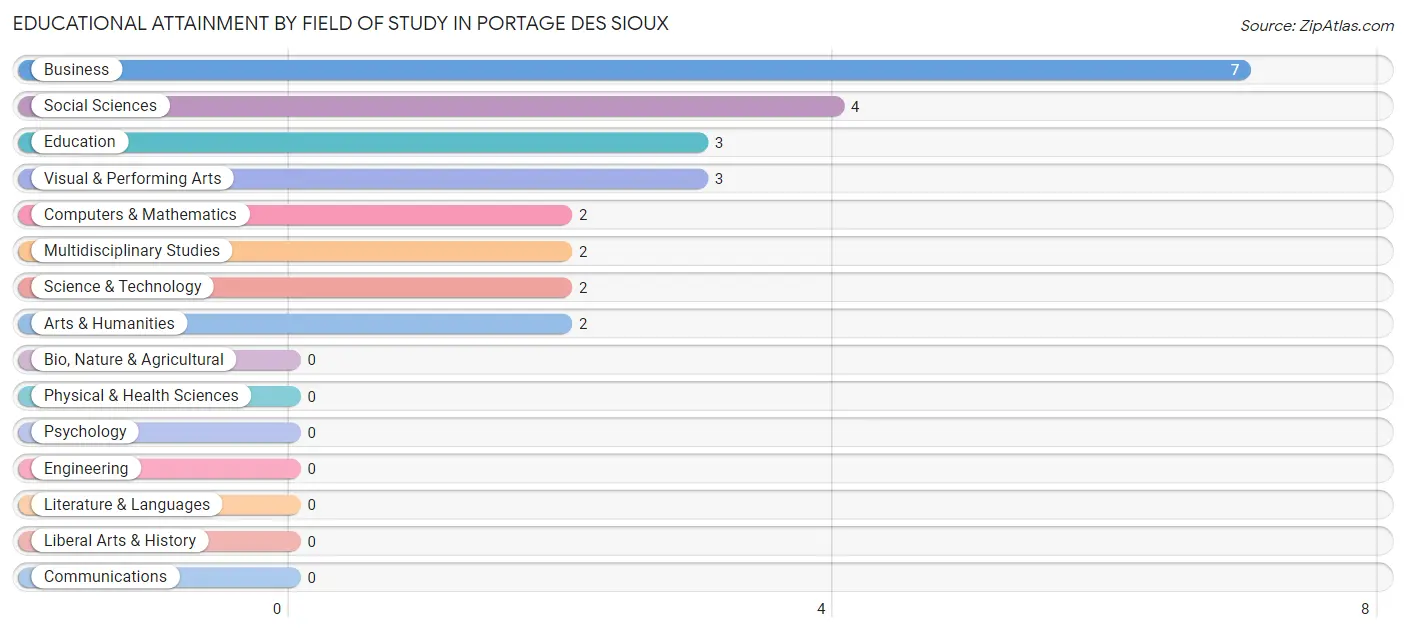
| Field of Study | # Graduates | % Graduates |
| Computers & Mathematics | 2 | 8.0% |
| Bio, Nature & Agricultural | 0 | 0.0% |
| Physical & Health Sciences | 0 | 0.0% |
| Psychology | 0 | 0.0% |
| Social Sciences | 4 | 16.0% |
| Engineering | 0 | 0.0% |
| Multidisciplinary Studies | 2 | 8.0% |
| Science & Technology | 2 | 8.0% |
| Business | 7 | 28.0% |
| Education | 3 | 12.0% |
| Literature & Languages | 0 | 0.0% |
| Liberal Arts & History | 0 | 0.0% |
| Visual & Performing Arts | 3 | 12.0% |
| Communications | 0 | 0.0% |
| Arts & Humanities | 2 | 8.0% |
| Total | 25 | 100.0% |
Transportation & Commute in Portage Des Sioux
Vehicle Availability by Sex in Portage Des Sioux
The most prevalent vehicle ownership categories in Portage Des Sioux are males with 2 vehicles (36, accounting for 38.3%) and females with 2 vehicles (28, making up 48.0%).
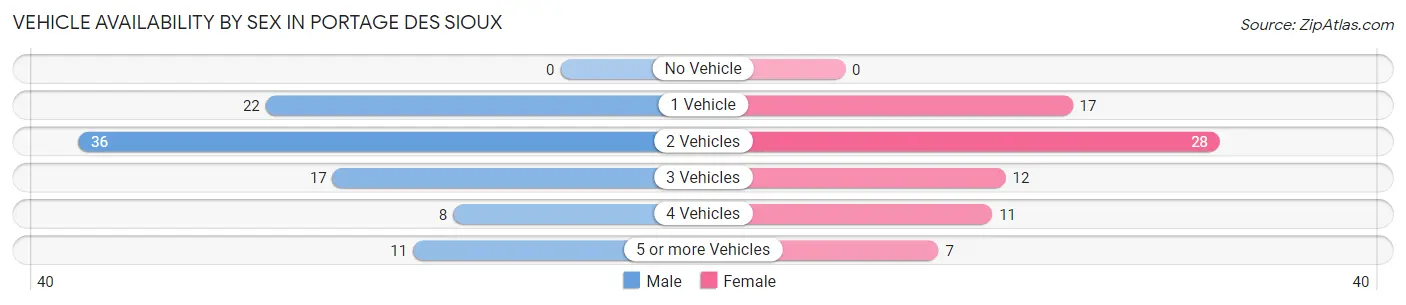
| Vehicles Available | Male | Female |
| No Vehicle | 0 (0.0%) | 0 (0.0%) |
| 1 Vehicle | 22 (23.4%) | 17 (22.7%) |
| 2 Vehicles | 36 (38.3%) | 28 (37.3%) |
| 3 Vehicles | 17 (18.1%) | 12 (16.0%) |
| 4 Vehicles | 8 (8.5%) | 11 (14.7%) |
| 5 or more Vehicles | 11 (11.7%) | 7 (9.3%) |
| Total | 94 (100.0%) | 75 (100.0%) |
Commute Time in Portage Des Sioux
The most frequently occuring commute durations in Portage Des Sioux are 30 to 34 minutes (33 commuters, 21.1%), 35 to 39 minutes (24 commuters, 15.4%), and 45 to 59 minutes (24 commuters, 15.4%).
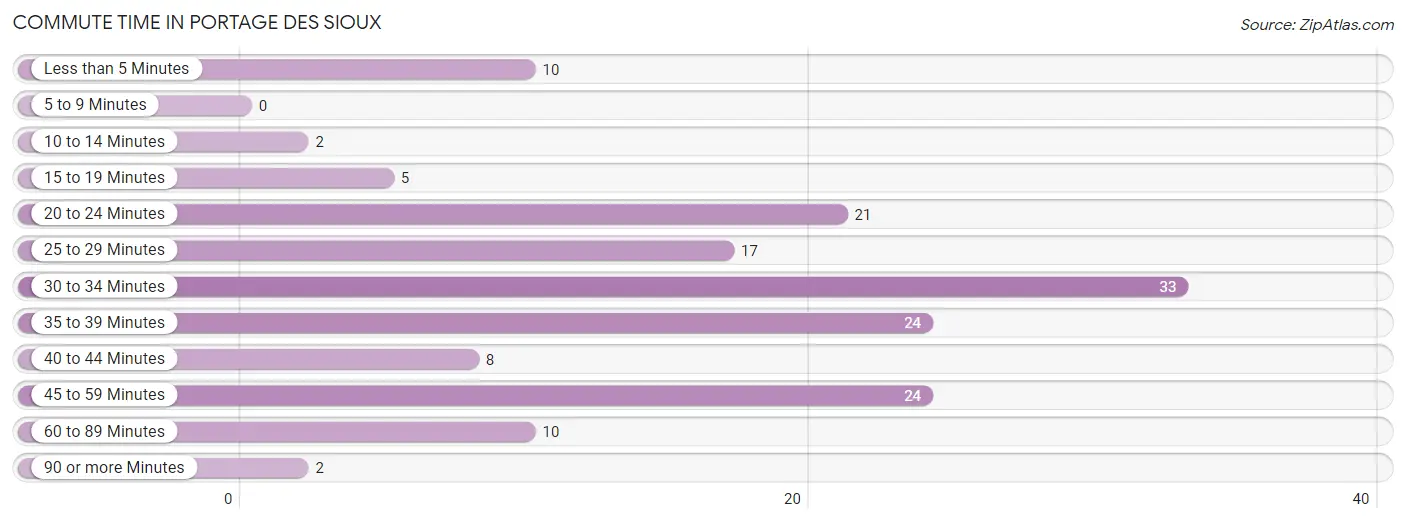
| Commute Time | # Commuters | % Commuters |
| Less than 5 Minutes | 10 | 6.4% |
| 5 to 9 Minutes | 0 | 0.0% |
| 10 to 14 Minutes | 2 | 1.3% |
| 15 to 19 Minutes | 5 | 3.2% |
| 20 to 24 Minutes | 21 | 13.5% |
| 25 to 29 Minutes | 17 | 10.9% |
| 30 to 34 Minutes | 33 | 21.1% |
| 35 to 39 Minutes | 24 | 15.4% |
| 40 to 44 Minutes | 8 | 5.1% |
| 45 to 59 Minutes | 24 | 15.4% |
| 60 to 89 Minutes | 10 | 6.4% |
| 90 or more Minutes | 2 | 1.3% |
Commute Time by Sex in Portage Des Sioux
The most common commute times in Portage Des Sioux are 30 to 34 minutes (21 commuters, 22.8%) for males and 25 to 29 minutes (17 commuters, 26.6%) for females.
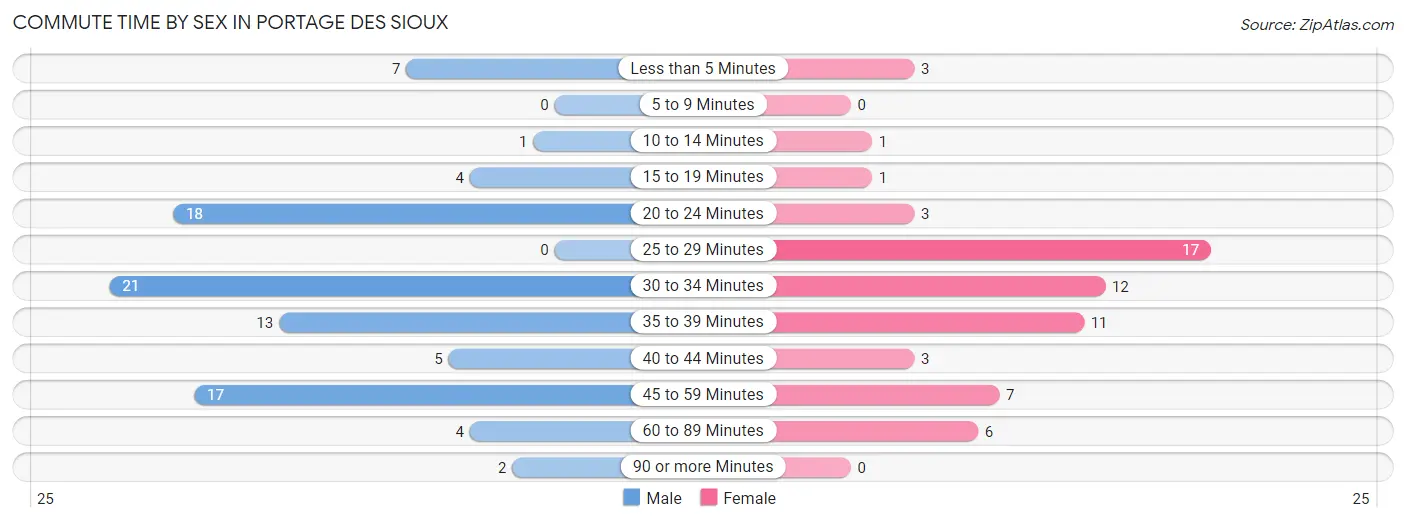
| Commute Time | Male | Female |
| Less than 5 Minutes | 7 (7.6%) | 3 (4.7%) |
| 5 to 9 Minutes | 0 (0.0%) | 0 (0.0%) |
| 10 to 14 Minutes | 1 (1.1%) | 1 (1.6%) |
| 15 to 19 Minutes | 4 (4.3%) | 1 (1.6%) |
| 20 to 24 Minutes | 18 (19.6%) | 3 (4.7%) |
| 25 to 29 Minutes | 0 (0.0%) | 17 (26.6%) |
| 30 to 34 Minutes | 21 (22.8%) | 12 (18.8%) |
| 35 to 39 Minutes | 13 (14.1%) | 11 (17.2%) |
| 40 to 44 Minutes | 5 (5.4%) | 3 (4.7%) |
| 45 to 59 Minutes | 17 (18.5%) | 7 (10.9%) |
| 60 to 89 Minutes | 4 (4.3%) | 6 (9.4%) |
| 90 or more Minutes | 2 (2.2%) | 0 (0.0%) |
Time of Departure to Work by Sex in Portage Des Sioux
The most frequent times of departure to work in Portage Des Sioux are 6:00 AM to 6:29 AM (31, 33.7%) for males and 6:00 AM to 6:29 AM (18, 28.1%) for females.
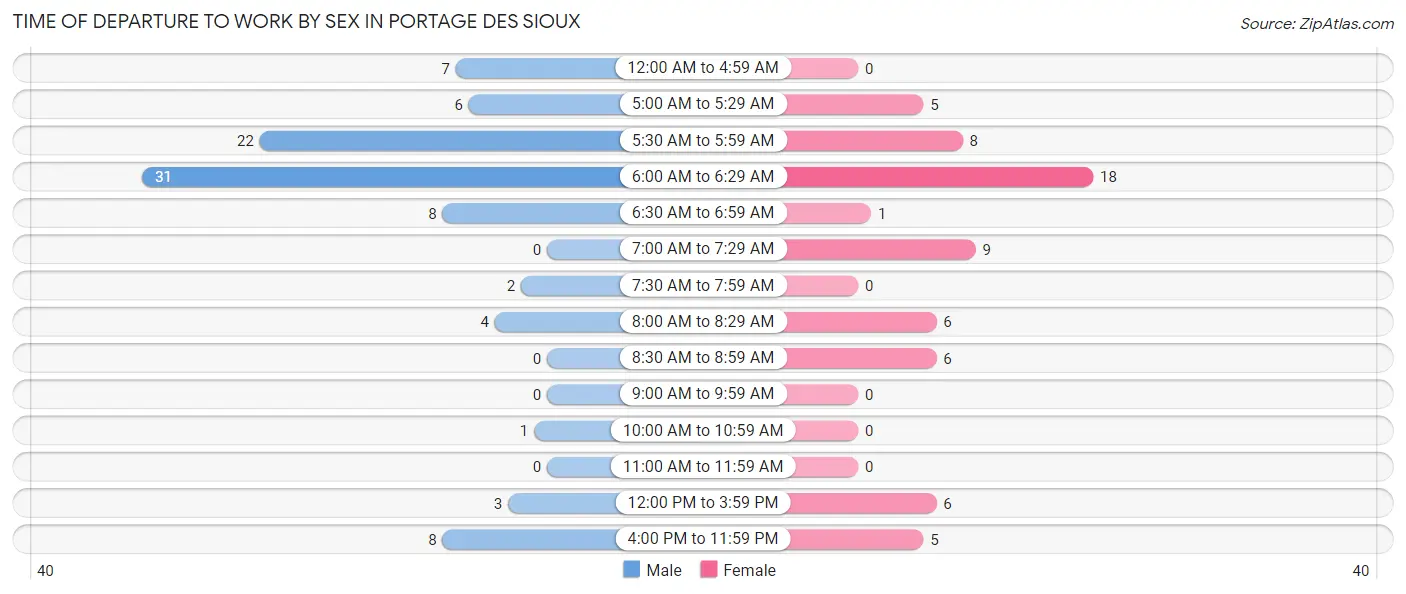
| Time of Departure | Male | Female |
| 12:00 AM to 4:59 AM | 7 (7.6%) | 0 (0.0%) |
| 5:00 AM to 5:29 AM | 6 (6.5%) | 5 (7.8%) |
| 5:30 AM to 5:59 AM | 22 (23.9%) | 8 (12.5%) |
| 6:00 AM to 6:29 AM | 31 (33.7%) | 18 (28.1%) |
| 6:30 AM to 6:59 AM | 8 (8.7%) | 1 (1.6%) |
| 7:00 AM to 7:29 AM | 0 (0.0%) | 9 (14.1%) |
| 7:30 AM to 7:59 AM | 2 (2.2%) | 0 (0.0%) |
| 8:00 AM to 8:29 AM | 4 (4.3%) | 6 (9.4%) |
| 8:30 AM to 8:59 AM | 0 (0.0%) | 6 (9.4%) |
| 9:00 AM to 9:59 AM | 0 (0.0%) | 0 (0.0%) |
| 10:00 AM to 10:59 AM | 1 (1.1%) | 0 (0.0%) |
| 11:00 AM to 11:59 AM | 0 (0.0%) | 0 (0.0%) |
| 12:00 PM to 3:59 PM | 3 (3.3%) | 6 (9.4%) |
| 4:00 PM to 11:59 PM | 8 (8.7%) | 5 (7.8%) |
| Total | 92 (100.0%) | 64 (100.0%) |
Housing Occupancy in Portage Des Sioux
Occupancy by Ownership in Portage Des Sioux
Of the total 130 dwellings in Portage Des Sioux, owner-occupied units account for 104 (80.0%), while renter-occupied units make up 26 (20.0%).
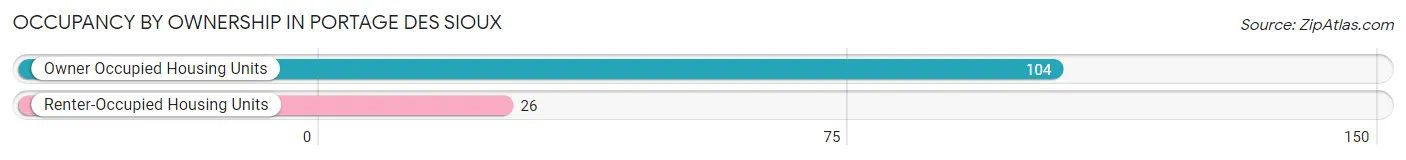
| Occupancy | # Housing Units | % Housing Units |
| Owner Occupied Housing Units | 104 | 80.0% |
| Renter-Occupied Housing Units | 26 | 20.0% |
| Total Occupied Housing Units | 130 | 100.0% |
Occupancy by Household Size in Portage Des Sioux
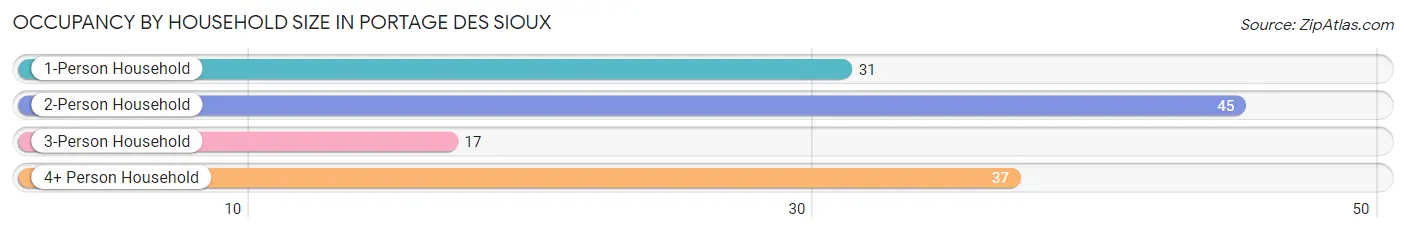
| Household Size | # Housing Units | % Housing Units |
| 1-Person Household | 31 | 23.8% |
| 2-Person Household | 45 | 34.6% |
| 3-Person Household | 17 | 13.1% |
| 4+ Person Household | 37 | 28.5% |
| Total Housing Units | 130 | 100.0% |
Occupancy by Ownership by Household Size in Portage Des Sioux
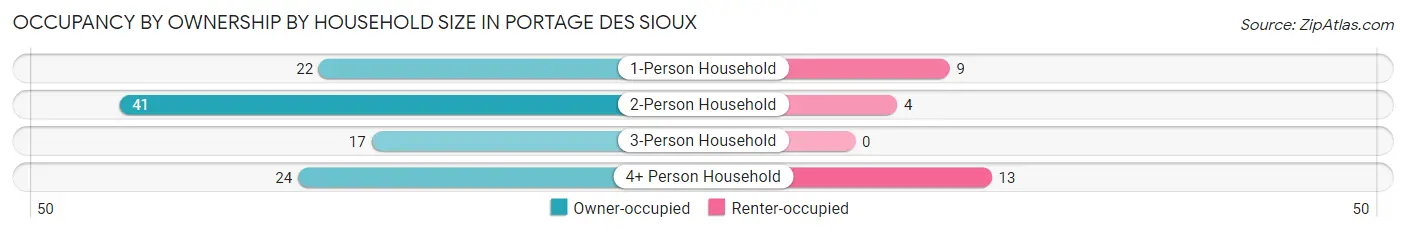
| Household Size | Owner-occupied | Renter-occupied |
| 1-Person Household | 22 (71.0%) | 9 (29.0%) |
| 2-Person Household | 41 (91.1%) | 4 (8.9%) |
| 3-Person Household | 17 (100.0%) | 0 (0.0%) |
| 4+ Person Household | 24 (64.9%) | 13 (35.1%) |
| Total Housing Units | 104 (80.0%) | 26 (20.0%) |
Occupancy by Educational Attainment in Portage Des Sioux
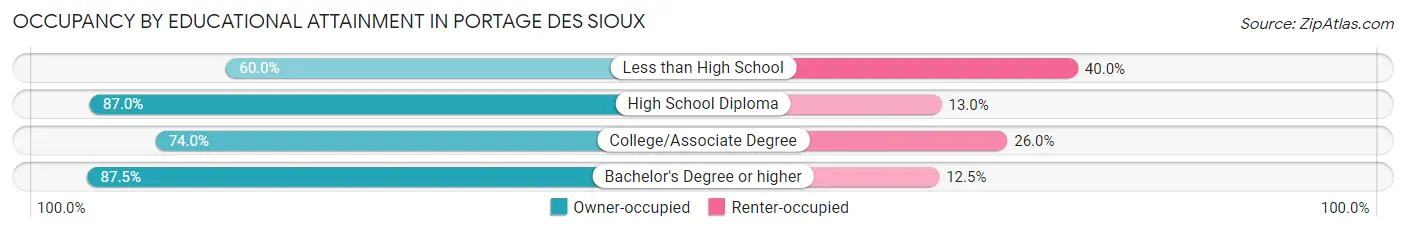
| Household Size | Owner-occupied | Renter-occupied |
| Less than High School | 6 (60.0%) | 4 (40.0%) |
| High School Diploma | 47 (87.0%) | 7 (13.0%) |
| College/Associate Degree | 37 (74.0%) | 13 (26.0%) |
| Bachelor's Degree or higher | 14 (87.5%) | 2 (12.5%) |
Occupancy by Age of Householder in Portage Des Sioux
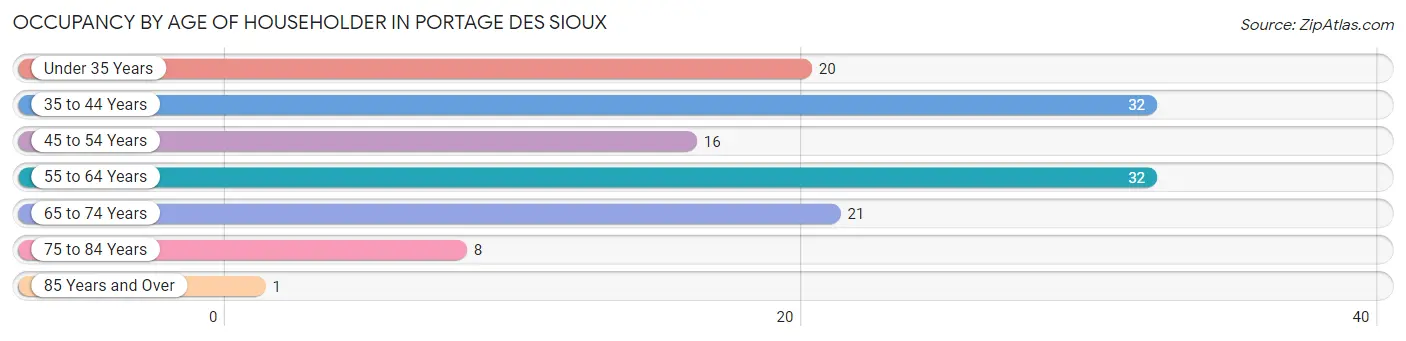
| Age Bracket | # Households | % Households |
| Under 35 Years | 20 | 15.4% |
| 35 to 44 Years | 32 | 24.6% |
| 45 to 54 Years | 16 | 12.3% |
| 55 to 64 Years | 32 | 24.6% |
| 65 to 74 Years | 21 | 16.2% |
| 75 to 84 Years | 8 | 6.1% |
| 85 Years and Over | 1 | 0.8% |
| Total | 130 | 100.0% |
Housing Finances in Portage Des Sioux
Median Income by Occupancy in Portage Des Sioux
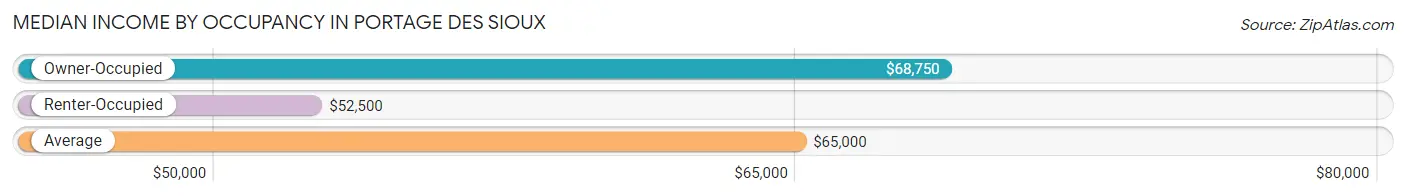
| Occupancy Type | # Households | Median Income |
| Owner-Occupied | 104 (80.0%) | $68,750 |
| Renter-Occupied | 26 (20.0%) | $52,500 |
| Average | 130 (100.0%) | $65,000 |
Occupancy by Householder Income Bracket in Portage Des Sioux
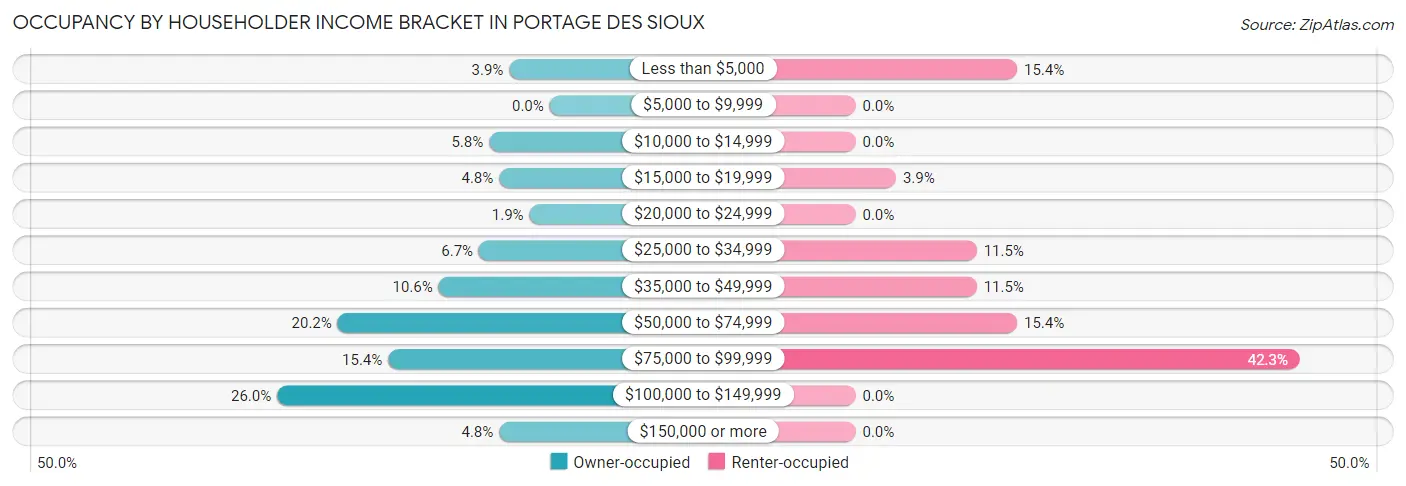
| Income Bracket | Owner-occupied | Renter-occupied |
| Less than $5,000 | 4 (3.8%) | 4 (15.4%) |
| $5,000 to $9,999 | 0 (0.0%) | 0 (0.0%) |
| $10,000 to $14,999 | 6 (5.8%) | 0 (0.0%) |
| $15,000 to $19,999 | 5 (4.8%) | 1 (3.8%) |
| $20,000 to $24,999 | 2 (1.9%) | 0 (0.0%) |
| $25,000 to $34,999 | 7 (6.7%) | 3 (11.5%) |
| $35,000 to $49,999 | 11 (10.6%) | 3 (11.5%) |
| $50,000 to $74,999 | 21 (20.2%) | 4 (15.4%) |
| $75,000 to $99,999 | 16 (15.4%) | 11 (42.3%) |
| $100,000 to $149,999 | 27 (26.0%) | 0 (0.0%) |
| $150,000 or more | 5 (4.8%) | 0 (0.0%) |
| Total | 104 (100.0%) | 26 (100.0%) |
Monthly Housing Cost Tiers in Portage Des Sioux
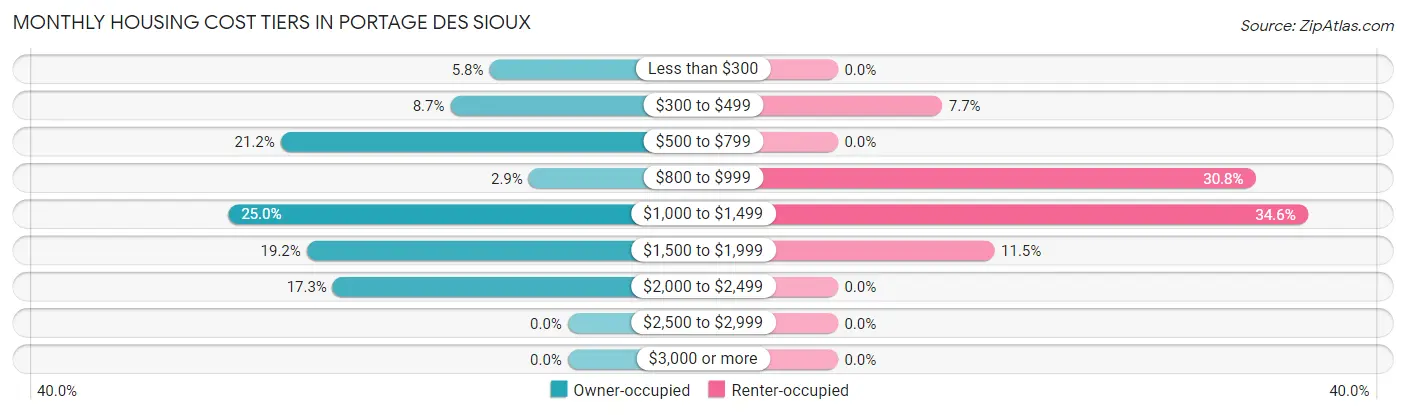
| Monthly Cost | Owner-occupied | Renter-occupied |
| Less than $300 | 6 (5.8%) | 0 (0.0%) |
| $300 to $499 | 9 (8.6%) | 2 (7.7%) |
| $500 to $799 | 22 (21.1%) | 0 (0.0%) |
| $800 to $999 | 3 (2.9%) | 8 (30.8%) |
| $1,000 to $1,499 | 26 (25.0%) | 9 (34.6%) |
| $1,500 to $1,999 | 20 (19.2%) | 3 (11.5%) |
| $2,000 to $2,499 | 18 (17.3%) | 0 (0.0%) |
| $2,500 to $2,999 | 0 (0.0%) | 0 (0.0%) |
| $3,000 or more | 0 (0.0%) | 0 (0.0%) |
| Total | 104 (100.0%) | 26 (100.0%) |
Physical Housing Characteristics in Portage Des Sioux
Housing Structures in Portage Des Sioux
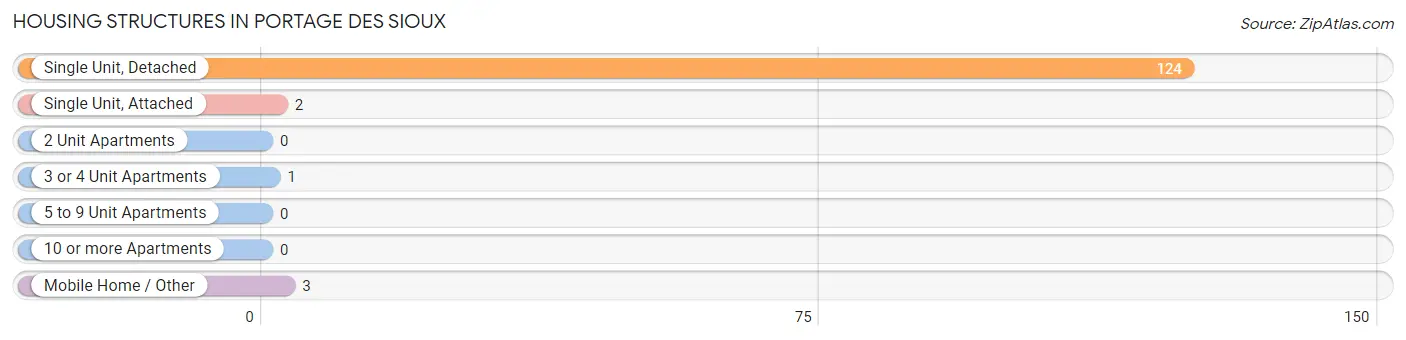
| Structure Type | # Housing Units | % Housing Units |
| Single Unit, Detached | 124 | 95.4% |
| Single Unit, Attached | 2 | 1.5% |
| 2 Unit Apartments | 0 | 0.0% |
| 3 or 4 Unit Apartments | 1 | 0.8% |
| 5 to 9 Unit Apartments | 0 | 0.0% |
| 10 or more Apartments | 0 | 0.0% |
| Mobile Home / Other | 3 | 2.3% |
| Total | 130 | 100.0% |
Housing Structures by Occupancy in Portage Des Sioux
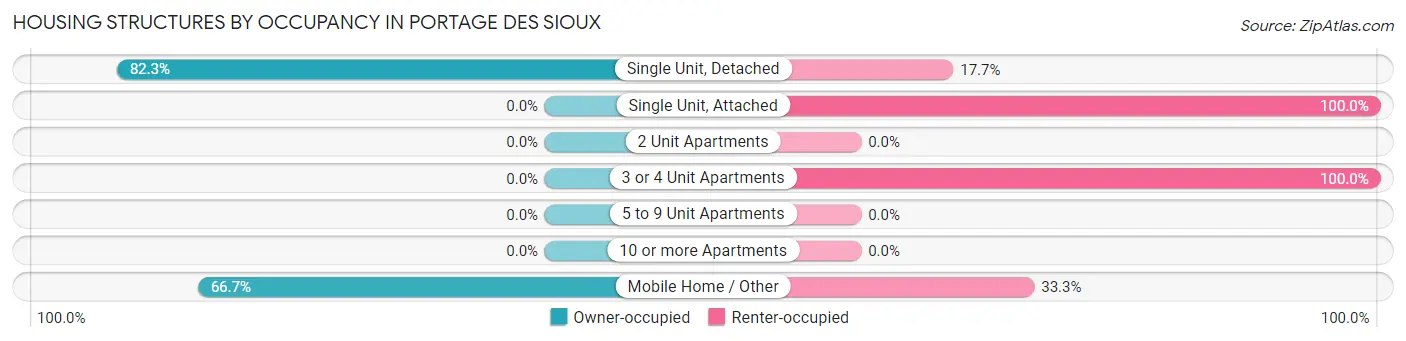
| Structure Type | Owner-occupied | Renter-occupied |
| Single Unit, Detached | 102 (82.3%) | 22 (17.7%) |
| Single Unit, Attached | 0 (0.0%) | 2 (100.0%) |
| 2 Unit Apartments | 0 (0.0%) | 0 (0.0%) |
| 3 or 4 Unit Apartments | 0 (0.0%) | 1 (100.0%) |
| 5 to 9 Unit Apartments | 0 (0.0%) | 0 (0.0%) |
| 10 or more Apartments | 0 (0.0%) | 0 (0.0%) |
| Mobile Home / Other | 2 (66.7%) | 1 (33.3%) |
| Total | 104 (80.0%) | 26 (20.0%) |
Housing Structures by Number of Rooms in Portage Des Sioux
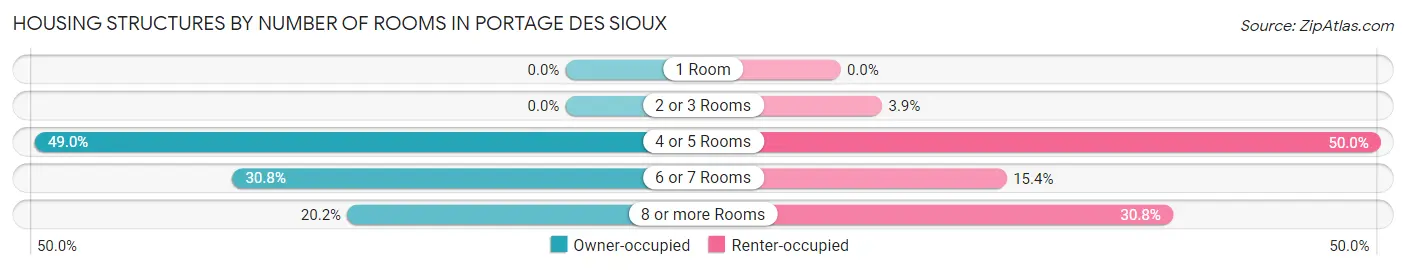
| Number of Rooms | Owner-occupied | Renter-occupied |
| 1 Room | 0 (0.0%) | 0 (0.0%) |
| 2 or 3 Rooms | 0 (0.0%) | 1 (3.8%) |
| 4 or 5 Rooms | 51 (49.0%) | 13 (50.0%) |
| 6 or 7 Rooms | 32 (30.8%) | 4 (15.4%) |
| 8 or more Rooms | 21 (20.2%) | 8 (30.8%) |
| Total | 104 (100.0%) | 26 (100.0%) |
Housing Structure by Heating Type in Portage Des Sioux
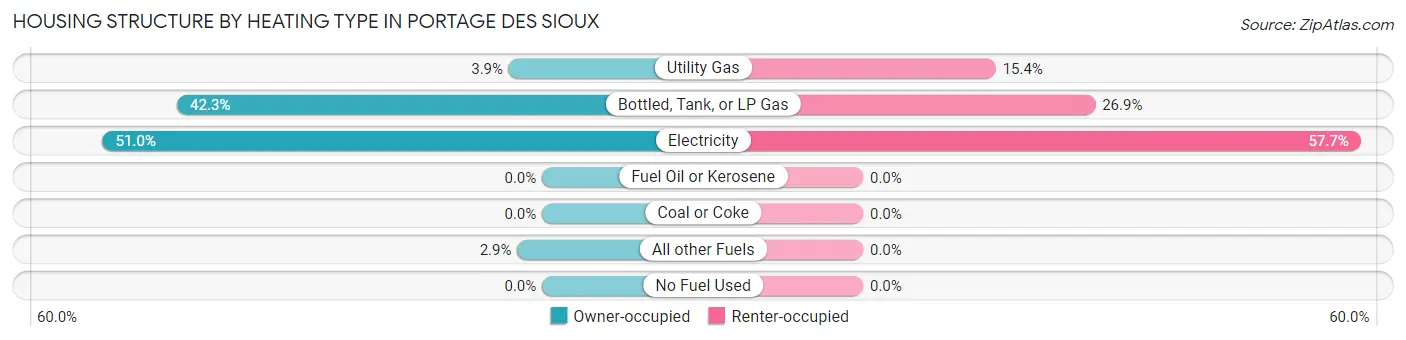
| Heating Type | Owner-occupied | Renter-occupied |
| Utility Gas | 4 (3.8%) | 4 (15.4%) |
| Bottled, Tank, or LP Gas | 44 (42.3%) | 7 (26.9%) |
| Electricity | 53 (51.0%) | 15 (57.7%) |
| Fuel Oil or Kerosene | 0 (0.0%) | 0 (0.0%) |
| Coal or Coke | 0 (0.0%) | 0 (0.0%) |
| All other Fuels | 3 (2.9%) | 0 (0.0%) |
| No Fuel Used | 0 (0.0%) | 0 (0.0%) |
| Total | 104 (100.0%) | 26 (100.0%) |
Household Vehicle Usage in Portage Des Sioux
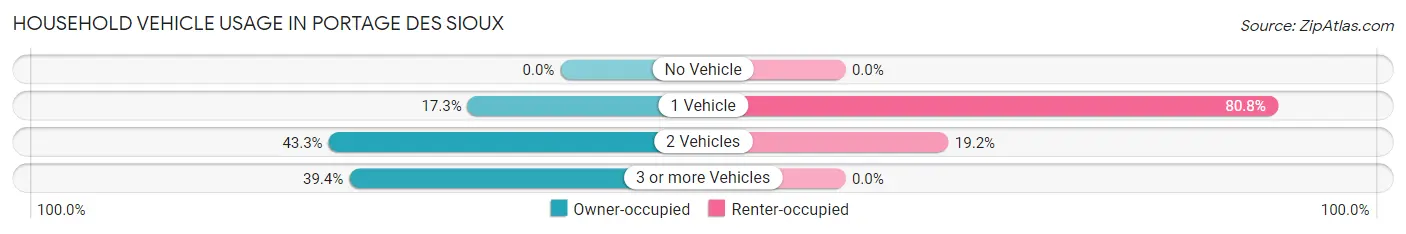
| Vehicles per Household | Owner-occupied | Renter-occupied |
| No Vehicle | 0 (0.0%) | 0 (0.0%) |
| 1 Vehicle | 18 (17.3%) | 21 (80.8%) |
| 2 Vehicles | 45 (43.3%) | 5 (19.2%) |
| 3 or more Vehicles | 41 (39.4%) | 0 (0.0%) |
| Total | 104 (100.0%) | 26 (100.0%) |
Real Estate & Mortgages in Portage Des Sioux
Real Estate and Mortgage Overview in Portage Des Sioux
| Characteristic | Without Mortgage | With Mortgage |
| Housing Units | 38 | 66 |
| Median Property Value | $140,000 | $170,000 |
| Median Household Income | $65,000 | $5 |
| Monthly Housing Costs | $557 | $0 |
| Real Estate Taxes | $1,438 | $3 |
Property Value by Mortgage Status in Portage Des Sioux
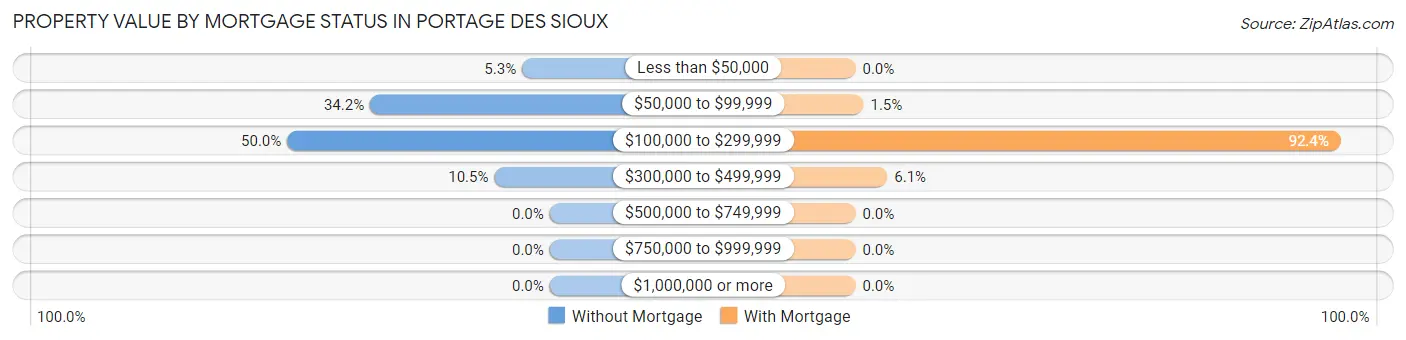
| Property Value | Without Mortgage | With Mortgage |
| Less than $50,000 | 2 (5.3%) | 0 (0.0%) |
| $50,000 to $99,999 | 13 (34.2%) | 1 (1.5%) |
| $100,000 to $299,999 | 19 (50.0%) | 61 (92.4%) |
| $300,000 to $499,999 | 4 (10.5%) | 4 (6.1%) |
| $500,000 to $749,999 | 0 (0.0%) | 0 (0.0%) |
| $750,000 to $999,999 | 0 (0.0%) | 0 (0.0%) |
| $1,000,000 or more | 0 (0.0%) | 0 (0.0%) |
| Total | 38 (100.0%) | 66 (100.0%) |
Household Income by Mortgage Status in Portage Des Sioux
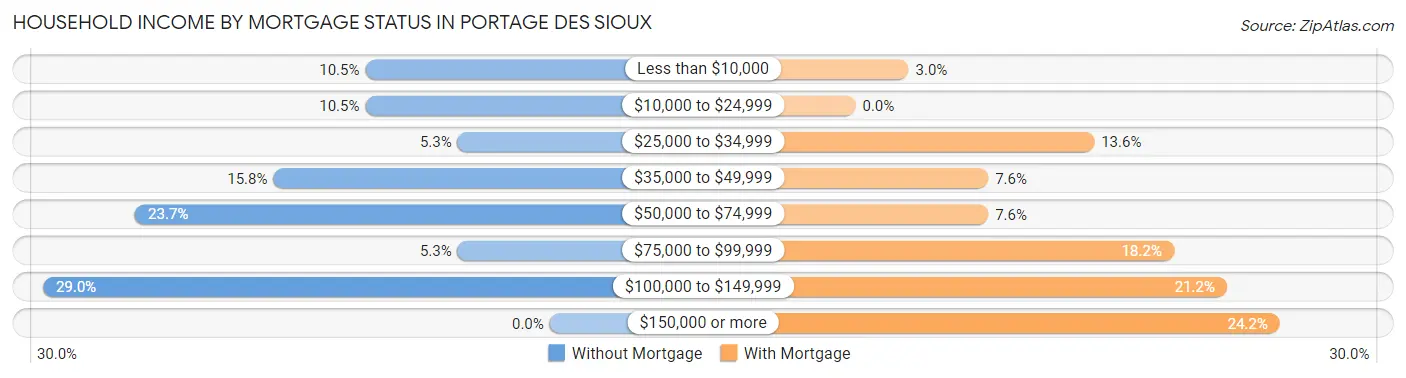
| Household Income | Without Mortgage | With Mortgage |
| Less than $10,000 | 4 (10.5%) | 2 (3.0%) |
| $10,000 to $24,999 | 4 (10.5%) | 0 (0.0%) |
| $25,000 to $34,999 | 2 (5.3%) | 9 (13.6%) |
| $35,000 to $49,999 | 6 (15.8%) | 5 (7.6%) |
| $50,000 to $74,999 | 9 (23.7%) | 5 (7.6%) |
| $75,000 to $99,999 | 2 (5.3%) | 12 (18.2%) |
| $100,000 to $149,999 | 11 (28.9%) | 14 (21.2%) |
| $150,000 or more | 0 (0.0%) | 16 (24.2%) |
| Total | 38 (100.0%) | 66 (100.0%) |
Property Value to Household Income Ratio in Portage Des Sioux
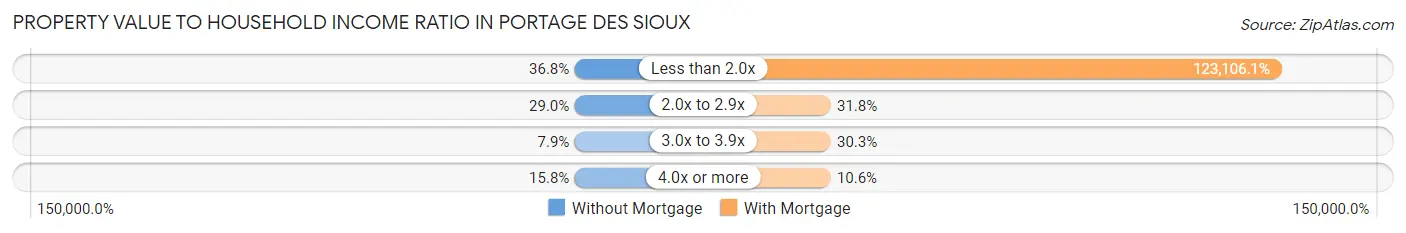
| Value-to-Income Ratio | Without Mortgage | With Mortgage |
| Less than 2.0x | 14 (36.8%) | 81,250 (123,106.1%) |
| 2.0x to 2.9x | 11 (28.9%) | 21 (31.8%) |
| 3.0x to 3.9x | 3 (7.9%) | 20 (30.3%) |
| 4.0x or more | 6 (15.8%) | 7 (10.6%) |
| Total | 38 (100.0%) | 66 (100.0%) |
Real Estate Taxes by Mortgage Status in Portage Des Sioux
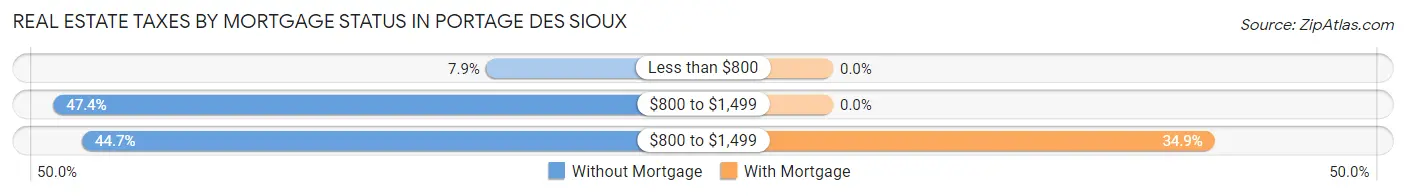
| Property Taxes | Without Mortgage | With Mortgage |
| Less than $800 | 3 (7.9%) | 0 (0.0%) |
| $800 to $1,499 | 18 (47.4%) | 0 (0.0%) |
| $800 to $1,499 | 17 (44.7%) | 23 (34.8%) |
| Total | 38 (100.0%) | 66 (100.0%) |
Health & Disability in Portage Des Sioux
Health Insurance Coverage by Age in Portage Des Sioux
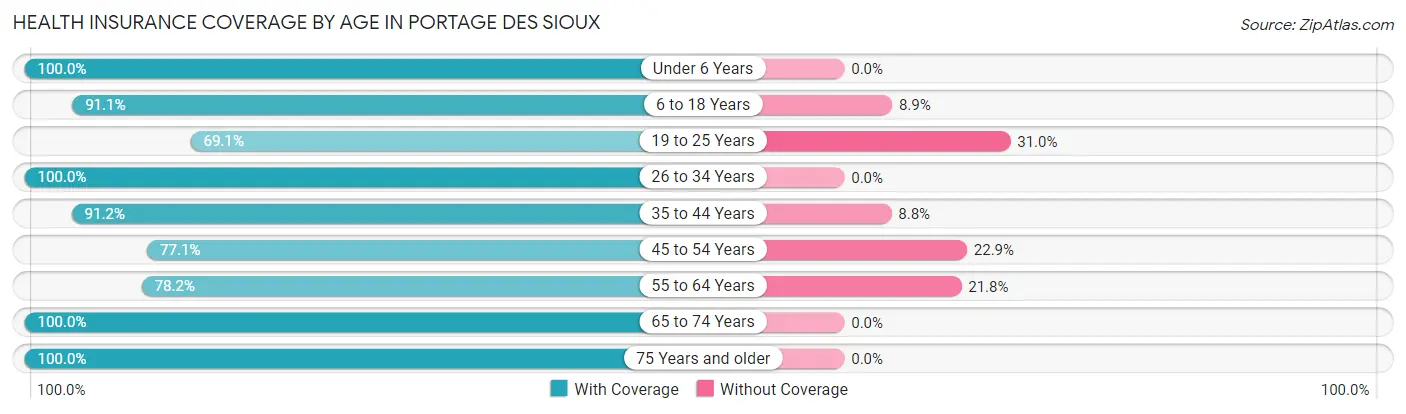
| Age Bracket | With Coverage | Without Coverage |
| Under 6 Years | 19 (100.0%) | 0 (0.0%) |
| 6 to 18 Years | 41 (91.1%) | 4 (8.9%) |
| 19 to 25 Years | 29 (69.1%) | 13 (30.9%) |
| 26 to 34 Years | 21 (100.0%) | 0 (0.0%) |
| 35 to 44 Years | 52 (91.2%) | 5 (8.8%) |
| 45 to 54 Years | 27 (77.1%) | 8 (22.9%) |
| 55 to 64 Years | 43 (78.2%) | 12 (21.8%) |
| 65 to 74 Years | 42 (100.0%) | 0 (0.0%) |
| 75 Years and older | 14 (100.0%) | 0 (0.0%) |
| Total | 288 (87.3%) | 42 (12.7%) |
Health Insurance Coverage by Citizenship Status in Portage Des Sioux
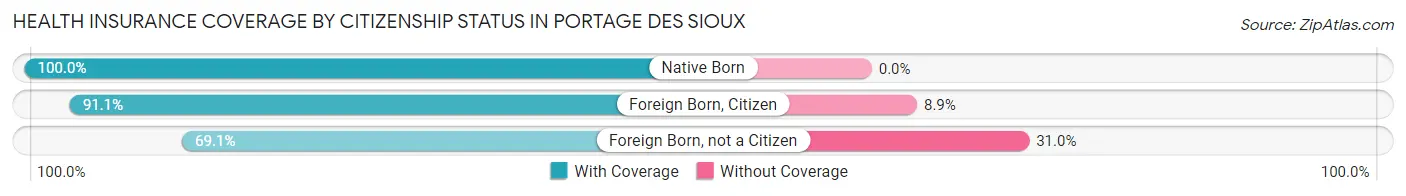
| Citizenship Status | With Coverage | Without Coverage |
| Native Born | 19 (100.0%) | 0 (0.0%) |
| Foreign Born, Citizen | 41 (91.1%) | 4 (8.9%) |
| Foreign Born, not a Citizen | 29 (69.1%) | 13 (30.9%) |
Health Insurance Coverage by Household Income in Portage Des Sioux
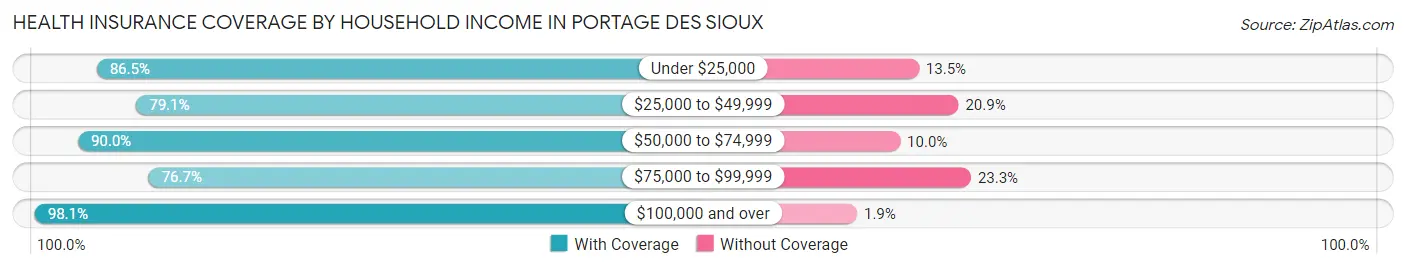
| Household Income | With Coverage | Without Coverage |
| Under $25,000 | 32 (86.5%) | 5 (13.5%) |
| $25,000 to $49,999 | 34 (79.1%) | 9 (20.9%) |
| $50,000 to $74,999 | 54 (90.0%) | 6 (10.0%) |
| $75,000 to $99,999 | 66 (76.7%) | 20 (23.3%) |
| $100,000 and over | 102 (98.1%) | 2 (1.9%) |
Public vs Private Health Insurance Coverage by Age in Portage Des Sioux
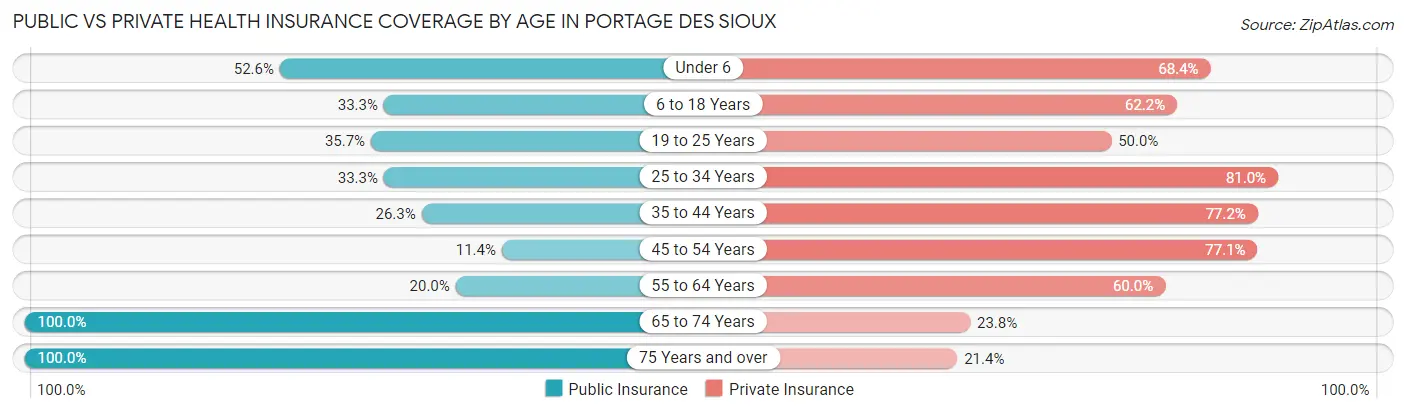
| Age Bracket | Public Insurance | Private Insurance |
| Under 6 | 10 (52.6%) | 13 (68.4%) |
| 6 to 18 Years | 15 (33.3%) | 28 (62.2%) |
| 19 to 25 Years | 15 (35.7%) | 21 (50.0%) |
| 25 to 34 Years | 7 (33.3%) | 17 (80.9%) |
| 35 to 44 Years | 15 (26.3%) | 44 (77.2%) |
| 45 to 54 Years | 4 (11.4%) | 27 (77.1%) |
| 55 to 64 Years | 11 (20.0%) | 33 (60.0%) |
| 65 to 74 Years | 42 (100.0%) | 10 (23.8%) |
| 75 Years and over | 14 (100.0%) | 3 (21.4%) |
| Total | 133 (40.3%) | 196 (59.4%) |
Disability Status by Sex by Age in Portage Des Sioux
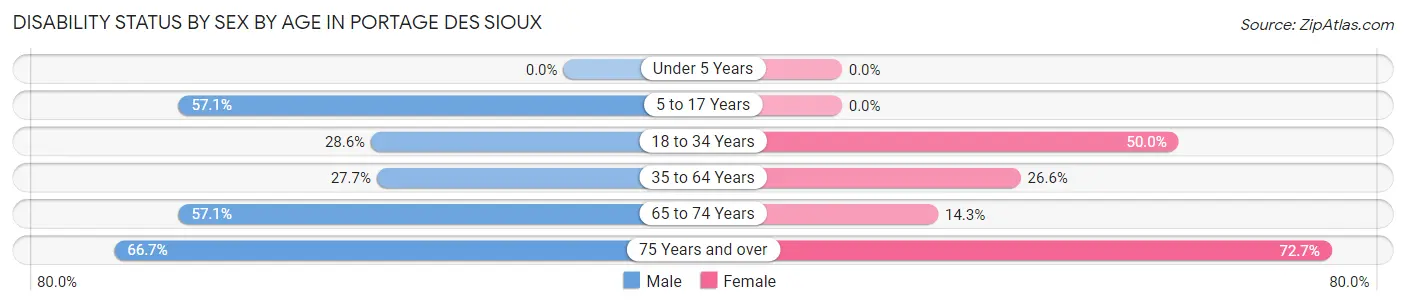
| Age Bracket | Male | Female |
| Under 5 Years | 0 (0.0%) | 0 (0.0%) |
| 5 to 17 Years | 12 (57.1%) | 0 (0.0%) |
| 18 to 34 Years | 10 (28.6%) | 14 (50.0%) |
| 35 to 64 Years | 23 (27.7%) | 17 (26.6%) |
| 65 to 74 Years | 12 (57.1%) | 3 (14.3%) |
| 75 Years and over | 2 (66.7%) | 8 (72.7%) |
Disability Class by Sex by Age in Portage Des Sioux
Disability Class: Hearing Difficulty
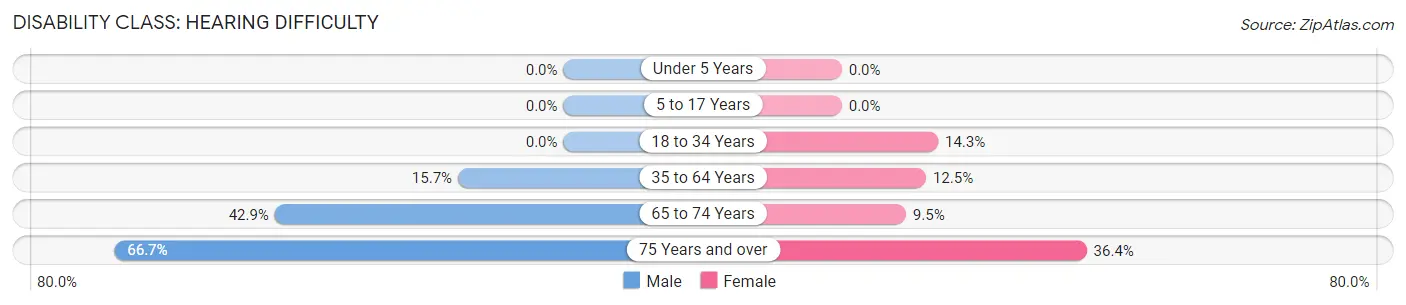
| Age Bracket | Male | Female |
| Under 5 Years | 0 (0.0%) | 0 (0.0%) |
| 5 to 17 Years | 0 (0.0%) | 0 (0.0%) |
| 18 to 34 Years | 0 (0.0%) | 4 (14.3%) |
| 35 to 64 Years | 13 (15.7%) | 8 (12.5%) |
| 65 to 74 Years | 9 (42.9%) | 2 (9.5%) |
| 75 Years and over | 2 (66.7%) | 4 (36.4%) |
Disability Class: Vision Difficulty
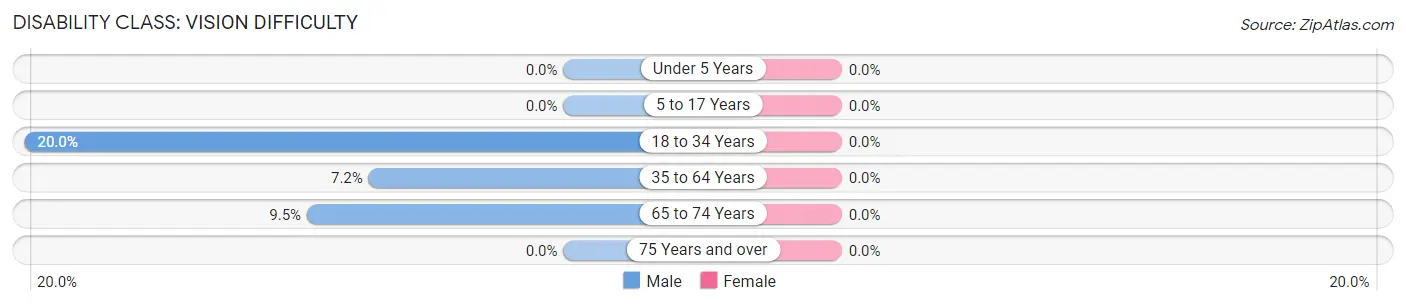
| Age Bracket | Male | Female |
| Under 5 Years | 0 (0.0%) | 0 (0.0%) |
| 5 to 17 Years | 0 (0.0%) | 0 (0.0%) |
| 18 to 34 Years | 7 (20.0%) | 0 (0.0%) |
| 35 to 64 Years | 6 (7.2%) | 0 (0.0%) |
| 65 to 74 Years | 2 (9.5%) | 0 (0.0%) |
| 75 Years and over | 0 (0.0%) | 0 (0.0%) |
Disability Class: Cognitive Difficulty
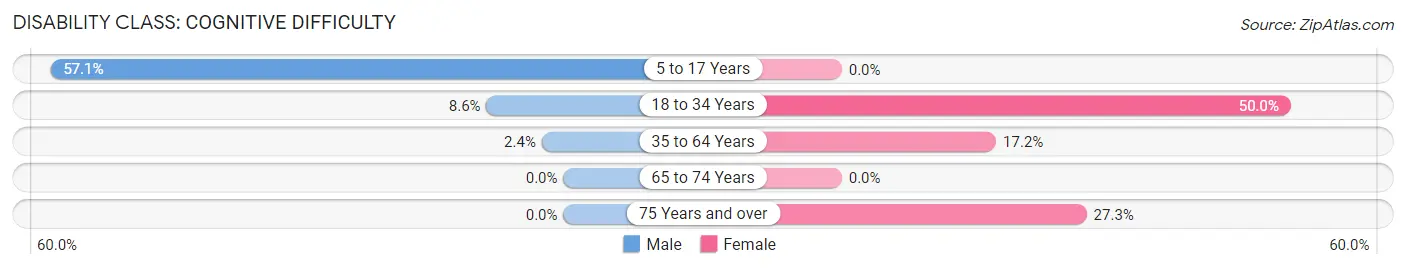
| Age Bracket | Male | Female |
| 5 to 17 Years | 12 (57.1%) | 0 (0.0%) |
| 18 to 34 Years | 3 (8.6%) | 14 (50.0%) |
| 35 to 64 Years | 2 (2.4%) | 11 (17.2%) |
| 65 to 74 Years | 0 (0.0%) | 0 (0.0%) |
| 75 Years and over | 0 (0.0%) | 3 (27.3%) |
Disability Class: Ambulatory Difficulty
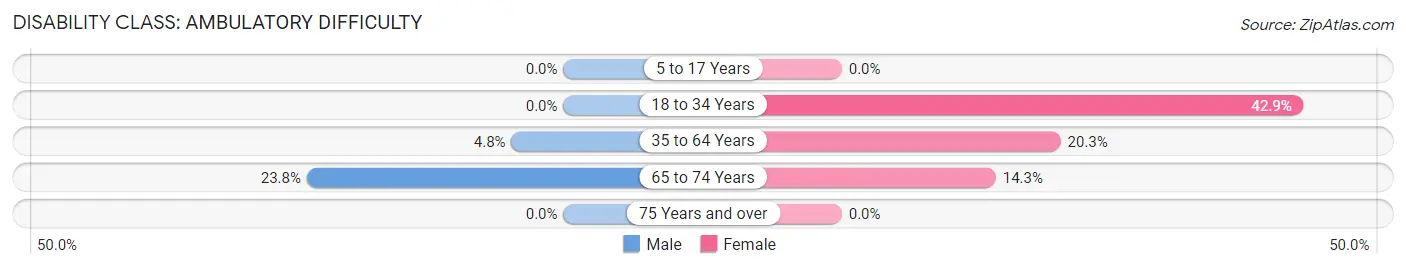
| Age Bracket | Male | Female |
| 5 to 17 Years | 0 (0.0%) | 0 (0.0%) |
| 18 to 34 Years | 0 (0.0%) | 12 (42.9%) |
| 35 to 64 Years | 4 (4.8%) | 13 (20.3%) |
| 65 to 74 Years | 5 (23.8%) | 3 (14.3%) |
| 75 Years and over | 0 (0.0%) | 0 (0.0%) |
Disability Class: Self-Care Difficulty
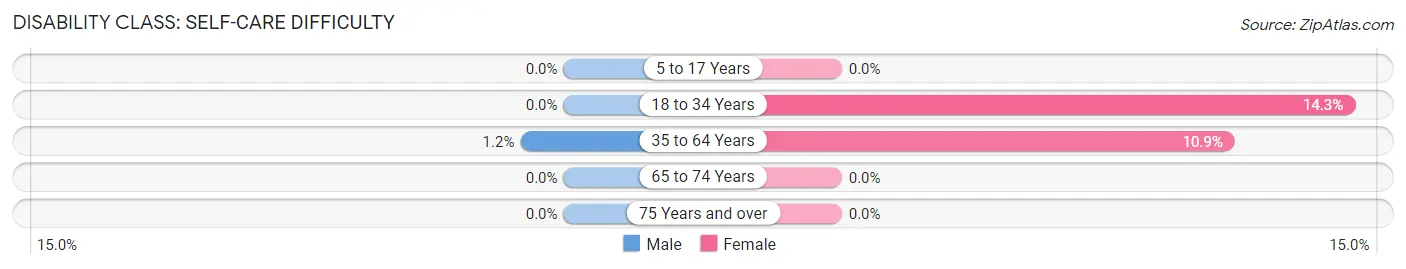
| Age Bracket | Male | Female |
| 5 to 17 Years | 0 (0.0%) | 0 (0.0%) |
| 18 to 34 Years | 0 (0.0%) | 4 (14.3%) |
| 35 to 64 Years | 1 (1.2%) | 7 (10.9%) |
| 65 to 74 Years | 0 (0.0%) | 0 (0.0%) |
| 75 Years and over | 0 (0.0%) | 0 (0.0%) |
Technology Access in Portage Des Sioux
Computing Device Access in Portage Des Sioux
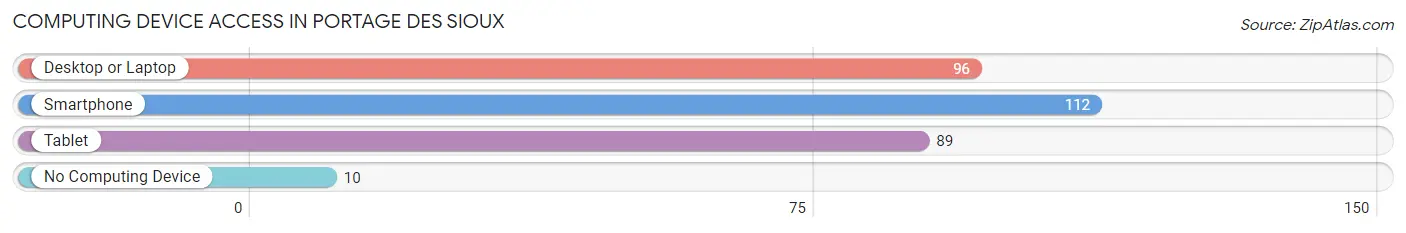
| Device Type | # Households | % Households |
| Desktop or Laptop | 96 | 73.9% |
| Smartphone | 112 | 86.2% |
| Tablet | 89 | 68.5% |
| No Computing Device | 10 | 7.7% |
| Total | 130 | 100.0% |
Internet Access in Portage Des Sioux
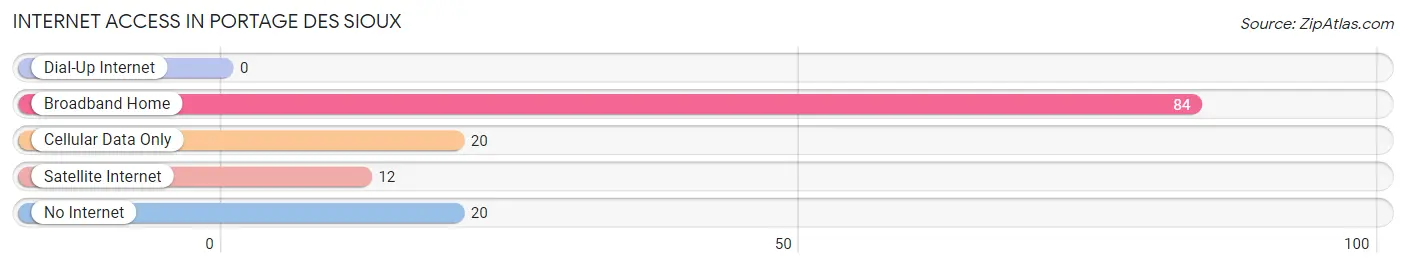
| Internet Type | # Households | % Households |
| Dial-Up Internet | 0 | 0.0% |
| Broadband Home | 84 | 64.6% |
| Cellular Data Only | 20 | 15.4% |
| Satellite Internet | 12 | 9.2% |
| No Internet | 20 | 15.4% |
| Total | 130 | 100.0% |
Portage Des Sioux Summary
Portage Des Sioux is a small city located in St. Charles County, Missouri, United States. It is situated on the west bank of the Mississippi River, approximately 25 miles north of St. Louis. The city is part of the Greater St. Louis metropolitan area and has a population of approximately 1,000 people.
History
Portage Des Sioux was first settled in the early 1800s by French-Canadian fur traders. The city was named after the portage, or short cut, that the traders used to cross the Mississippi River. The portage was located at the mouth of the Missouri River, which is now the site of the city.
In 1818, the city was officially incorporated as a village. The city was a major trading center for the area, and it was also a popular destination for steamboat travelers. In the late 1800s, the city experienced a period of growth and development, with the construction of several churches, schools, and businesses.
In the early 1900s, the city experienced a decline in population due to the Great Depression and World War II. However, the city experienced a resurgence in the 1950s and 1960s, with the construction of several new homes and businesses.
Geography
Portage Des Sioux is located in St. Charles County, Missouri, on the west bank of the Mississippi River. The city is situated approximately 25 miles north of St. Louis. The city is part of the Greater St. Louis metropolitan area and has a population of approximately 1,000 people.
The city is located in a flat, low-lying area, with the Mississippi River to the east and the Missouri River to the west. The city is surrounded by agricultural land, with several small towns and villages located nearby.
Economy
The economy of Portage Des Sioux is largely based on agriculture and tourism. The city is home to several small businesses, including restaurants, retail stores, and service providers. The city is also home to several large agricultural operations, including grain elevators, feed mills, and livestock farms.
The city is also a popular tourist destination, with several attractions located nearby. These include the historic Portage Des Sioux Lighthouse, the Lewis and Clark State Historic Site, and the Missouri River.
Demographics
As of the 2010 census, the population of Portage Des Sioux was 1,000 people. The racial makeup of the city was 97.2% White, 0.7% African American, 0.2% Native American, 0.2% Asian, 0.2% from other races, and 1.7% from two or more races. Hispanic or Latino of any race were 0.7% of the population.
The median income for a household in the city was $45,000, and the median income for a family was $50,000. The per capita income for the city was $20,000. About 8.3% of families and 10.3% of the population were below the poverty line, including 14.3% of those under age 18 and none of those age 65 or over.
Common Questions
What is Per Capita Income in Portage Des Sioux?
Per Capita income in Portage Des Sioux is $27,950.
What is the Median Family Income in Portage Des Sioux?
Median Family Income in Portage Des Sioux is $71,875.
What is the Median Household income in Portage Des Sioux?
Median Household Income in Portage Des Sioux is $65,000.
What is Income or Wage Gap in Portage Des Sioux?
Income or Wage Gap in Portage Des Sioux is 26.3%.
Women in Portage Des Sioux earn 73.7 cents for every dollar earned by a man.
What is Inequality or Gini Index in Portage Des Sioux?
Inequality or Gini Index in Portage Des Sioux is 0.36.
What is the Total Population of Portage Des Sioux?
Total Population of Portage Des Sioux is 330.
What is the Total Male Population of Portage Des Sioux?
Total Male Population of Portage Des Sioux is 170.
What is the Total Female Population of Portage Des Sioux?
Total Female Population of Portage Des Sioux is 160.
What is the Ratio of Males per 100 Females in Portage Des Sioux?
There are 106.25 Males per 100 Females in Portage Des Sioux.
What is the Ratio of Females per 100 Males in Portage Des Sioux?
There are 94.12 Females per 100 Males in Portage Des Sioux.
What is the Median Population Age in Portage Des Sioux?
Median Population Age in Portage Des Sioux is 40.5 Years.
What is the Average Family Size in Portage Des Sioux
Average Family Size in Portage Des Sioux is 2.8 People.
What is the Average Household Size in Portage Des Sioux
Average Household Size in Portage Des Sioux is 2.5 People.
How Large is the Labor Force in Portage Des Sioux?
There are 176 People in the Labor Forcein in Portage Des Sioux.
What is the Percentage of People in the Labor Force in Portage Des Sioux?
64.7% of People are in the Labor Force in Portage Des Sioux.
What is the Unemployment Rate in Portage Des Sioux?
Unemployment Rate in Portage Des Sioux is 3.4%.