Kenly, NC Map & Demographics
Kenly Map
Kenly Overview
$22,287
PER CAPITA INCOME
$74,460
AVG FAMILY INCOME
$51,250
AVG HOUSEHOLD INCOME
16.0%
WAGE / INCOME GAP [ % ]
84.0¢/ $1
WAGE / INCOME GAP [ $ ]
0.41
INEQUALITY / GINI INDEX
2,527
TOTAL POPULATION
1,258
MALE POPULATION
1,269
FEMALE POPULATION
99.13
MALES / 100 FEMALES
100.87
FEMALES / 100 MALES
36.6
MEDIAN AGE
3.4
AVG FAMILY SIZE
2.7
AVG HOUSEHOLD SIZE
1,061
LABOR FORCE [ PEOPLE ]
57.4%
PERCENT IN LABOR FORCE
8.7%
UNEMPLOYMENT RATE
Kenly Zip Codes
Kenly Area Codes
Income in Kenly
Income Overview in Kenly
Per Capita Income in Kenly is $22,287, while median incomes of families and households are $74,460 and $51,250 respectively.
| Characteristic | Number | Measure |
| Per Capita Income | 2,527 | $22,287 |
| Median Family Income | 587 | $74,460 |
| Mean Family Income | 587 | $69,147 |
| Median Household Income | 947 | $51,250 |
| Mean Household Income | 947 | $55,788 |
| Income Deficit | 587 | $0 |
| Wage / Income Gap (%) | 2,527 | 15.95% |
| Wage / Income Gap ($) | 2,527 | 84.05¢ per $1 |
| Gini / Inequality Index | 2,527 | 0.41 |
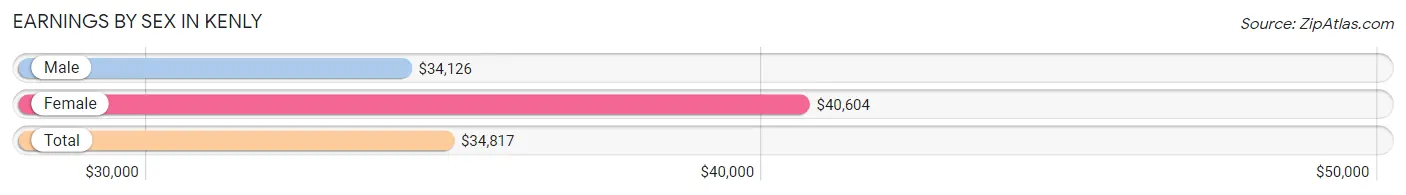
Earnings by Sex in Kenly
Average Earnings in Kenly are $34,817, $34,126 for men and $40,604 for women, a difference of 16.0%.
| Sex | Number | Average Earnings |
| Male | 524 (49.3%) | $34,126 |
| Female | 539 (50.7%) | $40,604 |
| Total | 1,063 (100.0%) | $34,817 |
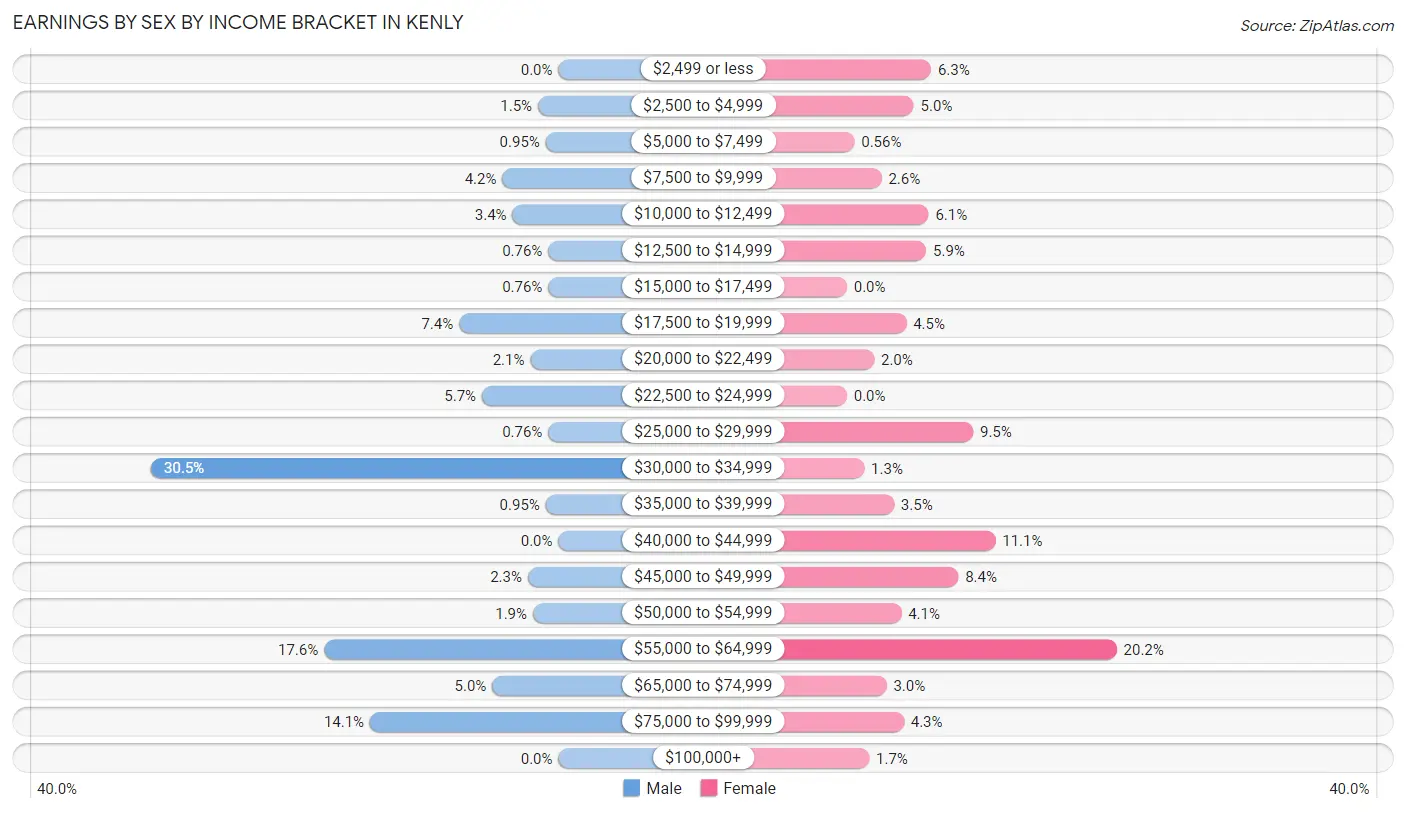
Earnings by Sex by Income Bracket in Kenly
The most common earnings brackets in Kenly are $30,000 to $34,999 for men (160 | 30.5%) and $55,000 to $64,999 for women (109 | 20.2%).
| Income | Male | Female |
| $2,499 or less | 0 (0.0%) | 34 (6.3%) |
| $2,500 to $4,999 | 8 (1.5%) | 27 (5.0%) |
| $5,000 to $7,499 | 5 (0.9%) | 3 (0.6%) |
| $7,500 to $9,999 | 22 (4.2%) | 14 (2.6%) |
| $10,000 to $12,499 | 18 (3.4%) | 33 (6.1%) |
| $12,500 to $14,999 | 4 (0.8%) | 32 (5.9%) |
| $15,000 to $17,499 | 4 (0.8%) | 0 (0.0%) |
| $17,500 to $19,999 | 39 (7.4%) | 24 (4.4%) |
| $20,000 to $22,499 | 11 (2.1%) | 11 (2.0%) |
| $22,500 to $24,999 | 30 (5.7%) | 0 (0.0%) |
| $25,000 to $29,999 | 4 (0.8%) | 51 (9.5%) |
| $30,000 to $34,999 | 160 (30.5%) | 7 (1.3%) |
| $35,000 to $39,999 | 5 (0.9%) | 19 (3.5%) |
| $40,000 to $44,999 | 0 (0.0%) | 60 (11.1%) |
| $45,000 to $49,999 | 12 (2.3%) | 45 (8.4%) |
| $50,000 to $54,999 | 10 (1.9%) | 22 (4.1%) |
| $55,000 to $64,999 | 92 (17.6%) | 109 (20.2%) |
| $65,000 to $74,999 | 26 (5.0%) | 16 (3.0%) |
| $75,000 to $99,999 | 74 (14.1%) | 23 (4.3%) |
| $100,000+ | 0 (0.0%) | 9 (1.7%) |
| Total | 524 (100.0%) | 539 (100.0%) |
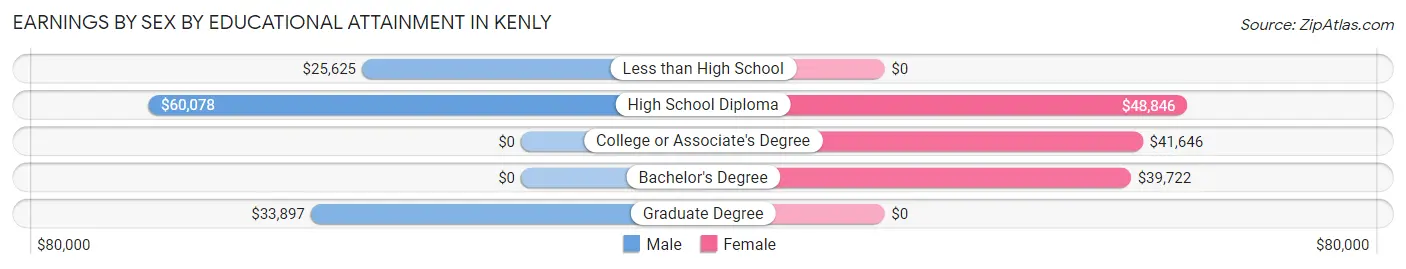
Earnings by Sex by Educational Attainment in Kenly
Average earnings in Kenly are $34,319 for men and $41,958 for women, a difference of 18.2%. Men with an educational attainment of high school diploma enjoy the highest average annual earnings of $60,078, while those with less than high school education earn the least with $25,625. Women with an educational attainment of high school diploma earn the most with the average annual earnings of $48,846, while those with bachelor's degree education have the smallest earnings of $39,722.
| Educational Attainment | Male Income | Female Income |
| Less than High School | $25,625 | $0 |
| High School Diploma | $60,078 | $48,846 |
| College or Associate's Degree | - | - |
| Bachelor's Degree | - | - |
| Graduate Degree | $33,897 | $0 |
| Total | $34,319 | $41,958 |
Family Income in Kenly
Family Income Brackets in Kenly
According to the Kenly family income data, there are 145 families falling into the $100,000 to $149,999 income range, which is the most common income bracket and makes up 24.7% of all families.
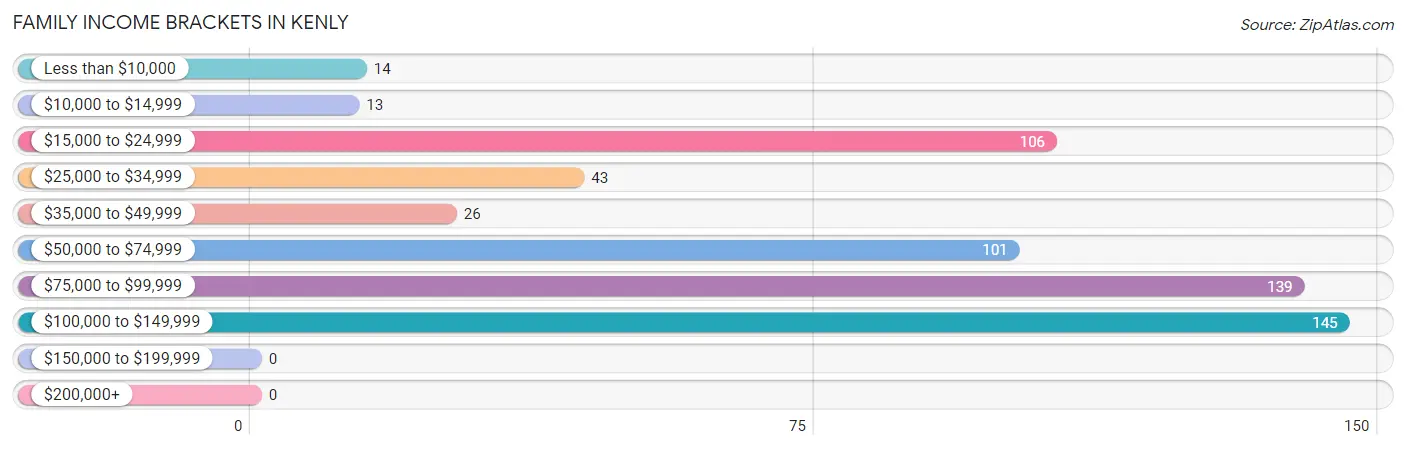
| Income Bracket | # Families | % Families |
| Less than $10,000 | 14 | 2.4% |
| $10,000 to $14,999 | 13 | 2.2% |
| $15,000 to $24,999 | 106 | 18.1% |
| $25,000 to $34,999 | 43 | 7.3% |
| $35,000 to $49,999 | 26 | 4.4% |
| $50,000 to $74,999 | 101 | 17.2% |
| $75,000 to $99,999 | 139 | 23.7% |
| $100,000 to $149,999 | 145 | 24.7% |
| $150,000 to $199,999 | 0 | 0.0% |
| $200,000+ | 0 | 0.0% |
Family Income by Famaliy Size in Kenly
4-person families (102 | 17.4%) account for the highest median family income in Kenly with $88,750 per family, while 2-person families (222 | 37.8%) have the highest median income of $27,284 per family member.
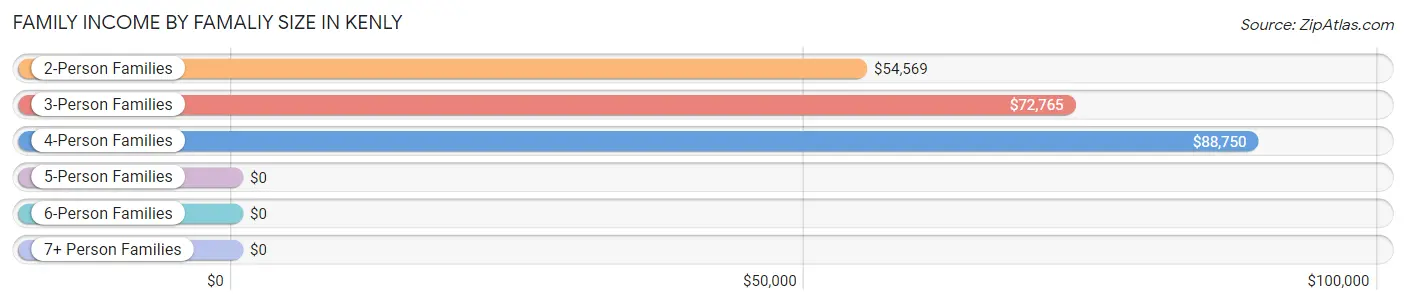
| Income Bracket | # Families | Median Income |
| 2-Person Families | 222 (37.8%) | $54,569 |
| 3-Person Families | 157 (26.8%) | $72,765 |
| 4-Person Families | 102 (17.4%) | $88,750 |
| 5-Person Families | 14 (2.4%) | $0 |
| 6-Person Families | 80 (13.6%) | $0 |
| 7+ Person Families | 12 (2.0%) | $0 |
| Total | 587 (100.0%) | $74,460 |
Family Income by Number of Earners in Kenly
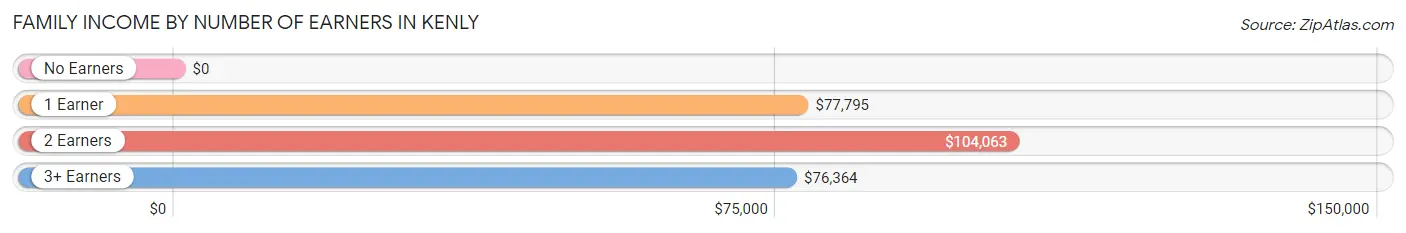
| Number of Earners | # Families | Median Income |
| No Earners | 117 (19.9%) | $0 |
| 1 Earner | 227 (38.7%) | $77,795 |
| 2 Earners | 193 (32.9%) | $104,063 |
| 3+ Earners | 50 (8.5%) | $76,364 |
| Total | 587 (100.0%) | $74,460 |
Household Income in Kenly
Household Income Brackets in Kenly
With 182 households falling in the category, the $15,000 to $24,999 income range is the most frequent in Kenly, accounting for 19.2% of all households.
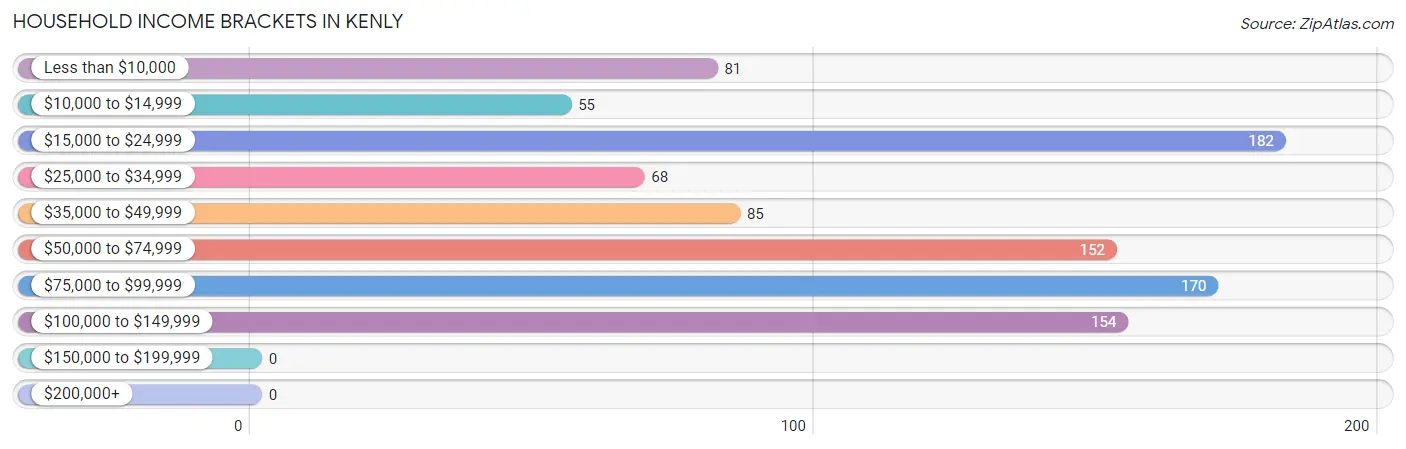
| Income Bracket | # Households | % Households |
| Less than $10,000 | 81 | 8.6% |
| $10,000 to $14,999 | 55 | 5.8% |
| $15,000 to $24,999 | 182 | 19.2% |
| $25,000 to $34,999 | 68 | 7.2% |
| $35,000 to $49,999 | 85 | 9.0% |
| $50,000 to $74,999 | 152 | 16.1% |
| $75,000 to $99,999 | 170 | 18.0% |
| $100,000 to $149,999 | 154 | 16.3% |
| $150,000 to $199,999 | 0 | 0.0% |
| $200,000+ | 0 | 0.0% |
Household Income by Householder Age in Kenly
The median household income in Kenly is $51,250, with the highest median household income of $73,668 found in the 25 to 44 years age bracket for the primary householder. A total of 359 households (37.9%) fall into this category. Meanwhile, the 15 to 24 years age bracket for the primary householder has the lowest median household income of $0, with 47 households (5.0%) in this group.
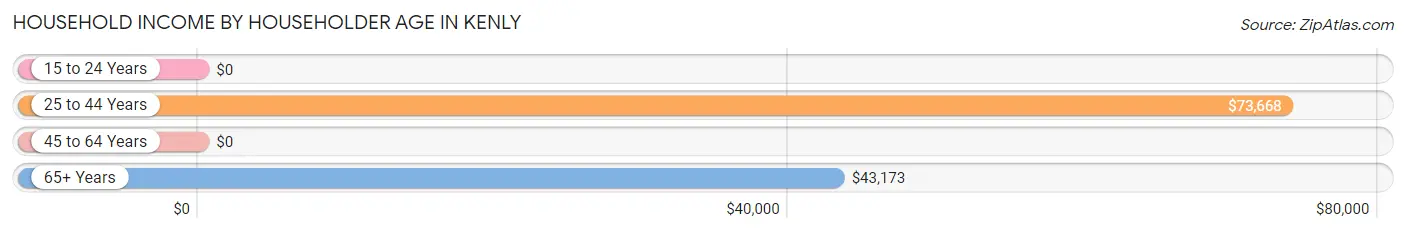
| Income Bracket | # Households | Median Income |
| 15 to 24 Years | 47 (5.0%) | $0 |
| 25 to 44 Years | 359 (37.9%) | $73,668 |
| 45 to 64 Years | 316 (33.4%) | $0 |
| 65+ Years | 225 (23.8%) | $43,173 |
| Total | 947 (100.0%) | $51,250 |
Poverty in Kenly
Income Below Poverty by Sex and Age in Kenly
With 19.2% poverty level for males and 25.4% for females among the residents of Kenly, 6 to 11 year old males and 5 year old females are the most vulnerable to poverty, with 30 males (78.9%) and 4 females (100.0%) in their respective age groups living below the poverty level.
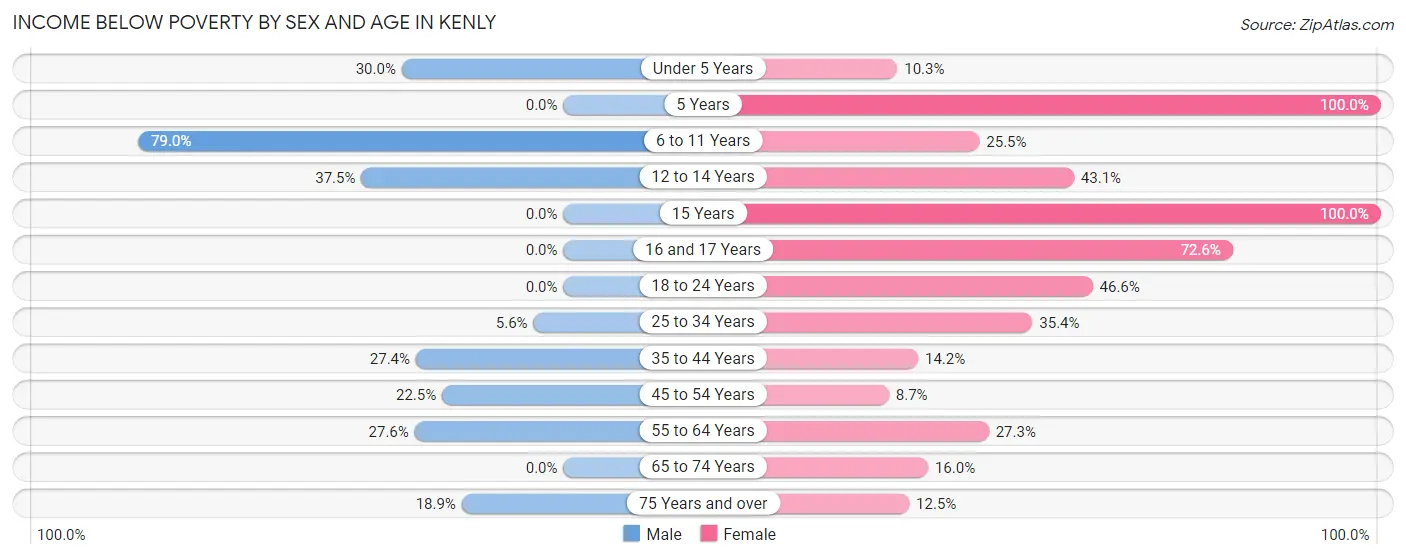
| Age Bracket | Male | Female |
| Under 5 Years | 60 (30.0%) | 10 (10.3%) |
| 5 Years | 0 (0.0%) | 4 (100.0%) |
| 6 to 11 Years | 30 (78.9%) | 24 (25.5%) |
| 12 to 14 Years | 24 (37.5%) | 28 (43.1%) |
| 15 Years | 0 (0.0%) | 9 (100.0%) |
| 16 and 17 Years | 0 (0.0%) | 37 (72.6%) |
| 18 to 24 Years | 0 (0.0%) | 27 (46.6%) |
| 25 to 34 Years | 10 (5.6%) | 58 (35.4%) |
| 35 to 44 Years | 46 (27.4%) | 32 (14.2%) |
| 45 to 54 Years | 25 (22.5%) | 9 (8.7%) |
| 55 to 64 Years | 37 (27.6%) | 60 (27.3%) |
| 65 to 74 Years | 0 (0.0%) | 8 (16.0%) |
| 75 Years and over | 10 (18.9%) | 16 (12.5%) |
| Total | 242 (19.2%) | 322 (25.4%) |
Income Above Poverty by Sex and Age in Kenly
According to the poverty statistics in Kenly, males aged 5 years and females aged 45 to 54 years are the age groups that are most secure financially, with 100.0% of males and 91.3% of females in these age groups living above the poverty line.
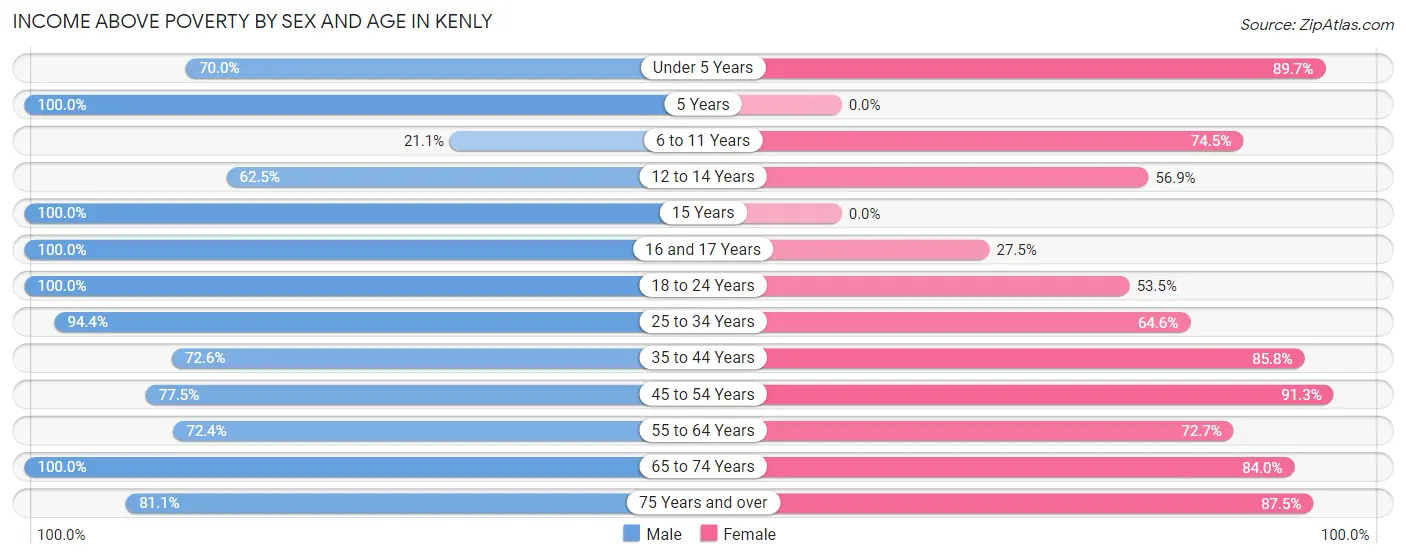
| Age Bracket | Male | Female |
| Under 5 Years | 140 (70.0%) | 87 (89.7%) |
| 5 Years | 12 (100.0%) | 0 (0.0%) |
| 6 to 11 Years | 8 (21.0%) | 70 (74.5%) |
| 12 to 14 Years | 40 (62.5%) | 37 (56.9%) |
| 15 Years | 96 (100.0%) | 0 (0.0%) |
| 16 and 17 Years | 19 (100.0%) | 14 (27.5%) |
| 18 to 24 Years | 45 (100.0%) | 31 (53.4%) |
| 25 to 34 Years | 170 (94.4%) | 106 (64.6%) |
| 35 to 44 Years | 122 (72.6%) | 194 (85.8%) |
| 45 to 54 Years | 86 (77.5%) | 94 (91.3%) |
| 55 to 64 Years | 97 (72.4%) | 160 (72.7%) |
| 65 to 74 Years | 138 (100.0%) | 42 (84.0%) |
| 75 Years and over | 43 (81.1%) | 112 (87.5%) |
| Total | 1,016 (80.8%) | 947 (74.6%) |
Income Below Poverty Among Married-Couple Families in Kenly
The poverty statistics for married-couple families in Kenly show that 12.3% or 42 of the total 341 families live below the poverty line. Families with 5 or more children have the highest poverty rate of 100.0%, comprising of 8 families. On the other hand, families with no children have the lowest poverty rate of 0.0%, which includes 0 families.
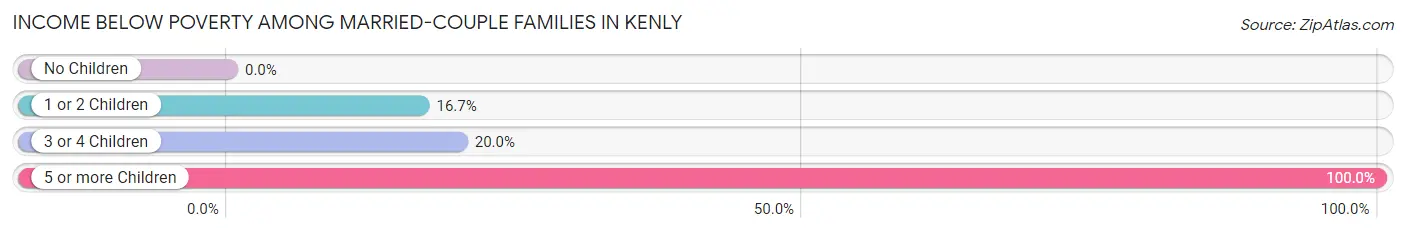
| Children | Above Poverty | Below Poverty |
| No Children | 148 (100.0%) | 0 (0.0%) |
| 1 or 2 Children | 75 (83.3%) | 15 (16.7%) |
| 3 or 4 Children | 76 (80.0%) | 19 (20.0%) |
| 5 or more Children | 0 (0.0%) | 8 (100.0%) |
| Total | 299 (87.7%) | 42 (12.3%) |
Income Below Poverty Among Single-Parent Households in Kenly
According to the poverty data in Kenly, 15.9% or 13 single-father households and 28.1% or 46 single-mother households are living below the poverty line. Among single-father households, those with no children have the highest poverty rate, with 13 households (28.3%) experiencing poverty. Likewise, among single-mother households, those with 1 or 2 children have the highest poverty rate, with 38 households (29.9%) falling below the poverty line.
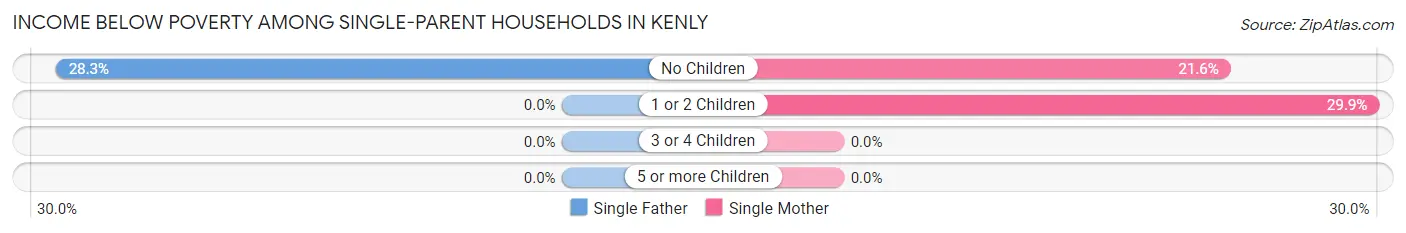
| Children | Single Father | Single Mother |
| No Children | 13 (28.3%) | 8 (21.6%) |
| 1 or 2 Children | 0 (0.0%) | 38 (29.9%) |
| 3 or 4 Children | 0 (0.0%) | 0 (0.0%) |
| 5 or more Children | 0 (0.0%) | 0 (0.0%) |
| Total | 13 (15.9%) | 46 (28.1%) |
Income Below Poverty Among Married-Couple vs Single-Parent Households in Kenly
The poverty data for Kenly shows that 42 of the married-couple family households (12.3%) and 59 of the single-parent households (24.0%) are living below the poverty level. Within the married-couple family households, those with 5 or more children have the highest poverty rate, with 8 households (100.0%) falling below the poverty line. Among the single-parent households, those with no children have the highest poverty rate, with 21 household (25.3%) living below poverty.
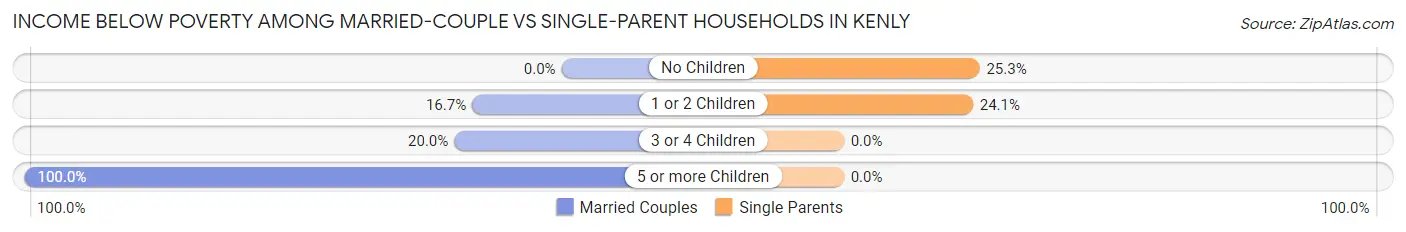
| Children | Married-Couple Families | Single-Parent Households |
| No Children | 0 (0.0%) | 21 (25.3%) |
| 1 or 2 Children | 15 (16.7%) | 38 (24.0%) |
| 3 or 4 Children | 19 (20.0%) | 0 (0.0%) |
| 5 or more Children | 8 (100.0%) | 0 (0.0%) |
| Total | 42 (12.3%) | 59 (24.0%) |
Race in Kenly
The most populous races in Kenly are White / Caucasian (1,535 | 60.7%), Black / African American (733 | 29.0%), and Hispanic or Latino (271 | 10.7%).
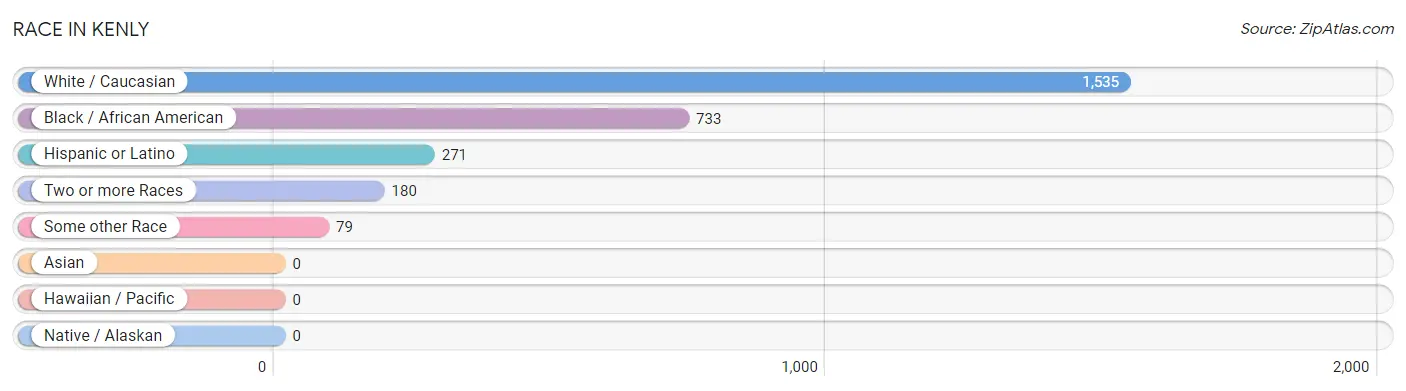
| Race | # Population | % Population |
| Asian | 0 | 0.0% |
| Black / African American | 733 | 29.0% |
| Hawaiian / Pacific | 0 | 0.0% |
| Hispanic or Latino | 271 | 10.7% |
| Native / Alaskan | 0 | 0.0% |
| White / Caucasian | 1,535 | 60.7% |
| Two or more Races | 180 | 7.1% |
| Some other Race | 79 | 3.1% |
| Total | 2,527 | 100.0% |
Ancestry in Kenly
The most populous ancestries reported in Kenly are Irish (520 | 20.6%), Russian (244 | 9.7%), Mexican (215 | 8.5%), American (168 | 6.7%), and English (166 | 6.6%), together accounting for 52.0% of all Kenly residents.
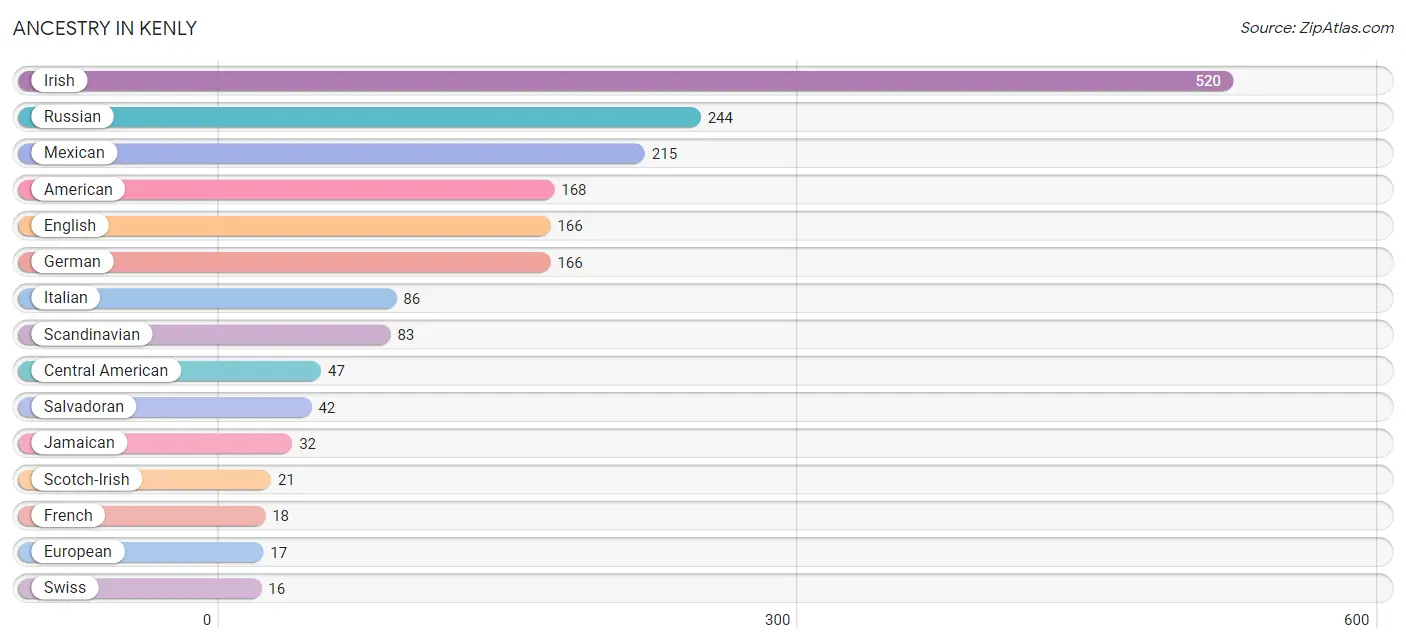
| Ancestry | # Population | % Population |
| African | 3 | 0.1% |
| American | 168 | 6.7% |
| British | 3 | 0.1% |
| Central American | 47 | 1.9% |
| Cherokee | 1 | 0.0% |
| Dutch | 9 | 0.4% |
| English | 166 | 6.6% |
| European | 17 | 0.7% |
| French | 18 | 0.7% |
| German | 166 | 6.6% |
| Guatemalan | 5 | 0.2% |
| Irish | 520 | 20.6% |
| Italian | 86 | 3.4% |
| Jamaican | 32 | 1.3% |
| Mexican | 215 | 8.5% |
| Mexican American Indian | 9 | 0.4% |
| Puerto Rican | 9 | 0.4% |
| Russian | 244 | 9.7% |
| Salvadoran | 42 | 1.7% |
| Scandinavian | 83 | 3.3% |
| Scotch-Irish | 21 | 0.8% |
| Subsaharan African | 3 | 0.1% |
| Swiss | 16 | 0.6% | View All 23 Rows |
Immigrants in Kenly
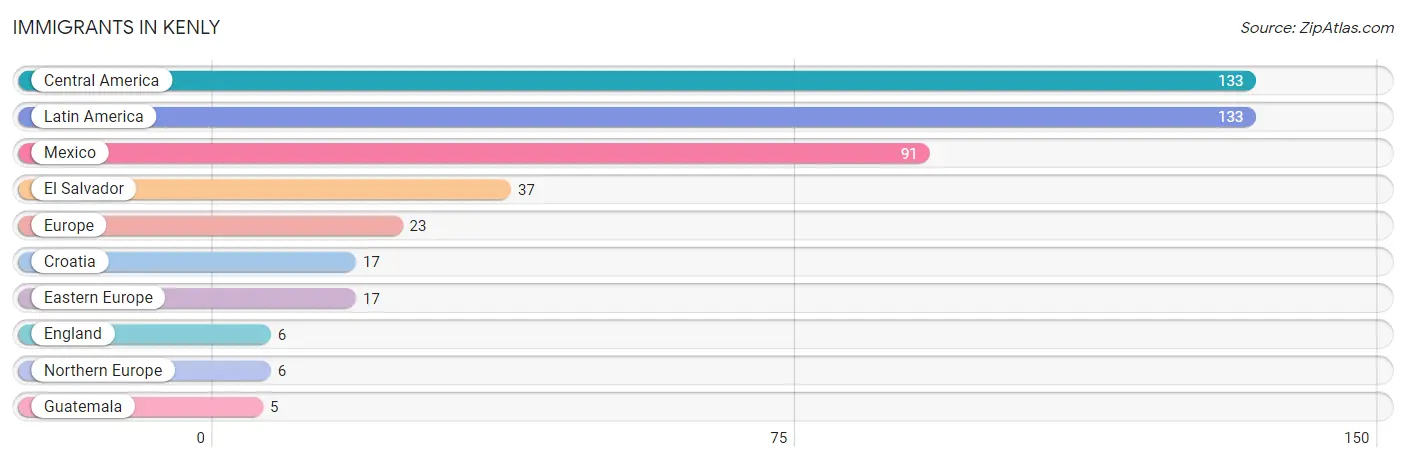
The most numerous immigrant groups reported in Kenly came from Central America (133 | 5.3%), Latin America (133 | 5.3%), Mexico (91 | 3.6%), El Salvador (37 | 1.5%), and Europe (23 | 0.9%), together accounting for 16.5% of all Kenly residents.
| Immigration Origin | # Population | % Population |
| Central America | 133 | 5.3% |
| Croatia | 17 | 0.7% |
| Eastern Europe | 17 | 0.7% |
| El Salvador | 37 | 1.5% |
| England | 6 | 0.2% |
| Europe | 23 | 0.9% |
| Guatemala | 5 | 0.2% |
| Latin America | 133 | 5.3% |
| Mexico | 91 | 3.6% |
| Northern Europe | 6 | 0.2% | View All 10 Rows |
Sex and Age in Kenly
Sex and Age in Kenly
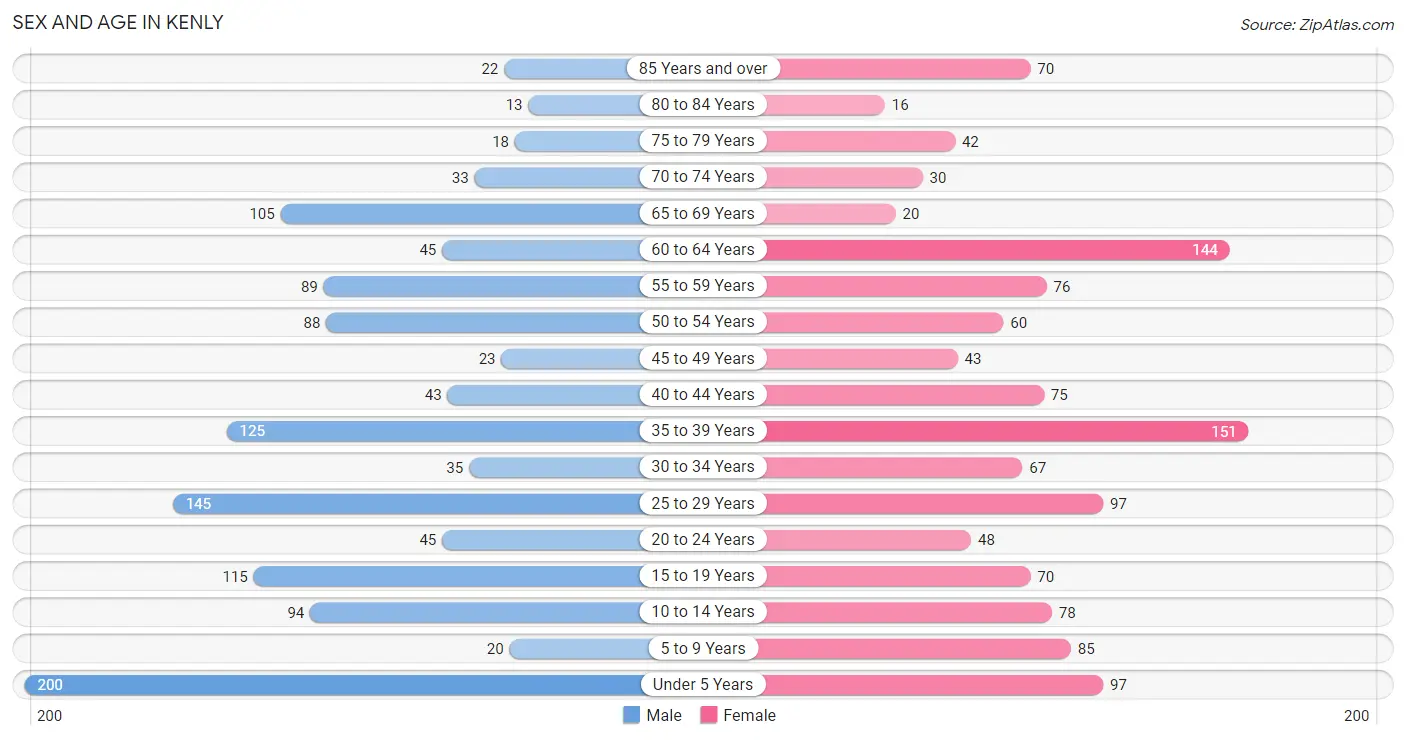
The most populous age groups in Kenly are Under 5 Years (200 | 15.9%) for men and 35 to 39 Years (151 | 11.9%) for women.
| Age Bracket | Male | Female |
| Under 5 Years | 200 (15.9%) | 97 (7.6%) |
| 5 to 9 Years | 20 (1.6%) | 85 (6.7%) |
| 10 to 14 Years | 94 (7.5%) | 78 (6.1%) |
| 15 to 19 Years | 115 (9.1%) | 70 (5.5%) |
| 20 to 24 Years | 45 (3.6%) | 48 (3.8%) |
| 25 to 29 Years | 145 (11.5%) | 97 (7.6%) |
| 30 to 34 Years | 35 (2.8%) | 67 (5.3%) |
| 35 to 39 Years | 125 (9.9%) | 151 (11.9%) |
| 40 to 44 Years | 43 (3.4%) | 75 (5.9%) |
| 45 to 49 Years | 23 (1.8%) | 43 (3.4%) |
| 50 to 54 Years | 88 (7.0%) | 60 (4.7%) |
| 55 to 59 Years | 89 (7.1%) | 76 (6.0%) |
| 60 to 64 Years | 45 (3.6%) | 144 (11.4%) |
| 65 to 69 Years | 105 (8.4%) | 20 (1.6%) |
| 70 to 74 Years | 33 (2.6%) | 30 (2.4%) |
| 75 to 79 Years | 18 (1.4%) | 42 (3.3%) |
| 80 to 84 Years | 13 (1.0%) | 16 (1.3%) |
| 85 Years and over | 22 (1.8%) | 70 (5.5%) |
| Total | 1,258 (100.0%) | 1,269 (100.0%) |
Families and Households in Kenly
Median Family Size in Kenly
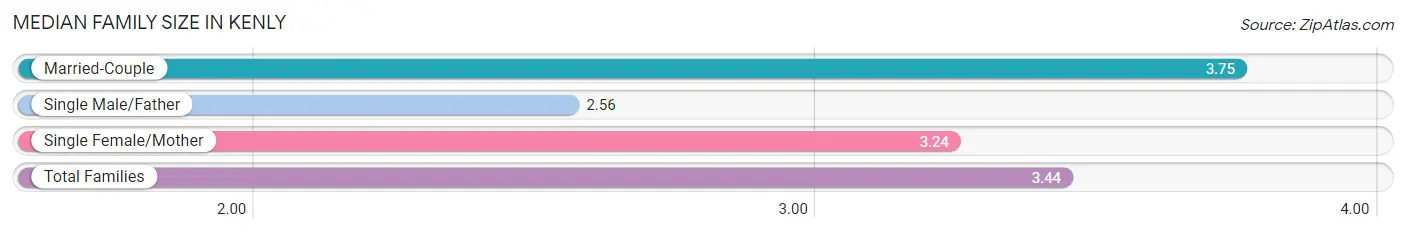
The median family size in Kenly is 3.44 persons per family, with married-couple families (341 | 58.1%) accounting for the largest median family size of 3.75 persons per family. On the other hand, single male/father families (82 | 14.0%) represent the smallest median family size with 2.56 persons per family.
| Family Type | # Families | Family Size |
| Married-Couple | 341 (58.1%) | 3.75 |
| Single Male/Father | 82 (14.0%) | 2.56 |
| Single Female/Mother | 164 (27.9%) | 3.24 |
| Total Families | 587 (100.0%) | 3.44 |
Median Household Size in Kenly
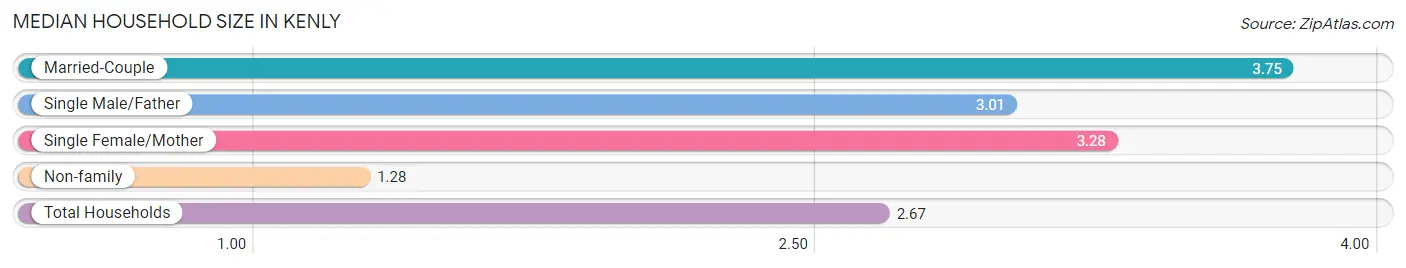
The median household size in Kenly is 2.67 persons per household, with married-couple households (341 | 36.0%) accounting for the largest median household size of 3.75 persons per household. non-family households (360 | 38.0%) represent the smallest median household size with 1.28 persons per household.
| Household Type | # Households | Household Size |
| Married-Couple | 341 (36.0%) | 3.75 |
| Single Male/Father | 82 (8.7%) | 3.01 |
| Single Female/Mother | 164 (17.3%) | 3.28 |
| Non-family | 360 (38.0%) | 1.28 |
| Total Households | 947 (100.0%) | 2.67 |
Household Size by Marriage Status in Kenly
Out of a total of 947 households in Kenly, 587 (62.0%) are family households, while 360 (38.0%) are nonfamily households. The most numerous type of family households are 2-person households, comprising 204, and the most common type of nonfamily households are 1-person households, comprising 292.
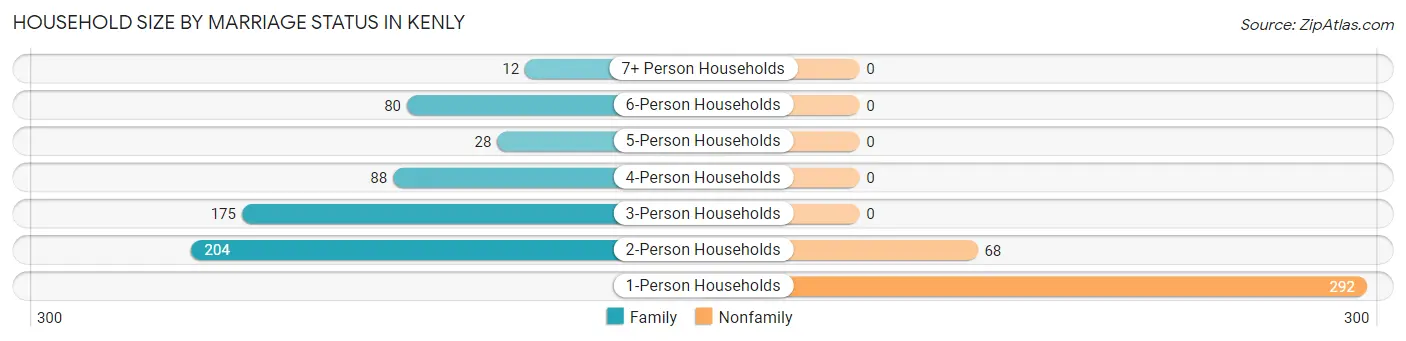
| Household Size | Family Households | Nonfamily Households |
| 1-Person Households | - | 292 (30.8%) |
| 2-Person Households | 204 (21.5%) | 68 (7.2%) |
| 3-Person Households | 175 (18.5%) | 0 (0.0%) |
| 4-Person Households | 88 (9.3%) | 0 (0.0%) |
| 5-Person Households | 28 (3.0%) | 0 (0.0%) |
| 6-Person Households | 80 (8.5%) | 0 (0.0%) |
| 7+ Person Households | 12 (1.3%) | 0 (0.0%) |
| Total | 587 (62.0%) | 360 (38.0%) |
Female Fertility in Kenly
Fertility by Age in Kenly
Average fertility rate in Kenly is 231.0 births per 1,000 women. Women in the age bracket of 35 to 50 years have the highest fertility rate with 272.0 births per 1,000 women. Women in the age bracket of 35 to 50 years acount for 59.9% of all women with births.
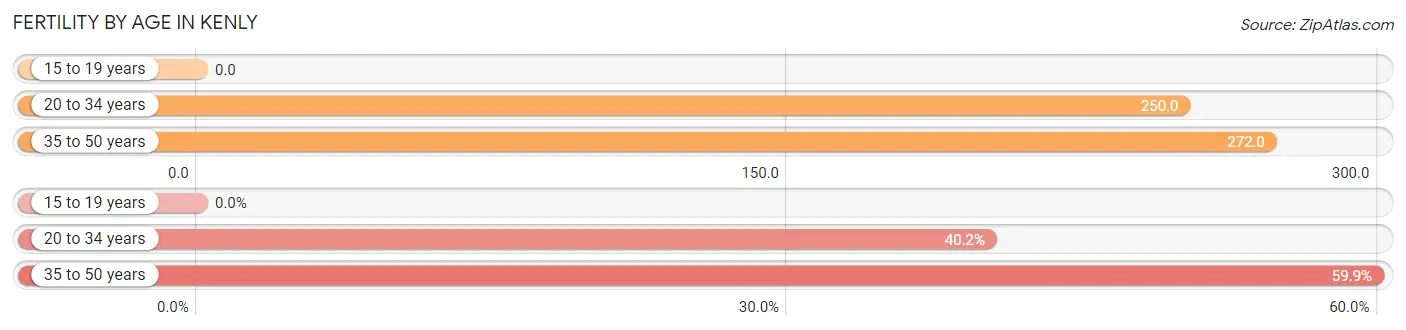
| Age Bracket | Women with Births | Births / 1,000 Women |
| 15 to 19 years | 0 (0.0%) | 0.0 |
| 20 to 34 years | 53 (40.2%) | 250.0 |
| 35 to 50 years | 79 (59.9%) | 272.0 |
| Total | 132 (100.0%) | 231.0 |
Fertility by Age by Marriage Status in Kenly
73.5% of women with births (132) in Kenly are married. The highest percentage of unmarried women with births falls into 20 to 34 years age bracket with 66.0% of them unmarried at the time of birth, while the lowest percentage of unmarried women with births belong to 35 to 50 years age bracket with 0.0% of them unmarried.
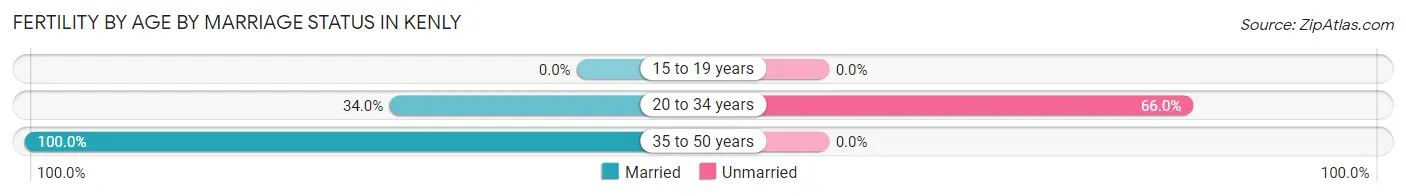
| Age Bracket | Married | Unmarried |
| 15 to 19 years | 0 (0.0%) | 0 (0.0%) |
| 20 to 34 years | 18 (34.0%) | 35 (66.0%) |
| 35 to 50 years | 79 (100.0%) | 0 (0.0%) |
| Total | 97 (73.5%) | 35 (26.5%) |
Fertility by Education in Kenly
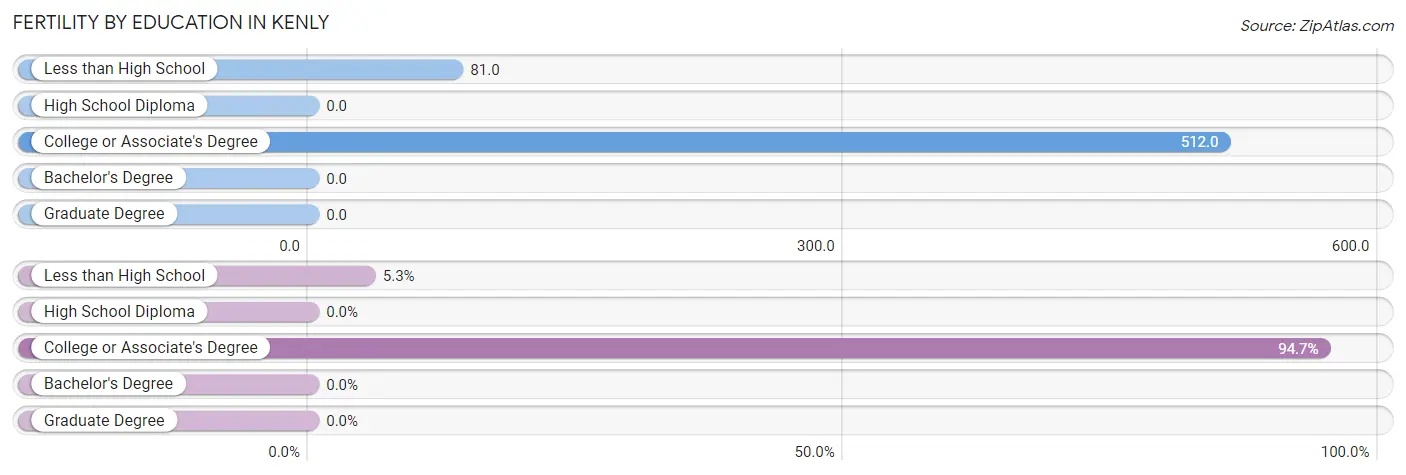
| Educational Attainment | Women with Births | Births / 1,000 Women |
| Less than High School | 7 (5.3%) | 81.0 |
| High School Diploma | 0 (0.0%) | 0.0 |
| College or Associate's Degree | 125 (94.7%) | 512.0 |
| Bachelor's Degree | 0 (0.0%) | 0.0 |
| Graduate Degree | 0 (0.0%) | 0.0 |
| Total | 132 (100.0%) | 231.0 |
Fertility by Education by Marriage Status in Kenly
26.5% of women with births in Kenly are unmarried. Women with the educational attainment of less than high school are most likely to be married with 100.0% of them married at childbirth, while women with the educational attainment of college or associate's degree are least likely to be married with 28.0% of them unmarried at childbirth.
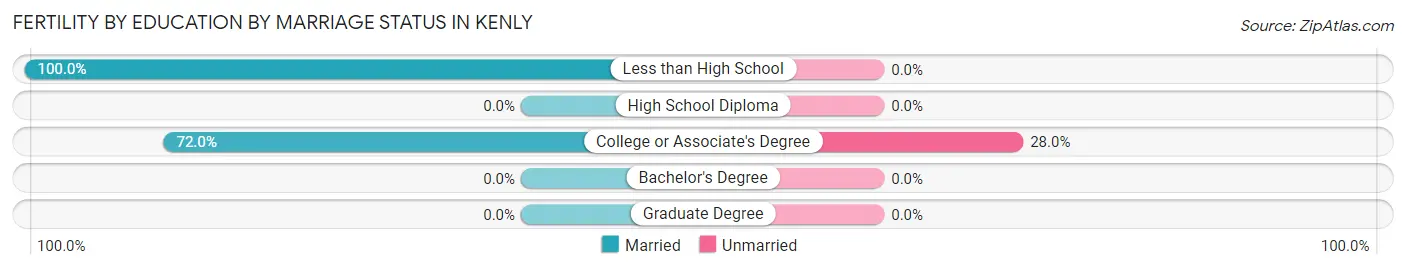
| Educational Attainment | Married | Unmarried |
| Less than High School | 7 (100.0%) | 0 (0.0%) |
| High School Diploma | 0 (0.0%) | 0 (0.0%) |
| College or Associate's Degree | 90 (72.0%) | 35 (28.0%) |
| Bachelor's Degree | 0 (0.0%) | 0 (0.0%) |
| Graduate Degree | 0 (0.0%) | 0 (0.0%) |
| Total | 97 (73.5%) | 35 (26.5%) |
Employment Characteristics in Kenly
Employment by Class of Employer in Kenly
Among the 913 employed individuals in Kenly, private company employees (638 | 69.9%), self-employed (not incorporated) (73 | 8.0%), and local government employees (70 | 7.7%) make up the most common classes of employment.
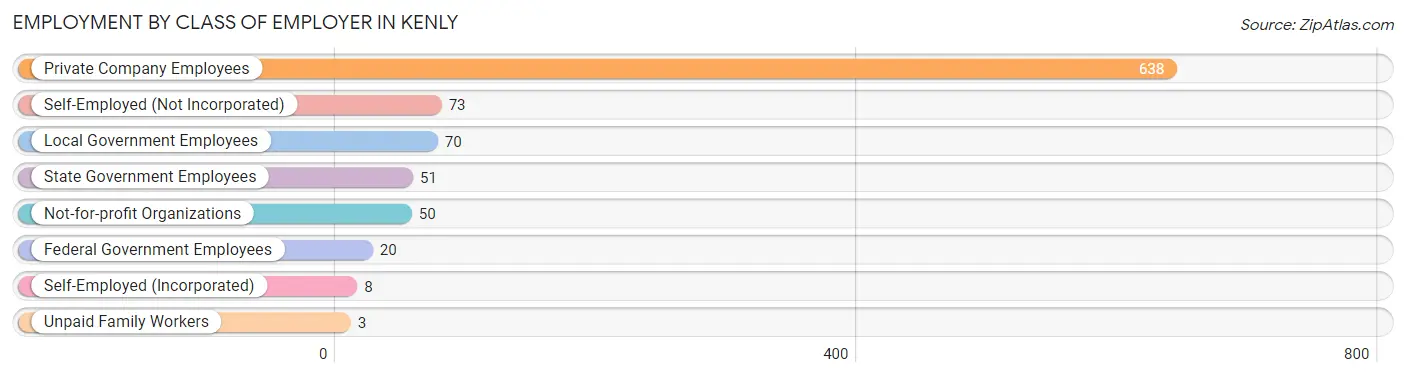
| Employer Class | # Employees | % Employees |
| Private Company Employees | 638 | 69.9% |
| Self-Employed (Incorporated) | 8 | 0.9% |
| Self-Employed (Not Incorporated) | 73 | 8.0% |
| Not-for-profit Organizations | 50 | 5.5% |
| Local Government Employees | 70 | 7.7% |
| State Government Employees | 51 | 5.6% |
| Federal Government Employees | 20 | 2.2% |
| Unpaid Family Workers | 3 | 0.3% |
| Total | 913 | 100.0% |
Employment Status by Age in Kenly
According to the labor force statistics for Kenly, out of the total population over 16 years of age (1,848), 57.4% or 1,061 individuals are in the labor force, with 8.7% or 92 of them unemployed. The age group with the highest labor force participation rate is 20 to 24 years, with 93.5% or 87 individuals in the labor force. Within the labor force, the 60 to 64 years age range has the highest percentage of unemployed individuals, with 39.8% or 39 of them being unemployed.
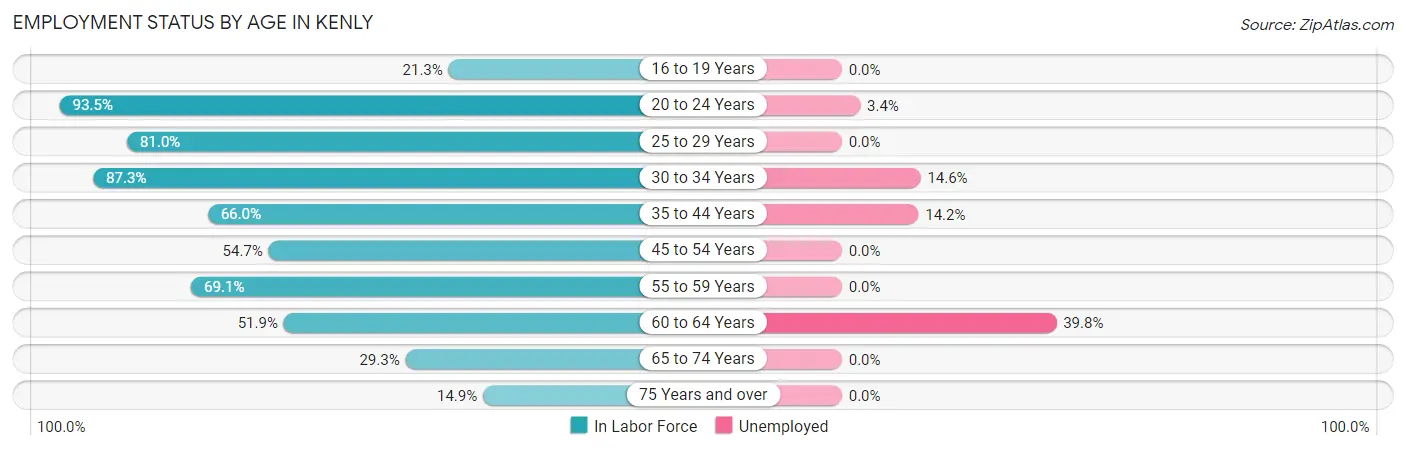
| Age Bracket | In Labor Force | Unemployed |
| 16 to 19 Years | 17 (21.3%) | 0 (0.0%) |
| 20 to 24 Years | 87 (93.5%) | 3 (3.4%) |
| 25 to 29 Years | 196 (81.0%) | 0 (0.0%) |
| 30 to 34 Years | 89 (87.3%) | 13 (14.6%) |
| 35 to 44 Years | 260 (66.0%) | 37 (14.2%) |
| 45 to 54 Years | 117 (54.7%) | 0 (0.0%) |
| 55 to 59 Years | 114 (69.1%) | 0 (0.0%) |
| 60 to 64 Years | 98 (51.9%) | 39 (39.8%) |
| 65 to 74 Years | 55 (29.3%) | 0 (0.0%) |
| 75 Years and over | 27 (14.9%) | 0 (0.0%) |
| Total | 1,061 (57.4%) | 92 (8.7%) |
Employment Status by Educational Attainment in Kenly
According to labor force statistics for Kenly, 66.9% of individuals (874) out of the total population between 25 and 64 years of age (1,306) are in the labor force, with 10.2% or 89 of them being unemployed. The group with the highest labor force participation rate are those with the educational attainment of high school diploma, with 81.6% or 368 individuals in the labor force. Within the labor force, individuals with college / associate degree education have the highest percentage of unemployment, with 19.0% or 63 of them being unemployed.
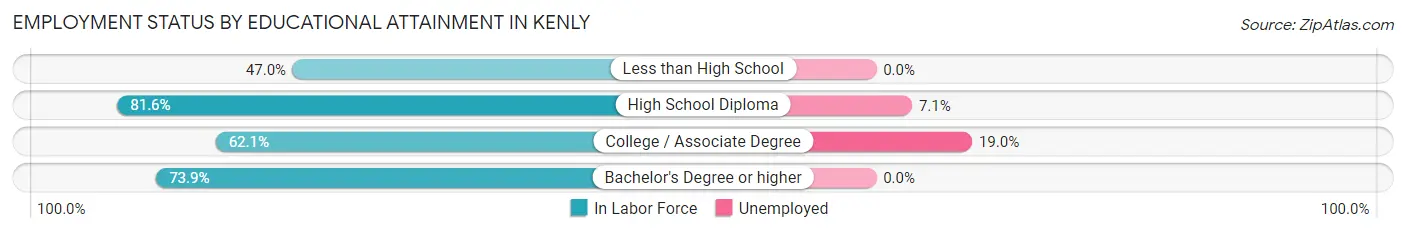
| Educational Attainment | In Labor Force | Unemployed |
| Less than High School | 110 (47.0%) | 0 (0.0%) |
| High School Diploma | 368 (81.6%) | 32 (7.1%) |
| College / Associate Degree | 331 (62.1%) | 101 (19.0%) |
| Bachelor's Degree or higher | 65 (73.9%) | 0 (0.0%) |
| Total | 874 (66.9%) | 133 (10.2%) |
Employment Occupations by Sex in Kenly
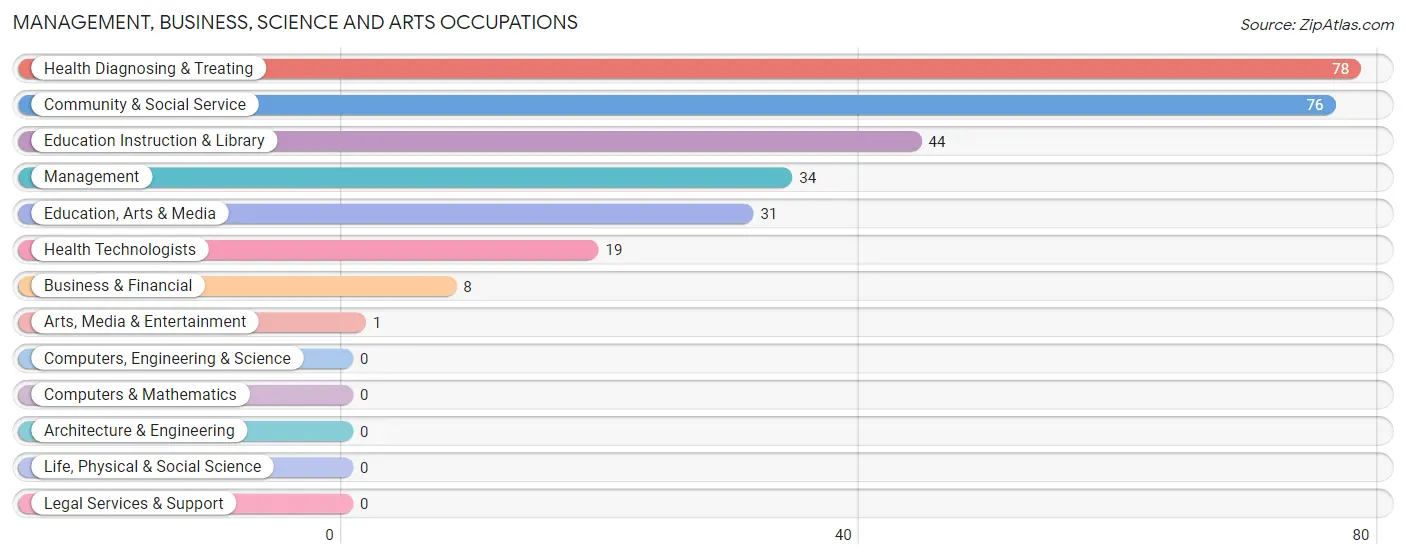
Management, Business, Science and Arts Occupations
The most common Management, Business, Science and Arts occupations in Kenly are Health Diagnosing & Treating (78 | 8.1%), Community & Social Service (76 | 7.9%), Education Instruction & Library (44 | 4.5%), Management (34 | 3.5%), and Education, Arts & Media (31 | 3.2%).
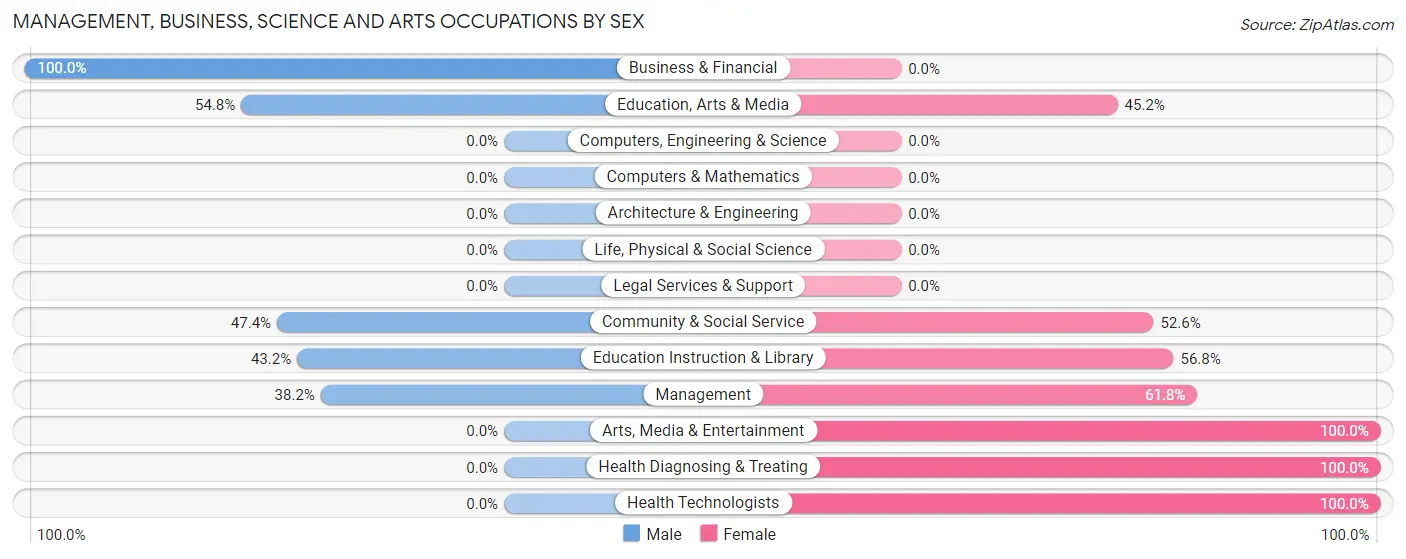
Management, Business, Science and Arts Occupations by Sex
Within the Management, Business, Science and Arts occupations in Kenly, the most male-oriented occupations are Business & Financial (100.0%), Education, Arts & Media (54.8%), and Community & Social Service (47.4%), while the most female-oriented occupations are Arts, Media & Entertainment (100.0%), Health Diagnosing & Treating (100.0%), and Health Technologists (100.0%).
| Occupation | Male | Female |
| Management | 13 (38.2%) | 21 (61.8%) |
| Business & Financial | 8 (100.0%) | 0 (0.0%) |
| Computers, Engineering & Science | 0 (0.0%) | 0 (0.0%) |
| Computers & Mathematics | 0 (0.0%) | 0 (0.0%) |
| Architecture & Engineering | 0 (0.0%) | 0 (0.0%) |
| Life, Physical & Social Science | 0 (0.0%) | 0 (0.0%) |
| Community & Social Service | 36 (47.4%) | 40 (52.6%) |
| Education, Arts & Media | 17 (54.8%) | 14 (45.2%) |
| Legal Services & Support | 0 (0.0%) | 0 (0.0%) |
| Education Instruction & Library | 19 (43.2%) | 25 (56.8%) |
| Arts, Media & Entertainment | 0 (0.0%) | 1 (100.0%) |
| Health Diagnosing & Treating | 0 (0.0%) | 78 (100.0%) |
| Health Technologists | 0 (0.0%) | 19 (100.0%) |
| Total (Category) | 57 (29.1%) | 139 (70.9%) |
| Total (Overall) | 493 (50.9%) | 475 (49.1%) |
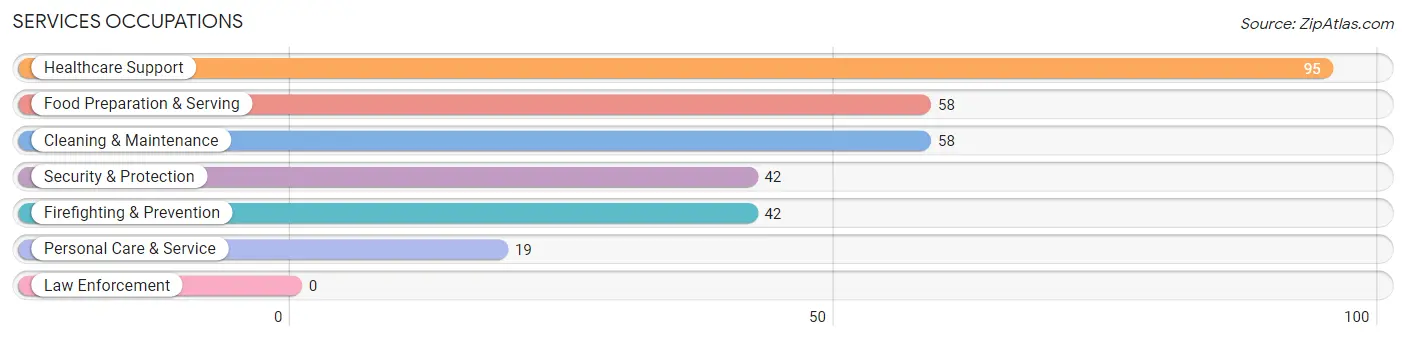
Services Occupations
The most common Services occupations in Kenly are Healthcare Support (95 | 9.8%), Food Preparation & Serving (58 | 6.0%), Cleaning & Maintenance (58 | 6.0%), Security & Protection (42 | 4.3%), and Firefighting & Prevention (42 | 4.3%).
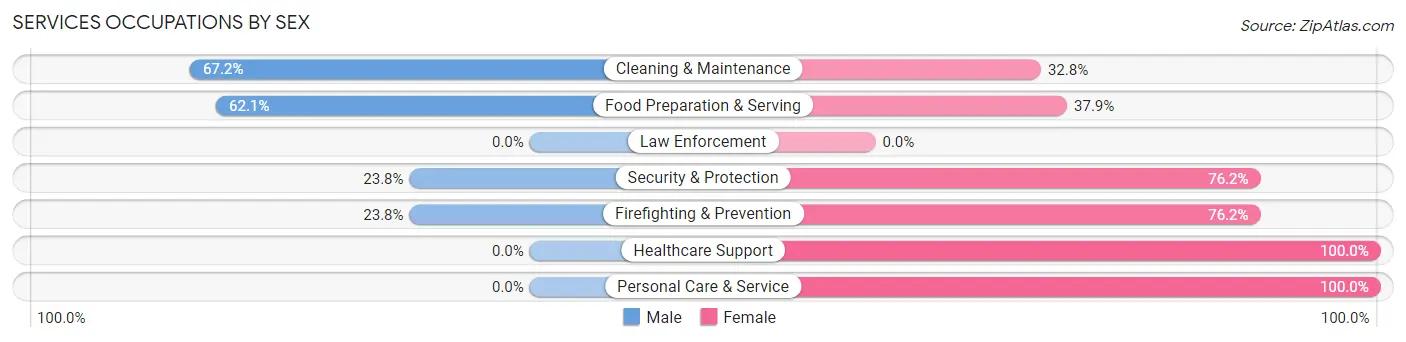
Services Occupations by Sex
Within the Services occupations in Kenly, the most male-oriented occupations are Cleaning & Maintenance (67.2%), Food Preparation & Serving (62.1%), and Security & Protection (23.8%), while the most female-oriented occupations are Healthcare Support (100.0%), Personal Care & Service (100.0%), and Security & Protection (76.2%).
| Occupation | Male | Female |
| Healthcare Support | 0 (0.0%) | 95 (100.0%) |
| Security & Protection | 10 (23.8%) | 32 (76.2%) |
| Firefighting & Prevention | 10 (23.8%) | 32 (76.2%) |
| Law Enforcement | 0 (0.0%) | 0 (0.0%) |
| Food Preparation & Serving | 36 (62.1%) | 22 (37.9%) |
| Cleaning & Maintenance | 39 (67.2%) | 19 (32.8%) |
| Personal Care & Service | 0 (0.0%) | 19 (100.0%) |
| Total (Category) | 85 (31.2%) | 187 (68.8%) |
| Total (Overall) | 493 (50.9%) | 475 (49.1%) |
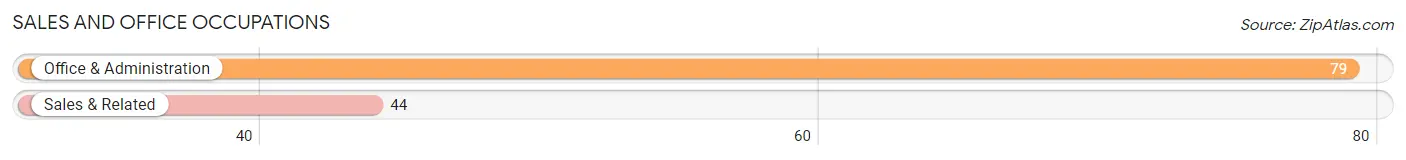
Sales and Office Occupations
The most common Sales and Office occupations in Kenly are Office & Administration (79 | 8.2%), and Sales & Related (44 | 4.5%).
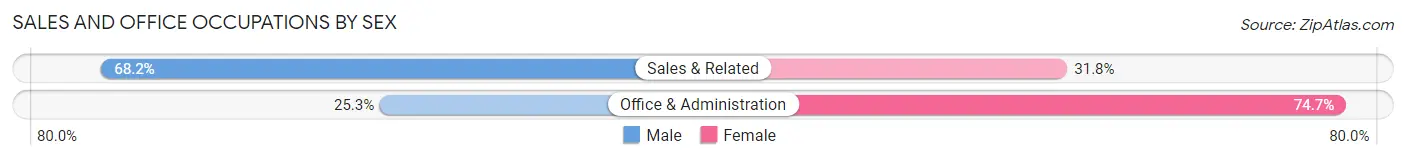
Sales and Office Occupations by Sex
| Occupation | Male | Female |
| Sales & Related | 30 (68.2%) | 14 (31.8%) |
| Office & Administration | 20 (25.3%) | 59 (74.7%) |
| Total (Category) | 50 (40.6%) | 73 (59.4%) |
| Total (Overall) | 493 (50.9%) | 475 (49.1%) |
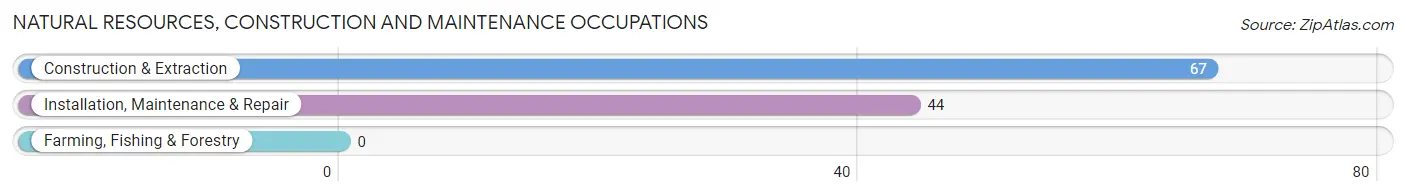
Natural Resources, Construction and Maintenance Occupations
The most common Natural Resources, Construction and Maintenance occupations in Kenly are Construction & Extraction (67 | 6.9%), and Installation, Maintenance & Repair (44 | 4.5%).
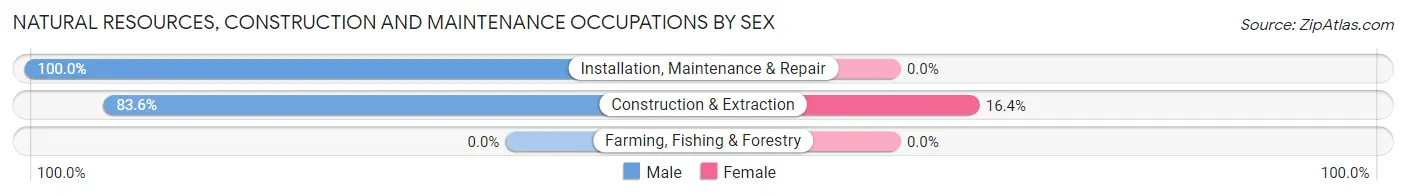
Natural Resources, Construction and Maintenance Occupations by Sex
| Occupation | Male | Female |
| Farming, Fishing & Forestry | 0 (0.0%) | 0 (0.0%) |
| Construction & Extraction | 56 (83.6%) | 11 (16.4%) |
| Installation, Maintenance & Repair | 44 (100.0%) | 0 (0.0%) |
| Total (Category) | 100 (90.1%) | 11 (9.9%) |
| Total (Overall) | 493 (50.9%) | 475 (49.1%) |
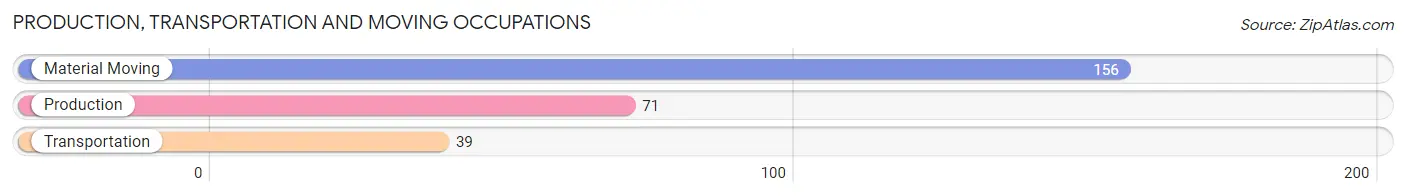
Production, Transportation and Moving Occupations
The most common Production, Transportation and Moving occupations in Kenly are Material Moving (156 | 16.1%), Production (71 | 7.3%), and Transportation (39 | 4.0%).
Production, Transportation and Moving Occupations by Sex
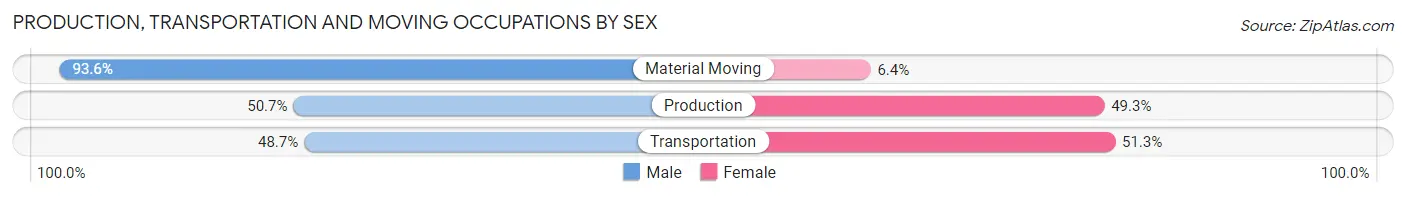
| Occupation | Male | Female |
| Production | 36 (50.7%) | 35 (49.3%) |
| Transportation | 19 (48.7%) | 20 (51.3%) |
| Material Moving | 146 (93.6%) | 10 (6.4%) |
| Total (Category) | 201 (75.6%) | 65 (24.4%) |
| Total (Overall) | 493 (50.9%) | 475 (49.1%) |
Employment Industries by Sex in Kenly
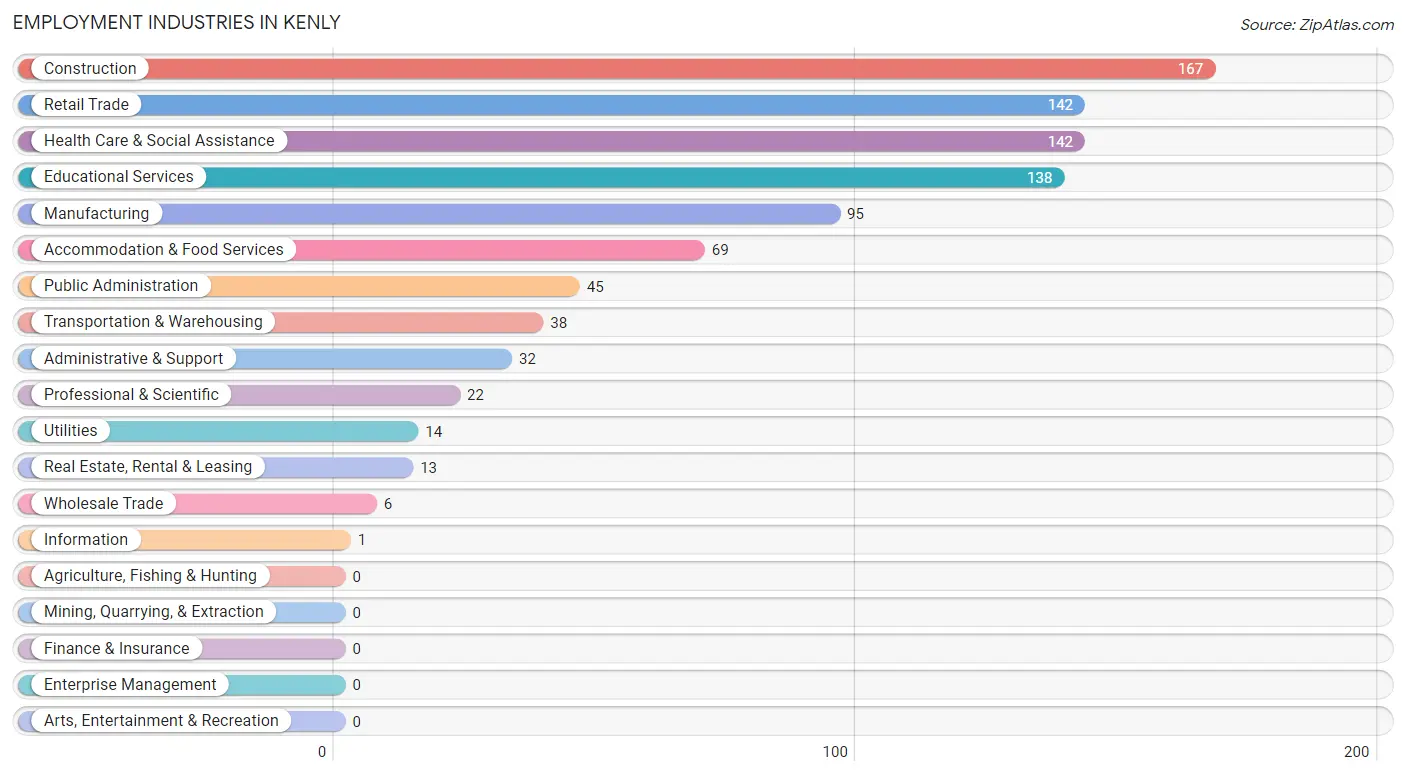
Employment Industries in Kenly
The major employment industries in Kenly include Construction (167 | 17.2%), Retail Trade (142 | 14.7%), Health Care & Social Assistance (142 | 14.7%), Educational Services (138 | 14.3%), and Manufacturing (95 | 9.8%).
Employment Industries by Sex in Kenly
The Kenly industries that see more men than women are Wholesale Trade (100.0%), Utilities (100.0%), and Construction (93.4%), whereas the industries that tend to have a higher number of women are Information (100.0%), Real Estate, Rental & Leasing (100.0%), and Professional & Scientific (100.0%).
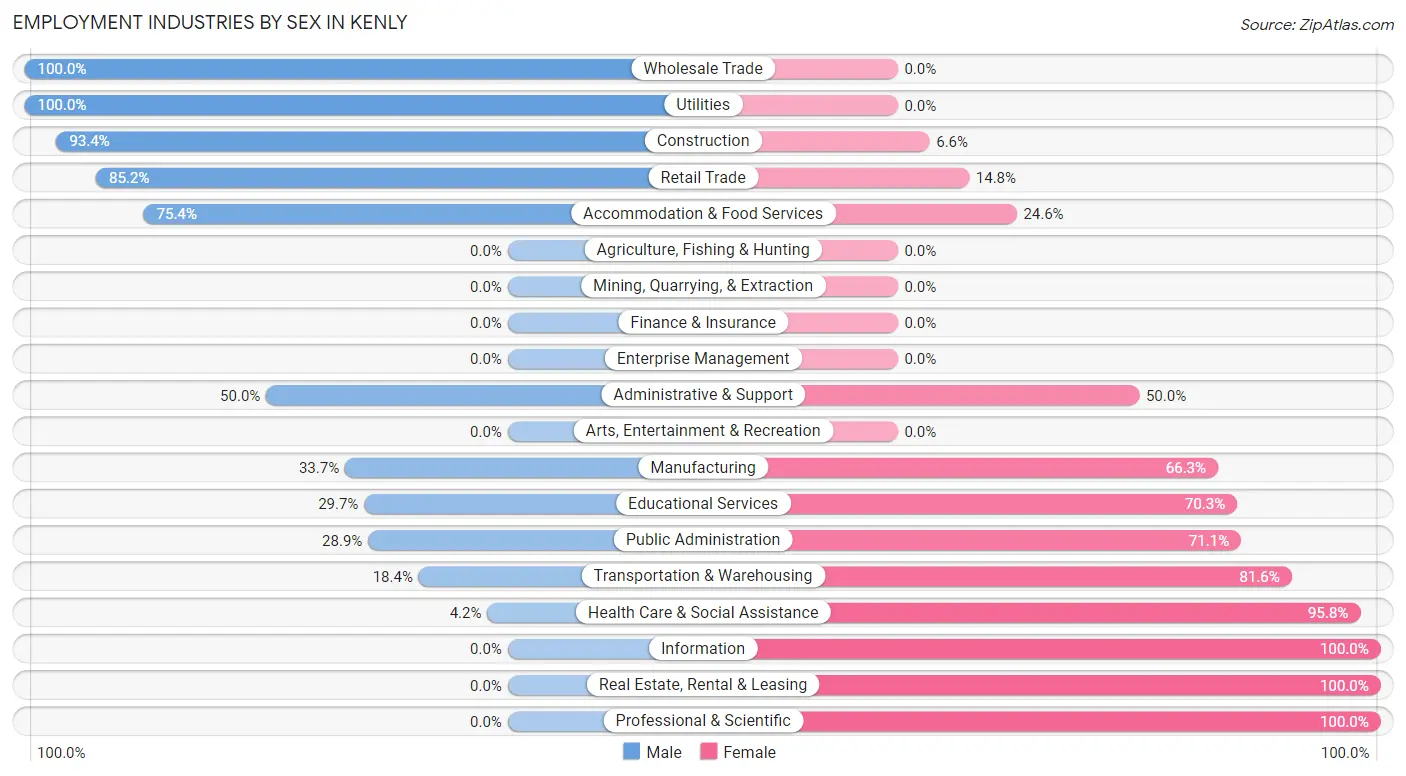
| Industry | Male | Female |
| Agriculture, Fishing & Hunting | 0 (0.0%) | 0 (0.0%) |
| Mining, Quarrying, & Extraction | 0 (0.0%) | 0 (0.0%) |
| Construction | 156 (93.4%) | 11 (6.6%) |
| Manufacturing | 32 (33.7%) | 63 (66.3%) |
| Wholesale Trade | 6 (100.0%) | 0 (0.0%) |
| Retail Trade | 121 (85.2%) | 21 (14.8%) |
| Transportation & Warehousing | 7 (18.4%) | 31 (81.6%) |
| Utilities | 14 (100.0%) | 0 (0.0%) |
| Information | 0 (0.0%) | 1 (100.0%) |
| Finance & Insurance | 0 (0.0%) | 0 (0.0%) |
| Real Estate, Rental & Leasing | 0 (0.0%) | 13 (100.0%) |
| Professional & Scientific | 0 (0.0%) | 22 (100.0%) |
| Enterprise Management | 0 (0.0%) | 0 (0.0%) |
| Administrative & Support | 16 (50.0%) | 16 (50.0%) |
| Educational Services | 41 (29.7%) | 97 (70.3%) |
| Health Care & Social Assistance | 6 (4.2%) | 136 (95.8%) |
| Arts, Entertainment & Recreation | 0 (0.0%) | 0 (0.0%) |
| Accommodation & Food Services | 52 (75.4%) | 17 (24.6%) |
| Public Administration | 13 (28.9%) | 32 (71.1%) |
| Total | 493 (50.9%) | 475 (49.1%) |
Education in Kenly
School Enrollment in Kenly
The most common levels of schooling among the 507 students in Kenly are high school (221 | 43.6%), middle school (112 | 22.1%), and kindergarten (77 | 15.2%).
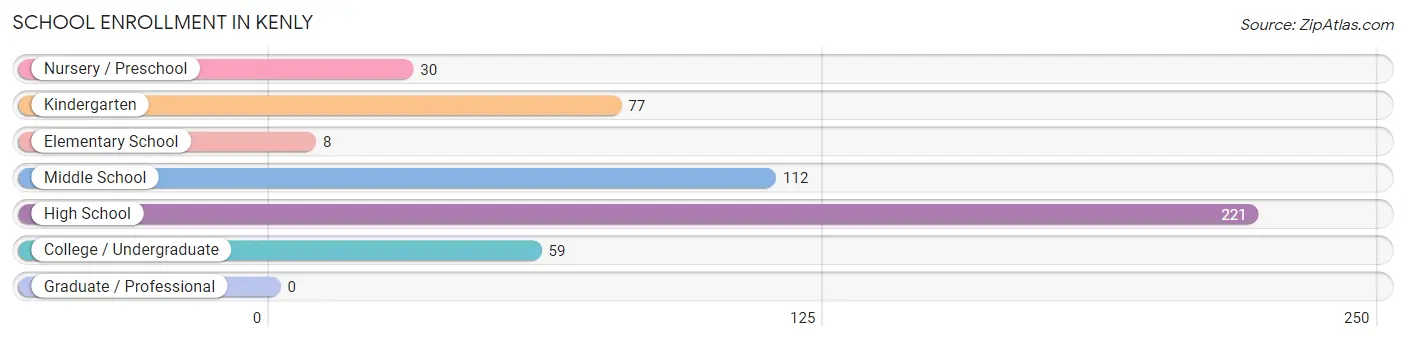
| School Level | # Students | % Students |
| Nursery / Preschool | 30 | 5.9% |
| Kindergarten | 77 | 15.2% |
| Elementary School | 8 | 1.6% |
| Middle School | 112 | 22.1% |
| High School | 221 | 43.6% |
| College / Undergraduate | 59 | 11.6% |
| Graduate / Professional | 0 | 0.0% |
| Total | 507 | 100.0% |
School Enrollment by Age by Funding Source in Kenly
Out of a total of 507 students who are enrolled in schools in Kenly, 23 (4.5%) attend a private institution, while the remaining 484 (95.5%) are enrolled in public schools. The age group of 25 to 34 year olds has the highest likelihood of being enrolled in private schools, with 12 (30.0% in the age bracket) enrolled. Conversely, the age group of 3 to 4 year olds has the lowest likelihood of being enrolled in a private school, with 25 (100.0% in the age bracket) attending a public institution.
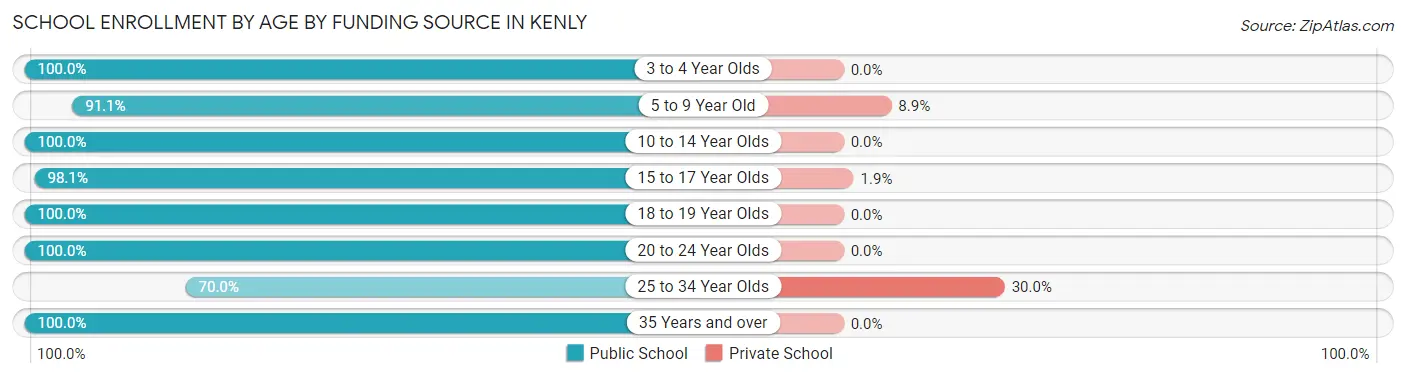
| Age Bracket | Public School | Private School |
| 3 to 4 Year Olds | 25 (100.0%) | 0 (0.0%) |
| 5 to 9 Year Old | 82 (91.1%) | 8 (8.9%) |
| 10 to 14 Year Olds | 172 (100.0%) | 0 (0.0%) |
| 15 to 17 Year Olds | 158 (98.1%) | 3 (1.9%) |
| 18 to 19 Year Olds | 7 (100.0%) | 0 (0.0%) |
| 20 to 24 Year Olds | 6 (100.0%) | 0 (0.0%) |
| 25 to 34 Year Olds | 28 (70.0%) | 12 (30.0%) |
| 35 Years and over | 6 (100.0%) | 0 (0.0%) |
| Total | 484 (95.5%) | 23 (4.5%) |
Educational Attainment by Field of Study in Kenly
Arts & humanities (34 | 19.2%), education (26 | 14.7%), business (23 | 13.0%), liberal arts & history (17 | 9.6%), and visual & performing arts (16 | 9.0%) are the most common fields of study among 177 individuals in Kenly who have obtained a bachelor's degree or higher.
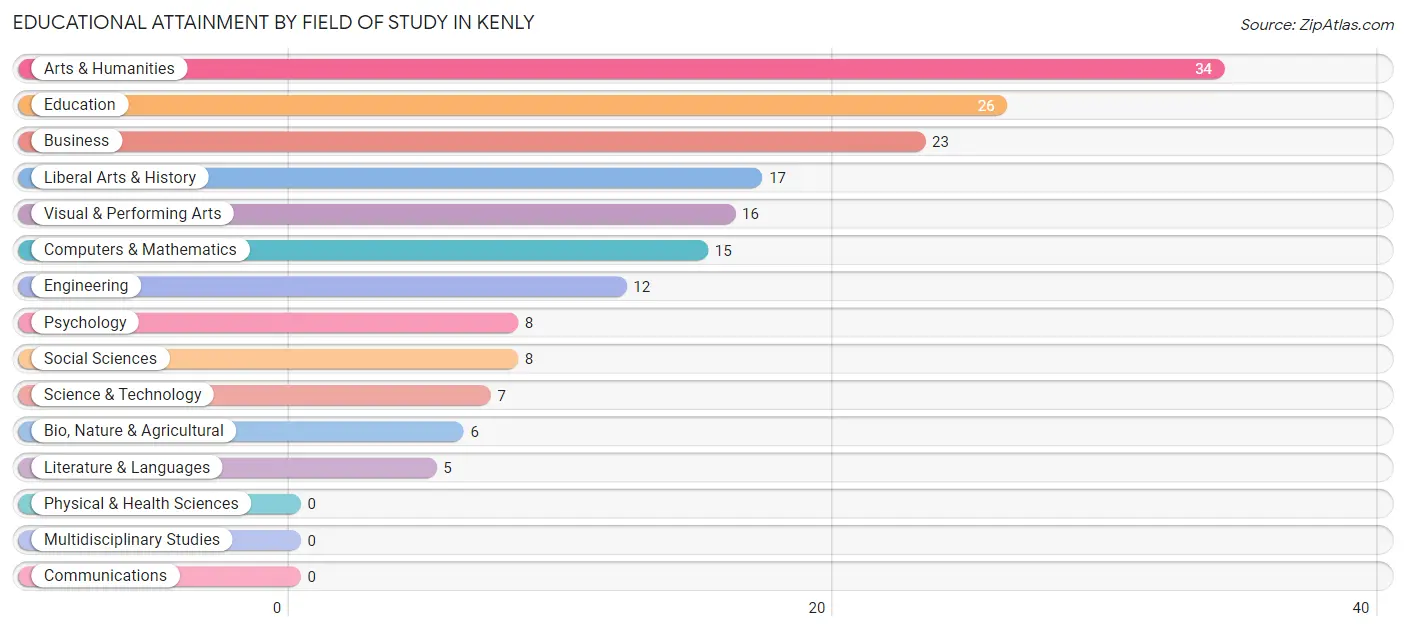
| Field of Study | # Graduates | % Graduates |
| Computers & Mathematics | 15 | 8.5% |
| Bio, Nature & Agricultural | 6 | 3.4% |
| Physical & Health Sciences | 0 | 0.0% |
| Psychology | 8 | 4.5% |
| Social Sciences | 8 | 4.5% |
| Engineering | 12 | 6.8% |
| Multidisciplinary Studies | 0 | 0.0% |
| Science & Technology | 7 | 4.0% |
| Business | 23 | 13.0% |
| Education | 26 | 14.7% |
| Literature & Languages | 5 | 2.8% |
| Liberal Arts & History | 17 | 9.6% |
| Visual & Performing Arts | 16 | 9.0% |
| Communications | 0 | 0.0% |
| Arts & Humanities | 34 | 19.2% |
| Total | 177 | 100.0% |
Transportation & Commute in Kenly
Vehicle Availability by Sex in Kenly
The most prevalent vehicle ownership categories in Kenly are males with 2 vehicles (158, accounting for 33.3%) and females with 2 vehicles (220, making up 36.0%).
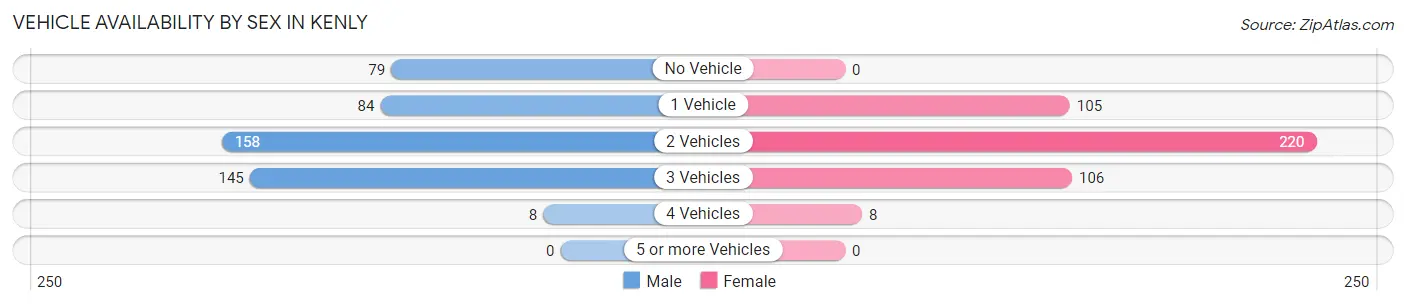
| Vehicles Available | Male | Female |
| No Vehicle | 79 (16.7%) | 0 (0.0%) |
| 1 Vehicle | 84 (17.7%) | 105 (23.9%) |
| 2 Vehicles | 158 (33.3%) | 220 (50.1%) |
| 3 Vehicles | 145 (30.6%) | 106 (24.1%) |
| 4 Vehicles | 8 (1.7%) | 8 (1.8%) |
| 5 or more Vehicles | 0 (0.0%) | 0 (0.0%) |
| Total | 474 (100.0%) | 439 (100.0%) |
Commute Time in Kenly
The most frequently occuring commute durations in Kenly are 10 to 14 minutes (154 commuters, 17.3%), 15 to 19 minutes (144 commuters, 16.2%), and 60 to 89 minutes (113 commuters, 12.7%).
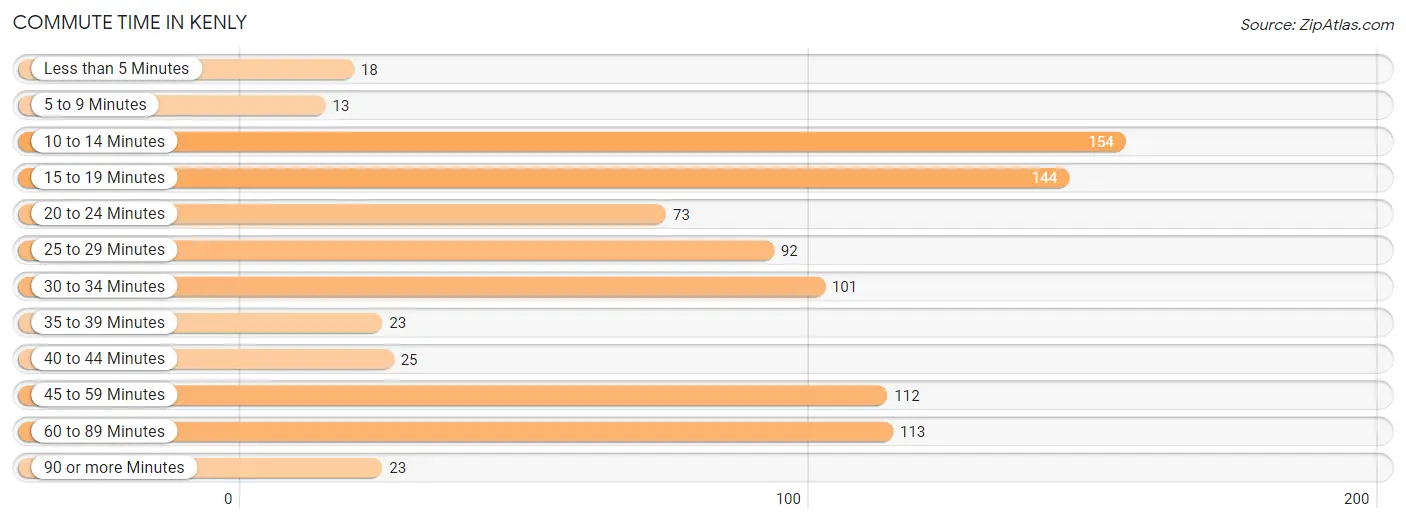
| Commute Time | # Commuters | % Commuters |
| Less than 5 Minutes | 18 | 2.0% |
| 5 to 9 Minutes | 13 | 1.5% |
| 10 to 14 Minutes | 154 | 17.3% |
| 15 to 19 Minutes | 144 | 16.2% |
| 20 to 24 Minutes | 73 | 8.2% |
| 25 to 29 Minutes | 92 | 10.3% |
| 30 to 34 Minutes | 101 | 11.3% |
| 35 to 39 Minutes | 23 | 2.6% |
| 40 to 44 Minutes | 25 | 2.8% |
| 45 to 59 Minutes | 112 | 12.6% |
| 60 to 89 Minutes | 113 | 12.7% |
| 90 or more Minutes | 23 | 2.6% |
Commute Time by Sex in Kenly
The most common commute times in Kenly are 10 to 14 minutes (150 commuters, 32.7%) for males and 15 to 19 minutes (80 commuters, 18.5%) for females.
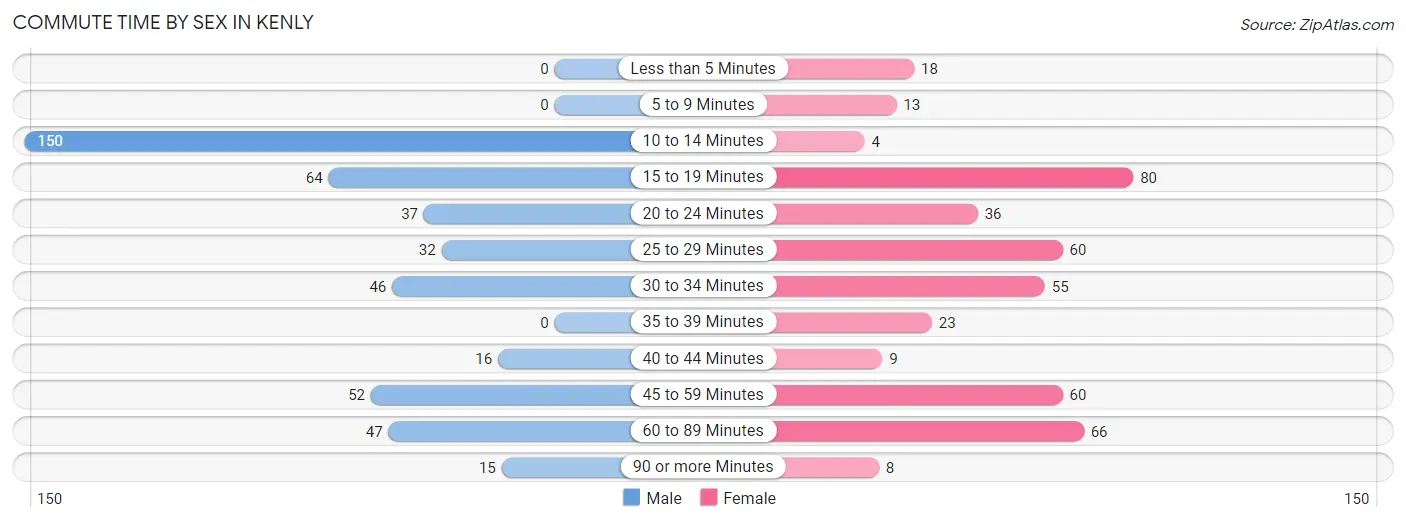
| Commute Time | Male | Female |
| Less than 5 Minutes | 0 (0.0%) | 18 (4.2%) |
| 5 to 9 Minutes | 0 (0.0%) | 13 (3.0%) |
| 10 to 14 Minutes | 150 (32.7%) | 4 (0.9%) |
| 15 to 19 Minutes | 64 (13.9%) | 80 (18.5%) |
| 20 to 24 Minutes | 37 (8.1%) | 36 (8.3%) |
| 25 to 29 Minutes | 32 (7.0%) | 60 (13.9%) |
| 30 to 34 Minutes | 46 (10.0%) | 55 (12.7%) |
| 35 to 39 Minutes | 0 (0.0%) | 23 (5.3%) |
| 40 to 44 Minutes | 16 (3.5%) | 9 (2.1%) |
| 45 to 59 Minutes | 52 (11.3%) | 60 (13.9%) |
| 60 to 89 Minutes | 47 (10.2%) | 66 (15.3%) |
| 90 or more Minutes | 15 (3.3%) | 8 (1.8%) |
Time of Departure to Work by Sex in Kenly
The most frequent times of departure to work in Kenly are 4:00 PM to 11:59 PM (95, 20.7%) for males and 8:00 AM to 8:29 AM (95, 22.0%) for females.
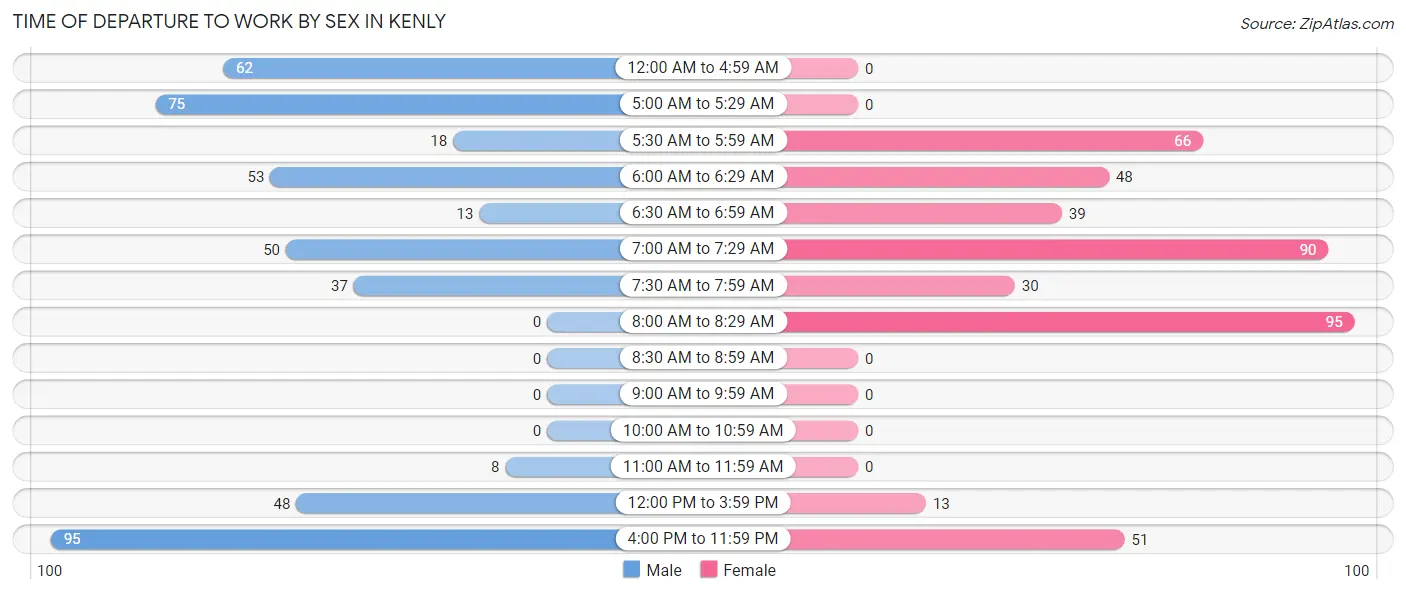
| Time of Departure | Male | Female |
| 12:00 AM to 4:59 AM | 62 (13.5%) | 0 (0.0%) |
| 5:00 AM to 5:29 AM | 75 (16.3%) | 0 (0.0%) |
| 5:30 AM to 5:59 AM | 18 (3.9%) | 66 (15.3%) |
| 6:00 AM to 6:29 AM | 53 (11.6%) | 48 (11.1%) |
| 6:30 AM to 6:59 AM | 13 (2.8%) | 39 (9.0%) |
| 7:00 AM to 7:29 AM | 50 (10.9%) | 90 (20.8%) |
| 7:30 AM to 7:59 AM | 37 (8.1%) | 30 (6.9%) |
| 8:00 AM to 8:29 AM | 0 (0.0%) | 95 (22.0%) |
| 8:30 AM to 8:59 AM | 0 (0.0%) | 0 (0.0%) |
| 9:00 AM to 9:59 AM | 0 (0.0%) | 0 (0.0%) |
| 10:00 AM to 10:59 AM | 0 (0.0%) | 0 (0.0%) |
| 11:00 AM to 11:59 AM | 8 (1.7%) | 0 (0.0%) |
| 12:00 PM to 3:59 PM | 48 (10.5%) | 13 (3.0%) |
| 4:00 PM to 11:59 PM | 95 (20.7%) | 51 (11.8%) |
| Total | 459 (100.0%) | 432 (100.0%) |
Housing Occupancy in Kenly
Occupancy by Ownership in Kenly
Of the total 947 dwellings in Kenly, owner-occupied units account for 511 (54.0%), while renter-occupied units make up 436 (46.0%).
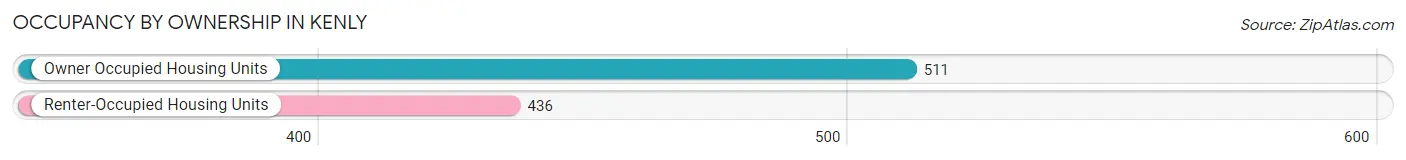
| Occupancy | # Housing Units | % Housing Units |
| Owner Occupied Housing Units | 511 | 54.0% |
| Renter-Occupied Housing Units | 436 | 46.0% |
| Total Occupied Housing Units | 947 | 100.0% |
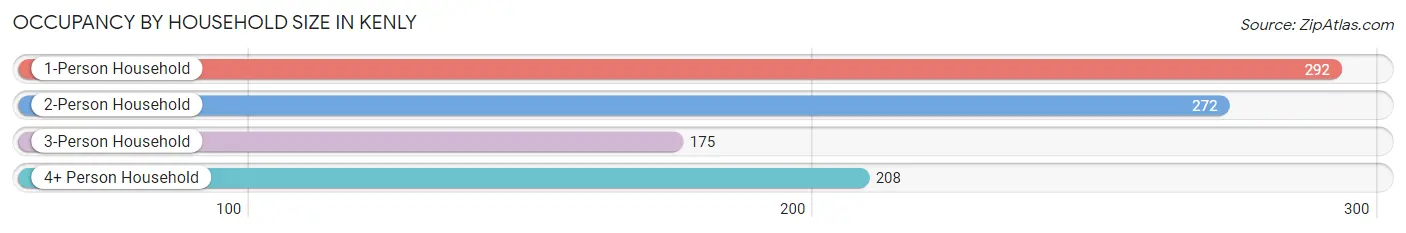
Occupancy by Household Size in Kenly
| Household Size | # Housing Units | % Housing Units |
| 1-Person Household | 292 | 30.8% |
| 2-Person Household | 272 | 28.7% |
| 3-Person Household | 175 | 18.5% |
| 4+ Person Household | 208 | 22.0% |
| Total Housing Units | 947 | 100.0% |
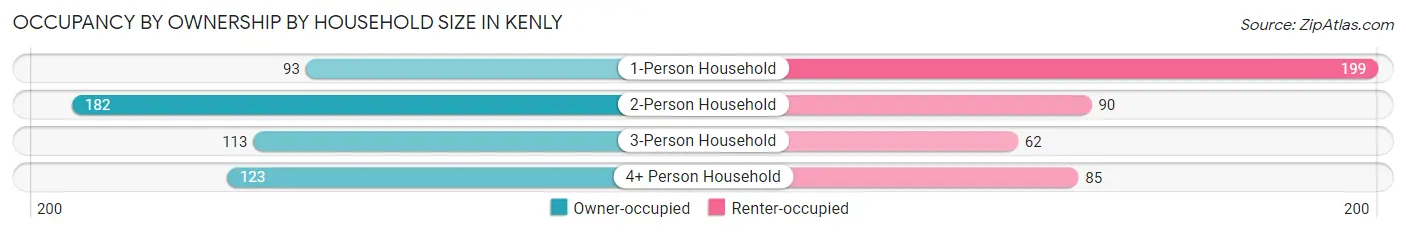
Occupancy by Ownership by Household Size in Kenly
| Household Size | Owner-occupied | Renter-occupied |
| 1-Person Household | 93 (31.9%) | 199 (68.1%) |
| 2-Person Household | 182 (66.9%) | 90 (33.1%) |
| 3-Person Household | 113 (64.6%) | 62 (35.4%) |
| 4+ Person Household | 123 (59.1%) | 85 (40.9%) |
| Total Housing Units | 511 (54.0%) | 436 (46.0%) |
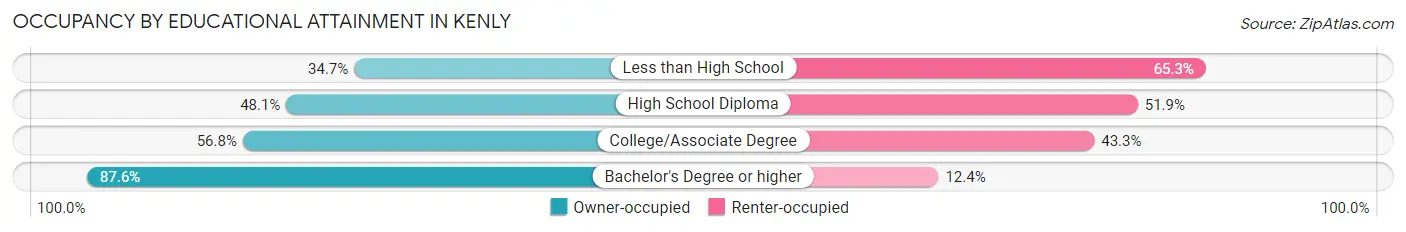
Occupancy by Educational Attainment in Kenly
| Household Size | Owner-occupied | Renter-occupied |
| Less than High School | 52 (34.7%) | 98 (65.3%) |
| High School Diploma | 116 (48.1%) | 125 (51.9%) |
| College/Associate Degree | 265 (56.8%) | 202 (43.2%) |
| Bachelor's Degree or higher | 78 (87.6%) | 11 (12.4%) |
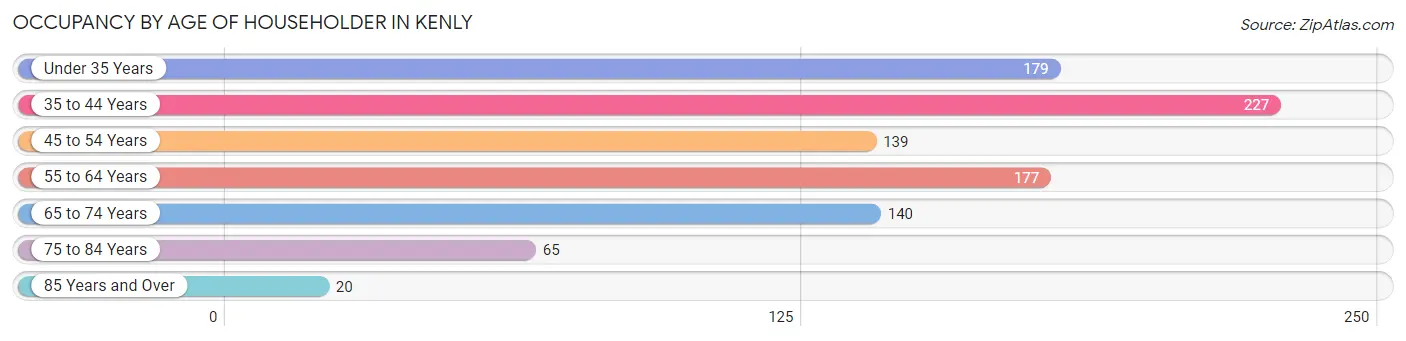
Occupancy by Age of Householder in Kenly
| Age Bracket | # Households | % Households |
| Under 35 Years | 179 | 18.9% |
| 35 to 44 Years | 227 | 24.0% |
| 45 to 54 Years | 139 | 14.7% |
| 55 to 64 Years | 177 | 18.7% |
| 65 to 74 Years | 140 | 14.8% |
| 75 to 84 Years | 65 | 6.9% |
| 85 Years and Over | 20 | 2.1% |
| Total | 947 | 100.0% |
Housing Finances in Kenly
Median Income by Occupancy in Kenly
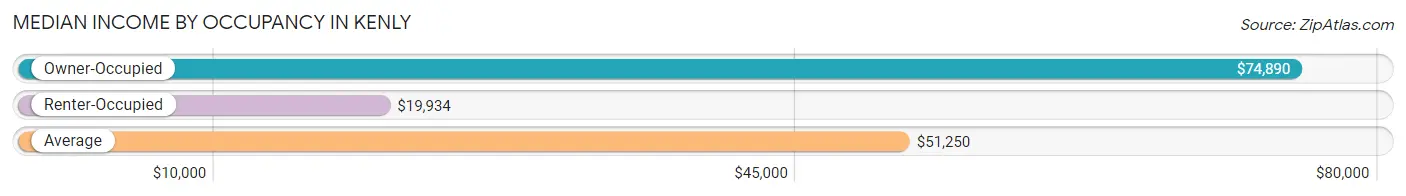
| Occupancy Type | # Households | Median Income |
| Owner-Occupied | 511 (54.0%) | $74,890 |
| Renter-Occupied | 436 (46.0%) | $19,934 |
| Average | 947 (100.0%) | $51,250 |
Occupancy by Householder Income Bracket in Kenly
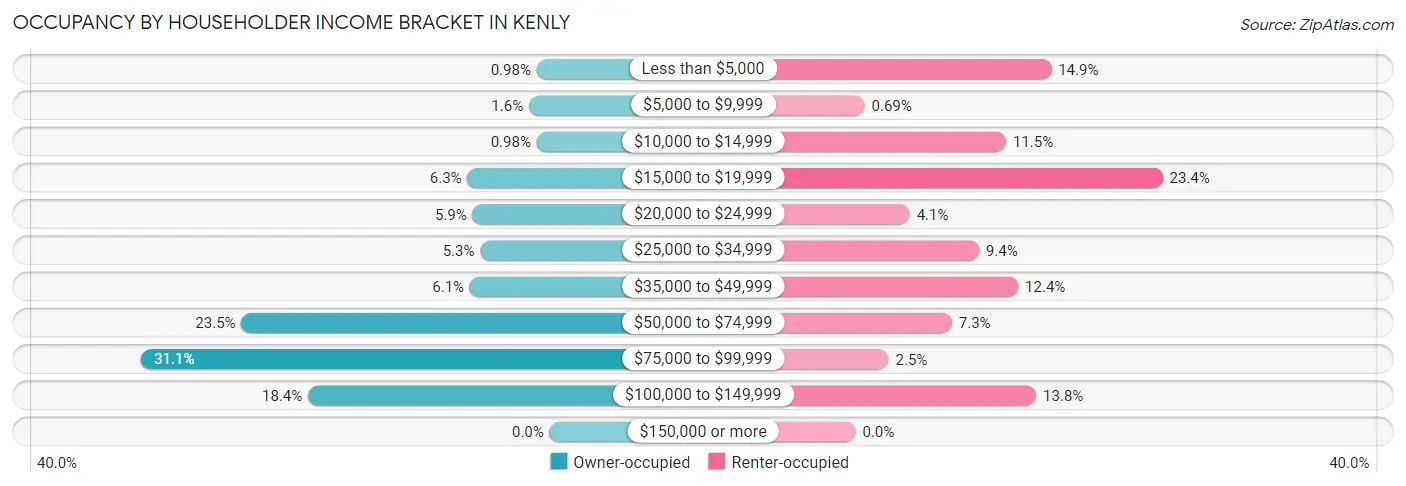
| Income Bracket | Owner-occupied | Renter-occupied |
| Less than $5,000 | 5 (1.0%) | 65 (14.9%) |
| $5,000 to $9,999 | 8 (1.6%) | 3 (0.7%) |
| $10,000 to $14,999 | 5 (1.0%) | 50 (11.5%) |
| $15,000 to $19,999 | 32 (6.3%) | 102 (23.4%) |
| $20,000 to $24,999 | 30 (5.9%) | 18 (4.1%) |
| $25,000 to $34,999 | 27 (5.3%) | 41 (9.4%) |
| $35,000 to $49,999 | 31 (6.1%) | 54 (12.4%) |
| $50,000 to $74,999 | 120 (23.5%) | 32 (7.3%) |
| $75,000 to $99,999 | 159 (31.1%) | 11 (2.5%) |
| $100,000 to $149,999 | 94 (18.4%) | 60 (13.8%) |
| $150,000 or more | 0 (0.0%) | 0 (0.0%) |
| Total | 511 (100.0%) | 436 (100.0%) |
Monthly Housing Cost Tiers in Kenly
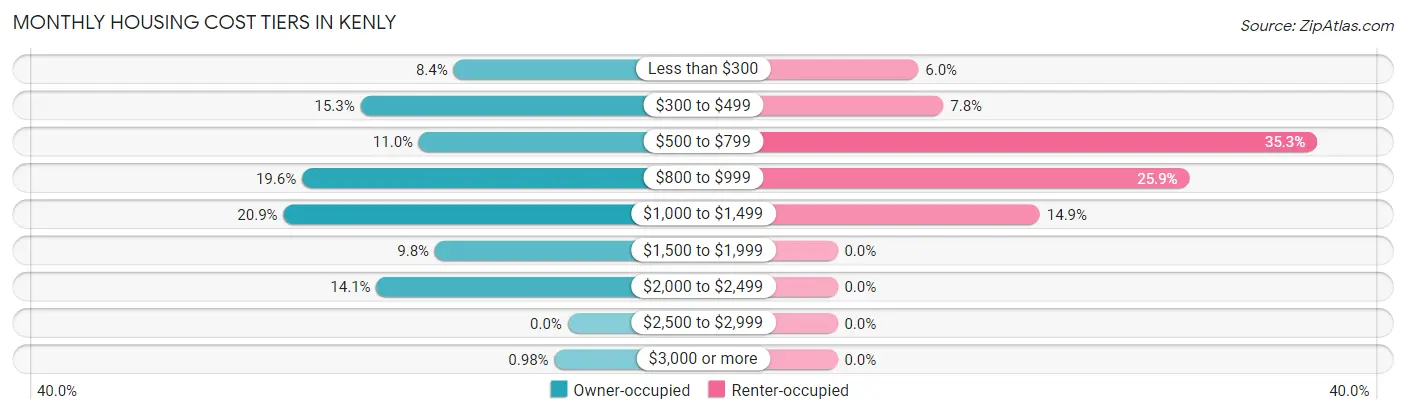
| Monthly Cost | Owner-occupied | Renter-occupied |
| Less than $300 | 43 (8.4%) | 26 (6.0%) |
| $300 to $499 | 78 (15.3%) | 34 (7.8%) |
| $500 to $799 | 56 (11.0%) | 154 (35.3%) |
| $800 to $999 | 100 (19.6%) | 113 (25.9%) |
| $1,000 to $1,499 | 107 (20.9%) | 65 (14.9%) |
| $1,500 to $1,999 | 50 (9.8%) | 0 (0.0%) |
| $2,000 to $2,499 | 72 (14.1%) | 0 (0.0%) |
| $2,500 to $2,999 | 0 (0.0%) | 0 (0.0%) |
| $3,000 or more | 5 (1.0%) | 0 (0.0%) |
| Total | 511 (100.0%) | 436 (100.0%) |
Physical Housing Characteristics in Kenly
Housing Structures in Kenly
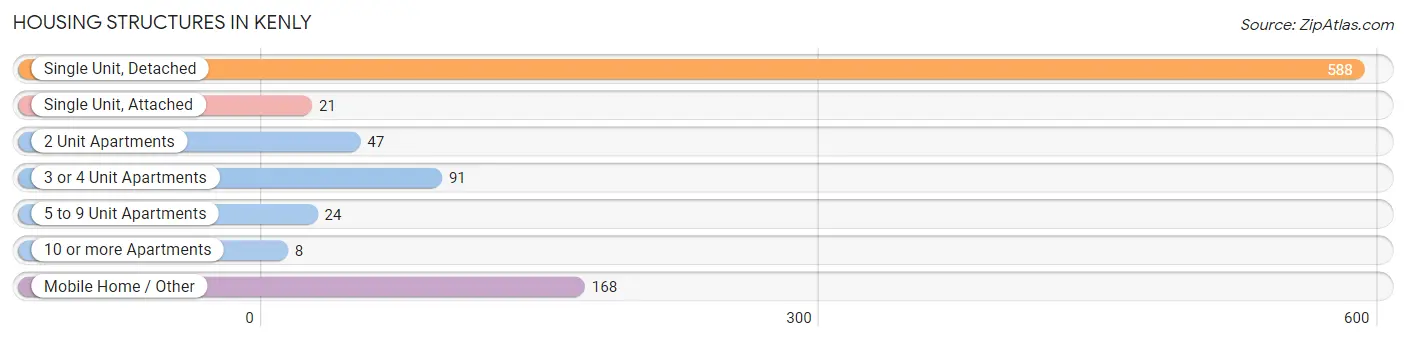
| Structure Type | # Housing Units | % Housing Units |
| Single Unit, Detached | 588 | 62.1% |
| Single Unit, Attached | 21 | 2.2% |
| 2 Unit Apartments | 47 | 5.0% |
| 3 or 4 Unit Apartments | 91 | 9.6% |
| 5 to 9 Unit Apartments | 24 | 2.5% |
| 10 or more Apartments | 8 | 0.8% |
| Mobile Home / Other | 168 | 17.7% |
| Total | 947 | 100.0% |
Housing Structures by Occupancy in Kenly
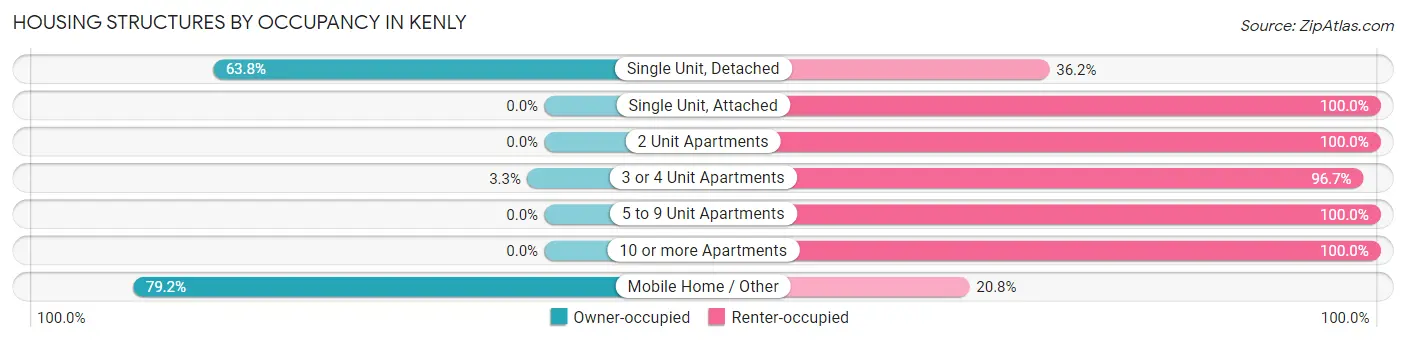
| Structure Type | Owner-occupied | Renter-occupied |
| Single Unit, Detached | 375 (63.8%) | 213 (36.2%) |
| Single Unit, Attached | 0 (0.0%) | 21 (100.0%) |
| 2 Unit Apartments | 0 (0.0%) | 47 (100.0%) |
| 3 or 4 Unit Apartments | 3 (3.3%) | 88 (96.7%) |
| 5 to 9 Unit Apartments | 0 (0.0%) | 24 (100.0%) |
| 10 or more Apartments | 0 (0.0%) | 8 (100.0%) |
| Mobile Home / Other | 133 (79.2%) | 35 (20.8%) |
| Total | 511 (54.0%) | 436 (46.0%) |
Housing Structures by Number of Rooms in Kenly
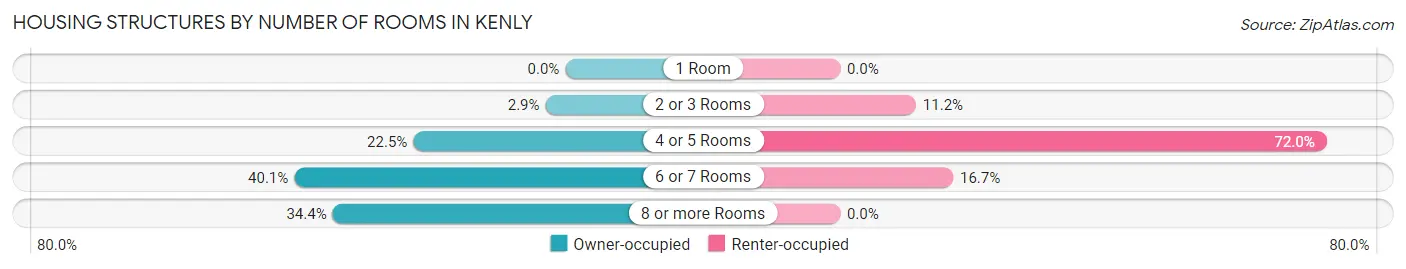
| Number of Rooms | Owner-occupied | Renter-occupied |
| 1 Room | 0 (0.0%) | 0 (0.0%) |
| 2 or 3 Rooms | 15 (2.9%) | 49 (11.2%) |
| 4 or 5 Rooms | 115 (22.5%) | 314 (72.0%) |
| 6 or 7 Rooms | 205 (40.1%) | 73 (16.7%) |
| 8 or more Rooms | 176 (34.4%) | 0 (0.0%) |
| Total | 511 (100.0%) | 436 (100.0%) |
Housing Structure by Heating Type in Kenly
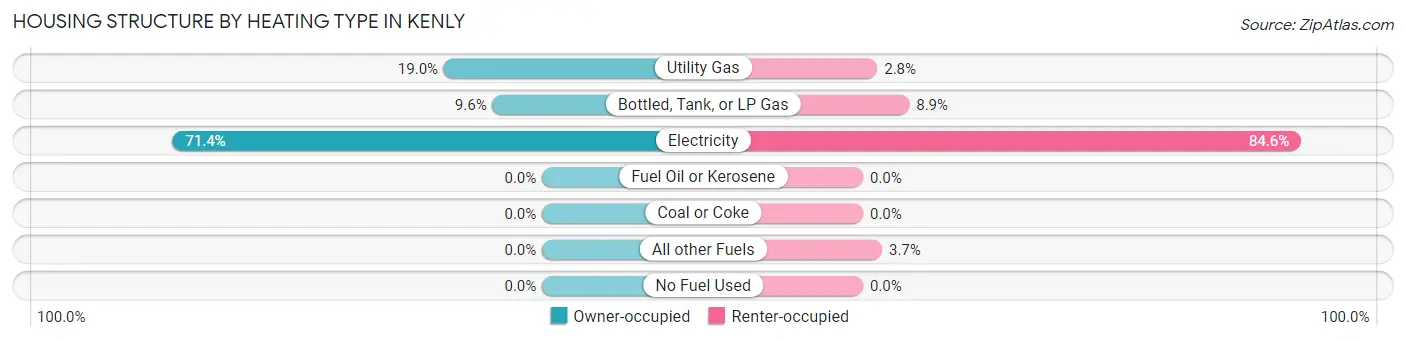
| Heating Type | Owner-occupied | Renter-occupied |
| Utility Gas | 97 (19.0%) | 12 (2.8%) |
| Bottled, Tank, or LP Gas | 49 (9.6%) | 39 (8.9%) |
| Electricity | 365 (71.4%) | 369 (84.6%) |
| Fuel Oil or Kerosene | 0 (0.0%) | 0 (0.0%) |
| Coal or Coke | 0 (0.0%) | 0 (0.0%) |
| All other Fuels | 0 (0.0%) | 16 (3.7%) |
| No Fuel Used | 0 (0.0%) | 0 (0.0%) |
| Total | 511 (100.0%) | 436 (100.0%) |
Household Vehicle Usage in Kenly
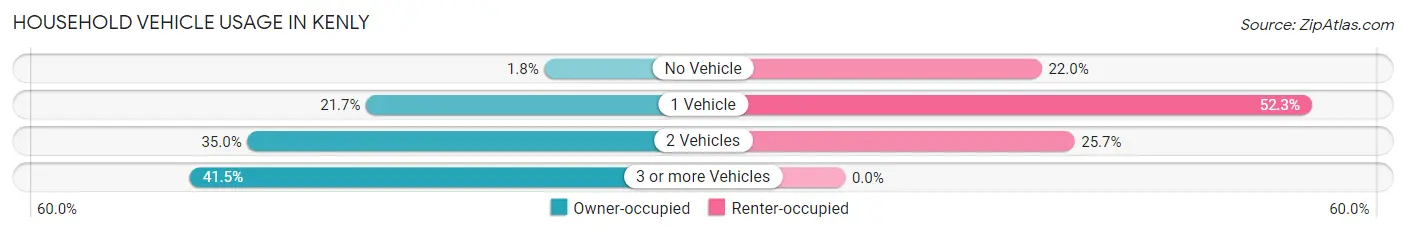
| Vehicles per Household | Owner-occupied | Renter-occupied |
| No Vehicle | 9 (1.8%) | 96 (22.0%) |
| 1 Vehicle | 111 (21.7%) | 228 (52.3%) |
| 2 Vehicles | 179 (35.0%) | 112 (25.7%) |
| 3 or more Vehicles | 212 (41.5%) | 0 (0.0%) |
| Total | 511 (100.0%) | 436 (100.0%) |
Real Estate & Mortgages in Kenly
Real Estate and Mortgage Overview in Kenly
| Characteristic | Without Mortgage | With Mortgage |
| Housing Units | 184 | 327 |
| Median Property Value | $86,300 | $184,700 |
| Median Household Income | $65,682 | $0 |
| Monthly Housing Costs | $452 | $5 |
| Real Estate Taxes | $883 | $30 |
Property Value by Mortgage Status in Kenly
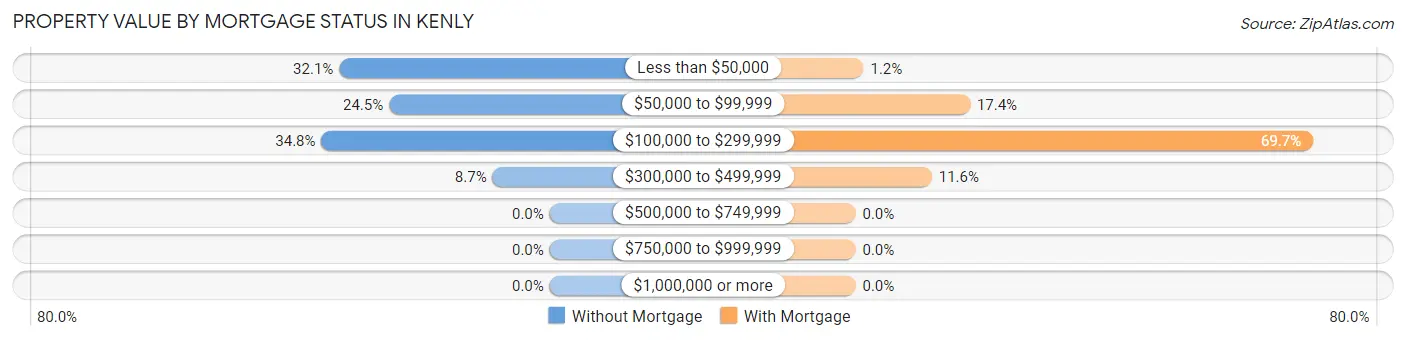
| Property Value | Without Mortgage | With Mortgage |
| Less than $50,000 | 59 (32.1%) | 4 (1.2%) |
| $50,000 to $99,999 | 45 (24.5%) | 57 (17.4%) |
| $100,000 to $299,999 | 64 (34.8%) | 228 (69.7%) |
| $300,000 to $499,999 | 16 (8.7%) | 38 (11.6%) |
| $500,000 to $749,999 | 0 (0.0%) | 0 (0.0%) |
| $750,000 to $999,999 | 0 (0.0%) | 0 (0.0%) |
| $1,000,000 or more | 0 (0.0%) | 0 (0.0%) |
| Total | 184 (100.0%) | 327 (100.0%) |
Household Income by Mortgage Status in Kenly
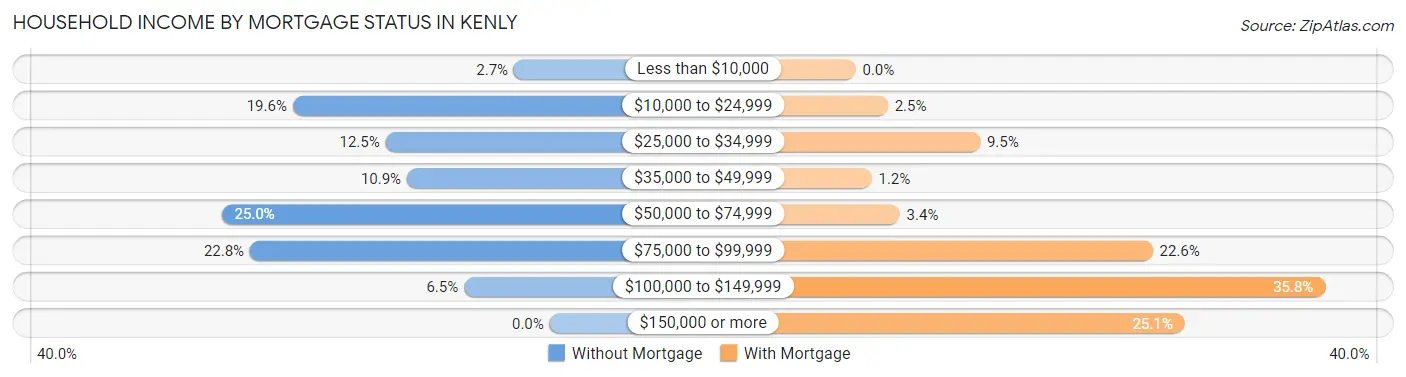
| Household Income | Without Mortgage | With Mortgage |
| Less than $10,000 | 5 (2.7%) | 0 (0.0%) |
| $10,000 to $24,999 | 36 (19.6%) | 8 (2.5%) |
| $25,000 to $34,999 | 23 (12.5%) | 31 (9.5%) |
| $35,000 to $49,999 | 20 (10.9%) | 4 (1.2%) |
| $50,000 to $74,999 | 46 (25.0%) | 11 (3.4%) |
| $75,000 to $99,999 | 42 (22.8%) | 74 (22.6%) |
| $100,000 to $149,999 | 12 (6.5%) | 117 (35.8%) |
| $150,000 or more | 0 (0.0%) | 82 (25.1%) |
| Total | 184 (100.0%) | 327 (100.0%) |
Property Value to Household Income Ratio in Kenly
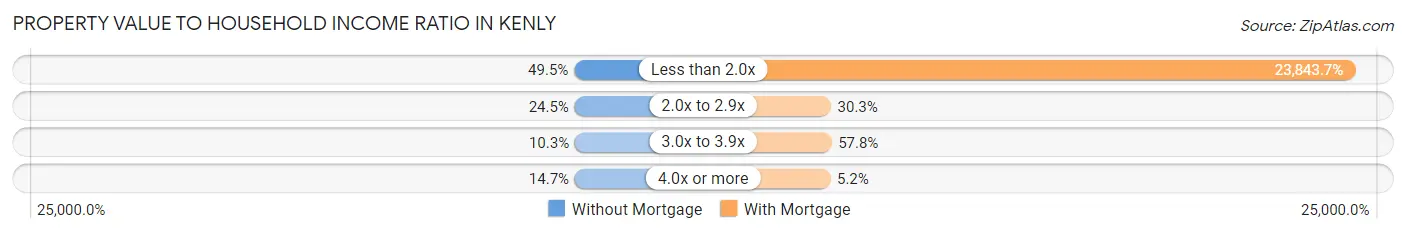
| Value-to-Income Ratio | Without Mortgage | With Mortgage |
| Less than 2.0x | 91 (49.5%) | 77,969 (23,843.7%) |
| 2.0x to 2.9x | 45 (24.5%) | 99 (30.3%) |
| 3.0x to 3.9x | 19 (10.3%) | 189 (57.8%) |
| 4.0x or more | 27 (14.7%) | 17 (5.2%) |
| Total | 184 (100.0%) | 327 (100.0%) |
Real Estate Taxes by Mortgage Status in Kenly
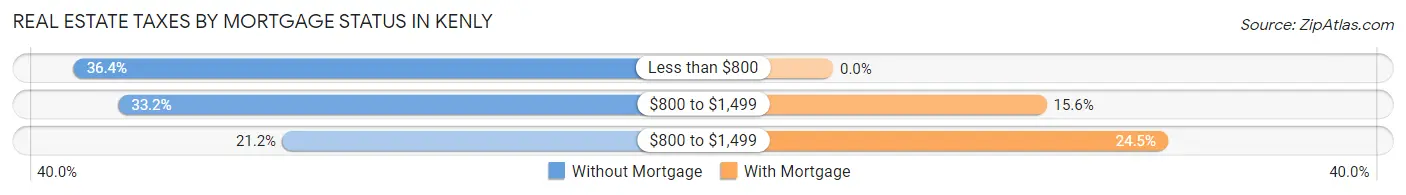
| Property Taxes | Without Mortgage | With Mortgage |
| Less than $800 | 67 (36.4%) | 0 (0.0%) |
| $800 to $1,499 | 61 (33.2%) | 51 (15.6%) |
| $800 to $1,499 | 39 (21.2%) | 80 (24.5%) |
| Total | 184 (100.0%) | 327 (100.0%) |
Health & Disability in Kenly
Health Insurance Coverage by Age in Kenly
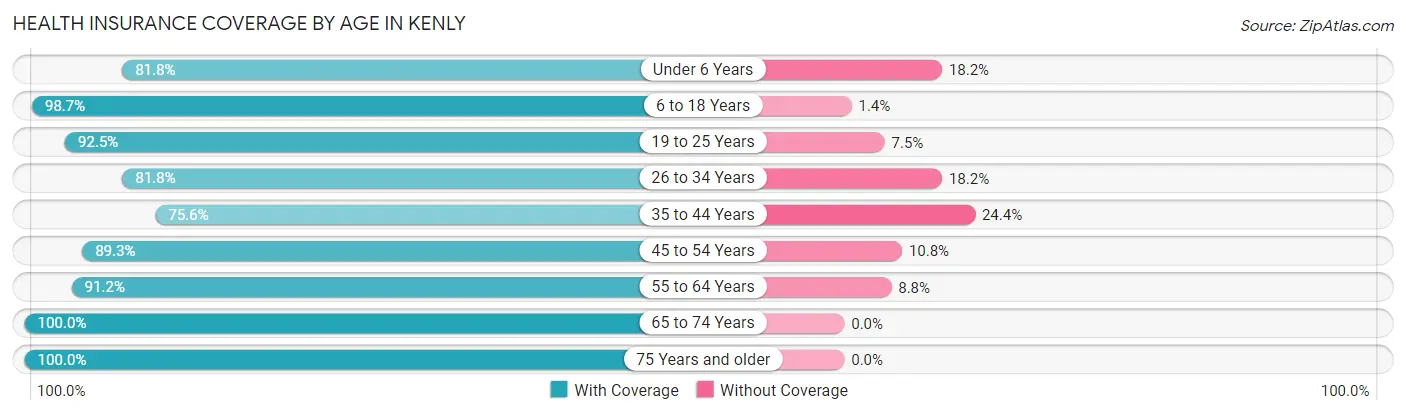
| Age Bracket | With Coverage | Without Coverage |
| Under 6 Years | 256 (81.8%) | 57 (18.2%) |
| 6 to 18 Years | 437 (98.7%) | 6 (1.3%) |
| 19 to 25 Years | 209 (92.5%) | 17 (7.5%) |
| 26 to 34 Years | 175 (81.8%) | 39 (18.2%) |
| 35 to 44 Years | 298 (75.6%) | 96 (24.4%) |
| 45 to 54 Years | 191 (89.2%) | 23 (10.7%) |
| 55 to 64 Years | 323 (91.2%) | 31 (8.8%) |
| 65 to 74 Years | 188 (100.0%) | 0 (0.0%) |
| 75 Years and older | 181 (100.0%) | 0 (0.0%) |
| Total | 2,258 (89.3%) | 269 (10.6%) |
Health Insurance Coverage by Citizenship Status in Kenly
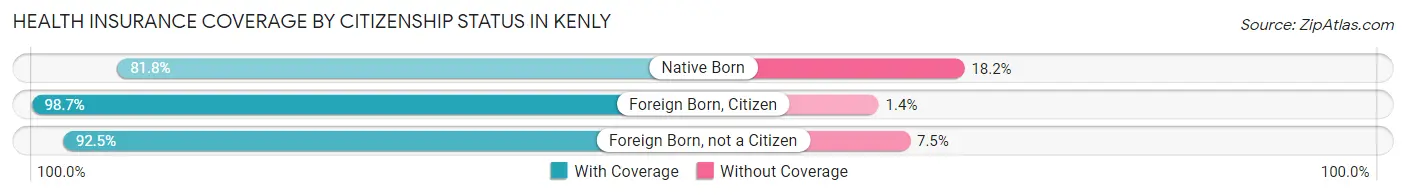
| Citizenship Status | With Coverage | Without Coverage |
| Native Born | 256 (81.8%) | 57 (18.2%) |
| Foreign Born, Citizen | 437 (98.7%) | 6 (1.3%) |
| Foreign Born, not a Citizen | 209 (92.5%) | 17 (7.5%) |
Health Insurance Coverage by Household Income in Kenly
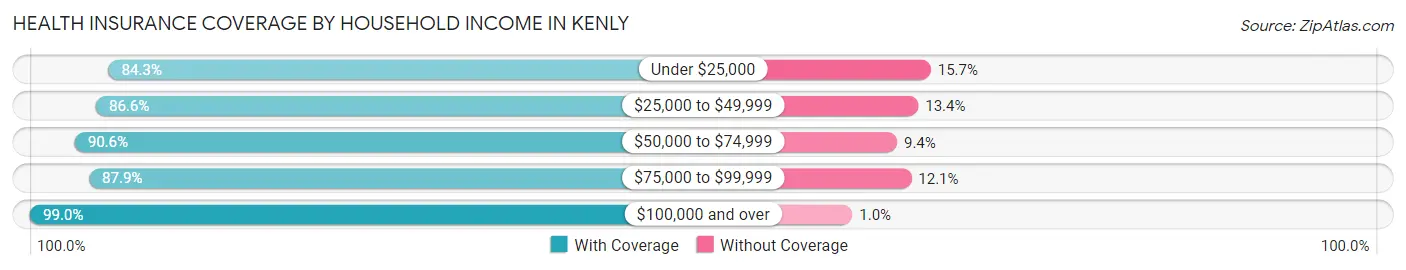
| Household Income | With Coverage | Without Coverage |
| Under $25,000 | 514 (84.3%) | 96 (15.7%) |
| $25,000 to $49,999 | 330 (86.6%) | 51 (13.4%) |
| $50,000 to $74,999 | 356 (90.6%) | 37 (9.4%) |
| $75,000 to $99,999 | 581 (87.9%) | 80 (12.1%) |
| $100,000 and over | 477 (99.0%) | 5 (1.0%) |
Public vs Private Health Insurance Coverage by Age in Kenly
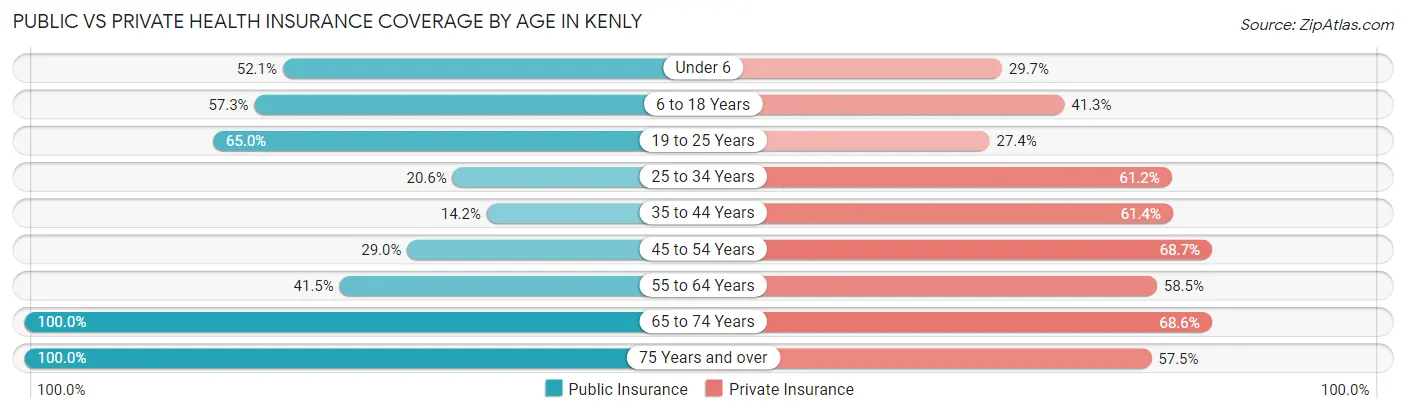
| Age Bracket | Public Insurance | Private Insurance |
| Under 6 | 163 (52.1%) | 93 (29.7%) |
| 6 to 18 Years | 254 (57.3%) | 183 (41.3%) |
| 19 to 25 Years | 147 (65.0%) | 62 (27.4%) |
| 25 to 34 Years | 44 (20.6%) | 131 (61.2%) |
| 35 to 44 Years | 56 (14.2%) | 242 (61.4%) |
| 45 to 54 Years | 62 (29.0%) | 147 (68.7%) |
| 55 to 64 Years | 147 (41.5%) | 207 (58.5%) |
| 65 to 74 Years | 188 (100.0%) | 129 (68.6%) |
| 75 Years and over | 181 (100.0%) | 104 (57.5%) |
| Total | 1,242 (49.1%) | 1,298 (51.4%) |
Disability Status by Sex by Age in Kenly
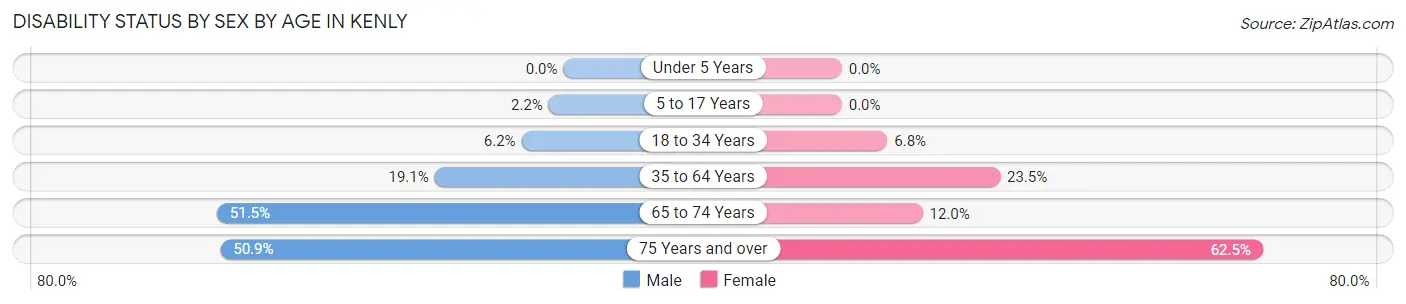
| Age Bracket | Male | Female |
| Under 5 Years | 0 (0.0%) | 0 (0.0%) |
| 5 to 17 Years | 5 (2.2%) | 0 (0.0%) |
| 18 to 34 Years | 14 (6.2%) | 15 (6.8%) |
| 35 to 64 Years | 79 (19.1%) | 129 (23.5%) |
| 65 to 74 Years | 71 (51.4%) | 6 (12.0%) |
| 75 Years and over | 27 (50.9%) | 80 (62.5%) |
Disability Class by Sex by Age in Kenly
Disability Class: Hearing Difficulty
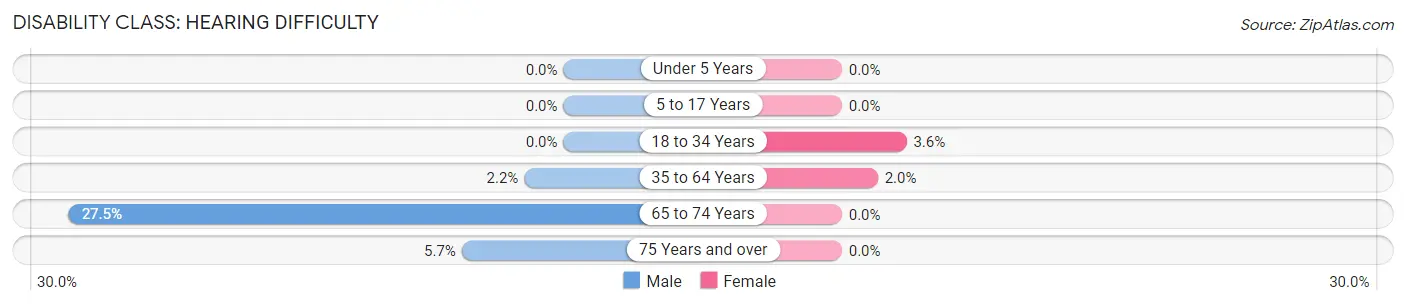
| Age Bracket | Male | Female |
| Under 5 Years | 0 (0.0%) | 0 (0.0%) |
| 5 to 17 Years | 0 (0.0%) | 0 (0.0%) |
| 18 to 34 Years | 0 (0.0%) | 8 (3.6%) |
| 35 to 64 Years | 9 (2.2%) | 11 (2.0%) |
| 65 to 74 Years | 38 (27.5%) | 0 (0.0%) |
| 75 Years and over | 3 (5.7%) | 0 (0.0%) |
Disability Class: Vision Difficulty
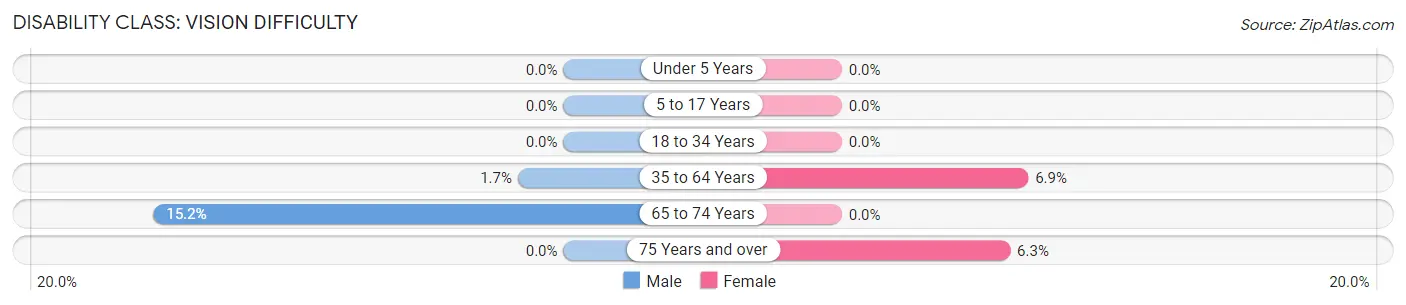
| Age Bracket | Male | Female |
| Under 5 Years | 0 (0.0%) | 0 (0.0%) |
| 5 to 17 Years | 0 (0.0%) | 0 (0.0%) |
| 18 to 34 Years | 0 (0.0%) | 0 (0.0%) |
| 35 to 64 Years | 7 (1.7%) | 38 (6.9%) |
| 65 to 74 Years | 21 (15.2%) | 0 (0.0%) |
| 75 Years and over | 0 (0.0%) | 8 (6.2%) |
Disability Class: Cognitive Difficulty
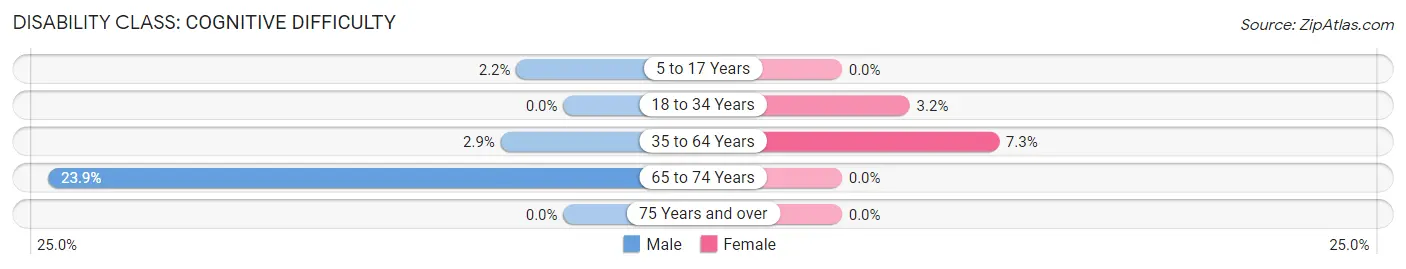
| Age Bracket | Male | Female |
| 5 to 17 Years | 5 (2.2%) | 0 (0.0%) |
| 18 to 34 Years | 0 (0.0%) | 7 (3.2%) |
| 35 to 64 Years | 12 (2.9%) | 40 (7.3%) |
| 65 to 74 Years | 33 (23.9%) | 0 (0.0%) |
| 75 Years and over | 0 (0.0%) | 0 (0.0%) |
Disability Class: Ambulatory Difficulty
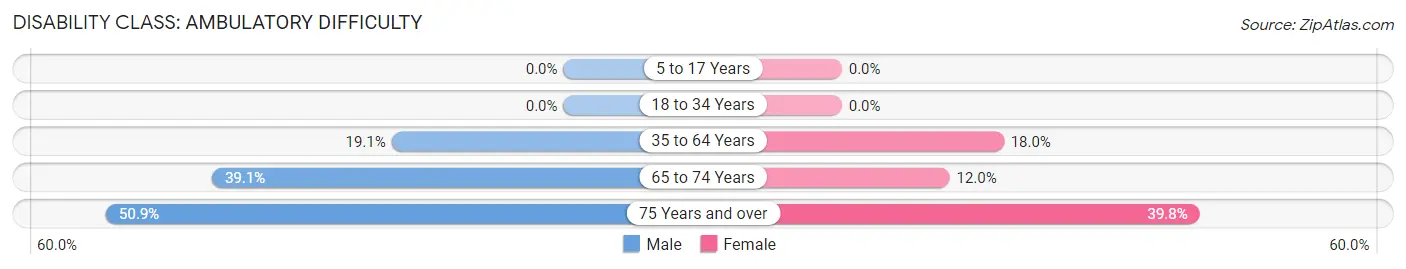
| Age Bracket | Male | Female |
| 5 to 17 Years | 0 (0.0%) | 0 (0.0%) |
| 18 to 34 Years | 0 (0.0%) | 0 (0.0%) |
| 35 to 64 Years | 79 (19.1%) | 99 (18.0%) |
| 65 to 74 Years | 54 (39.1%) | 6 (12.0%) |
| 75 Years and over | 27 (50.9%) | 51 (39.8%) |
Disability Class: Self-Care Difficulty
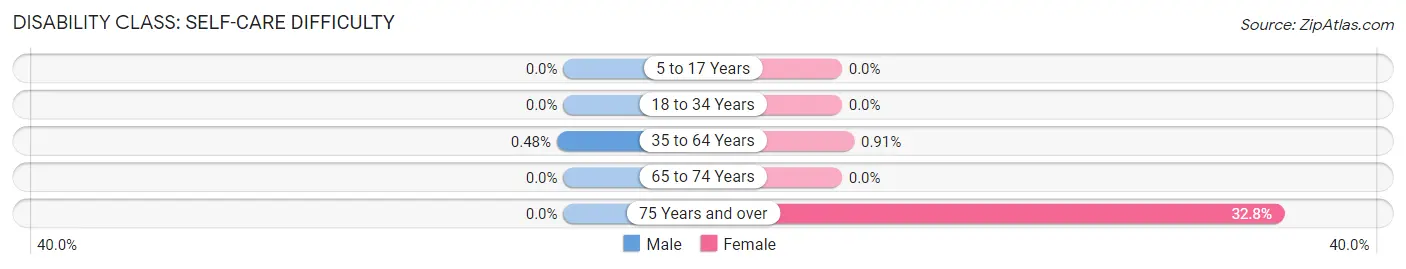
| Age Bracket | Male | Female |
| 5 to 17 Years | 0 (0.0%) | 0 (0.0%) |
| 18 to 34 Years | 0 (0.0%) | 0 (0.0%) |
| 35 to 64 Years | 2 (0.5%) | 5 (0.9%) |
| 65 to 74 Years | 0 (0.0%) | 0 (0.0%) |
| 75 Years and over | 0 (0.0%) | 42 (32.8%) |
Technology Access in Kenly
Computing Device Access in Kenly
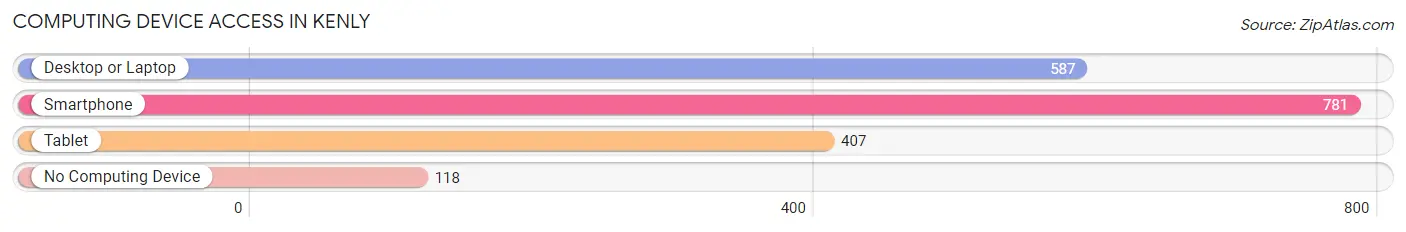
| Device Type | # Households | % Households |
| Desktop or Laptop | 587 | 62.0% |
| Smartphone | 781 | 82.5% |
| Tablet | 407 | 43.0% |
| No Computing Device | 118 | 12.5% |
| Total | 947 | 100.0% |
Internet Access in Kenly
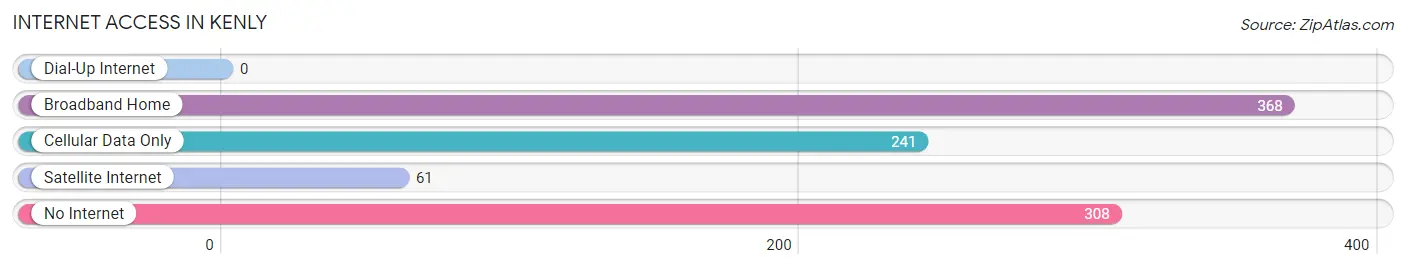
| Internet Type | # Households | % Households |
| Dial-Up Internet | 0 | 0.0% |
| Broadband Home | 368 | 38.9% |
| Cellular Data Only | 241 | 25.5% |
| Satellite Internet | 61 | 6.4% |
| No Internet | 308 | 32.5% |
| Total | 947 | 100.0% |
Kenly Summary
Kenly, North Carolina is a small town located in Johnston County, North Carolina. It is situated in the eastern part of the state, approximately 40 miles east of Raleigh. The town has a population of 1,845 people, according to the 2010 census.
History
Kenly was founded in 1872 by William Kenly, a local farmer. He named the town after himself and it was incorporated in 1887. The town was originally a farming community, but it soon developed into a small industrial center. The first industry in the town was a cotton mill, which was built in 1887. This was followed by a sawmill, a grist mill, and a brickyard.
The town grew steadily throughout the late 19th and early 20th centuries. In the 1920s, the town was home to several stores, a bank, a hotel, and a movie theater. The town also had a railroad station, which connected it to other towns in the area.
Geography
Kenly is located in the eastern part of Johnston County, North Carolina. It is situated at the intersection of US Highway 301 and NC Highway 222. The town is located approximately 40 miles east of Raleigh and 25 miles west of Wilson.
The town is situated in a rural area, with the nearest large city being Raleigh. The town is surrounded by farmland and forests. The Neuse River is located approximately 10 miles to the east of the town.
Economy
The economy of Kenly is largely based on agriculture and manufacturing. The town is home to several small businesses, including a grocery store, a hardware store, and a restaurant. The town also has a few small industrial plants, which produce a variety of products.
The town is also home to several farms, which produce a variety of crops, including corn, soybeans, and tobacco. The town is also home to several poultry farms, which produce eggs and chicken.
Demographics
According to the 2010 census, the population of Kenly was 1,845 people. The racial makeup of the town was 79.3% White, 17.2% African American, 0.7% Native American, 0.3% Asian, and 2.5% from other races. The median household income was $31,250, and the median family income was $37,500.
Conclusion
Kenly, North Carolina is a small town located in Johnston County, North Carolina. It was founded in 1872 and has a population of 1,845 people, according to the 2010 census. The town is situated in a rural area and is largely based on agriculture and manufacturing. The town is home to several small businesses, farms, and industrial plants. The racial makeup of the town is 79.3% White, 17.2% African American, 0.7% Native American, 0.3% Asian, and 2.5% from other races. The median household income was $31,250, and the median family income was $37,500.
Common Questions
What is Per Capita Income in Kenly?
Per Capita income in Kenly is $22,287.
What is the Median Family Income in Kenly?
Median Family Income in Kenly is $74,460.
What is the Median Household income in Kenly?
Median Household Income in Kenly is $51,250.
What is Income or Wage Gap in Kenly?
Income or Wage Gap in Kenly is 16.0%.
Women in Kenly earn 84.0 cents for every dollar earned by a man.
What is Inequality or Gini Index in Kenly?
Inequality or Gini Index in Kenly is 0.41.
What is the Total Population of Kenly?
Total Population of Kenly is 2,527.
What is the Total Male Population of Kenly?
Total Male Population of Kenly is 1,258.
What is the Total Female Population of Kenly?
Total Female Population of Kenly is 1,269.
What is the Ratio of Males per 100 Females in Kenly?
There are 99.13 Males per 100 Females in Kenly.
What is the Ratio of Females per 100 Males in Kenly?
There are 100.87 Females per 100 Males in Kenly.
What is the Median Population Age in Kenly?
Median Population Age in Kenly is 36.6 Years.
What is the Average Family Size in Kenly
Average Family Size in Kenly is 3.4 People.
What is the Average Household Size in Kenly
Average Household Size in Kenly is 2.7 People.
How Large is the Labor Force in Kenly?
There are 1,061 People in the Labor Forcein in Kenly.
What is the Percentage of People in the Labor Force in Kenly?
57.4% of People are in the Labor Force in Kenly.
What is the Unemployment Rate in Kenly?
Unemployment Rate in Kenly is 8.7%.