Medicine Lake, MN Map & Demographics
Medicine Lake Map
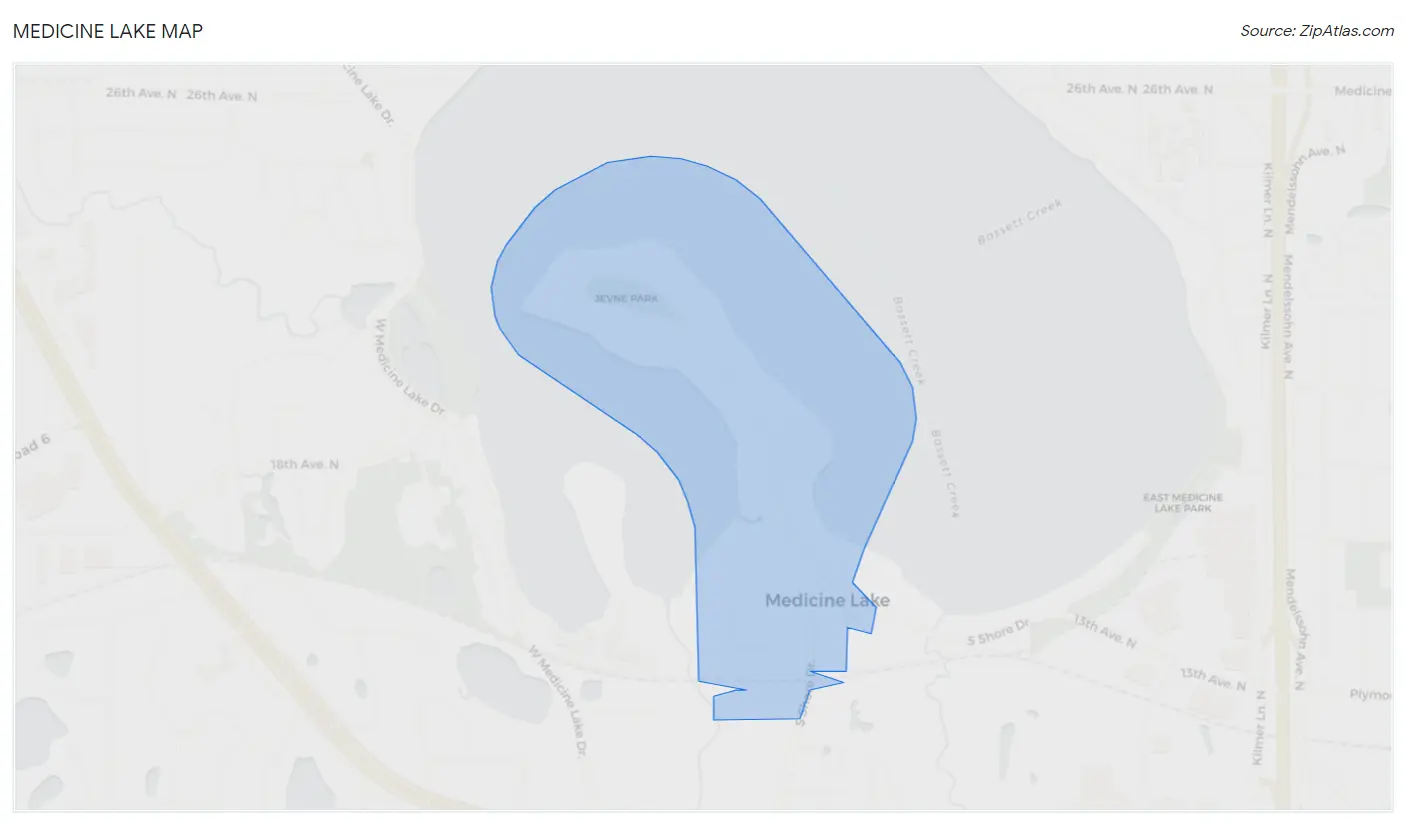
Medicine Lake Overview
$105,704
PER CAPITA INCOME
$250,001
AVG FAMILY INCOME
$136,250
AVG HOUSEHOLD INCOME
0.50
INEQUALITY / GINI INDEX
419
TOTAL POPULATION
224
MALE POPULATION
195
FEMALE POPULATION
114.87
MALES / 100 FEMALES
87.05
FEMALES / 100 MALES
45.4
MEDIAN AGE
2.9
AVG FAMILY SIZE
2.2
AVG HOUSEHOLD SIZE
224
LABOR FORCE [ PEOPLE ]
68.1%
PERCENT IN LABOR FORCE
Income in Medicine Lake
Income Overview in Medicine Lake
Per Capita Income in Medicine Lake is $105,704, while median incomes of families and households are $250,001 and $136,250 respectively.
| Characteristic | Number | Measure |
| Per Capita Income | 419 | $105,704 |
| Median Family Income | 118 | $250,001 |
| Mean Family Income | 118 | $310,590 |
| Median Household Income | 188 | $136,250 |
| Mean Household Income | 188 | $232,457 |
| Income Deficit | 118 | $0 |
| Wage / Income Gap (%) | 419 | 0.00% |
| Wage / Income Gap ($) | 419 | 100.00¢ per $1 |
| Gini / Inequality Index | 419 | 0.50 |
Earnings by Sex in Medicine Lake
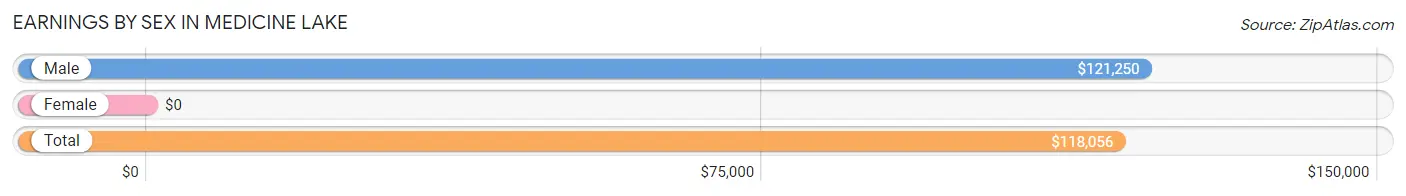
| Sex | Number | Average Earnings |
| Male | 127 (53.4%) | $121,250 |
| Female | 111 (46.6%) | $0 |
| Total | 238 (100.0%) | $118,056 |
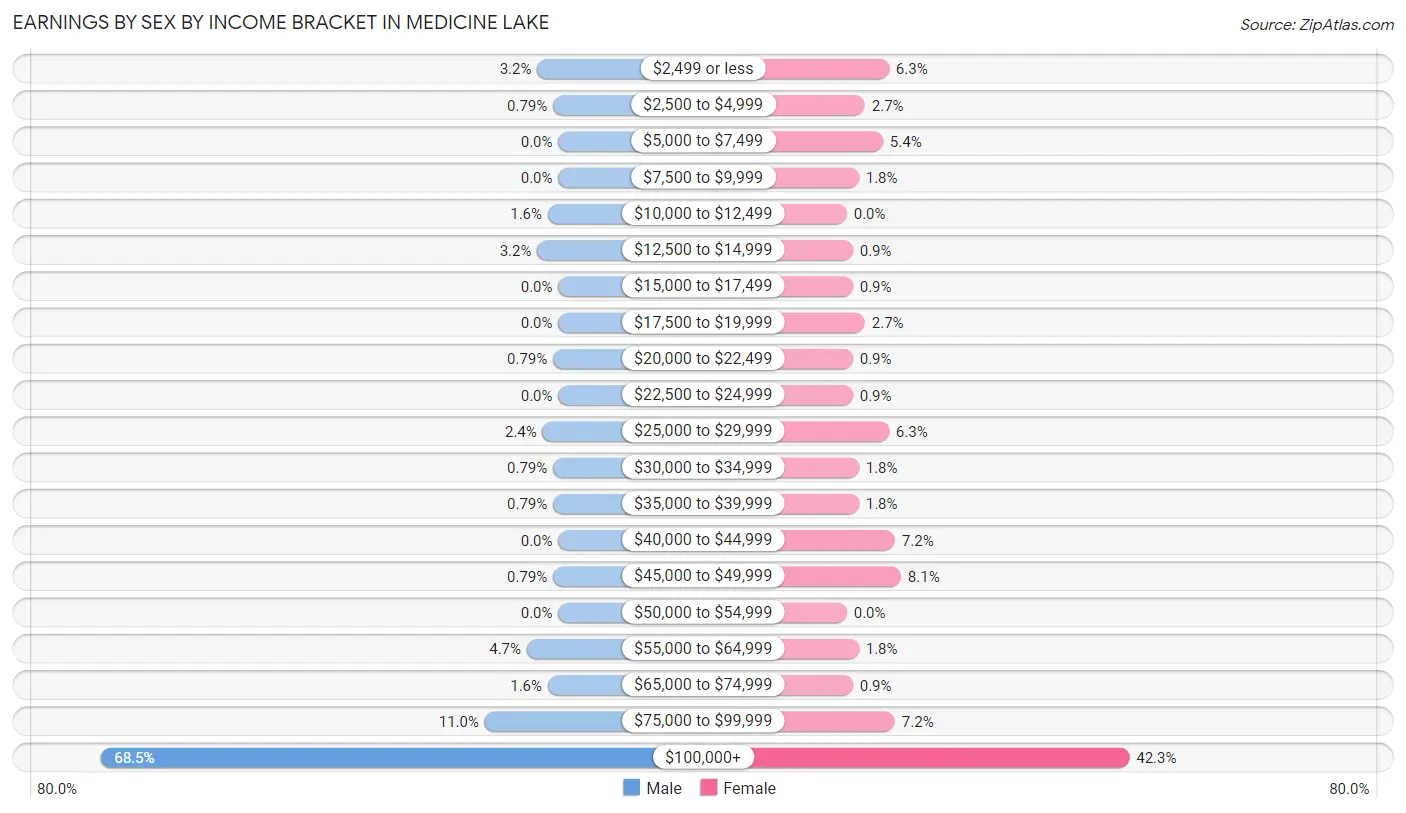
Earnings by Sex by Income Bracket in Medicine Lake
The most common earnings brackets in Medicine Lake are $100,000+ for men (87 | 68.5%) and $100,000+ for women (47 | 42.3%).
| Income | Male | Female |
| $2,499 or less | 4 (3.2%) | 7 (6.3%) |
| $2,500 to $4,999 | 1 (0.8%) | 3 (2.7%) |
| $5,000 to $7,499 | 0 (0.0%) | 6 (5.4%) |
| $7,500 to $9,999 | 0 (0.0%) | 2 (1.8%) |
| $10,000 to $12,499 | 2 (1.6%) | 0 (0.0%) |
| $12,500 to $14,999 | 4 (3.2%) | 1 (0.9%) |
| $15,000 to $17,499 | 0 (0.0%) | 1 (0.9%) |
| $17,500 to $19,999 | 0 (0.0%) | 3 (2.7%) |
| $20,000 to $22,499 | 1 (0.8%) | 1 (0.9%) |
| $22,500 to $24,999 | 0 (0.0%) | 1 (0.9%) |
| $25,000 to $29,999 | 3 (2.4%) | 7 (6.3%) |
| $30,000 to $34,999 | 1 (0.8%) | 2 (1.8%) |
| $35,000 to $39,999 | 1 (0.8%) | 2 (1.8%) |
| $40,000 to $44,999 | 0 (0.0%) | 8 (7.2%) |
| $45,000 to $49,999 | 1 (0.8%) | 9 (8.1%) |
| $50,000 to $54,999 | 0 (0.0%) | 0 (0.0%) |
| $55,000 to $64,999 | 6 (4.7%) | 2 (1.8%) |
| $65,000 to $74,999 | 2 (1.6%) | 1 (0.9%) |
| $75,000 to $99,999 | 14 (11.0%) | 8 (7.2%) |
| $100,000+ | 87 (68.5%) | 47 (42.3%) |
| Total | 127 (100.0%) | 111 (100.0%) |
Earnings by Sex by Educational Attainment in Medicine Lake
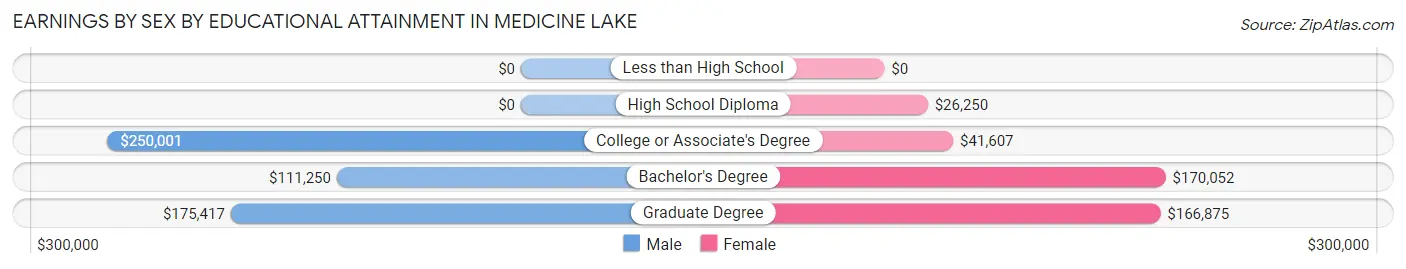
| Educational Attainment | Male Income | Female Income |
| Less than High School | - | - |
| High School Diploma | - | - |
| College or Associate's Degree | $250,001 | $41,607 |
| Bachelor's Degree | $111,250 | $170,052 |
| Graduate Degree | $175,417 | $166,875 |
| Total | $126,875 | $0 |
Family Income in Medicine Lake
Family Income Brackets in Medicine Lake
According to the Medicine Lake family income data, there are 68 families falling into the $200,000+ income range, which is the most common income bracket and makes up 57.6% of all families.
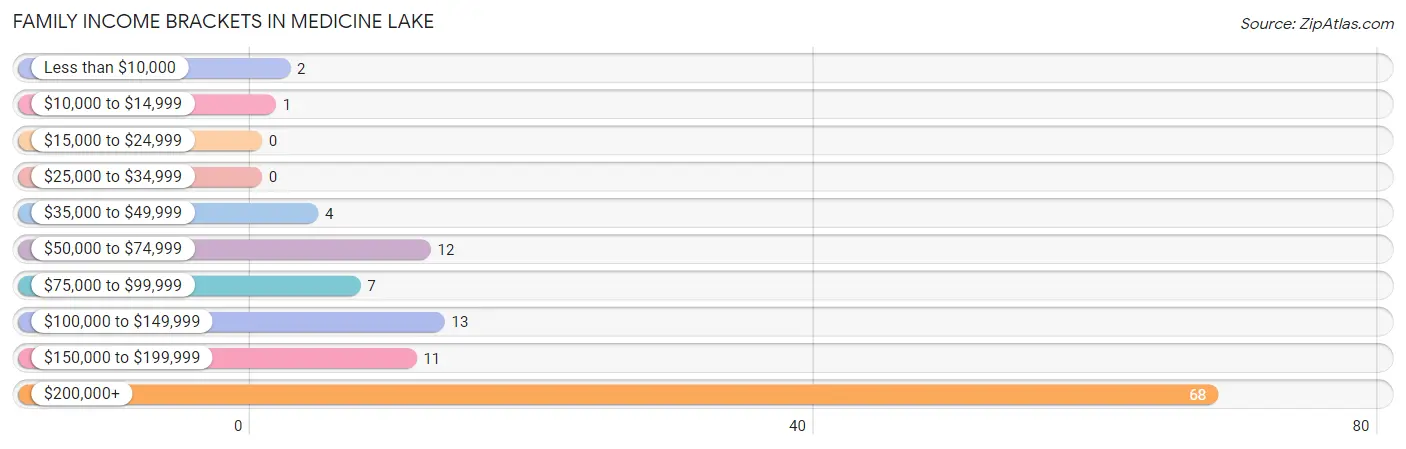
| Income Bracket | # Families | % Families |
| Less than $10,000 | 2 | 1.7% |
| $10,000 to $14,999 | 1 | 0.8% |
| $15,000 to $24,999 | 0 | 0.0% |
| $25,000 to $34,999 | 0 | 0.0% |
| $35,000 to $49,999 | 4 | 3.4% |
| $50,000 to $74,999 | 12 | 10.2% |
| $75,000 to $99,999 | 7 | 5.9% |
| $100,000 to $149,999 | 13 | 11.0% |
| $150,000 to $199,999 | 11 | 9.3% |
| $200,000+ | 68 | 57.6% |
Family Income by Famaliy Size in Medicine Lake
2-person families (60 | 50.8%) account for the highest median family income in Medicine Lake with $250,001 per family, while 2-person families (60 | 50.8%) have the highest median income of $125,000 per family member.
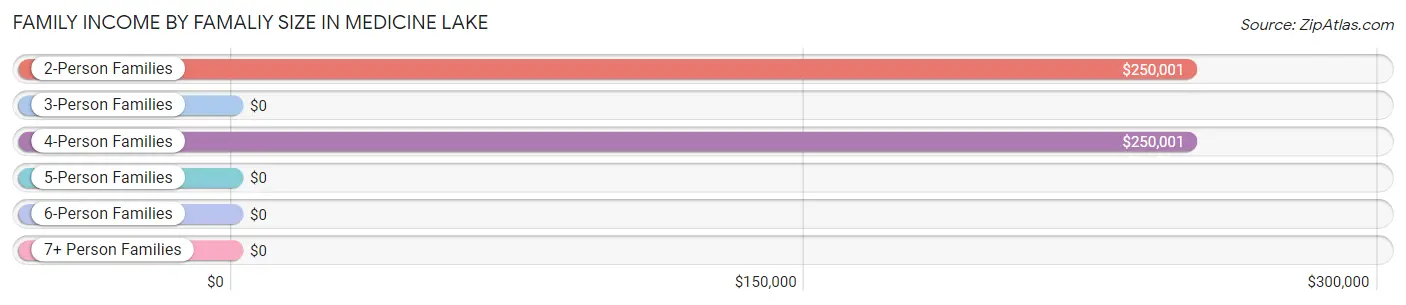
| Income Bracket | # Families | Median Income |
| 2-Person Families | 60 (50.8%) | $250,001 |
| 3-Person Families | 12 (10.2%) | $0 |
| 4-Person Families | 43 (36.4%) | $250,001 |
| 5-Person Families | 0 (0.0%) | $0 |
| 6-Person Families | 3 (2.5%) | $0 |
| 7+ Person Families | 0 (0.0%) | $0 |
| Total | 118 (100.0%) | $250,001 |
Family Income by Number of Earners in Medicine Lake
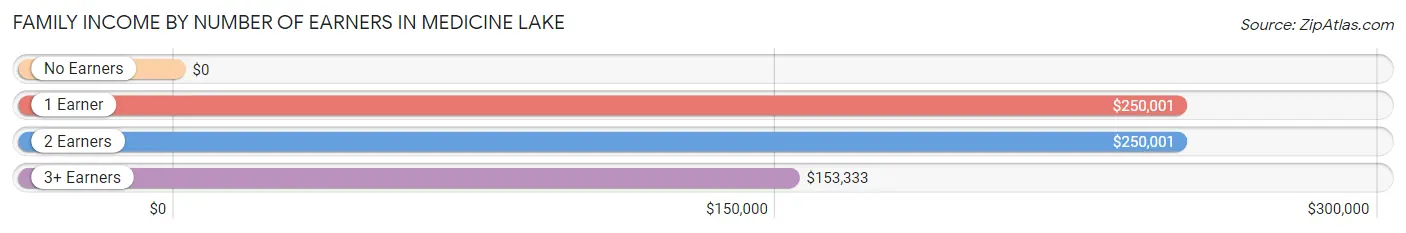
| Number of Earners | # Families | Median Income |
| No Earners | 14 (11.9%) | $0 |
| 1 Earner | 34 (28.8%) | $250,001 |
| 2 Earners | 60 (50.8%) | $250,001 |
| 3+ Earners | 10 (8.5%) | $153,333 |
| Total | 118 (100.0%) | $250,001 |
Household Income in Medicine Lake
Household Income Brackets in Medicine Lake
With 72 households falling in the category, the $200,000+ income range is the most frequent in Medicine Lake, accounting for 38.3% of all households.
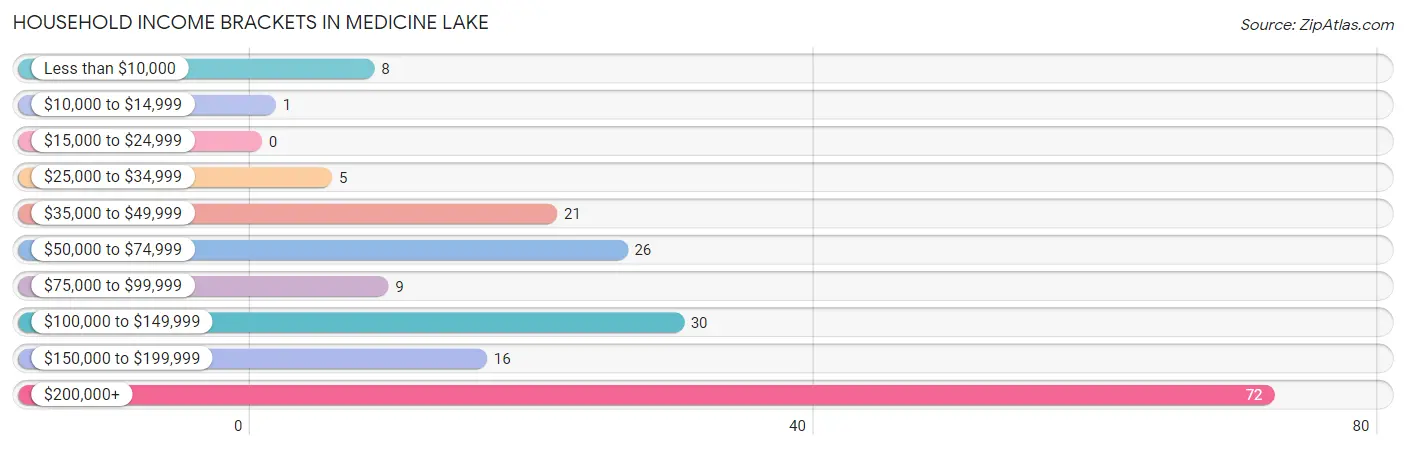
| Income Bracket | # Households | % Households |
| Less than $10,000 | 8 | 4.3% |
| $10,000 to $14,999 | 1 | 0.5% |
| $15,000 to $24,999 | 0 | 0.0% |
| $25,000 to $34,999 | 5 | 2.7% |
| $35,000 to $49,999 | 21 | 11.2% |
| $50,000 to $74,999 | 26 | 13.8% |
| $75,000 to $99,999 | 9 | 4.8% |
| $100,000 to $149,999 | 30 | 16.0% |
| $150,000 to $199,999 | 16 | 8.5% |
| $200,000+ | 72 | 38.3% |
Household Income by Householder Age in Medicine Lake
The median household income in Medicine Lake is $136,250, with the highest median household income of $250,001 found in the 45 to 64 years age bracket for the primary householder. A total of 101 households (53.7%) fall into this category. Meanwhile, the 15 to 24 years age bracket for the primary householder has the lowest median household income of $0, with 3 households (1.6%) in this group.
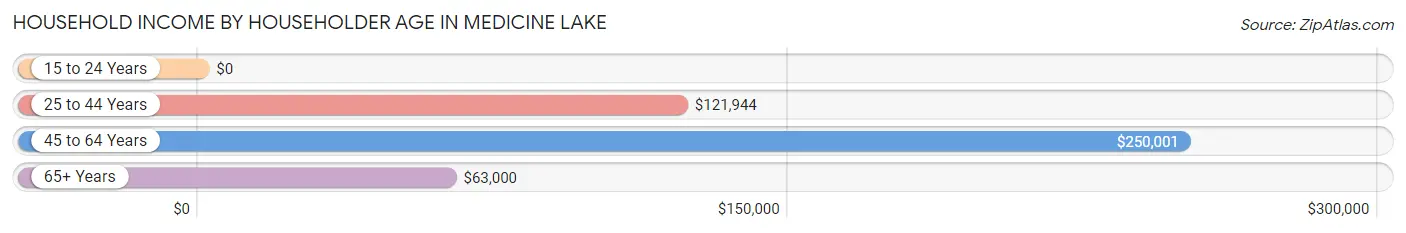
| Income Bracket | # Households | Median Income |
| 15 to 24 Years | 3 (1.6%) | $0 |
| 25 to 44 Years | 34 (18.1%) | $121,944 |
| 45 to 64 Years | 101 (53.7%) | $250,001 |
| 65+ Years | 50 (26.6%) | $63,000 |
| Total | 188 (100.0%) | $136,250 |
Poverty in Medicine Lake
Income Below Poverty by Sex and Age in Medicine Lake
With 4.5% poverty level for males and 3.6% for females among the residents of Medicine Lake, 16 and 17 year old males and 75 year old and over females are the most vulnerable to poverty, with 2 males (100.0%) and 2 females (10.5%) in their respective age groups living below the poverty level.
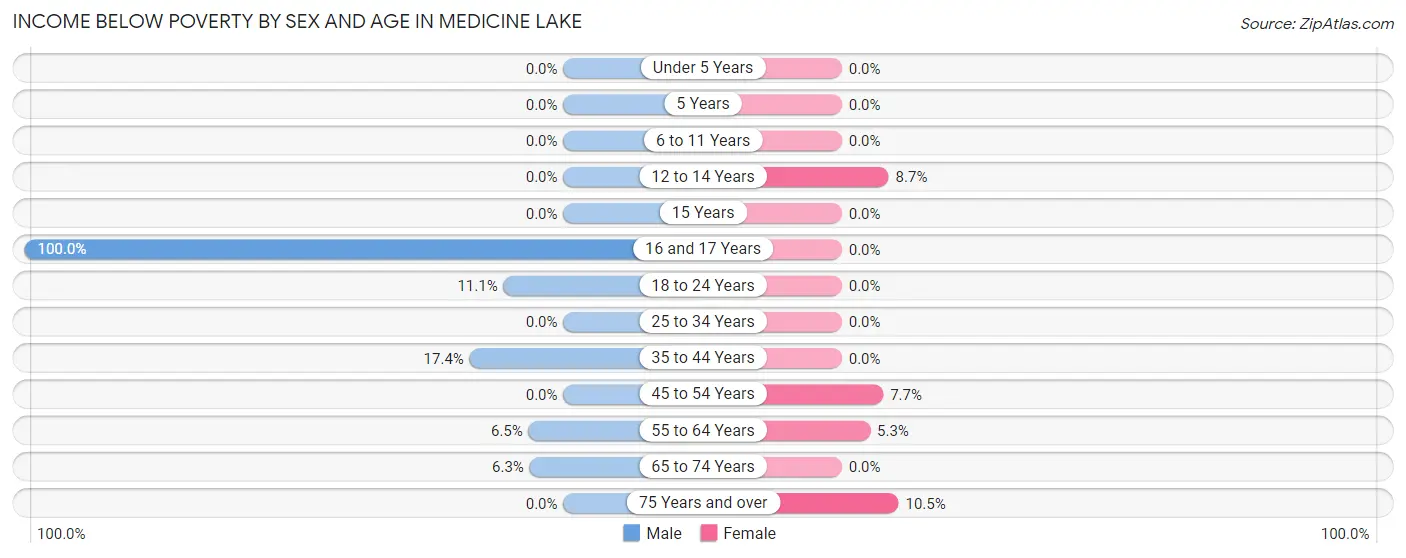
| Age Bracket | Male | Female |
| Under 5 Years | 0 (0.0%) | 0 (0.0%) |
| 5 Years | 0 (0.0%) | 0 (0.0%) |
| 6 to 11 Years | 0 (0.0%) | 0 (0.0%) |
| 12 to 14 Years | 0 (0.0%) | 2 (8.7%) |
| 15 Years | 0 (0.0%) | 0 (0.0%) |
| 16 and 17 Years | 2 (100.0%) | 0 (0.0%) |
| 18 to 24 Years | 1 (11.1%) | 0 (0.0%) |
| 25 to 34 Years | 0 (0.0%) | 0 (0.0%) |
| 35 to 44 Years | 4 (17.4%) | 0 (0.0%) |
| 45 to 54 Years | 0 (0.0%) | 2 (7.7%) |
| 55 to 64 Years | 2 (6.5%) | 1 (5.3%) |
| 65 to 74 Years | 1 (6.2%) | 0 (0.0%) |
| 75 Years and over | 0 (0.0%) | 2 (10.5%) |
| Total | 10 (4.5%) | 7 (3.6%) |
Income Above Poverty by Sex and Age in Medicine Lake
According to the poverty statistics in Medicine Lake, males aged under 5 years and females aged under 5 years are the age groups that are most secure financially, with 100.0% of males and 100.0% of females in these age groups living above the poverty line.
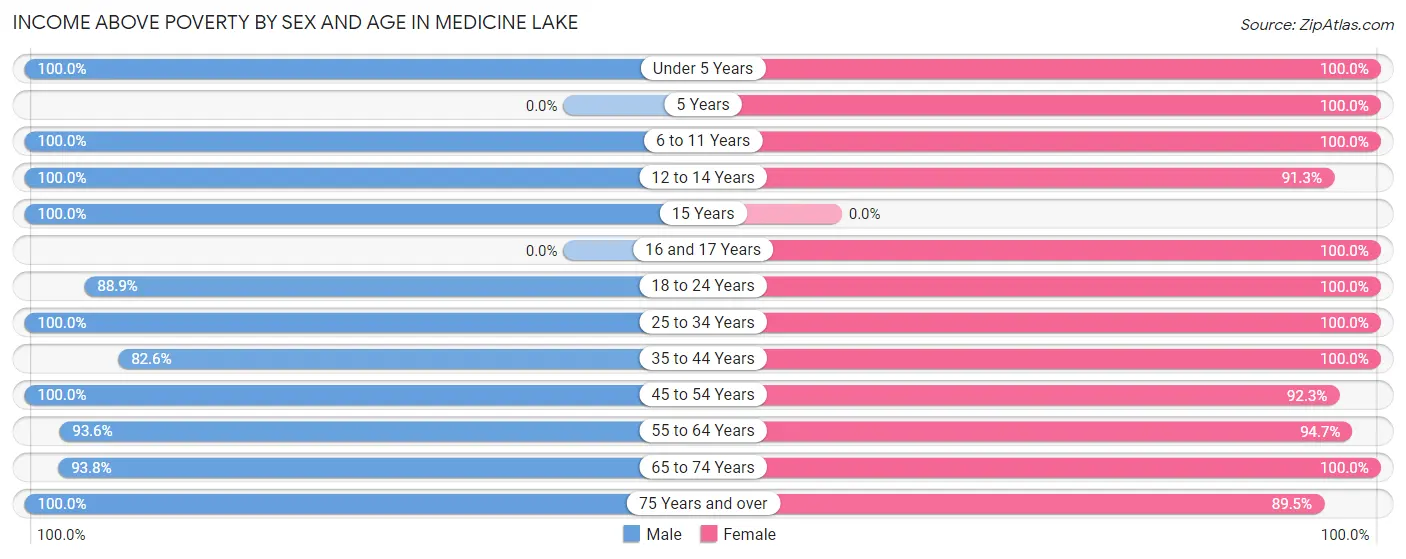
| Age Bracket | Male | Female |
| Under 5 Years | 2 (100.0%) | 4 (100.0%) |
| 5 Years | 0 (0.0%) | 6 (100.0%) |
| 6 to 11 Years | 29 (100.0%) | 8 (100.0%) |
| 12 to 14 Years | 15 (100.0%) | 21 (91.3%) |
| 15 Years | 3 (100.0%) | 0 (0.0%) |
| 16 and 17 Years | 0 (0.0%) | 9 (100.0%) |
| 18 to 24 Years | 8 (88.9%) | 6 (100.0%) |
| 25 to 34 Years | 6 (100.0%) | 30 (100.0%) |
| 35 to 44 Years | 19 (82.6%) | 28 (100.0%) |
| 45 to 54 Years | 65 (100.0%) | 24 (92.3%) |
| 55 to 64 Years | 29 (93.5%) | 18 (94.7%) |
| 65 to 74 Years | 15 (93.8%) | 17 (100.0%) |
| 75 Years and over | 23 (100.0%) | 17 (89.5%) |
| Total | 214 (95.5%) | 188 (96.4%) |
Income Below Poverty Among Married-Couple Families in Medicine Lake
The poverty statistics for married-couple families in Medicine Lake show that 1.0% or 1 of the total 98 families live below the poverty line. Families with no children have the highest poverty rate of 1.8%, comprising of 1 families. On the other hand, families with 1 or 2 children have the lowest poverty rate of 0.0%, which includes 0 families.
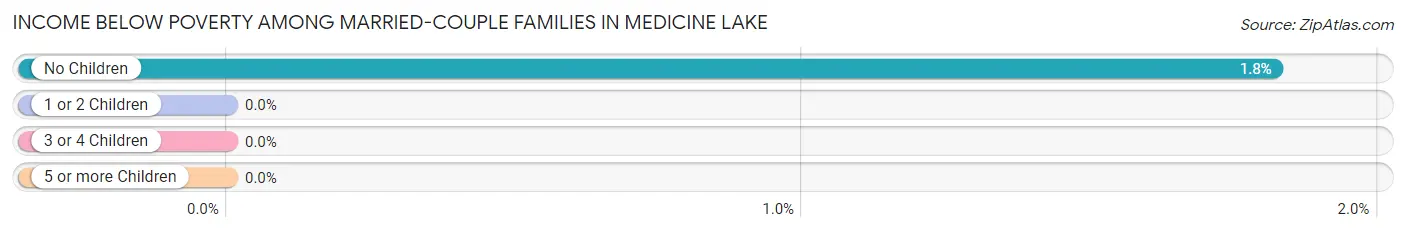
| Children | Above Poverty | Below Poverty |
| No Children | 54 (98.2%) | 1 (1.8%) |
| 1 or 2 Children | 40 (100.0%) | 0 (0.0%) |
| 3 or 4 Children | 3 (100.0%) | 0 (0.0%) |
| 5 or more Children | 0 (0.0%) | 0 (0.0%) |
| Total | 97 (99.0%) | 1 (1.0%) |
Income Below Poverty Among Single-Parent Households in Medicine Lake
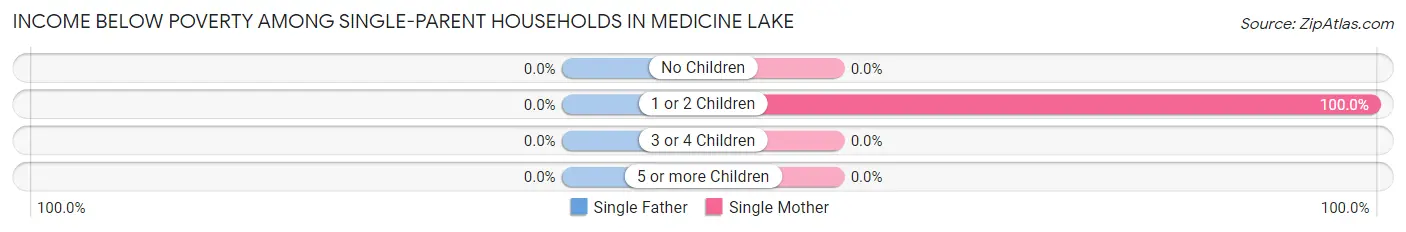
| Children | Single Father | Single Mother |
| No Children | 0 (0.0%) | 0 (0.0%) |
| 1 or 2 Children | 0 (0.0%) | 2 (100.0%) |
| 3 or 4 Children | 0 (0.0%) | 0 (0.0%) |
| 5 or more Children | 0 (0.0%) | 0 (0.0%) |
| Total | 0 (0.0%) | 2 (33.3%) |
Income Below Poverty Among Married-Couple vs Single-Parent Households in Medicine Lake
The poverty data for Medicine Lake shows that 1 of the married-couple family households (1.0%) and 2 of the single-parent households (10.0%) are living below the poverty level. Within the married-couple family households, those with no children have the highest poverty rate, with 1 households (1.8%) falling below the poverty line. Among the single-parent households, those with 1 or 2 children have the highest poverty rate, with 2 household (15.4%) living below poverty.
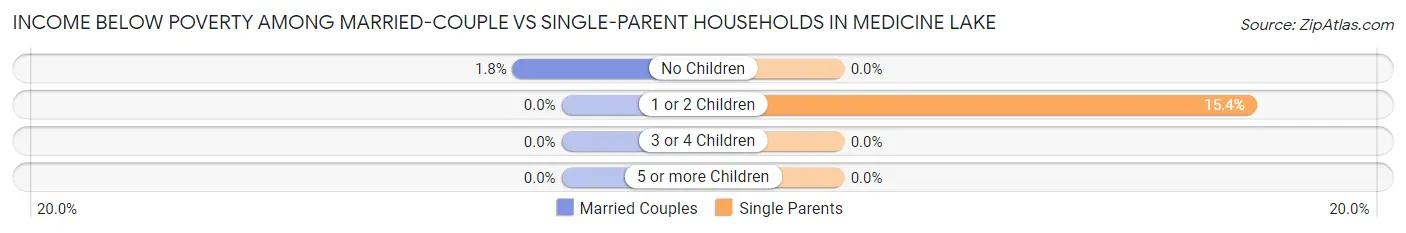
| Children | Married-Couple Families | Single-Parent Households |
| No Children | 1 (1.8%) | 0 (0.0%) |
| 1 or 2 Children | 0 (0.0%) | 2 (15.4%) |
| 3 or 4 Children | 0 (0.0%) | 0 (0.0%) |
| 5 or more Children | 0 (0.0%) | 0 (0.0%) |
| Total | 1 (1.0%) | 2 (10.0%) |
Race in Medicine Lake
The most populous races in Medicine Lake are White / Caucasian (392 | 93.6%), Hispanic or Latino (15 | 3.6%), and Some other Race (15 | 3.6%).
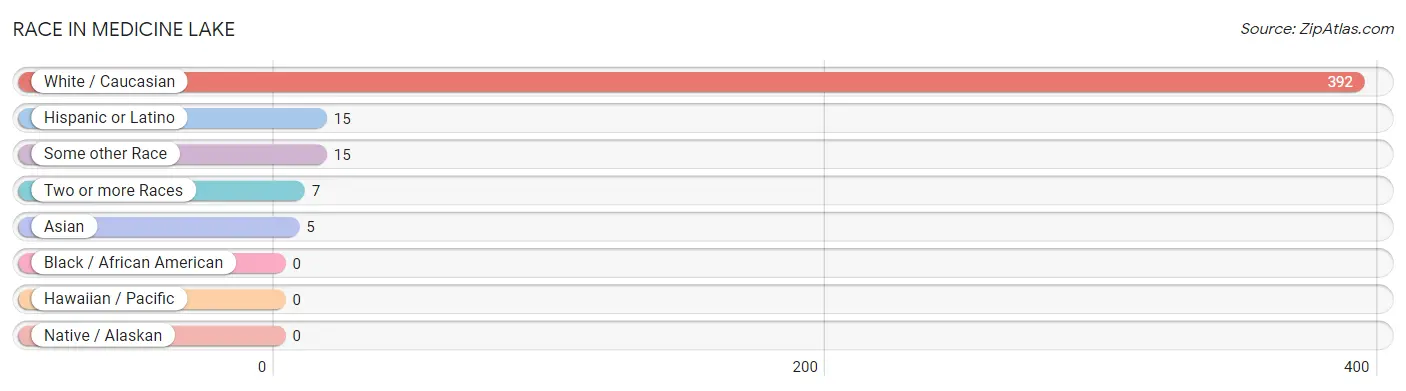
| Race | # Population | % Population |
| Asian | 5 | 1.2% |
| Black / African American | 0 | 0.0% |
| Hawaiian / Pacific | 0 | 0.0% |
| Hispanic or Latino | 15 | 3.6% |
| Native / Alaskan | 0 | 0.0% |
| White / Caucasian | 392 | 93.6% |
| Two or more Races | 7 | 1.7% |
| Some other Race | 15 | 3.6% |
| Total | 419 | 100.0% |
Ancestry in Medicine Lake
The most populous ancestries reported in Medicine Lake are German (135 | 32.2%), Norwegian (73 | 17.4%), Swedish (50 | 11.9%), English (46 | 11.0%), and Irish (35 | 8.4%), together accounting for 80.9% of all Medicine Lake residents.
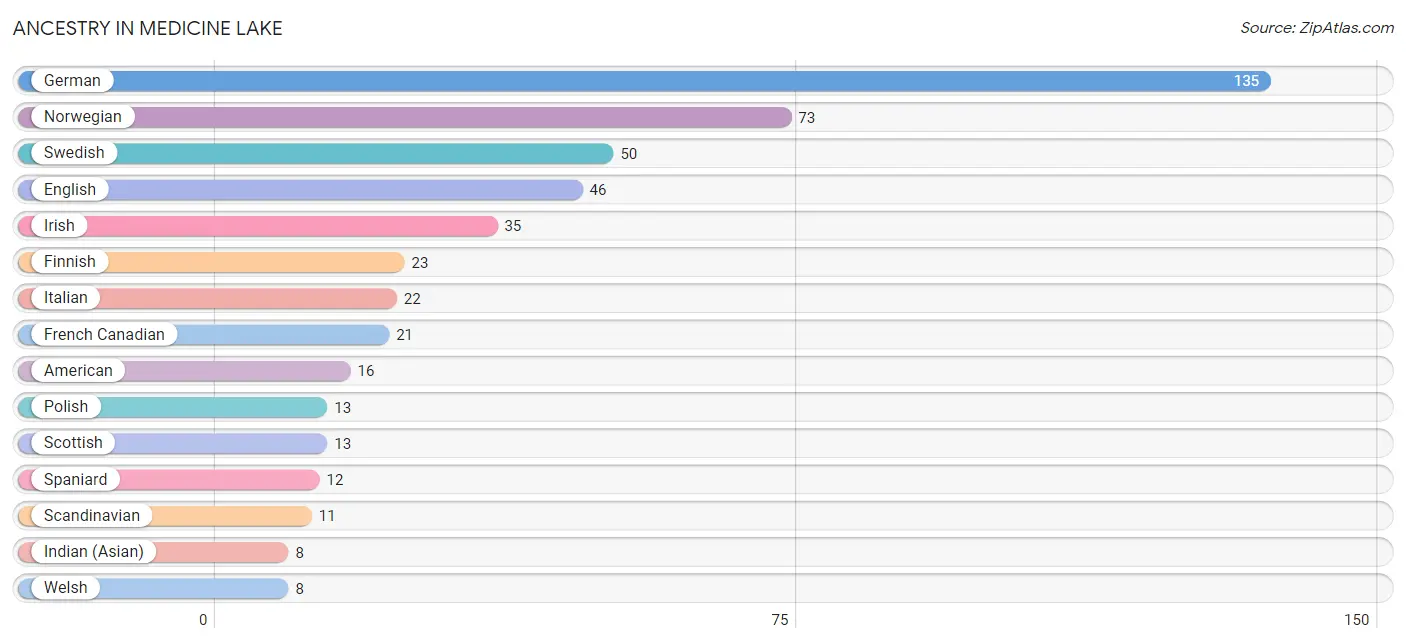
| Ancestry | # Population | % Population |
| American | 16 | 3.8% |
| Austrian | 2 | 0.5% |
| British | 1 | 0.2% |
| Burmese | 1 | 0.2% |
| Croatian | 7 | 1.7% |
| Danish | 3 | 0.7% |
| Dutch | 6 | 1.4% |
| Eastern European | 3 | 0.7% |
| English | 46 | 11.0% |
| European | 7 | 1.7% |
| Finnish | 23 | 5.5% |
| French | 5 | 1.2% |
| French Canadian | 21 | 5.0% |
| German | 135 | 32.2% |
| Hungarian | 2 | 0.5% |
| Indian (Asian) | 8 | 1.9% |
| Irish | 35 | 8.4% |
| Italian | 22 | 5.2% |
| Native Hawaiian | 1 | 0.2% |
| Norwegian | 73 | 17.4% |
| Polish | 13 | 3.1% |
| Romanian | 1 | 0.2% |
| Russian | 5 | 1.2% |
| Scandinavian | 11 | 2.6% |
| Scottish | 13 | 3.1% |
| Slovene | 4 | 0.9% |
| South American | 2 | 0.5% |
| Spaniard | 12 | 2.9% |
| Spanish | 1 | 0.2% |
| Swedish | 50 | 11.9% |
| Swiss | 2 | 0.5% |
| Venezuelan | 2 | 0.5% |
| Welsh | 8 | 1.9% | View All 33 Rows |
Immigrants in Medicine Lake
The most numerous immigrant groups reported in Medicine Lake came from Europe (27 | 6.4%), Eastern Europe (26 | 6.2%), Belarus (24 | 5.7%), Asia (2 | 0.5%), and Croatia (2 | 0.5%), together accounting for 19.3% of all Medicine Lake residents.
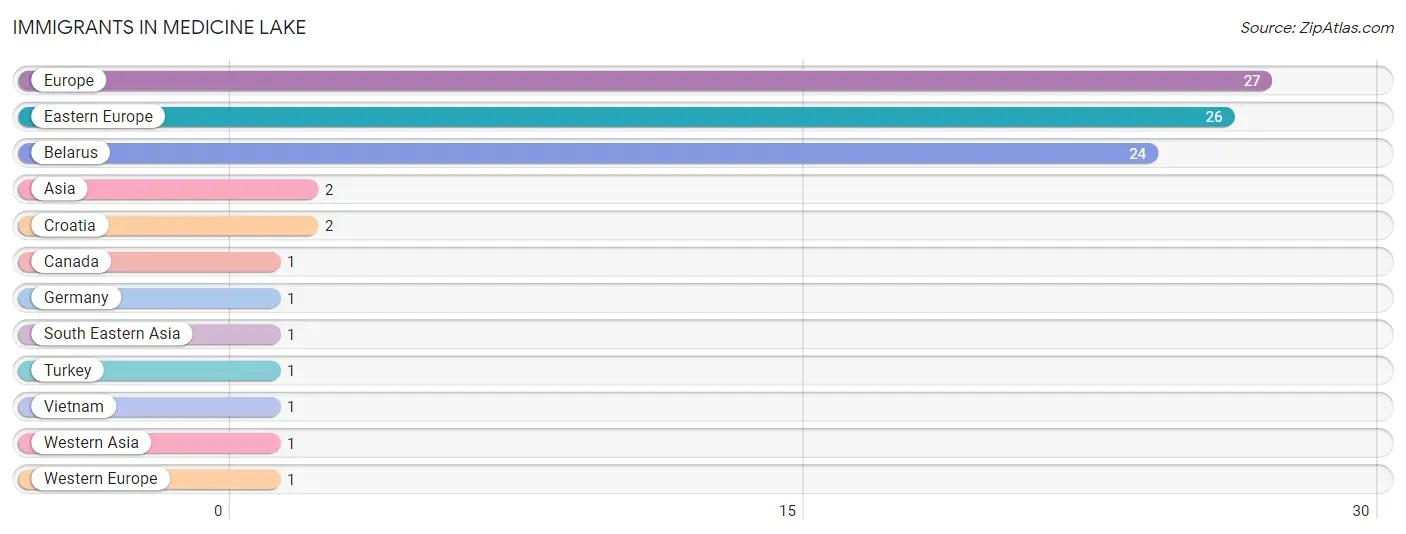
| Immigration Origin | # Population | % Population |
| Asia | 2 | 0.5% |
| Belarus | 24 | 5.7% |
| Canada | 1 | 0.2% |
| Croatia | 2 | 0.5% |
| Eastern Europe | 26 | 6.2% |
| Europe | 27 | 6.4% |
| Germany | 1 | 0.2% |
| South Eastern Asia | 1 | 0.2% |
| Turkey | 1 | 0.2% |
| Vietnam | 1 | 0.2% |
| Western Asia | 1 | 0.2% |
| Western Europe | 1 | 0.2% | View All 12 Rows |
Sex and Age in Medicine Lake
Sex and Age in Medicine Lake
The most populous age groups in Medicine Lake are 50 to 54 Years (36 | 16.1%) for men and 30 to 34 Years (25 | 12.8%) for women.
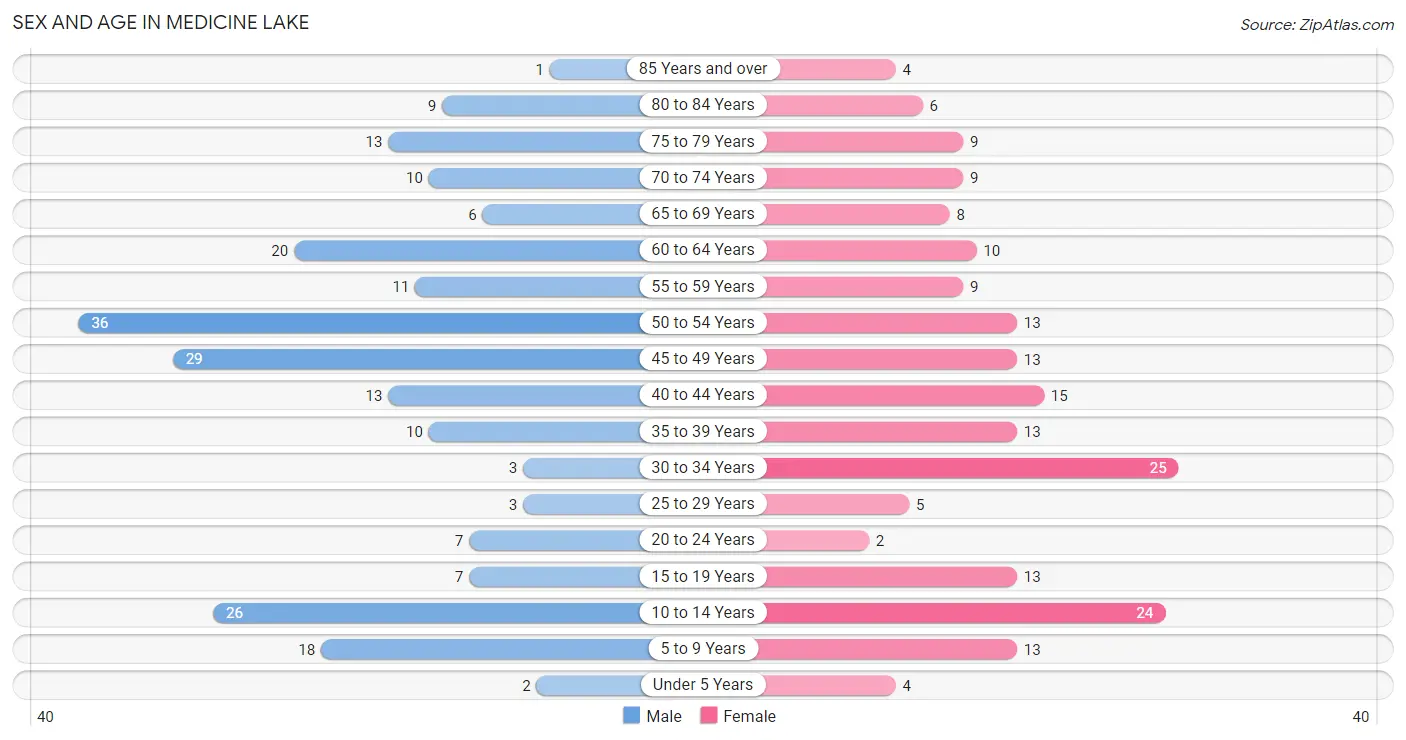
| Age Bracket | Male | Female |
| Under 5 Years | 2 (0.9%) | 4 (2.1%) |
| 5 to 9 Years | 18 (8.0%) | 13 (6.7%) |
| 10 to 14 Years | 26 (11.6%) | 24 (12.3%) |
| 15 to 19 Years | 7 (3.1%) | 13 (6.7%) |
| 20 to 24 Years | 7 (3.1%) | 2 (1.0%) |
| 25 to 29 Years | 3 (1.3%) | 5 (2.6%) |
| 30 to 34 Years | 3 (1.3%) | 25 (12.8%) |
| 35 to 39 Years | 10 (4.5%) | 13 (6.7%) |
| 40 to 44 Years | 13 (5.8%) | 15 (7.7%) |
| 45 to 49 Years | 29 (13.0%) | 13 (6.7%) |
| 50 to 54 Years | 36 (16.1%) | 13 (6.7%) |
| 55 to 59 Years | 11 (4.9%) | 9 (4.6%) |
| 60 to 64 Years | 20 (8.9%) | 10 (5.1%) |
| 65 to 69 Years | 6 (2.7%) | 8 (4.1%) |
| 70 to 74 Years | 10 (4.5%) | 9 (4.6%) |
| 75 to 79 Years | 13 (5.8%) | 9 (4.6%) |
| 80 to 84 Years | 9 (4.0%) | 6 (3.1%) |
| 85 Years and over | 1 (0.4%) | 4 (2.1%) |
| Total | 224 (100.0%) | 195 (100.0%) |
Families and Households in Medicine Lake
Median Family Size in Medicine Lake
The median family size in Medicine Lake is 2.85 persons per family, with married-couple families (98 | 83.1%) accounting for the largest median family size of 2.98 persons per family. On the other hand, single male/father families (14 | 11.9%) represent the smallest median family size with 1.93 persons per family.
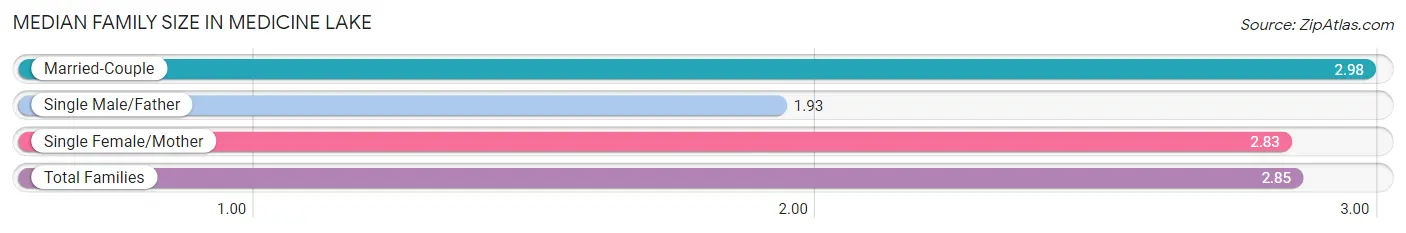
| Family Type | # Families | Family Size |
| Married-Couple | 98 (83.1%) | 2.98 |
| Single Male/Father | 14 (11.9%) | 1.93 |
| Single Female/Mother | 6 (5.1%) | 2.83 |
| Total Families | 118 (100.0%) | 2.85 |
Median Household Size in Medicine Lake
The median household size in Medicine Lake is 2.23 persons per household, with married-couple households (98 | 52.1%) accounting for the largest median household size of 2.98 persons per household. non-family households (70 | 37.2%) represent the smallest median household size with 1.13 persons per household.
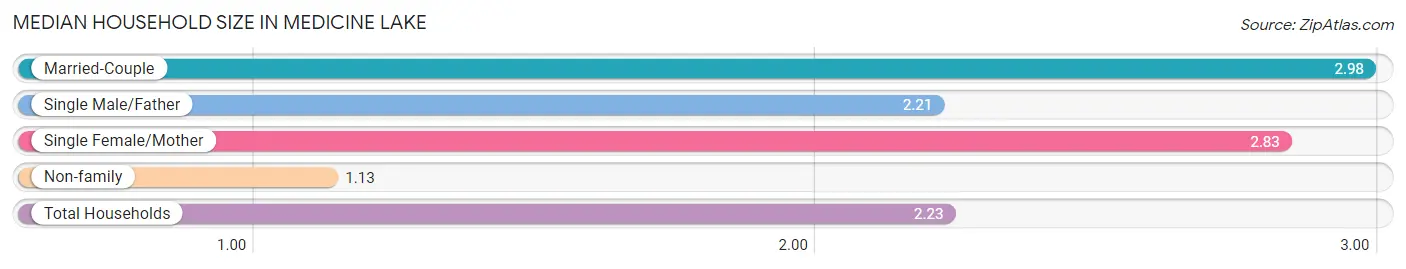
| Household Type | # Households | Household Size |
| Married-Couple | 98 (52.1%) | 2.98 |
| Single Male/Father | 14 (7.4%) | 2.21 |
| Single Female/Mother | 6 (3.2%) | 2.83 |
| Non-family | 70 (37.2%) | 1.13 |
| Total Households | 188 (100.0%) | 2.23 |
Household Size by Marriage Status in Medicine Lake
Out of a total of 188 households in Medicine Lake, 118 (62.8%) are family households, while 70 (37.2%) are nonfamily households. The most numerous type of family households are 2-person households, comprising 58, and the most common type of nonfamily households are 1-person households, comprising 62.
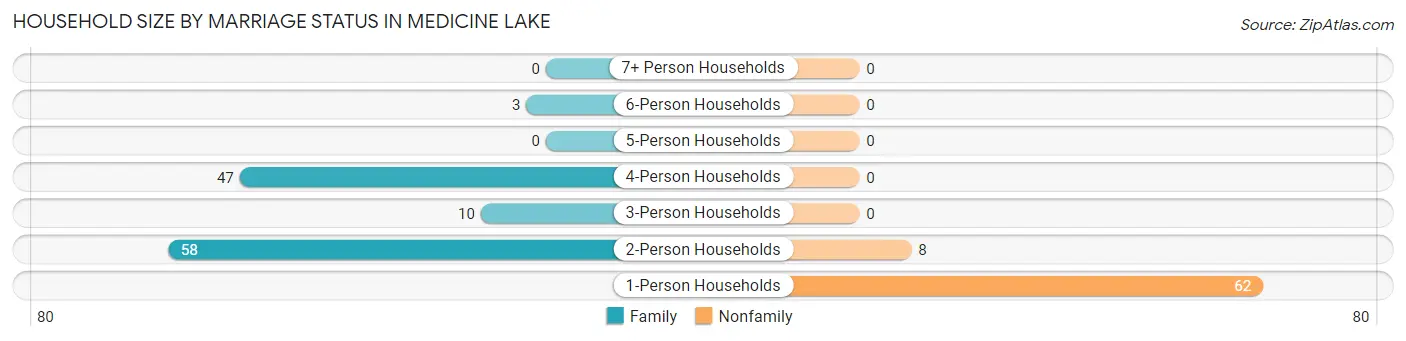
| Household Size | Family Households | Nonfamily Households |
| 1-Person Households | - | 62 (33.0%) |
| 2-Person Households | 58 (30.8%) | 8 (4.3%) |
| 3-Person Households | 10 (5.3%) | 0 (0.0%) |
| 4-Person Households | 47 (25.0%) | 0 (0.0%) |
| 5-Person Households | 0 (0.0%) | 0 (0.0%) |
| 6-Person Households | 3 (1.6%) | 0 (0.0%) |
| 7+ Person Households | 0 (0.0%) | 0 (0.0%) |
| Total | 118 (62.8%) | 70 (37.2%) |
Female Fertility in Medicine Lake
Fertility by Age in Medicine Lake
| Age Bracket | Women with Births | Births / 1,000 Women |
| 15 to 19 years | 0 (0.0%) | 0.0 |
| 20 to 34 years | 0 (0.0%) | 0.0 |
| 35 to 50 years | 0 (0.0%) | 0.0 |
| Total | 0 (0.0%) | 0.0 |
Fertility by Age by Marriage Status in Medicine Lake
| Age Bracket | Married | Unmarried |
| 15 to 19 years | 0 (0.0%) | 0 (0.0%) |
| 20 to 34 years | 0 (0.0%) | 0 (0.0%) |
| 35 to 50 years | 0 (0.0%) | 0 (0.0%) |
| Total | 0 (0.0%) | 0 (0.0%) |
Fertility by Education in Medicine Lake
| Educational Attainment | Women with Births | Births / 1,000 Women |
| Less than High School | 0 (0.0%) | 0.0 |
| High School Diploma | 0 (0.0%) | 0.0 |
| College or Associate's Degree | 0 (0.0%) | 0.0 |
| Bachelor's Degree | 0 (0.0%) | 0.0 |
| Graduate Degree | 0 (0.0%) | 0.0 |
| Total | 0 (0.0%) | 0.0 |
Fertility by Education by Marriage Status in Medicine Lake
| Educational Attainment | Married | Unmarried |
| Less than High School | 0 (0.0%) | 0 (0.0%) |
| High School Diploma | 0 (0.0%) | 0 (0.0%) |
| College or Associate's Degree | 0 (0.0%) | 0 (0.0%) |
| Bachelor's Degree | 0 (0.0%) | 0 (0.0%) |
| Graduate Degree | 0 (0.0%) | 0 (0.0%) |
| Total | 0 (0.0%) | 0 (0.0%) |
Employment Characteristics in Medicine Lake
Employment by Class of Employer in Medicine Lake
Among the 224 employed individuals in Medicine Lake, private company employees (170 | 75.9%), self-employed (not incorporated) (19 | 8.5%), and not-for-profit organizations (13 | 5.8%) make up the most common classes of employment.
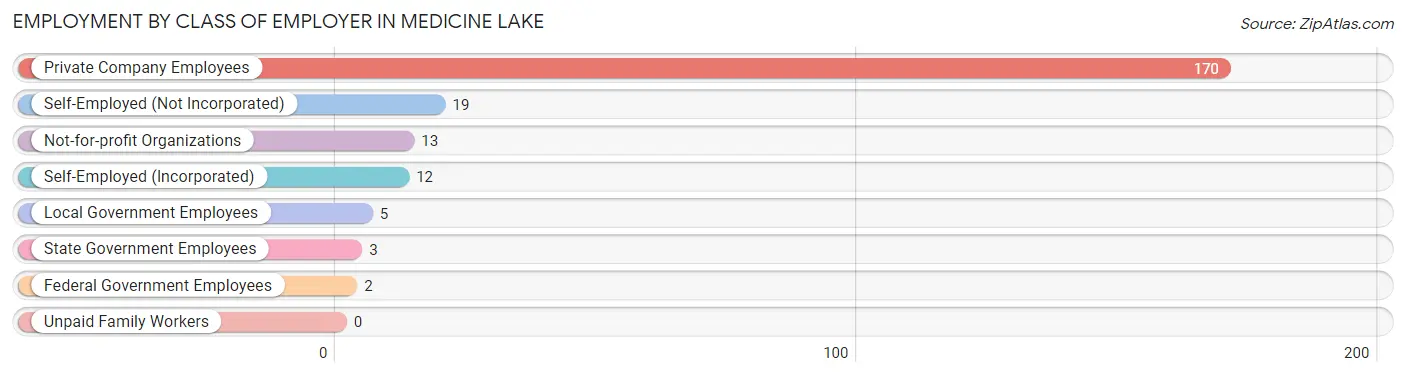
| Employer Class | # Employees | % Employees |
| Private Company Employees | 170 | 75.9% |
| Self-Employed (Incorporated) | 12 | 5.4% |
| Self-Employed (Not Incorporated) | 19 | 8.5% |
| Not-for-profit Organizations | 13 | 5.8% |
| Local Government Employees | 5 | 2.2% |
| State Government Employees | 3 | 1.3% |
| Federal Government Employees | 2 | 0.9% |
| Unpaid Family Workers | 0 | 0.0% |
| Total | 224 | 100.0% |
Employment Status by Age in Medicine Lake
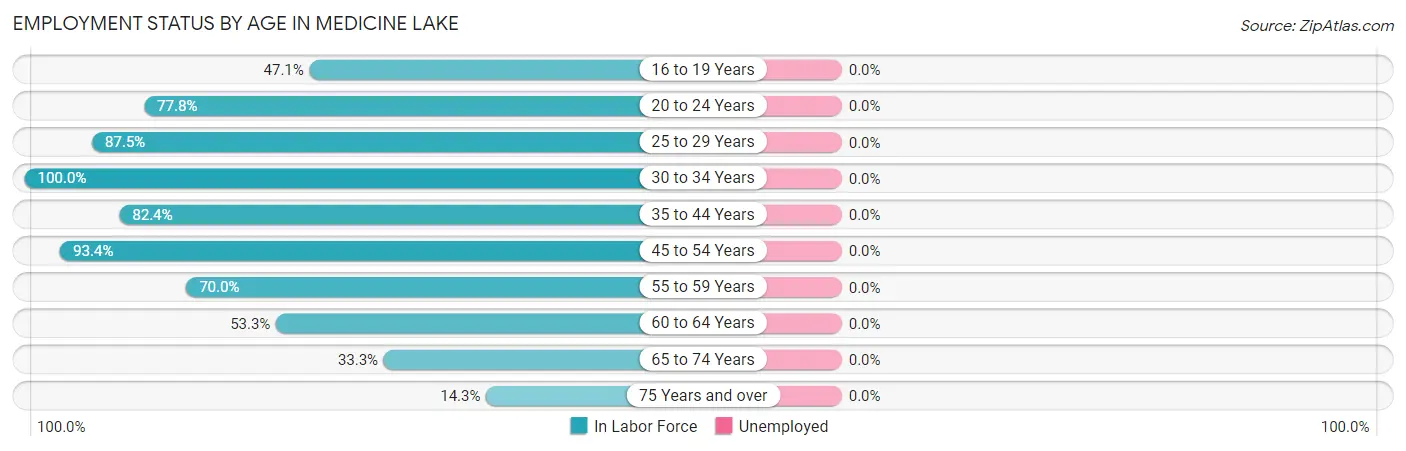
| Age Bracket | In Labor Force | Unemployed |
| 16 to 19 Years | 8 (47.1%) | 0 (0.0%) |
| 20 to 24 Years | 7 (77.8%) | 0 (0.0%) |
| 25 to 29 Years | 7 (87.5%) | 0 (0.0%) |
| 30 to 34 Years | 28 (100.0%) | 0 (0.0%) |
| 35 to 44 Years | 42 (82.4%) | 0 (0.0%) |
| 45 to 54 Years | 85 (93.4%) | 0 (0.0%) |
| 55 to 59 Years | 14 (70.0%) | 0 (0.0%) |
| 60 to 64 Years | 16 (53.3%) | 0 (0.0%) |
| 65 to 74 Years | 11 (33.3%) | 0 (0.0%) |
| 75 Years and over | 6 (14.3%) | 0 (0.0%) |
| Total | 224 (68.1%) | 0 (0.0%) |
Employment Status by Educational Attainment in Medicine Lake
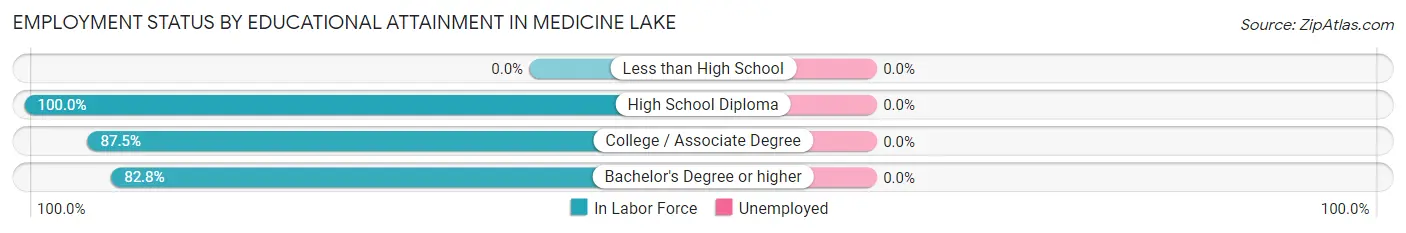
| Educational Attainment | In Labor Force | Unemployed |
| Less than High School | 0 (0.0%) | 0 (0.0%) |
| High School Diploma | 3 (100.0%) | 0 (0.0%) |
| College / Associate Degree | 49 (87.5%) | 0 (0.0%) |
| Bachelor's Degree or higher | 140 (82.8%) | 0 (0.0%) |
| Total | 192 (84.2%) | 0 (0.0%) |
Employment Occupations by Sex in Medicine Lake
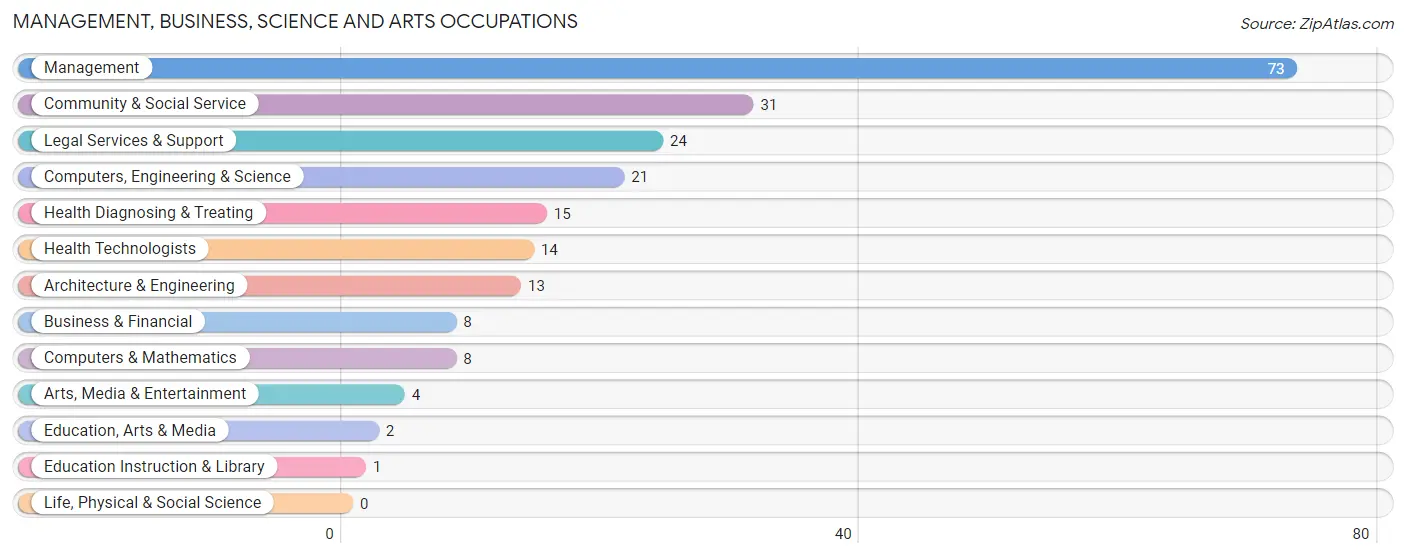
Management, Business, Science and Arts Occupations
The most common Management, Business, Science and Arts occupations in Medicine Lake are Management (73 | 32.6%), Community & Social Service (31 | 13.8%), Legal Services & Support (24 | 10.7%), Computers, Engineering & Science (21 | 9.4%), and Health Diagnosing & Treating (15 | 6.7%).
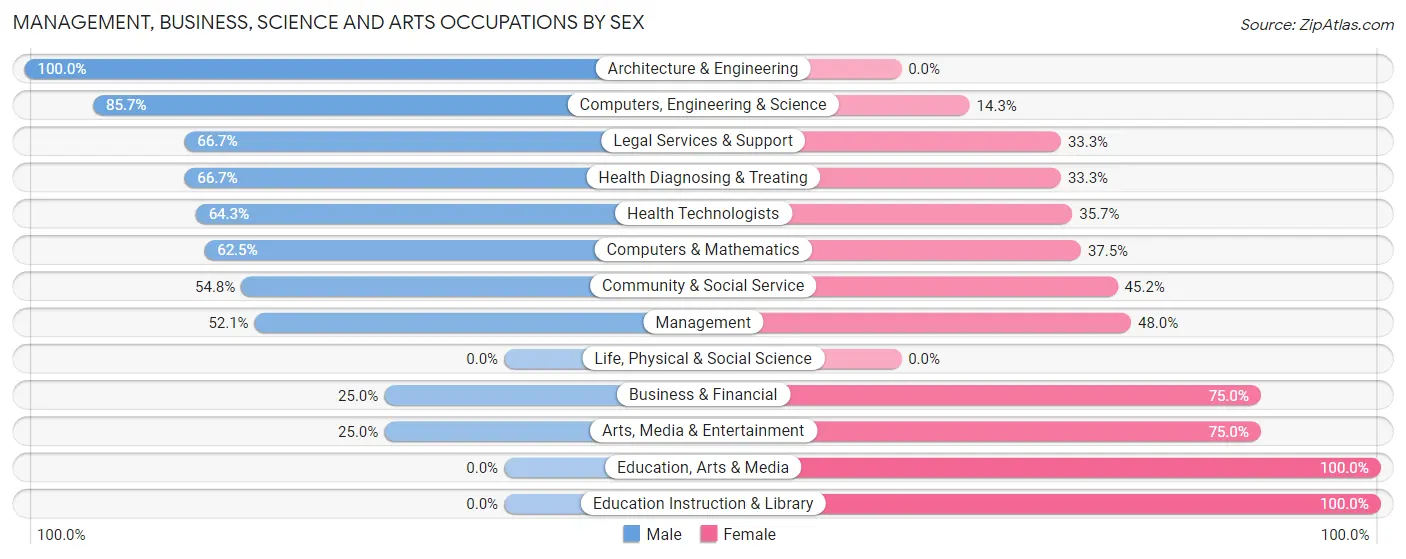
Management, Business, Science and Arts Occupations by Sex
Within the Management, Business, Science and Arts occupations in Medicine Lake, the most male-oriented occupations are Architecture & Engineering (100.0%), Computers, Engineering & Science (85.7%), and Legal Services & Support (66.7%), while the most female-oriented occupations are Education, Arts & Media (100.0%), Education Instruction & Library (100.0%), and Business & Financial (75.0%).
| Occupation | Male | Female |
| Management | 38 (52.0%) | 35 (47.9%) |
| Business & Financial | 2 (25.0%) | 6 (75.0%) |
| Computers, Engineering & Science | 18 (85.7%) | 3 (14.3%) |
| Computers & Mathematics | 5 (62.5%) | 3 (37.5%) |
| Architecture & Engineering | 13 (100.0%) | 0 (0.0%) |
| Life, Physical & Social Science | 0 (0.0%) | 0 (0.0%) |
| Community & Social Service | 17 (54.8%) | 14 (45.2%) |
| Education, Arts & Media | 0 (0.0%) | 2 (100.0%) |
| Legal Services & Support | 16 (66.7%) | 8 (33.3%) |
| Education Instruction & Library | 0 (0.0%) | 1 (100.0%) |
| Arts, Media & Entertainment | 1 (25.0%) | 3 (75.0%) |
| Health Diagnosing & Treating | 10 (66.7%) | 5 (33.3%) |
| Health Technologists | 9 (64.3%) | 5 (35.7%) |
| Total (Category) | 85 (57.4%) | 63 (42.6%) |
| Total (Overall) | 121 (54.0%) | 103 (46.0%) |
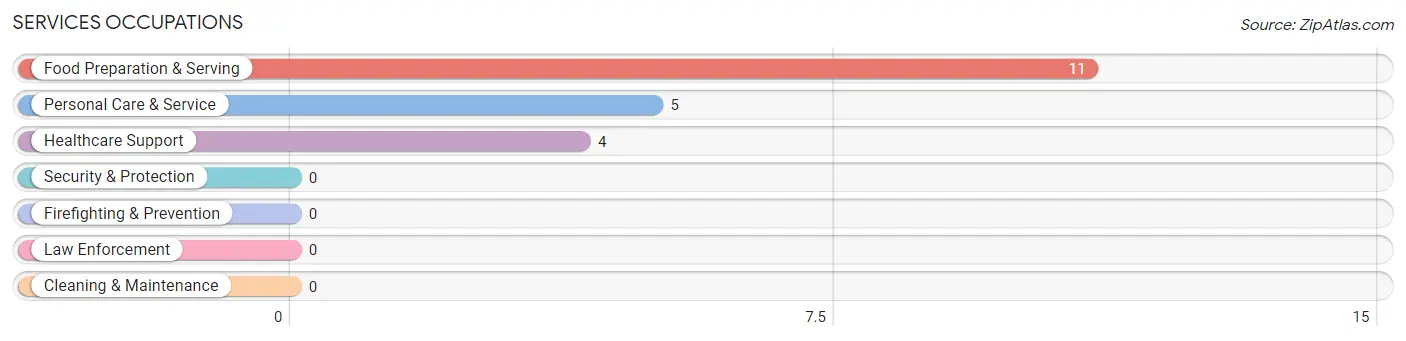
Services Occupations
The most common Services occupations in Medicine Lake are Food Preparation & Serving (11 | 4.9%), Personal Care & Service (5 | 2.2%), and Healthcare Support (4 | 1.8%).
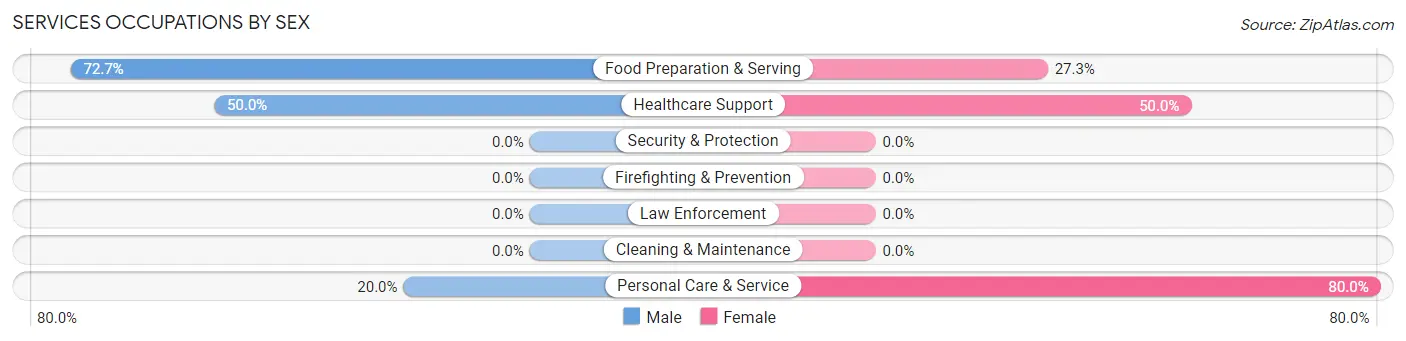
Services Occupations by Sex
Within the Services occupations in Medicine Lake, the most male-oriented occupations are Food Preparation & Serving (72.7%), Healthcare Support (50.0%), and Personal Care & Service (20.0%), while the most female-oriented occupations are Personal Care & Service (80.0%), Healthcare Support (50.0%), and Food Preparation & Serving (27.3%).
| Occupation | Male | Female |
| Healthcare Support | 2 (50.0%) | 2 (50.0%) |
| Security & Protection | 0 (0.0%) | 0 (0.0%) |
| Firefighting & Prevention | 0 (0.0%) | 0 (0.0%) |
| Law Enforcement | 0 (0.0%) | 0 (0.0%) |
| Food Preparation & Serving | 8 (72.7%) | 3 (27.3%) |
| Cleaning & Maintenance | 0 (0.0%) | 0 (0.0%) |
| Personal Care & Service | 1 (20.0%) | 4 (80.0%) |
| Total (Category) | 11 (55.0%) | 9 (45.0%) |
| Total (Overall) | 121 (54.0%) | 103 (46.0%) |
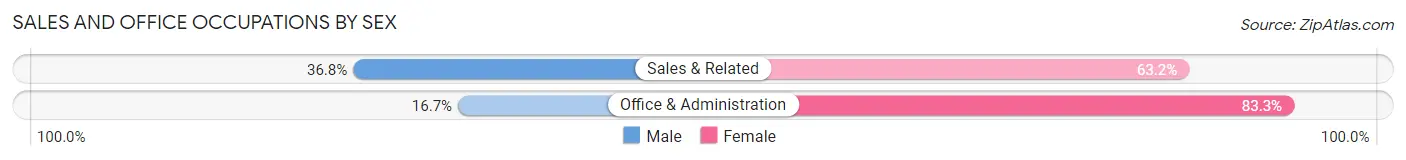
Sales and Office Occupations
The most common Sales and Office occupations in Medicine Lake are Sales & Related (19 | 8.5%), and Office & Administration (18 | 8.0%).
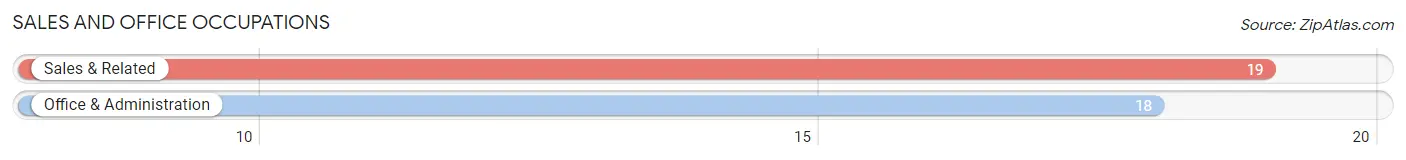
Sales and Office Occupations by Sex
| Occupation | Male | Female |
| Sales & Related | 7 (36.8%) | 12 (63.2%) |
| Office & Administration | 3 (16.7%) | 15 (83.3%) |
| Total (Category) | 10 (27.0%) | 27 (73.0%) |
| Total (Overall) | 121 (54.0%) | 103 (46.0%) |
Natural Resources, Construction and Maintenance Occupations
The most common Natural Resources, Construction and Maintenance occupations in Medicine Lake are Installation, Maintenance & Repair (5 | 2.2%), Farming, Fishing & Forestry (2 | 0.9%), and Construction & Extraction (1 | 0.4%).
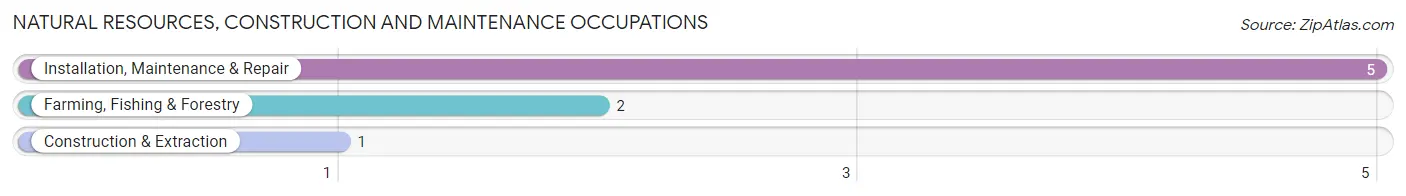
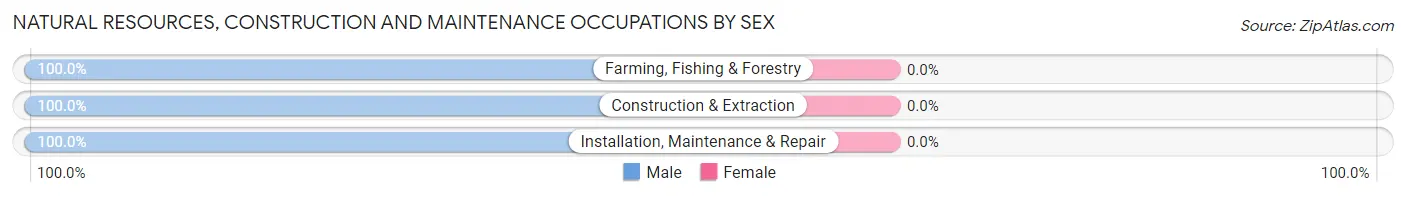
Natural Resources, Construction and Maintenance Occupations by Sex
| Occupation | Male | Female |
| Farming, Fishing & Forestry | 2 (100.0%) | 0 (0.0%) |
| Construction & Extraction | 1 (100.0%) | 0 (0.0%) |
| Installation, Maintenance & Repair | 5 (100.0%) | 0 (0.0%) |
| Total (Category) | 8 (100.0%) | 0 (0.0%) |
| Total (Overall) | 121 (54.0%) | 103 (46.0%) |
Production, Transportation and Moving Occupations
The most common Production, Transportation and Moving occupations in Medicine Lake are Material Moving (7 | 3.1%), and Transportation (4 | 1.8%).
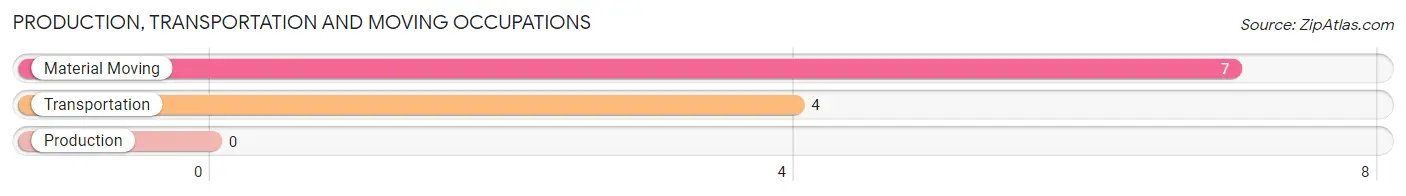
Production, Transportation and Moving Occupations by Sex
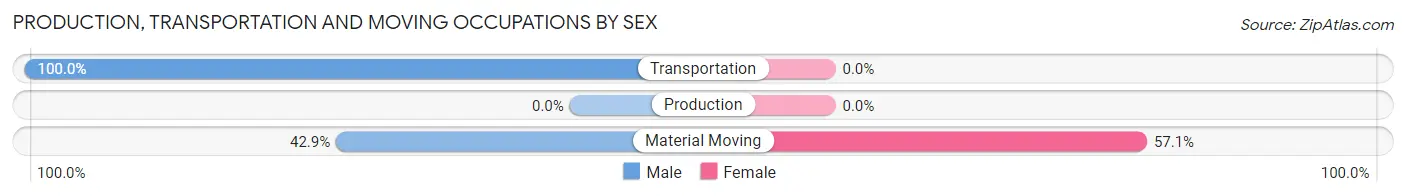
| Occupation | Male | Female |
| Production | 0 (0.0%) | 0 (0.0%) |
| Transportation | 4 (100.0%) | 0 (0.0%) |
| Material Moving | 3 (42.9%) | 4 (57.1%) |
| Total (Category) | 7 (63.6%) | 4 (36.4%) |
| Total (Overall) | 121 (54.0%) | 103 (46.0%) |
Employment Industries by Sex in Medicine Lake
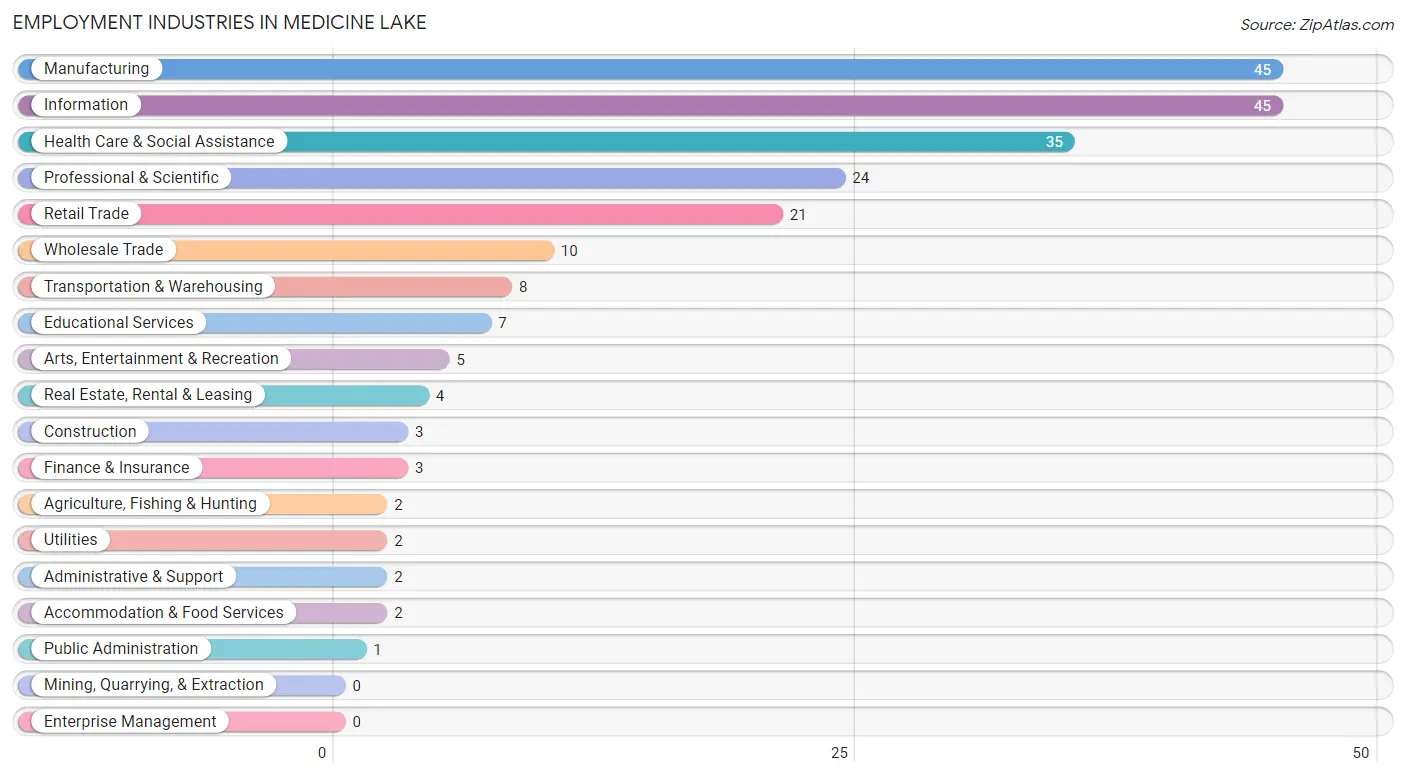
Employment Industries in Medicine Lake
The major employment industries in Medicine Lake include Manufacturing (45 | 20.1%), Information (45 | 20.1%), Health Care & Social Assistance (35 | 15.6%), Professional & Scientific (24 | 10.7%), and Retail Trade (21 | 9.4%).
Employment Industries by Sex in Medicine Lake
The Medicine Lake industries that see more men than women are Agriculture, Fishing & Hunting (100.0%), Construction (100.0%), and Finance & Insurance (100.0%), whereas the industries that tend to have a higher number of women are Utilities (100.0%), Educational Services (100.0%), and Public Administration (100.0%).
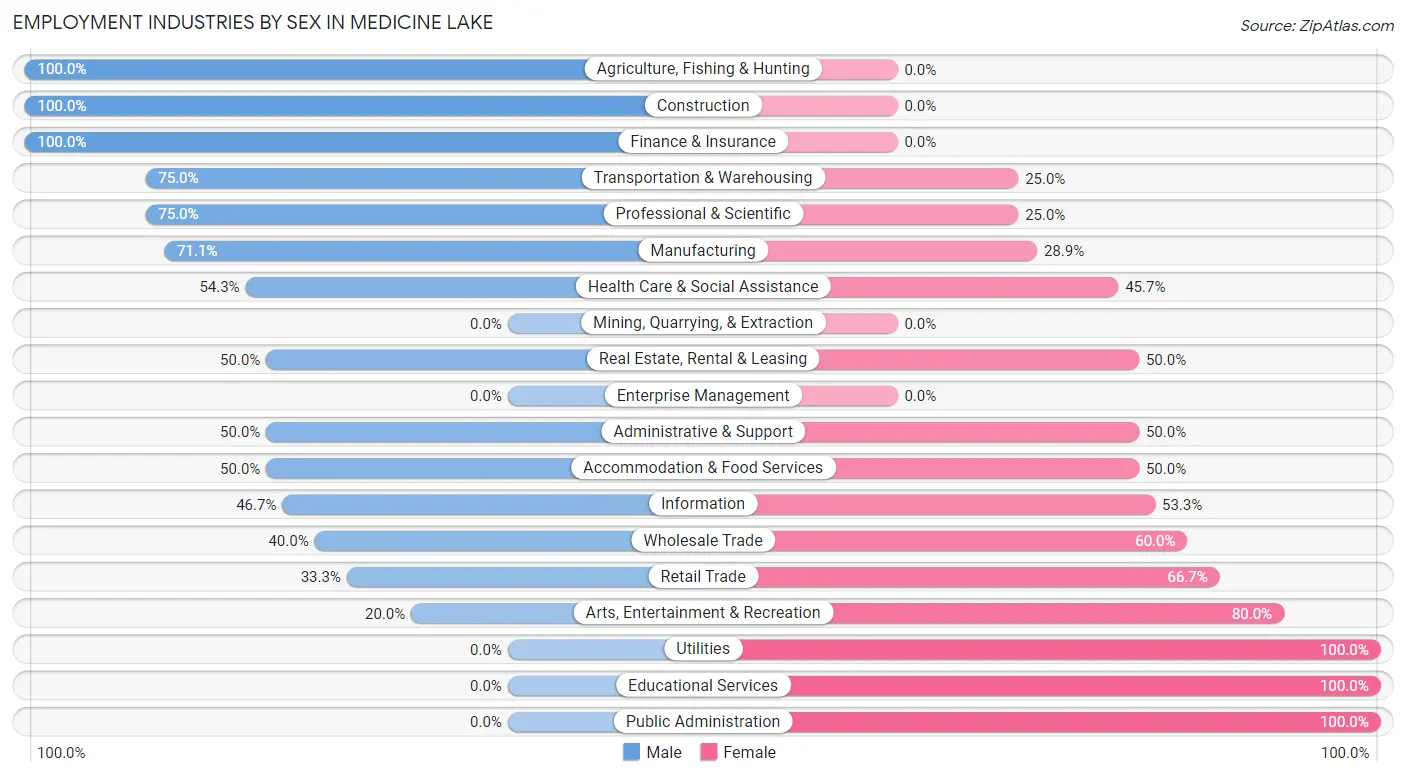
| Industry | Male | Female |
| Agriculture, Fishing & Hunting | 2 (100.0%) | 0 (0.0%) |
| Mining, Quarrying, & Extraction | 0 (0.0%) | 0 (0.0%) |
| Construction | 3 (100.0%) | 0 (0.0%) |
| Manufacturing | 32 (71.1%) | 13 (28.9%) |
| Wholesale Trade | 4 (40.0%) | 6 (60.0%) |
| Retail Trade | 7 (33.3%) | 14 (66.7%) |
| Transportation & Warehousing | 6 (75.0%) | 2 (25.0%) |
| Utilities | 0 (0.0%) | 2 (100.0%) |
| Information | 21 (46.7%) | 24 (53.3%) |
| Finance & Insurance | 3 (100.0%) | 0 (0.0%) |
| Real Estate, Rental & Leasing | 2 (50.0%) | 2 (50.0%) |
| Professional & Scientific | 18 (75.0%) | 6 (25.0%) |
| Enterprise Management | 0 (0.0%) | 0 (0.0%) |
| Administrative & Support | 1 (50.0%) | 1 (50.0%) |
| Educational Services | 0 (0.0%) | 7 (100.0%) |
| Health Care & Social Assistance | 19 (54.3%) | 16 (45.7%) |
| Arts, Entertainment & Recreation | 1 (20.0%) | 4 (80.0%) |
| Accommodation & Food Services | 1 (50.0%) | 1 (50.0%) |
| Public Administration | 0 (0.0%) | 1 (100.0%) |
| Total | 121 (54.0%) | 103 (46.0%) |
Education in Medicine Lake
School Enrollment in Medicine Lake
The most common levels of schooling among the 112 students in Medicine Lake are middle school (42 | 37.5%), high school (25 | 22.3%), and elementary school (24 | 21.4%).
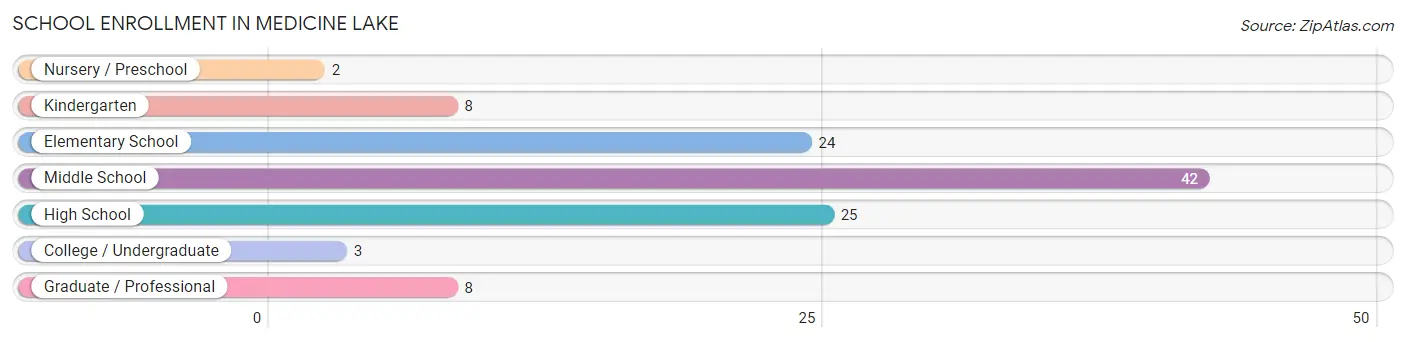
| School Level | # Students | % Students |
| Nursery / Preschool | 2 | 1.8% |
| Kindergarten | 8 | 7.1% |
| Elementary School | 24 | 21.4% |
| Middle School | 42 | 37.5% |
| High School | 25 | 22.3% |
| College / Undergraduate | 3 | 2.7% |
| Graduate / Professional | 8 | 7.1% |
| Total | 112 | 100.0% |
School Enrollment by Age by Funding Source in Medicine Lake
Out of a total of 112 students who are enrolled in schools in Medicine Lake, 23 (20.5%) attend a private institution, while the remaining 89 (79.5%) are enrolled in public schools. The age group of 3 to 4 year olds has the highest likelihood of being enrolled in private schools, with 2 (100.0% in the age bracket) enrolled. Conversely, the age group of 20 to 24 year olds has the lowest likelihood of being enrolled in a private school, with 2 (100.0% in the age bracket) attending a public institution.
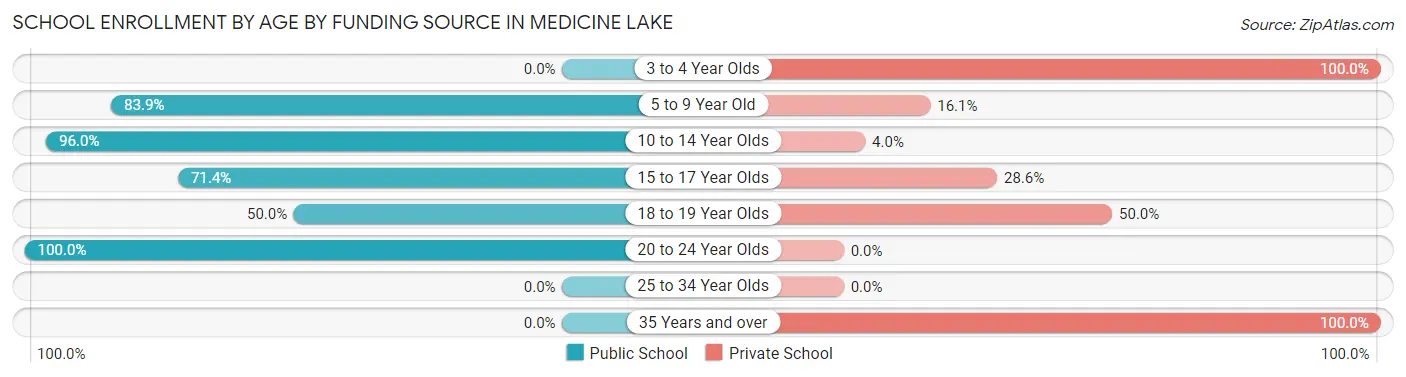
| Age Bracket | Public School | Private School |
| 3 to 4 Year Olds | 0 (0.0%) | 2 (100.0%) |
| 5 to 9 Year Old | 26 (83.9%) | 5 (16.1%) |
| 10 to 14 Year Olds | 48 (96.0%) | 2 (4.0%) |
| 15 to 17 Year Olds | 10 (71.4%) | 4 (28.6%) |
| 18 to 19 Year Olds | 3 (50.0%) | 3 (50.0%) |
| 20 to 24 Year Olds | 2 (100.0%) | 0 (0.0%) |
| 25 to 34 Year Olds | 0 (0.0%) | 0 (0.0%) |
| 35 Years and over | 0 (0.0%) | 7 (100.0%) |
| Total | 89 (79.5%) | 23 (20.5%) |
Educational Attainment by Field of Study in Medicine Lake
Business (67 | 27.8%), engineering (29 | 12.0%), literature & languages (26 | 10.8%), science & technology (17 | 7.0%), and education (17 | 7.0%) are the most common fields of study among 241 individuals in Medicine Lake who have obtained a bachelor's degree or higher.
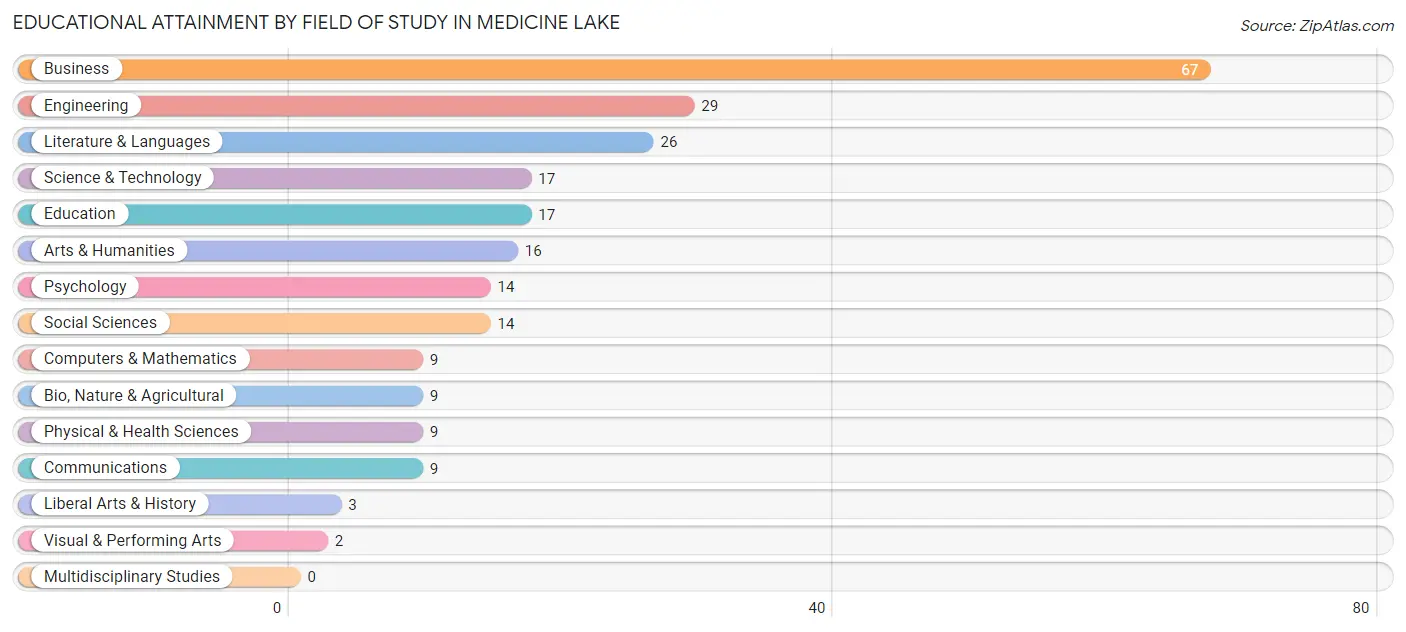
| Field of Study | # Graduates | % Graduates |
| Computers & Mathematics | 9 | 3.7% |
| Bio, Nature & Agricultural | 9 | 3.7% |
| Physical & Health Sciences | 9 | 3.7% |
| Psychology | 14 | 5.8% |
| Social Sciences | 14 | 5.8% |
| Engineering | 29 | 12.0% |
| Multidisciplinary Studies | 0 | 0.0% |
| Science & Technology | 17 | 7.0% |
| Business | 67 | 27.8% |
| Education | 17 | 7.0% |
| Literature & Languages | 26 | 10.8% |
| Liberal Arts & History | 3 | 1.2% |
| Visual & Performing Arts | 2 | 0.8% |
| Communications | 9 | 3.7% |
| Arts & Humanities | 16 | 6.6% |
| Total | 241 | 100.0% |
Transportation & Commute in Medicine Lake
Vehicle Availability by Sex in Medicine Lake
The most prevalent vehicle ownership categories in Medicine Lake are males with 2 vehicles (48, accounting for 39.7%) and females with 2 vehicles (34, making up 46.6%).
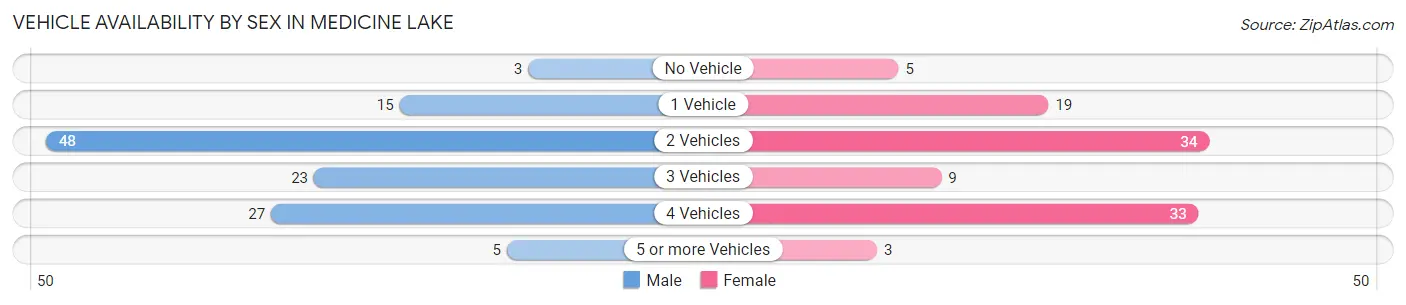
| Vehicles Available | Male | Female |
| No Vehicle | 3 (2.5%) | 5 (4.9%) |
| 1 Vehicle | 15 (12.4%) | 19 (18.4%) |
| 2 Vehicles | 48 (39.7%) | 34 (33.0%) |
| 3 Vehicles | 23 (19.0%) | 9 (8.7%) |
| 4 Vehicles | 27 (22.3%) | 33 (32.0%) |
| 5 or more Vehicles | 5 (4.1%) | 3 (2.9%) |
| Total | 121 (100.0%) | 103 (100.0%) |
Commute Time in Medicine Lake
The most frequently occuring commute durations in Medicine Lake are 5 to 9 minutes (51 commuters, 27.6%), 20 to 24 minutes (46 commuters, 24.9%), and 10 to 14 minutes (24 commuters, 13.0%).
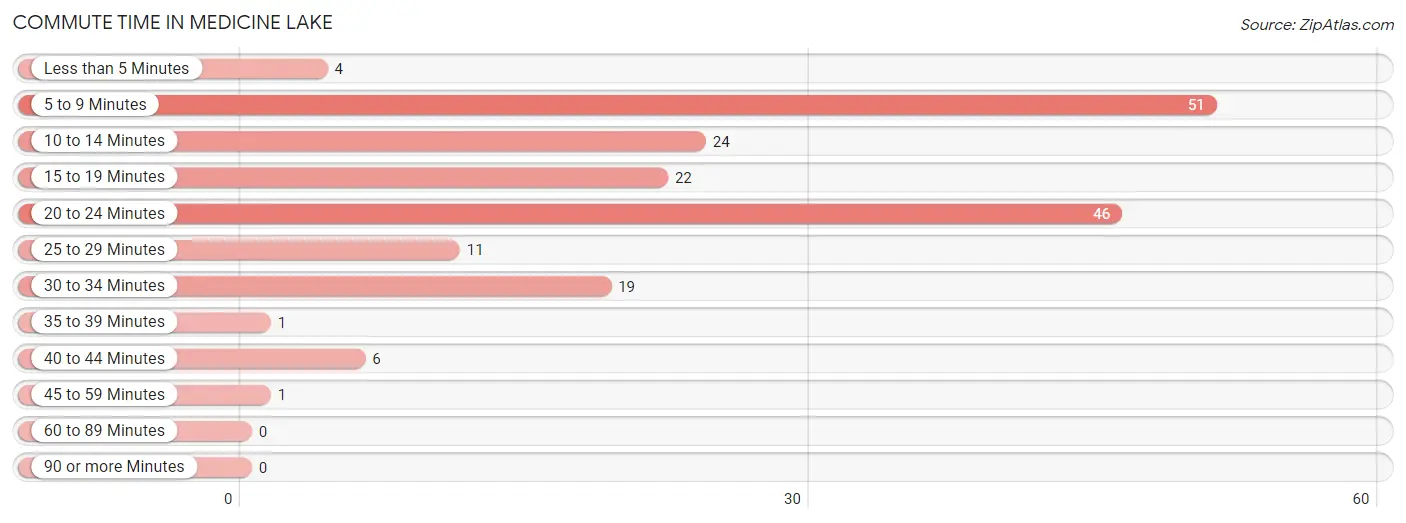
| Commute Time | # Commuters | % Commuters |
| Less than 5 Minutes | 4 | 2.2% |
| 5 to 9 Minutes | 51 | 27.6% |
| 10 to 14 Minutes | 24 | 13.0% |
| 15 to 19 Minutes | 22 | 11.9% |
| 20 to 24 Minutes | 46 | 24.9% |
| 25 to 29 Minutes | 11 | 5.9% |
| 30 to 34 Minutes | 19 | 10.3% |
| 35 to 39 Minutes | 1 | 0.5% |
| 40 to 44 Minutes | 6 | 3.2% |
| 45 to 59 Minutes | 1 | 0.5% |
| 60 to 89 Minutes | 0 | 0.0% |
| 90 or more Minutes | 0 | 0.0% |
Commute Time by Sex in Medicine Lake
The most common commute times in Medicine Lake are 20 to 24 minutes (31 commuters, 29.0%) for males and 5 to 9 minutes (27 commuters, 34.6%) for females.
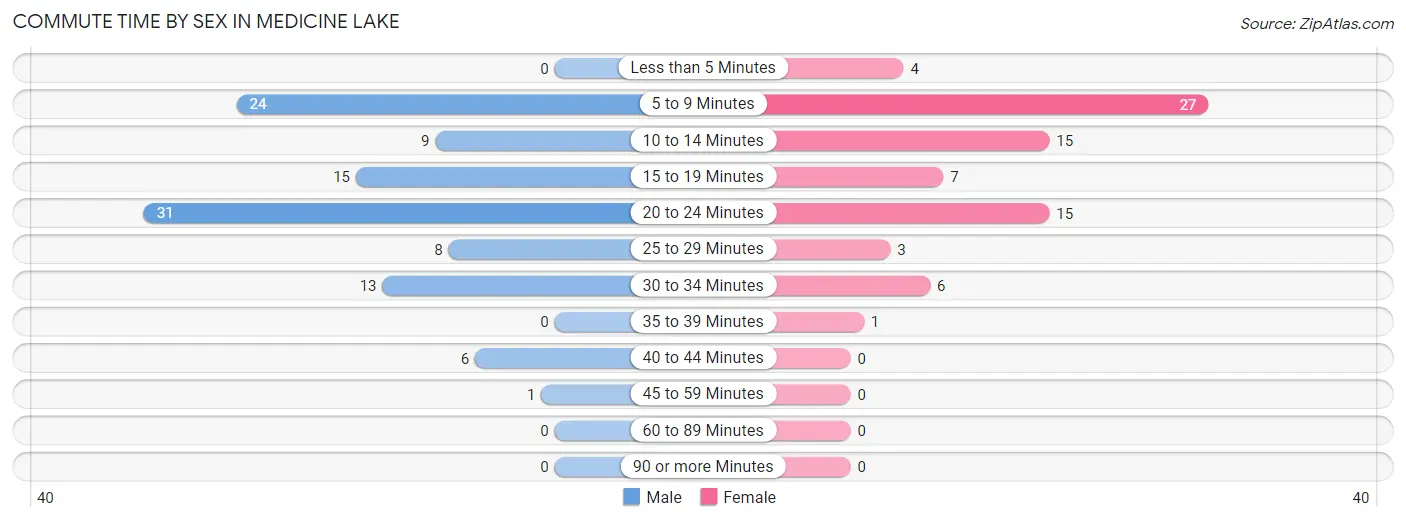
| Commute Time | Male | Female |
| Less than 5 Minutes | 0 (0.0%) | 4 (5.1%) |
| 5 to 9 Minutes | 24 (22.4%) | 27 (34.6%) |
| 10 to 14 Minutes | 9 (8.4%) | 15 (19.2%) |
| 15 to 19 Minutes | 15 (14.0%) | 7 (9.0%) |
| 20 to 24 Minutes | 31 (29.0%) | 15 (19.2%) |
| 25 to 29 Minutes | 8 (7.5%) | 3 (3.8%) |
| 30 to 34 Minutes | 13 (12.1%) | 6 (7.7%) |
| 35 to 39 Minutes | 0 (0.0%) | 1 (1.3%) |
| 40 to 44 Minutes | 6 (5.6%) | 0 (0.0%) |
| 45 to 59 Minutes | 1 (0.9%) | 0 (0.0%) |
| 60 to 89 Minutes | 0 (0.0%) | 0 (0.0%) |
| 90 or more Minutes | 0 (0.0%) | 0 (0.0%) |
Time of Departure to Work by Sex in Medicine Lake
The most frequent times of departure to work in Medicine Lake are 8:00 AM to 8:29 AM (46, 43.0%) for males and 8:00 AM to 8:29 AM (32, 41.0%) for females.
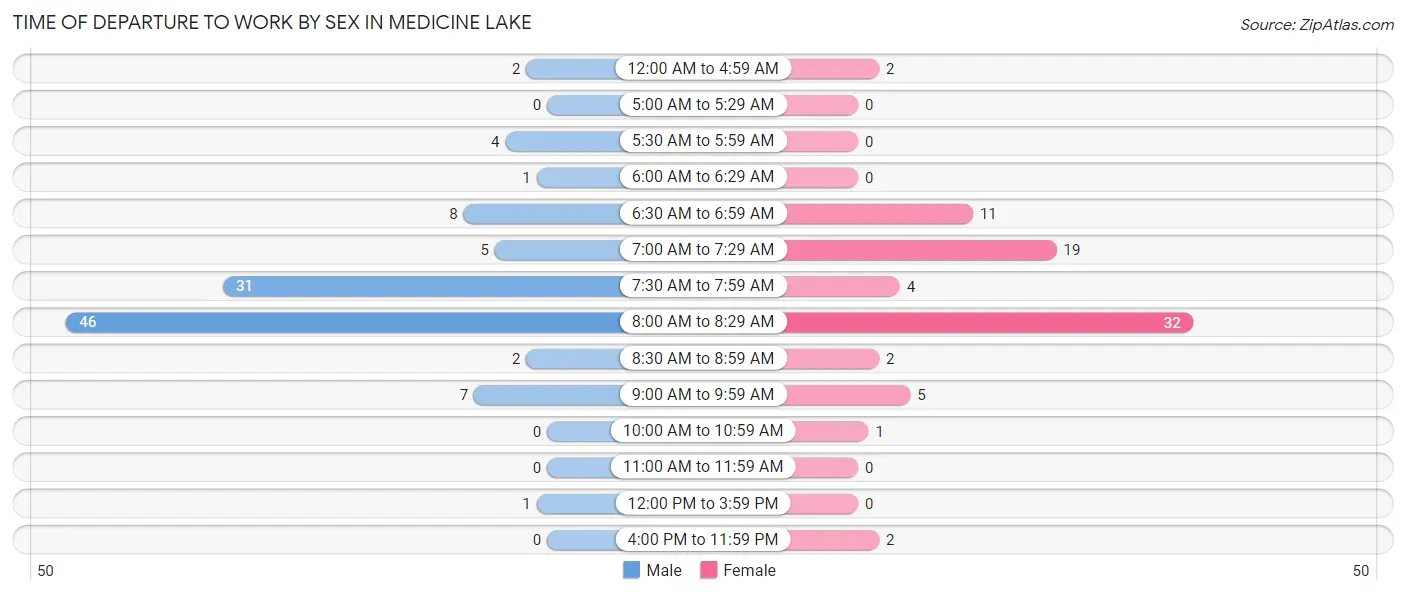
| Time of Departure | Male | Female |
| 12:00 AM to 4:59 AM | 2 (1.9%) | 2 (2.6%) |
| 5:00 AM to 5:29 AM | 0 (0.0%) | 0 (0.0%) |
| 5:30 AM to 5:59 AM | 4 (3.7%) | 0 (0.0%) |
| 6:00 AM to 6:29 AM | 1 (0.9%) | 0 (0.0%) |
| 6:30 AM to 6:59 AM | 8 (7.5%) | 11 (14.1%) |
| 7:00 AM to 7:29 AM | 5 (4.7%) | 19 (24.4%) |
| 7:30 AM to 7:59 AM | 31 (29.0%) | 4 (5.1%) |
| 8:00 AM to 8:29 AM | 46 (43.0%) | 32 (41.0%) |
| 8:30 AM to 8:59 AM | 2 (1.9%) | 2 (2.6%) |
| 9:00 AM to 9:59 AM | 7 (6.5%) | 5 (6.4%) |
| 10:00 AM to 10:59 AM | 0 (0.0%) | 1 (1.3%) |
| 11:00 AM to 11:59 AM | 0 (0.0%) | 0 (0.0%) |
| 12:00 PM to 3:59 PM | 1 (0.9%) | 0 (0.0%) |
| 4:00 PM to 11:59 PM | 0 (0.0%) | 2 (2.6%) |
| Total | 107 (100.0%) | 78 (100.0%) |
Housing Occupancy in Medicine Lake
Occupancy by Ownership in Medicine Lake
Of the total 188 dwellings in Medicine Lake, owner-occupied units account for 151 (80.3%), while renter-occupied units make up 37 (19.7%).
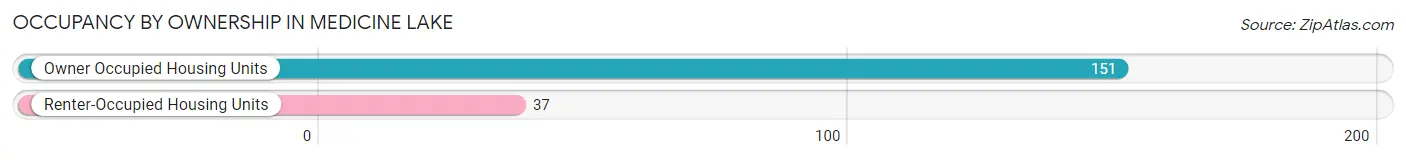
| Occupancy | # Housing Units | % Housing Units |
| Owner Occupied Housing Units | 151 | 80.3% |
| Renter-Occupied Housing Units | 37 | 19.7% |
| Total Occupied Housing Units | 188 | 100.0% |
Occupancy by Household Size in Medicine Lake
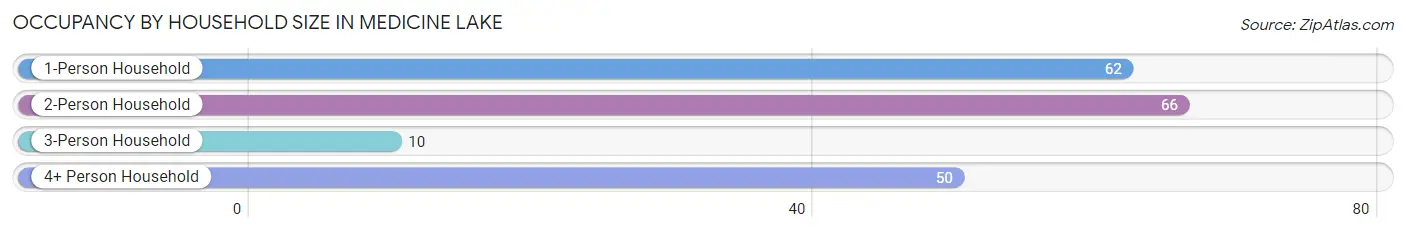
| Household Size | # Housing Units | % Housing Units |
| 1-Person Household | 62 | 33.0% |
| 2-Person Household | 66 | 35.1% |
| 3-Person Household | 10 | 5.3% |
| 4+ Person Household | 50 | 26.6% |
| Total Housing Units | 188 | 100.0% |
Occupancy by Ownership by Household Size in Medicine Lake
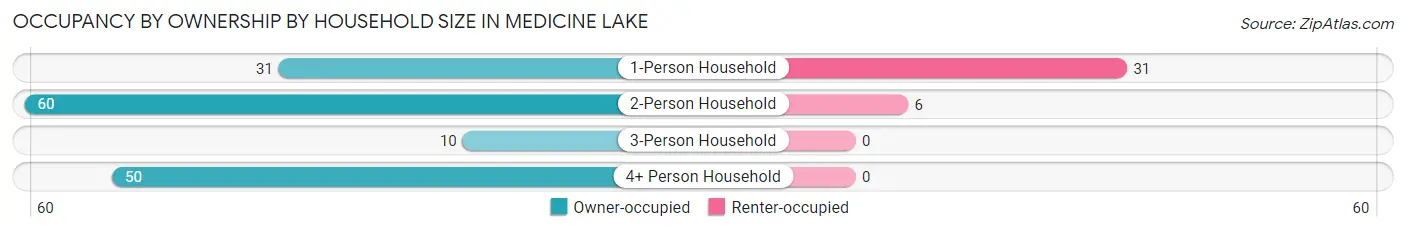
| Household Size | Owner-occupied | Renter-occupied |
| 1-Person Household | 31 (50.0%) | 31 (50.0%) |
| 2-Person Household | 60 (90.9%) | 6 (9.1%) |
| 3-Person Household | 10 (100.0%) | 0 (0.0%) |
| 4+ Person Household | 50 (100.0%) | 0 (0.0%) |
| Total Housing Units | 151 (80.3%) | 37 (19.7%) |
Occupancy by Educational Attainment in Medicine Lake
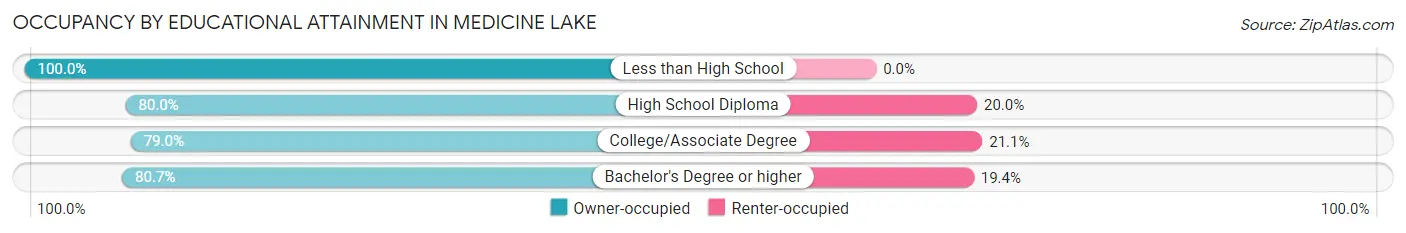
| Household Size | Owner-occupied | Renter-occupied |
| Less than High School | 2 (100.0%) | 0 (0.0%) |
| High School Diploma | 4 (80.0%) | 1 (20.0%) |
| College/Associate Degree | 45 (78.9%) | 12 (21.0%) |
| Bachelor's Degree or higher | 100 (80.6%) | 24 (19.4%) |
Occupancy by Age of Householder in Medicine Lake
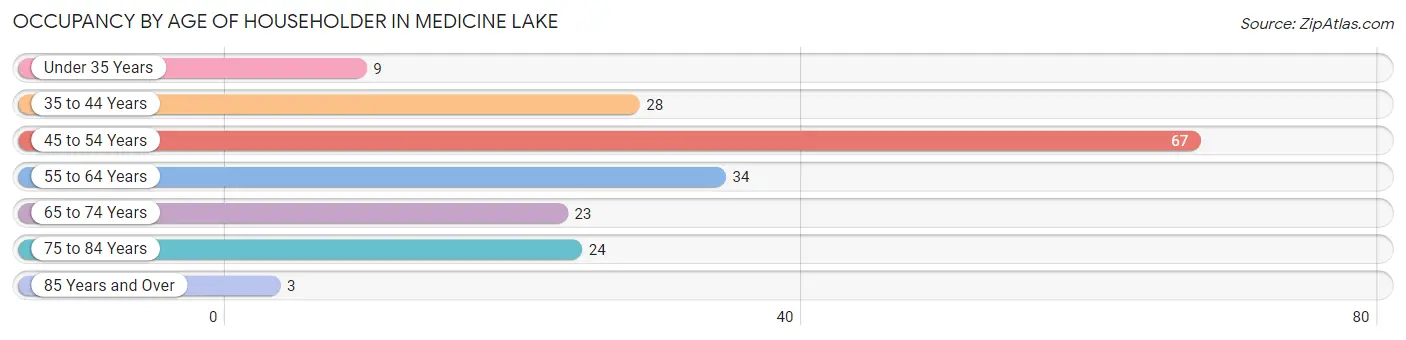
| Age Bracket | # Households | % Households |
| Under 35 Years | 9 | 4.8% |
| 35 to 44 Years | 28 | 14.9% |
| 45 to 54 Years | 67 | 35.6% |
| 55 to 64 Years | 34 | 18.1% |
| 65 to 74 Years | 23 | 12.2% |
| 75 to 84 Years | 24 | 12.8% |
| 85 Years and Over | 3 | 1.6% |
| Total | 188 | 100.0% |
Housing Finances in Medicine Lake
Median Income by Occupancy in Medicine Lake
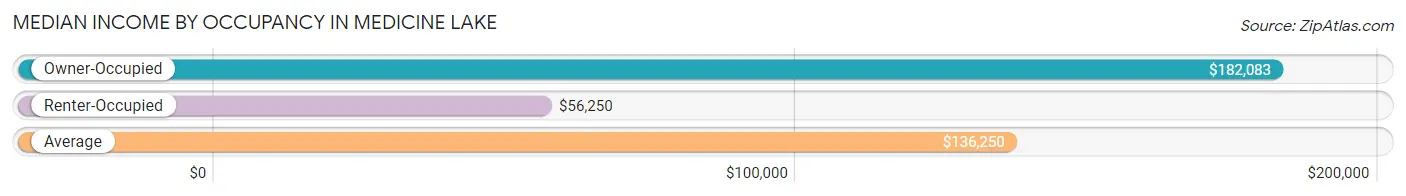
| Occupancy Type | # Households | Median Income |
| Owner-Occupied | 151 (80.3%) | $182,083 |
| Renter-Occupied | 37 (19.7%) | $56,250 |
| Average | 188 (100.0%) | $136,250 |
Occupancy by Householder Income Bracket in Medicine Lake
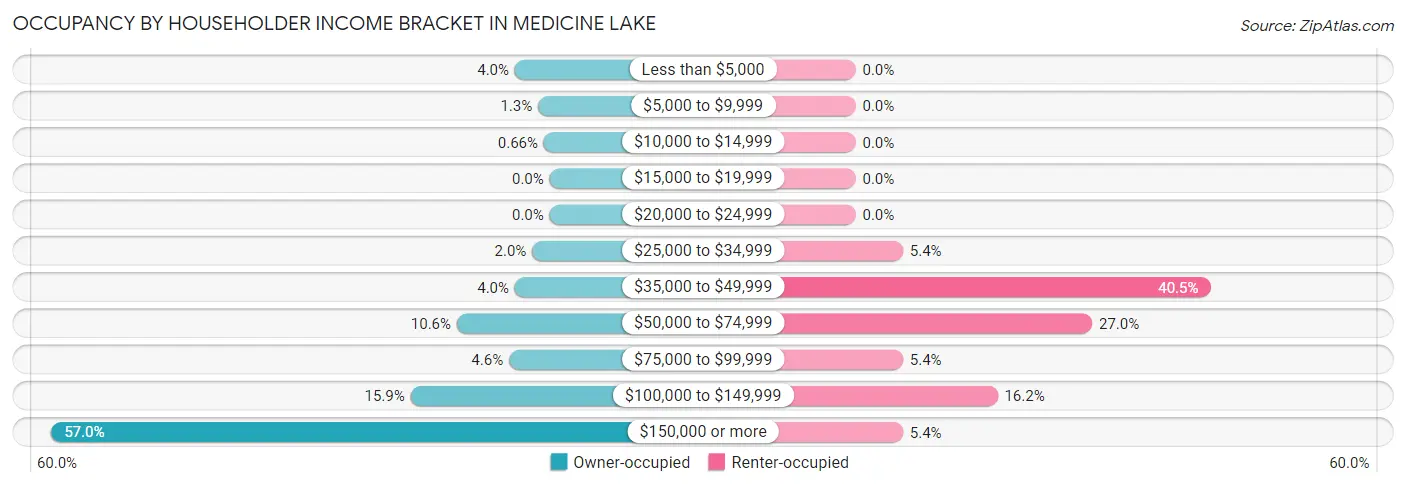
| Income Bracket | Owner-occupied | Renter-occupied |
| Less than $5,000 | 6 (4.0%) | 0 (0.0%) |
| $5,000 to $9,999 | 2 (1.3%) | 0 (0.0%) |
| $10,000 to $14,999 | 1 (0.7%) | 0 (0.0%) |
| $15,000 to $19,999 | 0 (0.0%) | 0 (0.0%) |
| $20,000 to $24,999 | 0 (0.0%) | 0 (0.0%) |
| $25,000 to $34,999 | 3 (2.0%) | 2 (5.4%) |
| $35,000 to $49,999 | 6 (4.0%) | 15 (40.5%) |
| $50,000 to $74,999 | 16 (10.6%) | 10 (27.0%) |
| $75,000 to $99,999 | 7 (4.6%) | 2 (5.4%) |
| $100,000 to $149,999 | 24 (15.9%) | 6 (16.2%) |
| $150,000 or more | 86 (57.0%) | 2 (5.4%) |
| Total | 151 (100.0%) | 37 (100.0%) |
Monthly Housing Cost Tiers in Medicine Lake
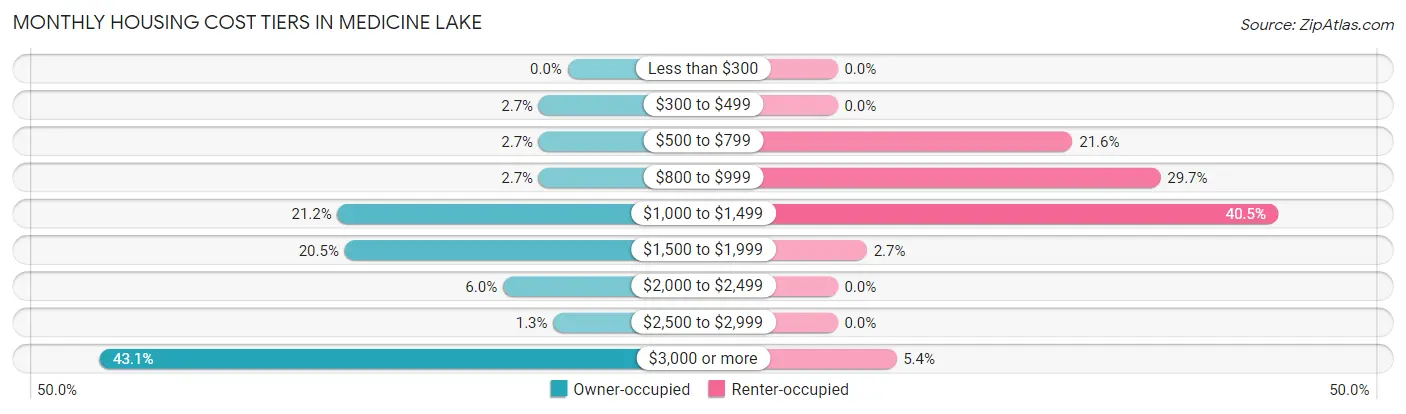
| Monthly Cost | Owner-occupied | Renter-occupied |
| Less than $300 | 0 (0.0%) | 0 (0.0%) |
| $300 to $499 | 4 (2.6%) | 0 (0.0%) |
| $500 to $799 | 4 (2.6%) | 8 (21.6%) |
| $800 to $999 | 4 (2.6%) | 11 (29.7%) |
| $1,000 to $1,499 | 32 (21.2%) | 15 (40.5%) |
| $1,500 to $1,999 | 31 (20.5%) | 1 (2.7%) |
| $2,000 to $2,499 | 9 (6.0%) | 0 (0.0%) |
| $2,500 to $2,999 | 2 (1.3%) | 0 (0.0%) |
| $3,000 or more | 65 (43.0%) | 2 (5.4%) |
| Total | 151 (100.0%) | 37 (100.0%) |
Physical Housing Characteristics in Medicine Lake
Housing Structures in Medicine Lake
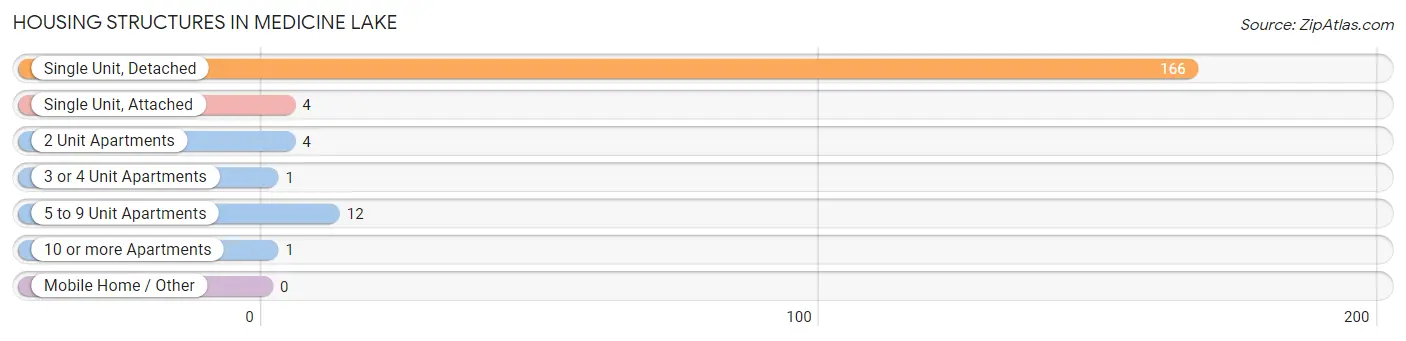
| Structure Type | # Housing Units | % Housing Units |
| Single Unit, Detached | 166 | 88.3% |
| Single Unit, Attached | 4 | 2.1% |
| 2 Unit Apartments | 4 | 2.1% |
| 3 or 4 Unit Apartments | 1 | 0.5% |
| 5 to 9 Unit Apartments | 12 | 6.4% |
| 10 or more Apartments | 1 | 0.5% |
| Mobile Home / Other | 0 | 0.0% |
| Total | 188 | 100.0% |
Housing Structures by Occupancy in Medicine Lake
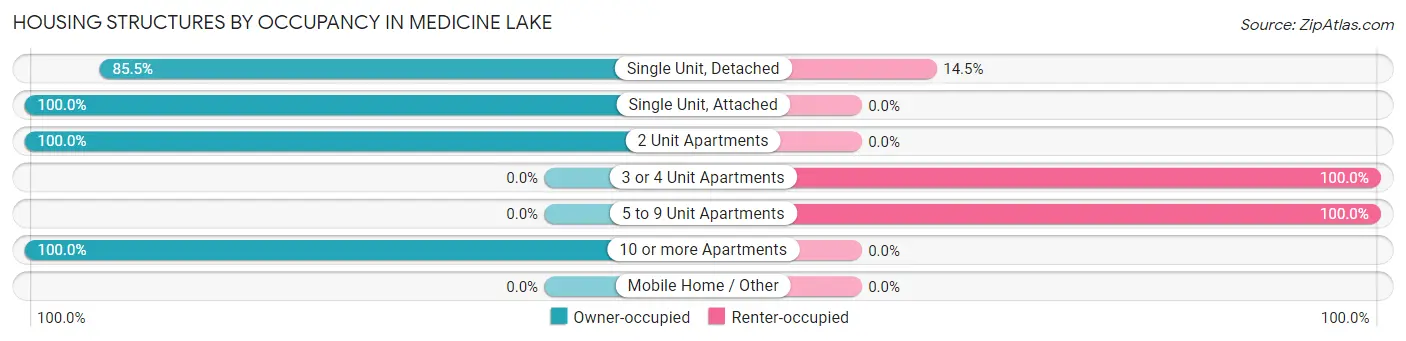
| Structure Type | Owner-occupied | Renter-occupied |
| Single Unit, Detached | 142 (85.5%) | 24 (14.5%) |
| Single Unit, Attached | 4 (100.0%) | 0 (0.0%) |
| 2 Unit Apartments | 4 (100.0%) | 0 (0.0%) |
| 3 or 4 Unit Apartments | 0 (0.0%) | 1 (100.0%) |
| 5 to 9 Unit Apartments | 0 (0.0%) | 12 (100.0%) |
| 10 or more Apartments | 1 (100.0%) | 0 (0.0%) |
| Mobile Home / Other | 0 (0.0%) | 0 (0.0%) |
| Total | 151 (80.3%) | 37 (19.7%) |
Housing Structures by Number of Rooms in Medicine Lake
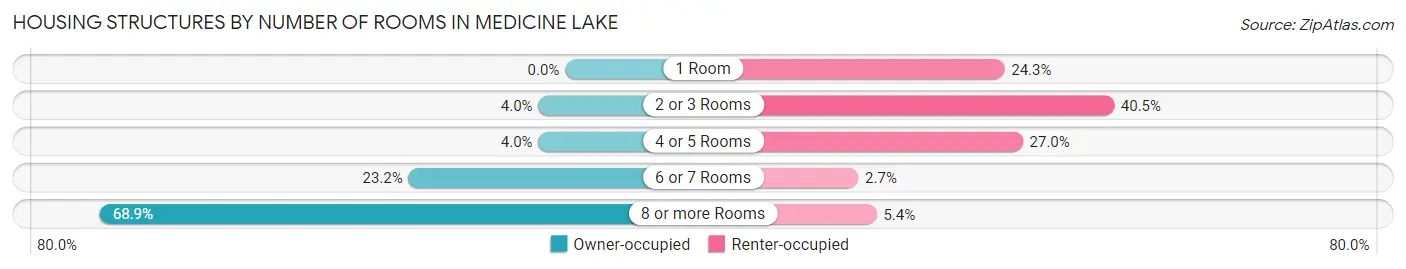
| Number of Rooms | Owner-occupied | Renter-occupied |
| 1 Room | 0 (0.0%) | 9 (24.3%) |
| 2 or 3 Rooms | 6 (4.0%) | 15 (40.5%) |
| 4 or 5 Rooms | 6 (4.0%) | 10 (27.0%) |
| 6 or 7 Rooms | 35 (23.2%) | 1 (2.7%) |
| 8 or more Rooms | 104 (68.9%) | 2 (5.4%) |
| Total | 151 (100.0%) | 37 (100.0%) |
Housing Structure by Heating Type in Medicine Lake
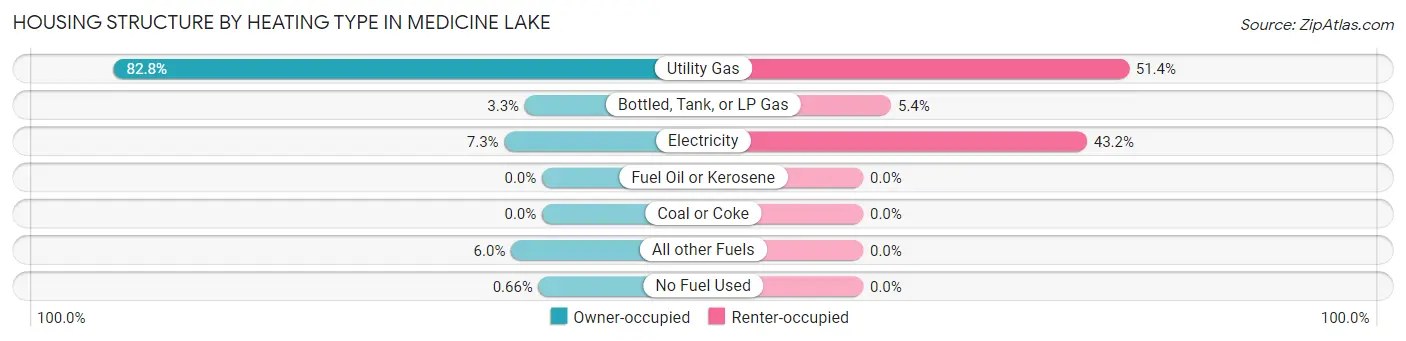
| Heating Type | Owner-occupied | Renter-occupied |
| Utility Gas | 125 (82.8%) | 19 (51.3%) |
| Bottled, Tank, or LP Gas | 5 (3.3%) | 2 (5.4%) |
| Electricity | 11 (7.3%) | 16 (43.2%) |
| Fuel Oil or Kerosene | 0 (0.0%) | 0 (0.0%) |
| Coal or Coke | 0 (0.0%) | 0 (0.0%) |
| All other Fuels | 9 (6.0%) | 0 (0.0%) |
| No Fuel Used | 1 (0.7%) | 0 (0.0%) |
| Total | 151 (100.0%) | 37 (100.0%) |
Household Vehicle Usage in Medicine Lake
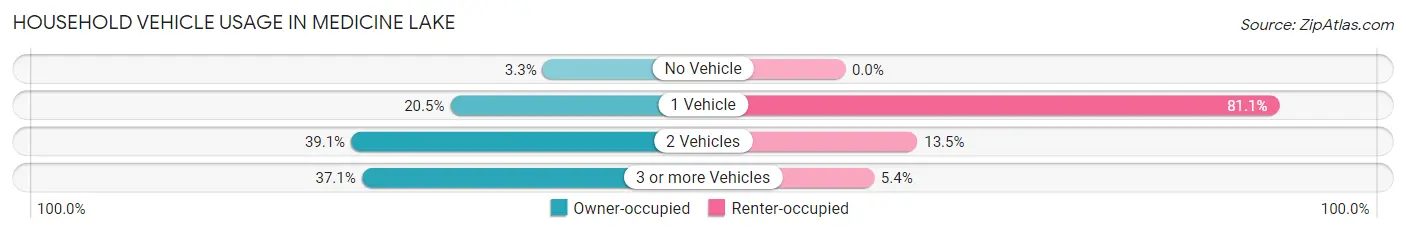
| Vehicles per Household | Owner-occupied | Renter-occupied |
| No Vehicle | 5 (3.3%) | 0 (0.0%) |
| 1 Vehicle | 31 (20.5%) | 30 (81.1%) |
| 2 Vehicles | 59 (39.1%) | 5 (13.5%) |
| 3 or more Vehicles | 56 (37.1%) | 2 (5.4%) |
| Total | 151 (100.0%) | 37 (100.0%) |
Real Estate & Mortgages in Medicine Lake
Real Estate and Mortgage Overview in Medicine Lake
| Characteristic | Without Mortgage | With Mortgage |
| Housing Units | 58 | 93 |
| Median Property Value | $1,000,000 | $1,125,000 |
| Median Household Income | $123,611 | $64 |
| Monthly Housing Costs | $1,300 | $65 |
| Real Estate Taxes | $10,001 | $0 |
Property Value by Mortgage Status in Medicine Lake
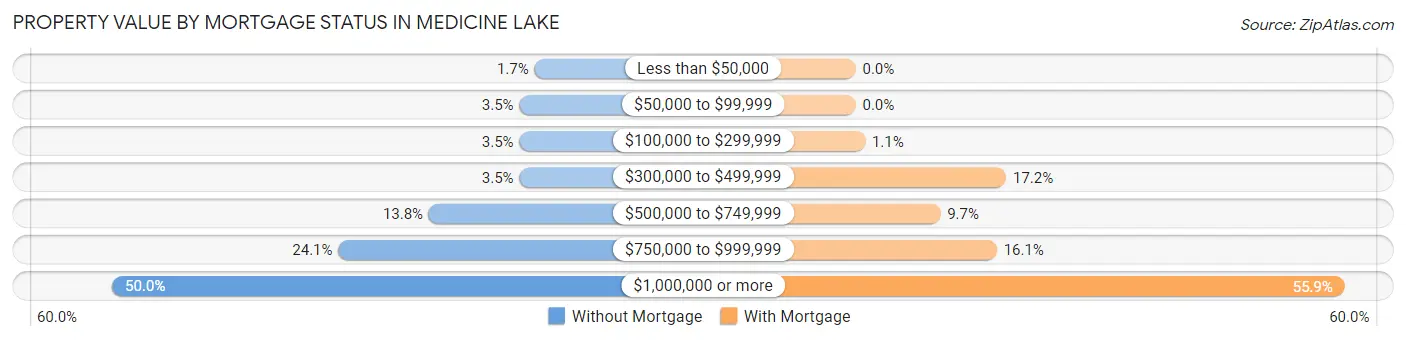
| Property Value | Without Mortgage | With Mortgage |
| Less than $50,000 | 1 (1.7%) | 0 (0.0%) |
| $50,000 to $99,999 | 2 (3.5%) | 0 (0.0%) |
| $100,000 to $299,999 | 2 (3.5%) | 1 (1.1%) |
| $300,000 to $499,999 | 2 (3.5%) | 16 (17.2%) |
| $500,000 to $749,999 | 8 (13.8%) | 9 (9.7%) |
| $750,000 to $999,999 | 14 (24.1%) | 15 (16.1%) |
| $1,000,000 or more | 29 (50.0%) | 52 (55.9%) |
| Total | 58 (100.0%) | 93 (100.0%) |
Household Income by Mortgage Status in Medicine Lake
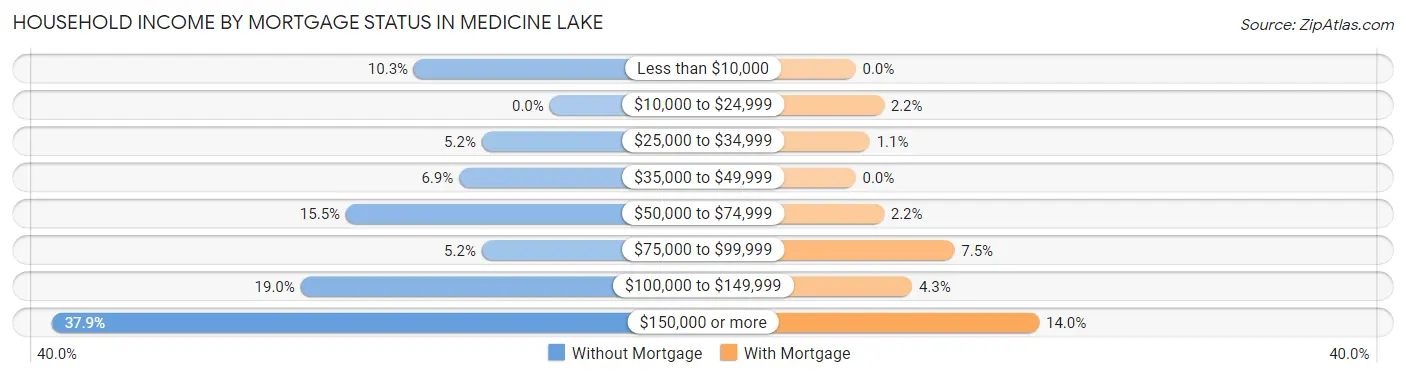
| Household Income | Without Mortgage | With Mortgage |
| Less than $10,000 | 6 (10.3%) | 0 (0.0%) |
| $10,000 to $24,999 | 0 (0.0%) | 2 (2.1%) |
| $25,000 to $34,999 | 3 (5.2%) | 1 (1.1%) |
| $35,000 to $49,999 | 4 (6.9%) | 0 (0.0%) |
| $50,000 to $74,999 | 9 (15.5%) | 2 (2.1%) |
| $75,000 to $99,999 | 3 (5.2%) | 7 (7.5%) |
| $100,000 to $149,999 | 11 (19.0%) | 4 (4.3%) |
| $150,000 or more | 22 (37.9%) | 13 (14.0%) |
| Total | 58 (100.0%) | 93 (100.0%) |
Property Value to Household Income Ratio in Medicine Lake
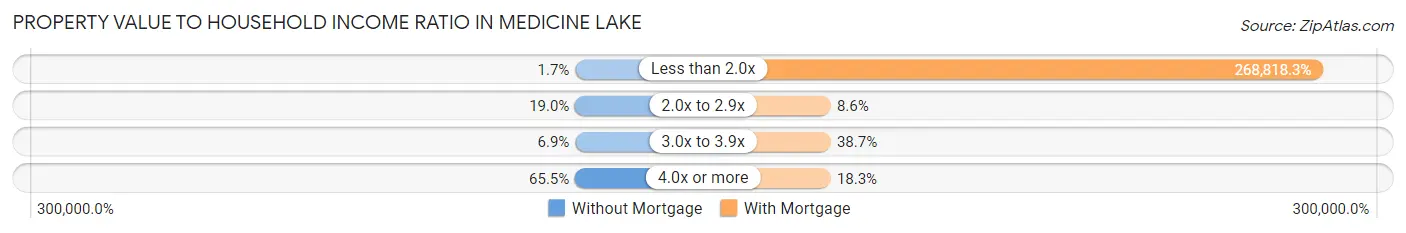
| Value-to-Income Ratio | Without Mortgage | With Mortgage |
| Less than 2.0x | 1 (1.7%) | 250,001 (268,818.3%) |
| 2.0x to 2.9x | 11 (19.0%) | 8 (8.6%) |
| 3.0x to 3.9x | 4 (6.9%) | 36 (38.7%) |
| 4.0x or more | 38 (65.5%) | 17 (18.3%) |
| Total | 58 (100.0%) | 93 (100.0%) |
Real Estate Taxes by Mortgage Status in Medicine Lake
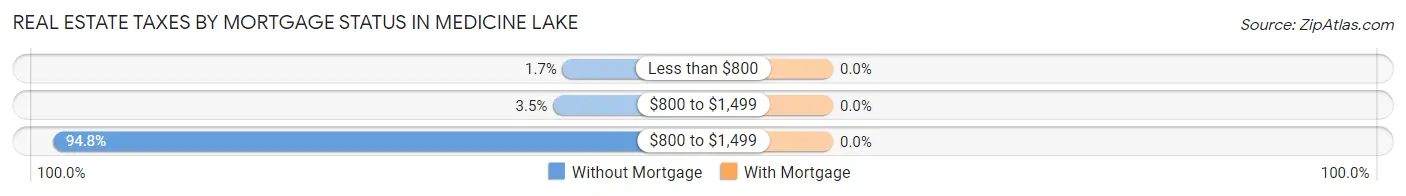
| Property Taxes | Without Mortgage | With Mortgage |
| Less than $800 | 1 (1.7%) | 0 (0.0%) |
| $800 to $1,499 | 2 (3.5%) | 0 (0.0%) |
| $800 to $1,499 | 55 (94.8%) | 0 (0.0%) |
| Total | 58 (100.0%) | 93 (100.0%) |
Health & Disability in Medicine Lake
Health Insurance Coverage by Age in Medicine Lake
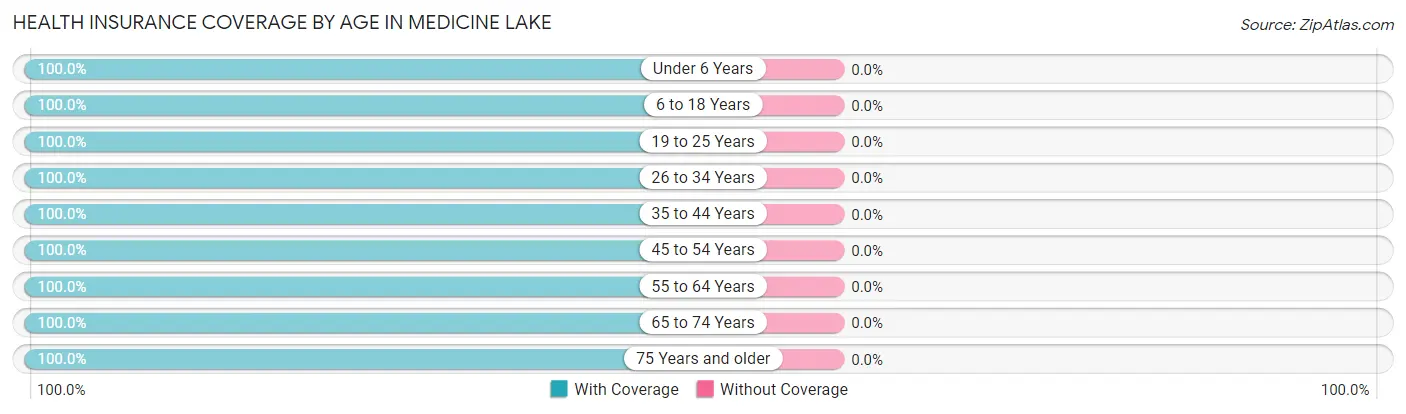
| Age Bracket | With Coverage | Without Coverage |
| Under 6 Years | 12 (100.0%) | 0 (0.0%) |
| 6 to 18 Years | 93 (100.0%) | 0 (0.0%) |
| 19 to 25 Years | 13 (100.0%) | 0 (0.0%) |
| 26 to 34 Years | 34 (100.0%) | 0 (0.0%) |
| 35 to 44 Years | 51 (100.0%) | 0 (0.0%) |
| 45 to 54 Years | 91 (100.0%) | 0 (0.0%) |
| 55 to 64 Years | 50 (100.0%) | 0 (0.0%) |
| 65 to 74 Years | 33 (100.0%) | 0 (0.0%) |
| 75 Years and older | 42 (100.0%) | 0 (0.0%) |
| Total | 419 (100.0%) | 0 (0.0%) |
Health Insurance Coverage by Citizenship Status in Medicine Lake
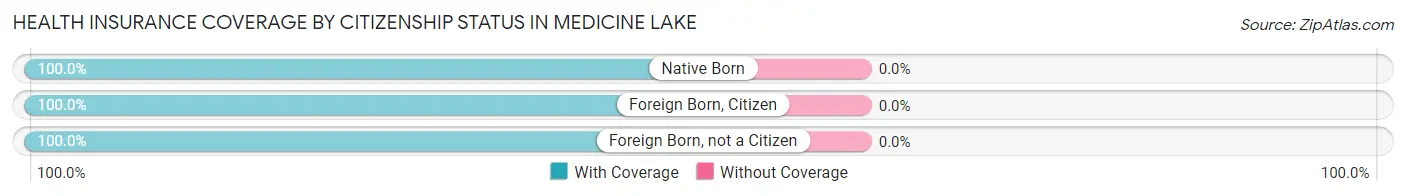
| Citizenship Status | With Coverage | Without Coverage |
| Native Born | 12 (100.0%) | 0 (0.0%) |
| Foreign Born, Citizen | 93 (100.0%) | 0 (0.0%) |
| Foreign Born, not a Citizen | 13 (100.0%) | 0 (0.0%) |
Health Insurance Coverage by Household Income in Medicine Lake
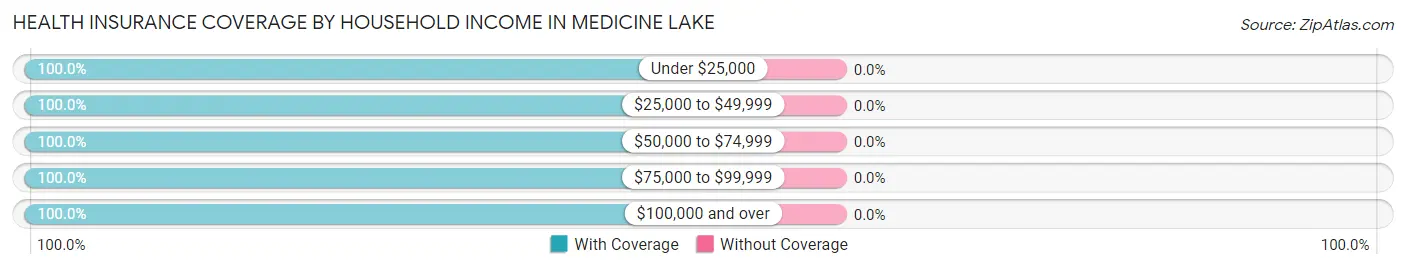
| Household Income | With Coverage | Without Coverage |
| Under $25,000 | 15 (100.0%) | 0 (0.0%) |
| $25,000 to $49,999 | 30 (100.0%) | 0 (0.0%) |
| $50,000 to $74,999 | 39 (100.0%) | 0 (0.0%) |
| $75,000 to $99,999 | 16 (100.0%) | 0 (0.0%) |
| $100,000 and over | 319 (100.0%) | 0 (0.0%) |
Public vs Private Health Insurance Coverage by Age in Medicine Lake
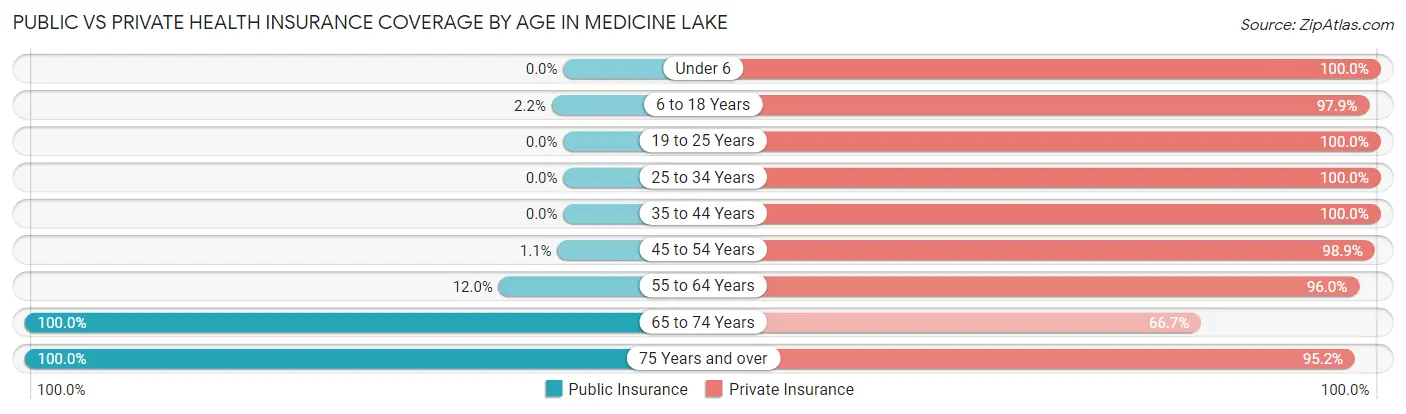
| Age Bracket | Public Insurance | Private Insurance |
| Under 6 | 0 (0.0%) | 12 (100.0%) |
| 6 to 18 Years | 2 (2.1%) | 91 (97.9%) |
| 19 to 25 Years | 0 (0.0%) | 13 (100.0%) |
| 25 to 34 Years | 0 (0.0%) | 34 (100.0%) |
| 35 to 44 Years | 0 (0.0%) | 51 (100.0%) |
| 45 to 54 Years | 1 (1.1%) | 90 (98.9%) |
| 55 to 64 Years | 6 (12.0%) | 48 (96.0%) |
| 65 to 74 Years | 33 (100.0%) | 22 (66.7%) |
| 75 Years and over | 42 (100.0%) | 40 (95.2%) |
| Total | 84 (20.1%) | 401 (95.7%) |
Disability Status by Sex by Age in Medicine Lake
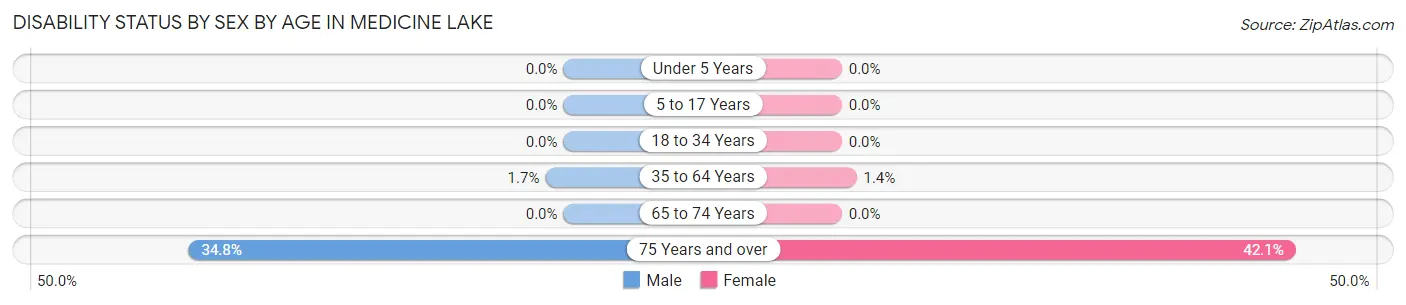
| Age Bracket | Male | Female |
| Under 5 Years | 0 (0.0%) | 0 (0.0%) |
| 5 to 17 Years | 0 (0.0%) | 0 (0.0%) |
| 18 to 34 Years | 0 (0.0%) | 0 (0.0%) |
| 35 to 64 Years | 2 (1.7%) | 1 (1.4%) |
| 65 to 74 Years | 0 (0.0%) | 0 (0.0%) |
| 75 Years and over | 8 (34.8%) | 8 (42.1%) |
Disability Class by Sex by Age in Medicine Lake
Disability Class: Hearing Difficulty
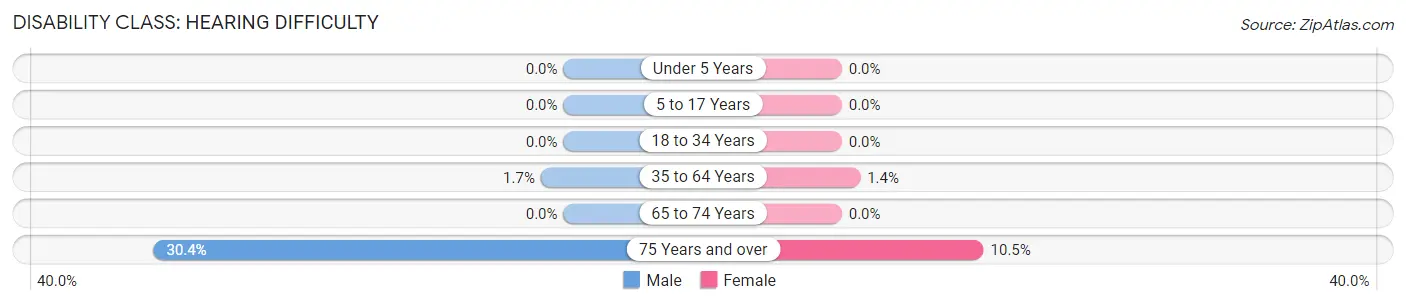
| Age Bracket | Male | Female |
| Under 5 Years | 0 (0.0%) | 0 (0.0%) |
| 5 to 17 Years | 0 (0.0%) | 0 (0.0%) |
| 18 to 34 Years | 0 (0.0%) | 0 (0.0%) |
| 35 to 64 Years | 2 (1.7%) | 1 (1.4%) |
| 65 to 74 Years | 0 (0.0%) | 0 (0.0%) |
| 75 Years and over | 7 (30.4%) | 2 (10.5%) |
Disability Class: Vision Difficulty
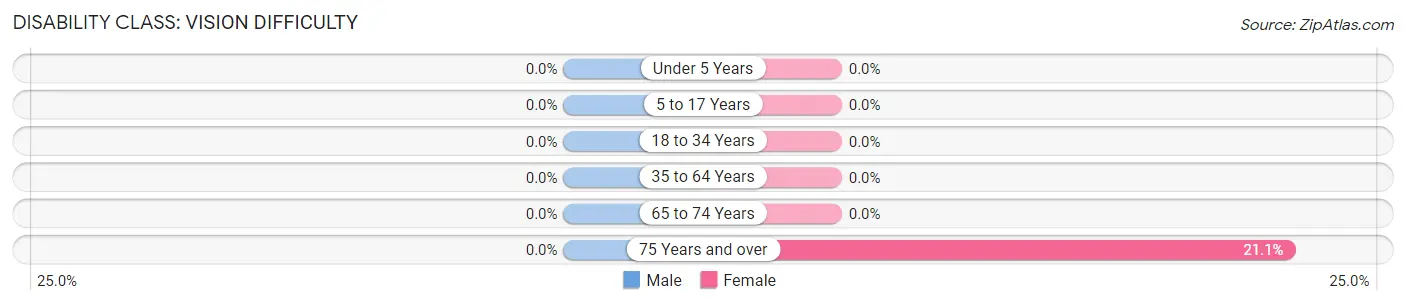
| Age Bracket | Male | Female |
| Under 5 Years | 0 (0.0%) | 0 (0.0%) |
| 5 to 17 Years | 0 (0.0%) | 0 (0.0%) |
| 18 to 34 Years | 0 (0.0%) | 0 (0.0%) |
| 35 to 64 Years | 0 (0.0%) | 0 (0.0%) |
| 65 to 74 Years | 0 (0.0%) | 0 (0.0%) |
| 75 Years and over | 0 (0.0%) | 4 (21.0%) |
Disability Class: Cognitive Difficulty
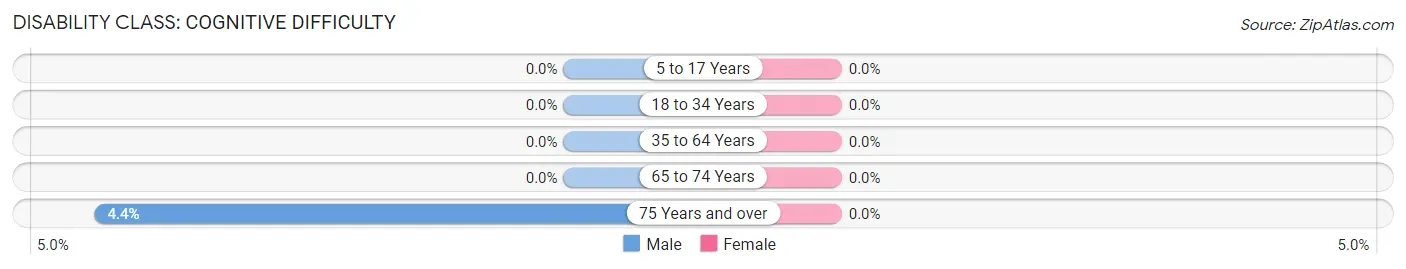
| Age Bracket | Male | Female |
| 5 to 17 Years | 0 (0.0%) | 0 (0.0%) |
| 18 to 34 Years | 0 (0.0%) | 0 (0.0%) |
| 35 to 64 Years | 0 (0.0%) | 0 (0.0%) |
| 65 to 74 Years | 0 (0.0%) | 0 (0.0%) |
| 75 Years and over | 1 (4.3%) | 0 (0.0%) |
Disability Class: Ambulatory Difficulty
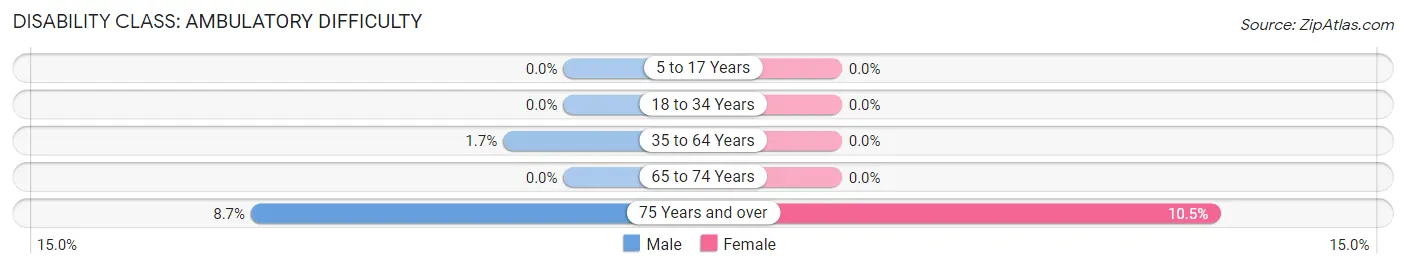
| Age Bracket | Male | Female |
| 5 to 17 Years | 0 (0.0%) | 0 (0.0%) |
| 18 to 34 Years | 0 (0.0%) | 0 (0.0%) |
| 35 to 64 Years | 2 (1.7%) | 0 (0.0%) |
| 65 to 74 Years | 0 (0.0%) | 0 (0.0%) |
| 75 Years and over | 2 (8.7%) | 2 (10.5%) |
Disability Class: Self-Care Difficulty
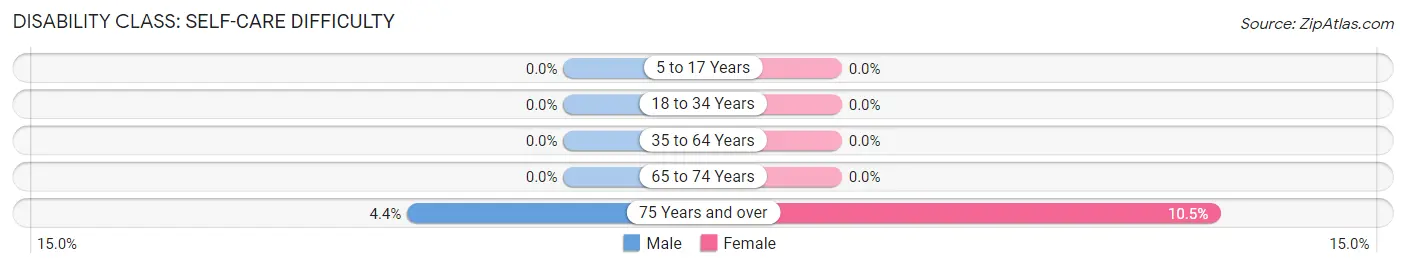
| Age Bracket | Male | Female |
| 5 to 17 Years | 0 (0.0%) | 0 (0.0%) |
| 18 to 34 Years | 0 (0.0%) | 0 (0.0%) |
| 35 to 64 Years | 0 (0.0%) | 0 (0.0%) |
| 65 to 74 Years | 0 (0.0%) | 0 (0.0%) |
| 75 Years and over | 1 (4.3%) | 2 (10.5%) |
Technology Access in Medicine Lake
Computing Device Access in Medicine Lake
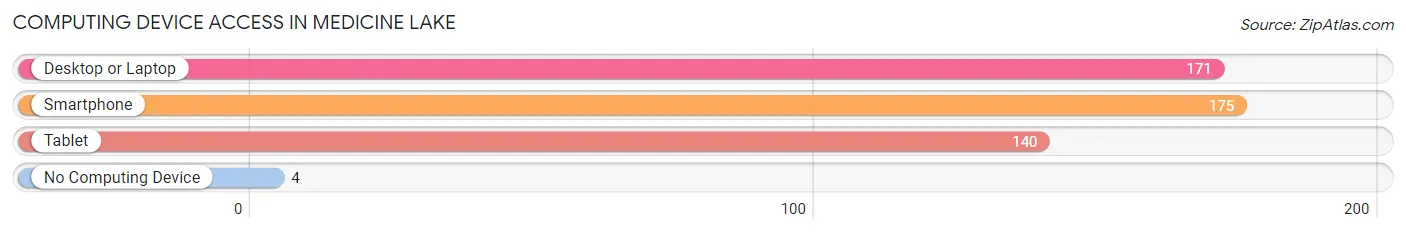
| Device Type | # Households | % Households |
| Desktop or Laptop | 171 | 91.0% |
| Smartphone | 175 | 93.1% |
| Tablet | 140 | 74.5% |
| No Computing Device | 4 | 2.1% |
| Total | 188 | 100.0% |
Internet Access in Medicine Lake
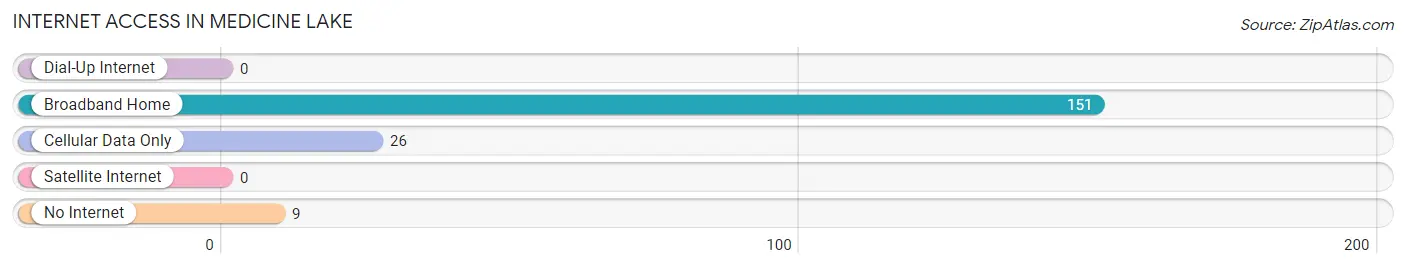
| Internet Type | # Households | % Households |
| Dial-Up Internet | 0 | 0.0% |
| Broadband Home | 151 | 80.3% |
| Cellular Data Only | 26 | 13.8% |
| Satellite Internet | 0 | 0.0% |
| No Internet | 9 | 4.8% |
| Total | 188 | 100.0% |
Medicine Lake Summary
Medicine Lake is a small town located in the northwestern corner of Minnesota, in the United States. It is situated in the heart of the Red River Valley, and is surrounded by rolling hills and lush forests. The town is located on the banks of Medicine Lake, a small lake that is part of the Red River watershed. The town has a population of just over 500 people, and is a popular destination for outdoor recreation.
History
The area around Medicine Lake has been inhabited for thousands of years. The first known inhabitants were the Dakota Sioux, who used the lake for fishing and hunting. The first European settlers arrived in the area in the late 1800s, and the town of Medicine Lake was officially established in 1887. The town was named after the nearby lake, which was believed to have healing properties.
The town grew slowly over the years, and by the early 1900s it had become a popular destination for tourists and outdoor enthusiasts. The town was also home to a number of businesses, including a hotel, a general store, and a sawmill.
Geography
Medicine Lake is located in northwestern Minnesota, in the Red River Valley. The town is situated on the banks of Medicine Lake, a small lake that is part of the Red River watershed. The lake is surrounded by rolling hills and lush forests, and is a popular destination for outdoor recreation.
The town is located about 25 miles north of the city of Fargo, North Dakota, and about 50 miles south of the city of Grand Forks, North Dakota. The nearest major city is Minneapolis, which is about 200 miles to the south.
Economy
The economy of Medicine Lake is largely based on tourism and outdoor recreation. The town is a popular destination for fishing, hunting, camping, and other outdoor activities. The town is also home to a number of businesses, including a hotel, a general store, and a sawmill.
Demographics
As of the 2010 census, the population of Medicine Lake was 514. The town has a median age of 44.7 years, and a median household income of $45,000. The town is predominantly white, with about 95% of the population identifying as such. The town also has a small Native American population, with about 4% of the population identifying as Native American.
Common Questions
What is Per Capita Income in Medicine Lake?
Per Capita income in Medicine Lake is $105,704.
What is the Median Family Income in Medicine Lake?
Median Family Income in Medicine Lake is $250,001.
What is the Median Household income in Medicine Lake?
Median Household Income in Medicine Lake is $136,250.
What is Inequality or Gini Index in Medicine Lake?
Inequality or Gini Index in Medicine Lake is 0.50.
What is the Total Population of Medicine Lake?
Total Population of Medicine Lake is 419.
What is the Total Male Population of Medicine Lake?
Total Male Population of Medicine Lake is 224.
What is the Total Female Population of Medicine Lake?
Total Female Population of Medicine Lake is 195.
What is the Ratio of Males per 100 Females in Medicine Lake?
There are 114.87 Males per 100 Females in Medicine Lake.
What is the Ratio of Females per 100 Males in Medicine Lake?
There are 87.05 Females per 100 Males in Medicine Lake.
What is the Median Population Age in Medicine Lake?
Median Population Age in Medicine Lake is 45.4 Years.
What is the Average Family Size in Medicine Lake
Average Family Size in Medicine Lake is 2.9 People.
What is the Average Household Size in Medicine Lake
Average Household Size in Medicine Lake is 2.2 People.
How Large is the Labor Force in Medicine Lake?
There are 224 People in the Labor Forcein in Medicine Lake.
What is the Percentage of People in the Labor Force in Medicine Lake?
68.1% of People are in the Labor Force in Medicine Lake.