Cities with the Highest Percentage of Immigrants from Croatia in New Jersey
RELATED REPORTS & OPTIONS
Croatia
New Jersey
Compare Cities
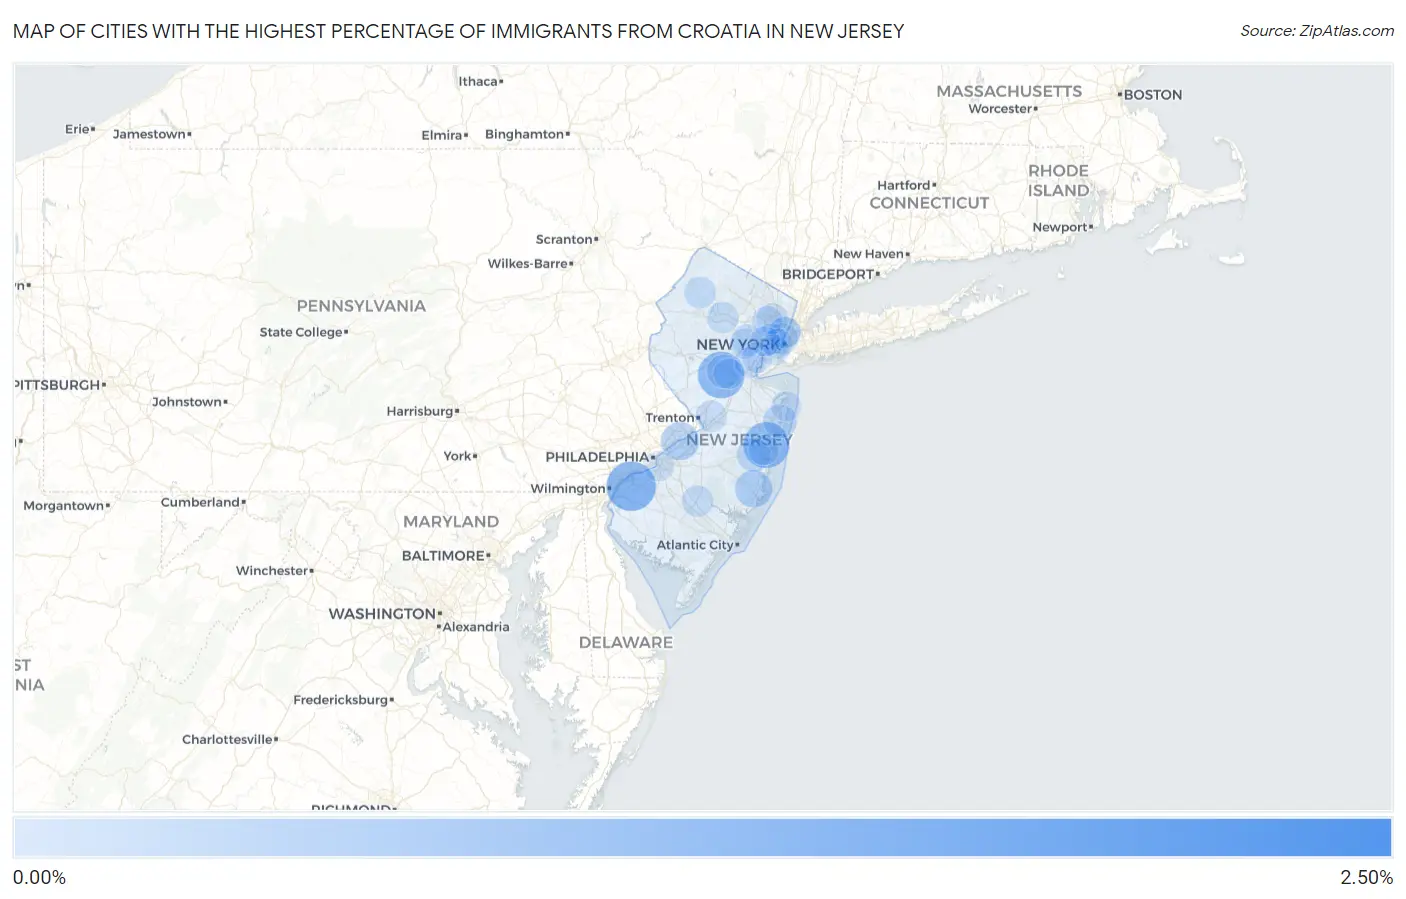
Map of Cities with the Highest Percentage of Immigrants from Croatia in New Jersey
0.00%
2.50%
Cities with the Highest Percentage of Immigrants from Croatia in New Jersey
| City | Croatia | vs State | vs National | |
| 1. | Jobstown | 2.45% | 0.028%(+2.42)#1 | 0.012%(+2.44)#3 |
| 2. | Fairview Borough | 2.32% | 0.028%(+2.29)#2 | 0.012%(+2.31)#4 |
| 3. | North Haledon Borough | 1.41% | 0.028%(+1.38)#3 | 0.012%(+1.40)#13 |
| 4. | Beckett | 1.29% | 0.028%(+1.26)#4 | 0.012%(+1.28)#17 |
| 5. | East Millstone | 1.11% | 0.028%(+1.08)#5 | 0.012%(+1.10)#19 |
| 6. | Leisure Village East | 1.05% | 0.028%(+1.02)#6 | 0.012%(+1.04)#22 |
| 7. | Hillsdale Borough | 0.87% | 0.028%(+0.841)#7 | 0.012%(+0.858)#31 |
| 8. | Ridgefield Borough | 0.75% | 0.028%(+0.722)#8 | 0.012%(+0.739)#44 |
| 9. | Harrington Park Borough | 0.70% | 0.028%(+0.676)#9 | 0.012%(+0.693)#48 |
| 10. | Cliffside Park Borough | 0.63% | 0.028%(+0.598)#10 | 0.012%(+0.615)#56 |
| 11. | Beverly | 0.52% | 0.028%(+0.491)#11 | 0.012%(+0.508)#74 |
| 12. | West Long Branch Borough | 0.51% | 0.028%(+0.486)#12 | 0.012%(+0.503)#76 |
| 13. | Ocean Acres | 0.48% | 0.028%(+0.449)#13 | 0.012%(+0.466)#82 |
| 14. | Leonia Borough | 0.44% | 0.028%(+0.414)#14 | 0.012%(+0.431)#93 |
| 15. | Ho Ho Kus Borough | 0.43% | 0.028%(+0.397)#15 | 0.012%(+0.414)#96 |
| 16. | Palisades Park Borough | 0.33% | 0.028%(+0.303)#16 | 0.012%(+0.320)#123 |
| 17. | Pompton Plains | 0.30% | 0.028%(+0.273)#17 | 0.012%(+0.290)#131 |
| 18. | Upper Saddle River Borough | 0.25% | 0.028%(+0.224)#18 | 0.012%(+0.241)#155 |
| 19. | Elmwood Park Borough | 0.24% | 0.028%(+0.216)#19 | 0.012%(+0.233)#157 |
| 20. | Holiday City Berkeley | 0.24% | 0.028%(+0.209)#20 | 0.012%(+0.226)#164 |
| 21. | Franklin Center | 0.23% | 0.028%(+0.204)#21 | 0.012%(+0.221)#165 |
| 22. | Shark River Hills | 0.23% | 0.028%(+0.204)#22 | 0.012%(+0.221)#168 |
| 23. | Butler Borough | 0.22% | 0.028%(+0.195)#23 | 0.012%(+0.212)#175 |
| 24. | Essex Fells Borough | 0.22% | 0.028%(+0.190)#24 | 0.012%(+0.207)#181 |
| 25. | Demarest Borough | 0.18% | 0.028%(+0.154)#25 | 0.012%(+0.171)#210 |
| 26. | Fanwood Borough | 0.18% | 0.028%(+0.153)#26 | 0.012%(+0.170)#214 |
| 27. | Oak Ridge | 0.17% | 0.028%(+0.144)#27 | 0.012%(+0.161)#226 |
| 28. | Fort Lee Borough | 0.12% | 0.028%(+0.090)#28 | 0.012%(+0.107)#297 |
| 29. | Bogota Borough | 0.11% | 0.028%(+0.083)#29 | 0.012%(+0.100)#309 |
| 30. | Glen Rock Borough | 0.11% | 0.028%(+0.079)#30 | 0.012%(+0.096)#312 |
| 31. | Newton | 0.11% | 0.028%(+0.079)#31 | 0.012%(+0.096)#313 |
| 32. | Audubon Borough | 0.10% | 0.028%(+0.075)#32 | 0.012%(+0.092)#321 |
| 33. | Guttenberg | 0.093% | 0.028%(+0.065)#33 | 0.012%(+0.082)#346 |
| 34. | East Rutherford Borough | 0.090% | 0.028%(+0.061)#34 | 0.012%(+0.078)#359 |
| 35. | Lodi Borough | 0.089% | 0.028%(+0.060)#35 | 0.012%(+0.077)#361 |
| 36. | Dover | 0.087% | 0.028%(+0.058)#36 | 0.012%(+0.075)#365 |
| 37. | Tenafly Borough | 0.085% | 0.028%(+0.057)#37 | 0.012%(+0.073)#372 |
| 38. | Closter Borough | 0.082% | 0.028%(+0.053)#38 | 0.012%(+0.070)#379 |
| 39. | Hammonton | 0.081% | 0.028%(+0.053)#39 | 0.012%(+0.070)#381 |
| 40. | Oakland Borough | 0.079% | 0.028%(+0.050)#40 | 0.012%(+0.067)#391 |
| 41. | Hamilton Square | 0.076% | 0.028%(+0.047)#41 | 0.012%(+0.064)#405 |
| 42. | West New York | 0.072% | 0.028%(+0.044)#42 | 0.012%(+0.061)#413 |
| 43. | Hoboken | 0.068% | 0.028%(+0.040)#43 | 0.012%(+0.057)#425 |
| 44. | Ramsey Borough | 0.068% | 0.028%(+0.039)#44 | 0.012%(+0.056)#426 |
| 45. | Short Hills | 0.062% | 0.028%(+0.034)#45 | 0.012%(+0.051)#446 |
| 46. | Garfield | 0.052% | 0.028%(+0.024)#46 | 0.012%(+0.041)#486 |
| 47. | Colonia | 0.048% | 0.028%(+0.020)#47 | 0.012%(+0.037)#499 |
| 48. | Bayonne | 0.044% | 0.028%(+0.016)#48 | 0.012%(+0.032)#521 |
| 49. | Linden | 0.044% | 0.028%(+0.015)#49 | 0.012%(+0.032)#523 |
| 50. | Roselle Park Borough | 0.036% | 0.028%(+0.007)#50 | 0.012%(+0.024)#559 |
| 51. | Moonachie Borough | 0.032% | 0.028%(+0.004)#51 | 0.012%(+0.021)#574 |
| 52. | Kearny | 0.027% | 0.028%(-0.002)#52 | 0.012%(+0.015)#616 |
| 53. | Somerset | 0.025% | 0.028%(-0.004)#53 | 0.012%(+0.013)#640 |
| 54. | Clifton | 0.025% | 0.028%(-0.004)#54 | 0.012%(+0.013)#643 |
| 55. | Jersey City | 0.019% | 0.028%(-0.010)#55 | 0.012%(+0.007)#700 |
| 56. | Summit | 0.018% | 0.028%(-0.011)#56 | 0.012%(+0.006)#709 |
| 57. | Bergenfield Borough | 0.018% | 0.028%(-0.011)#57 | 0.012%(+0.006)#710 |
| 58. | Paramus Borough | 0.015% | 0.028%(-0.013)#58 | 0.012%(+0.004)#742 |
| 59. | Barrington Borough | 0.014% | 0.028%(-0.014)#59 | 0.012%(+0.003)#751 |
| 60. | Gloucester City | 0.0087% | 0.028%(-0.020)#60 | 0.012%(-0.003)#803 |
| 61. | Toms River | 0.0086% | 0.028%(-0.020)#61 | 0.012%(-0.003)#805 |
| 62. | Lindenwold Borough | 0.0047% | 0.028%(-0.024)#62 | 0.012%(-0.007)#838 |
| 63. | Long Branch | 0.0031% | 0.028%(-0.025)#63 | 0.012%(-0.008)#852 |
| 64. | Newark | 0.00065% | 0.028%(-0.028)#64 | 0.012%(-0.011)#870 |
Common Questions
What are the Top 10 Cities with the Highest Percentage of Immigrants from Croatia in New Jersey?
Top 10 Cities with the Highest Percentage of Immigrants from Croatia in New Jersey are:
#1
1.29%
#2
1.11%
#3
1.05%
#4
0.52%
#5
0.48%
#6
0.24%
#7
0.23%
#8
0.23%
#9
0.11%
#10
0.093%
What city has the Highest Percentage of Immigrants from Croatia in New Jersey?
Beckett has the Highest Percentage of Immigrants from Croatia in New Jersey with 1.29%.
What is the Percentage of Immigrants from Croatia in the State of New Jersey?
Percentage of Immigrants from Croatia in New Jersey is 0.028%.
What is the Percentage of Immigrants from Croatia in the United States?
Percentage of Immigrants from Croatia in the United States is 0.012%.