Arnold, MO Map & Demographics
Arnold Map
Arnold Overview
$35,657
PER CAPITA INCOME
$89,195
AVG FAMILY INCOME
$72,317
AVG HOUSEHOLD INCOME
36.6%
WAGE / INCOME GAP [ % ]
63.4¢/ $1
WAGE / INCOME GAP [ $ ]
0.38
INEQUALITY / GINI INDEX
20,840
TOTAL POPULATION
10,203
MALE POPULATION
10,637
FEMALE POPULATION
95.92
MALES / 100 FEMALES
104.25
FEMALES / 100 MALES
41.0
MEDIAN AGE
3.0
AVG FAMILY SIZE
2.4
AVG HOUSEHOLD SIZE
11,145
LABOR FORCE [ PEOPLE ]
65.6%
PERCENT IN LABOR FORCE
3.5%
UNEMPLOYMENT RATE
Arnold Zip Codes
Arnold Area Codes
Income in Arnold
Income Overview in Arnold
Per Capita Income in Arnold is $35,657, while median incomes of families and households are $89,195 and $72,317 respectively.
| Characteristic | Number | Measure |
| Per Capita Income | 20,840 | $35,657 |
| Median Family Income | 5,526 | $89,195 |
| Mean Family Income | 5,526 | $98,271 |
| Median Household Income | 8,546 | $72,317 |
| Mean Household Income | 8,546 | $84,672 |
| Income Deficit | 5,526 | $0 |
| Wage / Income Gap (%) | 20,840 | 36.64% |
| Wage / Income Gap ($) | 20,840 | 63.36¢ per $1 |
| Gini / Inequality Index | 20,840 | 0.38 |
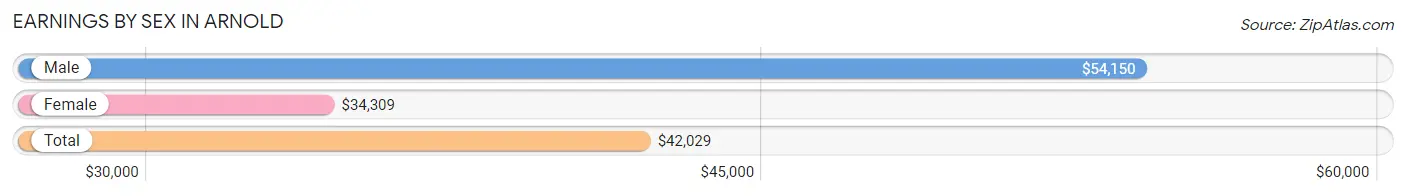
Earnings by Sex in Arnold
Average Earnings in Arnold are $42,029, $54,150 for men and $34,309 for women, a difference of 36.6%.
| Sex | Number | Average Earnings |
| Male | 5,959 (51.5%) | $54,150 |
| Female | 5,618 (48.5%) | $34,309 |
| Total | 11,577 (100.0%) | $42,029 |
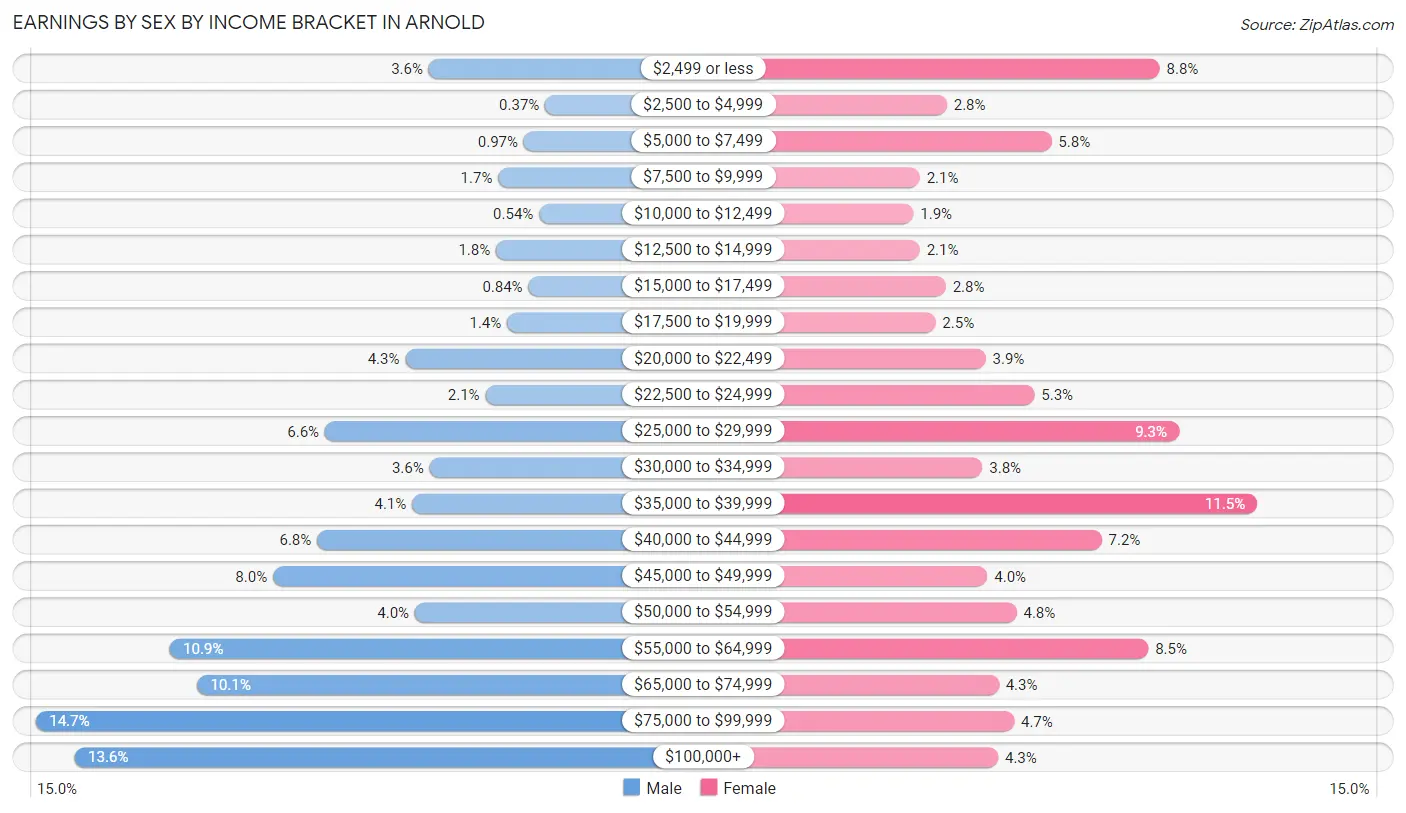
Earnings by Sex by Income Bracket in Arnold
The most common earnings brackets in Arnold are $75,000 to $99,999 for men (874 | 14.7%) and $35,000 to $39,999 for women (648 | 11.5%).
| Income | Male | Female |
| $2,499 or less | 217 (3.6%) | 494 (8.8%) |
| $2,500 to $4,999 | 22 (0.4%) | 158 (2.8%) |
| $5,000 to $7,499 | 58 (1.0%) | 323 (5.8%) |
| $7,500 to $9,999 | 101 (1.7%) | 115 (2.1%) |
| $10,000 to $12,499 | 32 (0.5%) | 105 (1.9%) |
| $12,500 to $14,999 | 104 (1.8%) | 115 (2.1%) |
| $15,000 to $17,499 | 50 (0.8%) | 156 (2.8%) |
| $17,500 to $19,999 | 86 (1.4%) | 140 (2.5%) |
| $20,000 to $22,499 | 256 (4.3%) | 219 (3.9%) |
| $22,500 to $24,999 | 122 (2.1%) | 296 (5.3%) |
| $25,000 to $29,999 | 391 (6.6%) | 524 (9.3%) |
| $30,000 to $34,999 | 216 (3.6%) | 214 (3.8%) |
| $35,000 to $39,999 | 245 (4.1%) | 648 (11.5%) |
| $40,000 to $44,999 | 404 (6.8%) | 402 (7.2%) |
| $45,000 to $49,999 | 478 (8.0%) | 222 (4.0%) |
| $50,000 to $54,999 | 240 (4.0%) | 268 (4.8%) |
| $55,000 to $64,999 | 650 (10.9%) | 476 (8.5%) |
| $65,000 to $74,999 | 604 (10.1%) | 240 (4.3%) |
| $75,000 to $99,999 | 874 (14.7%) | 264 (4.7%) |
| $100,000+ | 809 (13.6%) | 239 (4.3%) |
| Total | 5,959 (100.0%) | 5,618 (100.0%) |
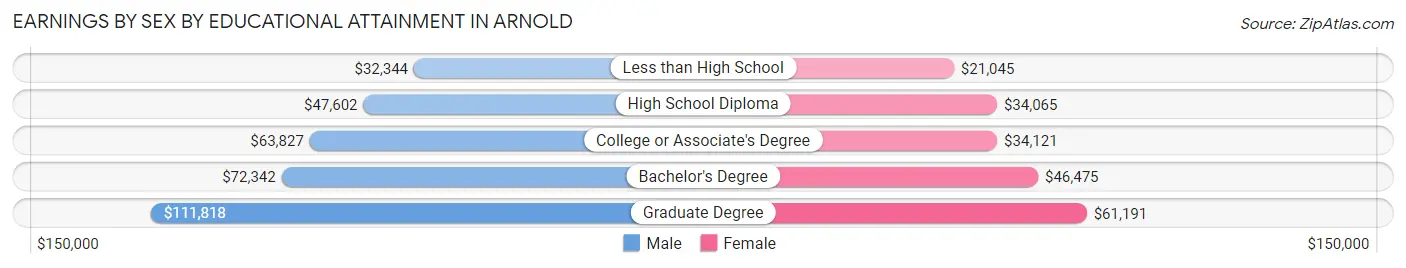
Earnings by Sex by Educational Attainment in Arnold
Average earnings in Arnold are $57,128 for men and $37,611 for women, a difference of 34.2%. Men with an educational attainment of graduate degree enjoy the highest average annual earnings of $111,818, while those with less than high school education earn the least with $32,344. Women with an educational attainment of graduate degree earn the most with the average annual earnings of $61,191, while those with less than high school education have the smallest earnings of $21,045.
| Educational Attainment | Male Income | Female Income |
| Less than High School | $32,344 | $21,045 |
| High School Diploma | $47,602 | $34,065 |
| College or Associate's Degree | $63,827 | $34,121 |
| Bachelor's Degree | $72,342 | $46,475 |
| Graduate Degree | $111,818 | $61,191 |
| Total | $57,128 | $37,611 |
Family Income in Arnold
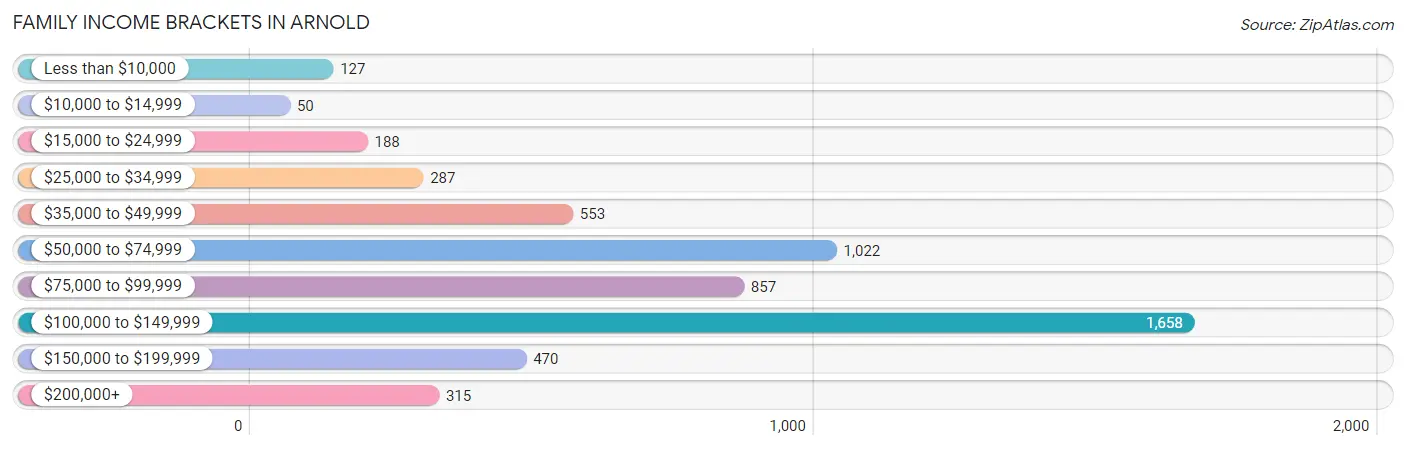
Family Income Brackets in Arnold
According to the Arnold family income data, there are 1,658 families falling into the $100,000 to $149,999 income range, which is the most common income bracket and makes up 30.0% of all families. Conversely, the $10,000 to $14,999 income bracket is the least frequent group with only 50 families (0.9%) belonging to this category.
| Income Bracket | # Families | % Families |
| Less than $10,000 | 127 | 2.3% |
| $10,000 to $14,999 | 50 | 0.9% |
| $15,000 to $24,999 | 188 | 3.4% |
| $25,000 to $34,999 | 287 | 5.2% |
| $35,000 to $49,999 | 553 | 10.0% |
| $50,000 to $74,999 | 1,022 | 18.5% |
| $75,000 to $99,999 | 857 | 15.5% |
| $100,000 to $149,999 | 1,658 | 30.0% |
| $150,000 to $199,999 | 470 | 8.5% |
| $200,000+ | 315 | 5.7% |
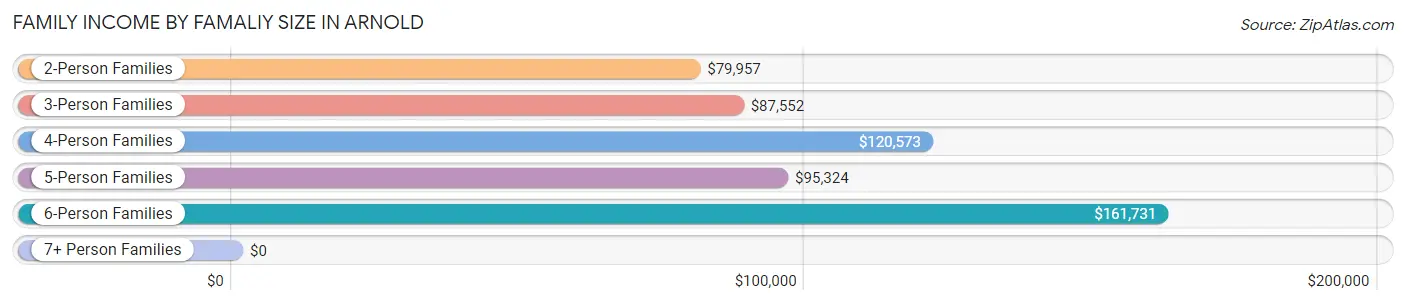
Family Income by Famaliy Size in Arnold
6-person families (78 | 1.4%) account for the highest median family income in Arnold with $161,731 per family, while 2-person families (2,622 | 47.4%) have the highest median income of $39,978 per family member.
| Income Bracket | # Families | Median Income |
| 2-Person Families | 2,622 (47.4%) | $79,957 |
| 3-Person Families | 1,330 (24.1%) | $87,552 |
| 4-Person Families | 955 (17.3%) | $120,573 |
| 5-Person Families | 529 (9.6%) | $95,324 |
| 6-Person Families | 78 (1.4%) | $161,731 |
| 7+ Person Families | 12 (0.2%) | $0 |
| Total | 5,526 (100.0%) | $89,195 |
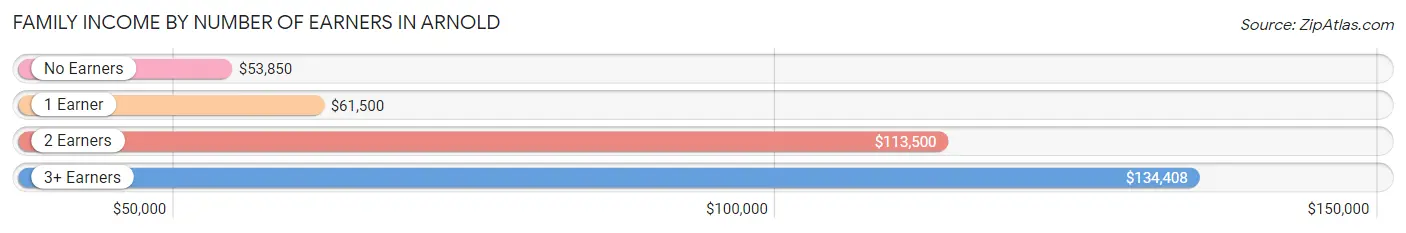
Family Income by Number of Earners in Arnold
The median family income in Arnold is $89,195, with families comprising 3+ earners (702) having the highest median family income of $134,408, while families with no earners (868) have the lowest median family income of $53,850, accounting for 12.7% and 15.7% of families, respectively.
| Number of Earners | # Families | Median Income |
| No Earners | 868 (15.7%) | $53,850 |
| 1 Earner | 1,756 (31.8%) | $61,500 |
| 2 Earners | 2,200 (39.8%) | $113,500 |
| 3+ Earners | 702 (12.7%) | $134,408 |
| Total | 5,526 (100.0%) | $89,195 |
Household Income in Arnold
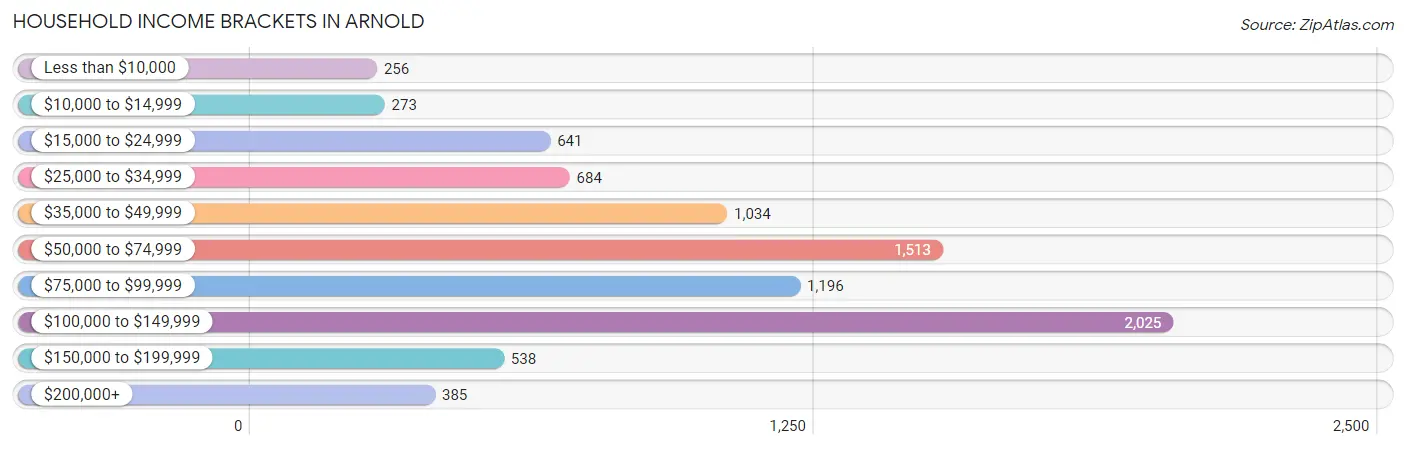
Household Income Brackets in Arnold
With 2,025 households falling in the category, the $100,000 to $149,999 income range is the most frequent in Arnold, accounting for 23.7% of all households. In contrast, only 256 households (3.0%) fall into the less than $10,000 income bracket, making it the least populous group.
| Income Bracket | # Households | % Households |
| Less than $10,000 | 256 | 3.0% |
| $10,000 to $14,999 | 273 | 3.2% |
| $15,000 to $24,999 | 641 | 7.5% |
| $25,000 to $34,999 | 684 | 8.0% |
| $35,000 to $49,999 | 1,034 | 12.1% |
| $50,000 to $74,999 | 1,513 | 17.7% |
| $75,000 to $99,999 | 1,196 | 14.0% |
| $100,000 to $149,999 | 2,025 | 23.7% |
| $150,000 to $199,999 | 538 | 6.3% |
| $200,000+ | 385 | 4.5% |
Household Income by Householder Age in Arnold
The median household income in Arnold is $72,317, with the highest median household income of $93,224 found in the 45 to 64 years age bracket for the primary householder. A total of 3,191 households (37.3%) fall into this category. Meanwhile, the 65+ years age bracket for the primary householder has the lowest median household income of $43,776, with 2,409 households (28.2%) in this group.
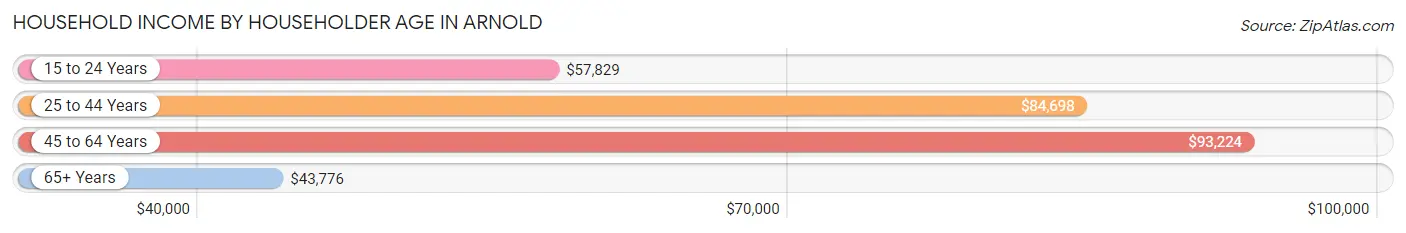
| Income Bracket | # Households | Median Income |
| 15 to 24 Years | 123 (1.4%) | $57,829 |
| 25 to 44 Years | 2,823 (33.0%) | $84,698 |
| 45 to 64 Years | 3,191 (37.3%) | $93,224 |
| 65+ Years | 2,409 (28.2%) | $43,776 |
| Total | 8,546 (100.0%) | $72,317 |
Poverty in Arnold
Income Below Poverty by Sex and Age in Arnold
With 6.8% poverty level for males and 9.8% for females among the residents of Arnold, 12 to 14 year old males and 15 year old females are the most vulnerable to poverty, with 53 males (17.3%) and 67 females (28.5%) in their respective age groups living below the poverty level.
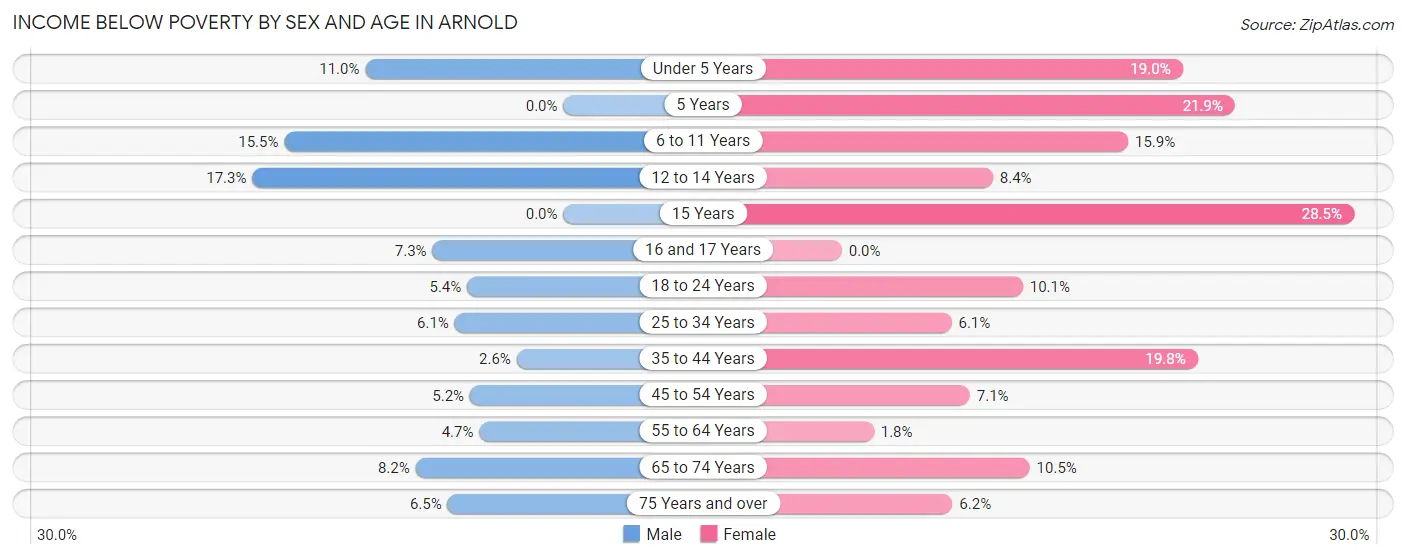
| Age Bracket | Male | Female |
| Under 5 Years | 79 (11.0%) | 107 (19.0%) |
| 5 Years | 0 (0.0%) | 14 (21.9%) |
| 6 to 11 Years | 113 (15.5%) | 91 (15.9%) |
| 12 to 14 Years | 53 (17.3%) | 29 (8.4%) |
| 15 Years | 0 (0.0%) | 67 (28.5%) |
| 16 and 17 Years | 14 (7.3%) | 0 (0.0%) |
| 18 to 24 Years | 32 (5.4%) | 64 (10.1%) |
| 25 to 34 Years | 111 (6.0%) | 92 (6.1%) |
| 35 to 44 Years | 29 (2.6%) | 268 (19.8%) |
| 45 to 54 Years | 59 (5.2%) | 87 (7.1%) |
| 55 to 64 Years | 80 (4.7%) | 27 (1.8%) |
| 65 to 74 Years | 76 (8.2%) | 121 (10.5%) |
| 75 Years and over | 42 (6.5%) | 62 (6.2%) |
| Total | 688 (6.8%) | 1,029 (9.8%) |
Income Above Poverty by Sex and Age in Arnold
According to the poverty statistics in Arnold, males aged 5 years and females aged 16 and 17 years are the age groups that are most secure financially, with 100.0% of males and 100.0% of females in these age groups living above the poverty line.
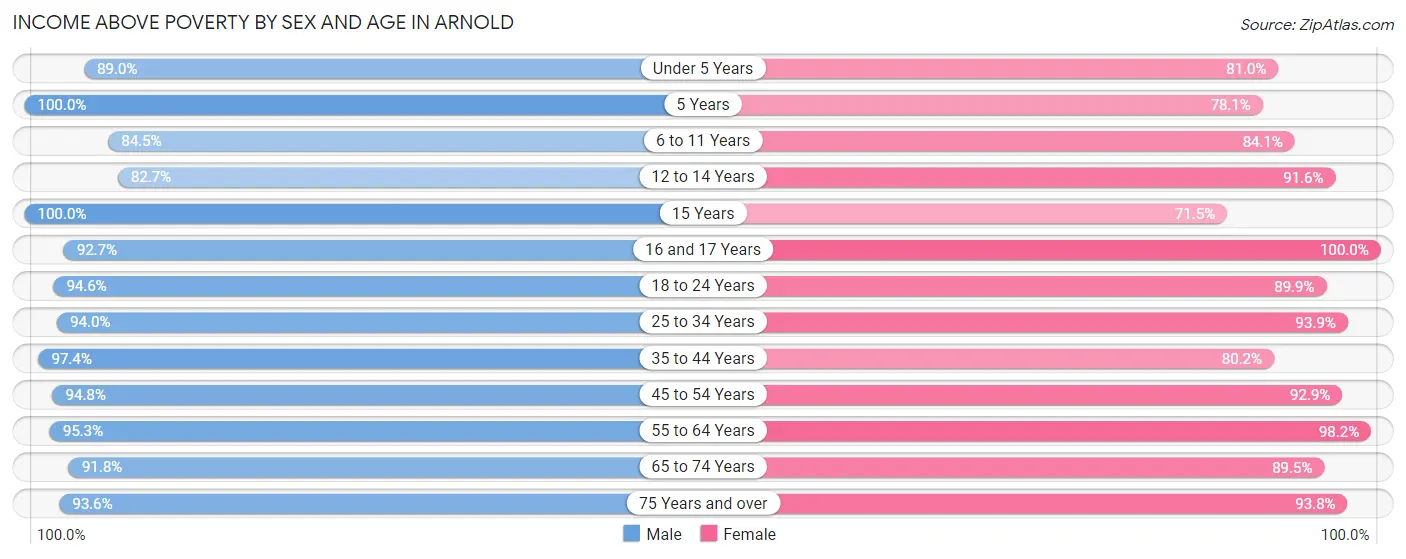
| Age Bracket | Male | Female |
| Under 5 Years | 637 (89.0%) | 457 (81.0%) |
| 5 Years | 74 (100.0%) | 50 (78.1%) |
| 6 to 11 Years | 614 (84.5%) | 480 (84.1%) |
| 12 to 14 Years | 253 (82.7%) | 316 (91.6%) |
| 15 Years | 155 (100.0%) | 168 (71.5%) |
| 16 and 17 Years | 178 (92.7%) | 303 (100.0%) |
| 18 to 24 Years | 565 (94.6%) | 571 (89.9%) |
| 25 to 34 Years | 1,724 (94.0%) | 1,414 (93.9%) |
| 35 to 44 Years | 1,086 (97.4%) | 1,085 (80.2%) |
| 45 to 54 Years | 1,076 (94.8%) | 1,134 (92.9%) |
| 55 to 64 Years | 1,629 (95.3%) | 1,492 (98.2%) |
| 65 to 74 Years | 848 (91.8%) | 1,036 (89.5%) |
| 75 Years and over | 609 (93.5%) | 944 (93.8%) |
| Total | 9,448 (93.2%) | 9,450 (90.2%) |
Income Below Poverty Among Married-Couple Families in Arnold
The poverty statistics for married-couple families in Arnold show that 4.1% or 165 of the total 4,040 families live below the poverty line. Families with 3 or 4 children have the highest poverty rate of 25.8%, comprising of 83 families. On the other hand, families with 1 or 2 children have the lowest poverty rate of 0.0%, which includes 0 families.
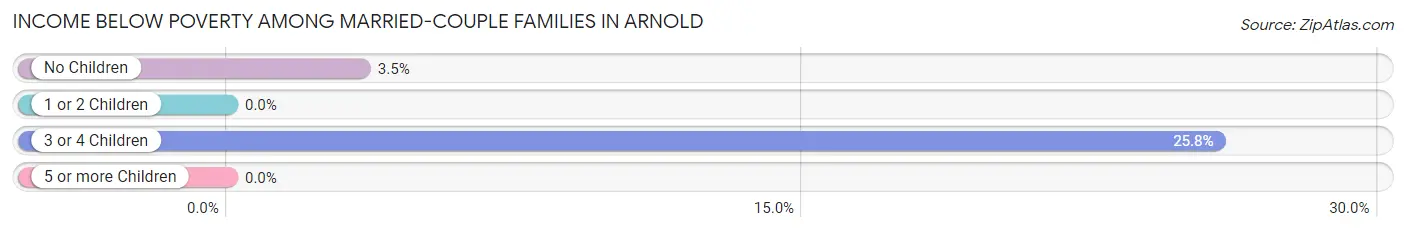
| Children | Above Poverty | Below Poverty |
| No Children | 2,284 (96.5%) | 82 (3.5%) |
| 1 or 2 Children | 1,340 (100.0%) | 0 (0.0%) |
| 3 or 4 Children | 239 (74.2%) | 83 (25.8%) |
| 5 or more Children | 12 (100.0%) | 0 (0.0%) |
| Total | 3,875 (95.9%) | 165 (4.1%) |
Income Below Poverty Among Single-Parent Households in Arnold
According to the poverty data in Arnold, 6.7% or 41 single-father households and 19.6% or 172 single-mother households are living below the poverty line. Among single-father households, those with 1 or 2 children have the highest poverty rate, with 41 households (9.3%) experiencing poverty. Likewise, among single-mother households, those with 1 or 2 children have the highest poverty rate, with 135 households (32.8%) falling below the poverty line.
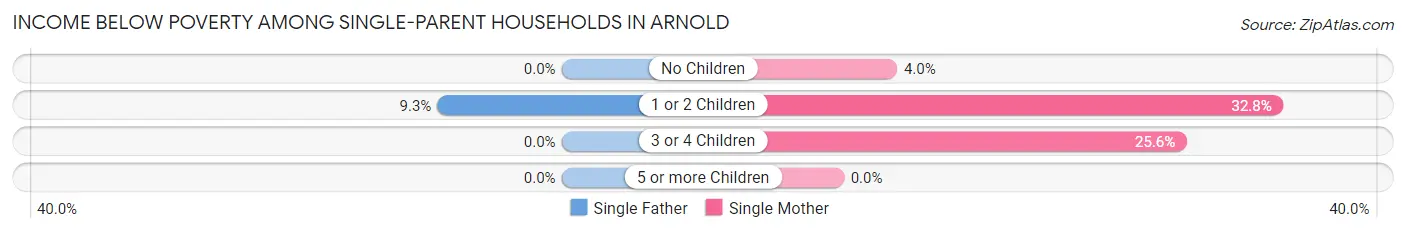
| Children | Single Father | Single Mother |
| No Children | 0 (0.0%) | 15 (4.0%) |
| 1 or 2 Children | 41 (9.3%) | 135 (32.8%) |
| 3 or 4 Children | 0 (0.0%) | 22 (25.6%) |
| 5 or more Children | 0 (0.0%) | 0 (0.0%) |
| Total | 41 (6.7%) | 172 (19.6%) |
Income Below Poverty Among Married-Couple vs Single-Parent Households in Arnold
The poverty data for Arnold shows that 165 of the married-couple family households (4.1%) and 213 of the single-parent households (14.3%) are living below the poverty level. Within the married-couple family households, those with 3 or 4 children have the highest poverty rate, with 83 households (25.8%) falling below the poverty line. Among the single-parent households, those with 3 or 4 children have the highest poverty rate, with 22 household (25.6%) living below poverty.
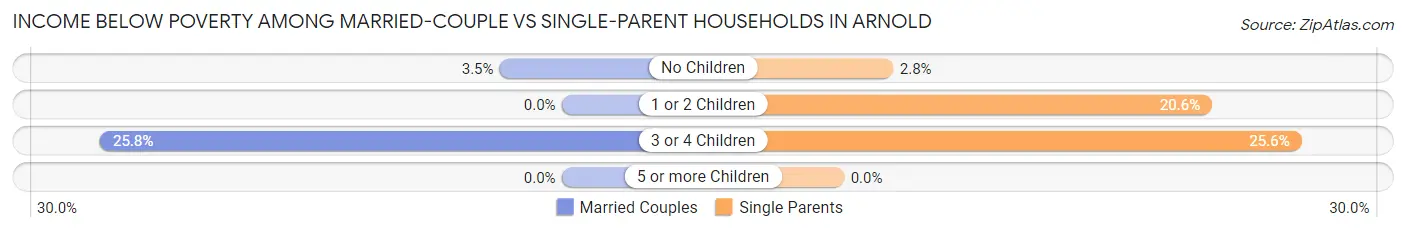
| Children | Married-Couple Families | Single-Parent Households |
| No Children | 82 (3.5%) | 15 (2.8%) |
| 1 or 2 Children | 0 (0.0%) | 176 (20.6%) |
| 3 or 4 Children | 83 (25.8%) | 22 (25.6%) |
| 5 or more Children | 0 (0.0%) | 0 (0.0%) |
| Total | 165 (4.1%) | 213 (14.3%) |
Race in Arnold
The most populous races in Arnold are White / Caucasian (19,161 | 91.9%), Two or more Races (1,421 | 6.8%), and Hispanic or Latino (422 | 2.0%).
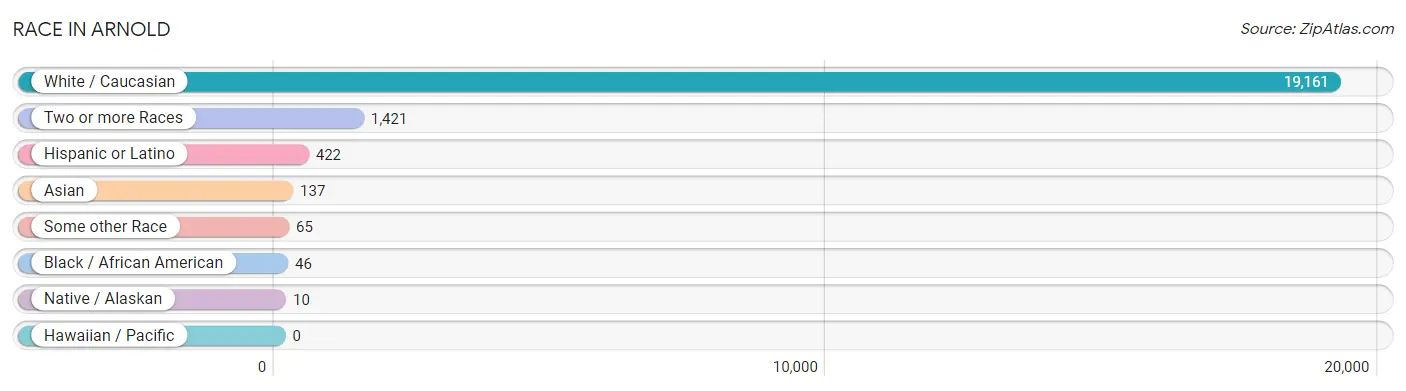
| Race | # Population | % Population |
| Asian | 137 | 0.7% |
| Black / African American | 46 | 0.2% |
| Hawaiian / Pacific | 0 | 0.0% |
| Hispanic or Latino | 422 | 2.0% |
| Native / Alaskan | 10 | 0.1% |
| White / Caucasian | 19,161 | 91.9% |
| Two or more Races | 1,421 | 6.8% |
| Some other Race | 65 | 0.3% |
| Total | 20,840 | 100.0% |
Ancestry in Arnold
The most populous ancestries reported in Arnold are German (5,883 | 28.2%), Irish (2,499 | 12.0%), English (1,814 | 8.7%), American (1,505 | 7.2%), and Italian (1,037 | 5.0%), together accounting for 61.1% of all Arnold residents.

| Ancestry | # Population | % Population |
| American | 1,505 | 7.2% |
| Arab | 92 | 0.4% |
| Armenian | 7 | 0.0% |
| Austrian | 60 | 0.3% |
| Belgian | 8 | 0.0% |
| Blackfeet | 4 | 0.0% |
| British | 68 | 0.3% |
| Canadian | 13 | 0.1% |
| Central American | 91 | 0.4% |
| Cherokee | 16 | 0.1% |
| Colombian | 90 | 0.4% |
| Costa Rican | 91 | 0.4% |
| Croatian | 131 | 0.6% |
| Czech | 116 | 0.6% |
| Czechoslovakian | 48 | 0.2% |
| Danish | 15 | 0.1% |
| Dutch | 140 | 0.7% |
| English | 1,814 | 8.7% |
| European | 545 | 2.6% |
| Filipino | 18 | 0.1% |
| French | 905 | 4.3% |
| French Canadian | 65 | 0.3% |
| German | 5,883 | 28.2% |
| Greek | 27 | 0.1% |
| Hungarian | 38 | 0.2% |
| Indian (Asian) | 106 | 0.5% |
| Irish | 2,499 | 12.0% |
| Italian | 1,037 | 5.0% |
| Korean | 24 | 0.1% |
| Lebanese | 48 | 0.2% |
| Lithuanian | 13 | 0.1% |
| Mexican | 122 | 0.6% |
| Northern European | 18 | 0.1% |
| Norwegian | 93 | 0.4% |
| Polish | 310 | 1.5% |
| Romanian | 20 | 0.1% |
| Russian | 19 | 0.1% |
| Scandinavian | 24 | 0.1% |
| Scotch-Irish | 80 | 0.4% |
| Scottish | 289 | 1.4% |
| Serbian | 131 | 0.6% |
| South American | 107 | 0.5% |
| Spaniard | 43 | 0.2% |
| Spanish | 59 | 0.3% |
| Swedish | 175 | 0.8% |
| Swiss | 45 | 0.2% |
| Turkish | 35 | 0.2% |
| Ukrainian | 96 | 0.5% |
| Venezuelan | 17 | 0.1% |
| Welsh | 41 | 0.2% |
| Yugoslavian | 634 | 3.0% | View All 51 Rows |
Immigrants in Arnold
The most numerous immigrant groups reported in Arnold came from Europe (910 | 4.4%), Eastern Europe (710 | 3.4%), Bosnia and Herzegovina (490 | 2.4%), Western Europe (170 | 0.8%), and Germany (147 | 0.7%), together accounting for 11.7% of all Arnold residents.
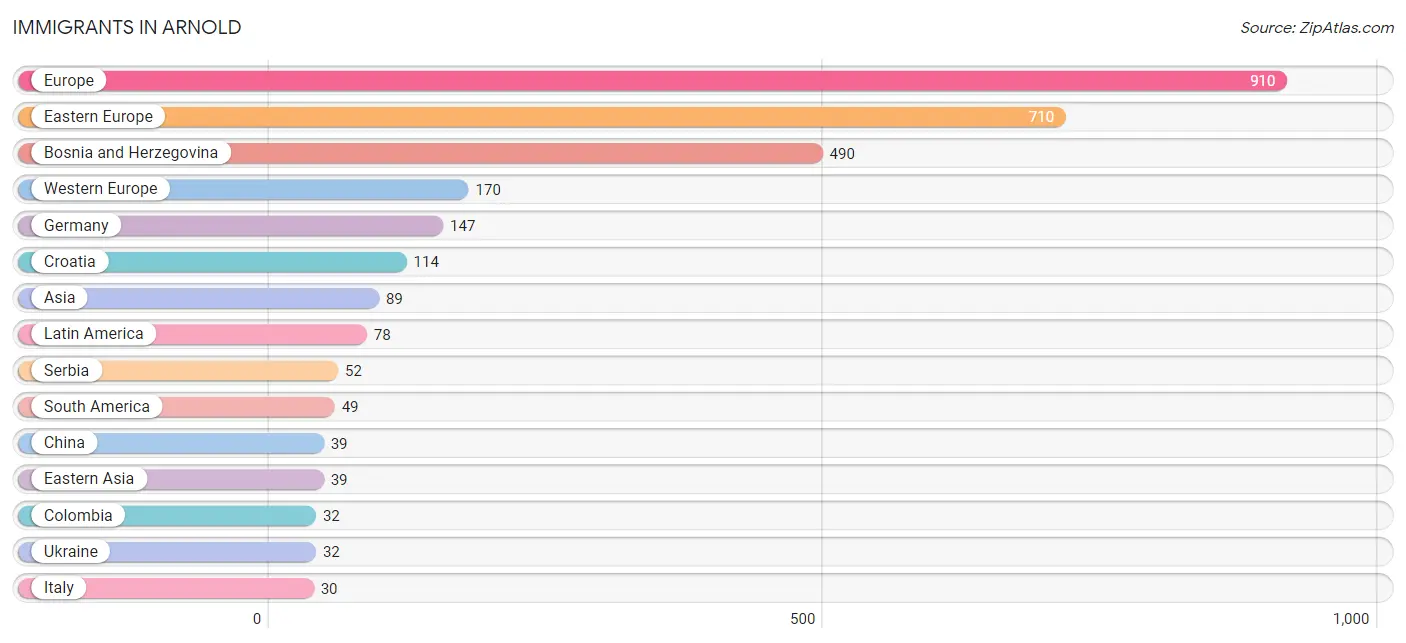
| Immigration Origin | # Population | % Population |
| Asia | 89 | 0.4% |
| Austria | 23 | 0.1% |
| Bosnia and Herzegovina | 490 | 2.4% |
| Canada | 13 | 0.1% |
| Central America | 29 | 0.1% |
| China | 39 | 0.2% |
| Colombia | 32 | 0.2% |
| Croatia | 114 | 0.5% |
| Eastern Asia | 39 | 0.2% |
| Eastern Europe | 710 | 3.4% |
| Europe | 910 | 4.4% |
| Germany | 147 | 0.7% |
| Italy | 30 | 0.1% |
| Kazakhstan | 13 | 0.1% |
| Latin America | 78 | 0.4% |
| Mexico | 29 | 0.1% |
| Oceania | 7 | 0.0% |
| Philippines | 24 | 0.1% |
| Russia | 22 | 0.1% |
| Serbia | 52 | 0.3% |
| South America | 49 | 0.2% |
| South Central Asia | 26 | 0.1% |
| South Eastern Asia | 24 | 0.1% |
| Southern Europe | 30 | 0.1% |
| Ukraine | 32 | 0.2% |
| Uzbekistan | 13 | 0.1% |
| Venezuela | 17 | 0.1% |
| Western Europe | 170 | 0.8% | View All 28 Rows |
Sex and Age in Arnold
Sex and Age in Arnold
The most populous age groups in Arnold are 30 to 34 Years (985 | 9.7%) for men and 25 to 29 Years (953 | 9.0%) for women.
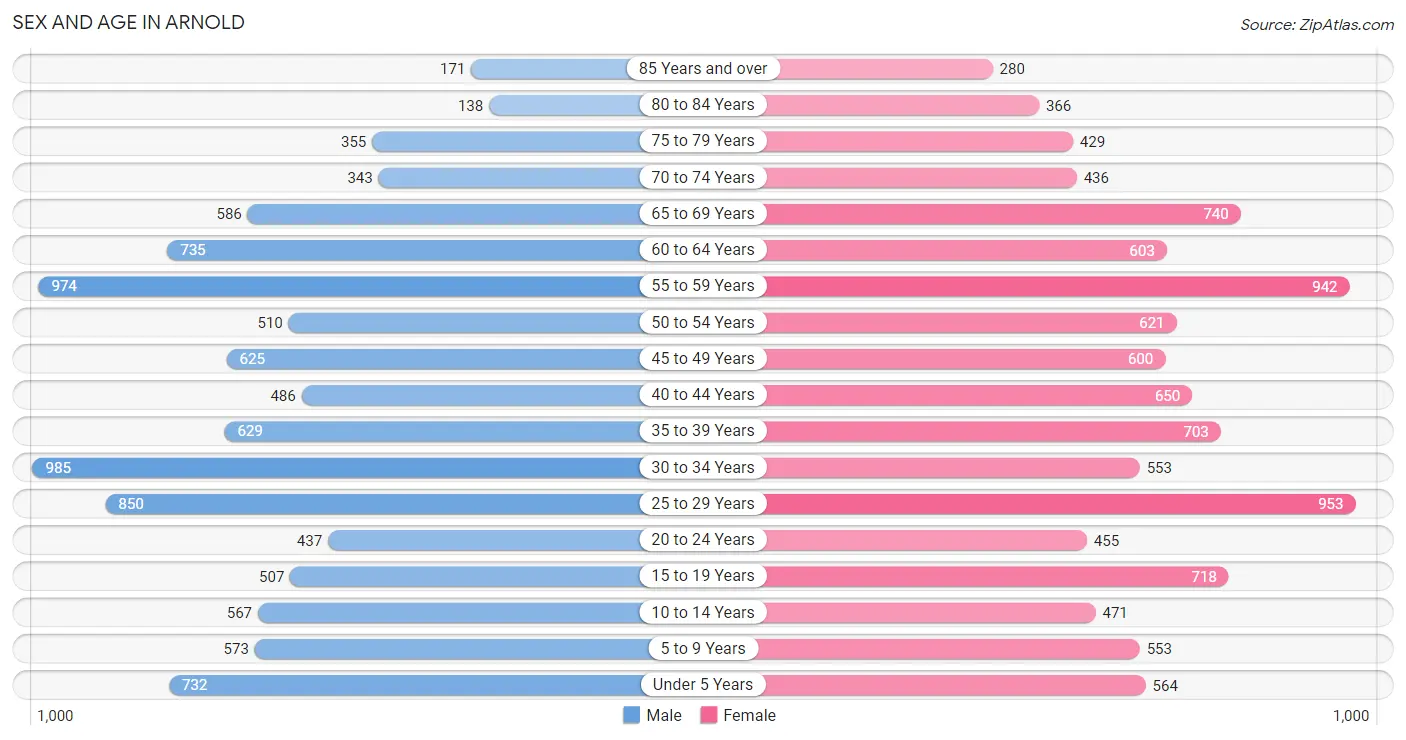
| Age Bracket | Male | Female |
| Under 5 Years | 732 (7.2%) | 564 (5.3%) |
| 5 to 9 Years | 573 (5.6%) | 553 (5.2%) |
| 10 to 14 Years | 567 (5.6%) | 471 (4.4%) |
| 15 to 19 Years | 507 (5.0%) | 718 (6.8%) |
| 20 to 24 Years | 437 (4.3%) | 455 (4.3%) |
| 25 to 29 Years | 850 (8.3%) | 953 (9.0%) |
| 30 to 34 Years | 985 (9.7%) | 553 (5.2%) |
| 35 to 39 Years | 629 (6.2%) | 703 (6.6%) |
| 40 to 44 Years | 486 (4.8%) | 650 (6.1%) |
| 45 to 49 Years | 625 (6.1%) | 600 (5.6%) |
| 50 to 54 Years | 510 (5.0%) | 621 (5.8%) |
| 55 to 59 Years | 974 (9.6%) | 942 (8.9%) |
| 60 to 64 Years | 735 (7.2%) | 603 (5.7%) |
| 65 to 69 Years | 586 (5.7%) | 740 (7.0%) |
| 70 to 74 Years | 343 (3.4%) | 436 (4.1%) |
| 75 to 79 Years | 355 (3.5%) | 429 (4.0%) |
| 80 to 84 Years | 138 (1.3%) | 366 (3.4%) |
| 85 Years and over | 171 (1.7%) | 280 (2.6%) |
| Total | 10,203 (100.0%) | 10,637 (100.0%) |
Families and Households in Arnold
Median Family Size in Arnold
The median family size in Arnold is 2.95 persons per family, with married-couple families (4,040 | 73.1%) accounting for the largest median family size of 3.02 persons per family. On the other hand, single male/father families (610 | 11.0%) represent the smallest median family size with 2.41 persons per family.
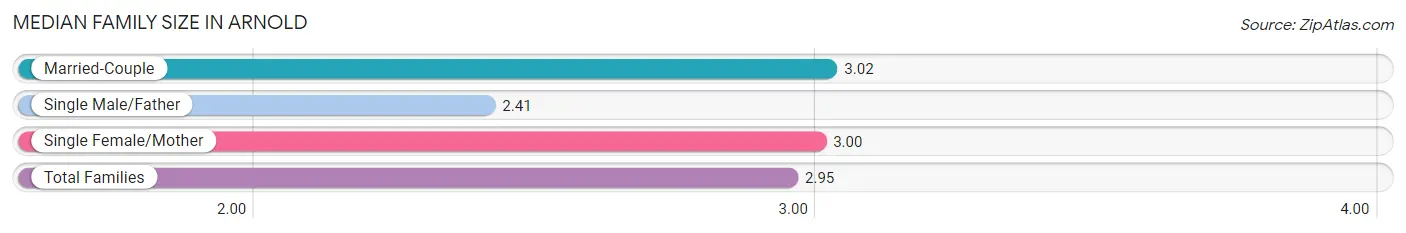
| Family Type | # Families | Family Size |
| Married-Couple | 4,040 (73.1%) | 3.02 |
| Single Male/Father | 610 (11.0%) | 2.41 |
| Single Female/Mother | 876 (15.9%) | 3.00 |
| Total Families | 5,526 (100.0%) | 2.95 |
Median Household Size in Arnold
The median household size in Arnold is 2.42 persons per household, with single female/mother households (876 | 10.2%) accounting for the largest median household size of 3.28 persons per household. non-family households (3,020 | 35.3%) represent the smallest median household size with 1.33 persons per household.
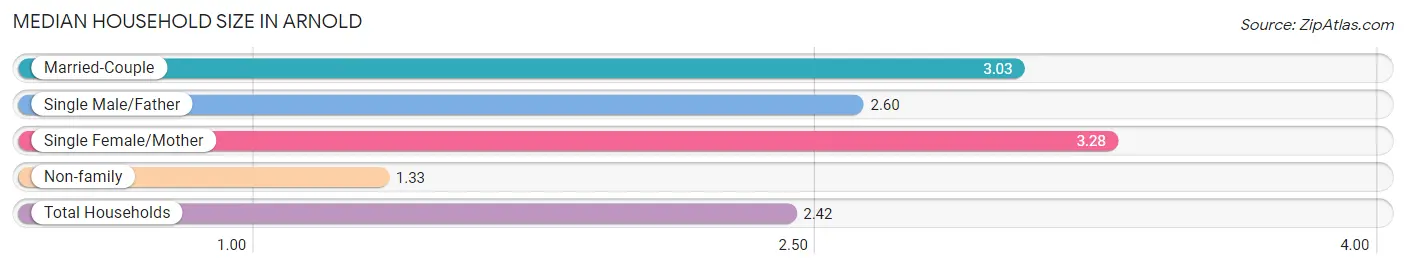
| Household Type | # Households | Household Size |
| Married-Couple | 4,040 (47.3%) | 3.03 |
| Single Male/Father | 610 (7.1%) | 2.60 |
| Single Female/Mother | 876 (10.2%) | 3.28 |
| Non-family | 3,020 (35.3%) | 1.33 |
| Total Households | 8,546 (100.0%) | 2.42 |
Household Size by Marriage Status in Arnold
Out of a total of 8,546 households in Arnold, 5,526 (64.7%) are family households, while 3,020 (35.3%) are nonfamily households. The most numerous type of family households are 2-person households, comprising 2,494, and the most common type of nonfamily households are 1-person households, comprising 2,183.
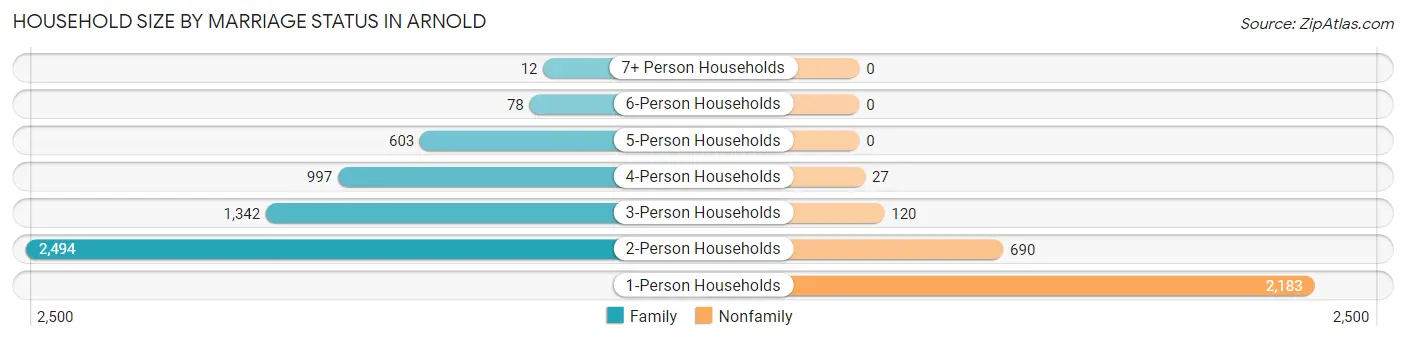
| Household Size | Family Households | Nonfamily Households |
| 1-Person Households | - | 2,183 (25.5%) |
| 2-Person Households | 2,494 (29.2%) | 690 (8.1%) |
| 3-Person Households | 1,342 (15.7%) | 120 (1.4%) |
| 4-Person Households | 997 (11.7%) | 27 (0.3%) |
| 5-Person Households | 603 (7.1%) | 0 (0.0%) |
| 6-Person Households | 78 (0.9%) | 0 (0.0%) |
| 7+ Person Households | 12 (0.1%) | 0 (0.0%) |
| Total | 5,526 (64.7%) | 3,020 (35.3%) |
Female Fertility in Arnold
Fertility by Age in Arnold
Average fertility rate in Arnold is 31.0 births per 1,000 women. Women in the age bracket of 20 to 34 years have the highest fertility rate with 56.0 births per 1,000 women. Women in the age bracket of 20 to 34 years acount for 74.2% of all women with births.
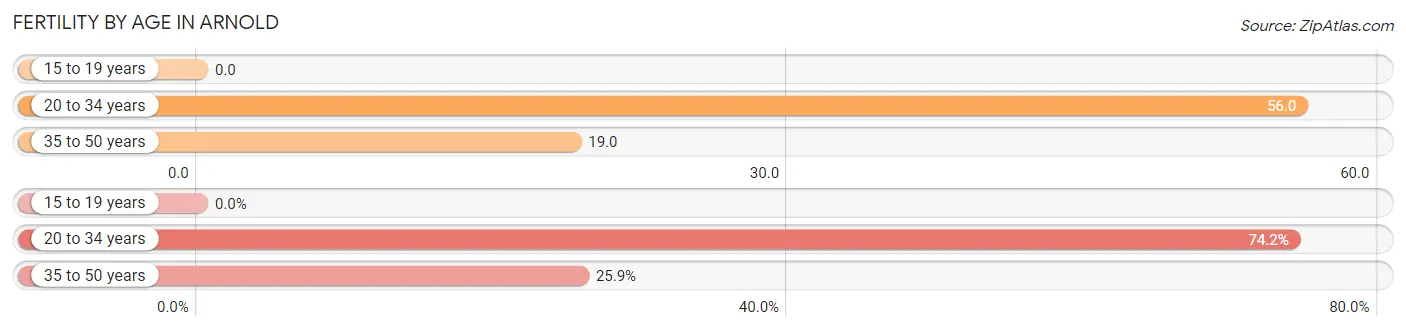
| Age Bracket | Women with Births | Births / 1,000 Women |
| 15 to 19 years | 0 (0.0%) | 0.0 |
| 20 to 34 years | 109 (74.2%) | 56.0 |
| 35 to 50 years | 38 (25.9%) | 19.0 |
| Total | 147 (100.0%) | 31.0 |
Fertility by Age by Marriage Status in Arnold
74.8% of women with births (147) in Arnold are married. The highest percentage of unmarried women with births falls into 35 to 50 years age bracket with 26.3% of them unmarried at the time of birth, while the lowest percentage of unmarried women with births belong to 20 to 34 years age bracket with 24.8% of them unmarried.
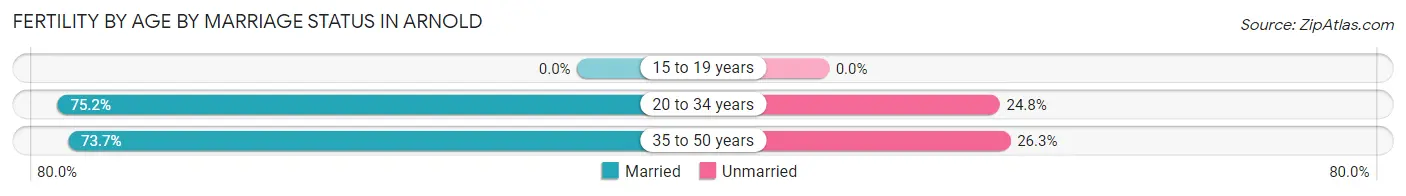
| Age Bracket | Married | Unmarried |
| 15 to 19 years | 0 (0.0%) | 0 (0.0%) |
| 20 to 34 years | 82 (75.2%) | 27 (24.8%) |
| 35 to 50 years | 28 (73.7%) | 10 (26.3%) |
| Total | 110 (74.8%) | 37 (25.2%) |
Fertility by Education in Arnold
Average fertility rate in Arnold is 31.0 births per 1,000 women. Women with the education attainment of bachelor's degree have the highest fertility rate of 56.0 births per 1,000 women, while women with the education attainment of high school diploma have the lowest fertility at 9.0 births per 1,000 women. Women with the education attainment of bachelor's degree represent 44.2% of all women with births.
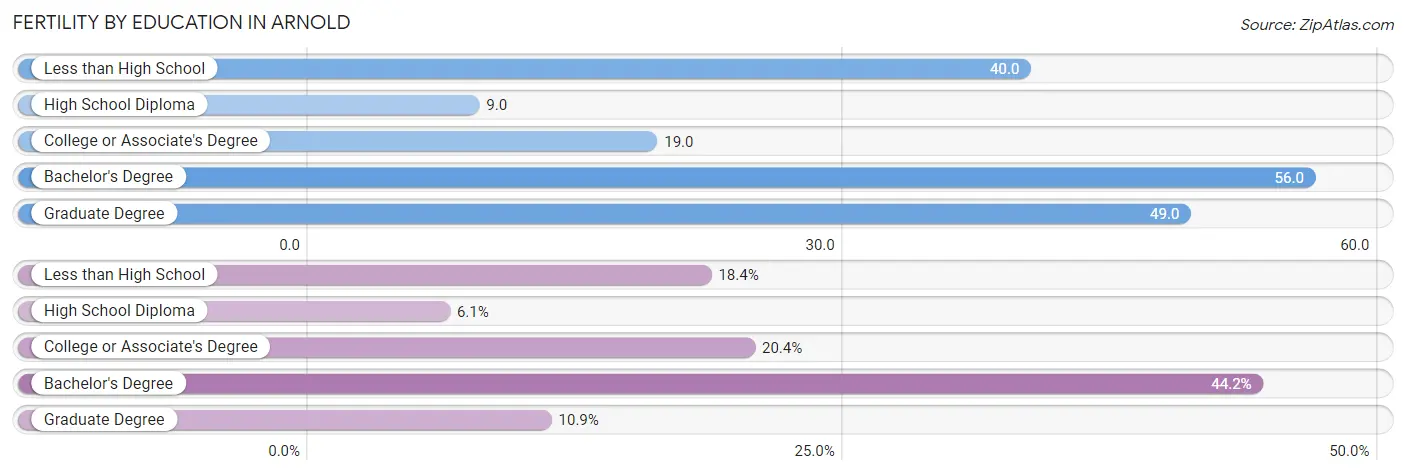
| Educational Attainment | Women with Births | Births / 1,000 Women |
| Less than High School | 27 (18.4%) | 40.0 |
| High School Diploma | 9 (6.1%) | 9.0 |
| College or Associate's Degree | 30 (20.4%) | 19.0 |
| Bachelor's Degree | 65 (44.2%) | 56.0 |
| Graduate Degree | 16 (10.9%) | 49.0 |
| Total | 147 (100.0%) | 31.0 |
Fertility by Education by Marriage Status in Arnold
25.2% of women with births in Arnold are unmarried. Women with the educational attainment of high school diploma are most likely to be married with 100.0% of them married at childbirth, while women with the educational attainment of less than high school are least likely to be married with 100.0% of them unmarried at childbirth.
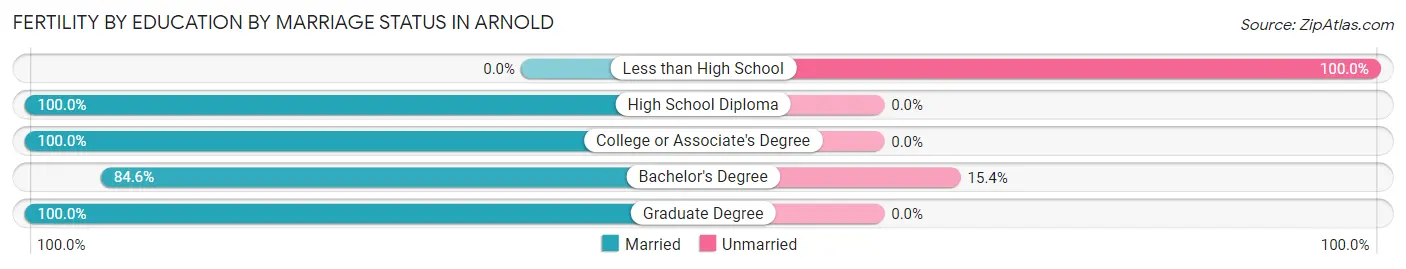
| Educational Attainment | Married | Unmarried |
| Less than High School | 0 (0.0%) | 27 (100.0%) |
| High School Diploma | 9 (100.0%) | 0 (0.0%) |
| College or Associate's Degree | 30 (100.0%) | 0 (0.0%) |
| Bachelor's Degree | 55 (84.6%) | 10 (15.4%) |
| Graduate Degree | 16 (100.0%) | 0 (0.0%) |
| Total | 110 (74.8%) | 37 (25.2%) |
Employment Characteristics in Arnold
Employment by Class of Employer in Arnold
Among the 10,576 employed individuals in Arnold, private company employees (7,378 | 69.8%), not-for-profit organizations (1,192 | 11.3%), and local government employees (680 | 6.4%) make up the most common classes of employment.
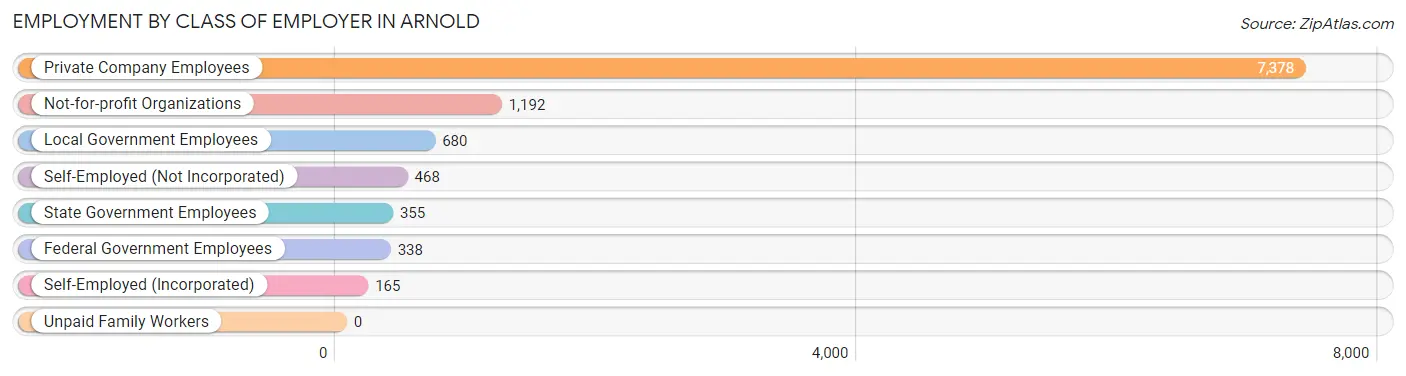
| Employer Class | # Employees | % Employees |
| Private Company Employees | 7,378 | 69.8% |
| Self-Employed (Incorporated) | 165 | 1.6% |
| Self-Employed (Not Incorporated) | 468 | 4.4% |
| Not-for-profit Organizations | 1,192 | 11.3% |
| Local Government Employees | 680 | 6.4% |
| State Government Employees | 355 | 3.4% |
| Federal Government Employees | 338 | 3.2% |
| Unpaid Family Workers | 0 | 0.0% |
| Total | 10,576 | 100.0% |
Employment Status by Age in Arnold
According to the labor force statistics for Arnold, out of the total population over 16 years of age (16,990), 65.6% or 11,145 individuals are in the labor force, with 3.5% or 390 of them unemployed. The age group with the highest labor force participation rate is 25 to 29 years, with 92.0% or 1,659 individuals in the labor force. Within the labor force, the 16 to 19 years age range has the highest percentage of unemployed individuals, with 15.3% or 51 of them being unemployed.
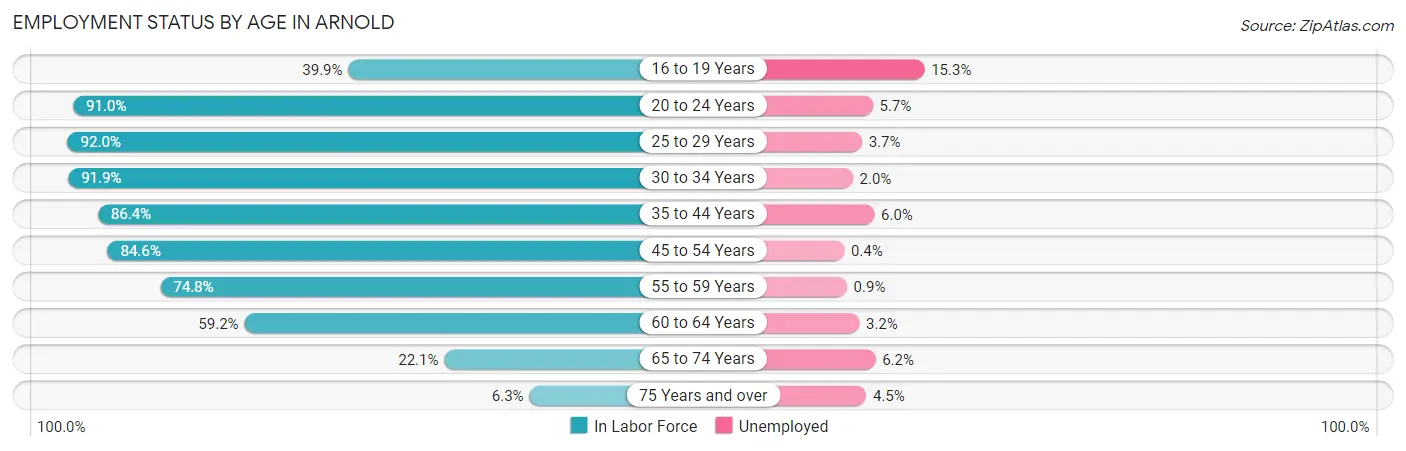
| Age Bracket | In Labor Force | Unemployed |
| 16 to 19 Years | 333 (39.9%) | 51 (15.3%) |
| 20 to 24 Years | 812 (91.0%) | 46 (5.7%) |
| 25 to 29 Years | 1,659 (92.0%) | 61 (3.7%) |
| 30 to 34 Years | 1,413 (91.9%) | 28 (2.0%) |
| 35 to 44 Years | 2,132 (86.4%) | 128 (6.0%) |
| 45 to 54 Years | 1,993 (84.6%) | 8 (0.4%) |
| 55 to 59 Years | 1,433 (74.8%) | 13 (0.9%) |
| 60 to 64 Years | 792 (59.2%) | 25 (3.2%) |
| 65 to 74 Years | 465 (22.1%) | 29 (6.2%) |
| 75 Years and over | 110 (6.3%) | 5 (4.5%) |
| Total | 11,145 (65.6%) | 390 (3.5%) |
Employment Status by Educational Attainment in Arnold
According to labor force statistics for Arnold, 82.5% of individuals (9,421) out of the total population between 25 and 64 years of age (11,419) are in the labor force, with 2.8% or 264 of them being unemployed. The group with the highest labor force participation rate are those with the educational attainment of bachelor's degree or higher, with 89.1% or 2,739 individuals in the labor force. Within the labor force, individuals with less than high school education have the highest percentage of unemployment, with 4.6% or 27 of them being unemployed.
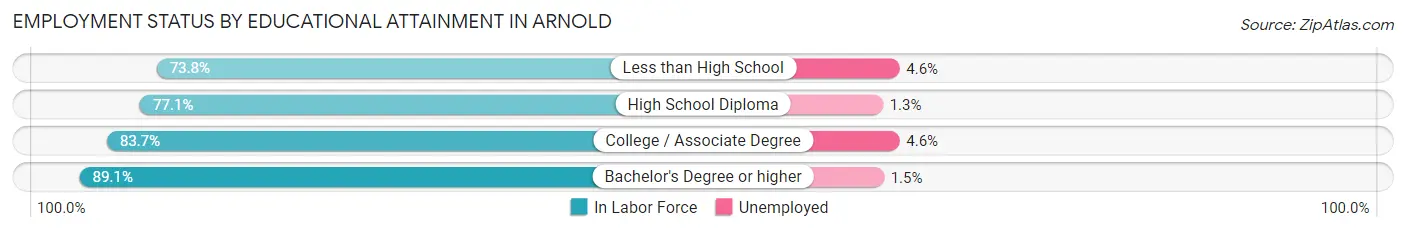
| Educational Attainment | In Labor Force | Unemployed |
| Less than High School | 581 (73.8%) | 36 (4.6%) |
| High School Diploma | 2,618 (77.1%) | 44 (1.3%) |
| College / Associate Degree | 3,484 (83.7%) | 191 (4.6%) |
| Bachelor's Degree or higher | 2,739 (89.1%) | 46 (1.5%) |
| Total | 9,421 (82.5%) | 320 (2.8%) |
Employment Occupations by Sex in Arnold
Management, Business, Science and Arts Occupations
The most common Management, Business, Science and Arts occupations in Arnold are Community & Social Service (1,010 | 9.5%), Computers, Engineering & Science (872 | 8.2%), Management (804 | 7.6%), Health Diagnosing & Treating (641 | 6.0%), and Education Instruction & Library (608 | 5.7%).
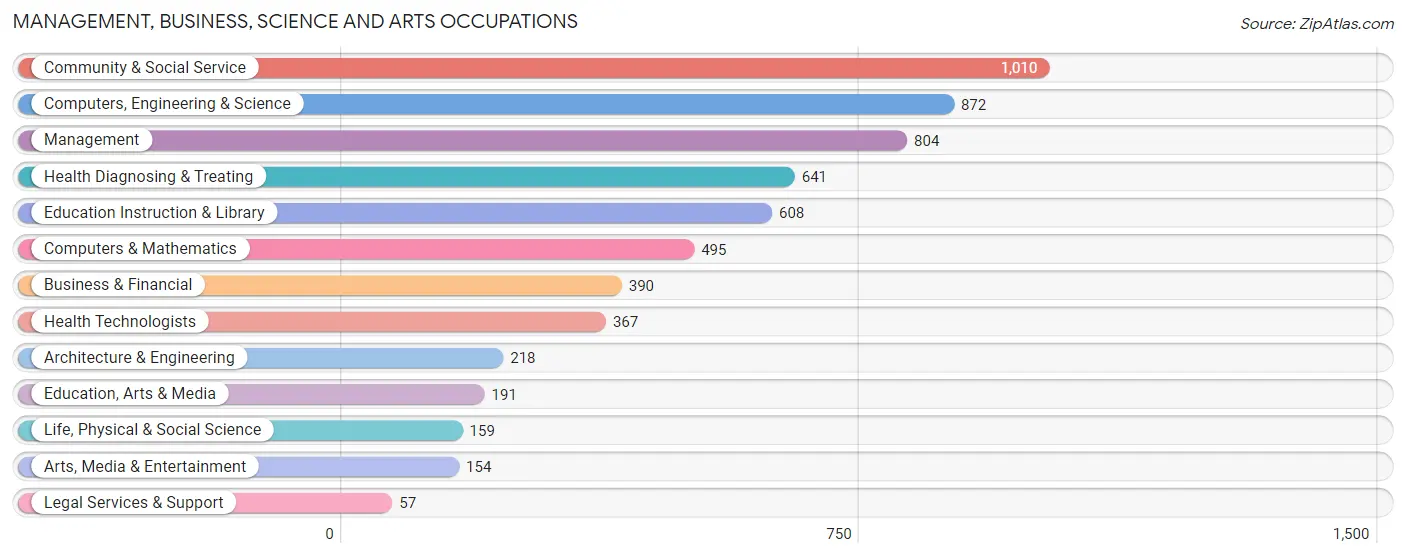
Management, Business, Science and Arts Occupations by Sex
Within the Management, Business, Science and Arts occupations in Arnold, the most male-oriented occupations are Architecture & Engineering (94.0%), Computers & Mathematics (84.4%), and Computers, Engineering & Science (82.0%), while the most female-oriented occupations are Legal Services & Support (100.0%), Arts, Media & Entertainment (90.9%), and Education, Arts & Media (86.9%).
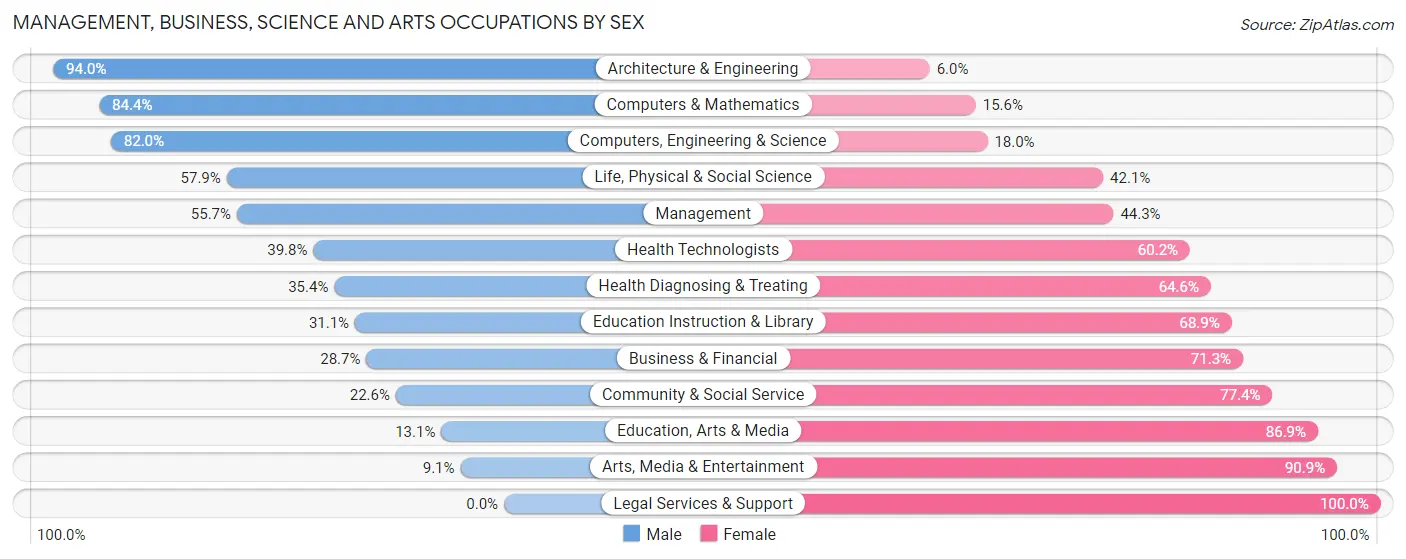
| Occupation | Male | Female |
| Management | 448 (55.7%) | 356 (44.3%) |
| Business & Financial | 112 (28.7%) | 278 (71.3%) |
| Computers, Engineering & Science | 715 (82.0%) | 157 (18.0%) |
| Computers & Mathematics | 418 (84.4%) | 77 (15.6%) |
| Architecture & Engineering | 205 (94.0%) | 13 (6.0%) |
| Life, Physical & Social Science | 92 (57.9%) | 67 (42.1%) |
| Community & Social Service | 228 (22.6%) | 782 (77.4%) |
| Education, Arts & Media | 25 (13.1%) | 166 (86.9%) |
| Legal Services & Support | 0 (0.0%) | 57 (100.0%) |
| Education Instruction & Library | 189 (31.1%) | 419 (68.9%) |
| Arts, Media & Entertainment | 14 (9.1%) | 140 (90.9%) |
| Health Diagnosing & Treating | 227 (35.4%) | 414 (64.6%) |
| Health Technologists | 146 (39.8%) | 221 (60.2%) |
| Total (Category) | 1,730 (46.5%) | 1,987 (53.5%) |
| Total (Overall) | 5,553 (52.2%) | 5,082 (47.8%) |
Services Occupations
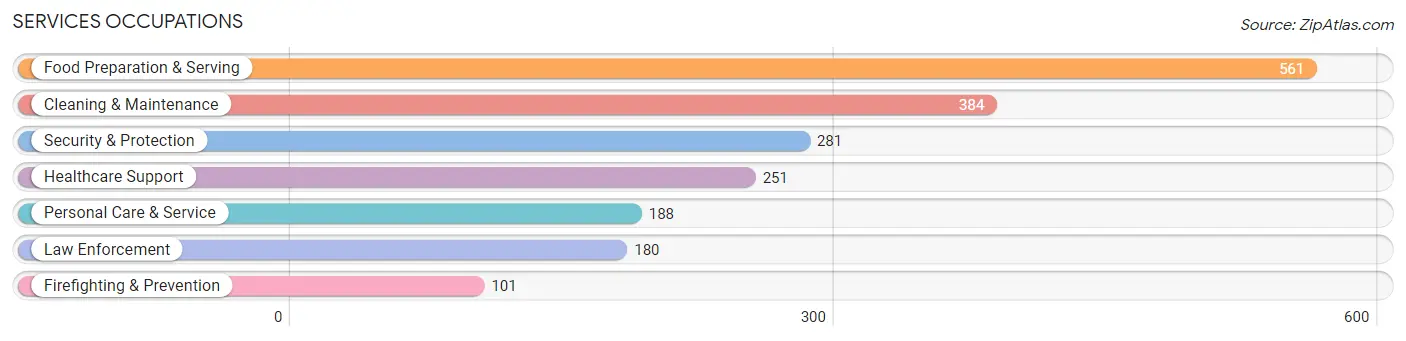
The most common Services occupations in Arnold are Food Preparation & Serving (561 | 5.3%), Cleaning & Maintenance (384 | 3.6%), Security & Protection (281 | 2.6%), Healthcare Support (251 | 2.4%), and Personal Care & Service (188 | 1.8%).
Services Occupations by Sex
Within the Services occupations in Arnold, the most male-oriented occupations are Law Enforcement (100.0%), Security & Protection (82.9%), and Cleaning & Maintenance (69.5%), while the most female-oriented occupations are Healthcare Support (100.0%), Personal Care & Service (82.5%), and Food Preparation & Serving (54.5%).
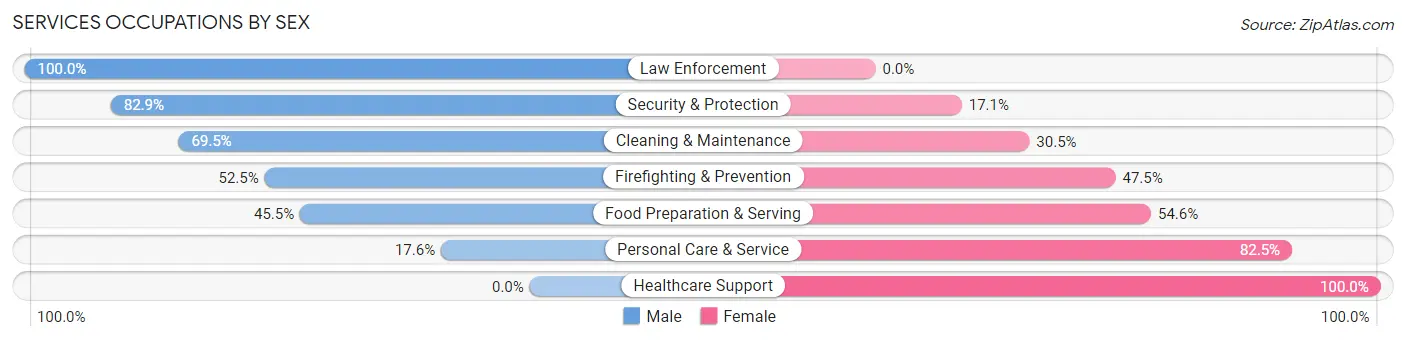
| Occupation | Male | Female |
| Healthcare Support | 0 (0.0%) | 251 (100.0%) |
| Security & Protection | 233 (82.9%) | 48 (17.1%) |
| Firefighting & Prevention | 53 (52.5%) | 48 (47.5%) |
| Law Enforcement | 180 (100.0%) | 0 (0.0%) |
| Food Preparation & Serving | 255 (45.5%) | 306 (54.5%) |
| Cleaning & Maintenance | 267 (69.5%) | 117 (30.5%) |
| Personal Care & Service | 33 (17.5%) | 155 (82.5%) |
| Total (Category) | 788 (47.3%) | 877 (52.7%) |
| Total (Overall) | 5,553 (52.2%) | 5,082 (47.8%) |
Sales and Office Occupations
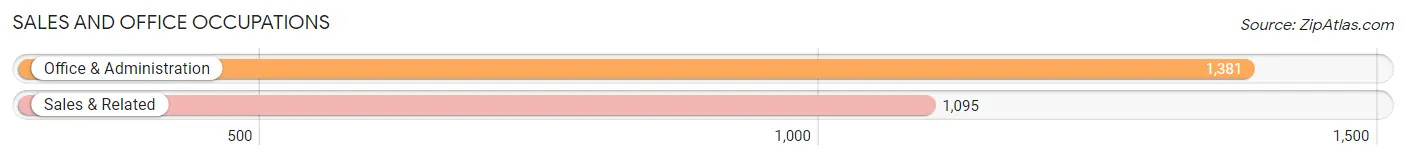
The most common Sales and Office occupations in Arnold are Office & Administration (1,381 | 13.0%), and Sales & Related (1,095 | 10.3%).
Sales and Office Occupations by Sex
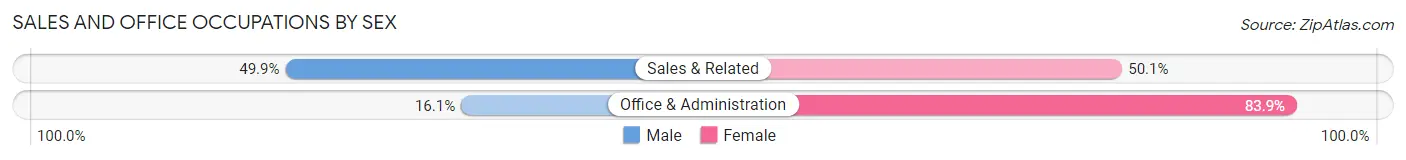
| Occupation | Male | Female |
| Sales & Related | 546 (49.9%) | 549 (50.1%) |
| Office & Administration | 222 (16.1%) | 1,159 (83.9%) |
| Total (Category) | 768 (31.0%) | 1,708 (69.0%) |
| Total (Overall) | 5,553 (52.2%) | 5,082 (47.8%) |
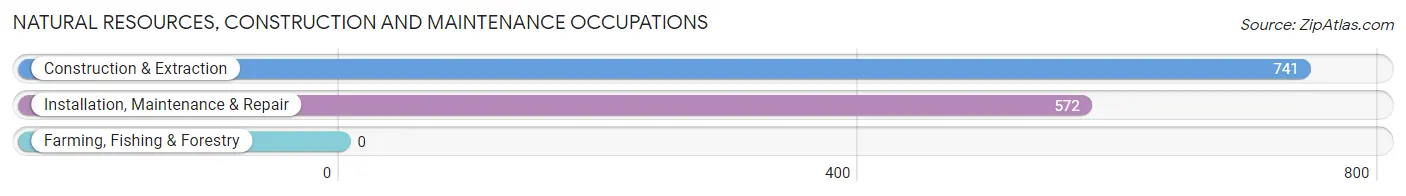
Natural Resources, Construction and Maintenance Occupations
The most common Natural Resources, Construction and Maintenance occupations in Arnold are Construction & Extraction (741 | 7.0%), and Installation, Maintenance & Repair (572 | 5.4%).
Natural Resources, Construction and Maintenance Occupations by Sex
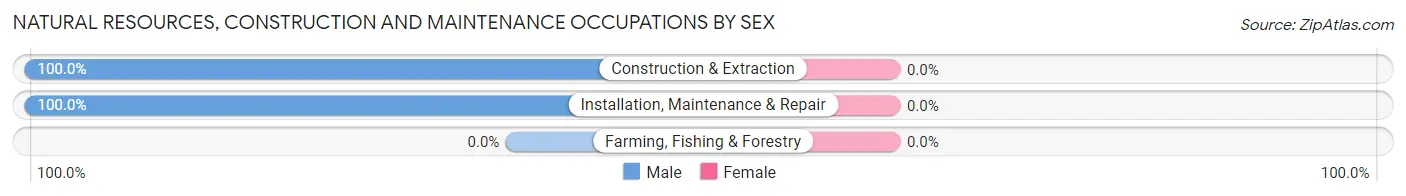
| Occupation | Male | Female |
| Farming, Fishing & Forestry | 0 (0.0%) | 0 (0.0%) |
| Construction & Extraction | 741 (100.0%) | 0 (0.0%) |
| Installation, Maintenance & Repair | 572 (100.0%) | 0 (0.0%) |
| Total (Category) | 1,313 (100.0%) | 0 (0.0%) |
| Total (Overall) | 5,553 (52.2%) | 5,082 (47.8%) |
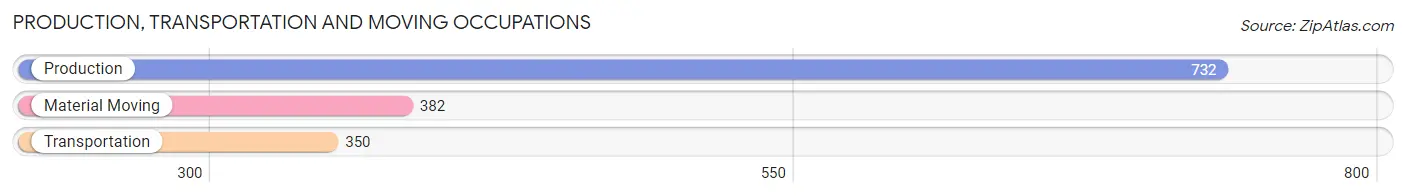
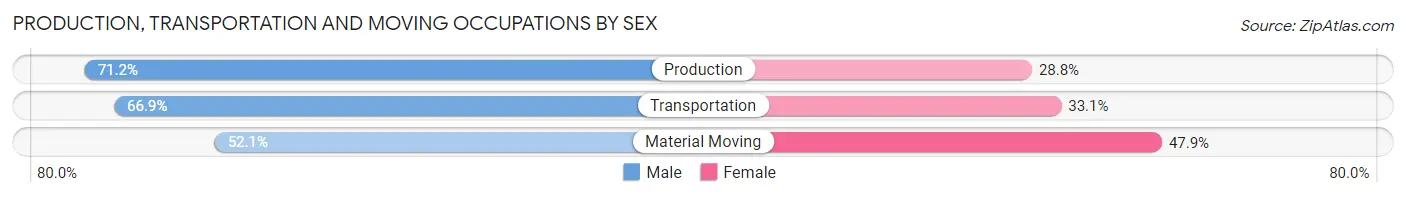
Production, Transportation and Moving Occupations
The most common Production, Transportation and Moving occupations in Arnold are Production (732 | 6.9%), Material Moving (382 | 3.6%), and Transportation (350 | 3.3%).
Production, Transportation and Moving Occupations by Sex
| Occupation | Male | Female |
| Production | 521 (71.2%) | 211 (28.8%) |
| Transportation | 234 (66.9%) | 116 (33.1%) |
| Material Moving | 199 (52.1%) | 183 (47.9%) |
| Total (Category) | 954 (65.2%) | 510 (34.8%) |
| Total (Overall) | 5,553 (52.2%) | 5,082 (47.8%) |
Employment Industries by Sex in Arnold
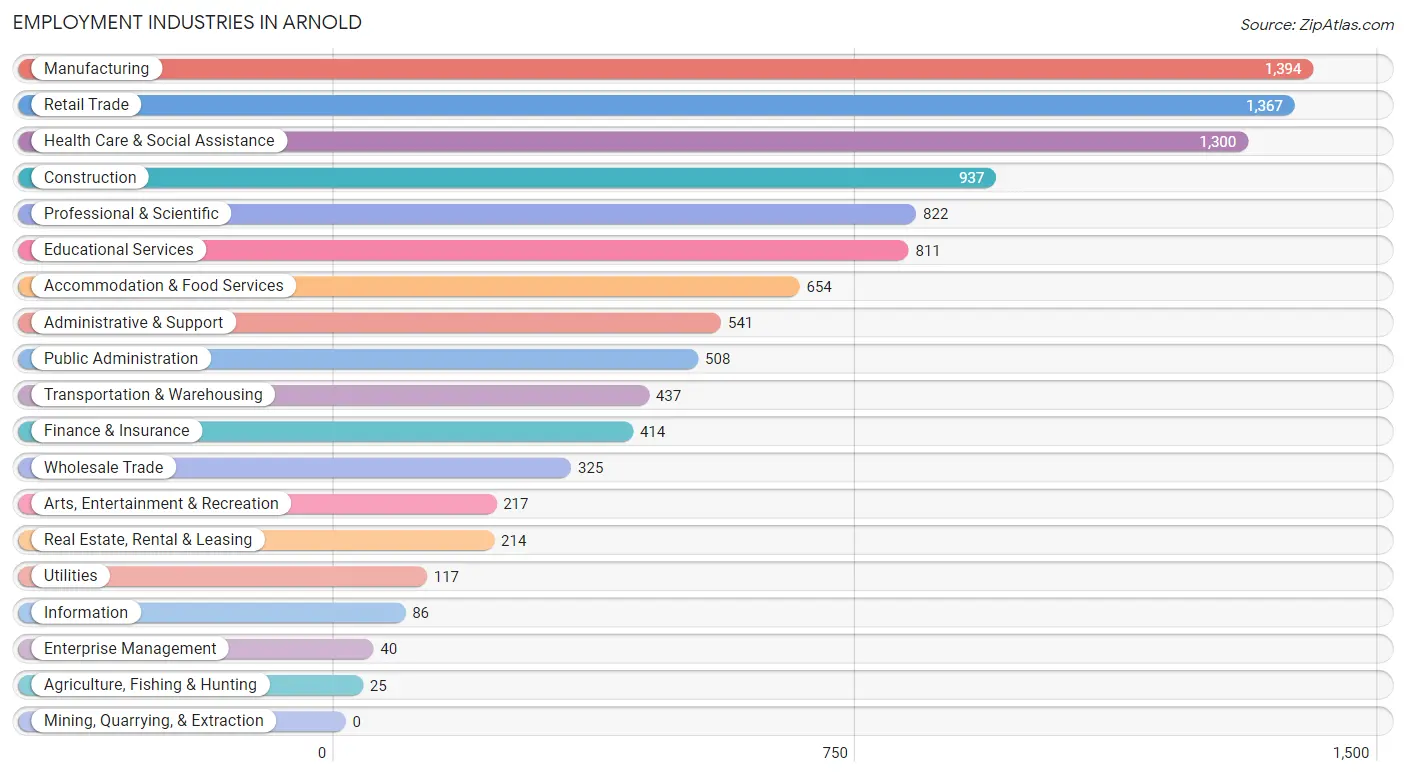
Employment Industries in Arnold
The major employment industries in Arnold include Manufacturing (1,394 | 13.1%), Retail Trade (1,367 | 12.9%), Health Care & Social Assistance (1,300 | 12.2%), Construction (937 | 8.8%), and Professional & Scientific (822 | 7.7%).
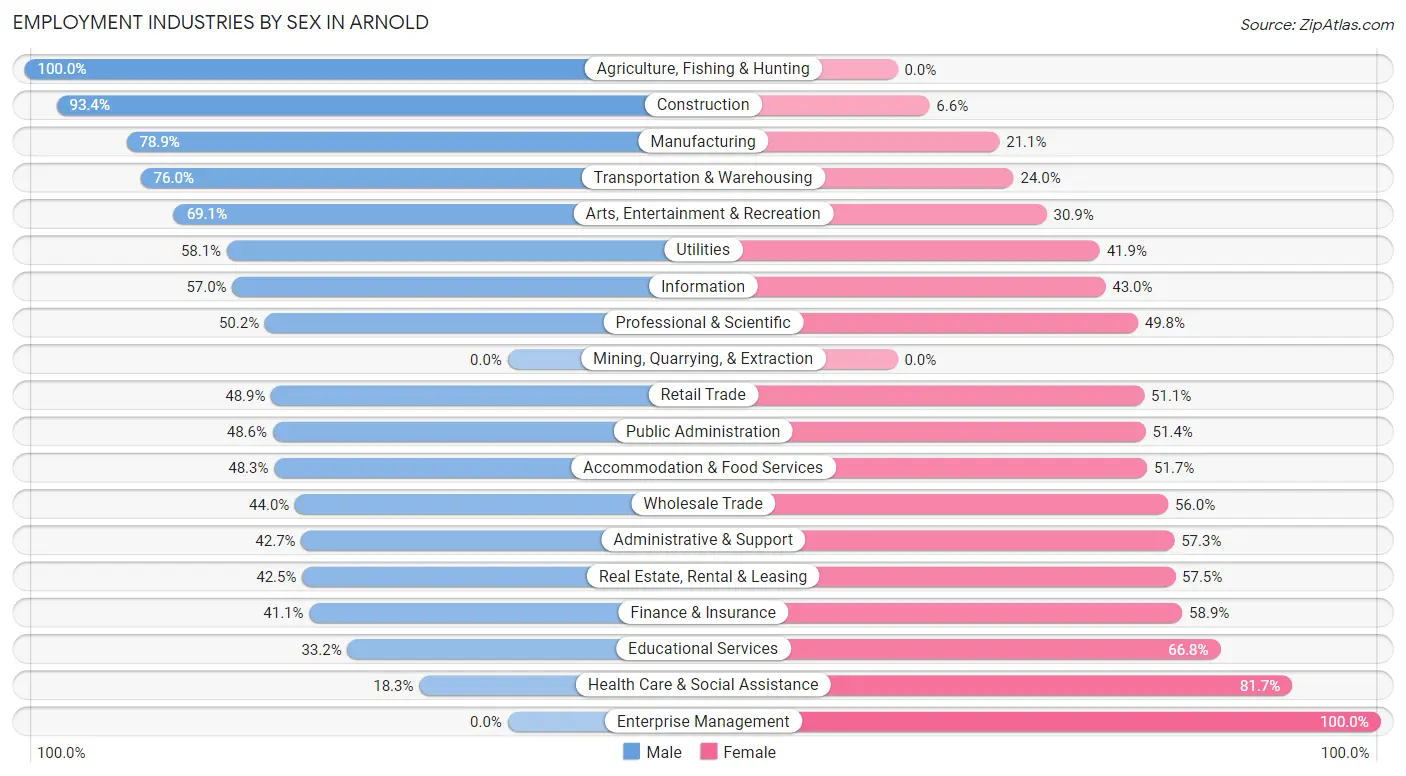
Employment Industries by Sex in Arnold
The Arnold industries that see more men than women are Agriculture, Fishing & Hunting (100.0%), Construction (93.4%), and Manufacturing (78.9%), whereas the industries that tend to have a higher number of women are Enterprise Management (100.0%), Health Care & Social Assistance (81.7%), and Educational Services (66.8%).
| Industry | Male | Female |
| Agriculture, Fishing & Hunting | 25 (100.0%) | 0 (0.0%) |
| Mining, Quarrying, & Extraction | 0 (0.0%) | 0 (0.0%) |
| Construction | 875 (93.4%) | 62 (6.6%) |
| Manufacturing | 1,100 (78.9%) | 294 (21.1%) |
| Wholesale Trade | 143 (44.0%) | 182 (56.0%) |
| Retail Trade | 669 (48.9%) | 698 (51.1%) |
| Transportation & Warehousing | 332 (76.0%) | 105 (24.0%) |
| Utilities | 68 (58.1%) | 49 (41.9%) |
| Information | 49 (57.0%) | 37 (43.0%) |
| Finance & Insurance | 170 (41.1%) | 244 (58.9%) |
| Real Estate, Rental & Leasing | 91 (42.5%) | 123 (57.5%) |
| Professional & Scientific | 413 (50.2%) | 409 (49.8%) |
| Enterprise Management | 0 (0.0%) | 40 (100.0%) |
| Administrative & Support | 231 (42.7%) | 310 (57.3%) |
| Educational Services | 269 (33.2%) | 542 (66.8%) |
| Health Care & Social Assistance | 238 (18.3%) | 1,062 (81.7%) |
| Arts, Entertainment & Recreation | 150 (69.1%) | 67 (30.9%) |
| Accommodation & Food Services | 316 (48.3%) | 338 (51.7%) |
| Public Administration | 247 (48.6%) | 261 (51.4%) |
| Total | 5,553 (52.2%) | 5,082 (47.8%) |
Education in Arnold
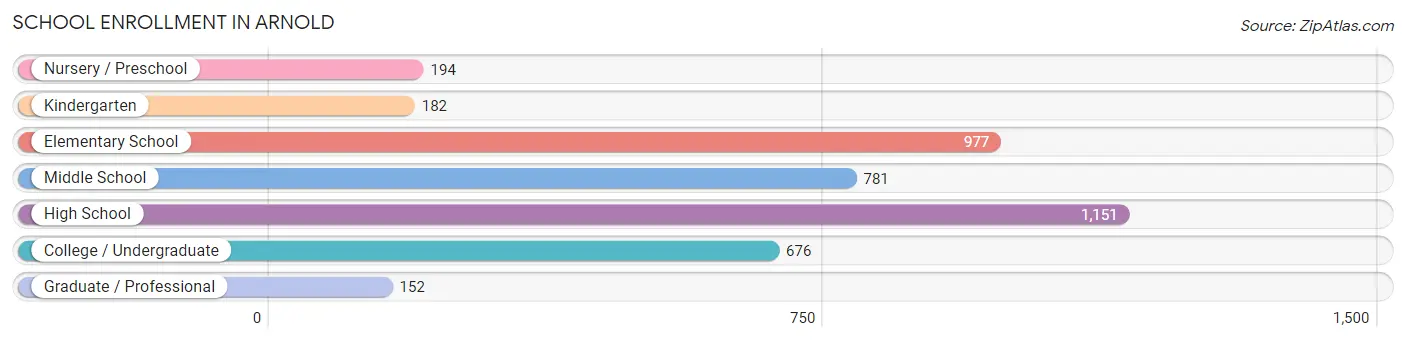
School Enrollment in Arnold
The most common levels of schooling among the 4,113 students in Arnold are high school (1,151 | 28.0%), elementary school (977 | 23.7%), and middle school (781 | 19.0%).
| School Level | # Students | % Students |
| Nursery / Preschool | 194 | 4.7% |
| Kindergarten | 182 | 4.4% |
| Elementary School | 977 | 23.7% |
| Middle School | 781 | 19.0% |
| High School | 1,151 | 28.0% |
| College / Undergraduate | 676 | 16.4% |
| Graduate / Professional | 152 | 3.7% |
| Total | 4,113 | 100.0% |
School Enrollment by Age by Funding Source in Arnold
Out of a total of 4,113 students who are enrolled in schools in Arnold, 864 (21.0%) attend a private institution, while the remaining 3,249 (79.0%) are enrolled in public schools. The age group of 35 years and over has the highest likelihood of being enrolled in private schools, with 63 (49.6% in the age bracket) enrolled. Conversely, the age group of 10 to 14 year olds has the lowest likelihood of being enrolled in a private school, with 975 (93.9% in the age bracket) attending a public institution.
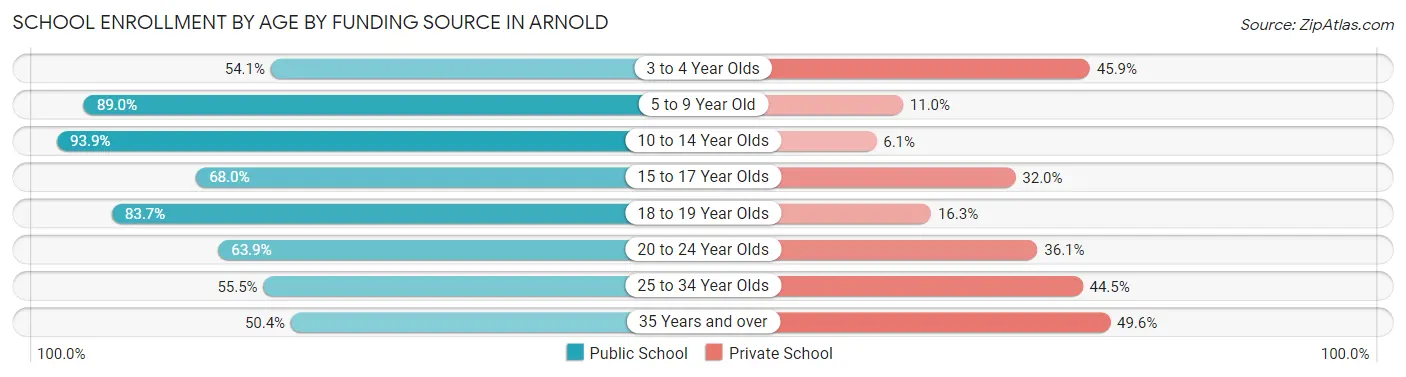
| Age Bracket | Public School | Private School |
| 3 to 4 Year Olds | 85 (54.1%) | 72 (45.9%) |
| 5 to 9 Year Old | 984 (89.0%) | 122 (11.0%) |
| 10 to 14 Year Olds | 975 (93.9%) | 63 (6.1%) |
| 15 to 17 Year Olds | 602 (68.0%) | 283 (32.0%) |
| 18 to 19 Year Olds | 206 (83.7%) | 40 (16.3%) |
| 20 to 24 Year Olds | 186 (63.9%) | 105 (36.1%) |
| 25 to 34 Year Olds | 146 (55.5%) | 117 (44.5%) |
| 35 Years and over | 64 (50.4%) | 63 (49.6%) |
| Total | 3,249 (79.0%) | 864 (21.0%) |
Educational Attainment by Field of Study in Arnold
Business (729 | 18.9%), science & technology (449 | 11.6%), bio, nature & agricultural (446 | 11.5%), education (387 | 10.0%), and arts & humanities (378 | 9.8%) are the most common fields of study among 3,867 individuals in Arnold who have obtained a bachelor's degree or higher.
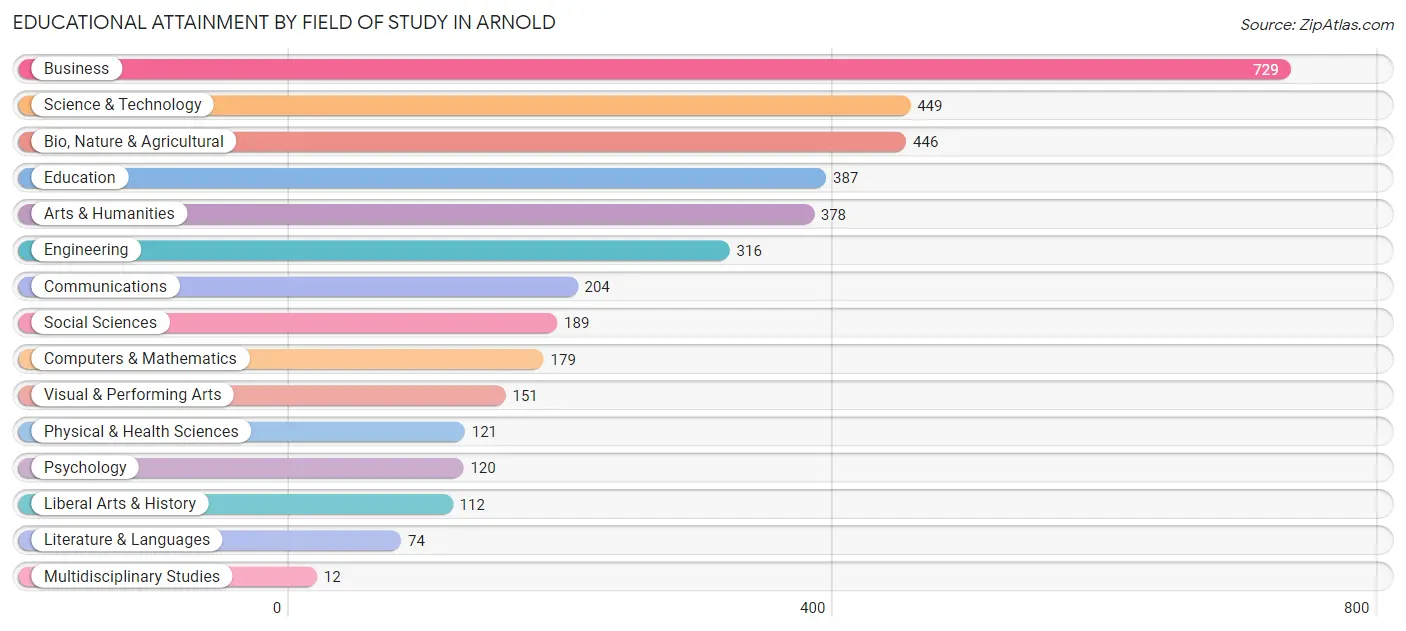
| Field of Study | # Graduates | % Graduates |
| Computers & Mathematics | 179 | 4.6% |
| Bio, Nature & Agricultural | 446 | 11.5% |
| Physical & Health Sciences | 121 | 3.1% |
| Psychology | 120 | 3.1% |
| Social Sciences | 189 | 4.9% |
| Engineering | 316 | 8.2% |
| Multidisciplinary Studies | 12 | 0.3% |
| Science & Technology | 449 | 11.6% |
| Business | 729 | 18.9% |
| Education | 387 | 10.0% |
| Literature & Languages | 74 | 1.9% |
| Liberal Arts & History | 112 | 2.9% |
| Visual & Performing Arts | 151 | 3.9% |
| Communications | 204 | 5.3% |
| Arts & Humanities | 378 | 9.8% |
| Total | 3,867 | 100.0% |
Transportation & Commute in Arnold
Vehicle Availability by Sex in Arnold
The most prevalent vehicle ownership categories in Arnold are males with 2 vehicles (2,469, accounting for 44.1%) and females with 2 vehicles (2,208, making up 49.7%).
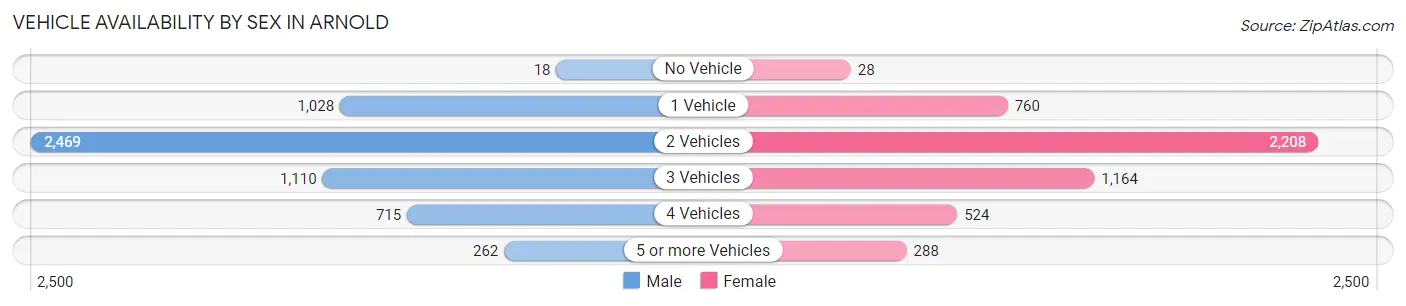
| Vehicles Available | Male | Female |
| No Vehicle | 18 (0.3%) | 28 (0.6%) |
| 1 Vehicle | 1,028 (18.3%) | 760 (15.3%) |
| 2 Vehicles | 2,469 (44.1%) | 2,208 (44.4%) |
| 3 Vehicles | 1,110 (19.8%) | 1,164 (23.4%) |
| 4 Vehicles | 715 (12.8%) | 524 (10.5%) |
| 5 or more Vehicles | 262 (4.7%) | 288 (5.8%) |
| Total | 5,602 (100.0%) | 4,972 (100.0%) |
Commute Time in Arnold
The most frequently occuring commute durations in Arnold are 30 to 34 minutes (1,945 commuters, 19.9%), 45 to 59 minutes (1,367 commuters, 14.0%), and 25 to 29 minutes (1,122 commuters, 11.5%).
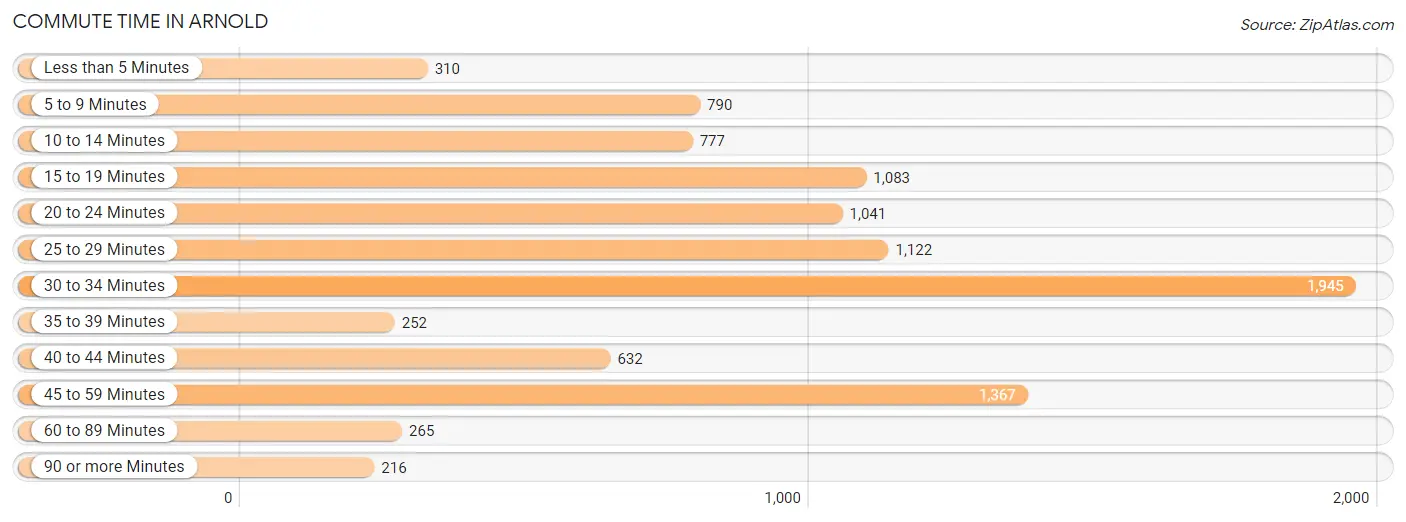
| Commute Time | # Commuters | % Commuters |
| Less than 5 Minutes | 310 | 3.2% |
| 5 to 9 Minutes | 790 | 8.1% |
| 10 to 14 Minutes | 777 | 7.9% |
| 15 to 19 Minutes | 1,083 | 11.1% |
| 20 to 24 Minutes | 1,041 | 10.6% |
| 25 to 29 Minutes | 1,122 | 11.5% |
| 30 to 34 Minutes | 1,945 | 19.9% |
| 35 to 39 Minutes | 252 | 2.6% |
| 40 to 44 Minutes | 632 | 6.5% |
| 45 to 59 Minutes | 1,367 | 14.0% |
| 60 to 89 Minutes | 265 | 2.7% |
| 90 or more Minutes | 216 | 2.2% |
Commute Time by Sex in Arnold
The most common commute times in Arnold are 30 to 34 minutes (998 commuters, 18.7%) for males and 30 to 34 minutes (947 commuters, 21.2%) for females.
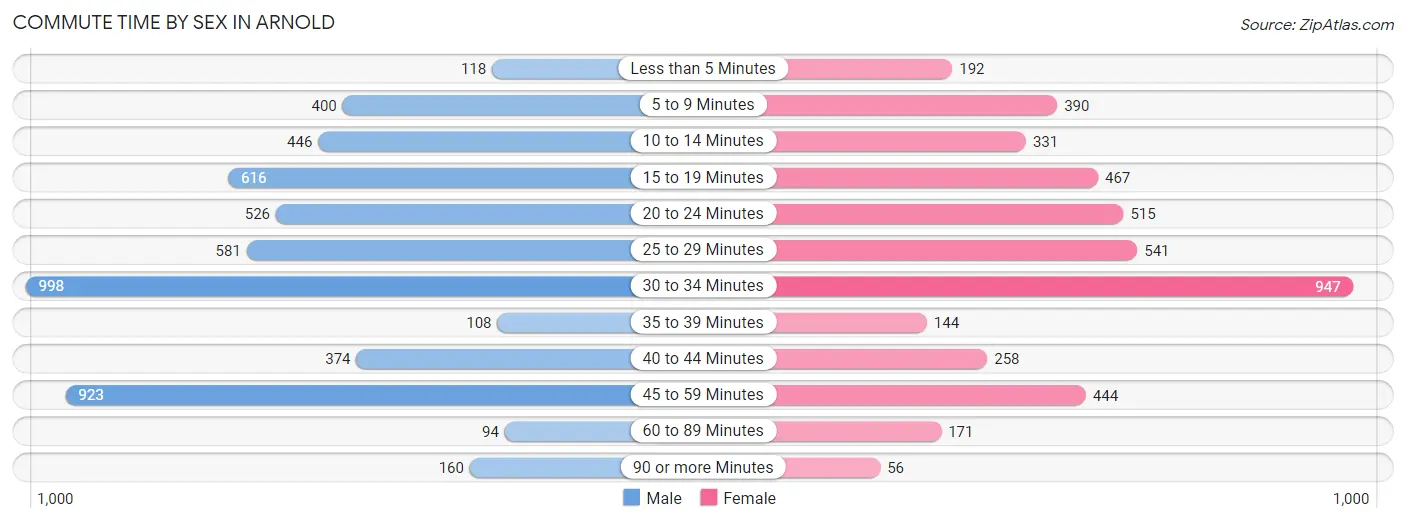
| Commute Time | Male | Female |
| Less than 5 Minutes | 118 (2.2%) | 192 (4.3%) |
| 5 to 9 Minutes | 400 (7.5%) | 390 (8.7%) |
| 10 to 14 Minutes | 446 (8.4%) | 331 (7.4%) |
| 15 to 19 Minutes | 616 (11.5%) | 467 (10.5%) |
| 20 to 24 Minutes | 526 (9.8%) | 515 (11.6%) |
| 25 to 29 Minutes | 581 (10.9%) | 541 (12.1%) |
| 30 to 34 Minutes | 998 (18.7%) | 947 (21.2%) |
| 35 to 39 Minutes | 108 (2.0%) | 144 (3.2%) |
| 40 to 44 Minutes | 374 (7.0%) | 258 (5.8%) |
| 45 to 59 Minutes | 923 (17.3%) | 444 (10.0%) |
| 60 to 89 Minutes | 94 (1.8%) | 171 (3.8%) |
| 90 or more Minutes | 160 (3.0%) | 56 (1.3%) |
Time of Departure to Work by Sex in Arnold
The most frequent times of departure to work in Arnold are 6:00 AM to 6:29 AM (754, 14.1%) for males and 6:30 AM to 6:59 AM (626, 14.1%) for females.
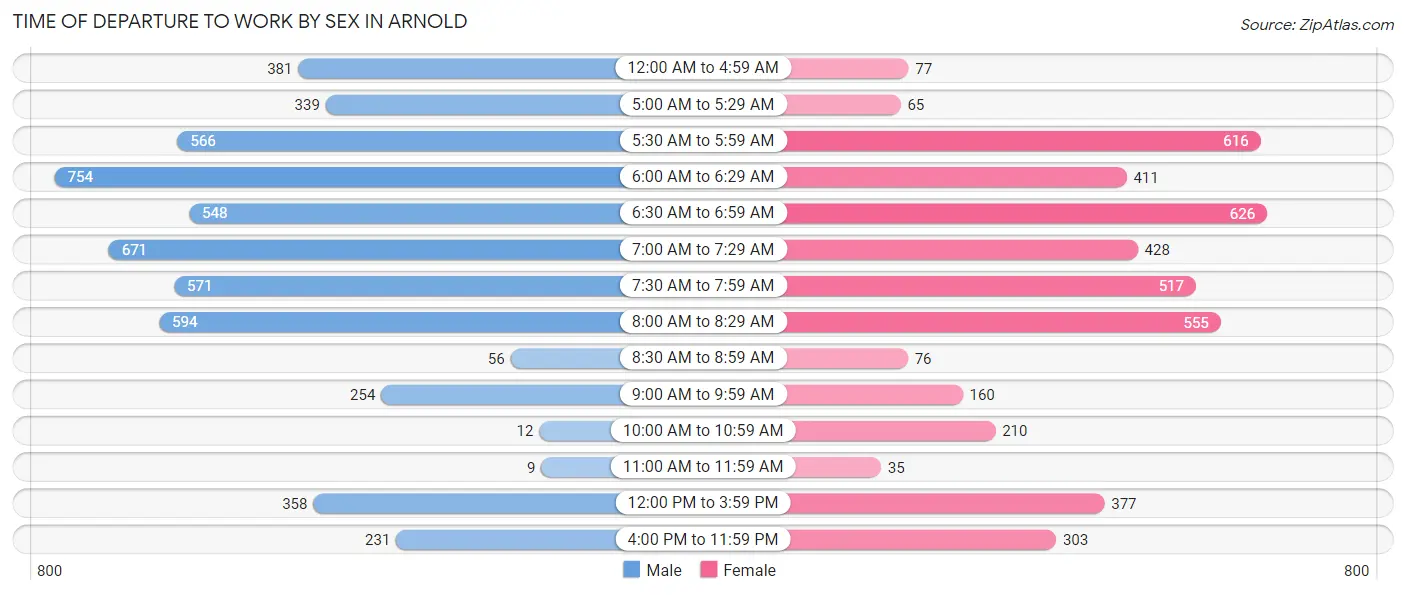
| Time of Departure | Male | Female |
| 12:00 AM to 4:59 AM | 381 (7.1%) | 77 (1.7%) |
| 5:00 AM to 5:29 AM | 339 (6.3%) | 65 (1.5%) |
| 5:30 AM to 5:59 AM | 566 (10.6%) | 616 (13.8%) |
| 6:00 AM to 6:29 AM | 754 (14.1%) | 411 (9.2%) |
| 6:30 AM to 6:59 AM | 548 (10.2%) | 626 (14.1%) |
| 7:00 AM to 7:29 AM | 671 (12.6%) | 428 (9.6%) |
| 7:30 AM to 7:59 AM | 571 (10.7%) | 517 (11.6%) |
| 8:00 AM to 8:29 AM | 594 (11.1%) | 555 (12.5%) |
| 8:30 AM to 8:59 AM | 56 (1.1%) | 76 (1.7%) |
| 9:00 AM to 9:59 AM | 254 (4.8%) | 160 (3.6%) |
| 10:00 AM to 10:59 AM | 12 (0.2%) | 210 (4.7%) |
| 11:00 AM to 11:59 AM | 9 (0.2%) | 35 (0.8%) |
| 12:00 PM to 3:59 PM | 358 (6.7%) | 377 (8.5%) |
| 4:00 PM to 11:59 PM | 231 (4.3%) | 303 (6.8%) |
| Total | 5,344 (100.0%) | 4,456 (100.0%) |
Housing Occupancy in Arnold
Occupancy by Ownership in Arnold
Of the total 8,546 dwellings in Arnold, owner-occupied units account for 6,382 (74.7%), while renter-occupied units make up 2,164 (25.3%).
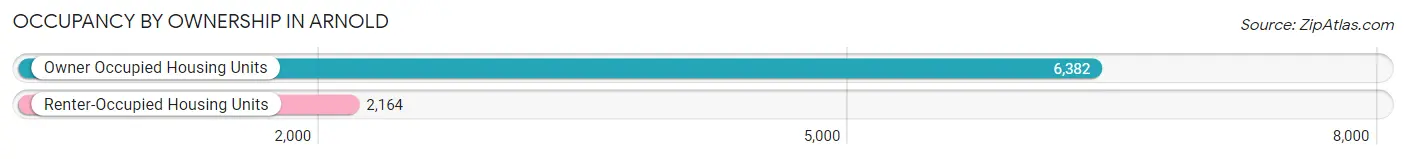
| Occupancy | # Housing Units | % Housing Units |
| Owner Occupied Housing Units | 6,382 | 74.7% |
| Renter-Occupied Housing Units | 2,164 | 25.3% |
| Total Occupied Housing Units | 8,546 | 100.0% |
Occupancy by Household Size in Arnold
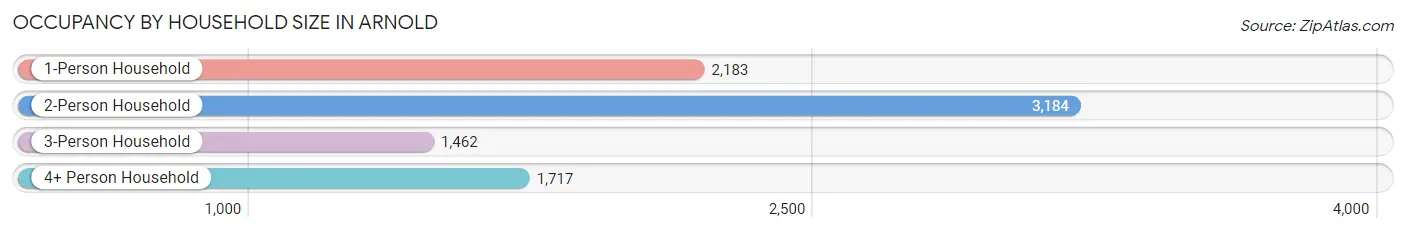
| Household Size | # Housing Units | % Housing Units |
| 1-Person Household | 2,183 | 25.5% |
| 2-Person Household | 3,184 | 37.3% |
| 3-Person Household | 1,462 | 17.1% |
| 4+ Person Household | 1,717 | 20.1% |
| Total Housing Units | 8,546 | 100.0% |
Occupancy by Ownership by Household Size in Arnold
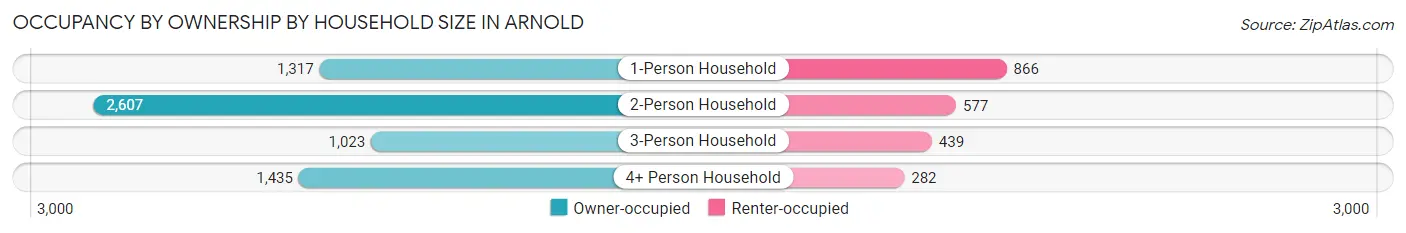
| Household Size | Owner-occupied | Renter-occupied |
| 1-Person Household | 1,317 (60.3%) | 866 (39.7%) |
| 2-Person Household | 2,607 (81.9%) | 577 (18.1%) |
| 3-Person Household | 1,023 (70.0%) | 439 (30.0%) |
| 4+ Person Household | 1,435 (83.6%) | 282 (16.4%) |
| Total Housing Units | 6,382 (74.7%) | 2,164 (25.3%) |
Occupancy by Educational Attainment in Arnold
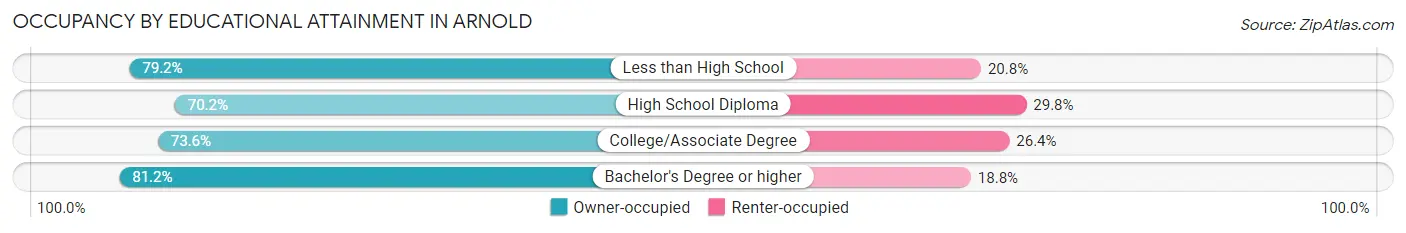
| Household Size | Owner-occupied | Renter-occupied |
| Less than High School | 530 (79.2%) | 139 (20.8%) |
| High School Diploma | 1,983 (70.2%) | 841 (29.8%) |
| College/Associate Degree | 2,265 (73.6%) | 813 (26.4%) |
| Bachelor's Degree or higher | 1,604 (81.2%) | 371 (18.8%) |
Occupancy by Age of Householder in Arnold
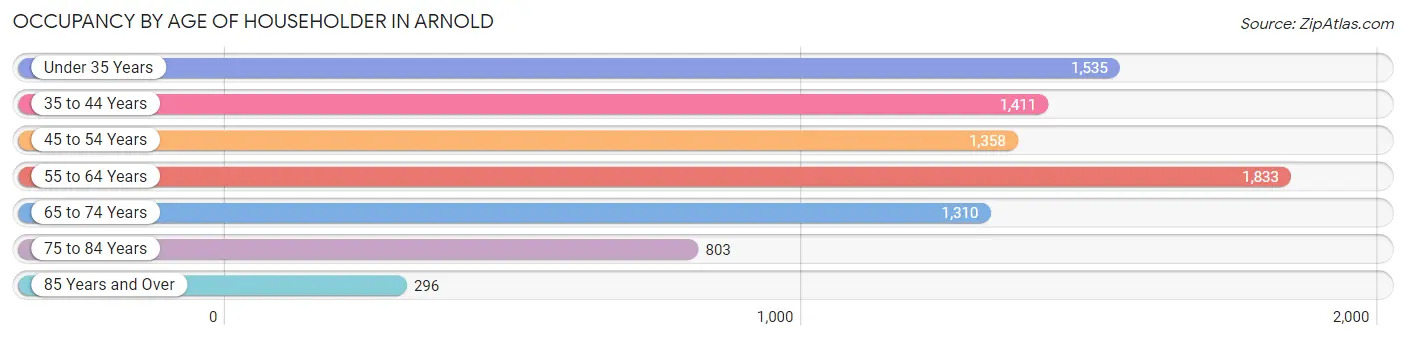
| Age Bracket | # Households | % Households |
| Under 35 Years | 1,535 | 18.0% |
| 35 to 44 Years | 1,411 | 16.5% |
| 45 to 54 Years | 1,358 | 15.9% |
| 55 to 64 Years | 1,833 | 21.4% |
| 65 to 74 Years | 1,310 | 15.3% |
| 75 to 84 Years | 803 | 9.4% |
| 85 Years and Over | 296 | 3.5% |
| Total | 8,546 | 100.0% |
Housing Finances in Arnold
Median Income by Occupancy in Arnold
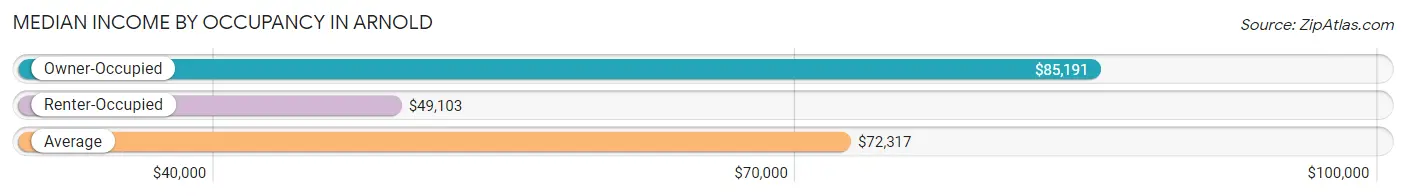
| Occupancy Type | # Households | Median Income |
| Owner-Occupied | 6,382 (74.7%) | $85,191 |
| Renter-Occupied | 2,164 (25.3%) | $49,103 |
| Average | 8,546 (100.0%) | $72,317 |
Occupancy by Householder Income Bracket in Arnold
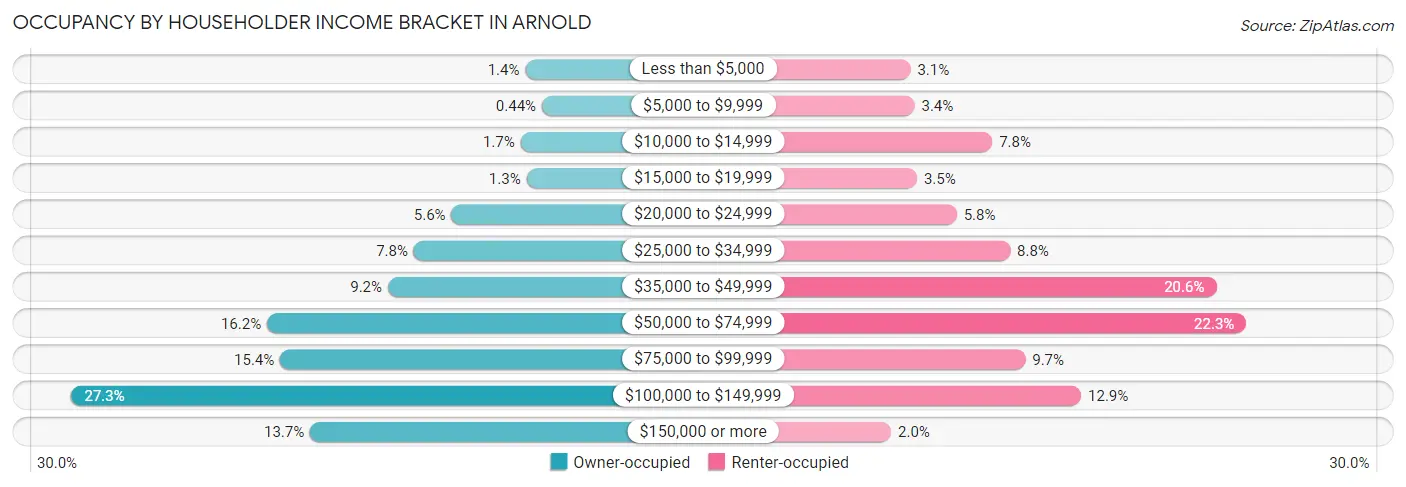
| Income Bracket | Owner-occupied | Renter-occupied |
| Less than $5,000 | 89 (1.4%) | 68 (3.1%) |
| $5,000 to $9,999 | 28 (0.4%) | 73 (3.4%) |
| $10,000 to $14,999 | 106 (1.7%) | 169 (7.8%) |
| $15,000 to $19,999 | 84 (1.3%) | 76 (3.5%) |
| $20,000 to $24,999 | 358 (5.6%) | 125 (5.8%) |
| $25,000 to $34,999 | 495 (7.8%) | 191 (8.8%) |
| $35,000 to $49,999 | 590 (9.2%) | 446 (20.6%) |
| $50,000 to $74,999 | 1,031 (16.2%) | 483 (22.3%) |
| $75,000 to $99,999 | 983 (15.4%) | 210 (9.7%) |
| $100,000 to $149,999 | 1,744 (27.3%) | 279 (12.9%) |
| $150,000 or more | 874 (13.7%) | 44 (2.0%) |
| Total | 6,382 (100.0%) | 2,164 (100.0%) |
Monthly Housing Cost Tiers in Arnold
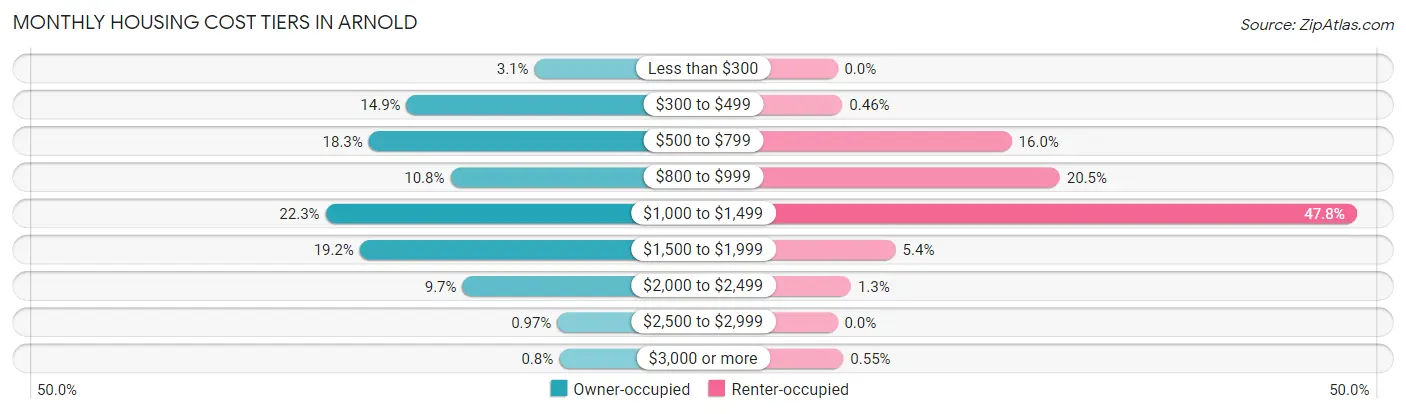
| Monthly Cost | Owner-occupied | Renter-occupied |
| Less than $300 | 196 (3.1%) | 0 (0.0%) |
| $300 to $499 | 948 (14.8%) | 10 (0.5%) |
| $500 to $799 | 1,170 (18.3%) | 347 (16.0%) |
| $800 to $999 | 690 (10.8%) | 443 (20.5%) |
| $1,000 to $1,499 | 1,424 (22.3%) | 1,034 (47.8%) |
| $1,500 to $1,999 | 1,222 (19.2%) | 116 (5.4%) |
| $2,000 to $2,499 | 619 (9.7%) | 27 (1.3%) |
| $2,500 to $2,999 | 62 (1.0%) | 0 (0.0%) |
| $3,000 or more | 51 (0.8%) | 12 (0.5%) |
| Total | 6,382 (100.0%) | 2,164 (100.0%) |
Physical Housing Characteristics in Arnold
Housing Structures in Arnold
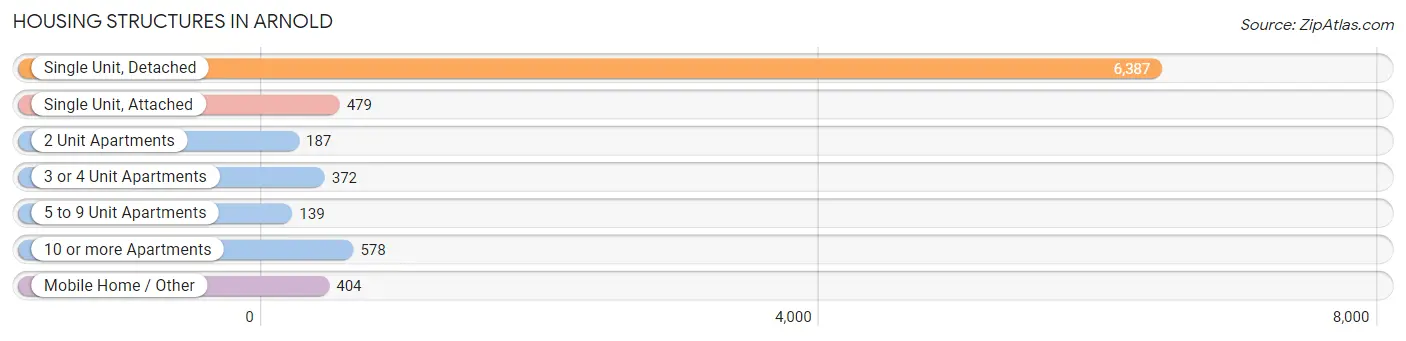
| Structure Type | # Housing Units | % Housing Units |
| Single Unit, Detached | 6,387 | 74.7% |
| Single Unit, Attached | 479 | 5.6% |
| 2 Unit Apartments | 187 | 2.2% |
| 3 or 4 Unit Apartments | 372 | 4.3% |
| 5 to 9 Unit Apartments | 139 | 1.6% |
| 10 or more Apartments | 578 | 6.8% |
| Mobile Home / Other | 404 | 4.7% |
| Total | 8,546 | 100.0% |
Housing Structures by Occupancy in Arnold
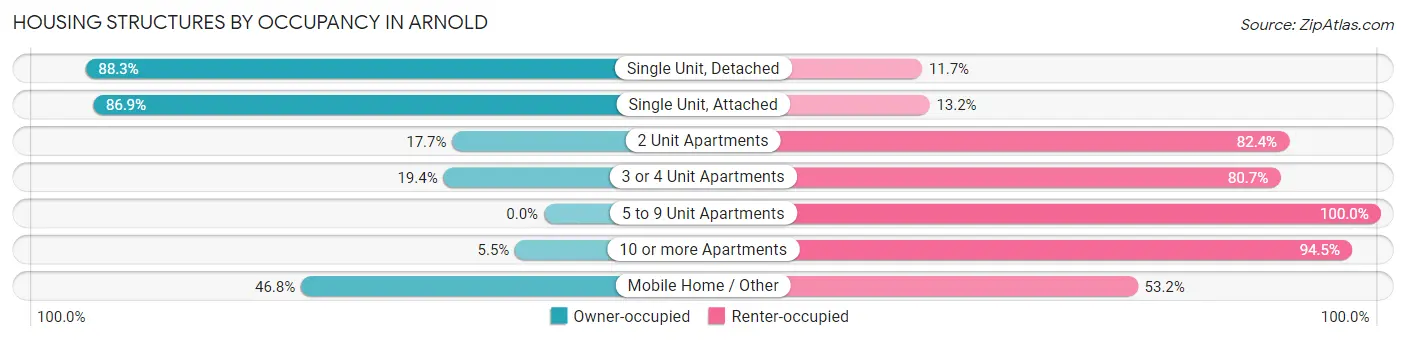
| Structure Type | Owner-occupied | Renter-occupied |
| Single Unit, Detached | 5,640 (88.3%) | 747 (11.7%) |
| Single Unit, Attached | 416 (86.9%) | 63 (13.2%) |
| 2 Unit Apartments | 33 (17.6%) | 154 (82.4%) |
| 3 or 4 Unit Apartments | 72 (19.4%) | 300 (80.6%) |
| 5 to 9 Unit Apartments | 0 (0.0%) | 139 (100.0%) |
| 10 or more Apartments | 32 (5.5%) | 546 (94.5%) |
| Mobile Home / Other | 189 (46.8%) | 215 (53.2%) |
| Total | 6,382 (74.7%) | 2,164 (25.3%) |
Housing Structures by Number of Rooms in Arnold
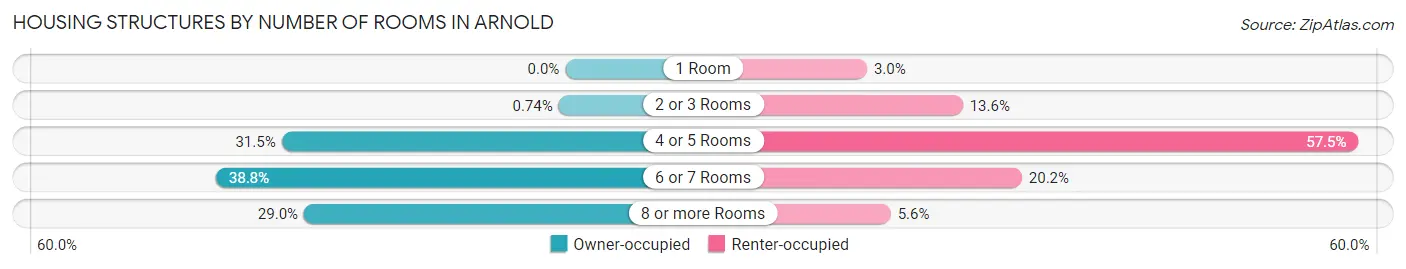
| Number of Rooms | Owner-occupied | Renter-occupied |
| 1 Room | 0 (0.0%) | 65 (3.0%) |
| 2 or 3 Rooms | 47 (0.7%) | 295 (13.6%) |
| 4 or 5 Rooms | 2,010 (31.5%) | 1,245 (57.5%) |
| 6 or 7 Rooms | 2,474 (38.8%) | 437 (20.2%) |
| 8 or more Rooms | 1,851 (29.0%) | 122 (5.6%) |
| Total | 6,382 (100.0%) | 2,164 (100.0%) |
Housing Structure by Heating Type in Arnold
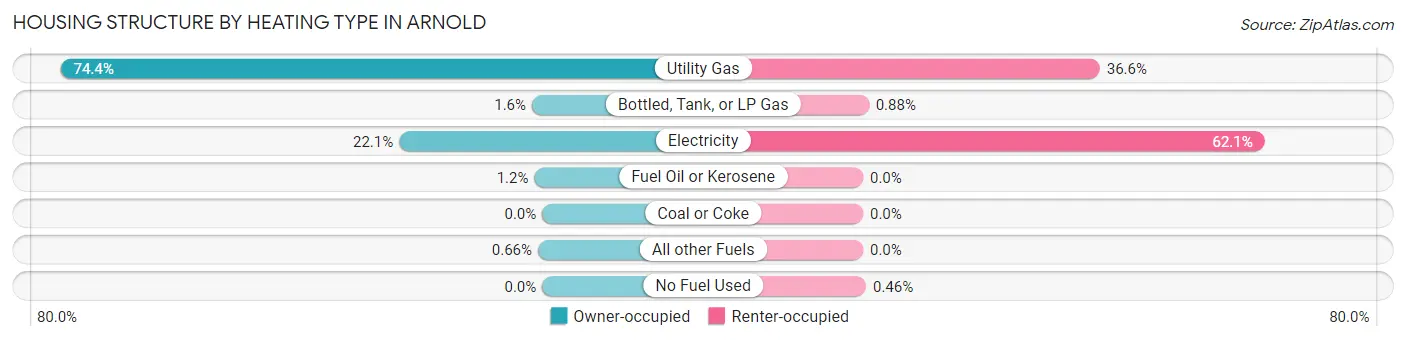
| Heating Type | Owner-occupied | Renter-occupied |
| Utility Gas | 4,751 (74.4%) | 792 (36.6%) |
| Bottled, Tank, or LP Gas | 101 (1.6%) | 19 (0.9%) |
| Electricity | 1,411 (22.1%) | 1,343 (62.1%) |
| Fuel Oil or Kerosene | 77 (1.2%) | 0 (0.0%) |
| Coal or Coke | 0 (0.0%) | 0 (0.0%) |
| All other Fuels | 42 (0.7%) | 0 (0.0%) |
| No Fuel Used | 0 (0.0%) | 10 (0.5%) |
| Total | 6,382 (100.0%) | 2,164 (100.0%) |
Household Vehicle Usage in Arnold
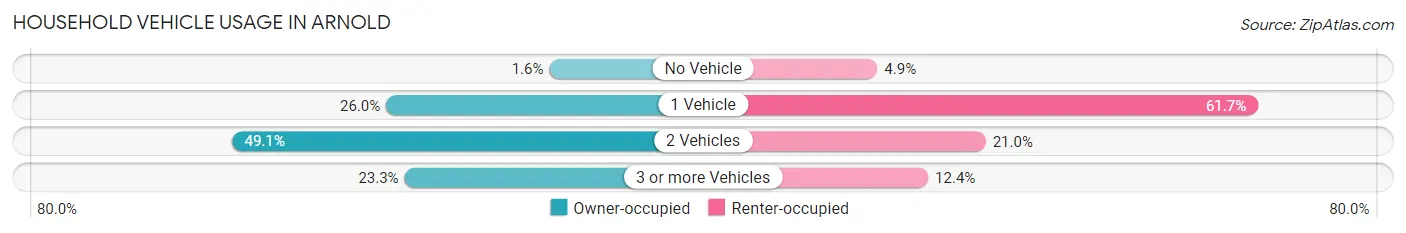
| Vehicles per Household | Owner-occupied | Renter-occupied |
| No Vehicle | 104 (1.6%) | 105 (4.9%) |
| 1 Vehicle | 1,660 (26.0%) | 1,335 (61.7%) |
| 2 Vehicles | 3,133 (49.1%) | 455 (21.0%) |
| 3 or more Vehicles | 1,485 (23.3%) | 269 (12.4%) |
| Total | 6,382 (100.0%) | 2,164 (100.0%) |
Real Estate & Mortgages in Arnold
Real Estate and Mortgage Overview in Arnold
| Characteristic | Without Mortgage | With Mortgage |
| Housing Units | 2,337 | 4,045 |
| Median Property Value | $178,600 | $198,700 |
| Median Household Income | $54,806 | $678 |
| Monthly Housing Costs | $511 | $51 |
| Real Estate Taxes | $1,440 | $40 |
Property Value by Mortgage Status in Arnold
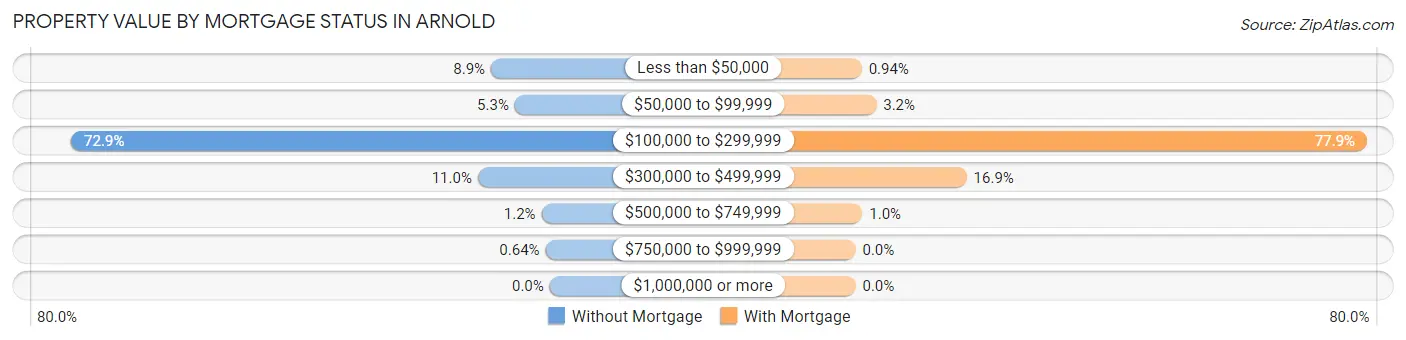
| Property Value | Without Mortgage | With Mortgage |
| Less than $50,000 | 209 (8.9%) | 38 (0.9%) |
| $50,000 to $99,999 | 124 (5.3%) | 128 (3.2%) |
| $100,000 to $299,999 | 1,704 (72.9%) | 3,152 (77.9%) |
| $300,000 to $499,999 | 256 (11.0%) | 685 (16.9%) |
| $500,000 to $749,999 | 29 (1.2%) | 42 (1.0%) |
| $750,000 to $999,999 | 15 (0.6%) | 0 (0.0%) |
| $1,000,000 or more | 0 (0.0%) | 0 (0.0%) |
| Total | 2,337 (100.0%) | 4,045 (100.0%) |
Household Income by Mortgage Status in Arnold
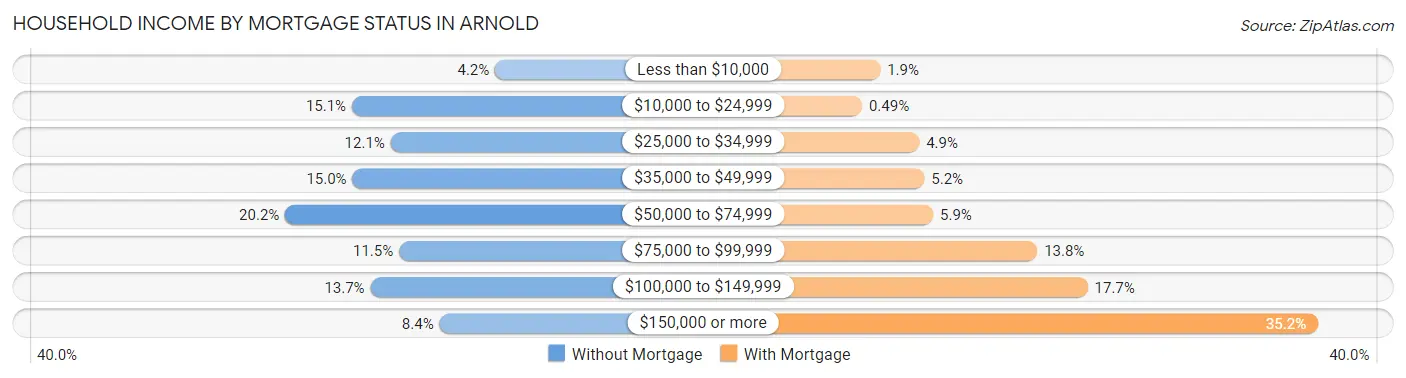
| Household Income | Without Mortgage | With Mortgage |
| Less than $10,000 | 97 (4.2%) | 76 (1.9%) |
| $10,000 to $24,999 | 352 (15.1%) | 20 (0.5%) |
| $25,000 to $34,999 | 283 (12.1%) | 196 (4.9%) |
| $35,000 to $49,999 | 351 (15.0%) | 212 (5.2%) |
| $50,000 to $74,999 | 471 (20.2%) | 239 (5.9%) |
| $75,000 to $99,999 | 268 (11.5%) | 560 (13.8%) |
| $100,000 to $149,999 | 319 (13.7%) | 715 (17.7%) |
| $150,000 or more | 196 (8.4%) | 1,425 (35.2%) |
| Total | 2,337 (100.0%) | 4,045 (100.0%) |
Property Value to Household Income Ratio in Arnold
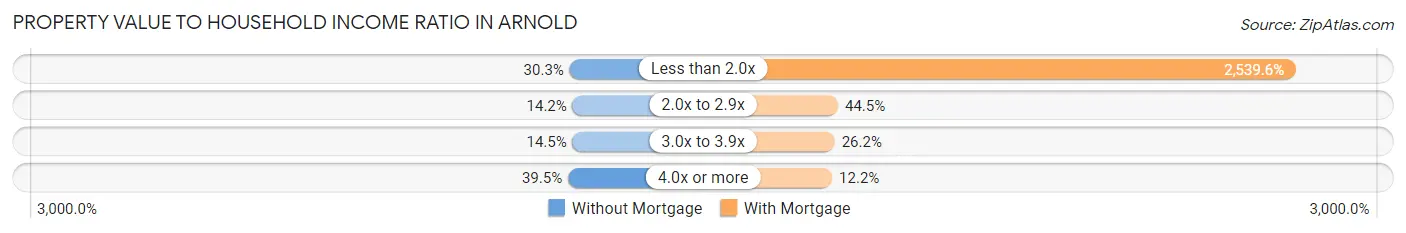
| Value-to-Income Ratio | Without Mortgage | With Mortgage |
| Less than 2.0x | 708 (30.3%) | 102,726 (2,539.6%) |
| 2.0x to 2.9x | 332 (14.2%) | 1,799 (44.5%) |
| 3.0x to 3.9x | 339 (14.5%) | 1,059 (26.2%) |
| 4.0x or more | 922 (39.5%) | 494 (12.2%) |
| Total | 2,337 (100.0%) | 4,045 (100.0%) |
Real Estate Taxes by Mortgage Status in Arnold
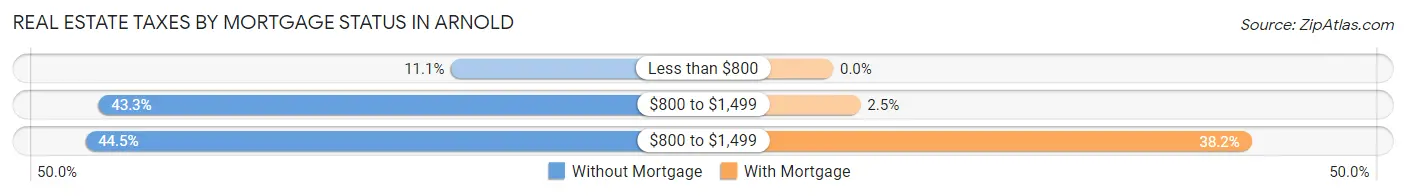
| Property Taxes | Without Mortgage | With Mortgage |
| Less than $800 | 260 (11.1%) | 0 (0.0%) |
| $800 to $1,499 | 1,011 (43.3%) | 101 (2.5%) |
| $800 to $1,499 | 1,039 (44.5%) | 1,546 (38.2%) |
| Total | 2,337 (100.0%) | 4,045 (100.0%) |
Health & Disability in Arnold
Health Insurance Coverage by Age in Arnold
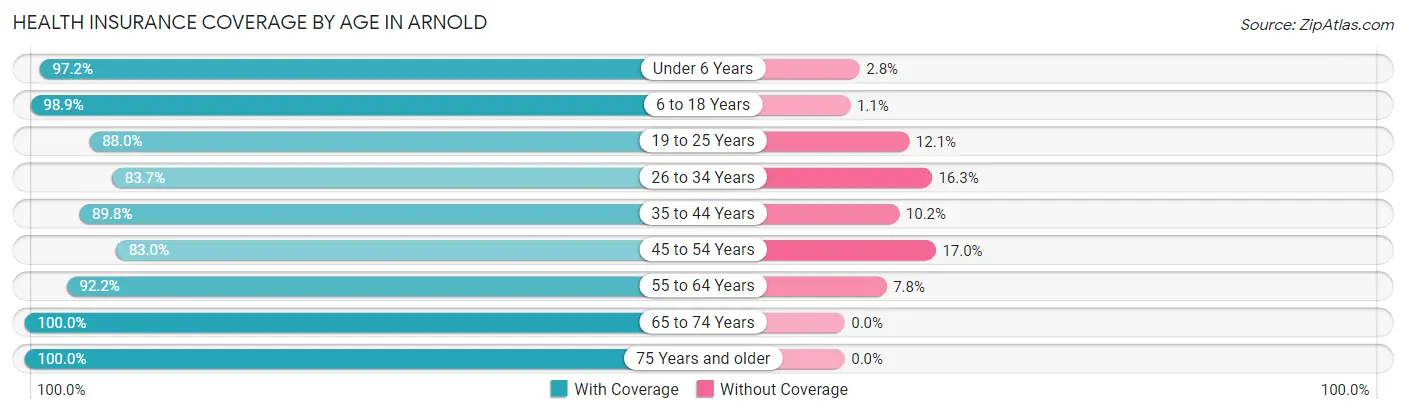
| Age Bracket | With Coverage | Without Coverage |
| Under 6 Years | 1,416 (97.2%) | 41 (2.8%) |
| 6 to 18 Years | 3,057 (98.9%) | 33 (1.1%) |
| 19 to 25 Years | 1,058 (87.9%) | 145 (12.0%) |
| 26 to 34 Years | 2,612 (83.7%) | 507 (16.3%) |
| 35 to 44 Years | 2,217 (89.8%) | 251 (10.2%) |
| 45 to 54 Years | 1,899 (83.0%) | 389 (17.0%) |
| 55 to 64 Years | 2,976 (92.2%) | 252 (7.8%) |
| 65 to 74 Years | 2,081 (100.0%) | 0 (0.0%) |
| 75 Years and older | 1,657 (100.0%) | 0 (0.0%) |
| Total | 18,973 (92.1%) | 1,618 (7.9%) |
Health Insurance Coverage by Citizenship Status in Arnold
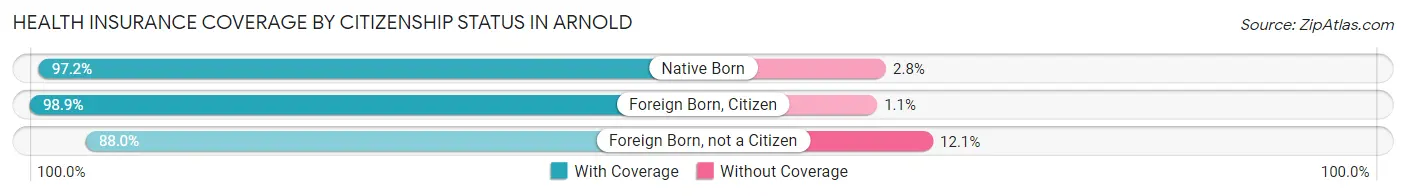
| Citizenship Status | With Coverage | Without Coverage |
| Native Born | 1,416 (97.2%) | 41 (2.8%) |
| Foreign Born, Citizen | 3,057 (98.9%) | 33 (1.1%) |
| Foreign Born, not a Citizen | 1,058 (87.9%) | 145 (12.0%) |
Health Insurance Coverage by Household Income in Arnold
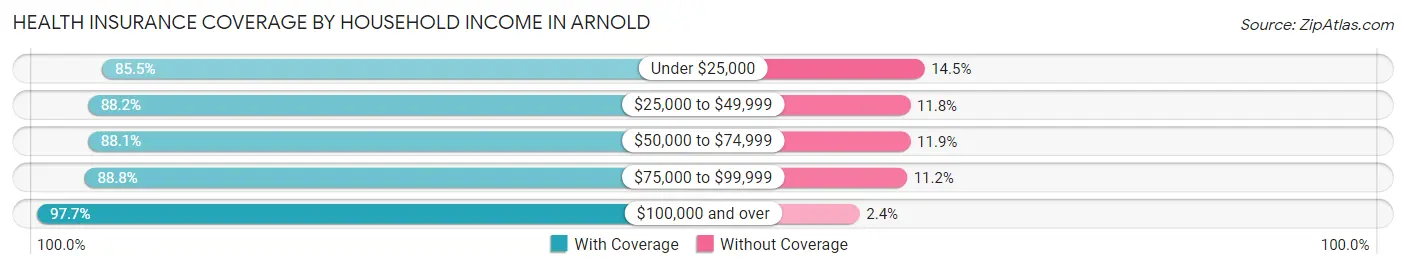
| Household Income | With Coverage | Without Coverage |
| Under $25,000 | 1,602 (85.5%) | 272 (14.5%) |
| $25,000 to $49,999 | 2,661 (88.2%) | 357 (11.8%) |
| $50,000 to $74,999 | 3,074 (88.1%) | 414 (11.9%) |
| $75,000 to $99,999 | 2,863 (88.8%) | 362 (11.2%) |
| $100,000 and over | 8,757 (97.7%) | 211 (2.4%) |
Public vs Private Health Insurance Coverage by Age in Arnold
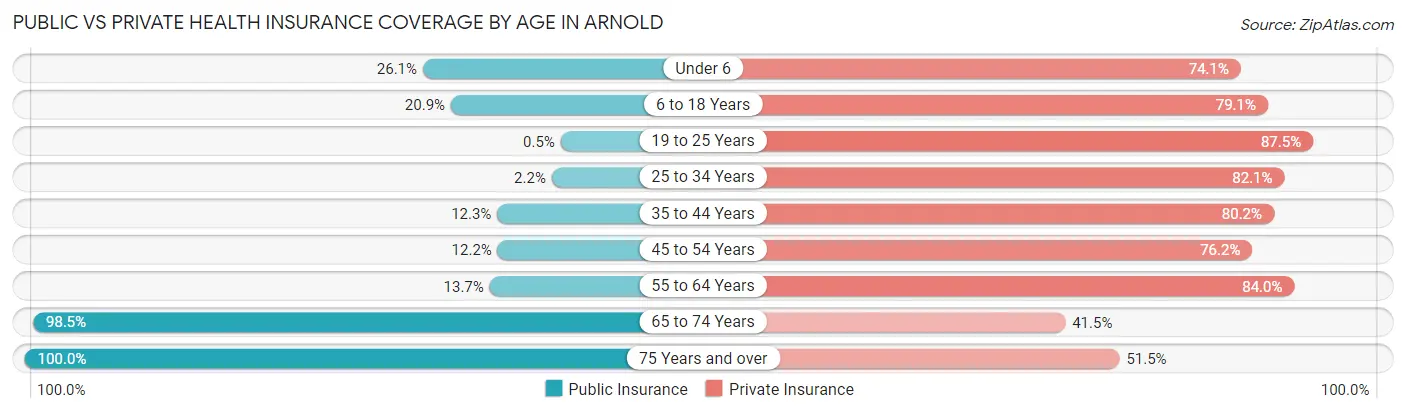
| Age Bracket | Public Insurance | Private Insurance |
| Under 6 | 380 (26.1%) | 1,079 (74.1%) |
| 6 to 18 Years | 645 (20.9%) | 2,443 (79.1%) |
| 19 to 25 Years | 6 (0.5%) | 1,052 (87.5%) |
| 25 to 34 Years | 67 (2.1%) | 2,562 (82.1%) |
| 35 to 44 Years | 303 (12.3%) | 1,979 (80.2%) |
| 45 to 54 Years | 279 (12.2%) | 1,743 (76.2%) |
| 55 to 64 Years | 442 (13.7%) | 2,711 (84.0%) |
| 65 to 74 Years | 2,049 (98.5%) | 863 (41.5%) |
| 75 Years and over | 1,657 (100.0%) | 854 (51.5%) |
| Total | 5,828 (28.3%) | 15,286 (74.2%) |
Disability Status by Sex by Age in Arnold
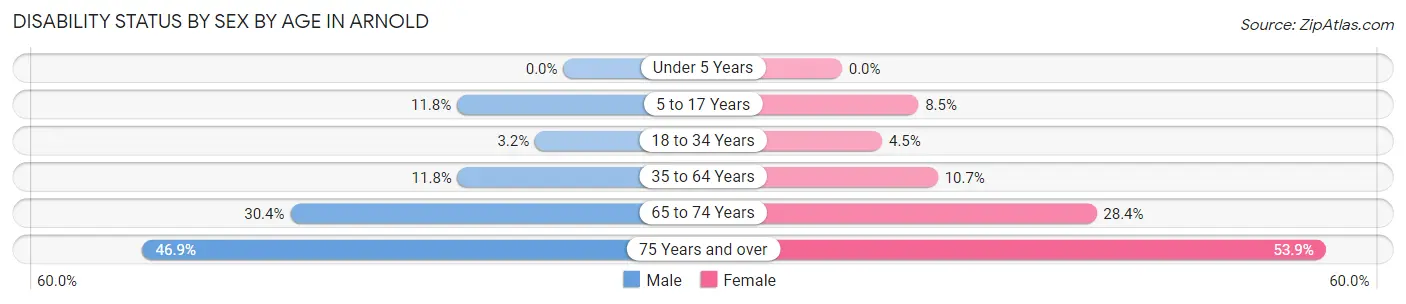
| Age Bracket | Male | Female |
| Under 5 Years | 0 (0.0%) | 0 (0.0%) |
| 5 to 17 Years | 176 (11.8%) | 133 (8.5%) |
| 18 to 34 Years | 75 (3.2%) | 96 (4.5%) |
| 35 to 64 Years | 458 (11.8%) | 437 (10.7%) |
| 65 to 74 Years | 281 (30.4%) | 328 (28.3%) |
| 75 Years and over | 305 (46.9%) | 542 (53.9%) |
Disability Class by Sex by Age in Arnold
Disability Class: Hearing Difficulty
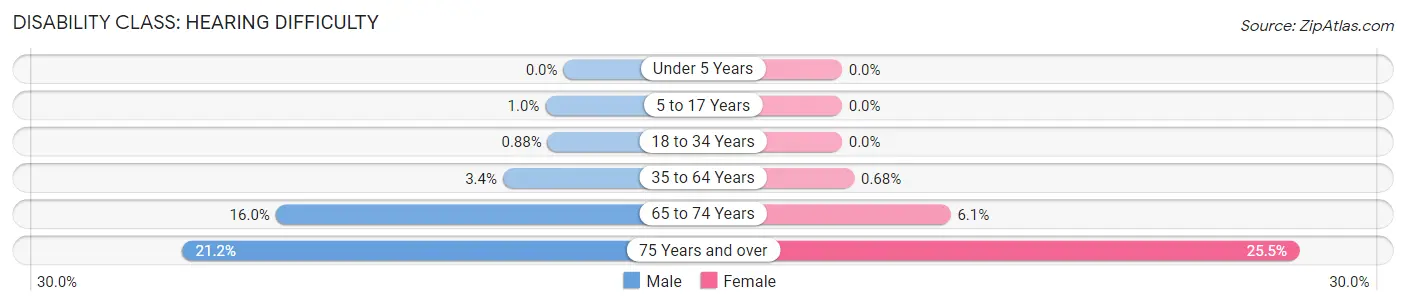
| Age Bracket | Male | Female |
| Under 5 Years | 0 (0.0%) | 0 (0.0%) |
| 5 to 17 Years | 15 (1.0%) | 0 (0.0%) |
| 18 to 34 Years | 21 (0.9%) | 0 (0.0%) |
| 35 to 64 Years | 131 (3.4%) | 28 (0.7%) |
| 65 to 74 Years | 148 (16.0%) | 70 (6.0%) |
| 75 Years and over | 138 (21.2%) | 256 (25.5%) |
Disability Class: Vision Difficulty
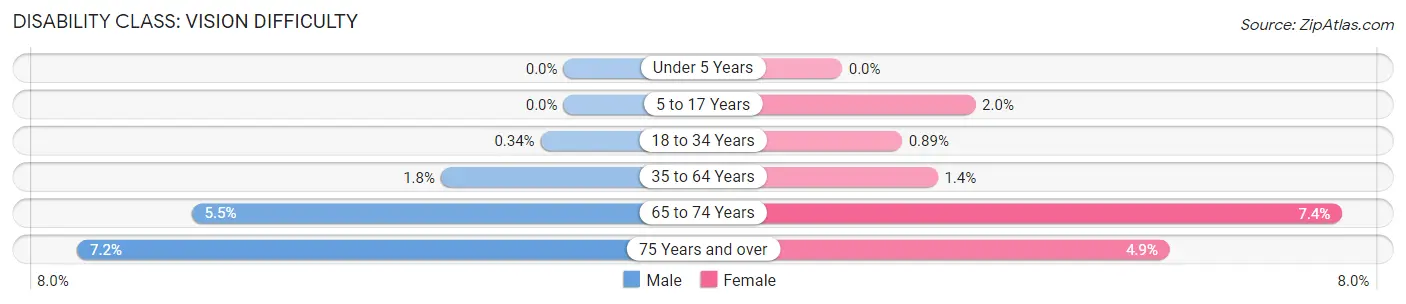
| Age Bracket | Male | Female |
| Under 5 Years | 0 (0.0%) | 0 (0.0%) |
| 5 to 17 Years | 0 (0.0%) | 31 (2.0%) |
| 18 to 34 Years | 8 (0.3%) | 19 (0.9%) |
| 35 to 64 Years | 71 (1.8%) | 58 (1.4%) |
| 65 to 74 Years | 51 (5.5%) | 86 (7.4%) |
| 75 Years and over | 47 (7.2%) | 49 (4.9%) |
Disability Class: Cognitive Difficulty
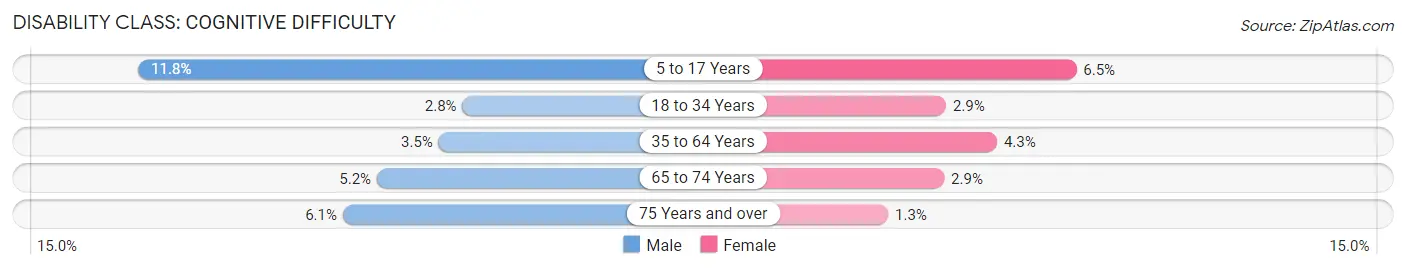
| Age Bracket | Male | Female |
| 5 to 17 Years | 176 (11.8%) | 102 (6.5%) |
| 18 to 34 Years | 67 (2.8%) | 62 (2.9%) |
| 35 to 64 Years | 135 (3.5%) | 177 (4.3%) |
| 65 to 74 Years | 48 (5.2%) | 33 (2.9%) |
| 75 Years and over | 40 (6.1%) | 13 (1.3%) |
Disability Class: Ambulatory Difficulty
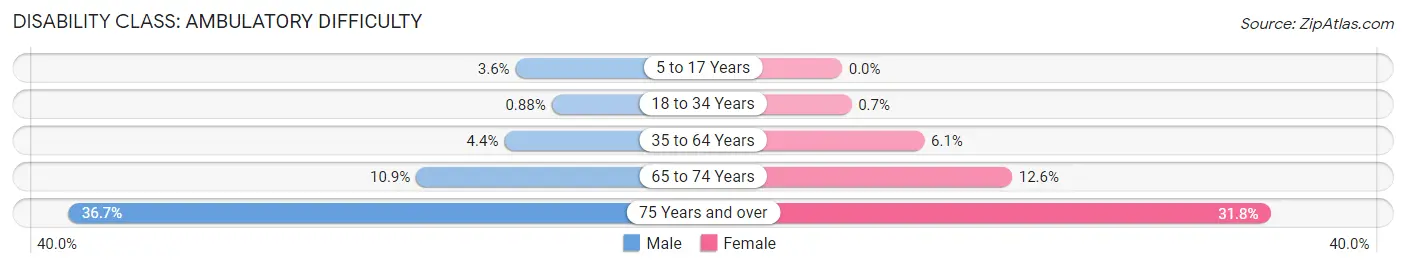
| Age Bracket | Male | Female |
| 5 to 17 Years | 53 (3.6%) | 0 (0.0%) |
| 18 to 34 Years | 21 (0.9%) | 15 (0.7%) |
| 35 to 64 Years | 171 (4.4%) | 250 (6.1%) |
| 65 to 74 Years | 101 (10.9%) | 146 (12.6%) |
| 75 Years and over | 239 (36.7%) | 320 (31.8%) |
Disability Class: Self-Care Difficulty
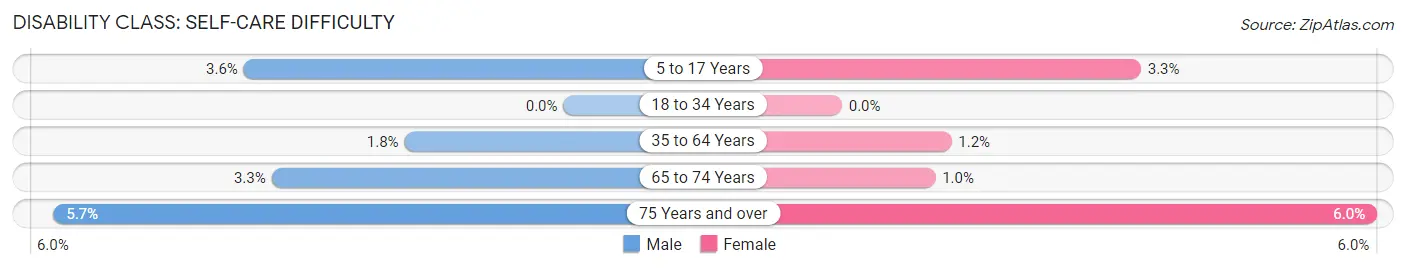
| Age Bracket | Male | Female |
| 5 to 17 Years | 53 (3.6%) | 52 (3.3%) |
| 18 to 34 Years | 0 (0.0%) | 0 (0.0%) |
| 35 to 64 Years | 69 (1.8%) | 50 (1.2%) |
| 65 to 74 Years | 30 (3.3%) | 12 (1.0%) |
| 75 Years and over | 37 (5.7%) | 60 (6.0%) |
Technology Access in Arnold
Computing Device Access in Arnold
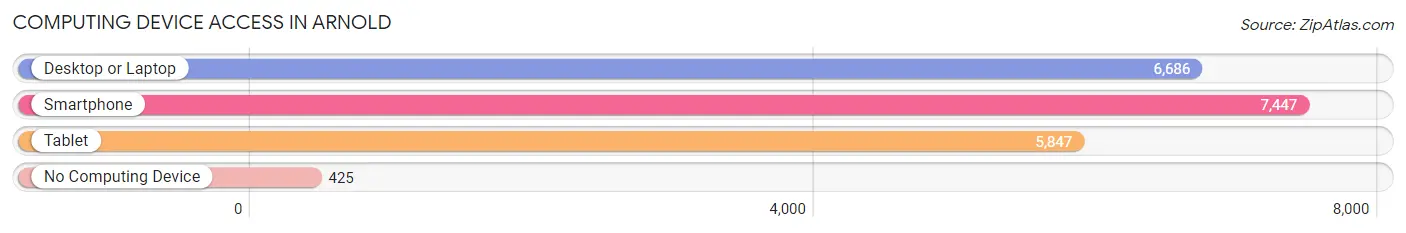
| Device Type | # Households | % Households |
| Desktop or Laptop | 6,686 | 78.2% |
| Smartphone | 7,447 | 87.1% |
| Tablet | 5,847 | 68.4% |
| No Computing Device | 425 | 5.0% |
| Total | 8,546 | 100.0% |
Internet Access in Arnold
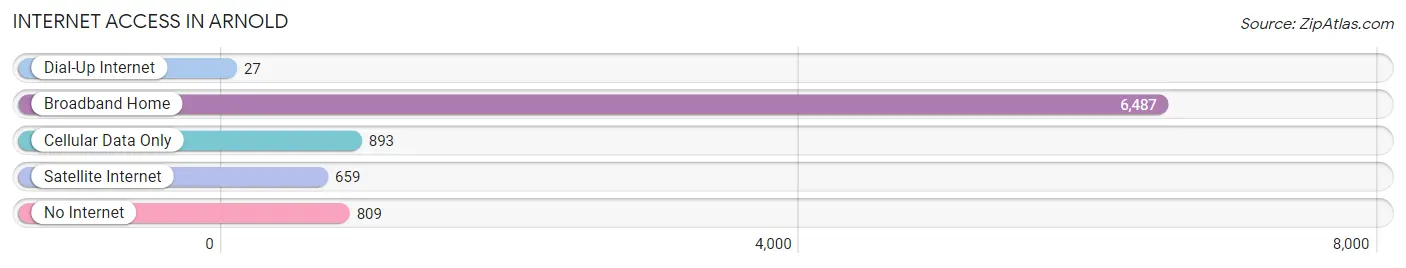
| Internet Type | # Households | % Households |
| Dial-Up Internet | 27 | 0.3% |
| Broadband Home | 6,487 | 75.9% |
| Cellular Data Only | 893 | 10.4% |
| Satellite Internet | 659 | 7.7% |
| No Internet | 809 | 9.5% |
| Total | 8,546 | 100.0% |
Arnold Summary
Arnold, Missouri is a city located in Jefferson County, Missouri, United States. It is part of the St. Louis metropolitan area and is located approximately 20 miles south of downtown St. Louis. The population of Arnold was estimated to be 21,945 in 2019.
History
Arnold was founded in 1858 by German immigrants who named the city after their hometown of Arnold, Germany. The city was incorporated in 1871 and was originally a farming community. In the late 19th century, the city began to grow as a result of the railroad industry. The city was also home to a number of coal mines, which provided employment for many of the city’s residents.
In the early 20th century, Arnold began to experience a period of growth and development. The city was home to a number of manufacturing plants, including a glass factory, a shoe factory, and a furniture factory. The city also became a popular tourist destination, with a number of resorts and amusement parks located in the area.
Geography
Arnold is located in Jefferson County, Missouri, approximately 20 miles south of downtown St. Louis. The city is situated on the Meramec River and is surrounded by rolling hills and forests. The city has a total area of 8.3 square miles, of which 8.2 square miles is land and 0.1 square miles is water.
Economy
Arnold’s economy is largely based on manufacturing and retail. The city is home to a number of manufacturing plants, including a glass factory, a shoe factory, and a furniture factory. The city is also home to a number of retail stores, including a Walmart Supercenter, a Target, and a Lowe’s.
The city is also home to a number of corporate headquarters, including the headquarters of the St. Louis-based company, Emerson Electric. The city is also home to a number of medical facilities, including the St. Louis Children’s Hospital and the St. Louis University Hospital.
Demographics
As of the 2019 census, the population of Arnold was estimated to be 21,945. The racial makeup of the city was 87.3% White, 8.2% African American, 0.7% Asian, 0.3% Native American, 0.1% Pacific Islander, and 2.4% from other races. The median household income in Arnold was $50,945 in 2019. The median age of the city’s population was 38.7 years.
Arnold is a diverse city with a variety of cultures and backgrounds. The city is home to a number of churches, including the First Baptist Church of Arnold, the Arnold United Methodist Church, and the St. John’s Lutheran Church. The city is also home to a number of schools, including the Arnold Public Schools, the Fox C-6 School District, and the St. Louis Community College.
Common Questions
What is Per Capita Income in Arnold?
Per Capita income in Arnold is $35,657.
What is the Median Family Income in Arnold?
Median Family Income in Arnold is $89,195.
What is the Median Household income in Arnold?
Median Household Income in Arnold is $72,317.
What is Income or Wage Gap in Arnold?
Income or Wage Gap in Arnold is 36.6%.
Women in Arnold earn 63.4 cents for every dollar earned by a man.
What is Inequality or Gini Index in Arnold?
Inequality or Gini Index in Arnold is 0.38.
What is the Total Population of Arnold?
Total Population of Arnold is 20,840.
What is the Total Male Population of Arnold?
Total Male Population of Arnold is 10,203.
What is the Total Female Population of Arnold?
Total Female Population of Arnold is 10,637.
What is the Ratio of Males per 100 Females in Arnold?
There are 95.92 Males per 100 Females in Arnold.
What is the Ratio of Females per 100 Males in Arnold?
There are 104.25 Females per 100 Males in Arnold.
What is the Median Population Age in Arnold?
Median Population Age in Arnold is 41.0 Years.
What is the Average Family Size in Arnold
Average Family Size in Arnold is 3.0 People.
What is the Average Household Size in Arnold
Average Household Size in Arnold is 2.4 People.
How Large is the Labor Force in Arnold?
There are 11,145 People in the Labor Forcein in Arnold.
What is the Percentage of People in the Labor Force in Arnold?
65.6% of People are in the Labor Force in Arnold.
What is the Unemployment Rate in Arnold?
Unemployment Rate in Arnold is 3.5%.