Fort Mohave, AZ Map & Demographics
Fort Mohave Map
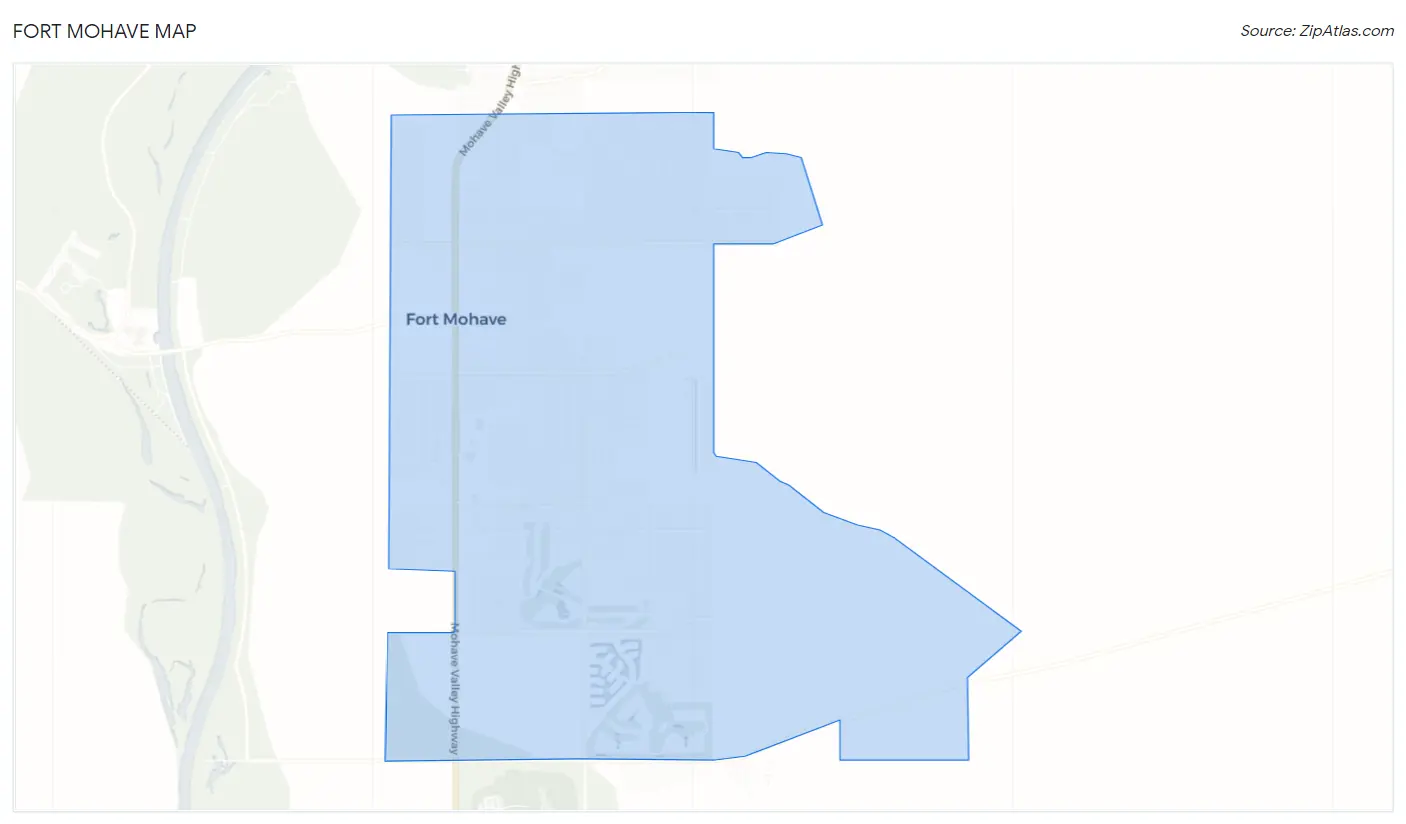
Fort Mohave Overview
$34,299
PER CAPITA INCOME
$72,106
AVG FAMILY INCOME
$66,702
AVG HOUSEHOLD INCOME
2.5%
WAGE / INCOME GAP [ % ]
97.5¢/ $1
WAGE / INCOME GAP [ $ ]
$13,360
FAMILY INCOME DEFICIT
0.44
INEQUALITY / GINI INDEX
16,038
TOTAL POPULATION
8,005
MALE POPULATION
8,033
FEMALE POPULATION
99.65
MALES / 100 FEMALES
100.35
FEMALES / 100 MALES
58.4
MEDIAN AGE
2.6
AVG FAMILY SIZE
2.3
AVG HOUSEHOLD SIZE
6,147
LABOR FORCE [ PEOPLE ]
43.6%
PERCENT IN LABOR FORCE
9.7%
UNEMPLOYMENT RATE
Fort Mohave Zip Codes
Fort Mohave Area Codes
Income in Fort Mohave
Income Overview in Fort Mohave
Per Capita Income in Fort Mohave is $34,299, while median incomes of families and households are $72,106 and $66,702 respectively.
| Characteristic | Number | Measure |
| Per Capita Income | 16,038 | $34,299 |
| Median Family Income | 4,955 | $72,106 |
| Mean Family Income | 4,955 | $90,880 |
| Median Household Income | 6,878 | $66,702 |
| Mean Household Income | 6,878 | $82,437 |
| Income Deficit | 4,955 | $13,360 |
| Wage / Income Gap (%) | 16,038 | 2.48% |
| Wage / Income Gap ($) | 16,038 | 97.52¢ per $1 |
| Gini / Inequality Index | 16,038 | 0.44 |
Earnings by Sex in Fort Mohave
Average Earnings in Fort Mohave are $34,704, $34,203 for men and $35,074 for women, a difference of 2.5%.
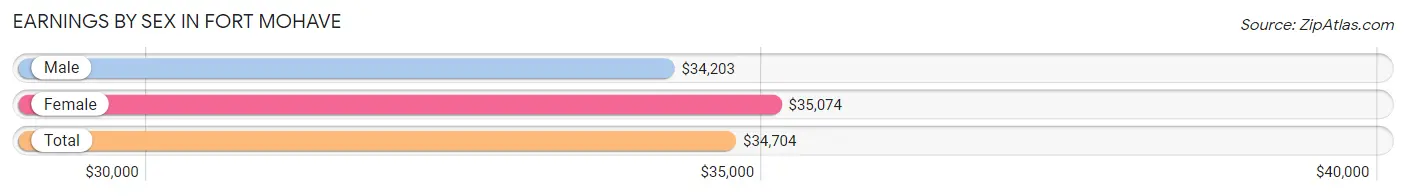
| Sex | Number | Average Earnings |
| Male | 3,564 (55.4%) | $34,203 |
| Female | 2,868 (44.6%) | $35,074 |
| Total | 6,432 (100.0%) | $34,704 |
Earnings by Sex by Income Bracket in Fort Mohave
The most common earnings brackets in Fort Mohave are $100,000+ for men (642 | 18.0%) and $55,000 to $64,999 for women (277 | 9.7%).
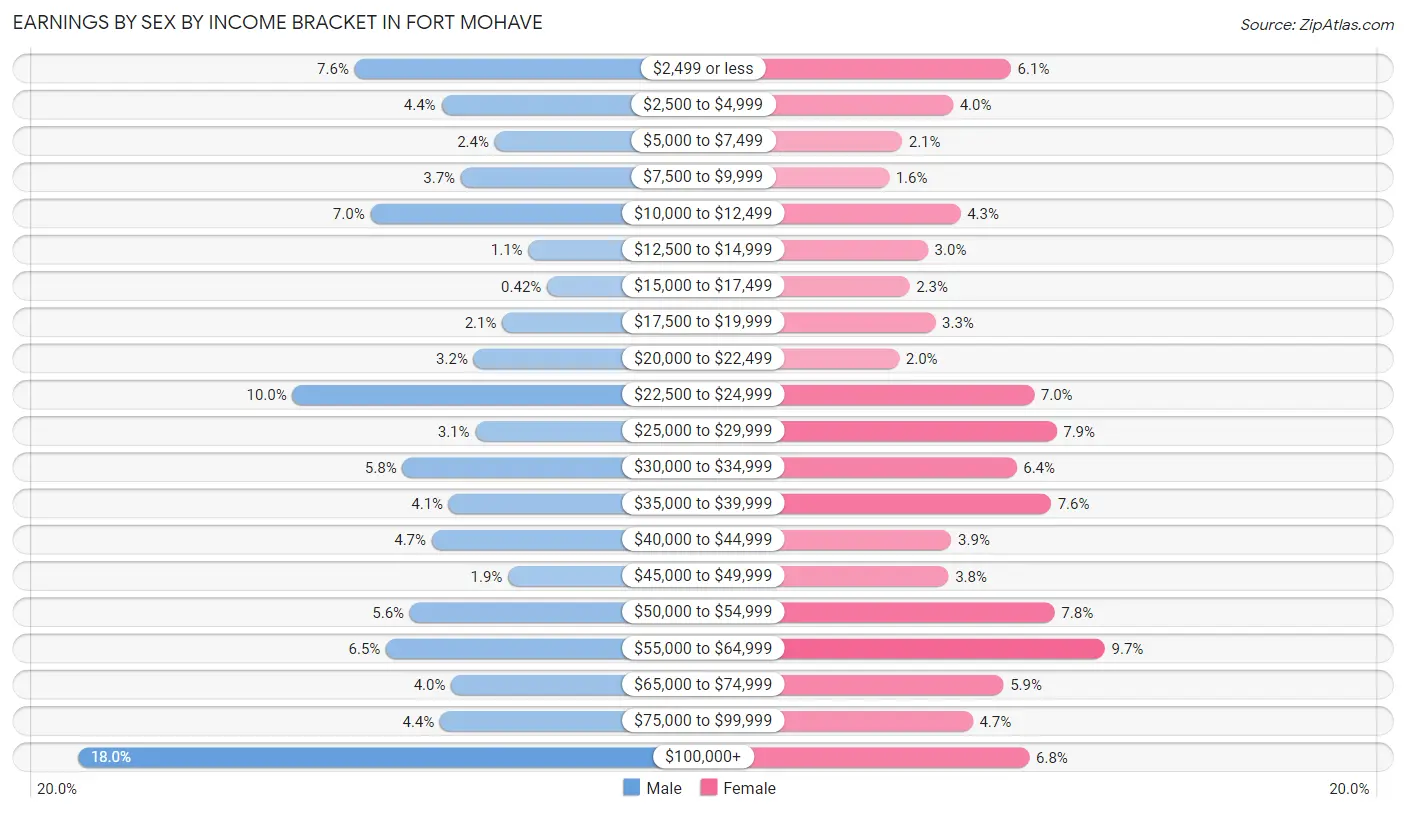
| Income | Male | Female |
| $2,499 or less | 272 (7.6%) | 176 (6.1%) |
| $2,500 to $4,999 | 156 (4.4%) | 114 (4.0%) |
| $5,000 to $7,499 | 85 (2.4%) | 59 (2.1%) |
| $7,500 to $9,999 | 130 (3.6%) | 45 (1.6%) |
| $10,000 to $12,499 | 251 (7.0%) | 122 (4.3%) |
| $12,500 to $14,999 | 40 (1.1%) | 87 (3.0%) |
| $15,000 to $17,499 | 15 (0.4%) | 67 (2.3%) |
| $17,500 to $19,999 | 75 (2.1%) | 95 (3.3%) |
| $20,000 to $22,499 | 113 (3.2%) | 56 (1.9%) |
| $22,500 to $24,999 | 355 (10.0%) | 201 (7.0%) |
| $25,000 to $29,999 | 111 (3.1%) | 225 (7.9%) |
| $30,000 to $34,999 | 208 (5.8%) | 182 (6.4%) |
| $35,000 to $39,999 | 146 (4.1%) | 219 (7.6%) |
| $40,000 to $44,999 | 169 (4.7%) | 112 (3.9%) |
| $45,000 to $49,999 | 67 (1.9%) | 109 (3.8%) |
| $50,000 to $54,999 | 198 (5.6%) | 223 (7.8%) |
| $55,000 to $64,999 | 230 (6.5%) | 277 (9.7%) |
| $65,000 to $74,999 | 143 (4.0%) | 168 (5.9%) |
| $75,000 to $99,999 | 158 (4.4%) | 135 (4.7%) |
| $100,000+ | 642 (18.0%) | 196 (6.8%) |
| Total | 3,564 (100.0%) | 2,868 (100.0%) |
Earnings by Sex by Educational Attainment in Fort Mohave
Average earnings in Fort Mohave are $38,668 for men and $36,760 for women, a difference of 4.9%. Men with an educational attainment of bachelor's degree enjoy the highest average annual earnings of $115,179, while those with less than high school education earn the least with $21,818. Women with an educational attainment of graduate degree earn the most with the average annual earnings of $58,578, while those with less than high school education have the smallest earnings of $19,594.
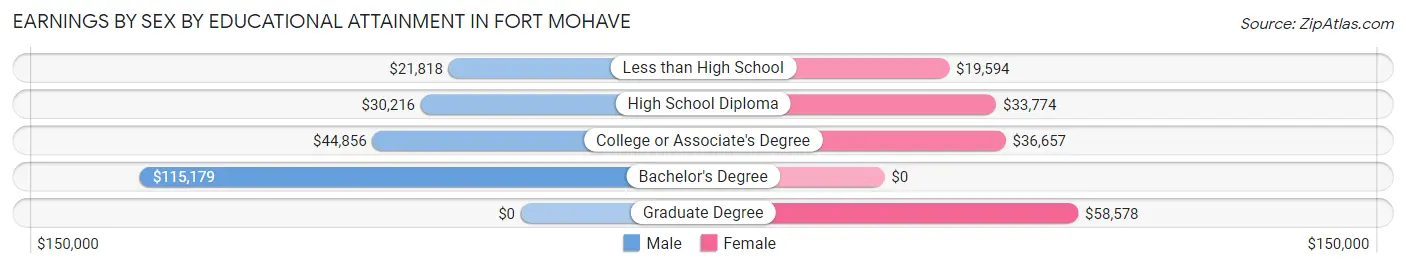
| Educational Attainment | Male Income | Female Income |
| Less than High School | $21,818 | $19,594 |
| High School Diploma | $30,216 | $33,774 |
| College or Associate's Degree | $44,856 | $36,657 |
| Bachelor's Degree | $115,179 | $0 |
| Graduate Degree | - | - |
| Total | $38,668 | $36,760 |
Family Income in Fort Mohave
Family Income Brackets in Fort Mohave
According to the Fort Mohave family income data, there are 1,145 families falling into the $50,000 to $74,999 income range, which is the most common income bracket and makes up 23.1% of all families. Conversely, the $10,000 to $14,999 income bracket is the least frequent group with only 168 families (3.4%) belonging to this category.
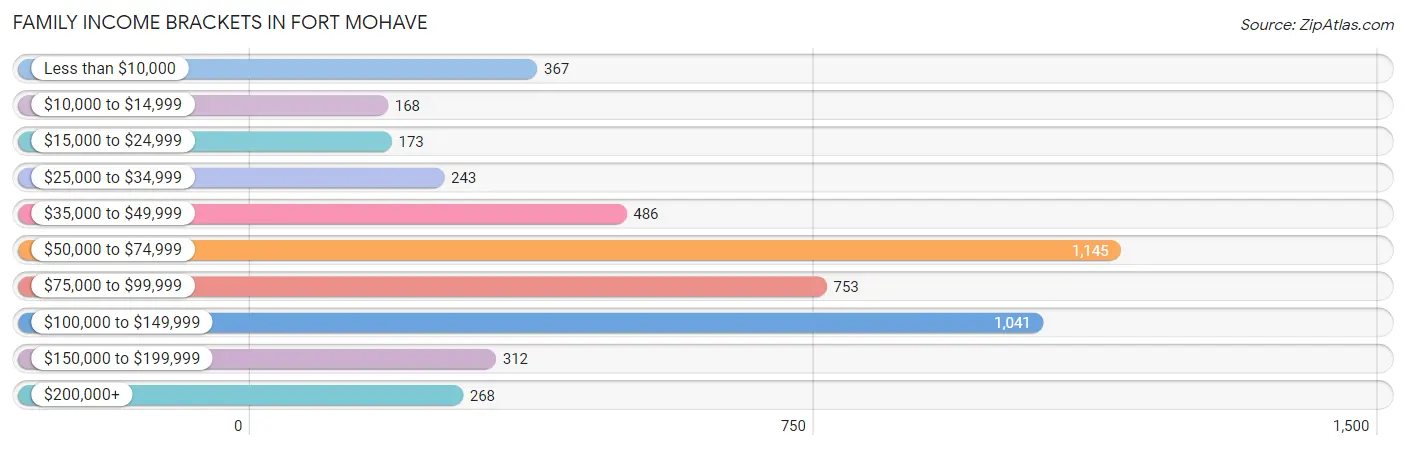
| Income Bracket | # Families | % Families |
| Less than $10,000 | 367 | 7.4% |
| $10,000 to $14,999 | 168 | 3.4% |
| $15,000 to $24,999 | 173 | 3.5% |
| $25,000 to $34,999 | 243 | 4.9% |
| $35,000 to $49,999 | 486 | 9.8% |
| $50,000 to $74,999 | 1,145 | 23.1% |
| $75,000 to $99,999 | 753 | 15.2% |
| $100,000 to $149,999 | 1,041 | 21.0% |
| $150,000 to $199,999 | 312 | 6.3% |
| $200,000+ | 268 | 5.4% |
Family Income by Famaliy Size in Fort Mohave
5-person families (307 | 6.2%) account for the highest median family income in Fort Mohave with $137,825 per family, while 2-person families (3,154 | 63.6%) have the highest median income of $33,315 per family member.
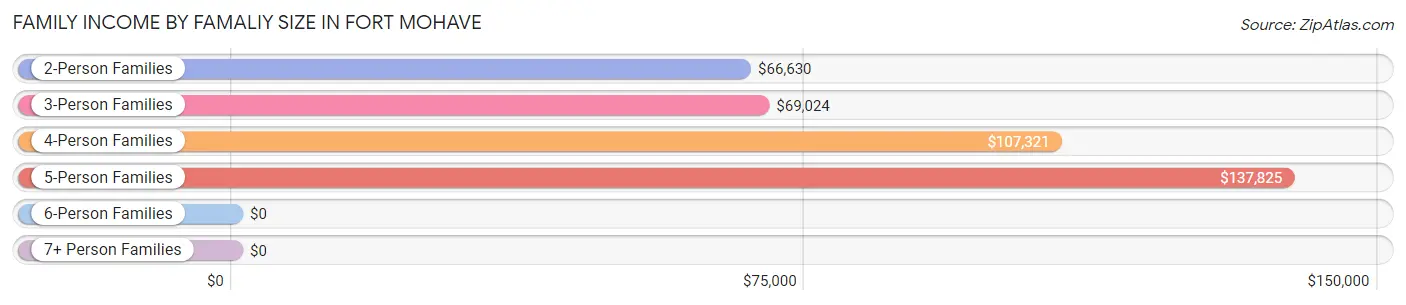
| Income Bracket | # Families | Median Income |
| 2-Person Families | 3,154 (63.6%) | $66,630 |
| 3-Person Families | 971 (19.6%) | $69,024 |
| 4-Person Families | 500 (10.1%) | $107,321 |
| 5-Person Families | 307 (6.2%) | $137,825 |
| 6-Person Families | 23 (0.5%) | $0 |
| 7+ Person Families | 0 (0.0%) | $0 |
| Total | 4,955 (100.0%) | $72,106 |
Family Income by Number of Earners in Fort Mohave
The median family income in Fort Mohave is $72,106, with families comprising 3+ earners (279) having the highest median family income of $121,758, while families with no earners (1,859) have the lowest median family income of $61,367, accounting for 5.6% and 37.5% of families, respectively.
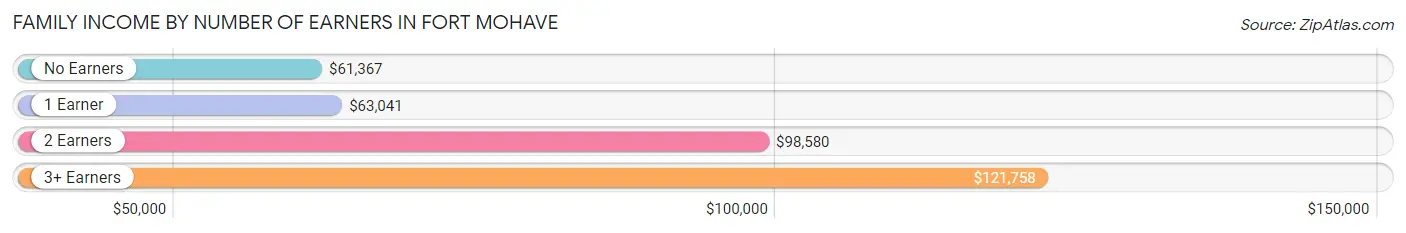
| Number of Earners | # Families | Median Income |
| No Earners | 1,859 (37.5%) | $61,367 |
| 1 Earner | 1,454 (29.3%) | $63,041 |
| 2 Earners | 1,363 (27.5%) | $98,580 |
| 3+ Earners | 279 (5.6%) | $121,758 |
| Total | 4,955 (100.0%) | $72,106 |
Household Income in Fort Mohave
Household Income Brackets in Fort Mohave
With 1,396 households falling in the category, the $50,000 to $74,999 income range is the most frequent in Fort Mohave, accounting for 20.3% of all households. In contrast, only 289 households (4.2%) fall into the $10,000 to $14,999 income bracket, making it the least populous group.
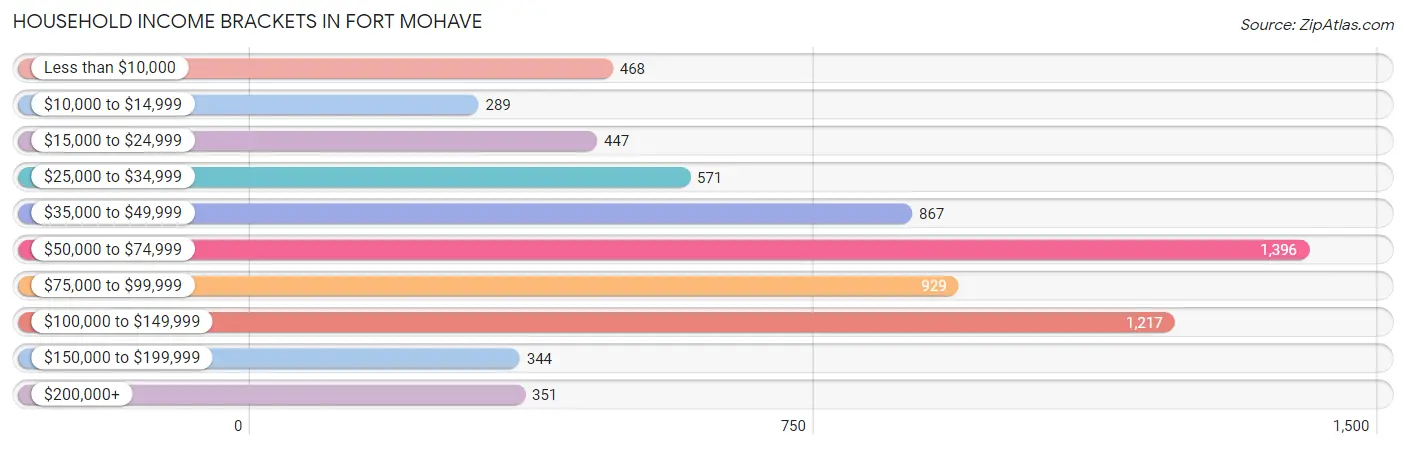
| Income Bracket | # Households | % Households |
| Less than $10,000 | 468 | 6.8% |
| $10,000 to $14,999 | 289 | 4.2% |
| $15,000 to $24,999 | 447 | 6.5% |
| $25,000 to $34,999 | 571 | 8.3% |
| $35,000 to $49,999 | 867 | 12.6% |
| $50,000 to $74,999 | 1,396 | 20.3% |
| $75,000 to $99,999 | 929 | 13.5% |
| $100,000 to $149,999 | 1,217 | 17.7% |
| $150,000 to $199,999 | 344 | 5.0% |
| $200,000+ | 351 | 5.1% |
Household Income by Householder Age in Fort Mohave
The median household income in Fort Mohave is $66,702, with the highest median household income of $89,896 found in the 25 to 44 years age bracket for the primary householder. A total of 999 households (14.5%) fall into this category. Meanwhile, the 15 to 24 years age bracket for the primary householder has the lowest median household income of $0, with 110 households (1.6%) in this group.
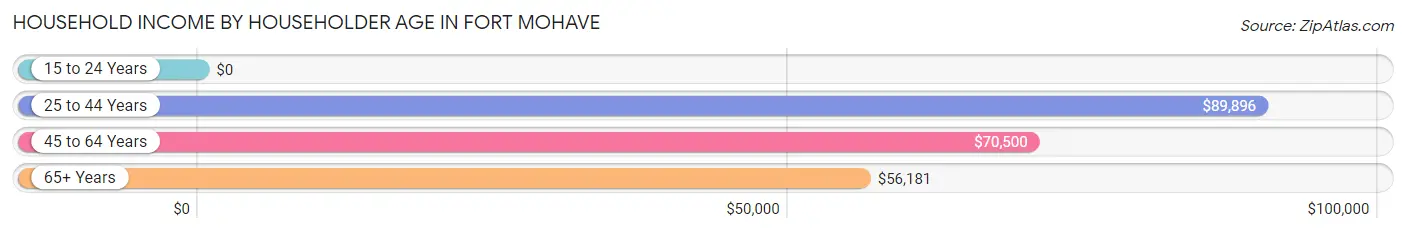
| Income Bracket | # Households | Median Income |
| 15 to 24 Years | 110 (1.6%) | $0 |
| 25 to 44 Years | 999 (14.5%) | $89,896 |
| 45 to 64 Years | 2,590 (37.7%) | $70,500 |
| 65+ Years | 3,179 (46.2%) | $56,181 |
| Total | 6,878 (100.0%) | $66,702 |
Poverty in Fort Mohave
Income Below Poverty by Sex and Age in Fort Mohave
With 12.9% poverty level for males and 15.7% for females among the residents of Fort Mohave, 6 to 11 year old males and 16 and 17 year old females are the most vulnerable to poverty, with 158 males (37.3%) and 58 females (56.3%) in their respective age groups living below the poverty level.
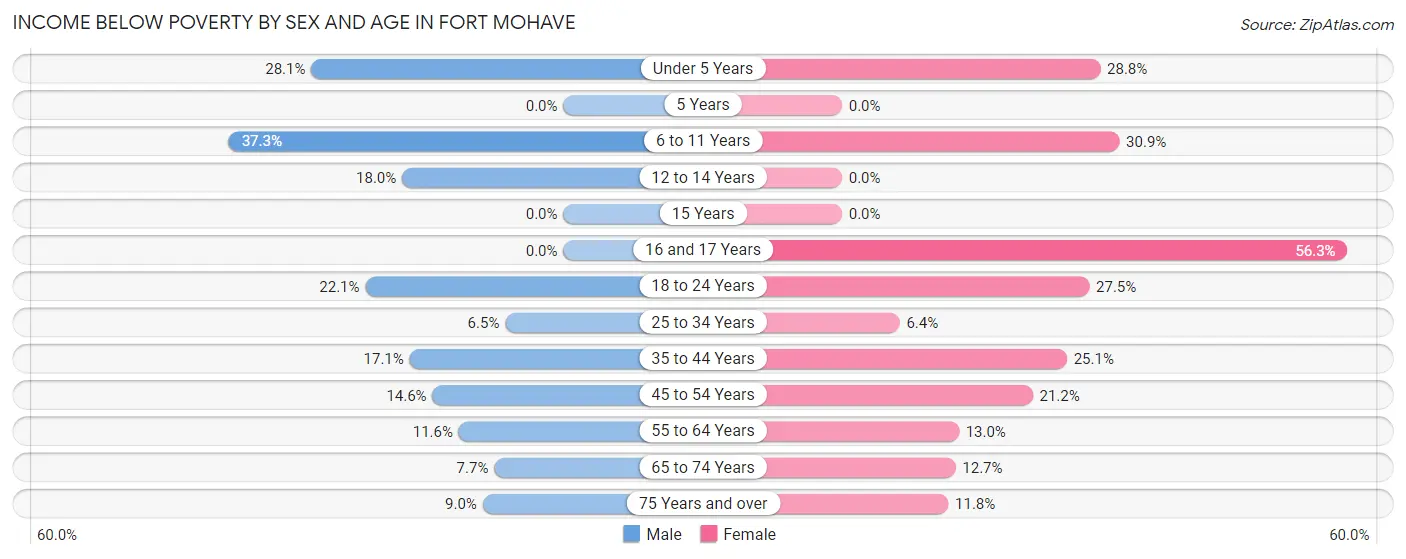
| Age Bracket | Male | Female |
| Under 5 Years | 48 (28.1%) | 63 (28.8%) |
| 5 Years | 0 (0.0%) | 0 (0.0%) |
| 6 to 11 Years | 158 (37.3%) | 101 (30.9%) |
| 12 to 14 Years | 44 (18.0%) | 0 (0.0%) |
| 15 Years | 0 (0.0%) | 0 (0.0%) |
| 16 and 17 Years | 0 (0.0%) | 58 (56.3%) |
| 18 to 24 Years | 84 (22.1%) | 92 (27.5%) |
| 25 to 34 Years | 35 (6.5%) | 37 (6.4%) |
| 35 to 44 Years | 125 (17.1%) | 132 (25.1%) |
| 45 to 54 Years | 133 (14.6%) | 185 (21.2%) |
| 55 to 64 Years | 182 (11.6%) | 221 (13.0%) |
| 65 to 74 Years | 135 (7.7%) | 240 (12.7%) |
| 75 Years and over | 83 (9.0%) | 128 (11.8%) |
| Total | 1,027 (12.9%) | 1,257 (15.7%) |
Income Above Poverty by Sex and Age in Fort Mohave
According to the poverty statistics in Fort Mohave, males aged 5 years and females aged 5 years are the age groups that are most secure financially, with 100.0% of males and 100.0% of females in these age groups living above the poverty line.
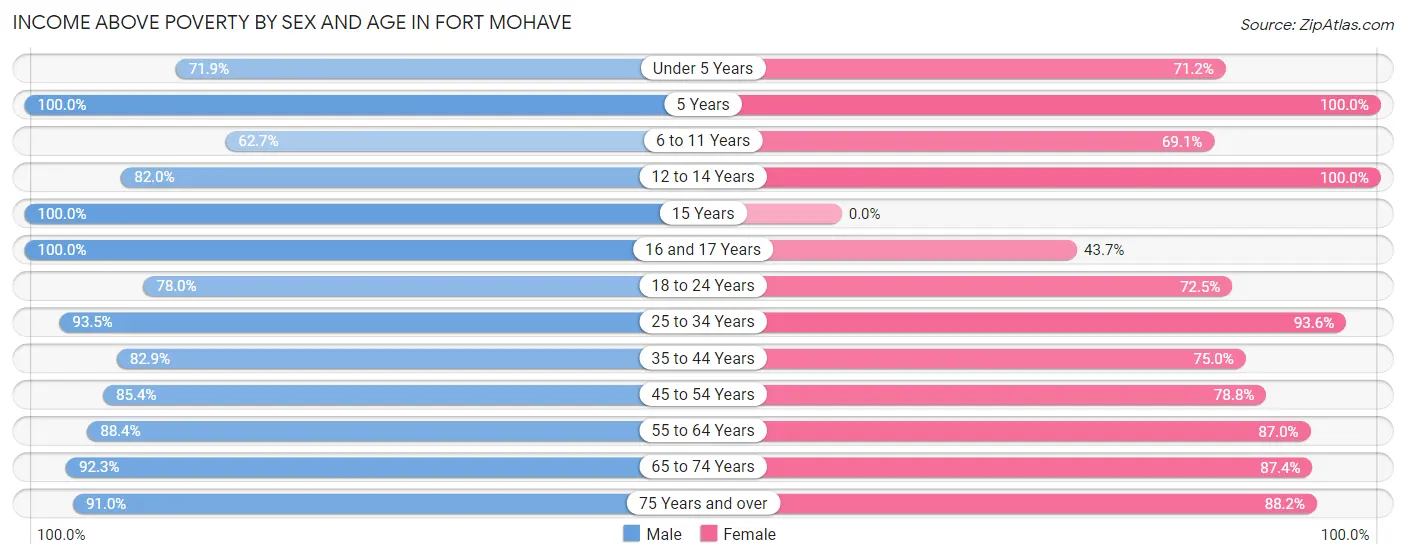
| Age Bracket | Male | Female |
| Under 5 Years | 123 (71.9%) | 156 (71.2%) |
| 5 Years | 61 (100.0%) | 102 (100.0%) |
| 6 to 11 Years | 266 (62.7%) | 226 (69.1%) |
| 12 to 14 Years | 201 (82.0%) | 271 (100.0%) |
| 15 Years | 77 (100.0%) | 0 (0.0%) |
| 16 and 17 Years | 209 (100.0%) | 45 (43.7%) |
| 18 to 24 Years | 297 (77.9%) | 242 (72.5%) |
| 25 to 34 Years | 506 (93.5%) | 539 (93.6%) |
| 35 to 44 Years | 605 (82.9%) | 395 (75.0%) |
| 45 to 54 Years | 779 (85.4%) | 686 (78.8%) |
| 55 to 64 Years | 1,381 (88.4%) | 1,476 (87.0%) |
| 65 to 74 Years | 1,618 (92.3%) | 1,657 (87.4%) |
| 75 Years and over | 841 (91.0%) | 953 (88.2%) |
| Total | 6,964 (87.2%) | 6,748 (84.3%) |
Income Below Poverty Among Married-Couple Families in Fort Mohave
The poverty statistics for married-couple families in Fort Mohave show that 7.7% or 296 of the total 3,833 families live below the poverty line. Families with 3 or 4 children have the highest poverty rate of 11.1%, comprising of 25 families. On the other hand, families with 1 or 2 children have the lowest poverty rate of 2.0%, which includes 13 families.
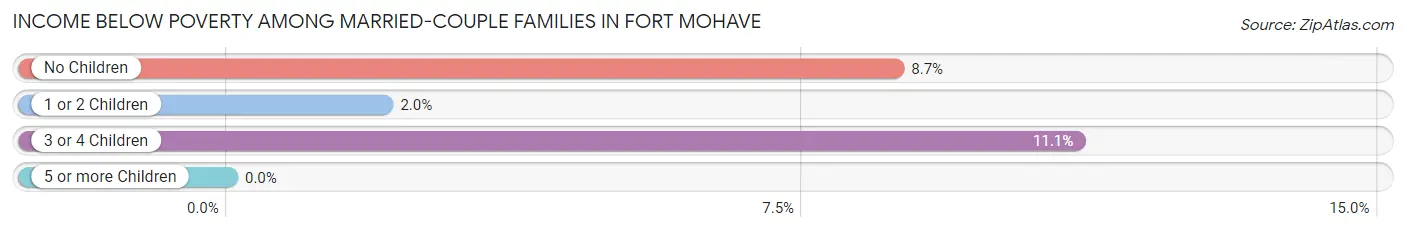
| Children | Above Poverty | Below Poverty |
| No Children | 2,708 (91.3%) | 258 (8.7%) |
| 1 or 2 Children | 628 (98.0%) | 13 (2.0%) |
| 3 or 4 Children | 201 (88.9%) | 25 (11.1%) |
| 5 or more Children | 0 (0.0%) | 0 (0.0%) |
| Total | 3,537 (92.3%) | 296 (7.7%) |
Income Below Poverty Among Single-Parent Households in Fort Mohave
According to the poverty data in Fort Mohave, 33.7% or 131 single-father households and 23.1% or 169 single-mother households are living below the poverty line. Among single-father households, those with 1 or 2 children have the highest poverty rate, with 105 households (41.3%) experiencing poverty. Likewise, among single-mother households, those with 1 or 2 children have the highest poverty rate, with 128 households (62.7%) falling below the poverty line.
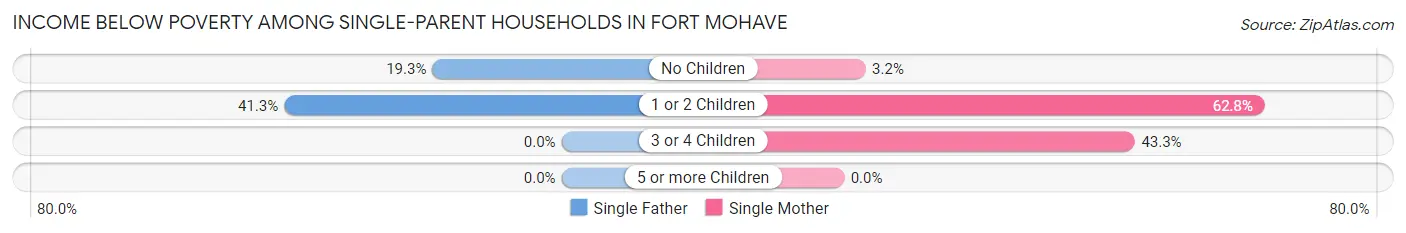
| Children | Single Father | Single Mother |
| No Children | 26 (19.3%) | 15 (3.2%) |
| 1 or 2 Children | 105 (41.3%) | 128 (62.7%) |
| 3 or 4 Children | 0 (0.0%) | 26 (43.3%) |
| 5 or more Children | 0 (0.0%) | 0 (0.0%) |
| Total | 131 (33.7%) | 169 (23.1%) |
Income Below Poverty Among Married-Couple vs Single-Parent Households in Fort Mohave
The poverty data for Fort Mohave shows that 296 of the married-couple family households (7.7%) and 300 of the single-parent households (26.7%) are living below the poverty level. Within the married-couple family households, those with 3 or 4 children have the highest poverty rate, with 25 households (11.1%) falling below the poverty line. Among the single-parent households, those with 1 or 2 children have the highest poverty rate, with 233 household (50.9%) living below poverty.
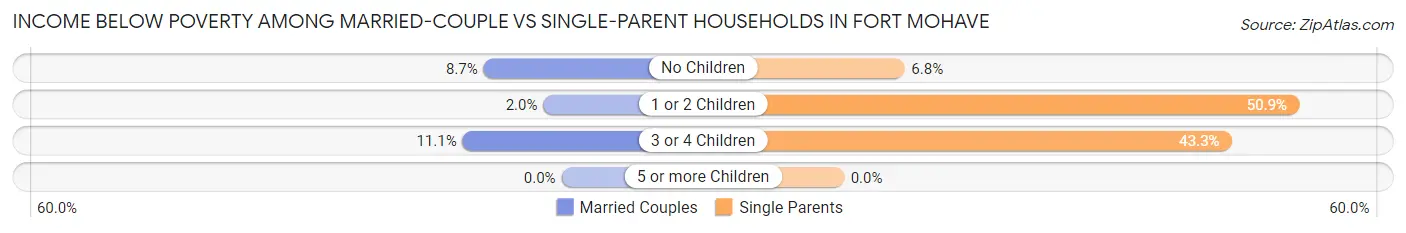
| Children | Married-Couple Families | Single-Parent Households |
| No Children | 258 (8.7%) | 41 (6.8%) |
| 1 or 2 Children | 13 (2.0%) | 233 (50.9%) |
| 3 or 4 Children | 25 (11.1%) | 26 (43.3%) |
| 5 or more Children | 0 (0.0%) | 0 (0.0%) |
| Total | 296 (7.7%) | 300 (26.7%) |
Race in Fort Mohave
The most populous races in Fort Mohave are White / Caucasian (13,424 | 83.7%), Hispanic or Latino (2,679 | 16.7%), and Two or more Races (1,080 | 6.7%).
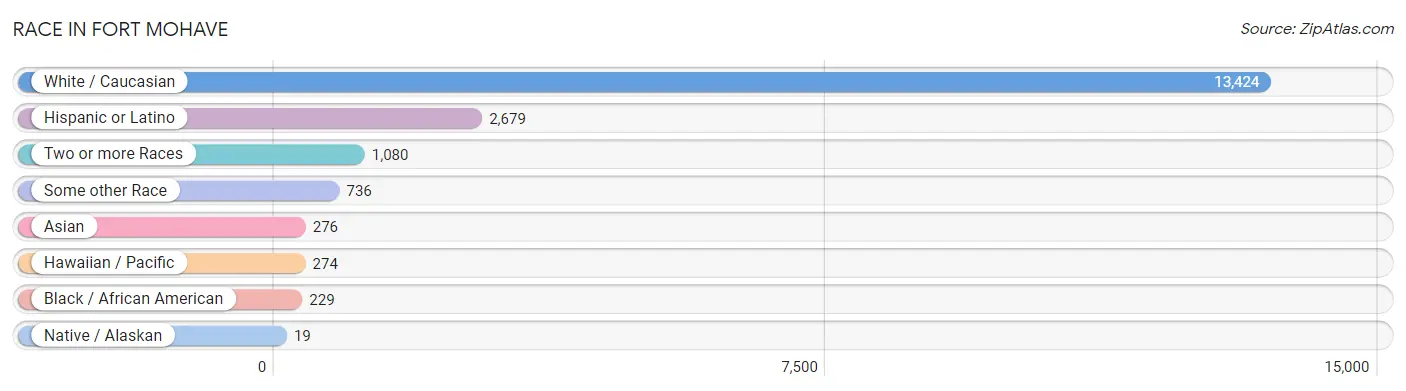
| Race | # Population | % Population |
| Asian | 276 | 1.7% |
| Black / African American | 229 | 1.4% |
| Hawaiian / Pacific | 274 | 1.7% |
| Hispanic or Latino | 2,679 | 16.7% |
| Native / Alaskan | 19 | 0.1% |
| White / Caucasian | 13,424 | 83.7% |
| Two or more Races | 1,080 | 6.7% |
| Some other Race | 736 | 4.6% |
| Total | 16,038 | 100.0% |
Ancestry in Fort Mohave
The most populous ancestries reported in Fort Mohave are English (2,610 | 16.3%), German (2,391 | 14.9%), Mexican (1,904 | 11.9%), Irish (1,425 | 8.9%), and American (773 | 4.8%), together accounting for 56.8% of all Fort Mohave residents.
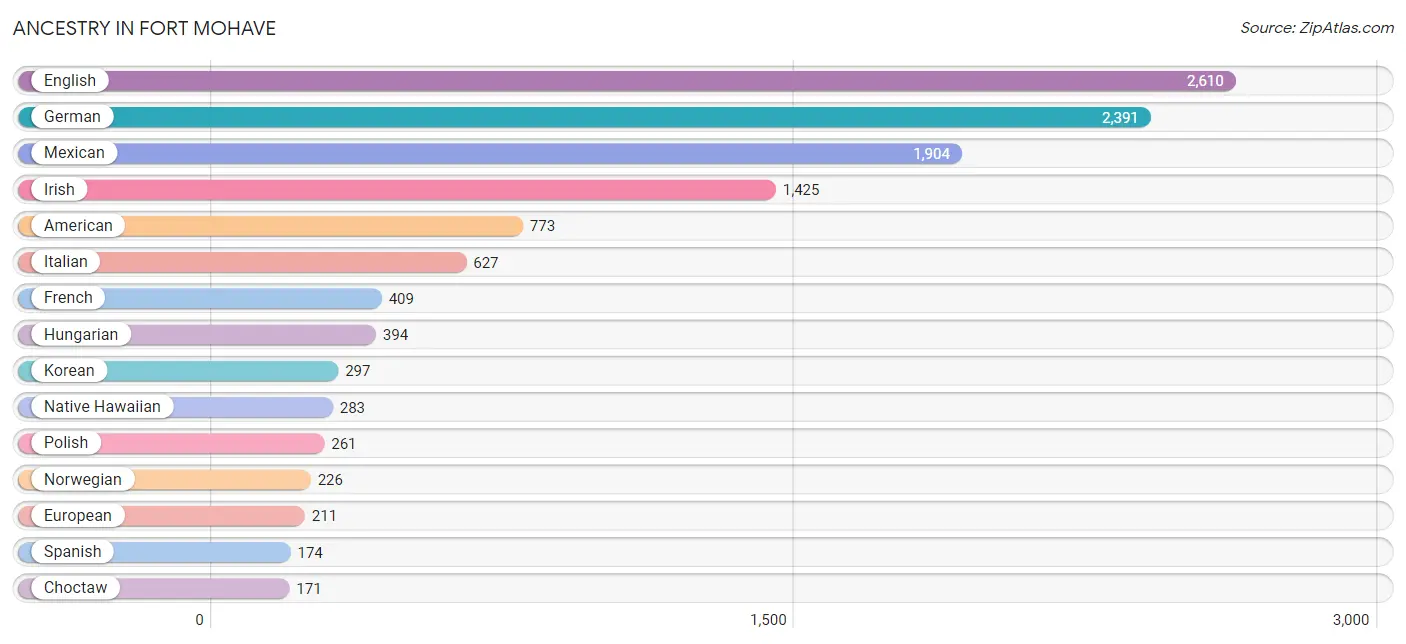
| Ancestry | # Population | % Population |
| African | 40 | 0.3% |
| Albanian | 58 | 0.4% |
| American | 773 | 4.8% |
| Arab | 8 | 0.1% |
| Austrian | 36 | 0.2% |
| Bhutanese | 51 | 0.3% |
| Blackfeet | 52 | 0.3% |
| British | 50 | 0.3% |
| Canadian | 19 | 0.1% |
| Central American | 56 | 0.4% |
| Cherokee | 62 | 0.4% |
| Choctaw | 171 | 1.1% |
| Croatian | 85 | 0.5% |
| Cuban | 25 | 0.2% |
| Czechoslovakian | 12 | 0.1% |
| Danish | 45 | 0.3% |
| Dutch | 134 | 0.8% |
| Eastern European | 56 | 0.4% |
| English | 2,610 | 16.3% |
| European | 211 | 1.3% |
| Finnish | 11 | 0.1% |
| French | 409 | 2.5% |
| French Canadian | 145 | 0.9% |
| German | 2,391 | 14.9% |
| Greek | 8 | 0.1% |
| Hungarian | 394 | 2.5% |
| Indian (Asian) | 13 | 0.1% |
| Irish | 1,425 | 8.9% |
| Italian | 627 | 3.9% |
| Korean | 297 | 1.8% |
| Laotian | 4 | 0.0% |
| Latvian | 8 | 0.1% |
| Lebanese | 8 | 0.1% |
| Lithuanian | 20 | 0.1% |
| Mexican | 1,904 | 11.9% |
| Native Hawaiian | 283 | 1.8% |
| Nicaraguan | 40 | 0.3% |
| Northern European | 31 | 0.2% |
| Norwegian | 226 | 1.4% |
| Panamanian | 16 | 0.1% |
| Pima | 34 | 0.2% |
| Polish | 261 | 1.6% |
| Portuguese | 107 | 0.7% |
| Pueblo | 11 | 0.1% |
| Puerto Rican | 27 | 0.2% |
| Russian | 32 | 0.2% |
| Scandinavian | 132 | 0.8% |
| Scotch-Irish | 98 | 0.6% |
| Scottish | 151 | 0.9% |
| Serbian | 79 | 0.5% |
| Slovak | 16 | 0.1% |
| Slovene | 6 | 0.0% |
| Spaniard | 126 | 0.8% |
| Spanish | 174 | 1.1% |
| Subsaharan African | 40 | 0.3% |
| Swedish | 137 | 0.9% |
| Swiss | 27 | 0.2% |
| Welsh | 132 | 0.8% | View All 58 Rows |
Immigrants in Fort Mohave
The most numerous immigrant groups reported in Fort Mohave came from Central America (338 | 2.1%), Latin America (338 | 2.1%), Asia (280 | 1.8%), Mexico (278 | 1.7%), and South Eastern Asia (221 | 1.4%), together accounting for 9.1% of all Fort Mohave residents.
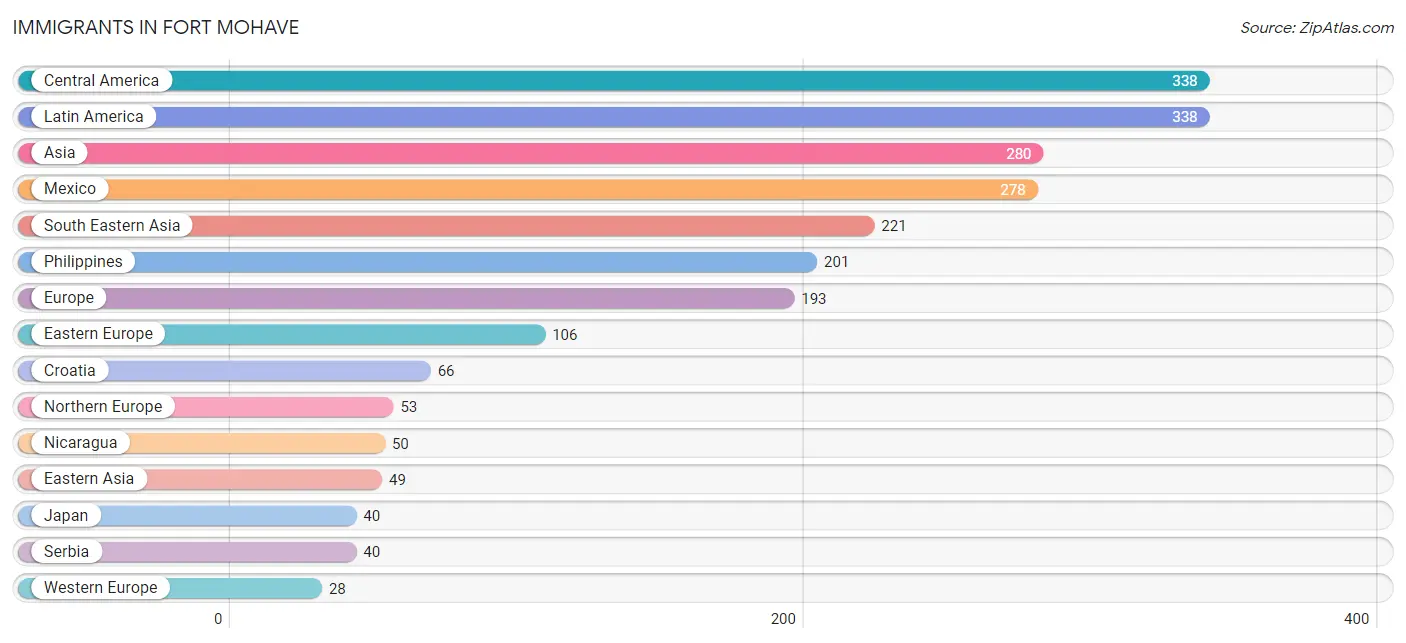
| Immigration Origin | # Population | % Population |
| Asia | 280 | 1.8% |
| Bangladesh | 10 | 0.1% |
| Canada | 8 | 0.1% |
| Central America | 338 | 2.1% |
| Croatia | 66 | 0.4% |
| Denmark | 10 | 0.1% |
| Eastern Asia | 49 | 0.3% |
| Eastern Europe | 106 | 0.7% |
| El Salvador | 10 | 0.1% |
| England | 9 | 0.1% |
| Europe | 193 | 1.2% |
| Germany | 20 | 0.1% |
| Indonesia | 20 | 0.1% |
| Ireland | 26 | 0.2% |
| Italy | 6 | 0.0% |
| Japan | 40 | 0.3% |
| Korea | 9 | 0.1% |
| Latin America | 338 | 2.1% |
| Mexico | 278 | 1.7% |
| Netherlands | 8 | 0.1% |
| Nicaragua | 50 | 0.3% |
| Northern Europe | 53 | 0.3% |
| Philippines | 201 | 1.3% |
| Serbia | 40 | 0.3% |
| South Central Asia | 10 | 0.1% |
| South Eastern Asia | 221 | 1.4% |
| Southern Europe | 6 | 0.0% |
| Western Europe | 28 | 0.2% | View All 28 Rows |
Sex and Age in Fort Mohave
Sex and Age in Fort Mohave
The most populous age groups in Fort Mohave are 65 to 69 Years (1,022 | 12.8%) for men and 65 to 69 Years (1,223 | 15.2%) for women.
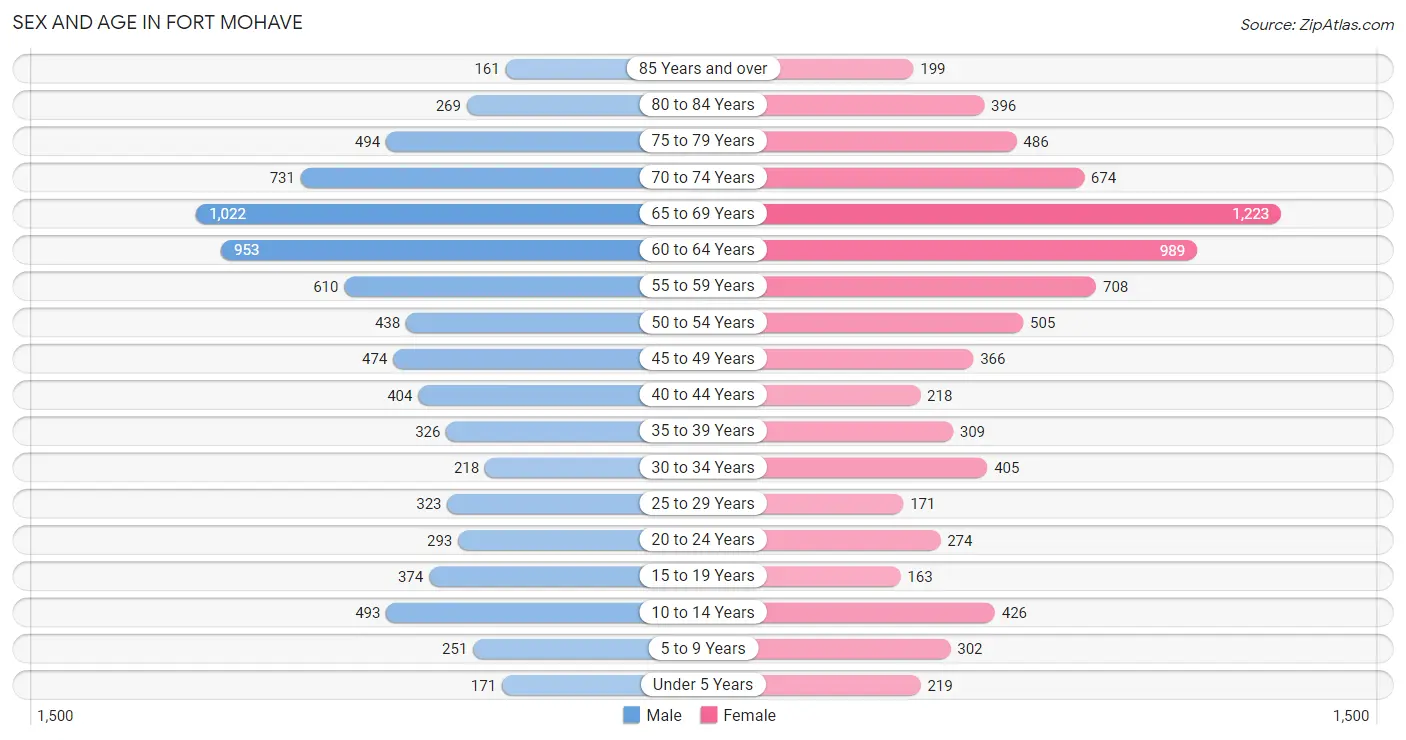
| Age Bracket | Male | Female |
| Under 5 Years | 171 (2.1%) | 219 (2.7%) |
| 5 to 9 Years | 251 (3.1%) | 302 (3.8%) |
| 10 to 14 Years | 493 (6.2%) | 426 (5.3%) |
| 15 to 19 Years | 374 (4.7%) | 163 (2.0%) |
| 20 to 24 Years | 293 (3.7%) | 274 (3.4%) |
| 25 to 29 Years | 323 (4.0%) | 171 (2.1%) |
| 30 to 34 Years | 218 (2.7%) | 405 (5.0%) |
| 35 to 39 Years | 326 (4.1%) | 309 (3.8%) |
| 40 to 44 Years | 404 (5.1%) | 218 (2.7%) |
| 45 to 49 Years | 474 (5.9%) | 366 (4.6%) |
| 50 to 54 Years | 438 (5.5%) | 505 (6.3%) |
| 55 to 59 Years | 610 (7.6%) | 708 (8.8%) |
| 60 to 64 Years | 953 (11.9%) | 989 (12.3%) |
| 65 to 69 Years | 1,022 (12.8%) | 1,223 (15.2%) |
| 70 to 74 Years | 731 (9.1%) | 674 (8.4%) |
| 75 to 79 Years | 494 (6.2%) | 486 (6.0%) |
| 80 to 84 Years | 269 (3.4%) | 396 (4.9%) |
| 85 Years and over | 161 (2.0%) | 199 (2.5%) |
| Total | 8,005 (100.0%) | 8,033 (100.0%) |
Families and Households in Fort Mohave
Median Family Size in Fort Mohave
The median family size in Fort Mohave is 2.62 persons per family, with single female/mother families (733 | 14.8%) accounting for the largest median family size of 3.07 persons per family. On the other hand, single male/father families (389 | 7.9%) represent the smallest median family size with 2.48 persons per family.
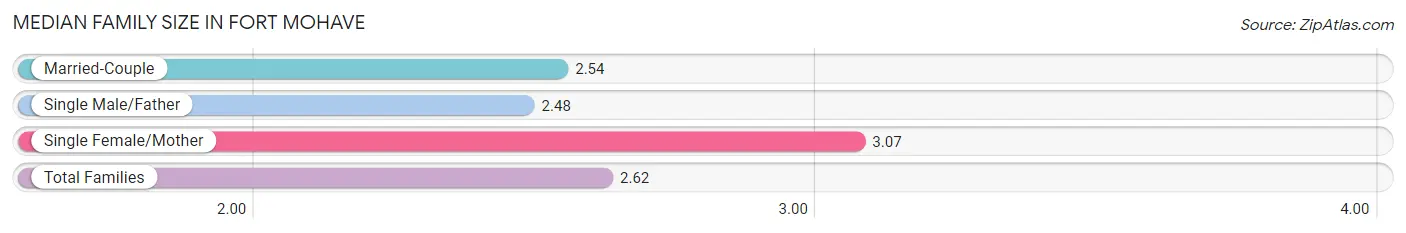
| Family Type | # Families | Family Size |
| Married-Couple | 3,833 (77.4%) | 2.54 |
| Single Male/Father | 389 (7.9%) | 2.48 |
| Single Female/Mother | 733 (14.8%) | 3.07 |
| Total Families | 4,955 (100.0%) | 2.62 |
Median Household Size in Fort Mohave
The median household size in Fort Mohave is 2.33 persons per household, with single female/mother households (733 | 10.7%) accounting for the largest median household size of 3.54 persons per household. non-family households (1,923 | 28.0%) represent the smallest median household size with 1.31 persons per household.
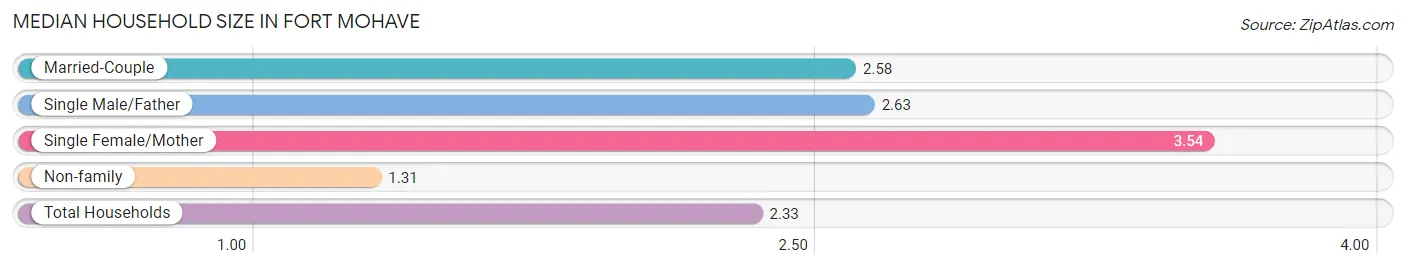
| Household Type | # Households | Household Size |
| Married-Couple | 3,833 (55.7%) | 2.58 |
| Single Male/Father | 389 (5.7%) | 2.63 |
| Single Female/Mother | 733 (10.7%) | 3.54 |
| Non-family | 1,923 (28.0%) | 1.31 |
| Total Households | 6,878 (100.0%) | 2.33 |
Household Size by Marriage Status in Fort Mohave
Out of a total of 6,878 households in Fort Mohave, 4,955 (72.0%) are family households, while 1,923 (28.0%) are nonfamily households. The most numerous type of family households are 2-person households, comprising 3,011, and the most common type of nonfamily households are 1-person households, comprising 1,451.
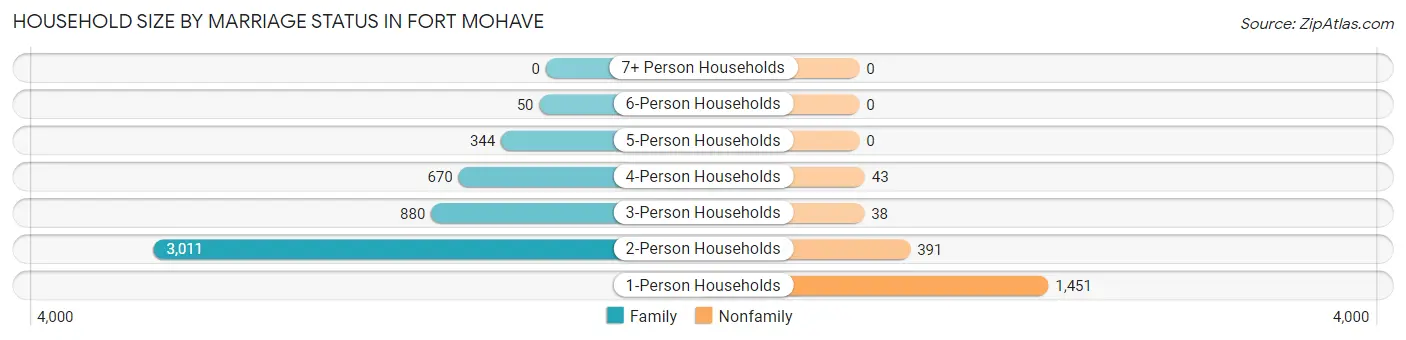
| Household Size | Family Households | Nonfamily Households |
| 1-Person Households | - | 1,451 (21.1%) |
| 2-Person Households | 3,011 (43.8%) | 391 (5.7%) |
| 3-Person Households | 880 (12.8%) | 38 (0.5%) |
| 4-Person Households | 670 (9.7%) | 43 (0.6%) |
| 5-Person Households | 344 (5.0%) | 0 (0.0%) |
| 6-Person Households | 50 (0.7%) | 0 (0.0%) |
| 7+ Person Households | 0 (0.0%) | 0 (0.0%) |
| Total | 4,955 (72.0%) | 1,923 (28.0%) |
Female Fertility in Fort Mohave
Fertility by Age in Fort Mohave
Average fertility rate in Fort Mohave is 112.0 births per 1,000 women. Women in the age bracket of 20 to 34 years have the highest fertility rate with 213.0 births per 1,000 women. Women in the age bracket of 20 to 34 years acount for 83.8% of all women with births.
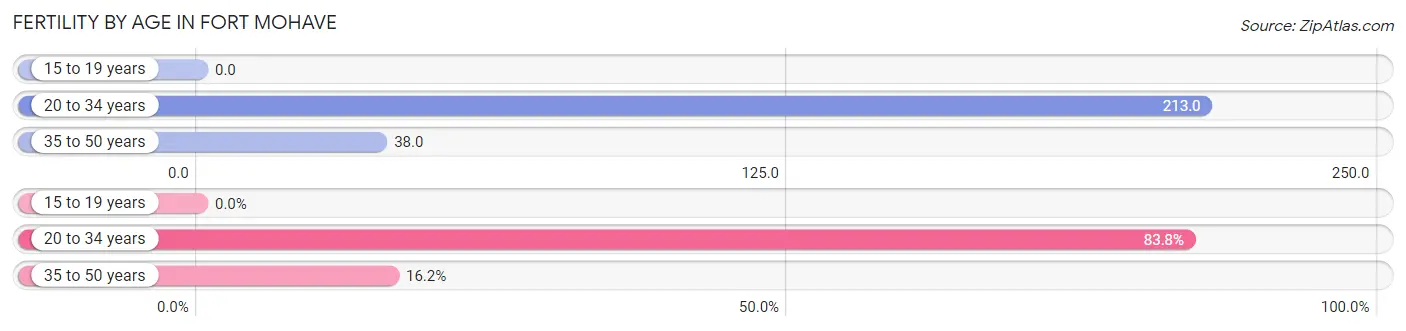
| Age Bracket | Women with Births | Births / 1,000 Women |
| 15 to 19 years | 0 (0.0%) | 0.0 |
| 20 to 34 years | 181 (83.8%) | 213.0 |
| 35 to 50 years | 35 (16.2%) | 38.0 |
| Total | 216 (100.0%) | 112.0 |
Fertility by Age by Marriage Status in Fort Mohave
66.7% of women with births (216) in Fort Mohave are married. The highest percentage of unmarried women with births falls into 20 to 34 years age bracket with 39.8% of them unmarried at the time of birth, while the lowest percentage of unmarried women with births belong to 35 to 50 years age bracket with 0.0% of them unmarried.
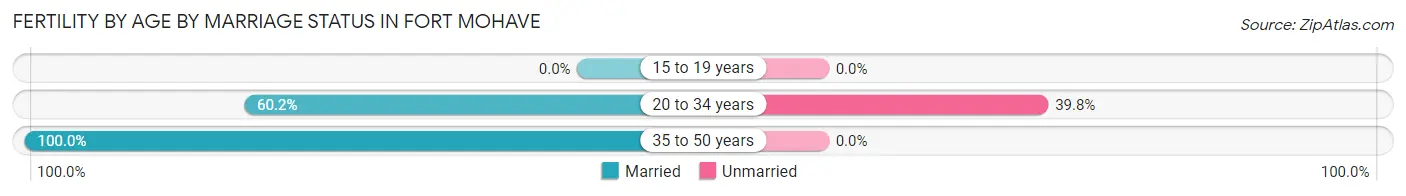
| Age Bracket | Married | Unmarried |
| 15 to 19 years | 0 (0.0%) | 0 (0.0%) |
| 20 to 34 years | 109 (60.2%) | 72 (39.8%) |
| 35 to 50 years | 35 (100.0%) | 0 (0.0%) |
| Total | 144 (66.7%) | 72 (33.3%) |
Fertility by Education in Fort Mohave
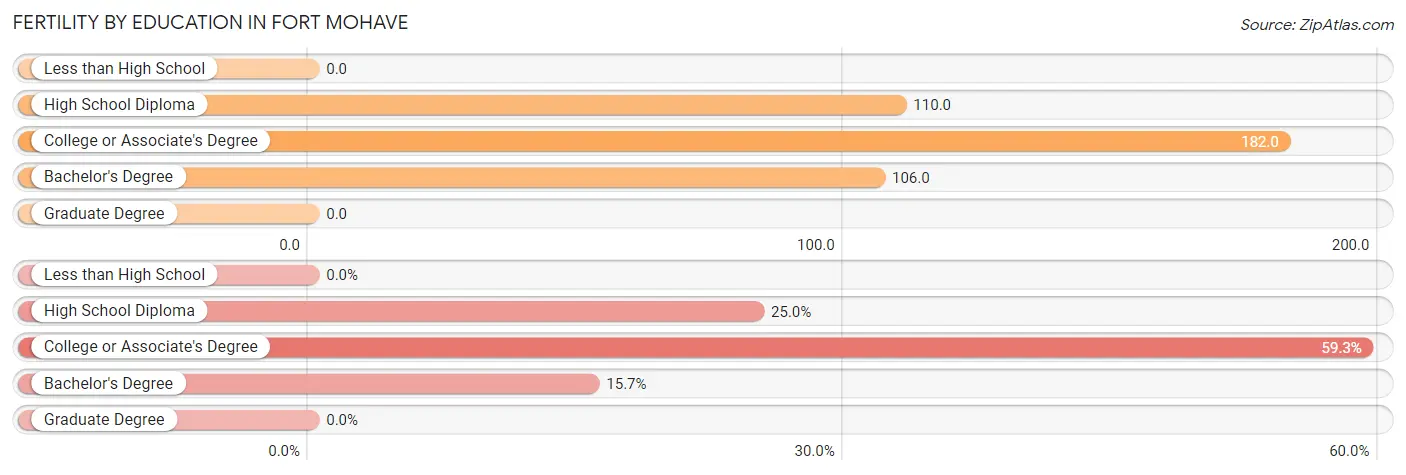
| Educational Attainment | Women with Births | Births / 1,000 Women |
| Less than High School | 0 (0.0%) | 0.0 |
| High School Diploma | 54 (25.0%) | 110.0 |
| College or Associate's Degree | 128 (59.3%) | 182.0 |
| Bachelor's Degree | 34 (15.7%) | 106.0 |
| Graduate Degree | 0 (0.0%) | 0.0 |
| Total | 216 (100.0%) | 112.0 |
Fertility by Education by Marriage Status in Fort Mohave
33.3% of women with births in Fort Mohave are unmarried. Women with the educational attainment of bachelor's degree are most likely to be married with 100.0% of them married at childbirth, while women with the educational attainment of high school diploma are least likely to be married with 100.0% of them unmarried at childbirth.
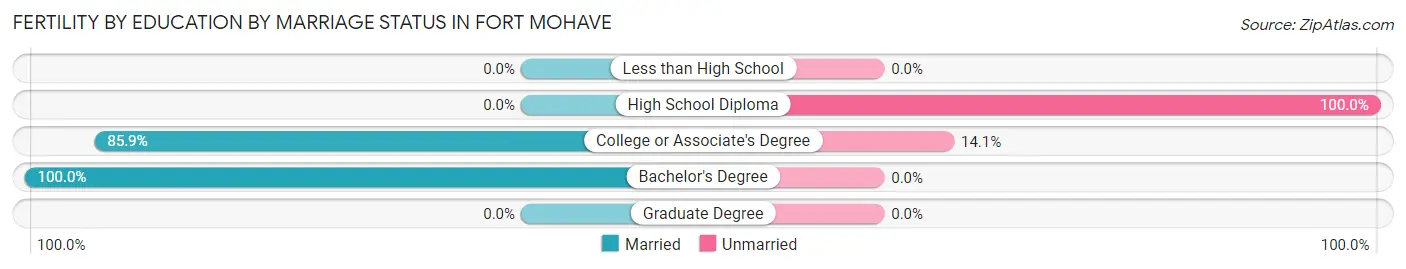
| Educational Attainment | Married | Unmarried |
| Less than High School | 0 (0.0%) | 0 (0.0%) |
| High School Diploma | 0 (0.0%) | 54 (100.0%) |
| College or Associate's Degree | 110 (85.9%) | 18 (14.1%) |
| Bachelor's Degree | 34 (100.0%) | 0 (0.0%) |
| Graduate Degree | 0 (0.0%) | 0 (0.0%) |
| Total | 144 (66.7%) | 72 (33.3%) |
Employment Characteristics in Fort Mohave
Employment by Class of Employer in Fort Mohave
Among the 5,482 employed individuals in Fort Mohave, private company employees (4,175 | 76.2%), local government employees (356 | 6.5%), and self-employed (not incorporated) (319 | 5.8%) make up the most common classes of employment.
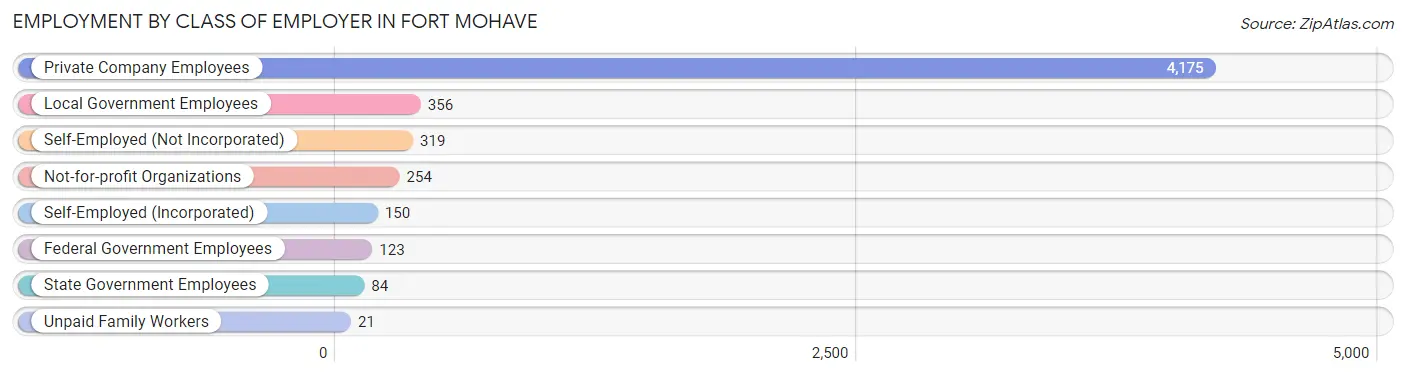
| Employer Class | # Employees | % Employees |
| Private Company Employees | 4,175 | 76.2% |
| Self-Employed (Incorporated) | 150 | 2.7% |
| Self-Employed (Not Incorporated) | 319 | 5.8% |
| Not-for-profit Organizations | 254 | 4.6% |
| Local Government Employees | 356 | 6.5% |
| State Government Employees | 84 | 1.5% |
| Federal Government Employees | 123 | 2.2% |
| Unpaid Family Workers | 21 | 0.4% |
| Total | 5,482 | 100.0% |
Employment Status by Age in Fort Mohave
According to the labor force statistics for Fort Mohave, out of the total population over 16 years of age (14,099), 43.6% or 6,147 individuals are in the labor force, with 9.7% or 596 of them unemployed. The age group with the highest labor force participation rate is 45 to 54 years, with 84.5% or 1,507 individuals in the labor force. Within the labor force, the 35 to 44 years age range has the highest percentage of unemployed individuals, with 25.3% or 245 of them being unemployed.
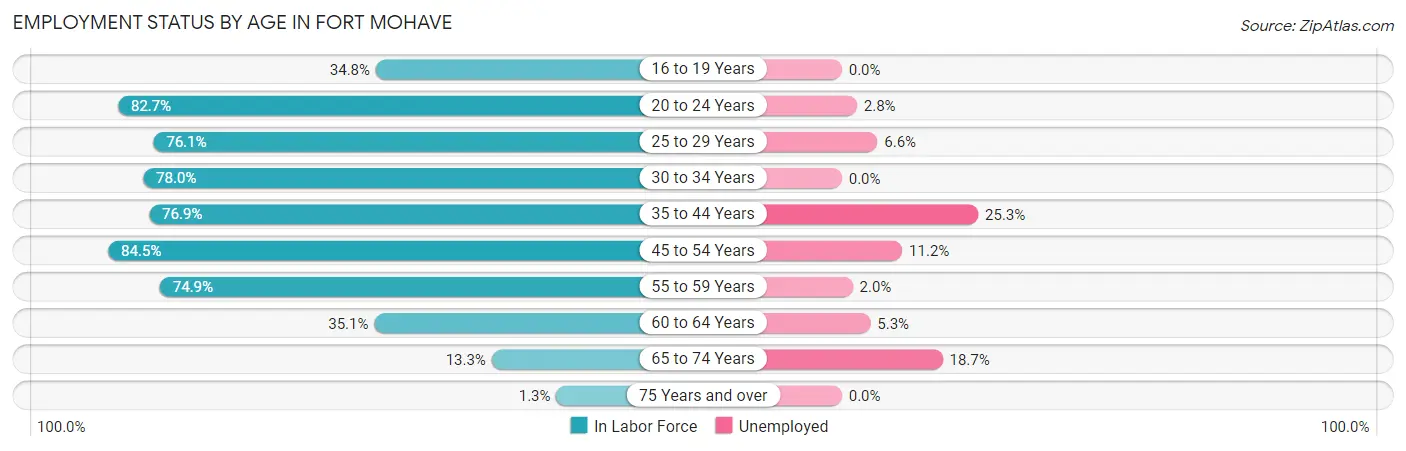
| Age Bracket | In Labor Force | Unemployed |
| 16 to 19 Years | 160 (34.8%) | 0 (0.0%) |
| 20 to 24 Years | 469 (82.7%) | 13 (2.8%) |
| 25 to 29 Years | 376 (76.1%) | 25 (6.6%) |
| 30 to 34 Years | 486 (78.0%) | 0 (0.0%) |
| 35 to 44 Years | 967 (76.9%) | 245 (25.3%) |
| 45 to 54 Years | 1,507 (84.5%) | 169 (11.2%) |
| 55 to 59 Years | 987 (74.9%) | 20 (2.0%) |
| 60 to 64 Years | 682 (35.1%) | 36 (5.3%) |
| 65 to 74 Years | 485 (13.3%) | 91 (18.7%) |
| 75 Years and over | 26 (1.3%) | 0 (0.0%) |
| Total | 6,147 (43.6%) | 596 (9.7%) |
Employment Status by Educational Attainment in Fort Mohave
According to labor force statistics for Fort Mohave, 67.5% of individuals (5,006) out of the total population between 25 and 64 years of age (7,417) are in the labor force, with 9.9% or 496 of them being unemployed. The group with the highest labor force participation rate are those with the educational attainment of bachelor's degree or higher, with 81.1% or 676 individuals in the labor force. Within the labor force, individuals with less than high school education have the highest percentage of unemployment, with 18.4% or 109 of them being unemployed.
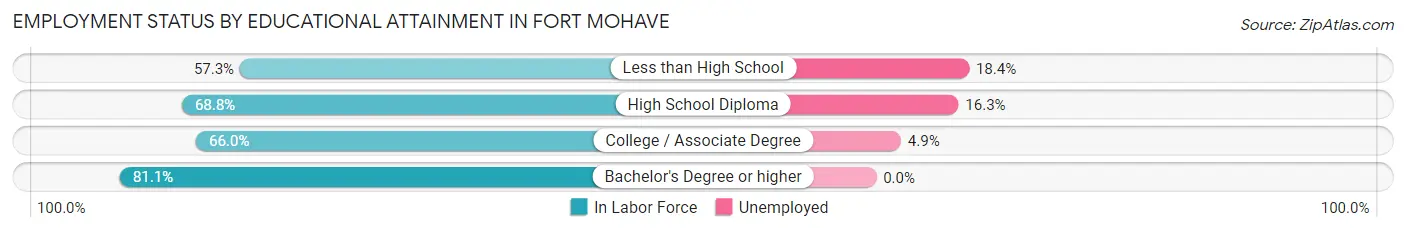
| Educational Attainment | In Labor Force | Unemployed |
| Less than High School | 591 (57.3%) | 190 (18.4%) |
| High School Diploma | 1,761 (68.8%) | 417 (16.3%) |
| College / Associate Degree | 1,975 (66.0%) | 147 (4.9%) |
| Bachelor's Degree or higher | 676 (81.1%) | 0 (0.0%) |
| Total | 5,006 (67.5%) | 734 (9.9%) |
Employment Occupations by Sex in Fort Mohave
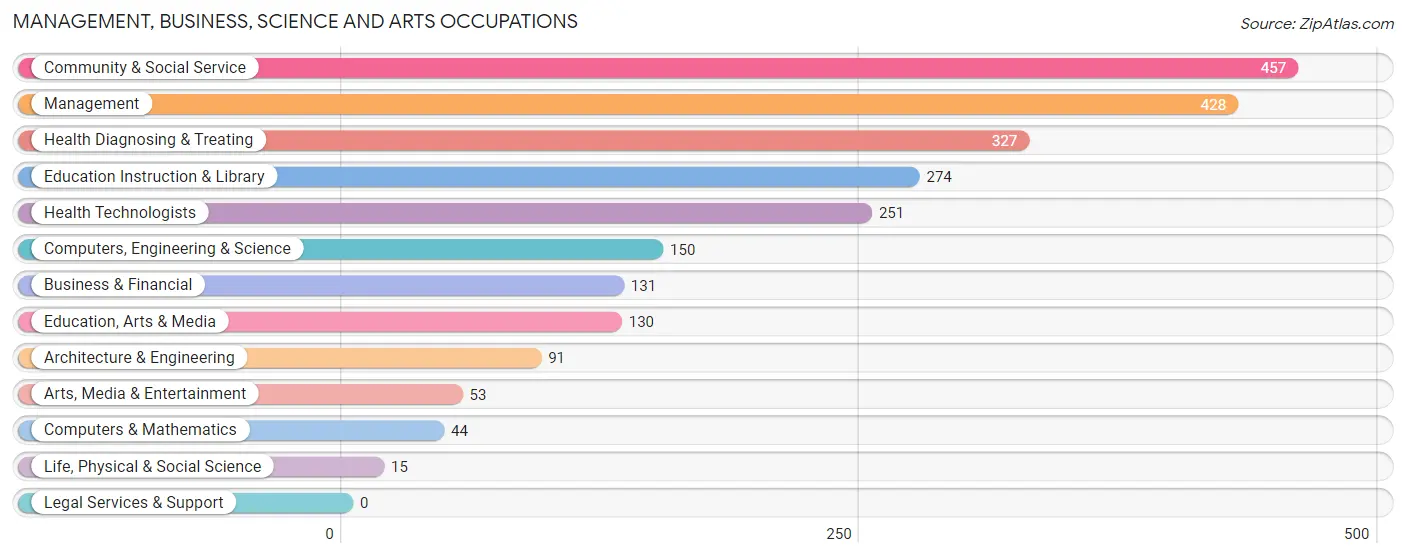
Management, Business, Science and Arts Occupations
The most common Management, Business, Science and Arts occupations in Fort Mohave are Community & Social Service (457 | 8.3%), Management (428 | 7.7%), Health Diagnosing & Treating (327 | 5.9%), Education Instruction & Library (274 | 5.0%), and Health Technologists (251 | 4.5%).
Management, Business, Science and Arts Occupations by Sex
Within the Management, Business, Science and Arts occupations in Fort Mohave, the most male-oriented occupations are Computers & Mathematics (100.0%), Life, Physical & Social Science (100.0%), and Computers, Engineering & Science (78.0%), while the most female-oriented occupations are Health Technologists (100.0%), Business & Financial (93.9%), and Health Diagnosing & Treating (88.7%).
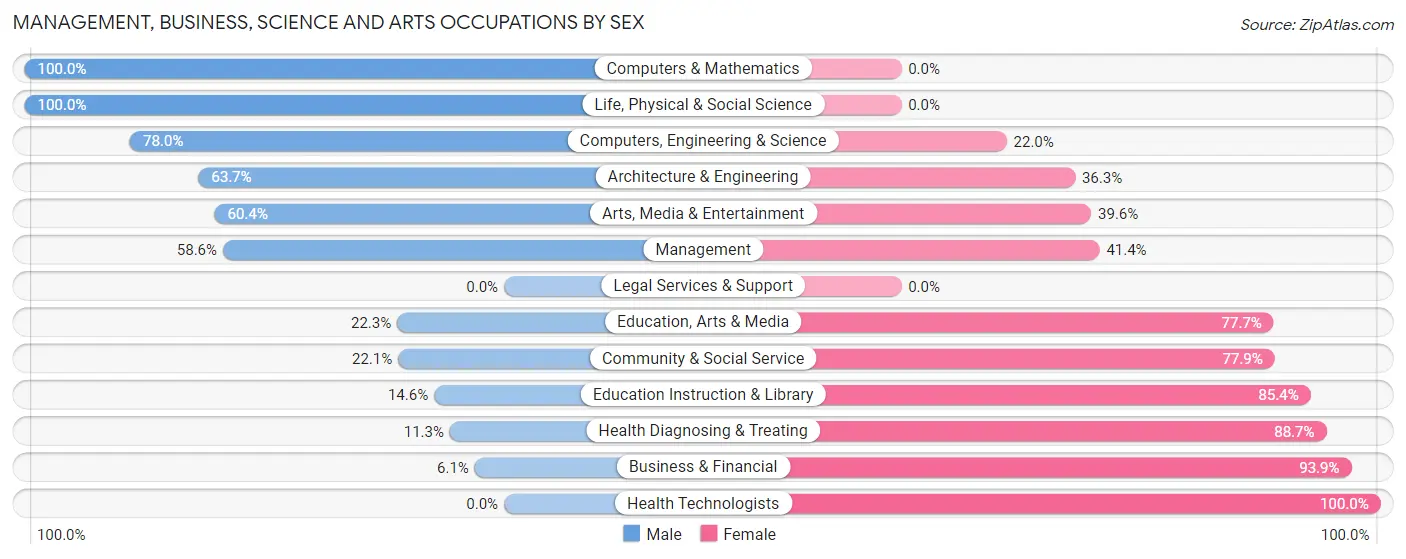
| Occupation | Male | Female |
| Management | 251 (58.6%) | 177 (41.4%) |
| Business & Financial | 8 (6.1%) | 123 (93.9%) |
| Computers, Engineering & Science | 117 (78.0%) | 33 (22.0%) |
| Computers & Mathematics | 44 (100.0%) | 0 (0.0%) |
| Architecture & Engineering | 58 (63.7%) | 33 (36.3%) |
| Life, Physical & Social Science | 15 (100.0%) | 0 (0.0%) |
| Community & Social Service | 101 (22.1%) | 356 (77.9%) |
| Education, Arts & Media | 29 (22.3%) | 101 (77.7%) |
| Legal Services & Support | 0 (0.0%) | 0 (0.0%) |
| Education Instruction & Library | 40 (14.6%) | 234 (85.4%) |
| Arts, Media & Entertainment | 32 (60.4%) | 21 (39.6%) |
| Health Diagnosing & Treating | 37 (11.3%) | 290 (88.7%) |
| Health Technologists | 0 (0.0%) | 251 (100.0%) |
| Total (Category) | 514 (34.4%) | 979 (65.6%) |
| Total (Overall) | 2,986 (53.9%) | 2,551 (46.1%) |
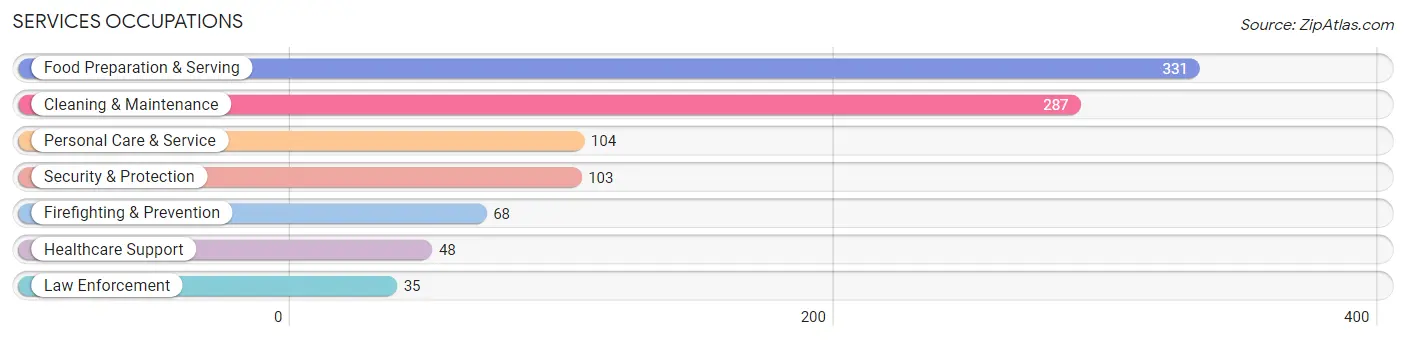
Services Occupations
The most common Services occupations in Fort Mohave are Food Preparation & Serving (331 | 6.0%), Cleaning & Maintenance (287 | 5.2%), Personal Care & Service (104 | 1.9%), Security & Protection (103 | 1.9%), and Firefighting & Prevention (68 | 1.2%).
Services Occupations by Sex
Within the Services occupations in Fort Mohave, the most male-oriented occupations are Security & Protection (100.0%), Firefighting & Prevention (100.0%), and Law Enforcement (100.0%), while the most female-oriented occupations are Personal Care & Service (84.6%), Healthcare Support (60.4%), and Food Preparation & Serving (44.7%).
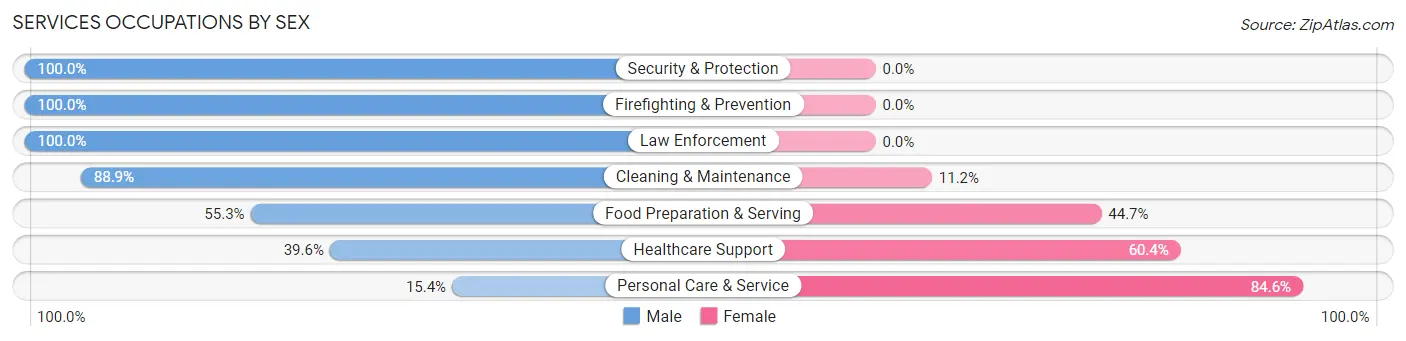
| Occupation | Male | Female |
| Healthcare Support | 19 (39.6%) | 29 (60.4%) |
| Security & Protection | 103 (100.0%) | 0 (0.0%) |
| Firefighting & Prevention | 68 (100.0%) | 0 (0.0%) |
| Law Enforcement | 35 (100.0%) | 0 (0.0%) |
| Food Preparation & Serving | 183 (55.3%) | 148 (44.7%) |
| Cleaning & Maintenance | 255 (88.8%) | 32 (11.2%) |
| Personal Care & Service | 16 (15.4%) | 88 (84.6%) |
| Total (Category) | 576 (66.0%) | 297 (34.0%) |
| Total (Overall) | 2,986 (53.9%) | 2,551 (46.1%) |
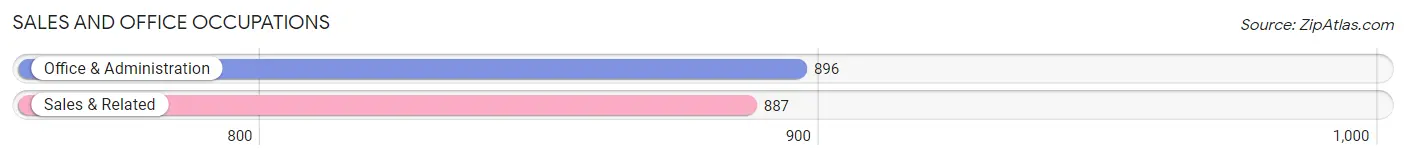
Sales and Office Occupations
The most common Sales and Office occupations in Fort Mohave are Office & Administration (896 | 16.2%), and Sales & Related (887 | 16.0%).
Sales and Office Occupations by Sex
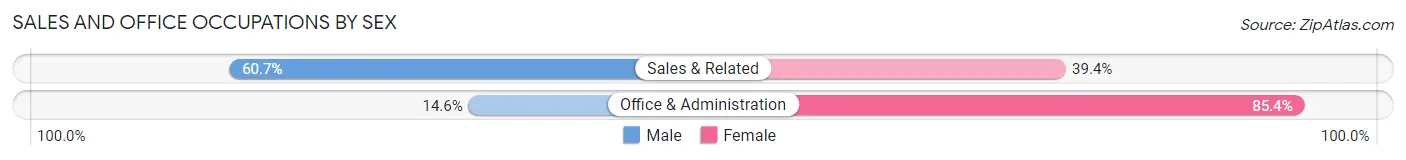
| Occupation | Male | Female |
| Sales & Related | 538 (60.7%) | 349 (39.4%) |
| Office & Administration | 131 (14.6%) | 765 (85.4%) |
| Total (Category) | 669 (37.5%) | 1,114 (62.5%) |
| Total (Overall) | 2,986 (53.9%) | 2,551 (46.1%) |
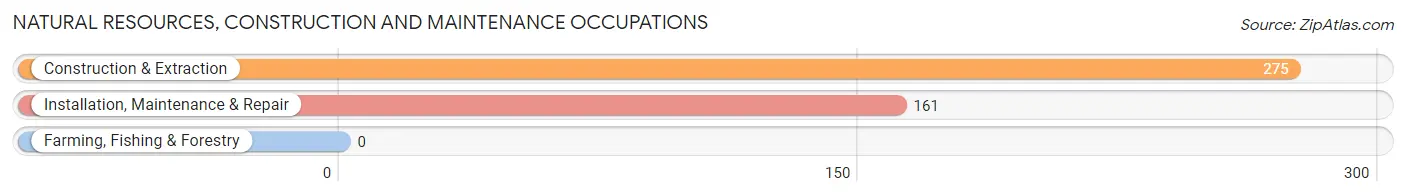
Natural Resources, Construction and Maintenance Occupations
The most common Natural Resources, Construction and Maintenance occupations in Fort Mohave are Construction & Extraction (275 | 5.0%), and Installation, Maintenance & Repair (161 | 2.9%).
Natural Resources, Construction and Maintenance Occupations by Sex

| Occupation | Male | Female |
| Farming, Fishing & Forestry | 0 (0.0%) | 0 (0.0%) |
| Construction & Extraction | 275 (100.0%) | 0 (0.0%) |
| Installation, Maintenance & Repair | 161 (100.0%) | 0 (0.0%) |
| Total (Category) | 436 (100.0%) | 0 (0.0%) |
| Total (Overall) | 2,986 (53.9%) | 2,551 (46.1%) |
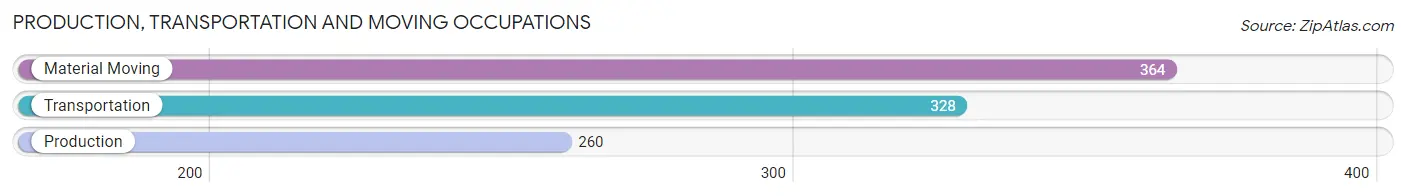
Production, Transportation and Moving Occupations
The most common Production, Transportation and Moving occupations in Fort Mohave are Material Moving (364 | 6.6%), Transportation (328 | 5.9%), and Production (260 | 4.7%).
Production, Transportation and Moving Occupations by Sex
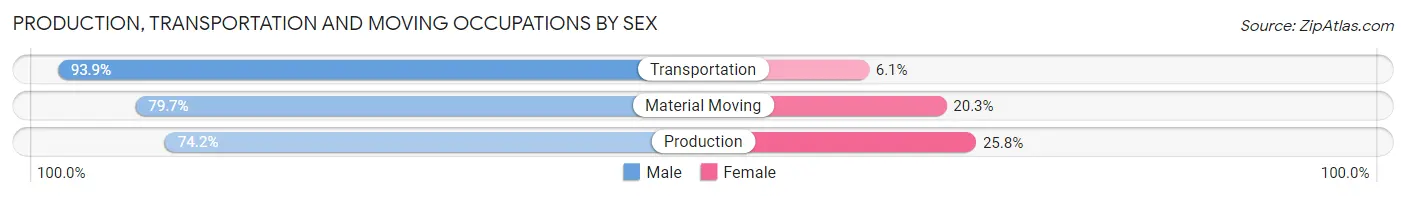
| Occupation | Male | Female |
| Production | 193 (74.2%) | 67 (25.8%) |
| Transportation | 308 (93.9%) | 20 (6.1%) |
| Material Moving | 290 (79.7%) | 74 (20.3%) |
| Total (Category) | 791 (83.1%) | 161 (16.9%) |
| Total (Overall) | 2,986 (53.9%) | 2,551 (46.1%) |
Employment Industries by Sex in Fort Mohave
Employment Industries in Fort Mohave
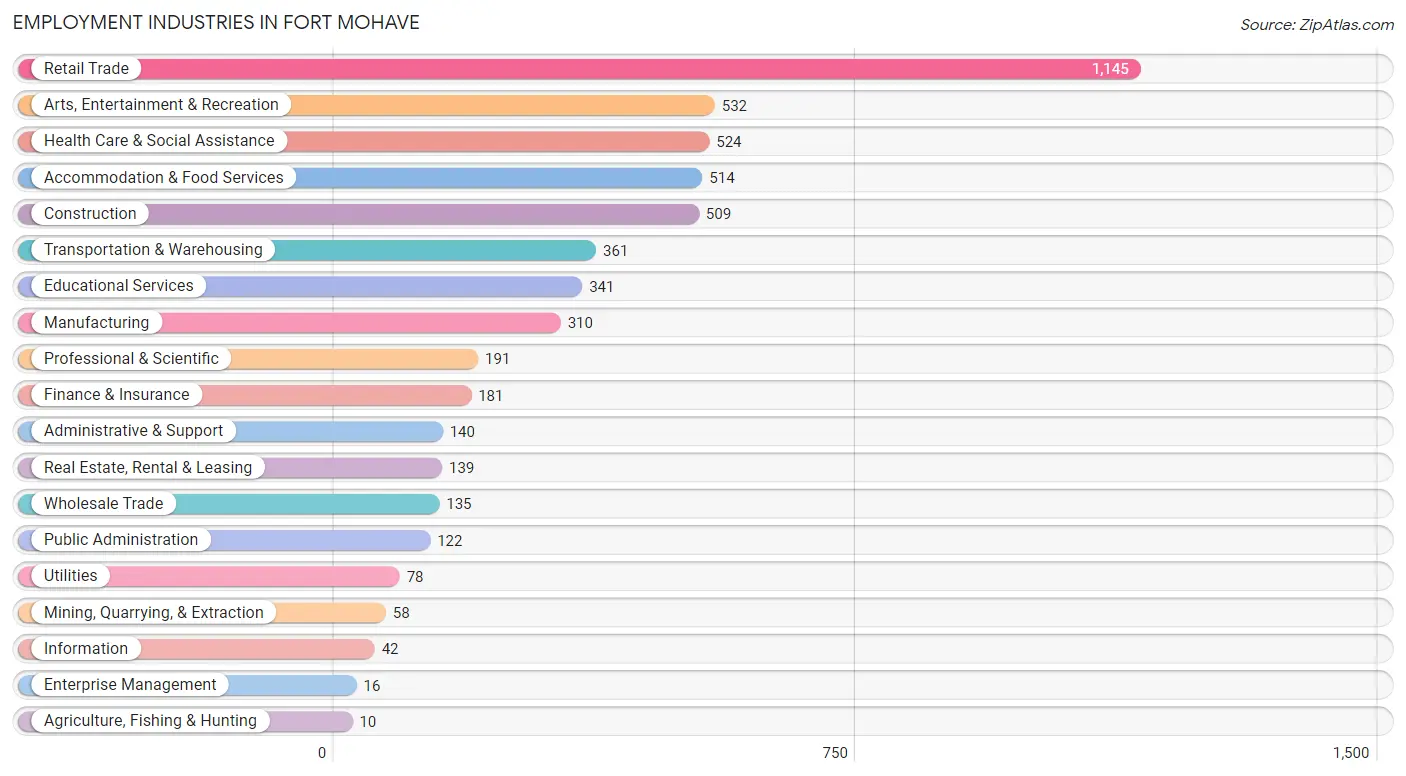
The major employment industries in Fort Mohave include Retail Trade (1,145 | 20.7%), Arts, Entertainment & Recreation (532 | 9.6%), Health Care & Social Assistance (524 | 9.5%), Accommodation & Food Services (514 | 9.3%), and Construction (509 | 9.2%).
Employment Industries by Sex in Fort Mohave
The Fort Mohave industries that see more men than women are Agriculture, Fishing & Hunting (100.0%), Mining, Quarrying, & Extraction (100.0%), and Utilities (100.0%), whereas the industries that tend to have a higher number of women are Enterprise Management (100.0%), Health Care & Social Assistance (82.3%), and Educational Services (73.6%).
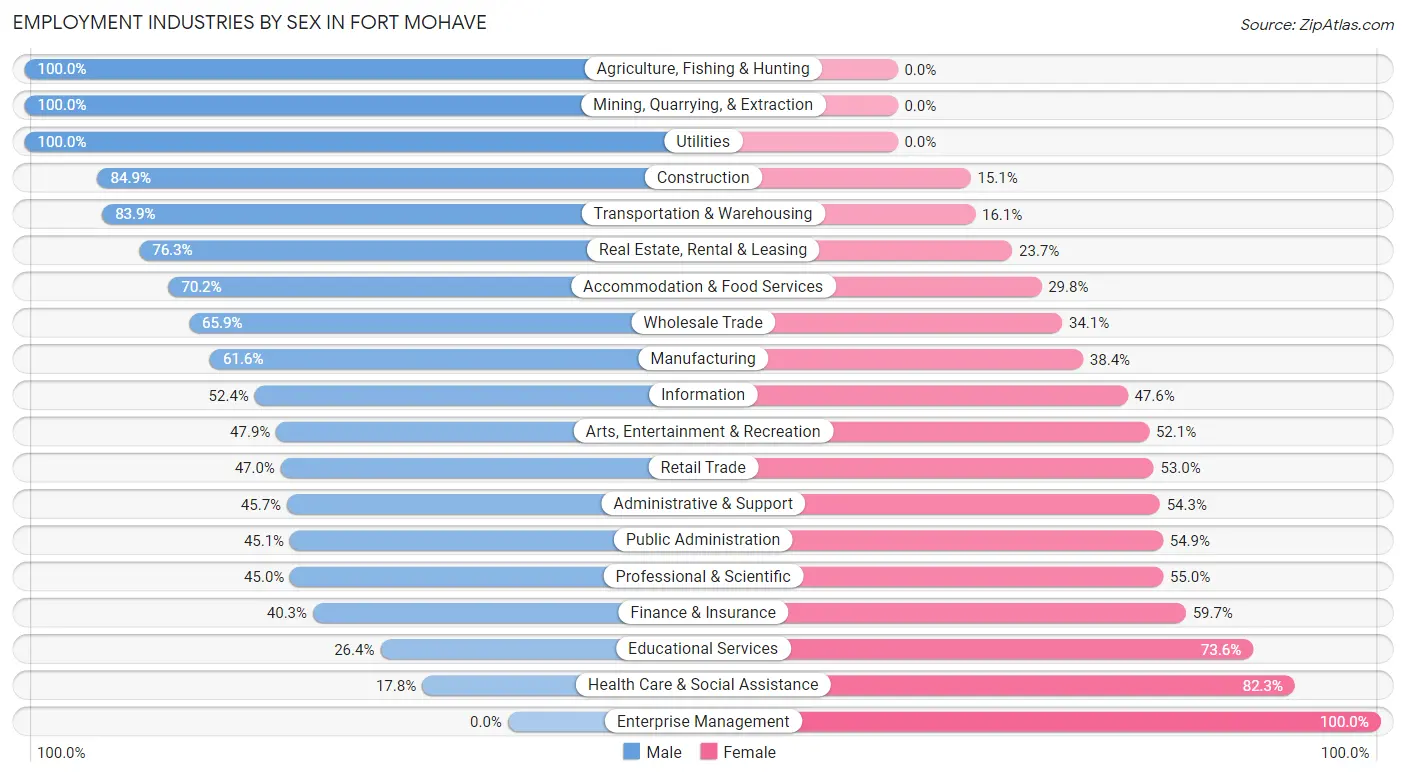
| Industry | Male | Female |
| Agriculture, Fishing & Hunting | 10 (100.0%) | 0 (0.0%) |
| Mining, Quarrying, & Extraction | 58 (100.0%) | 0 (0.0%) |
| Construction | 432 (84.9%) | 77 (15.1%) |
| Manufacturing | 191 (61.6%) | 119 (38.4%) |
| Wholesale Trade | 89 (65.9%) | 46 (34.1%) |
| Retail Trade | 538 (47.0%) | 607 (53.0%) |
| Transportation & Warehousing | 303 (83.9%) | 58 (16.1%) |
| Utilities | 78 (100.0%) | 0 (0.0%) |
| Information | 22 (52.4%) | 20 (47.6%) |
| Finance & Insurance | 73 (40.3%) | 108 (59.7%) |
| Real Estate, Rental & Leasing | 106 (76.3%) | 33 (23.7%) |
| Professional & Scientific | 86 (45.0%) | 105 (55.0%) |
| Enterprise Management | 0 (0.0%) | 16 (100.0%) |
| Administrative & Support | 64 (45.7%) | 76 (54.3%) |
| Educational Services | 90 (26.4%) | 251 (73.6%) |
| Health Care & Social Assistance | 93 (17.7%) | 431 (82.3%) |
| Arts, Entertainment & Recreation | 255 (47.9%) | 277 (52.1%) |
| Accommodation & Food Services | 361 (70.2%) | 153 (29.8%) |
| Public Administration | 55 (45.1%) | 67 (54.9%) |
| Total | 2,986 (53.9%) | 2,551 (46.1%) |
Education in Fort Mohave
School Enrollment in Fort Mohave
The most common levels of schooling among the 2,288 students in Fort Mohave are middle school (653 | 28.5%), high school (546 | 23.9%), and elementary school (484 | 21.1%).
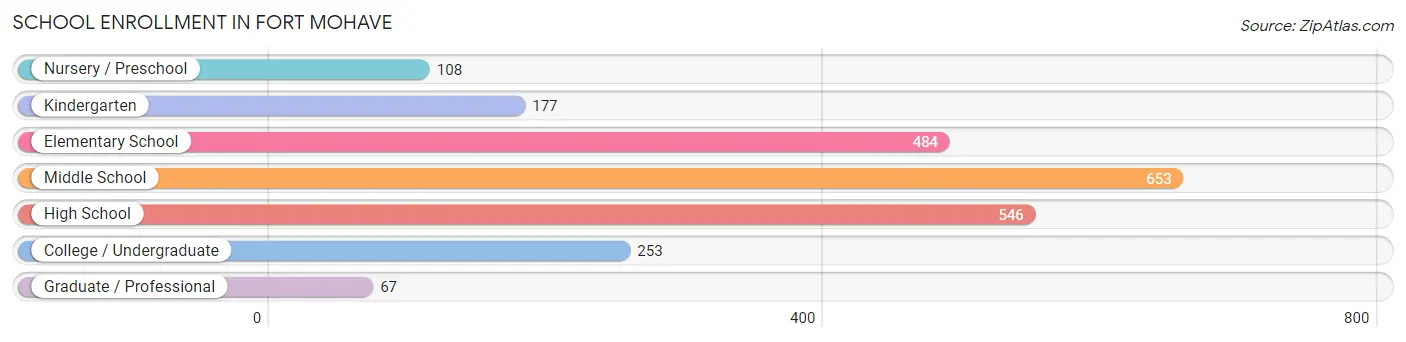
| School Level | # Students | % Students |
| Nursery / Preschool | 108 | 4.7% |
| Kindergarten | 177 | 7.7% |
| Elementary School | 484 | 21.1% |
| Middle School | 653 | 28.5% |
| High School | 546 | 23.9% |
| College / Undergraduate | 253 | 11.1% |
| Graduate / Professional | 67 | 2.9% |
| Total | 2,288 | 100.0% |
School Enrollment by Age by Funding Source in Fort Mohave
Out of a total of 2,288 students who are enrolled in schools in Fort Mohave, 357 (15.6%) attend a private institution, while the remaining 1,931 (84.4%) are enrolled in public schools. The age group of 35 years and over has the highest likelihood of being enrolled in private schools, with 94 (69.1% in the age bracket) enrolled. Conversely, the age group of 15 to 17 year olds has the lowest likelihood of being enrolled in a private school, with 389 (100.0% in the age bracket) attending a public institution.
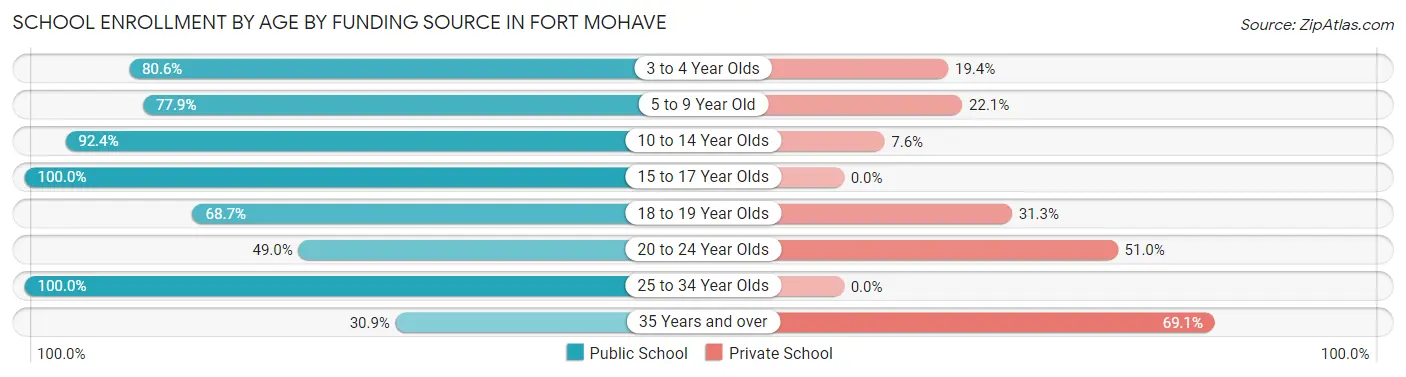
| Age Bracket | Public School | Private School |
| 3 to 4 Year Olds | 87 (80.6%) | 21 (19.4%) |
| 5 to 9 Year Old | 431 (77.9%) | 122 (22.1%) |
| 10 to 14 Year Olds | 780 (92.4%) | 64 (7.6%) |
| 15 to 17 Year Olds | 389 (100.0%) | 0 (0.0%) |
| 18 to 19 Year Olds | 68 (68.7%) | 31 (31.3%) |
| 20 to 24 Year Olds | 24 (49.0%) | 25 (51.0%) |
| 25 to 34 Year Olds | 110 (100.0%) | 0 (0.0%) |
| 35 Years and over | 42 (30.9%) | 94 (69.1%) |
| Total | 1,931 (84.4%) | 357 (15.6%) |
Educational Attainment by Field of Study in Fort Mohave
Business (341 | 22.1%), science & technology (275 | 17.8%), education (202 | 13.1%), computers & mathematics (131 | 8.5%), and social sciences (116 | 7.5%) are the most common fields of study among 1,544 individuals in Fort Mohave who have obtained a bachelor's degree or higher.
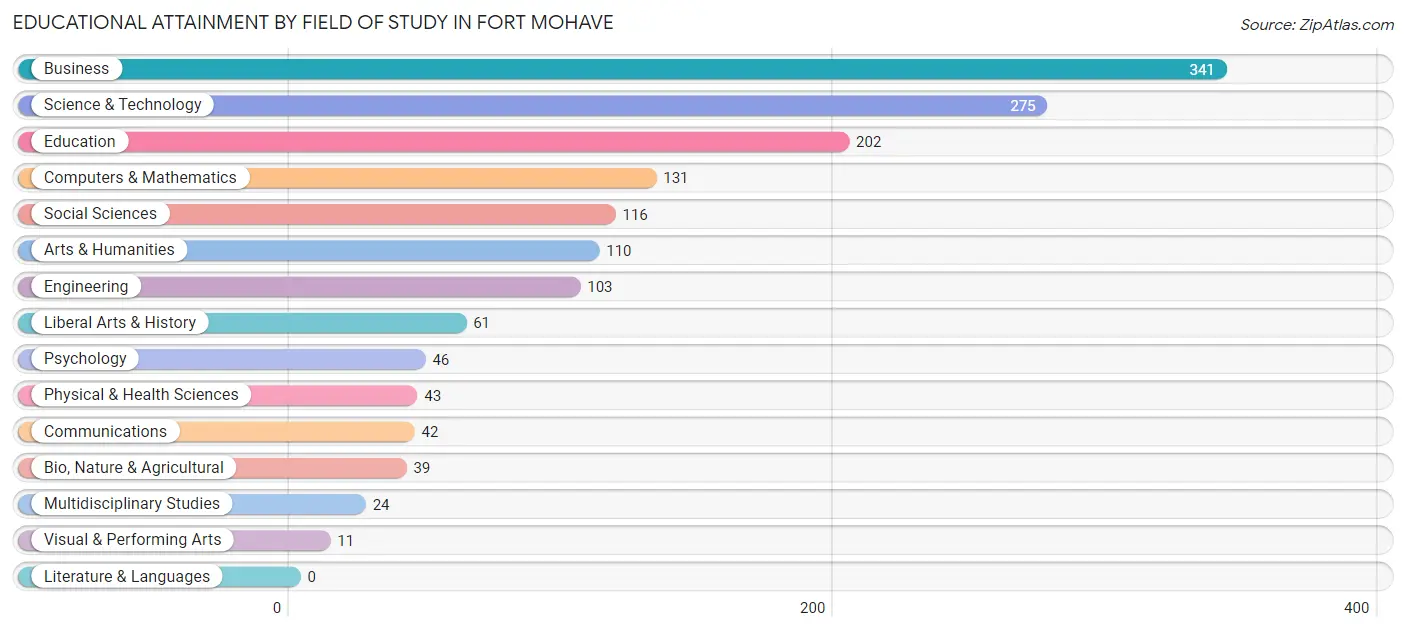
| Field of Study | # Graduates | % Graduates |
| Computers & Mathematics | 131 | 8.5% |
| Bio, Nature & Agricultural | 39 | 2.5% |
| Physical & Health Sciences | 43 | 2.8% |
| Psychology | 46 | 3.0% |
| Social Sciences | 116 | 7.5% |
| Engineering | 103 | 6.7% |
| Multidisciplinary Studies | 24 | 1.5% |
| Science & Technology | 275 | 17.8% |
| Business | 341 | 22.1% |
| Education | 202 | 13.1% |
| Literature & Languages | 0 | 0.0% |
| Liberal Arts & History | 61 | 4.0% |
| Visual & Performing Arts | 11 | 0.7% |
| Communications | 42 | 2.7% |
| Arts & Humanities | 110 | 7.1% |
| Total | 1,544 | 100.0% |
Transportation & Commute in Fort Mohave
Vehicle Availability by Sex in Fort Mohave
The most prevalent vehicle ownership categories in Fort Mohave are males with 2 vehicles (1,133, accounting for 38.3%) and females with 2 vehicles (999, making up 45.0%).
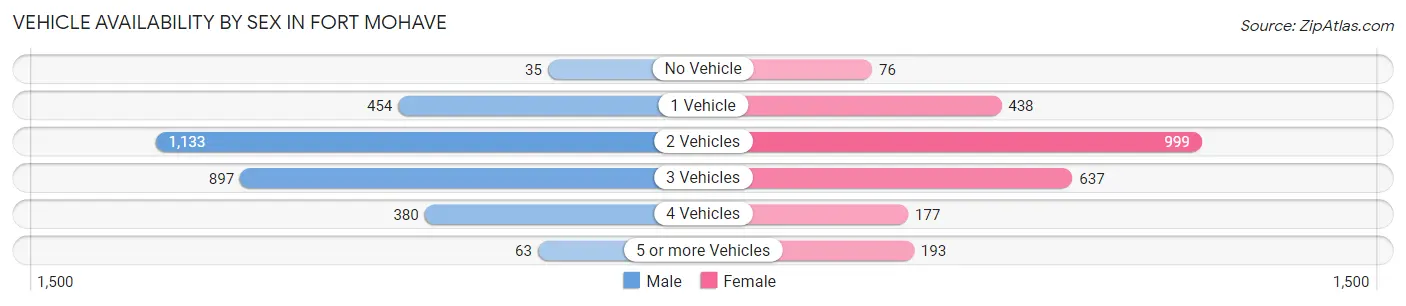
| Vehicles Available | Male | Female |
| No Vehicle | 35 (1.2%) | 76 (3.0%) |
| 1 Vehicle | 454 (15.3%) | 438 (17.4%) |
| 2 Vehicles | 1,133 (38.3%) | 999 (39.6%) |
| 3 Vehicles | 897 (30.3%) | 637 (25.3%) |
| 4 Vehicles | 380 (12.8%) | 177 (7.0%) |
| 5 or more Vehicles | 63 (2.1%) | 193 (7.7%) |
| Total | 2,962 (100.0%) | 2,520 (100.0%) |
Commute Time in Fort Mohave
The most frequently occuring commute durations in Fort Mohave are 15 to 19 minutes (1,096 commuters, 20.5%), 20 to 24 minutes (933 commuters, 17.5%), and 10 to 14 minutes (925 commuters, 17.3%).
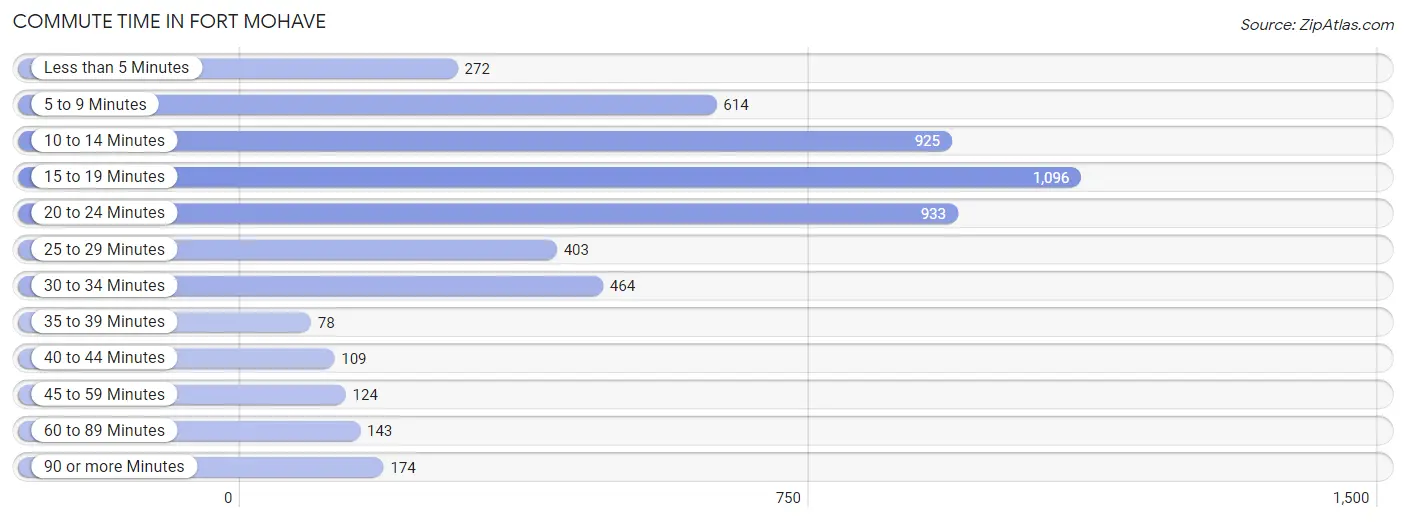
| Commute Time | # Commuters | % Commuters |
| Less than 5 Minutes | 272 | 5.1% |
| 5 to 9 Minutes | 614 | 11.5% |
| 10 to 14 Minutes | 925 | 17.3% |
| 15 to 19 Minutes | 1,096 | 20.5% |
| 20 to 24 Minutes | 933 | 17.5% |
| 25 to 29 Minutes | 403 | 7.5% |
| 30 to 34 Minutes | 464 | 8.7% |
| 35 to 39 Minutes | 78 | 1.5% |
| 40 to 44 Minutes | 109 | 2.0% |
| 45 to 59 Minutes | 124 | 2.3% |
| 60 to 89 Minutes | 143 | 2.7% |
| 90 or more Minutes | 174 | 3.3% |
Commute Time by Sex in Fort Mohave
The most common commute times in Fort Mohave are 20 to 24 minutes (590 commuters, 20.4%) for males and 15 to 19 minutes (558 commuters, 22.9%) for females.
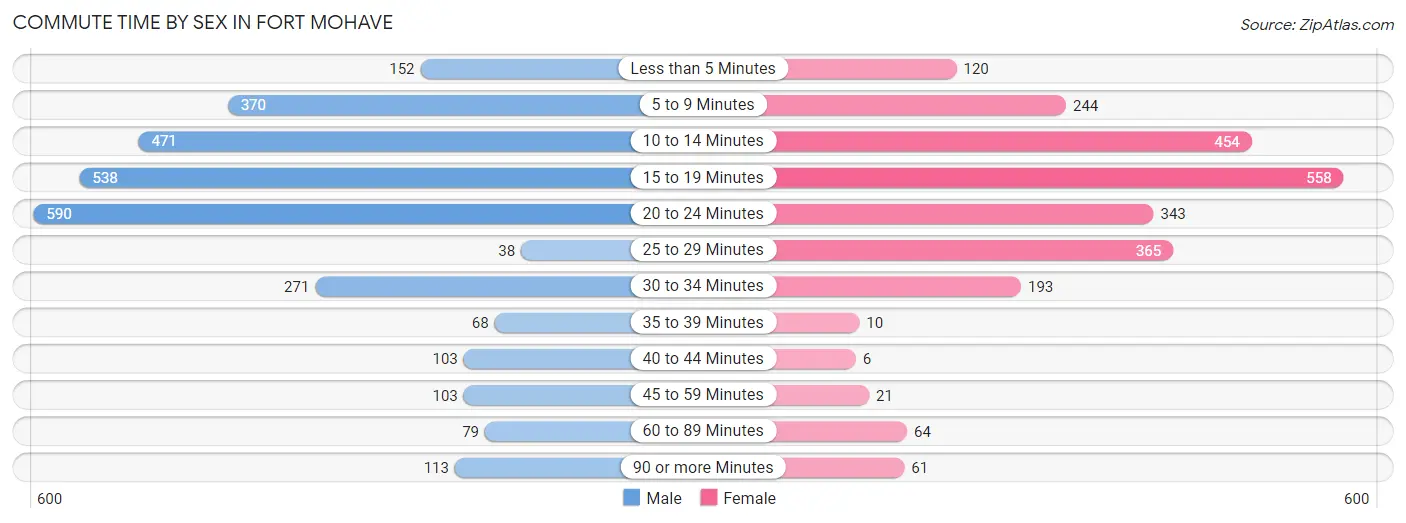
| Commute Time | Male | Female |
| Less than 5 Minutes | 152 (5.2%) | 120 (4.9%) |
| 5 to 9 Minutes | 370 (12.8%) | 244 (10.0%) |
| 10 to 14 Minutes | 471 (16.3%) | 454 (18.6%) |
| 15 to 19 Minutes | 538 (18.6%) | 558 (22.9%) |
| 20 to 24 Minutes | 590 (20.4%) | 343 (14.1%) |
| 25 to 29 Minutes | 38 (1.3%) | 365 (15.0%) |
| 30 to 34 Minutes | 271 (9.4%) | 193 (7.9%) |
| 35 to 39 Minutes | 68 (2.4%) | 10 (0.4%) |
| 40 to 44 Minutes | 103 (3.6%) | 6 (0.3%) |
| 45 to 59 Minutes | 103 (3.6%) | 21 (0.9%) |
| 60 to 89 Minutes | 79 (2.7%) | 64 (2.6%) |
| 90 or more Minutes | 113 (3.9%) | 61 (2.5%) |
Time of Departure to Work by Sex in Fort Mohave
The most frequent times of departure to work in Fort Mohave are 12:00 PM to 3:59 PM (357, 12.3%) for males and 7:00 AM to 7:29 AM (447, 18.3%) for females.
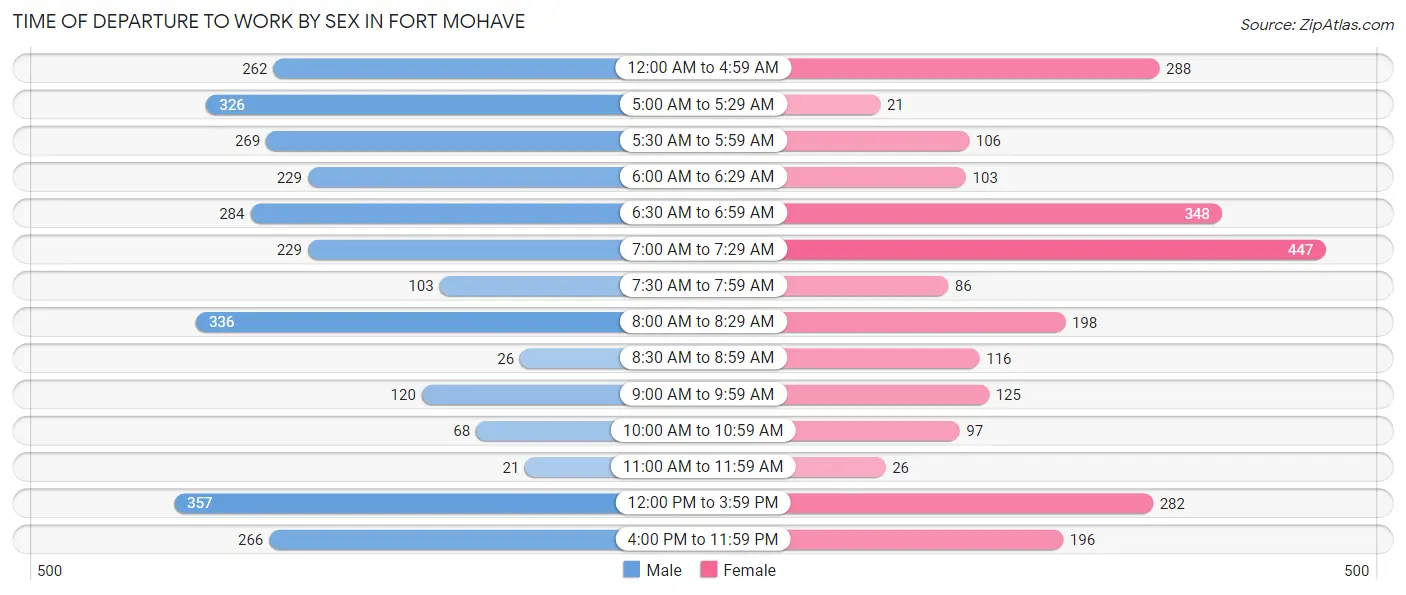
| Time of Departure | Male | Female |
| 12:00 AM to 4:59 AM | 262 (9.0%) | 288 (11.8%) |
| 5:00 AM to 5:29 AM | 326 (11.3%) | 21 (0.9%) |
| 5:30 AM to 5:59 AM | 269 (9.3%) | 106 (4.3%) |
| 6:00 AM to 6:29 AM | 229 (7.9%) | 103 (4.2%) |
| 6:30 AM to 6:59 AM | 284 (9.8%) | 348 (14.3%) |
| 7:00 AM to 7:29 AM | 229 (7.9%) | 447 (18.3%) |
| 7:30 AM to 7:59 AM | 103 (3.6%) | 86 (3.5%) |
| 8:00 AM to 8:29 AM | 336 (11.6%) | 198 (8.1%) |
| 8:30 AM to 8:59 AM | 26 (0.9%) | 116 (4.8%) |
| 9:00 AM to 9:59 AM | 120 (4.1%) | 125 (5.1%) |
| 10:00 AM to 10:59 AM | 68 (2.4%) | 97 (4.0%) |
| 11:00 AM to 11:59 AM | 21 (0.7%) | 26 (1.1%) |
| 12:00 PM to 3:59 PM | 357 (12.3%) | 282 (11.6%) |
| 4:00 PM to 11:59 PM | 266 (9.2%) | 196 (8.0%) |
| Total | 2,896 (100.0%) | 2,439 (100.0%) |
Housing Occupancy in Fort Mohave
Occupancy by Ownership in Fort Mohave
Of the total 6,878 dwellings in Fort Mohave, owner-occupied units account for 5,823 (84.7%), while renter-occupied units make up 1,055 (15.3%).
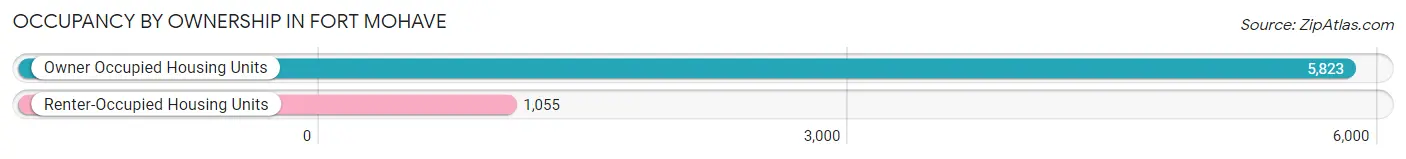
| Occupancy | # Housing Units | % Housing Units |
| Owner Occupied Housing Units | 5,823 | 84.7% |
| Renter-Occupied Housing Units | 1,055 | 15.3% |
| Total Occupied Housing Units | 6,878 | 100.0% |
Occupancy by Household Size in Fort Mohave
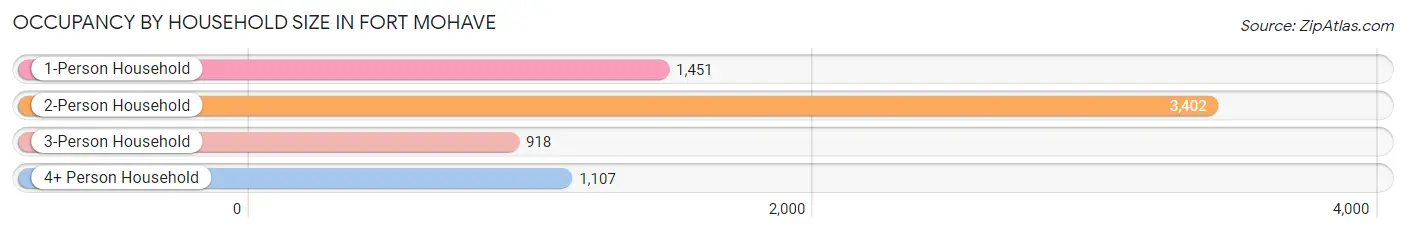
| Household Size | # Housing Units | % Housing Units |
| 1-Person Household | 1,451 | 21.1% |
| 2-Person Household | 3,402 | 49.5% |
| 3-Person Household | 918 | 13.4% |
| 4+ Person Household | 1,107 | 16.1% |
| Total Housing Units | 6,878 | 100.0% |
Occupancy by Ownership by Household Size in Fort Mohave
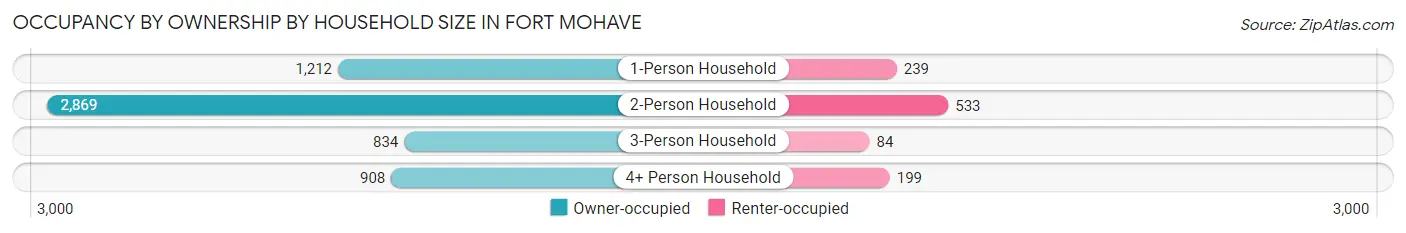
| Household Size | Owner-occupied | Renter-occupied |
| 1-Person Household | 1,212 (83.5%) | 239 (16.5%) |
| 2-Person Household | 2,869 (84.3%) | 533 (15.7%) |
| 3-Person Household | 834 (90.8%) | 84 (9.1%) |
| 4+ Person Household | 908 (82.0%) | 199 (18.0%) |
| Total Housing Units | 5,823 (84.7%) | 1,055 (15.3%) |
Occupancy by Educational Attainment in Fort Mohave
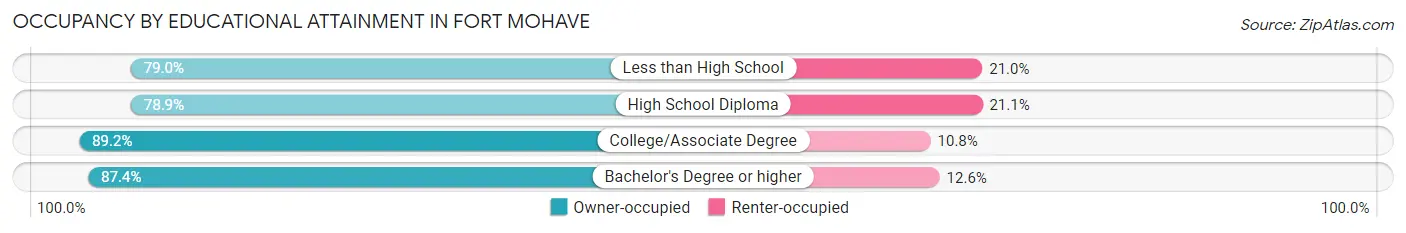
| Household Size | Owner-occupied | Renter-occupied |
| Less than High School | 563 (79.0%) | 150 (21.0%) |
| High School Diploma | 1,703 (78.9%) | 455 (21.1%) |
| College/Associate Degree | 2,703 (89.2%) | 327 (10.8%) |
| Bachelor's Degree or higher | 854 (87.4%) | 123 (12.6%) |
Occupancy by Age of Householder in Fort Mohave
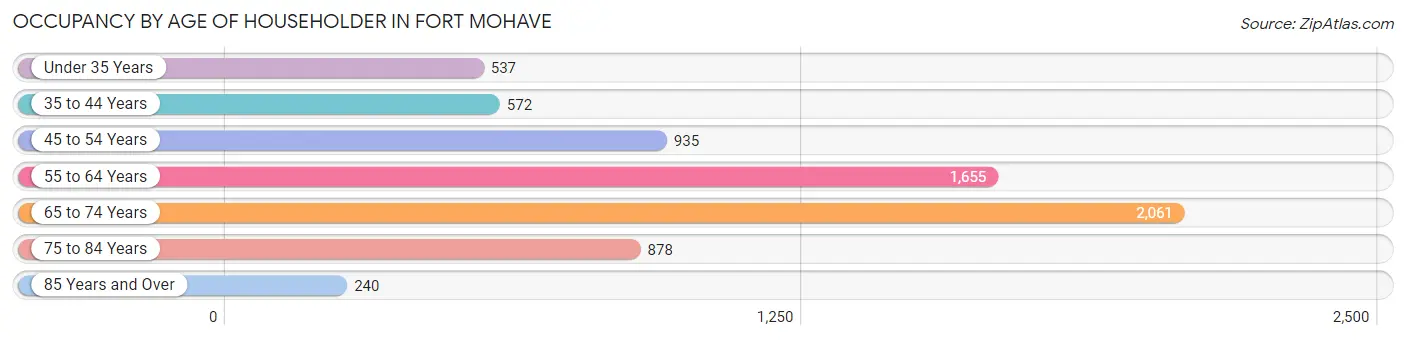
| Age Bracket | # Households | % Households |
| Under 35 Years | 537 | 7.8% |
| 35 to 44 Years | 572 | 8.3% |
| 45 to 54 Years | 935 | 13.6% |
| 55 to 64 Years | 1,655 | 24.1% |
| 65 to 74 Years | 2,061 | 30.0% |
| 75 to 84 Years | 878 | 12.8% |
| 85 Years and Over | 240 | 3.5% |
| Total | 6,878 | 100.0% |
Housing Finances in Fort Mohave
Median Income by Occupancy in Fort Mohave
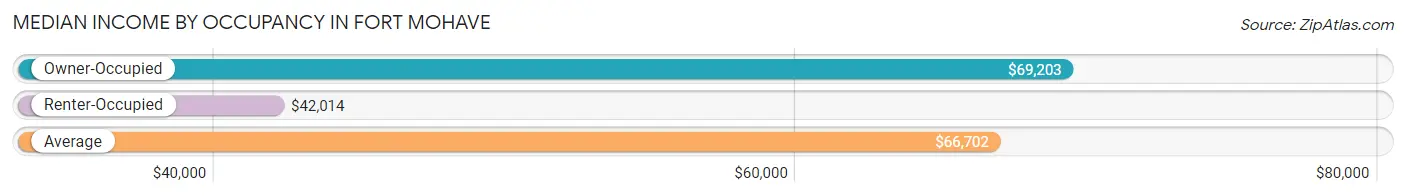
| Occupancy Type | # Households | Median Income |
| Owner-Occupied | 5,823 (84.7%) | $69,203 |
| Renter-Occupied | 1,055 (15.3%) | $42,014 |
| Average | 6,878 (100.0%) | $66,702 |
Occupancy by Householder Income Bracket in Fort Mohave
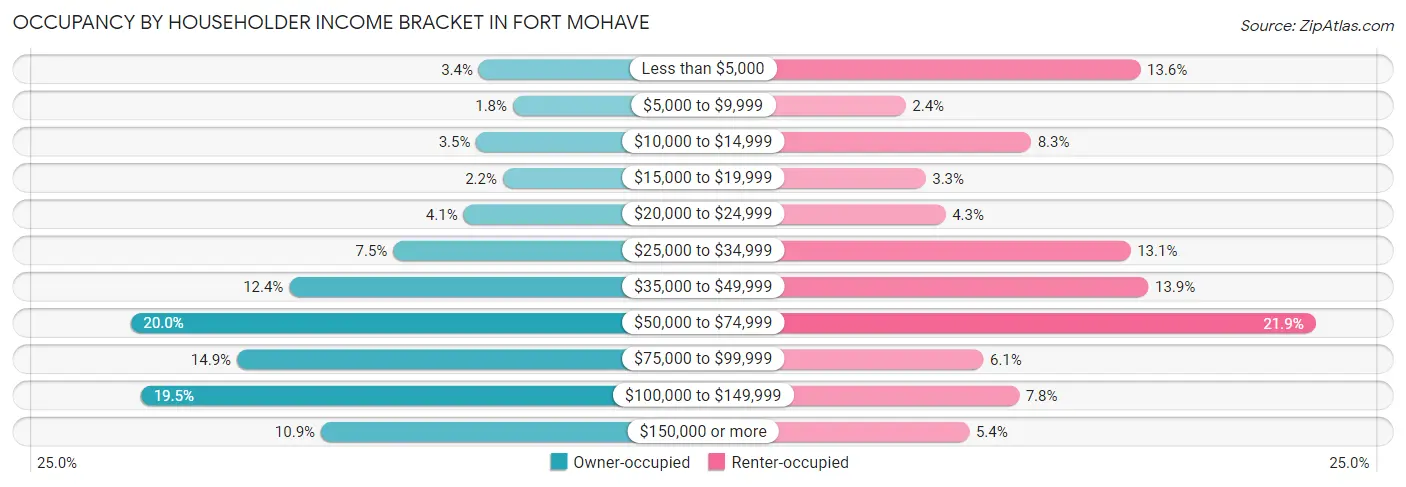
| Income Bracket | Owner-occupied | Renter-occupied |
| Less than $5,000 | 196 (3.4%) | 143 (13.6%) |
| $5,000 to $9,999 | 102 (1.8%) | 25 (2.4%) |
| $10,000 to $14,999 | 203 (3.5%) | 88 (8.3%) |
| $15,000 to $19,999 | 130 (2.2%) | 35 (3.3%) |
| $20,000 to $24,999 | 239 (4.1%) | 45 (4.3%) |
| $25,000 to $34,999 | 434 (7.4%) | 138 (13.1%) |
| $35,000 to $49,999 | 722 (12.4%) | 147 (13.9%) |
| $50,000 to $74,999 | 1,162 (20.0%) | 231 (21.9%) |
| $75,000 to $99,999 | 867 (14.9%) | 64 (6.1%) |
| $100,000 to $149,999 | 1,134 (19.5%) | 82 (7.8%) |
| $150,000 or more | 634 (10.9%) | 57 (5.4%) |
| Total | 5,823 (100.0%) | 1,055 (100.0%) |
Monthly Housing Cost Tiers in Fort Mohave
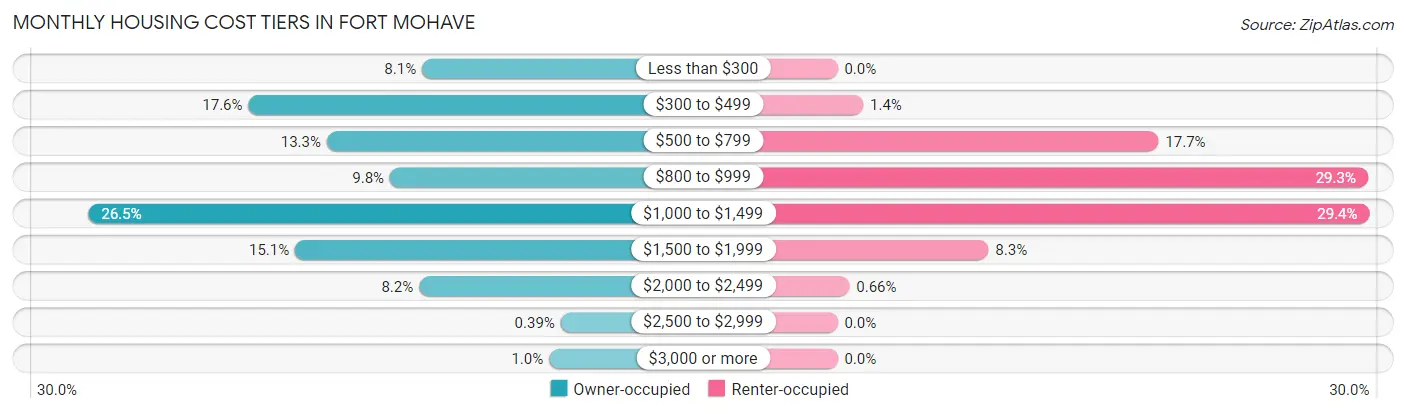
| Monthly Cost | Owner-occupied | Renter-occupied |
| Less than $300 | 469 (8.1%) | 0 (0.0%) |
| $300 to $499 | 1,027 (17.6%) | 15 (1.4%) |
| $500 to $799 | 775 (13.3%) | 187 (17.7%) |
| $800 to $999 | 572 (9.8%) | 309 (29.3%) |
| $1,000 to $1,499 | 1,542 (26.5%) | 310 (29.4%) |
| $1,500 to $1,999 | 877 (15.1%) | 88 (8.3%) |
| $2,000 to $2,499 | 478 (8.2%) | 7 (0.7%) |
| $2,500 to $2,999 | 23 (0.4%) | 0 (0.0%) |
| $3,000 or more | 60 (1.0%) | 0 (0.0%) |
| Total | 5,823 (100.0%) | 1,055 (100.0%) |
Physical Housing Characteristics in Fort Mohave
Housing Structures in Fort Mohave
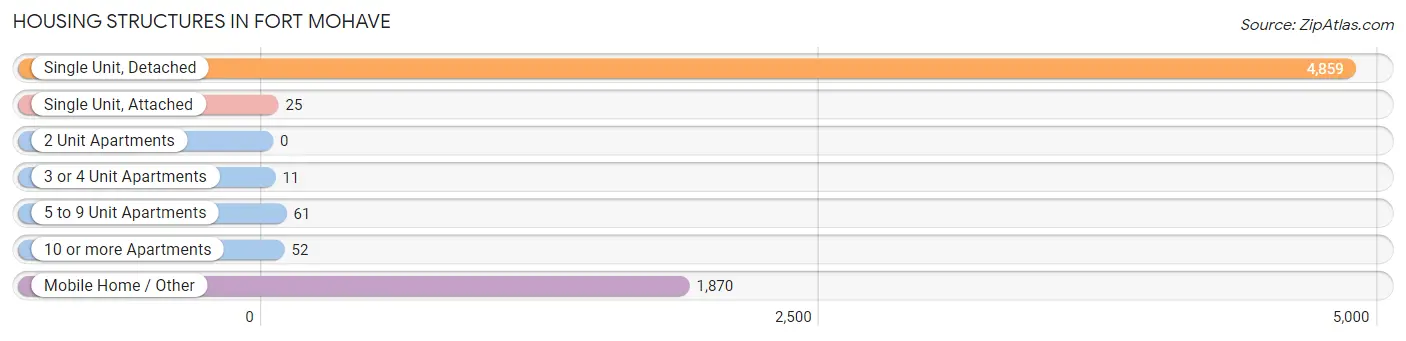
| Structure Type | # Housing Units | % Housing Units |
| Single Unit, Detached | 4,859 | 70.7% |
| Single Unit, Attached | 25 | 0.4% |
| 2 Unit Apartments | 0 | 0.0% |
| 3 or 4 Unit Apartments | 11 | 0.2% |
| 5 to 9 Unit Apartments | 61 | 0.9% |
| 10 or more Apartments | 52 | 0.8% |
| Mobile Home / Other | 1,870 | 27.2% |
| Total | 6,878 | 100.0% |
Housing Structures by Occupancy in Fort Mohave
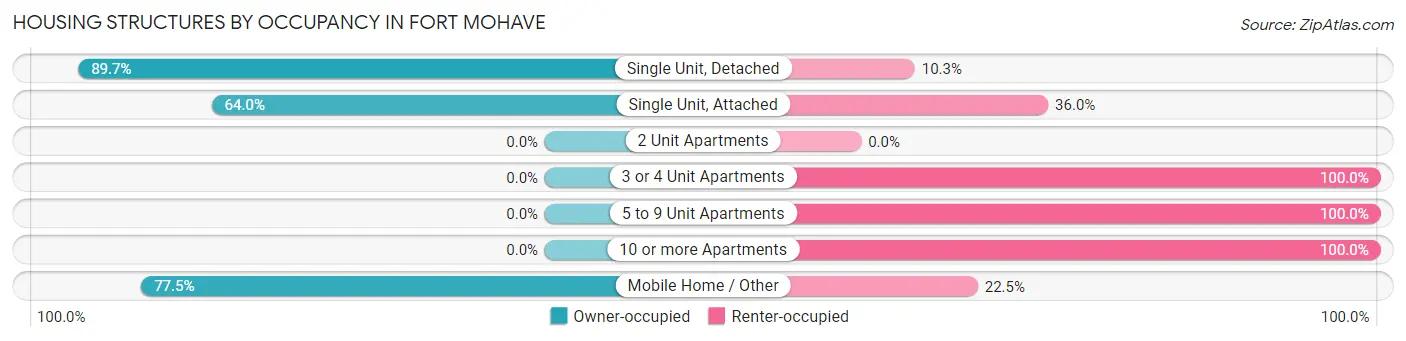
| Structure Type | Owner-occupied | Renter-occupied |
| Single Unit, Detached | 4,357 (89.7%) | 502 (10.3%) |
| Single Unit, Attached | 16 (64.0%) | 9 (36.0%) |
| 2 Unit Apartments | 0 (0.0%) | 0 (0.0%) |
| 3 or 4 Unit Apartments | 0 (0.0%) | 11 (100.0%) |
| 5 to 9 Unit Apartments | 0 (0.0%) | 61 (100.0%) |
| 10 or more Apartments | 0 (0.0%) | 52 (100.0%) |
| Mobile Home / Other | 1,450 (77.5%) | 420 (22.5%) |
| Total | 5,823 (84.7%) | 1,055 (15.3%) |
Housing Structures by Number of Rooms in Fort Mohave
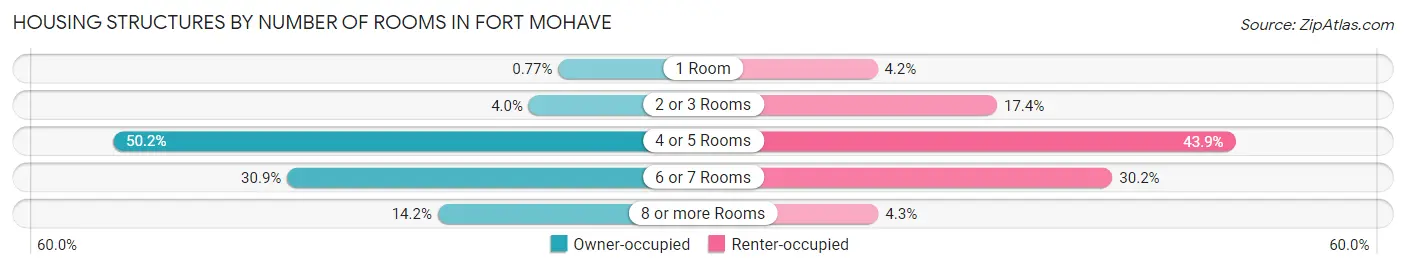
| Number of Rooms | Owner-occupied | Renter-occupied |
| 1 Room | 45 (0.8%) | 44 (4.2%) |
| 2 or 3 Rooms | 235 (4.0%) | 184 (17.4%) |
| 4 or 5 Rooms | 2,922 (50.2%) | 463 (43.9%) |
| 6 or 7 Rooms | 1,797 (30.9%) | 319 (30.2%) |
| 8 or more Rooms | 824 (14.1%) | 45 (4.3%) |
| Total | 5,823 (100.0%) | 1,055 (100.0%) |
Housing Structure by Heating Type in Fort Mohave
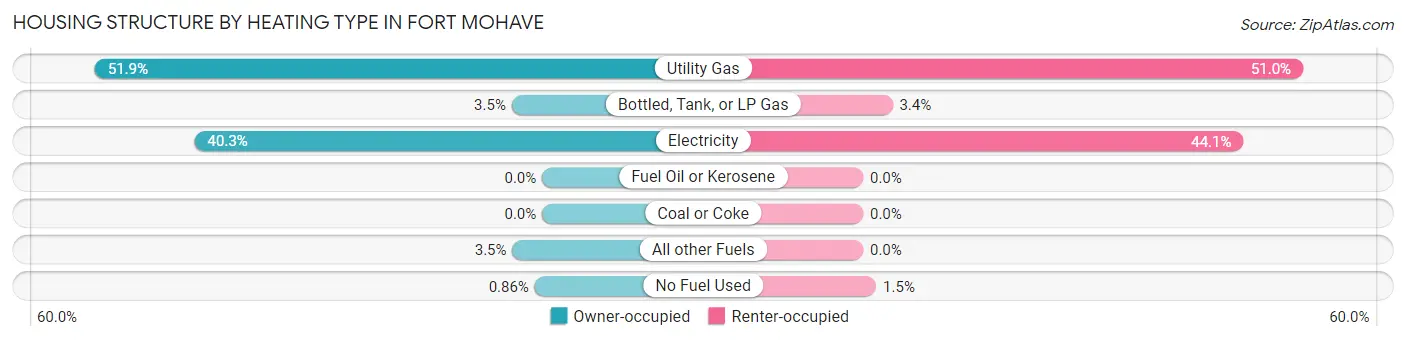
| Heating Type | Owner-occupied | Renter-occupied |
| Utility Gas | 3,020 (51.9%) | 538 (51.0%) |
| Bottled, Tank, or LP Gas | 205 (3.5%) | 36 (3.4%) |
| Electricity | 2,347 (40.3%) | 465 (44.1%) |
| Fuel Oil or Kerosene | 0 (0.0%) | 0 (0.0%) |
| Coal or Coke | 0 (0.0%) | 0 (0.0%) |
| All other Fuels | 201 (3.5%) | 0 (0.0%) |
| No Fuel Used | 50 (0.9%) | 16 (1.5%) |
| Total | 5,823 (100.0%) | 1,055 (100.0%) |
Household Vehicle Usage in Fort Mohave
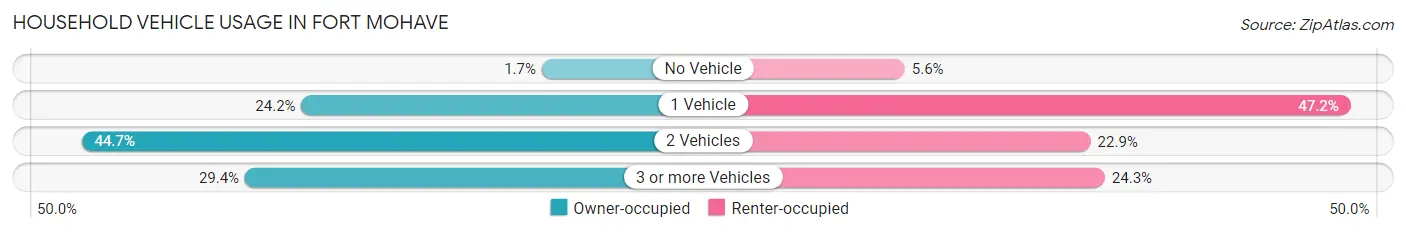
| Vehicles per Household | Owner-occupied | Renter-occupied |
| No Vehicle | 100 (1.7%) | 59 (5.6%) |
| 1 Vehicle | 1,407 (24.2%) | 498 (47.2%) |
| 2 Vehicles | 2,602 (44.7%) | 242 (22.9%) |
| 3 or more Vehicles | 1,714 (29.4%) | 256 (24.3%) |
| Total | 5,823 (100.0%) | 1,055 (100.0%) |
Real Estate & Mortgages in Fort Mohave
Real Estate and Mortgage Overview in Fort Mohave
| Characteristic | Without Mortgage | With Mortgage |
| Housing Units | 2,004 | 3,819 |
| Median Property Value | $213,300 | $267,800 |
| Median Household Income | $45,810 | $535 |
| Monthly Housing Costs | $418 | $60 |
| Real Estate Taxes | $1,151 | $23 |
Property Value by Mortgage Status in Fort Mohave
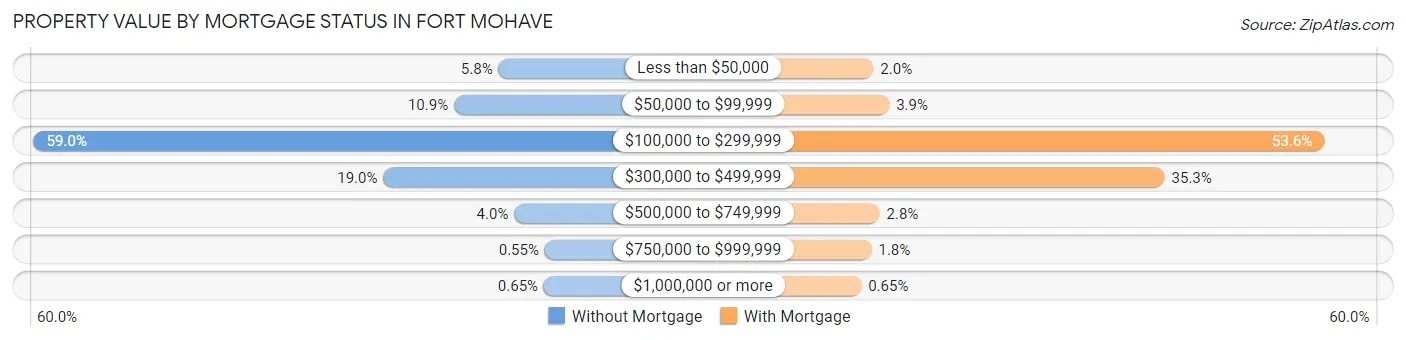
| Property Value | Without Mortgage | With Mortgage |
| Less than $50,000 | 117 (5.8%) | 78 (2.0%) |
| $50,000 to $99,999 | 219 (10.9%) | 147 (3.8%) |
| $100,000 to $299,999 | 1,182 (59.0%) | 2,045 (53.5%) |
| $300,000 to $499,999 | 381 (19.0%) | 1,349 (35.3%) |
| $500,000 to $749,999 | 81 (4.0%) | 105 (2.8%) |
| $750,000 to $999,999 | 11 (0.5%) | 70 (1.8%) |
| $1,000,000 or more | 13 (0.6%) | 25 (0.6%) |
| Total | 2,004 (100.0%) | 3,819 (100.0%) |
Household Income by Mortgage Status in Fort Mohave
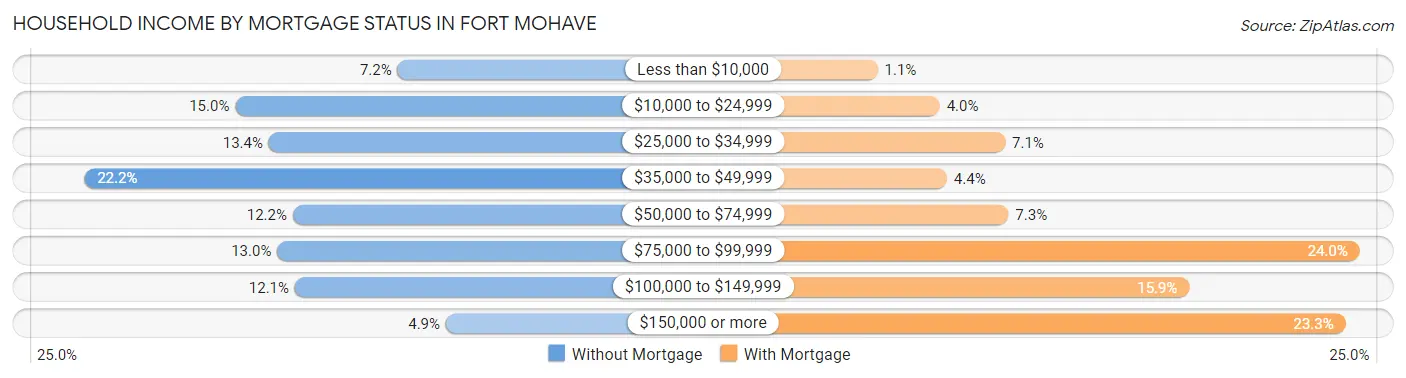
| Household Income | Without Mortgage | With Mortgage |
| Less than $10,000 | 145 (7.2%) | 40 (1.1%) |
| $10,000 to $24,999 | 300 (15.0%) | 153 (4.0%) |
| $25,000 to $34,999 | 268 (13.4%) | 272 (7.1%) |
| $35,000 to $49,999 | 444 (22.2%) | 166 (4.3%) |
| $50,000 to $74,999 | 245 (12.2%) | 278 (7.3%) |
| $75,000 to $99,999 | 260 (13.0%) | 917 (24.0%) |
| $100,000 to $149,999 | 243 (12.1%) | 607 (15.9%) |
| $150,000 or more | 99 (4.9%) | 891 (23.3%) |
| Total | 2,004 (100.0%) | 3,819 (100.0%) |
Property Value to Household Income Ratio in Fort Mohave
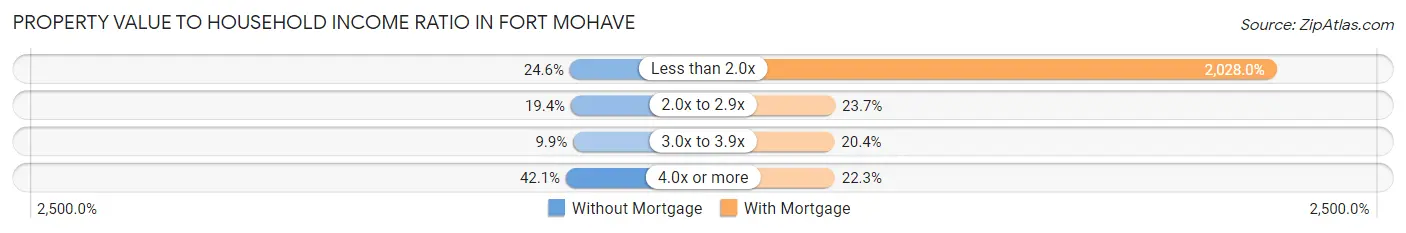
| Value-to-Income Ratio | Without Mortgage | With Mortgage |
| Less than 2.0x | 492 (24.5%) | 77,450 (2,028.0%) |
| 2.0x to 2.9x | 388 (19.4%) | 906 (23.7%) |
| 3.0x to 3.9x | 198 (9.9%) | 780 (20.4%) |
| 4.0x or more | 843 (42.1%) | 850 (22.3%) |
| Total | 2,004 (100.0%) | 3,819 (100.0%) |
Real Estate Taxes by Mortgage Status in Fort Mohave
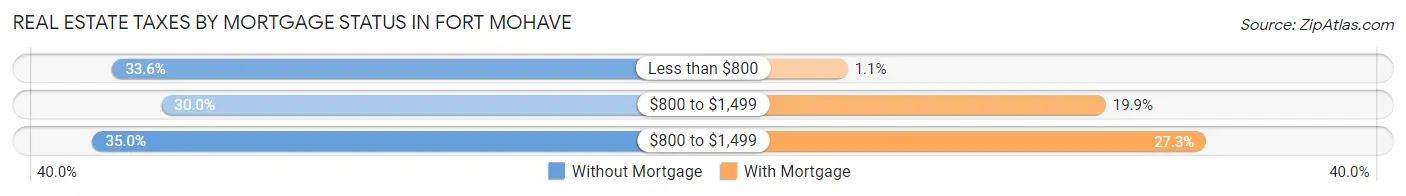
| Property Taxes | Without Mortgage | With Mortgage |
| Less than $800 | 673 (33.6%) | 41 (1.1%) |
| $800 to $1,499 | 601 (30.0%) | 761 (19.9%) |
| $800 to $1,499 | 702 (35.0%) | 1,041 (27.3%) |
| Total | 2,004 (100.0%) | 3,819 (100.0%) |
Health & Disability in Fort Mohave
Health Insurance Coverage by Age in Fort Mohave
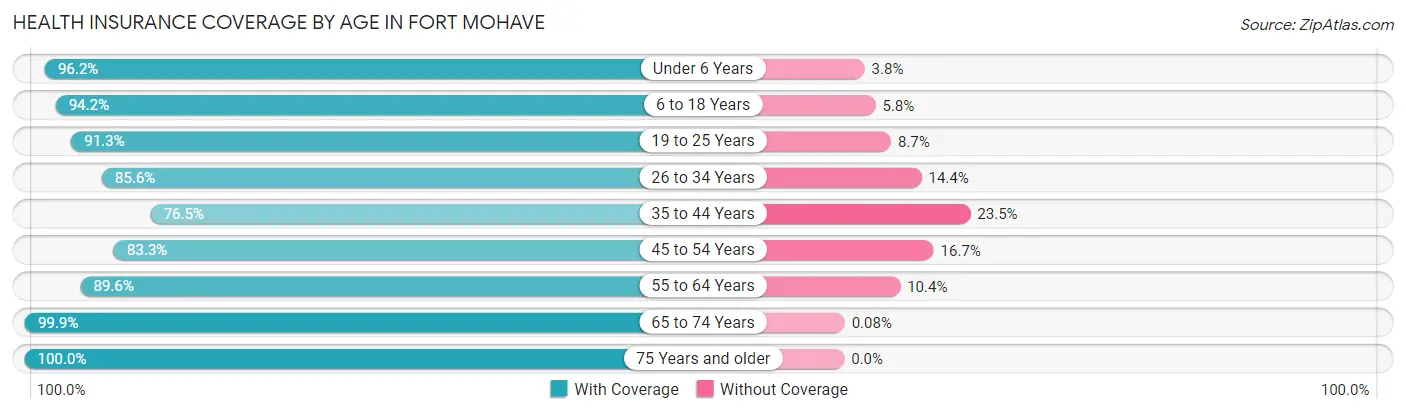
| Age Bracket | With Coverage | Without Coverage |
| Under 6 Years | 532 (96.2%) | 21 (3.8%) |
| 6 to 18 Years | 1,671 (94.2%) | 103 (5.8%) |
| 19 to 25 Years | 723 (91.3%) | 69 (8.7%) |
| 26 to 34 Years | 825 (85.6%) | 139 (14.4%) |
| 35 to 44 Years | 953 (76.5%) | 293 (23.5%) |
| 45 to 54 Years | 1,486 (83.3%) | 297 (16.7%) |
| 55 to 64 Years | 2,920 (89.6%) | 340 (10.4%) |
| 65 to 74 Years | 3,647 (99.9%) | 3 (0.1%) |
| 75 Years and older | 2,005 (100.0%) | 0 (0.0%) |
| Total | 14,762 (92.1%) | 1,265 (7.9%) |
Health Insurance Coverage by Citizenship Status in Fort Mohave
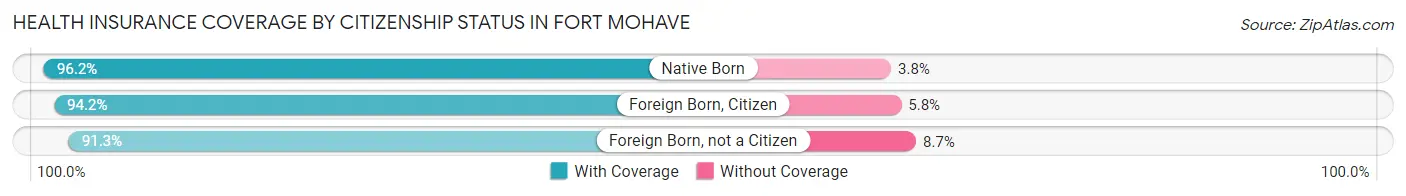
| Citizenship Status | With Coverage | Without Coverage |
| Native Born | 532 (96.2%) | 21 (3.8%) |
| Foreign Born, Citizen | 1,671 (94.2%) | 103 (5.8%) |
| Foreign Born, not a Citizen | 723 (91.3%) | 69 (8.7%) |
Health Insurance Coverage by Household Income in Fort Mohave
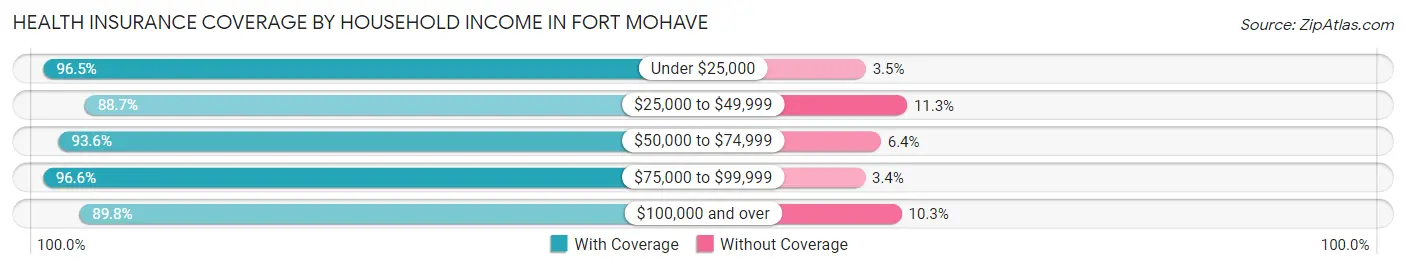
| Household Income | With Coverage | Without Coverage |
| Under $25,000 | 1,990 (96.5%) | 73 (3.5%) |
| $25,000 to $49,999 | 2,559 (88.7%) | 325 (11.3%) |
| $50,000 to $74,999 | 2,808 (93.6%) | 191 (6.4%) |
| $75,000 to $99,999 | 2,149 (96.6%) | 76 (3.4%) |
| $100,000 and over | 5,256 (89.7%) | 600 (10.2%) |
Public vs Private Health Insurance Coverage by Age in Fort Mohave
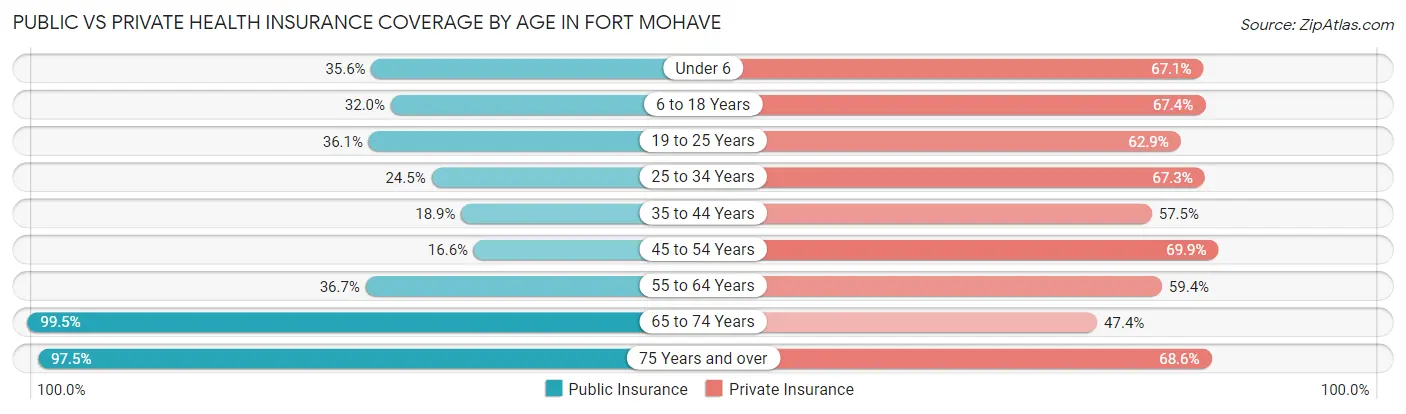
| Age Bracket | Public Insurance | Private Insurance |
| Under 6 | 197 (35.6%) | 371 (67.1%) |
| 6 to 18 Years | 568 (32.0%) | 1,196 (67.4%) |
| 19 to 25 Years | 286 (36.1%) | 498 (62.9%) |
| 25 to 34 Years | 236 (24.5%) | 649 (67.3%) |
| 35 to 44 Years | 236 (18.9%) | 717 (57.5%) |
| 45 to 54 Years | 296 (16.6%) | 1,246 (69.9%) |
| 55 to 64 Years | 1,196 (36.7%) | 1,937 (59.4%) |
| 65 to 74 Years | 3,631 (99.5%) | 1,730 (47.4%) |
| 75 Years and over | 1,955 (97.5%) | 1,375 (68.6%) |
| Total | 8,601 (53.7%) | 9,719 (60.6%) |
Disability Status by Sex by Age in Fort Mohave
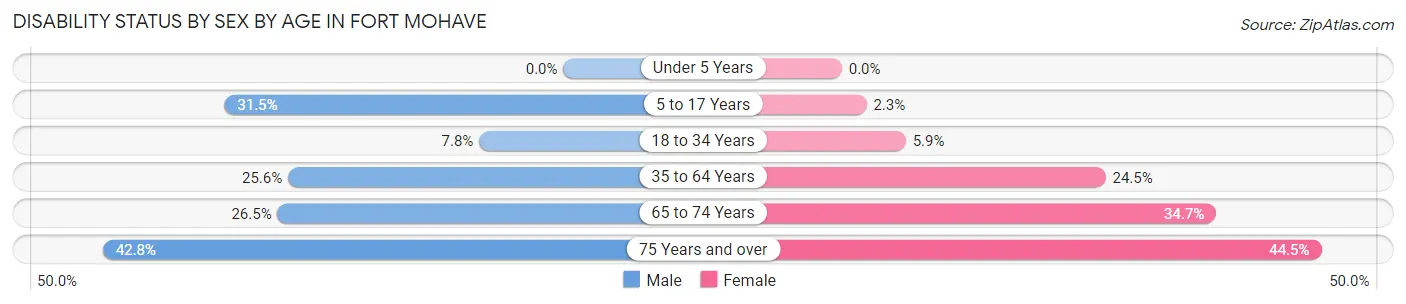
| Age Bracket | Male | Female |
| Under 5 Years | 0 (0.0%) | 0 (0.0%) |
| 5 to 17 Years | 324 (31.5%) | 19 (2.3%) |
| 18 to 34 Years | 72 (7.8%) | 54 (5.9%) |
| 35 to 64 Years | 819 (25.6%) | 755 (24.5%) |
| 65 to 74 Years | 465 (26.5%) | 659 (34.7%) |
| 75 Years and over | 395 (42.7%) | 481 (44.5%) |
Disability Class by Sex by Age in Fort Mohave
Disability Class: Hearing Difficulty
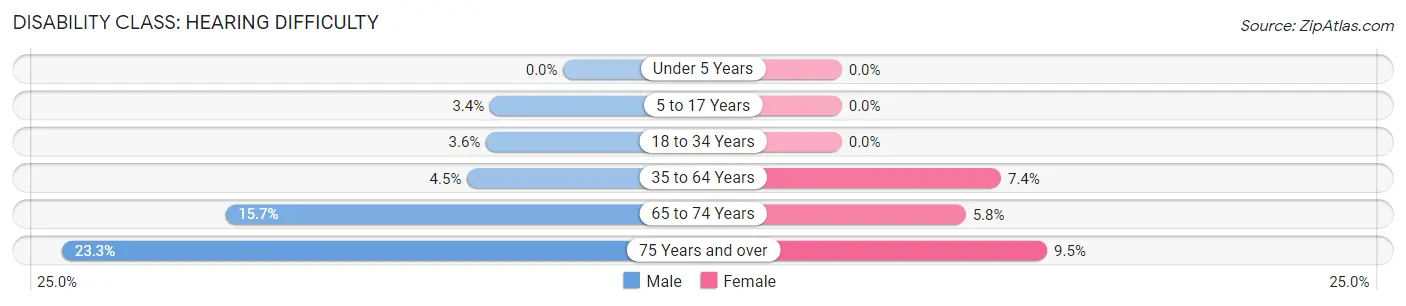
| Age Bracket | Male | Female |
| Under 5 Years | 0 (0.0%) | 0 (0.0%) |
| 5 to 17 Years | 35 (3.4%) | 0 (0.0%) |
| 18 to 34 Years | 33 (3.6%) | 0 (0.0%) |
| 35 to 64 Years | 143 (4.5%) | 228 (7.4%) |
| 65 to 74 Years | 275 (15.7%) | 109 (5.8%) |
| 75 Years and over | 215 (23.3%) | 103 (9.5%) |
Disability Class: Vision Difficulty
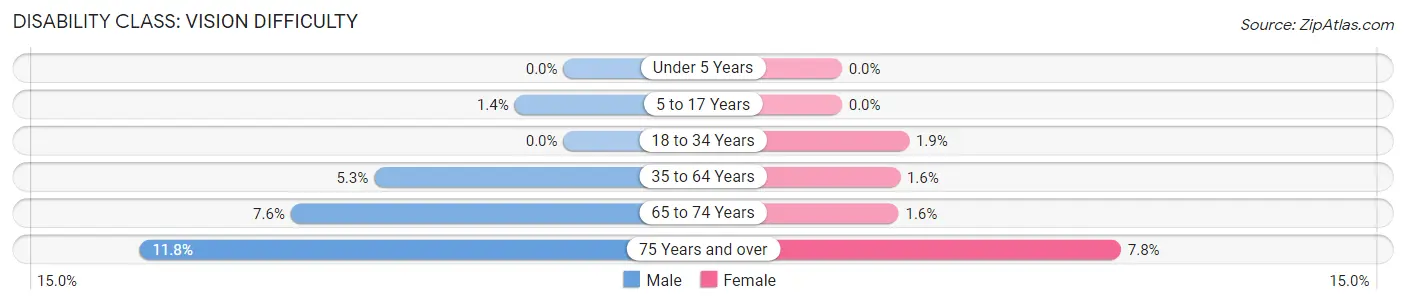
| Age Bracket | Male | Female |
| Under 5 Years | 0 (0.0%) | 0 (0.0%) |
| 5 to 17 Years | 14 (1.4%) | 0 (0.0%) |
| 18 to 34 Years | 0 (0.0%) | 17 (1.9%) |
| 35 to 64 Years | 169 (5.3%) | 50 (1.6%) |
| 65 to 74 Years | 133 (7.6%) | 30 (1.6%) |
| 75 Years and over | 109 (11.8%) | 84 (7.8%) |
Disability Class: Cognitive Difficulty
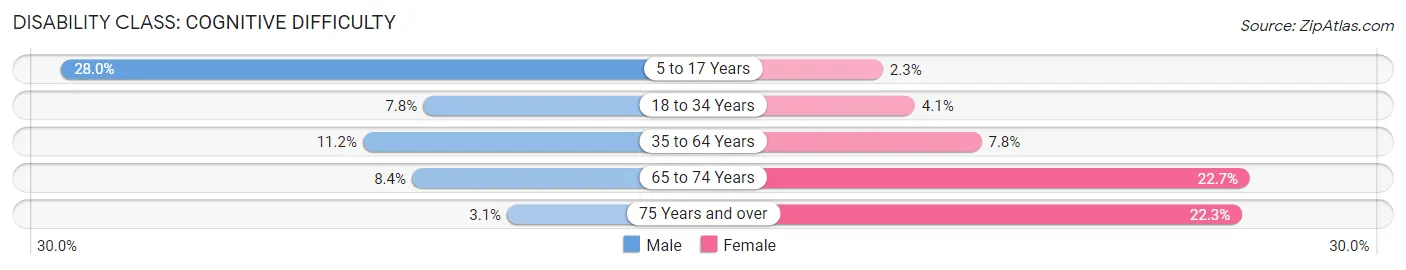
| Age Bracket | Male | Female |
| 5 to 17 Years | 288 (28.0%) | 19 (2.3%) |
| 18 to 34 Years | 72 (7.8%) | 37 (4.1%) |
| 35 to 64 Years | 358 (11.2%) | 240 (7.8%) |
| 65 to 74 Years | 148 (8.4%) | 431 (22.7%) |
| 75 Years and over | 29 (3.1%) | 241 (22.3%) |
Disability Class: Ambulatory Difficulty
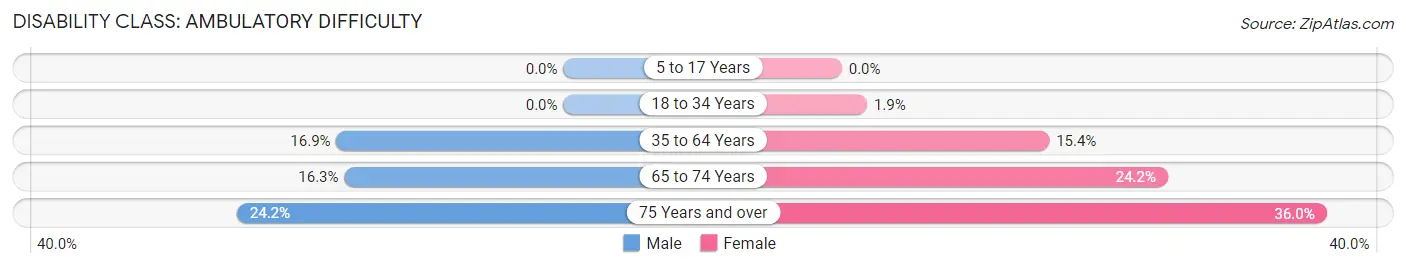
| Age Bracket | Male | Female |
| 5 to 17 Years | 0 (0.0%) | 0 (0.0%) |
| 18 to 34 Years | 0 (0.0%) | 17 (1.9%) |
| 35 to 64 Years | 540 (16.9%) | 475 (15.4%) |
| 65 to 74 Years | 285 (16.3%) | 459 (24.2%) |
| 75 Years and over | 224 (24.2%) | 389 (36.0%) |
Disability Class: Self-Care Difficulty
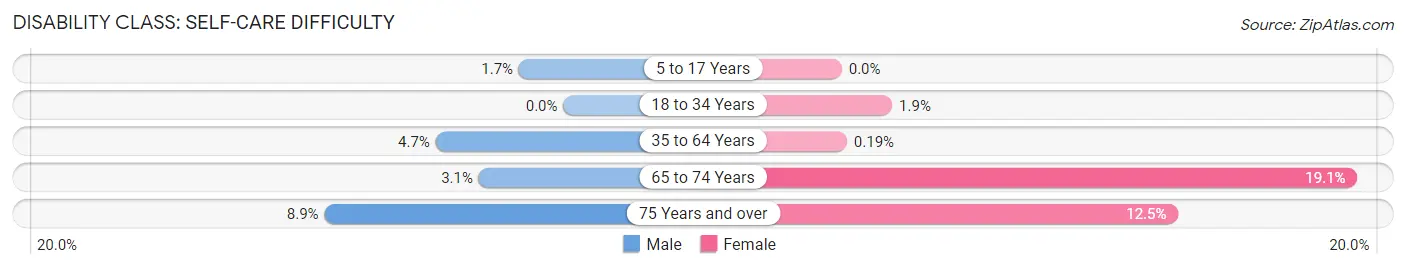
| Age Bracket | Male | Female |
| 5 to 17 Years | 17 (1.7%) | 0 (0.0%) |
| 18 to 34 Years | 0 (0.0%) | 17 (1.9%) |
| 35 to 64 Years | 152 (4.7%) | 6 (0.2%) |
| 65 to 74 Years | 55 (3.1%) | 363 (19.1%) |
| 75 Years and over | 82 (8.9%) | 135 (12.5%) |
Technology Access in Fort Mohave
Computing Device Access in Fort Mohave
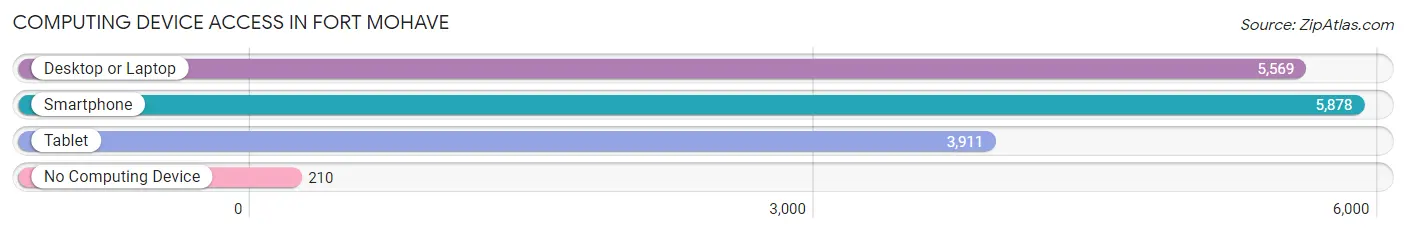
| Device Type | # Households | % Households |
| Desktop or Laptop | 5,569 | 81.0% |
| Smartphone | 5,878 | 85.5% |
| Tablet | 3,911 | 56.9% |
| No Computing Device | 210 | 3.0% |
| Total | 6,878 | 100.0% |
Internet Access in Fort Mohave
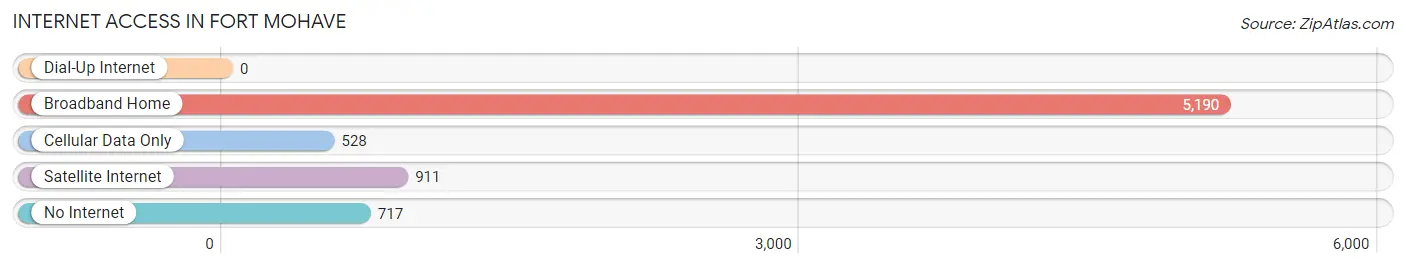
| Internet Type | # Households | % Households |
| Dial-Up Internet | 0 | 0.0% |
| Broadband Home | 5,190 | 75.5% |
| Cellular Data Only | 528 | 7.7% |
| Satellite Internet | 911 | 13.3% |
| No Internet | 717 | 10.4% |
| Total | 6,878 | 100.0% |
Fort Mohave Summary
Fort Mohave is a census-designated place (CDP) in Mohave County, Arizona, United States. The population was 14,364 at the 2010 census. It is located on the southern side of the Colorado River near the states of Nevada and California.
History
Fort Mohave was originally established as a military outpost in 1859 by the United States Army. The fort was named after the Mohave tribe of Native Americans who lived in the area. The fort was used to protect settlers from the Native Americans and to protect the area from the encroachment of other settlers. The fort was abandoned in 1868 and the land was sold to private owners.
In the early 1900s, the area was used for farming and ranching. The town of Fort Mohave was established in the 1930s and grew rapidly due to the construction of Davis Dam in the 1950s. The dam created Lake Mohave, which provided irrigation water for the area.
Geography
Fort Mohave is located in the Mojave Desert at the intersection of Arizona State Route 95 and Interstate 40. It is situated on the southern side of the Colorado River, near the states of Nevada and California. The CDP has a total area of 16.2 square miles, of which 15.9 square miles is land and 0.3 square miles is water.
Economy
The economy of Fort Mohave is largely based on tourism and agriculture. The area is home to several casinos, golf courses, and other tourist attractions. Agriculture is also an important part of the local economy, with cotton, alfalfa, and other crops being grown in the area.
Demographics
As of the 2010 census, there were 14,364 people, 5,845 households, and 4,072 families residing in the CDP. The population density was 890.3 people per square mile. The racial makeup of the CDP was 75.3% White, 1.3% African American, 1.7% Native American, 0.7% Asian, 0.1% Pacific Islander, 17.3% from other races, and 3.9% from two or more races. Hispanic or Latino of any race were 33.2% of the population.
The median income for a household in the CDP was $35,938, and the median income for a family was $41,944. Males had a median income of $30,917 versus $22,917 for females. The per capita income for the CDP was $17,845. About 11.3% of families and 14.7% of the population were below the poverty line, including 19.2% of those under age 18 and 8.2% of those age 65 or over.
Common Questions
What is Per Capita Income in Fort Mohave?
Per Capita income in Fort Mohave is $34,299.
What is the Median Family Income in Fort Mohave?
Median Family Income in Fort Mohave is $72,106.
What is the Median Household income in Fort Mohave?
Median Household Income in Fort Mohave is $66,702.
What is Income or Wage Gap in Fort Mohave?
Income or Wage Gap in Fort Mohave is 2.5%.
Women in Fort Mohave earn 97.5 cents for every dollar earned by a man.
What is Family Income Deficit in Fort Mohave?
Family Income Deficit in Fort Mohave is $13,360.
Families that are below poverty line in Fort Mohave earn $13,360 less on average than the poverty threshold level.
What is Inequality or Gini Index in Fort Mohave?
Inequality or Gini Index in Fort Mohave is 0.44.
What is the Total Population of Fort Mohave?
Total Population of Fort Mohave is 16,038.
What is the Total Male Population of Fort Mohave?
Total Male Population of Fort Mohave is 8,005.
What is the Total Female Population of Fort Mohave?
Total Female Population of Fort Mohave is 8,033.
What is the Ratio of Males per 100 Females in Fort Mohave?
There are 99.65 Males per 100 Females in Fort Mohave.
What is the Ratio of Females per 100 Males in Fort Mohave?
There are 100.35 Females per 100 Males in Fort Mohave.
What is the Median Population Age in Fort Mohave?
Median Population Age in Fort Mohave is 58.4 Years.
What is the Average Family Size in Fort Mohave
Average Family Size in Fort Mohave is 2.6 People.
What is the Average Household Size in Fort Mohave
Average Household Size in Fort Mohave is 2.3 People.
How Large is the Labor Force in Fort Mohave?
There are 6,147 People in the Labor Forcein in Fort Mohave.
What is the Percentage of People in the Labor Force in Fort Mohave?
43.6% of People are in the Labor Force in Fort Mohave.
What is the Unemployment Rate in Fort Mohave?
Unemployment Rate in Fort Mohave is 9.7%.