Kemah, TX Map & Demographics
Kemah Map
Kemah Overview
$42,087
PER CAPITA INCOME
$94,792
AVG FAMILY INCOME
$93,021
AVG HOUSEHOLD INCOME
30.7%
WAGE / INCOME GAP [ % ]
69.3¢/ $1
WAGE / INCOME GAP [ $ ]
$8,573
FAMILY INCOME DEFICIT
0.37
INEQUALITY / GINI INDEX
1,945
TOTAL POPULATION
986
MALE POPULATION
959
FEMALE POPULATION
102.82
MALES / 100 FEMALES
97.26
FEMALES / 100 MALES
41.5
MEDIAN AGE
2.9
AVG FAMILY SIZE
2.5
AVG HOUSEHOLD SIZE
1,104
LABOR FORCE [ PEOPLE ]
70.2%
PERCENT IN LABOR FORCE
6.1%
UNEMPLOYMENT RATE
Kemah Zip Codes
Income in Kemah
Income Overview in Kemah
Per Capita Income in Kemah is $42,087, while median incomes of families and households are $94,792 and $93,021 respectively.
| Characteristic | Number | Measure |
| Per Capita Income | 1,945 | $42,087 |
| Median Family Income | 535 | $94,792 |
| Mean Family Income | 535 | $112,827 |
| Median Household Income | 770 | $93,021 |
| Mean Household Income | 770 | $108,816 |
| Income Deficit | 535 | $8,573 |
| Wage / Income Gap (%) | 1,945 | 30.65% |
| Wage / Income Gap ($) | 1,945 | 69.35¢ per $1 |
| Gini / Inequality Index | 1,945 | 0.37 |
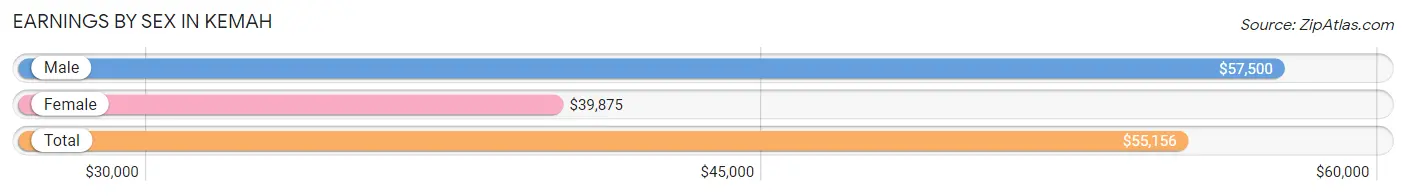
Earnings by Sex in Kemah
Average Earnings in Kemah are $55,156, $57,500 for men and $39,875 for women, a difference of 30.6%.
| Sex | Number | Average Earnings |
| Male | 624 (54.8%) | $57,500 |
| Female | 515 (45.2%) | $39,875 |
| Total | 1,139 (100.0%) | $55,156 |
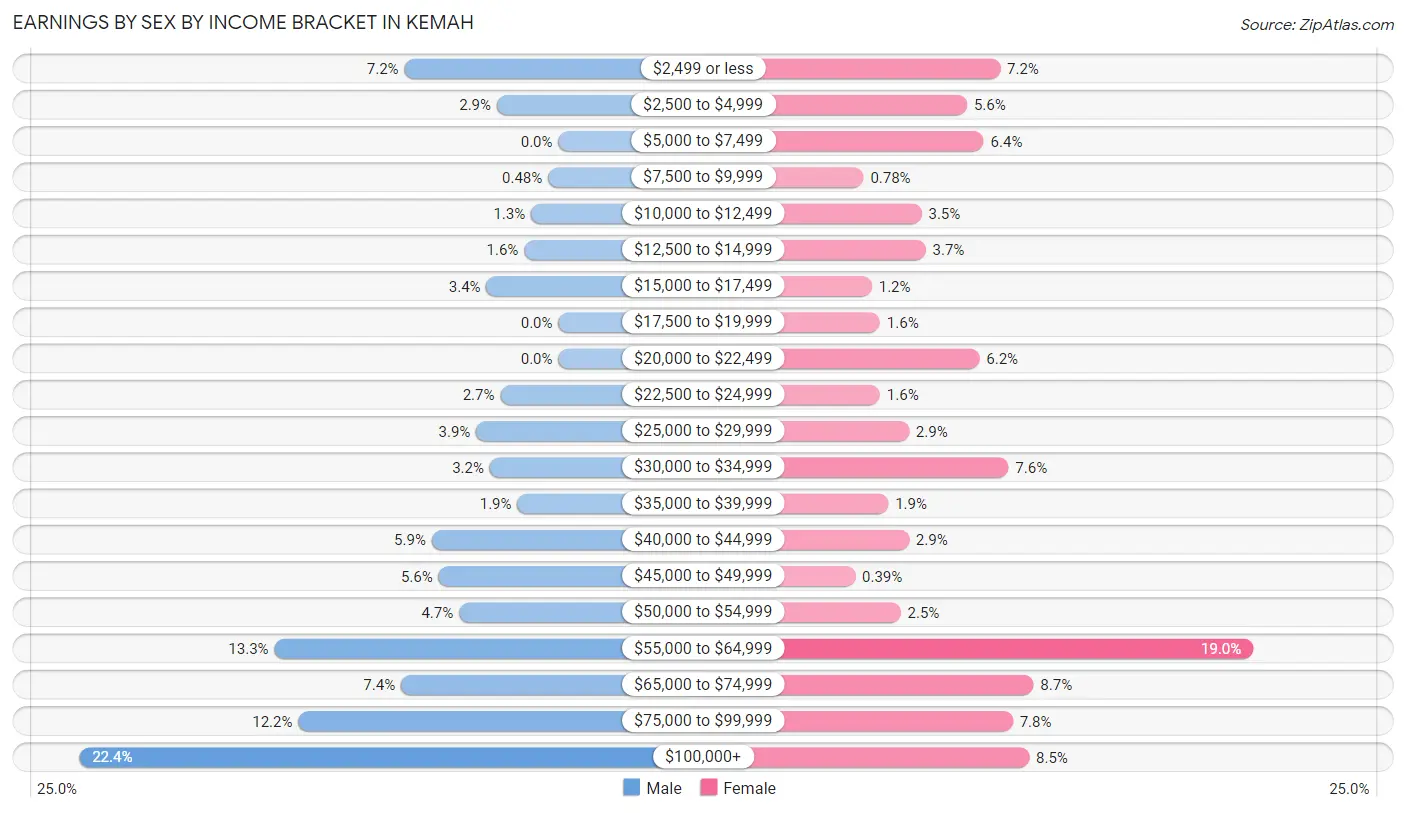
Earnings by Sex by Income Bracket in Kemah
The most common earnings brackets in Kemah are $100,000+ for men (140 | 22.4%) and $55,000 to $64,999 for women (98 | 19.0%).
| Income | Male | Female |
| $2,499 or less | 45 (7.2%) | 37 (7.2%) |
| $2,500 to $4,999 | 18 (2.9%) | 29 (5.6%) |
| $5,000 to $7,499 | 0 (0.0%) | 33 (6.4%) |
| $7,500 to $9,999 | 3 (0.5%) | 4 (0.8%) |
| $10,000 to $12,499 | 8 (1.3%) | 18 (3.5%) |
| $12,500 to $14,999 | 10 (1.6%) | 19 (3.7%) |
| $15,000 to $17,499 | 21 (3.4%) | 6 (1.2%) |
| $17,500 to $19,999 | 0 (0.0%) | 8 (1.5%) |
| $20,000 to $22,499 | 0 (0.0%) | 32 (6.2%) |
| $22,500 to $24,999 | 17 (2.7%) | 8 (1.5%) |
| $25,000 to $29,999 | 24 (3.8%) | 15 (2.9%) |
| $30,000 to $34,999 | 20 (3.2%) | 39 (7.6%) |
| $35,000 to $39,999 | 12 (1.9%) | 10 (1.9%) |
| $40,000 to $44,999 | 37 (5.9%) | 15 (2.9%) |
| $45,000 to $49,999 | 35 (5.6%) | 2 (0.4%) |
| $50,000 to $54,999 | 29 (4.6%) | 13 (2.5%) |
| $55,000 to $64,999 | 83 (13.3%) | 98 (19.0%) |
| $65,000 to $74,999 | 46 (7.4%) | 45 (8.7%) |
| $75,000 to $99,999 | 76 (12.2%) | 40 (7.8%) |
| $100,000+ | 140 (22.4%) | 44 (8.5%) |
| Total | 624 (100.0%) | 515 (100.0%) |
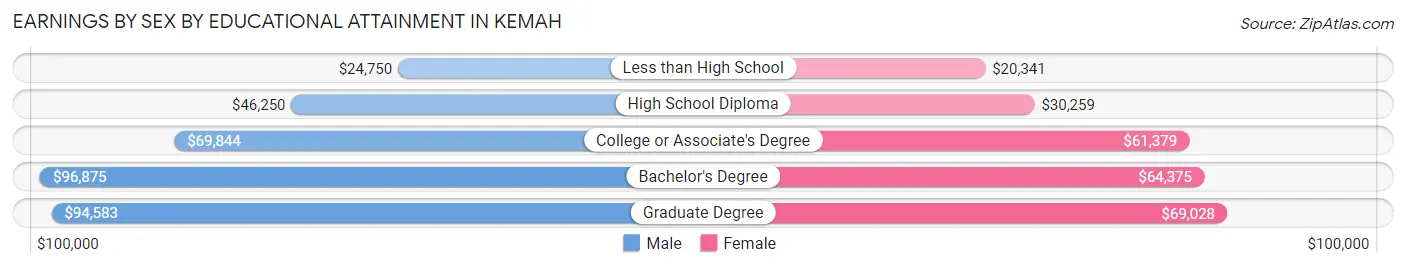
Earnings by Sex by Educational Attainment in Kemah
Average earnings in Kemah are $59,390 for men and $58,618 for women, a difference of 1.3%. Men with an educational attainment of bachelor's degree enjoy the highest average annual earnings of $96,875, while those with less than high school education earn the least with $24,750. Women with an educational attainment of graduate degree earn the most with the average annual earnings of $69,028, while those with less than high school education have the smallest earnings of $20,341.
| Educational Attainment | Male Income | Female Income |
| Less than High School | $24,750 | $20,341 |
| High School Diploma | $46,250 | $30,259 |
| College or Associate's Degree | $69,844 | $61,379 |
| Bachelor's Degree | $96,875 | $64,375 |
| Graduate Degree | $94,583 | $69,028 |
| Total | $59,390 | $58,618 |
Family Income in Kemah
Family Income Brackets in Kemah
According to the Kemah family income data, there are 110 families falling into the $100,000 to $149,999 income range, which is the most common income bracket and makes up 20.6% of all families. Conversely, the less than $10,000 income bracket is the least frequent group with only 17 families (3.2%) belonging to this category.
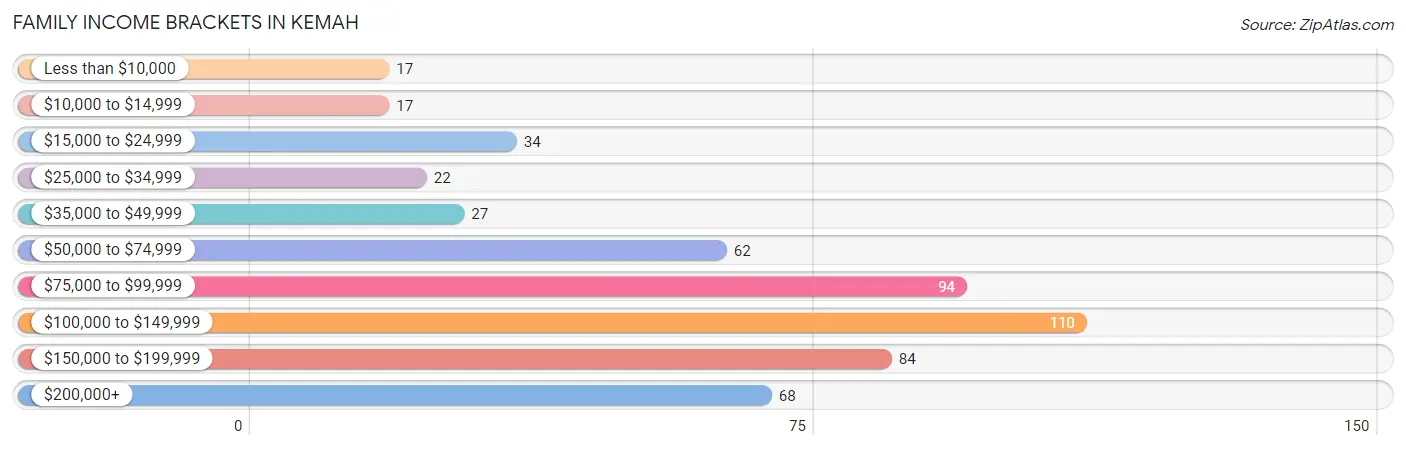
| Income Bracket | # Families | % Families |
| Less than $10,000 | 17 | 3.2% |
| $10,000 to $14,999 | 17 | 3.2% |
| $15,000 to $24,999 | 34 | 6.4% |
| $25,000 to $34,999 | 22 | 4.1% |
| $35,000 to $49,999 | 27 | 5.0% |
| $50,000 to $74,999 | 62 | 11.6% |
| $75,000 to $99,999 | 94 | 17.6% |
| $100,000 to $149,999 | 110 | 20.6% |
| $150,000 to $199,999 | 84 | 15.7% |
| $200,000+ | 68 | 12.7% |
Family Income by Famaliy Size in Kemah
5-person families (23 | 4.3%) account for the highest median family income in Kemah with $158,375 per family, while 2-person families (248 | 46.4%) have the highest median income of $47,062 per family member.
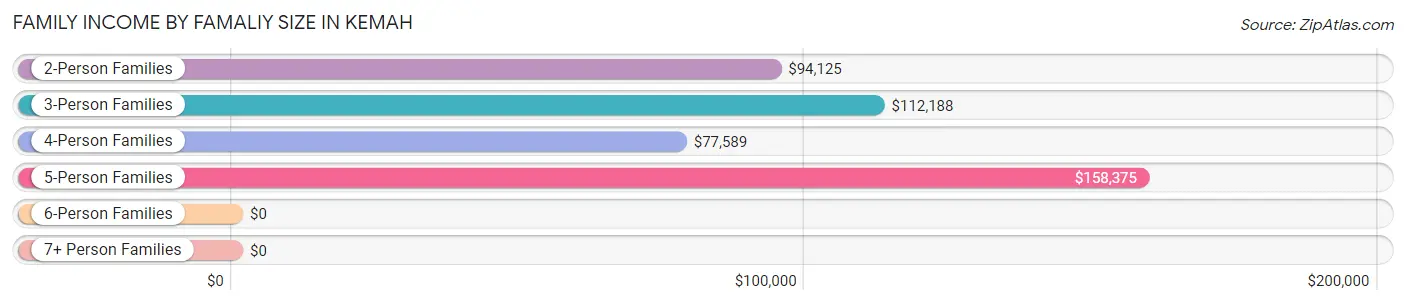
| Income Bracket | # Families | Median Income |
| 2-Person Families | 248 (46.4%) | $94,125 |
| 3-Person Families | 156 (29.2%) | $112,188 |
| 4-Person Families | 81 (15.1%) | $77,589 |
| 5-Person Families | 23 (4.3%) | $158,375 |
| 6-Person Families | 22 (4.1%) | $0 |
| 7+ Person Families | 5 (0.9%) | $0 |
| Total | 535 (100.0%) | $94,792 |
Family Income by Number of Earners in Kemah
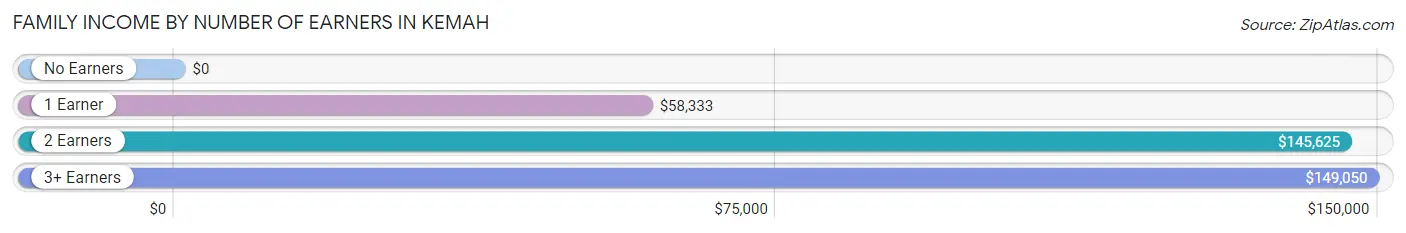
| Number of Earners | # Families | Median Income |
| No Earners | 32 (6.0%) | $0 |
| 1 Earner | 214 (40.0%) | $58,333 |
| 2 Earners | 222 (41.5%) | $145,625 |
| 3+ Earners | 67 (12.5%) | $149,050 |
| Total | 535 (100.0%) | $94,792 |
Household Income in Kemah
Household Income Brackets in Kemah
With 165 households falling in the category, the $100,000 to $149,999 income range is the most frequent in Kemah, accounting for 21.4% of all households. In contrast, only 25 households (3.3%) fall into the $10,000 to $14,999 income bracket, making it the least populous group.
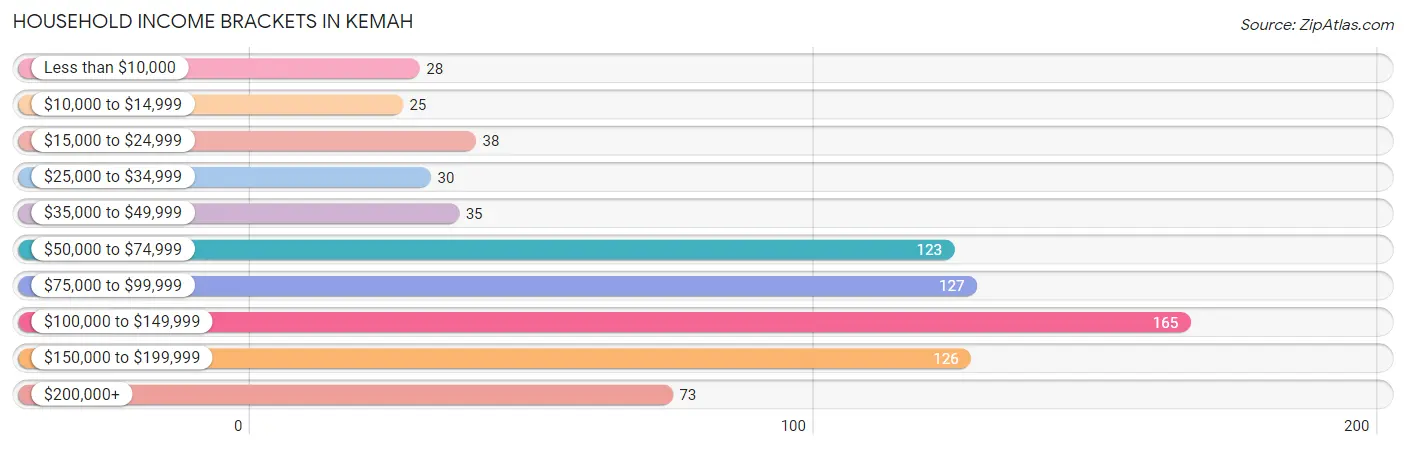
| Income Bracket | # Households | % Households |
| Less than $10,000 | 28 | 3.6% |
| $10,000 to $14,999 | 25 | 3.2% |
| $15,000 to $24,999 | 38 | 4.9% |
| $25,000 to $34,999 | 30 | 3.9% |
| $35,000 to $49,999 | 35 | 4.5% |
| $50,000 to $74,999 | 123 | 16.0% |
| $75,000 to $99,999 | 127 | 16.5% |
| $100,000 to $149,999 | 165 | 21.4% |
| $150,000 to $199,999 | 126 | 16.4% |
| $200,000+ | 73 | 9.5% |
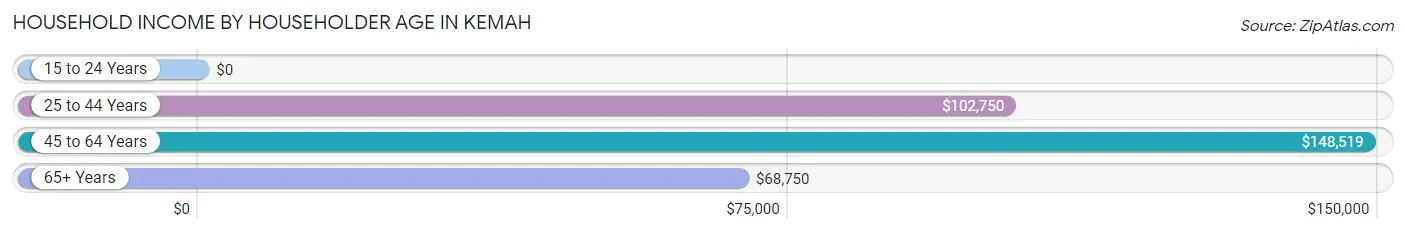
Household Income by Householder Age in Kemah
The median household income in Kemah is $93,021, with the highest median household income of $148,519 found in the 45 to 64 years age bracket for the primary householder. A total of 340 households (44.2%) fall into this category. Meanwhile, the 15 to 24 years age bracket for the primary householder has the lowest median household income of $0, with 42 households (5.4%) in this group.
| Income Bracket | # Households | Median Income |
| 15 to 24 Years | 42 (5.4%) | $0 |
| 25 to 44 Years | 206 (26.8%) | $102,750 |
| 45 to 64 Years | 340 (44.2%) | $148,519 |
| 65+ Years | 182 (23.6%) | $68,750 |
| Total | 770 (100.0%) | $93,021 |
Poverty in Kemah
Income Below Poverty by Sex and Age in Kemah
With 12.9% poverty level for males and 25.8% for females among the residents of Kemah, 5 year old males and 15 year old females are the most vulnerable to poverty, with 9 males (42.9%) and 18 females (66.7%) in their respective age groups living below the poverty level.
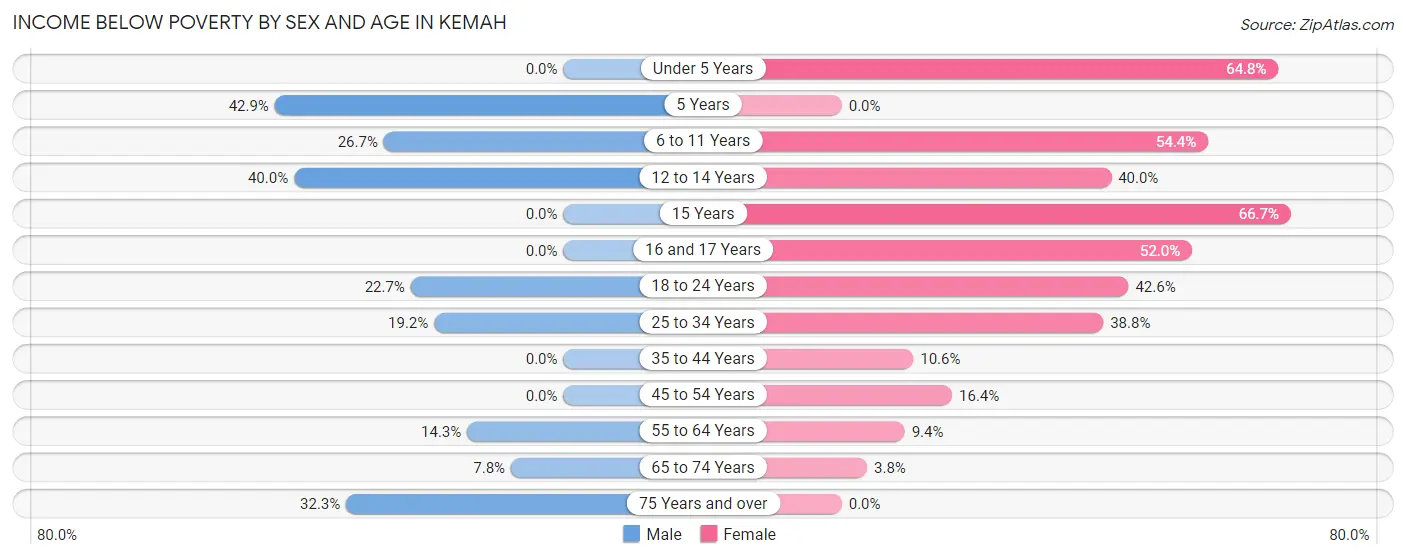
| Age Bracket | Male | Female |
| Under 5 Years | 0 (0.0%) | 35 (64.8%) |
| 5 Years | 9 (42.9%) | 0 (0.0%) |
| 6 to 11 Years | 16 (26.7%) | 31 (54.4%) |
| 12 to 14 Years | 14 (40.0%) | 12 (40.0%) |
| 15 Years | 0 (0.0%) | 18 (66.7%) |
| 16 and 17 Years | 0 (0.0%) | 26 (52.0%) |
| 18 to 24 Years | 17 (22.7%) | 43 (42.6%) |
| 25 to 34 Years | 33 (19.2%) | 33 (38.8%) |
| 35 to 44 Years | 0 (0.0%) | 12 (10.6%) |
| 45 to 54 Years | 0 (0.0%) | 19 (16.4%) |
| 55 to 64 Years | 21 (14.3%) | 13 (9.3%) |
| 65 to 74 Years | 7 (7.8%) | 5 (3.8%) |
| 75 Years and over | 10 (32.3%) | 0 (0.0%) |
| Total | 127 (12.9%) | 247 (25.8%) |
Income Above Poverty by Sex and Age in Kemah
According to the poverty statistics in Kemah, males aged under 5 years and females aged 5 years are the age groups that are most secure financially, with 100.0% of males and 100.0% of females in these age groups living above the poverty line.
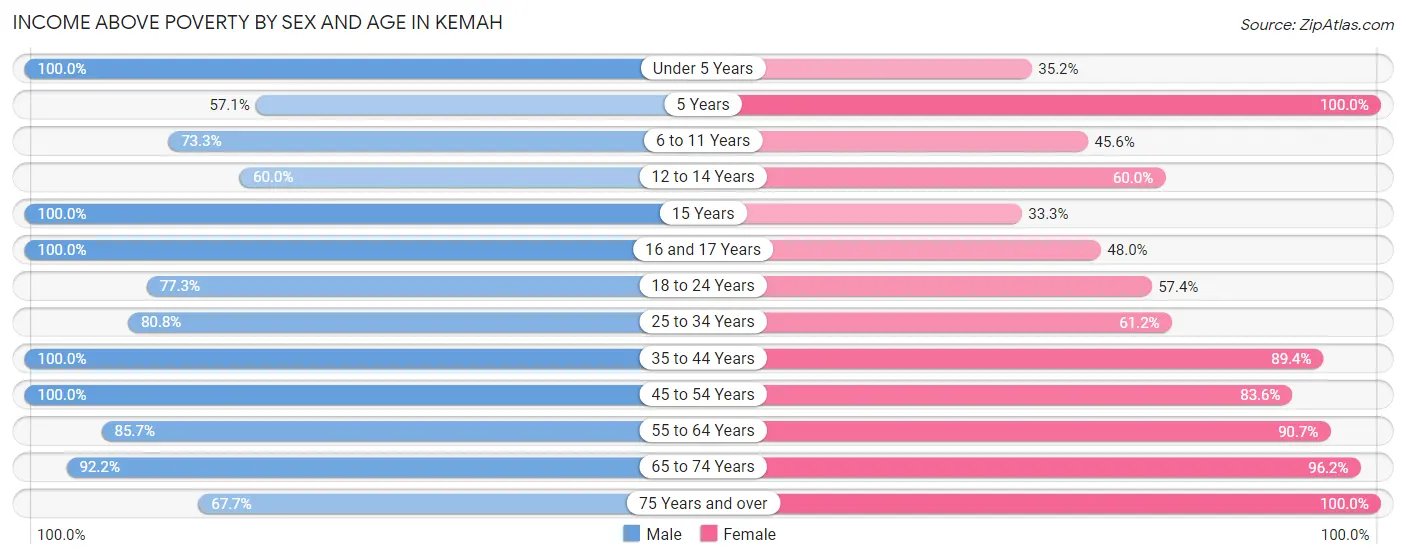
| Age Bracket | Male | Female |
| Under 5 Years | 24 (100.0%) | 19 (35.2%) |
| 5 Years | 12 (57.1%) | 12 (100.0%) |
| 6 to 11 Years | 44 (73.3%) | 26 (45.6%) |
| 12 to 14 Years | 21 (60.0%) | 18 (60.0%) |
| 15 Years | 52 (100.0%) | 9 (33.3%) |
| 16 and 17 Years | 16 (100.0%) | 24 (48.0%) |
| 18 to 24 Years | 58 (77.3%) | 58 (57.4%) |
| 25 to 34 Years | 139 (80.8%) | 52 (61.2%) |
| 35 to 44 Years | 92 (100.0%) | 101 (89.4%) |
| 45 to 54 Years | 171 (100.0%) | 97 (83.6%) |
| 55 to 64 Years | 126 (85.7%) | 126 (90.6%) |
| 65 to 74 Years | 83 (92.2%) | 128 (96.2%) |
| 75 Years and over | 21 (67.7%) | 42 (100.0%) |
| Total | 859 (87.1%) | 712 (74.2%) |
Income Below Poverty Among Married-Couple Families in Kemah
The poverty statistics for married-couple families in Kemah show that 6.9% or 26 of the total 377 families live below the poverty line. Families with 1 or 2 children have the highest poverty rate of 20.0%, comprising of 18 families. On the other hand, families with 3 or 4 children have the lowest poverty rate of 0.0%, which includes 0 families.
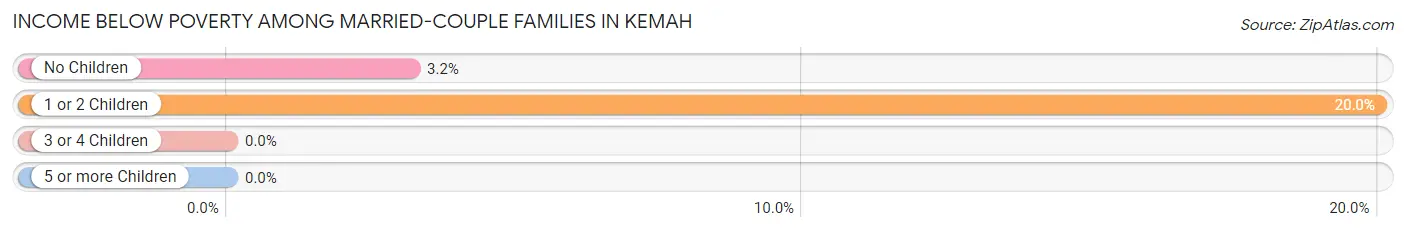
| Children | Above Poverty | Below Poverty |
| No Children | 244 (96.8%) | 8 (3.2%) |
| 1 or 2 Children | 72 (80.0%) | 18 (20.0%) |
| 3 or 4 Children | 35 (100.0%) | 0 (0.0%) |
| 5 or more Children | 0 (0.0%) | 0 (0.0%) |
| Total | 351 (93.1%) | 26 (6.9%) |
Income Below Poverty Among Single-Parent Households in Kemah
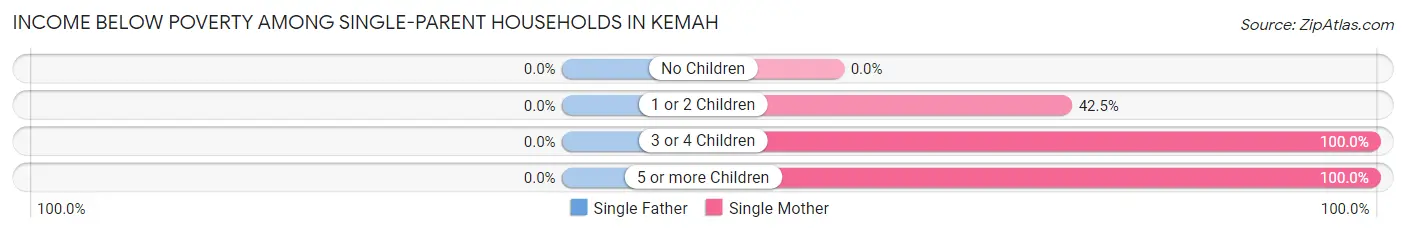
| Children | Single Father | Single Mother |
| No Children | 0 (0.0%) | 0 (0.0%) |
| 1 or 2 Children | 0 (0.0%) | 31 (42.5%) |
| 3 or 4 Children | 0 (0.0%) | 11 (100.0%) |
| 5 or more Children | 0 (0.0%) | 10 (100.0%) |
| Total | 0 (0.0%) | 52 (45.2%) |
Income Below Poverty Among Married-Couple vs Single-Parent Households in Kemah
The poverty data for Kemah shows that 26 of the married-couple family households (6.9%) and 52 of the single-parent households (32.9%) are living below the poverty level. Within the married-couple family households, those with 1 or 2 children have the highest poverty rate, with 18 households (20.0%) falling below the poverty line. Among the single-parent households, those with 3 or 4 children have the highest poverty rate, with 11 household (100.0%) living below poverty.
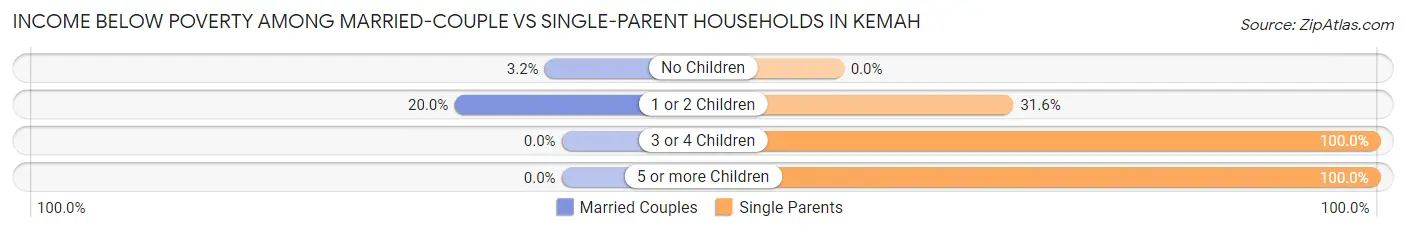
| Children | Married-Couple Families | Single-Parent Households |
| No Children | 8 (3.2%) | 0 (0.0%) |
| 1 or 2 Children | 18 (20.0%) | 31 (31.6%) |
| 3 or 4 Children | 0 (0.0%) | 11 (100.0%) |
| 5 or more Children | 0 (0.0%) | 10 (100.0%) |
| Total | 26 (6.9%) | 52 (32.9%) |
Race in Kemah
The most populous races in Kemah are White / Caucasian (1,315 | 67.6%), Hispanic or Latino (548 | 28.2%), and Some other Race (221 | 11.4%).
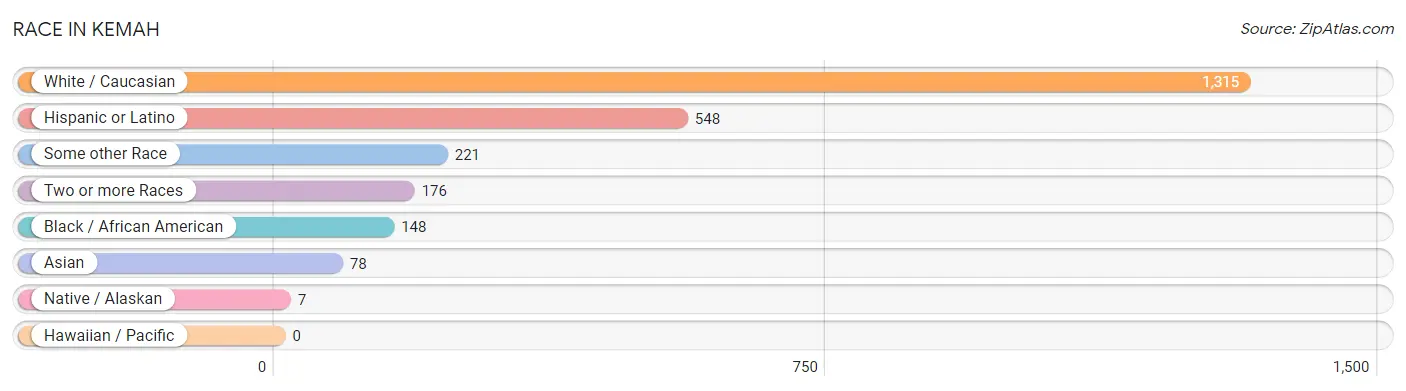
| Race | # Population | % Population |
| Asian | 78 | 4.0% |
| Black / African American | 148 | 7.6% |
| Hawaiian / Pacific | 0 | 0.0% |
| Hispanic or Latino | 548 | 28.2% |
| Native / Alaskan | 7 | 0.4% |
| White / Caucasian | 1,315 | 67.6% |
| Two or more Races | 176 | 9.0% |
| Some other Race | 221 | 11.4% |
| Total | 1,945 | 100.0% |
Ancestry in Kemah
The most populous ancestries reported in Kemah are German (382 | 19.6%), Mexican (355 | 18.2%), Irish (209 | 10.7%), English (205 | 10.5%), and Central American (132 | 6.8%), together accounting for 66.0% of all Kemah residents.
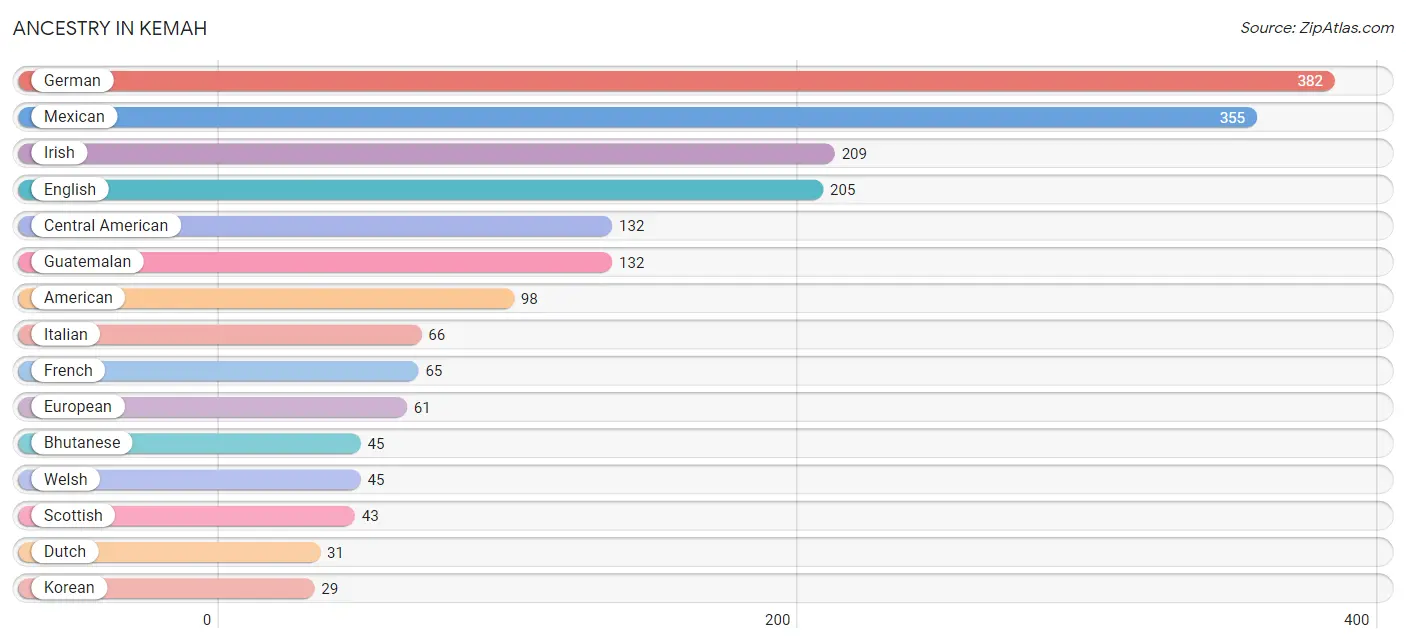
| Ancestry | # Population | % Population |
| American | 98 | 5.0% |
| Arab | 9 | 0.5% |
| Argentinean | 15 | 0.8% |
| Armenian | 2 | 0.1% |
| Bhutanese | 45 | 2.3% |
| British | 23 | 1.2% |
| Burmese | 1 | 0.1% |
| Central American | 132 | 6.8% |
| Colombian | 9 | 0.5% |
| Croatian | 23 | 1.2% |
| Cuban | 9 | 0.5% |
| Danish | 7 | 0.4% |
| Dutch | 31 | 1.6% |
| English | 205 | 10.5% |
| European | 61 | 3.1% |
| French | 65 | 3.3% |
| French Canadian | 5 | 0.3% |
| German | 382 | 19.6% |
| Greek | 3 | 0.2% |
| Guatemalan | 132 | 6.8% |
| Hungarian | 2 | 0.1% |
| Indian (Asian) | 11 | 0.6% |
| Irish | 209 | 10.7% |
| Italian | 66 | 3.4% |
| Jamaican | 12 | 0.6% |
| Korean | 29 | 1.5% |
| Lebanese | 6 | 0.3% |
| Lithuanian | 6 | 0.3% |
| Mexican | 355 | 18.2% |
| Mexican American Indian | 7 | 0.4% |
| Navajo | 5 | 0.3% |
| Norwegian | 2 | 0.1% |
| Polish | 21 | 1.1% |
| Portuguese | 13 | 0.7% |
| Puerto Rican | 6 | 0.3% |
| Romanian | 7 | 0.4% |
| Russian | 19 | 1.0% |
| Scandinavian | 14 | 0.7% |
| Scotch-Irish | 13 | 0.7% |
| Scottish | 43 | 2.2% |
| Sioux | 2 | 0.1% |
| South American | 24 | 1.2% |
| Spaniard | 16 | 0.8% |
| Sri Lankan | 14 | 0.7% |
| Swedish | 8 | 0.4% |
| Thai | 4 | 0.2% |
| Welsh | 45 | 2.3% | View All 47 Rows |
Immigrants in Kemah
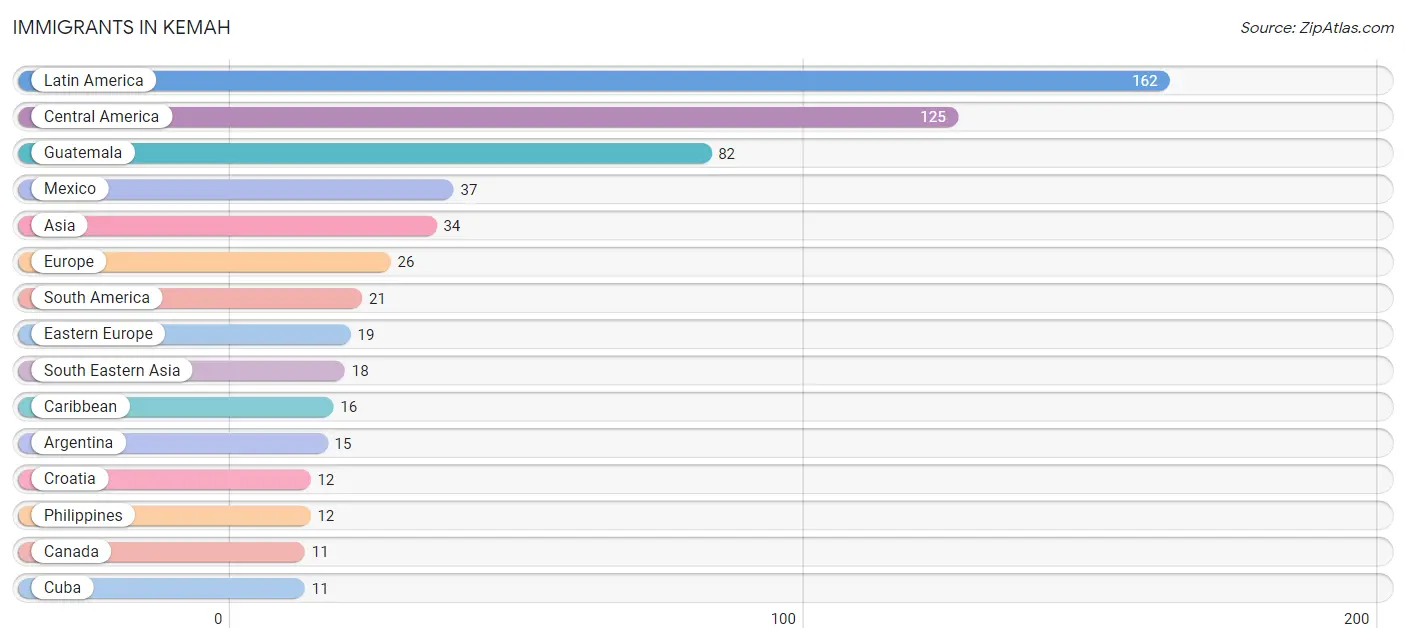
The most numerous immigrant groups reported in Kemah came from Latin America (162 | 8.3%), Central America (125 | 6.4%), Guatemala (82 | 4.2%), Mexico (37 | 1.9%), and Asia (34 | 1.8%), together accounting for 22.6% of all Kemah residents.
| Immigration Origin | # Population | % Population |
| Argentina | 15 | 0.8% |
| Asia | 34 | 1.8% |
| Brazil | 6 | 0.3% |
| Canada | 11 | 0.6% |
| Caribbean | 16 | 0.8% |
| Central America | 125 | 6.4% |
| China | 6 | 0.3% |
| Croatia | 12 | 0.6% |
| Cuba | 11 | 0.6% |
| Eastern Asia | 6 | 0.3% |
| Eastern Europe | 19 | 1.0% |
| El Salvador | 6 | 0.3% |
| Europe | 26 | 1.3% |
| Germany | 3 | 0.2% |
| Guatemala | 82 | 4.2% |
| India | 6 | 0.3% |
| Jamaica | 5 | 0.3% |
| Latin America | 162 | 8.3% |
| Mexico | 37 | 1.9% |
| Northern Europe | 4 | 0.2% |
| Pakistan | 4 | 0.2% |
| Philippines | 12 | 0.6% |
| Romania | 7 | 0.4% |
| South America | 21 | 1.1% |
| South Central Asia | 10 | 0.5% |
| South Eastern Asia | 18 | 0.9% |
| Vietnam | 6 | 0.3% |
| Western Europe | 3 | 0.2% | View All 28 Rows |
Sex and Age in Kemah
Sex and Age in Kemah
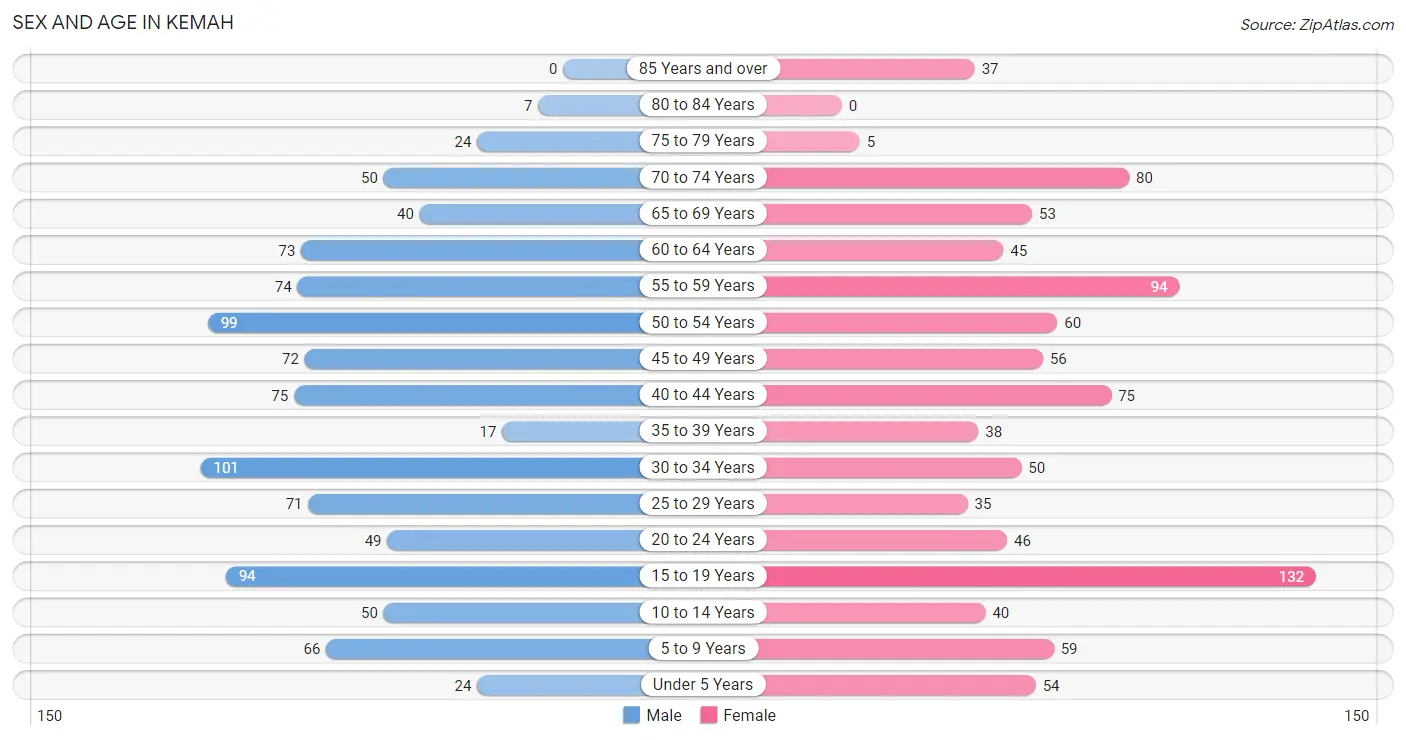
The most populous age groups in Kemah are 30 to 34 Years (101 | 10.2%) for men and 15 to 19 Years (132 | 13.8%) for women.
| Age Bracket | Male | Female |
| Under 5 Years | 24 (2.4%) | 54 (5.6%) |
| 5 to 9 Years | 66 (6.7%) | 59 (6.1%) |
| 10 to 14 Years | 50 (5.1%) | 40 (4.2%) |
| 15 to 19 Years | 94 (9.5%) | 132 (13.8%) |
| 20 to 24 Years | 49 (5.0%) | 46 (4.8%) |
| 25 to 29 Years | 71 (7.2%) | 35 (3.6%) |
| 30 to 34 Years | 101 (10.2%) | 50 (5.2%) |
| 35 to 39 Years | 17 (1.7%) | 38 (4.0%) |
| 40 to 44 Years | 75 (7.6%) | 75 (7.8%) |
| 45 to 49 Years | 72 (7.3%) | 56 (5.8%) |
| 50 to 54 Years | 99 (10.0%) | 60 (6.3%) |
| 55 to 59 Years | 74 (7.5%) | 94 (9.8%) |
| 60 to 64 Years | 73 (7.4%) | 45 (4.7%) |
| 65 to 69 Years | 40 (4.1%) | 53 (5.5%) |
| 70 to 74 Years | 50 (5.1%) | 80 (8.3%) |
| 75 to 79 Years | 24 (2.4%) | 5 (0.5%) |
| 80 to 84 Years | 7 (0.7%) | 0 (0.0%) |
| 85 Years and over | 0 (0.0%) | 37 (3.9%) |
| Total | 986 (100.0%) | 959 (100.0%) |
Families and Households in Kemah
Median Family Size in Kemah
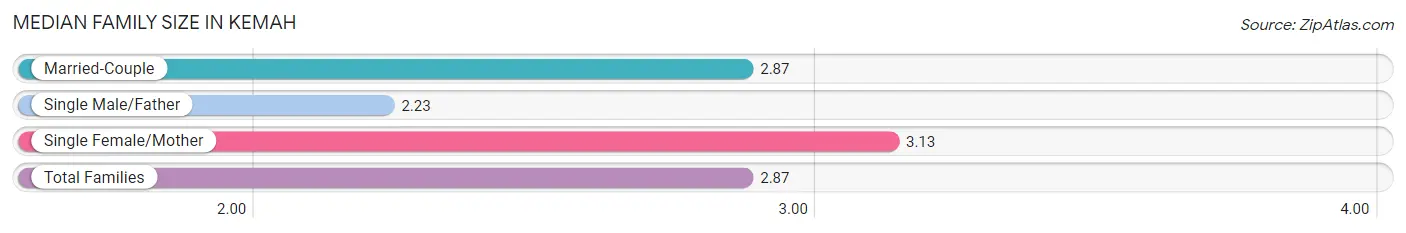
The median family size in Kemah is 2.87 persons per family, with single female/mother families (115 | 21.5%) accounting for the largest median family size of 3.13 persons per family. On the other hand, single male/father families (43 | 8.0%) represent the smallest median family size with 2.23 persons per family.
| Family Type | # Families | Family Size |
| Married-Couple | 377 (70.5%) | 2.87 |
| Single Male/Father | 43 (8.0%) | 2.23 |
| Single Female/Mother | 115 (21.5%) | 3.13 |
| Total Families | 535 (100.0%) | 2.87 |
Median Household Size in Kemah
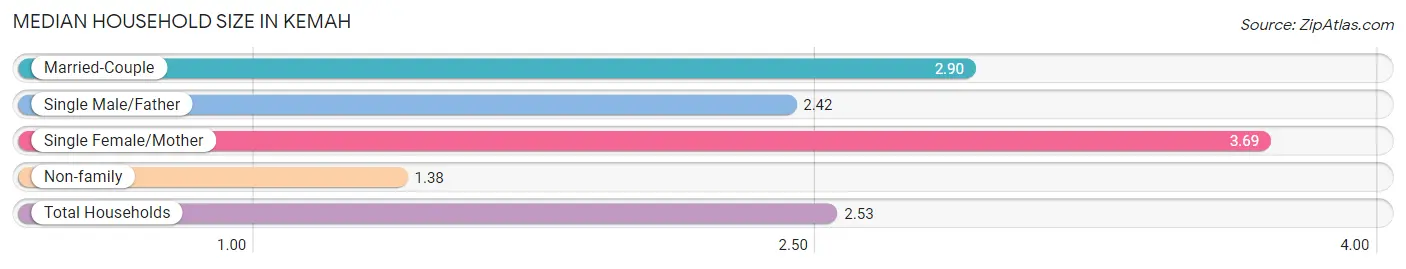
The median household size in Kemah is 2.53 persons per household, with single female/mother households (115 | 14.9%) accounting for the largest median household size of 3.69 persons per household. non-family households (235 | 30.5%) represent the smallest median household size with 1.38 persons per household.
| Household Type | # Households | Household Size |
| Married-Couple | 377 (49.0%) | 2.90 |
| Single Male/Father | 43 (5.6%) | 2.42 |
| Single Female/Mother | 115 (14.9%) | 3.69 |
| Non-family | 235 (30.5%) | 1.38 |
| Total Households | 770 (100.0%) | 2.53 |
Household Size by Marriage Status in Kemah
Out of a total of 770 households in Kemah, 535 (69.5%) are family households, while 235 (30.5%) are nonfamily households. The most numerous type of family households are 2-person households, comprising 240, and the most common type of nonfamily households are 1-person households, comprising 167.
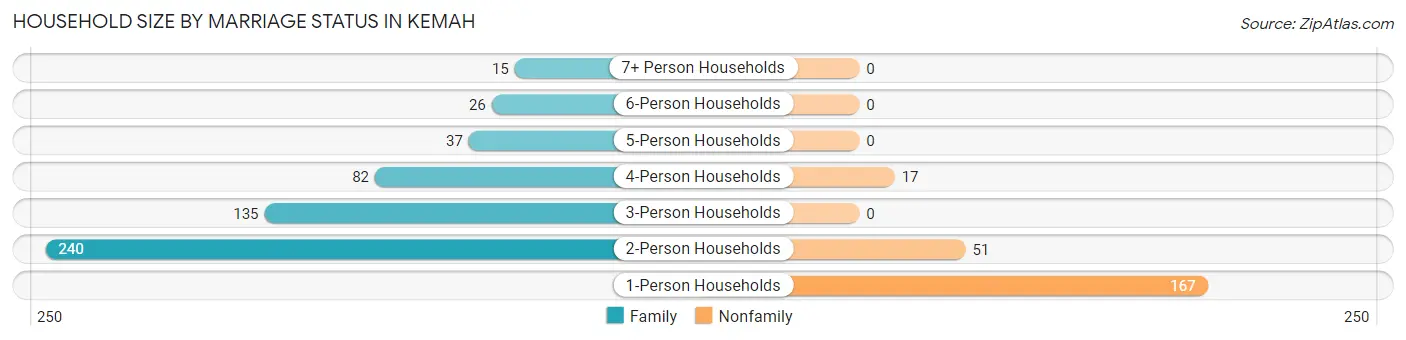
| Household Size | Family Households | Nonfamily Households |
| 1-Person Households | - | 167 (21.7%) |
| 2-Person Households | 240 (31.2%) | 51 (6.6%) |
| 3-Person Households | 135 (17.5%) | 0 (0.0%) |
| 4-Person Households | 82 (10.6%) | 17 (2.2%) |
| 5-Person Households | 37 (4.8%) | 0 (0.0%) |
| 6-Person Households | 26 (3.4%) | 0 (0.0%) |
| 7+ Person Households | 15 (1.9%) | 0 (0.0%) |
| Total | 535 (69.5%) | 235 (30.5%) |
Female Fertility in Kemah
Fertility by Age in Kemah
Average fertility rate in Kemah is 33.0 births per 1,000 women. Women in the age bracket of 20 to 34 years have the highest fertility rate with 92.0 births per 1,000 women. Women in the age bracket of 20 to 34 years acount for 80.0% of all women with births.
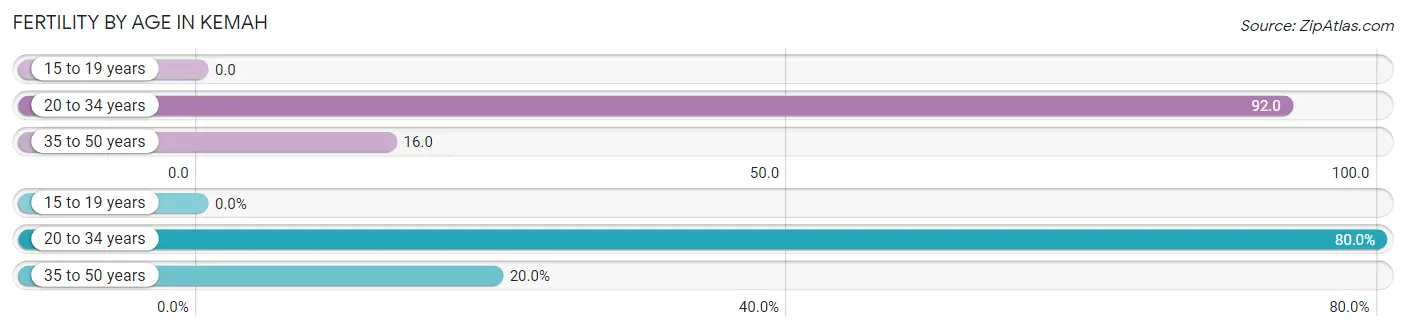
| Age Bracket | Women with Births | Births / 1,000 Women |
| 15 to 19 years | 0 (0.0%) | 0.0 |
| 20 to 34 years | 12 (80.0%) | 92.0 |
| 35 to 50 years | 3 (20.0%) | 16.0 |
| Total | 15 (100.0%) | 33.0 |
Fertility by Age by Marriage Status in Kemah
80.0% of women with births (15) in Kemah are married. The highest percentage of unmarried women with births falls into 20 to 34 years age bracket with 25.0% of them unmarried at the time of birth, while the lowest percentage of unmarried women with births belong to 35 to 50 years age bracket with 0.0% of them unmarried.
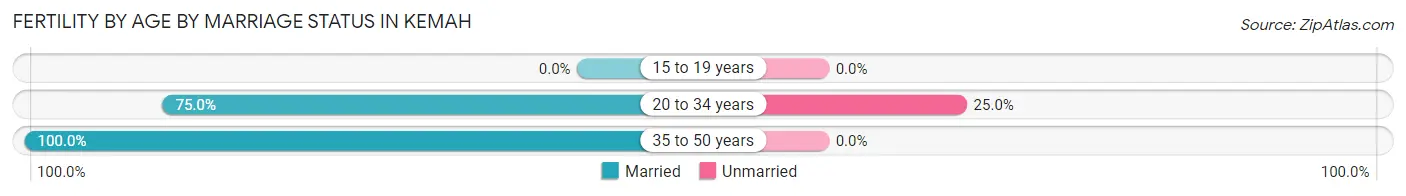
| Age Bracket | Married | Unmarried |
| 15 to 19 years | 0 (0.0%) | 0 (0.0%) |
| 20 to 34 years | 9 (75.0%) | 3 (25.0%) |
| 35 to 50 years | 3 (100.0%) | 0 (0.0%) |
| Total | 12 (80.0%) | 3 (20.0%) |
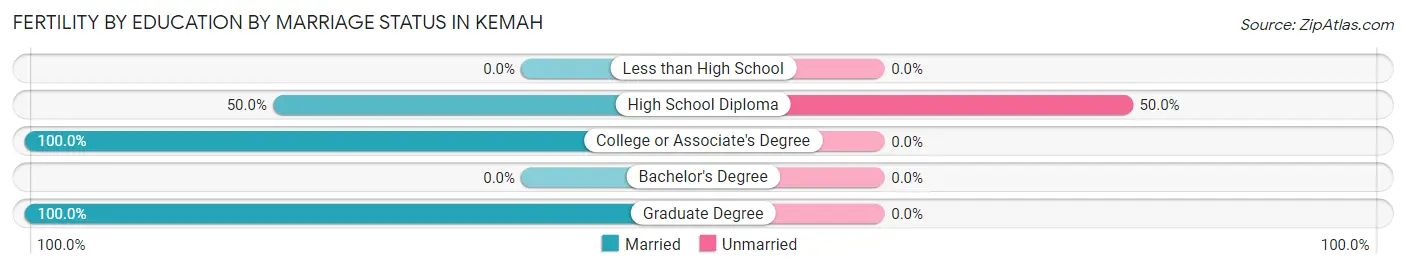
Fertility by Education in Kemah
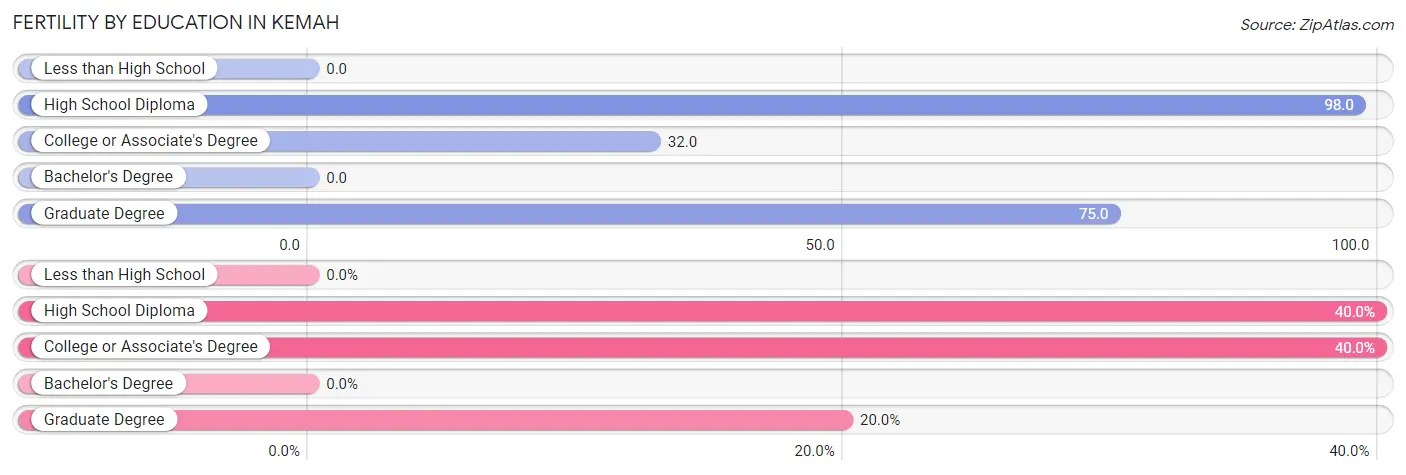
| Educational Attainment | Women with Births | Births / 1,000 Women |
| Less than High School | 0 (0.0%) | 0.0 |
| High School Diploma | 6 (40.0%) | 98.0 |
| College or Associate's Degree | 6 (40.0%) | 32.0 |
| Bachelor's Degree | 0 (0.0%) | 0.0 |
| Graduate Degree | 3 (20.0%) | 75.0 |
| Total | 15 (100.0%) | 33.0 |
Fertility by Education by Marriage Status in Kemah
20.0% of women with births in Kemah are unmarried. Women with the educational attainment of college or associate's degree are most likely to be married with 100.0% of them married at childbirth, while women with the educational attainment of high school diploma are least likely to be married with 50.0% of them unmarried at childbirth.
| Educational Attainment | Married | Unmarried |
| Less than High School | 0 (0.0%) | 0 (0.0%) |
| High School Diploma | 3 (50.0%) | 3 (50.0%) |
| College or Associate's Degree | 6 (100.0%) | 0 (0.0%) |
| Bachelor's Degree | 0 (0.0%) | 0 (0.0%) |
| Graduate Degree | 3 (100.0%) | 0 (0.0%) |
| Total | 12 (80.0%) | 3 (20.0%) |
Employment Characteristics in Kemah
Employment by Class of Employer in Kemah
Among the 1,035 employed individuals in Kemah, private company employees (663 | 64.1%), self-employed (not incorporated) (123 | 11.9%), and local government employees (99 | 9.6%) make up the most common classes of employment.
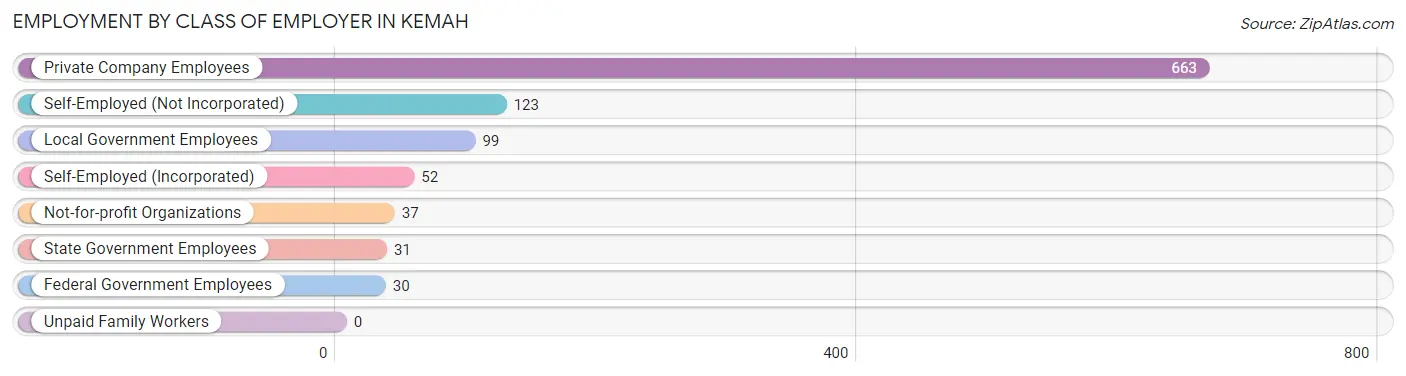
| Employer Class | # Employees | % Employees |
| Private Company Employees | 663 | 64.1% |
| Self-Employed (Incorporated) | 52 | 5.0% |
| Self-Employed (Not Incorporated) | 123 | 11.9% |
| Not-for-profit Organizations | 37 | 3.6% |
| Local Government Employees | 99 | 9.6% |
| State Government Employees | 31 | 3.0% |
| Federal Government Employees | 30 | 2.9% |
| Unpaid Family Workers | 0 | 0.0% |
| Total | 1,035 | 100.0% |
Employment Status by Age in Kemah
According to the labor force statistics for Kemah, out of the total population over 16 years of age (1,573), 70.2% or 1,104 individuals are in the labor force, with 6.1% or 67 of them unemployed. The age group with the highest labor force participation rate is 30 to 34 years, with 98.0% or 148 individuals in the labor force. Within the labor force, the 75 years and over age range has the highest percentage of unemployed individuals, with 61.5% or 8 of them being unemployed.
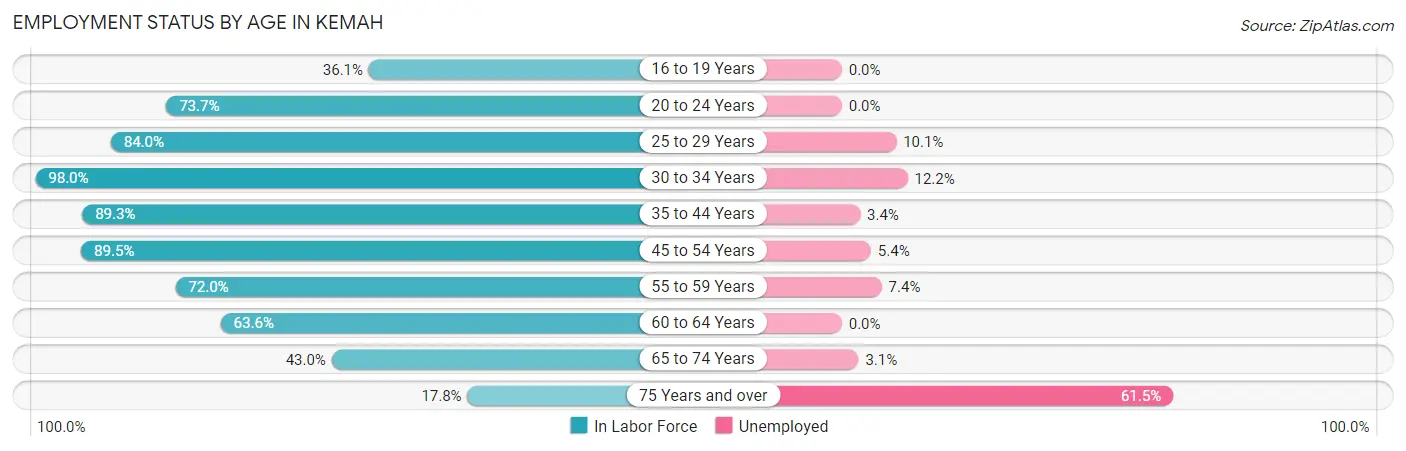
| Age Bracket | In Labor Force | Unemployed |
| 16 to 19 Years | 53 (36.1%) | 0 (0.0%) |
| 20 to 24 Years | 70 (73.7%) | 0 (0.0%) |
| 25 to 29 Years | 89 (84.0%) | 9 (10.1%) |
| 30 to 34 Years | 148 (98.0%) | 18 (12.2%) |
| 35 to 44 Years | 183 (89.3%) | 6 (3.4%) |
| 45 to 54 Years | 257 (89.5%) | 14 (5.4%) |
| 55 to 59 Years | 121 (72.0%) | 9 (7.4%) |
| 60 to 64 Years | 75 (63.6%) | 0 (0.0%) |
| 65 to 74 Years | 96 (43.0%) | 3 (3.1%) |
| 75 Years and over | 13 (17.8%) | 8 (61.5%) |
| Total | 1,104 (70.2%) | 67 (6.1%) |
Employment Status by Educational Attainment in Kemah
According to labor force statistics for Kemah, 84.3% of individuals (873) out of the total population between 25 and 64 years of age (1,035) are in the labor force, with 6.5% or 57 of them being unemployed. The group with the highest labor force participation rate are those with the educational attainment of bachelor's degree or higher, with 89.9% or 276 individuals in the labor force. Within the labor force, individuals with less than high school education have the highest percentage of unemployment, with 14.1% or 11 of them being unemployed.
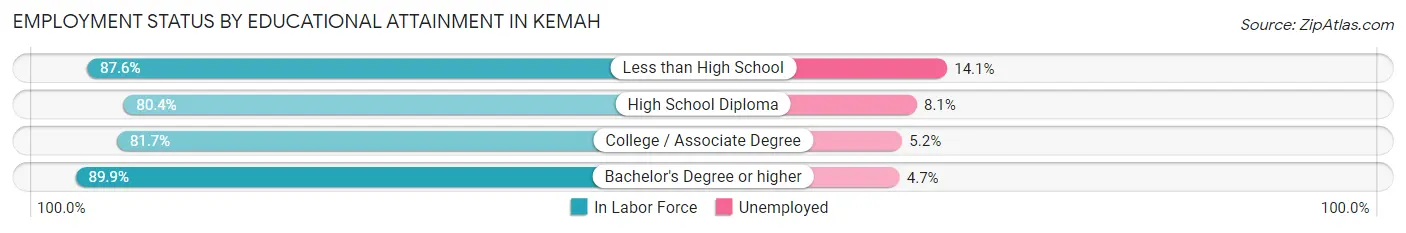
| Educational Attainment | In Labor Force | Unemployed |
| Less than High School | 78 (87.6%) | 13 (14.1%) |
| High School Diploma | 185 (80.4%) | 19 (8.1%) |
| College / Associate Degree | 334 (81.7%) | 21 (5.2%) |
| Bachelor's Degree or higher | 276 (89.9%) | 14 (4.7%) |
| Total | 873 (84.3%) | 67 (6.5%) |
Employment Occupations by Sex in Kemah
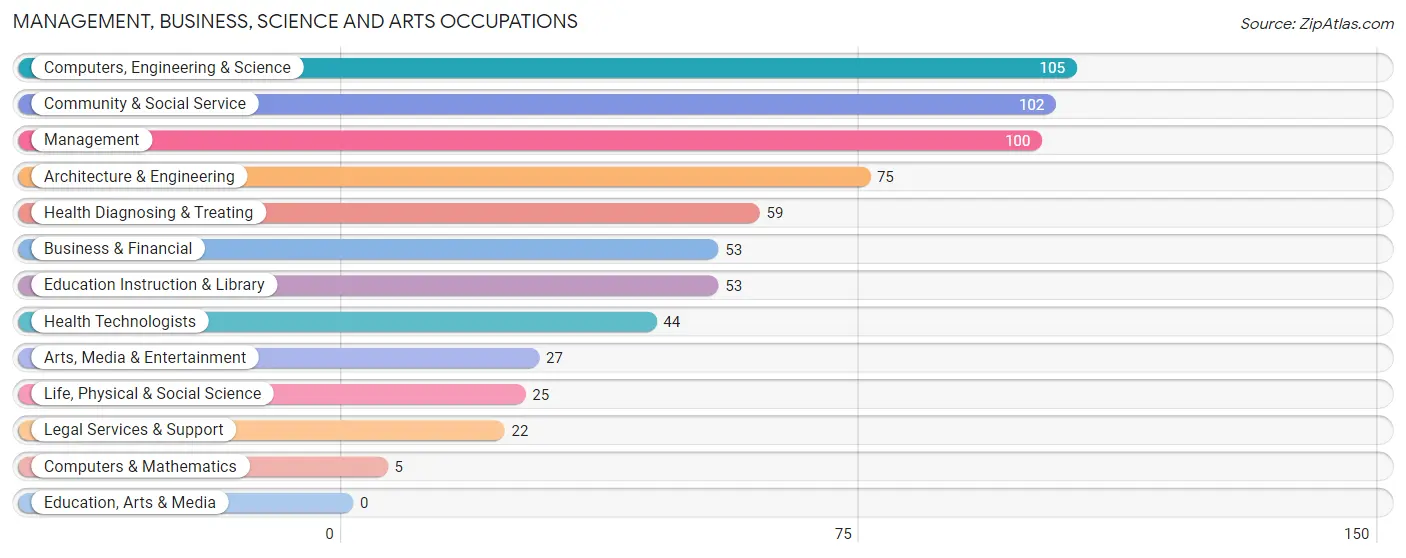
Management, Business, Science and Arts Occupations
The most common Management, Business, Science and Arts occupations in Kemah are Computers, Engineering & Science (105 | 10.2%), Community & Social Service (102 | 9.9%), Management (100 | 9.7%), Architecture & Engineering (75 | 7.3%), and Health Diagnosing & Treating (59 | 5.7%).
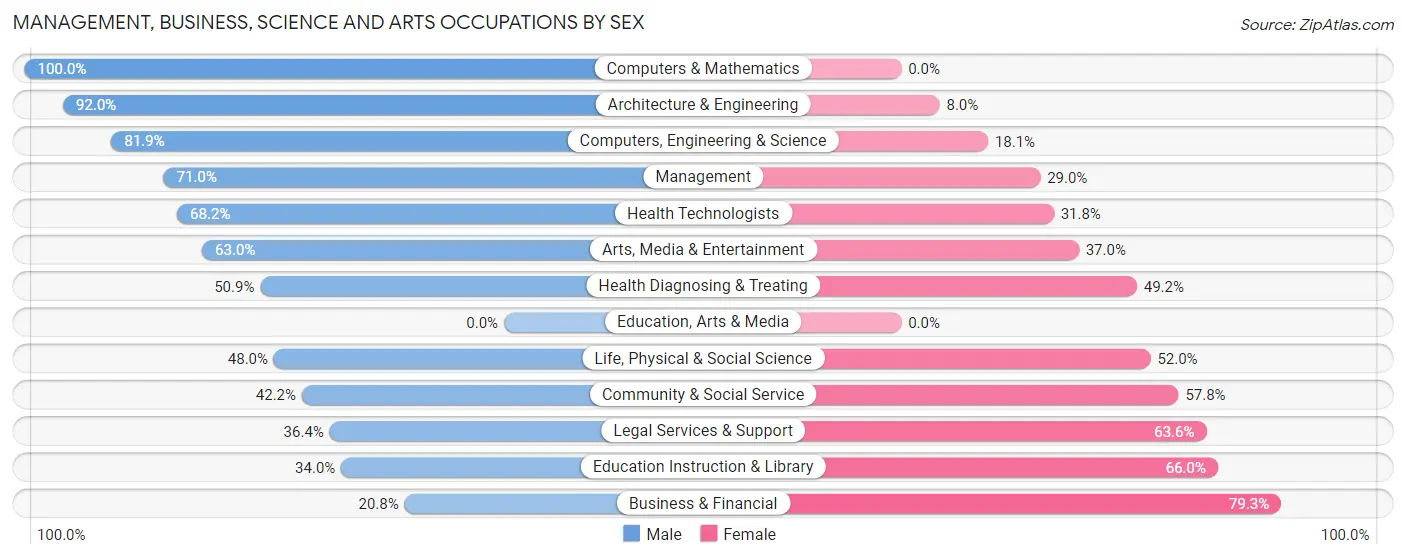
Management, Business, Science and Arts Occupations by Sex
Within the Management, Business, Science and Arts occupations in Kemah, the most male-oriented occupations are Computers & Mathematics (100.0%), Architecture & Engineering (92.0%), and Computers, Engineering & Science (81.9%), while the most female-oriented occupations are Business & Financial (79.2%), Education Instruction & Library (66.0%), and Legal Services & Support (63.6%).
| Occupation | Male | Female |
| Management | 71 (71.0%) | 29 (29.0%) |
| Business & Financial | 11 (20.7%) | 42 (79.2%) |
| Computers, Engineering & Science | 86 (81.9%) | 19 (18.1%) |
| Computers & Mathematics | 5 (100.0%) | 0 (0.0%) |
| Architecture & Engineering | 69 (92.0%) | 6 (8.0%) |
| Life, Physical & Social Science | 12 (48.0%) | 13 (52.0%) |
| Community & Social Service | 43 (42.2%) | 59 (57.8%) |
| Education, Arts & Media | 0 (0.0%) | 0 (0.0%) |
| Legal Services & Support | 8 (36.4%) | 14 (63.6%) |
| Education Instruction & Library | 18 (34.0%) | 35 (66.0%) |
| Arts, Media & Entertainment | 17 (63.0%) | 10 (37.0%) |
| Health Diagnosing & Treating | 30 (50.8%) | 29 (49.1%) |
| Health Technologists | 30 (68.2%) | 14 (31.8%) |
| Total (Category) | 241 (57.5%) | 178 (42.5%) |
| Total (Overall) | 557 (53.9%) | 476 (46.1%) |
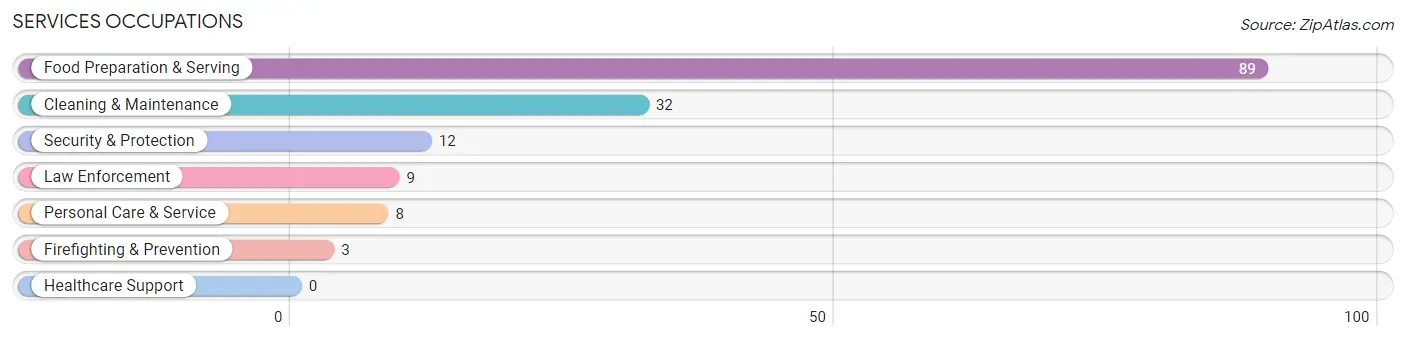
Services Occupations
The most common Services occupations in Kemah are Food Preparation & Serving (89 | 8.6%), Cleaning & Maintenance (32 | 3.1%), Security & Protection (12 | 1.2%), Law Enforcement (9 | 0.9%), and Personal Care & Service (8 | 0.8%).
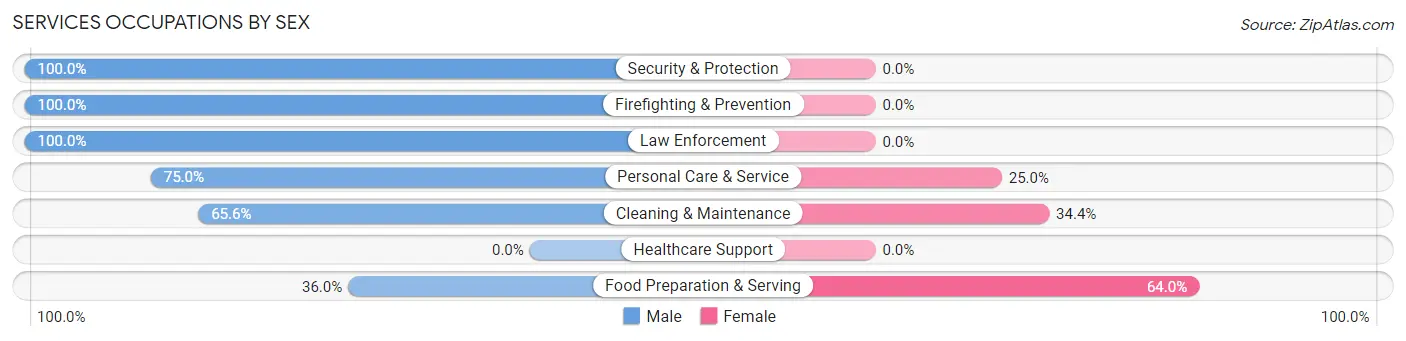
Services Occupations by Sex
Within the Services occupations in Kemah, the most male-oriented occupations are Security & Protection (100.0%), Firefighting & Prevention (100.0%), and Law Enforcement (100.0%), while the most female-oriented occupations are Food Preparation & Serving (64.0%), Cleaning & Maintenance (34.4%), and Personal Care & Service (25.0%).
| Occupation | Male | Female |
| Healthcare Support | 0 (0.0%) | 0 (0.0%) |
| Security & Protection | 12 (100.0%) | 0 (0.0%) |
| Firefighting & Prevention | 3 (100.0%) | 0 (0.0%) |
| Law Enforcement | 9 (100.0%) | 0 (0.0%) |
| Food Preparation & Serving | 32 (36.0%) | 57 (64.0%) |
| Cleaning & Maintenance | 21 (65.6%) | 11 (34.4%) |
| Personal Care & Service | 6 (75.0%) | 2 (25.0%) |
| Total (Category) | 71 (50.3%) | 70 (49.6%) |
| Total (Overall) | 557 (53.9%) | 476 (46.1%) |
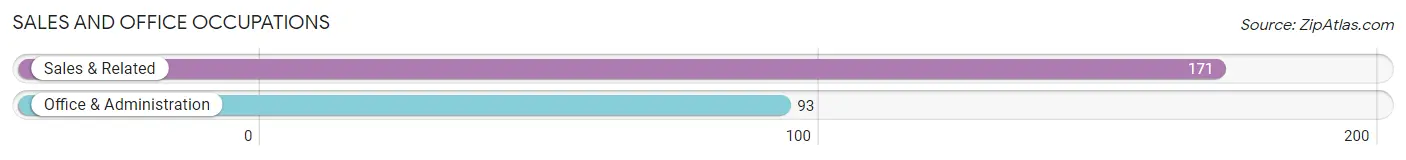
Sales and Office Occupations
The most common Sales and Office occupations in Kemah are Sales & Related (171 | 16.6%), and Office & Administration (93 | 9.0%).
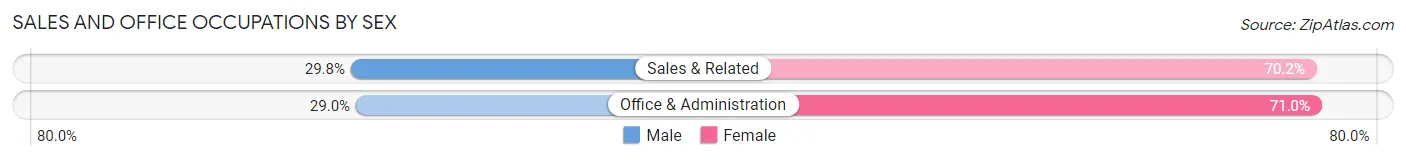
Sales and Office Occupations by Sex
| Occupation | Male | Female |
| Sales & Related | 51 (29.8%) | 120 (70.2%) |
| Office & Administration | 27 (29.0%) | 66 (71.0%) |
| Total (Category) | 78 (29.5%) | 186 (70.5%) |
| Total (Overall) | 557 (53.9%) | 476 (46.1%) |
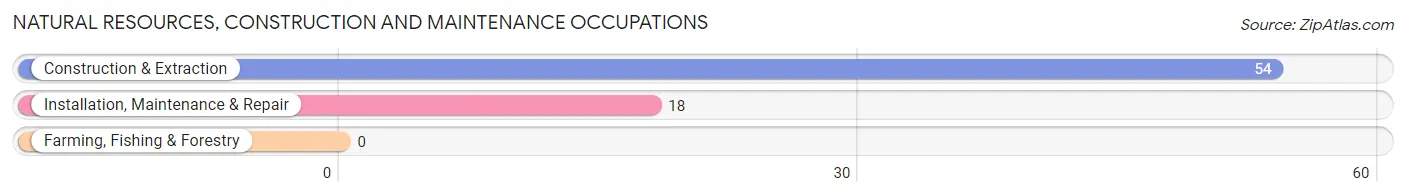
Natural Resources, Construction and Maintenance Occupations
The most common Natural Resources, Construction and Maintenance occupations in Kemah are Construction & Extraction (54 | 5.2%), and Installation, Maintenance & Repair (18 | 1.7%).
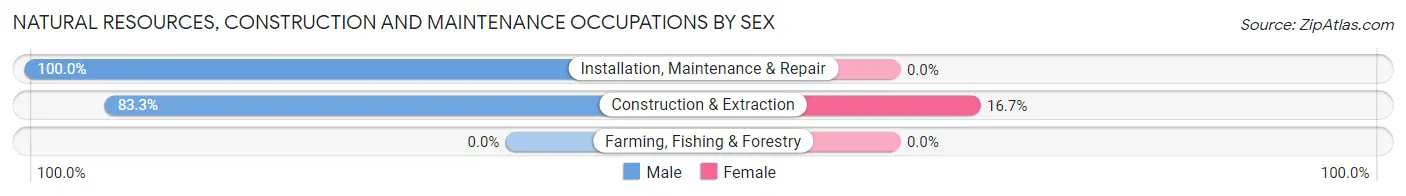
Natural Resources, Construction and Maintenance Occupations by Sex
| Occupation | Male | Female |
| Farming, Fishing & Forestry | 0 (0.0%) | 0 (0.0%) |
| Construction & Extraction | 45 (83.3%) | 9 (16.7%) |
| Installation, Maintenance & Repair | 18 (100.0%) | 0 (0.0%) |
| Total (Category) | 63 (87.5%) | 9 (12.5%) |
| Total (Overall) | 557 (53.9%) | 476 (46.1%) |
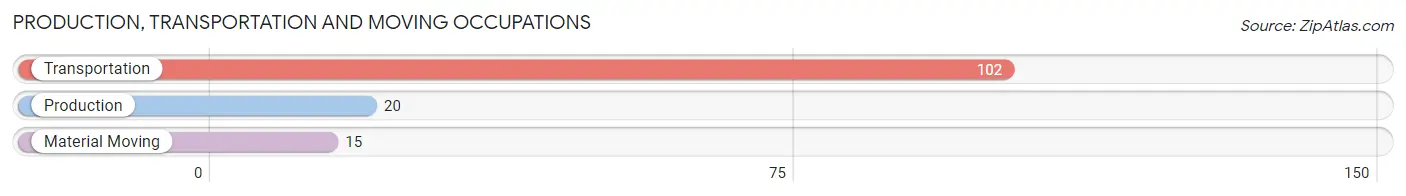
Production, Transportation and Moving Occupations
The most common Production, Transportation and Moving occupations in Kemah are Transportation (102 | 9.9%), Production (20 | 1.9%), and Material Moving (15 | 1.5%).
Production, Transportation and Moving Occupations by Sex
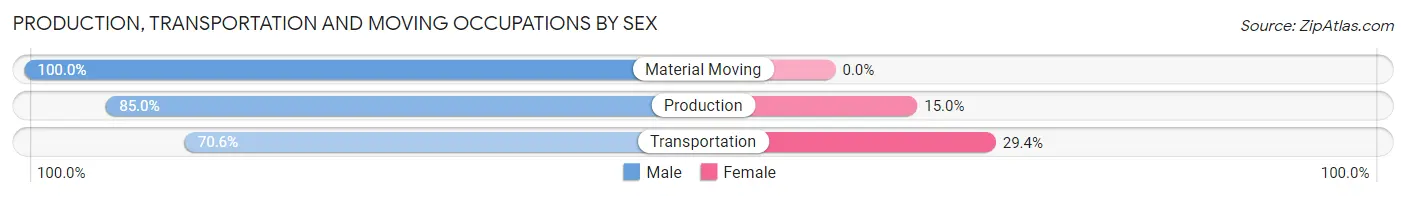
| Occupation | Male | Female |
| Production | 17 (85.0%) | 3 (15.0%) |
| Transportation | 72 (70.6%) | 30 (29.4%) |
| Material Moving | 15 (100.0%) | 0 (0.0%) |
| Total (Category) | 104 (75.9%) | 33 (24.1%) |
| Total (Overall) | 557 (53.9%) | 476 (46.1%) |
Employment Industries by Sex in Kemah
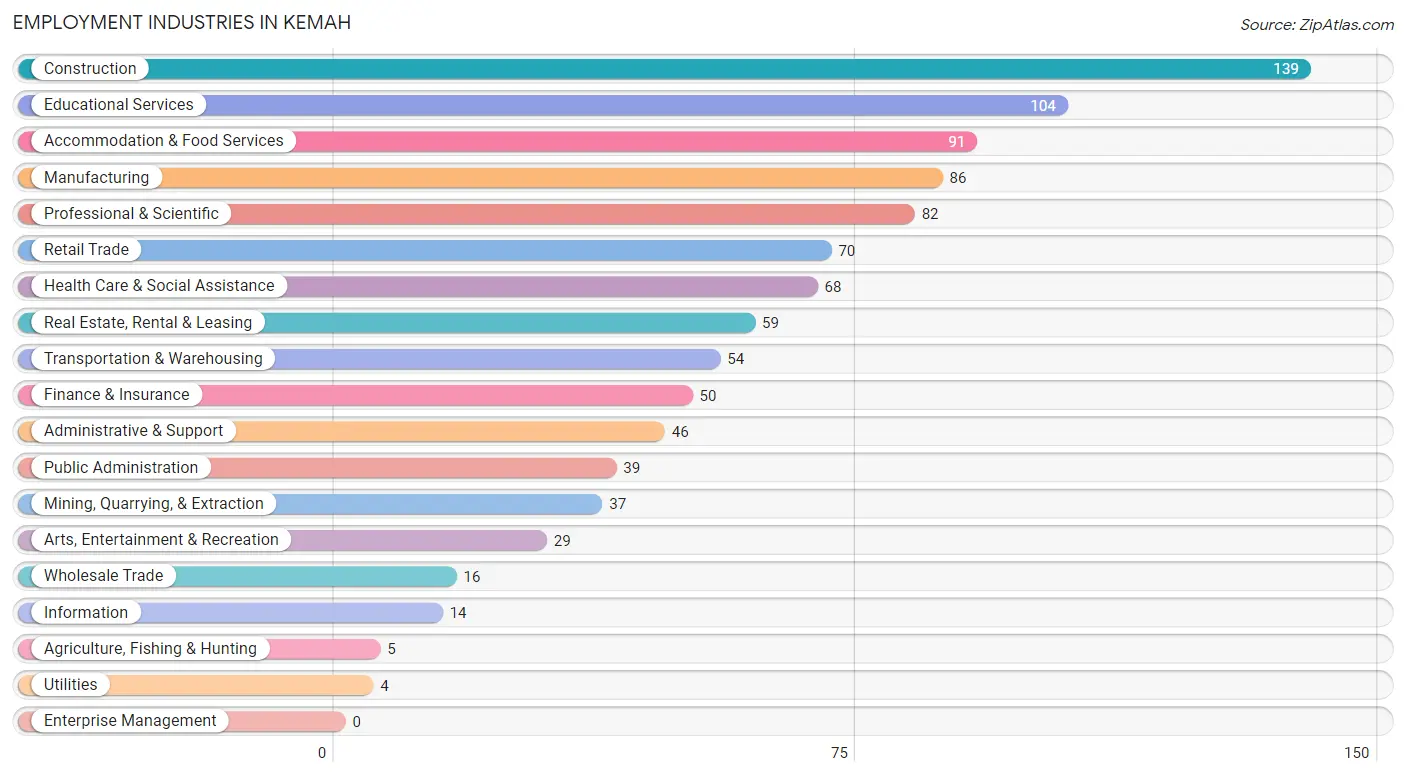
Employment Industries in Kemah
The major employment industries in Kemah include Construction (139 | 13.5%), Educational Services (104 | 10.1%), Accommodation & Food Services (91 | 8.8%), Manufacturing (86 | 8.3%), and Professional & Scientific (82 | 7.9%).
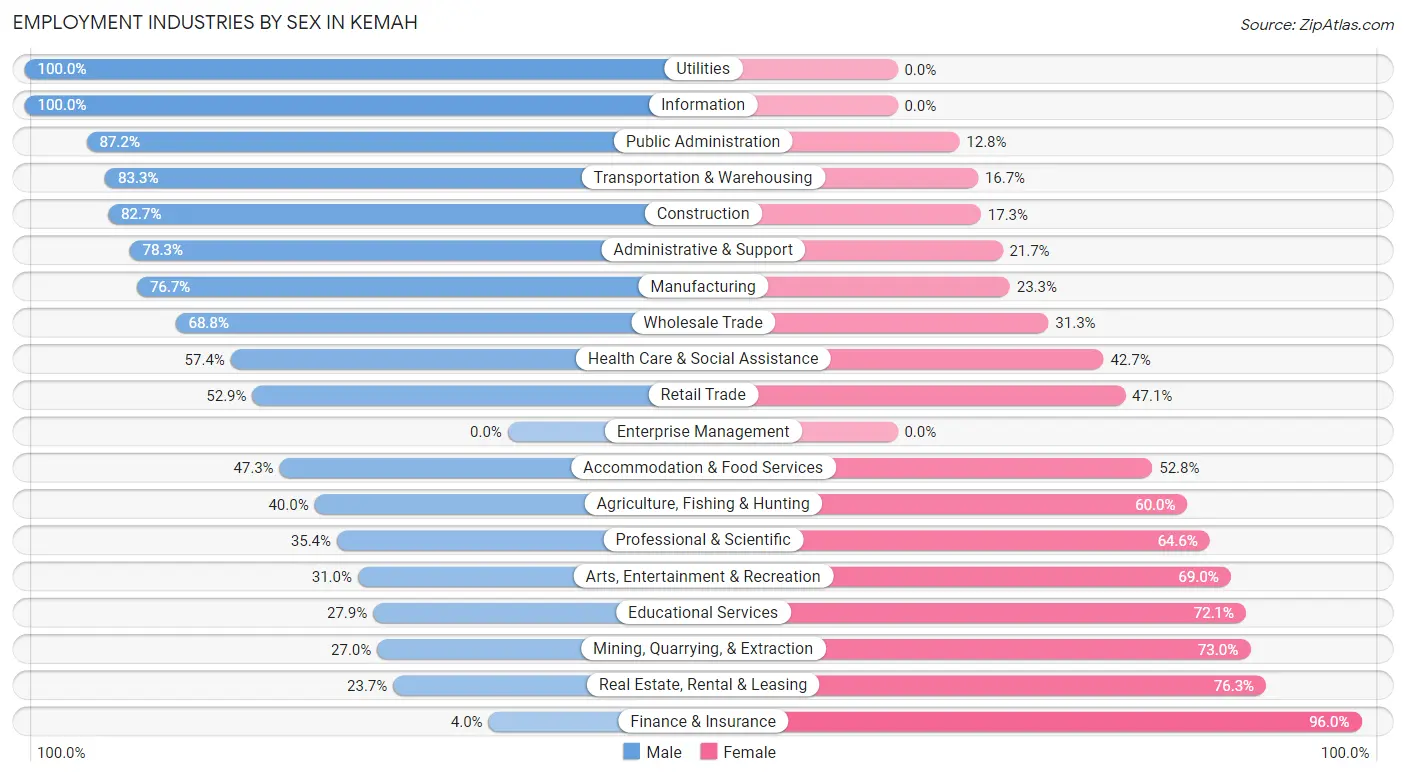
Employment Industries by Sex in Kemah
The Kemah industries that see more men than women are Utilities (100.0%), Information (100.0%), and Public Administration (87.2%), whereas the industries that tend to have a higher number of women are Finance & Insurance (96.0%), Real Estate, Rental & Leasing (76.3%), and Mining, Quarrying, & Extraction (73.0%).
| Industry | Male | Female |
| Agriculture, Fishing & Hunting | 2 (40.0%) | 3 (60.0%) |
| Mining, Quarrying, & Extraction | 10 (27.0%) | 27 (73.0%) |
| Construction | 115 (82.7%) | 24 (17.3%) |
| Manufacturing | 66 (76.7%) | 20 (23.3%) |
| Wholesale Trade | 11 (68.8%) | 5 (31.2%) |
| Retail Trade | 37 (52.9%) | 33 (47.1%) |
| Transportation & Warehousing | 45 (83.3%) | 9 (16.7%) |
| Utilities | 4 (100.0%) | 0 (0.0%) |
| Information | 14 (100.0%) | 0 (0.0%) |
| Finance & Insurance | 2 (4.0%) | 48 (96.0%) |
| Real Estate, Rental & Leasing | 14 (23.7%) | 45 (76.3%) |
| Professional & Scientific | 29 (35.4%) | 53 (64.6%) |
| Enterprise Management | 0 (0.0%) | 0 (0.0%) |
| Administrative & Support | 36 (78.3%) | 10 (21.7%) |
| Educational Services | 29 (27.9%) | 75 (72.1%) |
| Health Care & Social Assistance | 39 (57.4%) | 29 (42.6%) |
| Arts, Entertainment & Recreation | 9 (31.0%) | 20 (69.0%) |
| Accommodation & Food Services | 43 (47.2%) | 48 (52.7%) |
| Public Administration | 34 (87.2%) | 5 (12.8%) |
| Total | 557 (53.9%) | 476 (46.1%) |
Education in Kemah
School Enrollment in Kemah
The most common levels of schooling among the 509 students in Kemah are high school (156 | 30.6%), college / undergraduate (116 | 22.8%), and elementary school (92 | 18.1%).
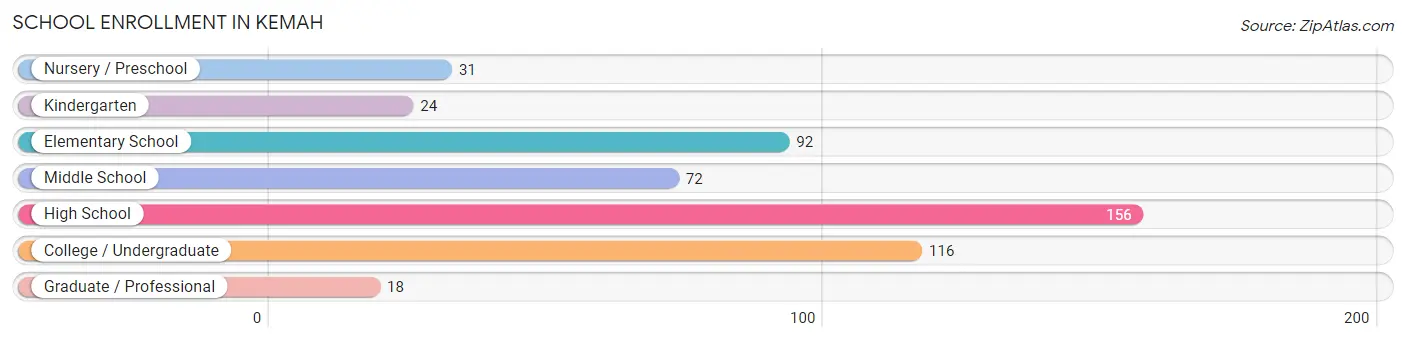
| School Level | # Students | % Students |
| Nursery / Preschool | 31 | 6.1% |
| Kindergarten | 24 | 4.7% |
| Elementary School | 92 | 18.1% |
| Middle School | 72 | 14.1% |
| High School | 156 | 30.6% |
| College / Undergraduate | 116 | 22.8% |
| Graduate / Professional | 18 | 3.5% |
| Total | 509 | 100.0% |
School Enrollment by Age by Funding Source in Kemah
Out of a total of 509 students who are enrolled in schools in Kemah, 35 (6.9%) attend a private institution, while the remaining 474 (93.1%) are enrolled in public schools. The age group of 25 to 34 year olds has the highest likelihood of being enrolled in private schools, with 6 (31.6% in the age bracket) enrolled. Conversely, the age group of 18 to 19 year olds has the lowest likelihood of being enrolled in a private school, with 77 (100.0% in the age bracket) attending a public institution.
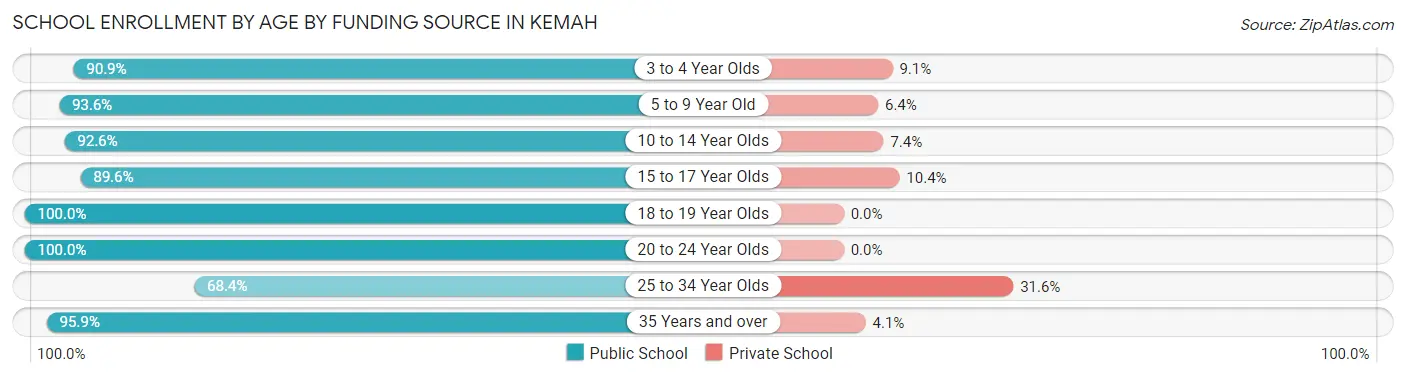
| Age Bracket | Public School | Private School |
| 3 to 4 Year Olds | 20 (90.9%) | 2 (9.1%) |
| 5 to 9 Year Old | 117 (93.6%) | 8 (6.4%) |
| 10 to 14 Year Olds | 75 (92.6%) | 6 (7.4%) |
| 15 to 17 Year Olds | 95 (89.6%) | 11 (10.4%) |
| 18 to 19 Year Olds | 77 (100.0%) | 0 (0.0%) |
| 20 to 24 Year Olds | 30 (100.0%) | 0 (0.0%) |
| 25 to 34 Year Olds | 13 (68.4%) | 6 (31.6%) |
| 35 Years and over | 47 (95.9%) | 2 (4.1%) |
| Total | 474 (93.1%) | 35 (6.9%) |
Educational Attainment by Field of Study in Kemah
Business (72 | 18.2%), science & technology (60 | 15.2%), education (54 | 13.7%), engineering (38 | 9.6%), and arts & humanities (31 | 7.9%) are the most common fields of study among 395 individuals in Kemah who have obtained a bachelor's degree or higher.
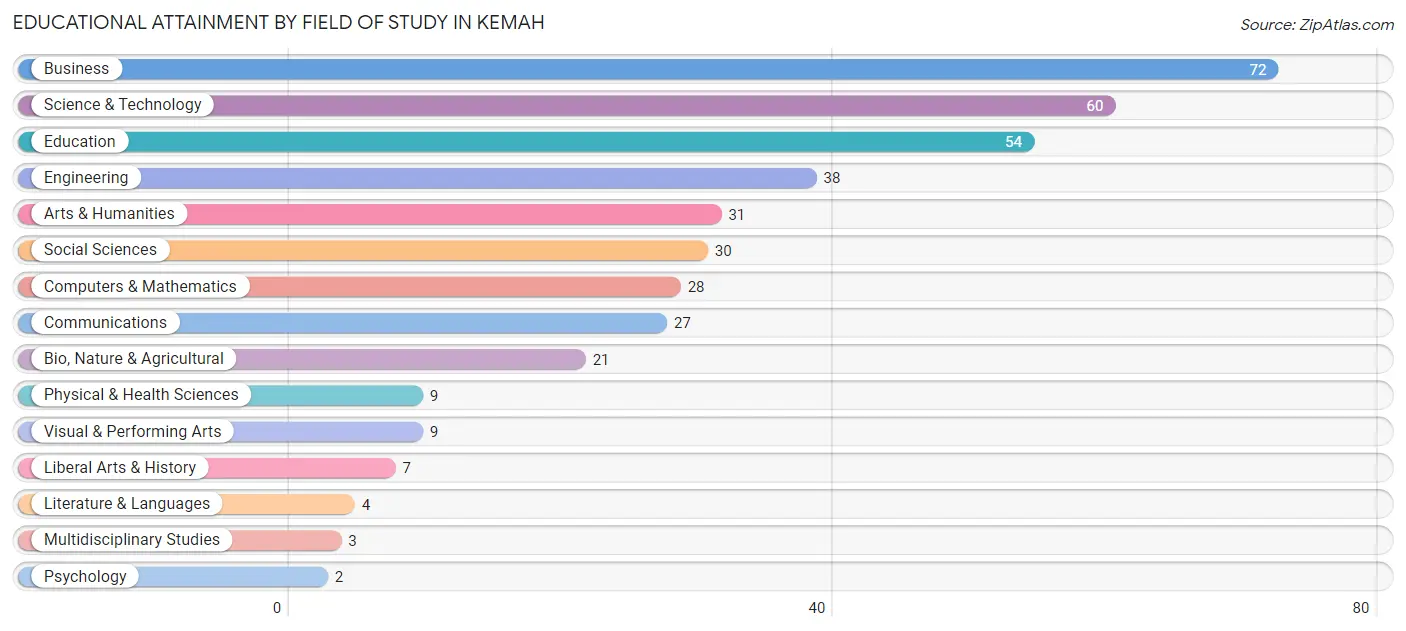
| Field of Study | # Graduates | % Graduates |
| Computers & Mathematics | 28 | 7.1% |
| Bio, Nature & Agricultural | 21 | 5.3% |
| Physical & Health Sciences | 9 | 2.3% |
| Psychology | 2 | 0.5% |
| Social Sciences | 30 | 7.6% |
| Engineering | 38 | 9.6% |
| Multidisciplinary Studies | 3 | 0.8% |
| Science & Technology | 60 | 15.2% |
| Business | 72 | 18.2% |
| Education | 54 | 13.7% |
| Literature & Languages | 4 | 1.0% |
| Liberal Arts & History | 7 | 1.8% |
| Visual & Performing Arts | 9 | 2.3% |
| Communications | 27 | 6.8% |
| Arts & Humanities | 31 | 7.9% |
| Total | 395 | 100.0% |
Transportation & Commute in Kemah
Vehicle Availability by Sex in Kemah
The most prevalent vehicle ownership categories in Kemah are males with 2 vehicles (221, accounting for 39.3%) and females with 2 vehicles (154, making up 46.7%).
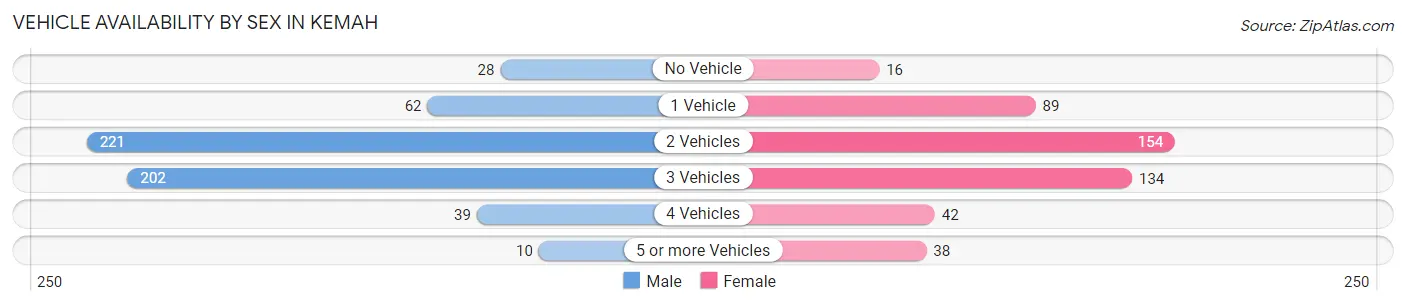
| Vehicles Available | Male | Female |
| No Vehicle | 28 (5.0%) | 16 (3.4%) |
| 1 Vehicle | 62 (11.0%) | 89 (18.8%) |
| 2 Vehicles | 221 (39.3%) | 154 (32.6%) |
| 3 Vehicles | 202 (35.9%) | 134 (28.3%) |
| 4 Vehicles | 39 (6.9%) | 42 (8.9%) |
| 5 or more Vehicles | 10 (1.8%) | 38 (8.0%) |
| Total | 562 (100.0%) | 473 (100.0%) |
Commute Time in Kemah
The most frequently occuring commute durations in Kemah are 30 to 34 minutes (251 commuters, 28.3%), 10 to 14 minutes (101 commuters, 11.4%), and 60 to 89 minutes (90 commuters, 10.1%).
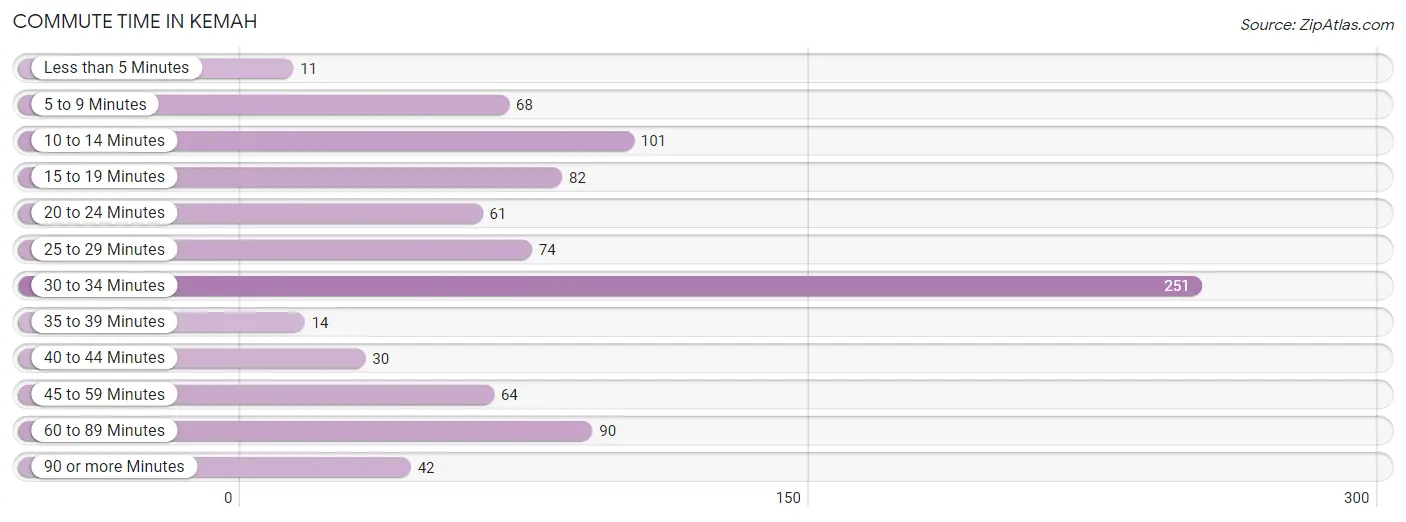
| Commute Time | # Commuters | % Commuters |
| Less than 5 Minutes | 11 | 1.2% |
| 5 to 9 Minutes | 68 | 7.7% |
| 10 to 14 Minutes | 101 | 11.4% |
| 15 to 19 Minutes | 82 | 9.2% |
| 20 to 24 Minutes | 61 | 6.9% |
| 25 to 29 Minutes | 74 | 8.3% |
| 30 to 34 Minutes | 251 | 28.3% |
| 35 to 39 Minutes | 14 | 1.6% |
| 40 to 44 Minutes | 30 | 3.4% |
| 45 to 59 Minutes | 64 | 7.2% |
| 60 to 89 Minutes | 90 | 10.1% |
| 90 or more Minutes | 42 | 4.7% |
Commute Time by Sex in Kemah
The most common commute times in Kemah are 30 to 34 minutes (204 commuters, 39.7%) for males and 10 to 14 minutes (78 commuters, 20.9%) for females.
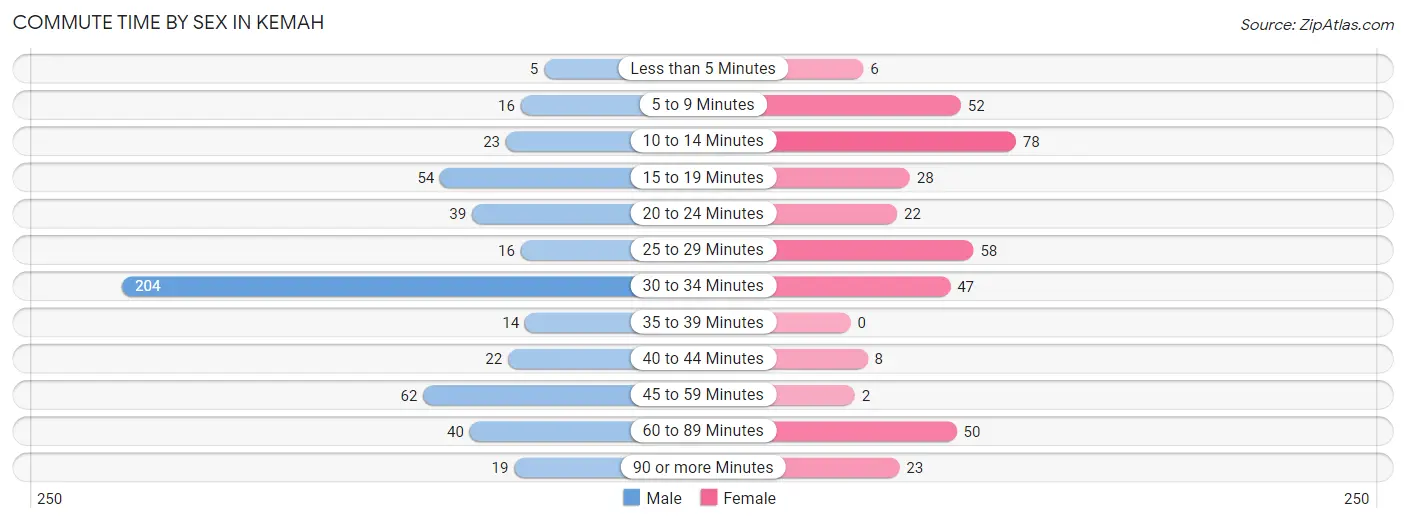
| Commute Time | Male | Female |
| Less than 5 Minutes | 5 (1.0%) | 6 (1.6%) |
| 5 to 9 Minutes | 16 (3.1%) | 52 (13.9%) |
| 10 to 14 Minutes | 23 (4.5%) | 78 (20.9%) |
| 15 to 19 Minutes | 54 (10.5%) | 28 (7.5%) |
| 20 to 24 Minutes | 39 (7.6%) | 22 (5.9%) |
| 25 to 29 Minutes | 16 (3.1%) | 58 (15.5%) |
| 30 to 34 Minutes | 204 (39.7%) | 47 (12.6%) |
| 35 to 39 Minutes | 14 (2.7%) | 0 (0.0%) |
| 40 to 44 Minutes | 22 (4.3%) | 8 (2.1%) |
| 45 to 59 Minutes | 62 (12.1%) | 2 (0.5%) |
| 60 to 89 Minutes | 40 (7.8%) | 50 (13.4%) |
| 90 or more Minutes | 19 (3.7%) | 23 (6.1%) |
Time of Departure to Work by Sex in Kemah
The most frequent times of departure to work in Kemah are 7:00 AM to 7:29 AM (98, 19.1%) for males and 6:30 AM to 6:59 AM (58, 15.5%) for females.
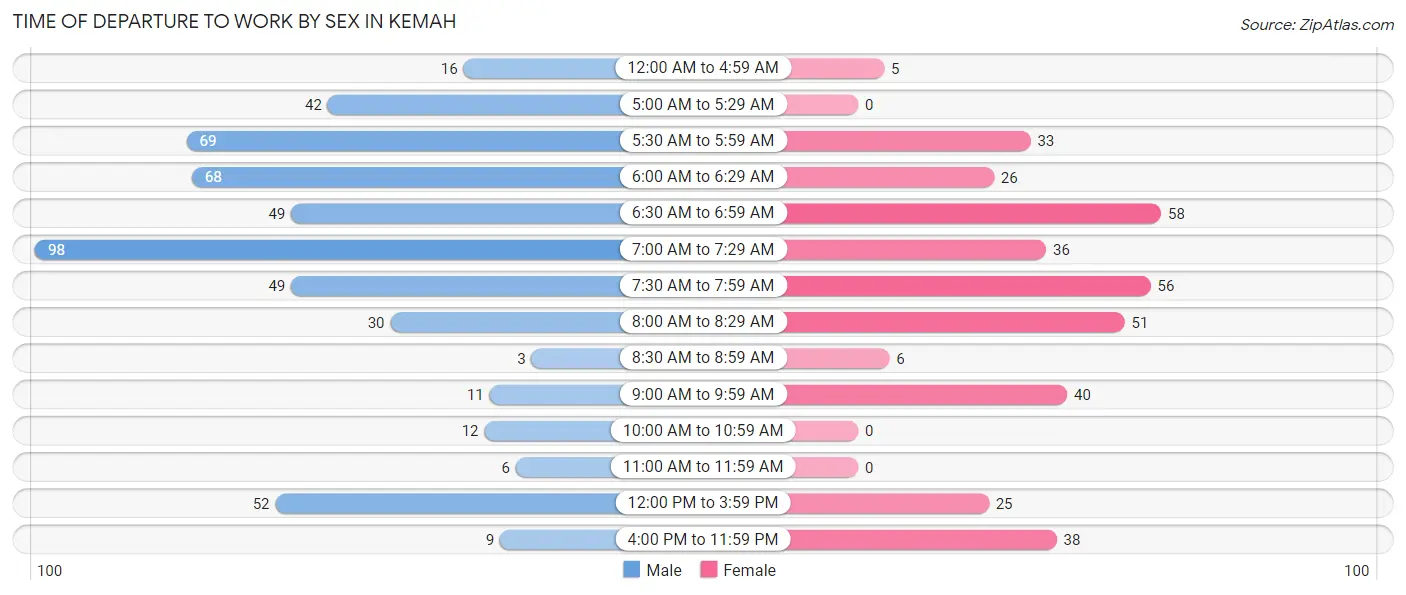
| Time of Departure | Male | Female |
| 12:00 AM to 4:59 AM | 16 (3.1%) | 5 (1.3%) |
| 5:00 AM to 5:29 AM | 42 (8.2%) | 0 (0.0%) |
| 5:30 AM to 5:59 AM | 69 (13.4%) | 33 (8.8%) |
| 6:00 AM to 6:29 AM | 68 (13.2%) | 26 (7.0%) |
| 6:30 AM to 6:59 AM | 49 (9.5%) | 58 (15.5%) |
| 7:00 AM to 7:29 AM | 98 (19.1%) | 36 (9.6%) |
| 7:30 AM to 7:59 AM | 49 (9.5%) | 56 (15.0%) |
| 8:00 AM to 8:29 AM | 30 (5.8%) | 51 (13.6%) |
| 8:30 AM to 8:59 AM | 3 (0.6%) | 6 (1.6%) |
| 9:00 AM to 9:59 AM | 11 (2.1%) | 40 (10.7%) |
| 10:00 AM to 10:59 AM | 12 (2.3%) | 0 (0.0%) |
| 11:00 AM to 11:59 AM | 6 (1.2%) | 0 (0.0%) |
| 12:00 PM to 3:59 PM | 52 (10.1%) | 25 (6.7%) |
| 4:00 PM to 11:59 PM | 9 (1.8%) | 38 (10.2%) |
| Total | 514 (100.0%) | 374 (100.0%) |
Housing Occupancy in Kemah
Occupancy by Ownership in Kemah
Of the total 770 dwellings in Kemah, owner-occupied units account for 543 (70.5%), while renter-occupied units make up 227 (29.5%).
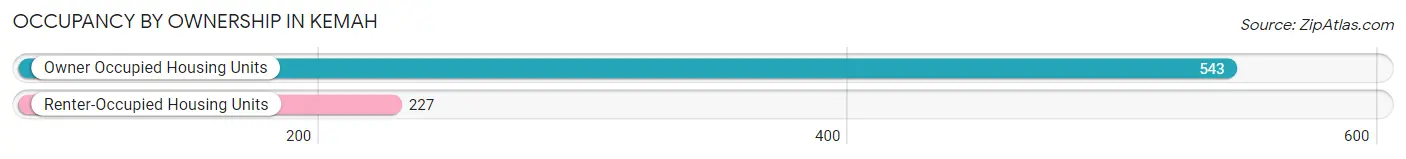
| Occupancy | # Housing Units | % Housing Units |
| Owner Occupied Housing Units | 543 | 70.5% |
| Renter-Occupied Housing Units | 227 | 29.5% |
| Total Occupied Housing Units | 770 | 100.0% |
Occupancy by Household Size in Kemah
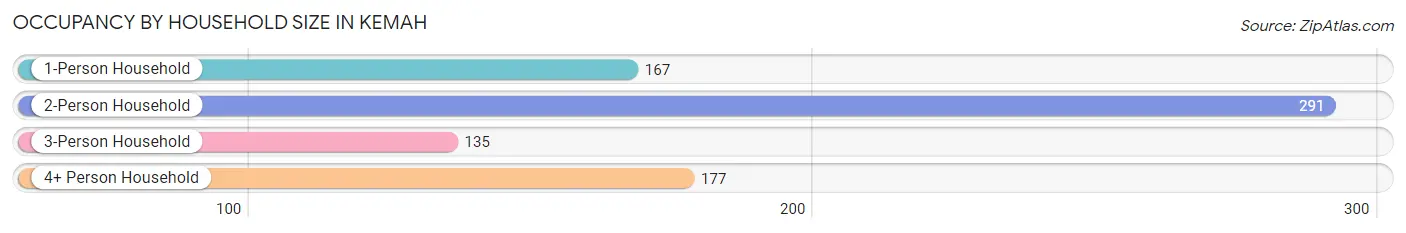
| Household Size | # Housing Units | % Housing Units |
| 1-Person Household | 167 | 21.7% |
| 2-Person Household | 291 | 37.8% |
| 3-Person Household | 135 | 17.5% |
| 4+ Person Household | 177 | 23.0% |
| Total Housing Units | 770 | 100.0% |
Occupancy by Ownership by Household Size in Kemah
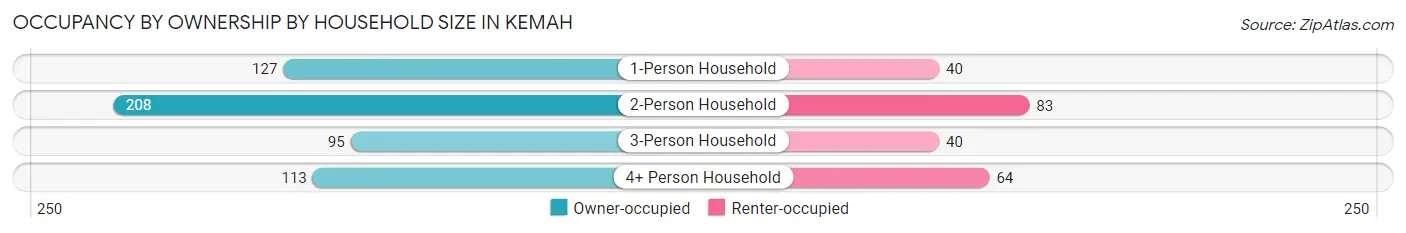
| Household Size | Owner-occupied | Renter-occupied |
| 1-Person Household | 127 (76.0%) | 40 (23.9%) |
| 2-Person Household | 208 (71.5%) | 83 (28.5%) |
| 3-Person Household | 95 (70.4%) | 40 (29.6%) |
| 4+ Person Household | 113 (63.8%) | 64 (36.2%) |
| Total Housing Units | 543 (70.5%) | 227 (29.5%) |
Occupancy by Educational Attainment in Kemah
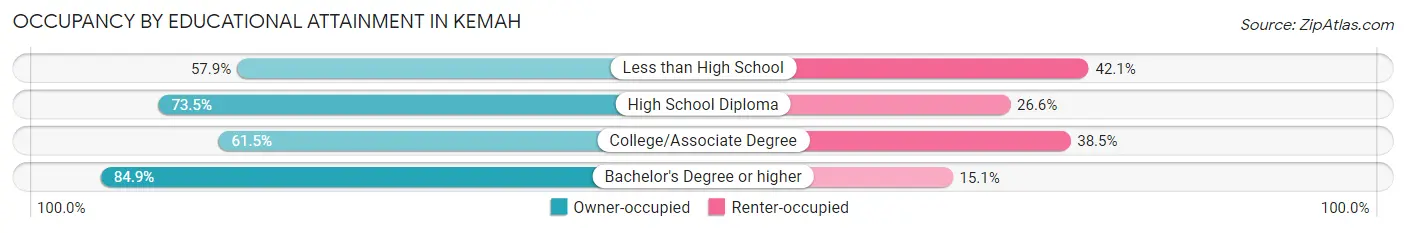
| Household Size | Owner-occupied | Renter-occupied |
| Less than High School | 44 (57.9%) | 32 (42.1%) |
| High School Diploma | 83 (73.5%) | 30 (26.6%) |
| College/Associate Degree | 203 (61.5%) | 127 (38.5%) |
| Bachelor's Degree or higher | 213 (84.9%) | 38 (15.1%) |
Occupancy by Age of Householder in Kemah
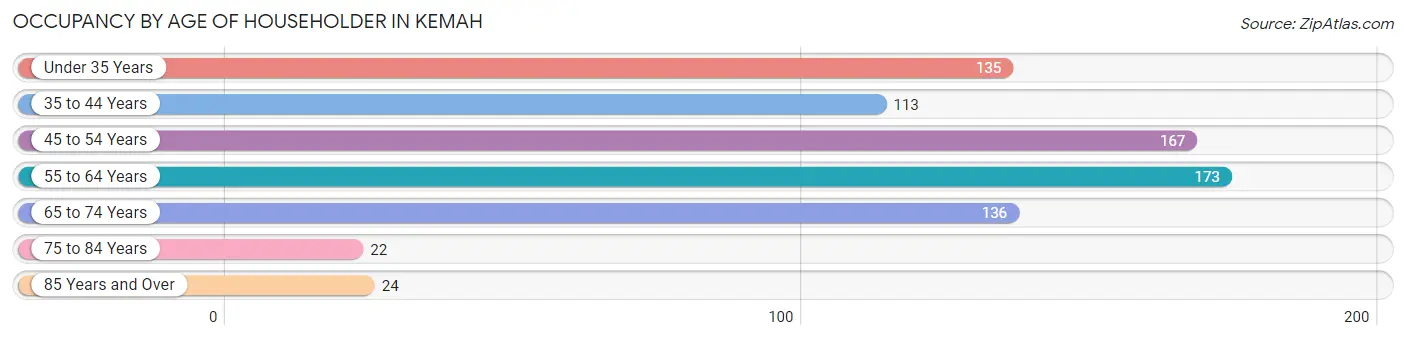
| Age Bracket | # Households | % Households |
| Under 35 Years | 135 | 17.5% |
| 35 to 44 Years | 113 | 14.7% |
| 45 to 54 Years | 167 | 21.7% |
| 55 to 64 Years | 173 | 22.5% |
| 65 to 74 Years | 136 | 17.7% |
| 75 to 84 Years | 22 | 2.9% |
| 85 Years and Over | 24 | 3.1% |
| Total | 770 | 100.0% |
Housing Finances in Kemah
Median Income by Occupancy in Kemah
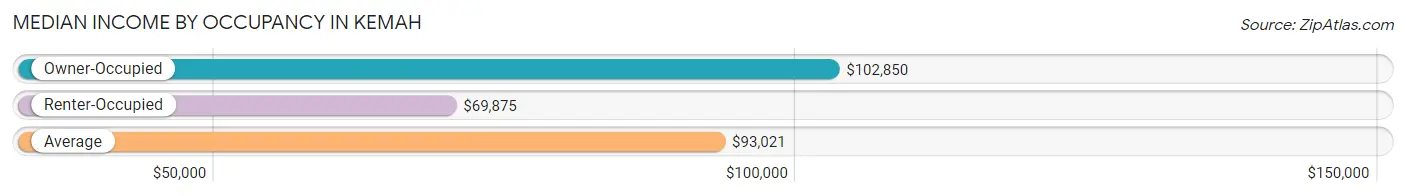
| Occupancy Type | # Households | Median Income |
| Owner-Occupied | 543 (70.5%) | $102,850 |
| Renter-Occupied | 227 (29.5%) | $69,875 |
| Average | 770 (100.0%) | $93,021 |
Occupancy by Householder Income Bracket in Kemah
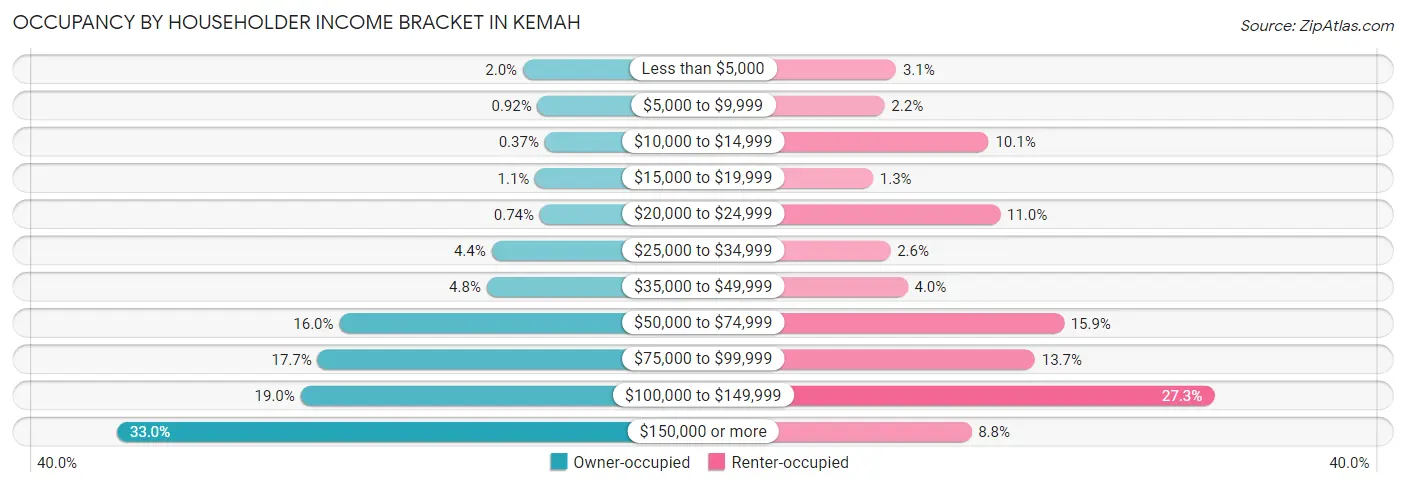
| Income Bracket | Owner-occupied | Renter-occupied |
| Less than $5,000 | 11 (2.0%) | 7 (3.1%) |
| $5,000 to $9,999 | 5 (0.9%) | 5 (2.2%) |
| $10,000 to $14,999 | 2 (0.4%) | 23 (10.1%) |
| $15,000 to $19,999 | 6 (1.1%) | 3 (1.3%) |
| $20,000 to $24,999 | 4 (0.7%) | 25 (11.0%) |
| $25,000 to $34,999 | 24 (4.4%) | 6 (2.6%) |
| $35,000 to $49,999 | 26 (4.8%) | 9 (4.0%) |
| $50,000 to $74,999 | 87 (16.0%) | 36 (15.9%) |
| $75,000 to $99,999 | 96 (17.7%) | 31 (13.7%) |
| $100,000 to $149,999 | 103 (19.0%) | 62 (27.3%) |
| $150,000 or more | 179 (33.0%) | 20 (8.8%) |
| Total | 543 (100.0%) | 227 (100.0%) |
Monthly Housing Cost Tiers in Kemah
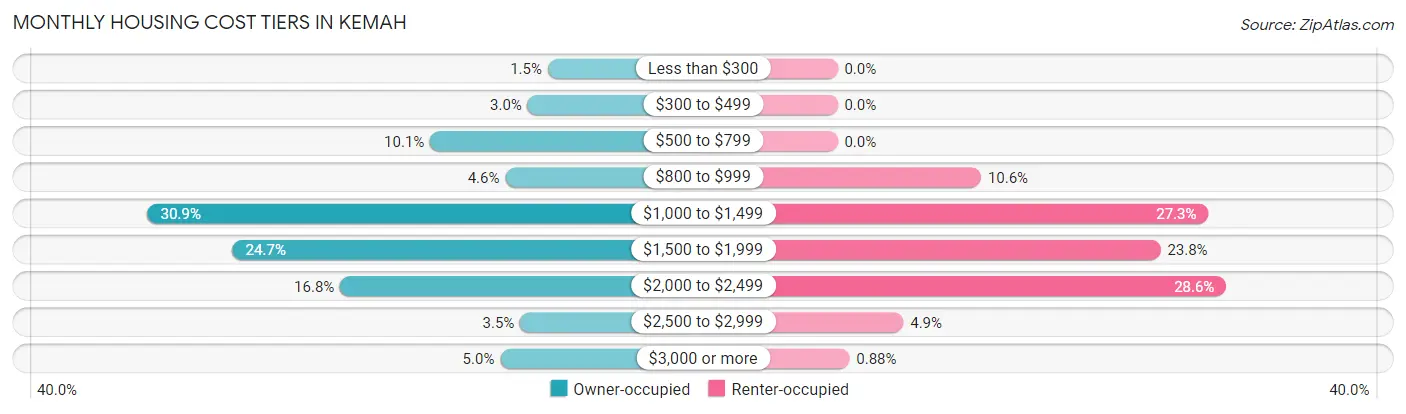
| Monthly Cost | Owner-occupied | Renter-occupied |
| Less than $300 | 8 (1.5%) | 0 (0.0%) |
| $300 to $499 | 16 (2.9%) | 0 (0.0%) |
| $500 to $799 | 55 (10.1%) | 0 (0.0%) |
| $800 to $999 | 25 (4.6%) | 24 (10.6%) |
| $1,000 to $1,499 | 168 (30.9%) | 62 (27.3%) |
| $1,500 to $1,999 | 134 (24.7%) | 54 (23.8%) |
| $2,000 to $2,499 | 91 (16.8%) | 65 (28.6%) |
| $2,500 to $2,999 | 19 (3.5%) | 11 (4.9%) |
| $3,000 or more | 27 (5.0%) | 2 (0.9%) |
| Total | 543 (100.0%) | 227 (100.0%) |
Physical Housing Characteristics in Kemah
Housing Structures in Kemah
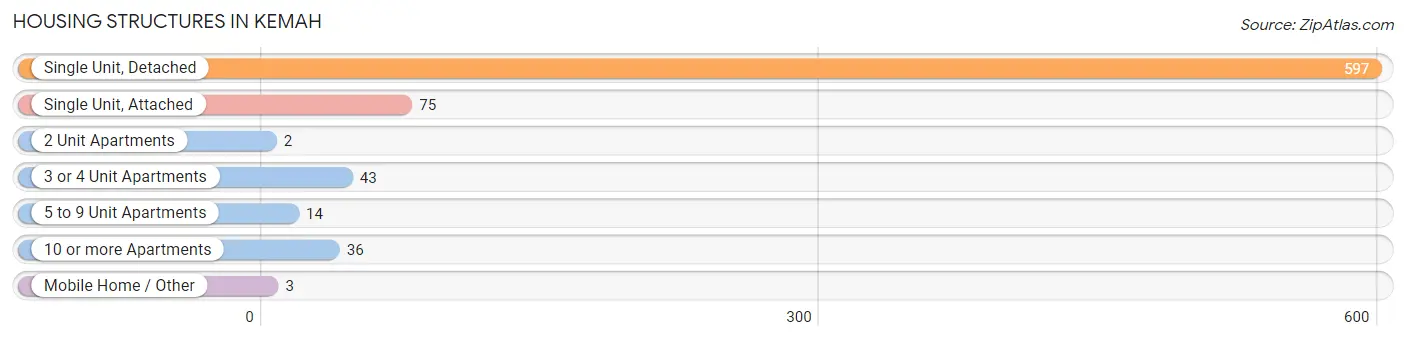
| Structure Type | # Housing Units | % Housing Units |
| Single Unit, Detached | 597 | 77.5% |
| Single Unit, Attached | 75 | 9.7% |
| 2 Unit Apartments | 2 | 0.3% |
| 3 or 4 Unit Apartments | 43 | 5.6% |
| 5 to 9 Unit Apartments | 14 | 1.8% |
| 10 or more Apartments | 36 | 4.7% |
| Mobile Home / Other | 3 | 0.4% |
| Total | 770 | 100.0% |
Housing Structures by Occupancy in Kemah
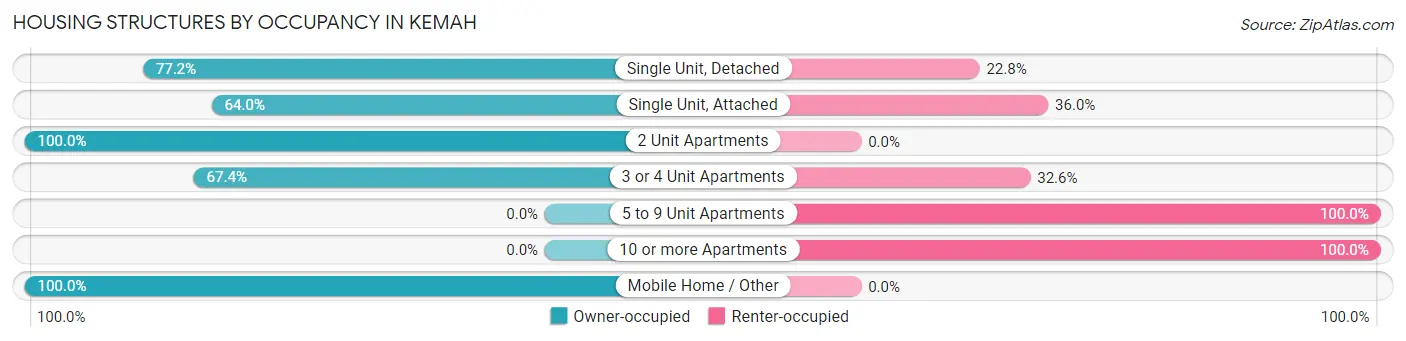
| Structure Type | Owner-occupied | Renter-occupied |
| Single Unit, Detached | 461 (77.2%) | 136 (22.8%) |
| Single Unit, Attached | 48 (64.0%) | 27 (36.0%) |
| 2 Unit Apartments | 2 (100.0%) | 0 (0.0%) |
| 3 or 4 Unit Apartments | 29 (67.4%) | 14 (32.6%) |
| 5 to 9 Unit Apartments | 0 (0.0%) | 14 (100.0%) |
| 10 or more Apartments | 0 (0.0%) | 36 (100.0%) |
| Mobile Home / Other | 3 (100.0%) | 0 (0.0%) |
| Total | 543 (70.5%) | 227 (29.5%) |
Housing Structures by Number of Rooms in Kemah
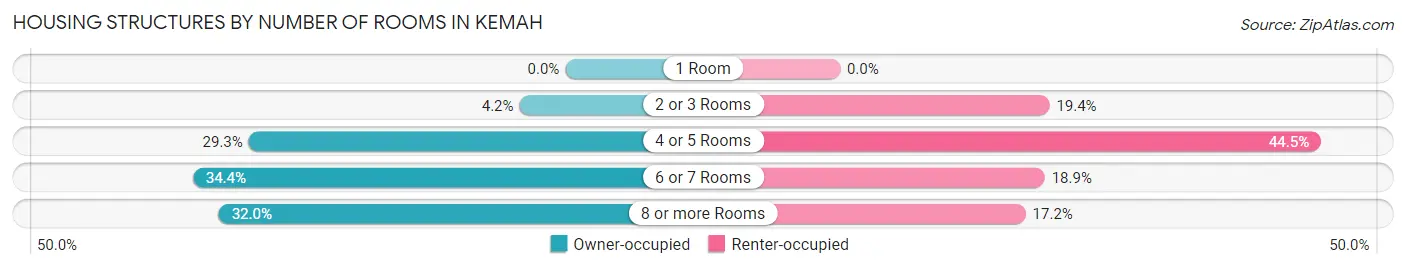
| Number of Rooms | Owner-occupied | Renter-occupied |
| 1 Room | 0 (0.0%) | 0 (0.0%) |
| 2 or 3 Rooms | 23 (4.2%) | 44 (19.4%) |
| 4 or 5 Rooms | 159 (29.3%) | 101 (44.5%) |
| 6 or 7 Rooms | 187 (34.4%) | 43 (18.9%) |
| 8 or more Rooms | 174 (32.0%) | 39 (17.2%) |
| Total | 543 (100.0%) | 227 (100.0%) |
Housing Structure by Heating Type in Kemah
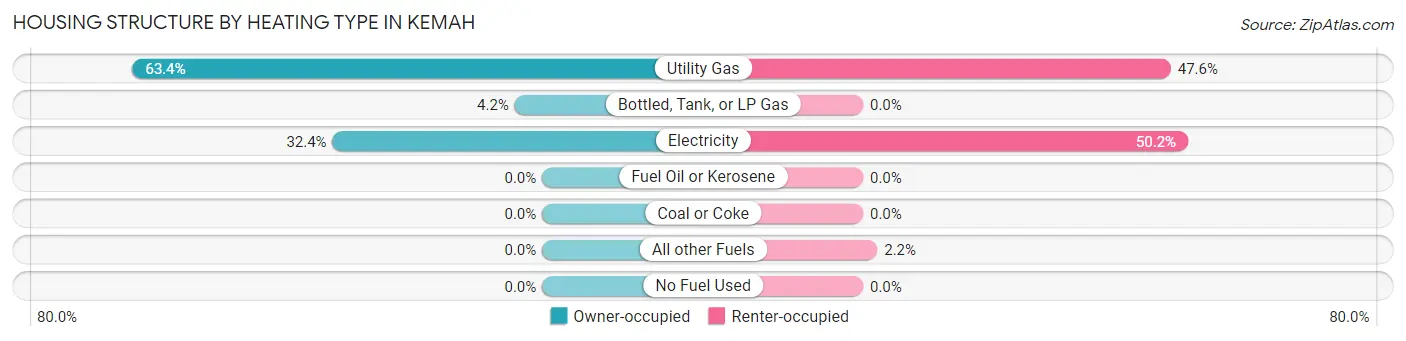
| Heating Type | Owner-occupied | Renter-occupied |
| Utility Gas | 344 (63.3%) | 108 (47.6%) |
| Bottled, Tank, or LP Gas | 23 (4.2%) | 0 (0.0%) |
| Electricity | 176 (32.4%) | 114 (50.2%) |
| Fuel Oil or Kerosene | 0 (0.0%) | 0 (0.0%) |
| Coal or Coke | 0 (0.0%) | 0 (0.0%) |
| All other Fuels | 0 (0.0%) | 5 (2.2%) |
| No Fuel Used | 0 (0.0%) | 0 (0.0%) |
| Total | 543 (100.0%) | 227 (100.0%) |
Household Vehicle Usage in Kemah
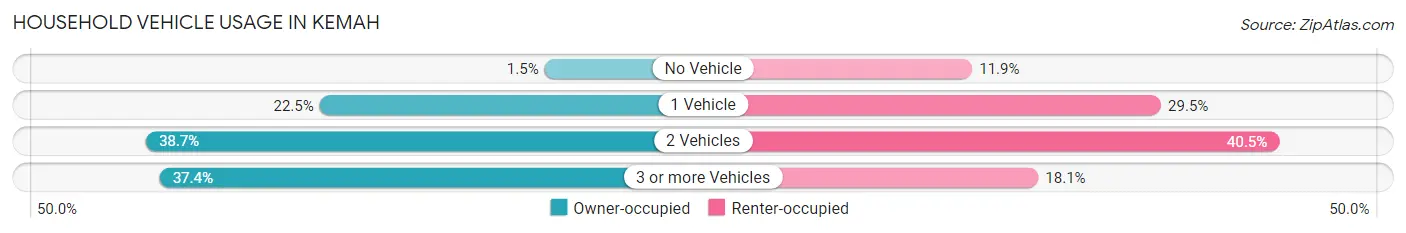
| Vehicles per Household | Owner-occupied | Renter-occupied |
| No Vehicle | 8 (1.5%) | 27 (11.9%) |
| 1 Vehicle | 122 (22.5%) | 67 (29.5%) |
| 2 Vehicles | 210 (38.7%) | 92 (40.5%) |
| 3 or more Vehicles | 203 (37.4%) | 41 (18.1%) |
| Total | 543 (100.0%) | 227 (100.0%) |
Real Estate & Mortgages in Kemah
Real Estate and Mortgage Overview in Kemah
| Characteristic | Without Mortgage | With Mortgage |
| Housing Units | 182 | 361 |
| Median Property Value | $390,900 | $257,500 |
| Median Household Income | $92,647 | $131 |
| Monthly Housing Costs | $1,023 | $23 |
| Real Estate Taxes | $5,578 | $2 |
Property Value by Mortgage Status in Kemah
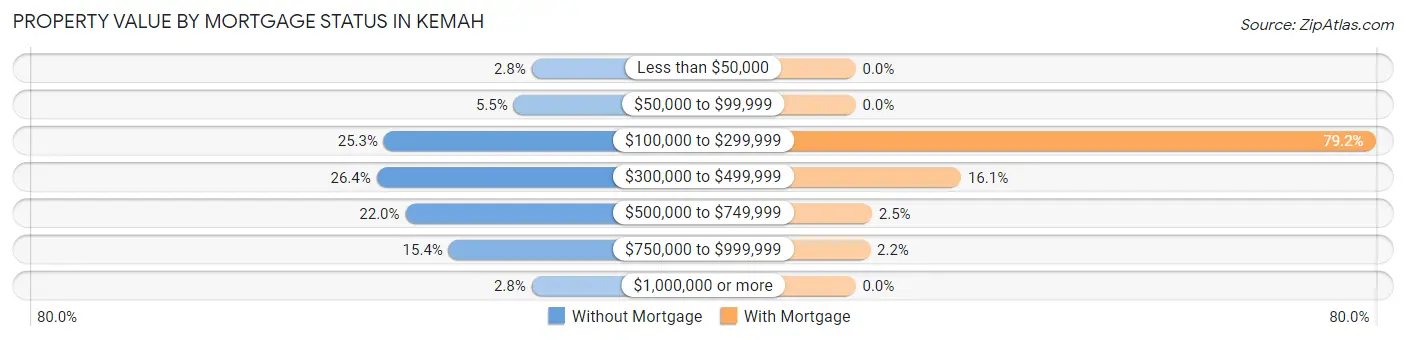
| Property Value | Without Mortgage | With Mortgage |
| Less than $50,000 | 5 (2.8%) | 0 (0.0%) |
| $50,000 to $99,999 | 10 (5.5%) | 0 (0.0%) |
| $100,000 to $299,999 | 46 (25.3%) | 286 (79.2%) |
| $300,000 to $499,999 | 48 (26.4%) | 58 (16.1%) |
| $500,000 to $749,999 | 40 (22.0%) | 9 (2.5%) |
| $750,000 to $999,999 | 28 (15.4%) | 8 (2.2%) |
| $1,000,000 or more | 5 (2.8%) | 0 (0.0%) |
| Total | 182 (100.0%) | 361 (100.0%) |
Household Income by Mortgage Status in Kemah
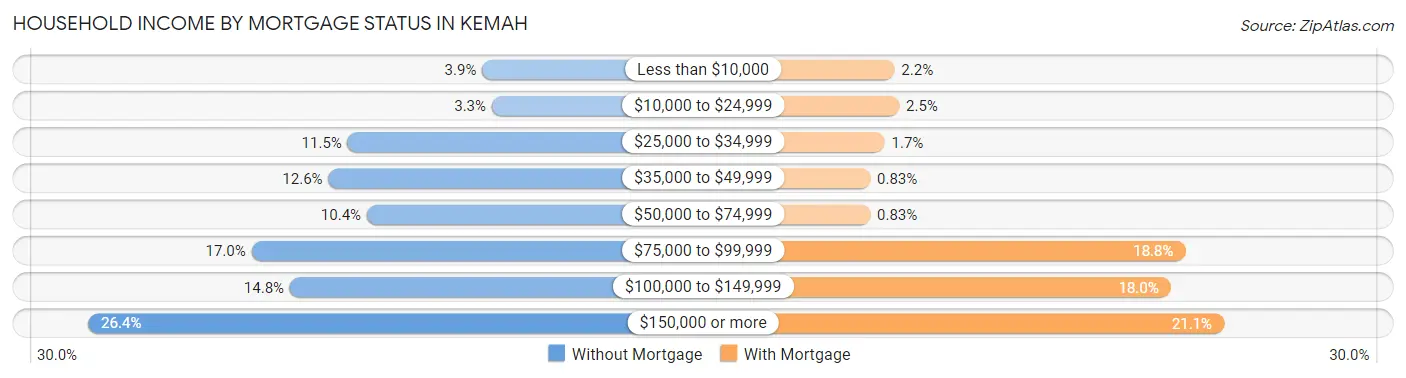
| Household Income | Without Mortgage | With Mortgage |
| Less than $10,000 | 7 (3.8%) | 8 (2.2%) |
| $10,000 to $24,999 | 6 (3.3%) | 9 (2.5%) |
| $25,000 to $34,999 | 21 (11.5%) | 6 (1.7%) |
| $35,000 to $49,999 | 23 (12.6%) | 3 (0.8%) |
| $50,000 to $74,999 | 19 (10.4%) | 3 (0.8%) |
| $75,000 to $99,999 | 31 (17.0%) | 68 (18.8%) |
| $100,000 to $149,999 | 27 (14.8%) | 65 (18.0%) |
| $150,000 or more | 48 (26.4%) | 76 (21.0%) |
| Total | 182 (100.0%) | 361 (100.0%) |
Property Value to Household Income Ratio in Kemah
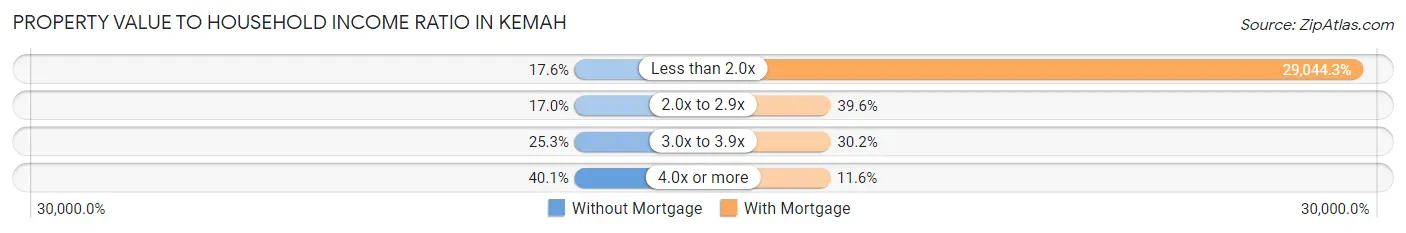
| Value-to-Income Ratio | Without Mortgage | With Mortgage |
| Less than 2.0x | 32 (17.6%) | 104,850 (29,044.3%) |
| 2.0x to 2.9x | 31 (17.0%) | 143 (39.6%) |
| 3.0x to 3.9x | 46 (25.3%) | 109 (30.2%) |
| 4.0x or more | 73 (40.1%) | 42 (11.6%) |
| Total | 182 (100.0%) | 361 (100.0%) |
Real Estate Taxes by Mortgage Status in Kemah
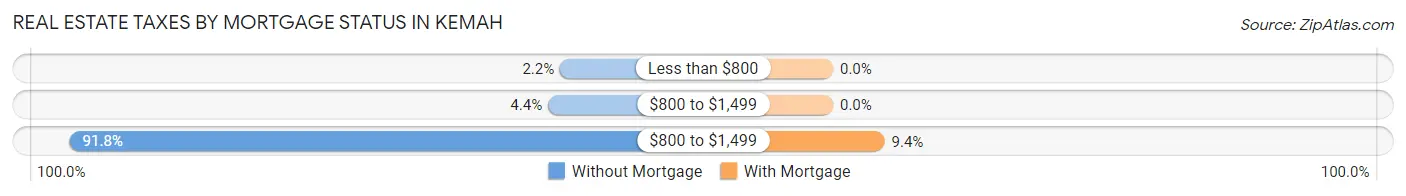
| Property Taxes | Without Mortgage | With Mortgage |
| Less than $800 | 4 (2.2%) | 0 (0.0%) |
| $800 to $1,499 | 8 (4.4%) | 0 (0.0%) |
| $800 to $1,499 | 167 (91.8%) | 34 (9.4%) |
| Total | 182 (100.0%) | 361 (100.0%) |
Health & Disability in Kemah
Health Insurance Coverage by Age in Kemah
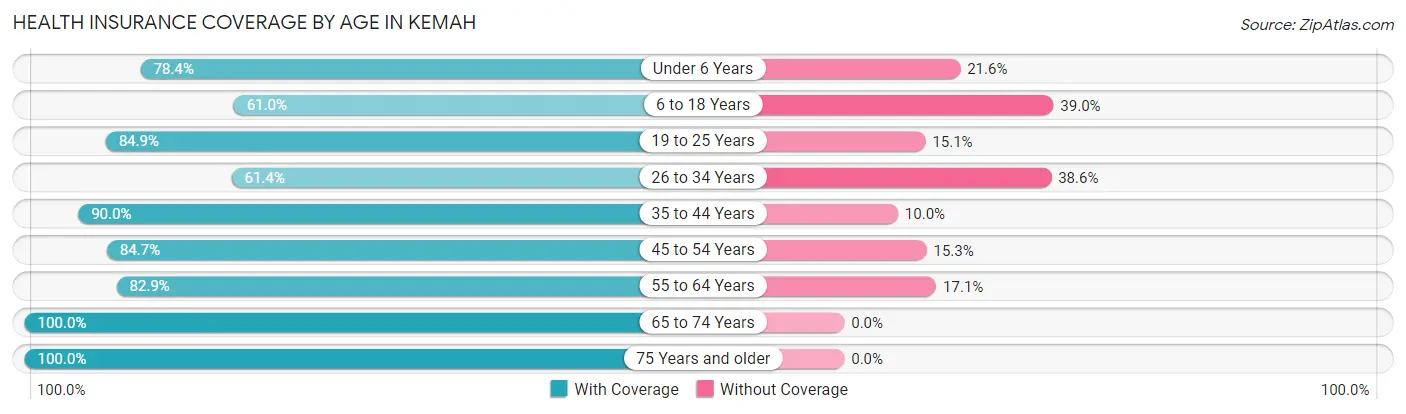
| Age Bracket | With Coverage | Without Coverage |
| Under 6 Years | 87 (78.4%) | 24 (21.6%) |
| 6 to 18 Years | 244 (61.0%) | 156 (39.0%) |
| 19 to 25 Years | 101 (84.9%) | 18 (15.1%) |
| 26 to 34 Years | 148 (61.4%) | 93 (38.6%) |
| 35 to 44 Years | 180 (90.0%) | 20 (10.0%) |
| 45 to 54 Years | 243 (84.7%) | 44 (15.3%) |
| 55 to 64 Years | 237 (82.9%) | 49 (17.1%) |
| 65 to 74 Years | 223 (100.0%) | 0 (0.0%) |
| 75 Years and older | 73 (100.0%) | 0 (0.0%) |
| Total | 1,536 (79.2%) | 404 (20.8%) |
Health Insurance Coverage by Citizenship Status in Kemah
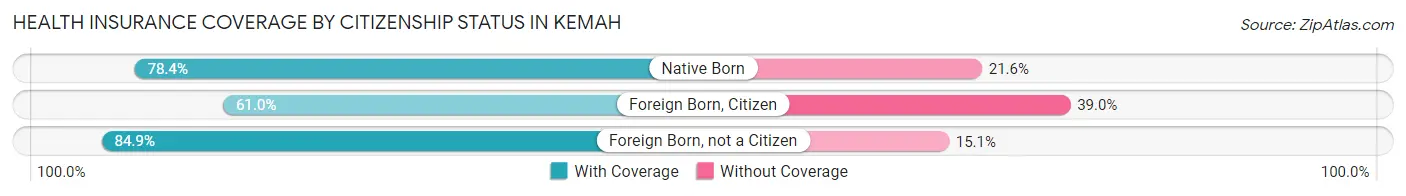
| Citizenship Status | With Coverage | Without Coverage |
| Native Born | 87 (78.4%) | 24 (21.6%) |
| Foreign Born, Citizen | 244 (61.0%) | 156 (39.0%) |
| Foreign Born, not a Citizen | 101 (84.9%) | 18 (15.1%) |
Health Insurance Coverage by Household Income in Kemah
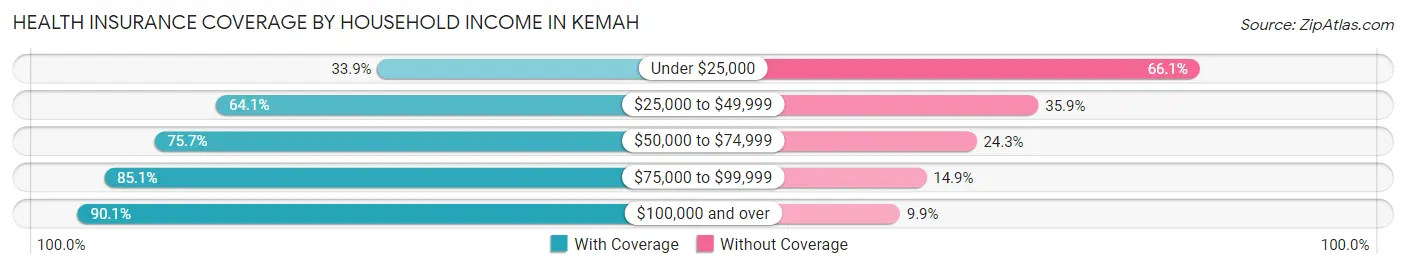
| Household Income | With Coverage | Without Coverage |
| Under $25,000 | 81 (33.9%) | 158 (66.1%) |
| $25,000 to $49,999 | 84 (64.1%) | 47 (35.9%) |
| $50,000 to $74,999 | 159 (75.7%) | 51 (24.3%) |
| $75,000 to $99,999 | 223 (85.1%) | 39 (14.9%) |
| $100,000 and over | 989 (90.1%) | 109 (9.9%) |
Public vs Private Health Insurance Coverage by Age in Kemah
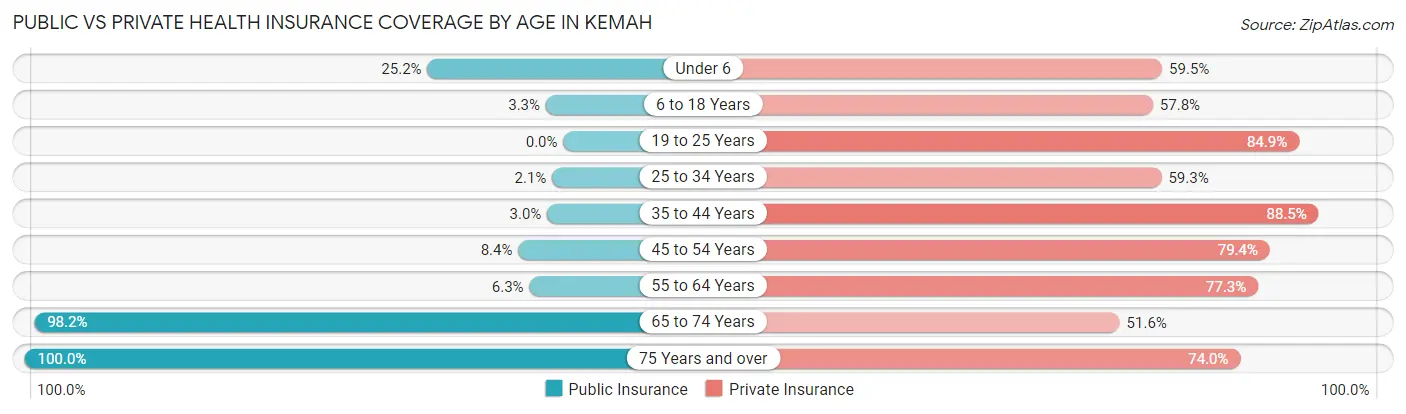
| Age Bracket | Public Insurance | Private Insurance |
| Under 6 | 28 (25.2%) | 66 (59.5%) |
| 6 to 18 Years | 13 (3.3%) | 231 (57.8%) |
| 19 to 25 Years | 0 (0.0%) | 101 (84.9%) |
| 25 to 34 Years | 5 (2.1%) | 143 (59.3%) |
| 35 to 44 Years | 6 (3.0%) | 177 (88.5%) |
| 45 to 54 Years | 24 (8.4%) | 228 (79.4%) |
| 55 to 64 Years | 18 (6.3%) | 221 (77.3%) |
| 65 to 74 Years | 219 (98.2%) | 115 (51.6%) |
| 75 Years and over | 73 (100.0%) | 54 (74.0%) |
| Total | 386 (19.9%) | 1,336 (68.9%) |
Disability Status by Sex by Age in Kemah
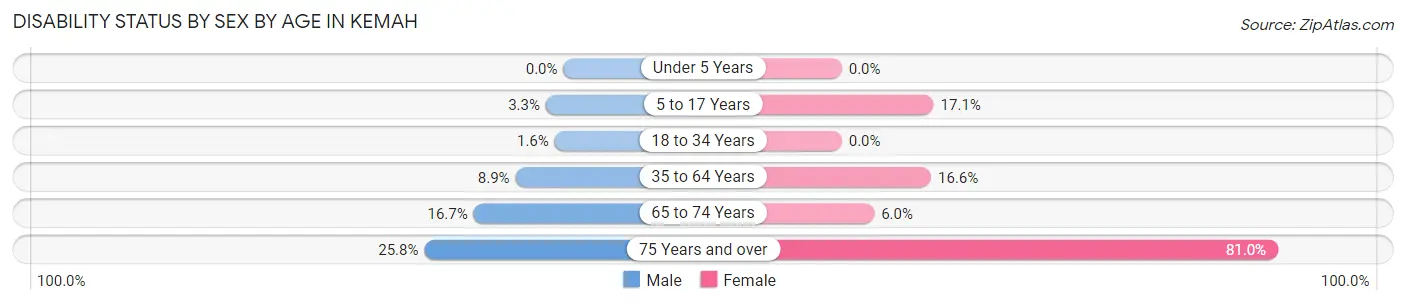
| Age Bracket | Male | Female |
| Under 5 Years | 0 (0.0%) | 0 (0.0%) |
| 5 to 17 Years | 6 (3.3%) | 30 (17.1%) |
| 18 to 34 Years | 4 (1.6%) | 0 (0.0%) |
| 35 to 64 Years | 36 (8.9%) | 61 (16.6%) |
| 65 to 74 Years | 15 (16.7%) | 8 (6.0%) |
| 75 Years and over | 8 (25.8%) | 34 (80.9%) |
Disability Class by Sex by Age in Kemah
Disability Class: Hearing Difficulty
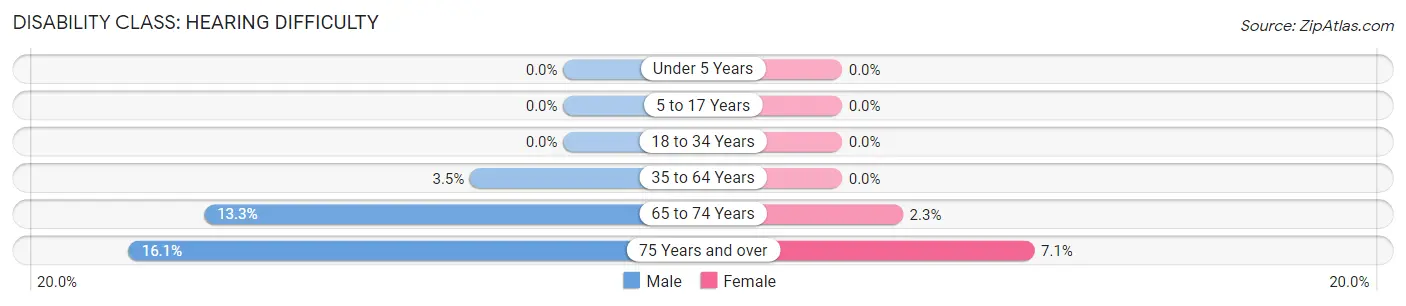
| Age Bracket | Male | Female |
| Under 5 Years | 0 (0.0%) | 0 (0.0%) |
| 5 to 17 Years | 0 (0.0%) | 0 (0.0%) |
| 18 to 34 Years | 0 (0.0%) | 0 (0.0%) |
| 35 to 64 Years | 14 (3.5%) | 0 (0.0%) |
| 65 to 74 Years | 12 (13.3%) | 3 (2.3%) |
| 75 Years and over | 5 (16.1%) | 3 (7.1%) |
Disability Class: Vision Difficulty
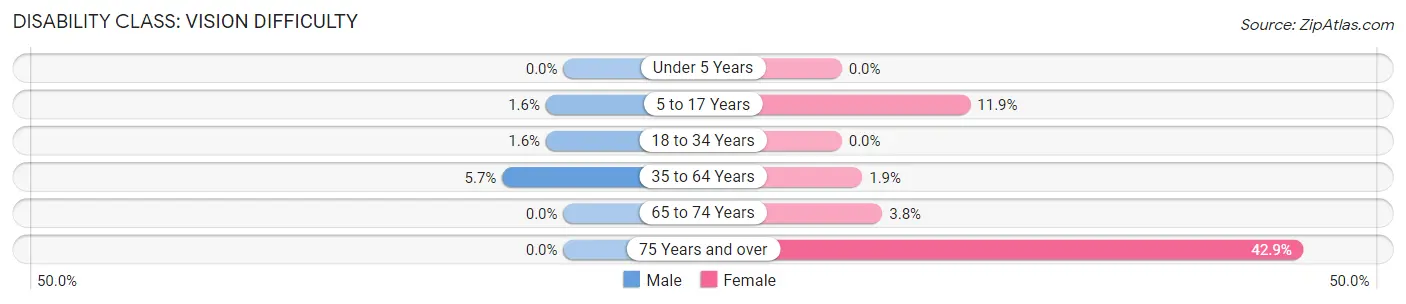
| Age Bracket | Male | Female |
| Under 5 Years | 0 (0.0%) | 0 (0.0%) |
| 5 to 17 Years | 3 (1.6%) | 21 (11.9%) |
| 18 to 34 Years | 4 (1.6%) | 0 (0.0%) |
| 35 to 64 Years | 23 (5.7%) | 7 (1.9%) |
| 65 to 74 Years | 0 (0.0%) | 5 (3.8%) |
| 75 Years and over | 0 (0.0%) | 18 (42.9%) |
Disability Class: Cognitive Difficulty
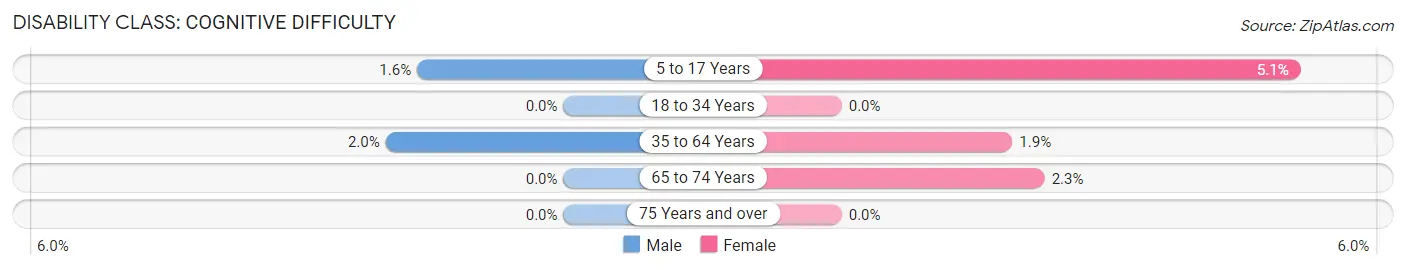
| Age Bracket | Male | Female |
| 5 to 17 Years | 3 (1.6%) | 9 (5.1%) |
| 18 to 34 Years | 0 (0.0%) | 0 (0.0%) |
| 35 to 64 Years | 8 (2.0%) | 7 (1.9%) |
| 65 to 74 Years | 0 (0.0%) | 3 (2.3%) |
| 75 Years and over | 0 (0.0%) | 0 (0.0%) |
Disability Class: Ambulatory Difficulty
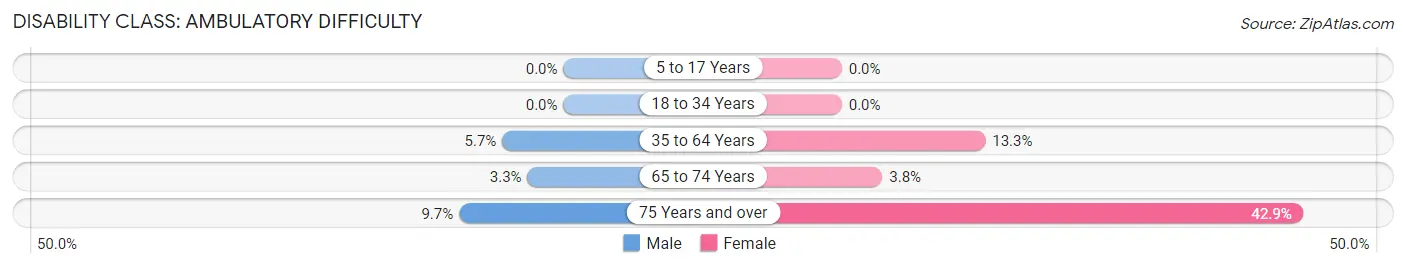
| Age Bracket | Male | Female |
| 5 to 17 Years | 0 (0.0%) | 0 (0.0%) |
| 18 to 34 Years | 0 (0.0%) | 0 (0.0%) |
| 35 to 64 Years | 23 (5.7%) | 49 (13.3%) |
| 65 to 74 Years | 3 (3.3%) | 5 (3.8%) |
| 75 Years and over | 3 (9.7%) | 18 (42.9%) |
Disability Class: Self-Care Difficulty
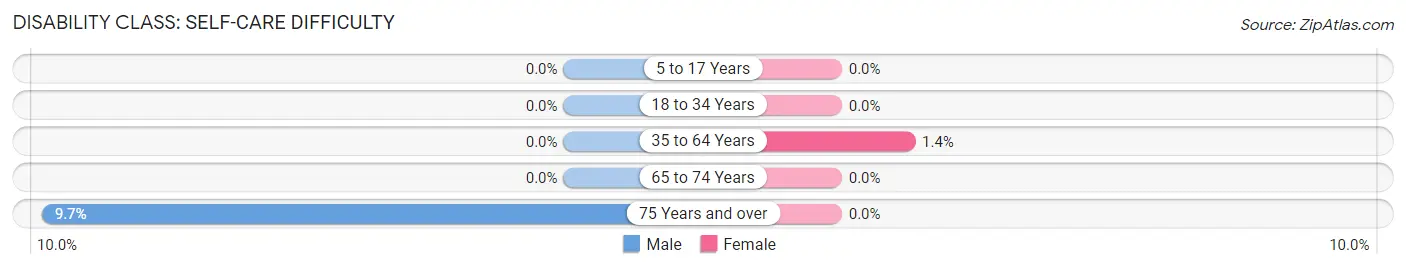
| Age Bracket | Male | Female |
| 5 to 17 Years | 0 (0.0%) | 0 (0.0%) |
| 18 to 34 Years | 0 (0.0%) | 0 (0.0%) |
| 35 to 64 Years | 0 (0.0%) | 5 (1.4%) |
| 65 to 74 Years | 0 (0.0%) | 0 (0.0%) |
| 75 Years and over | 3 (9.7%) | 0 (0.0%) |
Technology Access in Kemah
Computing Device Access in Kemah
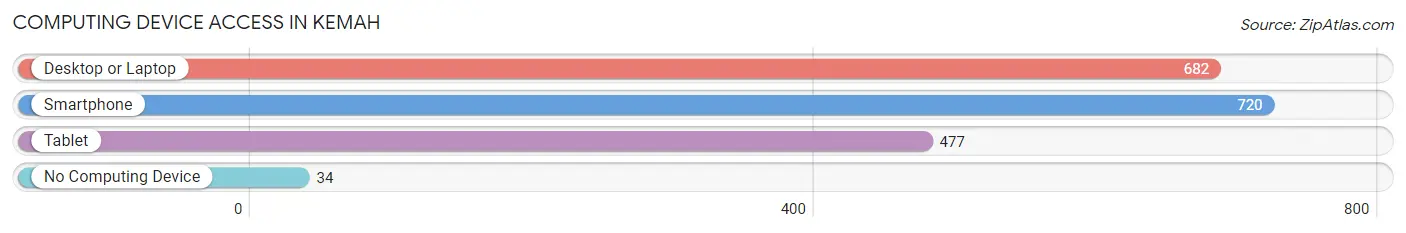
| Device Type | # Households | % Households |
| Desktop or Laptop | 682 | 88.6% |
| Smartphone | 720 | 93.5% |
| Tablet | 477 | 62.0% |
| No Computing Device | 34 | 4.4% |
| Total | 770 | 100.0% |
Internet Access in Kemah
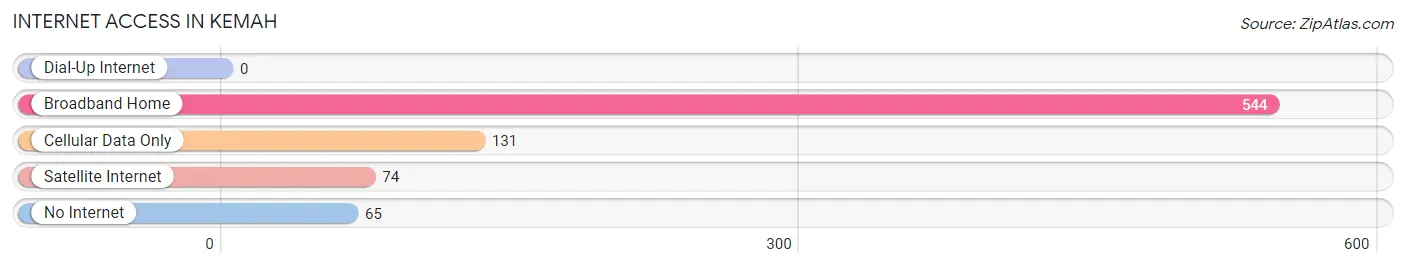
| Internet Type | # Households | % Households |
| Dial-Up Internet | 0 | 0.0% |
| Broadband Home | 544 | 70.7% |
| Cellular Data Only | 131 | 17.0% |
| Satellite Internet | 74 | 9.6% |
| No Internet | 65 | 8.4% |
| Total | 770 | 100.0% |
Kemah Summary
Kemah, Texas is a small city located in Galveston County, Texas, United States. It is situated on the shores of Galveston Bay, approximately 25 miles southeast of Houston. The city has a population of 2,330 as of the 2010 census.
History
Kemah was founded in 1867 by a group of settlers from the nearby town of Clear Lake. The town was named after the local Native American tribe, the Karankawa, who lived in the area. The settlers built a small fishing village on the bay, and the town quickly grew in size. By the late 19th century, Kemah had become a popular tourist destination, with visitors coming to enjoy the fishing, boating, and other recreational activities.
In the early 20th century, Kemah was a thriving port town, with a large fishing fleet and several canneries. The town also had a number of hotels and restaurants, as well as a movie theater.
In the 1950s, Kemah began to decline as the fishing industry moved away from the area. The town was further impacted by the construction of the Houston Ship Channel in the 1960s, which caused the bay to become polluted and the fishing industry to suffer.
In the late 20th century, Kemah began to experience a resurgence as a tourist destination. The city was revitalized with the construction of a boardwalk, which opened in 2001. The boardwalk features a variety of restaurants, shops, and attractions, and has become a popular destination for visitors from Houston and other nearby cities.
Geography
Kemah is located in southeastern Galveston County, on the shores of Galveston Bay. The city is situated approximately 25 miles southeast of Houston. The city has a total area of 2.2 square miles, all of which is land.
The city is bordered by Clear Lake to the north, League City to the east, and Dickinson to the south. The city is also adjacent to the cities of Seabrook and Taylor Lake Village.
Economy
Kemah’s economy is largely based on tourism. The city’s boardwalk is a popular destination for visitors from Houston and other nearby cities. The boardwalk features a variety of restaurants, shops, and attractions, including a Ferris wheel, a carousel, and a miniature golf course.
The city also has a number of marinas, which provide services for recreational boaters. In addition, Kemah is home to a number of businesses, including restaurants, retail stores, and boat repair shops.
Demographics
As of the 2010 census, Kemah had a population of 2,330. The racial makeup of the city was 79.3% White, 11.2% African American, 0.7% Native American, 0.7% Asian, 0.1% Pacific Islander, 5.2% from other races, and 2.8% from two or more races. Hispanic or Latino of any race were 14.2% of the population.
The median income for a household in the city was $50,938, and the median income for a family was $58,750. The per capita income for the city was $25,945. About 8.2% of families and 10.2% of the population were below the poverty line, including 14.2% of those under age 18 and 6.2% of those age 65 or over.
Common Questions
What is Per Capita Income in Kemah?
Per Capita income in Kemah is $42,087.
What is the Median Family Income in Kemah?
Median Family Income in Kemah is $94,792.
What is the Median Household income in Kemah?
Median Household Income in Kemah is $93,021.
What is Income or Wage Gap in Kemah?
Income or Wage Gap in Kemah is 30.7%.
Women in Kemah earn 69.3 cents for every dollar earned by a man.
What is Family Income Deficit in Kemah?
Family Income Deficit in Kemah is $8,573.
Families that are below poverty line in Kemah earn $8,573 less on average than the poverty threshold level.
What is Inequality or Gini Index in Kemah?
Inequality or Gini Index in Kemah is 0.37.
What is the Total Population of Kemah?
Total Population of Kemah is 1,945.
What is the Total Male Population of Kemah?
Total Male Population of Kemah is 986.
What is the Total Female Population of Kemah?
Total Female Population of Kemah is 959.
What is the Ratio of Males per 100 Females in Kemah?
There are 102.82 Males per 100 Females in Kemah.
What is the Ratio of Females per 100 Males in Kemah?
There are 97.26 Females per 100 Males in Kemah.
What is the Median Population Age in Kemah?
Median Population Age in Kemah is 41.5 Years.
What is the Average Family Size in Kemah
Average Family Size in Kemah is 2.9 People.
What is the Average Household Size in Kemah
Average Household Size in Kemah is 2.5 People.
How Large is the Labor Force in Kemah?
There are 1,104 People in the Labor Forcein in Kemah.
What is the Percentage of People in the Labor Force in Kemah?
70.2% of People are in the Labor Force in Kemah.
What is the Unemployment Rate in Kemah?
Unemployment Rate in Kemah is 6.1%.