Pevely, MO Map & Demographics
Pevely Map
Pevely Overview
$31,941
PER CAPITA INCOME
$78,780
AVG FAMILY INCOME
$68,141
AVG HOUSEHOLD INCOME
34.6%
WAGE / INCOME GAP [ % ]
65.4¢/ $1
WAGE / INCOME GAP [ $ ]
0.45
INEQUALITY / GINI INDEX
6,012
TOTAL POPULATION
3,195
MALE POPULATION
2,817
FEMALE POPULATION
113.42
MALES / 100 FEMALES
88.17
FEMALES / 100 MALES
34.2
MEDIAN AGE
3.5
AVG FAMILY SIZE
2.7
AVG HOUSEHOLD SIZE
2,960
LABOR FORCE [ PEOPLE ]
68.5%
PERCENT IN LABOR FORCE
4.7%
UNEMPLOYMENT RATE
Pevely Zip Codes
Pevely Area Codes
Income in Pevely
Income Overview in Pevely
Per Capita Income in Pevely is $31,941, while median incomes of families and households are $78,780 and $68,141 respectively.
| Characteristic | Number | Measure |
| Per Capita Income | 6,012 | $31,941 |
| Median Family Income | 1,405 | $78,780 |
| Mean Family Income | 1,405 | $103,225 |
| Median Household Income | 2,190 | $68,141 |
| Mean Household Income | 2,190 | $85,236 |
| Income Deficit | 1,405 | $0 |
| Wage / Income Gap (%) | 6,012 | 34.58% |
| Wage / Income Gap ($) | 6,012 | 65.42¢ per $1 |
| Gini / Inequality Index | 6,012 | 0.45 |
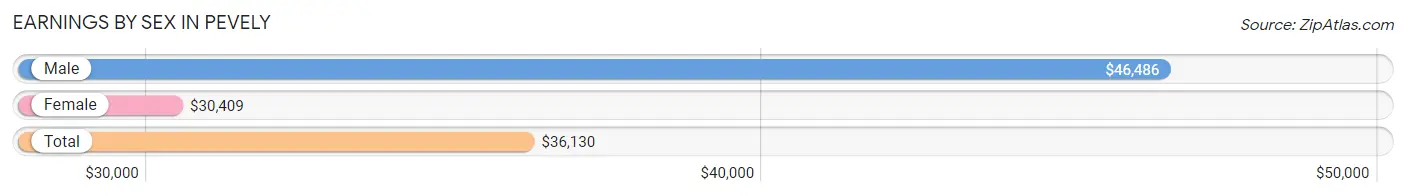
Earnings by Sex in Pevely
Average Earnings in Pevely are $36,130, $46,486 for men and $30,409 for women, a difference of 34.6%.
| Sex | Number | Average Earnings |
| Male | 1,698 (54.0%) | $46,486 |
| Female | 1,445 (46.0%) | $30,409 |
| Total | 3,143 (100.0%) | $36,130 |
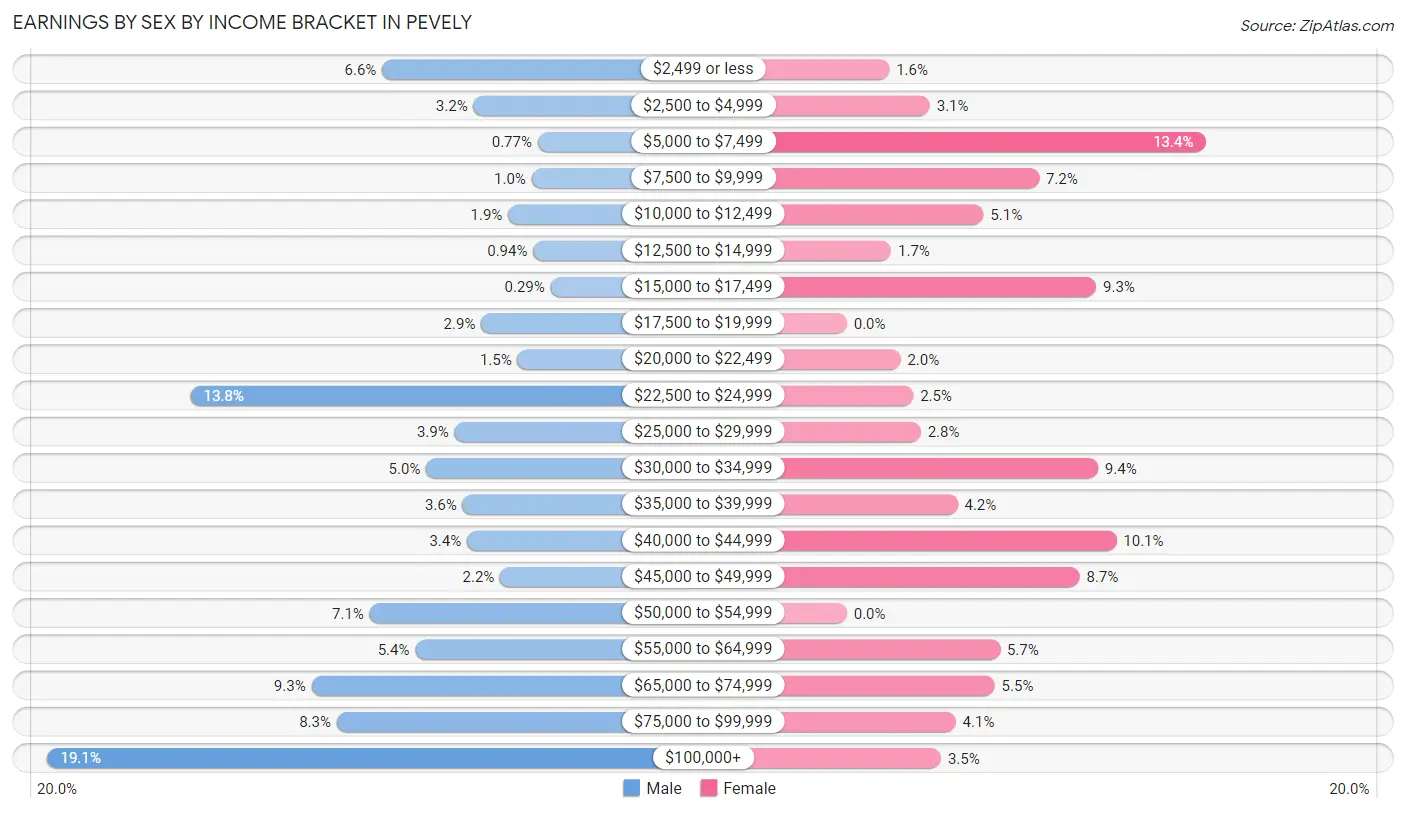
Earnings by Sex by Income Bracket in Pevely
The most common earnings brackets in Pevely are $100,000+ for men (325 | 19.1%) and $5,000 to $7,499 for women (194 | 13.4%).
| Income | Male | Female |
| $2,499 or less | 112 (6.6%) | 23 (1.6%) |
| $2,500 to $4,999 | 54 (3.2%) | 45 (3.1%) |
| $5,000 to $7,499 | 13 (0.8%) | 194 (13.4%) |
| $7,500 to $9,999 | 17 (1.0%) | 104 (7.2%) |
| $10,000 to $12,499 | 32 (1.9%) | 74 (5.1%) |
| $12,500 to $14,999 | 16 (0.9%) | 24 (1.7%) |
| $15,000 to $17,499 | 5 (0.3%) | 135 (9.3%) |
| $17,500 to $19,999 | 49 (2.9%) | 0 (0.0%) |
| $20,000 to $22,499 | 26 (1.5%) | 29 (2.0%) |
| $22,500 to $24,999 | 234 (13.8%) | 36 (2.5%) |
| $25,000 to $29,999 | 66 (3.9%) | 40 (2.8%) |
| $30,000 to $34,999 | 84 (5.0%) | 136 (9.4%) |
| $35,000 to $39,999 | 61 (3.6%) | 60 (4.2%) |
| $40,000 to $44,999 | 58 (3.4%) | 146 (10.1%) |
| $45,000 to $49,999 | 37 (2.2%) | 126 (8.7%) |
| $50,000 to $54,999 | 120 (7.1%) | 0 (0.0%) |
| $55,000 to $64,999 | 91 (5.4%) | 83 (5.7%) |
| $65,000 to $74,999 | 157 (9.2%) | 80 (5.5%) |
| $75,000 to $99,999 | 141 (8.3%) | 59 (4.1%) |
| $100,000+ | 325 (19.1%) | 51 (3.5%) |
| Total | 1,698 (100.0%) | 1,445 (100.0%) |
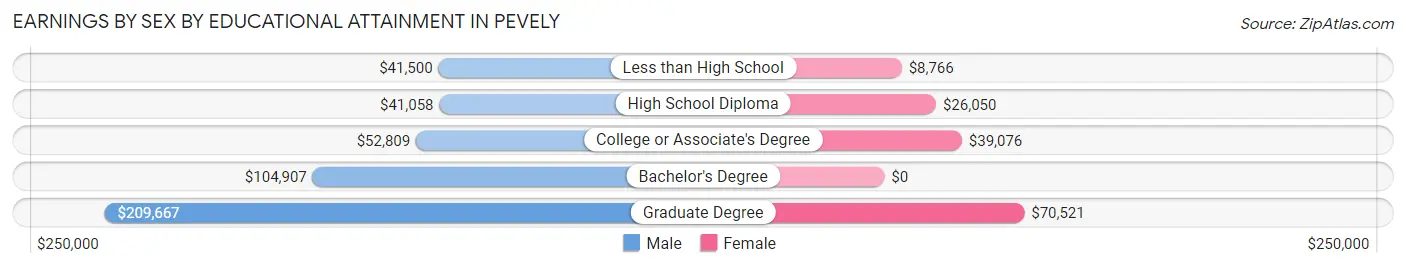
Earnings by Sex by Educational Attainment in Pevely
Average earnings in Pevely are $54,028 for men and $31,538 for women, a difference of 41.6%. Men with an educational attainment of graduate degree enjoy the highest average annual earnings of $209,667, while those with high school diploma education earn the least with $41,058. Women with an educational attainment of graduate degree earn the most with the average annual earnings of $70,521, while those with less than high school education have the smallest earnings of $8,766.
| Educational Attainment | Male Income | Female Income |
| Less than High School | $41,500 | $8,766 |
| High School Diploma | $41,058 | $26,050 |
| College or Associate's Degree | $52,809 | $39,076 |
| Bachelor's Degree | $104,907 | $0 |
| Graduate Degree | $209,667 | $70,521 |
| Total | $54,028 | $31,538 |
Family Income in Pevely
Family Income Brackets in Pevely
According to the Pevely family income data, there are 257 families falling into the $100,000 to $149,999 income range, which is the most common income bracket and makes up 18.3% of all families.
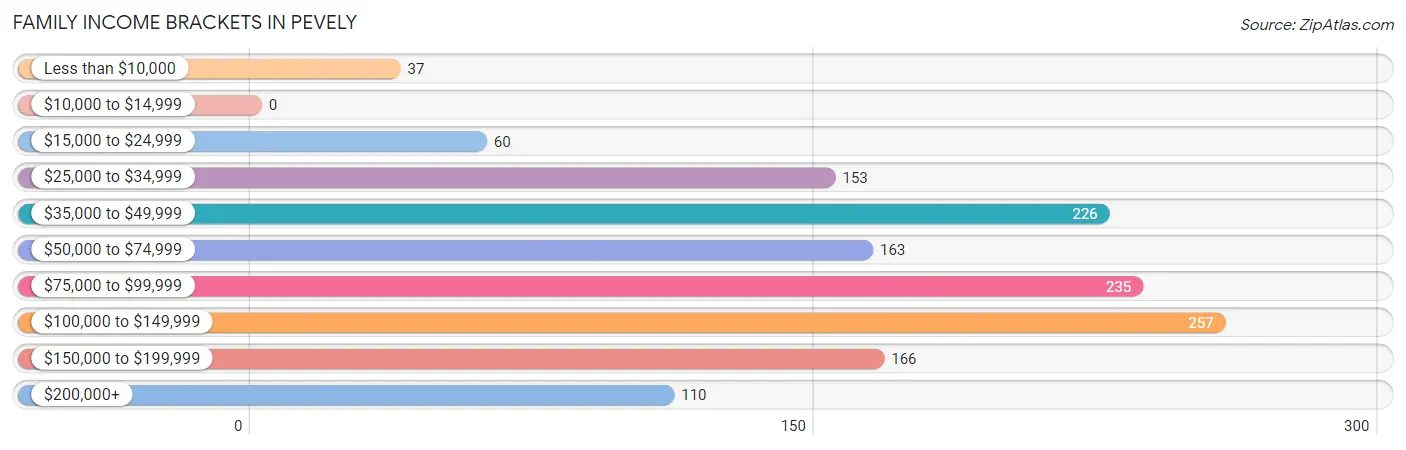
| Income Bracket | # Families | % Families |
| Less than $10,000 | 37 | 2.6% |
| $10,000 to $14,999 | 0 | 0.0% |
| $15,000 to $24,999 | 60 | 4.3% |
| $25,000 to $34,999 | 153 | 10.9% |
| $35,000 to $49,999 | 226 | 16.1% |
| $50,000 to $74,999 | 163 | 11.6% |
| $75,000 to $99,999 | 235 | 16.7% |
| $100,000 to $149,999 | 257 | 18.3% |
| $150,000 to $199,999 | 166 | 11.8% |
| $200,000+ | 110 | 7.8% |
Family Income by Famaliy Size in Pevely
4-person families (343 | 24.4%) account for the highest median family income in Pevely with $114,102 per family, while 2-person families (468 | 33.3%) have the highest median income of $34,655 per family member.
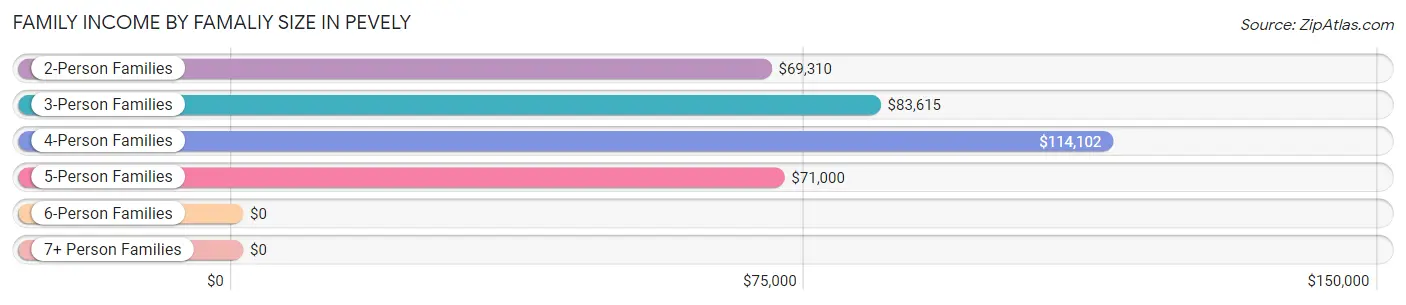
| Income Bracket | # Families | Median Income |
| 2-Person Families | 468 (33.3%) | $69,310 |
| 3-Person Families | 339 (24.1%) | $83,615 |
| 4-Person Families | 343 (24.4%) | $114,102 |
| 5-Person Families | 178 (12.7%) | $71,000 |
| 6-Person Families | 47 (3.4%) | $0 |
| 7+ Person Families | 30 (2.1%) | $0 |
| Total | 1,405 (100.0%) | $78,780 |
Family Income by Number of Earners in Pevely
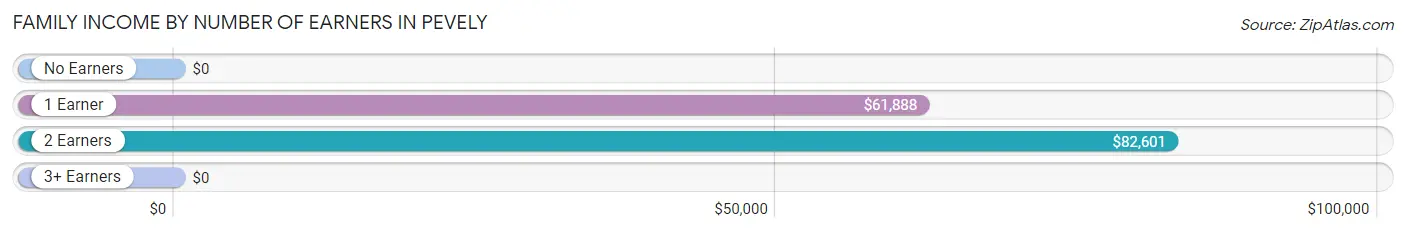
| Number of Earners | # Families | Median Income |
| No Earners | 116 (8.3%) | $0 |
| 1 Earner | 495 (35.2%) | $61,888 |
| 2 Earners | 625 (44.5%) | $82,601 |
| 3+ Earners | 169 (12.0%) | $0 |
| Total | 1,405 (100.0%) | $78,780 |
Household Income in Pevely
Household Income Brackets in Pevely
With 366 households falling in the category, the $75,000 to $99,999 income range is the most frequent in Pevely, accounting for 16.7% of all households. In contrast, only 107 households (4.9%) fall into the $15,000 to $24,999 income bracket, making it the least populous group.
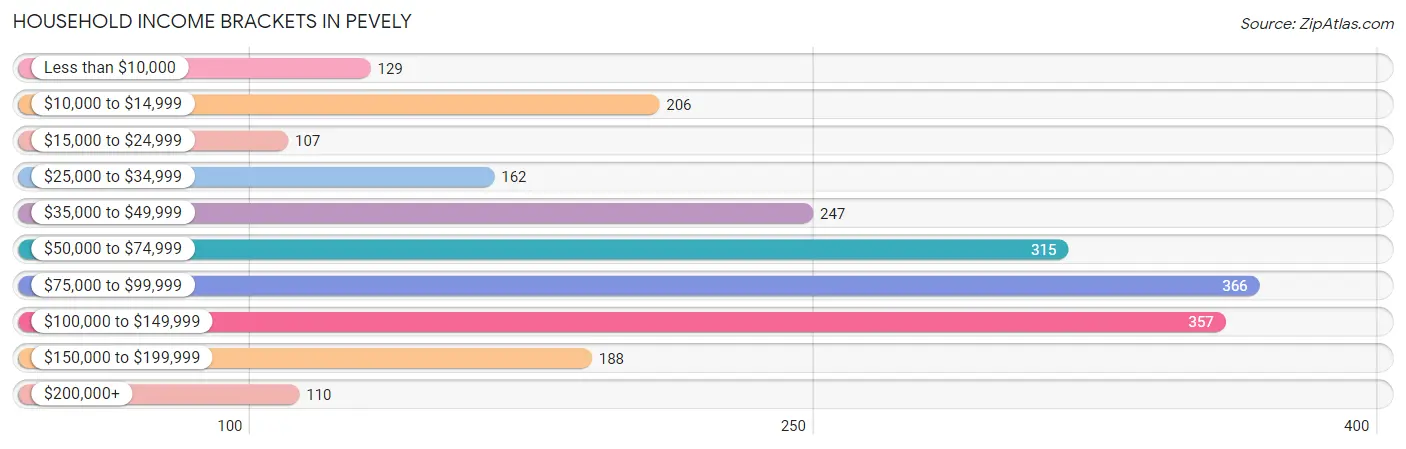
| Income Bracket | # Households | % Households |
| Less than $10,000 | 129 | 5.9% |
| $10,000 to $14,999 | 206 | 9.4% |
| $15,000 to $24,999 | 107 | 4.9% |
| $25,000 to $34,999 | 162 | 7.4% |
| $35,000 to $49,999 | 247 | 11.3% |
| $50,000 to $74,999 | 315 | 14.4% |
| $75,000 to $99,999 | 366 | 16.7% |
| $100,000 to $149,999 | 357 | 16.3% |
| $150,000 to $199,999 | 188 | 8.6% |
| $200,000+ | 110 | 5.0% |
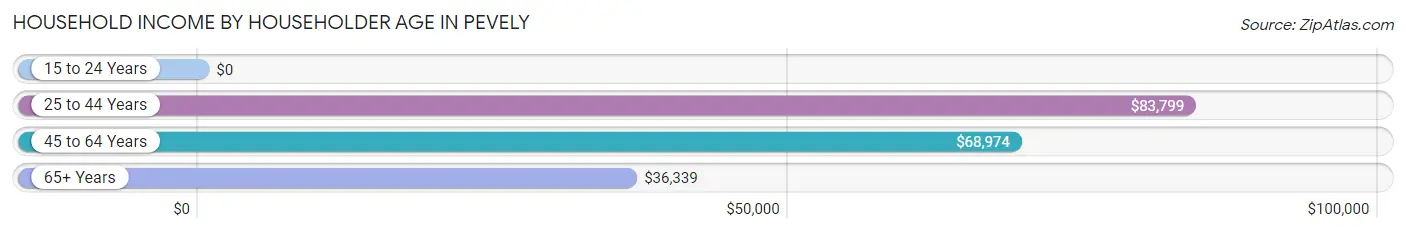
Household Income by Householder Age in Pevely
The median household income in Pevely is $68,141, with the highest median household income of $83,799 found in the 25 to 44 years age bracket for the primary householder. A total of 967 households (44.2%) fall into this category. Meanwhile, the 15 to 24 years age bracket for the primary householder has the lowest median household income of $0, with 24 households (1.1%) in this group.
| Income Bracket | # Households | Median Income |
| 15 to 24 Years | 24 (1.1%) | $0 |
| 25 to 44 Years | 967 (44.2%) | $83,799 |
| 45 to 64 Years | 792 (36.2%) | $68,974 |
| 65+ Years | 407 (18.6%) | $36,339 |
| Total | 2,190 (100.0%) | $68,141 |
Poverty in Pevely
Income Below Poverty by Sex and Age in Pevely
With 21.2% poverty level for males and 12.3% for females among the residents of Pevely, 5 year old males and 75 year old and over females are the most vulnerable to poverty, with 79 males (100.0%) and 36 females (43.9%) in their respective age groups living below the poverty level.
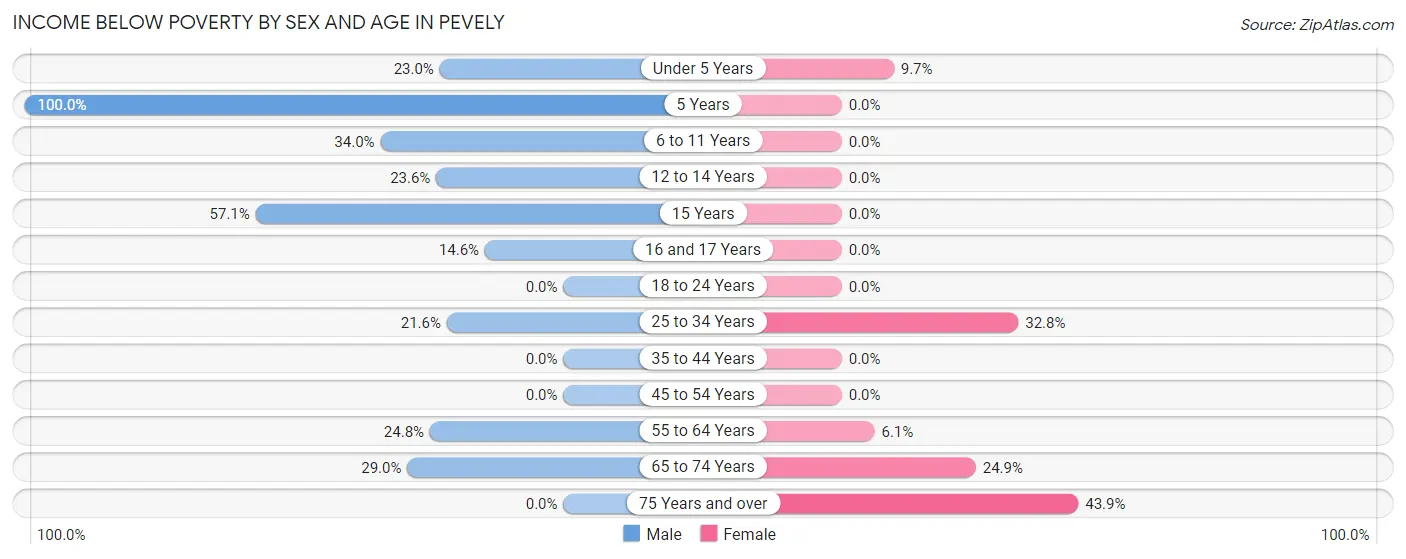
| Age Bracket | Male | Female |
| Under 5 Years | 84 (23.0%) | 25 (9.7%) |
| 5 Years | 79 (100.0%) | 0 (0.0%) |
| 6 to 11 Years | 127 (34.0%) | 0 (0.0%) |
| 12 to 14 Years | 38 (23.6%) | 0 (0.0%) |
| 15 Years | 28 (57.1%) | 0 (0.0%) |
| 16 and 17 Years | 16 (14.5%) | 0 (0.0%) |
| 18 to 24 Years | 0 (0.0%) | 0 (0.0%) |
| 25 to 34 Years | 101 (21.6%) | 211 (32.8%) |
| 35 to 44 Years | 0 (0.0%) | 0 (0.0%) |
| 45 to 54 Years | 0 (0.0%) | 0 (0.0%) |
| 55 to 64 Years | 133 (24.8%) | 22 (6.1%) |
| 65 to 74 Years | 73 (29.0%) | 52 (24.9%) |
| 75 Years and over | 0 (0.0%) | 36 (43.9%) |
| Total | 679 (21.2%) | 346 (12.3%) |
Income Above Poverty by Sex and Age in Pevely
According to the poverty statistics in Pevely, males aged 18 to 24 years and females aged 5 years are the age groups that are most secure financially, with 100.0% of males and 100.0% of females in these age groups living above the poverty line.
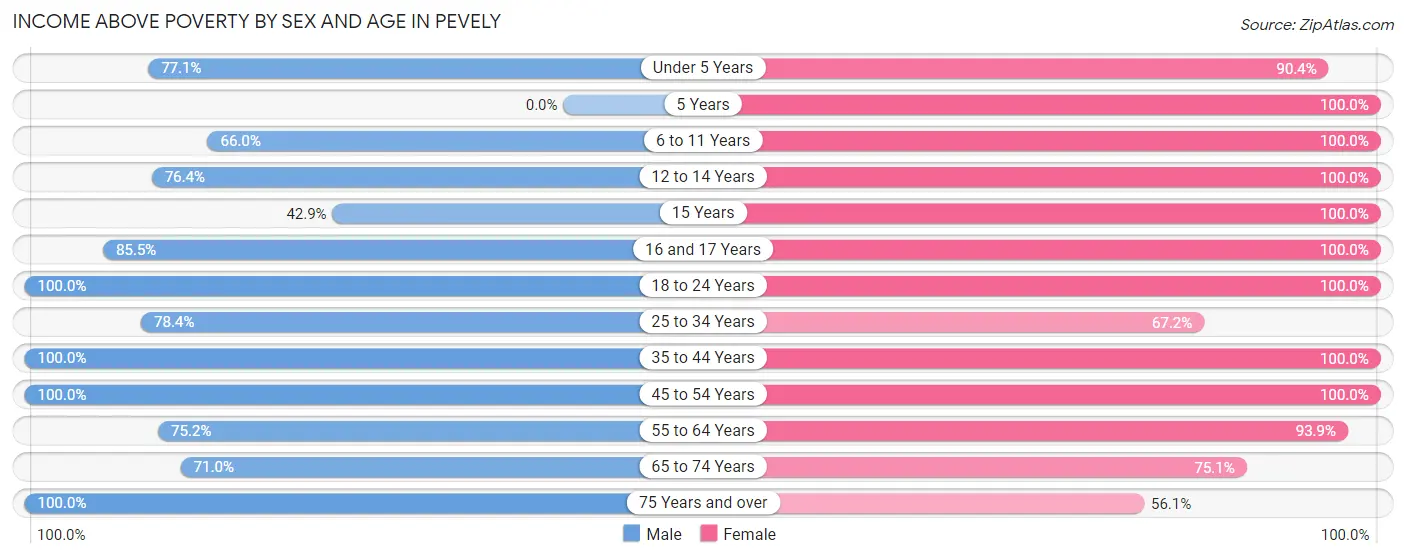
| Age Bracket | Male | Female |
| Under 5 Years | 282 (77.0%) | 234 (90.3%) |
| 5 Years | 0 (0.0%) | 21 (100.0%) |
| 6 to 11 Years | 247 (66.0%) | 228 (100.0%) |
| 12 to 14 Years | 123 (76.4%) | 137 (100.0%) |
| 15 Years | 21 (42.9%) | 17 (100.0%) |
| 16 and 17 Years | 94 (85.5%) | 43 (100.0%) |
| 18 to 24 Years | 134 (100.0%) | 225 (100.0%) |
| 25 to 34 Years | 366 (78.4%) | 433 (67.2%) |
| 35 to 44 Years | 296 (100.0%) | 360 (100.0%) |
| 45 to 54 Years | 351 (100.0%) | 230 (100.0%) |
| 55 to 64 Years | 404 (75.2%) | 340 (93.9%) |
| 65 to 74 Years | 179 (71.0%) | 157 (75.1%) |
| 75 Years and over | 19 (100.0%) | 46 (56.1%) |
| Total | 2,516 (78.7%) | 2,471 (87.7%) |
Income Below Poverty Among Married-Couple Families in Pevely
The poverty statistics for married-couple families in Pevely show that 10.8% or 118 of the total 1,095 families live below the poverty line. Families with 3 or 4 children have the highest poverty rate of 41.7%, comprising of 100 families. On the other hand, families with 1 or 2 children have the lowest poverty rate of 0.0%, which includes 0 families.
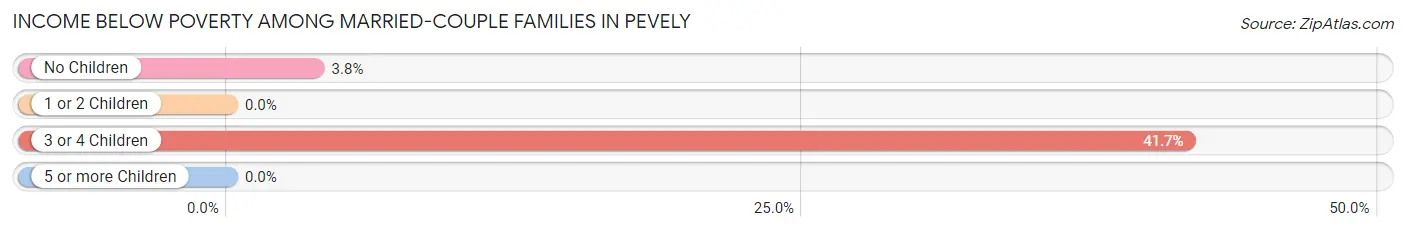
| Children | Above Poverty | Below Poverty |
| No Children | 459 (96.2%) | 18 (3.8%) |
| 1 or 2 Children | 378 (100.0%) | 0 (0.0%) |
| 3 or 4 Children | 140 (58.3%) | 100 (41.7%) |
| 5 or more Children | 0 (0.0%) | 0 (0.0%) |
| Total | 977 (89.2%) | 118 (10.8%) |
Income Below Poverty Among Single-Parent Households in Pevely
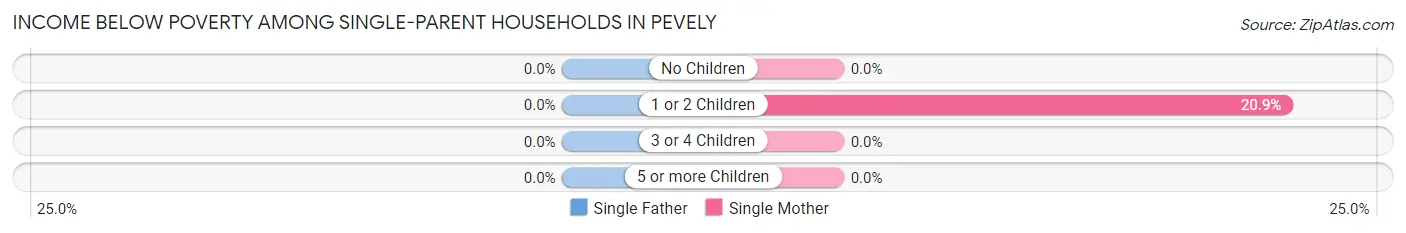
| Children | Single Father | Single Mother |
| No Children | 0 (0.0%) | 0 (0.0%) |
| 1 or 2 Children | 0 (0.0%) | 36 (20.9%) |
| 3 or 4 Children | 0 (0.0%) | 0 (0.0%) |
| 5 or more Children | 0 (0.0%) | 0 (0.0%) |
| Total | 0 (0.0%) | 36 (13.7%) |
Income Below Poverty Among Married-Couple vs Single-Parent Households in Pevely
The poverty data for Pevely shows that 118 of the married-couple family households (10.8%) and 36 of the single-parent households (11.6%) are living below the poverty level. Within the married-couple family households, those with 3 or 4 children have the highest poverty rate, with 100 households (41.7%) falling below the poverty line. Among the single-parent households, those with 1 or 2 children have the highest poverty rate, with 36 household (20.9%) living below poverty.
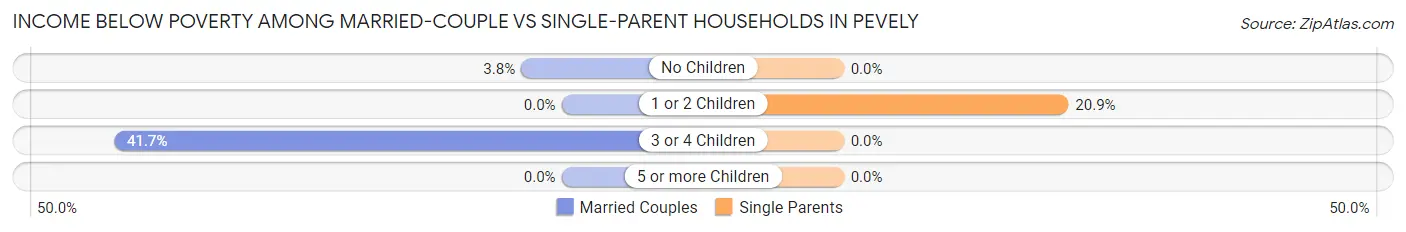
| Children | Married-Couple Families | Single-Parent Households |
| No Children | 18 (3.8%) | 0 (0.0%) |
| 1 or 2 Children | 0 (0.0%) | 36 (20.9%) |
| 3 or 4 Children | 100 (41.7%) | 0 (0.0%) |
| 5 or more Children | 0 (0.0%) | 0 (0.0%) |
| Total | 118 (10.8%) | 36 (11.6%) |
Race in Pevely
The most populous races in Pevely are White / Caucasian (5,604 | 93.2%), Two or more Races (315 | 5.2%), and Asian (82 | 1.4%).
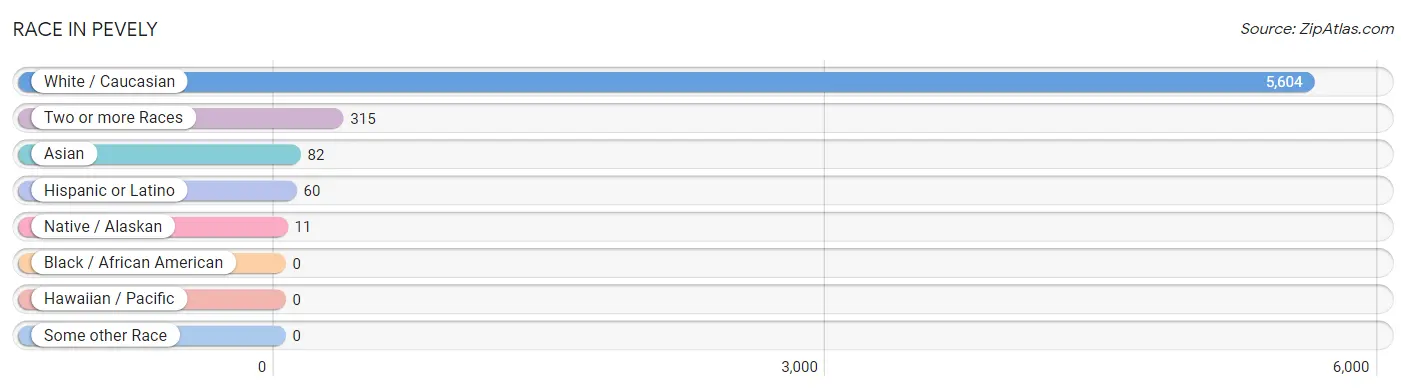
| Race | # Population | % Population |
| Asian | 82 | 1.4% |
| Black / African American | 0 | 0.0% |
| Hawaiian / Pacific | 0 | 0.0% |
| Hispanic or Latino | 60 | 1.0% |
| Native / Alaskan | 11 | 0.2% |
| White / Caucasian | 5,604 | 93.2% |
| Two or more Races | 315 | 5.2% |
| Some other Race | 0 | 0.0% |
| Total | 6,012 | 100.0% |
Ancestry in Pevely
The most populous ancestries reported in Pevely are German (1,247 | 20.7%), Irish (515 | 8.6%), English (445 | 7.4%), Italian (414 | 6.9%), and French (332 | 5.5%), together accounting for 49.1% of all Pevely residents.
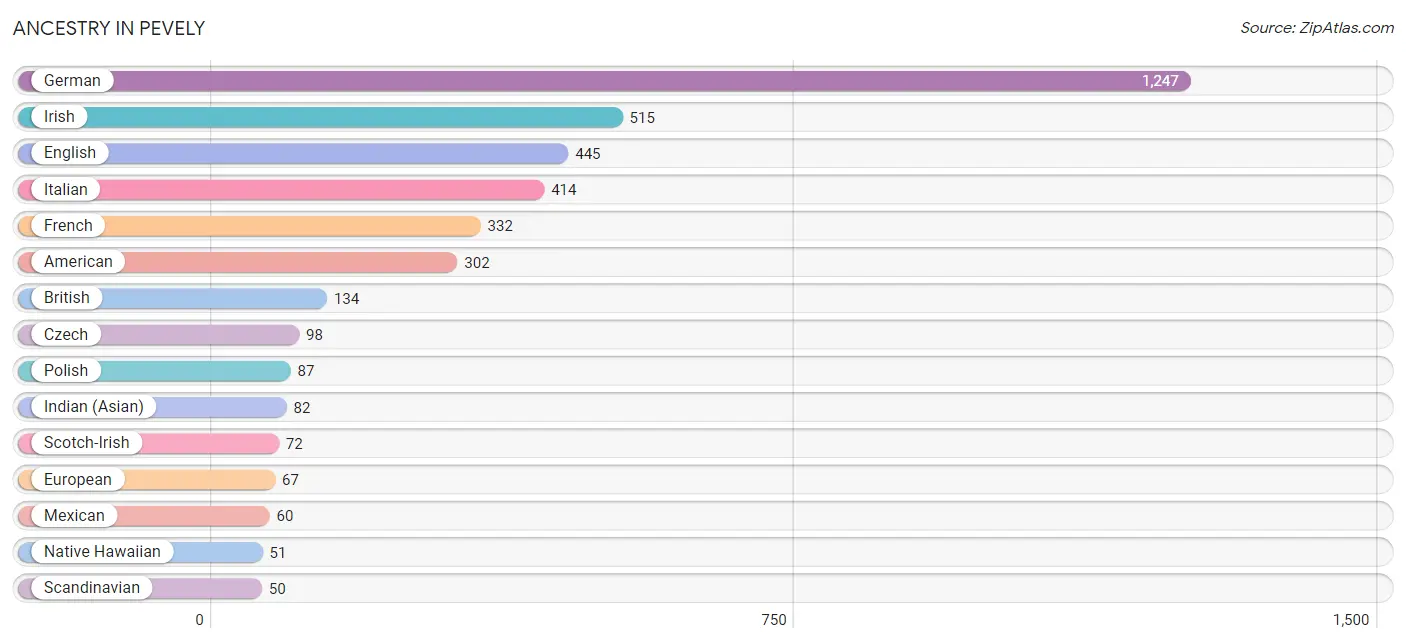
| Ancestry | # Population | % Population |
| American | 302 | 5.0% |
| British | 134 | 2.2% |
| Cherokee | 25 | 0.4% |
| Choctaw | 10 | 0.2% |
| Croatian | 34 | 0.6% |
| Czech | 98 | 1.6% |
| Dutch | 38 | 0.6% |
| English | 445 | 7.4% |
| European | 67 | 1.1% |
| French | 332 | 5.5% |
| German | 1,247 | 20.7% |
| Greek | 22 | 0.4% |
| Hungarian | 41 | 0.7% |
| Indian (Asian) | 82 | 1.4% |
| Irish | 515 | 8.6% |
| Iroquois | 26 | 0.4% |
| Italian | 414 | 6.9% |
| Mexican | 60 | 1.0% |
| Native Hawaiian | 51 | 0.9% |
| Norwegian | 38 | 0.6% |
| Polish | 87 | 1.5% |
| Scandinavian | 50 | 0.8% |
| Scotch-Irish | 72 | 1.2% |
| Scottish | 22 | 0.4% |
| Sri Lankan | 24 | 0.4% |
| Swiss | 26 | 0.4% | View All 26 Rows |
Immigrants in Pevely
The most numerous immigrant groups reported in Pevely came from Asia (82 | 1.4%), China (82 | 1.4%), Eastern Asia (82 | 1.4%), Croatia (30 | 0.5%), and Eastern Europe (30 | 0.5%), together accounting for 5.1% of all Pevely residents.
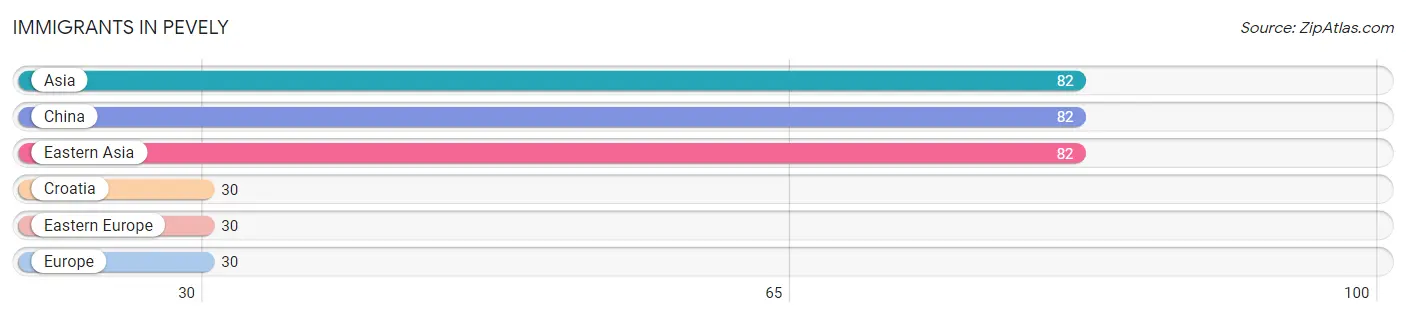
| Immigration Origin | # Population | % Population |
| Asia | 82 | 1.4% |
| China | 82 | 1.4% |
| Croatia | 30 | 0.5% |
| Eastern Asia | 82 | 1.4% |
| Eastern Europe | 30 | 0.5% |
| Europe | 30 | 0.5% | View All 6 Rows |
Sex and Age in Pevely
Sex and Age in Pevely
The most populous age groups in Pevely are 5 to 9 Years (399 | 12.5%) for men and 30 to 34 Years (343 | 12.2%) for women.
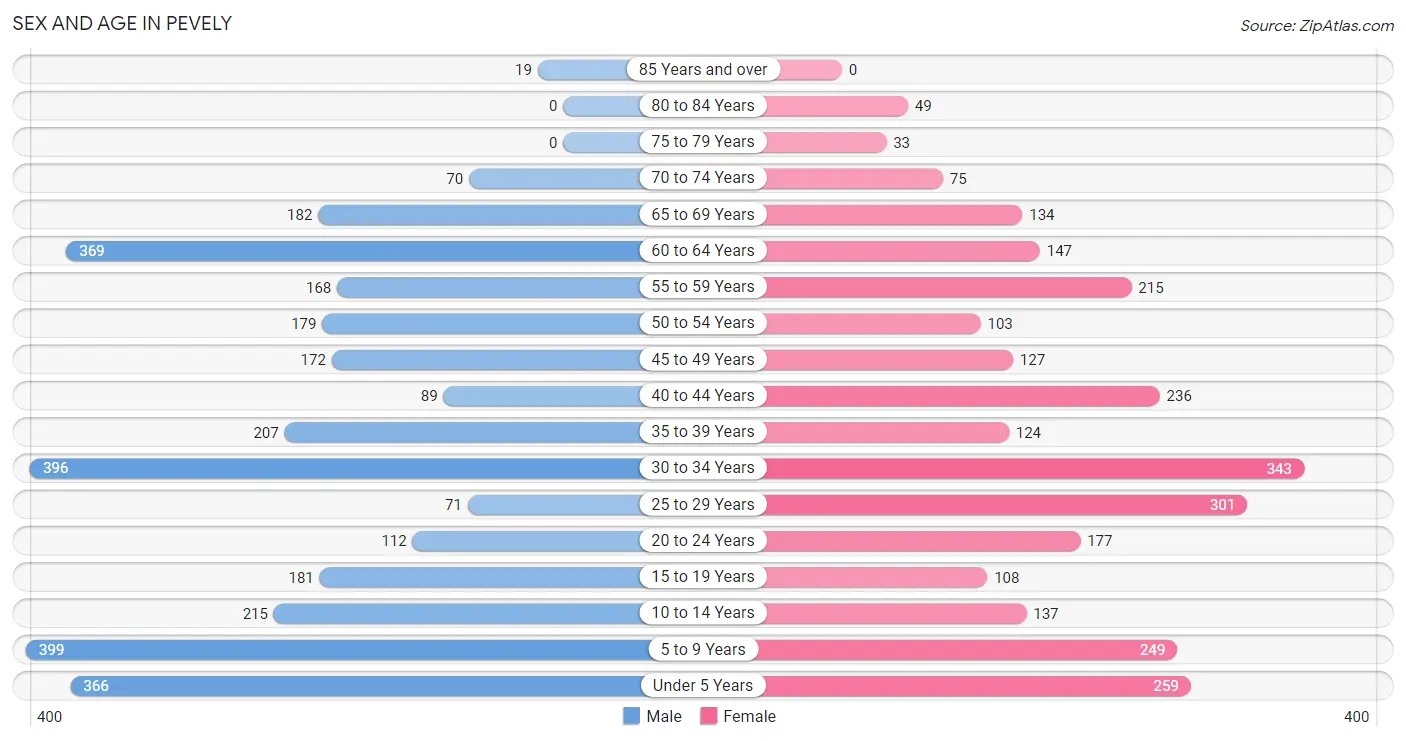
| Age Bracket | Male | Female |
| Under 5 Years | 366 (11.5%) | 259 (9.2%) |
| 5 to 9 Years | 399 (12.5%) | 249 (8.8%) |
| 10 to 14 Years | 215 (6.7%) | 137 (4.9%) |
| 15 to 19 Years | 181 (5.7%) | 108 (3.8%) |
| 20 to 24 Years | 112 (3.5%) | 177 (6.3%) |
| 25 to 29 Years | 71 (2.2%) | 301 (10.7%) |
| 30 to 34 Years | 396 (12.4%) | 343 (12.2%) |
| 35 to 39 Years | 207 (6.5%) | 124 (4.4%) |
| 40 to 44 Years | 89 (2.8%) | 236 (8.4%) |
| 45 to 49 Years | 172 (5.4%) | 127 (4.5%) |
| 50 to 54 Years | 179 (5.6%) | 103 (3.7%) |
| 55 to 59 Years | 168 (5.3%) | 215 (7.6%) |
| 60 to 64 Years | 369 (11.6%) | 147 (5.2%) |
| 65 to 69 Years | 182 (5.7%) | 134 (4.8%) |
| 70 to 74 Years | 70 (2.2%) | 75 (2.7%) |
| 75 to 79 Years | 0 (0.0%) | 33 (1.2%) |
| 80 to 84 Years | 0 (0.0%) | 49 (1.7%) |
| 85 Years and over | 19 (0.6%) | 0 (0.0%) |
| Total | 3,195 (100.0%) | 2,817 (100.0%) |
Families and Households in Pevely
Median Family Size in Pevely
The median family size in Pevely is 3.47 persons per family, with married-couple families (1,095 | 77.9%) accounting for the largest median family size of 3.58 persons per family. On the other hand, single male/father families (47 | 3.4%) represent the smallest median family size with 2.32 persons per family.
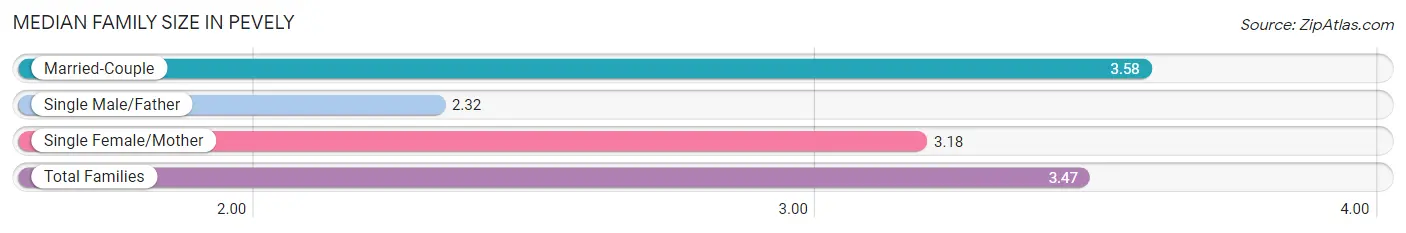
| Family Type | # Families | Family Size |
| Married-Couple | 1,095 (77.9%) | 3.58 |
| Single Male/Father | 47 (3.4%) | 2.32 |
| Single Female/Mother | 263 (18.7%) | 3.18 |
| Total Families | 1,405 (100.0%) | 3.47 |
Median Household Size in Pevely
The median household size in Pevely is 2.74 persons per household, with single female/mother households (263 | 12.0%) accounting for the largest median household size of 3.65 persons per household. non-family households (785 | 35.8%) represent the smallest median household size with 1.20 persons per household.
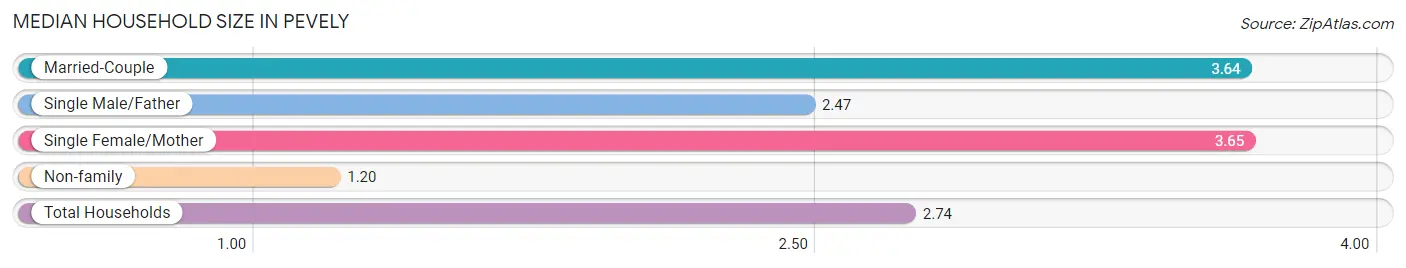
| Household Type | # Households | Household Size |
| Married-Couple | 1,095 (50.0%) | 3.64 |
| Single Male/Father | 47 (2.1%) | 2.47 |
| Single Female/Mother | 263 (12.0%) | 3.65 |
| Non-family | 785 (35.8%) | 1.20 |
| Total Households | 2,190 (100.0%) | 2.74 |
Household Size by Marriage Status in Pevely
Out of a total of 2,190 households in Pevely, 1,405 (64.2%) are family households, while 785 (35.8%) are nonfamily households. The most numerous type of family households are 2-person households, comprising 409, and the most common type of nonfamily households are 1-person households, comprising 655.
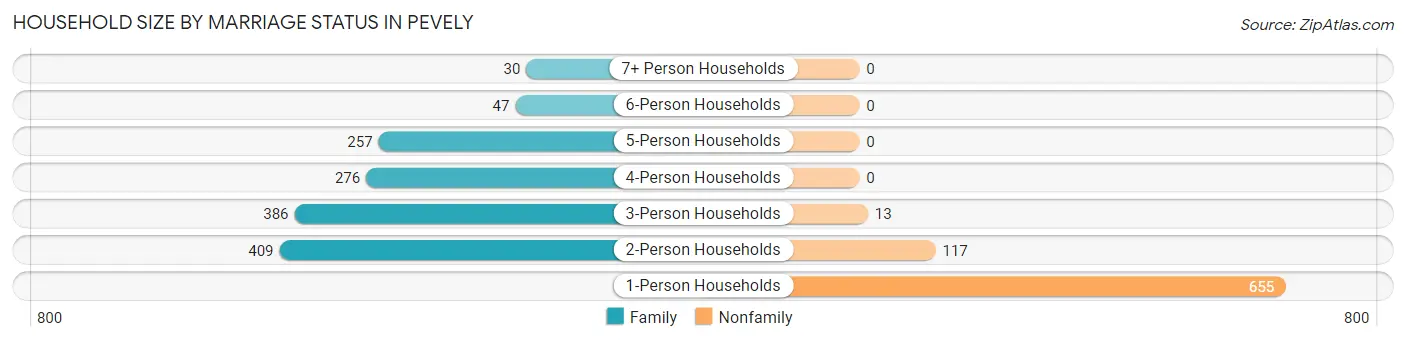
| Household Size | Family Households | Nonfamily Households |
| 1-Person Households | - | 655 (29.9%) |
| 2-Person Households | 409 (18.7%) | 117 (5.3%) |
| 3-Person Households | 386 (17.6%) | 13 (0.6%) |
| 4-Person Households | 276 (12.6%) | 0 (0.0%) |
| 5-Person Households | 257 (11.7%) | 0 (0.0%) |
| 6-Person Households | 47 (2.1%) | 0 (0.0%) |
| 7+ Person Households | 30 (1.4%) | 0 (0.0%) |
| Total | 1,405 (64.2%) | 785 (35.8%) |
Female Fertility in Pevely
Fertility by Age in Pevely
Average fertility rate in Pevely is 73.0 births per 1,000 women. Women in the age bracket of 20 to 34 years have the highest fertility rate with 125.0 births per 1,000 women. Women in the age bracket of 20 to 34 years acount for 100.0% of all women with births.
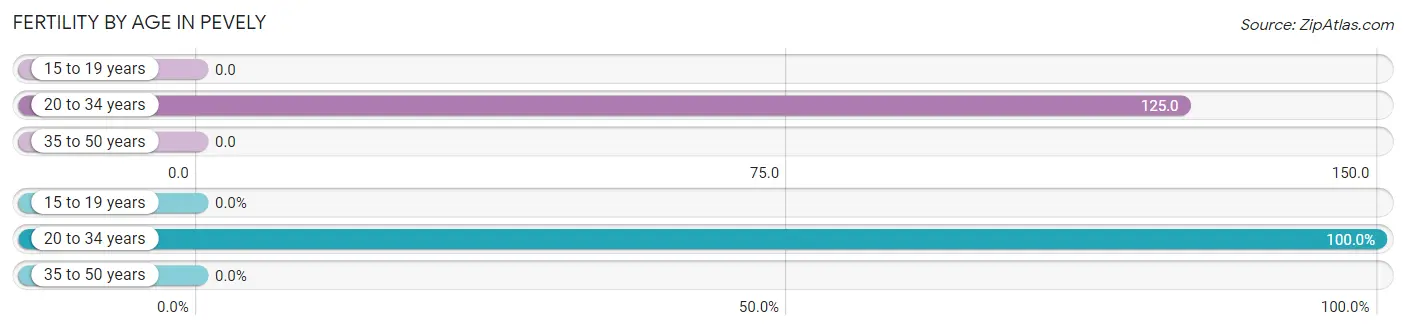
| Age Bracket | Women with Births | Births / 1,000 Women |
| 15 to 19 years | 0 (0.0%) | 0.0 |
| 20 to 34 years | 103 (100.0%) | 125.0 |
| 35 to 50 years | 0 (0.0%) | 0.0 |
| Total | 103 (100.0%) | 73.0 |
Fertility by Age by Marriage Status in Pevely
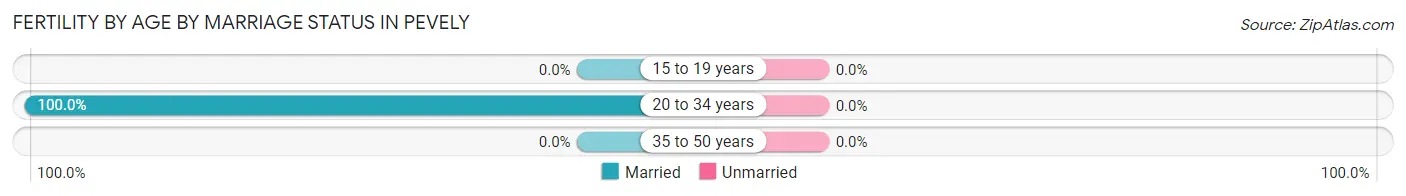
| Age Bracket | Married | Unmarried |
| 15 to 19 years | 0 (0.0%) | 0 (0.0%) |
| 20 to 34 years | 103 (100.0%) | 0 (0.0%) |
| 35 to 50 years | 0 (0.0%) | 0 (0.0%) |
| Total | 103 (100.0%) | 0 (0.0%) |
Fertility by Education in Pevely
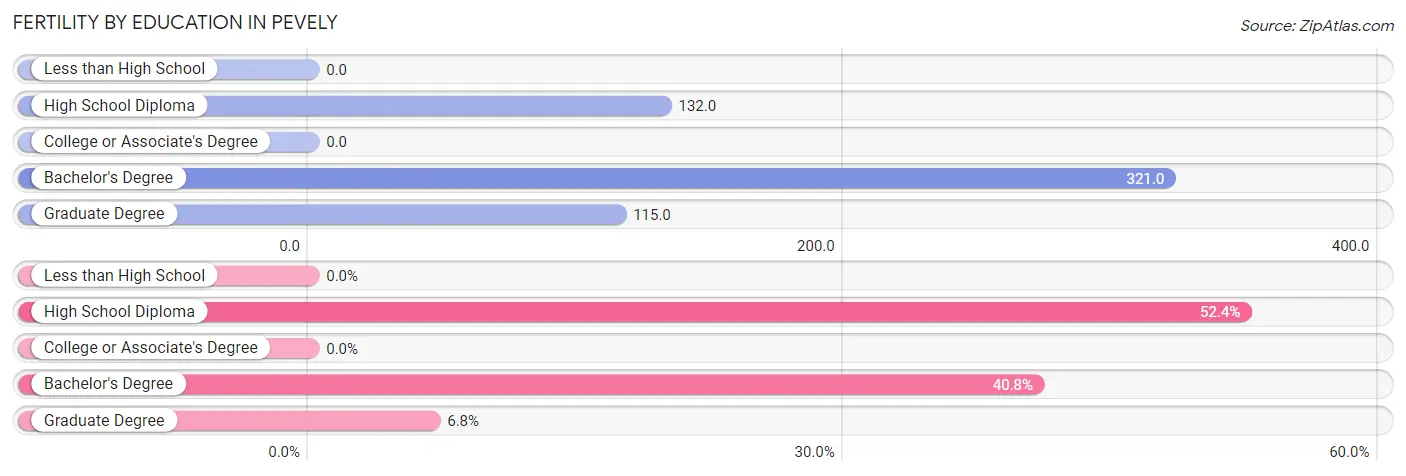
| Educational Attainment | Women with Births | Births / 1,000 Women |
| Less than High School | 0 (0.0%) | 0.0 |
| High School Diploma | 54 (52.4%) | 132.0 |
| College or Associate's Degree | 0 (0.0%) | 0.0 |
| Bachelor's Degree | 42 (40.8%) | 321.0 |
| Graduate Degree | 7 (6.8%) | 115.0 |
| Total | 103 (100.0%) | 73.0 |
Fertility by Education by Marriage Status in Pevely
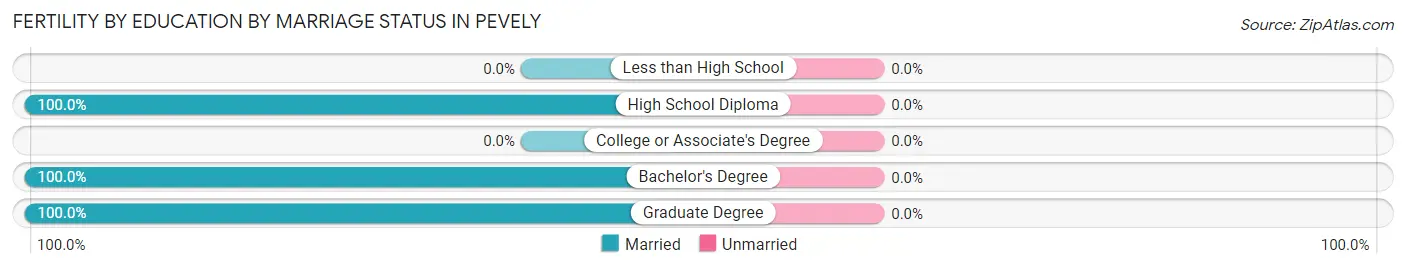
| Educational Attainment | Married | Unmarried |
| Less than High School | 0 (0.0%) | 0 (0.0%) |
| High School Diploma | 54 (100.0%) | 0 (0.0%) |
| College or Associate's Degree | 0 (0.0%) | 0 (0.0%) |
| Bachelor's Degree | 42 (100.0%) | 0 (0.0%) |
| Graduate Degree | 7 (100.0%) | 0 (0.0%) |
| Total | 103 (100.0%) | 0 (0.0%) |
Employment Characteristics in Pevely
Employment by Class of Employer in Pevely
Among the 2,822 employed individuals in Pevely, private company employees (2,354 | 83.4%), local government employees (125 | 4.4%), and not-for-profit organizations (103 | 3.6%) make up the most common classes of employment.
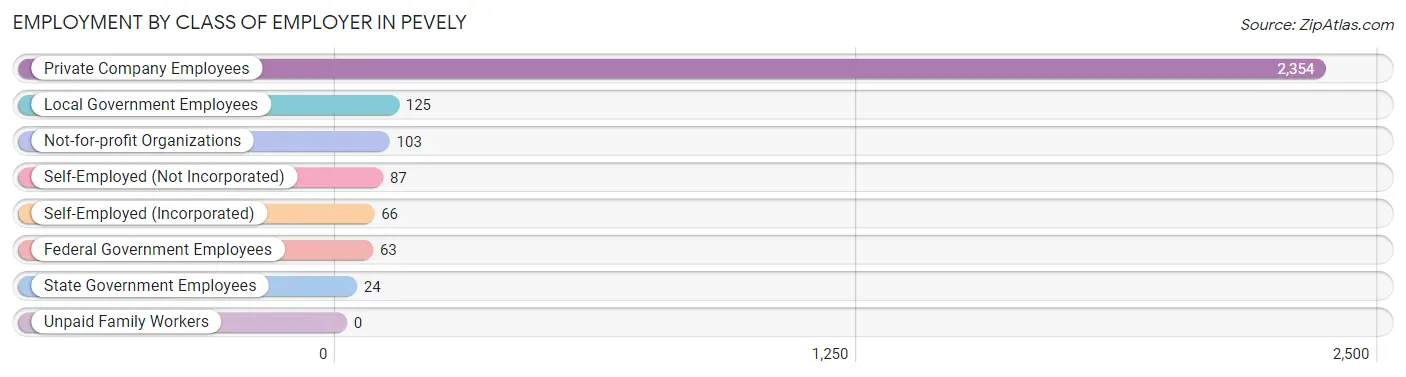
| Employer Class | # Employees | % Employees |
| Private Company Employees | 2,354 | 83.4% |
| Self-Employed (Incorporated) | 66 | 2.3% |
| Self-Employed (Not Incorporated) | 87 | 3.1% |
| Not-for-profit Organizations | 103 | 3.6% |
| Local Government Employees | 125 | 4.4% |
| State Government Employees | 24 | 0.9% |
| Federal Government Employees | 63 | 2.2% |
| Unpaid Family Workers | 0 | 0.0% |
| Total | 2,822 | 100.0% |
Employment Status by Age in Pevely
According to the labor force statistics for Pevely, out of the total population over 16 years of age (4,321), 68.5% or 2,960 individuals are in the labor force, with 4.7% or 139 of them unemployed. The age group with the highest labor force participation rate is 25 to 29 years, with 90.9% or 338 individuals in the labor force. Within the labor force, the 65 to 74 years age range has the highest percentage of unemployed individuals, with 45.0% or 72 of them being unemployed.
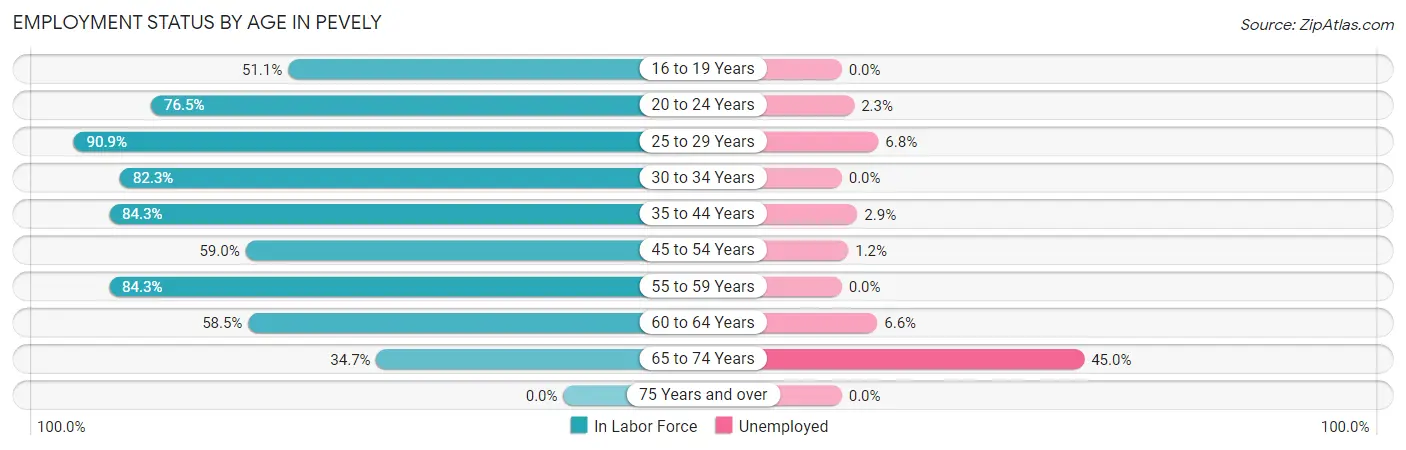
| Age Bracket | In Labor Force | Unemployed |
| 16 to 19 Years | 114 (51.1%) | 0 (0.0%) |
| 20 to 24 Years | 221 (76.5%) | 5 (2.3%) |
| 25 to 29 Years | 338 (90.9%) | 23 (6.8%) |
| 30 to 34 Years | 608 (82.3%) | 0 (0.0%) |
| 35 to 44 Years | 553 (84.3%) | 16 (2.9%) |
| 45 to 54 Years | 343 (59.0%) | 4 (1.2%) |
| 55 to 59 Years | 323 (84.3%) | 0 (0.0%) |
| 60 to 64 Years | 302 (58.5%) | 20 (6.6%) |
| 65 to 74 Years | 160 (34.7%) | 72 (45.0%) |
| 75 Years and over | 0 (0.0%) | 0 (0.0%) |
| Total | 2,960 (68.5%) | 139 (4.7%) |
Employment Status by Educational Attainment in Pevely
According to labor force statistics for Pevely, 76.0% of individuals (2,468) out of the total population between 25 and 64 years of age (3,247) are in the labor force, with 2.6% or 64 of them being unemployed. The group with the highest labor force participation rate are those with the educational attainment of college / associate degree, with 87.5% or 1,166 individuals in the labor force. Within the labor force, individuals with high school diploma education have the highest percentage of unemployment, with 7.7% or 59 of them being unemployed.
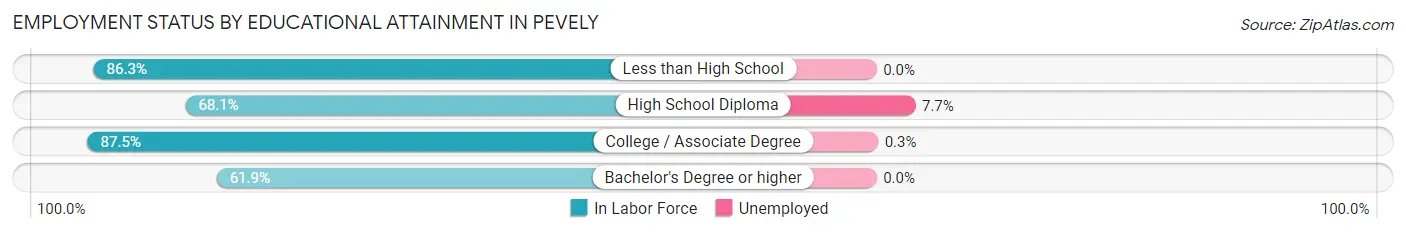
| Educational Attainment | In Labor Force | Unemployed |
| Less than High School | 164 (86.3%) | 0 (0.0%) |
| High School Diploma | 762 (68.1%) | 86 (7.7%) |
| College / Associate Degree | 1,166 (87.5%) | 4 (0.3%) |
| Bachelor's Degree or higher | 375 (61.9%) | 0 (0.0%) |
| Total | 2,468 (76.0%) | 84 (2.6%) |
Employment Occupations by Sex in Pevely
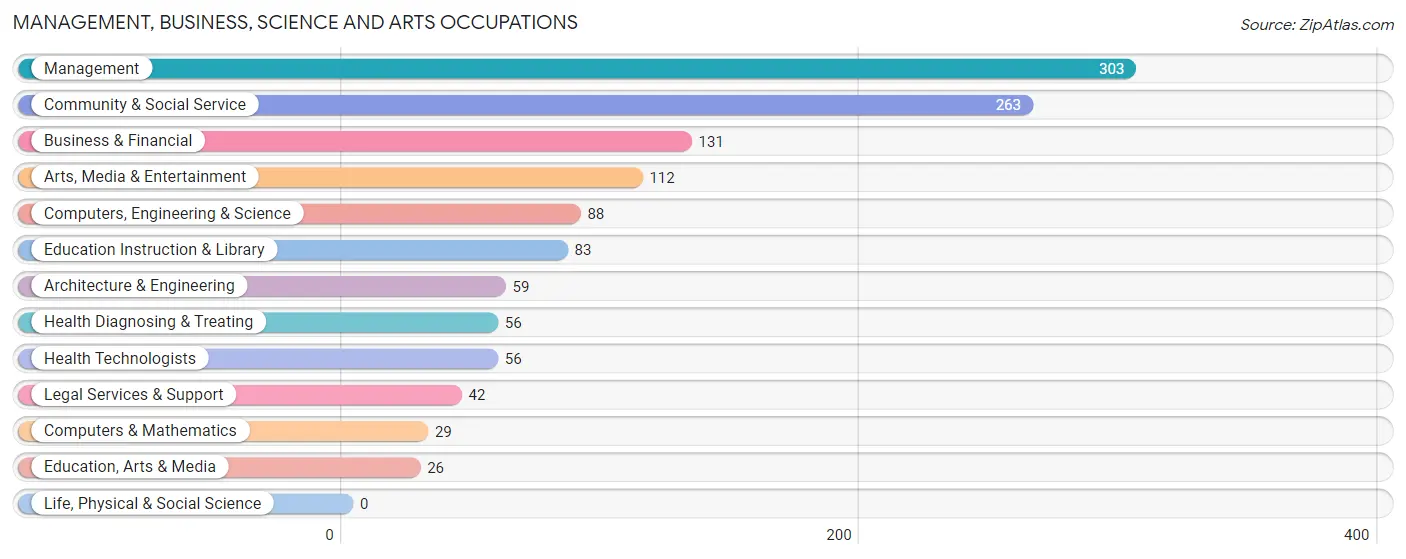
Management, Business, Science and Arts Occupations
The most common Management, Business, Science and Arts occupations in Pevely are Management (303 | 10.7%), Community & Social Service (263 | 9.3%), Business & Financial (131 | 4.6%), Arts, Media & Entertainment (112 | 4.0%), and Computers, Engineering & Science (88 | 3.1%).
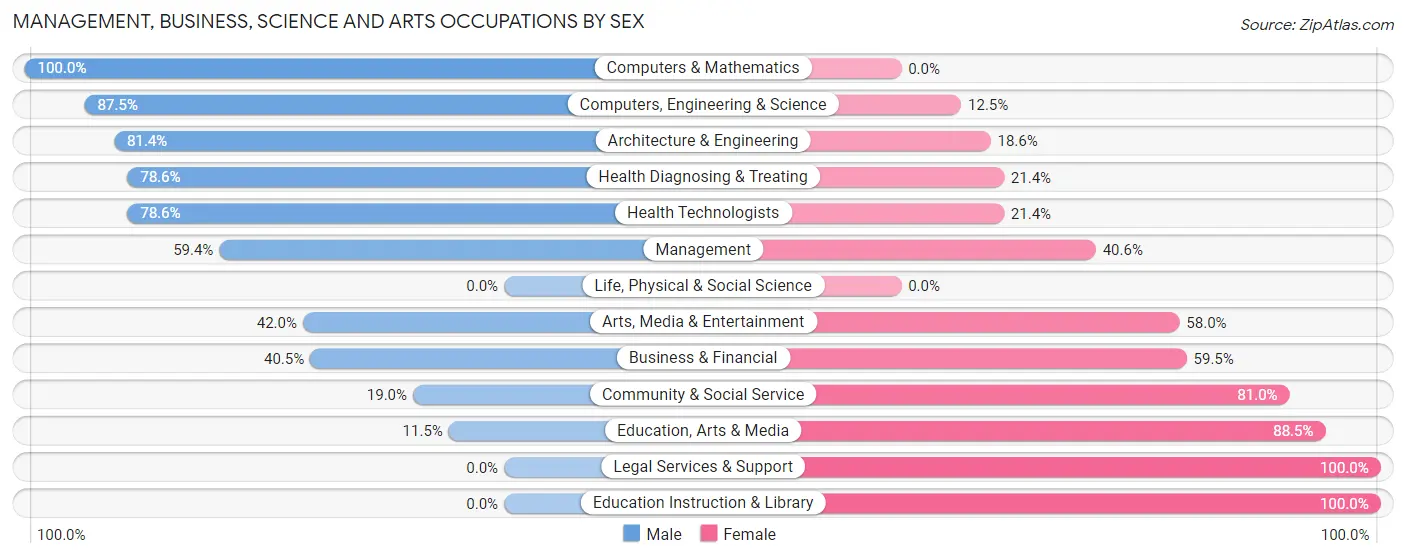
Management, Business, Science and Arts Occupations by Sex
Within the Management, Business, Science and Arts occupations in Pevely, the most male-oriented occupations are Computers & Mathematics (100.0%), Computers, Engineering & Science (87.5%), and Architecture & Engineering (81.4%), while the most female-oriented occupations are Legal Services & Support (100.0%), Education Instruction & Library (100.0%), and Education, Arts & Media (88.5%).
| Occupation | Male | Female |
| Management | 180 (59.4%) | 123 (40.6%) |
| Business & Financial | 53 (40.5%) | 78 (59.5%) |
| Computers, Engineering & Science | 77 (87.5%) | 11 (12.5%) |
| Computers & Mathematics | 29 (100.0%) | 0 (0.0%) |
| Architecture & Engineering | 48 (81.4%) | 11 (18.6%) |
| Life, Physical & Social Science | 0 (0.0%) | 0 (0.0%) |
| Community & Social Service | 50 (19.0%) | 213 (81.0%) |
| Education, Arts & Media | 3 (11.5%) | 23 (88.5%) |
| Legal Services & Support | 0 (0.0%) | 42 (100.0%) |
| Education Instruction & Library | 0 (0.0%) | 83 (100.0%) |
| Arts, Media & Entertainment | 47 (42.0%) | 65 (58.0%) |
| Health Diagnosing & Treating | 44 (78.6%) | 12 (21.4%) |
| Health Technologists | 44 (78.6%) | 12 (21.4%) |
| Total (Category) | 404 (48.0%) | 437 (52.0%) |
| Total (Overall) | 1,528 (54.1%) | 1,294 (45.9%) |
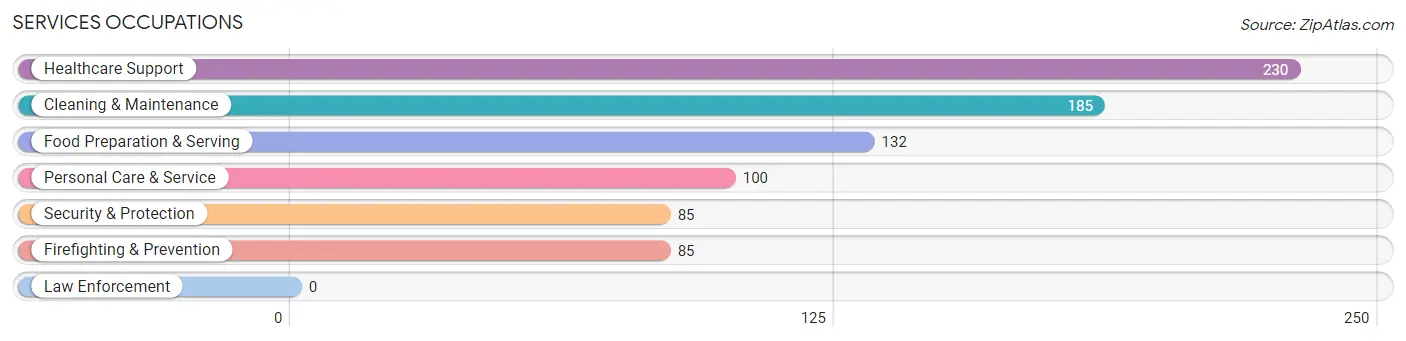
Services Occupations
The most common Services occupations in Pevely are Healthcare Support (230 | 8.2%), Cleaning & Maintenance (185 | 6.6%), Food Preparation & Serving (132 | 4.7%), Personal Care & Service (100 | 3.5%), and Security & Protection (85 | 3.0%).
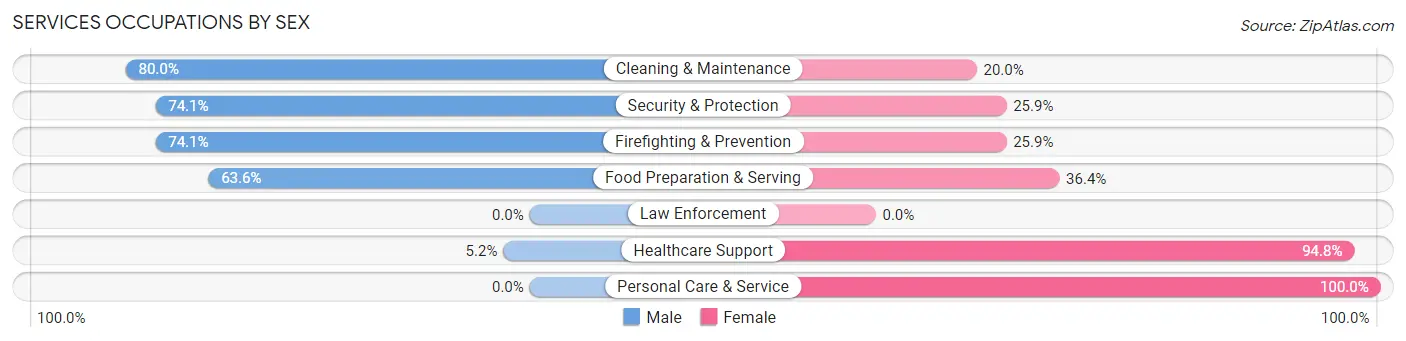
Services Occupations by Sex
Within the Services occupations in Pevely, the most male-oriented occupations are Cleaning & Maintenance (80.0%), Security & Protection (74.1%), and Firefighting & Prevention (74.1%), while the most female-oriented occupations are Personal Care & Service (100.0%), Healthcare Support (94.8%), and Food Preparation & Serving (36.4%).
| Occupation | Male | Female |
| Healthcare Support | 12 (5.2%) | 218 (94.8%) |
| Security & Protection | 63 (74.1%) | 22 (25.9%) |
| Firefighting & Prevention | 63 (74.1%) | 22 (25.9%) |
| Law Enforcement | 0 (0.0%) | 0 (0.0%) |
| Food Preparation & Serving | 84 (63.6%) | 48 (36.4%) |
| Cleaning & Maintenance | 148 (80.0%) | 37 (20.0%) |
| Personal Care & Service | 0 (0.0%) | 100 (100.0%) |
| Total (Category) | 307 (41.9%) | 425 (58.1%) |
| Total (Overall) | 1,528 (54.1%) | 1,294 (45.9%) |
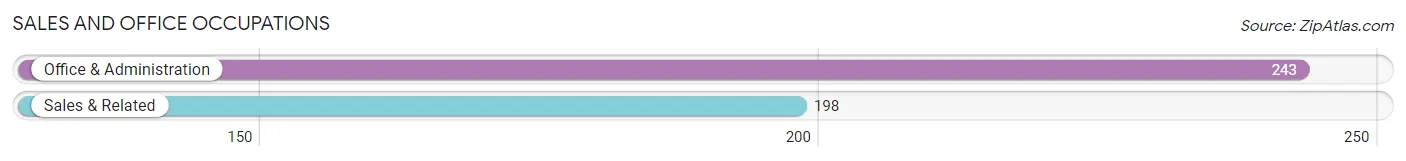
Sales and Office Occupations
The most common Sales and Office occupations in Pevely are Office & Administration (243 | 8.6%), and Sales & Related (198 | 7.0%).
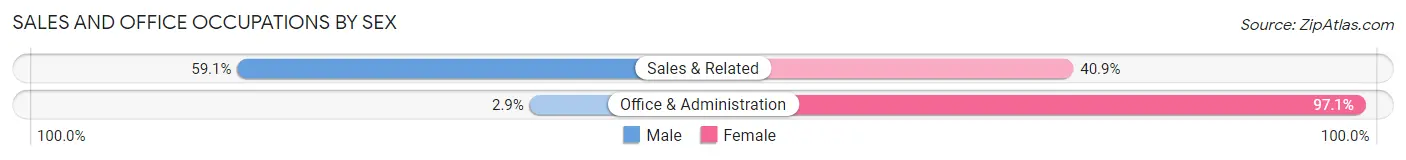
Sales and Office Occupations by Sex
| Occupation | Male | Female |
| Sales & Related | 117 (59.1%) | 81 (40.9%) |
| Office & Administration | 7 (2.9%) | 236 (97.1%) |
| Total (Category) | 124 (28.1%) | 317 (71.9%) |
| Total (Overall) | 1,528 (54.1%) | 1,294 (45.9%) |
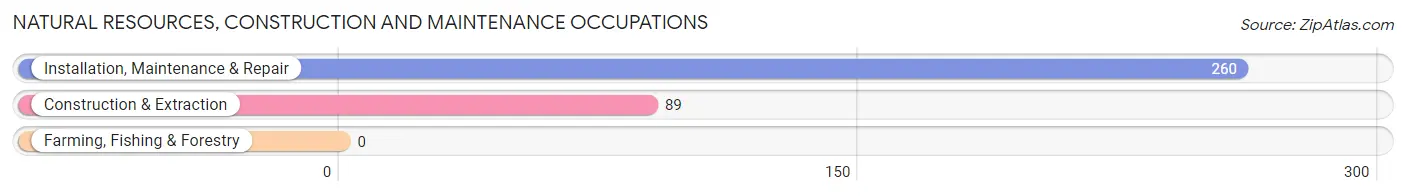
Natural Resources, Construction and Maintenance Occupations
The most common Natural Resources, Construction and Maintenance occupations in Pevely are Installation, Maintenance & Repair (260 | 9.2%), and Construction & Extraction (89 | 3.2%).
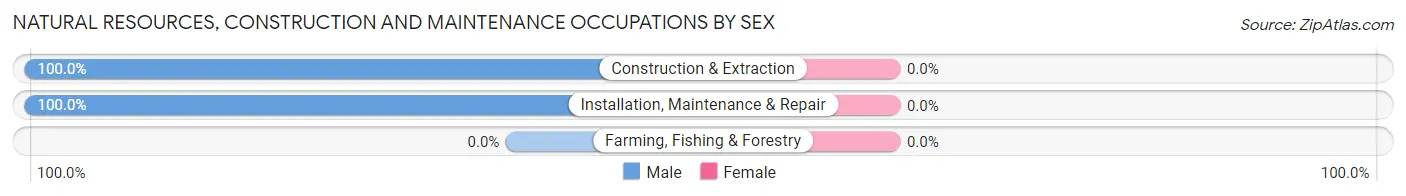
Natural Resources, Construction and Maintenance Occupations by Sex
| Occupation | Male | Female |
| Farming, Fishing & Forestry | 0 (0.0%) | 0 (0.0%) |
| Construction & Extraction | 89 (100.0%) | 0 (0.0%) |
| Installation, Maintenance & Repair | 260 (100.0%) | 0 (0.0%) |
| Total (Category) | 349 (100.0%) | 0 (0.0%) |
| Total (Overall) | 1,528 (54.1%) | 1,294 (45.9%) |
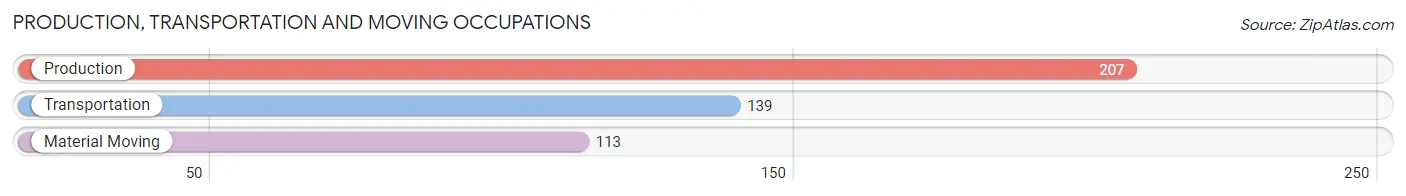
Production, Transportation and Moving Occupations
The most common Production, Transportation and Moving occupations in Pevely are Production (207 | 7.3%), Transportation (139 | 4.9%), and Material Moving (113 | 4.0%).
Production, Transportation and Moving Occupations by Sex
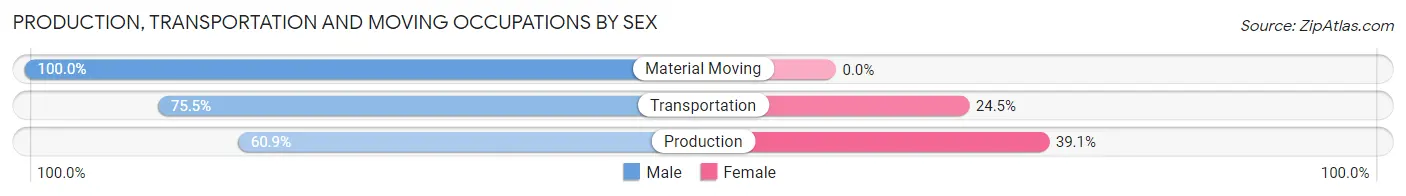
| Occupation | Male | Female |
| Production | 126 (60.9%) | 81 (39.1%) |
| Transportation | 105 (75.5%) | 34 (24.5%) |
| Material Moving | 113 (100.0%) | 0 (0.0%) |
| Total (Category) | 344 (75.0%) | 115 (25.1%) |
| Total (Overall) | 1,528 (54.1%) | 1,294 (45.9%) |
Employment Industries by Sex in Pevely
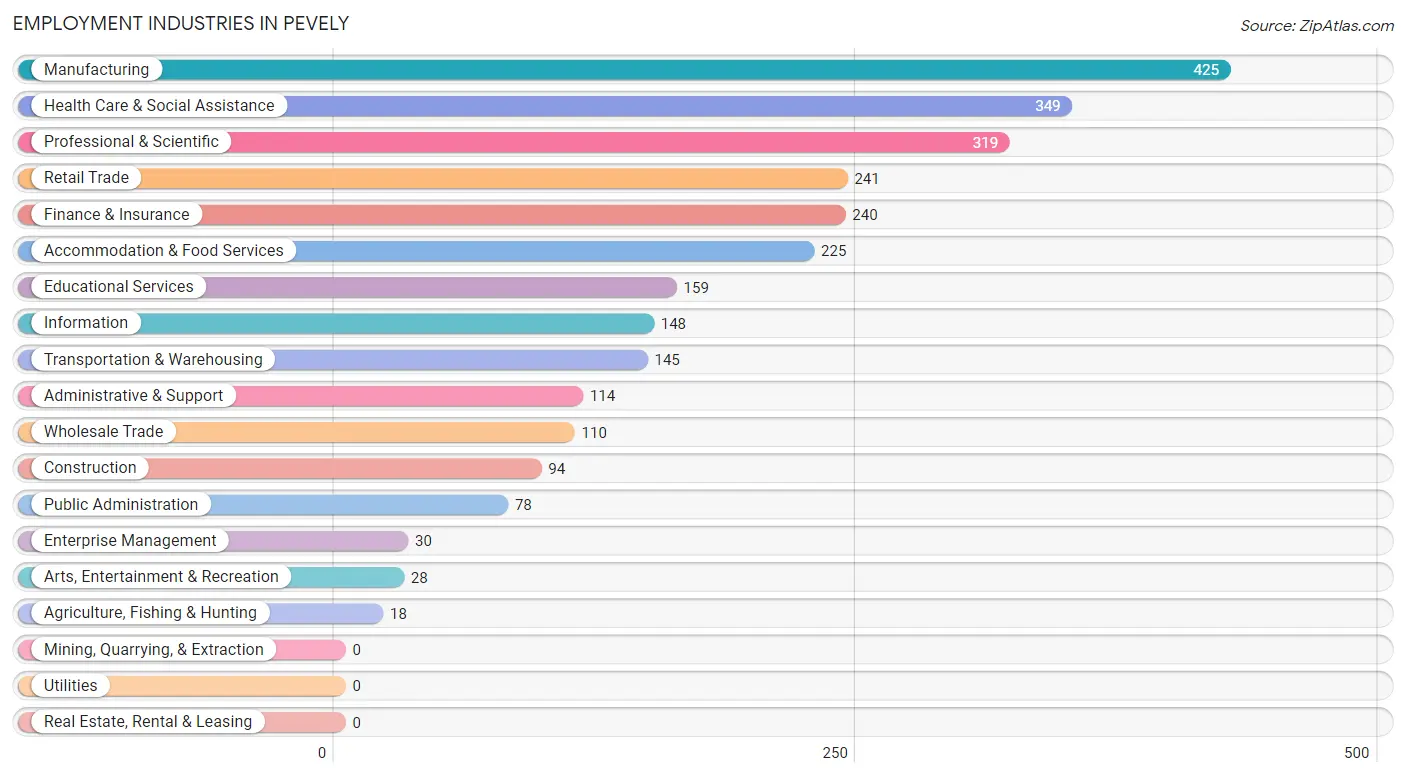
Employment Industries in Pevely
The major employment industries in Pevely include Manufacturing (425 | 15.1%), Health Care & Social Assistance (349 | 12.4%), Professional & Scientific (319 | 11.3%), Retail Trade (241 | 8.5%), and Finance & Insurance (240 | 8.5%).
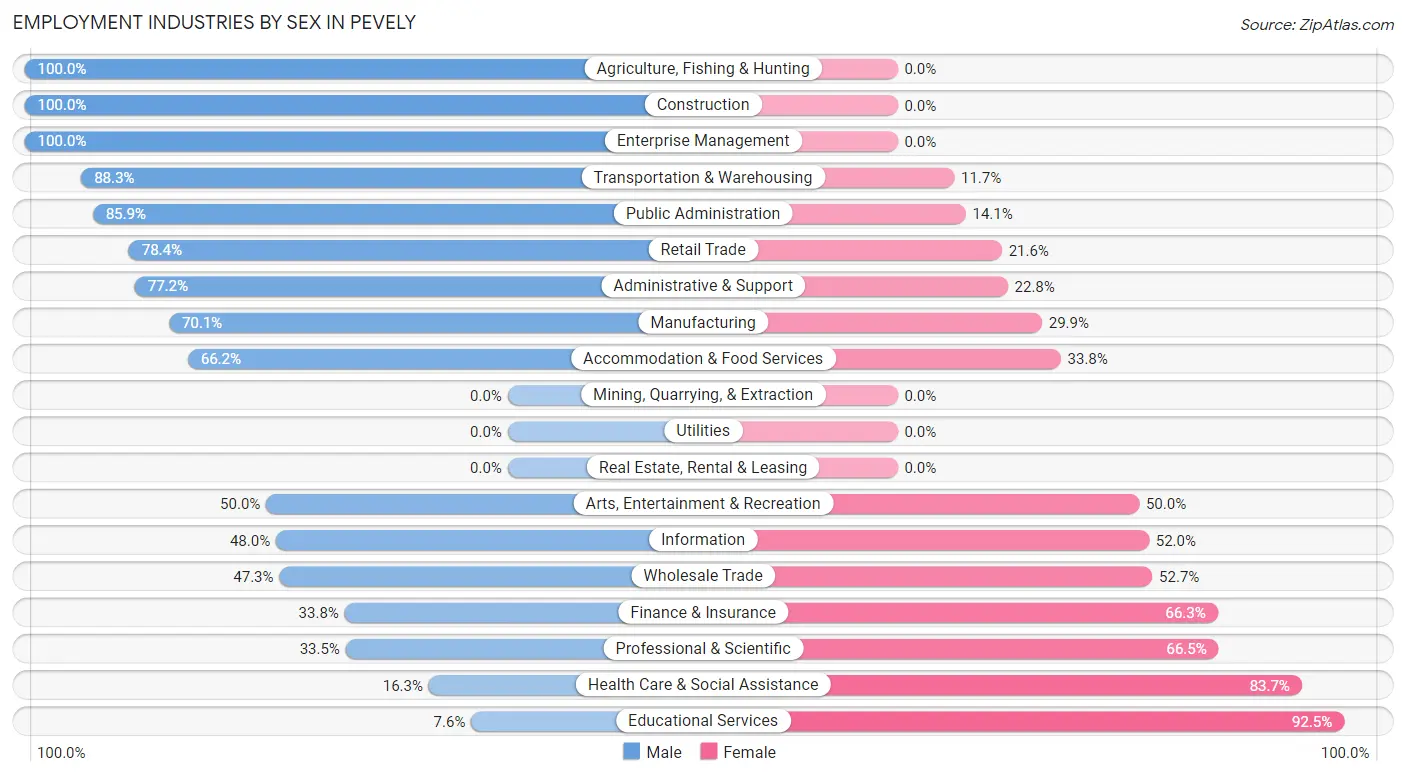
Employment Industries by Sex in Pevely
The Pevely industries that see more men than women are Agriculture, Fishing & Hunting (100.0%), Construction (100.0%), and Enterprise Management (100.0%), whereas the industries that tend to have a higher number of women are Educational Services (92.4%), Health Care & Social Assistance (83.7%), and Professional & Scientific (66.5%).
| Industry | Male | Female |
| Agriculture, Fishing & Hunting | 18 (100.0%) | 0 (0.0%) |
| Mining, Quarrying, & Extraction | 0 (0.0%) | 0 (0.0%) |
| Construction | 94 (100.0%) | 0 (0.0%) |
| Manufacturing | 298 (70.1%) | 127 (29.9%) |
| Wholesale Trade | 52 (47.3%) | 58 (52.7%) |
| Retail Trade | 189 (78.4%) | 52 (21.6%) |
| Transportation & Warehousing | 128 (88.3%) | 17 (11.7%) |
| Utilities | 0 (0.0%) | 0 (0.0%) |
| Information | 71 (48.0%) | 77 (52.0%) |
| Finance & Insurance | 81 (33.8%) | 159 (66.2%) |
| Real Estate, Rental & Leasing | 0 (0.0%) | 0 (0.0%) |
| Professional & Scientific | 107 (33.5%) | 212 (66.5%) |
| Enterprise Management | 30 (100.0%) | 0 (0.0%) |
| Administrative & Support | 88 (77.2%) | 26 (22.8%) |
| Educational Services | 12 (7.5%) | 147 (92.4%) |
| Health Care & Social Assistance | 57 (16.3%) | 292 (83.7%) |
| Arts, Entertainment & Recreation | 14 (50.0%) | 14 (50.0%) |
| Accommodation & Food Services | 149 (66.2%) | 76 (33.8%) |
| Public Administration | 67 (85.9%) | 11 (14.1%) |
| Total | 1,528 (54.1%) | 1,294 (45.9%) |
Education in Pevely
School Enrollment in Pevely
The most common levels of schooling among the 1,742 students in Pevely are elementary school (470 | 27.0%), middle school (298 | 17.1%), and high school (257 | 14.7%).
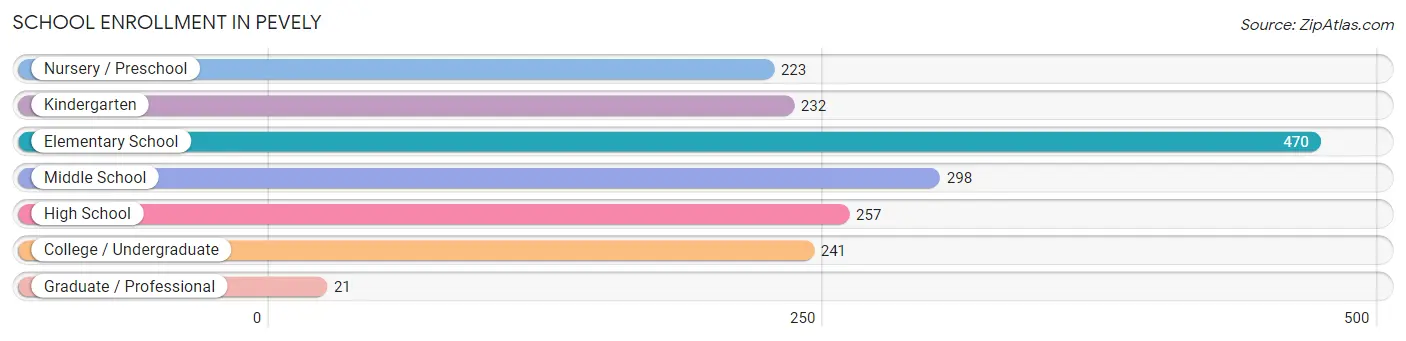
| School Level | # Students | % Students |
| Nursery / Preschool | 223 | 12.8% |
| Kindergarten | 232 | 13.3% |
| Elementary School | 470 | 27.0% |
| Middle School | 298 | 17.1% |
| High School | 257 | 14.7% |
| College / Undergraduate | 241 | 13.8% |
| Graduate / Professional | 21 | 1.2% |
| Total | 1,742 | 100.0% |
School Enrollment by Age by Funding Source in Pevely
Out of a total of 1,742 students who are enrolled in schools in Pevely, 160 (9.2%) attend a private institution, while the remaining 1,582 (90.8%) are enrolled in public schools. The age group of 18 to 19 year olds has the highest likelihood of being enrolled in private schools, with 25 (41.7% in the age bracket) enrolled. Conversely, the age group of 35 years and over has the lowest likelihood of being enrolled in a private school, with 62 (100.0% in the age bracket) attending a public institution.
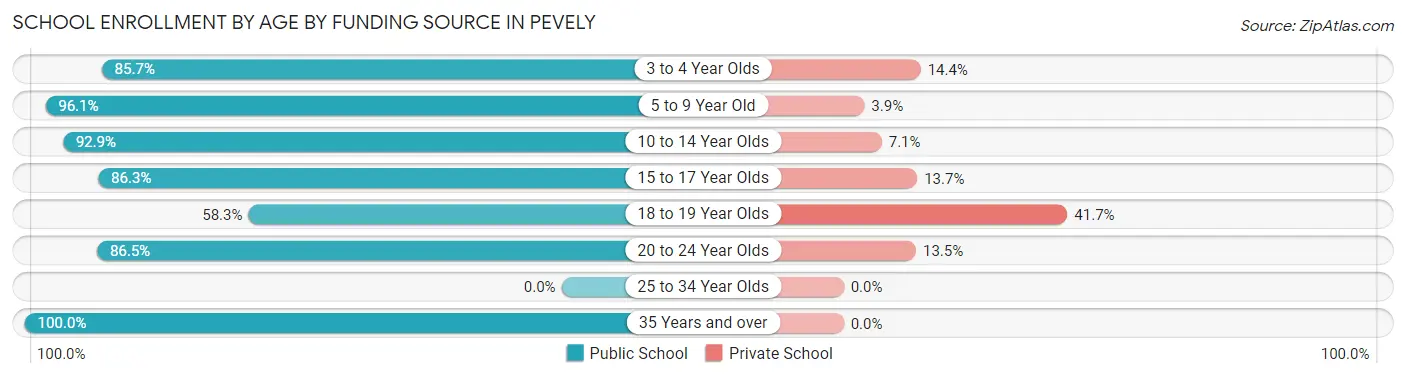
| Age Bracket | Public School | Private School |
| 3 to 4 Year Olds | 191 (85.7%) | 32 (14.3%) |
| 5 to 9 Year Old | 623 (96.1%) | 25 (3.9%) |
| 10 to 14 Year Olds | 327 (92.9%) | 25 (7.1%) |
| 15 to 17 Year Olds | 189 (86.3%) | 30 (13.7%) |
| 18 to 19 Year Olds | 35 (58.3%) | 25 (41.7%) |
| 20 to 24 Year Olds | 154 (86.5%) | 24 (13.5%) |
| 25 to 34 Year Olds | 0 (0.0%) | 0 (0.0%) |
| 35 Years and over | 62 (100.0%) | 0 (0.0%) |
| Total | 1,582 (90.8%) | 160 (9.2%) |
Educational Attainment by Field of Study in Pevely
Education (216 | 28.7%), business (151 | 20.1%), visual & performing arts (78 | 10.4%), bio, nature & agricultural (71 | 9.4%), and social sciences (49 | 6.5%) are the most common fields of study among 753 individuals in Pevely who have obtained a bachelor's degree or higher.
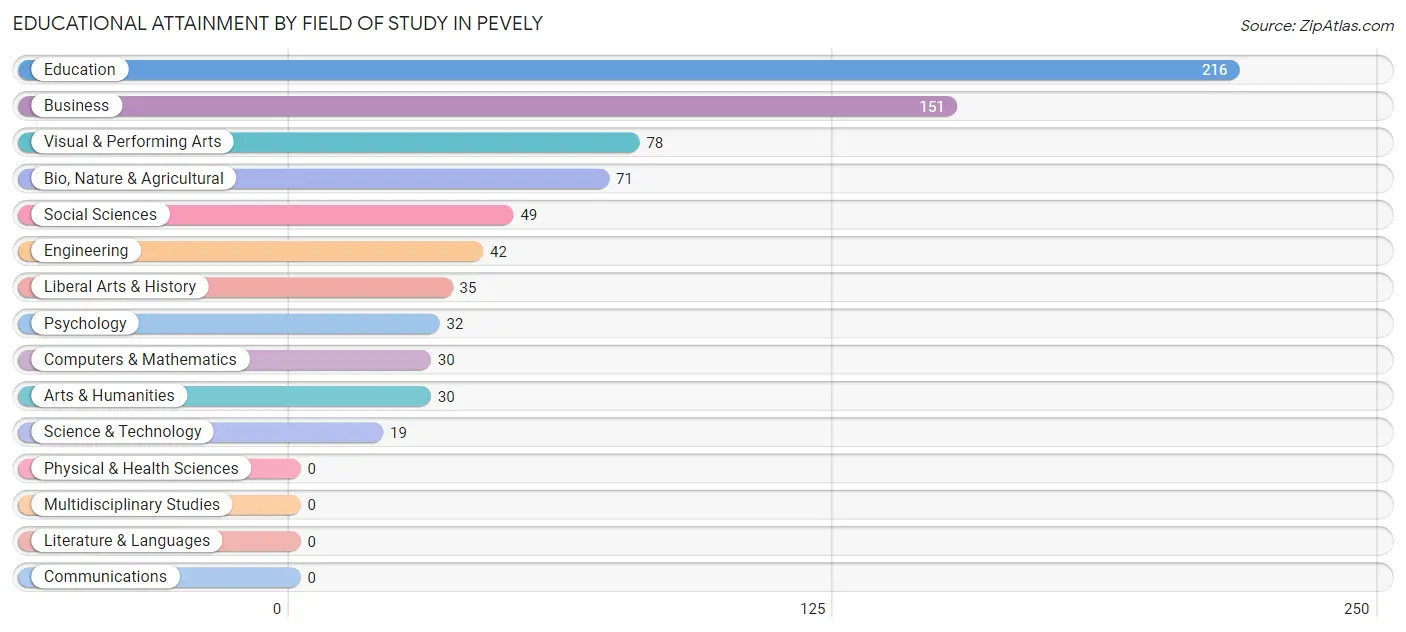
| Field of Study | # Graduates | % Graduates |
| Computers & Mathematics | 30 | 4.0% |
| Bio, Nature & Agricultural | 71 | 9.4% |
| Physical & Health Sciences | 0 | 0.0% |
| Psychology | 32 | 4.3% |
| Social Sciences | 49 | 6.5% |
| Engineering | 42 | 5.6% |
| Multidisciplinary Studies | 0 | 0.0% |
| Science & Technology | 19 | 2.5% |
| Business | 151 | 20.1% |
| Education | 216 | 28.7% |
| Literature & Languages | 0 | 0.0% |
| Liberal Arts & History | 35 | 4.6% |
| Visual & Performing Arts | 78 | 10.4% |
| Communications | 0 | 0.0% |
| Arts & Humanities | 30 | 4.0% |
| Total | 753 | 100.0% |
Transportation & Commute in Pevely
Vehicle Availability by Sex in Pevely
The most prevalent vehicle ownership categories in Pevely are males with 2 vehicles (692, accounting for 45.4%) and females with 2 vehicles (503, making up 53.5%).
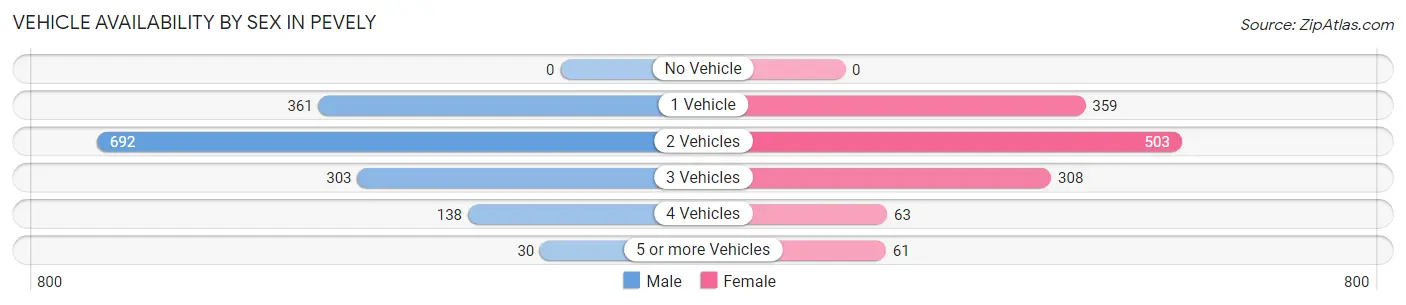
| Vehicles Available | Male | Female |
| No Vehicle | 0 (0.0%) | 0 (0.0%) |
| 1 Vehicle | 361 (23.7%) | 359 (27.7%) |
| 2 Vehicles | 692 (45.4%) | 503 (38.9%) |
| 3 Vehicles | 303 (19.9%) | 308 (23.8%) |
| 4 Vehicles | 138 (9.1%) | 63 (4.9%) |
| 5 or more Vehicles | 30 (2.0%) | 61 (4.7%) |
| Total | 1,524 (100.0%) | 1,294 (100.0%) |
Commute Time in Pevely
The most frequently occuring commute durations in Pevely are 45 to 59 minutes (493 commuters, 19.7%), 15 to 19 minutes (443 commuters, 17.7%), and 30 to 34 minutes (384 commuters, 15.3%).
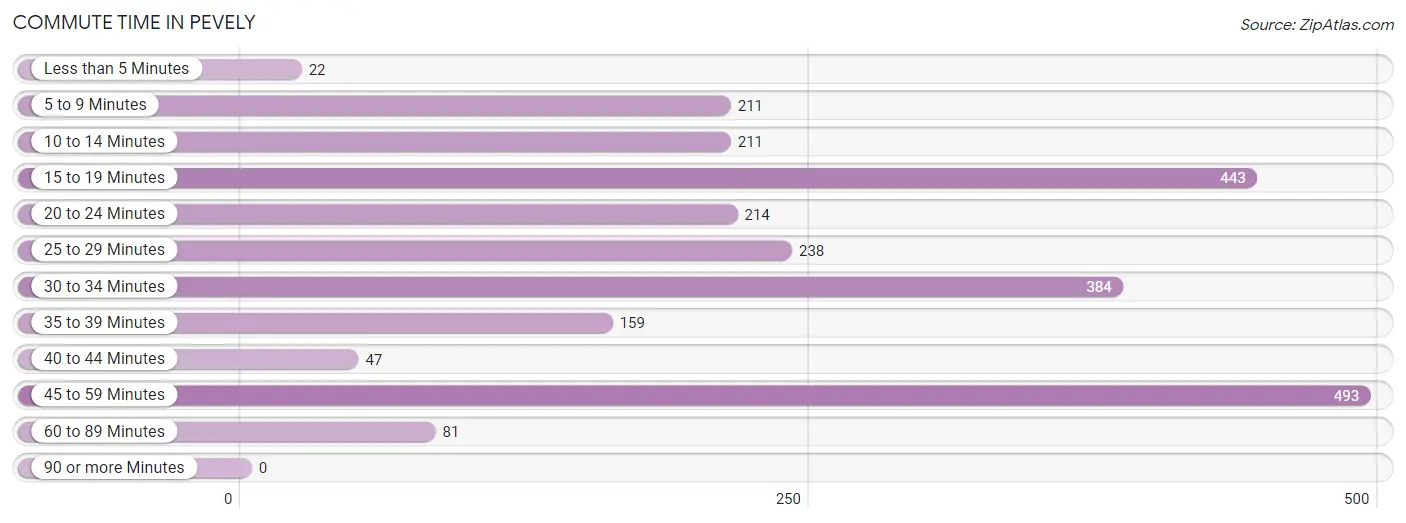
| Commute Time | # Commuters | % Commuters |
| Less than 5 Minutes | 22 | 0.9% |
| 5 to 9 Minutes | 211 | 8.4% |
| 10 to 14 Minutes | 211 | 8.4% |
| 15 to 19 Minutes | 443 | 17.7% |
| 20 to 24 Minutes | 214 | 8.6% |
| 25 to 29 Minutes | 238 | 9.5% |
| 30 to 34 Minutes | 384 | 15.3% |
| 35 to 39 Minutes | 159 | 6.4% |
| 40 to 44 Minutes | 47 | 1.9% |
| 45 to 59 Minutes | 493 | 19.7% |
| 60 to 89 Minutes | 81 | 3.2% |
| 90 or more Minutes | 0 | 0.0% |
Commute Time by Sex in Pevely
The most common commute times in Pevely are 45 to 59 minutes (352 commuters, 25.3%) for males and 15 to 19 minutes (243 commuters, 21.8%) for females.
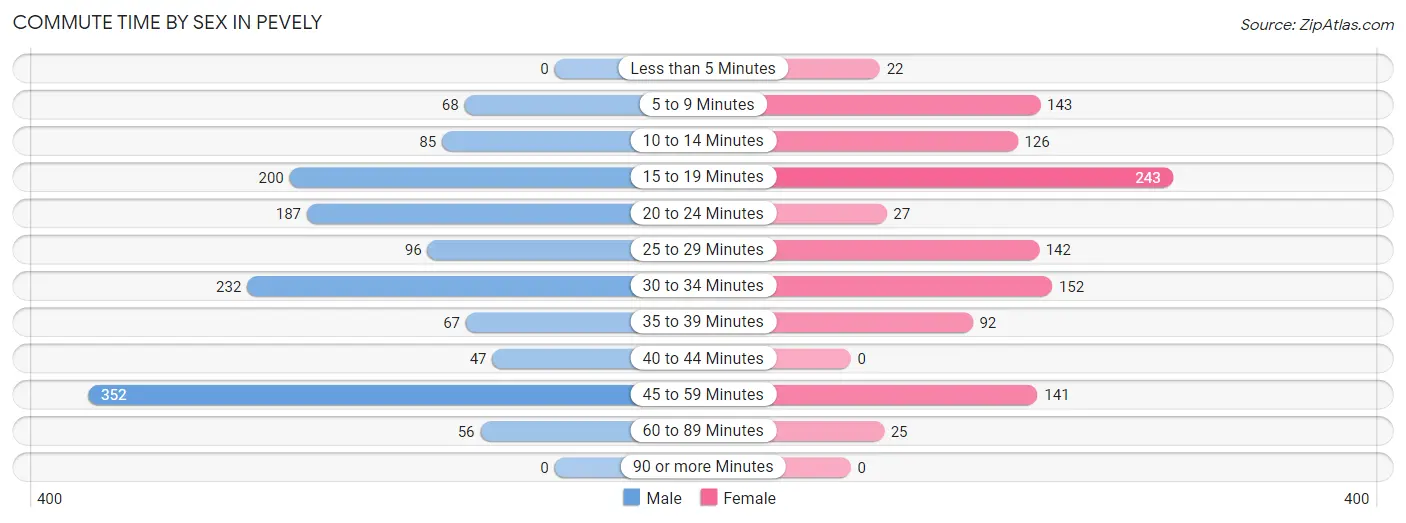
| Commute Time | Male | Female |
| Less than 5 Minutes | 0 (0.0%) | 22 (2.0%) |
| 5 to 9 Minutes | 68 (4.9%) | 143 (12.9%) |
| 10 to 14 Minutes | 85 (6.1%) | 126 (11.3%) |
| 15 to 19 Minutes | 200 (14.4%) | 243 (21.8%) |
| 20 to 24 Minutes | 187 (13.5%) | 27 (2.4%) |
| 25 to 29 Minutes | 96 (6.9%) | 142 (12.8%) |
| 30 to 34 Minutes | 232 (16.7%) | 152 (13.7%) |
| 35 to 39 Minutes | 67 (4.8%) | 92 (8.3%) |
| 40 to 44 Minutes | 47 (3.4%) | 0 (0.0%) |
| 45 to 59 Minutes | 352 (25.3%) | 141 (12.7%) |
| 60 to 89 Minutes | 56 (4.0%) | 25 (2.2%) |
| 90 or more Minutes | 0 (0.0%) | 0 (0.0%) |
Time of Departure to Work by Sex in Pevely
The most frequent times of departure to work in Pevely are 8:00 AM to 8:29 AM (268, 19.3%) for males and 6:30 AM to 6:59 AM (241, 21.6%) for females.
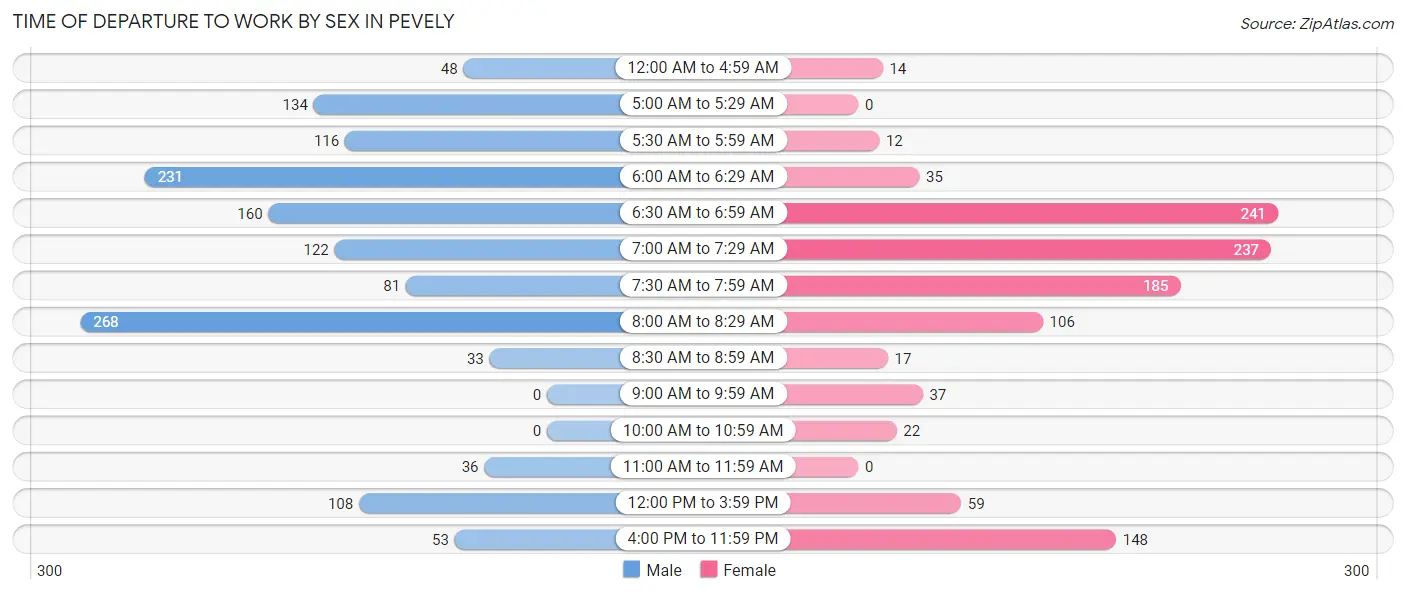
| Time of Departure | Male | Female |
| 12:00 AM to 4:59 AM | 48 (3.5%) | 14 (1.3%) |
| 5:00 AM to 5:29 AM | 134 (9.6%) | 0 (0.0%) |
| 5:30 AM to 5:59 AM | 116 (8.4%) | 12 (1.1%) |
| 6:00 AM to 6:29 AM | 231 (16.6%) | 35 (3.1%) |
| 6:30 AM to 6:59 AM | 160 (11.5%) | 241 (21.6%) |
| 7:00 AM to 7:29 AM | 122 (8.8%) | 237 (21.3%) |
| 7:30 AM to 7:59 AM | 81 (5.8%) | 185 (16.6%) |
| 8:00 AM to 8:29 AM | 268 (19.3%) | 106 (9.5%) |
| 8:30 AM to 8:59 AM | 33 (2.4%) | 17 (1.5%) |
| 9:00 AM to 9:59 AM | 0 (0.0%) | 37 (3.3%) |
| 10:00 AM to 10:59 AM | 0 (0.0%) | 22 (2.0%) |
| 11:00 AM to 11:59 AM | 36 (2.6%) | 0 (0.0%) |
| 12:00 PM to 3:59 PM | 108 (7.8%) | 59 (5.3%) |
| 4:00 PM to 11:59 PM | 53 (3.8%) | 148 (13.3%) |
| Total | 1,390 (100.0%) | 1,113 (100.0%) |
Housing Occupancy in Pevely
Occupancy by Ownership in Pevely
Of the total 2,190 dwellings in Pevely, owner-occupied units account for 1,449 (66.2%), while renter-occupied units make up 741 (33.8%).
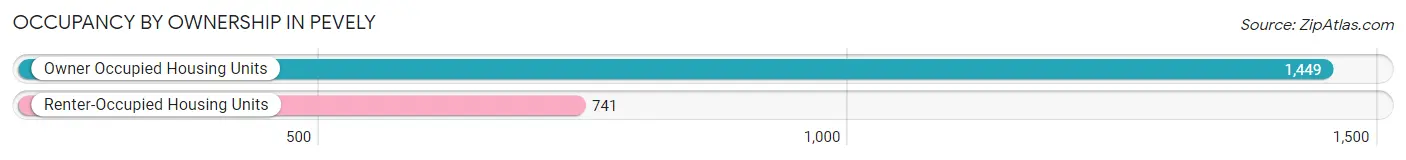
| Occupancy | # Housing Units | % Housing Units |
| Owner Occupied Housing Units | 1,449 | 66.2% |
| Renter-Occupied Housing Units | 741 | 33.8% |
| Total Occupied Housing Units | 2,190 | 100.0% |
Occupancy by Household Size in Pevely
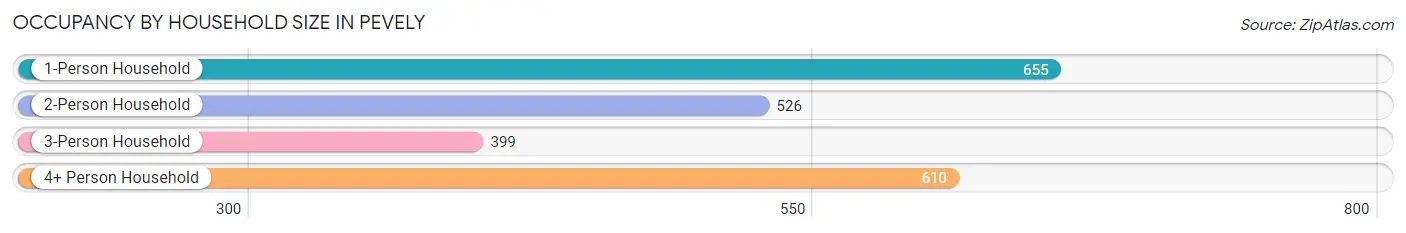
| Household Size | # Housing Units | % Housing Units |
| 1-Person Household | 655 | 29.9% |
| 2-Person Household | 526 | 24.0% |
| 3-Person Household | 399 | 18.2% |
| 4+ Person Household | 610 | 27.9% |
| Total Housing Units | 2,190 | 100.0% |
Occupancy by Ownership by Household Size in Pevely
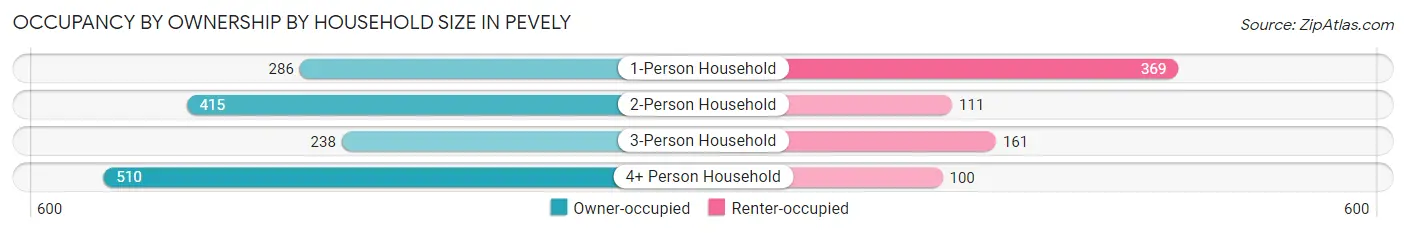
| Household Size | Owner-occupied | Renter-occupied |
| 1-Person Household | 286 (43.7%) | 369 (56.3%) |
| 2-Person Household | 415 (78.9%) | 111 (21.1%) |
| 3-Person Household | 238 (59.7%) | 161 (40.4%) |
| 4+ Person Household | 510 (83.6%) | 100 (16.4%) |
| Total Housing Units | 1,449 (66.2%) | 741 (33.8%) |
Occupancy by Educational Attainment in Pevely
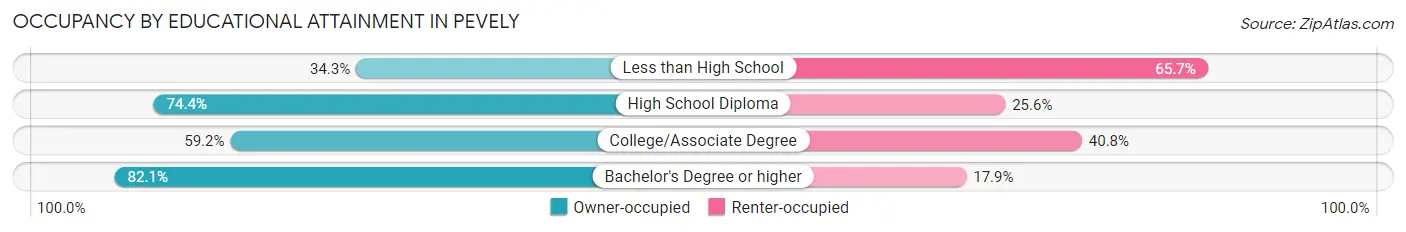
| Household Size | Owner-occupied | Renter-occupied |
| Less than High School | 60 (34.3%) | 115 (65.7%) |
| High School Diploma | 349 (74.4%) | 120 (25.6%) |
| College/Associate Degree | 594 (59.2%) | 409 (40.8%) |
| Bachelor's Degree or higher | 446 (82.1%) | 97 (17.9%) |
Occupancy by Age of Householder in Pevely
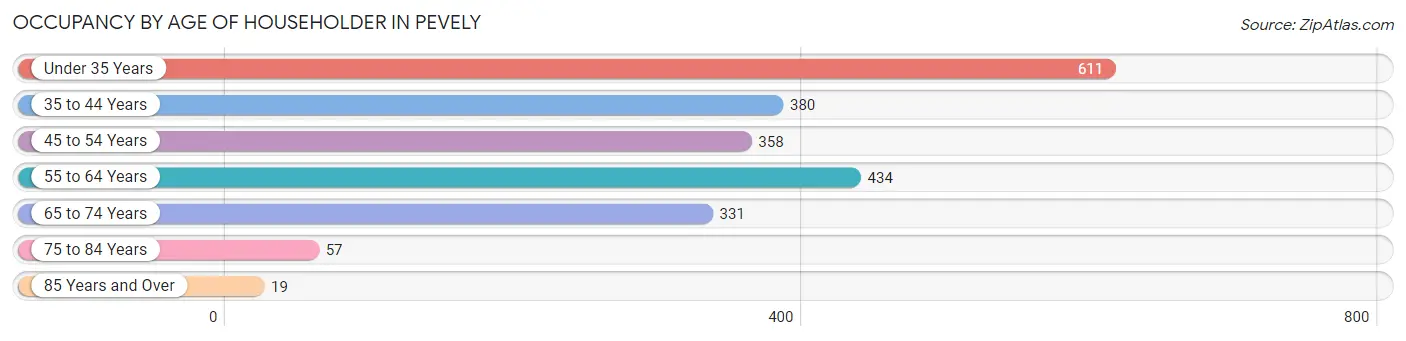
| Age Bracket | # Households | % Households |
| Under 35 Years | 611 | 27.9% |
| 35 to 44 Years | 380 | 17.3% |
| 45 to 54 Years | 358 | 16.4% |
| 55 to 64 Years | 434 | 19.8% |
| 65 to 74 Years | 331 | 15.1% |
| 75 to 84 Years | 57 | 2.6% |
| 85 Years and Over | 19 | 0.9% |
| Total | 2,190 | 100.0% |
Housing Finances in Pevely
Median Income by Occupancy in Pevely
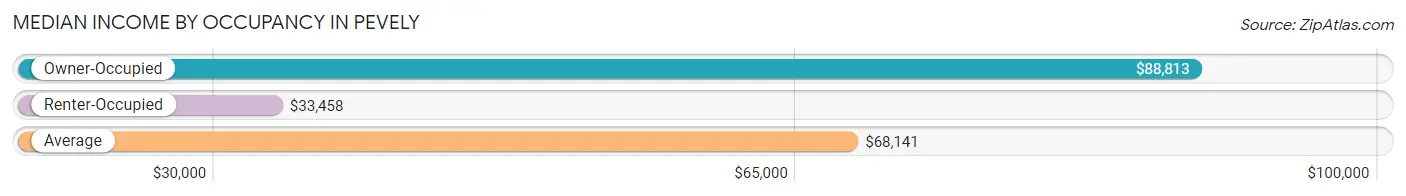
| Occupancy Type | # Households | Median Income |
| Owner-Occupied | 1,449 (66.2%) | $88,813 |
| Renter-Occupied | 741 (33.8%) | $33,458 |
| Average | 2,190 (100.0%) | $68,141 |
Occupancy by Householder Income Bracket in Pevely
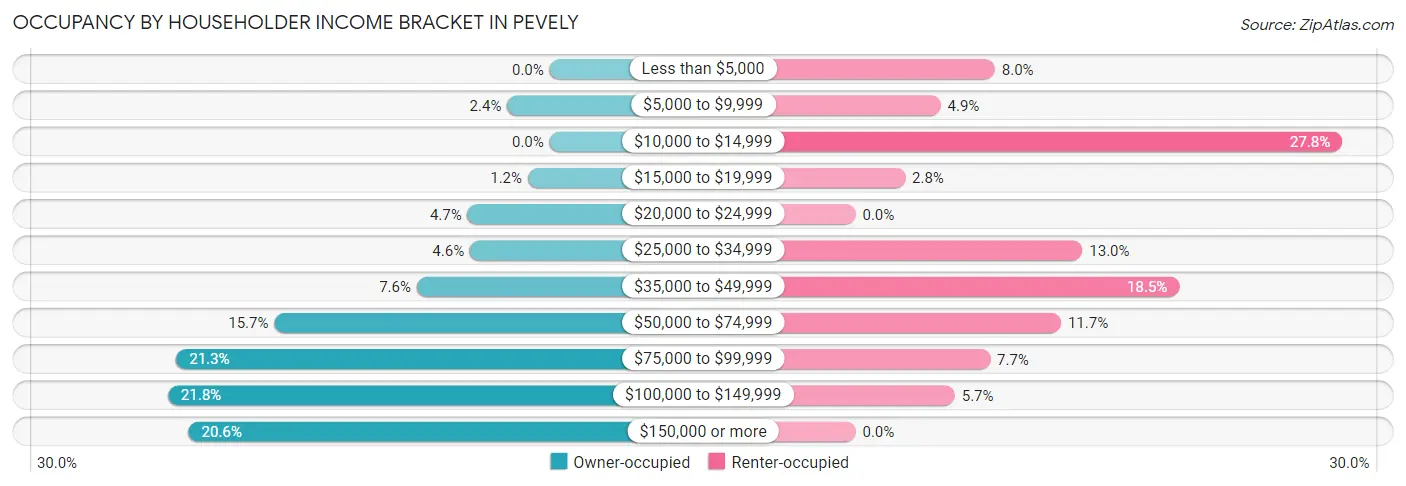
| Income Bracket | Owner-occupied | Renter-occupied |
| Less than $5,000 | 0 (0.0%) | 59 (8.0%) |
| $5,000 to $9,999 | 35 (2.4%) | 36 (4.9%) |
| $10,000 to $14,999 | 0 (0.0%) | 206 (27.8%) |
| $15,000 to $19,999 | 18 (1.2%) | 21 (2.8%) |
| $20,000 to $24,999 | 68 (4.7%) | 0 (0.0%) |
| $25,000 to $34,999 | 66 (4.5%) | 96 (13.0%) |
| $35,000 to $49,999 | 110 (7.6%) | 137 (18.5%) |
| $50,000 to $74,999 | 228 (15.7%) | 87 (11.7%) |
| $75,000 to $99,999 | 309 (21.3%) | 57 (7.7%) |
| $100,000 to $149,999 | 316 (21.8%) | 42 (5.7%) |
| $150,000 or more | 299 (20.6%) | 0 (0.0%) |
| Total | 1,449 (100.0%) | 741 (100.0%) |
Monthly Housing Cost Tiers in Pevely
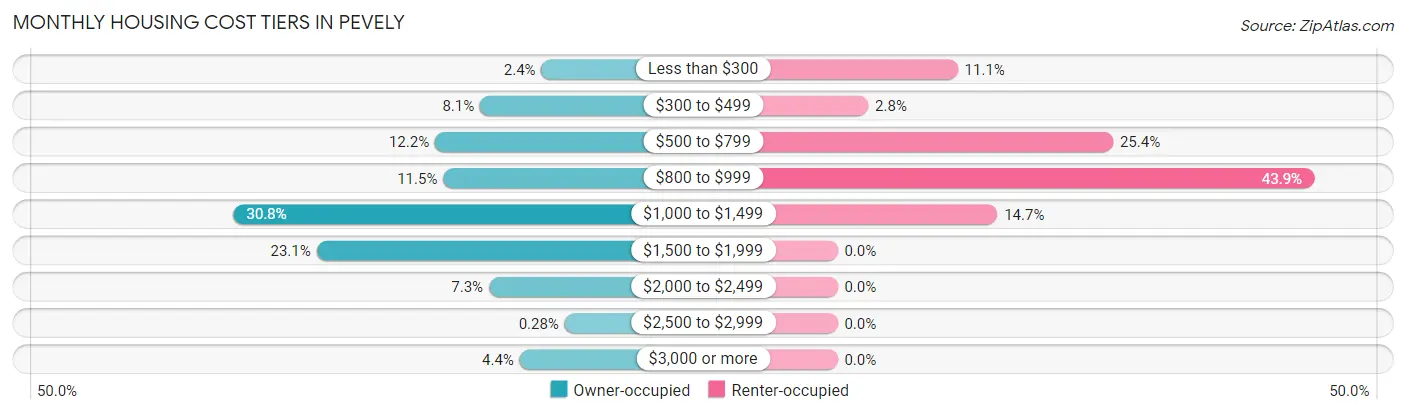
| Monthly Cost | Owner-occupied | Renter-occupied |
| Less than $300 | 35 (2.4%) | 82 (11.1%) |
| $300 to $499 | 117 (8.1%) | 21 (2.8%) |
| $500 to $799 | 177 (12.2%) | 188 (25.4%) |
| $800 to $999 | 166 (11.5%) | 325 (43.9%) |
| $1,000 to $1,499 | 446 (30.8%) | 109 (14.7%) |
| $1,500 to $1,999 | 335 (23.1%) | 0 (0.0%) |
| $2,000 to $2,499 | 105 (7.2%) | 0 (0.0%) |
| $2,500 to $2,999 | 4 (0.3%) | 0 (0.0%) |
| $3,000 or more | 64 (4.4%) | 0 (0.0%) |
| Total | 1,449 (100.0%) | 741 (100.0%) |
Physical Housing Characteristics in Pevely
Housing Structures in Pevely
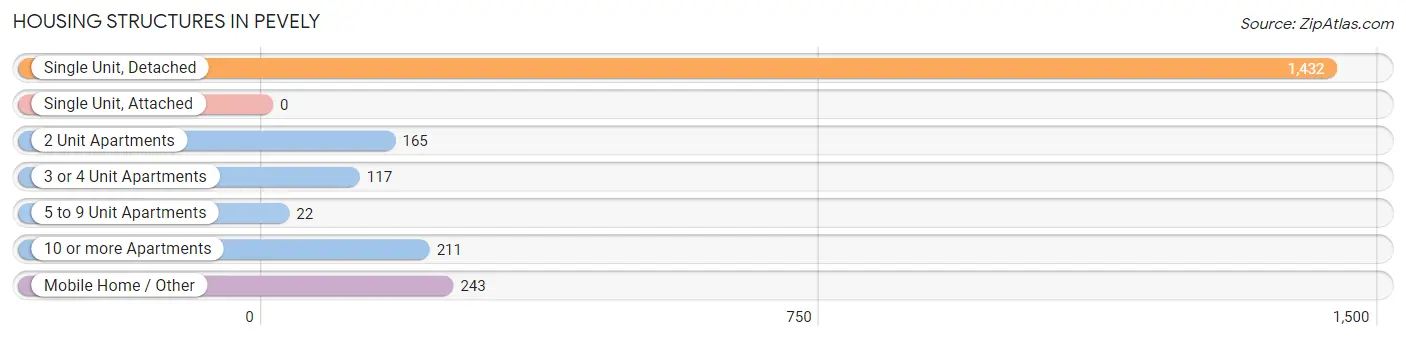
| Structure Type | # Housing Units | % Housing Units |
| Single Unit, Detached | 1,432 | 65.4% |
| Single Unit, Attached | 0 | 0.0% |
| 2 Unit Apartments | 165 | 7.5% |
| 3 or 4 Unit Apartments | 117 | 5.3% |
| 5 to 9 Unit Apartments | 22 | 1.0% |
| 10 or more Apartments | 211 | 9.6% |
| Mobile Home / Other | 243 | 11.1% |
| Total | 2,190 | 100.0% |
Housing Structures by Occupancy in Pevely
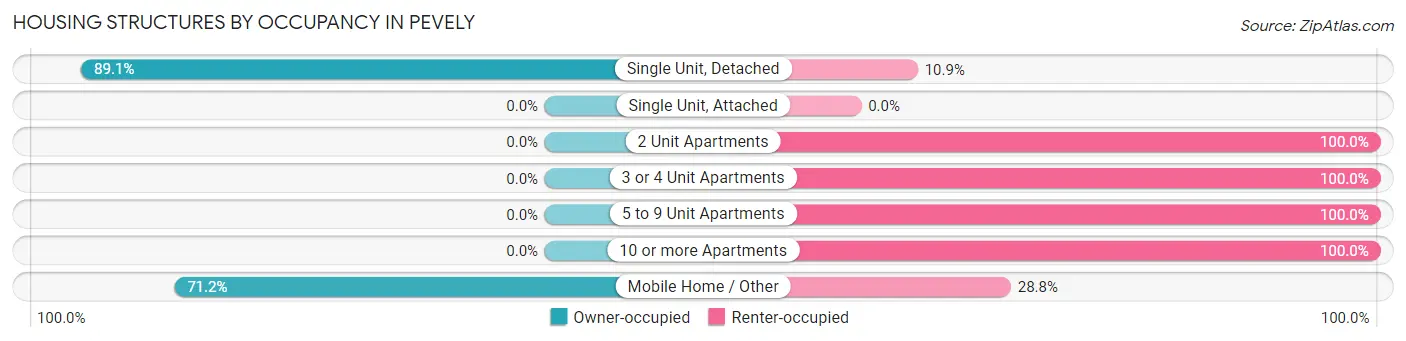
| Structure Type | Owner-occupied | Renter-occupied |
| Single Unit, Detached | 1,276 (89.1%) | 156 (10.9%) |
| Single Unit, Attached | 0 (0.0%) | 0 (0.0%) |
| 2 Unit Apartments | 0 (0.0%) | 165 (100.0%) |
| 3 or 4 Unit Apartments | 0 (0.0%) | 117 (100.0%) |
| 5 to 9 Unit Apartments | 0 (0.0%) | 22 (100.0%) |
| 10 or more Apartments | 0 (0.0%) | 211 (100.0%) |
| Mobile Home / Other | 173 (71.2%) | 70 (28.8%) |
| Total | 1,449 (66.2%) | 741 (33.8%) |
Housing Structures by Number of Rooms in Pevely
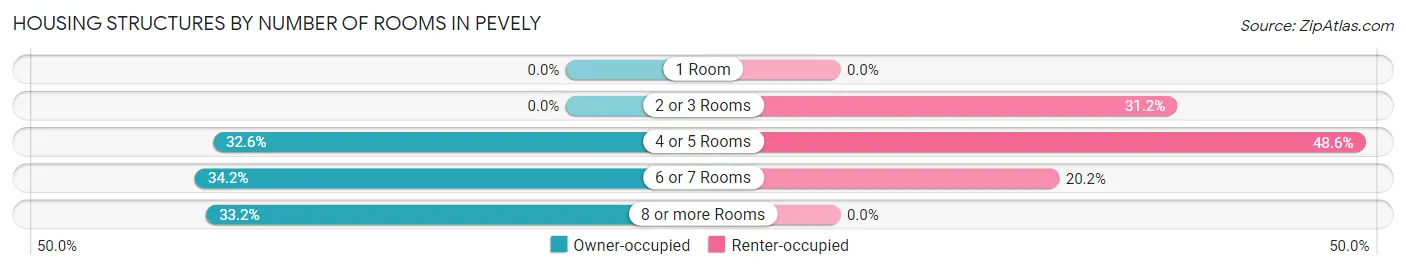
| Number of Rooms | Owner-occupied | Renter-occupied |
| 1 Room | 0 (0.0%) | 0 (0.0%) |
| 2 or 3 Rooms | 0 (0.0%) | 231 (31.2%) |
| 4 or 5 Rooms | 472 (32.6%) | 360 (48.6%) |
| 6 or 7 Rooms | 496 (34.2%) | 150 (20.2%) |
| 8 or more Rooms | 481 (33.2%) | 0 (0.0%) |
| Total | 1,449 (100.0%) | 741 (100.0%) |
Housing Structure by Heating Type in Pevely
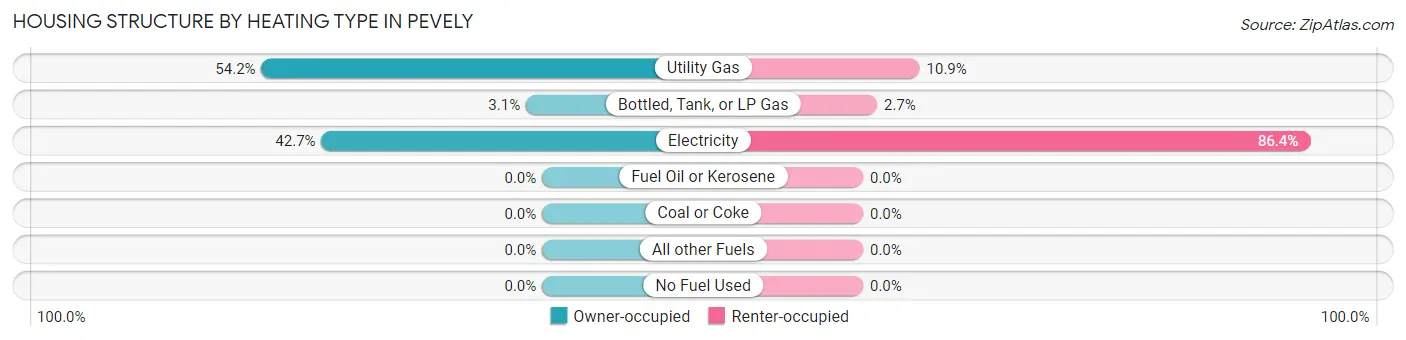
| Heating Type | Owner-occupied | Renter-occupied |
| Utility Gas | 786 (54.2%) | 81 (10.9%) |
| Bottled, Tank, or LP Gas | 45 (3.1%) | 20 (2.7%) |
| Electricity | 618 (42.6%) | 640 (86.4%) |
| Fuel Oil or Kerosene | 0 (0.0%) | 0 (0.0%) |
| Coal or Coke | 0 (0.0%) | 0 (0.0%) |
| All other Fuels | 0 (0.0%) | 0 (0.0%) |
| No Fuel Used | 0 (0.0%) | 0 (0.0%) |
| Total | 1,449 (100.0%) | 741 (100.0%) |
Household Vehicle Usage in Pevely
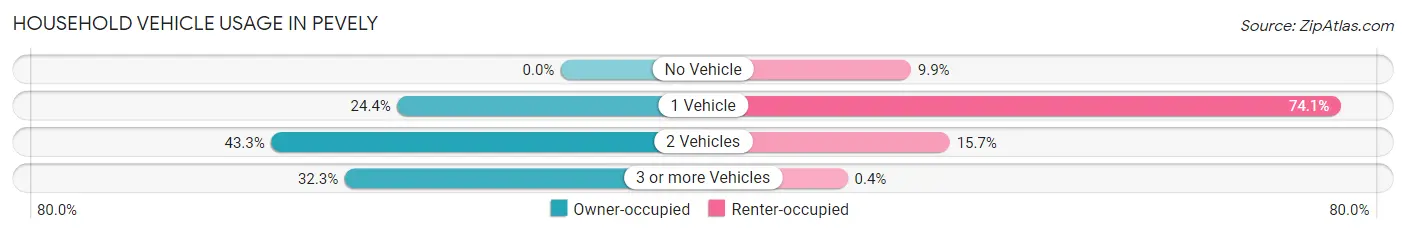
| Vehicles per Household | Owner-occupied | Renter-occupied |
| No Vehicle | 0 (0.0%) | 73 (9.9%) |
| 1 Vehicle | 354 (24.4%) | 549 (74.1%) |
| 2 Vehicles | 627 (43.3%) | 116 (15.7%) |
| 3 or more Vehicles | 468 (32.3%) | 3 (0.4%) |
| Total | 1,449 (100.0%) | 741 (100.0%) |
Real Estate & Mortgages in Pevely
Real Estate and Mortgage Overview in Pevely
| Characteristic | Without Mortgage | With Mortgage |
| Housing Units | 362 | 1,087 |
| Median Property Value | $170,000 | $211,400 |
| Median Household Income | $97,788 | $199 |
| Monthly Housing Costs | $600 | $64 |
| Real Estate Taxes | $3,078 | $85 |
Property Value by Mortgage Status in Pevely
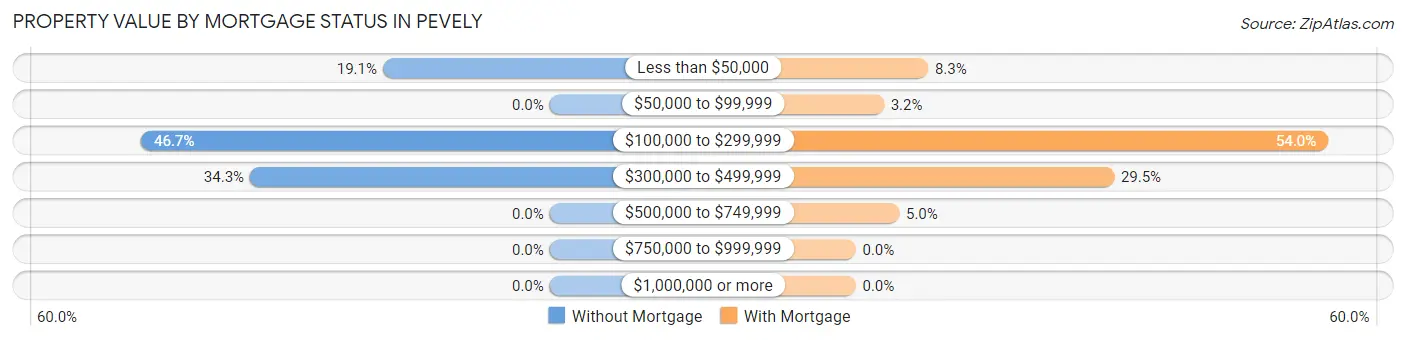
| Property Value | Without Mortgage | With Mortgage |
| Less than $50,000 | 69 (19.1%) | 90 (8.3%) |
| $50,000 to $99,999 | 0 (0.0%) | 35 (3.2%) |
| $100,000 to $299,999 | 169 (46.7%) | 587 (54.0%) |
| $300,000 to $499,999 | 124 (34.3%) | 321 (29.5%) |
| $500,000 to $749,999 | 0 (0.0%) | 54 (5.0%) |
| $750,000 to $999,999 | 0 (0.0%) | 0 (0.0%) |
| $1,000,000 or more | 0 (0.0%) | 0 (0.0%) |
| Total | 362 (100.0%) | 1,087 (100.0%) |
Household Income by Mortgage Status in Pevely
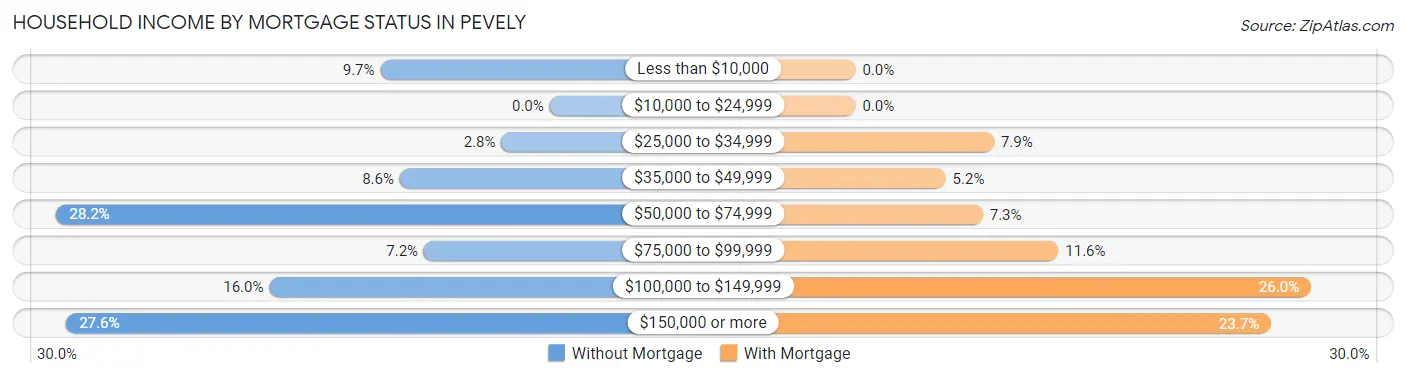
| Household Income | Without Mortgage | With Mortgage |
| Less than $10,000 | 35 (9.7%) | 0 (0.0%) |
| $10,000 to $24,999 | 0 (0.0%) | 0 (0.0%) |
| $25,000 to $34,999 | 10 (2.8%) | 86 (7.9%) |
| $35,000 to $49,999 | 31 (8.6%) | 56 (5.1%) |
| $50,000 to $74,999 | 102 (28.2%) | 79 (7.3%) |
| $75,000 to $99,999 | 26 (7.2%) | 126 (11.6%) |
| $100,000 to $149,999 | 58 (16.0%) | 283 (26.0%) |
| $150,000 or more | 100 (27.6%) | 258 (23.7%) |
| Total | 362 (100.0%) | 1,087 (100.0%) |
Property Value to Household Income Ratio in Pevely
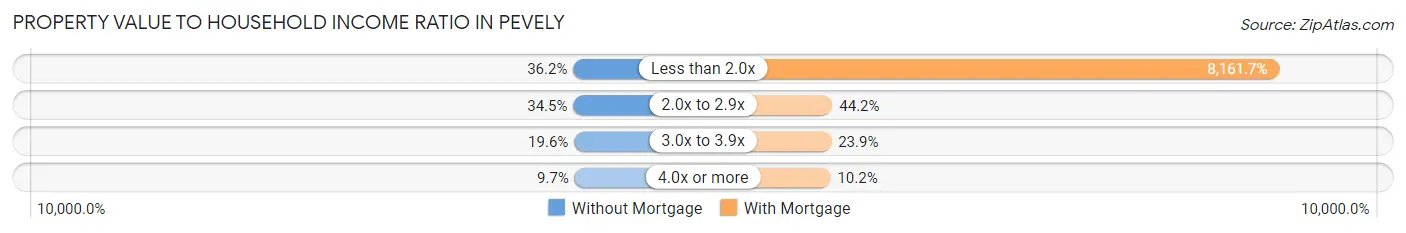
| Value-to-Income Ratio | Without Mortgage | With Mortgage |
| Less than 2.0x | 131 (36.2%) | 88,718 (8,161.7%) |
| 2.0x to 2.9x | 125 (34.5%) | 480 (44.2%) |
| 3.0x to 3.9x | 71 (19.6%) | 260 (23.9%) |
| 4.0x or more | 35 (9.7%) | 111 (10.2%) |
| Total | 362 (100.0%) | 1,087 (100.0%) |
Real Estate Taxes by Mortgage Status in Pevely
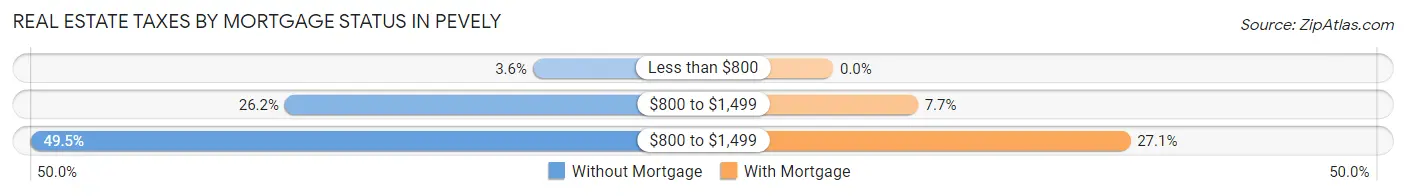
| Property Taxes | Without Mortgage | With Mortgage |
| Less than $800 | 13 (3.6%) | 0 (0.0%) |
| $800 to $1,499 | 95 (26.2%) | 84 (7.7%) |
| $800 to $1,499 | 179 (49.4%) | 295 (27.1%) |
| Total | 362 (100.0%) | 1,087 (100.0%) |
Health & Disability in Pevely
Health Insurance Coverage by Age in Pevely
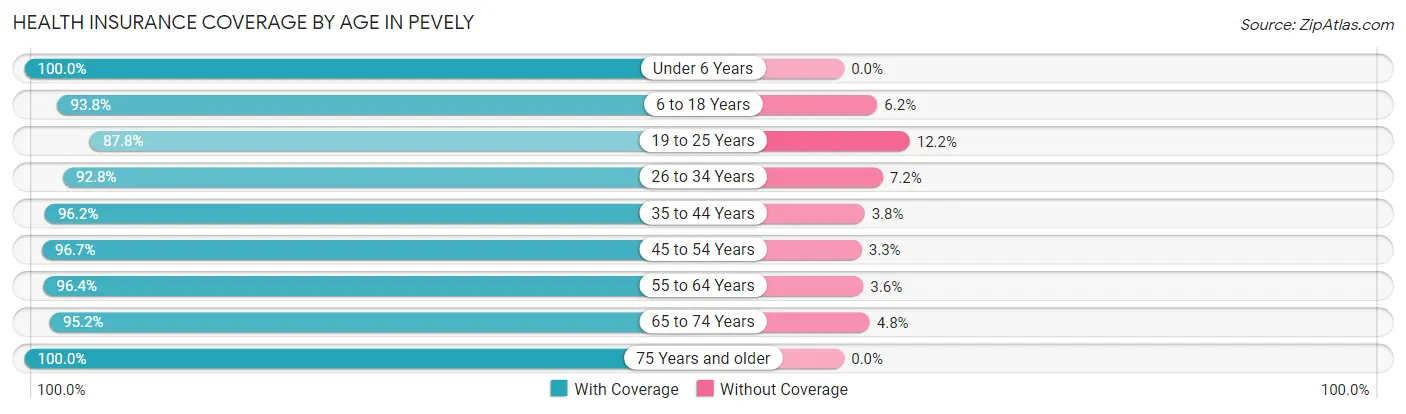
| Age Bracket | With Coverage | Without Coverage |
| Under 6 Years | 725 (100.0%) | 0 (0.0%) |
| 6 to 18 Years | 1,095 (93.8%) | 72 (6.2%) |
| 19 to 25 Years | 273 (87.8%) | 38 (12.2%) |
| 26 to 34 Years | 1,031 (92.8%) | 80 (7.2%) |
| 35 to 44 Years | 631 (96.2%) | 25 (3.8%) |
| 45 to 54 Years | 562 (96.7%) | 19 (3.3%) |
| 55 to 64 Years | 867 (96.4%) | 32 (3.6%) |
| 65 to 74 Years | 439 (95.2%) | 22 (4.8%) |
| 75 Years and older | 101 (100.0%) | 0 (0.0%) |
| Total | 5,724 (95.2%) | 288 (4.8%) |
Health Insurance Coverage by Citizenship Status in Pevely
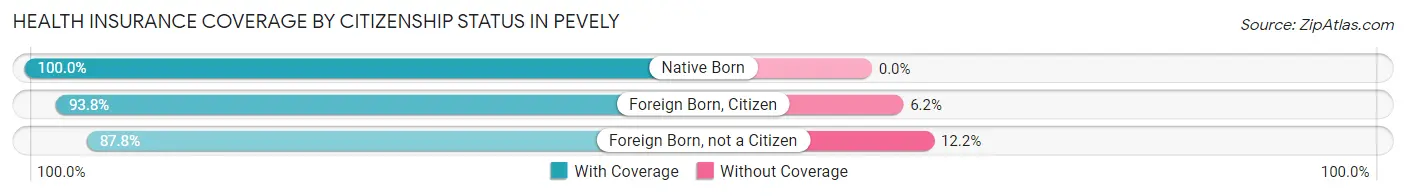
| Citizenship Status | With Coverage | Without Coverage |
| Native Born | 725 (100.0%) | 0 (0.0%) |
| Foreign Born, Citizen | 1,095 (93.8%) | 72 (6.2%) |
| Foreign Born, not a Citizen | 273 (87.8%) | 38 (12.2%) |
Health Insurance Coverage by Household Income in Pevely
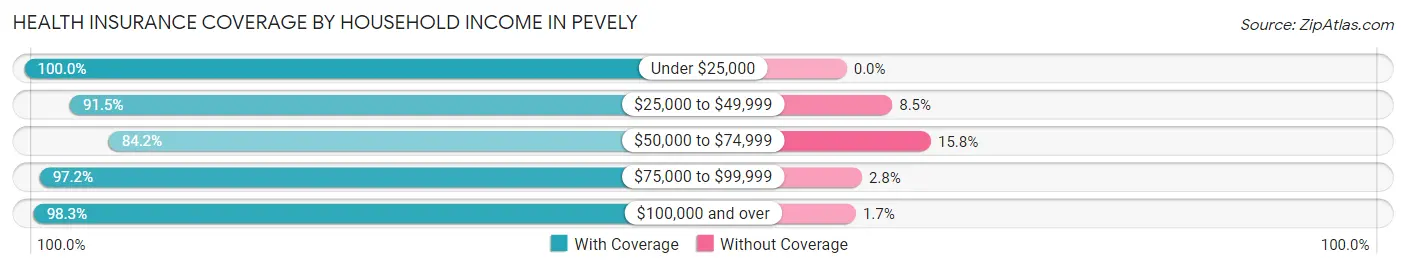
| Household Income | With Coverage | Without Coverage |
| Under $25,000 | 563 (100.0%) | 0 (0.0%) |
| $25,000 to $49,999 | 1,160 (91.5%) | 108 (8.5%) |
| $50,000 to $74,999 | 560 (84.2%) | 105 (15.8%) |
| $75,000 to $99,999 | 1,266 (97.2%) | 37 (2.8%) |
| $100,000 and over | 2,168 (98.3%) | 38 (1.7%) |
Public vs Private Health Insurance Coverage by Age in Pevely
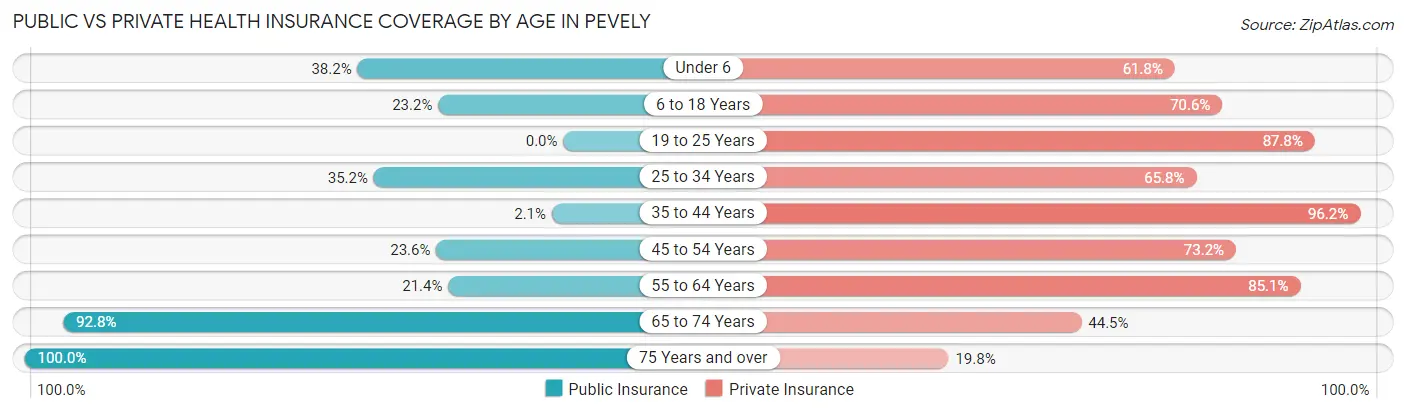
| Age Bracket | Public Insurance | Private Insurance |
| Under 6 | 277 (38.2%) | 448 (61.8%) |
| 6 to 18 Years | 271 (23.2%) | 824 (70.6%) |
| 19 to 25 Years | 0 (0.0%) | 273 (87.8%) |
| 25 to 34 Years | 391 (35.2%) | 731 (65.8%) |
| 35 to 44 Years | 14 (2.1%) | 631 (96.2%) |
| 45 to 54 Years | 137 (23.6%) | 425 (73.2%) |
| 55 to 64 Years | 192 (21.4%) | 765 (85.1%) |
| 65 to 74 Years | 428 (92.8%) | 205 (44.5%) |
| 75 Years and over | 101 (100.0%) | 20 (19.8%) |
| Total | 1,811 (30.1%) | 4,322 (71.9%) |
Disability Status by Sex by Age in Pevely
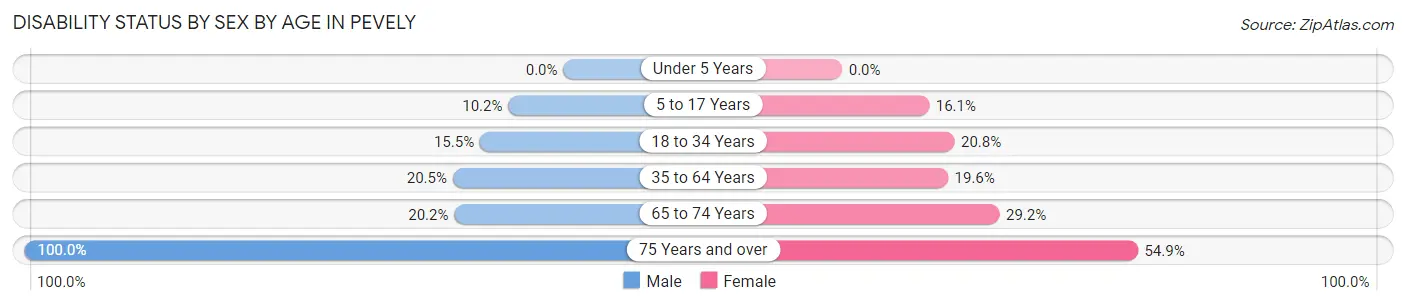
| Age Bracket | Male | Female |
| Under 5 Years | 0 (0.0%) | 0 (0.0%) |
| 5 to 17 Years | 79 (10.2%) | 72 (16.1%) |
| 18 to 34 Years | 93 (15.5%) | 181 (20.8%) |
| 35 to 64 Years | 243 (20.5%) | 187 (19.6%) |
| 65 to 74 Years | 51 (20.2%) | 61 (29.2%) |
| 75 Years and over | 19 (100.0%) | 45 (54.9%) |
Disability Class by Sex by Age in Pevely
Disability Class: Hearing Difficulty
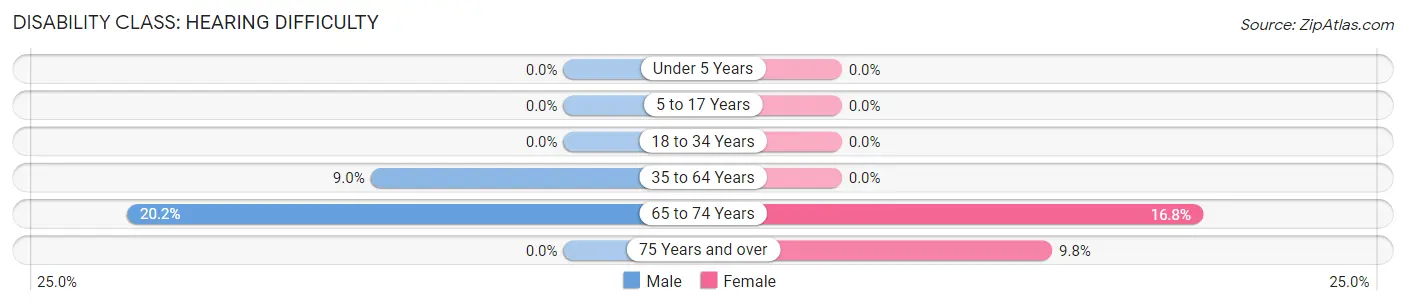
| Age Bracket | Male | Female |
| Under 5 Years | 0 (0.0%) | 0 (0.0%) |
| 5 to 17 Years | 0 (0.0%) | 0 (0.0%) |
| 18 to 34 Years | 0 (0.0%) | 0 (0.0%) |
| 35 to 64 Years | 106 (8.9%) | 0 (0.0%) |
| 65 to 74 Years | 51 (20.2%) | 35 (16.8%) |
| 75 Years and over | 0 (0.0%) | 8 (9.8%) |
Disability Class: Vision Difficulty
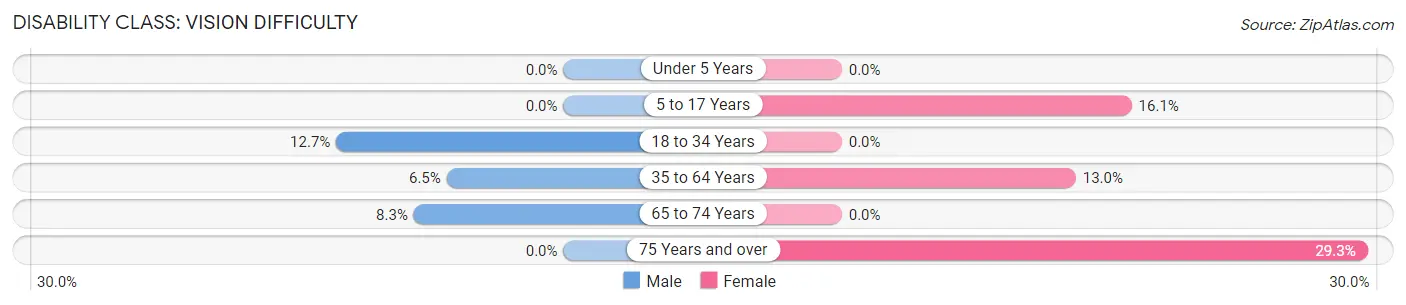
| Age Bracket | Male | Female |
| Under 5 Years | 0 (0.0%) | 0 (0.0%) |
| 5 to 17 Years | 0 (0.0%) | 72 (16.1%) |
| 18 to 34 Years | 76 (12.7%) | 0 (0.0%) |
| 35 to 64 Years | 77 (6.5%) | 124 (13.0%) |
| 65 to 74 Years | 21 (8.3%) | 0 (0.0%) |
| 75 Years and over | 0 (0.0%) | 24 (29.3%) |
Disability Class: Cognitive Difficulty
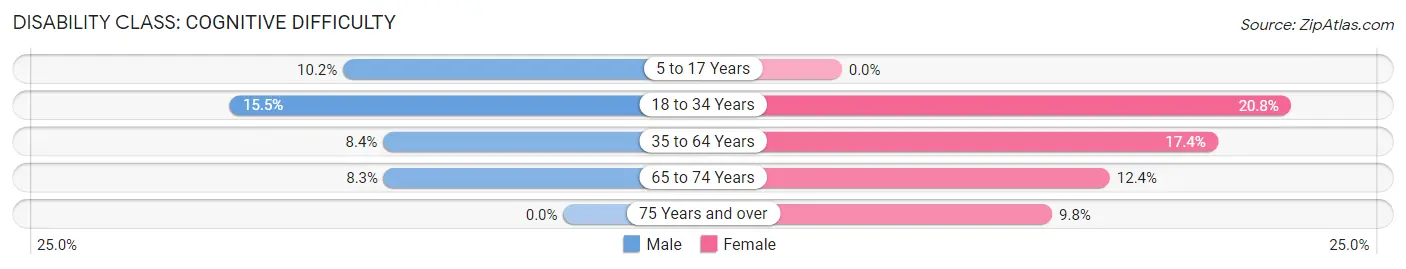
| Age Bracket | Male | Female |
| 5 to 17 Years | 79 (10.2%) | 0 (0.0%) |
| 18 to 34 Years | 93 (15.5%) | 181 (20.8%) |
| 35 to 64 Years | 99 (8.4%) | 166 (17.4%) |
| 65 to 74 Years | 21 (8.3%) | 26 (12.4%) |
| 75 Years and over | 0 (0.0%) | 8 (9.8%) |
Disability Class: Ambulatory Difficulty
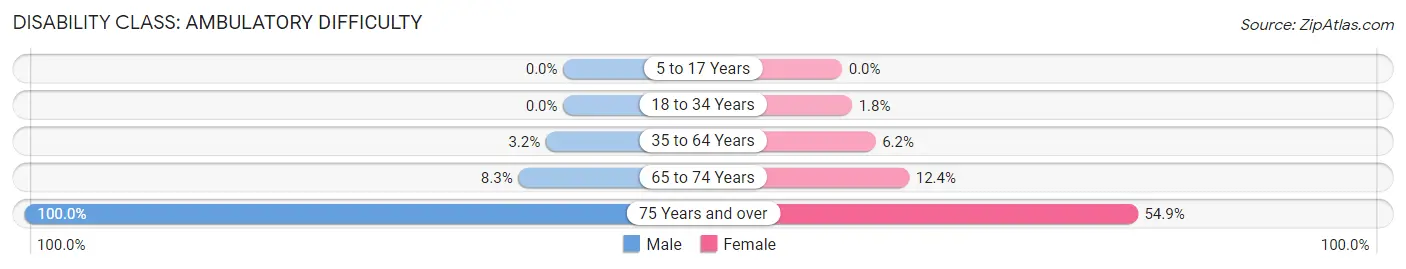
| Age Bracket | Male | Female |
| 5 to 17 Years | 0 (0.0%) | 0 (0.0%) |
| 18 to 34 Years | 0 (0.0%) | 16 (1.8%) |
| 35 to 64 Years | 38 (3.2%) | 59 (6.2%) |
| 65 to 74 Years | 21 (8.3%) | 26 (12.4%) |
| 75 Years and over | 19 (100.0%) | 45 (54.9%) |
Disability Class: Self-Care Difficulty
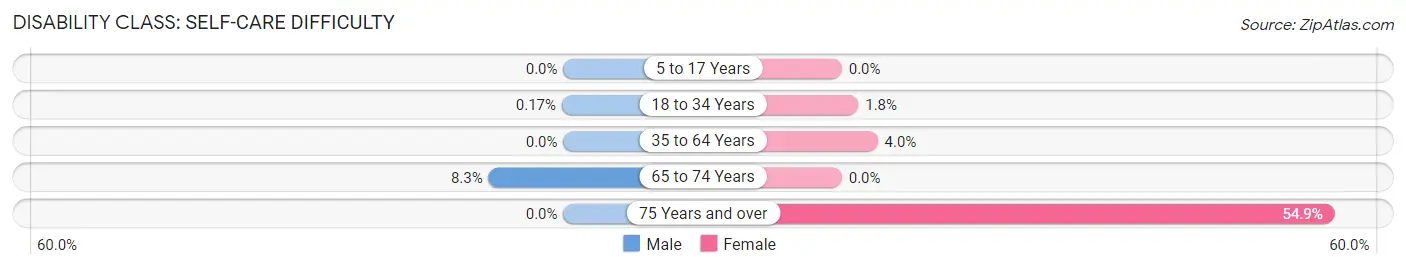
| Age Bracket | Male | Female |
| 5 to 17 Years | 0 (0.0%) | 0 (0.0%) |
| 18 to 34 Years | 1 (0.2%) | 16 (1.8%) |
| 35 to 64 Years | 0 (0.0%) | 38 (4.0%) |
| 65 to 74 Years | 21 (8.3%) | 0 (0.0%) |
| 75 Years and over | 0 (0.0%) | 45 (54.9%) |
Technology Access in Pevely
Computing Device Access in Pevely
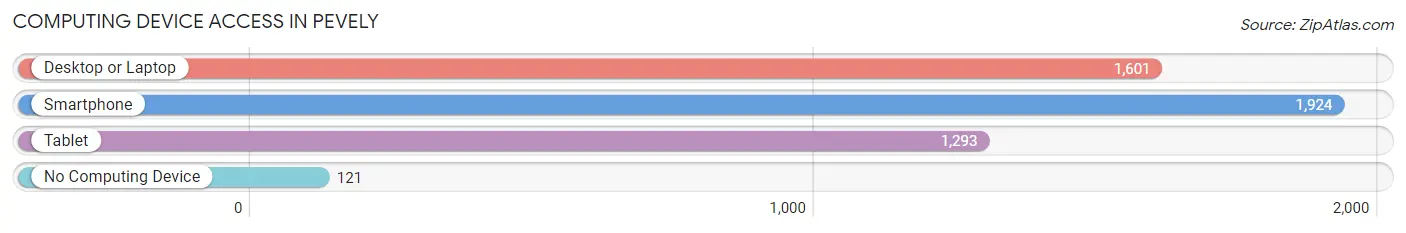
| Device Type | # Households | % Households |
| Desktop or Laptop | 1,601 | 73.1% |
| Smartphone | 1,924 | 87.8% |
| Tablet | 1,293 | 59.0% |
| No Computing Device | 121 | 5.5% |
| Total | 2,190 | 100.0% |
Internet Access in Pevely
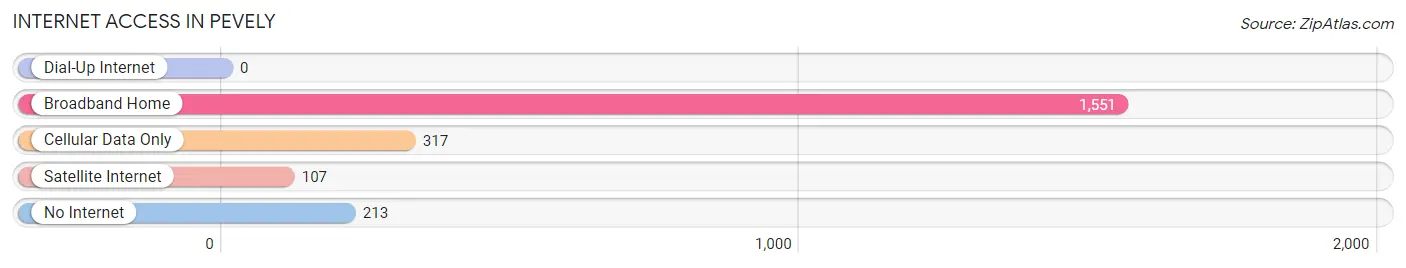
| Internet Type | # Households | % Households |
| Dial-Up Internet | 0 | 0.0% |
| Broadband Home | 1,551 | 70.8% |
| Cellular Data Only | 317 | 14.5% |
| Satellite Internet | 107 | 4.9% |
| No Internet | 213 | 9.7% |
| Total | 2,190 | 100.0% |
Pevely Summary
Pevley, Missouri is a small city located in Jefferson County, Missouri. It is situated on the banks of the Mississippi River, approximately 25 miles south of St. Louis. The city has a population of approximately 2,500 people and is part of the St. Louis Metropolitan Statistical Area.
History
The area that is now Pevely was first settled in the early 1800s by German immigrants. The city was originally known as “Pfeiffer’s Landing”, named after the first settler, John Pfeiffer. In 1845, the name was changed to Pevely, after the first postmaster, John Pevely.
The city was incorporated in 1876 and was a major port for the shipment of coal and other goods. The city was also home to several brickyards and other industries. In the late 1800s, the city was a major stop on the St. Louis and Iron Mountain Railroad.
Geography
Pevely is located in Jefferson County, Missouri, on the banks of the Mississippi River. The city is situated at an elevation of approximately 500 feet above sea level. The city has a total area of 1.3 square miles, all of which is land.
The climate in Pevely is classified as humid subtropical, with hot, humid summers and cold, wet winters. The average annual temperature is around 57 degrees Fahrenheit, with an average high of around 79 degrees in the summer and an average low of around 35 degrees in the winter.
Economy
The economy of Pevely is largely based on agriculture and manufacturing. The city is home to several large farms, as well as several manufacturing plants. The city is also home to several small businesses, including restaurants, retail stores, and service providers.
The city is also home to several large employers, including the Pevely Dairy, the Pevely Brick Company, and the Pevely Steel Company. The city is also home to several small businesses, including restaurants, retail stores, and service providers.
Demographics
As of the 2010 census, the population of Pevely was 2,500. The racial makeup of the city was 97.2% White, 0.8% African American, 0.4% Native American, 0.4% Asian, and 1.2% from other races. The median household income was $41,250, and the median family income was $50,000.
The city is home to several churches, including the First Baptist Church, the First United Methodist Church, and the St. John’s Lutheran Church. The city is also home to several schools, including the Pevely Elementary School, the Pevely Middle School, and the Pevely High School.
Conclusion
Pevely, Missouri is a small city located in Jefferson County, Missouri. It is situated on the banks of the Mississippi River, approximately 25 miles south of St. Louis. The city has a population of approximately 2,500 people and is part of the St. Louis Metropolitan Statistical Area. The economy of Pevely is largely based on agriculture and manufacturing, and the city is home to several large employers. The racial makeup of the city is 97.2% White, 0.8% African American, 0.4% Native American, 0.4% Asian, and 1.2% from other races. The city is home to several churches, schools, and small businesses.
Common Questions
What is Per Capita Income in Pevely?
Per Capita income in Pevely is $31,941.
What is the Median Family Income in Pevely?
Median Family Income in Pevely is $78,780.
What is the Median Household income in Pevely?
Median Household Income in Pevely is $68,141.
What is Income or Wage Gap in Pevely?
Income or Wage Gap in Pevely is 34.6%.
Women in Pevely earn 65.4 cents for every dollar earned by a man.
What is Inequality or Gini Index in Pevely?
Inequality or Gini Index in Pevely is 0.45.
What is the Total Population of Pevely?
Total Population of Pevely is 6,012.
What is the Total Male Population of Pevely?
Total Male Population of Pevely is 3,195.
What is the Total Female Population of Pevely?
Total Female Population of Pevely is 2,817.
What is the Ratio of Males per 100 Females in Pevely?
There are 113.42 Males per 100 Females in Pevely.
What is the Ratio of Females per 100 Males in Pevely?
There are 88.17 Females per 100 Males in Pevely.
What is the Median Population Age in Pevely?
Median Population Age in Pevely is 34.2 Years.
What is the Average Family Size in Pevely
Average Family Size in Pevely is 3.5 People.
What is the Average Household Size in Pevely
Average Household Size in Pevely is 2.7 People.
How Large is the Labor Force in Pevely?
There are 2,960 People in the Labor Forcein in Pevely.
What is the Percentage of People in the Labor Force in Pevely?
68.5% of People are in the Labor Force in Pevely.
What is the Unemployment Rate in Pevely?
Unemployment Rate in Pevely is 4.7%.