Kilauea, HI Map & Demographics
Kilauea Map
Kilauea Overview
$37,756
PER CAPITA INCOME
$84,542
AVG FAMILY INCOME
$85,227
AVG HOUSEHOLD INCOME
17.8%
WAGE / INCOME GAP [ % ]
82.2¢/ $1
WAGE / INCOME GAP [ $ ]
0.49
INEQUALITY / GINI INDEX
3,386
TOTAL POPULATION
1,591
MALE POPULATION
1,795
FEMALE POPULATION
88.64
MALES / 100 FEMALES
112.82
FEMALES / 100 MALES
40.2
MEDIAN AGE
3.5
AVG FAMILY SIZE
3.4
AVG HOUSEHOLD SIZE
1,742
LABOR FORCE [ PEOPLE ]
65.3%
PERCENT IN LABOR FORCE
4.1%
UNEMPLOYMENT RATE
Kilauea Zip Codes
Kilauea Area Codes
Income in Kilauea
Income Overview in Kilauea
Per Capita Income in Kilauea is $37,756, while median incomes of families and households are $84,542 and $85,227 respectively.
| Characteristic | Number | Measure |
| Per Capita Income | 3,386 | $37,756 |
| Median Family Income | 739 | $84,542 |
| Mean Family Income | 739 | $115,382 |
| Median Household Income | 986 | $85,227 |
| Mean Household Income | 986 | $118,893 |
| Income Deficit | 739 | $0 |
| Wage / Income Gap (%) | 3,386 | 17.80% |
| Wage / Income Gap ($) | 3,386 | 82.20¢ per $1 |
| Gini / Inequality Index | 3,386 | 0.49 |
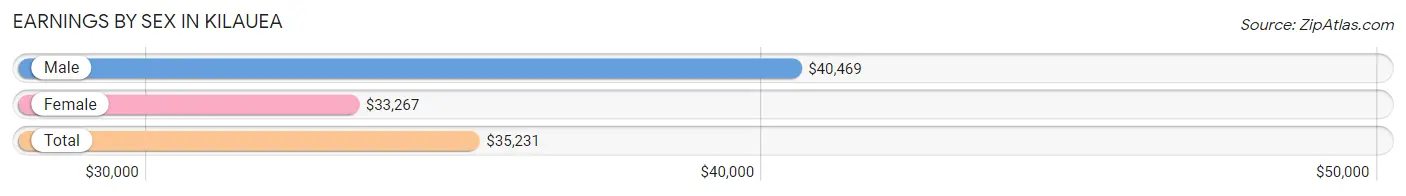
Earnings by Sex in Kilauea
Average Earnings in Kilauea are $35,231, $40,469 for men and $33,267 for women, a difference of 17.8%.
| Sex | Number | Average Earnings |
| Male | 931 (49.7%) | $40,469 |
| Female | 943 (50.3%) | $33,267 |
| Total | 1,874 (100.0%) | $35,231 |
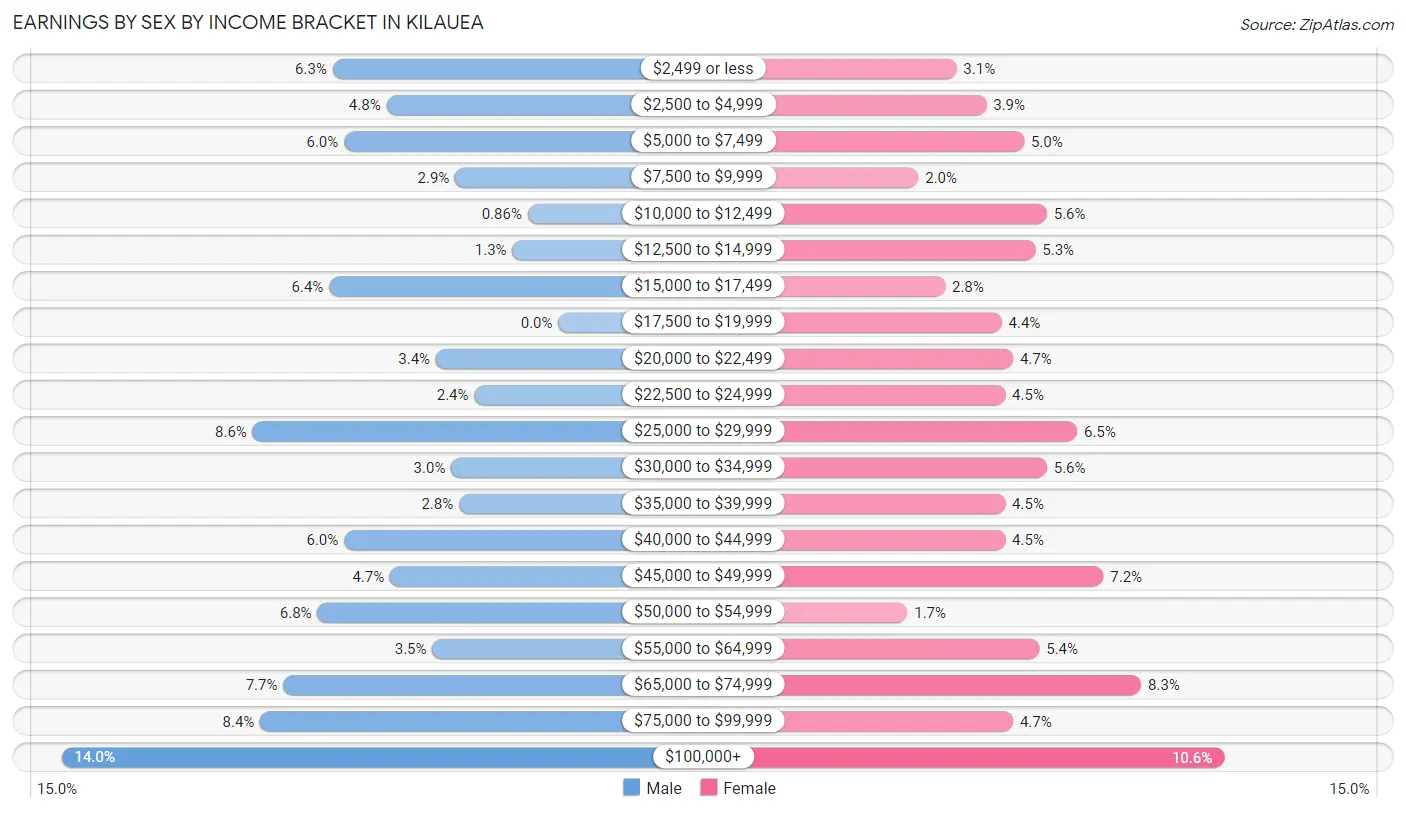
Earnings by Sex by Income Bracket in Kilauea
The most common earnings brackets in Kilauea are $100,000+ for men (130 | 14.0%) and $100,000+ for women (100 | 10.6%).
| Income | Male | Female |
| $2,499 or less | 59 (6.3%) | 29 (3.1%) |
| $2,500 to $4,999 | 45 (4.8%) | 37 (3.9%) |
| $5,000 to $7,499 | 56 (6.0%) | 47 (5.0%) |
| $7,500 to $9,999 | 27 (2.9%) | 19 (2.0%) |
| $10,000 to $12,499 | 8 (0.9%) | 53 (5.6%) |
| $12,500 to $14,999 | 12 (1.3%) | 50 (5.3%) |
| $15,000 to $17,499 | 60 (6.4%) | 26 (2.8%) |
| $17,500 to $19,999 | 0 (0.0%) | 41 (4.3%) |
| $20,000 to $22,499 | 32 (3.4%) | 44 (4.7%) |
| $22,500 to $24,999 | 22 (2.4%) | 42 (4.4%) |
| $25,000 to $29,999 | 80 (8.6%) | 61 (6.5%) |
| $30,000 to $34,999 | 28 (3.0%) | 53 (5.6%) |
| $35,000 to $39,999 | 26 (2.8%) | 42 (4.4%) |
| $40,000 to $44,999 | 56 (6.0%) | 42 (4.4%) |
| $45,000 to $49,999 | 44 (4.7%) | 68 (7.2%) |
| $50,000 to $54,999 | 63 (6.8%) | 16 (1.7%) |
| $55,000 to $64,999 | 33 (3.5%) | 51 (5.4%) |
| $65,000 to $74,999 | 72 (7.7%) | 78 (8.3%) |
| $75,000 to $99,999 | 78 (8.4%) | 44 (4.7%) |
| $100,000+ | 130 (14.0%) | 100 (10.6%) |
| Total | 931 (100.0%) | 943 (100.0%) |
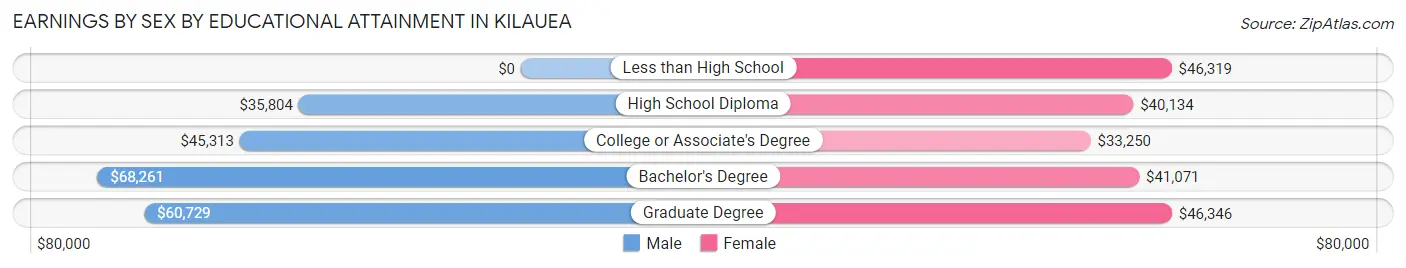
Earnings by Sex by Educational Attainment in Kilauea
Average earnings in Kilauea are $41,205 for men and $35,865 for women, a difference of 13.0%. Men with an educational attainment of bachelor's degree enjoy the highest average annual earnings of $68,261, while those with high school diploma education earn the least with $35,804. Women with an educational attainment of graduate degree earn the most with the average annual earnings of $46,346, while those with college or associate's degree education have the smallest earnings of $33,250.
| Educational Attainment | Male Income | Female Income |
| Less than High School | - | - |
| High School Diploma | $35,804 | $40,134 |
| College or Associate's Degree | $45,313 | $33,250 |
| Bachelor's Degree | $68,261 | $41,071 |
| Graduate Degree | $60,729 | $46,346 |
| Total | $41,205 | $35,865 |
Family Income in Kilauea
Family Income Brackets in Kilauea
According to the Kilauea family income data, there are 146 families falling into the $75,000 to $99,999 income range, which is the most common income bracket and makes up 19.8% of all families.
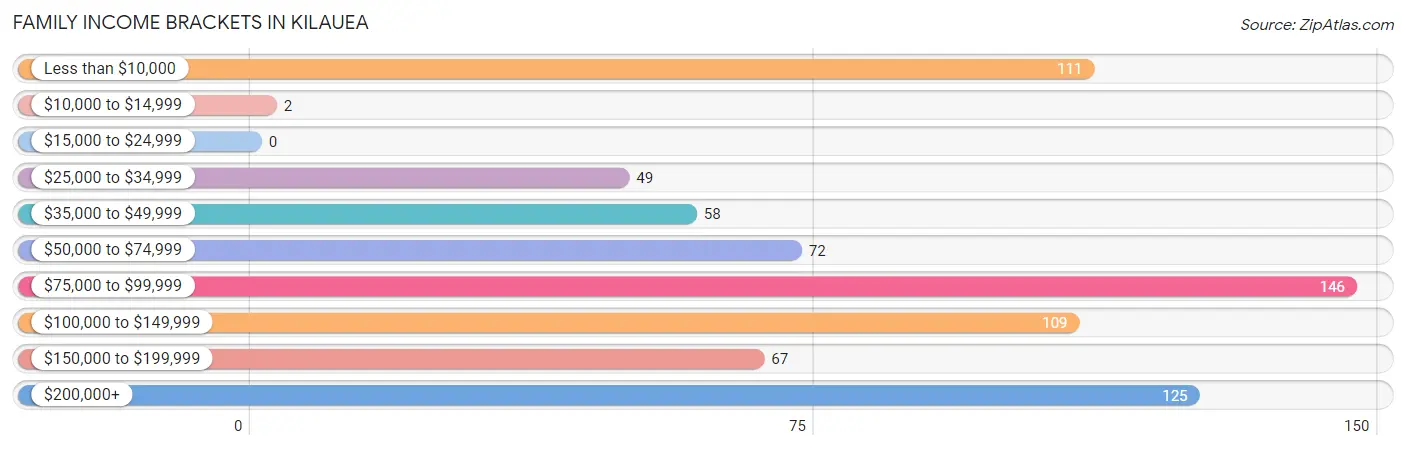
| Income Bracket | # Families | % Families |
| Less than $10,000 | 111 | 15.0% |
| $10,000 to $14,999 | 2 | 0.3% |
| $15,000 to $24,999 | 0 | 0.0% |
| $25,000 to $34,999 | 49 | 6.6% |
| $35,000 to $49,999 | 58 | 7.8% |
| $50,000 to $74,999 | 72 | 9.7% |
| $75,000 to $99,999 | 146 | 19.8% |
| $100,000 to $149,999 | 109 | 14.7% |
| $150,000 to $199,999 | 67 | 9.1% |
| $200,000+ | 125 | 16.9% |
Family Income by Famaliy Size in Kilauea
5-person families (78 | 10.5%) account for the highest median family income in Kilauea with $152,344 per family, while 2-person families (364 | 49.3%) have the highest median income of $39,808 per family member.
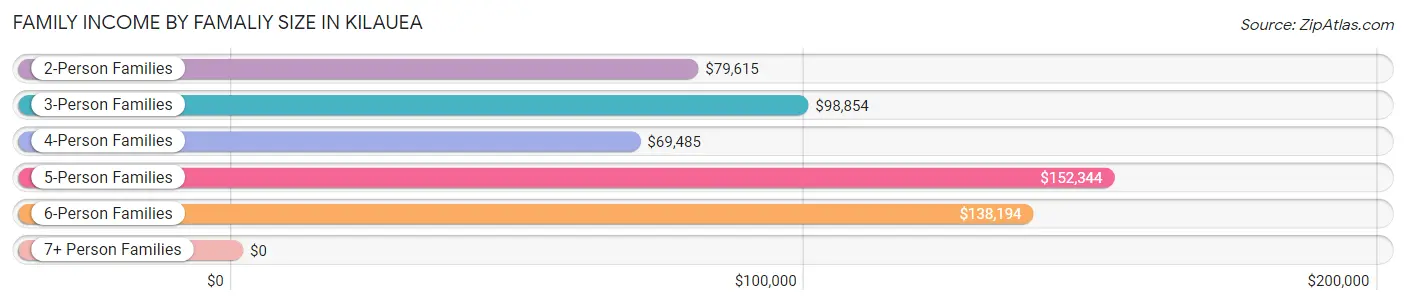
| Income Bracket | # Families | Median Income |
| 2-Person Families | 364 (49.3%) | $79,615 |
| 3-Person Families | 160 (21.6%) | $98,854 |
| 4-Person Families | 81 (11.0%) | $69,485 |
| 5-Person Families | 78 (10.5%) | $152,344 |
| 6-Person Families | 42 (5.7%) | $138,194 |
| 7+ Person Families | 14 (1.9%) | $0 |
| Total | 739 (100.0%) | $84,542 |
Family Income by Number of Earners in Kilauea
The median family income in Kilauea is $84,542, with families comprising 3+ earners (104) having the highest median family income of $138,194, while families with no earners (170) have the lowest median family income of $2,499, accounting for 14.1% and 23.0% of families, respectively.
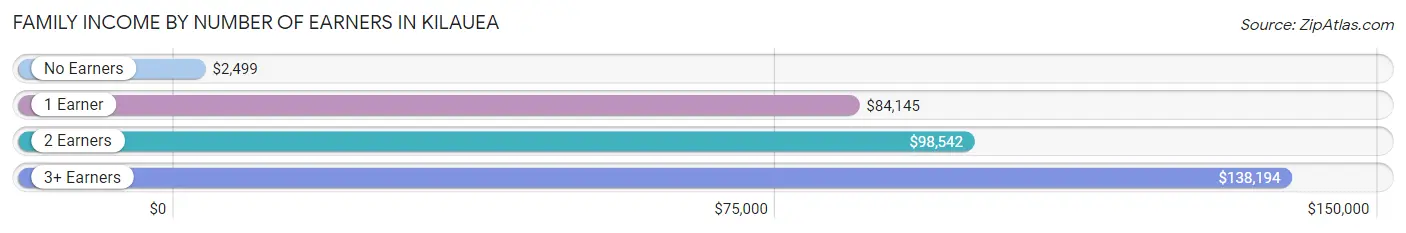
| Number of Earners | # Families | Median Income |
| No Earners | 170 (23.0%) | $2,499 |
| 1 Earner | 199 (26.9%) | $84,145 |
| 2 Earners | 266 (36.0%) | $98,542 |
| 3+ Earners | 104 (14.1%) | $138,194 |
| Total | 739 (100.0%) | $84,542 |
Household Income in Kilauea
Household Income Brackets in Kilauea
With 202 households falling in the category, the $75,000 to $99,999 income range is the most frequent in Kilauea, accounting for 20.5% of all households. In contrast, only 16 households (1.6%) fall into the $10,000 to $14,999 income bracket, making it the least populous group.
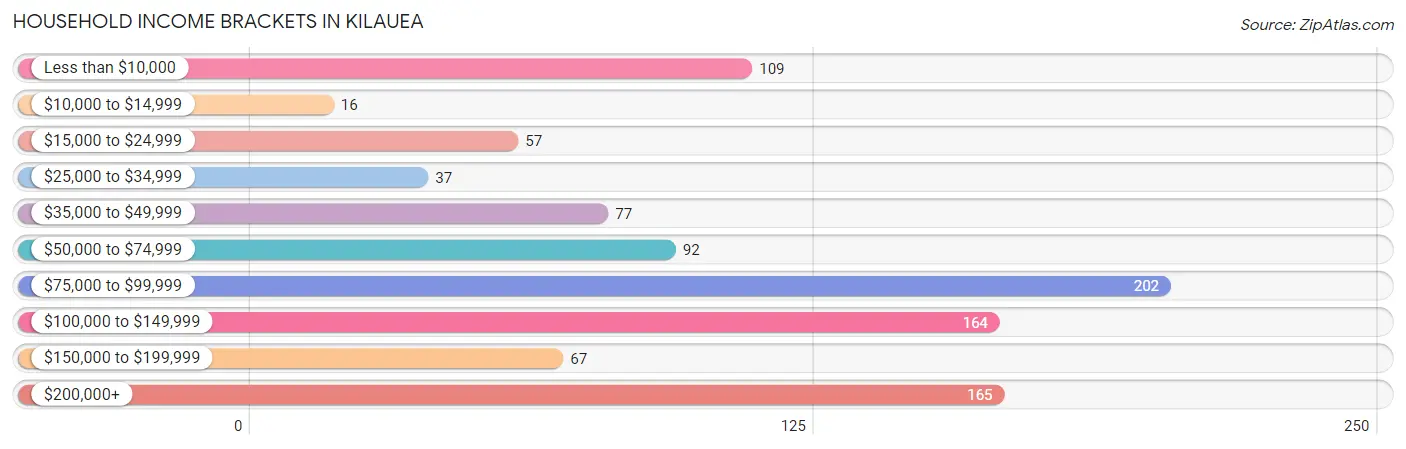
| Income Bracket | # Households | % Households |
| Less than $10,000 | 109 | 11.1% |
| $10,000 to $14,999 | 16 | 1.6% |
| $15,000 to $24,999 | 57 | 5.8% |
| $25,000 to $34,999 | 37 | 3.8% |
| $35,000 to $49,999 | 77 | 7.8% |
| $50,000 to $74,999 | 92 | 9.3% |
| $75,000 to $99,999 | 202 | 20.5% |
| $100,000 to $149,999 | 164 | 16.6% |
| $150,000 to $199,999 | 67 | 6.8% |
| $200,000+ | 165 | 16.7% |
Household Income by Householder Age in Kilauea
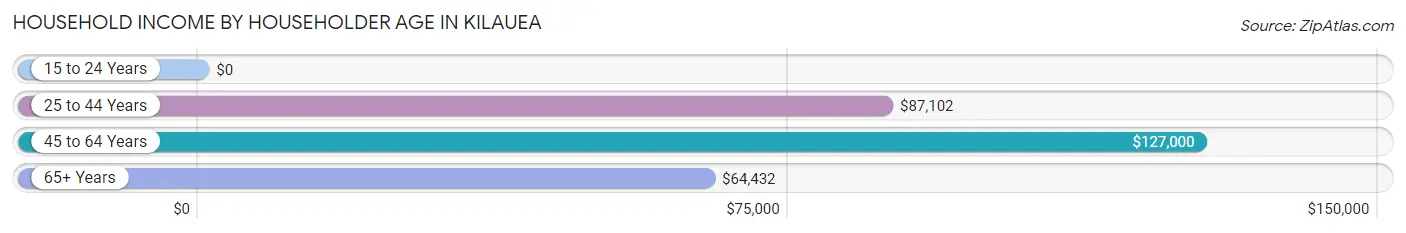
The median household income in Kilauea is $85,227, with the highest median household income of $127,000 found in the 45 to 64 years age bracket for the primary householder. A total of 332 households (33.7%) fall into this category. Meanwhile, the 15 to 24 years age bracket for the primary householder has the lowest median household income of $0, with 20 households (2.0%) in this group.
| Income Bracket | # Households | Median Income |
| 15 to 24 Years | 20 (2.0%) | $0 |
| 25 to 44 Years | 247 (25.1%) | $87,102 |
| 45 to 64 Years | 332 (33.7%) | $127,000 |
| 65+ Years | 387 (39.3%) | $64,432 |
| Total | 986 (100.0%) | $85,227 |
Poverty in Kilauea
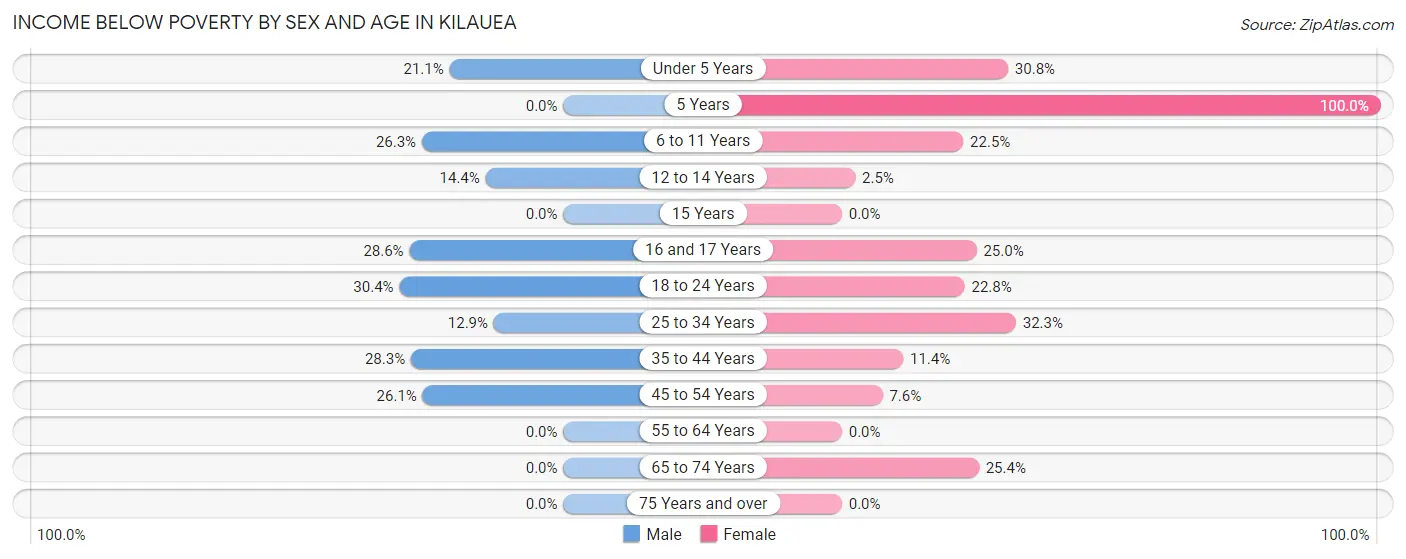
Income Below Poverty by Sex and Age in Kilauea
With 16.8% poverty level for males and 17.2% for females among the residents of Kilauea, 18 to 24 year old males and 5 year old females are the most vulnerable to poverty, with 35 males (30.4%) and 28 females (100.0%) in their respective age groups living below the poverty level.
| Age Bracket | Male | Female |
| Under 5 Years | 15 (21.1%) | 37 (30.8%) |
| 5 Years | 0 (0.0%) | 28 (100.0%) |
| 6 to 11 Years | 21 (26.3%) | 41 (22.5%) |
| 12 to 14 Years | 14 (14.4%) | 2 (2.5%) |
| 15 Years | 0 (0.0%) | 0 (0.0%) |
| 16 and 17 Years | 12 (28.6%) | 3 (25.0%) |
| 18 to 24 Years | 35 (30.4%) | 18 (22.8%) |
| 25 to 34 Years | 28 (12.9%) | 52 (32.3%) |
| 35 to 44 Years | 84 (28.3%) | 29 (11.4%) |
| 45 to 54 Years | 59 (26.1%) | 8 (7.5%) |
| 55 to 64 Years | 0 (0.0%) | 0 (0.0%) |
| 65 to 74 Years | 0 (0.0%) | 90 (25.4%) |
| 75 Years and over | 0 (0.0%) | 0 (0.0%) |
| Total | 268 (16.8%) | 308 (17.2%) |
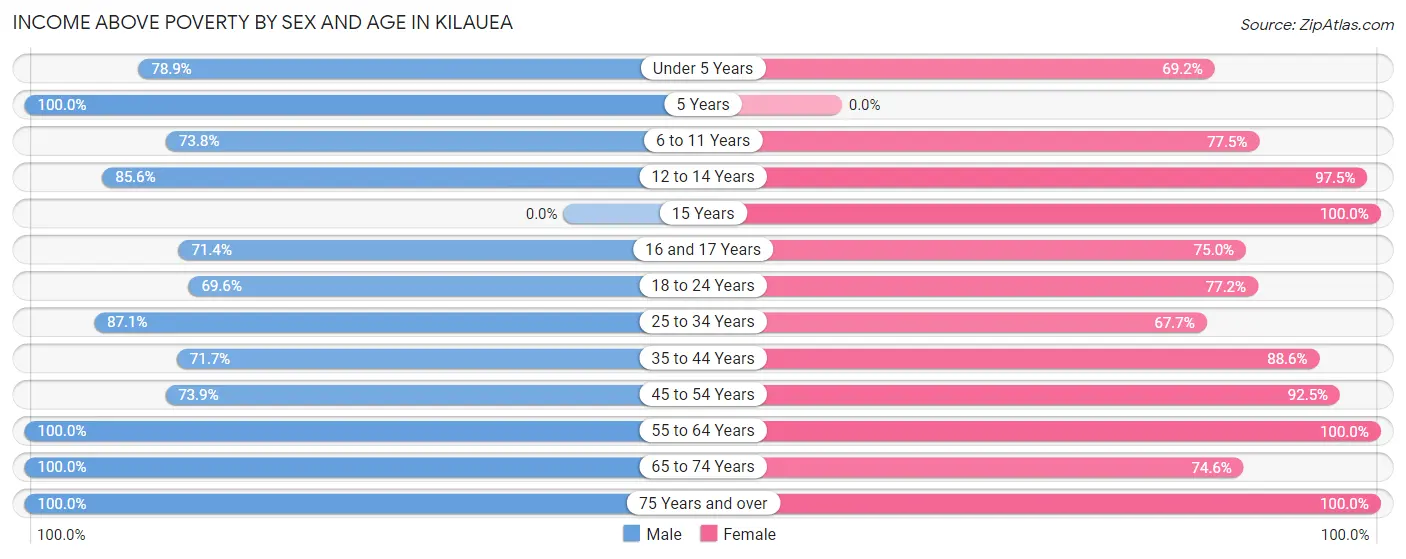
Income Above Poverty by Sex and Age in Kilauea
According to the poverty statistics in Kilauea, males aged 5 years and females aged 15 years are the age groups that are most secure financially, with 100.0% of males and 100.0% of females in these age groups living above the poverty line.
| Age Bracket | Male | Female |
| Under 5 Years | 56 (78.9%) | 83 (69.2%) |
| 5 Years | 10 (100.0%) | 0 (0.0%) |
| 6 to 11 Years | 59 (73.8%) | 141 (77.5%) |
| 12 to 14 Years | 83 (85.6%) | 79 (97.5%) |
| 15 Years | 0 (0.0%) | 49 (100.0%) |
| 16 and 17 Years | 30 (71.4%) | 9 (75.0%) |
| 18 to 24 Years | 80 (69.6%) | 61 (77.2%) |
| 25 to 34 Years | 189 (87.1%) | 109 (67.7%) |
| 35 to 44 Years | 213 (71.7%) | 226 (88.6%) |
| 45 to 54 Years | 167 (73.9%) | 98 (92.4%) |
| 55 to 64 Years | 148 (100.0%) | 272 (100.0%) |
| 65 to 74 Years | 265 (100.0%) | 264 (74.6%) |
| 75 Years and over | 23 (100.0%) | 96 (100.0%) |
| Total | 1,323 (83.2%) | 1,487 (82.8%) |
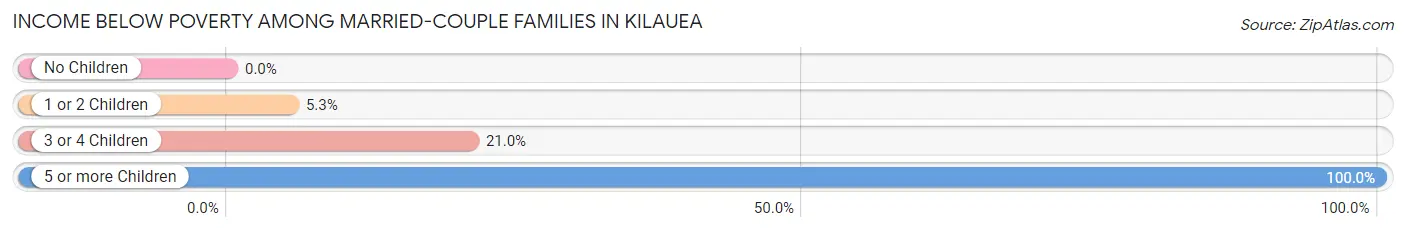
Income Below Poverty Among Married-Couple Families in Kilauea
The poverty statistics for married-couple families in Kilauea show that 7.4% or 34 of the total 459 families live below the poverty line. Families with 5 or more children have the highest poverty rate of 100.0%, comprising of 14 families. On the other hand, families with no children have the lowest poverty rate of 0.0%, which includes 0 families.
| Children | Above Poverty | Below Poverty |
| No Children | 251 (100.0%) | 0 (0.0%) |
| 1 or 2 Children | 125 (94.7%) | 7 (5.3%) |
| 3 or 4 Children | 49 (79.0%) | 13 (21.0%) |
| 5 or more Children | 0 (0.0%) | 14 (100.0%) |
| Total | 425 (92.6%) | 34 (7.4%) |
Income Below Poverty Among Single-Parent Households in Kilauea
According to the poverty data in Kilauea, 14.3% or 5 single-father households and 35.5% or 87 single-mother households are living below the poverty line. Among single-father households, those with 1 or 2 children have the highest poverty rate, with 5 households (35.7%) experiencing poverty. Likewise, among single-mother households, those with 5 or more children have the highest poverty rate, with 2 households (100.0%) falling below the poverty line.
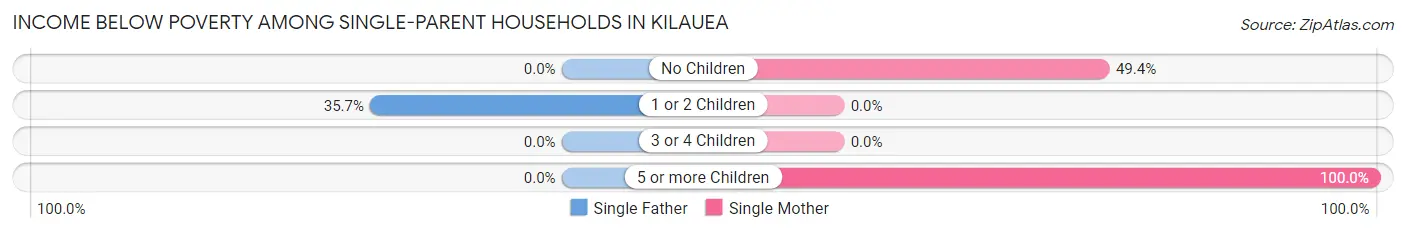
| Children | Single Father | Single Mother |
| No Children | 0 (0.0%) | 85 (49.4%) |
| 1 or 2 Children | 5 (35.7%) | 0 (0.0%) |
| 3 or 4 Children | 0 (0.0%) | 0 (0.0%) |
| 5 or more Children | 0 (0.0%) | 2 (100.0%) |
| Total | 5 (14.3%) | 87 (35.5%) |
Income Below Poverty Among Married-Couple vs Single-Parent Households in Kilauea
The poverty data for Kilauea shows that 34 of the married-couple family households (7.4%) and 92 of the single-parent households (32.9%) are living below the poverty level. Within the married-couple family households, those with 5 or more children have the highest poverty rate, with 14 households (100.0%) falling below the poverty line. Among the single-parent households, those with 5 or more children have the highest poverty rate, with 2 household (100.0%) living below poverty.
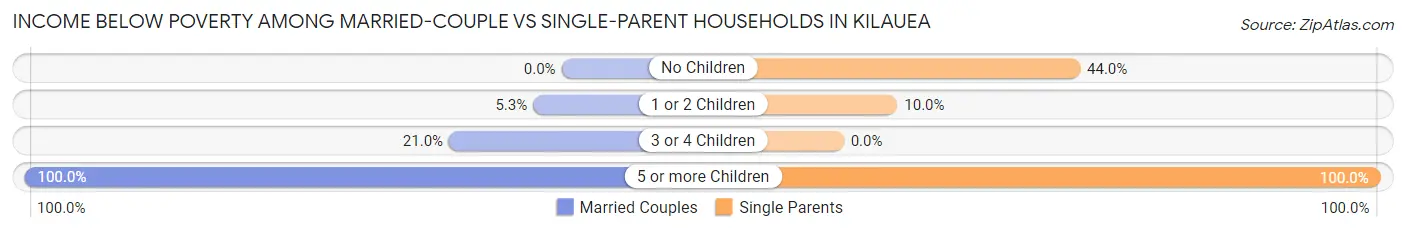
| Children | Married-Couple Families | Single-Parent Households |
| No Children | 0 (0.0%) | 85 (44.0%) |
| 1 or 2 Children | 7 (5.3%) | 5 (10.0%) |
| 3 or 4 Children | 13 (21.0%) | 0 (0.0%) |
| 5 or more Children | 14 (100.0%) | 2 (100.0%) |
| Total | 34 (7.4%) | 92 (32.9%) |
Race in Kilauea
The most populous races in Kilauea are White / Caucasian (2,010 | 59.4%), Asian (682 | 20.1%), and Two or more Races (621 | 18.3%).
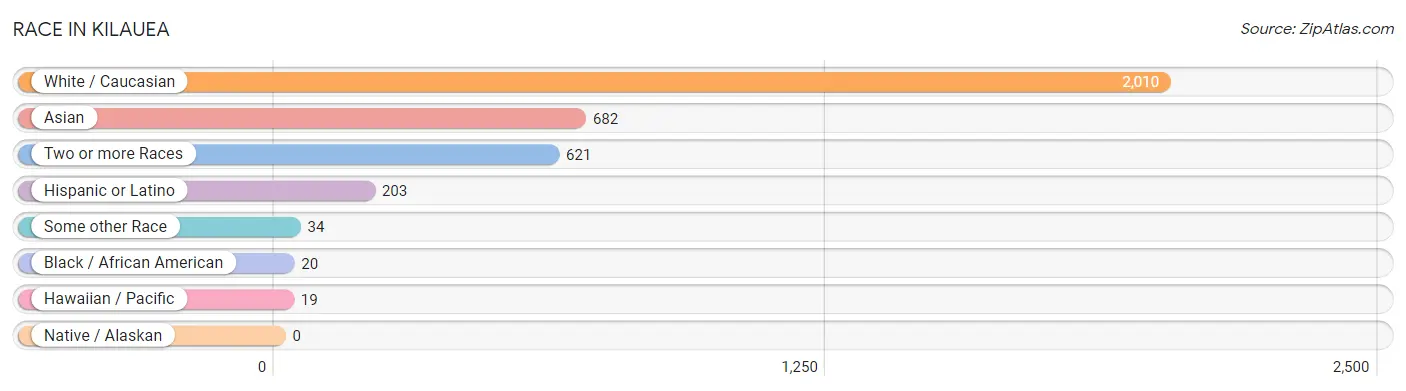
| Race | # Population | % Population |
| Asian | 682 | 20.1% |
| Black / African American | 20 | 0.6% |
| Hawaiian / Pacific | 19 | 0.6% |
| Hispanic or Latino | 203 | 6.0% |
| Native / Alaskan | 0 | 0.0% |
| White / Caucasian | 2,010 | 59.4% |
| Two or more Races | 621 | 18.3% |
| Some other Race | 34 | 1.0% |
| Total | 3,386 | 100.0% |
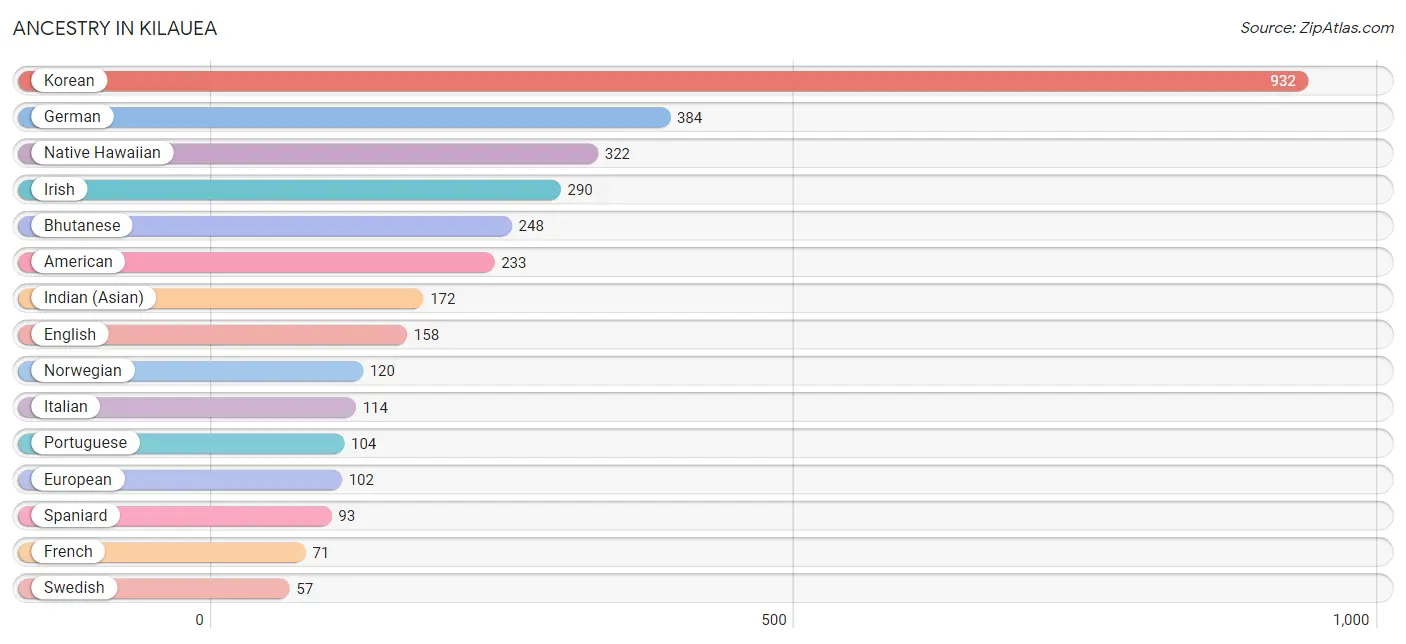
Ancestry in Kilauea
The most populous ancestries reported in Kilauea are Korean (932 | 27.5%), German (384 | 11.3%), Native Hawaiian (322 | 9.5%), Irish (290 | 8.6%), and Bhutanese (248 | 7.3%), together accounting for 64.3% of all Kilauea residents.
| Ancestry | # Population | % Population |
| African | 27 | 0.8% |
| American | 233 | 6.9% |
| Arab | 5 | 0.2% |
| Australian | 8 | 0.2% |
| Bhutanese | 248 | 7.3% |
| Brazilian | 12 | 0.4% |
| British | 5 | 0.2% |
| Central American | 17 | 0.5% |
| Colombian | 12 | 0.4% |
| Czech | 11 | 0.3% |
| Danish | 21 | 0.6% |
| Dutch | 14 | 0.4% |
| Eastern European | 15 | 0.4% |
| Ecuadorian | 7 | 0.2% |
| English | 158 | 4.7% |
| European | 102 | 3.0% |
| Finnish | 8 | 0.2% |
| French | 71 | 2.1% |
| German | 384 | 11.3% |
| Greek | 51 | 1.5% |
| Hungarian | 19 | 0.6% |
| Indian (Asian) | 172 | 5.1% |
| Irish | 290 | 8.6% |
| Israeli | 25 | 0.7% |
| Italian | 114 | 3.4% |
| Korean | 932 | 27.5% |
| Lebanese | 5 | 0.2% |
| Mexican | 51 | 1.5% |
| Native Hawaiian | 322 | 9.5% |
| Northern European | 15 | 0.4% |
| Norwegian | 120 | 3.5% |
| Polish | 9 | 0.3% |
| Portuguese | 104 | 3.1% |
| Romanian | 6 | 0.2% |
| Russian | 6 | 0.2% |
| Salvadoran | 17 | 0.5% |
| Scandinavian | 32 | 0.9% |
| Scotch-Irish | 26 | 0.8% |
| Scottish | 19 | 0.6% |
| South African | 9 | 0.3% |
| South American | 19 | 0.6% |
| Spaniard | 93 | 2.8% |
| Spanish | 23 | 0.7% |
| Subsaharan African | 36 | 1.1% |
| Swedish | 57 | 1.7% |
| Ukrainian | 3 | 0.1% |
| Welsh | 6 | 0.2% |
| Yugoslavian | 5 | 0.2% | View All 48 Rows |
Immigrants in Kilauea
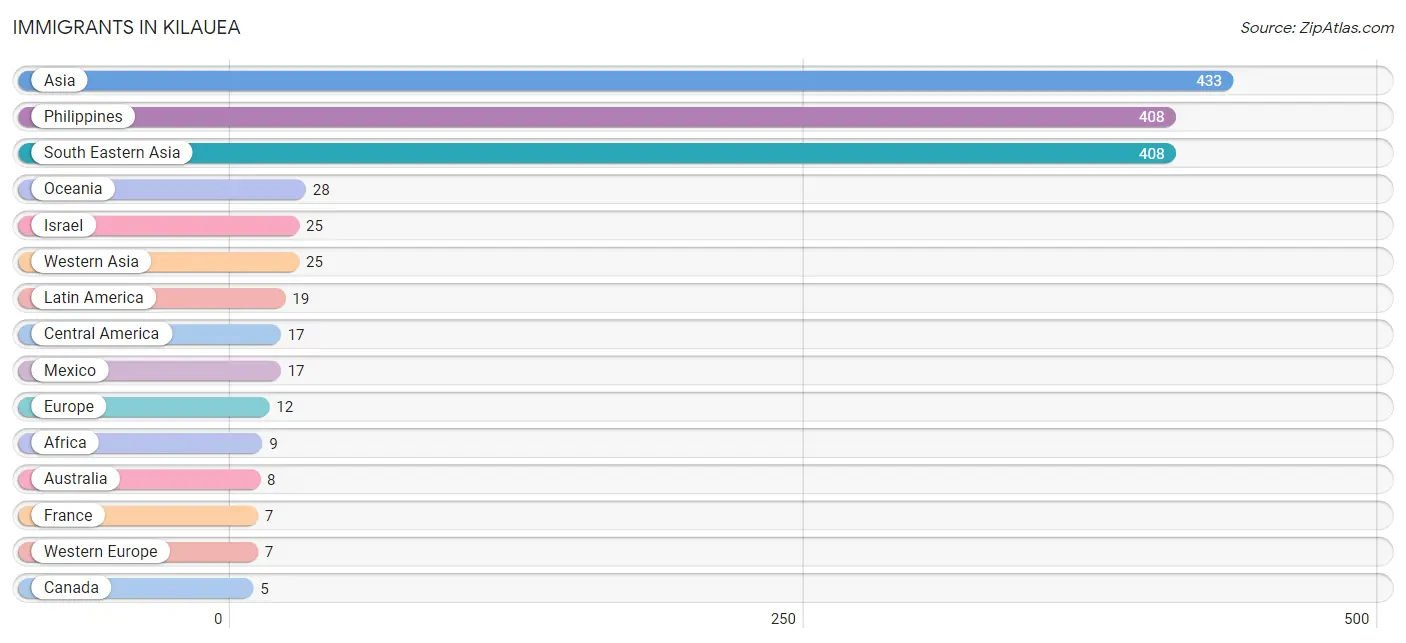
The most numerous immigrant groups reported in Kilauea came from Asia (433 | 12.8%), Philippines (408 | 12.0%), South Eastern Asia (408 | 12.0%), Oceania (28 | 0.8%), and Israel (25 | 0.7%), together accounting for 38.5% of all Kilauea residents.
| Immigration Origin | # Population | % Population |
| Africa | 9 | 0.3% |
| Asia | 433 | 12.8% |
| Australia | 8 | 0.2% |
| Brazil | 2 | 0.1% |
| Canada | 5 | 0.2% |
| Central America | 17 | 0.5% |
| Europe | 12 | 0.4% |
| France | 7 | 0.2% |
| Israel | 25 | 0.7% |
| Latin America | 19 | 0.6% |
| Mexico | 17 | 0.5% |
| Northern Europe | 5 | 0.2% |
| Oceania | 28 | 0.8% |
| Philippines | 408 | 12.0% |
| South America | 2 | 0.1% |
| South Eastern Asia | 408 | 12.0% |
| Western Asia | 25 | 0.7% |
| Western Europe | 7 | 0.2% | View All 18 Rows |
Sex and Age in Kilauea
Sex and Age in Kilauea
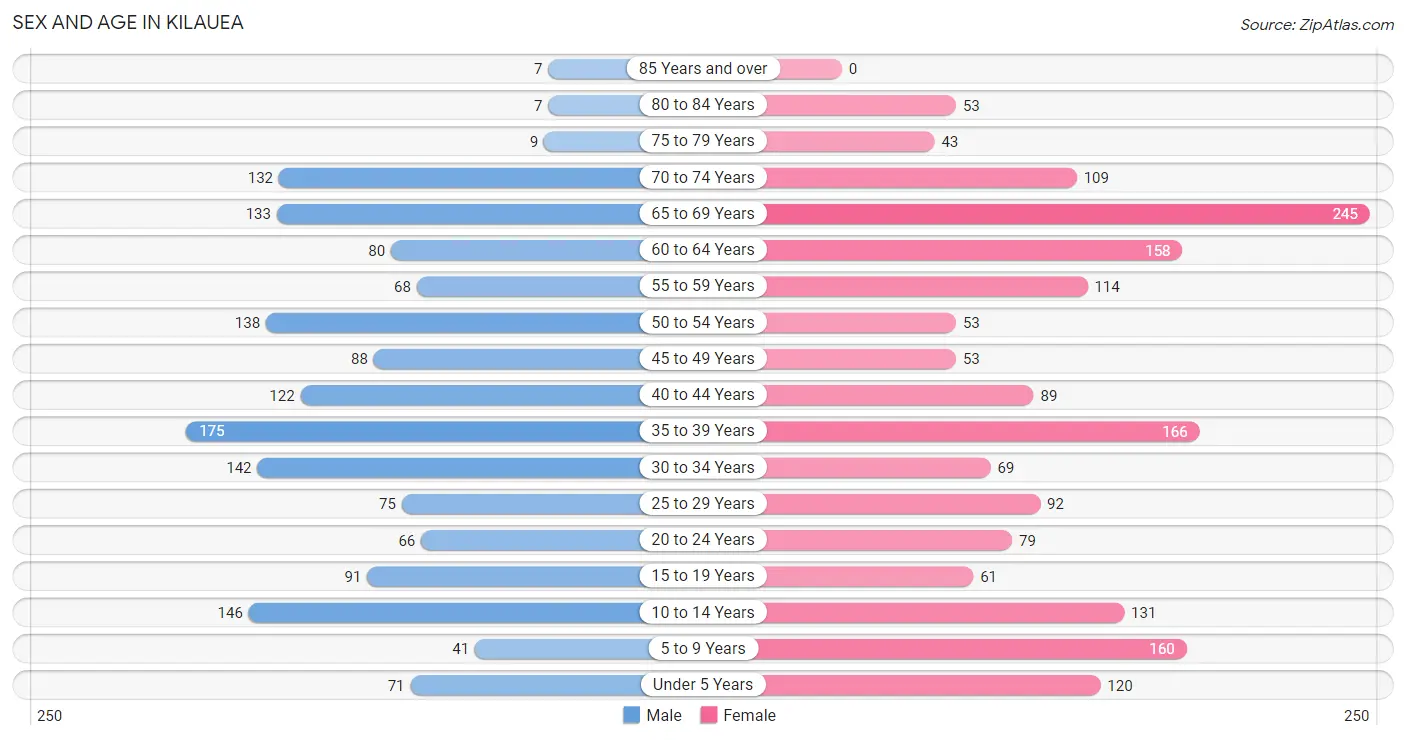
The most populous age groups in Kilauea are 35 to 39 Years (175 | 11.0%) for men and 65 to 69 Years (245 | 13.7%) for women.
| Age Bracket | Male | Female |
| Under 5 Years | 71 (4.5%) | 120 (6.7%) |
| 5 to 9 Years | 41 (2.6%) | 160 (8.9%) |
| 10 to 14 Years | 146 (9.2%) | 131 (7.3%) |
| 15 to 19 Years | 91 (5.7%) | 61 (3.4%) |
| 20 to 24 Years | 66 (4.2%) | 79 (4.4%) |
| 25 to 29 Years | 75 (4.7%) | 92 (5.1%) |
| 30 to 34 Years | 142 (8.9%) | 69 (3.8%) |
| 35 to 39 Years | 175 (11.0%) | 166 (9.2%) |
| 40 to 44 Years | 122 (7.7%) | 89 (5.0%) |
| 45 to 49 Years | 88 (5.5%) | 53 (2.9%) |
| 50 to 54 Years | 138 (8.7%) | 53 (2.9%) |
| 55 to 59 Years | 68 (4.3%) | 114 (6.4%) |
| 60 to 64 Years | 80 (5.0%) | 158 (8.8%) |
| 65 to 69 Years | 133 (8.4%) | 245 (13.7%) |
| 70 to 74 Years | 132 (8.3%) | 109 (6.1%) |
| 75 to 79 Years | 9 (0.6%) | 43 (2.4%) |
| 80 to 84 Years | 7 (0.4%) | 53 (2.9%) |
| 85 Years and over | 7 (0.4%) | 0 (0.0%) |
| Total | 1,591 (100.0%) | 1,795 (100.0%) |
Families and Households in Kilauea
Median Family Size in Kilauea
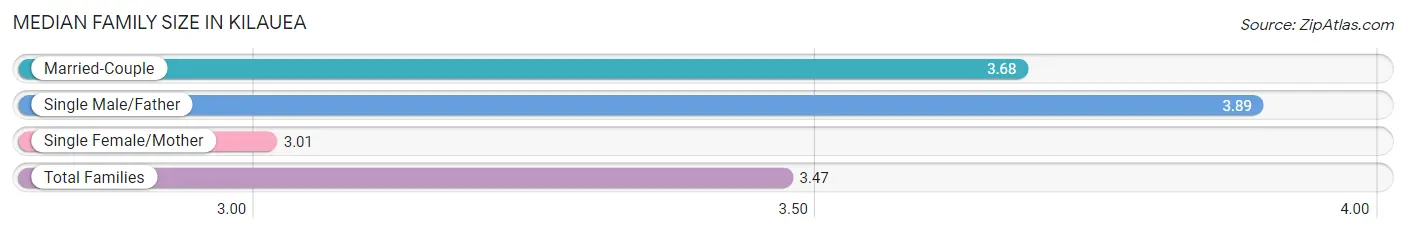
The median family size in Kilauea is 3.47 persons per family, with single male/father families (35 | 4.7%) accounting for the largest median family size of 3.89 persons per family. On the other hand, single female/mother families (245 | 33.2%) represent the smallest median family size with 3.01 persons per family.
| Family Type | # Families | Family Size |
| Married-Couple | 459 (62.1%) | 3.68 |
| Single Male/Father | 35 (4.7%) | 3.89 |
| Single Female/Mother | 245 (33.2%) | 3.01 |
| Total Families | 739 (100.0%) | 3.47 |
Median Household Size in Kilauea
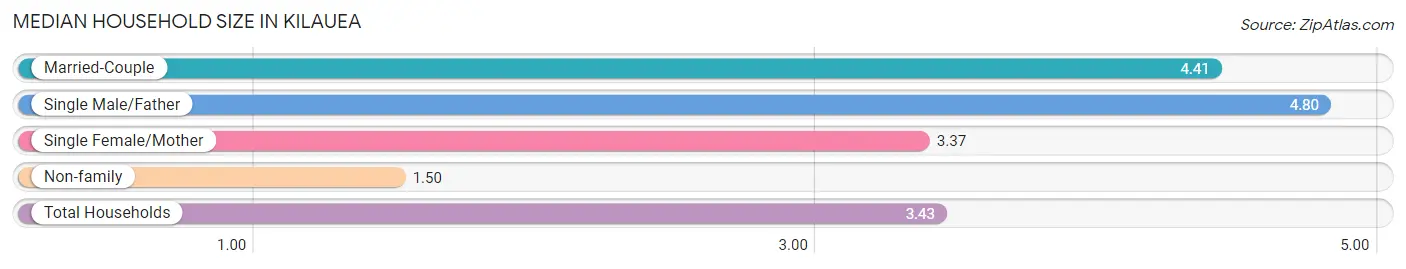
The median household size in Kilauea is 3.43 persons per household, with single male/father households (35 | 3.5%) accounting for the largest median household size of 4.8 persons per household. non-family households (247 | 25.1%) represent the smallest median household size with 1.50 persons per household.
| Household Type | # Households | Household Size |
| Married-Couple | 459 (46.6%) | 4.41 |
| Single Male/Father | 35 (3.5%) | 4.80 |
| Single Female/Mother | 245 (24.8%) | 3.37 |
| Non-family | 247 (25.1%) | 1.50 |
| Total Households | 986 (100.0%) | 3.43 |
Household Size by Marriage Status in Kilauea
Out of a total of 986 households in Kilauea, 739 (75.0%) are family households, while 247 (25.1%) are nonfamily households. The most numerous type of family households are 2-person households, comprising 321, and the most common type of nonfamily households are 1-person households, comprising 154.
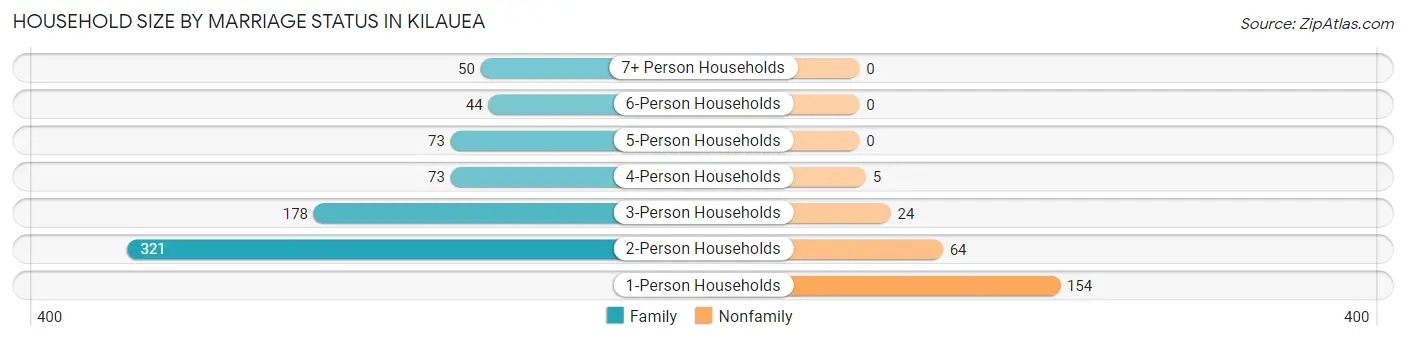
| Household Size | Family Households | Nonfamily Households |
| 1-Person Households | - | 154 (15.6%) |
| 2-Person Households | 321 (32.6%) | 64 (6.5%) |
| 3-Person Households | 178 (18.0%) | 24 (2.4%) |
| 4-Person Households | 73 (7.4%) | 5 (0.5%) |
| 5-Person Households | 73 (7.4%) | 0 (0.0%) |
| 6-Person Households | 44 (4.5%) | 0 (0.0%) |
| 7+ Person Households | 50 (5.1%) | 0 (0.0%) |
| Total | 739 (75.0%) | 247 (25.1%) |
Female Fertility in Kilauea
Fertility by Age in Kilauea
Average fertility rate in Kilauea is 91.0 births per 1,000 women. Women in the age bracket of 20 to 34 years have the highest fertility rate with 108.0 births per 1,000 women. Women in the age bracket of 35 to 50 years acount for 54.4% of all women with births.
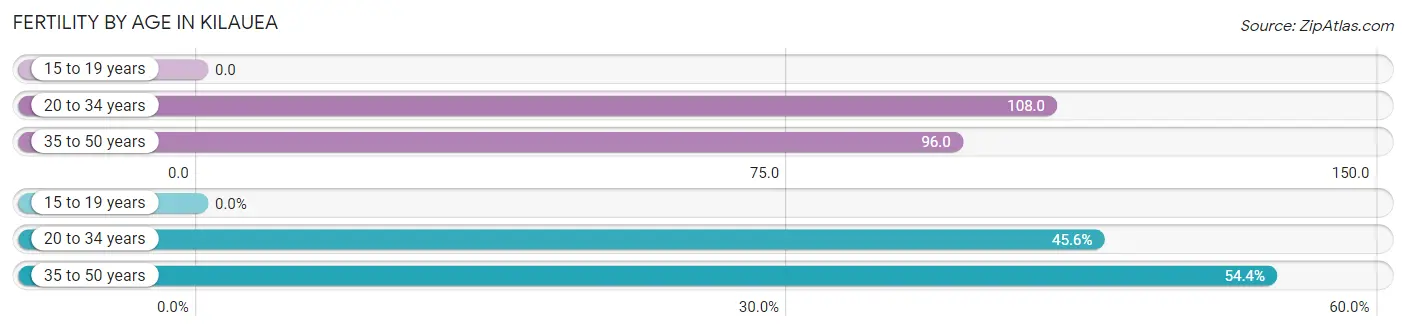
| Age Bracket | Women with Births | Births / 1,000 Women |
| 15 to 19 years | 0 (0.0%) | 0.0 |
| 20 to 34 years | 26 (45.6%) | 108.0 |
| 35 to 50 years | 31 (54.4%) | 96.0 |
| Total | 57 (100.0%) | 91.0 |
Fertility by Age by Marriage Status in Kilauea
71.9% of women with births (57) in Kilauea are married. The highest percentage of unmarried women with births falls into 20 to 34 years age bracket with 61.5% of them unmarried at the time of birth, while the lowest percentage of unmarried women with births belong to 35 to 50 years age bracket with 0.0% of them unmarried.
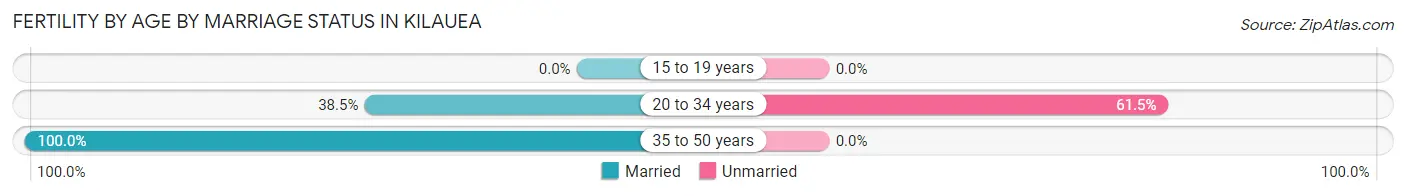
| Age Bracket | Married | Unmarried |
| 15 to 19 years | 0 (0.0%) | 0 (0.0%) |
| 20 to 34 years | 10 (38.5%) | 16 (61.5%) |
| 35 to 50 years | 31 (100.0%) | 0 (0.0%) |
| Total | 41 (71.9%) | 16 (28.1%) |
Fertility by Education in Kilauea
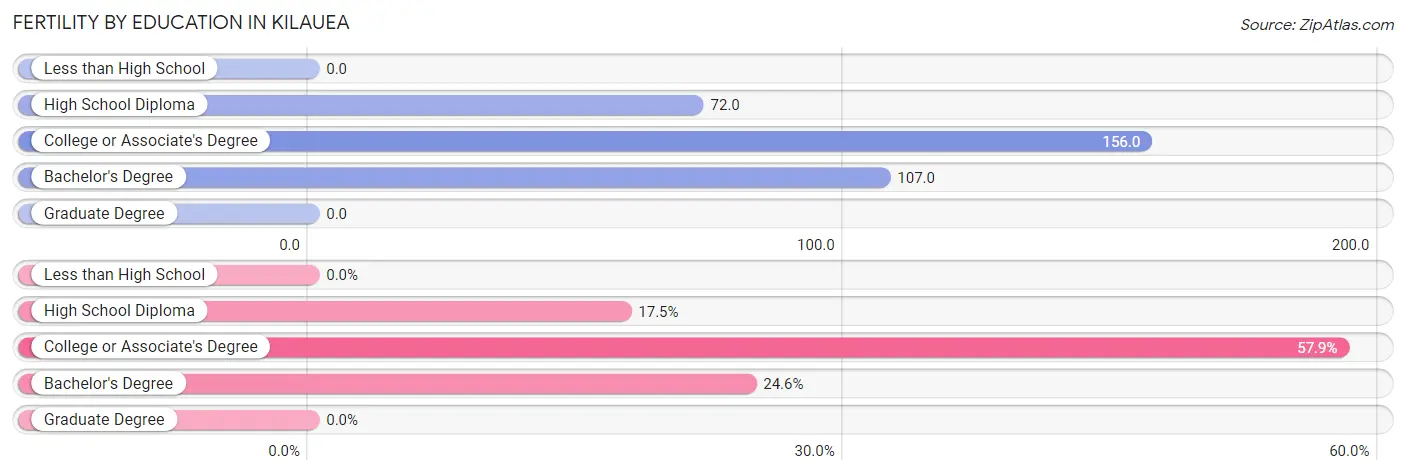
| Educational Attainment | Women with Births | Births / 1,000 Women |
| Less than High School | 0 (0.0%) | 0.0 |
| High School Diploma | 10 (17.5%) | 72.0 |
| College or Associate's Degree | 33 (57.9%) | 156.0 |
| Bachelor's Degree | 14 (24.6%) | 107.0 |
| Graduate Degree | 0 (0.0%) | 0.0 |
| Total | 57 (100.0%) | 91.0 |
Fertility by Education by Marriage Status in Kilauea
28.1% of women with births in Kilauea are unmarried. Women with the educational attainment of high school diploma are most likely to be married with 100.0% of them married at childbirth, while women with the educational attainment of college or associate's degree are least likely to be married with 48.5% of them unmarried at childbirth.
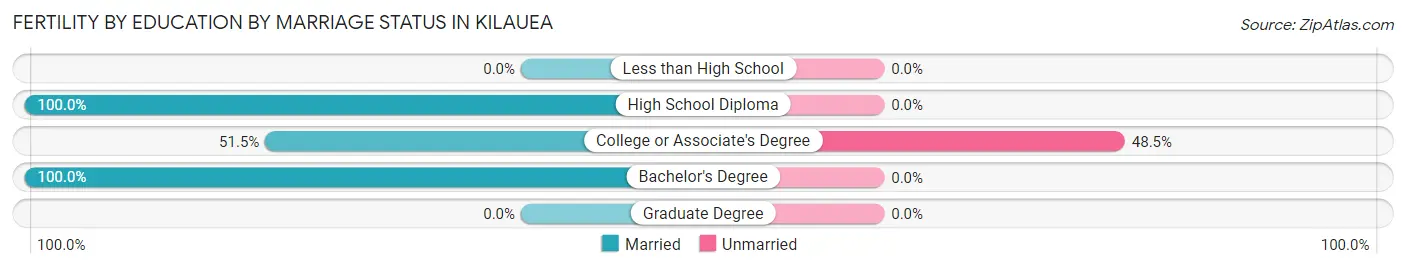
| Educational Attainment | Married | Unmarried |
| Less than High School | 0 (0.0%) | 0 (0.0%) |
| High School Diploma | 10 (100.0%) | 0 (0.0%) |
| College or Associate's Degree | 17 (51.5%) | 16 (48.5%) |
| Bachelor's Degree | 14 (100.0%) | 0 (0.0%) |
| Graduate Degree | 0 (0.0%) | 0 (0.0%) |
| Total | 41 (71.9%) | 16 (28.1%) |
Employment Characteristics in Kilauea
Employment by Class of Employer in Kilauea
Among the 1,655 employed individuals in Kilauea, private company employees (960 | 58.0%), self-employed (not incorporated) (268 | 16.2%), and self-employed (incorporated) (169 | 10.2%) make up the most common classes of employment.
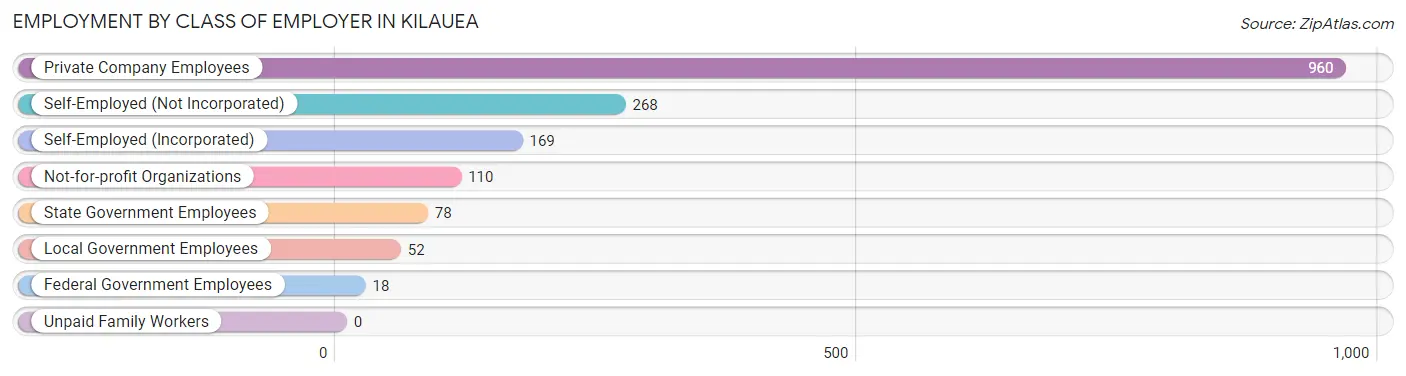
| Employer Class | # Employees | % Employees |
| Private Company Employees | 960 | 58.0% |
| Self-Employed (Incorporated) | 169 | 10.2% |
| Self-Employed (Not Incorporated) | 268 | 16.2% |
| Not-for-profit Organizations | 110 | 6.7% |
| Local Government Employees | 52 | 3.1% |
| State Government Employees | 78 | 4.7% |
| Federal Government Employees | 18 | 1.1% |
| Unpaid Family Workers | 0 | 0.0% |
| Total | 1,655 | 100.0% |
Employment Status by Age in Kilauea
According to the labor force statistics for Kilauea, out of the total population over 16 years of age (2,668), 65.3% or 1,742 individuals are in the labor force, with 4.1% or 71 of them unemployed. The age group with the highest labor force participation rate is 20 to 24 years, with 93.8% or 136 individuals in the labor force. Within the labor force, the 25 to 29 years age range has the highest percentage of unemployed individuals, with 16.8% or 20 of them being unemployed.
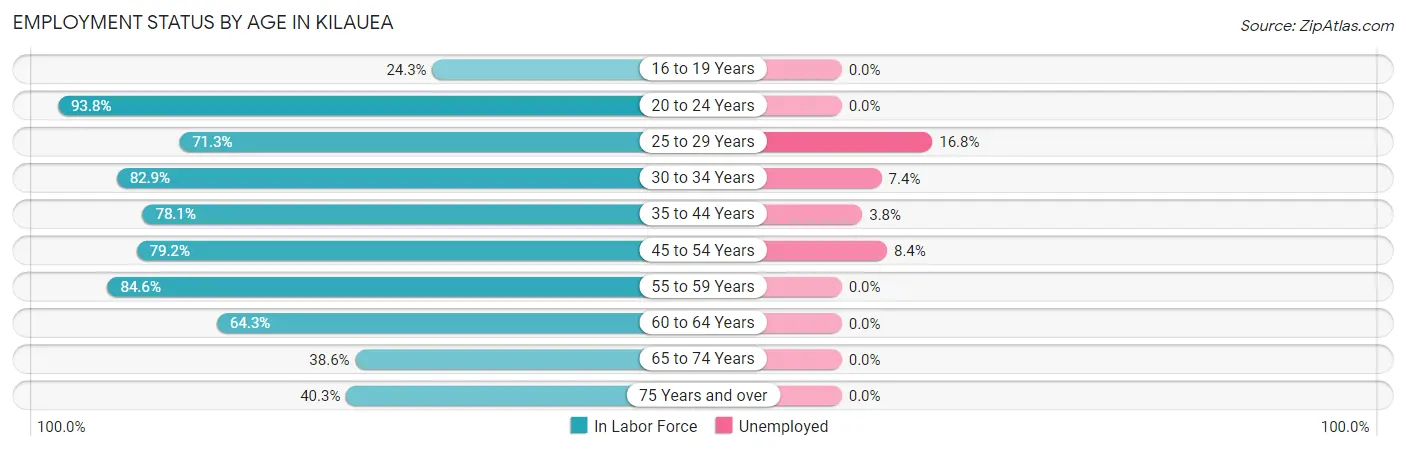
| Age Bracket | In Labor Force | Unemployed |
| 16 to 19 Years | 25 (24.3%) | 0 (0.0%) |
| 20 to 24 Years | 136 (93.8%) | 0 (0.0%) |
| 25 to 29 Years | 119 (71.3%) | 20 (16.8%) |
| 30 to 34 Years | 175 (82.9%) | 13 (7.4%) |
| 35 to 44 Years | 431 (78.1%) | 16 (3.8%) |
| 45 to 54 Years | 263 (79.2%) | 22 (8.4%) |
| 55 to 59 Years | 154 (84.6%) | 0 (0.0%) |
| 60 to 64 Years | 153 (64.3%) | 0 (0.0%) |
| 65 to 74 Years | 239 (38.6%) | 0 (0.0%) |
| 75 Years and over | 48 (40.3%) | 0 (0.0%) |
| Total | 1,742 (65.3%) | 71 (4.1%) |
Employment Status by Educational Attainment in Kilauea
According to labor force statistics for Kilauea, 77.0% of individuals (1,295) out of the total population between 25 and 64 years of age (1,682) are in the labor force, with 5.5% or 71 of them being unemployed. The group with the highest labor force participation rate are those with the educational attainment of college / associate degree, with 87.9% or 515 individuals in the labor force. Within the labor force, individuals with college / associate degree education have the highest percentage of unemployment, with 10.9% or 56 of them being unemployed.
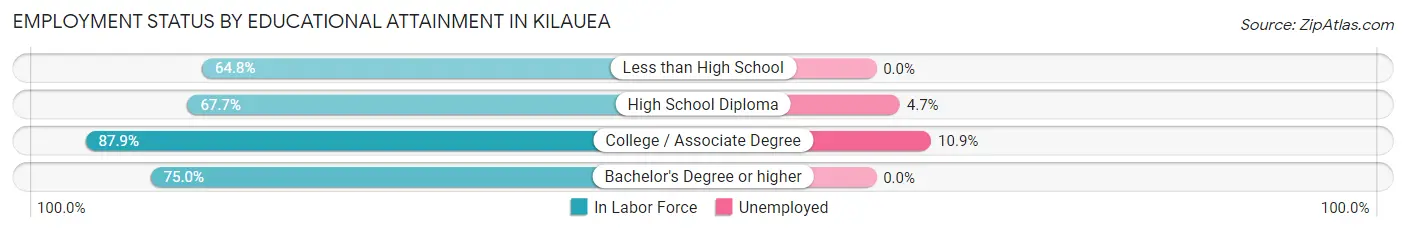
| Educational Attainment | In Labor Force | Unemployed |
| Less than High School | 46 (64.8%) | 0 (0.0%) |
| High School Diploma | 320 (67.7%) | 22 (4.7%) |
| College / Associate Degree | 515 (87.9%) | 64 (10.9%) |
| Bachelor's Degree or higher | 414 (75.0%) | 0 (0.0%) |
| Total | 1,295 (77.0%) | 93 (5.5%) |
Employment Occupations by Sex in Kilauea
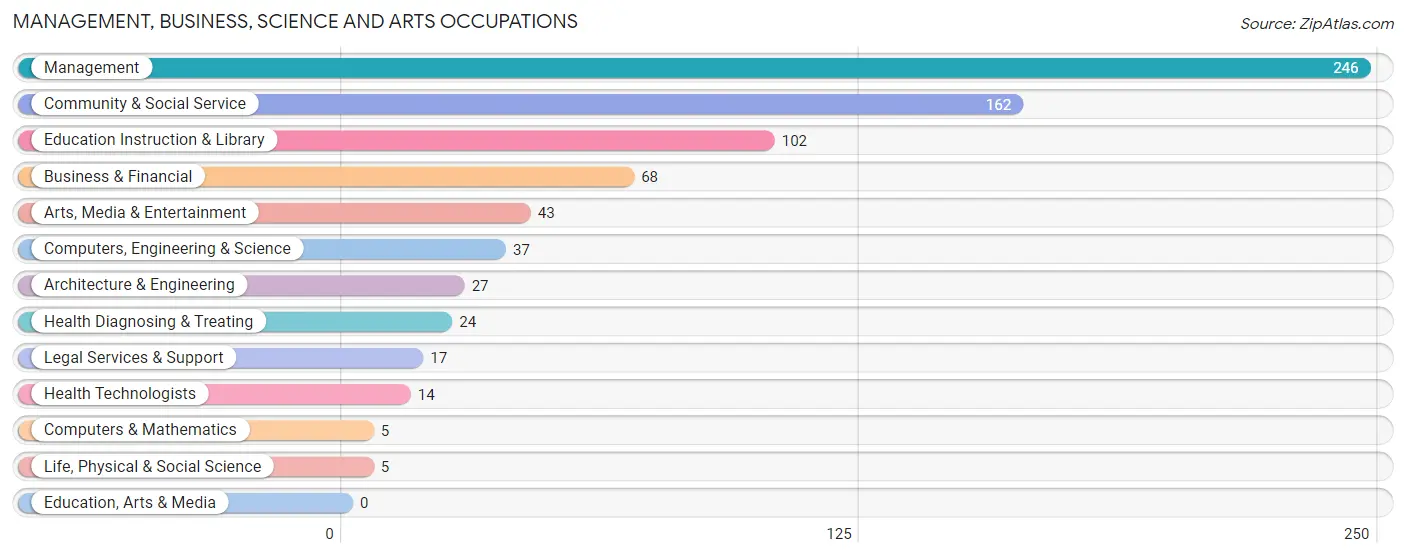
Management, Business, Science and Arts Occupations
The most common Management, Business, Science and Arts occupations in Kilauea are Management (246 | 14.8%), Community & Social Service (162 | 9.8%), Education Instruction & Library (102 | 6.1%), Business & Financial (68 | 4.1%), and Arts, Media & Entertainment (43 | 2.6%).
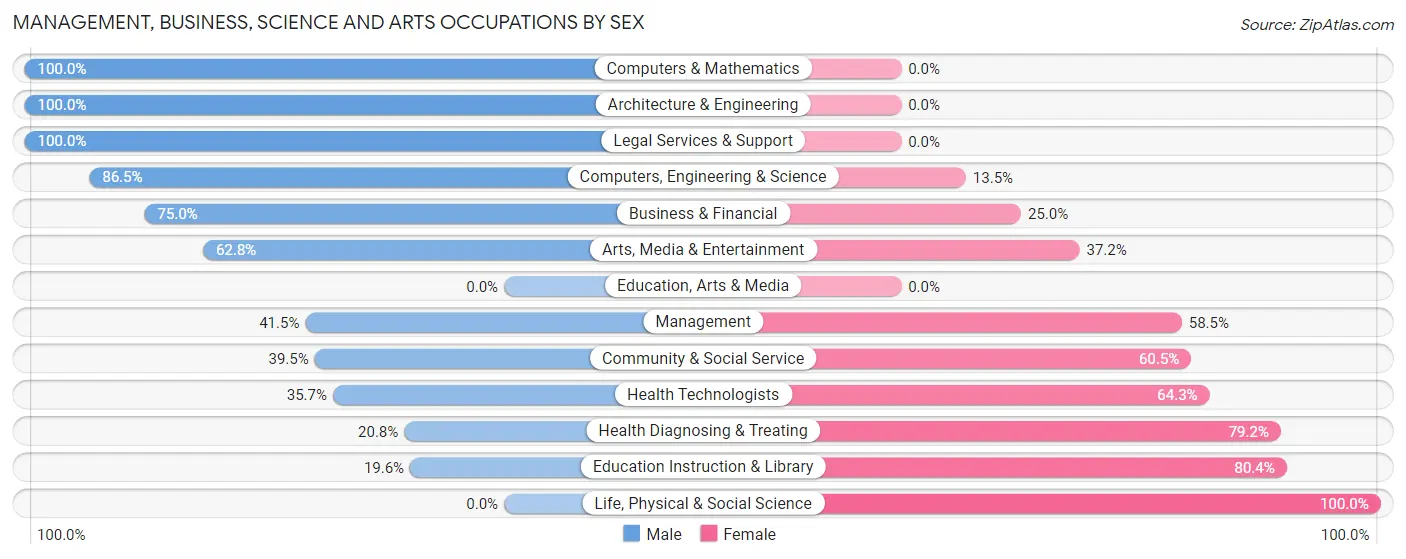
Management, Business, Science and Arts Occupations by Sex
Within the Management, Business, Science and Arts occupations in Kilauea, the most male-oriented occupations are Computers & Mathematics (100.0%), Architecture & Engineering (100.0%), and Legal Services & Support (100.0%), while the most female-oriented occupations are Life, Physical & Social Science (100.0%), Education Instruction & Library (80.4%), and Health Diagnosing & Treating (79.2%).
| Occupation | Male | Female |
| Management | 102 (41.5%) | 144 (58.5%) |
| Business & Financial | 51 (75.0%) | 17 (25.0%) |
| Computers, Engineering & Science | 32 (86.5%) | 5 (13.5%) |
| Computers & Mathematics | 5 (100.0%) | 0 (0.0%) |
| Architecture & Engineering | 27 (100.0%) | 0 (0.0%) |
| Life, Physical & Social Science | 0 (0.0%) | 5 (100.0%) |
| Community & Social Service | 64 (39.5%) | 98 (60.5%) |
| Education, Arts & Media | 0 (0.0%) | 0 (0.0%) |
| Legal Services & Support | 17 (100.0%) | 0 (0.0%) |
| Education Instruction & Library | 20 (19.6%) | 82 (80.4%) |
| Arts, Media & Entertainment | 27 (62.8%) | 16 (37.2%) |
| Health Diagnosing & Treating | 5 (20.8%) | 19 (79.2%) |
| Health Technologists | 5 (35.7%) | 9 (64.3%) |
| Total (Category) | 254 (47.3%) | 283 (52.7%) |
| Total (Overall) | 780 (47.0%) | 880 (53.0%) |
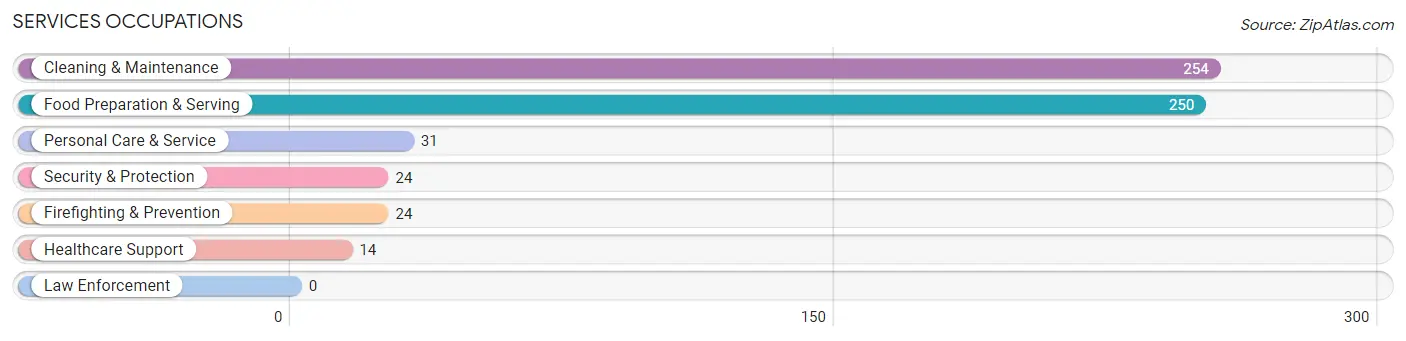
Services Occupations
The most common Services occupations in Kilauea are Cleaning & Maintenance (254 | 15.3%), Food Preparation & Serving (250 | 15.1%), Personal Care & Service (31 | 1.9%), Security & Protection (24 | 1.5%), and Firefighting & Prevention (24 | 1.5%).
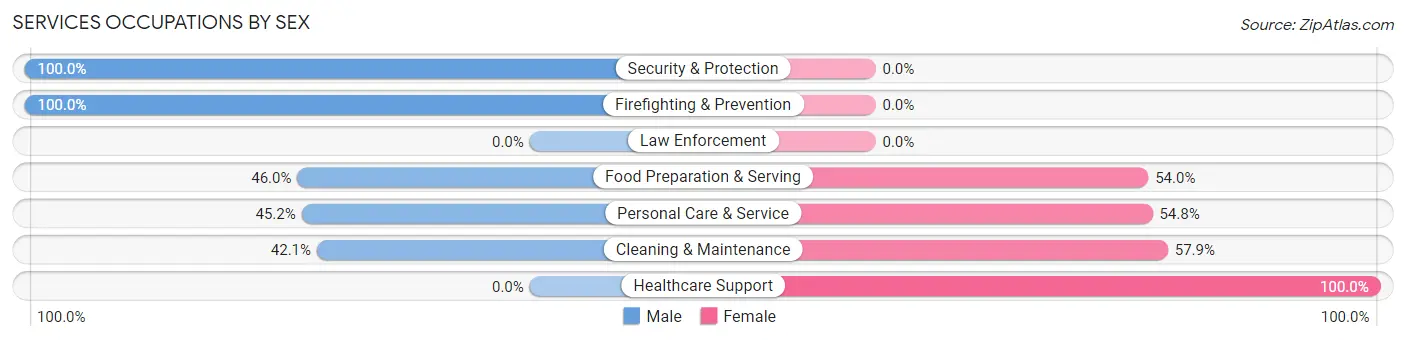
Services Occupations by Sex
Within the Services occupations in Kilauea, the most male-oriented occupations are Security & Protection (100.0%), Firefighting & Prevention (100.0%), and Food Preparation & Serving (46.0%), while the most female-oriented occupations are Healthcare Support (100.0%), Cleaning & Maintenance (57.9%), and Personal Care & Service (54.8%).
| Occupation | Male | Female |
| Healthcare Support | 0 (0.0%) | 14 (100.0%) |
| Security & Protection | 24 (100.0%) | 0 (0.0%) |
| Firefighting & Prevention | 24 (100.0%) | 0 (0.0%) |
| Law Enforcement | 0 (0.0%) | 0 (0.0%) |
| Food Preparation & Serving | 115 (46.0%) | 135 (54.0%) |
| Cleaning & Maintenance | 107 (42.1%) | 147 (57.9%) |
| Personal Care & Service | 14 (45.2%) | 17 (54.8%) |
| Total (Category) | 260 (45.4%) | 313 (54.6%) |
| Total (Overall) | 780 (47.0%) | 880 (53.0%) |
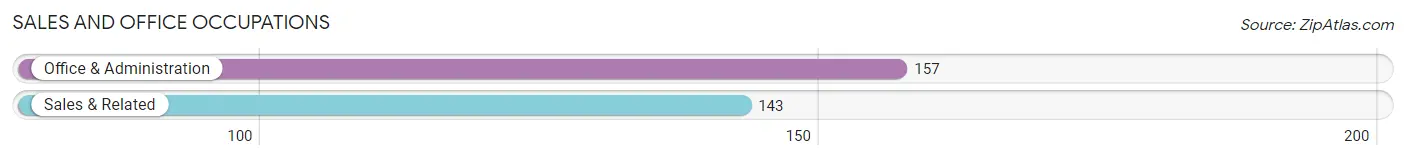
Sales and Office Occupations
The most common Sales and Office occupations in Kilauea are Office & Administration (157 | 9.5%), and Sales & Related (143 | 8.6%).
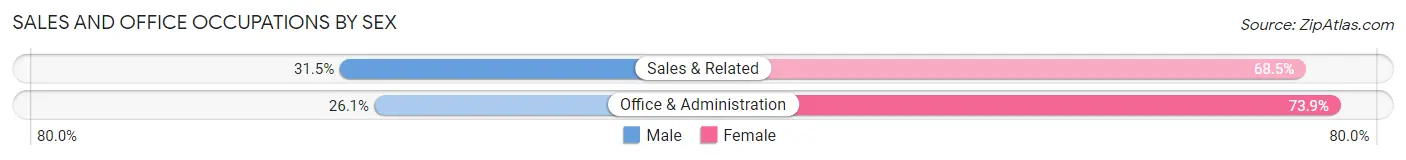
Sales and Office Occupations by Sex
| Occupation | Male | Female |
| Sales & Related | 45 (31.5%) | 98 (68.5%) |
| Office & Administration | 41 (26.1%) | 116 (73.9%) |
| Total (Category) | 86 (28.7%) | 214 (71.3%) |
| Total (Overall) | 780 (47.0%) | 880 (53.0%) |
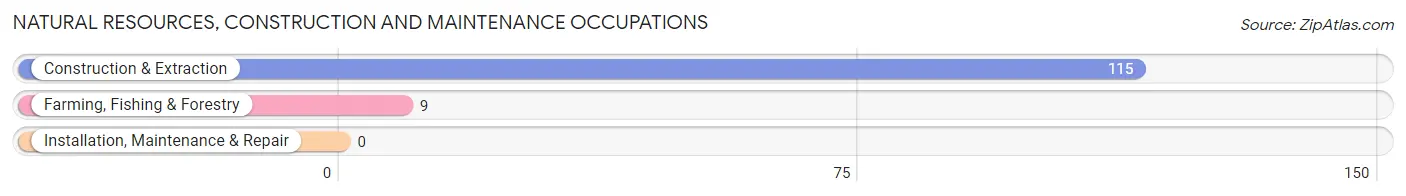
Natural Resources, Construction and Maintenance Occupations
The most common Natural Resources, Construction and Maintenance occupations in Kilauea are Construction & Extraction (115 | 6.9%), and Farming, Fishing & Forestry (9 | 0.5%).
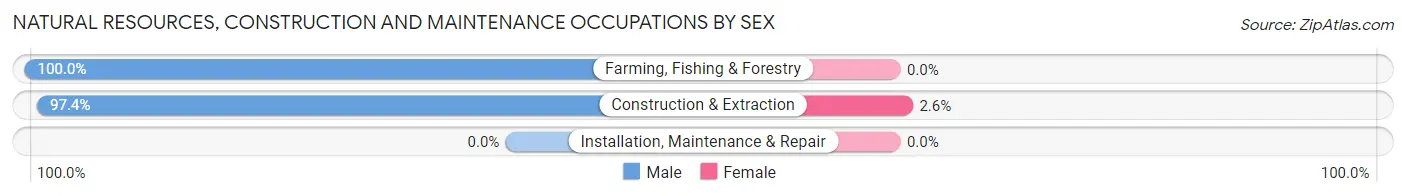
Natural Resources, Construction and Maintenance Occupations by Sex
| Occupation | Male | Female |
| Farming, Fishing & Forestry | 9 (100.0%) | 0 (0.0%) |
| Construction & Extraction | 112 (97.4%) | 3 (2.6%) |
| Installation, Maintenance & Repair | 0 (0.0%) | 0 (0.0%) |
| Total (Category) | 121 (97.6%) | 3 (2.4%) |
| Total (Overall) | 780 (47.0%) | 880 (53.0%) |
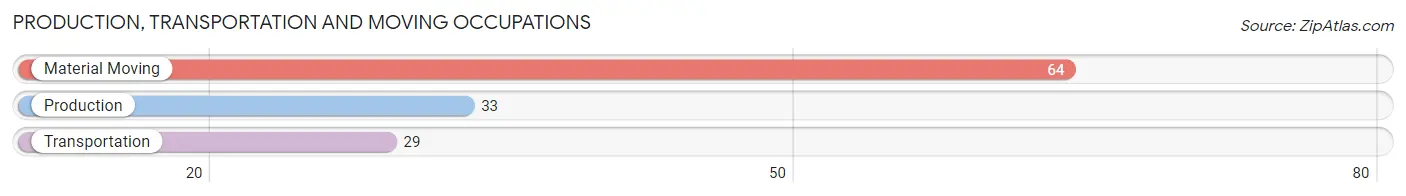
Production, Transportation and Moving Occupations
The most common Production, Transportation and Moving occupations in Kilauea are Material Moving (64 | 3.9%), Production (33 | 2.0%), and Transportation (29 | 1.8%).
Production, Transportation and Moving Occupations by Sex
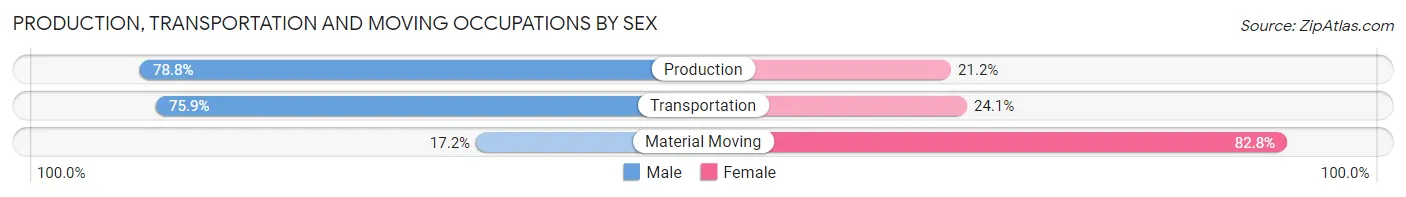
| Occupation | Male | Female |
| Production | 26 (78.8%) | 7 (21.2%) |
| Transportation | 22 (75.9%) | 7 (24.1%) |
| Material Moving | 11 (17.2%) | 53 (82.8%) |
| Total (Category) | 59 (46.8%) | 67 (53.2%) |
| Total (Overall) | 780 (47.0%) | 880 (53.0%) |
Employment Industries by Sex in Kilauea
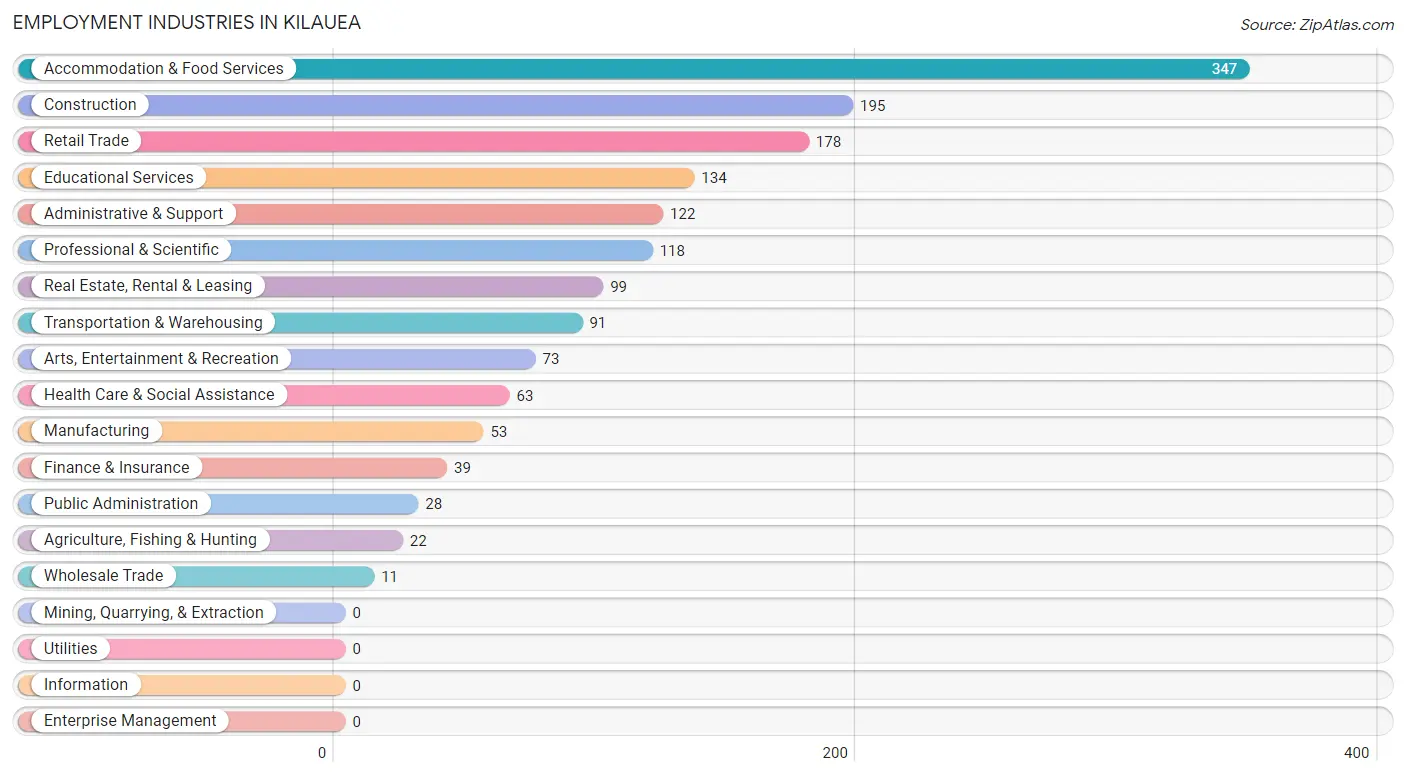
Employment Industries in Kilauea
The major employment industries in Kilauea include Accommodation & Food Services (347 | 20.9%), Construction (195 | 11.7%), Retail Trade (178 | 10.7%), Educational Services (134 | 8.1%), and Administrative & Support (122 | 7.3%).
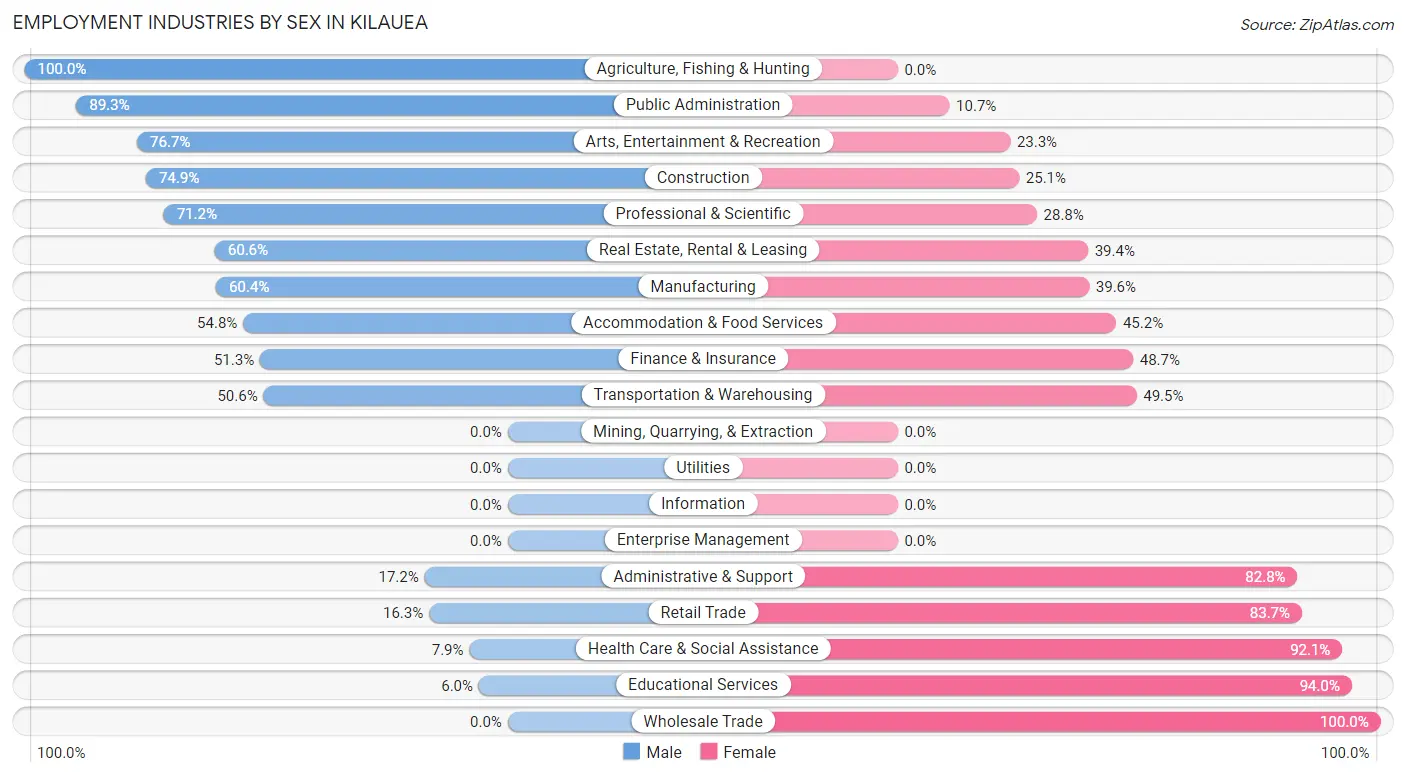
Employment Industries by Sex in Kilauea
The Kilauea industries that see more men than women are Agriculture, Fishing & Hunting (100.0%), Public Administration (89.3%), and Arts, Entertainment & Recreation (76.7%), whereas the industries that tend to have a higher number of women are Wholesale Trade (100.0%), Educational Services (94.0%), and Health Care & Social Assistance (92.1%).
| Industry | Male | Female |
| Agriculture, Fishing & Hunting | 22 (100.0%) | 0 (0.0%) |
| Mining, Quarrying, & Extraction | 0 (0.0%) | 0 (0.0%) |
| Construction | 146 (74.9%) | 49 (25.1%) |
| Manufacturing | 32 (60.4%) | 21 (39.6%) |
| Wholesale Trade | 0 (0.0%) | 11 (100.0%) |
| Retail Trade | 29 (16.3%) | 149 (83.7%) |
| Transportation & Warehousing | 46 (50.5%) | 45 (49.4%) |
| Utilities | 0 (0.0%) | 0 (0.0%) |
| Information | 0 (0.0%) | 0 (0.0%) |
| Finance & Insurance | 20 (51.3%) | 19 (48.7%) |
| Real Estate, Rental & Leasing | 60 (60.6%) | 39 (39.4%) |
| Professional & Scientific | 84 (71.2%) | 34 (28.8%) |
| Enterprise Management | 0 (0.0%) | 0 (0.0%) |
| Administrative & Support | 21 (17.2%) | 101 (82.8%) |
| Educational Services | 8 (6.0%) | 126 (94.0%) |
| Health Care & Social Assistance | 5 (7.9%) | 58 (92.1%) |
| Arts, Entertainment & Recreation | 56 (76.7%) | 17 (23.3%) |
| Accommodation & Food Services | 190 (54.8%) | 157 (45.2%) |
| Public Administration | 25 (89.3%) | 3 (10.7%) |
| Total | 780 (47.0%) | 880 (53.0%) |
Education in Kilauea
School Enrollment in Kilauea
The most common levels of schooling among the 712 students in Kilauea are middle school (215 | 30.2%), elementary school (189 | 26.5%), and high school (126 | 17.7%).
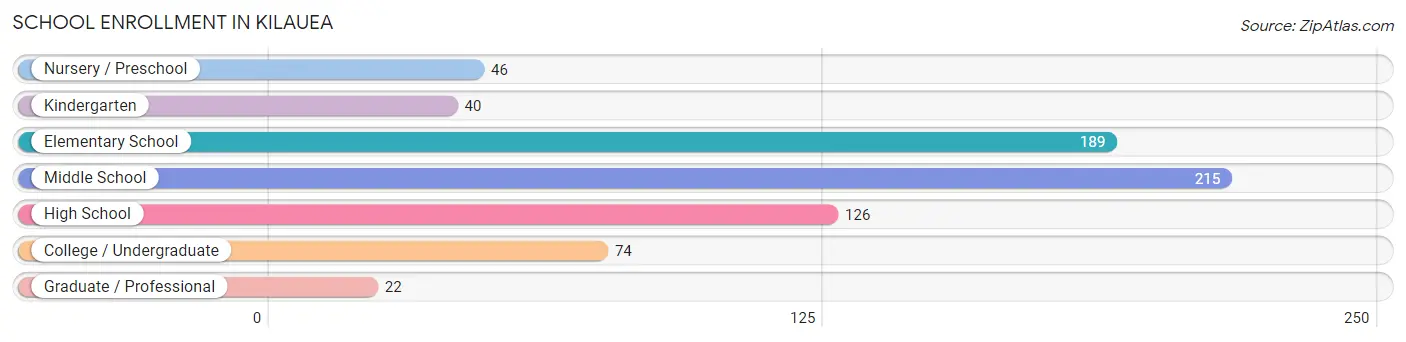
| School Level | # Students | % Students |
| Nursery / Preschool | 46 | 6.5% |
| Kindergarten | 40 | 5.6% |
| Elementary School | 189 | 26.5% |
| Middle School | 215 | 30.2% |
| High School | 126 | 17.7% |
| College / Undergraduate | 74 | 10.4% |
| Graduate / Professional | 22 | 3.1% |
| Total | 712 | 100.0% |
School Enrollment by Age by Funding Source in Kilauea
Out of a total of 712 students who are enrolled in schools in Kilauea, 216 (30.3%) attend a private institution, while the remaining 496 (69.7%) are enrolled in public schools. The age group of 25 to 34 year olds has the highest likelihood of being enrolled in private schools, with 13 (100.0% in the age bracket) enrolled. Conversely, the age group of 18 to 19 year olds has the lowest likelihood of being enrolled in a private school, with 33 (100.0% in the age bracket) attending a public institution.
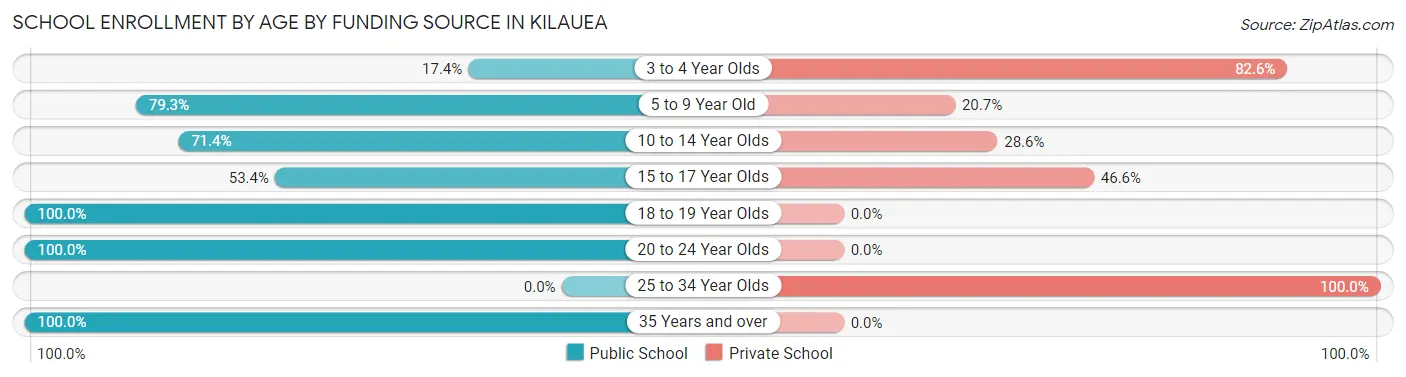
| Age Bracket | Public School | Private School |
| 3 to 4 Year Olds | 8 (17.4%) | 38 (82.6%) |
| 5 to 9 Year Old | 153 (79.3%) | 40 (20.7%) |
| 10 to 14 Year Olds | 192 (71.4%) | 77 (28.6%) |
| 15 to 17 Year Olds | 55 (53.4%) | 48 (46.6%) |
| 18 to 19 Year Olds | 33 (100.0%) | 0 (0.0%) |
| 20 to 24 Year Olds | 39 (100.0%) | 0 (0.0%) |
| 25 to 34 Year Olds | 0 (0.0%) | 13 (100.0%) |
| 35 Years and over | 16 (100.0%) | 0 (0.0%) |
| Total | 496 (69.7%) | 216 (30.3%) |
Educational Attainment by Field of Study in Kilauea
Business (175 | 23.1%), science & technology (107 | 14.1%), education (98 | 12.9%), arts & humanities (55 | 7.2%), and communications (53 | 7.0%) are the most common fields of study among 759 individuals in Kilauea who have obtained a bachelor's degree or higher.
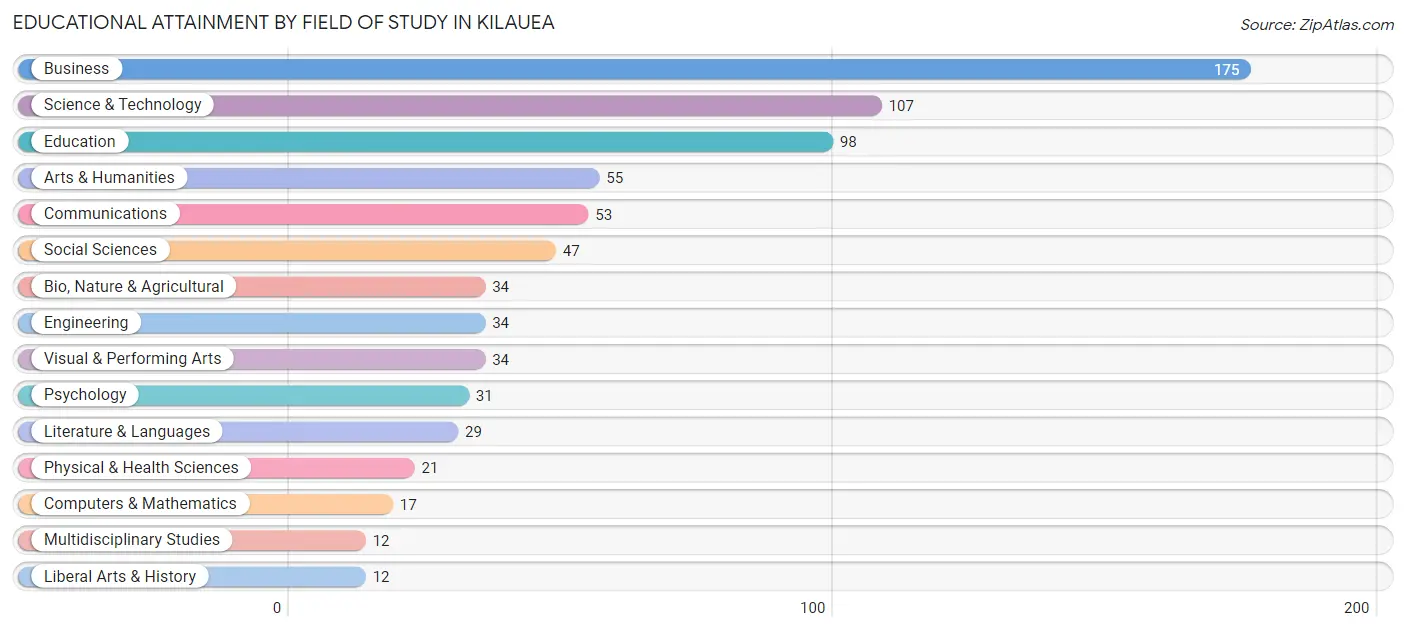
| Field of Study | # Graduates | % Graduates |
| Computers & Mathematics | 17 | 2.2% |
| Bio, Nature & Agricultural | 34 | 4.5% |
| Physical & Health Sciences | 21 | 2.8% |
| Psychology | 31 | 4.1% |
| Social Sciences | 47 | 6.2% |
| Engineering | 34 | 4.5% |
| Multidisciplinary Studies | 12 | 1.6% |
| Science & Technology | 107 | 14.1% |
| Business | 175 | 23.1% |
| Education | 98 | 12.9% |
| Literature & Languages | 29 | 3.8% |
| Liberal Arts & History | 12 | 1.6% |
| Visual & Performing Arts | 34 | 4.5% |
| Communications | 53 | 7.0% |
| Arts & Humanities | 55 | 7.2% |
| Total | 759 | 100.0% |
Transportation & Commute in Kilauea
Vehicle Availability by Sex in Kilauea
The most prevalent vehicle ownership categories in Kilauea are males with 2 vehicles (302, accounting for 38.6%) and females with 2 vehicles (339, making up 34.6%).
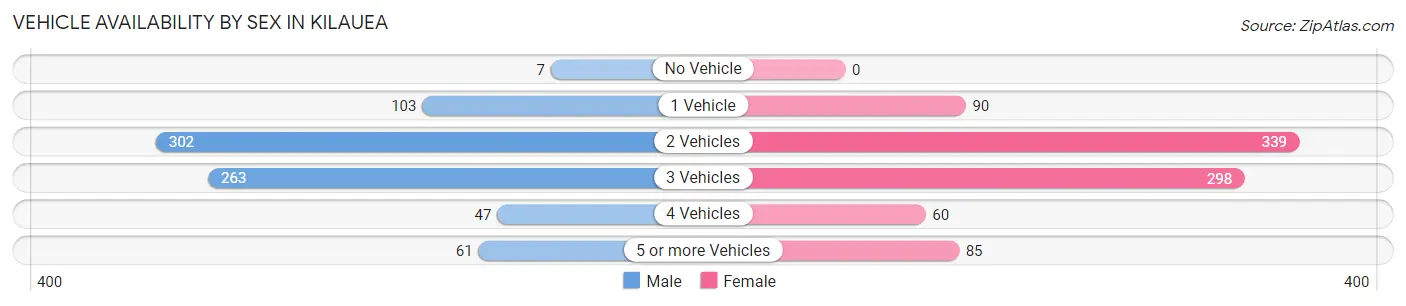
| Vehicles Available | Male | Female |
| No Vehicle | 7 (0.9%) | 0 (0.0%) |
| 1 Vehicle | 103 (13.2%) | 90 (10.3%) |
| 2 Vehicles | 302 (38.6%) | 339 (38.9%) |
| 3 Vehicles | 263 (33.6%) | 298 (34.2%) |
| 4 Vehicles | 47 (6.0%) | 60 (6.9%) |
| 5 or more Vehicles | 61 (7.8%) | 85 (9.8%) |
| Total | 783 (100.0%) | 872 (100.0%) |
Commute Time in Kilauea
The most frequently occuring commute durations in Kilauea are 15 to 19 minutes (332 commuters, 23.8%), 10 to 14 minutes (250 commuters, 17.9%), and 5 to 9 minutes (173 commuters, 12.4%).
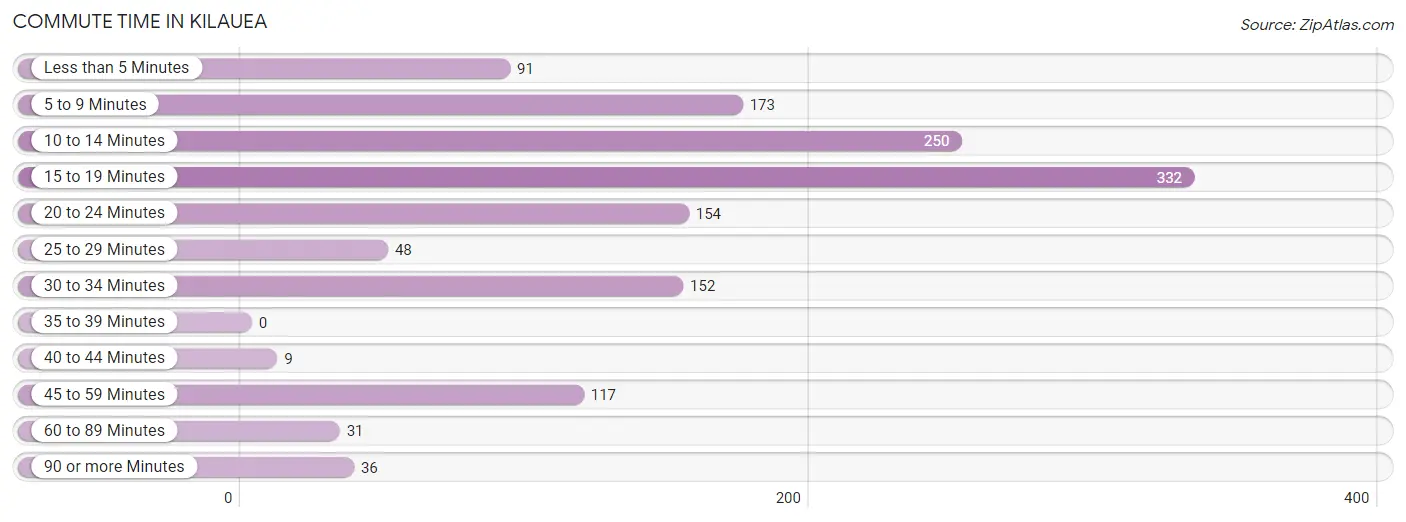
| Commute Time | # Commuters | % Commuters |
| Less than 5 Minutes | 91 | 6.5% |
| 5 to 9 Minutes | 173 | 12.4% |
| 10 to 14 Minutes | 250 | 17.9% |
| 15 to 19 Minutes | 332 | 23.8% |
| 20 to 24 Minutes | 154 | 11.1% |
| 25 to 29 Minutes | 48 | 3.5% |
| 30 to 34 Minutes | 152 | 10.9% |
| 35 to 39 Minutes | 0 | 0.0% |
| 40 to 44 Minutes | 9 | 0.6% |
| 45 to 59 Minutes | 117 | 8.4% |
| 60 to 89 Minutes | 31 | 2.2% |
| 90 or more Minutes | 36 | 2.6% |
Commute Time by Sex in Kilauea
The most common commute times in Kilauea are 15 to 19 minutes (164 commuters, 26.3%) for males and 10 to 14 minutes (196 commuters, 25.5%) for females.
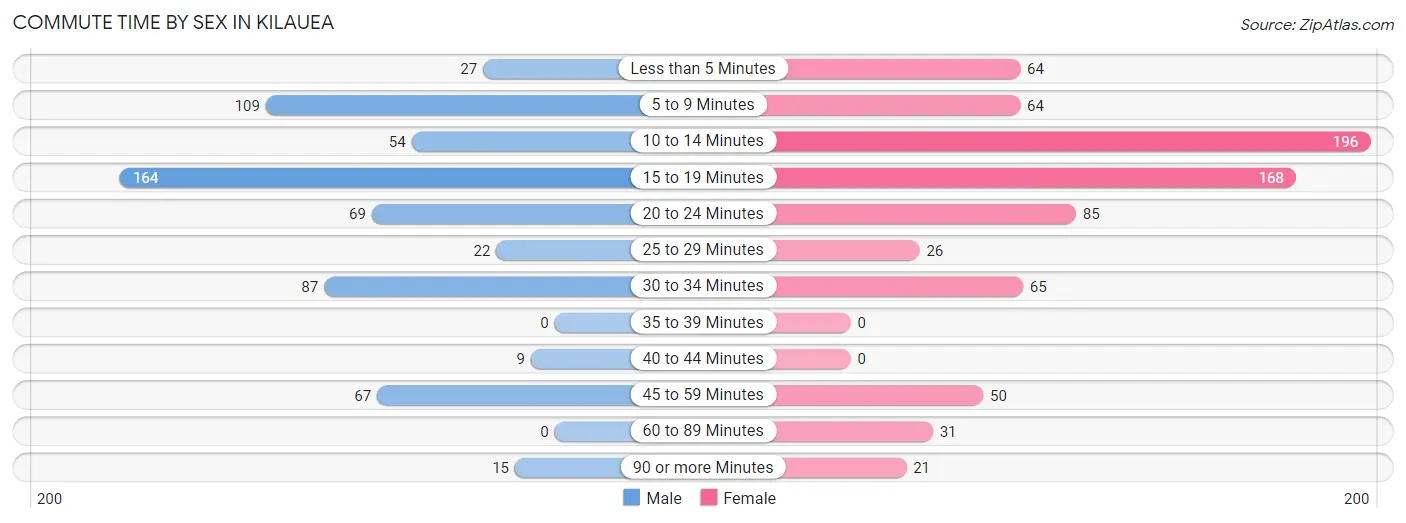
| Commute Time | Male | Female |
| Less than 5 Minutes | 27 (4.3%) | 64 (8.3%) |
| 5 to 9 Minutes | 109 (17.5%) | 64 (8.3%) |
| 10 to 14 Minutes | 54 (8.7%) | 196 (25.5%) |
| 15 to 19 Minutes | 164 (26.3%) | 168 (21.8%) |
| 20 to 24 Minutes | 69 (11.1%) | 85 (11.0%) |
| 25 to 29 Minutes | 22 (3.5%) | 26 (3.4%) |
| 30 to 34 Minutes | 87 (14.0%) | 65 (8.4%) |
| 35 to 39 Minutes | 0 (0.0%) | 0 (0.0%) |
| 40 to 44 Minutes | 9 (1.4%) | 0 (0.0%) |
| 45 to 59 Minutes | 67 (10.7%) | 50 (6.5%) |
| 60 to 89 Minutes | 0 (0.0%) | 31 (4.0%) |
| 90 or more Minutes | 15 (2.4%) | 21 (2.7%) |
Time of Departure to Work by Sex in Kilauea
The most frequent times of departure to work in Kilauea are 7:30 AM to 7:59 AM (103, 16.5%) for males and 8:00 AM to 8:29 AM (130, 16.9%) for females.
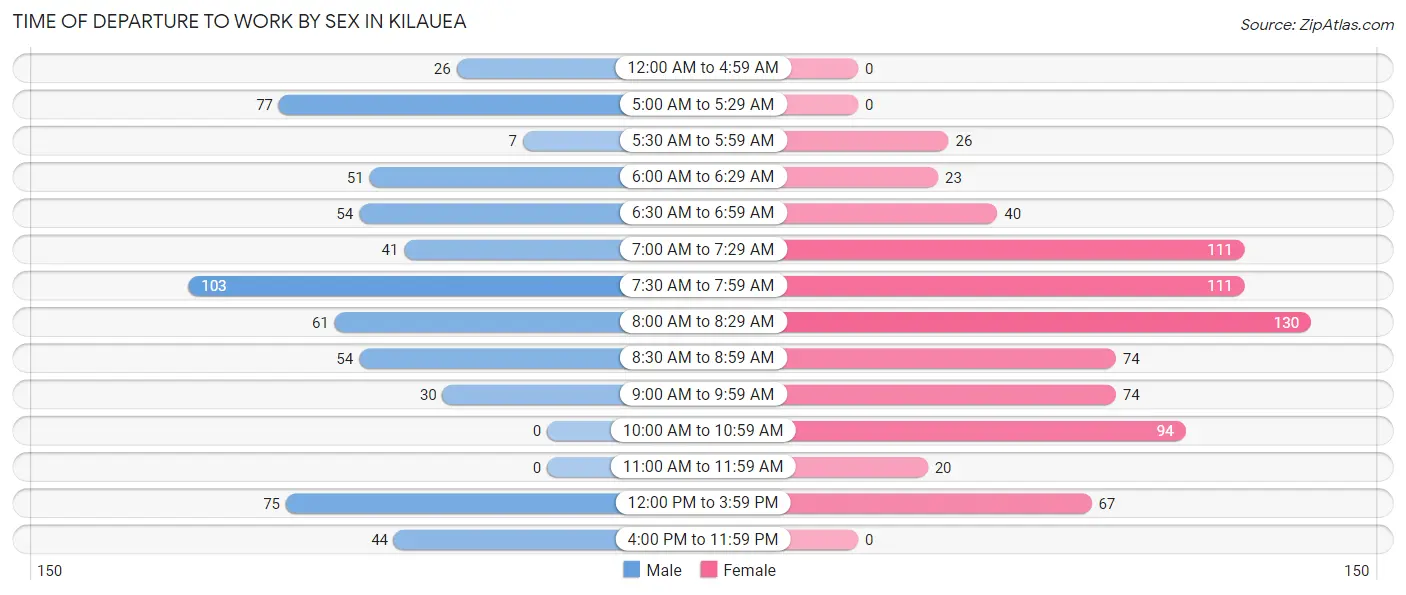
| Time of Departure | Male | Female |
| 12:00 AM to 4:59 AM | 26 (4.2%) | 0 (0.0%) |
| 5:00 AM to 5:29 AM | 77 (12.4%) | 0 (0.0%) |
| 5:30 AM to 5:59 AM | 7 (1.1%) | 26 (3.4%) |
| 6:00 AM to 6:29 AM | 51 (8.2%) | 23 (3.0%) |
| 6:30 AM to 6:59 AM | 54 (8.7%) | 40 (5.2%) |
| 7:00 AM to 7:29 AM | 41 (6.6%) | 111 (14.4%) |
| 7:30 AM to 7:59 AM | 103 (16.5%) | 111 (14.4%) |
| 8:00 AM to 8:29 AM | 61 (9.8%) | 130 (16.9%) |
| 8:30 AM to 8:59 AM | 54 (8.7%) | 74 (9.6%) |
| 9:00 AM to 9:59 AM | 30 (4.8%) | 74 (9.6%) |
| 10:00 AM to 10:59 AM | 0 (0.0%) | 94 (12.2%) |
| 11:00 AM to 11:59 AM | 0 (0.0%) | 20 (2.6%) |
| 12:00 PM to 3:59 PM | 75 (12.0%) | 67 (8.7%) |
| 4:00 PM to 11:59 PM | 44 (7.1%) | 0 (0.0%) |
| Total | 623 (100.0%) | 770 (100.0%) |
Housing Occupancy in Kilauea
Occupancy by Ownership in Kilauea
Of the total 986 dwellings in Kilauea, owner-occupied units account for 792 (80.3%), while renter-occupied units make up 194 (19.7%).
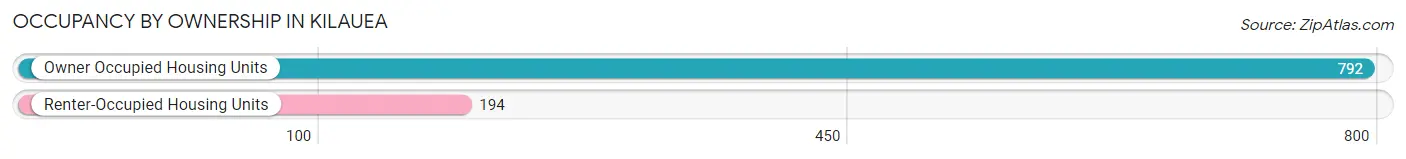
| Occupancy | # Housing Units | % Housing Units |
| Owner Occupied Housing Units | 792 | 80.3% |
| Renter-Occupied Housing Units | 194 | 19.7% |
| Total Occupied Housing Units | 986 | 100.0% |
Occupancy by Household Size in Kilauea
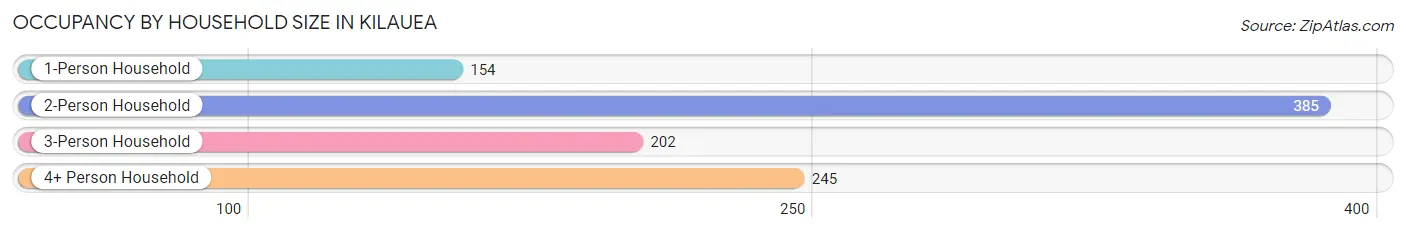
| Household Size | # Housing Units | % Housing Units |
| 1-Person Household | 154 | 15.6% |
| 2-Person Household | 385 | 39.1% |
| 3-Person Household | 202 | 20.5% |
| 4+ Person Household | 245 | 24.8% |
| Total Housing Units | 986 | 100.0% |
Occupancy by Ownership by Household Size in Kilauea
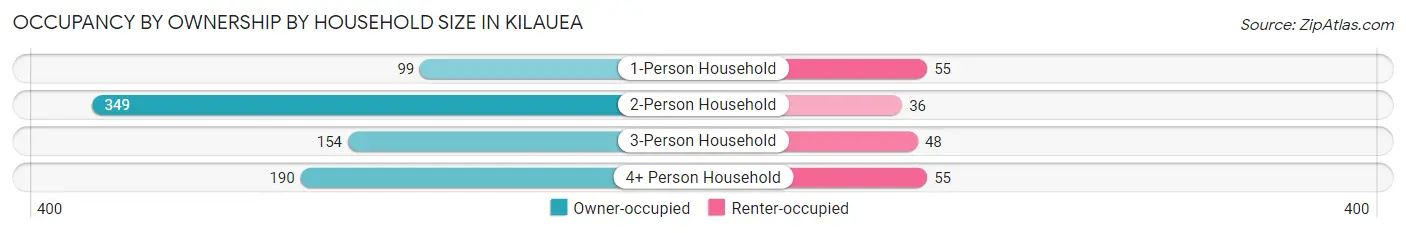
| Household Size | Owner-occupied | Renter-occupied |
| 1-Person Household | 99 (64.3%) | 55 (35.7%) |
| 2-Person Household | 349 (90.6%) | 36 (9.3%) |
| 3-Person Household | 154 (76.2%) | 48 (23.8%) |
| 4+ Person Household | 190 (77.5%) | 55 (22.5%) |
| Total Housing Units | 792 (80.3%) | 194 (19.7%) |
Occupancy by Educational Attainment in Kilauea
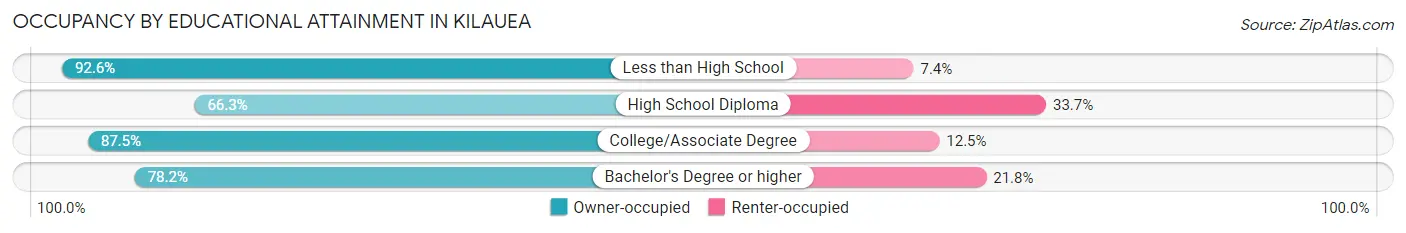
| Household Size | Owner-occupied | Renter-occupied |
| Less than High School | 50 (92.6%) | 4 (7.4%) |
| High School Diploma | 128 (66.3%) | 65 (33.7%) |
| College/Associate Degree | 342 (87.5%) | 49 (12.5%) |
| Bachelor's Degree or higher | 272 (78.2%) | 76 (21.8%) |
Occupancy by Age of Householder in Kilauea
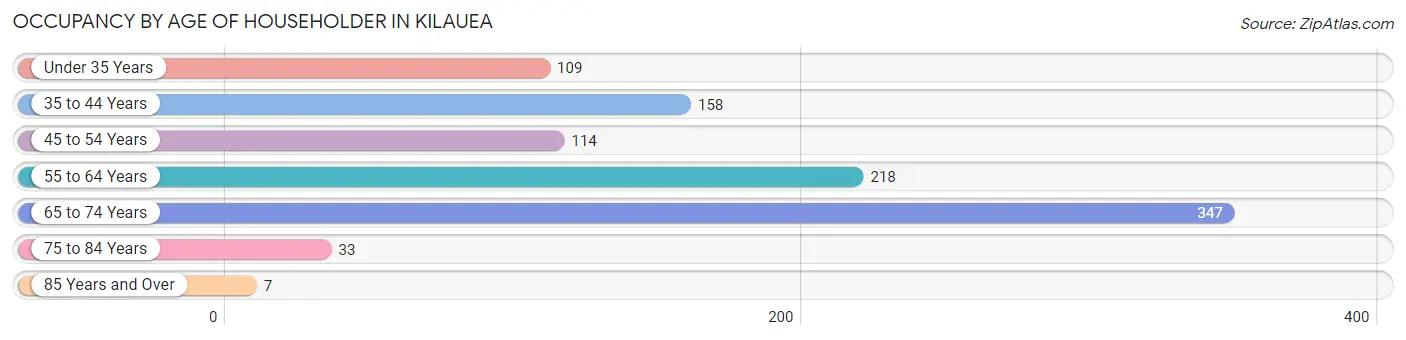
| Age Bracket | # Households | % Households |
| Under 35 Years | 109 | 11.1% |
| 35 to 44 Years | 158 | 16.0% |
| 45 to 54 Years | 114 | 11.6% |
| 55 to 64 Years | 218 | 22.1% |
| 65 to 74 Years | 347 | 35.2% |
| 75 to 84 Years | 33 | 3.4% |
| 85 Years and Over | 7 | 0.7% |
| Total | 986 | 100.0% |
Housing Finances in Kilauea
Median Income by Occupancy in Kilauea
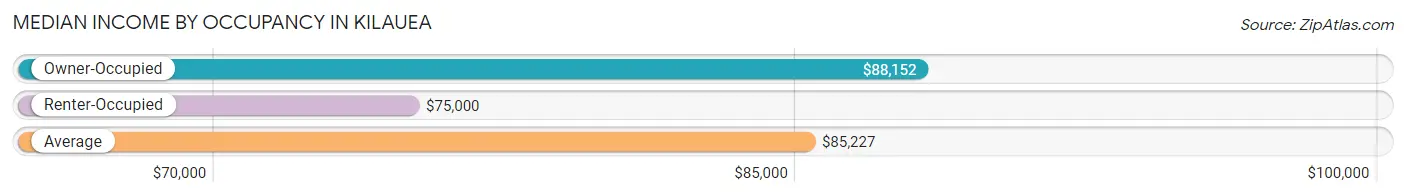
| Occupancy Type | # Households | Median Income |
| Owner-Occupied | 792 (80.3%) | $88,152 |
| Renter-Occupied | 194 (19.7%) | $75,000 |
| Average | 986 (100.0%) | $85,227 |
Occupancy by Householder Income Bracket in Kilauea
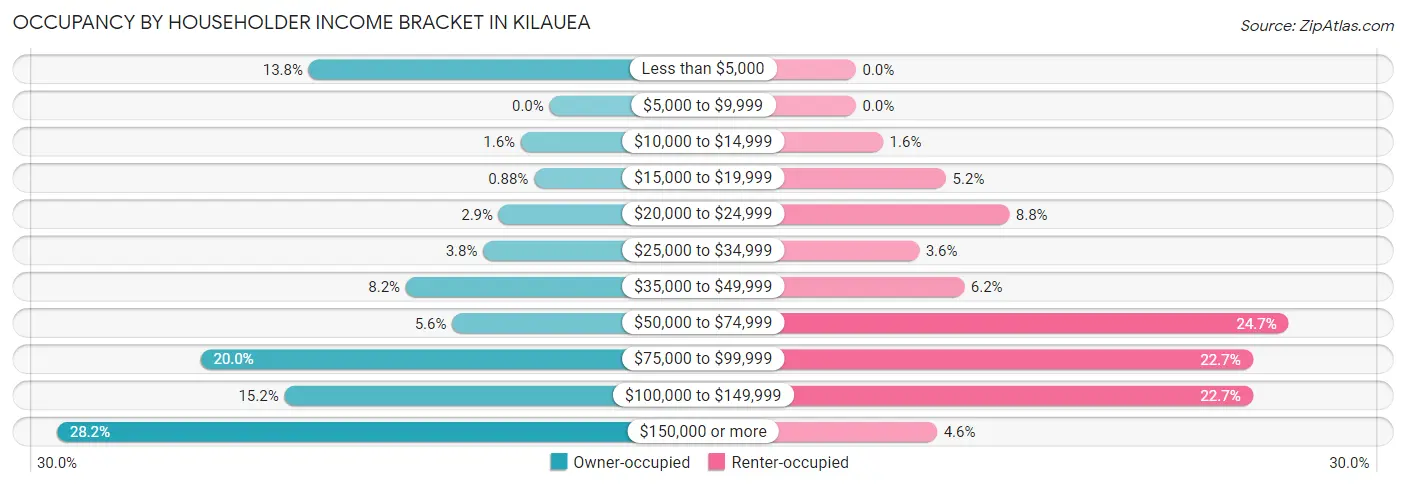
| Income Bracket | Owner-occupied | Renter-occupied |
| Less than $5,000 | 109 (13.8%) | 0 (0.0%) |
| $5,000 to $9,999 | 0 (0.0%) | 0 (0.0%) |
| $10,000 to $14,999 | 13 (1.6%) | 3 (1.5%) |
| $15,000 to $19,999 | 7 (0.9%) | 10 (5.1%) |
| $20,000 to $24,999 | 23 (2.9%) | 17 (8.8%) |
| $25,000 to $34,999 | 30 (3.8%) | 7 (3.6%) |
| $35,000 to $49,999 | 65 (8.2%) | 12 (6.2%) |
| $50,000 to $74,999 | 44 (5.6%) | 48 (24.7%) |
| $75,000 to $99,999 | 158 (20.0%) | 44 (22.7%) |
| $100,000 to $149,999 | 120 (15.1%) | 44 (22.7%) |
| $150,000 or more | 223 (28.2%) | 9 (4.6%) |
| Total | 792 (100.0%) | 194 (100.0%) |
Monthly Housing Cost Tiers in Kilauea
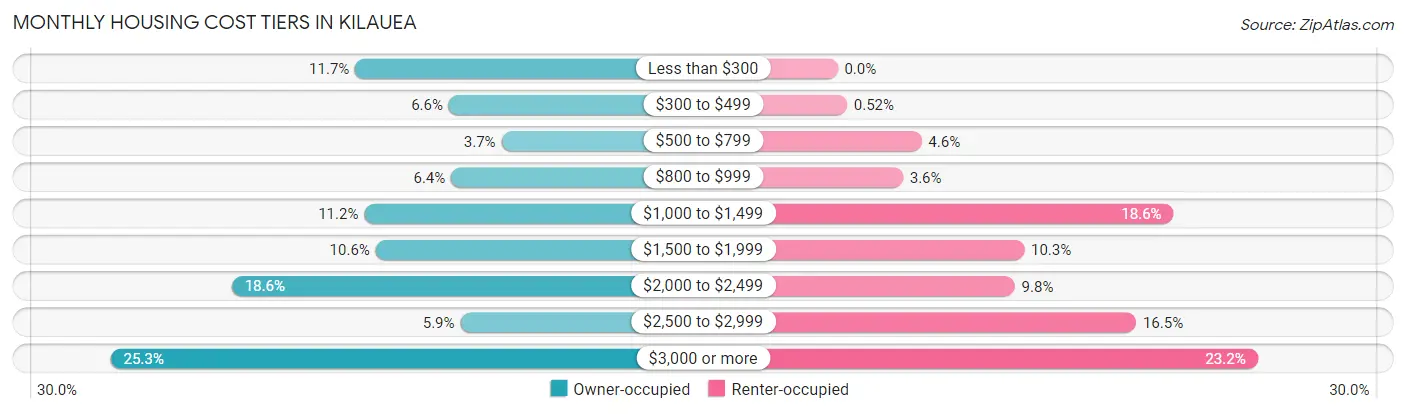
| Monthly Cost | Owner-occupied | Renter-occupied |
| Less than $300 | 93 (11.7%) | 0 (0.0%) |
| $300 to $499 | 52 (6.6%) | 1 (0.5%) |
| $500 to $799 | 29 (3.7%) | 9 (4.6%) |
| $800 to $999 | 51 (6.4%) | 7 (3.6%) |
| $1,000 to $1,499 | 89 (11.2%) | 36 (18.6%) |
| $1,500 to $1,999 | 84 (10.6%) | 20 (10.3%) |
| $2,000 to $2,499 | 147 (18.6%) | 19 (9.8%) |
| $2,500 to $2,999 | 47 (5.9%) | 32 (16.5%) |
| $3,000 or more | 200 (25.3%) | 45 (23.2%) |
| Total | 792 (100.0%) | 194 (100.0%) |
Physical Housing Characteristics in Kilauea
Housing Structures in Kilauea
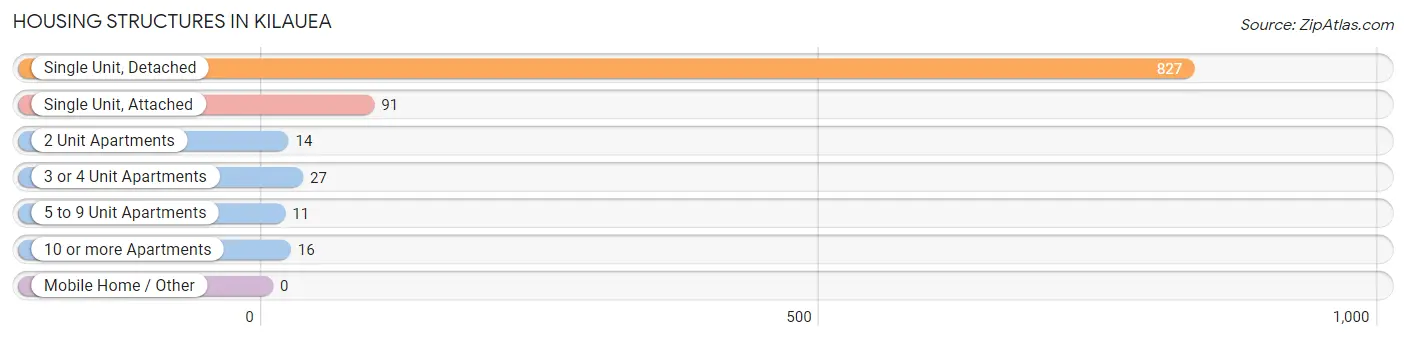
| Structure Type | # Housing Units | % Housing Units |
| Single Unit, Detached | 827 | 83.9% |
| Single Unit, Attached | 91 | 9.2% |
| 2 Unit Apartments | 14 | 1.4% |
| 3 or 4 Unit Apartments | 27 | 2.7% |
| 5 to 9 Unit Apartments | 11 | 1.1% |
| 10 or more Apartments | 16 | 1.6% |
| Mobile Home / Other | 0 | 0.0% |
| Total | 986 | 100.0% |
Housing Structures by Occupancy in Kilauea
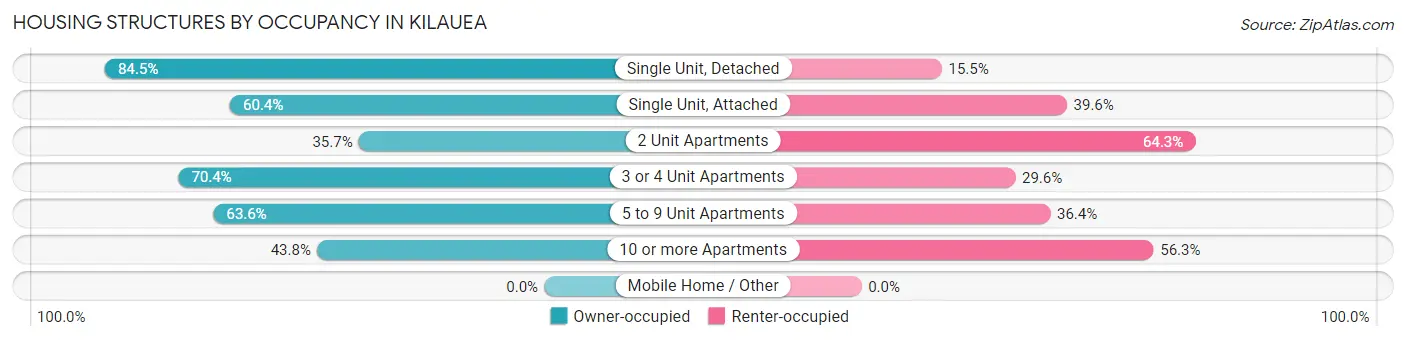
| Structure Type | Owner-occupied | Renter-occupied |
| Single Unit, Detached | 699 (84.5%) | 128 (15.5%) |
| Single Unit, Attached | 55 (60.4%) | 36 (39.6%) |
| 2 Unit Apartments | 5 (35.7%) | 9 (64.3%) |
| 3 or 4 Unit Apartments | 19 (70.4%) | 8 (29.6%) |
| 5 to 9 Unit Apartments | 7 (63.6%) | 4 (36.4%) |
| 10 or more Apartments | 7 (43.8%) | 9 (56.2%) |
| Mobile Home / Other | 0 (0.0%) | 0 (0.0%) |
| Total | 792 (80.3%) | 194 (19.7%) |
Housing Structures by Number of Rooms in Kilauea
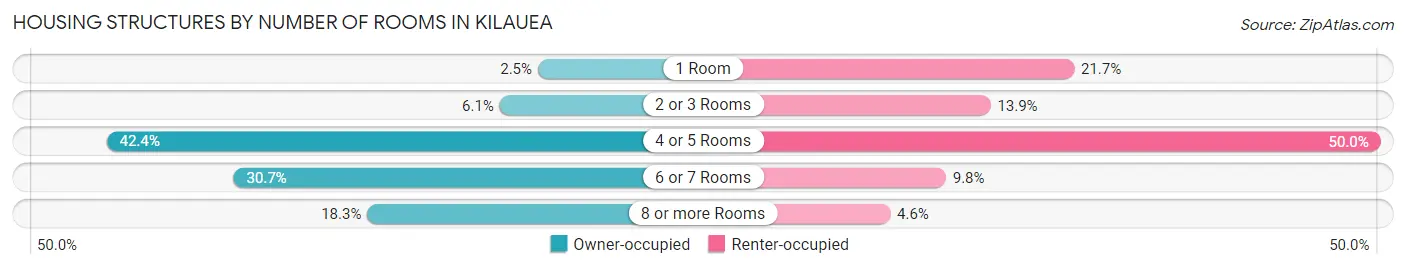
| Number of Rooms | Owner-occupied | Renter-occupied |
| 1 Room | 20 (2.5%) | 42 (21.6%) |
| 2 or 3 Rooms | 48 (6.1%) | 27 (13.9%) |
| 4 or 5 Rooms | 336 (42.4%) | 97 (50.0%) |
| 6 or 7 Rooms | 243 (30.7%) | 19 (9.8%) |
| 8 or more Rooms | 145 (18.3%) | 9 (4.6%) |
| Total | 792 (100.0%) | 194 (100.0%) |
Housing Structure by Heating Type in Kilauea
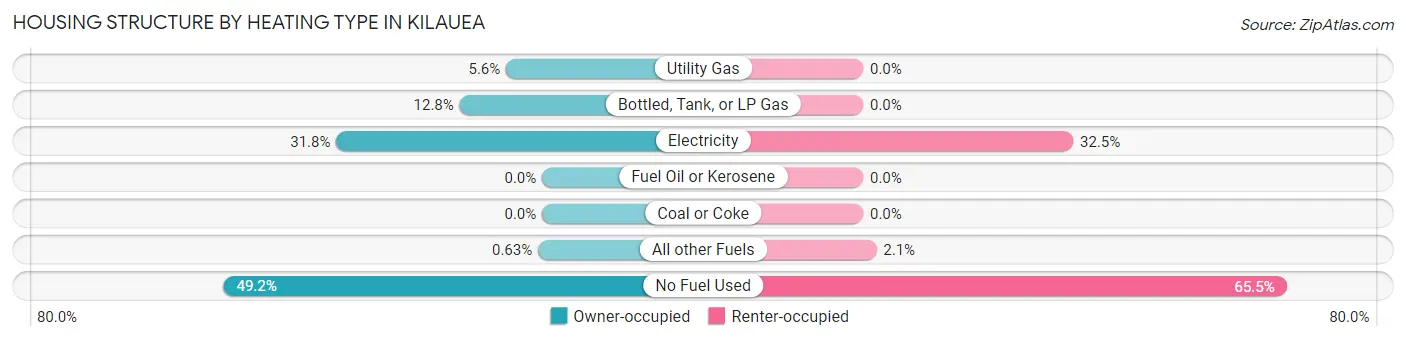
| Heating Type | Owner-occupied | Renter-occupied |
| Utility Gas | 44 (5.6%) | 0 (0.0%) |
| Bottled, Tank, or LP Gas | 101 (12.8%) | 0 (0.0%) |
| Electricity | 252 (31.8%) | 63 (32.5%) |
| Fuel Oil or Kerosene | 0 (0.0%) | 0 (0.0%) |
| Coal or Coke | 0 (0.0%) | 0 (0.0%) |
| All other Fuels | 5 (0.6%) | 4 (2.1%) |
| No Fuel Used | 390 (49.2%) | 127 (65.5%) |
| Total | 792 (100.0%) | 194 (100.0%) |
Household Vehicle Usage in Kilauea
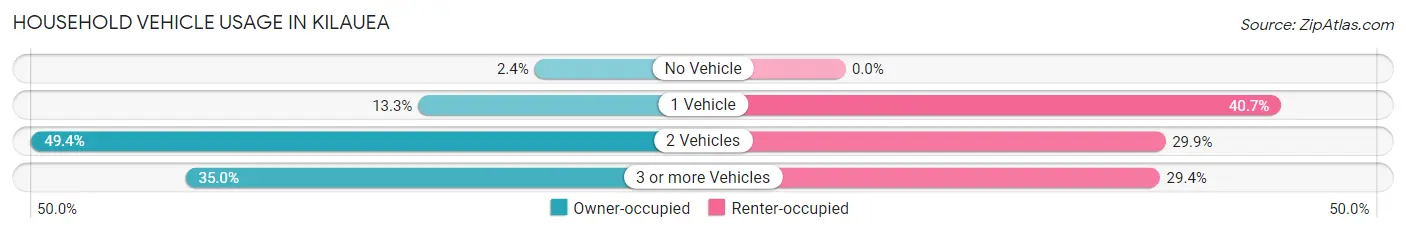
| Vehicles per Household | Owner-occupied | Renter-occupied |
| No Vehicle | 19 (2.4%) | 0 (0.0%) |
| 1 Vehicle | 105 (13.3%) | 79 (40.7%) |
| 2 Vehicles | 391 (49.4%) | 58 (29.9%) |
| 3 or more Vehicles | 277 (35.0%) | 57 (29.4%) |
| Total | 792 (100.0%) | 194 (100.0%) |
Real Estate & Mortgages in Kilauea
Real Estate and Mortgage Overview in Kilauea
| Characteristic | Without Mortgage | With Mortgage |
| Housing Units | 289 | 503 |
| Median Property Value | $1,001,600 | $879,800 |
| Median Household Income | $80,469 | $139 |
| Monthly Housing Costs | $494 | $200 |
| Real Estate Taxes | $2,059 | $0 |
Property Value by Mortgage Status in Kilauea
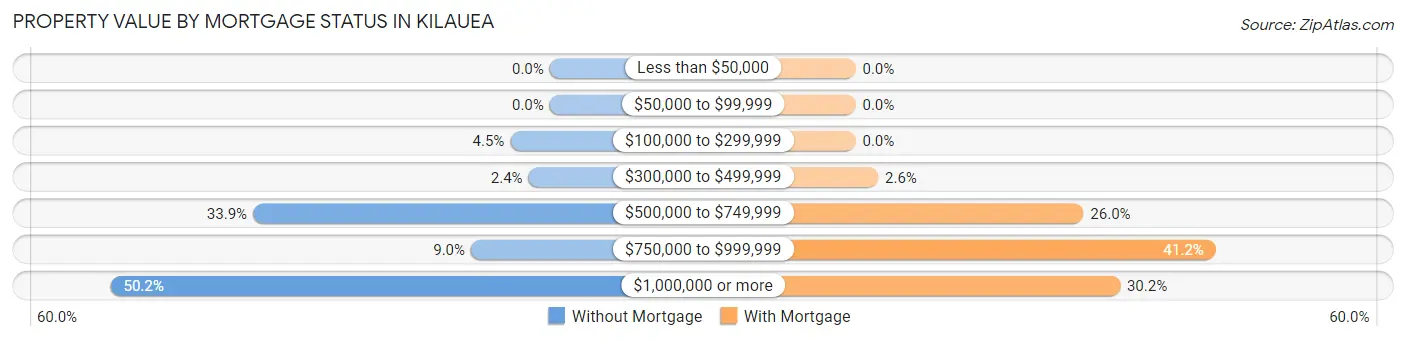
| Property Value | Without Mortgage | With Mortgage |
| Less than $50,000 | 0 (0.0%) | 0 (0.0%) |
| $50,000 to $99,999 | 0 (0.0%) | 0 (0.0%) |
| $100,000 to $299,999 | 13 (4.5%) | 0 (0.0%) |
| $300,000 to $499,999 | 7 (2.4%) | 13 (2.6%) |
| $500,000 to $749,999 | 98 (33.9%) | 131 (26.0%) |
| $750,000 to $999,999 | 26 (9.0%) | 207 (41.1%) |
| $1,000,000 or more | 145 (50.2%) | 152 (30.2%) |
| Total | 289 (100.0%) | 503 (100.0%) |
Household Income by Mortgage Status in Kilauea
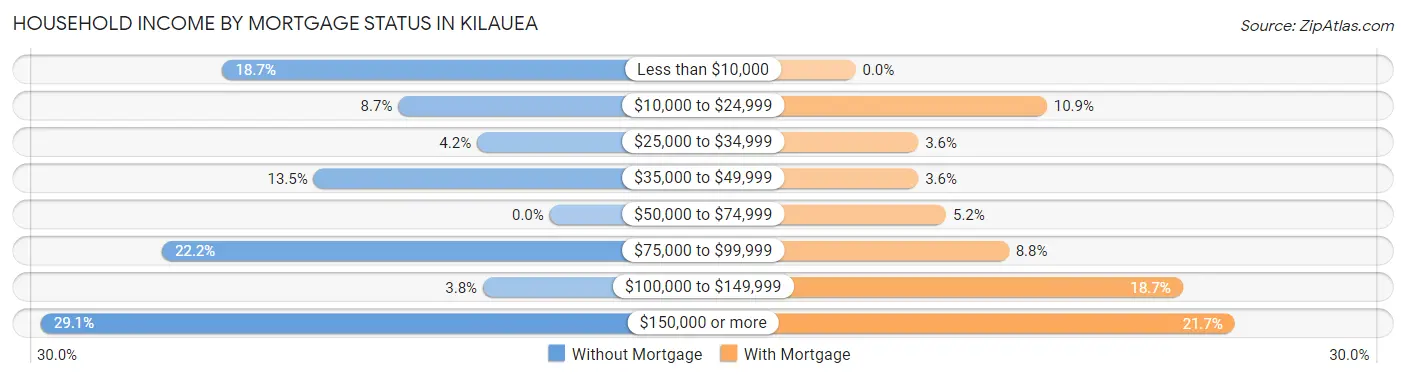
| Household Income | Without Mortgage | With Mortgage |
| Less than $10,000 | 54 (18.7%) | 0 (0.0%) |
| $10,000 to $24,999 | 25 (8.6%) | 55 (10.9%) |
| $25,000 to $34,999 | 12 (4.2%) | 18 (3.6%) |
| $35,000 to $49,999 | 39 (13.5%) | 18 (3.6%) |
| $50,000 to $74,999 | 0 (0.0%) | 26 (5.2%) |
| $75,000 to $99,999 | 64 (22.2%) | 44 (8.7%) |
| $100,000 to $149,999 | 11 (3.8%) | 94 (18.7%) |
| $150,000 or more | 84 (29.1%) | 109 (21.7%) |
| Total | 289 (100.0%) | 503 (100.0%) |
Property Value to Household Income Ratio in Kilauea
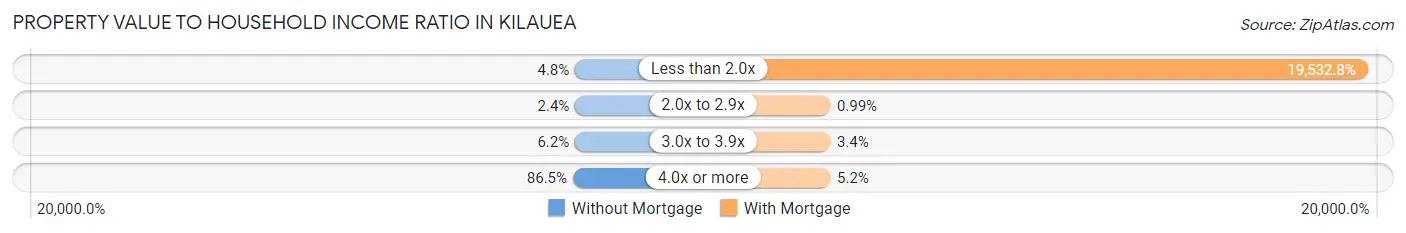
| Value-to-Income Ratio | Without Mortgage | With Mortgage |
| Less than 2.0x | 14 (4.8%) | 98,250 (19,532.8%) |
| 2.0x to 2.9x | 7 (2.4%) | 5 (1.0%) |
| 3.0x to 3.9x | 18 (6.2%) | 17 (3.4%) |
| 4.0x or more | 250 (86.5%) | 26 (5.2%) |
| Total | 289 (100.0%) | 503 (100.0%) |
Real Estate Taxes by Mortgage Status in Kilauea
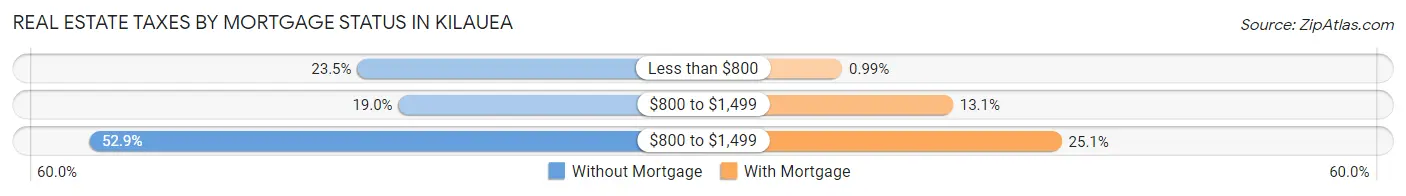
| Property Taxes | Without Mortgage | With Mortgage |
| Less than $800 | 68 (23.5%) | 5 (1.0%) |
| $800 to $1,499 | 55 (19.0%) | 66 (13.1%) |
| $800 to $1,499 | 153 (52.9%) | 126 (25.1%) |
| Total | 289 (100.0%) | 503 (100.0%) |
Health & Disability in Kilauea
Health Insurance Coverage by Age in Kilauea
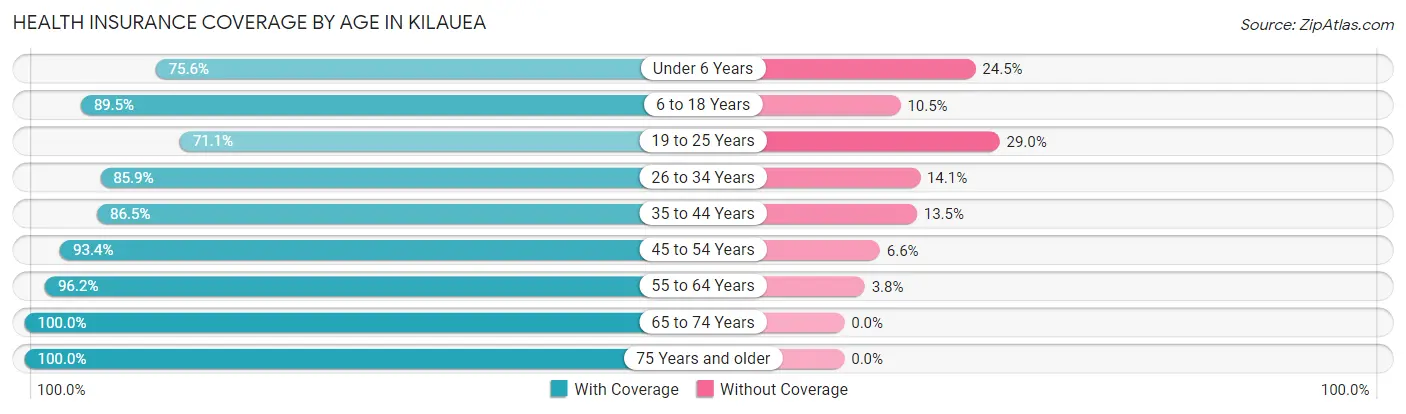
| Age Bracket | With Coverage | Without Coverage |
| Under 6 Years | 173 (75.5%) | 56 (24.4%) |
| 6 to 18 Years | 530 (89.5%) | 62 (10.5%) |
| 19 to 25 Years | 135 (71.1%) | 55 (28.9%) |
| 26 to 34 Years | 286 (85.9%) | 47 (14.1%) |
| 35 to 44 Years | 467 (86.5%) | 73 (13.5%) |
| 45 to 54 Years | 310 (93.4%) | 22 (6.6%) |
| 55 to 64 Years | 404 (96.2%) | 16 (3.8%) |
| 65 to 74 Years | 619 (100.0%) | 0 (0.0%) |
| 75 Years and older | 119 (100.0%) | 0 (0.0%) |
| Total | 3,043 (90.2%) | 331 (9.8%) |
Health Insurance Coverage by Citizenship Status in Kilauea
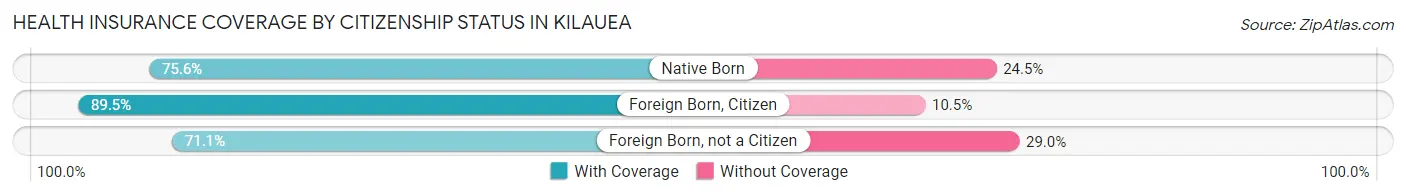
| Citizenship Status | With Coverage | Without Coverage |
| Native Born | 173 (75.5%) | 56 (24.4%) |
| Foreign Born, Citizen | 530 (89.5%) | 62 (10.5%) |
| Foreign Born, not a Citizen | 135 (71.1%) | 55 (28.9%) |
Health Insurance Coverage by Household Income in Kilauea
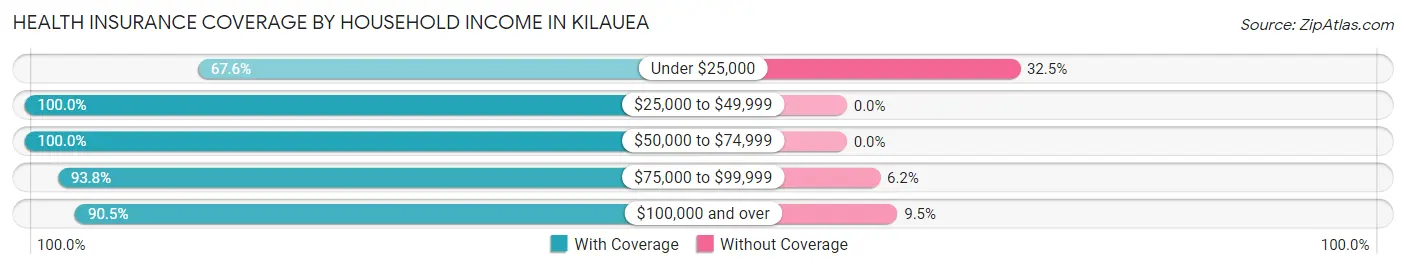
| Household Income | With Coverage | Without Coverage |
| Under $25,000 | 256 (67.5%) | 123 (32.5%) |
| $25,000 to $49,999 | 283 (100.0%) | 0 (0.0%) |
| $50,000 to $74,999 | 261 (100.0%) | 0 (0.0%) |
| $75,000 to $99,999 | 692 (93.8%) | 46 (6.2%) |
| $100,000 and over | 1,551 (90.5%) | 162 (9.5%) |
Public vs Private Health Insurance Coverage by Age in Kilauea
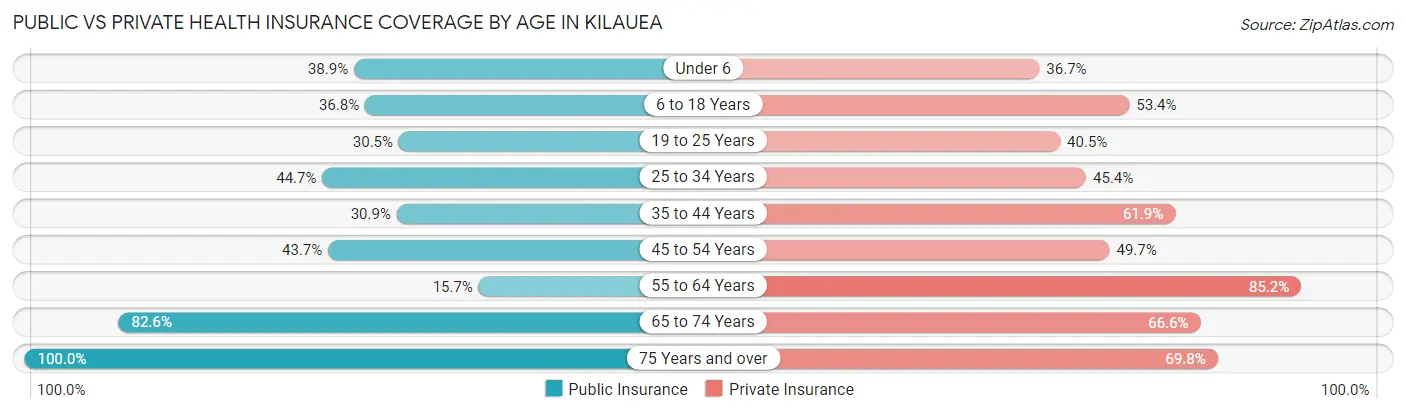
| Age Bracket | Public Insurance | Private Insurance |
| Under 6 | 89 (38.9%) | 84 (36.7%) |
| 6 to 18 Years | 218 (36.8%) | 316 (53.4%) |
| 19 to 25 Years | 58 (30.5%) | 77 (40.5%) |
| 25 to 34 Years | 149 (44.7%) | 151 (45.4%) |
| 35 to 44 Years | 167 (30.9%) | 334 (61.9%) |
| 45 to 54 Years | 145 (43.7%) | 165 (49.7%) |
| 55 to 64 Years | 66 (15.7%) | 358 (85.2%) |
| 65 to 74 Years | 511 (82.6%) | 412 (66.6%) |
| 75 Years and over | 119 (100.0%) | 83 (69.8%) |
| Total | 1,522 (45.1%) | 1,980 (58.7%) |
Disability Status by Sex by Age in Kilauea
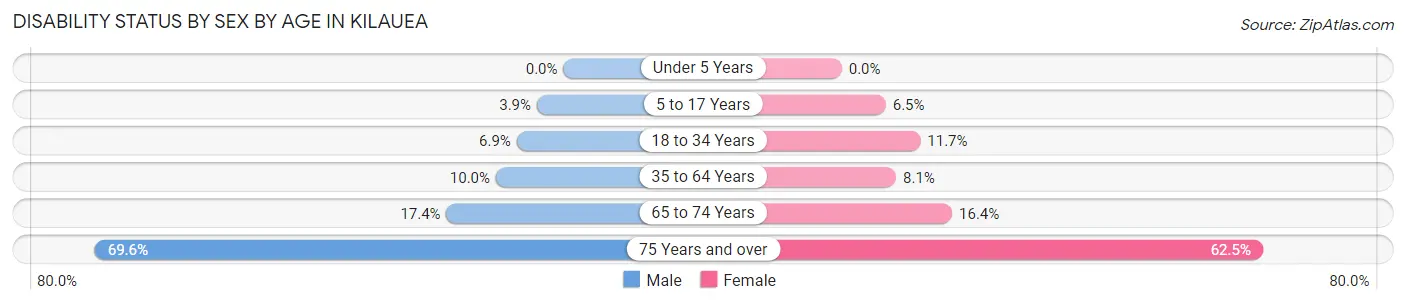
| Age Bracket | Male | Female |
| Under 5 Years | 0 (0.0%) | 0 (0.0%) |
| 5 to 17 Years | 9 (3.9%) | 23 (6.5%) |
| 18 to 34 Years | 23 (6.9%) | 28 (11.7%) |
| 35 to 64 Years | 66 (10.0%) | 51 (8.1%) |
| 65 to 74 Years | 46 (17.4%) | 58 (16.4%) |
| 75 Years and over | 16 (69.6%) | 60 (62.5%) |
Disability Class by Sex by Age in Kilauea
Disability Class: Hearing Difficulty
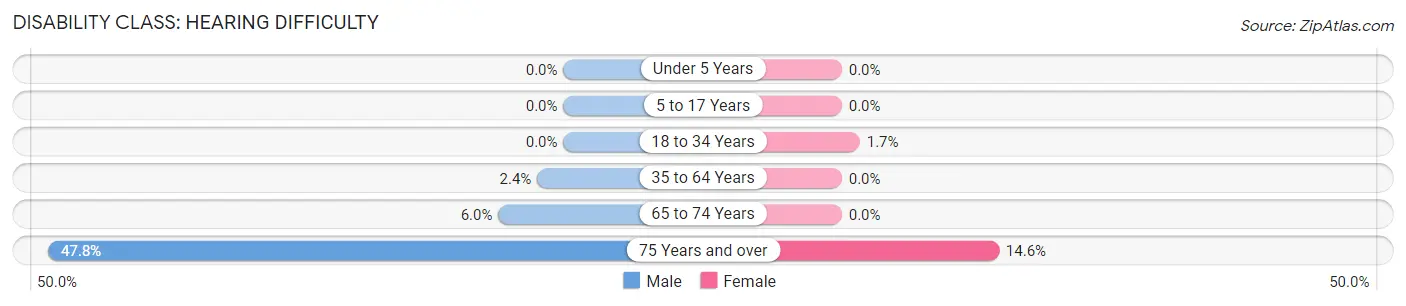
| Age Bracket | Male | Female |
| Under 5 Years | 0 (0.0%) | 0 (0.0%) |
| 5 to 17 Years | 0 (0.0%) | 0 (0.0%) |
| 18 to 34 Years | 0 (0.0%) | 4 (1.7%) |
| 35 to 64 Years | 16 (2.4%) | 0 (0.0%) |
| 65 to 74 Years | 16 (6.0%) | 0 (0.0%) |
| 75 Years and over | 11 (47.8%) | 14 (14.6%) |
Disability Class: Vision Difficulty
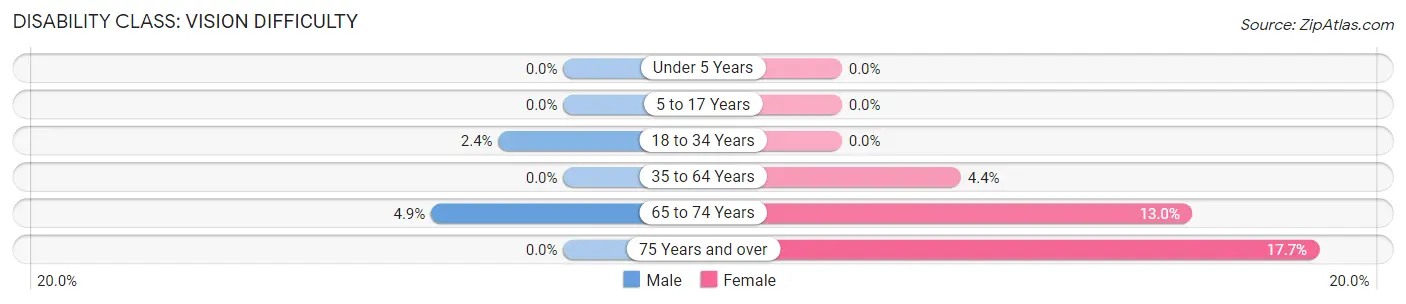
| Age Bracket | Male | Female |
| Under 5 Years | 0 (0.0%) | 0 (0.0%) |
| 5 to 17 Years | 0 (0.0%) | 0 (0.0%) |
| 18 to 34 Years | 8 (2.4%) | 0 (0.0%) |
| 35 to 64 Years | 0 (0.0%) | 28 (4.4%) |
| 65 to 74 Years | 13 (4.9%) | 46 (13.0%) |
| 75 Years and over | 0 (0.0%) | 17 (17.7%) |
Disability Class: Cognitive Difficulty
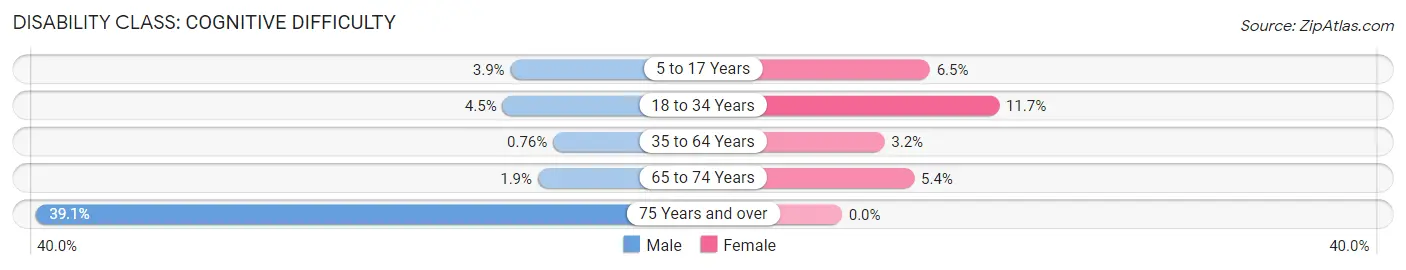
| Age Bracket | Male | Female |
| 5 to 17 Years | 9 (3.9%) | 23 (6.5%) |
| 18 to 34 Years | 15 (4.5%) | 28 (11.7%) |
| 35 to 64 Years | 5 (0.8%) | 20 (3.2%) |
| 65 to 74 Years | 5 (1.9%) | 19 (5.4%) |
| 75 Years and over | 9 (39.1%) | 0 (0.0%) |
Disability Class: Ambulatory Difficulty
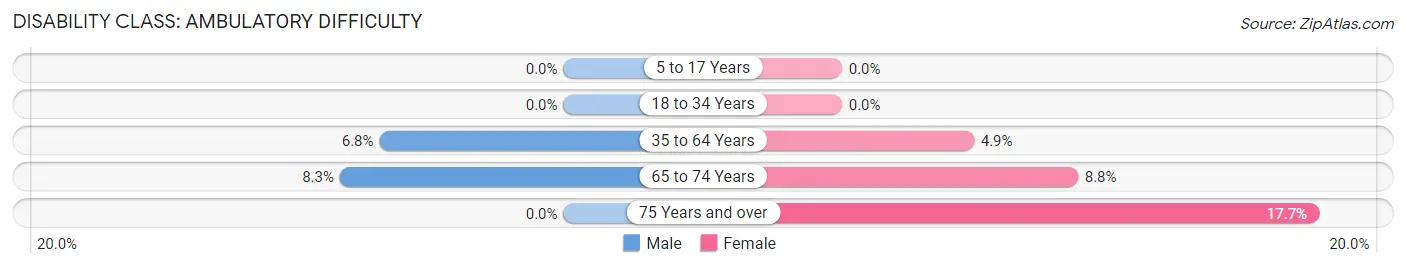
| Age Bracket | Male | Female |
| 5 to 17 Years | 0 (0.0%) | 0 (0.0%) |
| 18 to 34 Years | 0 (0.0%) | 0 (0.0%) |
| 35 to 64 Years | 45 (6.8%) | 31 (4.9%) |
| 65 to 74 Years | 22 (8.3%) | 31 (8.8%) |
| 75 Years and over | 0 (0.0%) | 17 (17.7%) |
Disability Class: Self-Care Difficulty
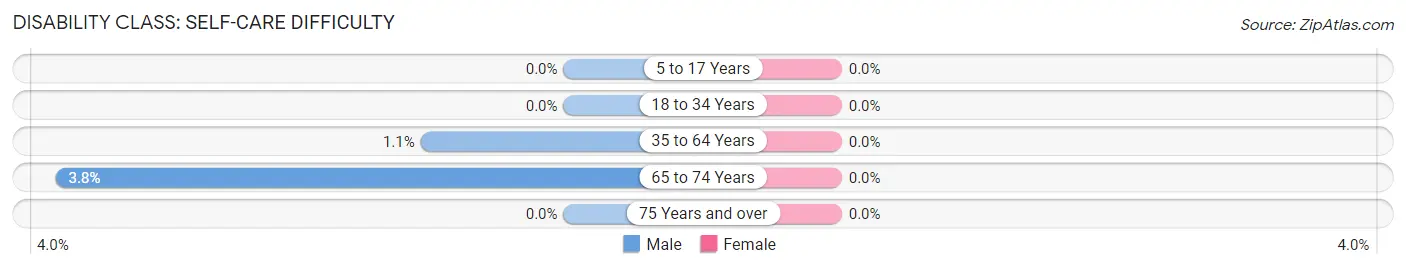
| Age Bracket | Male | Female |
| 5 to 17 Years | 0 (0.0%) | 0 (0.0%) |
| 18 to 34 Years | 0 (0.0%) | 0 (0.0%) |
| 35 to 64 Years | 7 (1.1%) | 0 (0.0%) |
| 65 to 74 Years | 10 (3.8%) | 0 (0.0%) |
| 75 Years and over | 0 (0.0%) | 0 (0.0%) |
Technology Access in Kilauea
Computing Device Access in Kilauea
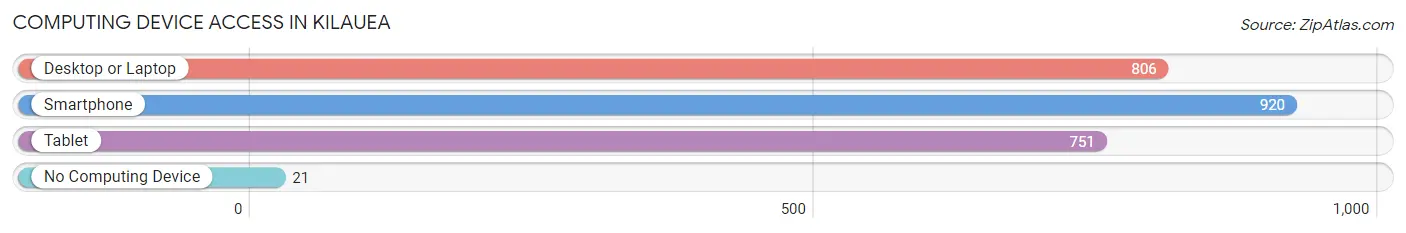
| Device Type | # Households | % Households |
| Desktop or Laptop | 806 | 81.7% |
| Smartphone | 920 | 93.3% |
| Tablet | 751 | 76.2% |
| No Computing Device | 21 | 2.1% |
| Total | 986 | 100.0% |
Internet Access in Kilauea
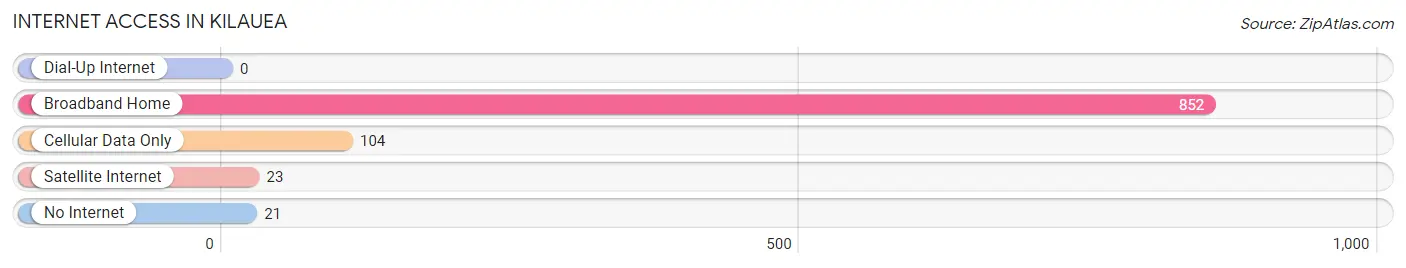
| Internet Type | # Households | % Households |
| Dial-Up Internet | 0 | 0.0% |
| Broadband Home | 852 | 86.4% |
| Cellular Data Only | 104 | 10.5% |
| Satellite Internet | 23 | 2.3% |
| No Internet | 21 | 2.1% |
| Total | 986 | 100.0% |
Kilauea Summary
Kilauea is a small town located on the island of Hawaii in the United States. It is situated on the eastern side of the island, near the town of Volcano. Kilauea is known for its active volcano, which has been erupting since 1983. The town is home to a population of about 2,000 people, and is a popular tourist destination due to its proximity to the volcano and its stunning natural beauty.
History
Kilauea has a long and rich history. The area was first settled by Polynesian settlers in the late 1700s, and the town was officially established in 1820. The town was named after the nearby Kilauea volcano, which has been active since the early 1800s. The town was a major center of the sugar industry in the late 1800s and early 1900s, and the town’s economy was largely based on the production of sugar.
In the early 1900s, the town was devastated by a series of volcanic eruptions, which destroyed much of the town and forced many of its residents to flee. The town was rebuilt in the 1920s, and the economy shifted to tourism and agriculture. The town has remained a popular tourist destination ever since, and the volcano continues to be a major draw for visitors.
Geography
Kilauea is located on the eastern side of the island of Hawaii, near the town of Volcano. The town is situated at an elevation of about 1,000 feet, and is surrounded by lush tropical rainforest. The town is located near the Kilauea volcano, which is one of the most active volcanoes in the world. The volcano is located within the Hawaii Volcanoes National Park, and is a popular tourist destination.
The town is located near the Pacific Ocean, and is known for its stunning beaches and ocean views. The town is also home to a number of waterfalls, including the popular Akaka Falls. The town is also home to a number of hiking trails, which offer stunning views of the surrounding landscape.
Economy
Kilauea’s economy is largely based on tourism and agriculture. The town is a popular tourist destination due to its proximity to the Kilauea volcano and its stunning natural beauty. The town is also home to a number of hotels, restaurants, and other tourist-oriented businesses. The town is also home to a number of agricultural businesses, including coffee and macadamia nut farms.
Demographics
As of the 2010 census, the population of Kilauea was 2,084. The town is predominantly white, with about 75% of the population identifying as white. The town is also home to a small Native Hawaiian population, with about 8% of the population identifying as Native Hawaiian. The town is also home to a small Asian population, with about 4% of the population identifying as Asian. The town is also home to a small Hispanic population, with about 3% of the population identifying as Hispanic. The median household income in Kilauea is $50,000, and the median home value is $400,000.
Common Questions
What is Per Capita Income in Kilauea?
Per Capita income in Kilauea is $37,756.
What is the Median Family Income in Kilauea?
Median Family Income in Kilauea is $84,542.
What is the Median Household income in Kilauea?
Median Household Income in Kilauea is $85,227.
What is Income or Wage Gap in Kilauea?
Income or Wage Gap in Kilauea is 17.8%.
Women in Kilauea earn 82.2 cents for every dollar earned by a man.
What is Inequality or Gini Index in Kilauea?
Inequality or Gini Index in Kilauea is 0.49.
What is the Total Population of Kilauea?
Total Population of Kilauea is 3,386.
What is the Total Male Population of Kilauea?
Total Male Population of Kilauea is 1,591.
What is the Total Female Population of Kilauea?
Total Female Population of Kilauea is 1,795.
What is the Ratio of Males per 100 Females in Kilauea?
There are 88.64 Males per 100 Females in Kilauea.
What is the Ratio of Females per 100 Males in Kilauea?
There are 112.82 Females per 100 Males in Kilauea.
What is the Median Population Age in Kilauea?
Median Population Age in Kilauea is 40.2 Years.
What is the Average Family Size in Kilauea
Average Family Size in Kilauea is 3.5 People.
What is the Average Household Size in Kilauea
Average Household Size in Kilauea is 3.4 People.
How Large is the Labor Force in Kilauea?
There are 1,742 People in the Labor Forcein in Kilauea.
What is the Percentage of People in the Labor Force in Kilauea?
65.3% of People are in the Labor Force in Kilauea.
What is the Unemployment Rate in Kilauea?
Unemployment Rate in Kilauea is 4.1%.