Germantown, TN Map & Demographics
Germantown Map
Germantown Overview
$71,070
PER CAPITA INCOME
$163,424
AVG FAMILY INCOME
$140,429
AVG HOUSEHOLD INCOME
40.0%
WAGE / INCOME GAP [ % ]
60.0¢/ $1
WAGE / INCOME GAP [ $ ]
$13,396
FAMILY INCOME DEFICIT
0.45
INEQUALITY / GINI INDEX
41,094
TOTAL POPULATION
20,172
MALE POPULATION
20,922
FEMALE POPULATION
96.42
MALES / 100 FEMALES
103.72
FEMALES / 100 MALES
43.5
MEDIAN AGE
3.1
AVG FAMILY SIZE
2.7
AVG HOUSEHOLD SIZE
19,541
LABOR FORCE [ PEOPLE ]
61.8%
PERCENT IN LABOR FORCE
2.8%
UNEMPLOYMENT RATE
Germantown Area Codes
Income in Germantown
Income Overview in Germantown
Per Capita Income in Germantown is $71,070, while median incomes of families and households are $163,424 and $140,429 respectively.
| Characteristic | Number | Measure |
| Per Capita Income | 41,094 | $71,070 |
| Median Family Income | 11,723 | $163,424 |
| Mean Family Income | 11,723 | $220,588 |
| Median Household Income | 15,376 | $140,429 |
| Mean Household Income | 15,376 | $189,087 |
| Income Deficit | 11,723 | $13,396 |
| Wage / Income Gap (%) | 41,094 | 39.98% |
| Wage / Income Gap ($) | 41,094 | 60.02¢ per $1 |
| Gini / Inequality Index | 41,094 | 0.45 |
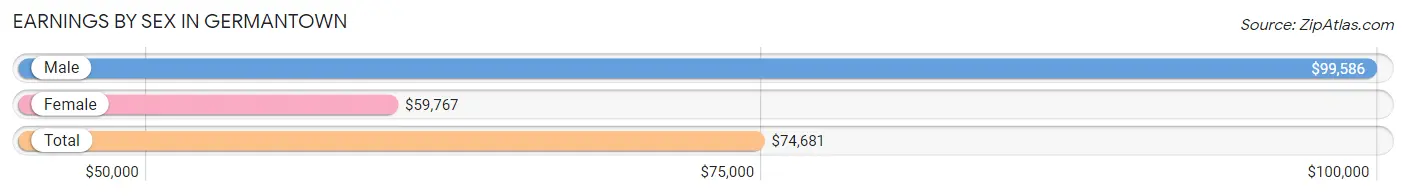
Earnings by Sex in Germantown
Average Earnings in Germantown are $74,681, $99,586 for men and $59,767 for women, a difference of 40.0%.
| Sex | Number | Average Earnings |
| Male | 11,442 (56.3%) | $99,586 |
| Female | 8,884 (43.7%) | $59,767 |
| Total | 20,326 (100.0%) | $74,681 |
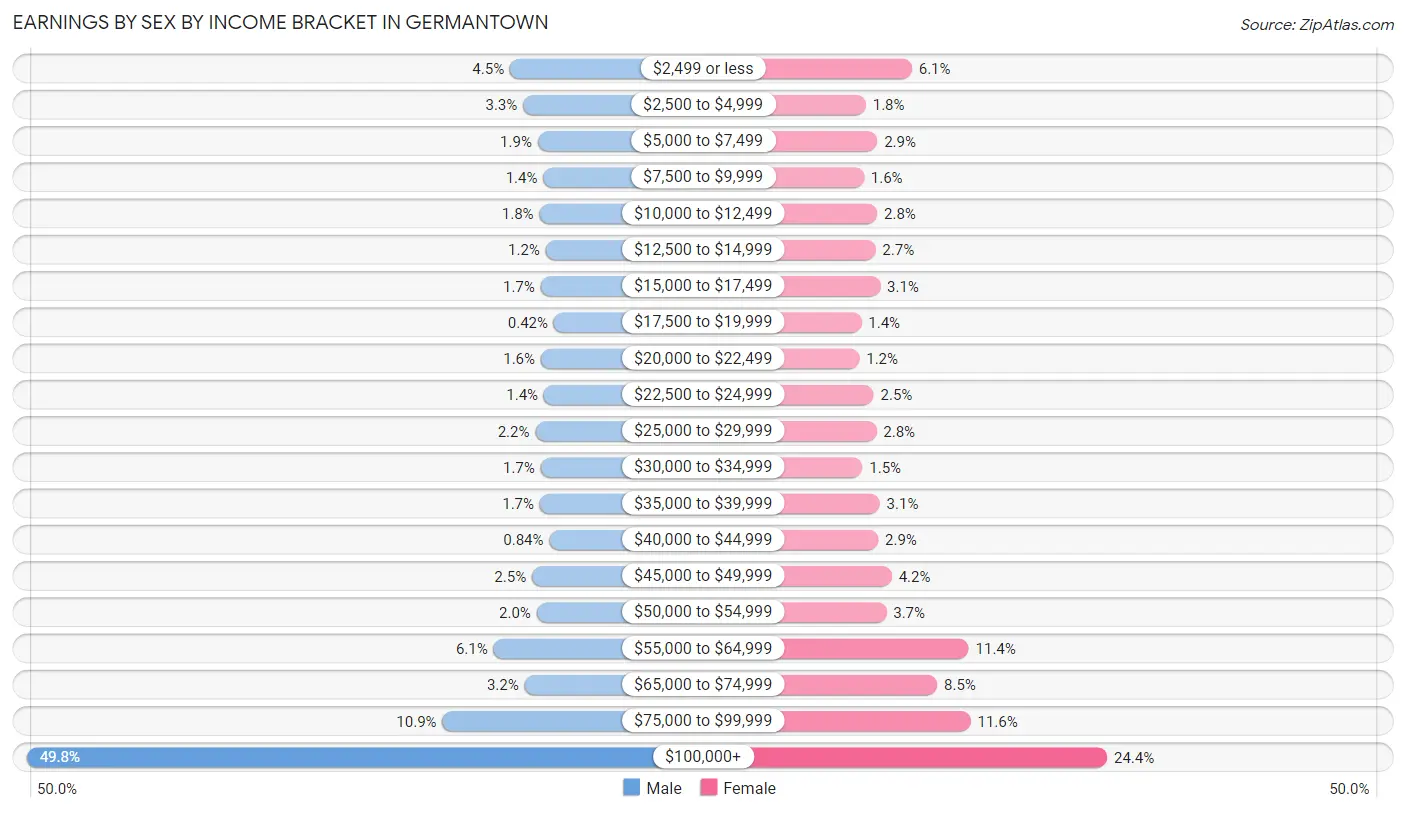
Earnings by Sex by Income Bracket in Germantown
The most common earnings brackets in Germantown are $100,000+ for men (5,698 | 49.8%) and $100,000+ for women (2,166 | 24.4%).
| Income | Male | Female |
| $2,499 or less | 518 (4.5%) | 541 (6.1%) |
| $2,500 to $4,999 | 378 (3.3%) | 158 (1.8%) |
| $5,000 to $7,499 | 221 (1.9%) | 253 (2.9%) |
| $7,500 to $9,999 | 161 (1.4%) | 142 (1.6%) |
| $10,000 to $12,499 | 202 (1.8%) | 252 (2.8%) |
| $12,500 to $14,999 | 136 (1.2%) | 238 (2.7%) |
| $15,000 to $17,499 | 190 (1.7%) | 277 (3.1%) |
| $17,500 to $19,999 | 48 (0.4%) | 121 (1.4%) |
| $20,000 to $22,499 | 188 (1.6%) | 104 (1.2%) |
| $22,500 to $24,999 | 155 (1.3%) | 223 (2.5%) |
| $25,000 to $29,999 | 247 (2.2%) | 246 (2.8%) |
| $30,000 to $34,999 | 190 (1.7%) | 130 (1.5%) |
| $35,000 to $39,999 | 198 (1.7%) | 274 (3.1%) |
| $40,000 to $44,999 | 96 (0.8%) | 260 (2.9%) |
| $45,000 to $49,999 | 283 (2.5%) | 374 (4.2%) |
| $50,000 to $54,999 | 232 (2.0%) | 329 (3.7%) |
| $55,000 to $64,999 | 695 (6.1%) | 1,014 (11.4%) |
| $65,000 to $74,999 | 363 (3.2%) | 752 (8.5%) |
| $75,000 to $99,999 | 1,243 (10.9%) | 1,030 (11.6%) |
| $100,000+ | 5,698 (49.8%) | 2,166 (24.4%) |
| Total | 11,442 (100.0%) | 8,884 (100.0%) |
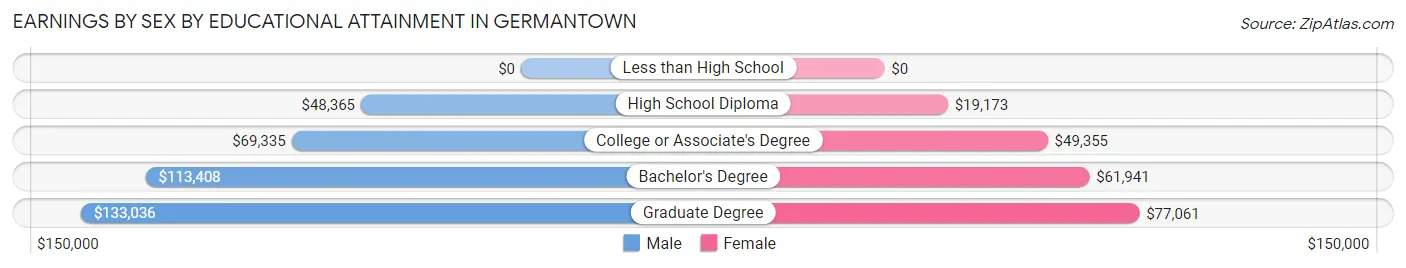
Earnings by Sex by Educational Attainment in Germantown
Average earnings in Germantown are $108,772 for men and $63,383 for women, a difference of 41.7%. Men with an educational attainment of graduate degree enjoy the highest average annual earnings of $133,036, while those with high school diploma education earn the least with $48,365. Women with an educational attainment of graduate degree earn the most with the average annual earnings of $77,061, while those with high school diploma education have the smallest earnings of $19,173.
| Educational Attainment | Male Income | Female Income |
| Less than High School | - | - |
| High School Diploma | $48,365 | $19,173 |
| College or Associate's Degree | $69,335 | $49,355 |
| Bachelor's Degree | $113,408 | $61,941 |
| Graduate Degree | $133,036 | $77,061 |
| Total | $108,772 | $63,383 |
Family Income in Germantown
Family Income Brackets in Germantown
According to the Germantown family income data, there are 4,584 families falling into the $200,000+ income range, which is the most common income bracket and makes up 39.1% of all families. Conversely, the $10,000 to $14,999 income bracket is the least frequent group with only 23 families (0.2%) belonging to this category.
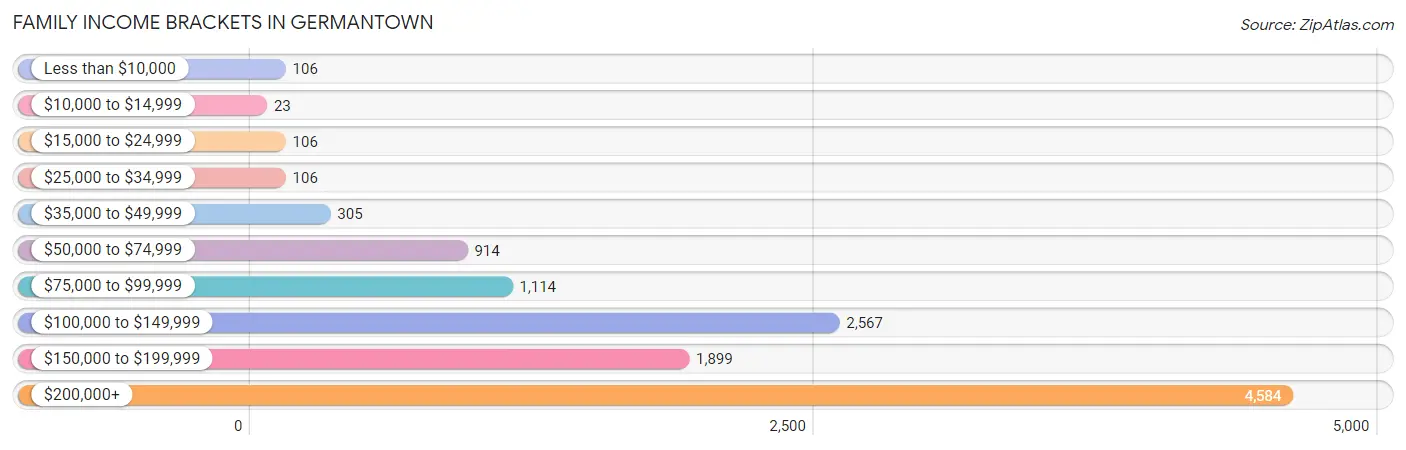
| Income Bracket | # Families | % Families |
| Less than $10,000 | 106 | 0.9% |
| $10,000 to $14,999 | 23 | 0.2% |
| $15,000 to $24,999 | 106 | 0.9% |
| $25,000 to $34,999 | 106 | 0.9% |
| $35,000 to $49,999 | 305 | 2.6% |
| $50,000 to $74,999 | 914 | 7.8% |
| $75,000 to $99,999 | 1,114 | 9.5% |
| $100,000 to $149,999 | 2,567 | 21.9% |
| $150,000 to $199,999 | 1,899 | 16.2% |
| $200,000+ | 4,584 | 39.1% |
Family Income by Famaliy Size in Germantown
4-person families (2,583 | 22.0%) account for the highest median family income in Germantown with $195,716 per family, while 2-person families (5,330 | 45.5%) have the highest median income of $74,231 per family member.
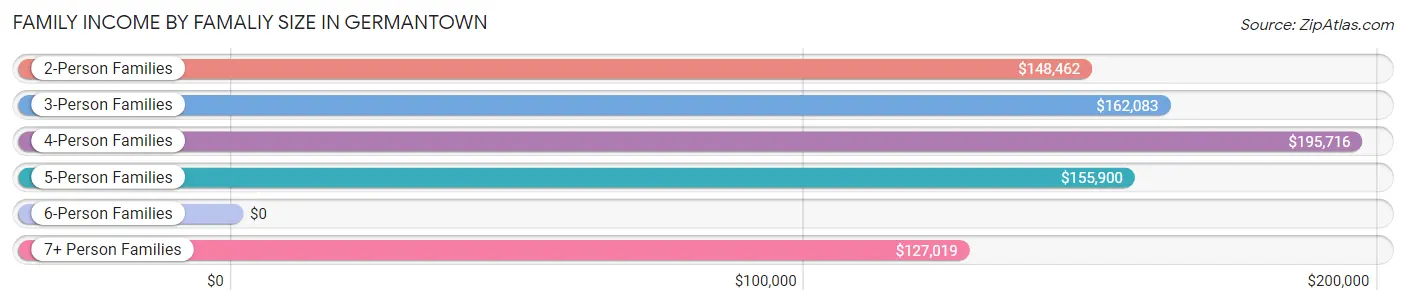
| Income Bracket | # Families | Median Income |
| 2-Person Families | 5,330 (45.5%) | $148,462 |
| 3-Person Families | 2,464 (21.0%) | $162,083 |
| 4-Person Families | 2,583 (22.0%) | $195,716 |
| 5-Person Families | 862 (7.3%) | $155,900 |
| 6-Person Families | 321 (2.7%) | $0 |
| 7+ Person Families | 163 (1.4%) | $127,019 |
| Total | 11,723 (100.0%) | $163,424 |
Family Income by Number of Earners in Germantown
The median family income in Germantown is $163,424, with families comprising 2 earners (5,534) having the highest median family income of $191,129, while families with no earners (1,486) have the lowest median family income of $93,628, accounting for 47.2% and 12.7% of families, respectively.
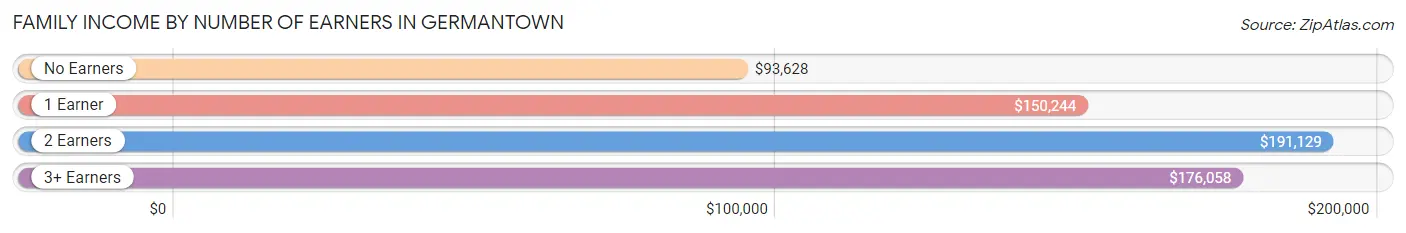
| Number of Earners | # Families | Median Income |
| No Earners | 1,486 (12.7%) | $93,628 |
| 1 Earner | 3,706 (31.6%) | $150,244 |
| 2 Earners | 5,534 (47.2%) | $191,129 |
| 3+ Earners | 997 (8.5%) | $176,058 |
| Total | 11,723 (100.0%) | $163,424 |
Household Income in Germantown
Household Income Brackets in Germantown
With 4,736 households falling in the category, the $200,000+ income range is the most frequent in Germantown, accounting for 30.8% of all households. In contrast, only 231 households (1.5%) fall into the less than $10,000 income bracket, making it the least populous group.
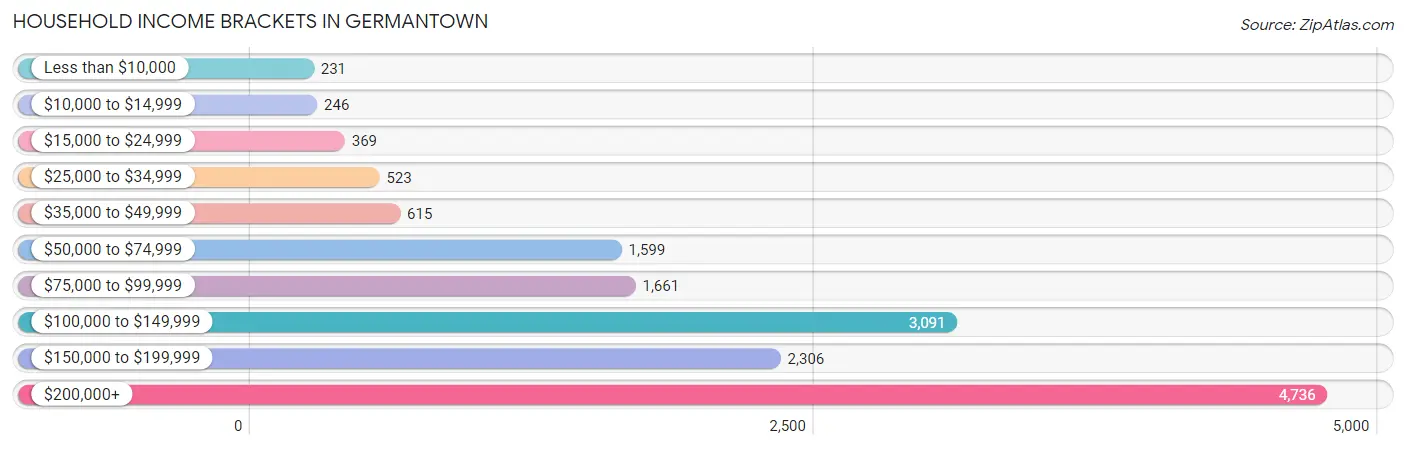
| Income Bracket | # Households | % Households |
| Less than $10,000 | 231 | 1.5% |
| $10,000 to $14,999 | 246 | 1.6% |
| $15,000 to $24,999 | 369 | 2.4% |
| $25,000 to $34,999 | 523 | 3.4% |
| $35,000 to $49,999 | 615 | 4.0% |
| $50,000 to $74,999 | 1,599 | 10.4% |
| $75,000 to $99,999 | 1,661 | 10.8% |
| $100,000 to $149,999 | 3,091 | 20.1% |
| $150,000 to $199,999 | 2,306 | 15.0% |
| $200,000+ | 4,736 | 30.8% |
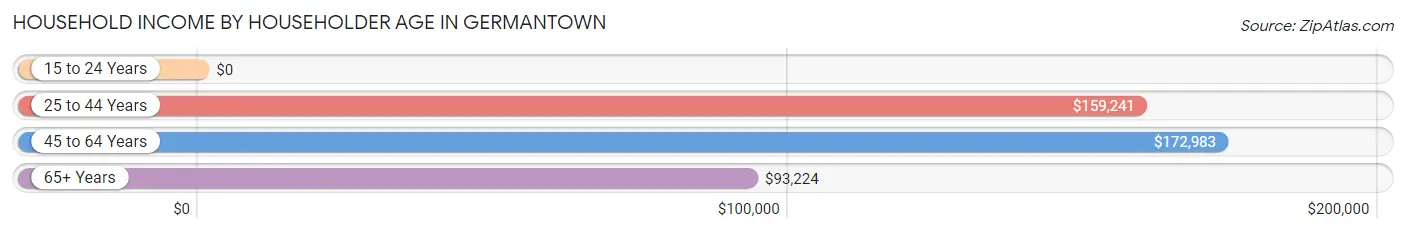
Household Income by Householder Age in Germantown
The median household income in Germantown is $140,429, with the highest median household income of $172,983 found in the 45 to 64 years age bracket for the primary householder. A total of 5,549 households (36.1%) fall into this category. Meanwhile, the 15 to 24 years age bracket for the primary householder has the lowest median household income of $0, with 78 households (0.5%) in this group.
| Income Bracket | # Households | Median Income |
| 15 to 24 Years | 78 (0.5%) | $0 |
| 25 to 44 Years | 3,913 (25.5%) | $159,241 |
| 45 to 64 Years | 5,549 (36.1%) | $172,983 |
| 65+ Years | 5,836 (38.0%) | $93,224 |
| Total | 15,376 (100.0%) | $140,429 |
Poverty in Germantown
Income Below Poverty by Sex and Age in Germantown
With 1.4% poverty level for males and 3.3% for females among the residents of Germantown, 25 to 34 year old males and 15 year old females are the most vulnerable to poverty, with 65 males (5.1%) and 40 females (21.9%) in their respective age groups living below the poverty level.
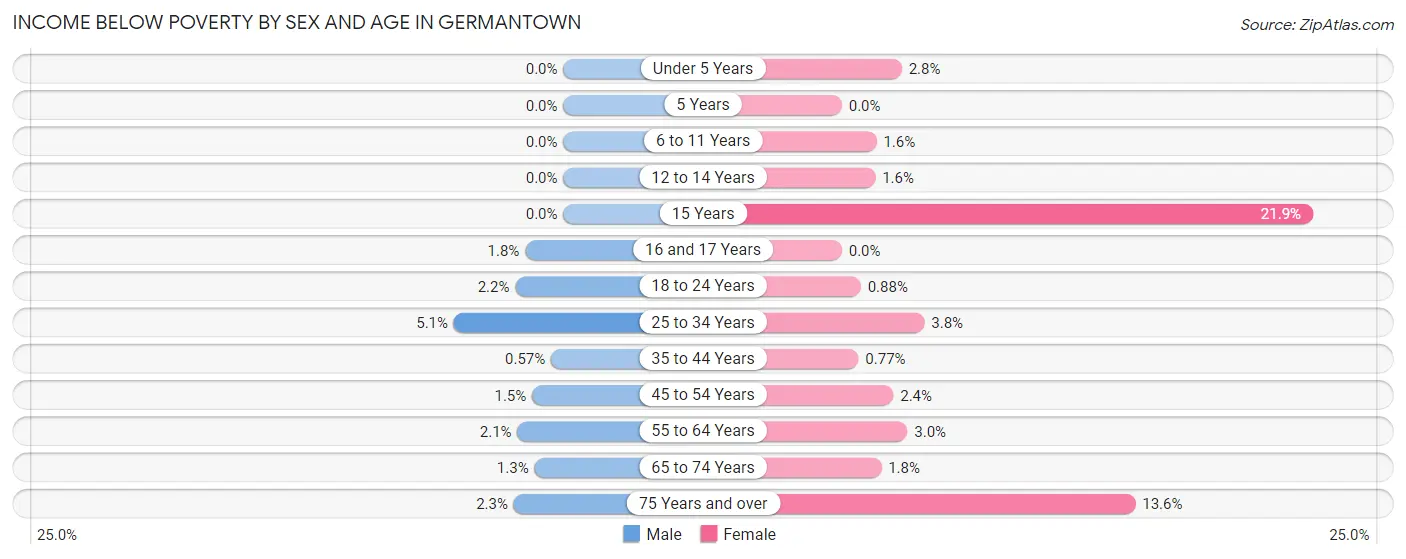
| Age Bracket | Male | Female |
| Under 5 Years | 0 (0.0%) | 40 (2.8%) |
| 5 Years | 0 (0.0%) | 0 (0.0%) |
| 6 to 11 Years | 0 (0.0%) | 33 (1.6%) |
| 12 to 14 Years | 0 (0.0%) | 12 (1.5%) |
| 15 Years | 0 (0.0%) | 40 (21.9%) |
| 16 and 17 Years | 14 (1.8%) | 0 (0.0%) |
| 18 to 24 Years | 28 (2.2%) | 6 (0.9%) |
| 25 to 34 Years | 65 (5.1%) | 54 (3.8%) |
| 35 to 44 Years | 15 (0.6%) | 26 (0.8%) |
| 45 to 54 Years | 40 (1.5%) | 60 (2.4%) |
| 55 to 64 Years | 52 (2.1%) | 66 (3.0%) |
| 65 to 74 Years | 32 (1.3%) | 50 (1.8%) |
| 75 Years and over | 44 (2.3%) | 303 (13.6%) |
| Total | 290 (1.4%) | 690 (3.3%) |
Income Above Poverty by Sex and Age in Germantown
According to the poverty statistics in Germantown, males aged under 5 years and females aged 5 years are the age groups that are most secure financially, with 100.0% of males and 100.0% of females in these age groups living above the poverty line.
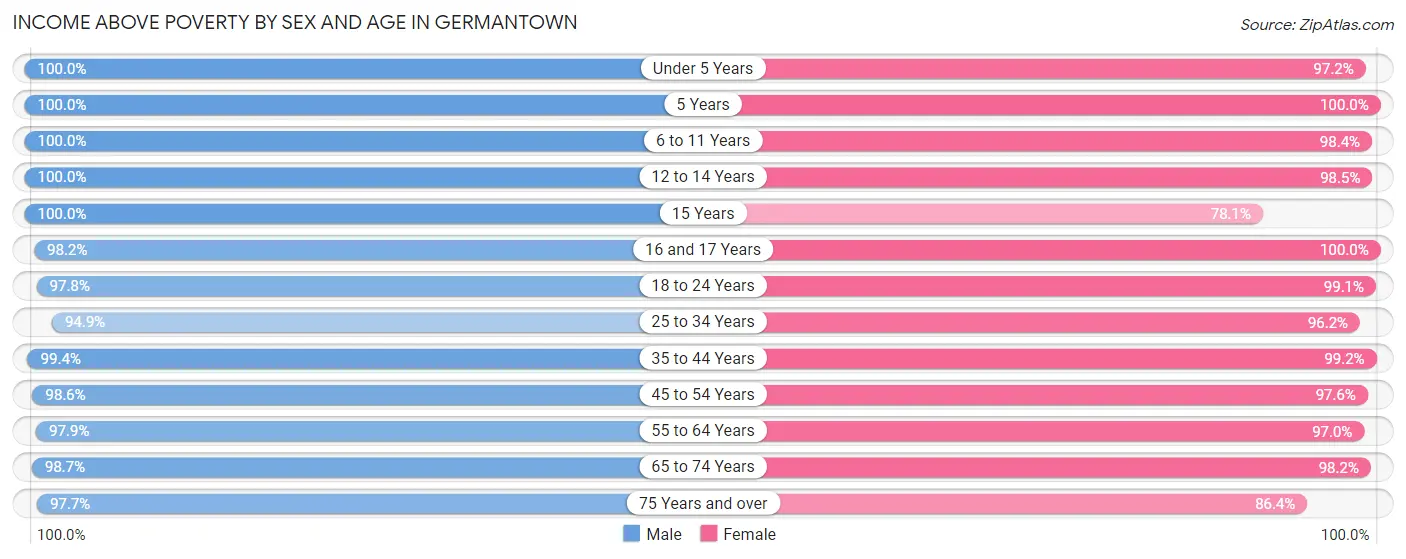
| Age Bracket | Male | Female |
| Under 5 Years | 1,051 (100.0%) | 1,398 (97.2%) |
| 5 Years | 405 (100.0%) | 341 (100.0%) |
| 6 to 11 Years | 1,969 (100.0%) | 2,018 (98.4%) |
| 12 to 14 Years | 991 (100.0%) | 764 (98.5%) |
| 15 Years | 235 (100.0%) | 143 (78.1%) |
| 16 and 17 Years | 779 (98.2%) | 912 (100.0%) |
| 18 to 24 Years | 1,229 (97.8%) | 673 (99.1%) |
| 25 to 34 Years | 1,215 (94.9%) | 1,357 (96.2%) |
| 35 to 44 Years | 2,623 (99.4%) | 3,338 (99.2%) |
| 45 to 54 Years | 2,724 (98.6%) | 2,449 (97.6%) |
| 55 to 64 Years | 2,389 (97.9%) | 2,102 (97.0%) |
| 65 to 74 Years | 2,363 (98.7%) | 2,685 (98.2%) |
| 75 Years and over | 1,872 (97.7%) | 1,921 (86.4%) |
| Total | 19,845 (98.6%) | 20,101 (96.7%) |
Income Below Poverty Among Married-Couple Families in Germantown
The poverty statistics for married-couple families in Germantown show that 1.0% or 106 of the total 10,606 families live below the poverty line. Families with 1 or 2 children have the highest poverty rate of 1.4%, comprising of 53 families. On the other hand, families with 3 or 4 children have the lowest poverty rate of 0.0%, which includes 0 families.
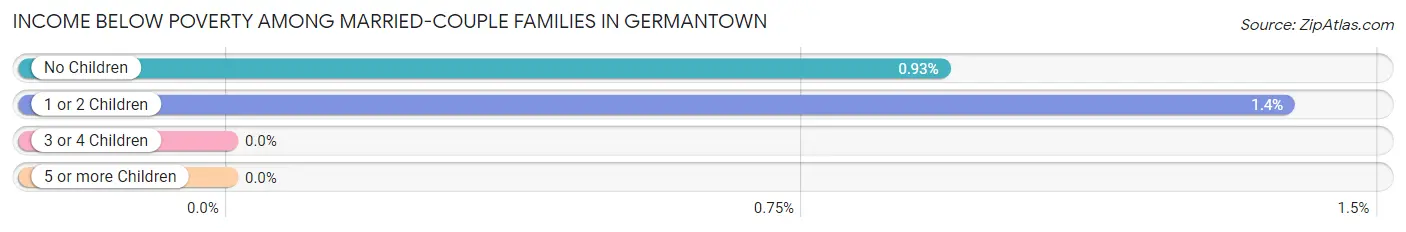
| Children | Above Poverty | Below Poverty |
| No Children | 5,669 (99.1%) | 53 (0.9%) |
| 1 or 2 Children | 3,774 (98.6%) | 53 (1.4%) |
| 3 or 4 Children | 986 (100.0%) | 0 (0.0%) |
| 5 or more Children | 71 (100.0%) | 0 (0.0%) |
| Total | 10,500 (99.0%) | 106 (1.0%) |
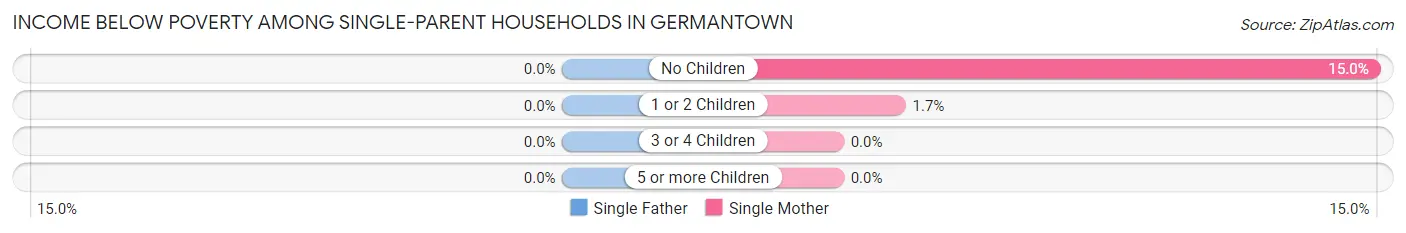
Income Below Poverty Among Single-Parent Households in Germantown
| Children | Single Father | Single Mother |
| No Children | 0 (0.0%) | 45 (15.0%) |
| 1 or 2 Children | 0 (0.0%) | 8 (1.7%) |
| 3 or 4 Children | 0 (0.0%) | 0 (0.0%) |
| 5 or more Children | 0 (0.0%) | 0 (0.0%) |
| Total | 0 (0.0%) | 53 (6.8%) |
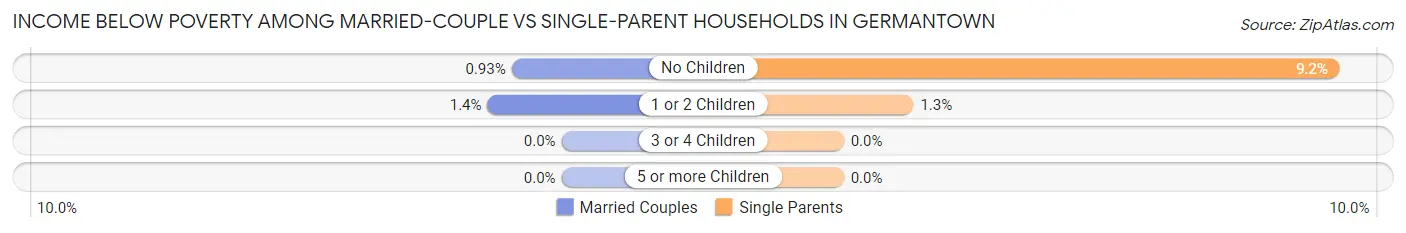
Income Below Poverty Among Married-Couple vs Single-Parent Households in Germantown
The poverty data for Germantown shows that 106 of the married-couple family households (1.0%) and 53 of the single-parent households (4.7%) are living below the poverty level. Within the married-couple family households, those with 1 or 2 children have the highest poverty rate, with 53 households (1.4%) falling below the poverty line. Among the single-parent households, those with no children have the highest poverty rate, with 45 household (9.2%) living below poverty.
| Children | Married-Couple Families | Single-Parent Households |
| No Children | 53 (0.9%) | 45 (9.2%) |
| 1 or 2 Children | 53 (1.4%) | 8 (1.3%) |
| 3 or 4 Children | 0 (0.0%) | 0 (0.0%) |
| 5 or more Children | 0 (0.0%) | 0 (0.0%) |
| Total | 106 (1.0%) | 53 (4.7%) |
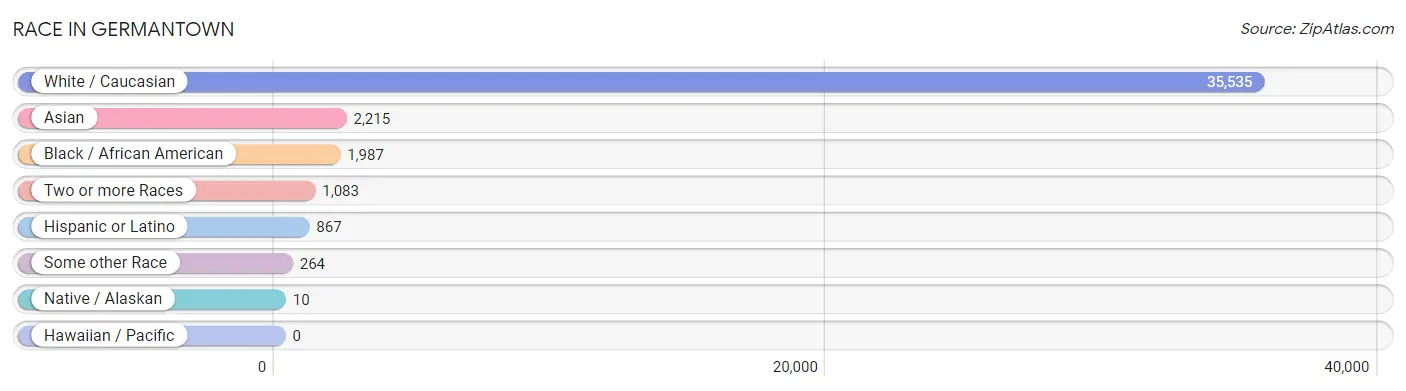
Race in Germantown
The most populous races in Germantown are White / Caucasian (35,535 | 86.5%), Asian (2,215 | 5.4%), and Black / African American (1,987 | 4.8%).
| Race | # Population | % Population |
| Asian | 2,215 | 5.4% |
| Black / African American | 1,987 | 4.8% |
| Hawaiian / Pacific | 0 | 0.0% |
| Hispanic or Latino | 867 | 2.1% |
| Native / Alaskan | 10 | 0.0% |
| White / Caucasian | 35,535 | 86.5% |
| Two or more Races | 1,083 | 2.6% |
| Some other Race | 264 | 0.6% |
| Total | 41,094 | 100.0% |
Ancestry in Germantown
The most populous ancestries reported in Germantown are American (7,888 | 19.2%), English (6,753 | 16.4%), German (4,292 | 10.4%), Irish (3,861 | 9.4%), and Italian (2,563 | 6.2%), together accounting for 61.7% of all Germantown residents.

| Ancestry | # Population | % Population |
| African | 17 | 0.0% |
| Albanian | 11 | 0.0% |
| American | 7,888 | 19.2% |
| Apache | 2 | 0.0% |
| Arab | 772 | 1.9% |
| Argentinean | 26 | 0.1% |
| Armenian | 16 | 0.0% |
| Austrian | 94 | 0.2% |
| Basque | 24 | 0.1% |
| Belgian | 92 | 0.2% |
| Bhutanese | 34 | 0.1% |
| Brazilian | 42 | 0.1% |
| British | 341 | 0.8% |
| Burmese | 327 | 0.8% |
| Cajun | 37 | 0.1% |
| Canadian | 223 | 0.5% |
| Central American | 53 | 0.1% |
| Central American Indian | 10 | 0.0% |
| Cherokee | 23 | 0.1% |
| Chickasaw | 1 | 0.0% |
| Choctaw | 16 | 0.0% |
| Colombian | 80 | 0.2% |
| Costa Rican | 8 | 0.0% |
| Croatian | 299 | 0.7% |
| Cuban | 62 | 0.2% |
| Czech | 109 | 0.3% |
| Czechoslovakian | 10 | 0.0% |
| Danish | 187 | 0.5% |
| Dutch | 300 | 0.7% |
| Eastern European | 165 | 0.4% |
| Egyptian | 25 | 0.1% |
| English | 6,753 | 16.4% |
| Ethiopian | 118 | 0.3% |
| European | 987 | 2.4% |
| Filipino | 70 | 0.2% |
| Finnish | 156 | 0.4% |
| French | 764 | 1.9% |
| French Canadian | 33 | 0.1% |
| German | 4,292 | 10.4% |
| Greek | 245 | 0.6% |
| Guatemalan | 10 | 0.0% |
| Honduran | 14 | 0.0% |
| Hungarian | 104 | 0.3% |
| Indian (Asian) | 750 | 1.8% |
| Indonesian | 27 | 0.1% |
| Iranian | 41 | 0.1% |
| Irish | 3,861 | 9.4% |
| Italian | 2,563 | 6.2% |
| Jamaican | 66 | 0.2% |
| Jordanian | 19 | 0.1% |
| Korean | 94 | 0.2% |
| Lebanese | 277 | 0.7% |
| Lithuanian | 89 | 0.2% |
| Mexican | 412 | 1.0% |
| Mongolian | 16 | 0.0% |
| Moroccan | 14 | 0.0% |
| Nigerian | 22 | 0.1% |
| Northern European | 61 | 0.2% |
| Norwegian | 436 | 1.1% |
| Pakistani | 73 | 0.2% |
| Palestinian | 266 | 0.6% |
| Panamanian | 18 | 0.0% |
| Polish | 1,098 | 2.7% |
| Portuguese | 16 | 0.0% |
| Puerto Rican | 136 | 0.3% |
| Romanian | 53 | 0.1% |
| Russian | 280 | 0.7% |
| Salvadoran | 3 | 0.0% |
| Scandinavian | 200 | 0.5% |
| Scotch-Irish | 884 | 2.1% |
| Scottish | 1,090 | 2.6% |
| Slovak | 18 | 0.0% |
| Slovene | 11 | 0.0% |
| Somali | 95 | 0.2% |
| South American | 162 | 0.4% |
| Spaniard | 15 | 0.0% |
| Sri Lankan | 175 | 0.4% |
| Subsaharan African | 252 | 0.6% |
| Swedish | 225 | 0.5% |
| Swiss | 104 | 0.3% |
| Syrian | 121 | 0.3% |
| Thai | 836 | 2.0% |
| Turkish | 60 | 0.2% |
| Ukrainian | 91 | 0.2% |
| Venezuelan | 56 | 0.1% |
| Welsh | 225 | 0.5% | View All 86 Rows |
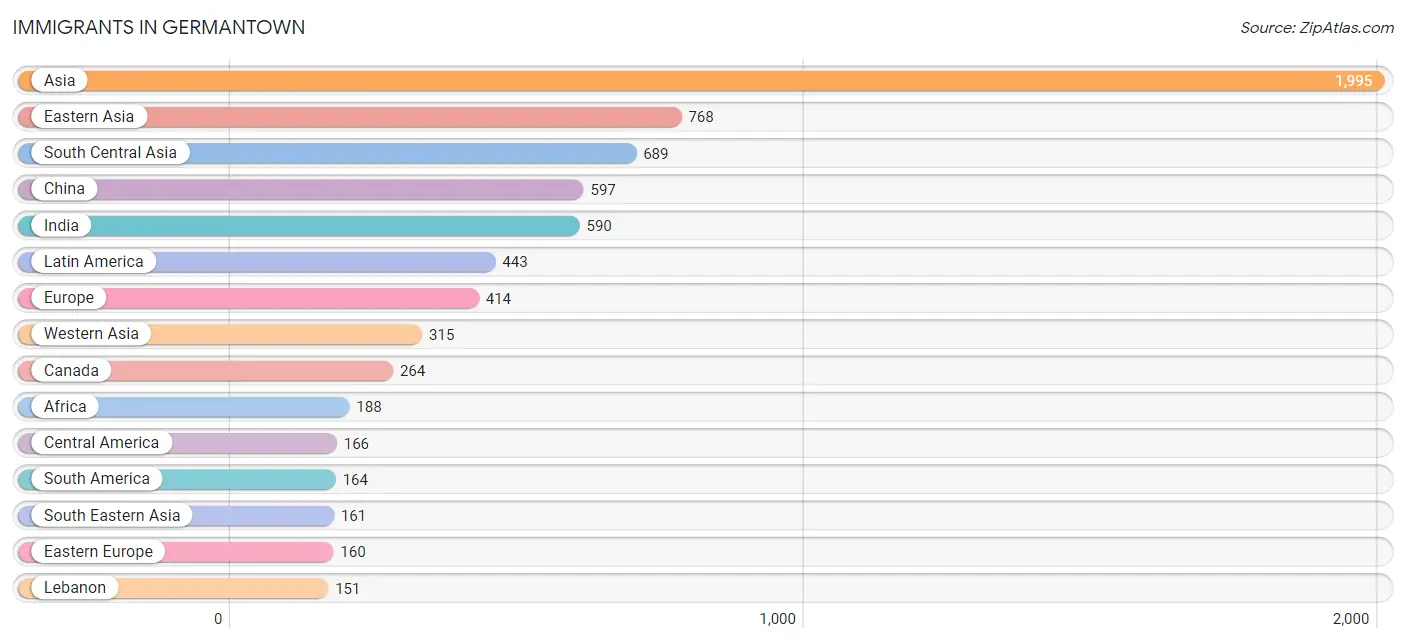
Immigrants in Germantown
The most numerous immigrant groups reported in Germantown came from Asia (1,995 | 4.9%), Eastern Asia (768 | 1.9%), South Central Asia (689 | 1.7%), China (597 | 1.5%), and India (590 | 1.4%), together accounting for 11.3% of all Germantown residents.
| Immigration Origin | # Population | % Population |
| Africa | 188 | 0.5% |
| Albania | 11 | 0.0% |
| Argentina | 16 | 0.0% |
| Asia | 1,995 | 4.9% |
| Austria | 31 | 0.1% |
| Belgium | 24 | 0.1% |
| Brazil | 28 | 0.1% |
| Canada | 264 | 0.6% |
| Caribbean | 113 | 0.3% |
| Central America | 166 | 0.4% |
| China | 597 | 1.5% |
| Colombia | 73 | 0.2% |
| Costa Rica | 8 | 0.0% |
| Cuba | 29 | 0.1% |
| Czechoslovakia | 11 | 0.0% |
| Eastern Africa | 88 | 0.2% |
| Eastern Asia | 768 | 1.9% |
| Eastern Europe | 160 | 0.4% |
| Egypt | 25 | 0.1% |
| El Salvador | 3 | 0.0% |
| England | 85 | 0.2% |
| Ethiopia | 61 | 0.2% |
| Europe | 414 | 1.0% |
| Germany | 57 | 0.1% |
| Guatemala | 18 | 0.0% |
| Honduras | 14 | 0.0% |
| India | 590 | 1.4% |
| Iran | 52 | 0.1% |
| Israel | 23 | 0.1% |
| Italy | 32 | 0.1% |
| Jamaica | 66 | 0.2% |
| Japan | 23 | 0.1% |
| Jordan | 35 | 0.1% |
| Korea | 148 | 0.4% |
| Latin America | 443 | 1.1% |
| Lebanon | 151 | 0.4% |
| Malaysia | 40 | 0.1% |
| Mexico | 123 | 0.3% |
| Nigeria | 22 | 0.1% |
| Northern Africa | 78 | 0.2% |
| Northern Europe | 110 | 0.3% |
| Pakistan | 47 | 0.1% |
| Peru | 4 | 0.0% |
| Philippines | 15 | 0.0% |
| Romania | 21 | 0.1% |
| Russia | 76 | 0.2% |
| Saudi Arabia | 29 | 0.1% |
| Singapore | 1 | 0.0% |
| Somalia | 27 | 0.1% |
| South America | 164 | 0.4% |
| South Central Asia | 689 | 1.7% |
| South Eastern Asia | 161 | 0.4% |
| Southern Europe | 32 | 0.1% |
| Sweden | 12 | 0.0% |
| Syria | 37 | 0.1% |
| Taiwan | 55 | 0.1% |
| Thailand | 12 | 0.0% |
| Turkey | 40 | 0.1% |
| Ukraine | 41 | 0.1% |
| Venezuela | 43 | 0.1% |
| Vietnam | 86 | 0.2% |
| Western Africa | 22 | 0.1% |
| Western Asia | 315 | 0.8% |
| Western Europe | 112 | 0.3% | View All 64 Rows |
Sex and Age in Germantown
Sex and Age in Germantown
The most populous age groups in Germantown are 5 to 9 Years (1,755 | 8.7%) for men and 5 to 9 Years (1,927 | 9.2%) for women.
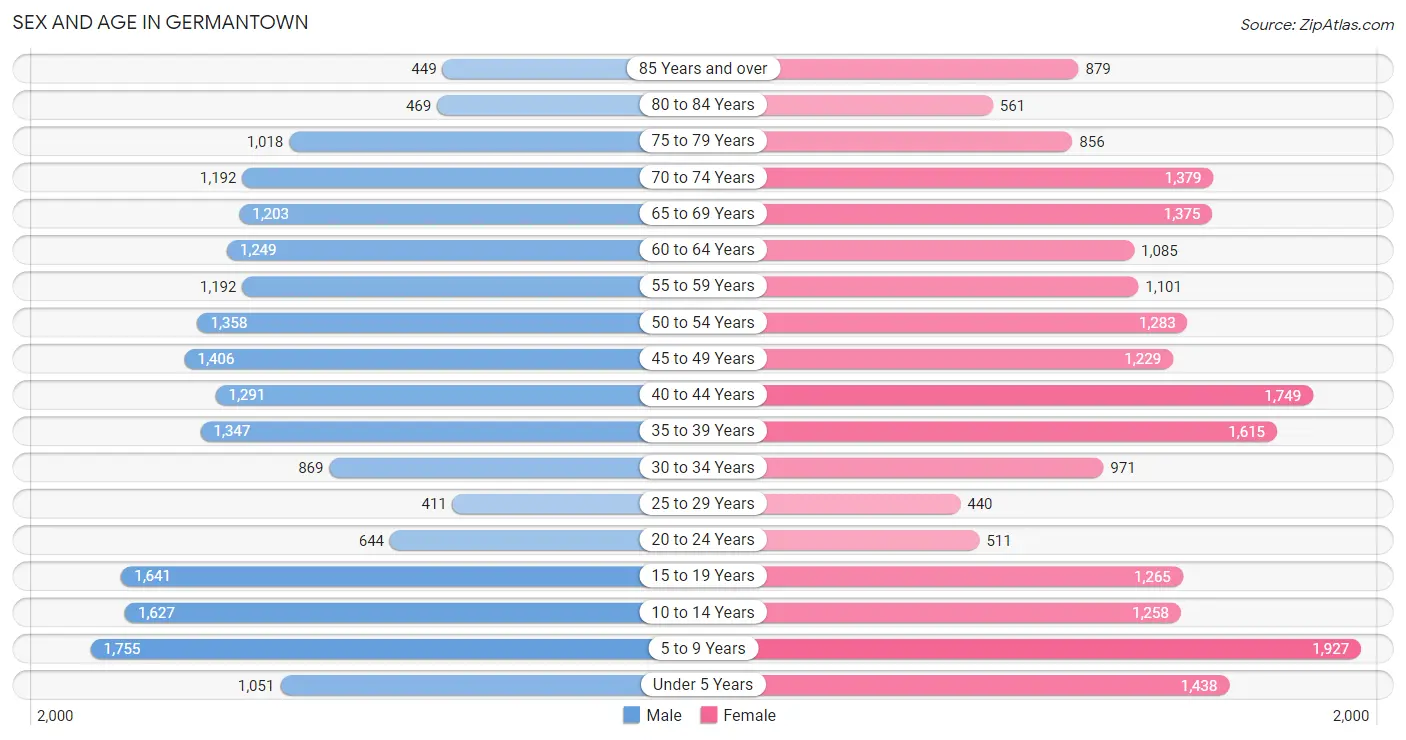
| Age Bracket | Male | Female |
| Under 5 Years | 1,051 (5.2%) | 1,438 (6.9%) |
| 5 to 9 Years | 1,755 (8.7%) | 1,927 (9.2%) |
| 10 to 14 Years | 1,627 (8.1%) | 1,258 (6.0%) |
| 15 to 19 Years | 1,641 (8.1%) | 1,265 (6.0%) |
| 20 to 24 Years | 644 (3.2%) | 511 (2.4%) |
| 25 to 29 Years | 411 (2.0%) | 440 (2.1%) |
| 30 to 34 Years | 869 (4.3%) | 971 (4.6%) |
| 35 to 39 Years | 1,347 (6.7%) | 1,615 (7.7%) |
| 40 to 44 Years | 1,291 (6.4%) | 1,749 (8.4%) |
| 45 to 49 Years | 1,406 (7.0%) | 1,229 (5.9%) |
| 50 to 54 Years | 1,358 (6.7%) | 1,283 (6.1%) |
| 55 to 59 Years | 1,192 (5.9%) | 1,101 (5.3%) |
| 60 to 64 Years | 1,249 (6.2%) | 1,085 (5.2%) |
| 65 to 69 Years | 1,203 (6.0%) | 1,375 (6.6%) |
| 70 to 74 Years | 1,192 (5.9%) | 1,379 (6.6%) |
| 75 to 79 Years | 1,018 (5.1%) | 856 (4.1%) |
| 80 to 84 Years | 469 (2.3%) | 561 (2.7%) |
| 85 Years and over | 449 (2.2%) | 879 (4.2%) |
| Total | 20,172 (100.0%) | 20,922 (100.0%) |
Families and Households in Germantown
Median Family Size in Germantown
The median family size in Germantown is 3.14 persons per family, with married-couple families (10,606 | 90.5%) accounting for the largest median family size of 3.17 persons per family. On the other hand, single male/father families (340 | 2.9%) represent the smallest median family size with 2.65 persons per family.
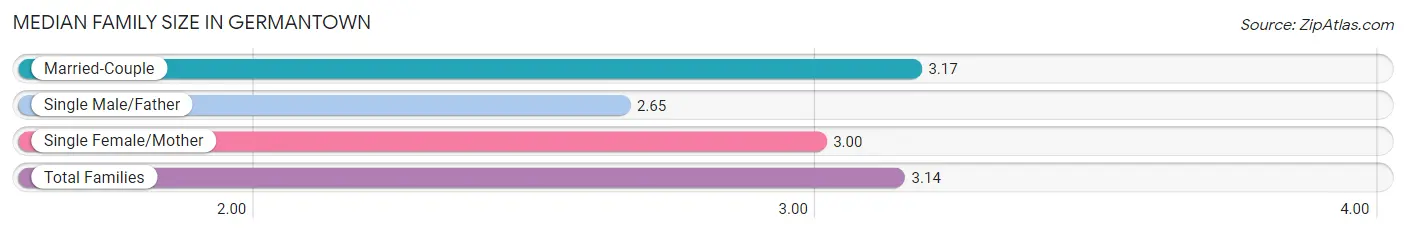
| Family Type | # Families | Family Size |
| Married-Couple | 10,606 (90.5%) | 3.17 |
| Single Male/Father | 340 (2.9%) | 2.65 |
| Single Female/Mother | 777 (6.6%) | 3.00 |
| Total Families | 11,723 (100.0%) | 3.14 |
Median Household Size in Germantown
The median household size in Germantown is 2.66 persons per household, with married-couple households (10,606 | 69.0%) accounting for the largest median household size of 3.17 persons per household. non-family households (3,653 | 23.8%) represent the smallest median household size with 1.08 persons per household.
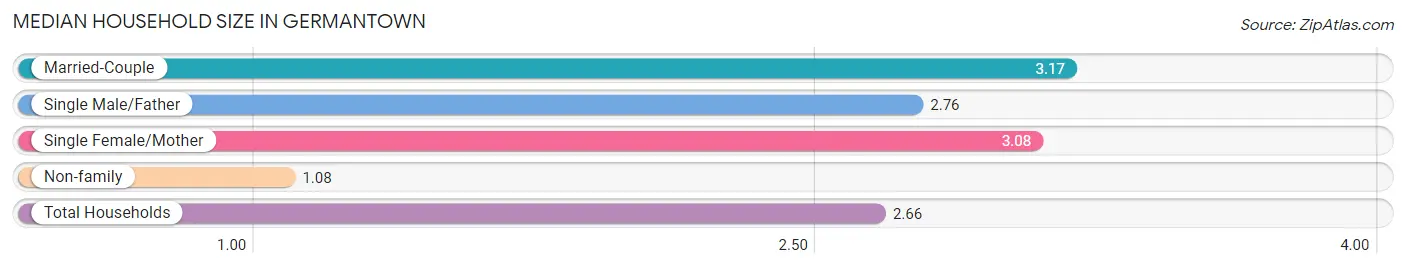
| Household Type | # Households | Household Size |
| Married-Couple | 10,606 (69.0%) | 3.17 |
| Single Male/Father | 340 (2.2%) | 2.76 |
| Single Female/Mother | 777 (5.1%) | 3.08 |
| Non-family | 3,653 (23.8%) | 1.08 |
| Total Households | 15,376 (100.0%) | 2.66 |
Household Size by Marriage Status in Germantown
Out of a total of 15,376 households in Germantown, 11,723 (76.2%) are family households, while 3,653 (23.8%) are nonfamily households. The most numerous type of family households are 2-person households, comprising 5,319, and the most common type of nonfamily households are 1-person households, comprising 3,455.
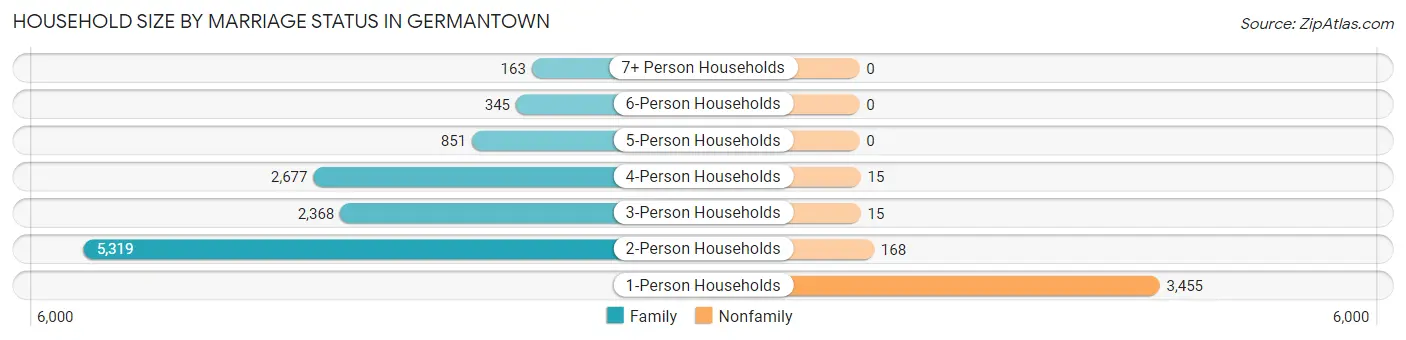
| Household Size | Family Households | Nonfamily Households |
| 1-Person Households | - | 3,455 (22.5%) |
| 2-Person Households | 5,319 (34.6%) | 168 (1.1%) |
| 3-Person Households | 2,368 (15.4%) | 15 (0.1%) |
| 4-Person Households | 2,677 (17.4%) | 15 (0.1%) |
| 5-Person Households | 851 (5.5%) | 0 (0.0%) |
| 6-Person Households | 345 (2.2%) | 0 (0.0%) |
| 7+ Person Households | 163 (1.1%) | 0 (0.0%) |
| Total | 11,723 (76.2%) | 3,653 (23.8%) |
Female Fertility in Germantown
Fertility by Age in Germantown
Average fertility rate in Germantown is 41.0 births per 1,000 women. Women in the age bracket of 20 to 34 years have the highest fertility rate with 101.0 births per 1,000 women. Women in the age bracket of 20 to 34 years acount for 59.3% of all women with births.
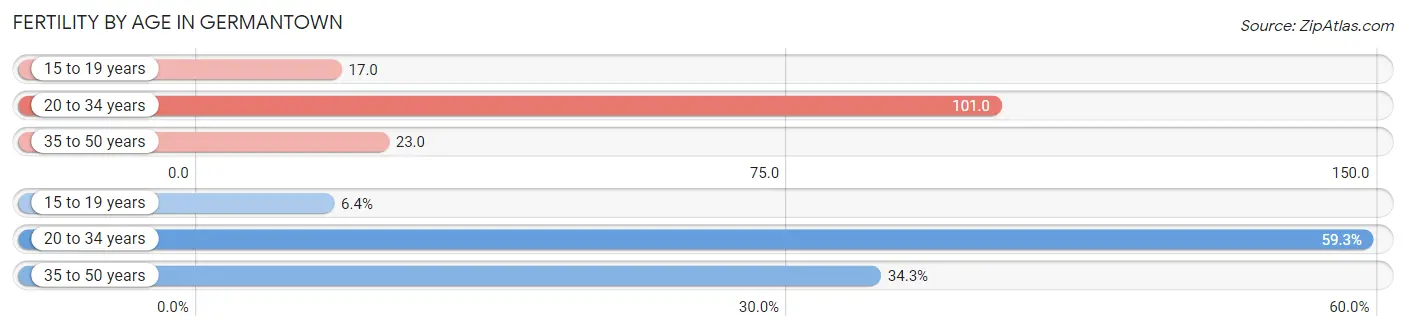
| Age Bracket | Women with Births | Births / 1,000 Women |
| 15 to 19 years | 21 (6.4%) | 17.0 |
| 20 to 34 years | 194 (59.3%) | 101.0 |
| 35 to 50 years | 112 (34.3%) | 23.0 |
| Total | 327 (100.0%) | 41.0 |
Fertility by Age by Marriage Status in Germantown
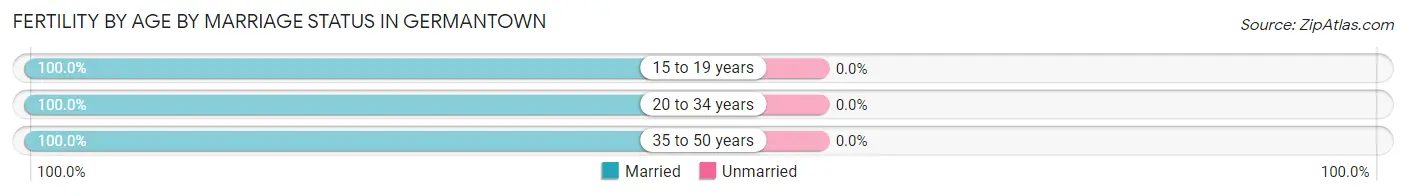
| Age Bracket | Married | Unmarried |
| 15 to 19 years | 21 (100.0%) | 0 (0.0%) |
| 20 to 34 years | 194 (100.0%) | 0 (0.0%) |
| 35 to 50 years | 112 (100.0%) | 0 (0.0%) |
| Total | 327 (100.0%) | 0 (0.0%) |
Fertility by Education in Germantown
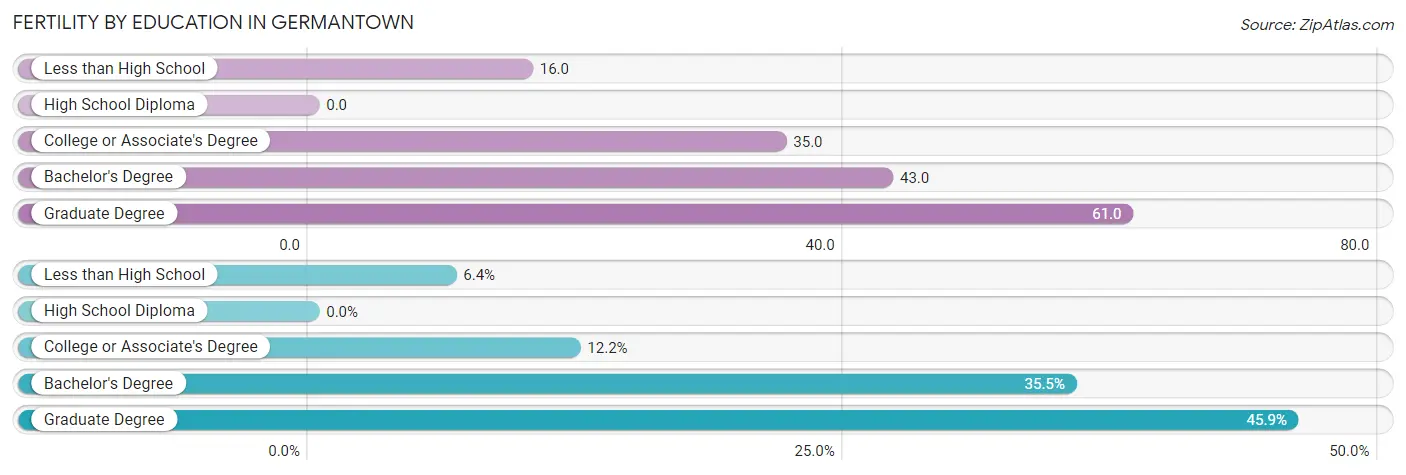
| Educational Attainment | Women with Births | Births / 1,000 Women |
| Less than High School | 21 (6.4%) | 16.0 |
| High School Diploma | 0 (0.0%) | 0.0 |
| College or Associate's Degree | 40 (12.2%) | 35.0 |
| Bachelor's Degree | 116 (35.5%) | 43.0 |
| Graduate Degree | 150 (45.9%) | 61.0 |
| Total | 327 (100.0%) | 41.0 |
Fertility by Education by Marriage Status in Germantown
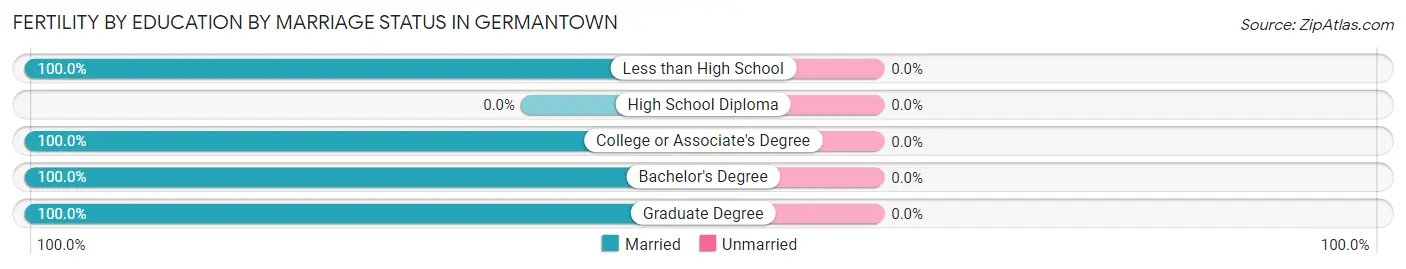
| Educational Attainment | Married | Unmarried |
| Less than High School | 21 (100.0%) | 0 (0.0%) |
| High School Diploma | 0 (0.0%) | 0 (0.0%) |
| College or Associate's Degree | 40 (100.0%) | 0 (0.0%) |
| Bachelor's Degree | 116 (100.0%) | 0 (0.0%) |
| Graduate Degree | 150 (100.0%) | 0 (0.0%) |
| Total | 327 (100.0%) | 0 (0.0%) |
Employment Characteristics in Germantown
Employment by Class of Employer in Germantown
Among the 18,826 employed individuals in Germantown, private company employees (12,616 | 67.0%), not-for-profit organizations (2,318 | 12.3%), and self-employed (not incorporated) (1,216 | 6.5%) make up the most common classes of employment.
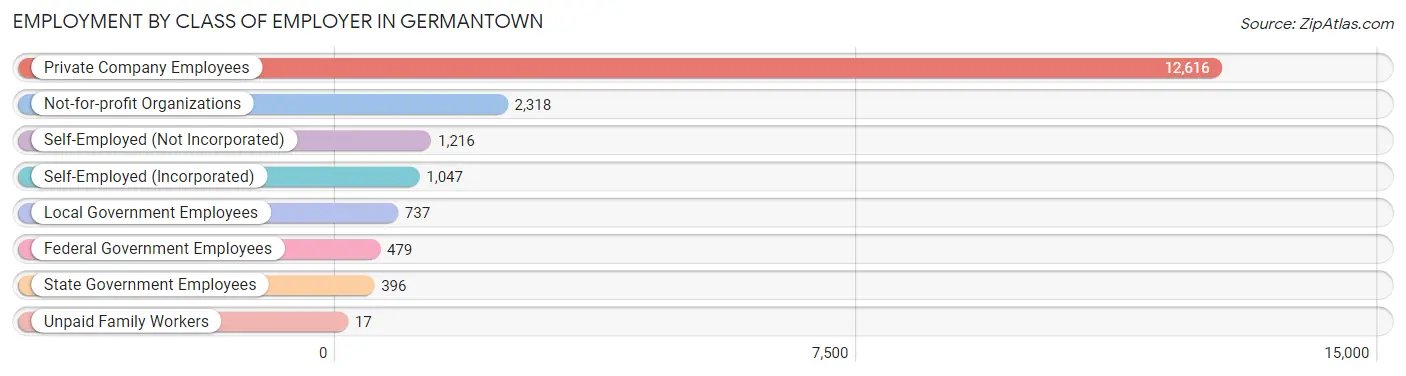
| Employer Class | # Employees | % Employees |
| Private Company Employees | 12,616 | 67.0% |
| Self-Employed (Incorporated) | 1,047 | 5.6% |
| Self-Employed (Not Incorporated) | 1,216 | 6.5% |
| Not-for-profit Organizations | 2,318 | 12.3% |
| Local Government Employees | 737 | 3.9% |
| State Government Employees | 396 | 2.1% |
| Federal Government Employees | 479 | 2.5% |
| Unpaid Family Workers | 17 | 0.1% |
| Total | 18,826 | 100.0% |
Employment Status by Age in Germantown
According to the labor force statistics for Germantown, out of the total population over 16 years of age (31,620), 61.8% or 19,541 individuals are in the labor force, with 2.8% or 547 of them unemployed. The age group with the highest labor force participation rate is 25 to 29 years, with 89.2% or 759 individuals in the labor force. Within the labor force, the 16 to 19 years age range has the highest percentage of unemployed individuals, with 16.1% or 132 of them being unemployed.
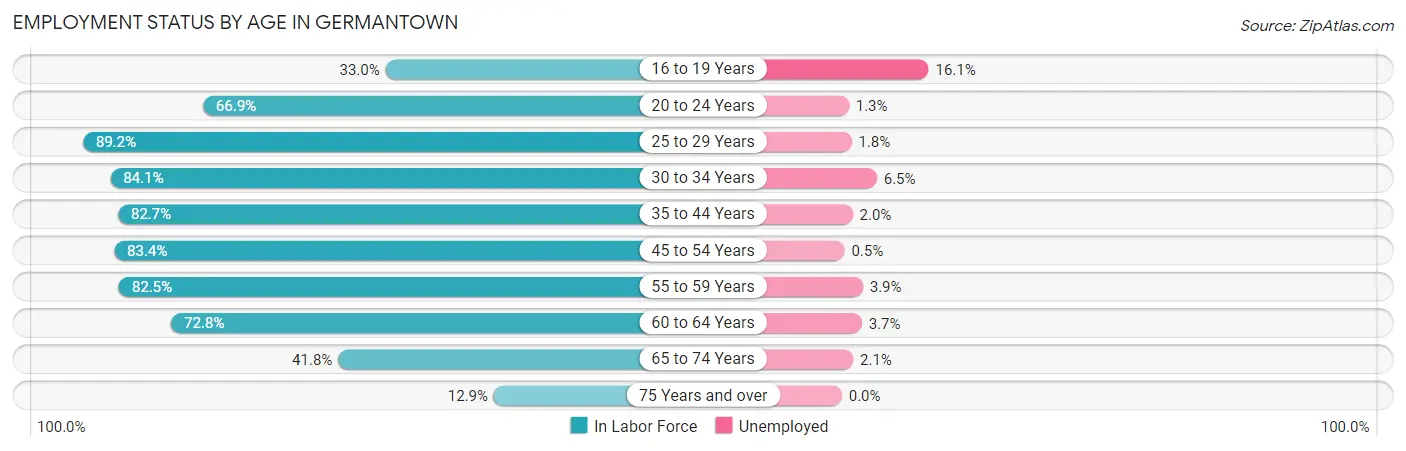
| Age Bracket | In Labor Force | Unemployed |
| 16 to 19 Years | 821 (33.0%) | 132 (16.1%) |
| 20 to 24 Years | 773 (66.9%) | 10 (1.3%) |
| 25 to 29 Years | 759 (89.2%) | 14 (1.8%) |
| 30 to 34 Years | 1,547 (84.1%) | 101 (6.5%) |
| 35 to 44 Years | 4,964 (82.7%) | 99 (2.0%) |
| 45 to 54 Years | 4,400 (83.4%) | 22 (0.5%) |
| 55 to 59 Years | 1,892 (82.5%) | 74 (3.9%) |
| 60 to 64 Years | 1,699 (72.8%) | 63 (3.7%) |
| 65 to 74 Years | 2,152 (41.8%) | 45 (2.1%) |
| 75 Years and over | 546 (12.9%) | 0 (0.0%) |
| Total | 19,541 (61.8%) | 547 (2.8%) |
Employment Status by Educational Attainment in Germantown
According to labor force statistics for Germantown, 82.1% of individuals (15,267) out of the total population between 25 and 64 years of age (18,596) are in the labor force, with 2.4% or 366 of them being unemployed. The group with the highest labor force participation rate are those with the educational attainment of bachelor's degree or higher, with 84.9% or 11,832 individuals in the labor force. Within the labor force, individuals with college / associate degree education have the highest percentage of unemployment, with 3.9% or 95 of them being unemployed.
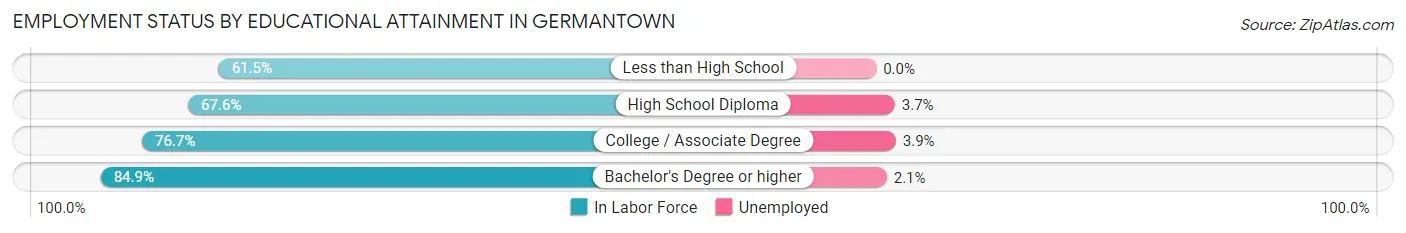
| Educational Attainment | In Labor Force | Unemployed |
| Less than High School | 126 (61.5%) | 0 (0.0%) |
| High School Diploma | 869 (67.6%) | 48 (3.7%) |
| College / Associate Degree | 2,431 (76.7%) | 124 (3.9%) |
| Bachelor's Degree or higher | 11,832 (84.9%) | 293 (2.1%) |
| Total | 15,267 (82.1%) | 446 (2.4%) |
Employment Occupations by Sex in Germantown
Management, Business, Science and Arts Occupations
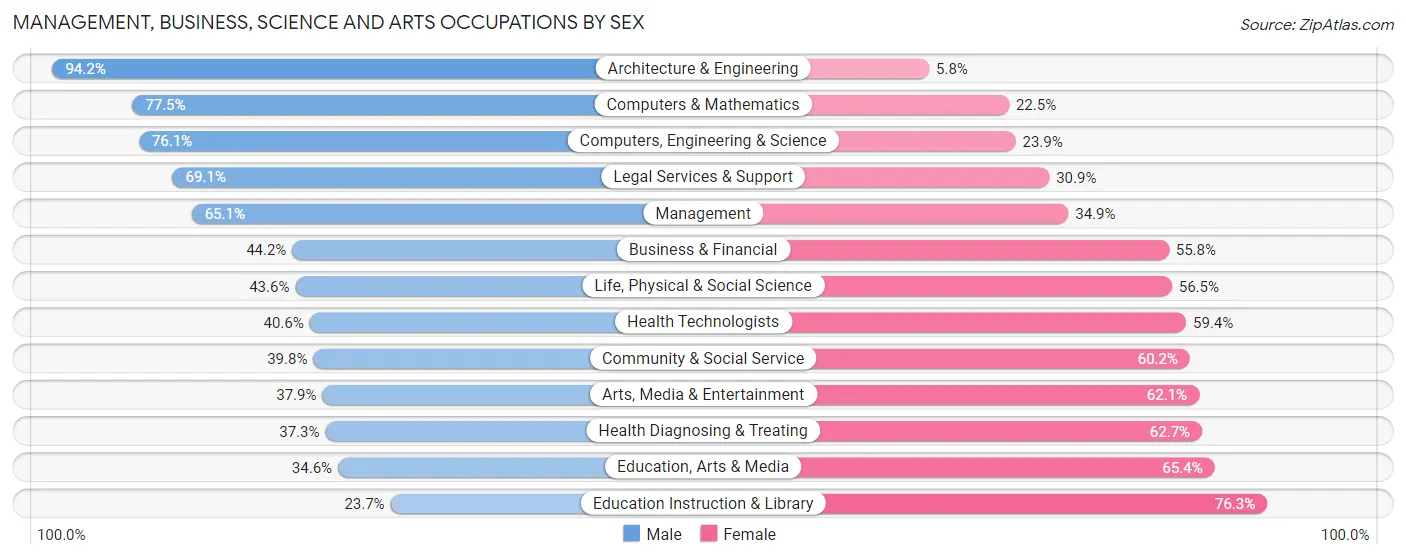
The most common Management, Business, Science and Arts occupations in Germantown are Management (3,938 | 20.8%), Community & Social Service (2,727 | 14.4%), Health Diagnosing & Treating (2,415 | 12.7%), Business & Financial (2,098 | 11.1%), and Health Technologists (2,086 | 11.0%).
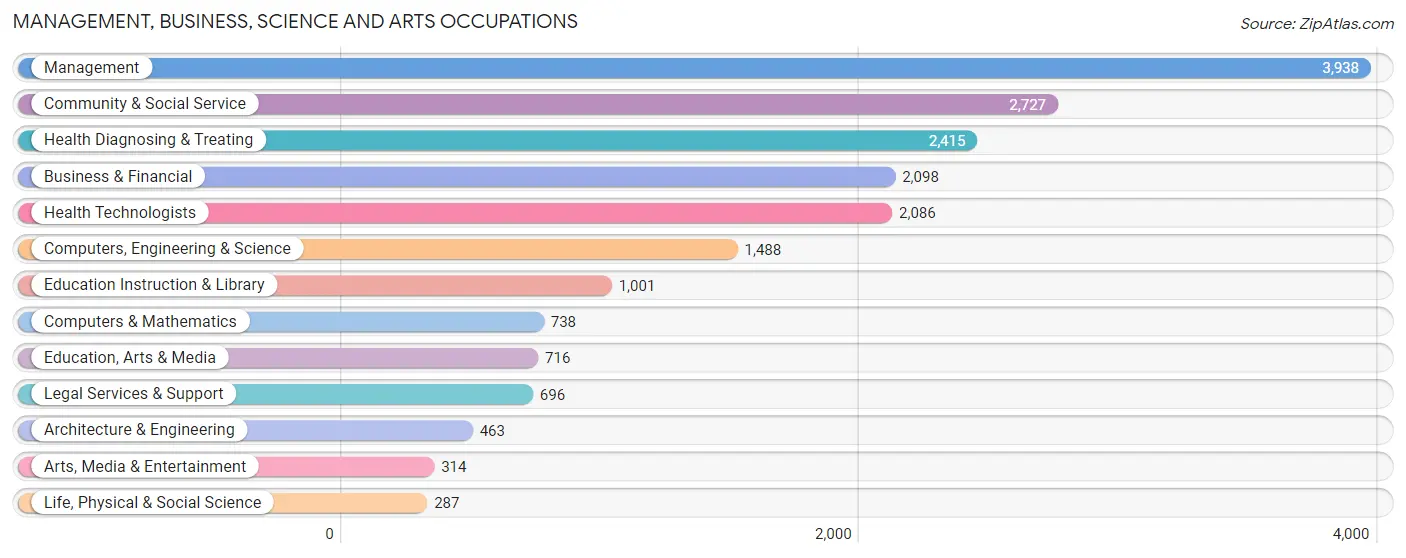
Management, Business, Science and Arts Occupations by Sex
Within the Management, Business, Science and Arts occupations in Germantown, the most male-oriented occupations are Architecture & Engineering (94.2%), Computers & Mathematics (77.5%), and Computers, Engineering & Science (76.1%), while the most female-oriented occupations are Education Instruction & Library (76.3%), Education, Arts & Media (65.4%), and Health Diagnosing & Treating (62.7%).
| Occupation | Male | Female |
| Management | 2,565 (65.1%) | 1,373 (34.9%) |
| Business & Financial | 927 (44.2%) | 1,171 (55.8%) |
| Computers, Engineering & Science | 1,133 (76.1%) | 355 (23.9%) |
| Computers & Mathematics | 572 (77.5%) | 166 (22.5%) |
| Architecture & Engineering | 436 (94.2%) | 27 (5.8%) |
| Life, Physical & Social Science | 125 (43.5%) | 162 (56.5%) |
| Community & Social Service | 1,085 (39.8%) | 1,642 (60.2%) |
| Education, Arts & Media | 248 (34.6%) | 468 (65.4%) |
| Legal Services & Support | 481 (69.1%) | 215 (30.9%) |
| Education Instruction & Library | 237 (23.7%) | 764 (76.3%) |
| Arts, Media & Entertainment | 119 (37.9%) | 195 (62.1%) |
| Health Diagnosing & Treating | 900 (37.3%) | 1,515 (62.7%) |
| Health Technologists | 846 (40.6%) | 1,240 (59.4%) |
| Total (Category) | 6,610 (52.2%) | 6,056 (47.8%) |
| Total (Overall) | 10,715 (56.6%) | 8,234 (43.4%) |
Services Occupations
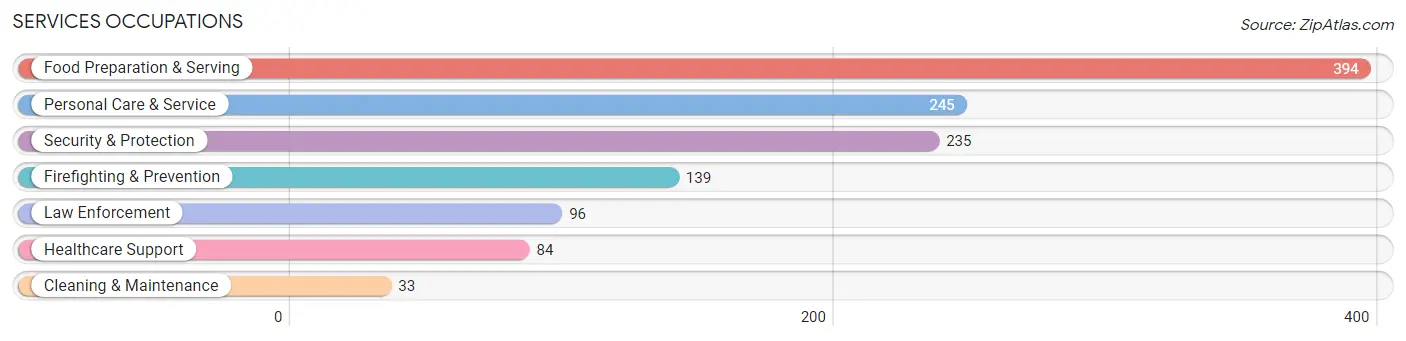
The most common Services occupations in Germantown are Food Preparation & Serving (394 | 2.1%), Personal Care & Service (245 | 1.3%), Security & Protection (235 | 1.2%), Firefighting & Prevention (139 | 0.7%), and Law Enforcement (96 | 0.5%).
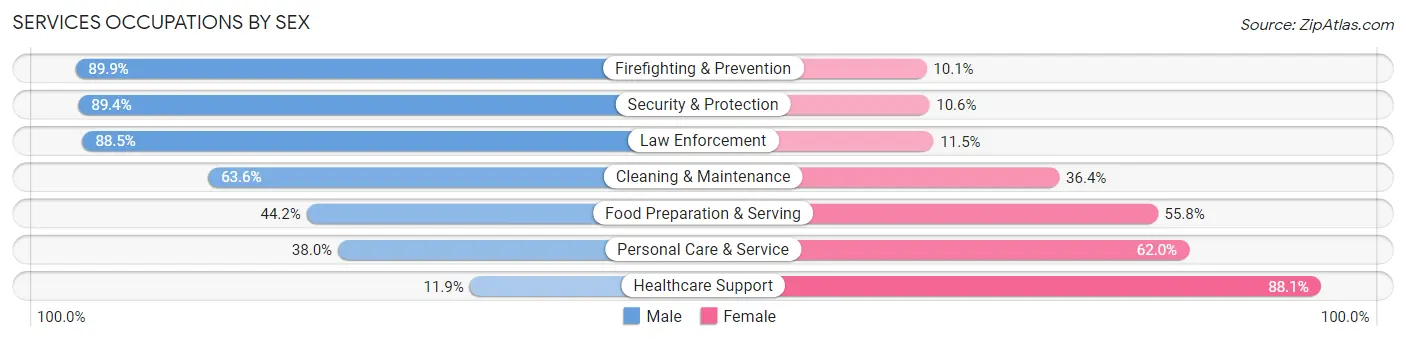
Services Occupations by Sex
Within the Services occupations in Germantown, the most male-oriented occupations are Firefighting & Prevention (89.9%), Security & Protection (89.4%), and Law Enforcement (88.5%), while the most female-oriented occupations are Healthcare Support (88.1%), Personal Care & Service (62.0%), and Food Preparation & Serving (55.8%).
| Occupation | Male | Female |
| Healthcare Support | 10 (11.9%) | 74 (88.1%) |
| Security & Protection | 210 (89.4%) | 25 (10.6%) |
| Firefighting & Prevention | 125 (89.9%) | 14 (10.1%) |
| Law Enforcement | 85 (88.5%) | 11 (11.5%) |
| Food Preparation & Serving | 174 (44.2%) | 220 (55.8%) |
| Cleaning & Maintenance | 21 (63.6%) | 12 (36.4%) |
| Personal Care & Service | 93 (38.0%) | 152 (62.0%) |
| Total (Category) | 508 (51.3%) | 483 (48.7%) |
| Total (Overall) | 10,715 (56.6%) | 8,234 (43.4%) |
Sales and Office Occupations
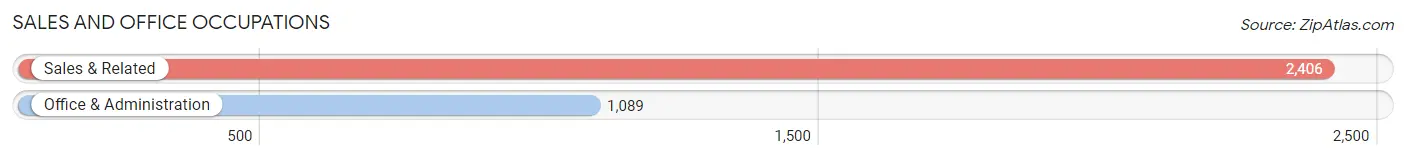
The most common Sales and Office occupations in Germantown are Sales & Related (2,406 | 12.7%), and Office & Administration (1,089 | 5.8%).
Sales and Office Occupations by Sex
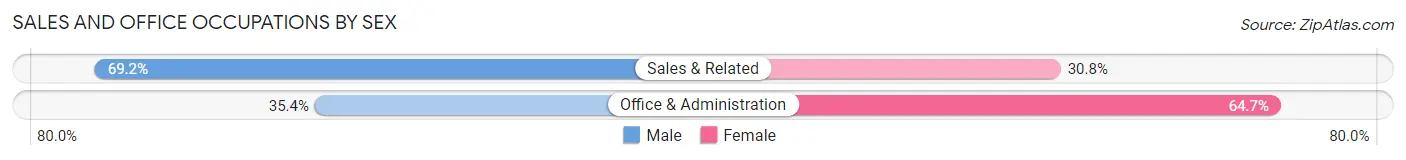
| Occupation | Male | Female |
| Sales & Related | 1,665 (69.2%) | 741 (30.8%) |
| Office & Administration | 385 (35.3%) | 704 (64.6%) |
| Total (Category) | 2,050 (58.7%) | 1,445 (41.3%) |
| Total (Overall) | 10,715 (56.6%) | 8,234 (43.4%) |
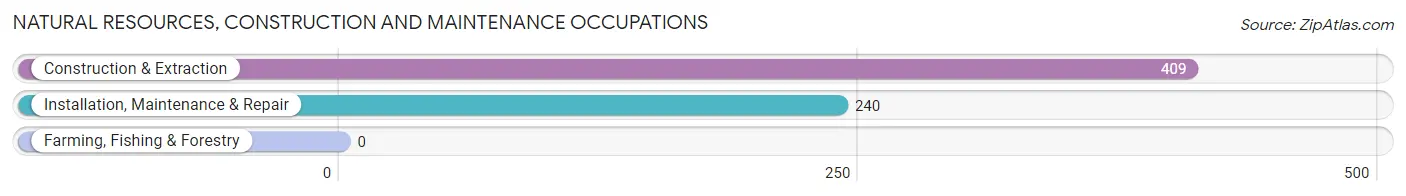
Natural Resources, Construction and Maintenance Occupations
The most common Natural Resources, Construction and Maintenance occupations in Germantown are Construction & Extraction (409 | 2.2%), and Installation, Maintenance & Repair (240 | 1.3%).
Natural Resources, Construction and Maintenance Occupations by Sex
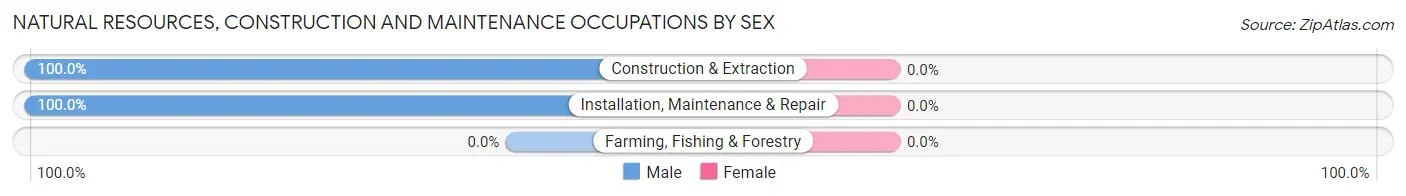
| Occupation | Male | Female |
| Farming, Fishing & Forestry | 0 (0.0%) | 0 (0.0%) |
| Construction & Extraction | 409 (100.0%) | 0 (0.0%) |
| Installation, Maintenance & Repair | 240 (100.0%) | 0 (0.0%) |
| Total (Category) | 649 (100.0%) | 0 (0.0%) |
| Total (Overall) | 10,715 (56.6%) | 8,234 (43.4%) |
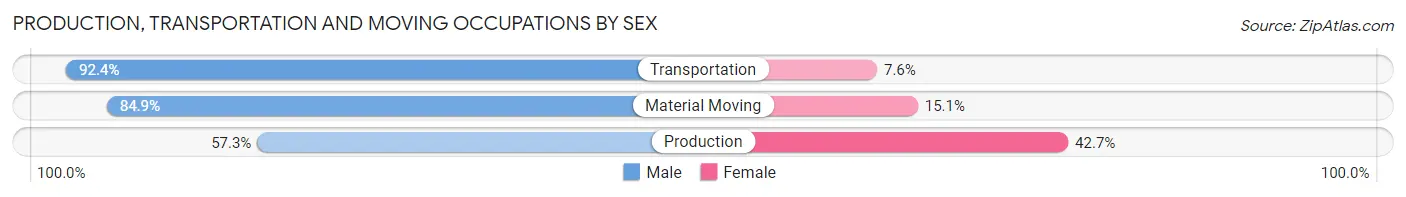
Production, Transportation and Moving Occupations
The most common Production, Transportation and Moving occupations in Germantown are Transportation (460 | 2.4%), Production (403 | 2.1%), and Material Moving (285 | 1.5%).
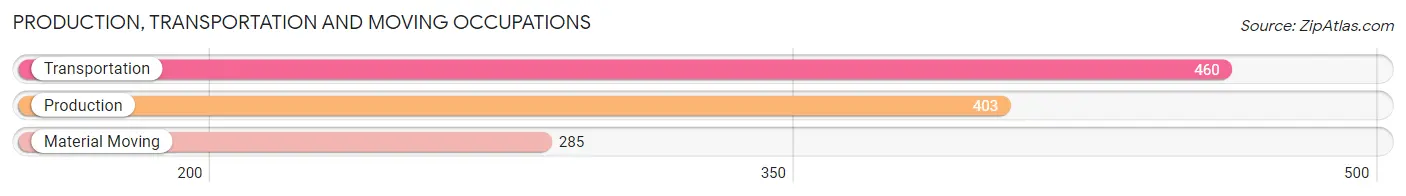
Production, Transportation and Moving Occupations by Sex
| Occupation | Male | Female |
| Production | 231 (57.3%) | 172 (42.7%) |
| Transportation | 425 (92.4%) | 35 (7.6%) |
| Material Moving | 242 (84.9%) | 43 (15.1%) |
| Total (Category) | 898 (78.2%) | 250 (21.8%) |
| Total (Overall) | 10,715 (56.6%) | 8,234 (43.4%) |
Employment Industries by Sex in Germantown
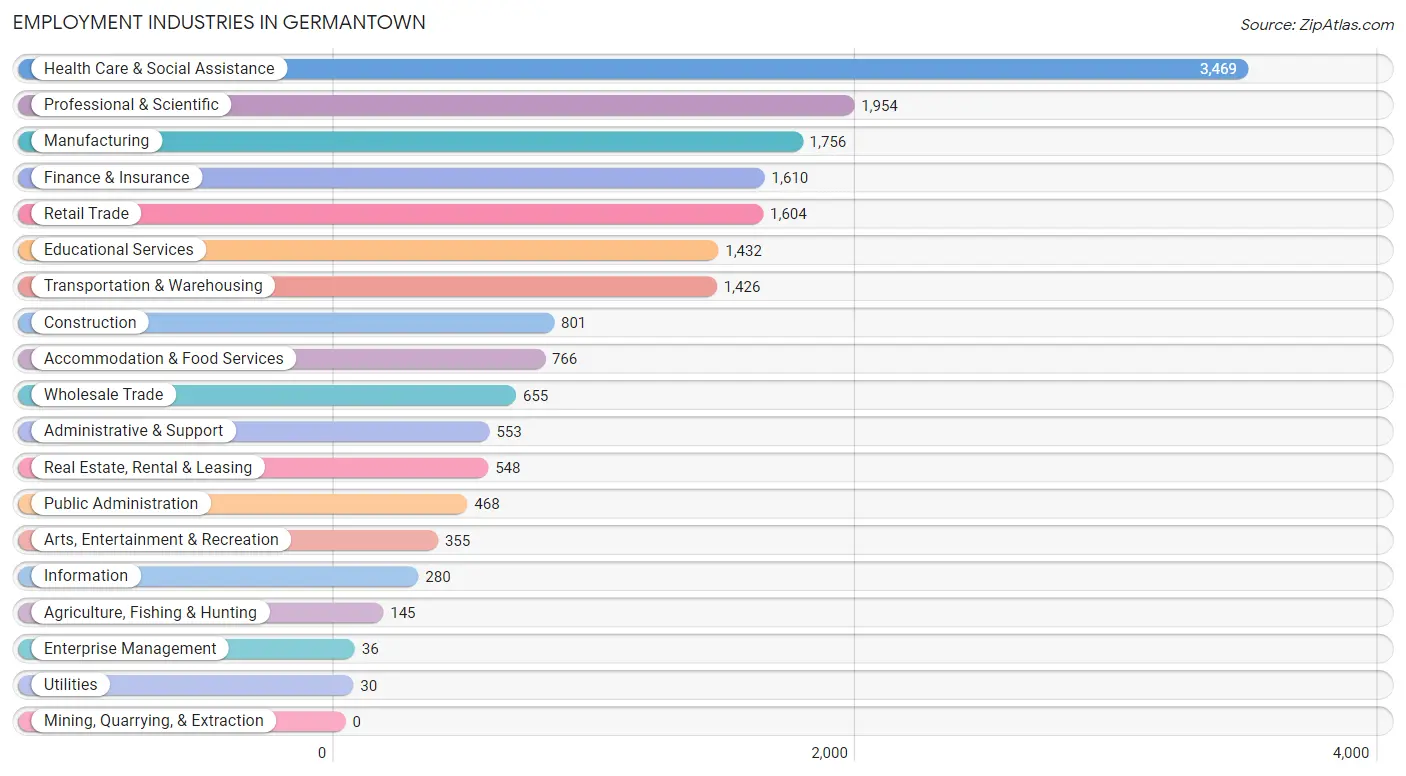
Employment Industries in Germantown
The major employment industries in Germantown include Health Care & Social Assistance (3,469 | 18.3%), Professional & Scientific (1,954 | 10.3%), Manufacturing (1,756 | 9.3%), Finance & Insurance (1,610 | 8.5%), and Retail Trade (1,604 | 8.5%).
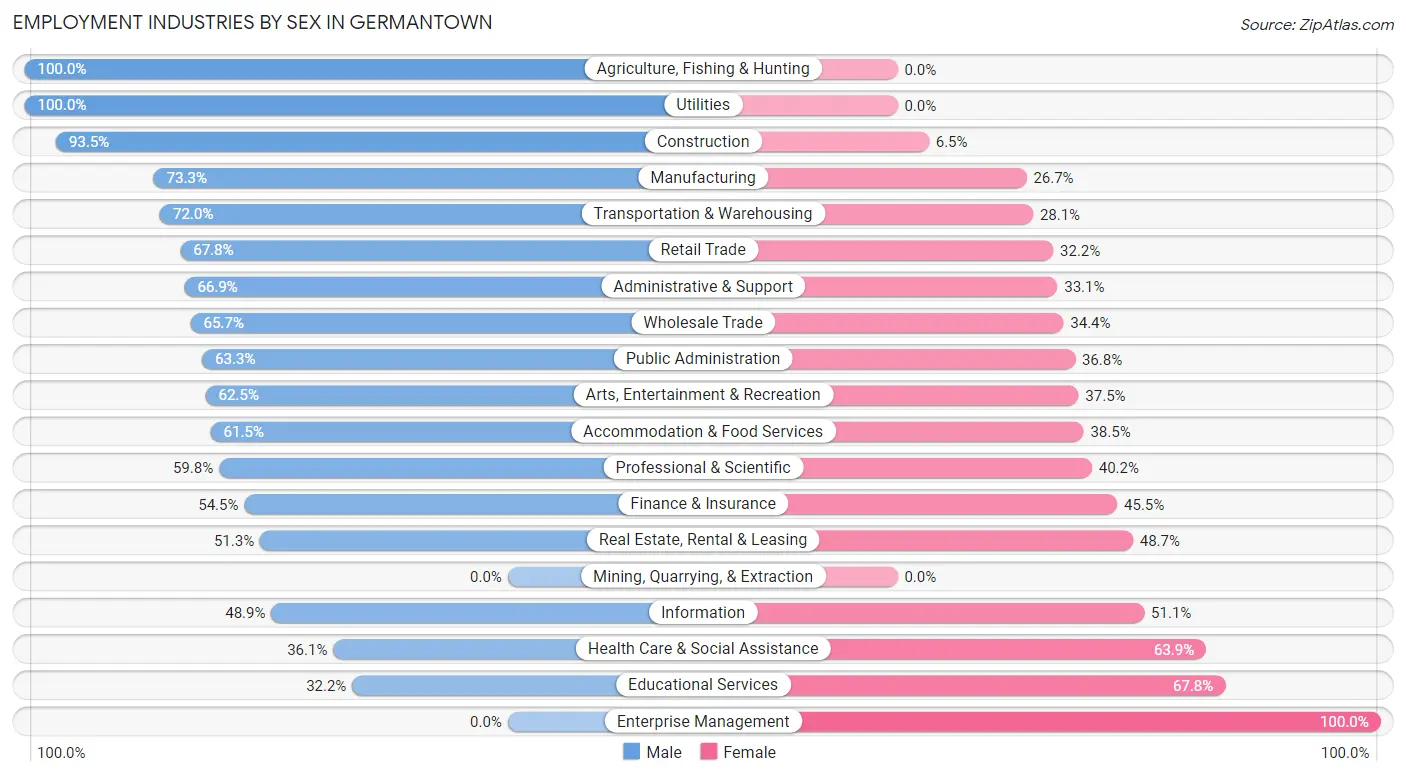
Employment Industries by Sex in Germantown
The Germantown industries that see more men than women are Agriculture, Fishing & Hunting (100.0%), Utilities (100.0%), and Construction (93.5%), whereas the industries that tend to have a higher number of women are Enterprise Management (100.0%), Educational Services (67.8%), and Health Care & Social Assistance (63.9%).
| Industry | Male | Female |
| Agriculture, Fishing & Hunting | 145 (100.0%) | 0 (0.0%) |
| Mining, Quarrying, & Extraction | 0 (0.0%) | 0 (0.0%) |
| Construction | 749 (93.5%) | 52 (6.5%) |
| Manufacturing | 1,287 (73.3%) | 469 (26.7%) |
| Wholesale Trade | 430 (65.6%) | 225 (34.4%) |
| Retail Trade | 1,087 (67.8%) | 517 (32.2%) |
| Transportation & Warehousing | 1,026 (72.0%) | 400 (28.1%) |
| Utilities | 30 (100.0%) | 0 (0.0%) |
| Information | 137 (48.9%) | 143 (51.1%) |
| Finance & Insurance | 878 (54.5%) | 732 (45.5%) |
| Real Estate, Rental & Leasing | 281 (51.3%) | 267 (48.7%) |
| Professional & Scientific | 1,168 (59.8%) | 786 (40.2%) |
| Enterprise Management | 0 (0.0%) | 36 (100.0%) |
| Administrative & Support | 370 (66.9%) | 183 (33.1%) |
| Educational Services | 461 (32.2%) | 971 (67.8%) |
| Health Care & Social Assistance | 1,253 (36.1%) | 2,216 (63.9%) |
| Arts, Entertainment & Recreation | 222 (62.5%) | 133 (37.5%) |
| Accommodation & Food Services | 471 (61.5%) | 295 (38.5%) |
| Public Administration | 296 (63.2%) | 172 (36.7%) |
| Total | 10,715 (56.6%) | 8,234 (43.4%) |
Education in Germantown
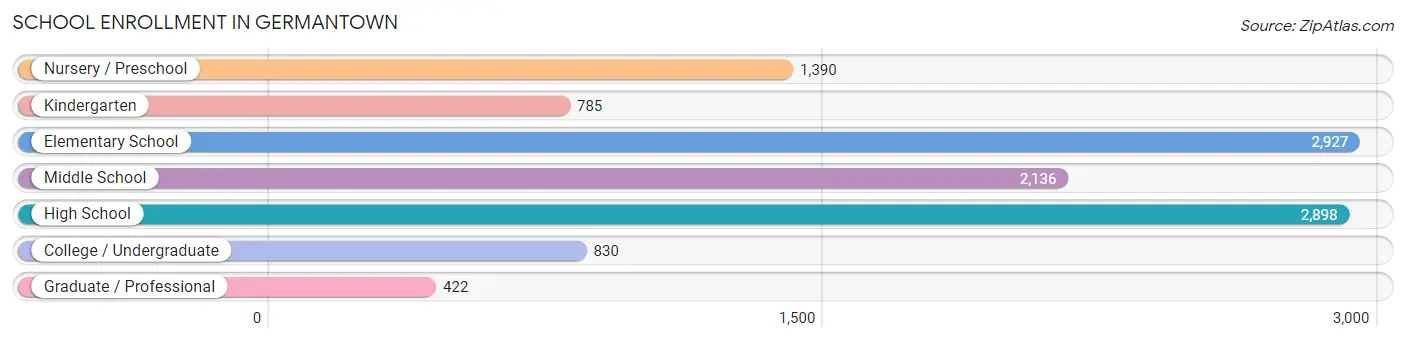
School Enrollment in Germantown
The most common levels of schooling among the 11,388 students in Germantown are elementary school (2,927 | 25.7%), high school (2,898 | 25.5%), and middle school (2,136 | 18.8%).
| School Level | # Students | % Students |
| Nursery / Preschool | 1,390 | 12.2% |
| Kindergarten | 785 | 6.9% |
| Elementary School | 2,927 | 25.7% |
| Middle School | 2,136 | 18.8% |
| High School | 2,898 | 25.5% |
| College / Undergraduate | 830 | 7.3% |
| Graduate / Professional | 422 | 3.7% |
| Total | 11,388 | 100.0% |
School Enrollment by Age by Funding Source in Germantown
Out of a total of 11,388 students who are enrolled in schools in Germantown, 3,496 (30.7%) attend a private institution, while the remaining 7,892 (69.3%) are enrolled in public schools. The age group of 3 to 4 year olds has the highest likelihood of being enrolled in private schools, with 624 (63.5% in the age bracket) enrolled. Conversely, the age group of 25 to 34 year olds has the lowest likelihood of being enrolled in a private school, with 174 (80.6% in the age bracket) attending a public institution.
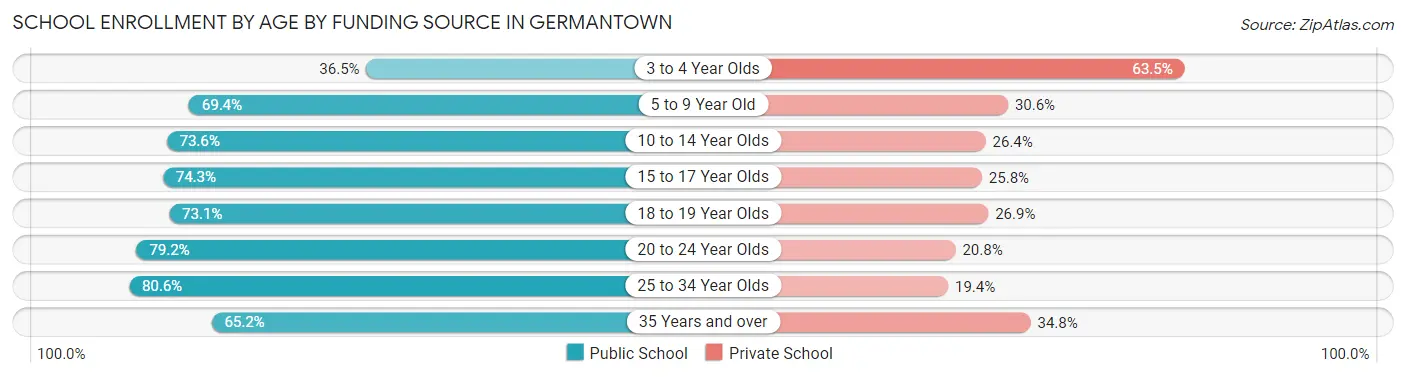
| Age Bracket | Public School | Private School |
| 3 to 4 Year Olds | 359 (36.5%) | 624 (63.5%) |
| 5 to 9 Year Old | 2,497 (69.4%) | 1,101 (30.6%) |
| 10 to 14 Year Olds | 2,106 (73.6%) | 757 (26.4%) |
| 15 to 17 Year Olds | 1,557 (74.3%) | 540 (25.8%) |
| 18 to 19 Year Olds | 521 (73.1%) | 192 (26.9%) |
| 20 to 24 Year Olds | 422 (79.2%) | 111 (20.8%) |
| 25 to 34 Year Olds | 174 (80.6%) | 42 (19.4%) |
| 35 Years and over | 251 (65.2%) | 134 (34.8%) |
| Total | 7,892 (69.3%) | 3,496 (30.7%) |
Educational Attainment by Field of Study in Germantown
Business (5,629 | 27.4%), science & technology (2,215 | 10.8%), education (1,947 | 9.5%), engineering (1,652 | 8.0%), and bio, nature & agricultural (1,449 | 7.1%) are the most common fields of study among 20,537 individuals in Germantown who have obtained a bachelor's degree or higher.
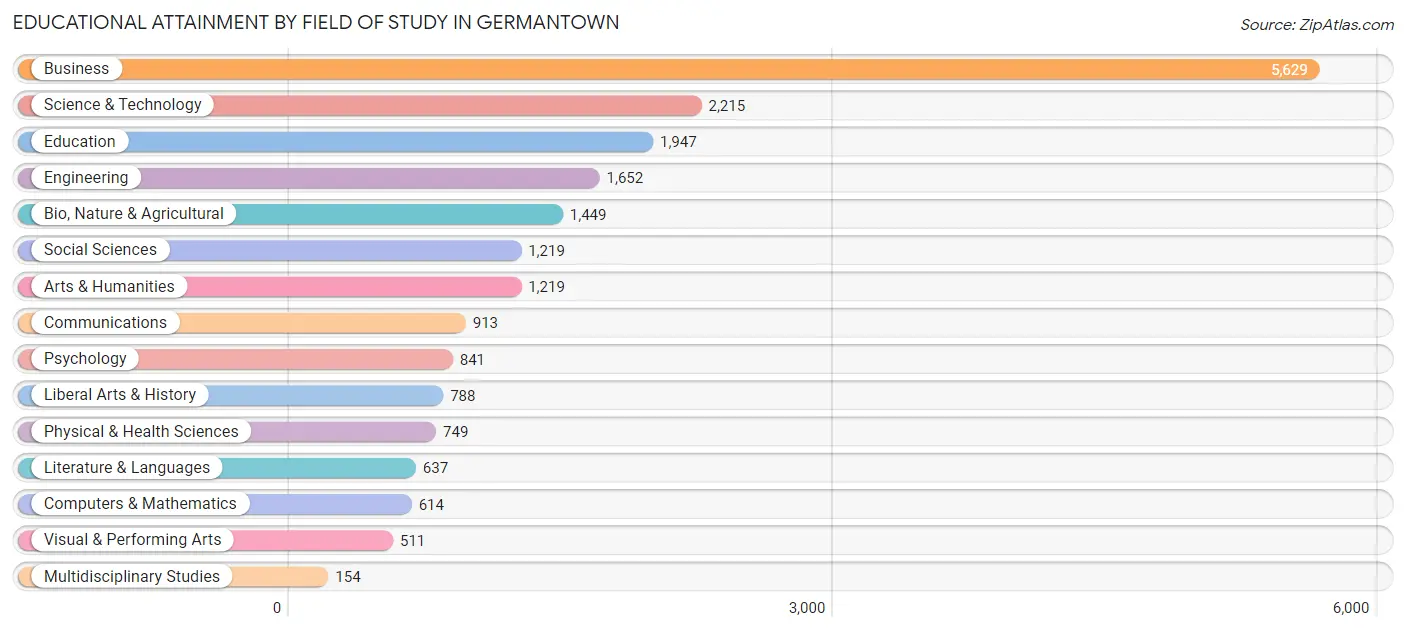
| Field of Study | # Graduates | % Graduates |
| Computers & Mathematics | 614 | 3.0% |
| Bio, Nature & Agricultural | 1,449 | 7.1% |
| Physical & Health Sciences | 749 | 3.6% |
| Psychology | 841 | 4.1% |
| Social Sciences | 1,219 | 5.9% |
| Engineering | 1,652 | 8.0% |
| Multidisciplinary Studies | 154 | 0.7% |
| Science & Technology | 2,215 | 10.8% |
| Business | 5,629 | 27.4% |
| Education | 1,947 | 9.5% |
| Literature & Languages | 637 | 3.1% |
| Liberal Arts & History | 788 | 3.8% |
| Visual & Performing Arts | 511 | 2.5% |
| Communications | 913 | 4.4% |
| Arts & Humanities | 1,219 | 5.9% |
| Total | 20,537 | 100.0% |
Transportation & Commute in Germantown
Vehicle Availability by Sex in Germantown
The most prevalent vehicle ownership categories in Germantown are males with 2 vehicles (5,761, accounting for 53.9%) and females with 2 vehicles (3,732, making up 70.8%).
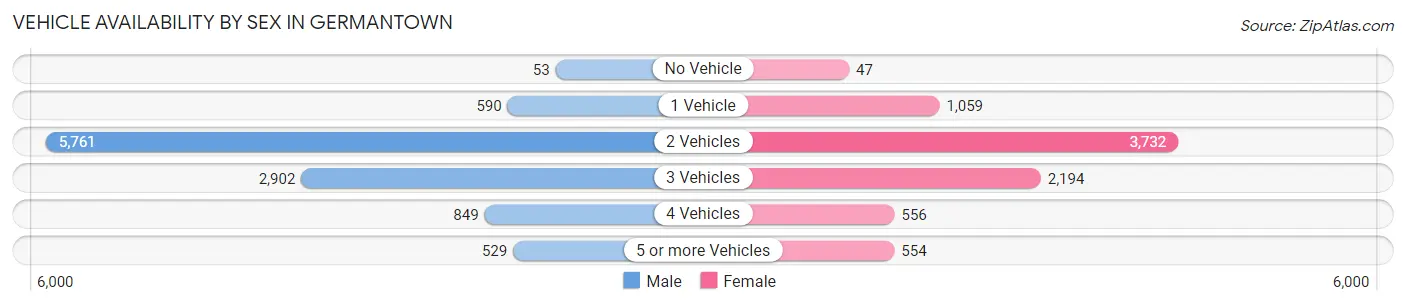
| Vehicles Available | Male | Female |
| No Vehicle | 53 (0.5%) | 47 (0.6%) |
| 1 Vehicle | 590 (5.5%) | 1,059 (13.0%) |
| 2 Vehicles | 5,761 (53.9%) | 3,732 (45.8%) |
| 3 Vehicles | 2,902 (27.2%) | 2,194 (27.0%) |
| 4 Vehicles | 849 (8.0%) | 556 (6.8%) |
| 5 or more Vehicles | 529 (5.0%) | 554 (6.8%) |
| Total | 10,684 (100.0%) | 8,142 (100.0%) |
Commute Time in Germantown
The most frequently occuring commute durations in Germantown are 30 to 34 minutes (2,933 commuters, 18.2%), 15 to 19 minutes (2,803 commuters, 17.4%), and 20 to 24 minutes (2,606 commuters, 16.2%).
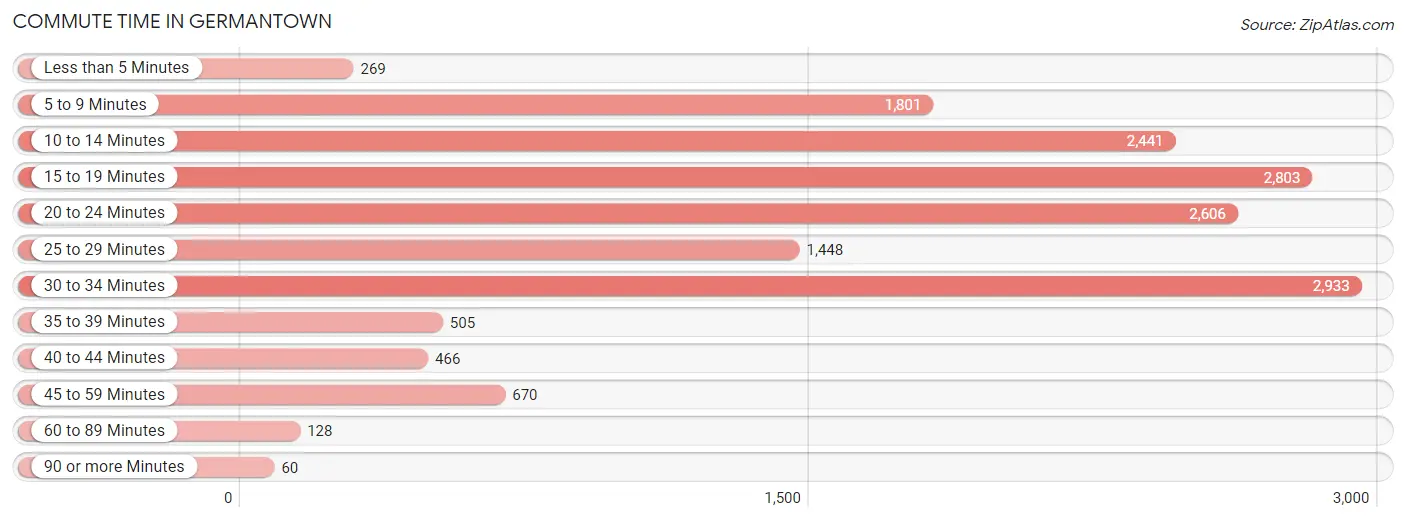
| Commute Time | # Commuters | % Commuters |
| Less than 5 Minutes | 269 | 1.7% |
| 5 to 9 Minutes | 1,801 | 11.2% |
| 10 to 14 Minutes | 2,441 | 15.1% |
| 15 to 19 Minutes | 2,803 | 17.4% |
| 20 to 24 Minutes | 2,606 | 16.2% |
| 25 to 29 Minutes | 1,448 | 9.0% |
| 30 to 34 Minutes | 2,933 | 18.2% |
| 35 to 39 Minutes | 505 | 3.1% |
| 40 to 44 Minutes | 466 | 2.9% |
| 45 to 59 Minutes | 670 | 4.2% |
| 60 to 89 Minutes | 128 | 0.8% |
| 90 or more Minutes | 60 | 0.4% |
Commute Time by Sex in Germantown
The most common commute times in Germantown are 30 to 34 minutes (1,771 commuters, 19.6%) for males and 20 to 24 minutes (1,317 commuters, 18.5%) for females.
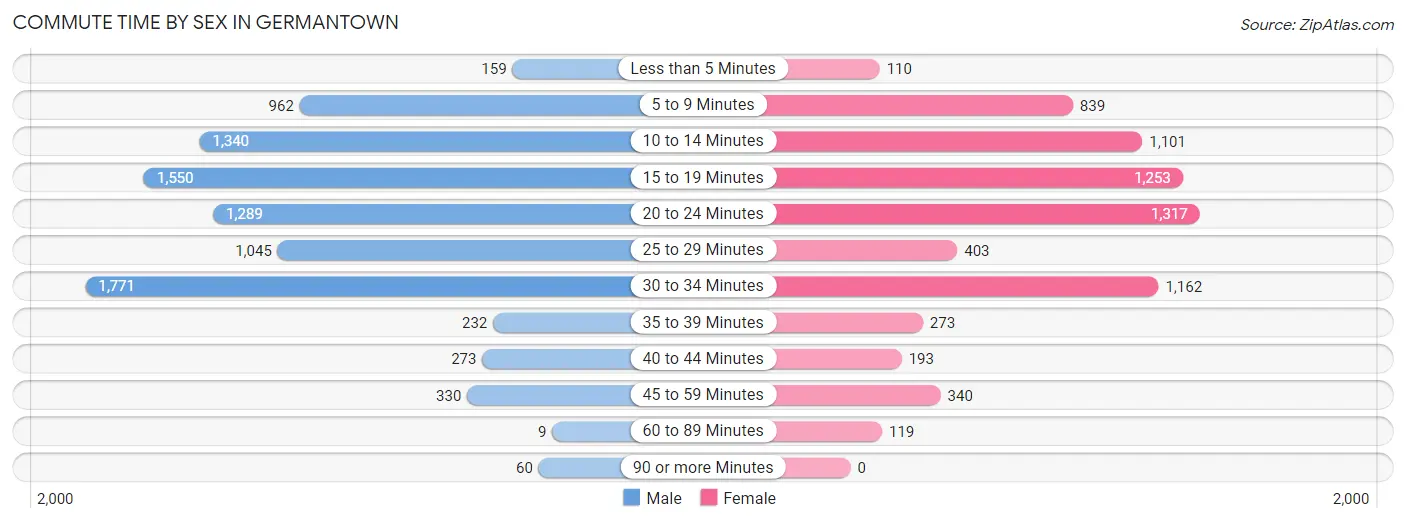
| Commute Time | Male | Female |
| Less than 5 Minutes | 159 (1.8%) | 110 (1.5%) |
| 5 to 9 Minutes | 962 (10.7%) | 839 (11.8%) |
| 10 to 14 Minutes | 1,340 (14.9%) | 1,101 (15.5%) |
| 15 to 19 Minutes | 1,550 (17.2%) | 1,253 (17.6%) |
| 20 to 24 Minutes | 1,289 (14.3%) | 1,317 (18.5%) |
| 25 to 29 Minutes | 1,045 (11.6%) | 403 (5.7%) |
| 30 to 34 Minutes | 1,771 (19.6%) | 1,162 (16.3%) |
| 35 to 39 Minutes | 232 (2.6%) | 273 (3.8%) |
| 40 to 44 Minutes | 273 (3.0%) | 193 (2.7%) |
| 45 to 59 Minutes | 330 (3.7%) | 340 (4.8%) |
| 60 to 89 Minutes | 9 (0.1%) | 119 (1.7%) |
| 90 or more Minutes | 60 (0.7%) | 0 (0.0%) |
Time of Departure to Work by Sex in Germantown
The most frequent times of departure to work in Germantown are 8:00 AM to 8:29 AM (1,815, 20.1%) for males and 8:00 AM to 8:29 AM (1,578, 22.2%) for females.
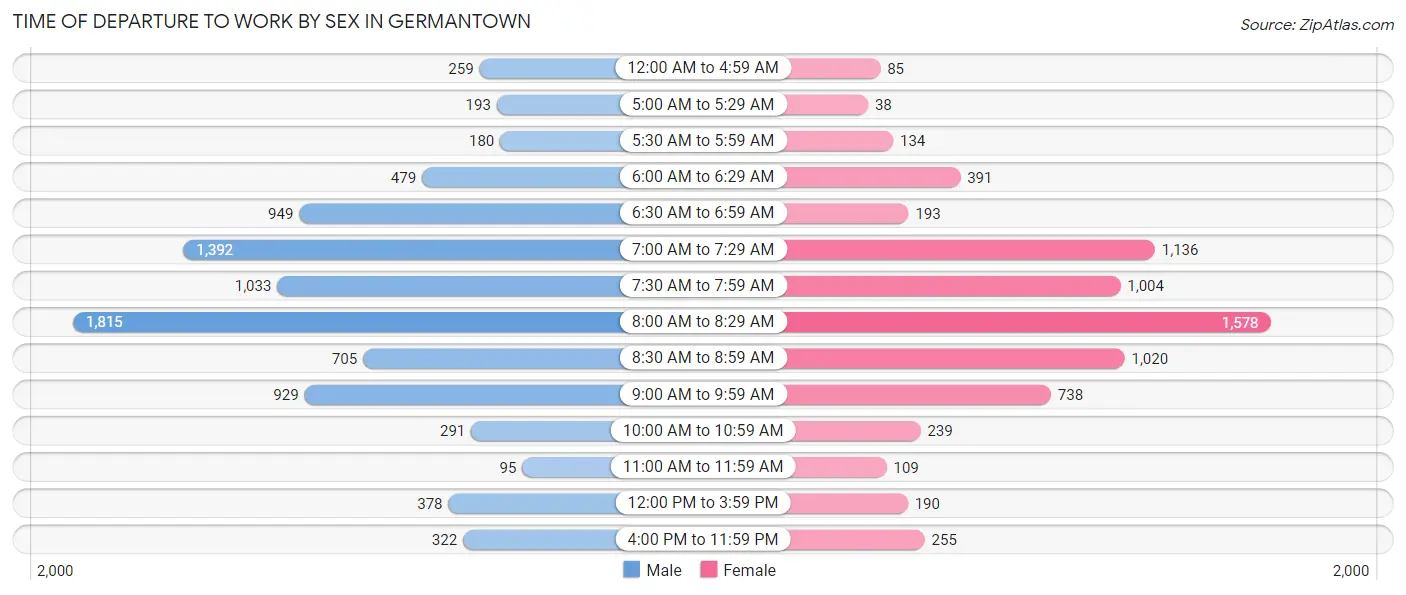
| Time of Departure | Male | Female |
| 12:00 AM to 4:59 AM | 259 (2.9%) | 85 (1.2%) |
| 5:00 AM to 5:29 AM | 193 (2.1%) | 38 (0.5%) |
| 5:30 AM to 5:59 AM | 180 (2.0%) | 134 (1.9%) |
| 6:00 AM to 6:29 AM | 479 (5.3%) | 391 (5.5%) |
| 6:30 AM to 6:59 AM | 949 (10.5%) | 193 (2.7%) |
| 7:00 AM to 7:29 AM | 1,392 (15.4%) | 1,136 (16.0%) |
| 7:30 AM to 7:59 AM | 1,033 (11.5%) | 1,004 (14.1%) |
| 8:00 AM to 8:29 AM | 1,815 (20.1%) | 1,578 (22.2%) |
| 8:30 AM to 8:59 AM | 705 (7.8%) | 1,020 (14.3%) |
| 9:00 AM to 9:59 AM | 929 (10.3%) | 738 (10.4%) |
| 10:00 AM to 10:59 AM | 291 (3.2%) | 239 (3.4%) |
| 11:00 AM to 11:59 AM | 95 (1.1%) | 109 (1.5%) |
| 12:00 PM to 3:59 PM | 378 (4.2%) | 190 (2.7%) |
| 4:00 PM to 11:59 PM | 322 (3.6%) | 255 (3.6%) |
| Total | 9,020 (100.0%) | 7,110 (100.0%) |
Housing Occupancy in Germantown
Occupancy by Ownership in Germantown
Of the total 15,376 dwellings in Germantown, owner-occupied units account for 13,468 (87.6%), while renter-occupied units make up 1,908 (12.4%).
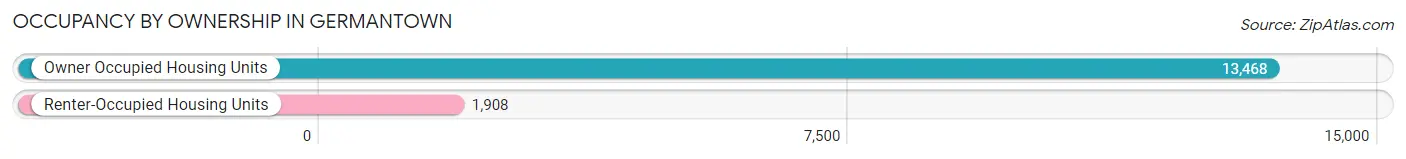
| Occupancy | # Housing Units | % Housing Units |
| Owner Occupied Housing Units | 13,468 | 87.6% |
| Renter-Occupied Housing Units | 1,908 | 12.4% |
| Total Occupied Housing Units | 15,376 | 100.0% |
Occupancy by Household Size in Germantown
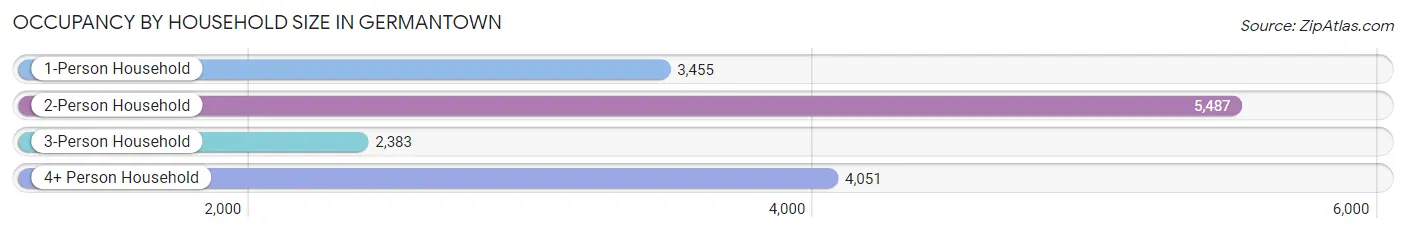
| Household Size | # Housing Units | % Housing Units |
| 1-Person Household | 3,455 | 22.5% |
| 2-Person Household | 5,487 | 35.7% |
| 3-Person Household | 2,383 | 15.5% |
| 4+ Person Household | 4,051 | 26.4% |
| Total Housing Units | 15,376 | 100.0% |
Occupancy by Ownership by Household Size in Germantown
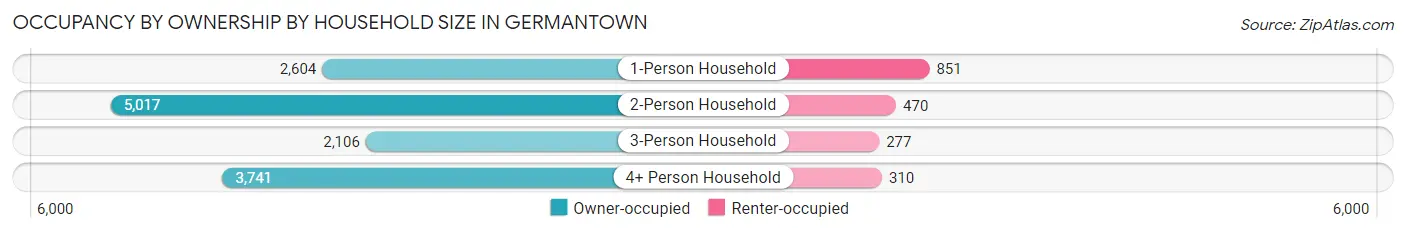
| Household Size | Owner-occupied | Renter-occupied |
| 1-Person Household | 2,604 (75.4%) | 851 (24.6%) |
| 2-Person Household | 5,017 (91.4%) | 470 (8.6%) |
| 3-Person Household | 2,106 (88.4%) | 277 (11.6%) |
| 4+ Person Household | 3,741 (92.3%) | 310 (7.6%) |
| Total Housing Units | 13,468 (87.6%) | 1,908 (12.4%) |
Occupancy by Educational Attainment in Germantown
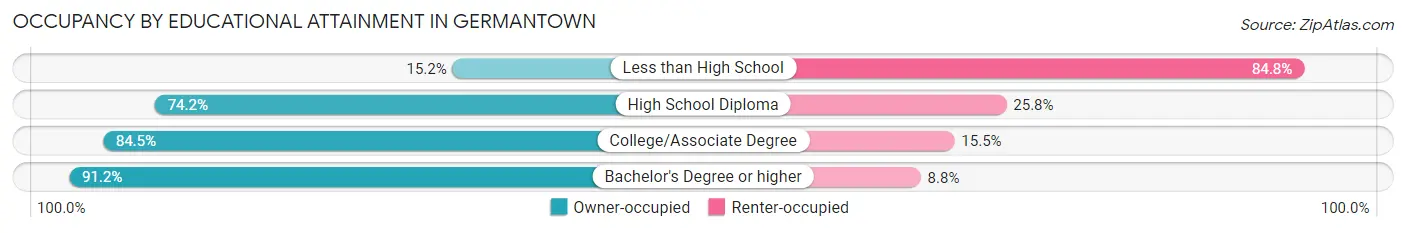
| Household Size | Owner-occupied | Renter-occupied |
| Less than High School | 37 (15.2%) | 207 (84.8%) |
| High School Diploma | 707 (74.2%) | 246 (25.8%) |
| College/Associate Degree | 2,576 (84.5%) | 473 (15.5%) |
| Bachelor's Degree or higher | 10,148 (91.2%) | 982 (8.8%) |
Occupancy by Age of Householder in Germantown
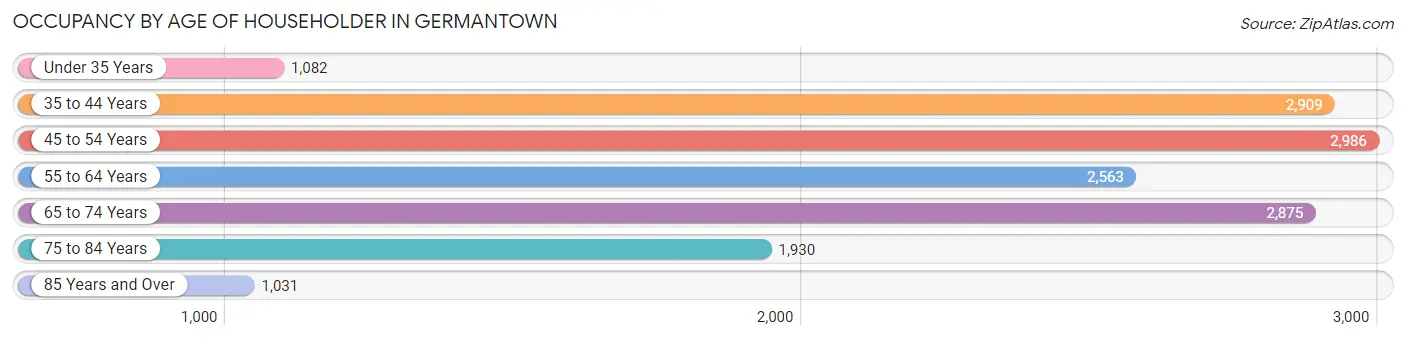
| Age Bracket | # Households | % Households |
| Under 35 Years | 1,082 | 7.0% |
| 35 to 44 Years | 2,909 | 18.9% |
| 45 to 54 Years | 2,986 | 19.4% |
| 55 to 64 Years | 2,563 | 16.7% |
| 65 to 74 Years | 2,875 | 18.7% |
| 75 to 84 Years | 1,930 | 12.6% |
| 85 Years and Over | 1,031 | 6.7% |
| Total | 15,376 | 100.0% |
Housing Finances in Germantown
Median Income by Occupancy in Germantown
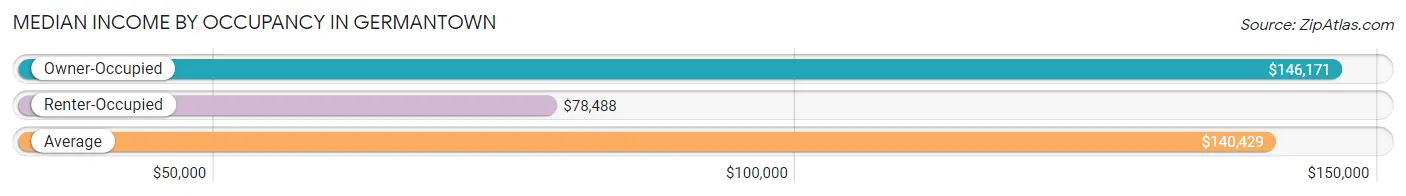
| Occupancy Type | # Households | Median Income |
| Owner-Occupied | 13,468 (87.6%) | $146,171 |
| Renter-Occupied | 1,908 (12.4%) | $78,488 |
| Average | 15,376 (100.0%) | $140,429 |
Occupancy by Householder Income Bracket in Germantown
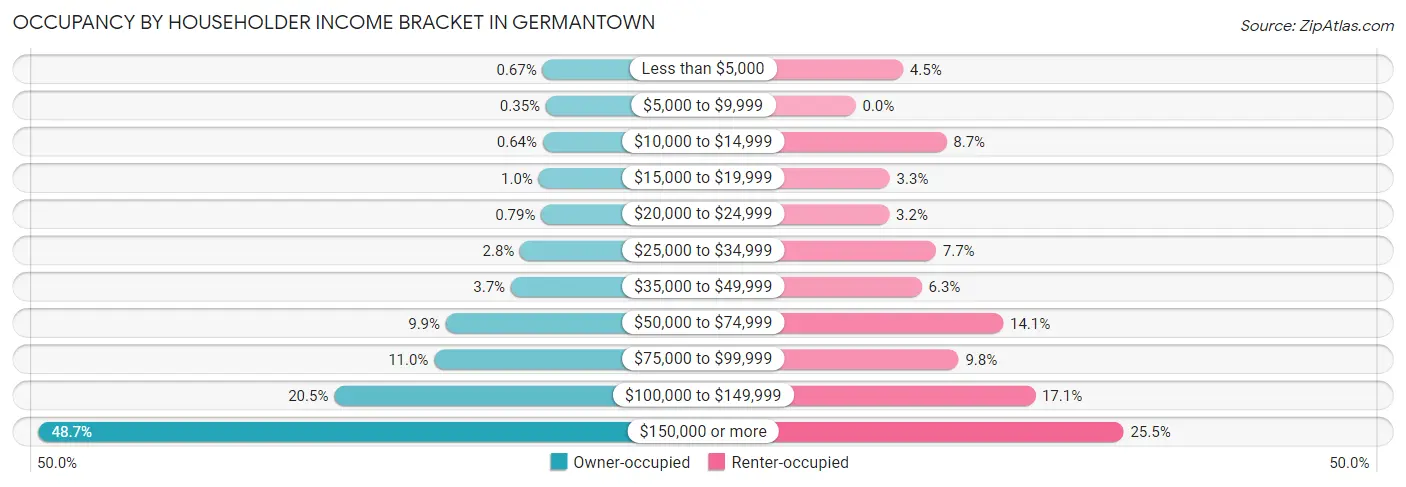
| Income Bracket | Owner-occupied | Renter-occupied |
| Less than $5,000 | 90 (0.7%) | 86 (4.5%) |
| $5,000 to $9,999 | 47 (0.4%) | 0 (0.0%) |
| $10,000 to $14,999 | 86 (0.6%) | 165 (8.6%) |
| $15,000 to $19,999 | 140 (1.0%) | 62 (3.3%) |
| $20,000 to $24,999 | 106 (0.8%) | 61 (3.2%) |
| $25,000 to $34,999 | 377 (2.8%) | 146 (7.6%) |
| $35,000 to $49,999 | 496 (3.7%) | 120 (6.3%) |
| $50,000 to $74,999 | 1,330 (9.9%) | 268 (14.1%) |
| $75,000 to $99,999 | 1,480 (11.0%) | 187 (9.8%) |
| $100,000 to $149,999 | 2,762 (20.5%) | 326 (17.1%) |
| $150,000 or more | 6,554 (48.7%) | 487 (25.5%) |
| Total | 13,468 (100.0%) | 1,908 (100.0%) |
Monthly Housing Cost Tiers in Germantown
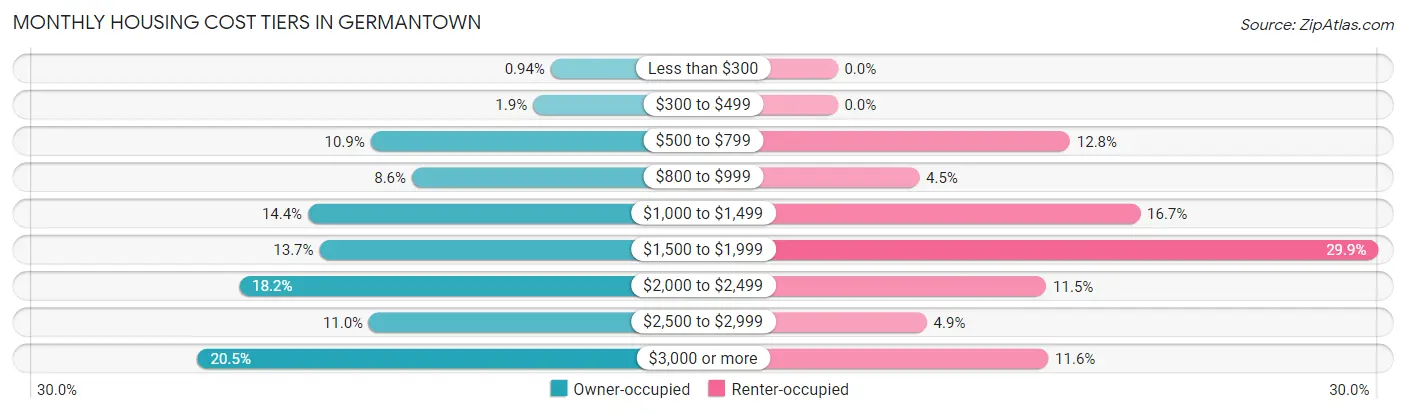
| Monthly Cost | Owner-occupied | Renter-occupied |
| Less than $300 | 126 (0.9%) | 0 (0.0%) |
| $300 to $499 | 259 (1.9%) | 0 (0.0%) |
| $500 to $799 | 1,466 (10.9%) | 245 (12.8%) |
| $800 to $999 | 1,159 (8.6%) | 86 (4.5%) |
| $1,000 to $1,499 | 1,933 (14.3%) | 319 (16.7%) |
| $1,500 to $1,999 | 1,848 (13.7%) | 570 (29.9%) |
| $2,000 to $2,499 | 2,444 (18.1%) | 220 (11.5%) |
| $2,500 to $2,999 | 1,479 (11.0%) | 94 (4.9%) |
| $3,000 or more | 2,754 (20.4%) | 222 (11.6%) |
| Total | 13,468 (100.0%) | 1,908 (100.0%) |
Physical Housing Characteristics in Germantown
Housing Structures in Germantown
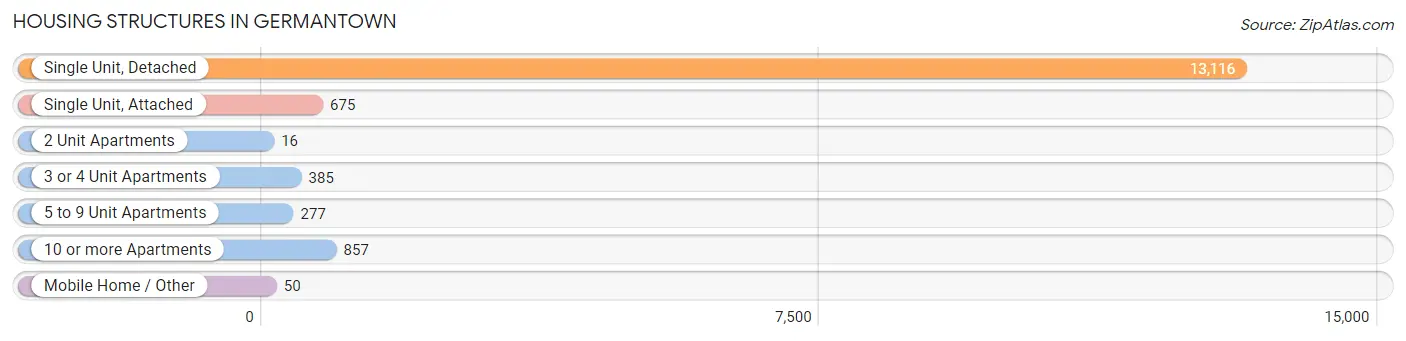
| Structure Type | # Housing Units | % Housing Units |
| Single Unit, Detached | 13,116 | 85.3% |
| Single Unit, Attached | 675 | 4.4% |
| 2 Unit Apartments | 16 | 0.1% |
| 3 or 4 Unit Apartments | 385 | 2.5% |
| 5 to 9 Unit Apartments | 277 | 1.8% |
| 10 or more Apartments | 857 | 5.6% |
| Mobile Home / Other | 50 | 0.3% |
| Total | 15,376 | 100.0% |
Housing Structures by Occupancy in Germantown
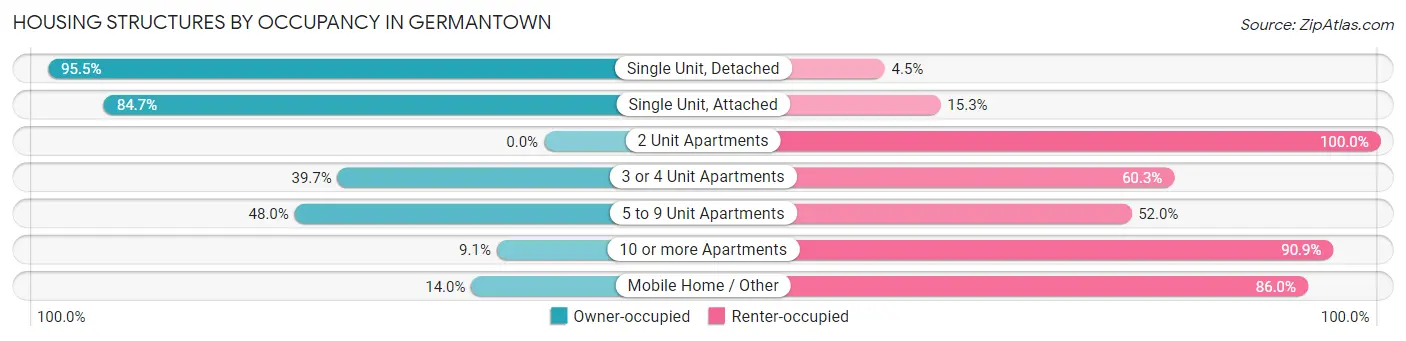
| Structure Type | Owner-occupied | Renter-occupied |
| Single Unit, Detached | 12,525 (95.5%) | 591 (4.5%) |
| Single Unit, Attached | 572 (84.7%) | 103 (15.3%) |
| 2 Unit Apartments | 0 (0.0%) | 16 (100.0%) |
| 3 or 4 Unit Apartments | 153 (39.7%) | 232 (60.3%) |
| 5 to 9 Unit Apartments | 133 (48.0%) | 144 (52.0%) |
| 10 or more Apartments | 78 (9.1%) | 779 (90.9%) |
| Mobile Home / Other | 7 (14.0%) | 43 (86.0%) |
| Total | 13,468 (87.6%) | 1,908 (12.4%) |
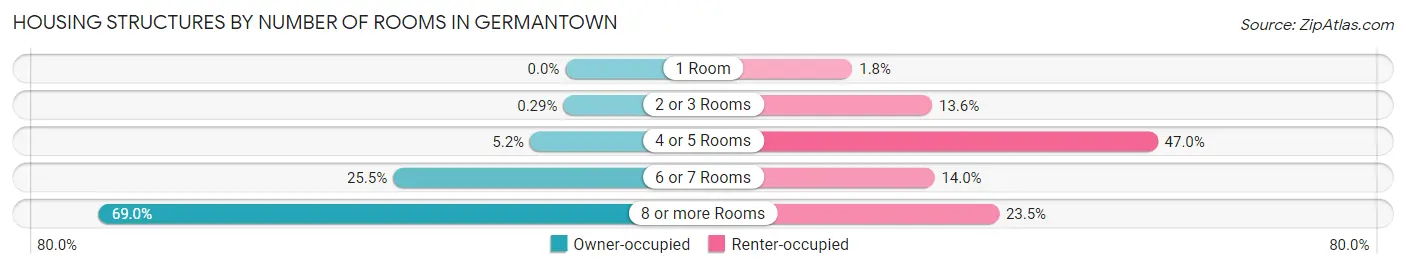
Housing Structures by Number of Rooms in Germantown
| Number of Rooms | Owner-occupied | Renter-occupied |
| 1 Room | 0 (0.0%) | 35 (1.8%) |
| 2 or 3 Rooms | 39 (0.3%) | 260 (13.6%) |
| 4 or 5 Rooms | 703 (5.2%) | 897 (47.0%) |
| 6 or 7 Rooms | 3,431 (25.5%) | 267 (14.0%) |
| 8 or more Rooms | 9,295 (69.0%) | 449 (23.5%) |
| Total | 13,468 (100.0%) | 1,908 (100.0%) |
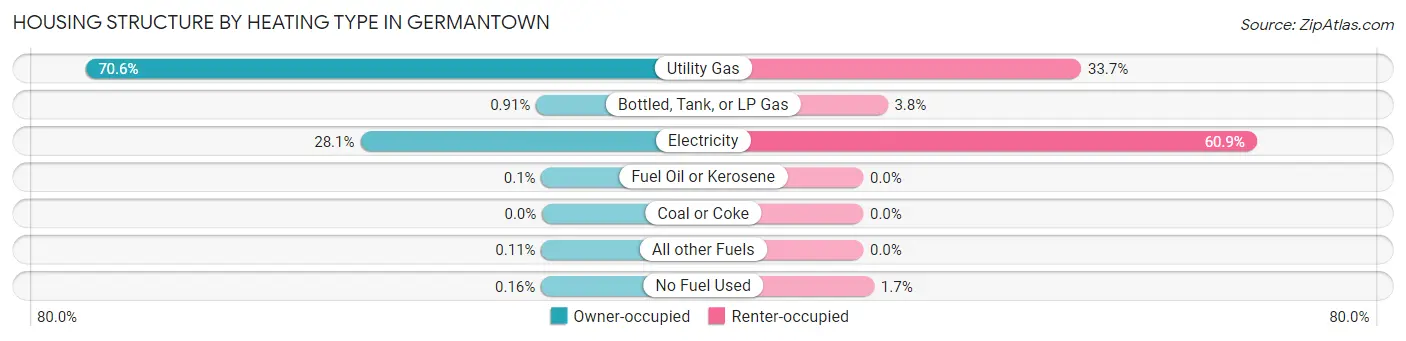
Housing Structure by Heating Type in Germantown
| Heating Type | Owner-occupied | Renter-occupied |
| Utility Gas | 9,512 (70.6%) | 643 (33.7%) |
| Bottled, Tank, or LP Gas | 123 (0.9%) | 72 (3.8%) |
| Electricity | 3,784 (28.1%) | 1,161 (60.9%) |
| Fuel Oil or Kerosene | 13 (0.1%) | 0 (0.0%) |
| Coal or Coke | 0 (0.0%) | 0 (0.0%) |
| All other Fuels | 15 (0.1%) | 0 (0.0%) |
| No Fuel Used | 21 (0.2%) | 32 (1.7%) |
| Total | 13,468 (100.0%) | 1,908 (100.0%) |
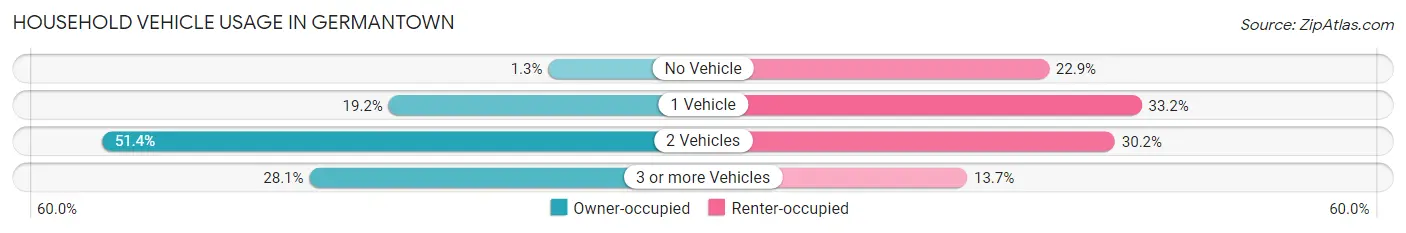
Household Vehicle Usage in Germantown
| Vehicles per Household | Owner-occupied | Renter-occupied |
| No Vehicle | 180 (1.3%) | 436 (22.9%) |
| 1 Vehicle | 2,588 (19.2%) | 634 (33.2%) |
| 2 Vehicles | 6,916 (51.3%) | 577 (30.2%) |
| 3 or more Vehicles | 3,784 (28.1%) | 261 (13.7%) |
| Total | 13,468 (100.0%) | 1,908 (100.0%) |
Real Estate & Mortgages in Germantown
Real Estate and Mortgage Overview in Germantown
| Characteristic | Without Mortgage | With Mortgage |
| Housing Units | 4,467 | 9,001 |
| Median Property Value | $411,600 | $398,500 |
| Median Household Income | $119,885 | $4,914 |
| Monthly Housing Costs | $859 | $2,724 |
| Real Estate Taxes | $4,605 | $176 |
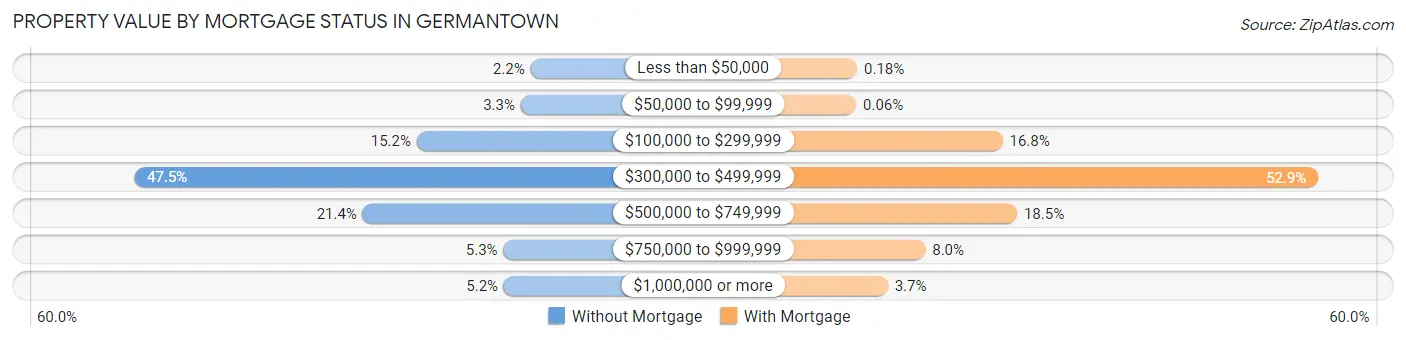
Property Value by Mortgage Status in Germantown
| Property Value | Without Mortgage | With Mortgage |
| Less than $50,000 | 97 (2.2%) | 16 (0.2%) |
| $50,000 to $99,999 | 147 (3.3%) | 5 (0.1%) |
| $100,000 to $299,999 | 678 (15.2%) | 1,512 (16.8%) |
| $300,000 to $499,999 | 2,122 (47.5%) | 4,759 (52.9%) |
| $500,000 to $749,999 | 954 (21.4%) | 1,661 (18.4%) |
| $750,000 to $999,999 | 236 (5.3%) | 717 (8.0%) |
| $1,000,000 or more | 233 (5.2%) | 331 (3.7%) |
| Total | 4,467 (100.0%) | 9,001 (100.0%) |
Household Income by Mortgage Status in Germantown
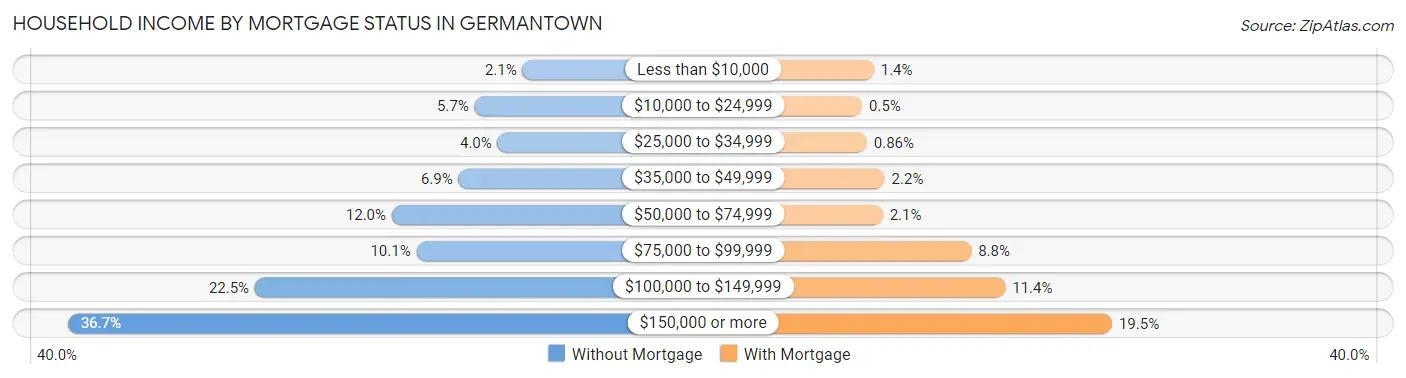
| Household Income | Without Mortgage | With Mortgage |
| Less than $10,000 | 92 (2.1%) | 125 (1.4%) |
| $10,000 to $24,999 | 255 (5.7%) | 45 (0.5%) |
| $25,000 to $34,999 | 177 (4.0%) | 77 (0.9%) |
| $35,000 to $49,999 | 310 (6.9%) | 200 (2.2%) |
| $50,000 to $74,999 | 537 (12.0%) | 186 (2.1%) |
| $75,000 to $99,999 | 453 (10.1%) | 793 (8.8%) |
| $100,000 to $149,999 | 1,003 (22.5%) | 1,027 (11.4%) |
| $150,000 or more | 1,640 (36.7%) | 1,759 (19.5%) |
| Total | 4,467 (100.0%) | 9,001 (100.0%) |
Property Value to Household Income Ratio in Germantown
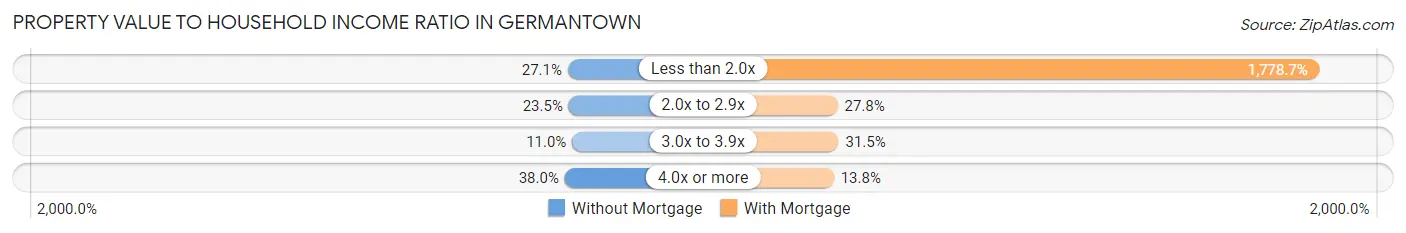
| Value-to-Income Ratio | Without Mortgage | With Mortgage |
| Less than 2.0x | 1,210 (27.1%) | 160,104 (1,778.7%) |
| 2.0x to 2.9x | 1,050 (23.5%) | 2,506 (27.8%) |
| 3.0x to 3.9x | 490 (11.0%) | 2,831 (31.5%) |
| 4.0x or more | 1,699 (38.0%) | 1,245 (13.8%) |
| Total | 4,467 (100.0%) | 9,001 (100.0%) |
Real Estate Taxes by Mortgage Status in Germantown
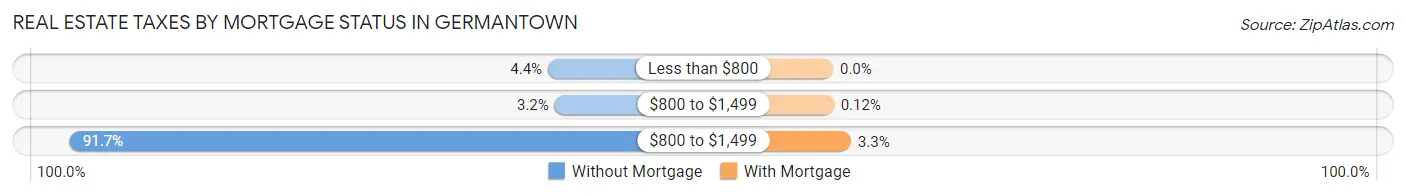
| Property Taxes | Without Mortgage | With Mortgage |
| Less than $800 | 197 (4.4%) | 0 (0.0%) |
| $800 to $1,499 | 143 (3.2%) | 11 (0.1%) |
| $800 to $1,499 | 4,097 (91.7%) | 293 (3.3%) |
| Total | 4,467 (100.0%) | 9,001 (100.0%) |
Health & Disability in Germantown
Health Insurance Coverage by Age in Germantown
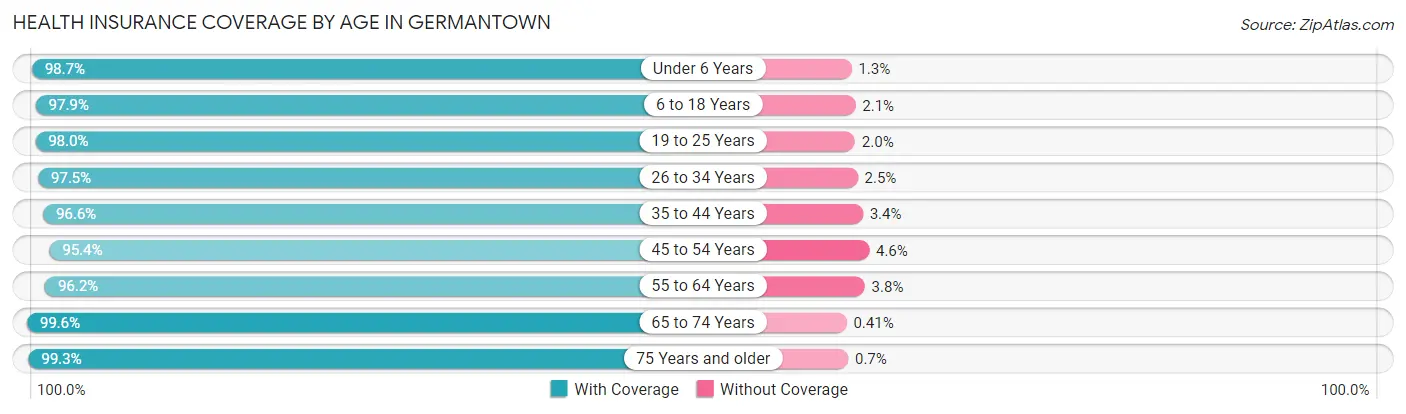
| Age Bracket | With Coverage | Without Coverage |
| Under 6 Years | 3,192 (98.7%) | 43 (1.3%) |
| 6 to 18 Years | 8,359 (97.9%) | 176 (2.1%) |
| 19 to 25 Years | 1,389 (98.0%) | 28 (2.0%) |
| 26 to 34 Years | 2,554 (97.5%) | 65 (2.5%) |
| 35 to 44 Years | 5,750 (96.6%) | 204 (3.4%) |
| 45 to 54 Years | 5,030 (95.4%) | 243 (4.6%) |
| 55 to 64 Years | 4,434 (96.2%) | 175 (3.8%) |
| 65 to 74 Years | 5,109 (99.6%) | 21 (0.4%) |
| 75 Years and older | 4,111 (99.3%) | 29 (0.7%) |
| Total | 39,928 (97.6%) | 984 (2.4%) |
Health Insurance Coverage by Citizenship Status in Germantown
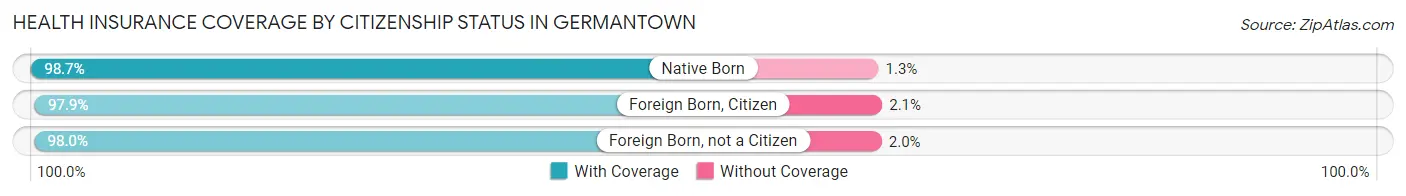
| Citizenship Status | With Coverage | Without Coverage |
| Native Born | 3,192 (98.7%) | 43 (1.3%) |
| Foreign Born, Citizen | 8,359 (97.9%) | 176 (2.1%) |
| Foreign Born, not a Citizen | 1,389 (98.0%) | 28 (2.0%) |
Health Insurance Coverage by Household Income in Germantown
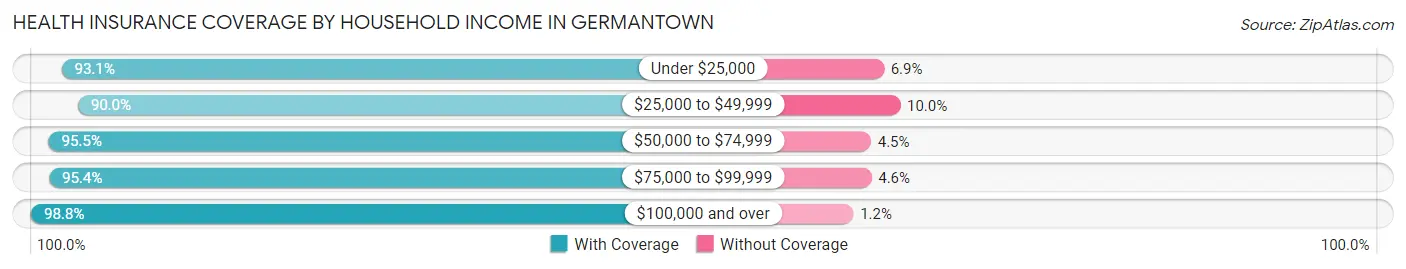
| Household Income | With Coverage | Without Coverage |
| Under $25,000 | 1,129 (93.1%) | 84 (6.9%) |
| $25,000 to $49,999 | 1,670 (90.0%) | 185 (10.0%) |
| $50,000 to $74,999 | 3,373 (95.5%) | 159 (4.5%) |
| $75,000 to $99,999 | 3,969 (95.4%) | 191 (4.6%) |
| $100,000 and over | 29,786 (98.8%) | 365 (1.2%) |
Public vs Private Health Insurance Coverage by Age in Germantown
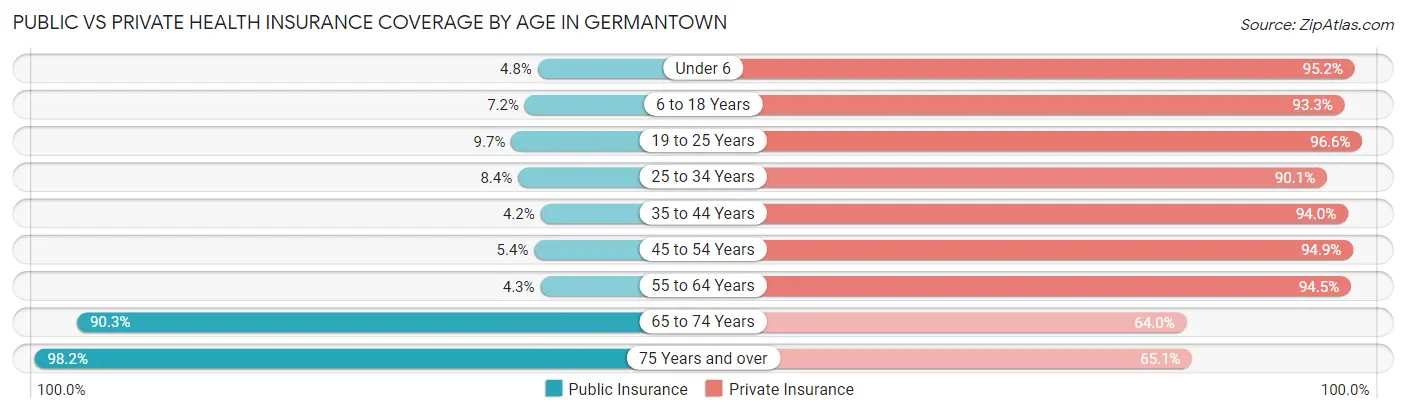
| Age Bracket | Public Insurance | Private Insurance |
| Under 6 | 154 (4.8%) | 3,080 (95.2%) |
| 6 to 18 Years | 610 (7.1%) | 7,966 (93.3%) |
| 19 to 25 Years | 137 (9.7%) | 1,369 (96.6%) |
| 25 to 34 Years | 220 (8.4%) | 2,359 (90.1%) |
| 35 to 44 Years | 252 (4.2%) | 5,594 (94.0%) |
| 45 to 54 Years | 285 (5.4%) | 5,005 (94.9%) |
| 55 to 64 Years | 197 (4.3%) | 4,356 (94.5%) |
| 65 to 74 Years | 4,631 (90.3%) | 3,283 (64.0%) |
| 75 Years and over | 4,064 (98.2%) | 2,694 (65.1%) |
| Total | 10,550 (25.8%) | 35,706 (87.3%) |
Disability Status by Sex by Age in Germantown
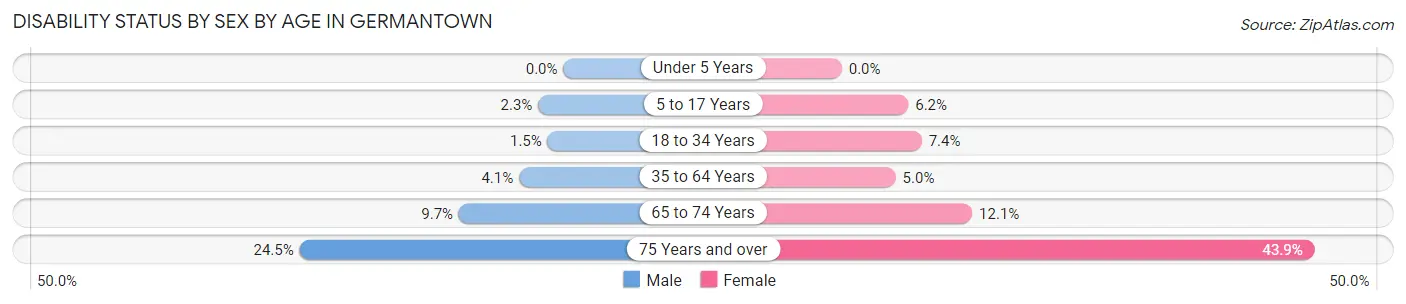
| Age Bracket | Male | Female |
| Under 5 Years | 0 (0.0%) | 0 (0.0%) |
| 5 to 17 Years | 103 (2.3%) | 264 (6.2%) |
| 18 to 34 Years | 37 (1.5%) | 155 (7.4%) |
| 35 to 64 Years | 320 (4.1%) | 402 (5.0%) |
| 65 to 74 Years | 232 (9.7%) | 331 (12.1%) |
| 75 Years and over | 469 (24.5%) | 976 (43.9%) |
Disability Class by Sex by Age in Germantown
Disability Class: Hearing Difficulty
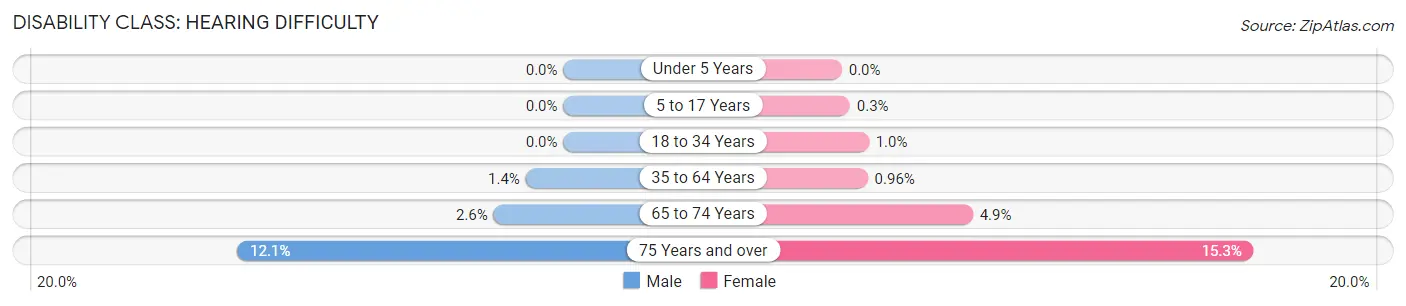
| Age Bracket | Male | Female |
| Under 5 Years | 0 (0.0%) | 0 (0.0%) |
| 5 to 17 Years | 0 (0.0%) | 13 (0.3%) |
| 18 to 34 Years | 0 (0.0%) | 21 (1.0%) |
| 35 to 64 Years | 109 (1.4%) | 77 (1.0%) |
| 65 to 74 Years | 62 (2.6%) | 133 (4.9%) |
| 75 Years and over | 232 (12.1%) | 340 (15.3%) |
Disability Class: Vision Difficulty
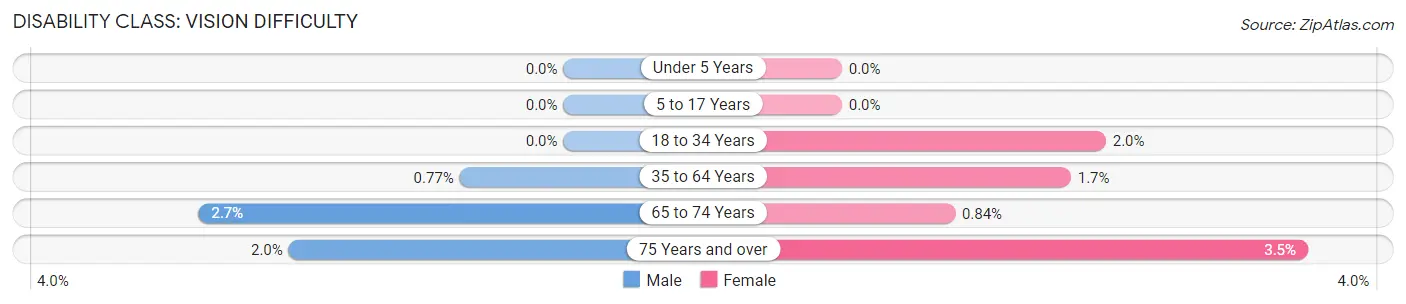
| Age Bracket | Male | Female |
| Under 5 Years | 0 (0.0%) | 0 (0.0%) |
| 5 to 17 Years | 0 (0.0%) | 0 (0.0%) |
| 18 to 34 Years | 0 (0.0%) | 41 (2.0%) |
| 35 to 64 Years | 60 (0.8%) | 137 (1.7%) |
| 65 to 74 Years | 65 (2.7%) | 23 (0.8%) |
| 75 Years and over | 39 (2.0%) | 77 (3.5%) |
Disability Class: Cognitive Difficulty
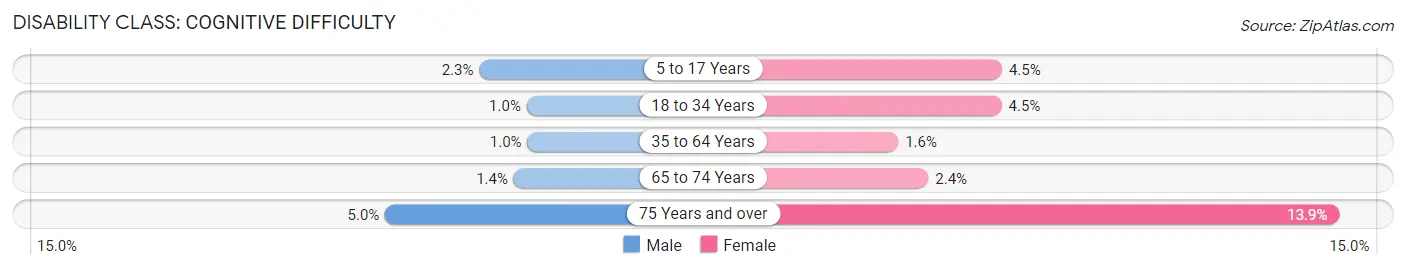
| Age Bracket | Male | Female |
| 5 to 17 Years | 103 (2.3%) | 191 (4.5%) |
| 18 to 34 Years | 26 (1.0%) | 93 (4.4%) |
| 35 to 64 Years | 78 (1.0%) | 126 (1.6%) |
| 65 to 74 Years | 33 (1.4%) | 66 (2.4%) |
| 75 Years and over | 95 (5.0%) | 308 (13.9%) |
Disability Class: Ambulatory Difficulty
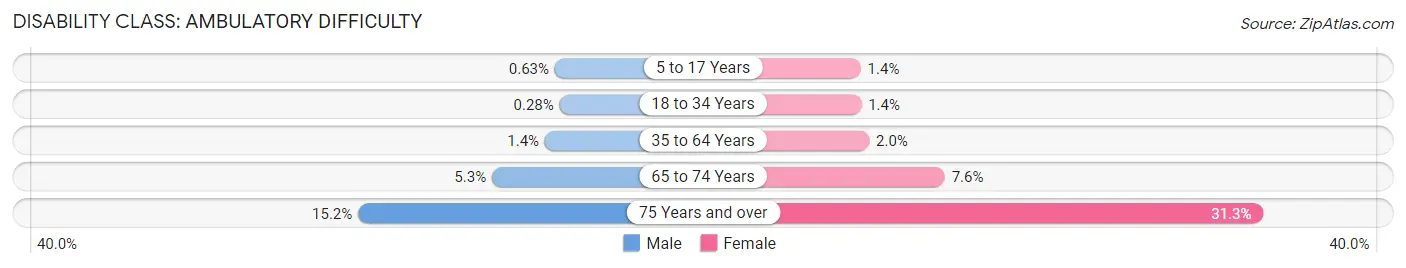
| Age Bracket | Male | Female |
| 5 to 17 Years | 28 (0.6%) | 60 (1.4%) |
| 18 to 34 Years | 7 (0.3%) | 30 (1.4%) |
| 35 to 64 Years | 107 (1.4%) | 163 (2.0%) |
| 65 to 74 Years | 127 (5.3%) | 209 (7.6%) |
| 75 Years and over | 292 (15.2%) | 696 (31.3%) |
Disability Class: Self-Care Difficulty
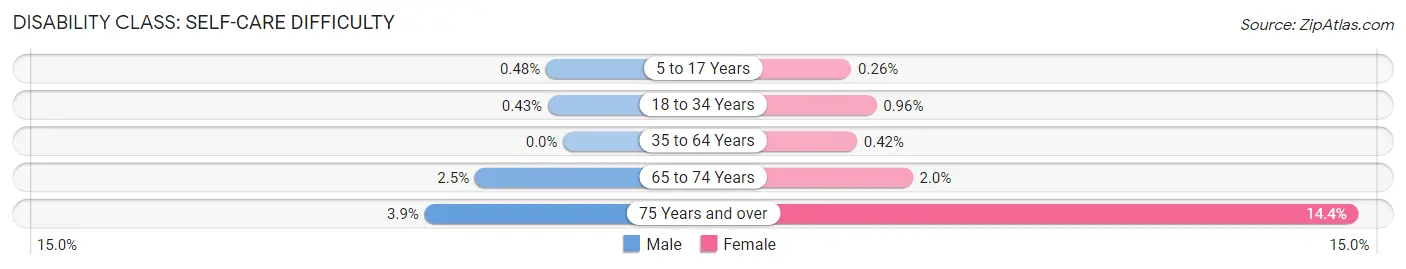
| Age Bracket | Male | Female |
| 5 to 17 Years | 21 (0.5%) | 11 (0.3%) |
| 18 to 34 Years | 11 (0.4%) | 20 (1.0%) |
| 35 to 64 Years | 0 (0.0%) | 34 (0.4%) |
| 65 to 74 Years | 59 (2.5%) | 54 (2.0%) |
| 75 Years and over | 74 (3.9%) | 320 (14.4%) |
Technology Access in Germantown
Computing Device Access in Germantown
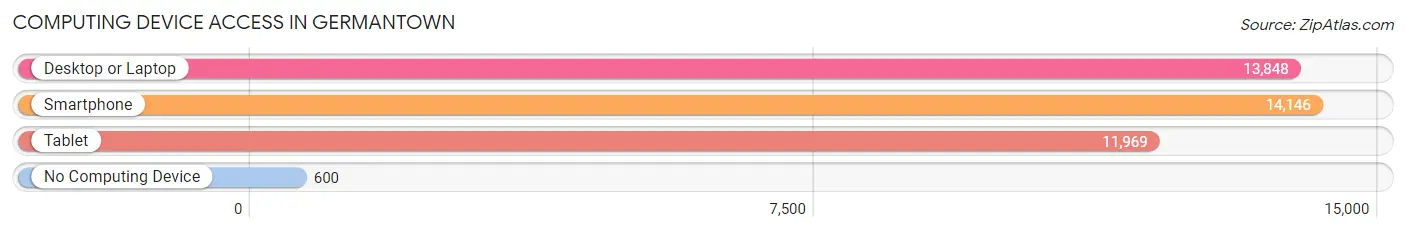
| Device Type | # Households | % Households |
| Desktop or Laptop | 13,848 | 90.1% |
| Smartphone | 14,146 | 92.0% |
| Tablet | 11,969 | 77.8% |
| No Computing Device | 600 | 3.9% |
| Total | 15,376 | 100.0% |
Internet Access in Germantown
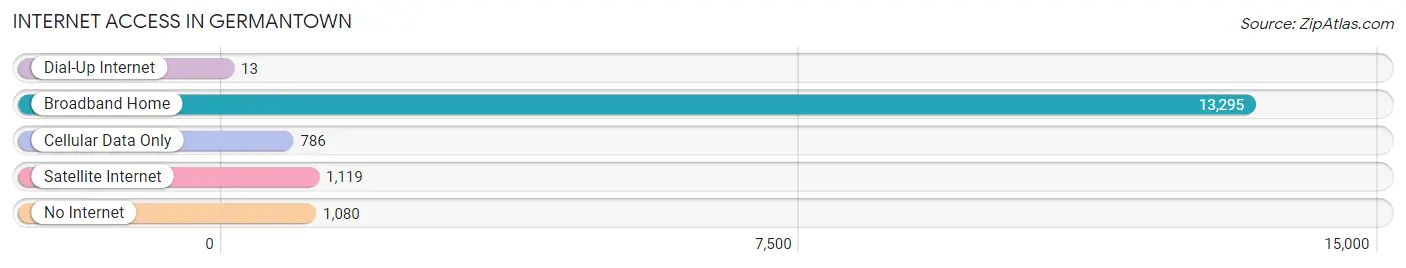
| Internet Type | # Households | % Households |
| Dial-Up Internet | 13 | 0.1% |
| Broadband Home | 13,295 | 86.5% |
| Cellular Data Only | 786 | 5.1% |
| Satellite Internet | 1,119 | 7.3% |
| No Internet | 1,080 | 7.0% |
| Total | 15,376 | 100.0% |
Germantown Summary
Germantown is a city in Shelby County, Tennessee, United States. The population was 38,844 at the 2010 census. Germantown is an affluent suburb of Memphis, bordering it to the east-southeast.
History
Germantown was founded in 1825 by German immigrants. The city was named after the German city of the same name, which was the hometown of the first settlers. The original settlers of Germantown were mostly farmers, and the city was known for its agricultural production.
In the late 19th century, Germantown began to grow rapidly as Memphis expanded. The city was incorporated in 1841 and was the first suburb of Memphis. In the early 20th century, Germantown became a popular destination for wealthy Memphians, and the city's population grew rapidly.
Geography
Germantown is located in the southeastern corner of Shelby County, Tennessee, at 35°6′39″N 89°47′24″W (35.1108, -89.7900). It is bordered to the east and southeast by the city of Memphis, to the north by the city of Bartlett, to the west by the unincorporated communities of Cordova and Fisherville, and to the south by the unincorporated community of Piperton.
Germantown covers an area of 17.6 square miles (45.6 km2), of which 17.5 square miles (45.3 km2) is land and 0.1 square miles (0.3 km2) is water.
Economy
Germantown is a prosperous suburb of Memphis and is home to many corporate headquarters and regional offices. The city's largest employers include FedEx, International Paper, and AutoZone. Germantown is also home to several medical centers, including Baptist Memorial Hospital-Germantown and Methodist Le Bonheur Germantown Hospital.
Germantown is home to several shopping centers, including Germantown Town Center, Saddle Creek, and Shops of Saddle Creek. The city also has a vibrant restaurant scene, with many popular restaurants located in the city's historic downtown area.
Demographics
As of the 2010 census, there were 38,844 people, 14,717 households, and 10,945 families residing in the city. The population density was 2,219.2 people per square mile (856.2/km2). There were 15,817 housing units at an average density of 899.3 per square mile (347.2/km2). The racial makeup of the city was 79.2% White, 11.2% African American, 0.2% Native American, 6.2% Asian, 0.1% Pacific Islander, 1.3% from other races, and 2.0% from two or more races. Hispanic or Latino of any race were 3.7% of the population.
There were 14,717 households, out of which 40.2% had children under the age of 18 living with them, 63.2% were married couples living together, 8.2% had a female householder with no husband present, and 25.2% were non-families. 21.2% of all households were made up of individuals, and 6.7% had someone living alone who was 65 years of age or older. The average household size was 2.63 and the average family size was 3.09.
In the city, the population was spread out, with 28.2% under the age of 18, 5.7% from 18 to 24, 30.2% from 25 to 44, 25.7% from 45 to 64, and 10.2% who were 65 years of age or older. The median age was 38 years. For every 100 females, there were 93.2 males. For every 100 females age 18 and over, there were 89.2 males.
The median income for a household in the city was $76,843, and the median income for a family was $86,717. Males had a median income of $60,988 versus $41,964 for females. The per capita income for the city was $37,945. About 3.2% of families and 4.3% of the population were below the poverty line, including 5.2% of those under age 18 and 4.2% of those age 65 or over.
Common Questions
What is Per Capita Income in Germantown?
Per Capita income in Germantown is $71,070.
What is the Median Family Income in Germantown?
Median Family Income in Germantown is $163,424.
What is the Median Household income in Germantown?
Median Household Income in Germantown is $140,429.
What is Income or Wage Gap in Germantown?
Income or Wage Gap in Germantown is 40.0%.
Women in Germantown earn 60.0 cents for every dollar earned by a man.
What is Family Income Deficit in Germantown?
Family Income Deficit in Germantown is $13,396.
Families that are below poverty line in Germantown earn $13,396 less on average than the poverty threshold level.
What is Inequality or Gini Index in Germantown?
Inequality or Gini Index in Germantown is 0.45.
What is the Total Population of Germantown?
Total Population of Germantown is 41,094.
What is the Total Male Population of Germantown?
Total Male Population of Germantown is 20,172.
What is the Total Female Population of Germantown?
Total Female Population of Germantown is 20,922.
What is the Ratio of Males per 100 Females in Germantown?
There are 96.42 Males per 100 Females in Germantown.
What is the Ratio of Females per 100 Males in Germantown?
There are 103.72 Females per 100 Males in Germantown.
What is the Median Population Age in Germantown?
Median Population Age in Germantown is 43.5 Years.
What is the Average Family Size in Germantown
Average Family Size in Germantown is 3.1 People.
What is the Average Household Size in Germantown
Average Household Size in Germantown is 2.7 People.
How Large is the Labor Force in Germantown?
There are 19,541 People in the Labor Forcein in Germantown.
What is the Percentage of People in the Labor Force in Germantown?
61.8% of People are in the Labor Force in Germantown.
What is the Unemployment Rate in Germantown?
Unemployment Rate in Germantown is 2.8%.