Lancaster, NH Map & Demographics
Lancaster Map
Lancaster Overview
$32,082
PER CAPITA INCOME
$90,870
AVG FAMILY INCOME
$67,331
AVG HOUSEHOLD INCOME
36.6%
WAGE / INCOME GAP [ % ]
63.4¢/ $1
WAGE / INCOME GAP [ $ ]
0.35
INEQUALITY / GINI INDEX
2,260
TOTAL POPULATION
1,108
MALE POPULATION
1,152
FEMALE POPULATION
96.18
MALES / 100 FEMALES
103.97
FEMALES / 100 MALES
41.3
MEDIAN AGE
3.2
AVG FAMILY SIZE
2.5
AVG HOUSEHOLD SIZE
1,134
LABOR FORCE [ PEOPLE ]
63.7%
PERCENT IN LABOR FORCE
2.6%
UNEMPLOYMENT RATE
Lancaster Zip Codes
Lancaster Area Codes
Income in Lancaster
Income Overview in Lancaster
Per Capita Income in Lancaster is $32,082, while median incomes of families and households are $90,870 and $67,331 respectively.
| Characteristic | Number | Measure |
| Per Capita Income | 2,260 | $32,082 |
| Median Family Income | 488 | $90,870 |
| Mean Family Income | 488 | $94,084 |
| Median Household Income | 860 | $67,331 |
| Mean Household Income | 860 | $81,424 |
| Income Deficit | 488 | $0 |
| Wage / Income Gap (%) | 2,260 | 36.56% |
| Wage / Income Gap ($) | 2,260 | 63.44¢ per $1 |
| Gini / Inequality Index | 2,260 | 0.35 |
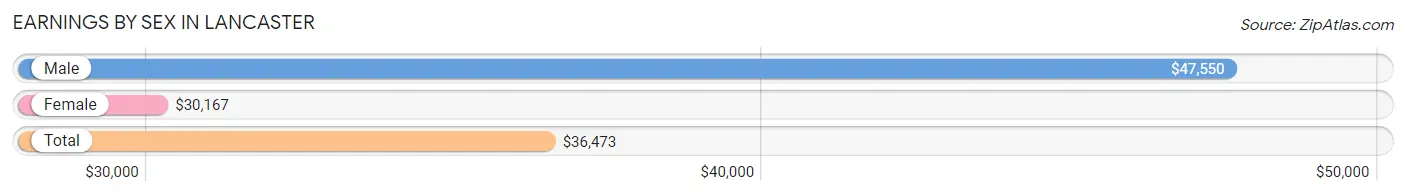
Earnings by Sex in Lancaster
Average Earnings in Lancaster are $36,473, $47,550 for men and $30,167 for women, a difference of 36.6%.
| Sex | Number | Average Earnings |
| Male | 644 (51.2%) | $47,550 |
| Female | 614 (48.8%) | $30,167 |
| Total | 1,258 (100.0%) | $36,473 |
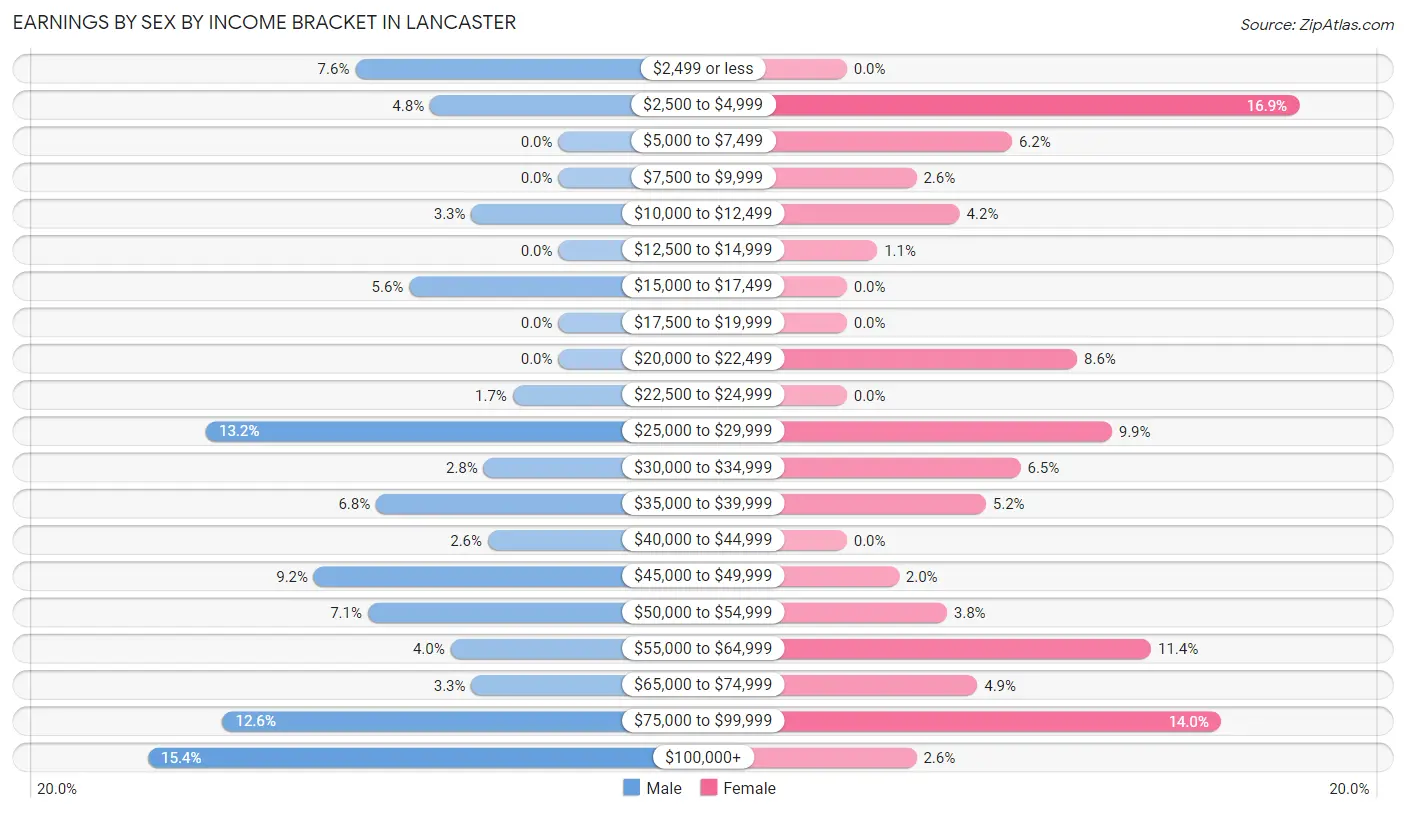
Earnings by Sex by Income Bracket in Lancaster
The most common earnings brackets in Lancaster are $100,000+ for men (99 | 15.4%) and $2,500 to $4,999 for women (104 | 16.9%).
| Income | Male | Female |
| $2,499 or less | 49 (7.6%) | 0 (0.0%) |
| $2,500 to $4,999 | 31 (4.8%) | 104 (16.9%) |
| $5,000 to $7,499 | 0 (0.0%) | 38 (6.2%) |
| $7,500 to $9,999 | 0 (0.0%) | 16 (2.6%) |
| $10,000 to $12,499 | 21 (3.3%) | 26 (4.2%) |
| $12,500 to $14,999 | 0 (0.0%) | 7 (1.1%) |
| $15,000 to $17,499 | 36 (5.6%) | 0 (0.0%) |
| $17,500 to $19,999 | 0 (0.0%) | 0 (0.0%) |
| $20,000 to $22,499 | 0 (0.0%) | 53 (8.6%) |
| $22,500 to $24,999 | 11 (1.7%) | 0 (0.0%) |
| $25,000 to $29,999 | 85 (13.2%) | 61 (9.9%) |
| $30,000 to $34,999 | 18 (2.8%) | 40 (6.5%) |
| $35,000 to $39,999 | 44 (6.8%) | 32 (5.2%) |
| $40,000 to $44,999 | 17 (2.6%) | 0 (0.0%) |
| $45,000 to $49,999 | 59 (9.2%) | 12 (1.9%) |
| $50,000 to $54,999 | 46 (7.1%) | 23 (3.7%) |
| $55,000 to $64,999 | 26 (4.0%) | 70 (11.4%) |
| $65,000 to $74,999 | 21 (3.3%) | 30 (4.9%) |
| $75,000 to $99,999 | 81 (12.6%) | 86 (14.0%) |
| $100,000+ | 99 (15.4%) | 16 (2.6%) |
| Total | 644 (100.0%) | 614 (100.0%) |
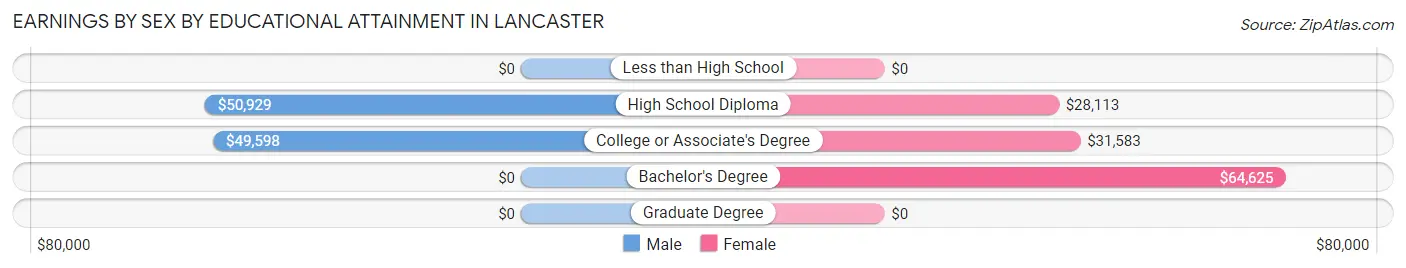
Earnings by Sex by Educational Attainment in Lancaster
Average earnings in Lancaster are $49,375 for men and $35,000 for women, a difference of 29.1%. Men with an educational attainment of high school diploma enjoy the highest average annual earnings of $50,929, while those with college or associate's degree education earn the least with $49,598. Women with an educational attainment of bachelor's degree earn the most with the average annual earnings of $64,625, while those with high school diploma education have the smallest earnings of $28,113.
| Educational Attainment | Male Income | Female Income |
| Less than High School | - | - |
| High School Diploma | $50,929 | $28,113 |
| College or Associate's Degree | $49,598 | $31,583 |
| Bachelor's Degree | - | - |
| Graduate Degree | - | - |
| Total | $49,375 | $35,000 |
Family Income in Lancaster
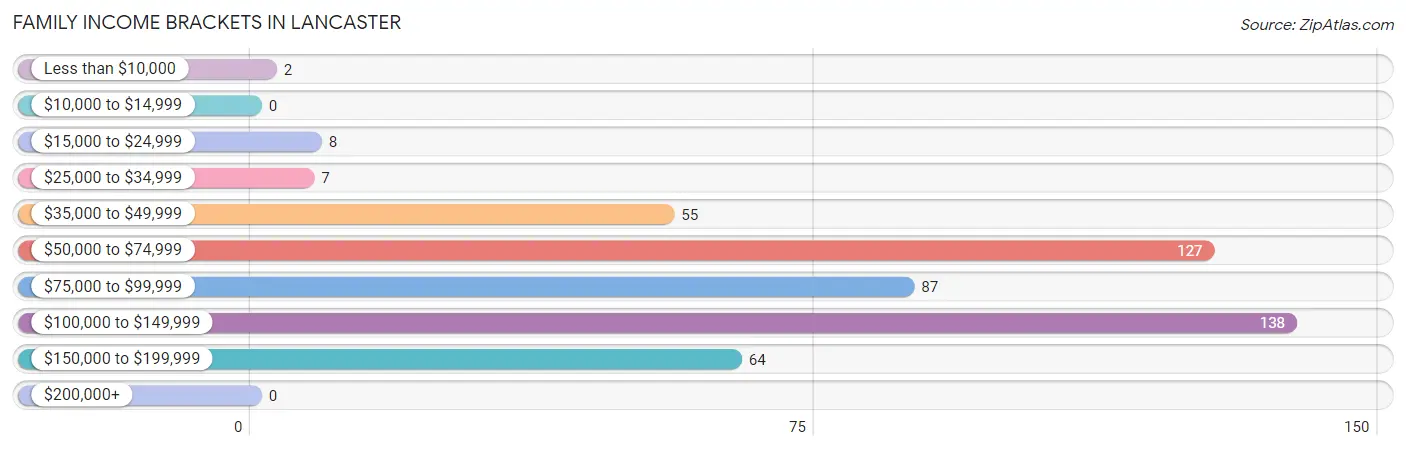
Family Income Brackets in Lancaster
According to the Lancaster family income data, there are 138 families falling into the $100,000 to $149,999 income range, which is the most common income bracket and makes up 28.3% of all families.
| Income Bracket | # Families | % Families |
| Less than $10,000 | 2 | 0.4% |
| $10,000 to $14,999 | 0 | 0.0% |
| $15,000 to $24,999 | 8 | 1.6% |
| $25,000 to $34,999 | 7 | 1.4% |
| $35,000 to $49,999 | 55 | 11.3% |
| $50,000 to $74,999 | 127 | 26.0% |
| $75,000 to $99,999 | 87 | 17.8% |
| $100,000 to $149,999 | 138 | 28.3% |
| $150,000 to $199,999 | 64 | 13.1% |
| $200,000+ | 0 | 0.0% |
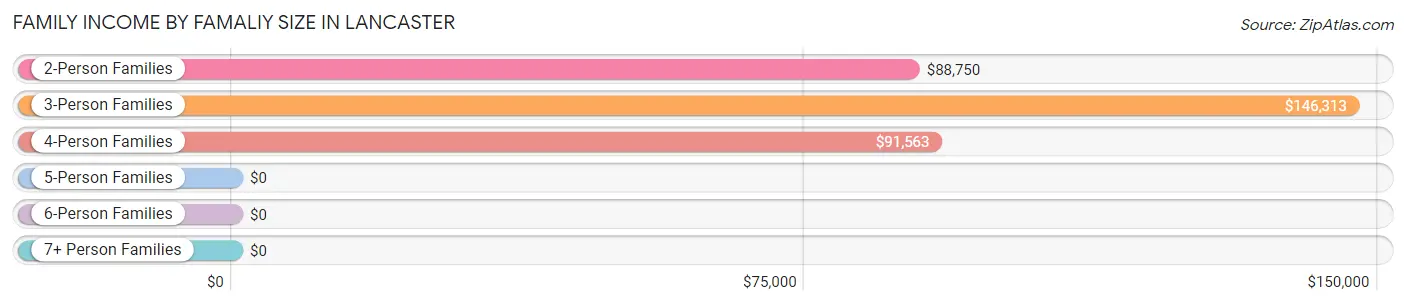
Family Income by Famaliy Size in Lancaster
3-person families (121 | 24.8%) account for the highest median family income in Lancaster with $146,313 per family, while 3-person families (121 | 24.8%) have the highest median income of $48,771 per family member.
| Income Bracket | # Families | Median Income |
| 2-Person Families | 224 (45.9%) | $88,750 |
| 3-Person Families | 121 (24.8%) | $146,313 |
| 4-Person Families | 73 (15.0%) | $91,563 |
| 5-Person Families | 32 (6.6%) | $0 |
| 6-Person Families | 0 (0.0%) | $0 |
| 7+ Person Families | 38 (7.8%) | $0 |
| Total | 488 (100.0%) | $90,870 |
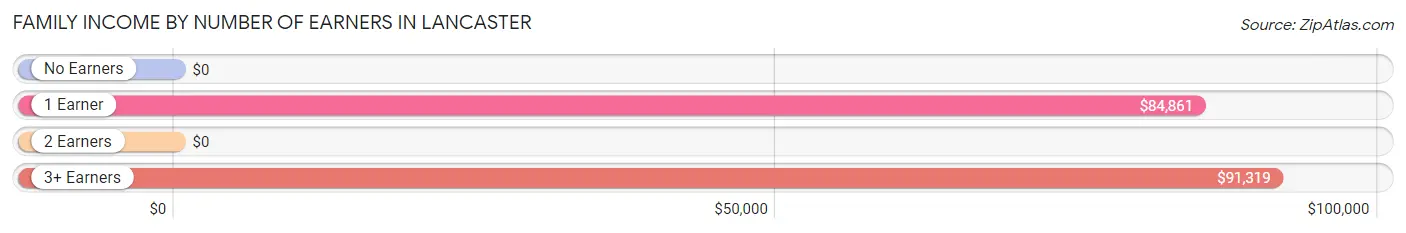
Family Income by Number of Earners in Lancaster
| Number of Earners | # Families | Median Income |
| No Earners | 0 (0.0%) | $0 |
| 1 Earner | 183 (37.5%) | $84,861 |
| 2 Earners | 191 (39.1%) | $0 |
| 3+ Earners | 114 (23.4%) | $91,319 |
| Total | 488 (100.0%) | $90,870 |
Household Income in Lancaster
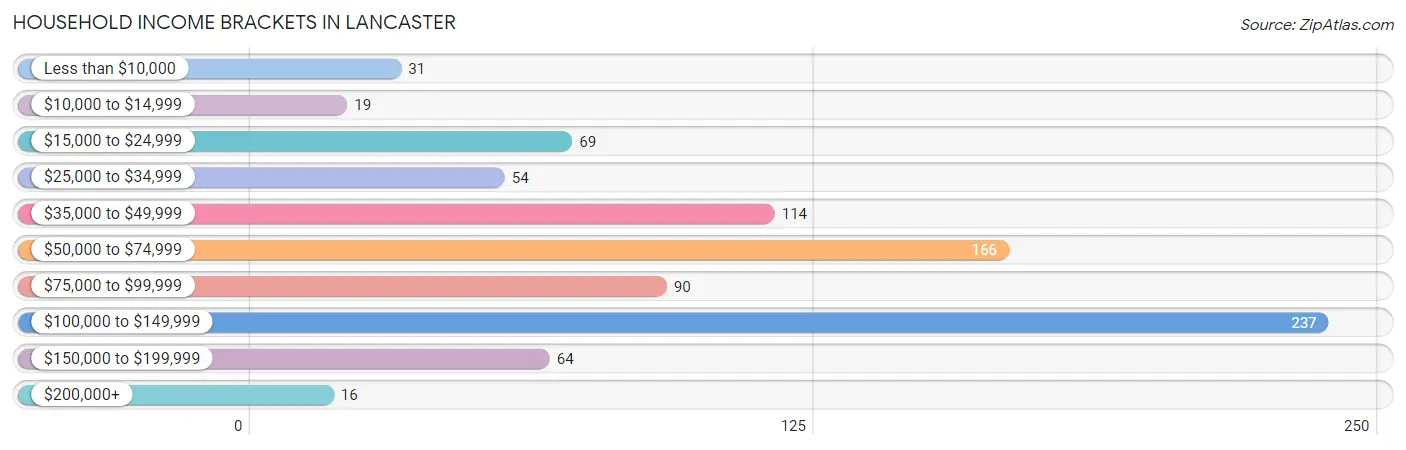
Household Income Brackets in Lancaster
With 237 households falling in the category, the $100,000 to $149,999 income range is the most frequent in Lancaster, accounting for 27.6% of all households. In contrast, only 16 households (1.9%) fall into the $200,000+ income bracket, making it the least populous group.
| Income Bracket | # Households | % Households |
| Less than $10,000 | 31 | 3.6% |
| $10,000 to $14,999 | 19 | 2.2% |
| $15,000 to $24,999 | 69 | 8.0% |
| $25,000 to $34,999 | 54 | 6.3% |
| $35,000 to $49,999 | 114 | 13.3% |
| $50,000 to $74,999 | 166 | 19.3% |
| $75,000 to $99,999 | 90 | 10.5% |
| $100,000 to $149,999 | 237 | 27.6% |
| $150,000 to $199,999 | 64 | 7.4% |
| $200,000+ | 16 | 1.9% |
Household Income by Householder Age in Lancaster
The median household income in Lancaster is $67,331, with the highest median household income of $102,500 found in the 25 to 44 years age bracket for the primary householder. A total of 260 households (30.2%) fall into this category. Meanwhile, the 15 to 24 years age bracket for the primary householder has the lowest median household income of $0, with 35 households (4.1%) in this group.
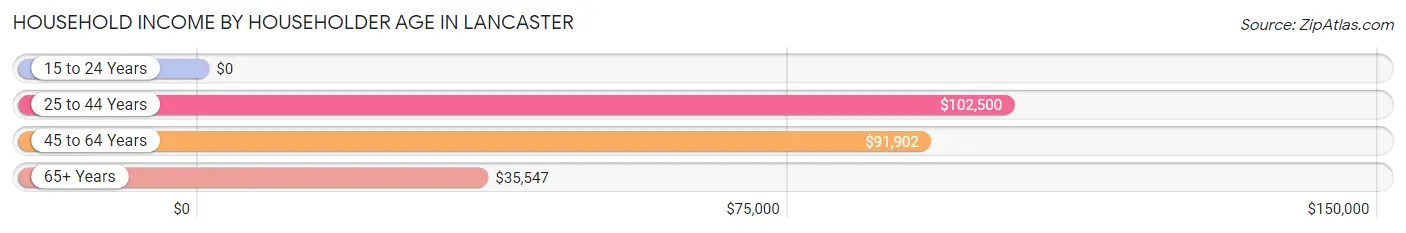
| Income Bracket | # Households | Median Income |
| 15 to 24 Years | 35 (4.1%) | $0 |
| 25 to 44 Years | 260 (30.2%) | $102,500 |
| 45 to 64 Years | 304 (35.3%) | $91,902 |
| 65+ Years | 261 (30.3%) | $35,547 |
| Total | 860 (100.0%) | $67,331 |
Poverty in Lancaster
Income Below Poverty by Sex and Age in Lancaster
With 5.8% poverty level for males and 11.4% for females among the residents of Lancaster, 12 to 14 year old males and 25 to 34 year old females are the most vulnerable to poverty, with 24 males (27.6%) and 76 females (38.2%) in their respective age groups living below the poverty level.
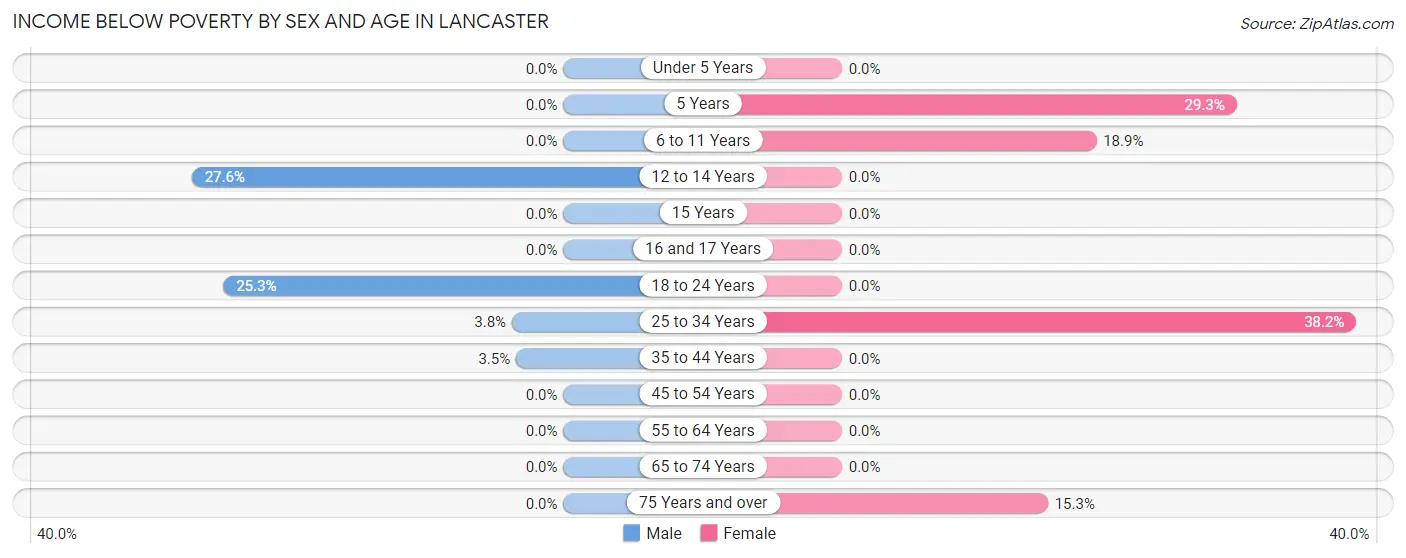
| Age Bracket | Male | Female |
| Under 5 Years | 0 (0.0%) | 0 (0.0%) |
| 5 Years | 0 (0.0%) | 17 (29.3%) |
| 6 to 11 Years | 0 (0.0%) | 17 (18.9%) |
| 12 to 14 Years | 24 (27.6%) | 0 (0.0%) |
| 15 Years | 0 (0.0%) | 0 (0.0%) |
| 16 and 17 Years | 0 (0.0%) | 0 (0.0%) |
| 18 to 24 Years | 25 (25.3%) | 0 (0.0%) |
| 25 to 34 Years | 6 (3.8%) | 76 (38.2%) |
| 35 to 44 Years | 6 (3.5%) | 0 (0.0%) |
| 45 to 54 Years | 0 (0.0%) | 0 (0.0%) |
| 55 to 64 Years | 0 (0.0%) | 0 (0.0%) |
| 65 to 74 Years | 0 (0.0%) | 0 (0.0%) |
| 75 Years and over | 0 (0.0%) | 13 (15.3%) |
| Total | 61 (5.8%) | 123 (11.4%) |
Income Above Poverty by Sex and Age in Lancaster
According to the poverty statistics in Lancaster, males aged under 5 years and females aged under 5 years are the age groups that are most secure financially, with 100.0% of males and 100.0% of females in these age groups living above the poverty line.
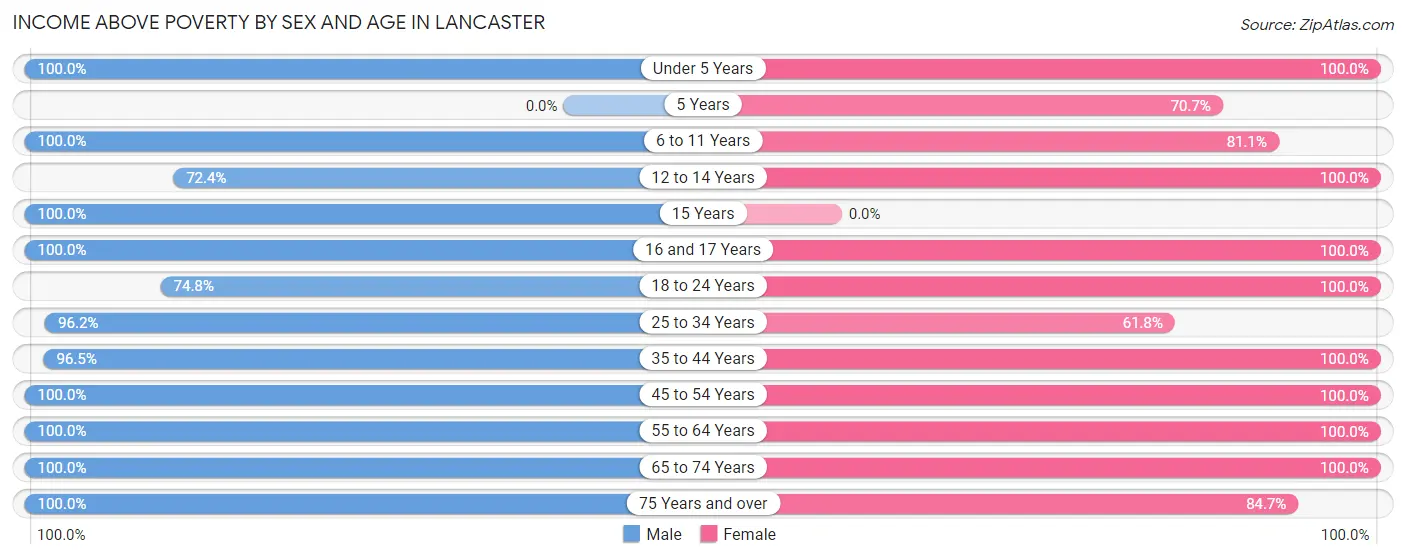
| Age Bracket | Male | Female |
| Under 5 Years | 110 (100.0%) | 54 (100.0%) |
| 5 Years | 0 (0.0%) | 41 (70.7%) |
| 6 to 11 Years | 17 (100.0%) | 73 (81.1%) |
| 12 to 14 Years | 63 (72.4%) | 7 (100.0%) |
| 15 Years | 39 (100.0%) | 0 (0.0%) |
| 16 and 17 Years | 18 (100.0%) | 41 (100.0%) |
| 18 to 24 Years | 74 (74.8%) | 35 (100.0%) |
| 25 to 34 Years | 151 (96.2%) | 123 (61.8%) |
| 35 to 44 Years | 165 (96.5%) | 73 (100.0%) |
| 45 to 54 Years | 119 (100.0%) | 158 (100.0%) |
| 55 to 64 Years | 107 (100.0%) | 149 (100.0%) |
| 65 to 74 Years | 100 (100.0%) | 129 (100.0%) |
| 75 Years and over | 35 (100.0%) | 72 (84.7%) |
| Total | 998 (94.2%) | 955 (88.6%) |
Income Below Poverty Among Married-Couple Families in Lancaster
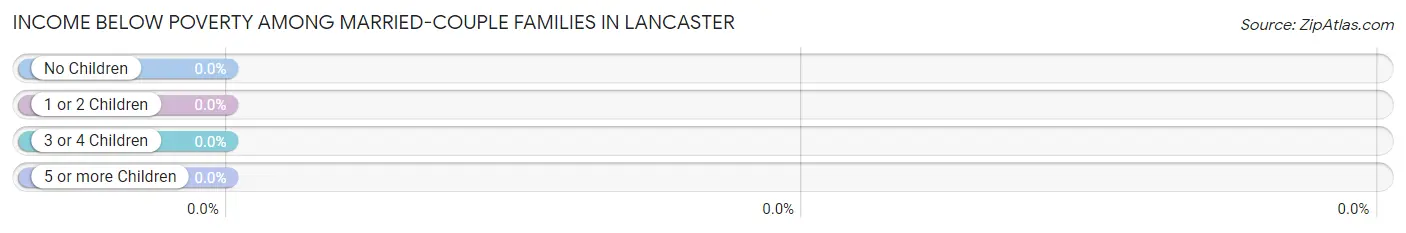
| Children | Above Poverty | Below Poverty |
| No Children | 135 (100.0%) | 0 (0.0%) |
| 1 or 2 Children | 136 (100.0%) | 0 (0.0%) |
| 3 or 4 Children | 38 (100.0%) | 0 (0.0%) |
| 5 or more Children | 0 (0.0%) | 0 (0.0%) |
| Total | 309 (100.0%) | 0 (0.0%) |
Income Below Poverty Among Single-Parent Households in Lancaster
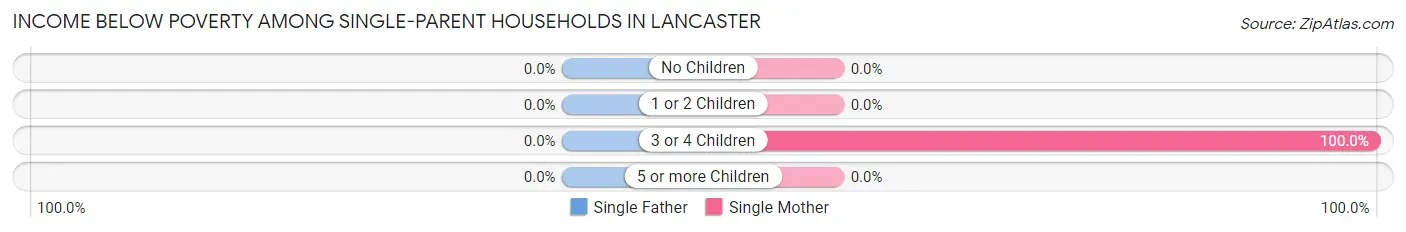
| Children | Single Father | Single Mother |
| No Children | 0 (0.0%) | 0 (0.0%) |
| 1 or 2 Children | 0 (0.0%) | 0 (0.0%) |
| 3 or 4 Children | 0 (0.0%) | 2 (100.0%) |
| 5 or more Children | 0 (0.0%) | 0 (0.0%) |
| Total | 0 (0.0%) | 2 (1.9%) |
Income Below Poverty Among Married-Couple vs Single-Parent Households in Lancaster
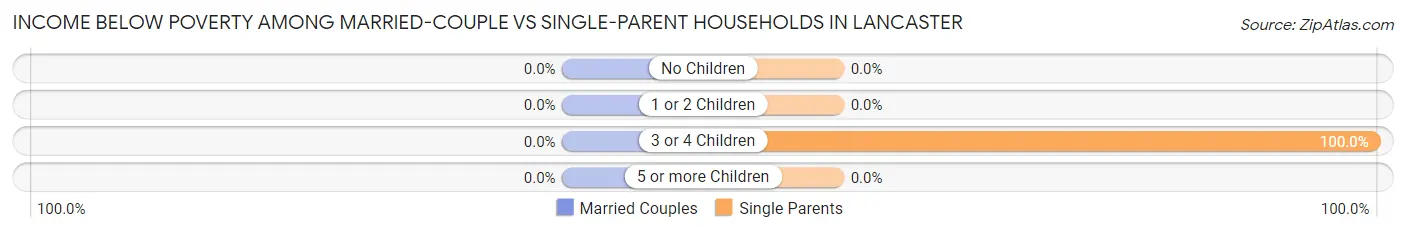
| Children | Married-Couple Families | Single-Parent Households |
| No Children | 0 (0.0%) | 0 (0.0%) |
| 1 or 2 Children | 0 (0.0%) | 0 (0.0%) |
| 3 or 4 Children | 0 (0.0%) | 2 (100.0%) |
| 5 or more Children | 0 (0.0%) | 0 (0.0%) |
| Total | 0 (0.0%) | 2 (1.1%) |
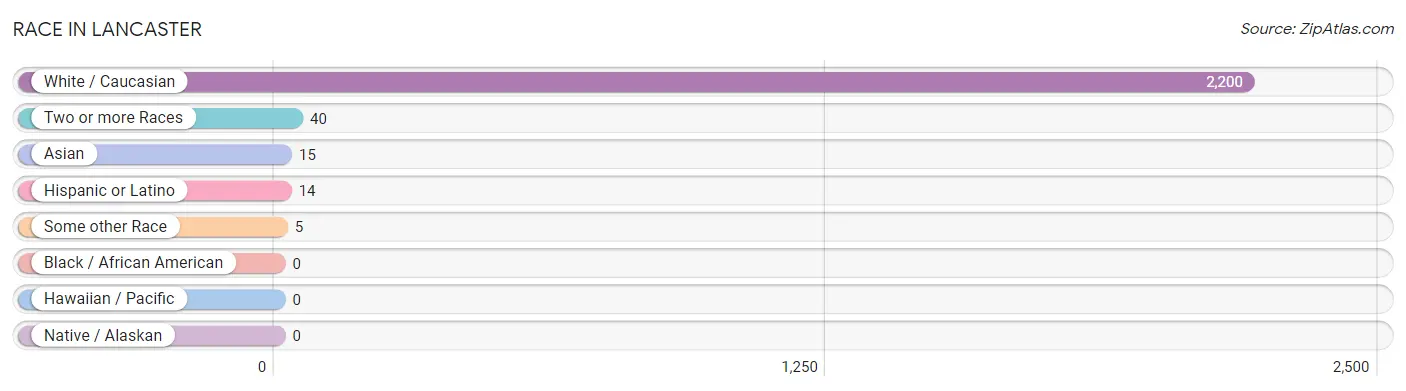
Race in Lancaster
The most populous races in Lancaster are White / Caucasian (2,200 | 97.4%), Two or more Races (40 | 1.8%), and Asian (15 | 0.7%).
| Race | # Population | % Population |
| Asian | 15 | 0.7% |
| Black / African American | 0 | 0.0% |
| Hawaiian / Pacific | 0 | 0.0% |
| Hispanic or Latino | 14 | 0.6% |
| Native / Alaskan | 0 | 0.0% |
| White / Caucasian | 2,200 | 97.4% |
| Two or more Races | 40 | 1.8% |
| Some other Race | 5 | 0.2% |
| Total | 2,260 | 100.0% |
Ancestry in Lancaster
The most populous ancestries reported in Lancaster are English (484 | 21.4%), French (334 | 14.8%), French Canadian (270 | 11.9%), Irish (256 | 11.3%), and German (214 | 9.5%), together accounting for 69.0% of all Lancaster residents.
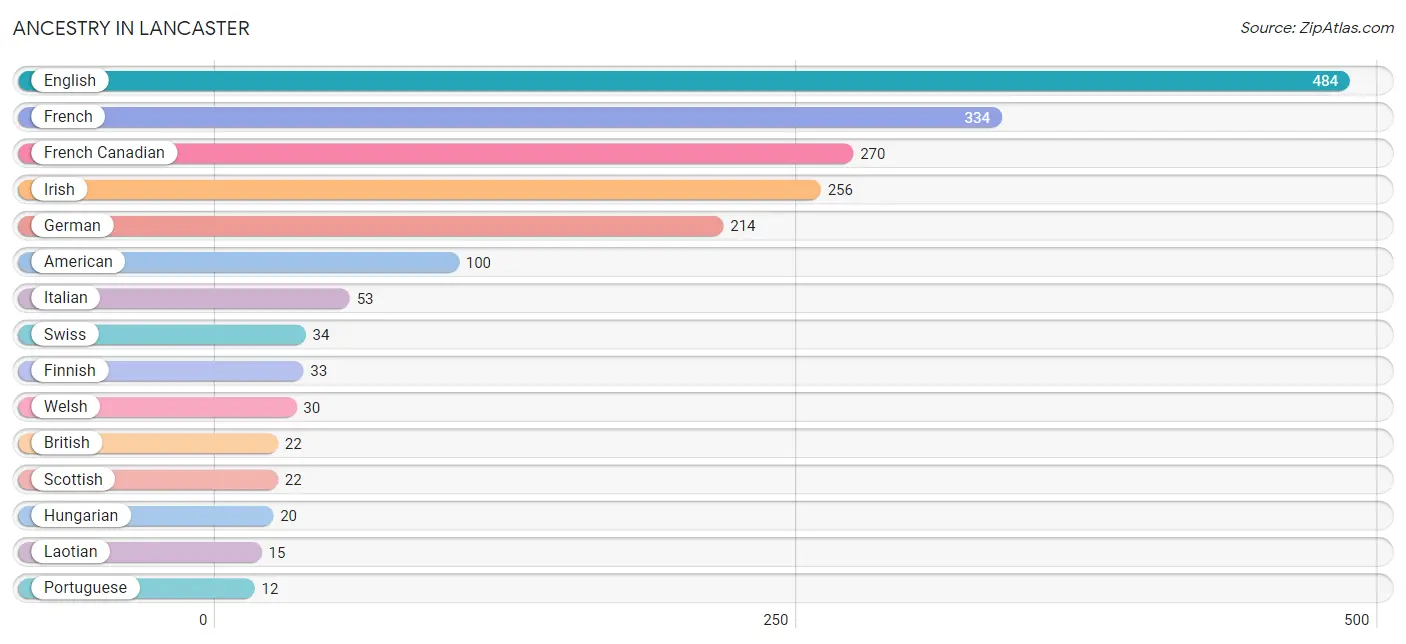
| Ancestry | # Population | % Population |
| American | 100 | 4.4% |
| British | 22 | 1.0% |
| Cree | 4 | 0.2% |
| Danish | 6 | 0.3% |
| English | 484 | 21.4% |
| European | 10 | 0.4% |
| Finnish | 33 | 1.5% |
| French | 334 | 14.8% |
| French Canadian | 270 | 11.9% |
| German | 214 | 9.5% |
| Hungarian | 20 | 0.9% |
| Irish | 256 | 11.3% |
| Iroquois | 4 | 0.2% |
| Italian | 53 | 2.4% |
| Laotian | 15 | 0.7% |
| Lithuanian | 4 | 0.2% |
| Norwegian | 9 | 0.4% |
| Polish | 11 | 0.5% |
| Portuguese | 12 | 0.5% |
| Puerto Rican | 12 | 0.5% |
| Russian | 3 | 0.1% |
| Scotch-Irish | 8 | 0.4% |
| Scottish | 22 | 1.0% |
| Swiss | 34 | 1.5% |
| Welsh | 30 | 1.3% | View All 25 Rows |
Immigrants in Lancaster
The most numerous immigrant groups reported in Lancaster came from Europe (58 | 2.6%), Eastern Europe (36 | 1.6%), Poland (36 | 1.6%), England (22 | 1.0%), and Northern Europe (22 | 1.0%), together accounting for 7.7% of all Lancaster residents.
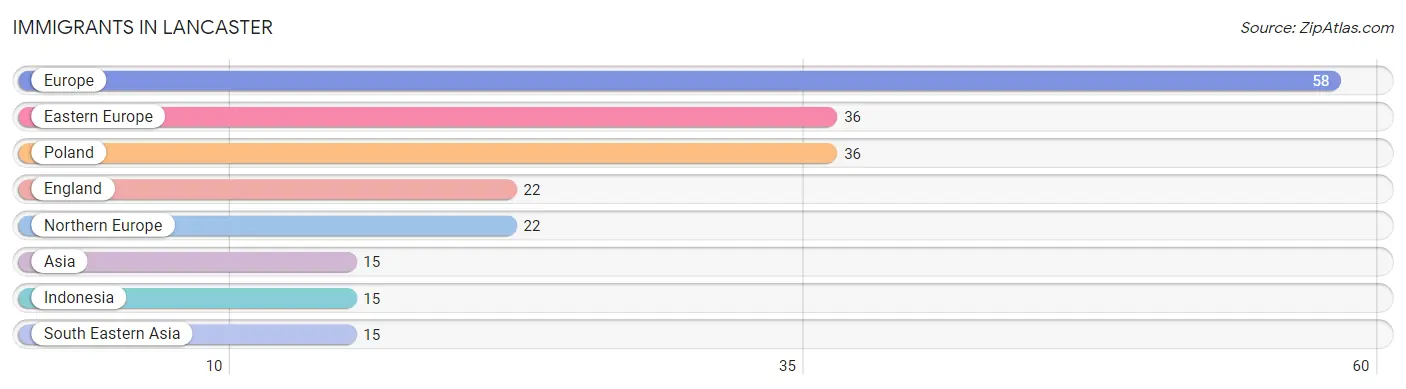
| Immigration Origin | # Population | % Population |
| Asia | 15 | 0.7% |
| Eastern Europe | 36 | 1.6% |
| England | 22 | 1.0% |
| Europe | 58 | 2.6% |
| Indonesia | 15 | 0.7% |
| Northern Europe | 22 | 1.0% |
| Poland | 36 | 1.6% |
| South Eastern Asia | 15 | 0.7% | View All 8 Rows |
Sex and Age in Lancaster
Sex and Age in Lancaster
The most populous age groups in Lancaster are 30 to 34 Years (126 | 11.4%) for men and 25 to 29 Years (158 | 13.7%) for women.
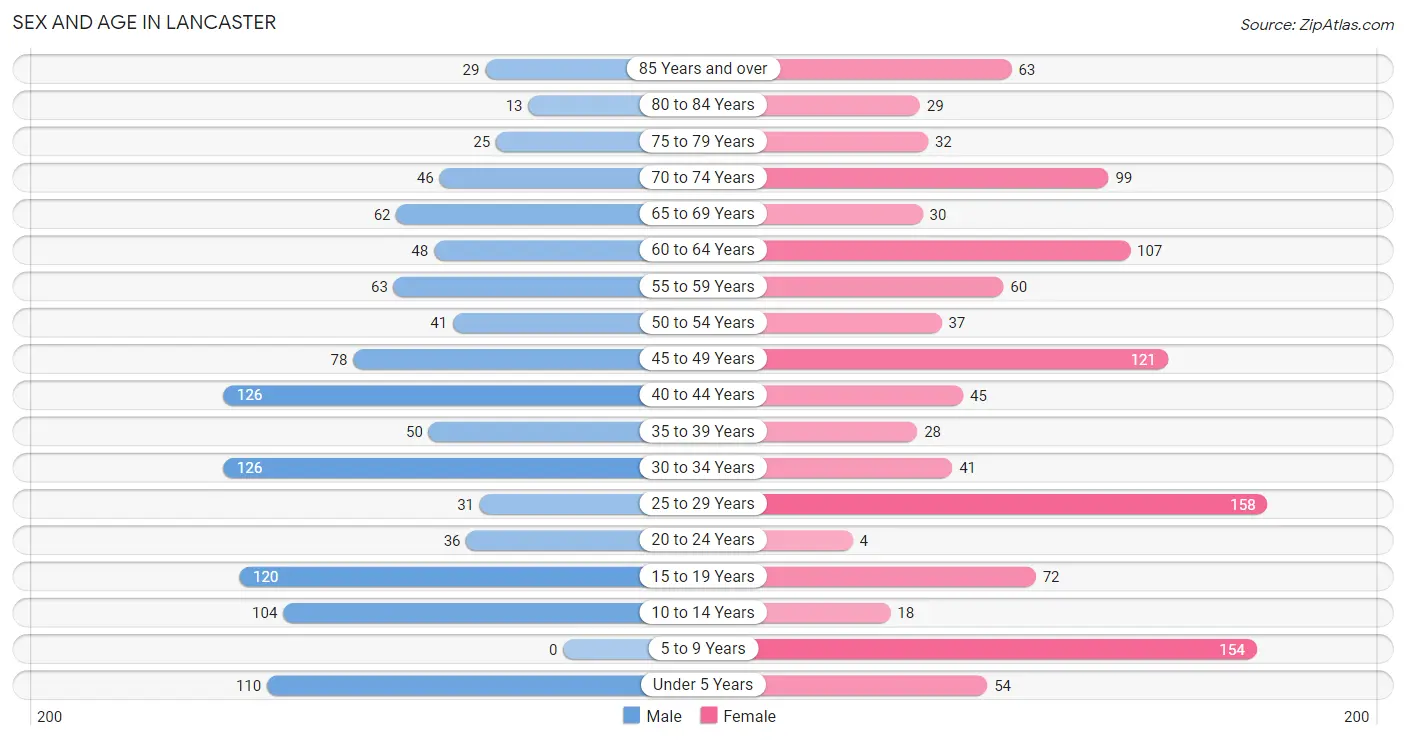
| Age Bracket | Male | Female |
| Under 5 Years | 110 (9.9%) | 54 (4.7%) |
| 5 to 9 Years | 0 (0.0%) | 154 (13.4%) |
| 10 to 14 Years | 104 (9.4%) | 18 (1.6%) |
| 15 to 19 Years | 120 (10.8%) | 72 (6.2%) |
| 20 to 24 Years | 36 (3.3%) | 4 (0.4%) |
| 25 to 29 Years | 31 (2.8%) | 158 (13.7%) |
| 30 to 34 Years | 126 (11.4%) | 41 (3.6%) |
| 35 to 39 Years | 50 (4.5%) | 28 (2.4%) |
| 40 to 44 Years | 126 (11.4%) | 45 (3.9%) |
| 45 to 49 Years | 78 (7.0%) | 121 (10.5%) |
| 50 to 54 Years | 41 (3.7%) | 37 (3.2%) |
| 55 to 59 Years | 63 (5.7%) | 60 (5.2%) |
| 60 to 64 Years | 48 (4.3%) | 107 (9.3%) |
| 65 to 69 Years | 62 (5.6%) | 30 (2.6%) |
| 70 to 74 Years | 46 (4.2%) | 99 (8.6%) |
| 75 to 79 Years | 25 (2.3%) | 32 (2.8%) |
| 80 to 84 Years | 13 (1.2%) | 29 (2.5%) |
| 85 Years and over | 29 (2.6%) | 63 (5.5%) |
| Total | 1,108 (100.0%) | 1,152 (100.0%) |
Families and Households in Lancaster
Median Family Size in Lancaster
The median family size in Lancaster is 3.17 persons per family, with single female/mother families (106 | 21.7%) accounting for the largest median family size of 3.42 persons per family. On the other hand, single male/father families (73 | 15.0%) represent the smallest median family size with 2.55 persons per family.
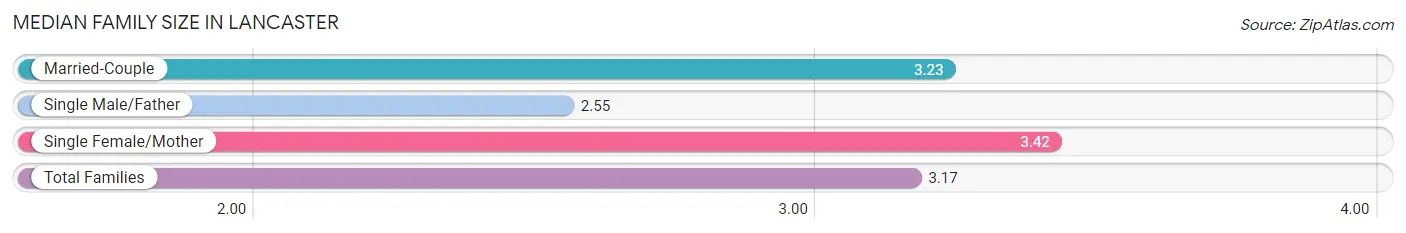
| Family Type | # Families | Family Size |
| Married-Couple | 309 (63.3%) | 3.23 |
| Single Male/Father | 73 (15.0%) | 2.55 |
| Single Female/Mother | 106 (21.7%) | 3.42 |
| Total Families | 488 (100.0%) | 3.17 |
Median Household Size in Lancaster
The median household size in Lancaster is 2.49 persons per household, with single female/mother households (106 | 12.3%) accounting for the largest median household size of 4.07 persons per household. non-family households (372 | 43.3%) represent the smallest median household size with 1.20 persons per household.
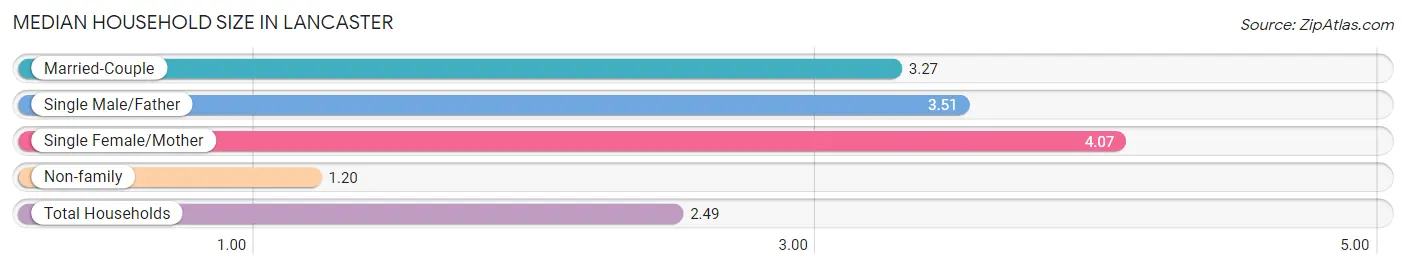
| Household Type | # Households | Household Size |
| Married-Couple | 309 (35.9%) | 3.27 |
| Single Male/Father | 73 (8.5%) | 3.51 |
| Single Female/Mother | 106 (12.3%) | 4.07 |
| Non-family | 372 (43.3%) | 1.20 |
| Total Households | 860 (100.0%) | 2.49 |
Household Size by Marriage Status in Lancaster
Out of a total of 860 households in Lancaster, 488 (56.7%) are family households, while 372 (43.3%) are nonfamily households. The most numerous type of family households are 2-person households, comprising 172, and the most common type of nonfamily households are 1-person households, comprising 276.
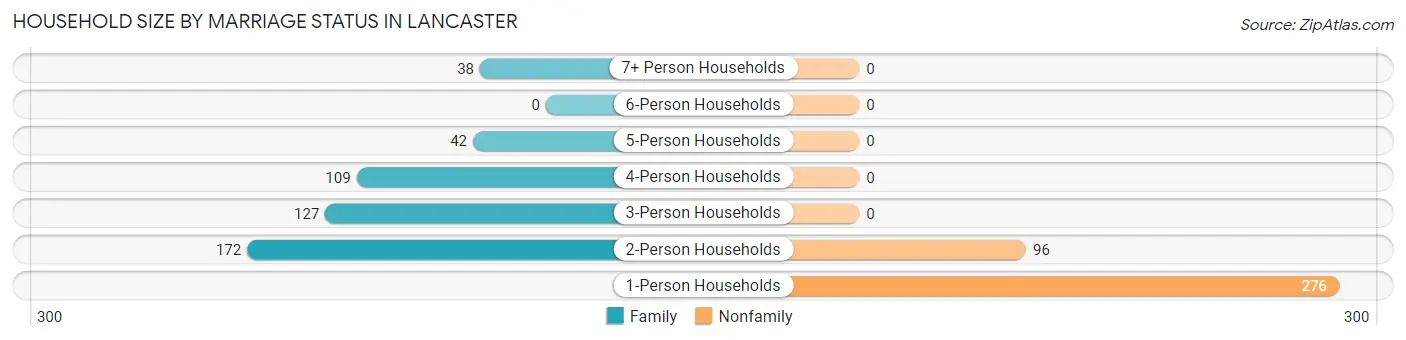
| Household Size | Family Households | Nonfamily Households |
| 1-Person Households | - | 276 (32.1%) |
| 2-Person Households | 172 (20.0%) | 96 (11.2%) |
| 3-Person Households | 127 (14.8%) | 0 (0.0%) |
| 4-Person Households | 109 (12.7%) | 0 (0.0%) |
| 5-Person Households | 42 (4.9%) | 0 (0.0%) |
| 6-Person Households | 0 (0.0%) | 0 (0.0%) |
| 7+ Person Households | 38 (4.4%) | 0 (0.0%) |
| Total | 488 (56.7%) | 372 (43.3%) |
Female Fertility in Lancaster
Fertility by Age in Lancaster
Average fertility rate in Lancaster is 6.0 births per 1,000 women. Women in the age bracket of 20 to 34 years have the highest fertility rate with 15.0 births per 1,000 women. Women in the age bracket of 20 to 34 years acount for 100.0% of all women with births.
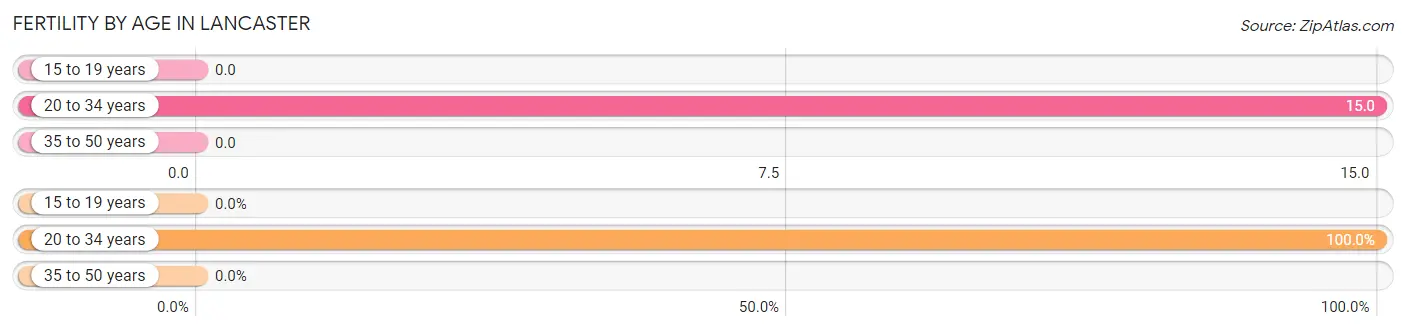
| Age Bracket | Women with Births | Births / 1,000 Women |
| 15 to 19 years | 0 (0.0%) | 0.0 |
| 20 to 34 years | 3 (100.0%) | 15.0 |
| 35 to 50 years | 0 (0.0%) | 0.0 |
| Total | 3 (100.0%) | 6.0 |
Fertility by Age by Marriage Status in Lancaster
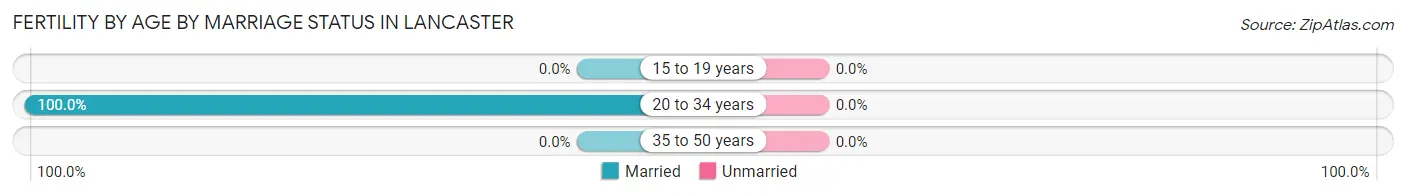
| Age Bracket | Married | Unmarried |
| 15 to 19 years | 0 (0.0%) | 0 (0.0%) |
| 20 to 34 years | 3 (100.0%) | 0 (0.0%) |
| 35 to 50 years | 0 (0.0%) | 0 (0.0%) |
| Total | 3 (100.0%) | 0 (0.0%) |
Fertility by Education in Lancaster
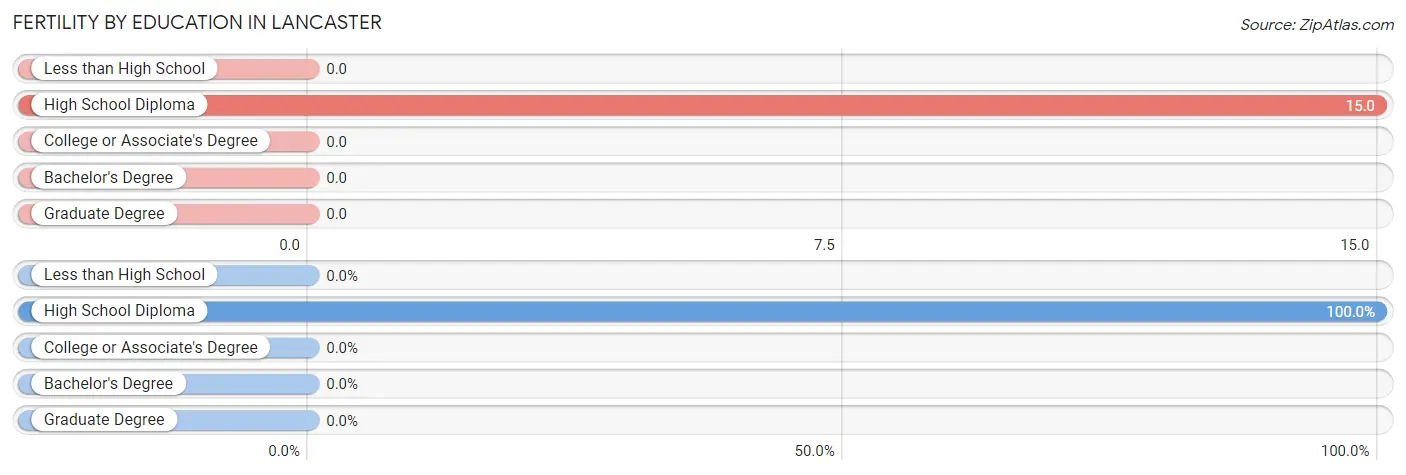
| Educational Attainment | Women with Births | Births / 1,000 Women |
| Less than High School | 0 (0.0%) | 0.0 |
| High School Diploma | 3 (100.0%) | 15.0 |
| College or Associate's Degree | 0 (0.0%) | 0.0 |
| Bachelor's Degree | 0 (0.0%) | 0.0 |
| Graduate Degree | 0 (0.0%) | 0.0 |
| Total | 3 (100.0%) | 6.0 |
Fertility by Education by Marriage Status in Lancaster
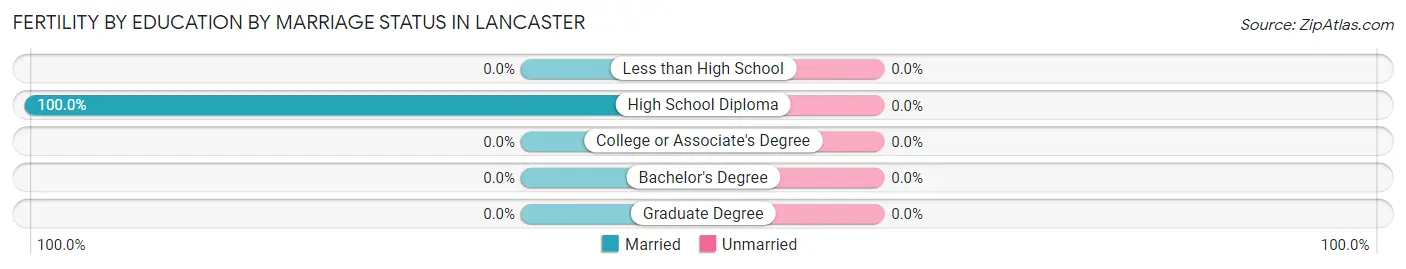
| Educational Attainment | Married | Unmarried |
| Less than High School | 0 (0.0%) | 0 (0.0%) |
| High School Diploma | 3 (100.0%) | 0 (0.0%) |
| College or Associate's Degree | 0 (0.0%) | 0 (0.0%) |
| Bachelor's Degree | 0 (0.0%) | 0 (0.0%) |
| Graduate Degree | 0 (0.0%) | 0 (0.0%) |
| Total | 3 (100.0%) | 0 (0.0%) |
Employment Characteristics in Lancaster
Employment by Class of Employer in Lancaster
Among the 1,084 employed individuals in Lancaster, private company employees (641 | 59.1%), local government employees (163 | 15.0%), and self-employed (not incorporated) (137 | 12.6%) make up the most common classes of employment.
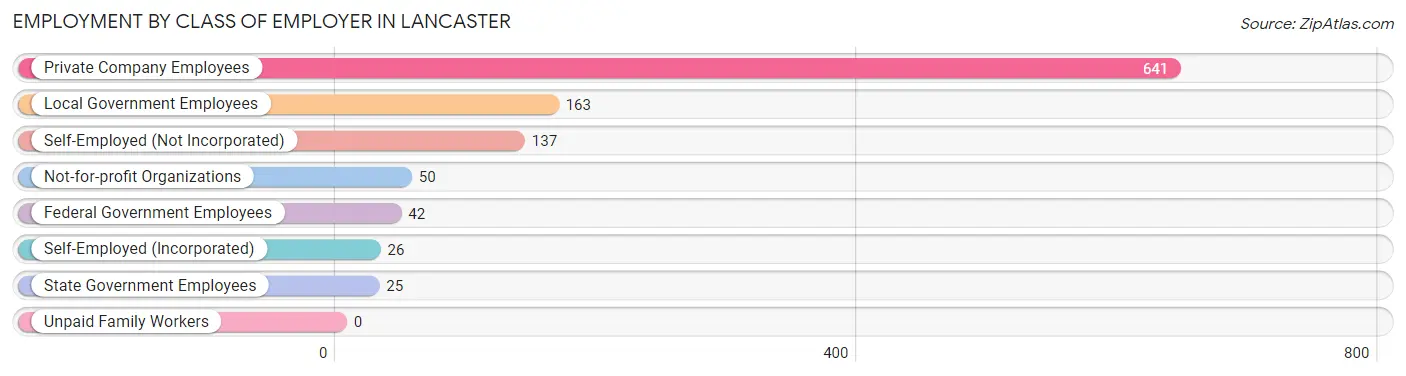
| Employer Class | # Employees | % Employees |
| Private Company Employees | 641 | 59.1% |
| Self-Employed (Incorporated) | 26 | 2.4% |
| Self-Employed (Not Incorporated) | 137 | 12.6% |
| Not-for-profit Organizations | 50 | 4.6% |
| Local Government Employees | 163 | 15.0% |
| State Government Employees | 25 | 2.3% |
| Federal Government Employees | 42 | 3.9% |
| Unpaid Family Workers | 0 | 0.0% |
| Total | 1,084 | 100.0% |
Employment Status by Age in Lancaster
According to the labor force statistics for Lancaster, out of the total population over 16 years of age (1,781), 63.7% or 1,134 individuals are in the labor force, with 2.6% or 29 of them unemployed. The age group with the highest labor force participation rate is 20 to 24 years, with 100.0% or 40 individuals in the labor force. Within the labor force, the 20 to 24 years age range has the highest percentage of unemployed individuals, with 20.0% or 8 of them being unemployed.
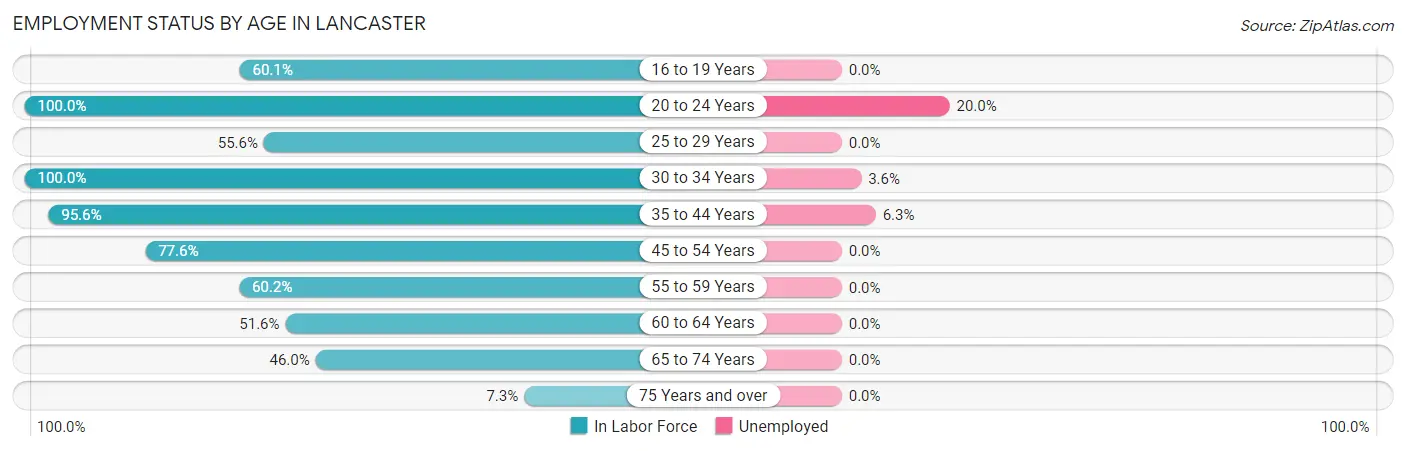
| Age Bracket | In Labor Force | Unemployed |
| 16 to 19 Years | 92 (60.1%) | 0 (0.0%) |
| 20 to 24 Years | 40 (100.0%) | 8 (20.0%) |
| 25 to 29 Years | 105 (55.6%) | 0 (0.0%) |
| 30 to 34 Years | 167 (100.0%) | 6 (3.6%) |
| 35 to 44 Years | 238 (95.6%) | 15 (6.3%) |
| 45 to 54 Years | 215 (77.6%) | 0 (0.0%) |
| 55 to 59 Years | 74 (60.2%) | 0 (0.0%) |
| 60 to 64 Years | 80 (51.6%) | 0 (0.0%) |
| 65 to 74 Years | 109 (46.0%) | 0 (0.0%) |
| 75 Years and over | 14 (7.3%) | 0 (0.0%) |
| Total | 1,134 (63.7%) | 29 (2.6%) |
Employment Status by Educational Attainment in Lancaster
According to labor force statistics for Lancaster, 75.8% of individuals (879) out of the total population between 25 and 64 years of age (1,160) are in the labor force, with 2.4% or 21 of them being unemployed. The group with the highest labor force participation rate are those with the educational attainment of bachelor's degree or higher, with 99.3% or 274 individuals in the labor force. Within the labor force, individuals with less than high school education have the highest percentage of unemployment, with 37.5% or 15 of them being unemployed.
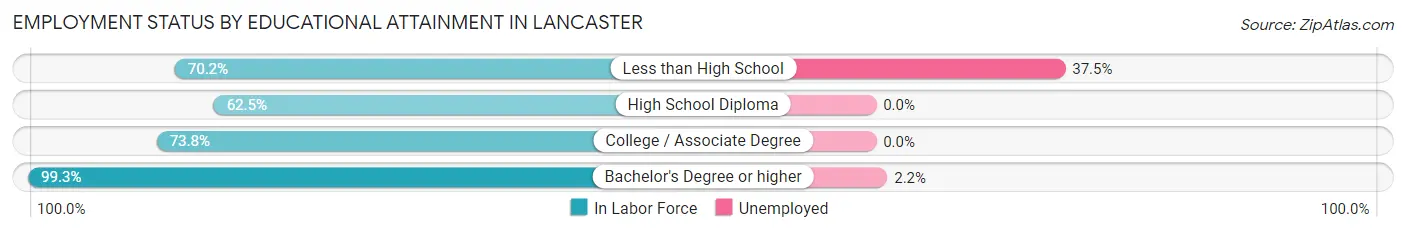
| Educational Attainment | In Labor Force | Unemployed |
| Less than High School | 40 (70.2%) | 21 (37.5%) |
| High School Diploma | 252 (62.5%) | 0 (0.0%) |
| College / Associate Degree | 313 (73.8%) | 0 (0.0%) |
| Bachelor's Degree or higher | 274 (99.3%) | 6 (2.2%) |
| Total | 879 (75.8%) | 28 (2.4%) |
Employment Occupations by Sex in Lancaster
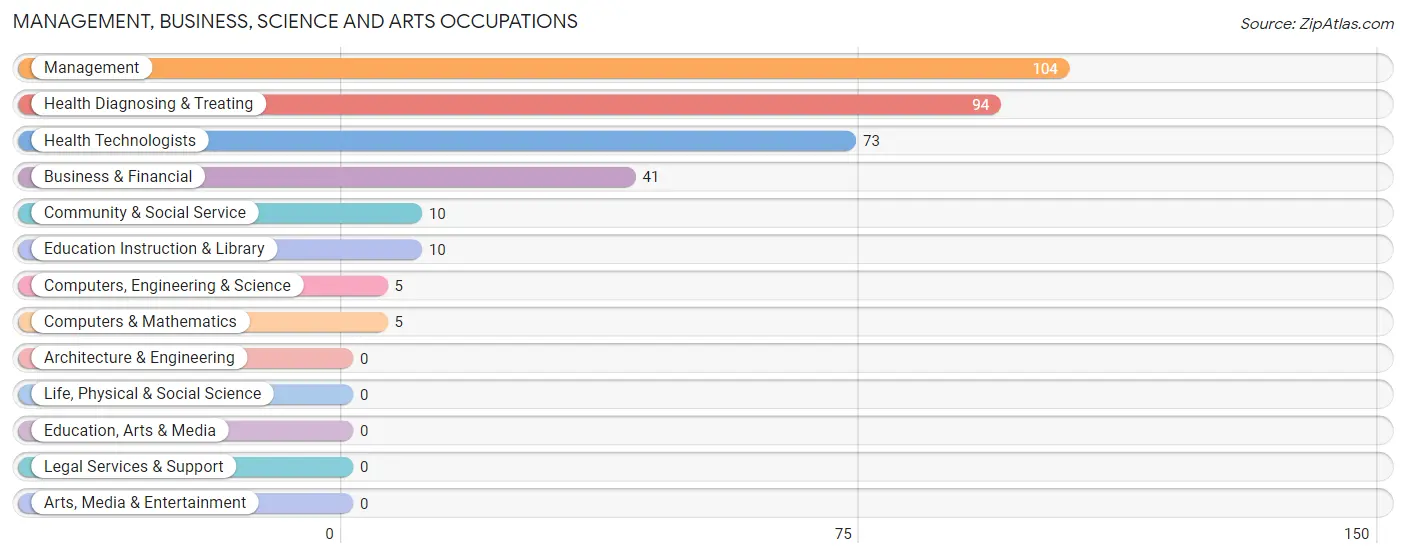
Management, Business, Science and Arts Occupations
The most common Management, Business, Science and Arts occupations in Lancaster are Management (104 | 9.4%), Health Diagnosing & Treating (94 | 8.5%), Health Technologists (73 | 6.6%), Business & Financial (41 | 3.7%), and Community & Social Service (10 | 0.9%).
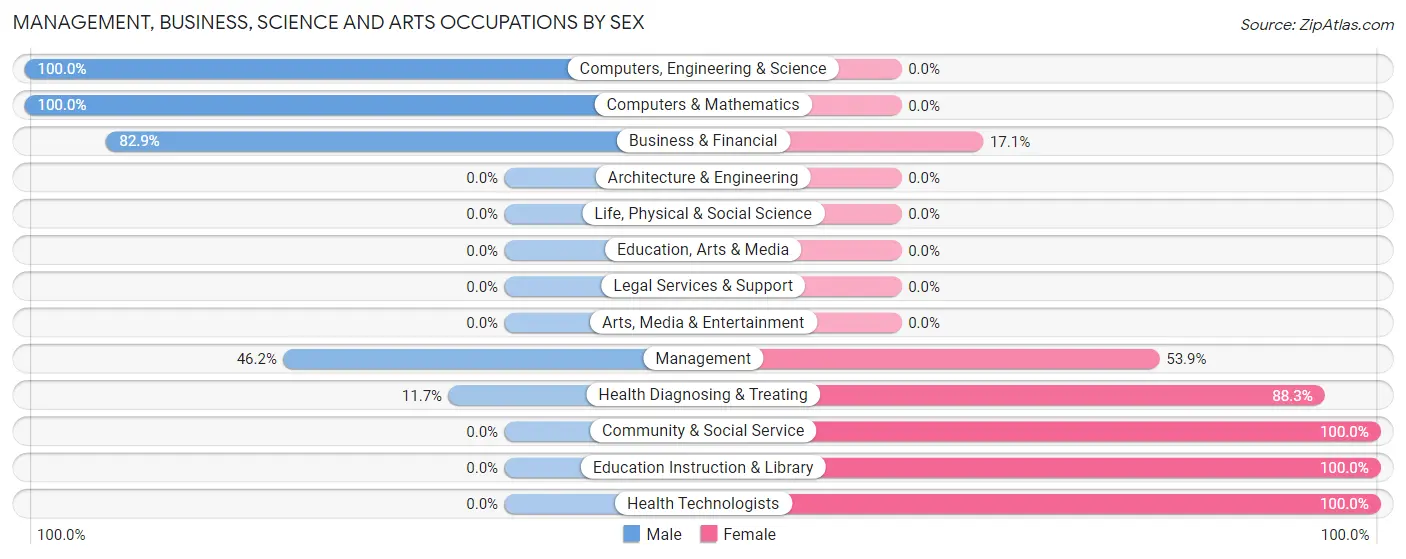
Management, Business, Science and Arts Occupations by Sex
Within the Management, Business, Science and Arts occupations in Lancaster, the most male-oriented occupations are Computers, Engineering & Science (100.0%), Computers & Mathematics (100.0%), and Business & Financial (82.9%), while the most female-oriented occupations are Community & Social Service (100.0%), Education Instruction & Library (100.0%), and Health Technologists (100.0%).
| Occupation | Male | Female |
| Management | 48 (46.2%) | 56 (53.8%) |
| Business & Financial | 34 (82.9%) | 7 (17.1%) |
| Computers, Engineering & Science | 5 (100.0%) | 0 (0.0%) |
| Computers & Mathematics | 5 (100.0%) | 0 (0.0%) |
| Architecture & Engineering | 0 (0.0%) | 0 (0.0%) |
| Life, Physical & Social Science | 0 (0.0%) | 0 (0.0%) |
| Community & Social Service | 0 (0.0%) | 10 (100.0%) |
| Education, Arts & Media | 0 (0.0%) | 0 (0.0%) |
| Legal Services & Support | 0 (0.0%) | 0 (0.0%) |
| Education Instruction & Library | 0 (0.0%) | 10 (100.0%) |
| Arts, Media & Entertainment | 0 (0.0%) | 0 (0.0%) |
| Health Diagnosing & Treating | 11 (11.7%) | 83 (88.3%) |
| Health Technologists | 0 (0.0%) | 73 (100.0%) |
| Total (Category) | 98 (38.6%) | 156 (61.4%) |
| Total (Overall) | 572 (51.8%) | 533 (48.2%) |
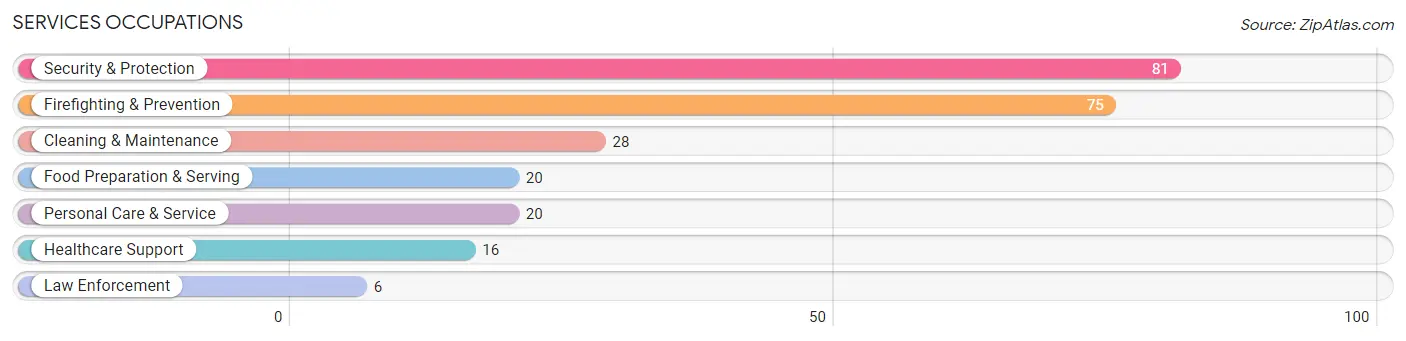
Services Occupations
The most common Services occupations in Lancaster are Security & Protection (81 | 7.3%), Firefighting & Prevention (75 | 6.8%), Cleaning & Maintenance (28 | 2.5%), Food Preparation & Serving (20 | 1.8%), and Personal Care & Service (20 | 1.8%).
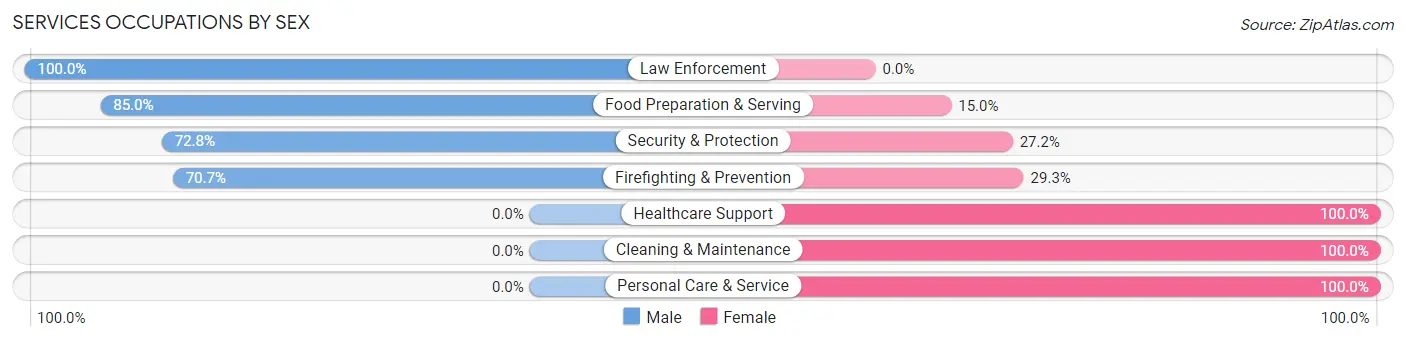
Services Occupations by Sex
Within the Services occupations in Lancaster, the most male-oriented occupations are Law Enforcement (100.0%), Food Preparation & Serving (85.0%), and Security & Protection (72.8%), while the most female-oriented occupations are Healthcare Support (100.0%), Cleaning & Maintenance (100.0%), and Personal Care & Service (100.0%).
| Occupation | Male | Female |
| Healthcare Support | 0 (0.0%) | 16 (100.0%) |
| Security & Protection | 59 (72.8%) | 22 (27.2%) |
| Firefighting & Prevention | 53 (70.7%) | 22 (29.3%) |
| Law Enforcement | 6 (100.0%) | 0 (0.0%) |
| Food Preparation & Serving | 17 (85.0%) | 3 (15.0%) |
| Cleaning & Maintenance | 0 (0.0%) | 28 (100.0%) |
| Personal Care & Service | 0 (0.0%) | 20 (100.0%) |
| Total (Category) | 76 (46.1%) | 89 (53.9%) |
| Total (Overall) | 572 (51.8%) | 533 (48.2%) |
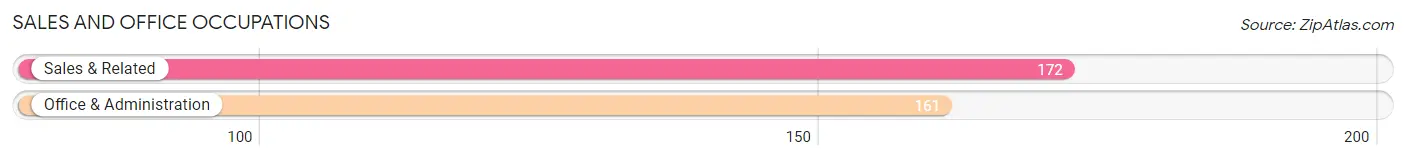
Sales and Office Occupations
The most common Sales and Office occupations in Lancaster are Sales & Related (172 | 15.6%), and Office & Administration (161 | 14.6%).
Sales and Office Occupations by Sex
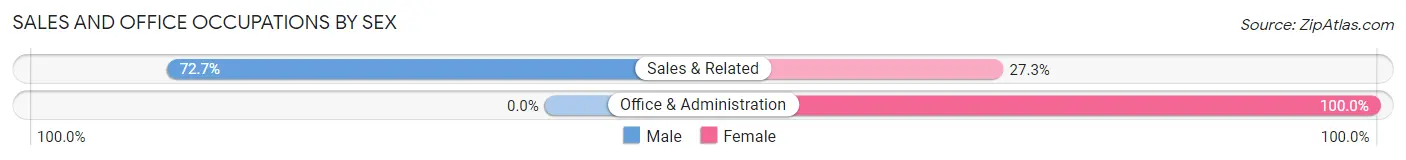
| Occupation | Male | Female |
| Sales & Related | 125 (72.7%) | 47 (27.3%) |
| Office & Administration | 0 (0.0%) | 161 (100.0%) |
| Total (Category) | 125 (37.5%) | 208 (62.5%) |
| Total (Overall) | 572 (51.8%) | 533 (48.2%) |
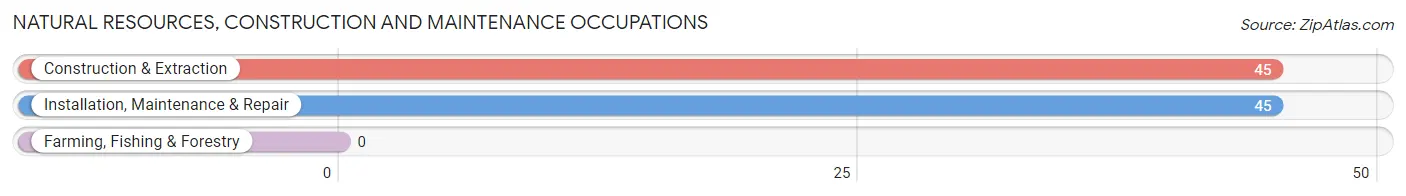
Natural Resources, Construction and Maintenance Occupations
The most common Natural Resources, Construction and Maintenance occupations in Lancaster are Construction & Extraction (45 | 4.1%), and Installation, Maintenance & Repair (45 | 4.1%).
Natural Resources, Construction and Maintenance Occupations by Sex
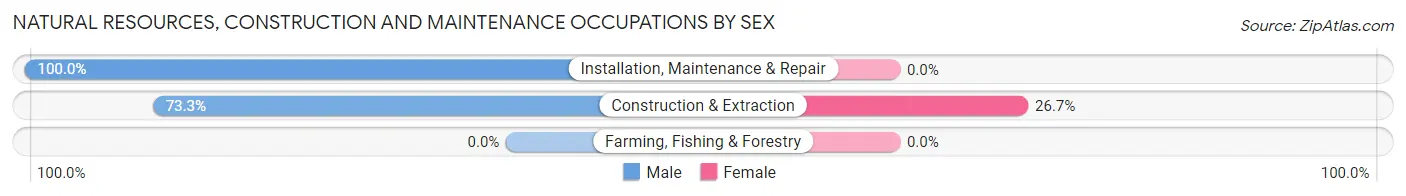
| Occupation | Male | Female |
| Farming, Fishing & Forestry | 0 (0.0%) | 0 (0.0%) |
| Construction & Extraction | 33 (73.3%) | 12 (26.7%) |
| Installation, Maintenance & Repair | 45 (100.0%) | 0 (0.0%) |
| Total (Category) | 78 (86.7%) | 12 (13.3%) |
| Total (Overall) | 572 (51.8%) | 533 (48.2%) |
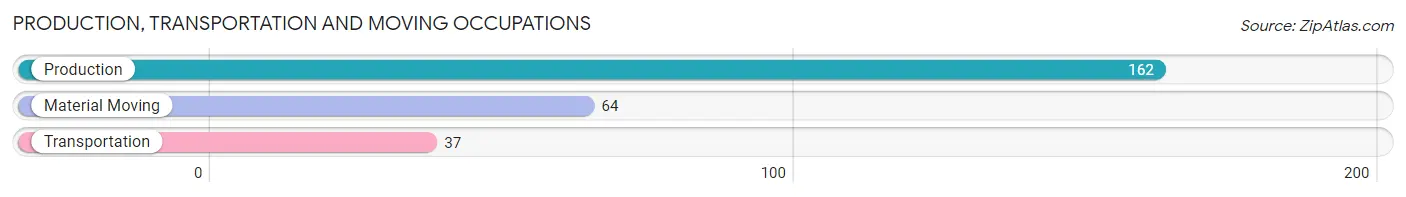
Production, Transportation and Moving Occupations
The most common Production, Transportation and Moving occupations in Lancaster are Production (162 | 14.7%), Material Moving (64 | 5.8%), and Transportation (37 | 3.4%).
Production, Transportation and Moving Occupations by Sex
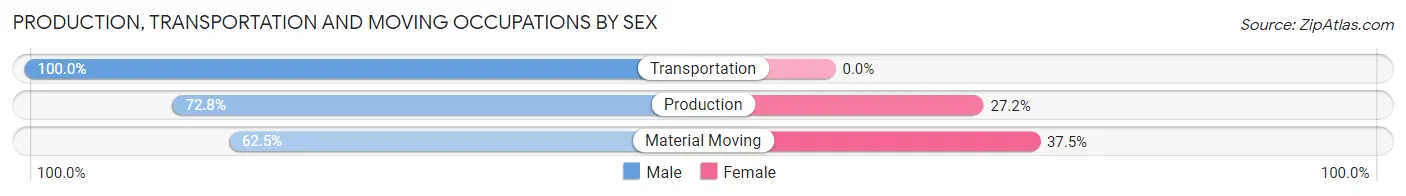
| Occupation | Male | Female |
| Production | 118 (72.8%) | 44 (27.2%) |
| Transportation | 37 (100.0%) | 0 (0.0%) |
| Material Moving | 40 (62.5%) | 24 (37.5%) |
| Total (Category) | 195 (74.1%) | 68 (25.9%) |
| Total (Overall) | 572 (51.8%) | 533 (48.2%) |
Employment Industries by Sex in Lancaster
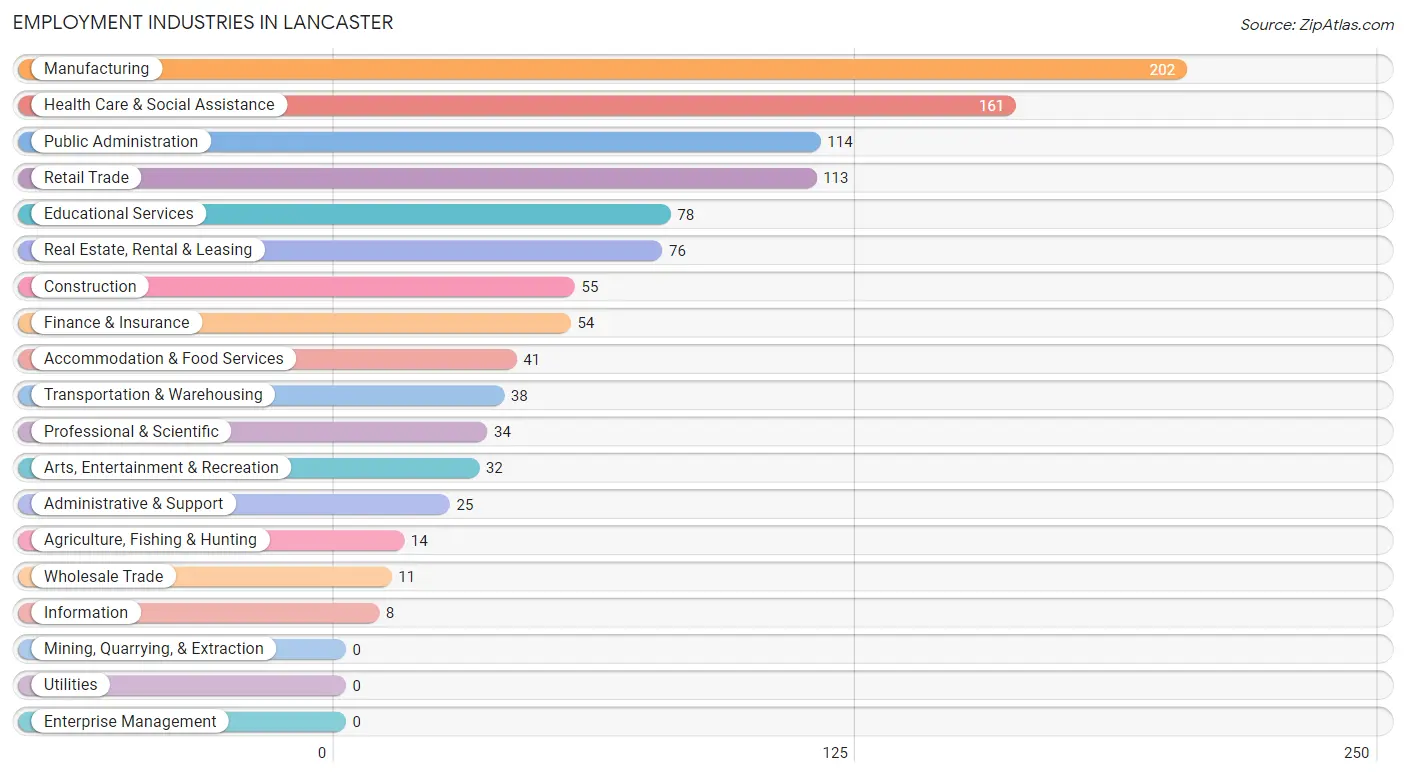
Employment Industries in Lancaster
The major employment industries in Lancaster include Manufacturing (202 | 18.3%), Health Care & Social Assistance (161 | 14.6%), Public Administration (114 | 10.3%), Retail Trade (113 | 10.2%), and Educational Services (78 | 7.1%).
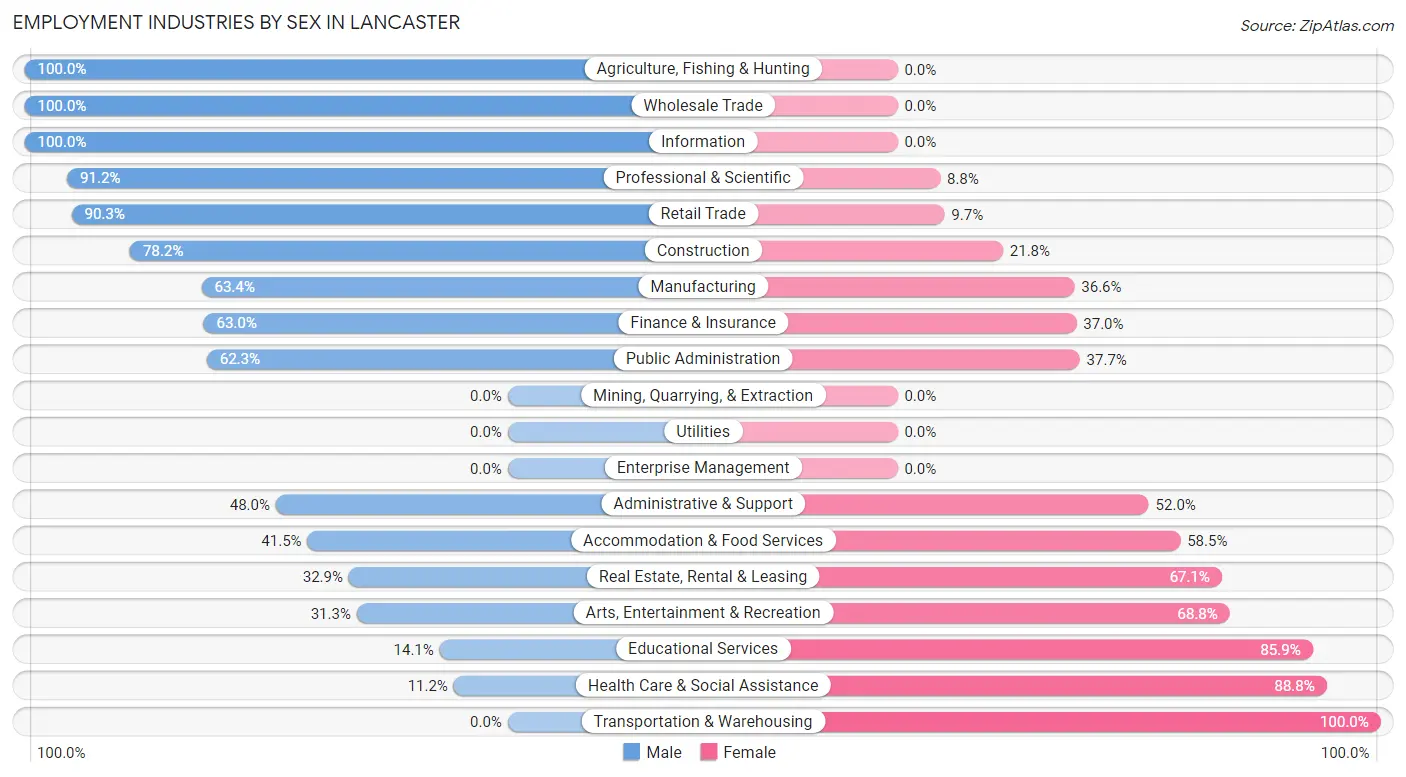
Employment Industries by Sex in Lancaster
The Lancaster industries that see more men than women are Agriculture, Fishing & Hunting (100.0%), Wholesale Trade (100.0%), and Information (100.0%), whereas the industries that tend to have a higher number of women are Transportation & Warehousing (100.0%), Health Care & Social Assistance (88.8%), and Educational Services (85.9%).
| Industry | Male | Female |
| Agriculture, Fishing & Hunting | 14 (100.0%) | 0 (0.0%) |
| Mining, Quarrying, & Extraction | 0 (0.0%) | 0 (0.0%) |
| Construction | 43 (78.2%) | 12 (21.8%) |
| Manufacturing | 128 (63.4%) | 74 (36.6%) |
| Wholesale Trade | 11 (100.0%) | 0 (0.0%) |
| Retail Trade | 102 (90.3%) | 11 (9.7%) |
| Transportation & Warehousing | 0 (0.0%) | 38 (100.0%) |
| Utilities | 0 (0.0%) | 0 (0.0%) |
| Information | 8 (100.0%) | 0 (0.0%) |
| Finance & Insurance | 34 (63.0%) | 20 (37.0%) |
| Real Estate, Rental & Leasing | 25 (32.9%) | 51 (67.1%) |
| Professional & Scientific | 31 (91.2%) | 3 (8.8%) |
| Enterprise Management | 0 (0.0%) | 0 (0.0%) |
| Administrative & Support | 12 (48.0%) | 13 (52.0%) |
| Educational Services | 11 (14.1%) | 67 (85.9%) |
| Health Care & Social Assistance | 18 (11.2%) | 143 (88.8%) |
| Arts, Entertainment & Recreation | 10 (31.2%) | 22 (68.8%) |
| Accommodation & Food Services | 17 (41.5%) | 24 (58.5%) |
| Public Administration | 71 (62.3%) | 43 (37.7%) |
| Total | 572 (51.8%) | 533 (48.2%) |
Education in Lancaster
School Enrollment in Lancaster
The most common levels of schooling among the 428 students in Lancaster are high school (173 | 40.4%), elementary school (101 | 23.6%), and middle school (74 | 17.3%).
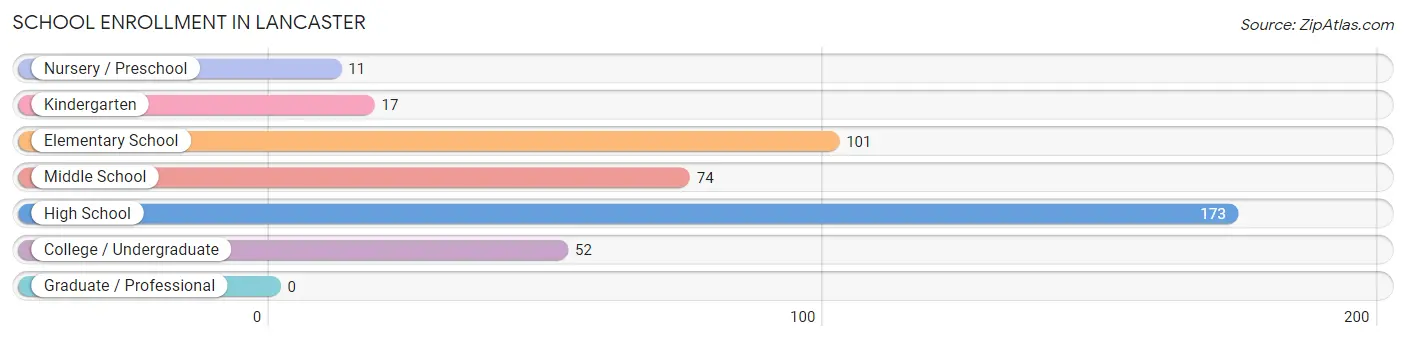
| School Level | # Students | % Students |
| Nursery / Preschool | 11 | 2.6% |
| Kindergarten | 17 | 4.0% |
| Elementary School | 101 | 23.6% |
| Middle School | 74 | 17.3% |
| High School | 173 | 40.4% |
| College / Undergraduate | 52 | 12.1% |
| Graduate / Professional | 0 | 0.0% |
| Total | 428 | 100.0% |
School Enrollment by Age by Funding Source in Lancaster
Out of a total of 428 students who are enrolled in schools in Lancaster, 24 (5.6%) attend a private institution, while the remaining 404 (94.4%) are enrolled in public schools. The age group of 10 to 14 year olds has the highest likelihood of being enrolled in private schools, with 11 (9.0% in the age bracket) enrolled. Conversely, the age group of 15 to 17 year olds has the lowest likelihood of being enrolled in a private school, with 98 (100.0% in the age bracket) attending a public institution.
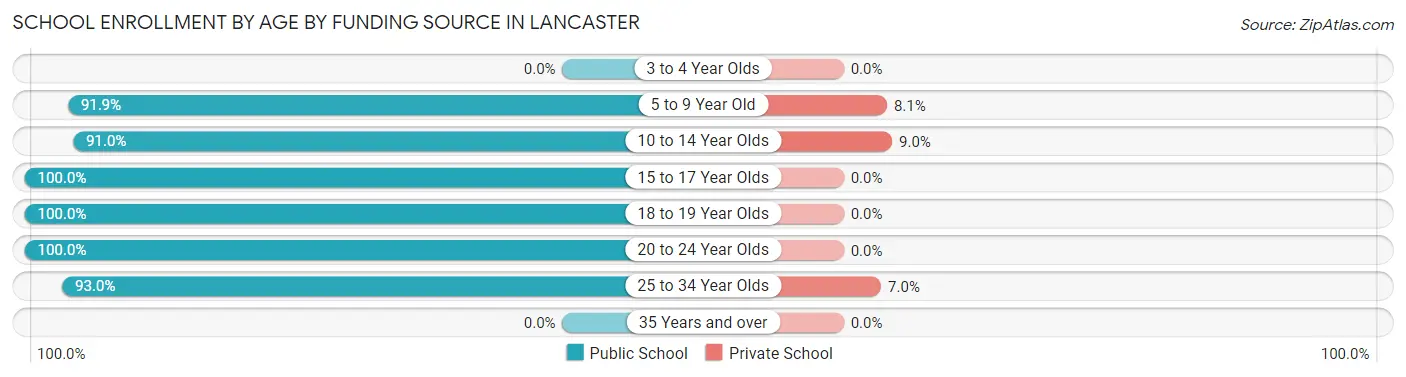
| Age Bracket | Public School | Private School |
| 3 to 4 Year Olds | 0 (0.0%) | 0 (0.0%) |
| 5 to 9 Year Old | 114 (91.9%) | 10 (8.1%) |
| 10 to 14 Year Olds | 111 (91.0%) | 11 (9.0%) |
| 15 to 17 Year Olds | 98 (100.0%) | 0 (0.0%) |
| 18 to 19 Year Olds | 32 (100.0%) | 0 (0.0%) |
| 20 to 24 Year Olds | 9 (100.0%) | 0 (0.0%) |
| 25 to 34 Year Olds | 40 (93.0%) | 3 (7.0%) |
| 35 Years and over | 0 (0.0%) | 0 (0.0%) |
| Total | 404 (94.4%) | 24 (5.6%) |
Educational Attainment by Field of Study in Lancaster
Arts & humanities (82 | 24.0%), science & technology (49 | 14.3%), visual & performing arts (48 | 14.0%), liberal arts & history (46 | 13.5%), and engineering (34 | 9.9%) are the most common fields of study among 342 individuals in Lancaster who have obtained a bachelor's degree or higher.
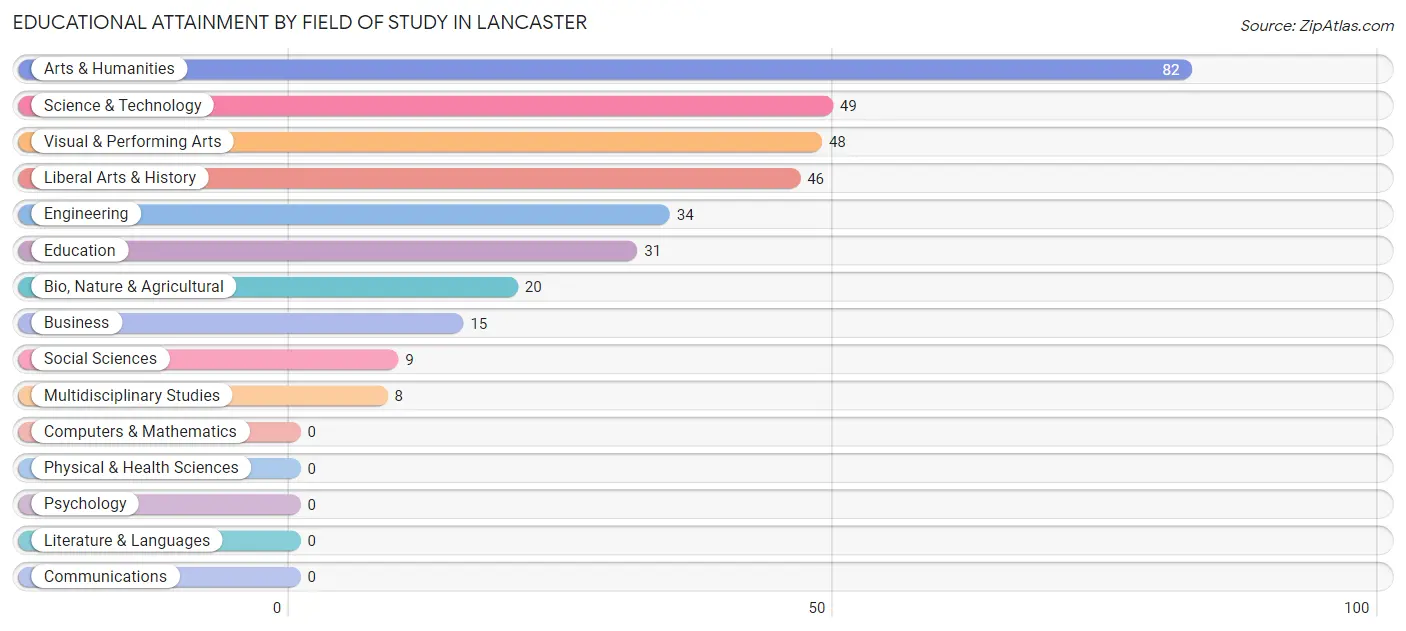
| Field of Study | # Graduates | % Graduates |
| Computers & Mathematics | 0 | 0.0% |
| Bio, Nature & Agricultural | 20 | 5.9% |
| Physical & Health Sciences | 0 | 0.0% |
| Psychology | 0 | 0.0% |
| Social Sciences | 9 | 2.6% |
| Engineering | 34 | 9.9% |
| Multidisciplinary Studies | 8 | 2.3% |
| Science & Technology | 49 | 14.3% |
| Business | 15 | 4.4% |
| Education | 31 | 9.1% |
| Literature & Languages | 0 | 0.0% |
| Liberal Arts & History | 46 | 13.5% |
| Visual & Performing Arts | 48 | 14.0% |
| Communications | 0 | 0.0% |
| Arts & Humanities | 82 | 24.0% |
| Total | 342 | 100.0% |
Transportation & Commute in Lancaster
Vehicle Availability by Sex in Lancaster
The most prevalent vehicle ownership categories in Lancaster are males with 2 vehicles (369, accounting for 67.2%) and females with 2 vehicles (288, making up 69.4%).
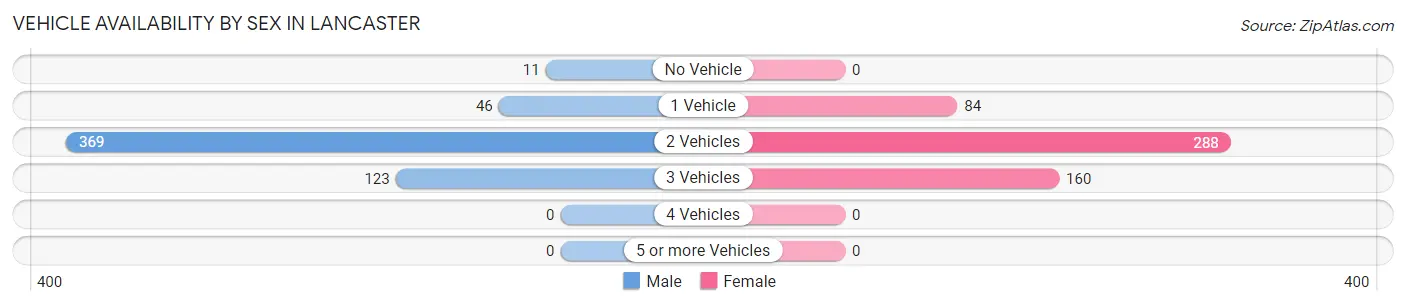
| Vehicles Available | Male | Female |
| No Vehicle | 11 (2.0%) | 0 (0.0%) |
| 1 Vehicle | 46 (8.4%) | 84 (15.8%) |
| 2 Vehicles | 369 (67.2%) | 288 (54.1%) |
| 3 Vehicles | 123 (22.4%) | 160 (30.1%) |
| 4 Vehicles | 0 (0.0%) | 0 (0.0%) |
| 5 or more Vehicles | 0 (0.0%) | 0 (0.0%) |
| Total | 549 (100.0%) | 532 (100.0%) |
Commute Time in Lancaster
The most frequently occuring commute durations in Lancaster are less than 5 minutes (164 commuters, 17.6%), 20 to 24 minutes (135 commuters, 14.5%), and 5 to 9 minutes (129 commuters, 13.9%).
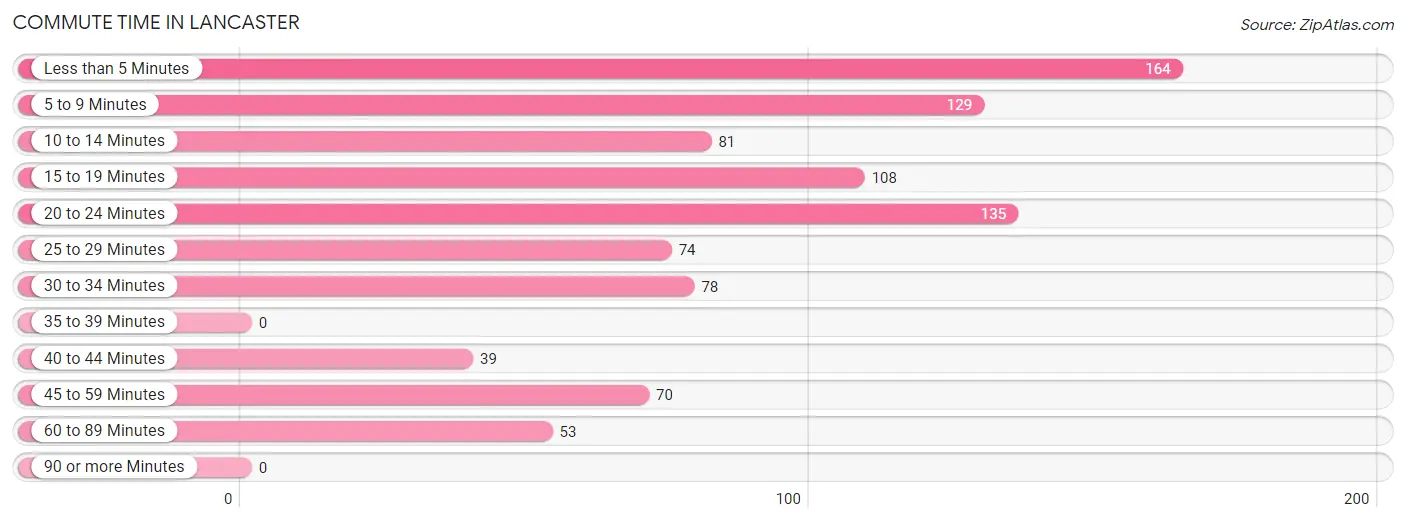
| Commute Time | # Commuters | % Commuters |
| Less than 5 Minutes | 164 | 17.6% |
| 5 to 9 Minutes | 129 | 13.9% |
| 10 to 14 Minutes | 81 | 8.7% |
| 15 to 19 Minutes | 108 | 11.6% |
| 20 to 24 Minutes | 135 | 14.5% |
| 25 to 29 Minutes | 74 | 8.0% |
| 30 to 34 Minutes | 78 | 8.4% |
| 35 to 39 Minutes | 0 | 0.0% |
| 40 to 44 Minutes | 39 | 4.2% |
| 45 to 59 Minutes | 70 | 7.5% |
| 60 to 89 Minutes | 53 | 5.7% |
| 90 or more Minutes | 0 | 0.0% |
Commute Time by Sex in Lancaster
The most common commute times in Lancaster are less than 5 minutes (73 commuters, 16.1%) for males and 20 to 24 minutes (104 commuters, 21.8%) for females.
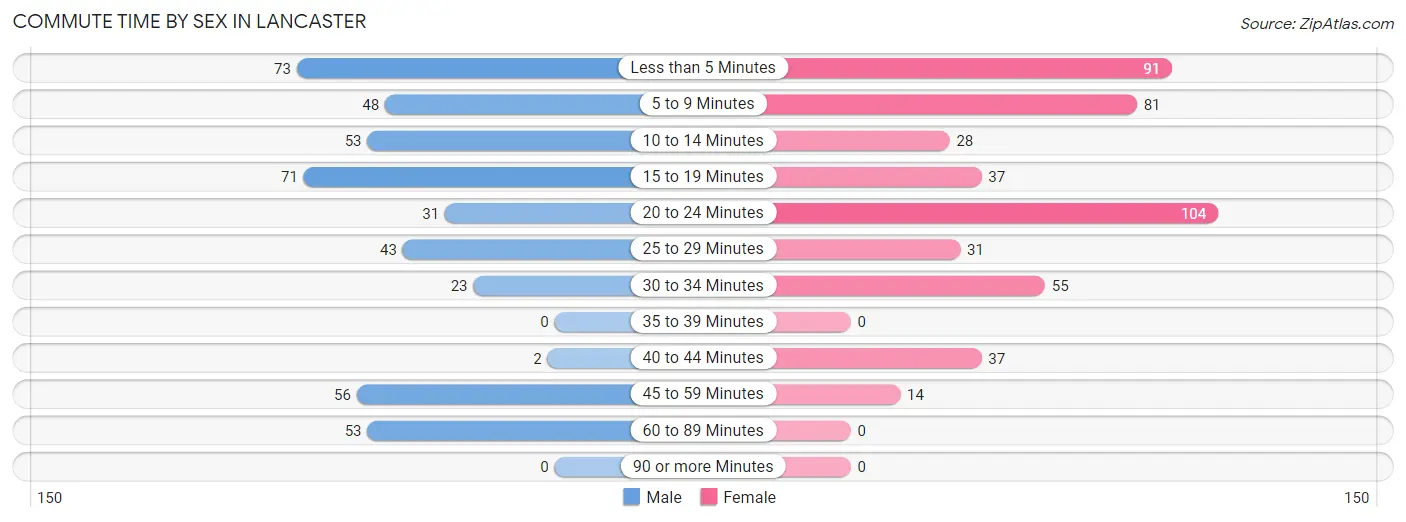
| Commute Time | Male | Female |
| Less than 5 Minutes | 73 (16.1%) | 91 (19.0%) |
| 5 to 9 Minutes | 48 (10.6%) | 81 (17.0%) |
| 10 to 14 Minutes | 53 (11.7%) | 28 (5.9%) |
| 15 to 19 Minutes | 71 (15.7%) | 37 (7.7%) |
| 20 to 24 Minutes | 31 (6.8%) | 104 (21.8%) |
| 25 to 29 Minutes | 43 (9.5%) | 31 (6.5%) |
| 30 to 34 Minutes | 23 (5.1%) | 55 (11.5%) |
| 35 to 39 Minutes | 0 (0.0%) | 0 (0.0%) |
| 40 to 44 Minutes | 2 (0.4%) | 37 (7.7%) |
| 45 to 59 Minutes | 56 (12.4%) | 14 (2.9%) |
| 60 to 89 Minutes | 53 (11.7%) | 0 (0.0%) |
| 90 or more Minutes | 0 (0.0%) | 0 (0.0%) |
Time of Departure to Work by Sex in Lancaster
The most frequent times of departure to work in Lancaster are 7:00 AM to 7:29 AM (96, 21.2%) for males and 7:00 AM to 7:29 AM (117, 24.5%) for females.
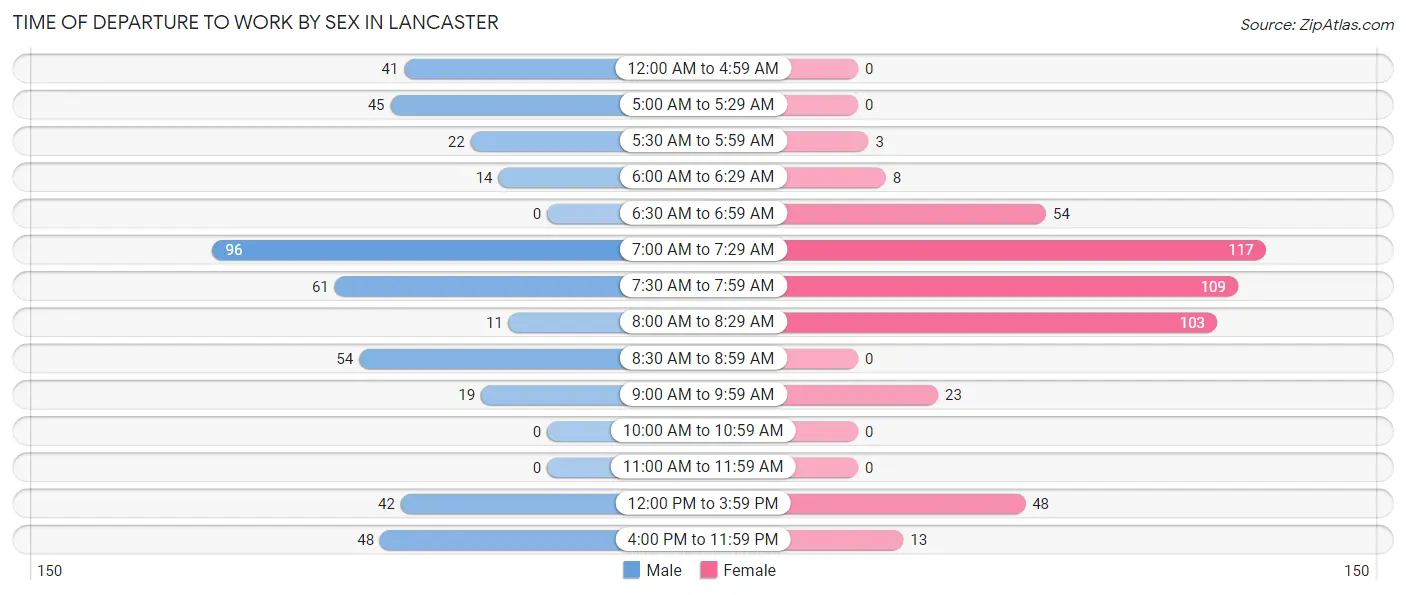
| Time of Departure | Male | Female |
| 12:00 AM to 4:59 AM | 41 (9.0%) | 0 (0.0%) |
| 5:00 AM to 5:29 AM | 45 (9.9%) | 0 (0.0%) |
| 5:30 AM to 5:59 AM | 22 (4.9%) | 3 (0.6%) |
| 6:00 AM to 6:29 AM | 14 (3.1%) | 8 (1.7%) |
| 6:30 AM to 6:59 AM | 0 (0.0%) | 54 (11.3%) |
| 7:00 AM to 7:29 AM | 96 (21.2%) | 117 (24.5%) |
| 7:30 AM to 7:59 AM | 61 (13.5%) | 109 (22.8%) |
| 8:00 AM to 8:29 AM | 11 (2.4%) | 103 (21.5%) |
| 8:30 AM to 8:59 AM | 54 (11.9%) | 0 (0.0%) |
| 9:00 AM to 9:59 AM | 19 (4.2%) | 23 (4.8%) |
| 10:00 AM to 10:59 AM | 0 (0.0%) | 0 (0.0%) |
| 11:00 AM to 11:59 AM | 0 (0.0%) | 0 (0.0%) |
| 12:00 PM to 3:59 PM | 42 (9.3%) | 48 (10.0%) |
| 4:00 PM to 11:59 PM | 48 (10.6%) | 13 (2.7%) |
| Total | 453 (100.0%) | 478 (100.0%) |
Housing Occupancy in Lancaster
Occupancy by Ownership in Lancaster
Of the total 860 dwellings in Lancaster, owner-occupied units account for 624 (72.6%), while renter-occupied units make up 236 (27.4%).
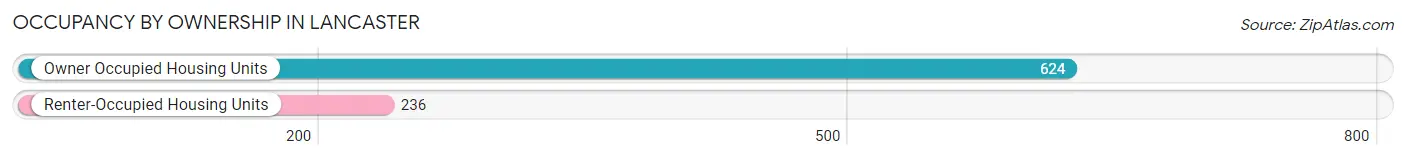
| Occupancy | # Housing Units | % Housing Units |
| Owner Occupied Housing Units | 624 | 72.6% |
| Renter-Occupied Housing Units | 236 | 27.4% |
| Total Occupied Housing Units | 860 | 100.0% |
Occupancy by Household Size in Lancaster
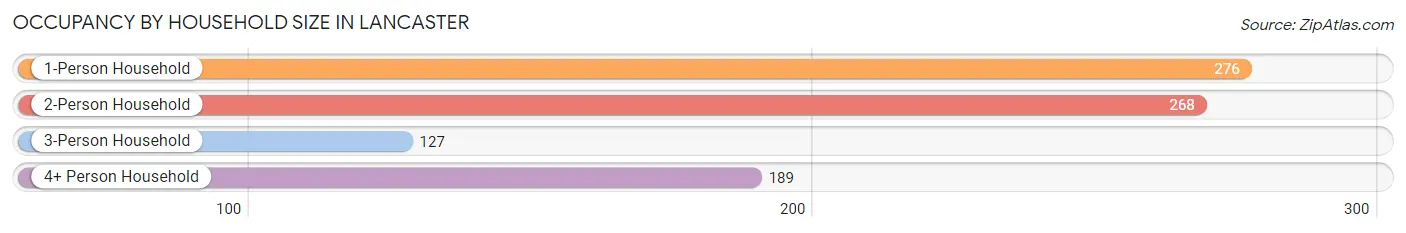
| Household Size | # Housing Units | % Housing Units |
| 1-Person Household | 276 | 32.1% |
| 2-Person Household | 268 | 31.2% |
| 3-Person Household | 127 | 14.8% |
| 4+ Person Household | 189 | 22.0% |
| Total Housing Units | 860 | 100.0% |
Occupancy by Ownership by Household Size in Lancaster
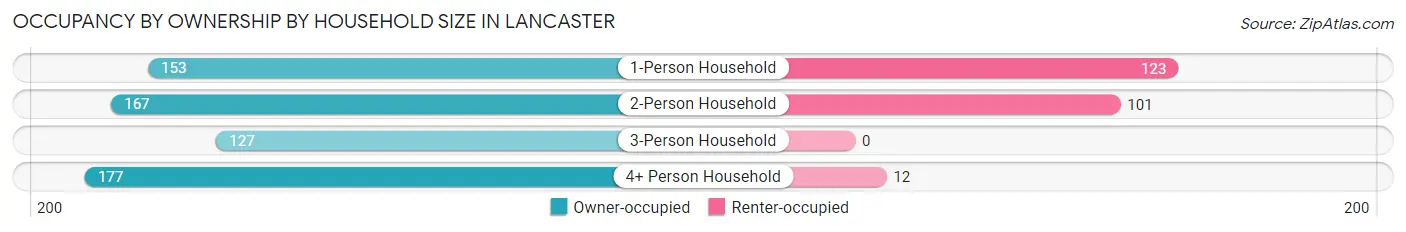
| Household Size | Owner-occupied | Renter-occupied |
| 1-Person Household | 153 (55.4%) | 123 (44.6%) |
| 2-Person Household | 167 (62.3%) | 101 (37.7%) |
| 3-Person Household | 127 (100.0%) | 0 (0.0%) |
| 4+ Person Household | 177 (93.6%) | 12 (6.4%) |
| Total Housing Units | 624 (72.6%) | 236 (27.4%) |
Occupancy by Educational Attainment in Lancaster
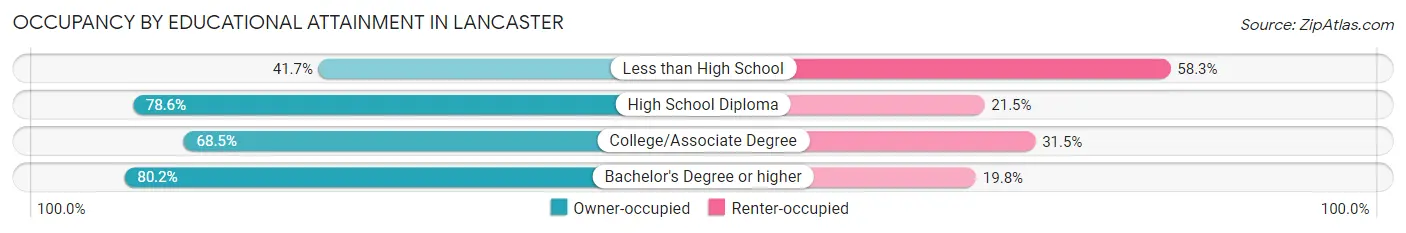
| Household Size | Owner-occupied | Renter-occupied |
| Less than High School | 40 (41.7%) | 56 (58.3%) |
| High School Diploma | 238 (78.5%) | 65 (21.4%) |
| College/Associate Degree | 139 (68.5%) | 64 (31.5%) |
| Bachelor's Degree or higher | 207 (80.2%) | 51 (19.8%) |
Occupancy by Age of Householder in Lancaster
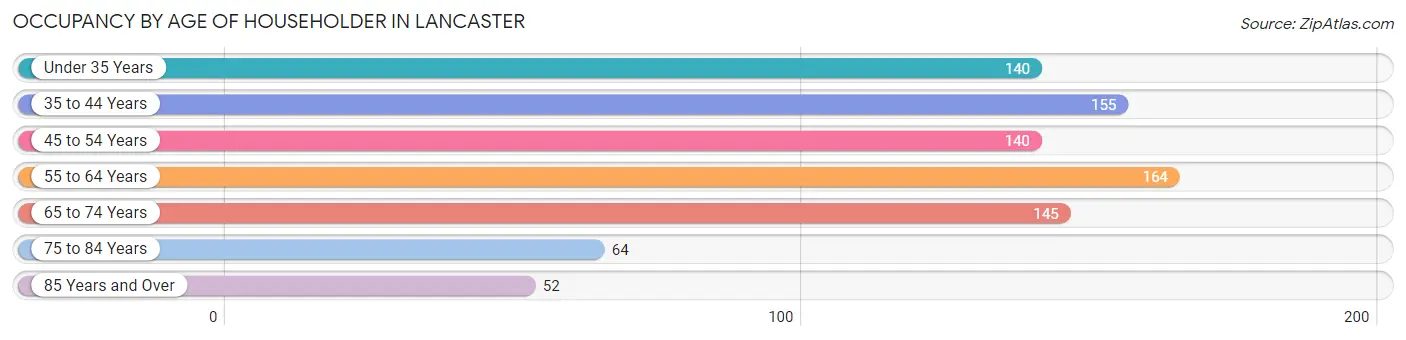
| Age Bracket | # Households | % Households |
| Under 35 Years | 140 | 16.3% |
| 35 to 44 Years | 155 | 18.0% |
| 45 to 54 Years | 140 | 16.3% |
| 55 to 64 Years | 164 | 19.1% |
| 65 to 74 Years | 145 | 16.9% |
| 75 to 84 Years | 64 | 7.4% |
| 85 Years and Over | 52 | 6.0% |
| Total | 860 | 100.0% |
Housing Finances in Lancaster
Median Income by Occupancy in Lancaster
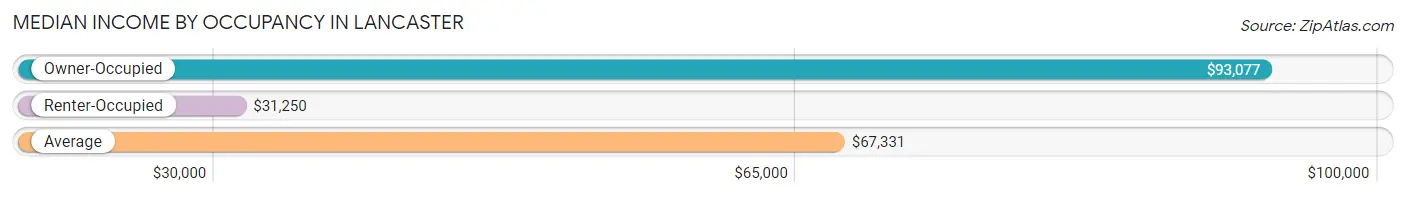
| Occupancy Type | # Households | Median Income |
| Owner-Occupied | 624 (72.6%) | $93,077 |
| Renter-Occupied | 236 (27.4%) | $31,250 |
| Average | 860 (100.0%) | $67,331 |
Occupancy by Householder Income Bracket in Lancaster
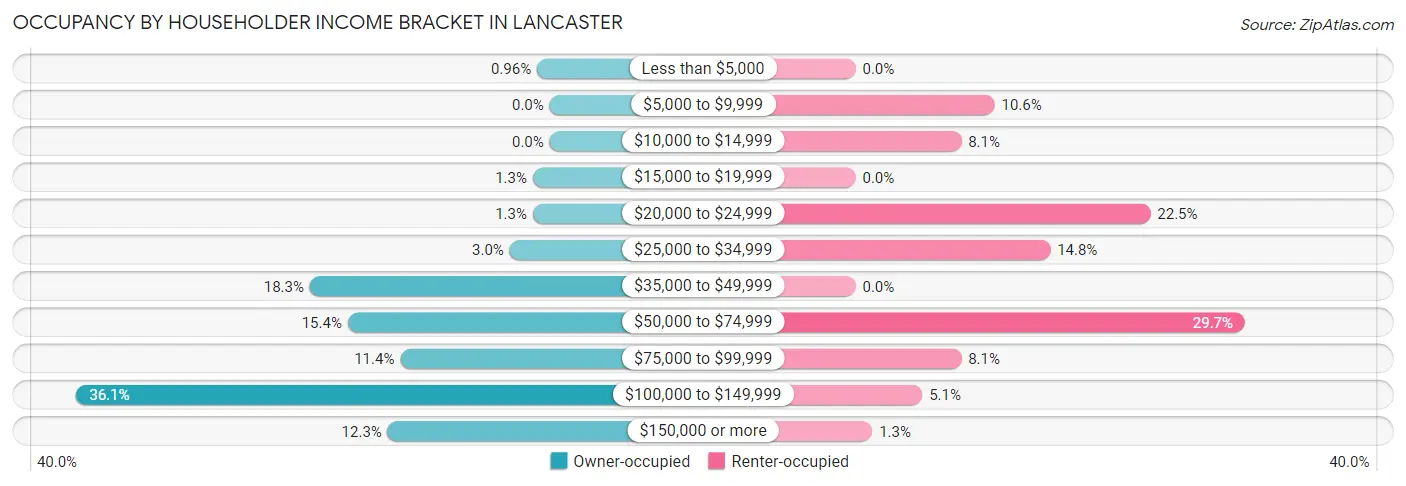
| Income Bracket | Owner-occupied | Renter-occupied |
| Less than $5,000 | 6 (1.0%) | 0 (0.0%) |
| $5,000 to $9,999 | 0 (0.0%) | 25 (10.6%) |
| $10,000 to $14,999 | 0 (0.0%) | 19 (8.1%) |
| $15,000 to $19,999 | 8 (1.3%) | 0 (0.0%) |
| $20,000 to $24,999 | 8 (1.3%) | 53 (22.5%) |
| $25,000 to $34,999 | 19 (3.0%) | 35 (14.8%) |
| $35,000 to $49,999 | 114 (18.3%) | 0 (0.0%) |
| $50,000 to $74,999 | 96 (15.4%) | 70 (29.7%) |
| $75,000 to $99,999 | 71 (11.4%) | 19 (8.1%) |
| $100,000 to $149,999 | 225 (36.1%) | 12 (5.1%) |
| $150,000 or more | 77 (12.3%) | 3 (1.3%) |
| Total | 624 (100.0%) | 236 (100.0%) |
Monthly Housing Cost Tiers in Lancaster
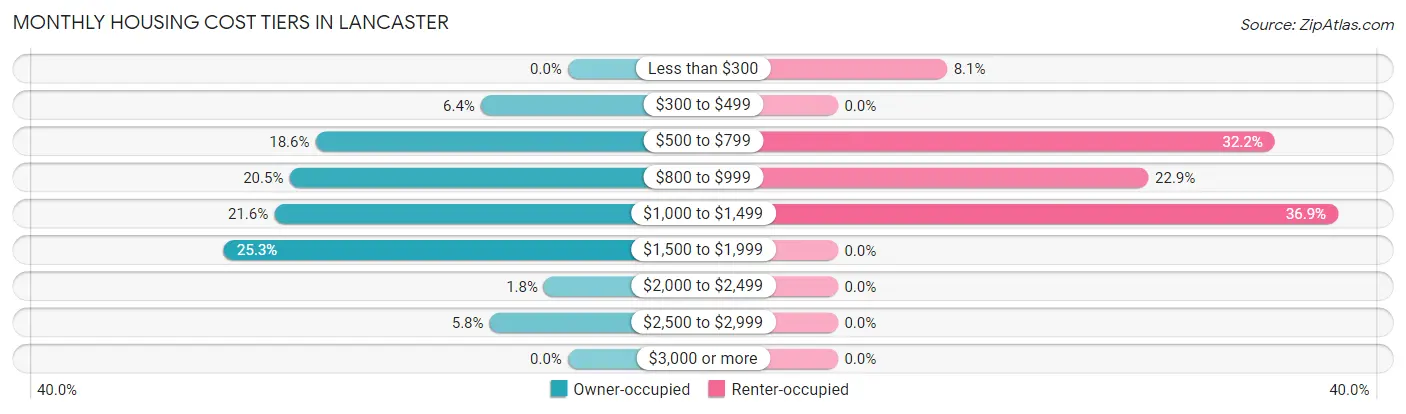
| Monthly Cost | Owner-occupied | Renter-occupied |
| Less than $300 | 0 (0.0%) | 19 (8.1%) |
| $300 to $499 | 40 (6.4%) | 0 (0.0%) |
| $500 to $799 | 116 (18.6%) | 76 (32.2%) |
| $800 to $999 | 128 (20.5%) | 54 (22.9%) |
| $1,000 to $1,499 | 135 (21.6%) | 87 (36.9%) |
| $1,500 to $1,999 | 158 (25.3%) | 0 (0.0%) |
| $2,000 to $2,499 | 11 (1.8%) | 0 (0.0%) |
| $2,500 to $2,999 | 36 (5.8%) | 0 (0.0%) |
| $3,000 or more | 0 (0.0%) | 0 (0.0%) |
| Total | 624 (100.0%) | 236 (100.0%) |
Physical Housing Characteristics in Lancaster
Housing Structures in Lancaster
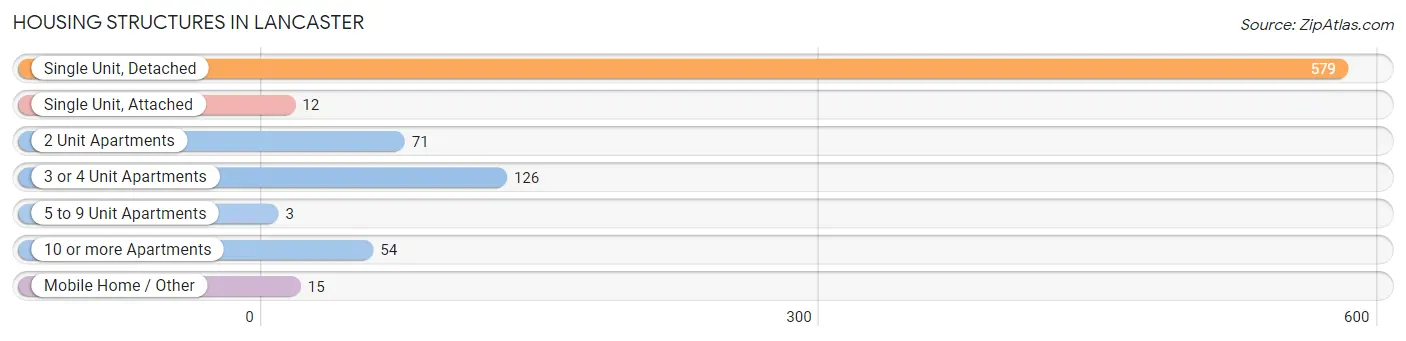
| Structure Type | # Housing Units | % Housing Units |
| Single Unit, Detached | 579 | 67.3% |
| Single Unit, Attached | 12 | 1.4% |
| 2 Unit Apartments | 71 | 8.3% |
| 3 or 4 Unit Apartments | 126 | 14.6% |
| 5 to 9 Unit Apartments | 3 | 0.4% |
| 10 or more Apartments | 54 | 6.3% |
| Mobile Home / Other | 15 | 1.7% |
| Total | 860 | 100.0% |
Housing Structures by Occupancy in Lancaster
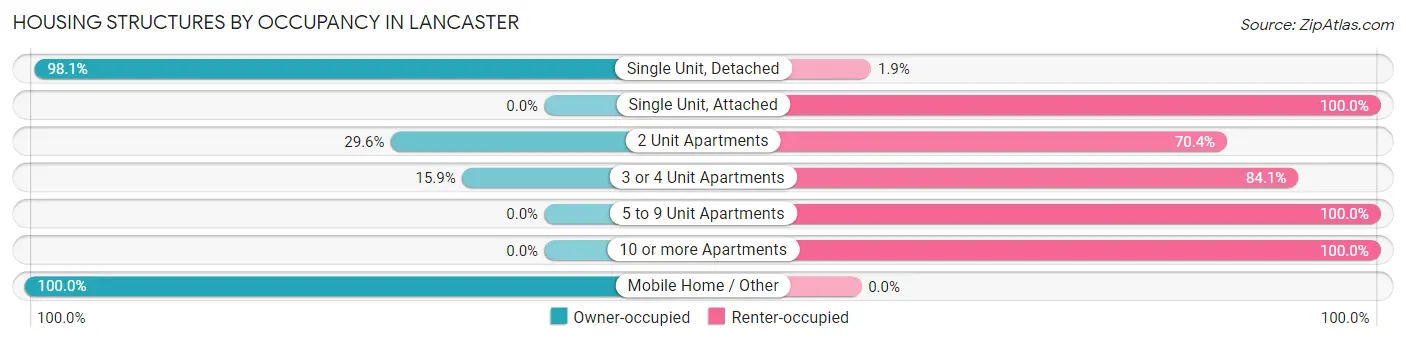
| Structure Type | Owner-occupied | Renter-occupied |
| Single Unit, Detached | 568 (98.1%) | 11 (1.9%) |
| Single Unit, Attached | 0 (0.0%) | 12 (100.0%) |
| 2 Unit Apartments | 21 (29.6%) | 50 (70.4%) |
| 3 or 4 Unit Apartments | 20 (15.9%) | 106 (84.1%) |
| 5 to 9 Unit Apartments | 0 (0.0%) | 3 (100.0%) |
| 10 or more Apartments | 0 (0.0%) | 54 (100.0%) |
| Mobile Home / Other | 15 (100.0%) | 0 (0.0%) |
| Total | 624 (72.6%) | 236 (27.4%) |
Housing Structures by Number of Rooms in Lancaster
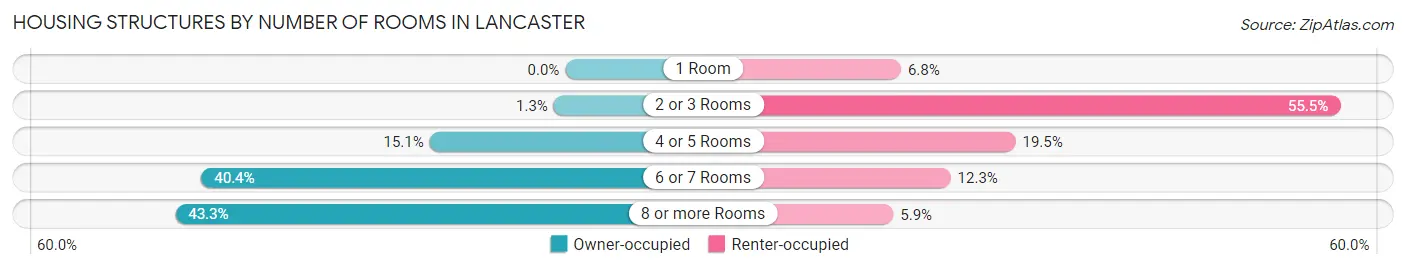
| Number of Rooms | Owner-occupied | Renter-occupied |
| 1 Room | 0 (0.0%) | 16 (6.8%) |
| 2 or 3 Rooms | 8 (1.3%) | 131 (55.5%) |
| 4 or 5 Rooms | 94 (15.1%) | 46 (19.5%) |
| 6 or 7 Rooms | 252 (40.4%) | 29 (12.3%) |
| 8 or more Rooms | 270 (43.3%) | 14 (5.9%) |
| Total | 624 (100.0%) | 236 (100.0%) |
Housing Structure by Heating Type in Lancaster
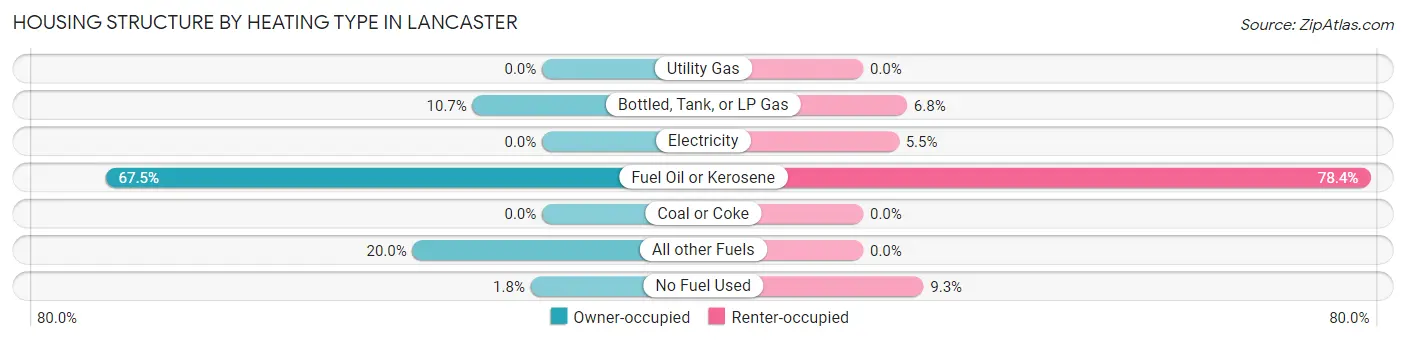
| Heating Type | Owner-occupied | Renter-occupied |
| Utility Gas | 0 (0.0%) | 0 (0.0%) |
| Bottled, Tank, or LP Gas | 67 (10.7%) | 16 (6.8%) |
| Electricity | 0 (0.0%) | 13 (5.5%) |
| Fuel Oil or Kerosene | 421 (67.5%) | 185 (78.4%) |
| Coal or Coke | 0 (0.0%) | 0 (0.0%) |
| All other Fuels | 125 (20.0%) | 0 (0.0%) |
| No Fuel Used | 11 (1.8%) | 22 (9.3%) |
| Total | 624 (100.0%) | 236 (100.0%) |
Household Vehicle Usage in Lancaster
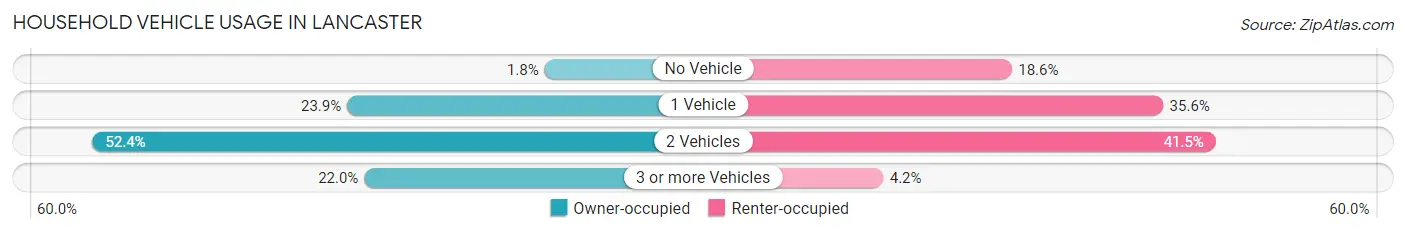
| Vehicles per Household | Owner-occupied | Renter-occupied |
| No Vehicle | 11 (1.8%) | 44 (18.6%) |
| 1 Vehicle | 149 (23.9%) | 84 (35.6%) |
| 2 Vehicles | 327 (52.4%) | 98 (41.5%) |
| 3 or more Vehicles | 137 (22.0%) | 10 (4.2%) |
| Total | 624 (100.0%) | 236 (100.0%) |
Real Estate & Mortgages in Lancaster
Real Estate and Mortgage Overview in Lancaster
| Characteristic | Without Mortgage | With Mortgage |
| Housing Units | 310 | 314 |
| Median Property Value | $184,700 | $154,700 |
| Median Household Income | $102,685 | $40 |
| Monthly Housing Costs | $798 | $0 |
| Real Estate Taxes | $3,638 | $0 |
Property Value by Mortgage Status in Lancaster
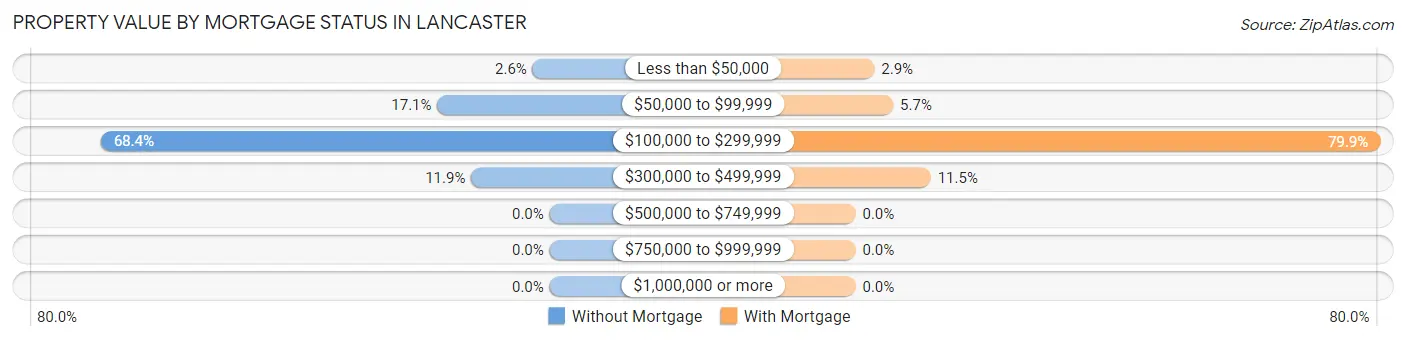
| Property Value | Without Mortgage | With Mortgage |
| Less than $50,000 | 8 (2.6%) | 9 (2.9%) |
| $50,000 to $99,999 | 53 (17.1%) | 18 (5.7%) |
| $100,000 to $299,999 | 212 (68.4%) | 251 (79.9%) |
| $300,000 to $499,999 | 37 (11.9%) | 36 (11.5%) |
| $500,000 to $749,999 | 0 (0.0%) | 0 (0.0%) |
| $750,000 to $999,999 | 0 (0.0%) | 0 (0.0%) |
| $1,000,000 or more | 0 (0.0%) | 0 (0.0%) |
| Total | 310 (100.0%) | 314 (100.0%) |
Household Income by Mortgage Status in Lancaster
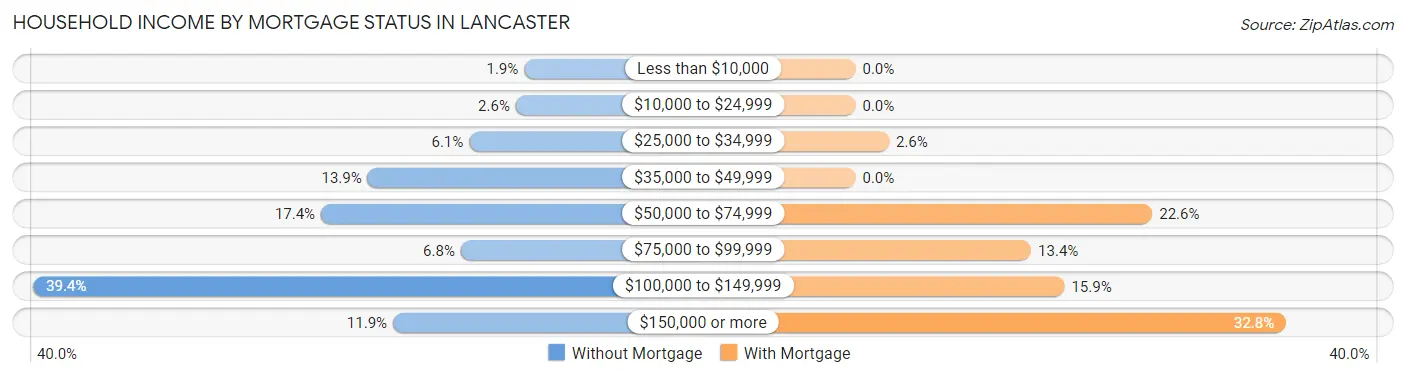
| Household Income | Without Mortgage | With Mortgage |
| Less than $10,000 | 6 (1.9%) | 0 (0.0%) |
| $10,000 to $24,999 | 8 (2.6%) | 0 (0.0%) |
| $25,000 to $34,999 | 19 (6.1%) | 8 (2.5%) |
| $35,000 to $49,999 | 43 (13.9%) | 0 (0.0%) |
| $50,000 to $74,999 | 54 (17.4%) | 71 (22.6%) |
| $75,000 to $99,999 | 21 (6.8%) | 42 (13.4%) |
| $100,000 to $149,999 | 122 (39.4%) | 50 (15.9%) |
| $150,000 or more | 37 (11.9%) | 103 (32.8%) |
| Total | 310 (100.0%) | 314 (100.0%) |
Property Value to Household Income Ratio in Lancaster
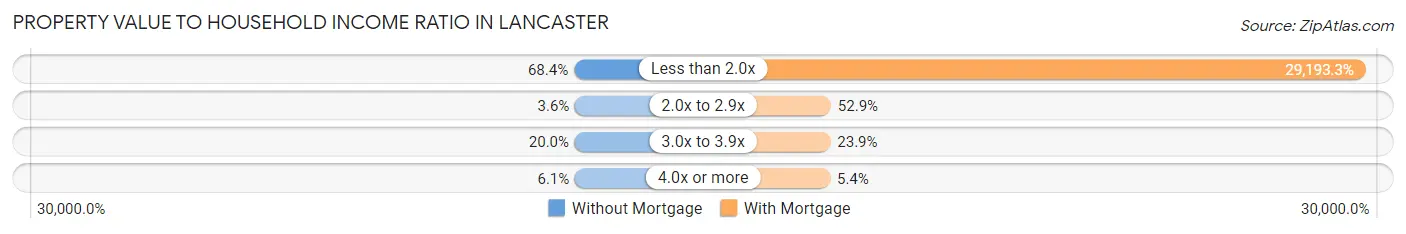
| Value-to-Income Ratio | Without Mortgage | With Mortgage |
| Less than 2.0x | 212 (68.4%) | 91,667 (29,193.3%) |
| 2.0x to 2.9x | 11 (3.5%) | 166 (52.9%) |
| 3.0x to 3.9x | 62 (20.0%) | 75 (23.9%) |
| 4.0x or more | 19 (6.1%) | 17 (5.4%) |
| Total | 310 (100.0%) | 314 (100.0%) |
Real Estate Taxes by Mortgage Status in Lancaster
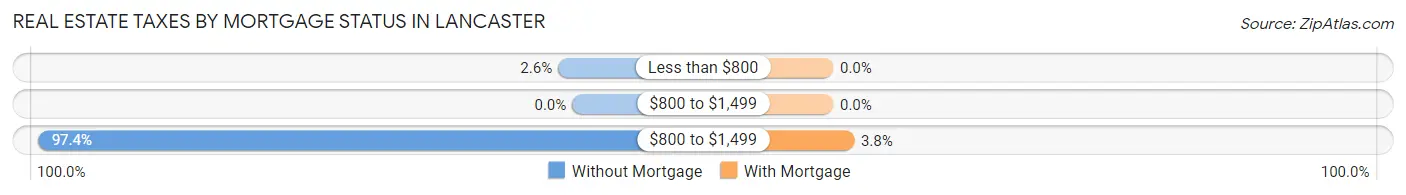
| Property Taxes | Without Mortgage | With Mortgage |
| Less than $800 | 8 (2.6%) | 0 (0.0%) |
| $800 to $1,499 | 0 (0.0%) | 0 (0.0%) |
| $800 to $1,499 | 302 (97.4%) | 12 (3.8%) |
| Total | 310 (100.0%) | 314 (100.0%) |
Health & Disability in Lancaster
Health Insurance Coverage by Age in Lancaster
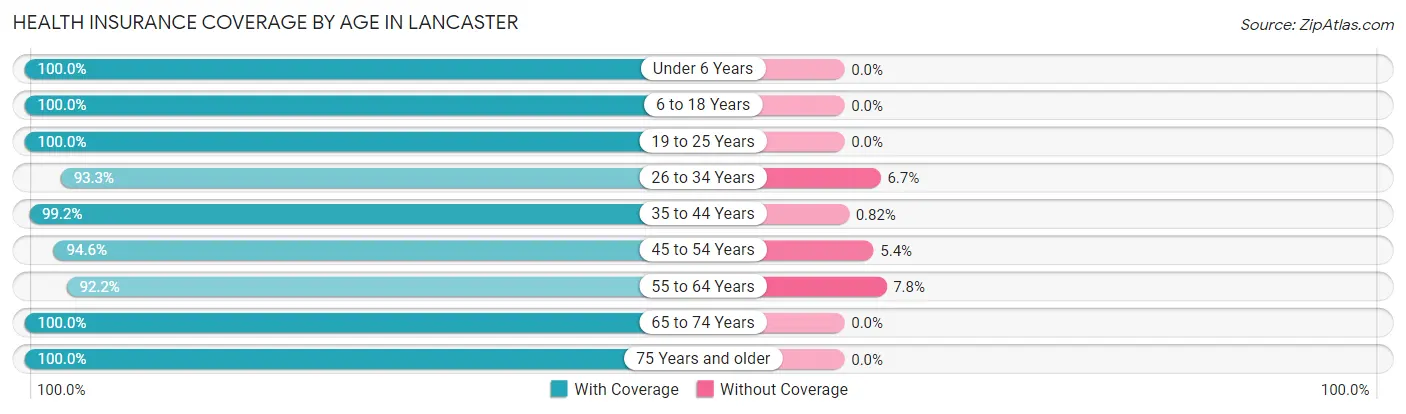
| Age Bracket | With Coverage | Without Coverage |
| Under 6 Years | 222 (100.0%) | 0 (0.0%) |
| 6 to 18 Years | 385 (100.0%) | 0 (0.0%) |
| 19 to 25 Years | 65 (100.0%) | 0 (0.0%) |
| 26 to 34 Years | 332 (93.3%) | 24 (6.7%) |
| 35 to 44 Years | 242 (99.2%) | 2 (0.8%) |
| 45 to 54 Years | 262 (94.6%) | 15 (5.4%) |
| 55 to 64 Years | 236 (92.2%) | 20 (7.8%) |
| 65 to 74 Years | 229 (100.0%) | 0 (0.0%) |
| 75 Years and older | 120 (100.0%) | 0 (0.0%) |
| Total | 2,093 (97.2%) | 61 (2.8%) |
Health Insurance Coverage by Citizenship Status in Lancaster
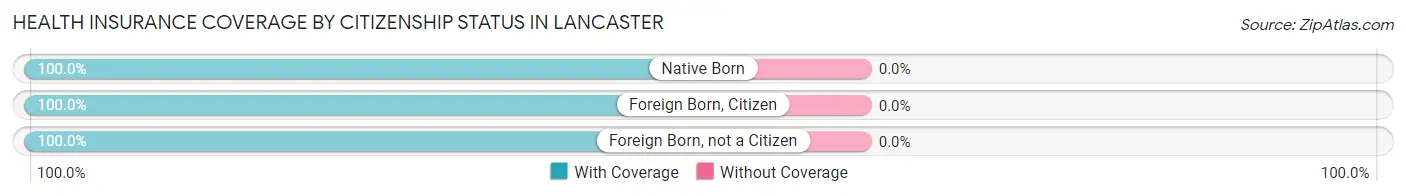
| Citizenship Status | With Coverage | Without Coverage |
| Native Born | 222 (100.0%) | 0 (0.0%) |
| Foreign Born, Citizen | 385 (100.0%) | 0 (0.0%) |
| Foreign Born, not a Citizen | 65 (100.0%) | 0 (0.0%) |
Health Insurance Coverage by Household Income in Lancaster
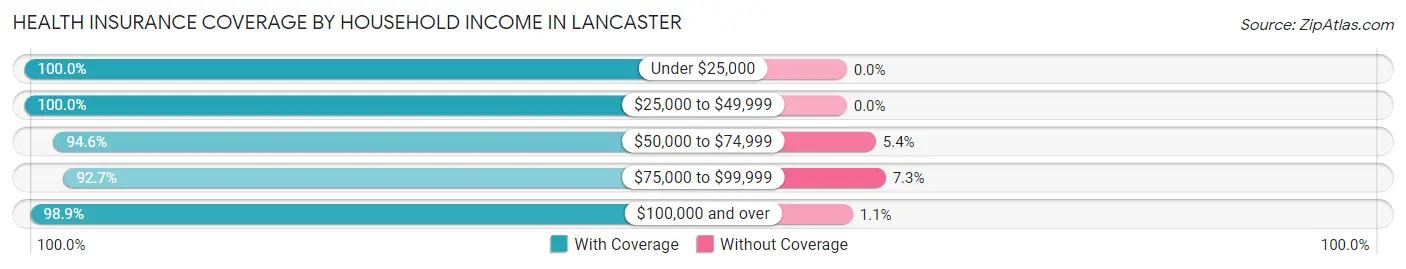
| Household Income | With Coverage | Without Coverage |
| Under $25,000 | 211 (100.0%) | 0 (0.0%) |
| $25,000 to $49,999 | 244 (100.0%) | 0 (0.0%) |
| $50,000 to $74,999 | 487 (94.6%) | 28 (5.4%) |
| $75,000 to $99,999 | 267 (92.7%) | 21 (7.3%) |
| $100,000 and over | 876 (98.9%) | 10 (1.1%) |
Public vs Private Health Insurance Coverage by Age in Lancaster
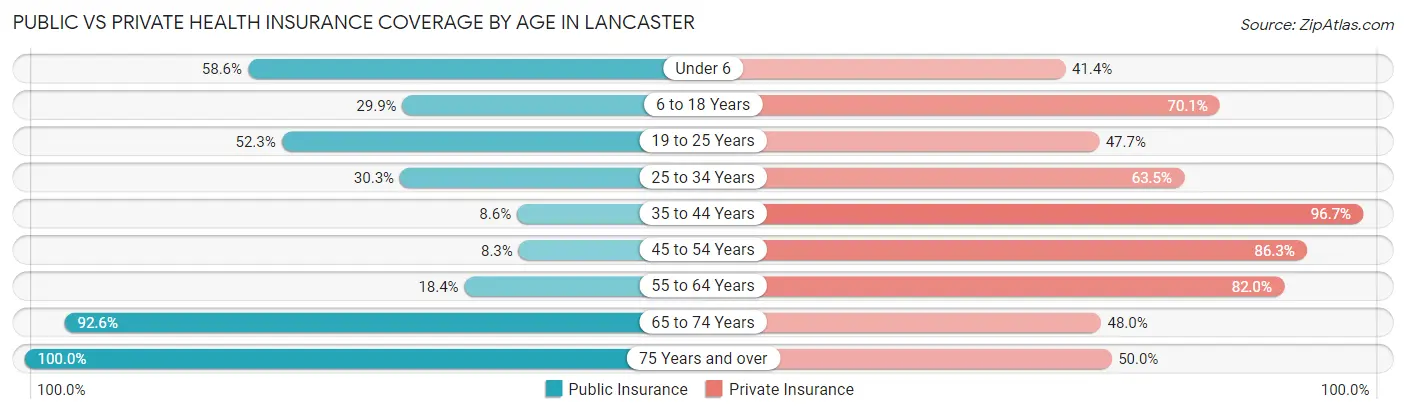
| Age Bracket | Public Insurance | Private Insurance |
| Under 6 | 130 (58.6%) | 92 (41.4%) |
| 6 to 18 Years | 115 (29.9%) | 270 (70.1%) |
| 19 to 25 Years | 34 (52.3%) | 31 (47.7%) |
| 25 to 34 Years | 108 (30.3%) | 226 (63.5%) |
| 35 to 44 Years | 21 (8.6%) | 236 (96.7%) |
| 45 to 54 Years | 23 (8.3%) | 239 (86.3%) |
| 55 to 64 Years | 47 (18.4%) | 210 (82.0%) |
| 65 to 74 Years | 212 (92.6%) | 110 (48.0%) |
| 75 Years and over | 120 (100.0%) | 60 (50.0%) |
| Total | 810 (37.6%) | 1,474 (68.4%) |
Disability Status by Sex by Age in Lancaster
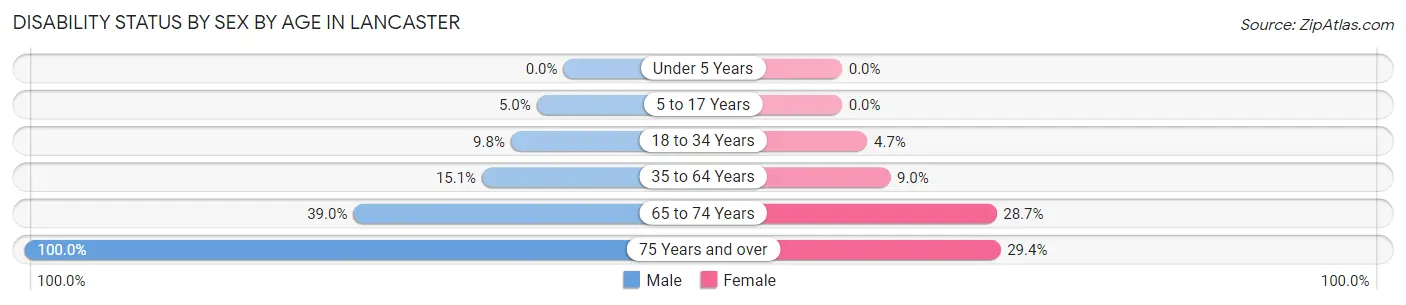
| Age Bracket | Male | Female |
| Under 5 Years | 0 (0.0%) | 0 (0.0%) |
| 5 to 17 Years | 8 (5.0%) | 0 (0.0%) |
| 18 to 34 Years | 25 (9.8%) | 11 (4.7%) |
| 35 to 64 Years | 60 (15.1%) | 34 (8.9%) |
| 65 to 74 Years | 39 (39.0%) | 37 (28.7%) |
| 75 Years and over | 35 (100.0%) | 25 (29.4%) |
Disability Class by Sex by Age in Lancaster
Disability Class: Hearing Difficulty
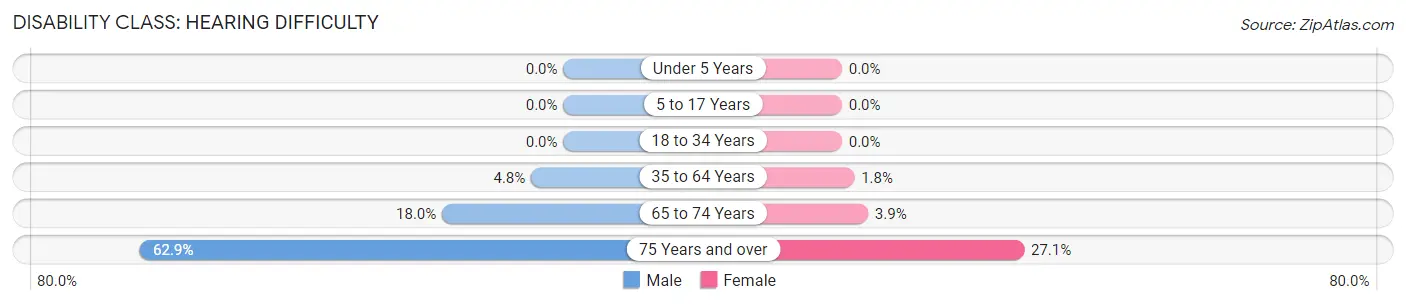
| Age Bracket | Male | Female |
| Under 5 Years | 0 (0.0%) | 0 (0.0%) |
| 5 to 17 Years | 0 (0.0%) | 0 (0.0%) |
| 18 to 34 Years | 0 (0.0%) | 0 (0.0%) |
| 35 to 64 Years | 19 (4.8%) | 7 (1.8%) |
| 65 to 74 Years | 18 (18.0%) | 5 (3.9%) |
| 75 Years and over | 22 (62.9%) | 23 (27.1%) |
Disability Class: Vision Difficulty
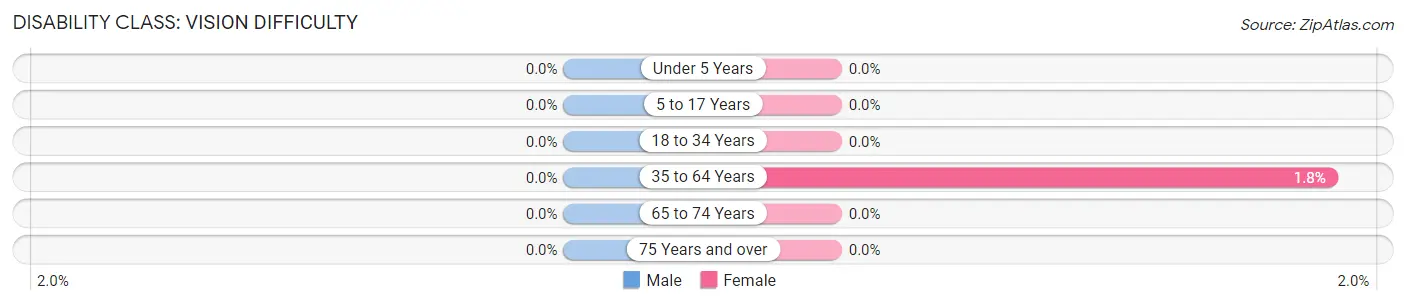
| Age Bracket | Male | Female |
| Under 5 Years | 0 (0.0%) | 0 (0.0%) |
| 5 to 17 Years | 0 (0.0%) | 0 (0.0%) |
| 18 to 34 Years | 0 (0.0%) | 0 (0.0%) |
| 35 to 64 Years | 0 (0.0%) | 7 (1.8%) |
| 65 to 74 Years | 0 (0.0%) | 0 (0.0%) |
| 75 Years and over | 0 (0.0%) | 0 (0.0%) |
Disability Class: Cognitive Difficulty
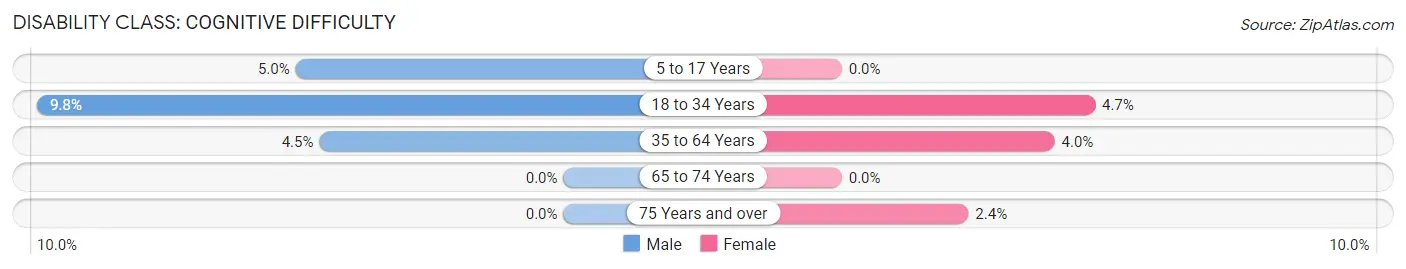
| Age Bracket | Male | Female |
| 5 to 17 Years | 8 (5.0%) | 0 (0.0%) |
| 18 to 34 Years | 25 (9.8%) | 11 (4.7%) |
| 35 to 64 Years | 18 (4.5%) | 15 (4.0%) |
| 65 to 74 Years | 0 (0.0%) | 0 (0.0%) |
| 75 Years and over | 0 (0.0%) | 2 (2.4%) |
Disability Class: Ambulatory Difficulty
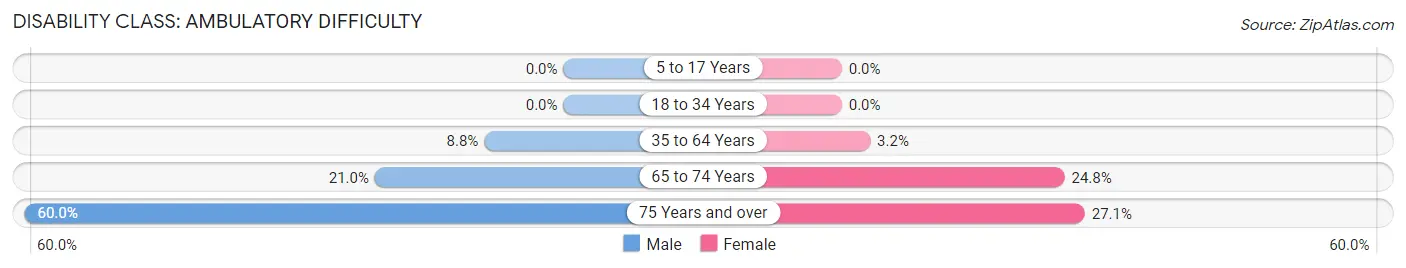
| Age Bracket | Male | Female |
| 5 to 17 Years | 0 (0.0%) | 0 (0.0%) |
| 18 to 34 Years | 0 (0.0%) | 0 (0.0%) |
| 35 to 64 Years | 35 (8.8%) | 12 (3.2%) |
| 65 to 74 Years | 21 (21.0%) | 32 (24.8%) |
| 75 Years and over | 21 (60.0%) | 23 (27.1%) |
Disability Class: Self-Care Difficulty
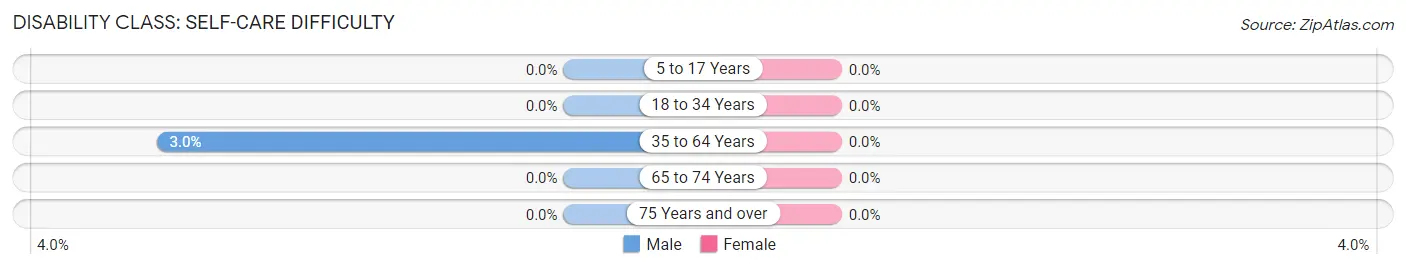
| Age Bracket | Male | Female |
| 5 to 17 Years | 0 (0.0%) | 0 (0.0%) |
| 18 to 34 Years | 0 (0.0%) | 0 (0.0%) |
| 35 to 64 Years | 12 (3.0%) | 0 (0.0%) |
| 65 to 74 Years | 0 (0.0%) | 0 (0.0%) |
| 75 Years and over | 0 (0.0%) | 0 (0.0%) |
Technology Access in Lancaster
Computing Device Access in Lancaster
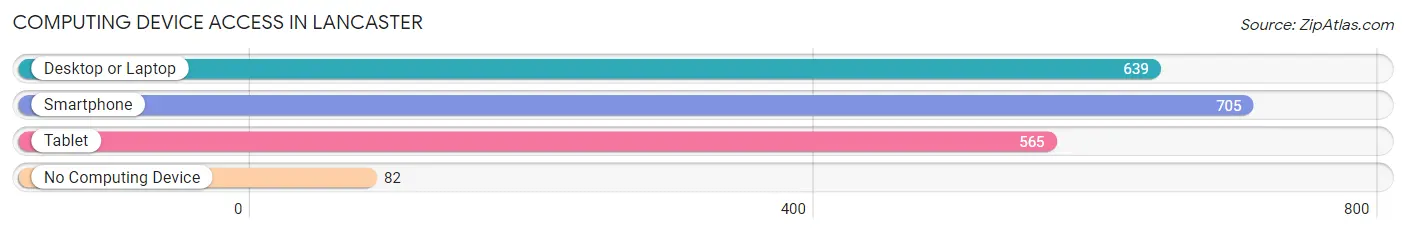
| Device Type | # Households | % Households |
| Desktop or Laptop | 639 | 74.3% |
| Smartphone | 705 | 82.0% |
| Tablet | 565 | 65.7% |
| No Computing Device | 82 | 9.5% |
| Total | 860 | 100.0% |
Internet Access in Lancaster
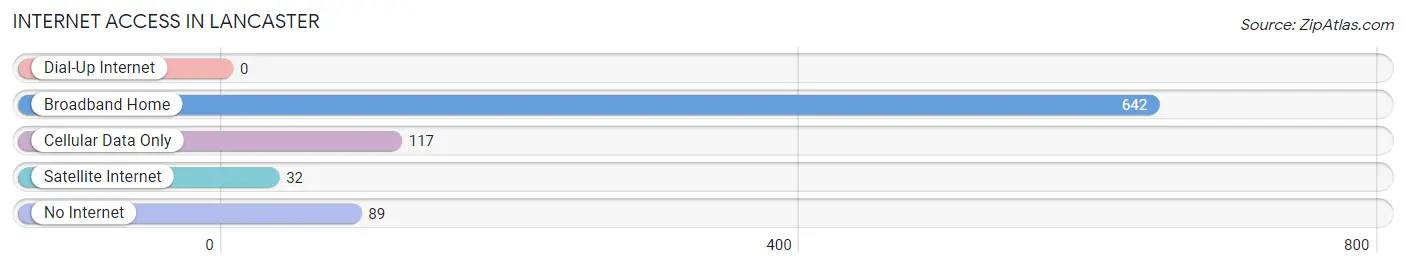
| Internet Type | # Households | % Households |
| Dial-Up Internet | 0 | 0.0% |
| Broadband Home | 642 | 74.7% |
| Cellular Data Only | 117 | 13.6% |
| Satellite Internet | 32 | 3.7% |
| No Internet | 89 | 10.3% |
| Total | 860 | 100.0% |
Lancaster Summary
Lancaster is a town located in Coos County, New Hampshire, United States. The population was 2,387 at the 2010 census. It is the county seat of Coos County.
Geography
Lancaster is located in the northern part of Coos County, in the White Mountains region of New Hampshire. It is bordered to the north by the town of Whitefield, to the east by the town of Dalton, to the south by the town of Jefferson, and to the west by the town of Northumberland.
The town is situated in the Connecticut River Valley, with the Connecticut River forming the western boundary of the town. The town is located in the White Mountain National Forest, and is home to the White Mountain National Forest Visitor Center.
The highest point in Lancaster is the summit of Mount Prospect, at an elevation of 3,890 feet (1,186 m). The town is drained by the Israel River, which flows through the center of town.
History
The area that is now Lancaster was first settled in 1763 by settlers from Massachusetts. The town was incorporated in 1773, and was named after Lancaster, Massachusetts.
In the 19th century, Lancaster was an important center for the lumber industry, and was home to several sawmills and gristmills. The town was also home to several iron works, and was the site of the first iron furnace in the state.
In the late 19th century, Lancaster was a popular tourist destination, and was home to several grand hotels. The town was also home to several large resorts, including the Lancaster House, the Lancaster Inn, and the Lancaster Hotel.
Economy
Today, Lancaster is a rural community, with a population of just over 2,000 people. The town is home to several small businesses, including a few restaurants, a grocery store, and a few retail stores.
The town is also home to several small manufacturing companies, including a paper mill, a woodworking shop, and a metal fabrication shop.
Demographics
As of the 2010 census, there were 2,387 people, 1,039 households, and 645 families residing in the town. The population density was 39.3 people per square mile (15.2/km2). There were 1,179 housing units at an average density of 19.3 per square mile (7.4/km2).
The racial makeup of the town was 97.2% White, 0.3% African American, 0.4% Native American, 0.3% Asian, 0.1% Pacific Islander, 0.2% from other races, and 1.5% from two or more races. Hispanic or Latino of any race were 0.9% of the population.
There were 1,039 households, out of which 25.3% had children under the age of 18 living with them, 48.2% were married couples living together, 10.2% had a female householder with no husband present, and 37.2% were non-families. 32.2% of all households were made up of individuals, and 14.7% had someone living alone who was 65 years of age or older. The average household size was 2.27 and the average family size was 2.86.
In the town, the population was spread out, with 22.2% under the age of 18, 6.2% from 18 to 24, 24.2% from 25 to 44, 28.2% from 45 to 64, and 19.2% who were 65 years of age or older. The median age was 43 years. For every 100 females, there were 92.2 males. For every 100 females age 18 and over, there were 88.3 males.
The median income for a household in the town was $37,917, and the median income for a family was $45,000. Males had a median income of $31,250 versus $25,000 for females. The per capita income for the town was $20,945. About 8.2% of families and 11.2% of the population were below the poverty line, including 15.2% of those under age 18 and 8.2% of those age 65 or over.
Common Questions
What is Per Capita Income in Lancaster?
Per Capita income in Lancaster is $32,082.
What is the Median Family Income in Lancaster?
Median Family Income in Lancaster is $90,870.
What is the Median Household income in Lancaster?
Median Household Income in Lancaster is $67,331.
What is Income or Wage Gap in Lancaster?
Income or Wage Gap in Lancaster is 36.6%.
Women in Lancaster earn 63.4 cents for every dollar earned by a man.
What is Inequality or Gini Index in Lancaster?
Inequality or Gini Index in Lancaster is 0.35.
What is the Total Population of Lancaster?
Total Population of Lancaster is 2,260.
What is the Total Male Population of Lancaster?
Total Male Population of Lancaster is 1,108.
What is the Total Female Population of Lancaster?
Total Female Population of Lancaster is 1,152.
What is the Ratio of Males per 100 Females in Lancaster?
There are 96.18 Males per 100 Females in Lancaster.
What is the Ratio of Females per 100 Males in Lancaster?
There are 103.97 Females per 100 Males in Lancaster.
What is the Median Population Age in Lancaster?
Median Population Age in Lancaster is 41.3 Years.
What is the Average Family Size in Lancaster
Average Family Size in Lancaster is 3.2 People.
What is the Average Household Size in Lancaster
Average Household Size in Lancaster is 2.5 People.
How Large is the Labor Force in Lancaster?
There are 1,134 People in the Labor Forcein in Lancaster.
What is the Percentage of People in the Labor Force in Lancaster?
63.7% of People are in the Labor Force in Lancaster.
What is the Unemployment Rate in Lancaster?
Unemployment Rate in Lancaster is 2.6%.