Pennington, AL Map & Demographics
Pennington Map
Pennington Overview
$21,100
PER CAPITA INCOME
$40,156
AVG FAMILY INCOME
$28,362
AVG HOUSEHOLD INCOME
51.9%
WAGE / INCOME GAP [ % ]
48.1¢/ $1
WAGE / INCOME GAP [ $ ]
0.48
INEQUALITY / GINI INDEX
628
TOTAL POPULATION
249
MALE POPULATION
379
FEMALE POPULATION
65.70
MALES / 100 FEMALES
152.21
FEMALES / 100 MALES
38.8
MEDIAN AGE
3.4
AVG FAMILY SIZE
2.5
AVG HOUSEHOLD SIZE
202
LABOR FORCE [ PEOPLE ]
42.3%
PERCENT IN LABOR FORCE
8.4%
UNEMPLOYMENT RATE
Pennington Zip Codes
Income in Pennington
Income Overview in Pennington
Per Capita Income in Pennington is $21,100, while median incomes of families and households are $40,156 and $28,362 respectively.
| Characteristic | Number | Measure |
| Per Capita Income | 628 | $21,100 |
| Median Family Income | 143 | $40,156 |
| Mean Family Income | 143 | $57,927 |
| Median Household Income | 254 | $28,362 |
| Mean Household Income | 254 | $51,073 |
| Income Deficit | 143 | $0 |
| Wage / Income Gap (%) | 628 | 51.93% |
| Wage / Income Gap ($) | 628 | 48.07¢ per $1 |
| Gini / Inequality Index | 628 | 0.48 |
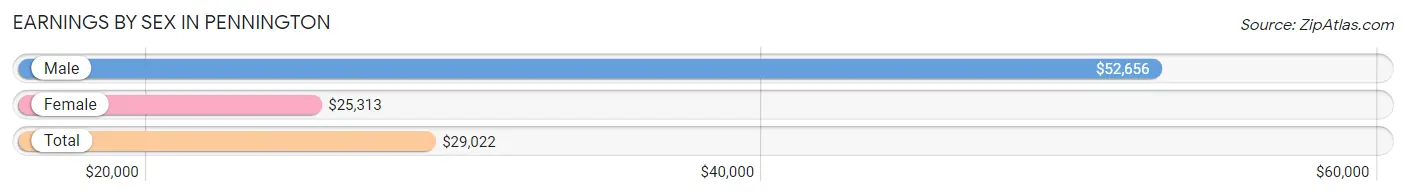
Earnings by Sex in Pennington
Average Earnings in Pennington are $29,022, $52,656 for men and $25,313 for women, a difference of 51.9%.
| Sex | Number | Average Earnings |
| Male | 79 (36.6%) | $52,656 |
| Female | 137 (63.4%) | $25,313 |
| Total | 216 (100.0%) | $29,022 |
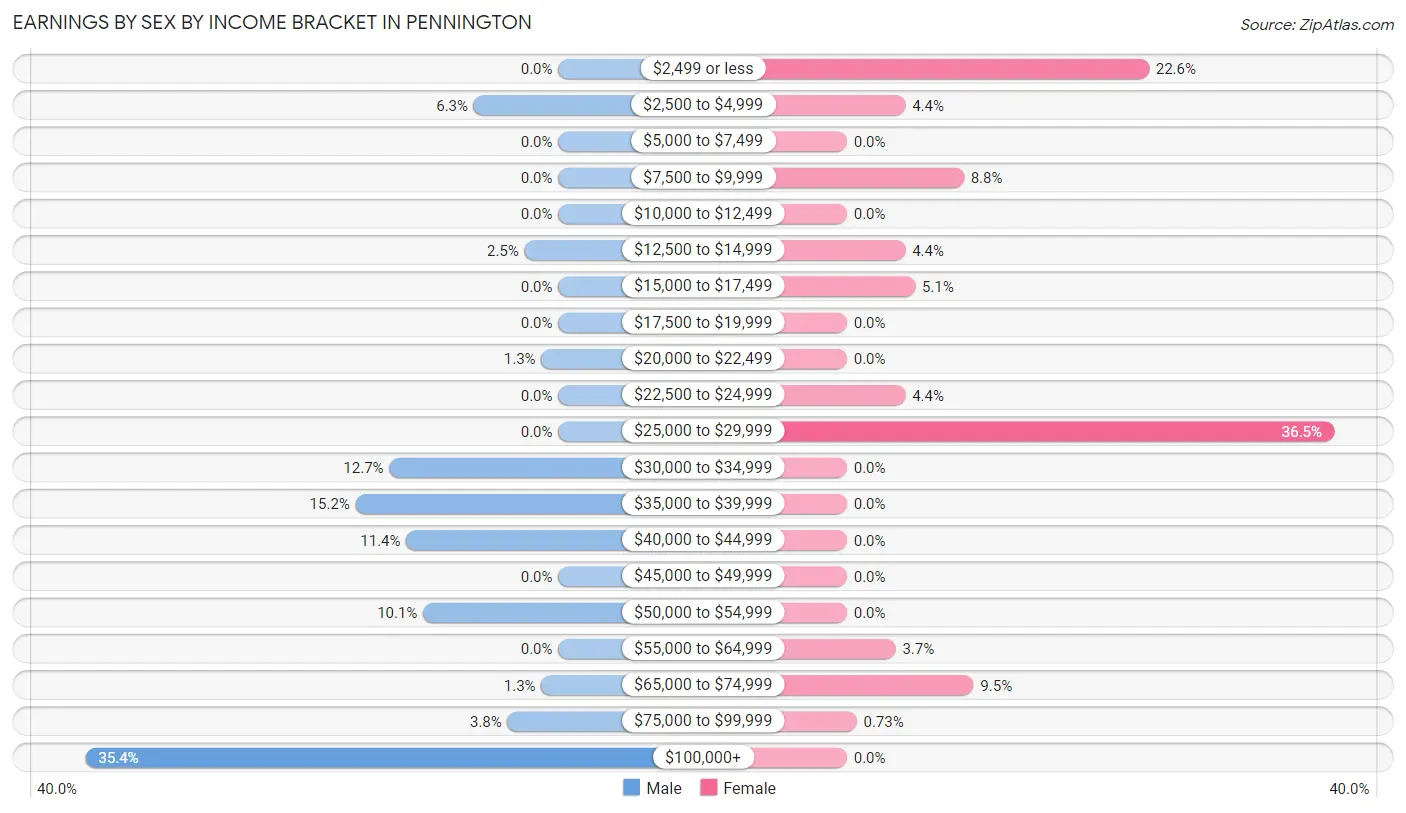
Earnings by Sex by Income Bracket in Pennington
The most common earnings brackets in Pennington are $100,000+ for men (28 | 35.4%) and $25,000 to $29,999 for women (50 | 36.5%).
| Income | Male | Female |
| $2,499 or less | 0 (0.0%) | 31 (22.6%) |
| $2,500 to $4,999 | 5 (6.3%) | 6 (4.4%) |
| $5,000 to $7,499 | 0 (0.0%) | 0 (0.0%) |
| $7,500 to $9,999 | 0 (0.0%) | 12 (8.8%) |
| $10,000 to $12,499 | 0 (0.0%) | 0 (0.0%) |
| $12,500 to $14,999 | 2 (2.5%) | 6 (4.4%) |
| $15,000 to $17,499 | 0 (0.0%) | 7 (5.1%) |
| $17,500 to $19,999 | 0 (0.0%) | 0 (0.0%) |
| $20,000 to $22,499 | 1 (1.3%) | 0 (0.0%) |
| $22,500 to $24,999 | 0 (0.0%) | 6 (4.4%) |
| $25,000 to $29,999 | 0 (0.0%) | 50 (36.5%) |
| $30,000 to $34,999 | 10 (12.7%) | 0 (0.0%) |
| $35,000 to $39,999 | 12 (15.2%) | 0 (0.0%) |
| $40,000 to $44,999 | 9 (11.4%) | 0 (0.0%) |
| $45,000 to $49,999 | 0 (0.0%) | 0 (0.0%) |
| $50,000 to $54,999 | 8 (10.1%) | 0 (0.0%) |
| $55,000 to $64,999 | 0 (0.0%) | 5 (3.6%) |
| $65,000 to $74,999 | 1 (1.3%) | 13 (9.5%) |
| $75,000 to $99,999 | 3 (3.8%) | 1 (0.7%) |
| $100,000+ | 28 (35.4%) | 0 (0.0%) |
| Total | 79 (100.0%) | 137 (100.0%) |
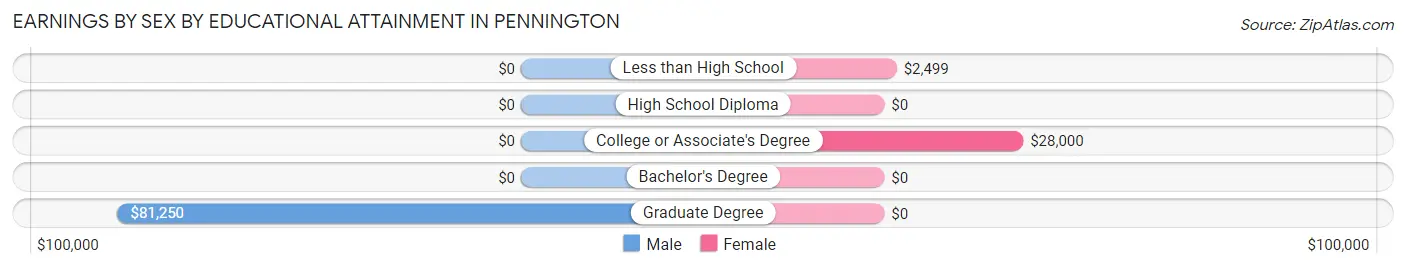
Earnings by Sex by Educational Attainment in Pennington
| Educational Attainment | Male Income | Female Income |
| Less than High School | - | - |
| High School Diploma | - | - |
| College or Associate's Degree | - | - |
| Bachelor's Degree | - | - |
| Graduate Degree | $81,250 | $0 |
| Total | - | - |
Family Income in Pennington
Family Income Brackets in Pennington
According to the Pennington family income data, there are 52 families falling into the $25,000 to $34,999 income range, which is the most common income bracket and makes up 36.4% of all families.
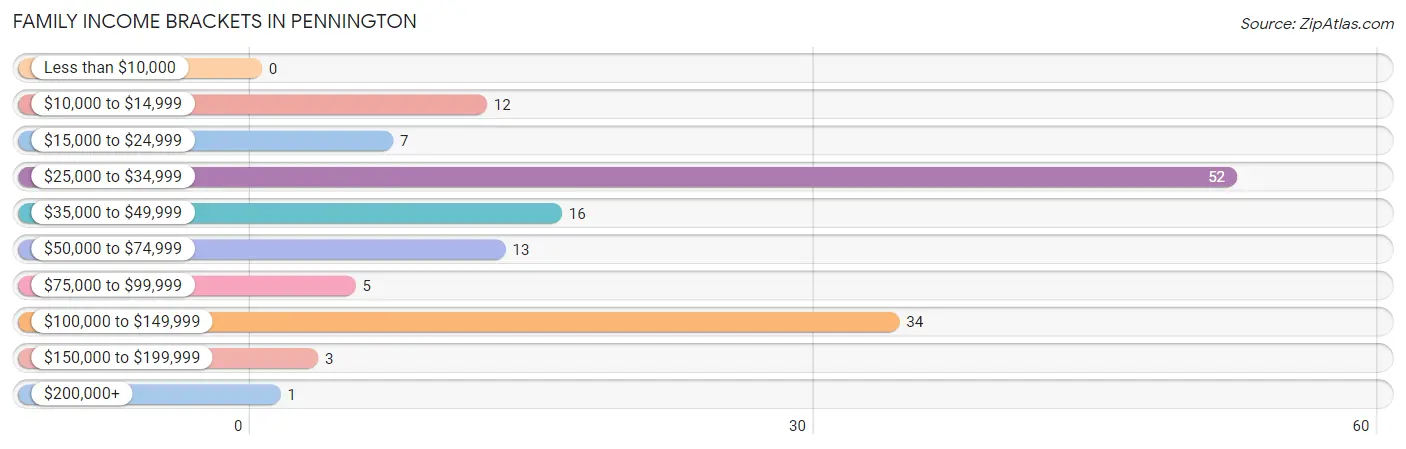
| Income Bracket | # Families | % Families |
| Less than $10,000 | 0 | 0.0% |
| $10,000 to $14,999 | 12 | 8.4% |
| $15,000 to $24,999 | 7 | 4.9% |
| $25,000 to $34,999 | 52 | 36.4% |
| $35,000 to $49,999 | 16 | 11.2% |
| $50,000 to $74,999 | 13 | 9.1% |
| $75,000 to $99,999 | 5 | 3.5% |
| $100,000 to $149,999 | 34 | 23.8% |
| $150,000 to $199,999 | 3 | 2.1% |
| $200,000+ | 1 | 0.7% |
Family Income by Famaliy Size in Pennington
5-person families (30 | 21.0%) account for the highest median family income in Pennington with $113,375 per family, while 3-person families (15 | 10.5%) have the highest median income of $36,215 per family member.
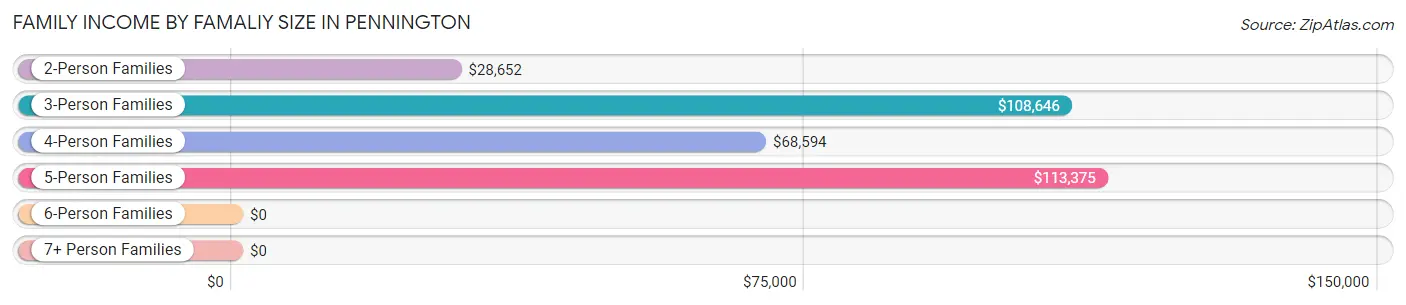
| Income Bracket | # Families | Median Income |
| 2-Person Families | 83 (58.0%) | $28,652 |
| 3-Person Families | 15 (10.5%) | $108,646 |
| 4-Person Families | 15 (10.5%) | $68,594 |
| 5-Person Families | 30 (21.0%) | $113,375 |
| 6-Person Families | 0 (0.0%) | $0 |
| 7+ Person Families | 0 (0.0%) | $0 |
| Total | 143 (100.0%) | $40,156 |
Family Income by Number of Earners in Pennington
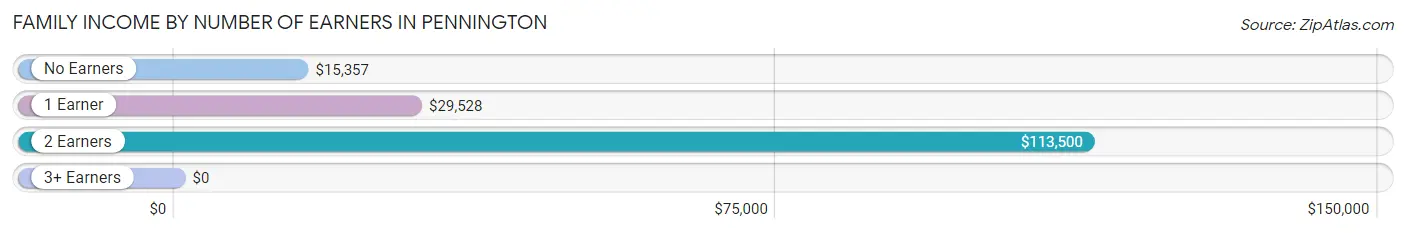
| Number of Earners | # Families | Median Income |
| No Earners | 26 (18.2%) | $15,357 |
| 1 Earner | 73 (51.0%) | $29,528 |
| 2 Earners | 32 (22.4%) | $113,500 |
| 3+ Earners | 12 (8.4%) | $0 |
| Total | 143 (100.0%) | $40,156 |
Household Income in Pennington
Household Income Brackets in Pennington
With 76 households falling in the category, the $15,000 to $24,999 income range is the most frequent in Pennington, accounting for 29.9% of all households. In contrast, only 3 households (1.2%) fall into the $150,000 to $199,999 income bracket, making it the least populous group.
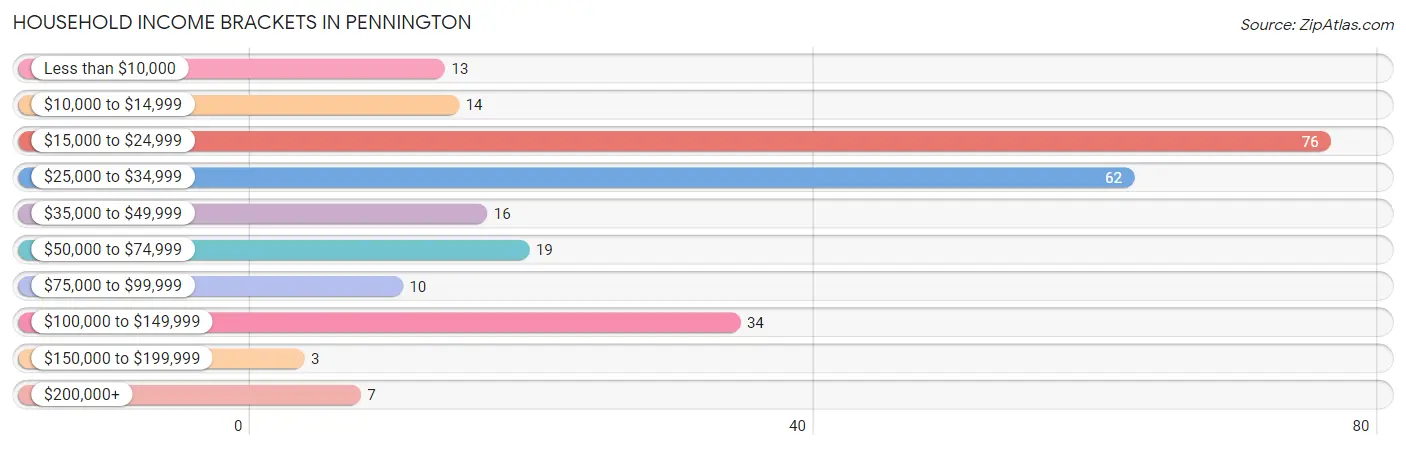
| Income Bracket | # Households | % Households |
| Less than $10,000 | 13 | 5.1% |
| $10,000 to $14,999 | 14 | 5.5% |
| $15,000 to $24,999 | 76 | 29.9% |
| $25,000 to $34,999 | 62 | 24.4% |
| $35,000 to $49,999 | 16 | 6.3% |
| $50,000 to $74,999 | 19 | 7.5% |
| $75,000 to $99,999 | 10 | 3.9% |
| $100,000 to $149,999 | 34 | 13.4% |
| $150,000 to $199,999 | 3 | 1.2% |
| $200,000+ | 7 | 2.8% |
Household Income by Householder Age in Pennington
The median household income in Pennington is $28,362, with the highest median household income of $23,950 found in the 45 to 64 years age bracket for the primary householder. A total of 132 households (52.0%) fall into this category.
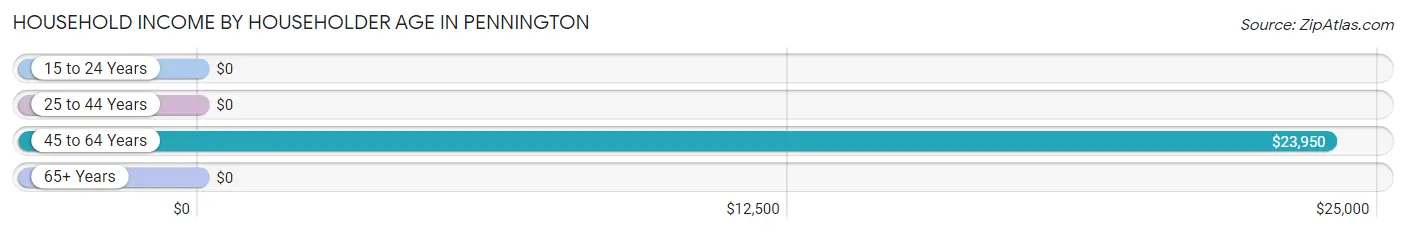
| Income Bracket | # Households | Median Income |
| 15 to 24 Years | 0 (0.0%) | $0 |
| 25 to 44 Years | 80 (31.5%) | $0 |
| 45 to 64 Years | 132 (52.0%) | $23,950 |
| 65+ Years | 42 (16.5%) | $0 |
| Total | 254 (100.0%) | $28,362 |
Poverty in Pennington
Income Below Poverty by Sex and Age in Pennington
With 11.2% poverty level for males and 14.2% for females among the residents of Pennington, 75 year old and over males and 45 to 54 year old females are the most vulnerable to poverty, with 12 males (38.7%) and 15 females (57.7%) in their respective age groups living below the poverty level.
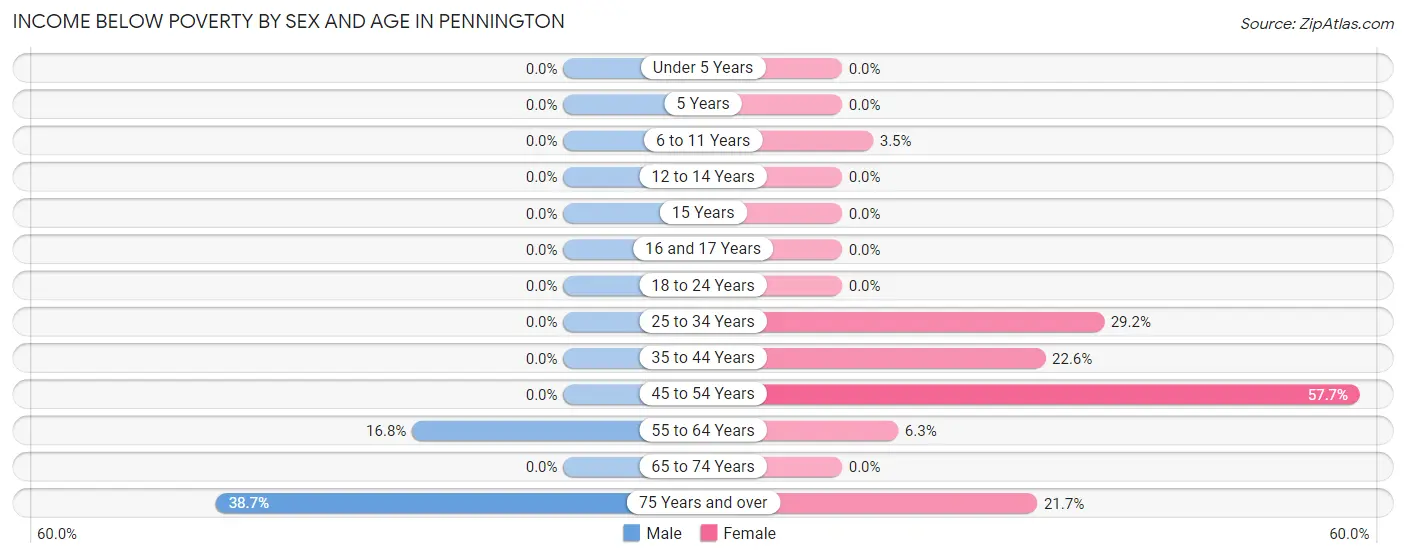
| Age Bracket | Male | Female |
| Under 5 Years | 0 (0.0%) | 0 (0.0%) |
| 5 Years | 0 (0.0%) | 0 (0.0%) |
| 6 to 11 Years | 0 (0.0%) | 2 (3.5%) |
| 12 to 14 Years | 0 (0.0%) | 0 (0.0%) |
| 15 Years | 0 (0.0%) | 0 (0.0%) |
| 16 and 17 Years | 0 (0.0%) | 0 (0.0%) |
| 18 to 24 Years | 0 (0.0%) | 0 (0.0%) |
| 25 to 34 Years | 0 (0.0%) | 7 (29.2%) |
| 35 to 44 Years | 0 (0.0%) | 24 (22.6%) |
| 45 to 54 Years | 0 (0.0%) | 15 (57.7%) |
| 55 to 64 Years | 16 (16.8%) | 1 (6.2%) |
| 65 to 74 Years | 0 (0.0%) | 0 (0.0%) |
| 75 Years and over | 12 (38.7%) | 5 (21.7%) |
| Total | 28 (11.2%) | 54 (14.2%) |
Income Above Poverty by Sex and Age in Pennington
According to the poverty statistics in Pennington, males aged 16 and 17 years and females aged under 5 years are the age groups that are most secure financially, with 100.0% of males and 100.0% of females in these age groups living above the poverty line.
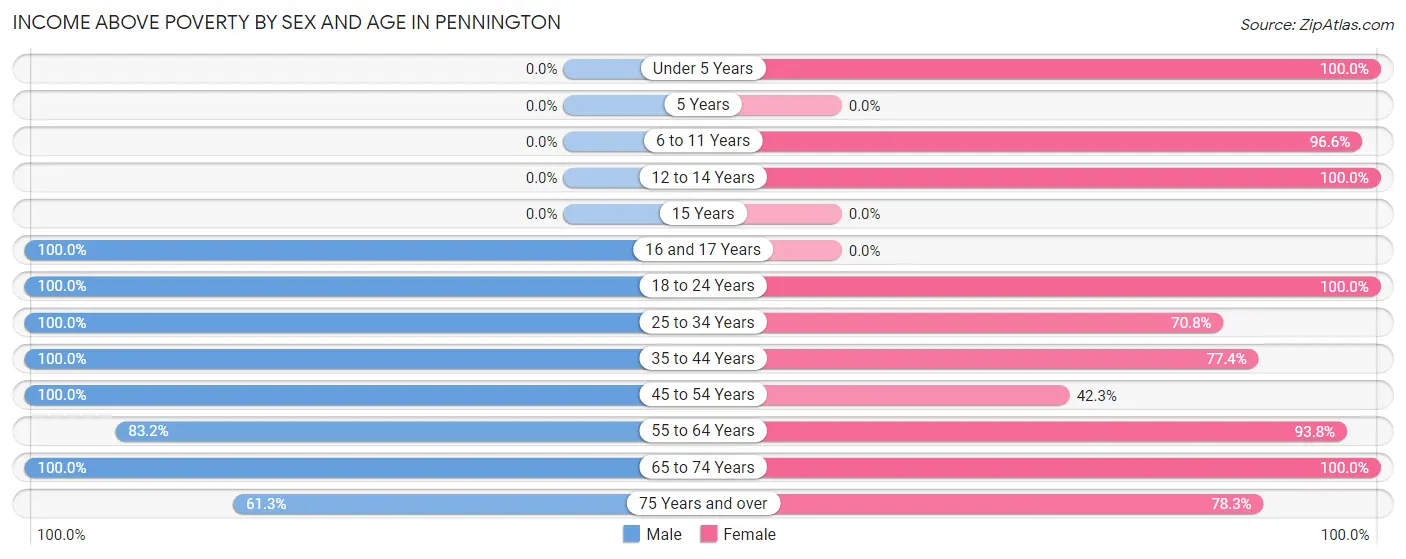
| Age Bracket | Male | Female |
| Under 5 Years | 0 (0.0%) | 91 (100.0%) |
| 5 Years | 0 (0.0%) | 0 (0.0%) |
| 6 to 11 Years | 0 (0.0%) | 56 (96.6%) |
| 12 to 14 Years | 0 (0.0%) | 2 (100.0%) |
| 15 Years | 0 (0.0%) | 0 (0.0%) |
| 16 and 17 Years | 48 (100.0%) | 0 (0.0%) |
| 18 to 24 Years | 11 (100.0%) | 12 (100.0%) |
| 25 to 34 Years | 4 (100.0%) | 17 (70.8%) |
| 35 to 44 Years | 37 (100.0%) | 82 (77.4%) |
| 45 to 54 Years | 21 (100.0%) | 11 (42.3%) |
| 55 to 64 Years | 79 (83.2%) | 15 (93.8%) |
| 65 to 74 Years | 2 (100.0%) | 21 (100.0%) |
| 75 Years and over | 19 (61.3%) | 18 (78.3%) |
| Total | 221 (88.8%) | 325 (85.8%) |
Income Below Poverty Among Married-Couple Families in Pennington
The poverty statistics for married-couple families in Pennington show that 15.6% or 12 of the total 77 families live below the poverty line. Families with no children have the highest poverty rate of 30.0%, comprising of 12 families. On the other hand, families with 1 or 2 children have the lowest poverty rate of 0.0%, which includes 0 families.
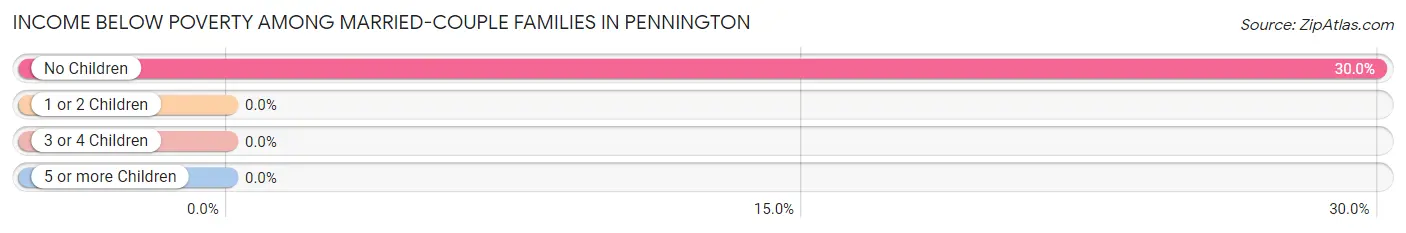
| Children | Above Poverty | Below Poverty |
| No Children | 28 (70.0%) | 12 (30.0%) |
| 1 or 2 Children | 17 (100.0%) | 0 (0.0%) |
| 3 or 4 Children | 20 (100.0%) | 0 (0.0%) |
| 5 or more Children | 0 (0.0%) | 0 (0.0%) |
| Total | 65 (84.4%) | 12 (15.6%) |
Income Below Poverty Among Single-Parent Households in Pennington
According to the poverty data in Pennington, 46.2% or 6 single-father households and 1.9% or 1 single-mother households are living below the poverty line. Among single-father households, those with no children have the highest poverty rate, with 6 households (85.7%) experiencing poverty. Likewise, among single-mother households, those with 1 or 2 children have the highest poverty rate, with 1 households (2.2%) falling below the poverty line.
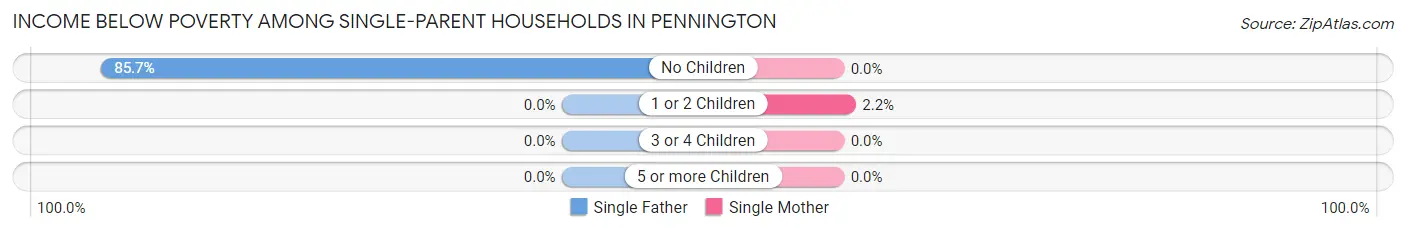
| Children | Single Father | Single Mother |
| No Children | 6 (85.7%) | 0 (0.0%) |
| 1 or 2 Children | 0 (0.0%) | 1 (2.2%) |
| 3 or 4 Children | 0 (0.0%) | 0 (0.0%) |
| 5 or more Children | 0 (0.0%) | 0 (0.0%) |
| Total | 6 (46.2%) | 1 (1.9%) |
Income Below Poverty Among Married-Couple vs Single-Parent Households in Pennington
The poverty data for Pennington shows that 12 of the married-couple family households (15.6%) and 7 of the single-parent households (10.6%) are living below the poverty level. Within the married-couple family households, those with no children have the highest poverty rate, with 12 households (30.0%) falling below the poverty line. Among the single-parent households, those with no children have the highest poverty rate, with 6 household (42.9%) living below poverty.
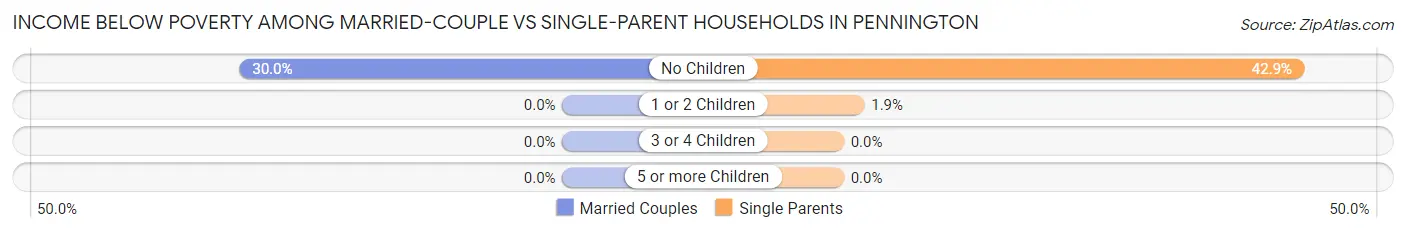
| Children | Married-Couple Families | Single-Parent Households |
| No Children | 12 (30.0%) | 6 (42.9%) |
| 1 or 2 Children | 0 (0.0%) | 1 (1.9%) |
| 3 or 4 Children | 0 (0.0%) | 0 (0.0%) |
| 5 or more Children | 0 (0.0%) | 0 (0.0%) |
| Total | 12 (15.6%) | 7 (10.6%) |
Race in Pennington
The most populous races in Pennington are Black / African American (382 | 60.8%), and White / Caucasian (246 | 39.2%).
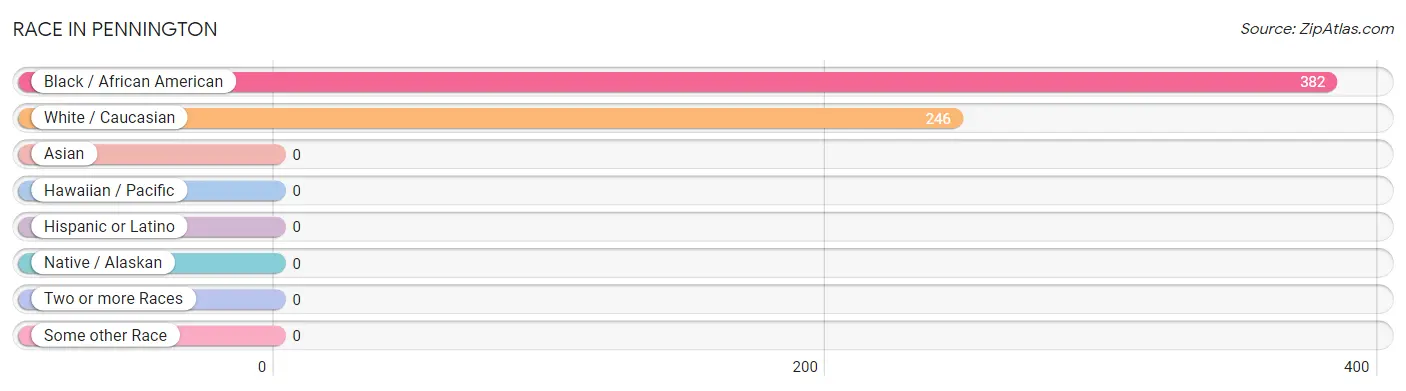
| Race | # Population | % Population |
| Asian | 0 | 0.0% |
| Black / African American | 382 | 60.8% |
| Hawaiian / Pacific | 0 | 0.0% |
| Hispanic or Latino | 0 | 0.0% |
| Native / Alaskan | 0 | 0.0% |
| White / Caucasian | 246 | 39.2% |
| Two or more Races | 0 | 0.0% |
| Some other Race | 0 | 0.0% |
| Total | 628 | 100.0% |
Ancestry in Pennington
The most populous ancestries reported in Pennington are German (108 | 17.2%), American (98 | 15.6%), Scottish (84 | 13.4%), Irish (58 | 9.2%), and Italian (32 | 5.1%), together accounting for 60.5% of all Pennington residents.
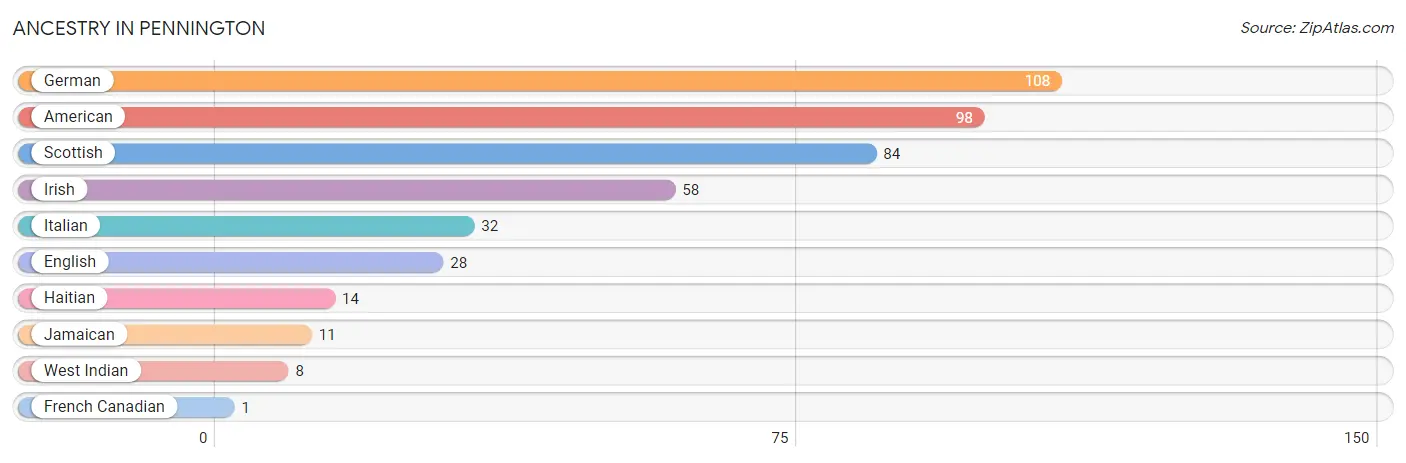
| Ancestry | # Population | % Population |
| American | 98 | 15.6% |
| English | 28 | 4.5% |
| French Canadian | 1 | 0.2% |
| German | 108 | 17.2% |
| Haitian | 14 | 2.2% |
| Irish | 58 | 9.2% |
| Italian | 32 | 5.1% |
| Jamaican | 11 | 1.8% |
| Scottish | 84 | 13.4% |
| West Indian | 8 | 1.3% | View All 10 Rows |
Immigrants in Pennington

| Immigration Origin | # Population | % Population | View All 0 Rows |
Sex and Age in Pennington
Sex and Age in Pennington
The most populous age groups in Pennington are 60 to 64 Years (64 | 25.7%) for men and Under 5 Years (91 | 24.0%) for women.
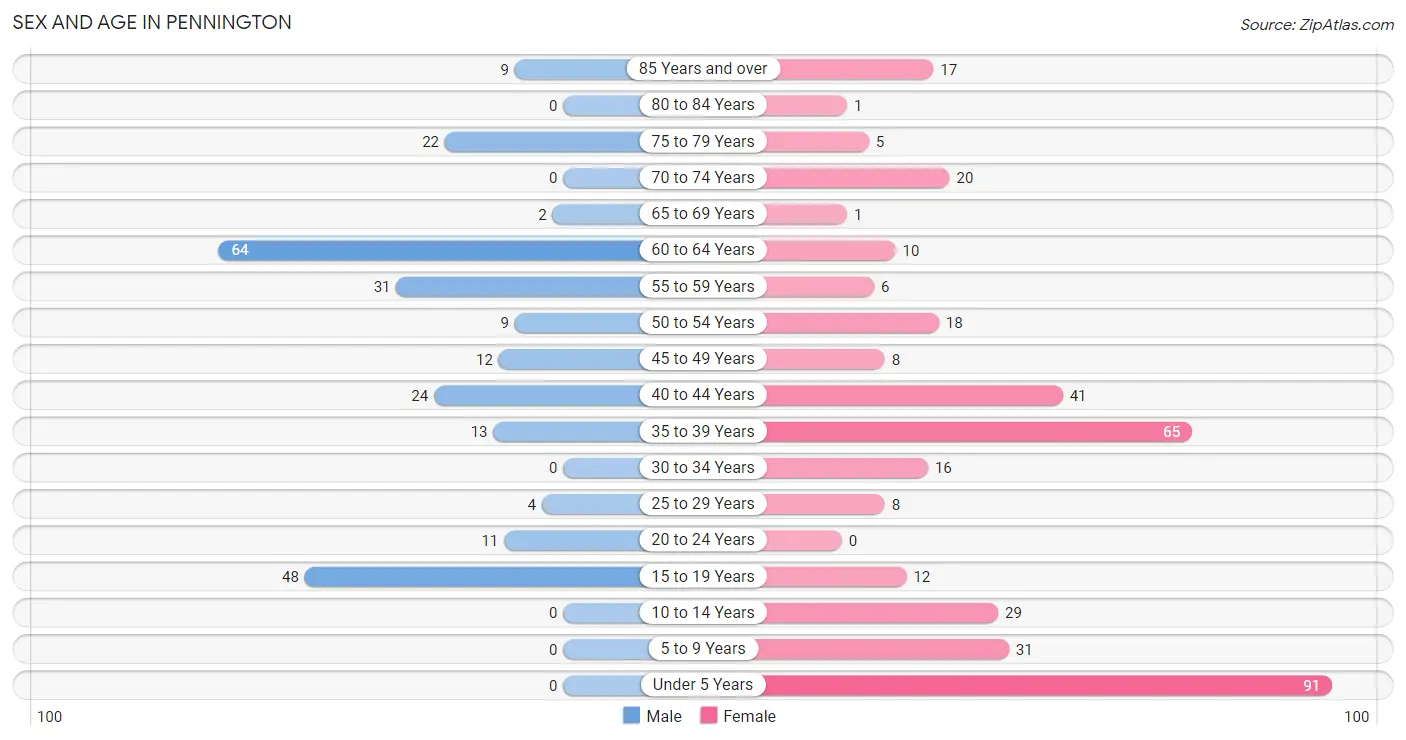
| Age Bracket | Male | Female |
| Under 5 Years | 0 (0.0%) | 91 (24.0%) |
| 5 to 9 Years | 0 (0.0%) | 31 (8.2%) |
| 10 to 14 Years | 0 (0.0%) | 29 (7.6%) |
| 15 to 19 Years | 48 (19.3%) | 12 (3.2%) |
| 20 to 24 Years | 11 (4.4%) | 0 (0.0%) |
| 25 to 29 Years | 4 (1.6%) | 8 (2.1%) |
| 30 to 34 Years | 0 (0.0%) | 16 (4.2%) |
| 35 to 39 Years | 13 (5.2%) | 65 (17.2%) |
| 40 to 44 Years | 24 (9.6%) | 41 (10.8%) |
| 45 to 49 Years | 12 (4.8%) | 8 (2.1%) |
| 50 to 54 Years | 9 (3.6%) | 18 (4.8%) |
| 55 to 59 Years | 31 (12.4%) | 6 (1.6%) |
| 60 to 64 Years | 64 (25.7%) | 10 (2.6%) |
| 65 to 69 Years | 2 (0.8%) | 1 (0.3%) |
| 70 to 74 Years | 0 (0.0%) | 20 (5.3%) |
| 75 to 79 Years | 22 (8.8%) | 5 (1.3%) |
| 80 to 84 Years | 0 (0.0%) | 1 (0.3%) |
| 85 Years and over | 9 (3.6%) | 17 (4.5%) |
| Total | 249 (100.0%) | 379 (100.0%) |
Families and Households in Pennington
Median Family Size in Pennington
The median family size in Pennington is 3.44 persons per family, with married-couple families (77 | 53.8%) accounting for the largest median family size of 3.74 persons per family. On the other hand, single female/mother families (53 | 37.1%) represent the smallest median family size with 2.94 persons per family.
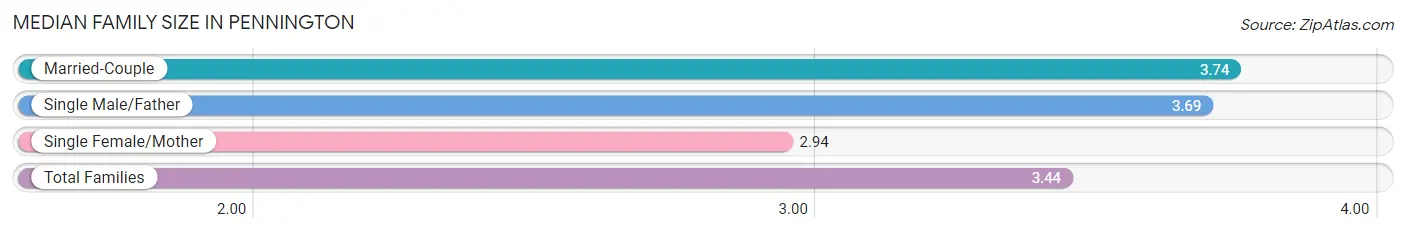
| Family Type | # Families | Family Size |
| Married-Couple | 77 (53.8%) | 3.74 |
| Single Male/Father | 13 (9.1%) | 3.69 |
| Single Female/Mother | 53 (37.1%) | 2.94 |
| Total Families | 143 (100.0%) | 3.44 |
Median Household Size in Pennington
The median household size in Pennington is 2.47 persons per household, with single male/father households (13 | 5.1%) accounting for the largest median household size of 4.62 persons per household. non-family households (111 | 43.7%) represent the smallest median household size with 1.11 persons per household.
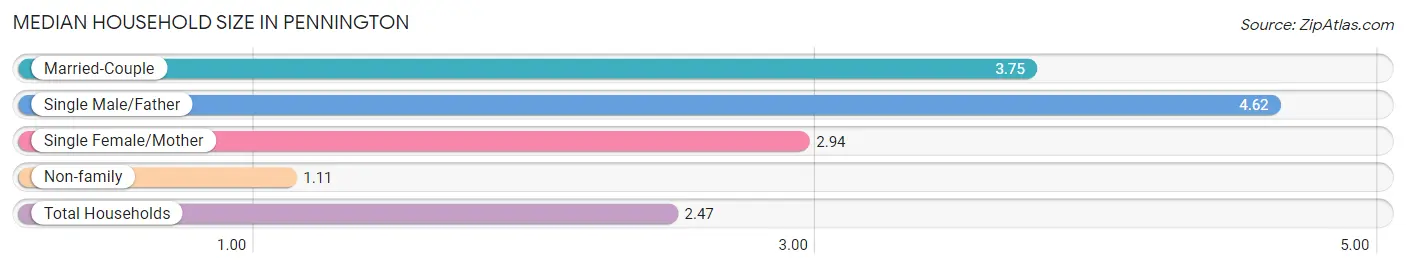
| Household Type | # Households | Household Size |
| Married-Couple | 77 (30.3%) | 3.75 |
| Single Male/Father | 13 (5.1%) | 4.62 |
| Single Female/Mother | 53 (20.9%) | 2.94 |
| Non-family | 111 (43.7%) | 1.11 |
| Total Households | 254 (100.0%) | 2.47 |
Household Size by Marriage Status in Pennington
Out of a total of 254 households in Pennington, 143 (56.3%) are family households, while 111 (43.7%) are nonfamily households. The most numerous type of family households are 2-person households, comprising 76, and the most common type of nonfamily households are 1-person households, comprising 106.
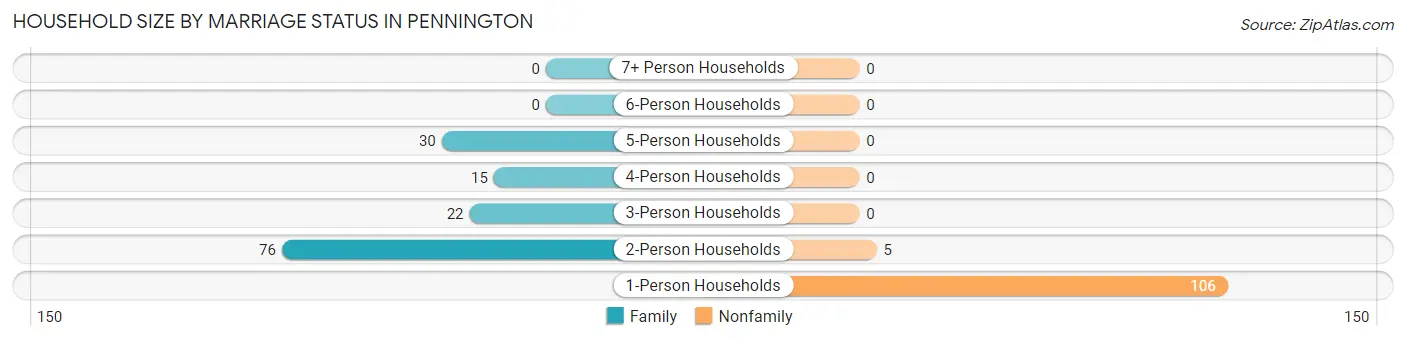
| Household Size | Family Households | Nonfamily Households |
| 1-Person Households | - | 106 (41.7%) |
| 2-Person Households | 76 (29.9%) | 5 (2.0%) |
| 3-Person Households | 22 (8.7%) | 0 (0.0%) |
| 4-Person Households | 15 (5.9%) | 0 (0.0%) |
| 5-Person Households | 30 (11.8%) | 0 (0.0%) |
| 6-Person Households | 0 (0.0%) | 0 (0.0%) |
| 7+ Person Households | 0 (0.0%) | 0 (0.0%) |
| Total | 143 (56.3%) | 111 (43.7%) |
Female Fertility in Pennington
Fertility by Age in Pennington
| Age Bracket | Women with Births | Births / 1,000 Women |
| 15 to 19 years | 0 (0.0%) | 0.0 |
| 20 to 34 years | 0 (0.0%) | 0.0 |
| 35 to 50 years | 0 (0.0%) | 0.0 |
| Total | 0 (0.0%) | 0.0 |
Fertility by Age by Marriage Status in Pennington
| Age Bracket | Married | Unmarried |
| 15 to 19 years | 0 (0.0%) | 0 (0.0%) |
| 20 to 34 years | 0 (0.0%) | 0 (0.0%) |
| 35 to 50 years | 0 (0.0%) | 0 (0.0%) |
| Total | 0 (0.0%) | 0 (0.0%) |
Fertility by Education in Pennington
| Educational Attainment | Women with Births | Births / 1,000 Women |
| Less than High School | 0 (0.0%) | 0.0 |
| High School Diploma | 0 (0.0%) | 0.0 |
| College or Associate's Degree | 0 (0.0%) | 0.0 |
| Bachelor's Degree | 0 (0.0%) | 0.0 |
| Graduate Degree | 0 (0.0%) | 0.0 |
| Total | 0 (0.0%) | 0.0 |
Fertility by Education by Marriage Status in Pennington
| Educational Attainment | Married | Unmarried |
| Less than High School | 0 (0.0%) | 0 (0.0%) |
| High School Diploma | 0 (0.0%) | 0 (0.0%) |
| College or Associate's Degree | 0 (0.0%) | 0 (0.0%) |
| Bachelor's Degree | 0 (0.0%) | 0 (0.0%) |
| Graduate Degree | 0 (0.0%) | 0 (0.0%) |
| Total | 0 (0.0%) | 0 (0.0%) |
Employment Characteristics in Pennington
Employment by Class of Employer in Pennington
Among the 185 employed individuals in Pennington, private company employees (91 | 49.2%), state government employees (55 | 29.7%), and local government employees (22 | 11.9%) make up the most common classes of employment.
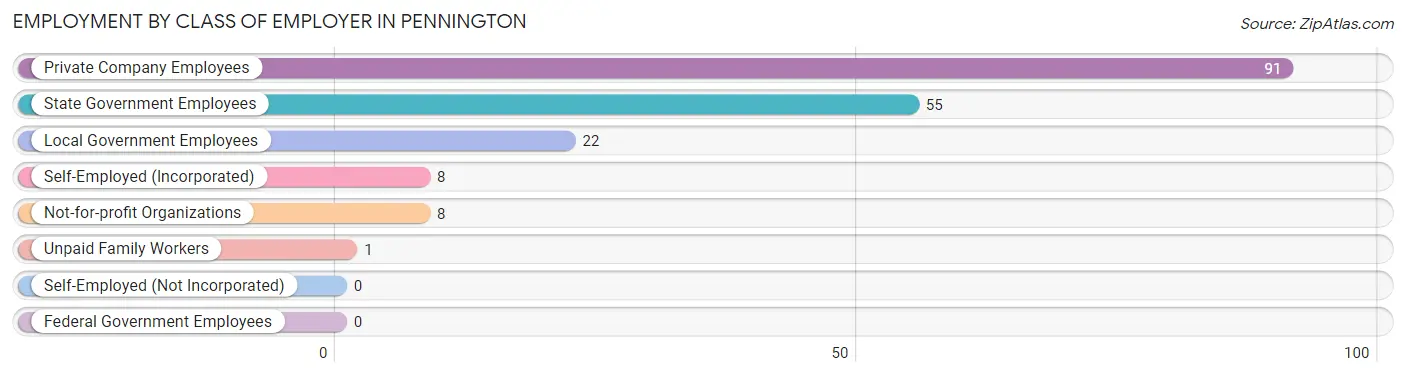
| Employer Class | # Employees | % Employees |
| Private Company Employees | 91 | 49.2% |
| Self-Employed (Incorporated) | 8 | 4.3% |
| Self-Employed (Not Incorporated) | 0 | 0.0% |
| Not-for-profit Organizations | 8 | 4.3% |
| Local Government Employees | 22 | 11.9% |
| State Government Employees | 55 | 29.7% |
| Federal Government Employees | 0 | 0.0% |
| Unpaid Family Workers | 1 | 0.5% |
| Total | 185 | 100.0% |
Employment Status by Age in Pennington
According to the labor force statistics for Pennington, out of the total population over 16 years of age (477), 42.3% or 202 individuals are in the labor force, with 8.4% or 17 of them unemployed. The age group with the highest labor force participation rate is 20 to 24 years, with 100.0% or 11 individuals in the labor force. Within the labor force, the 25 to 29 years age range has the highest percentage of unemployed individuals, with 88.9% or 8 of them being unemployed.
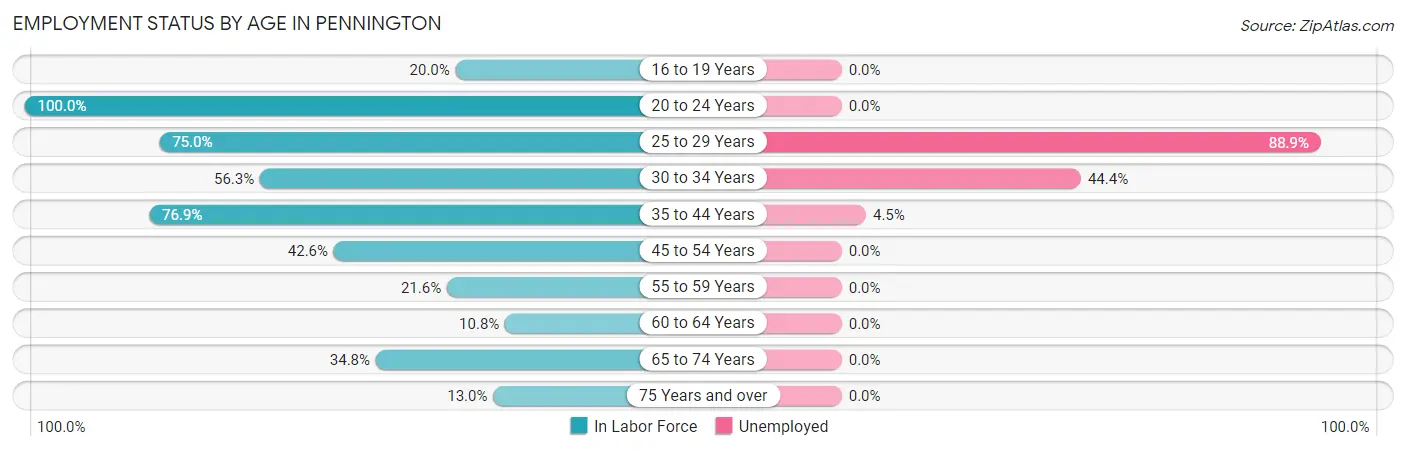
| Age Bracket | In Labor Force | Unemployed |
| 16 to 19 Years | 12 (20.0%) | 0 (0.0%) |
| 20 to 24 Years | 11 (100.0%) | 0 (0.0%) |
| 25 to 29 Years | 9 (75.0%) | 8 (88.9%) |
| 30 to 34 Years | 9 (56.3%) | 4 (44.4%) |
| 35 to 44 Years | 110 (76.9%) | 5 (4.5%) |
| 45 to 54 Years | 20 (42.6%) | 0 (0.0%) |
| 55 to 59 Years | 8 (21.6%) | 0 (0.0%) |
| 60 to 64 Years | 8 (10.8%) | 0 (0.0%) |
| 65 to 74 Years | 8 (34.8%) | 0 (0.0%) |
| 75 Years and over | 7 (13.0%) | 0 (0.0%) |
| Total | 202 (42.3%) | 17 (8.4%) |
Employment Status by Educational Attainment in Pennington
According to labor force statistics for Pennington, 49.8% of individuals (164) out of the total population between 25 and 64 years of age (329) are in the labor force, with 10.4% or 17 of them being unemployed. The group with the highest labor force participation rate are those with the educational attainment of bachelor's degree or higher, with 76.5% or 13 individuals in the labor force. Within the labor force, individuals with high school diploma education have the highest percentage of unemployment, with 18.8% or 13 of them being unemployed.
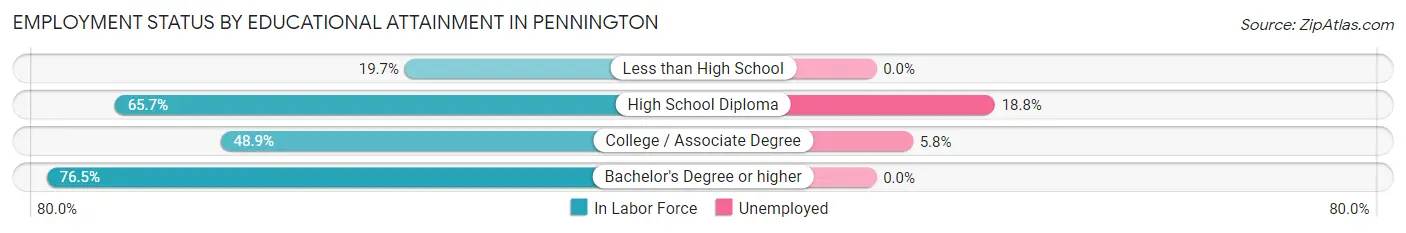
| Educational Attainment | In Labor Force | Unemployed |
| Less than High School | 13 (19.7%) | 0 (0.0%) |
| High School Diploma | 69 (65.7%) | 20 (18.8%) |
| College / Associate Degree | 69 (48.9%) | 8 (5.8%) |
| Bachelor's Degree or higher | 13 (76.5%) | 0 (0.0%) |
| Total | 164 (49.8%) | 34 (10.4%) |
Employment Occupations by Sex in Pennington
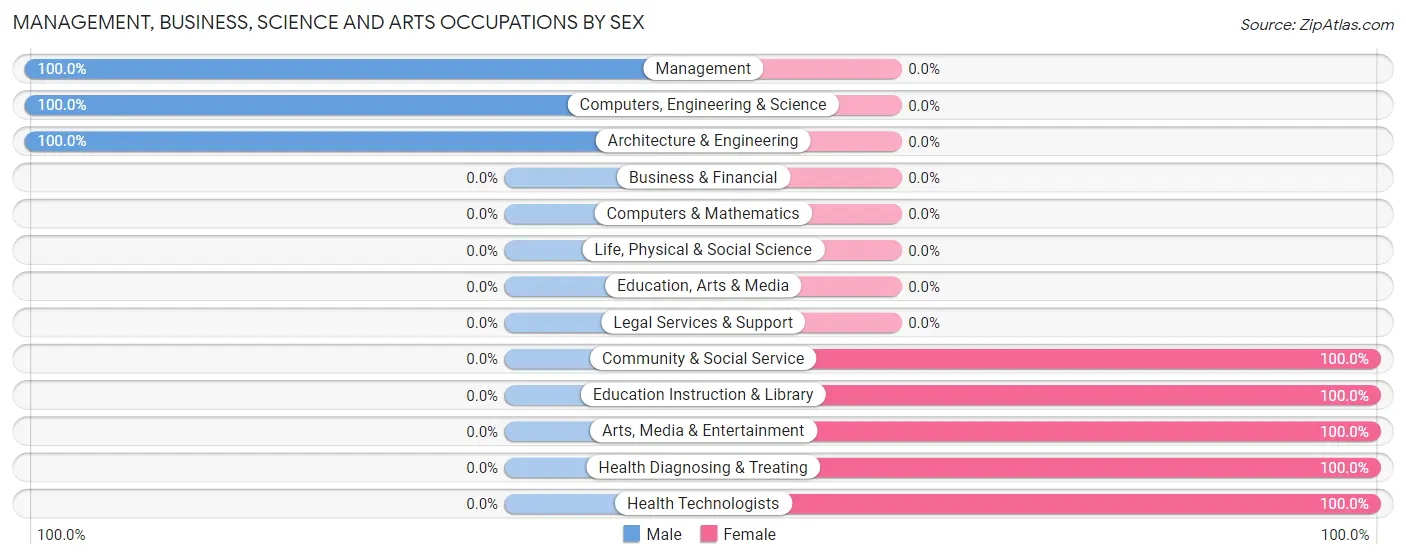
Management, Business, Science and Arts Occupations
The most common Management, Business, Science and Arts occupations in Pennington are Management (9 | 4.9%), Community & Social Service (8 | 4.3%), Arts, Media & Entertainment (5 | 2.7%), Education Instruction & Library (3 | 1.6%), and Health Diagnosing & Treating (3 | 1.6%).
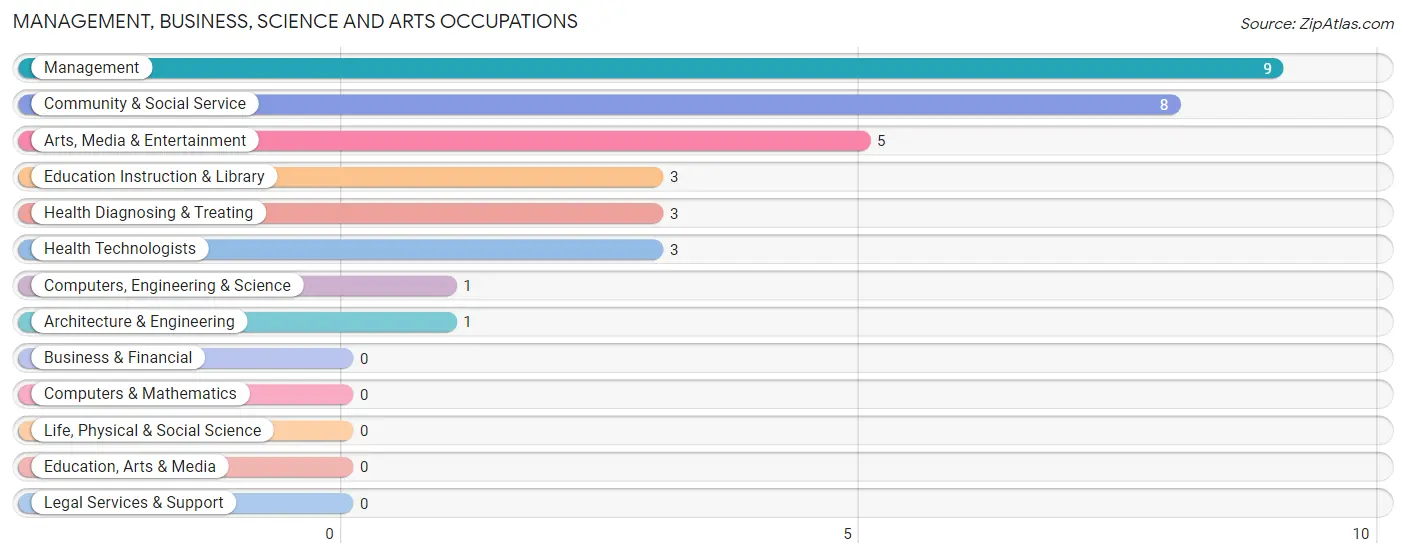
Management, Business, Science and Arts Occupations by Sex
Within the Management, Business, Science and Arts occupations in Pennington, the most male-oriented occupations are Management (100.0%), Computers, Engineering & Science (100.0%), and Architecture & Engineering (100.0%), while the most female-oriented occupations are Community & Social Service (100.0%), Education Instruction & Library (100.0%), and Arts, Media & Entertainment (100.0%).
| Occupation | Male | Female |
| Management | 9 (100.0%) | 0 (0.0%) |
| Business & Financial | 0 (0.0%) | 0 (0.0%) |
| Computers, Engineering & Science | 1 (100.0%) | 0 (0.0%) |
| Computers & Mathematics | 0 (0.0%) | 0 (0.0%) |
| Architecture & Engineering | 1 (100.0%) | 0 (0.0%) |
| Life, Physical & Social Science | 0 (0.0%) | 0 (0.0%) |
| Community & Social Service | 0 (0.0%) | 8 (100.0%) |
| Education, Arts & Media | 0 (0.0%) | 0 (0.0%) |
| Legal Services & Support | 0 (0.0%) | 0 (0.0%) |
| Education Instruction & Library | 0 (0.0%) | 3 (100.0%) |
| Arts, Media & Entertainment | 0 (0.0%) | 5 (100.0%) |
| Health Diagnosing & Treating | 0 (0.0%) | 3 (100.0%) |
| Health Technologists | 0 (0.0%) | 3 (100.0%) |
| Total (Category) | 10 (47.6%) | 11 (52.4%) |
| Total (Overall) | 73 (39.5%) | 112 (60.5%) |
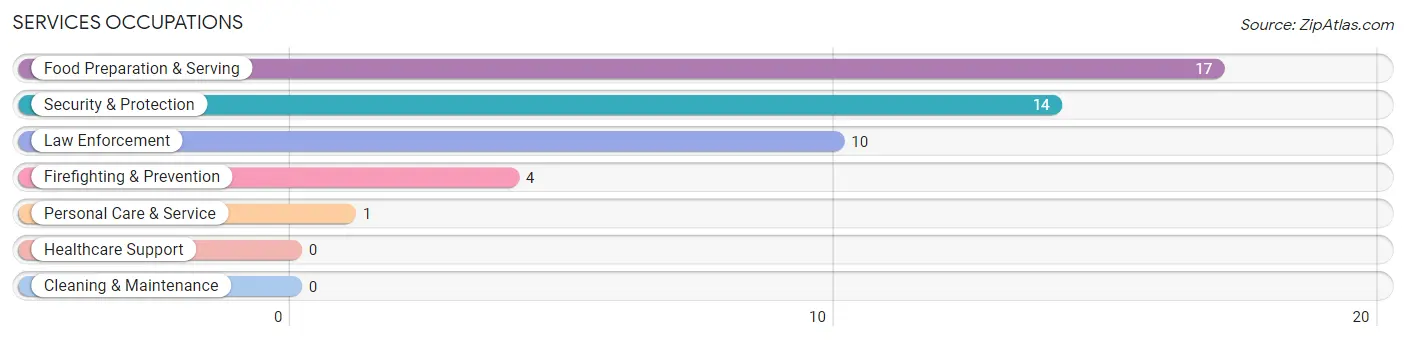
Services Occupations
The most common Services occupations in Pennington are Food Preparation & Serving (17 | 9.2%), Security & Protection (14 | 7.6%), Law Enforcement (10 | 5.4%), Firefighting & Prevention (4 | 2.2%), and Personal Care & Service (1 | 0.5%).
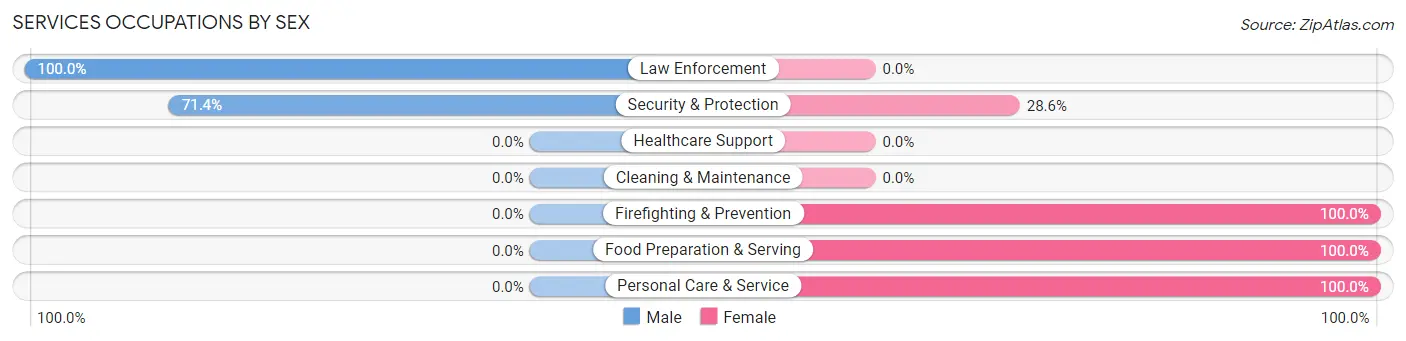
Services Occupations by Sex
Within the Services occupations in Pennington, the most male-oriented occupations are Law Enforcement (100.0%), and Security & Protection (71.4%), while the most female-oriented occupations are Firefighting & Prevention (100.0%), Food Preparation & Serving (100.0%), and Personal Care & Service (100.0%).
| Occupation | Male | Female |
| Healthcare Support | 0 (0.0%) | 0 (0.0%) |
| Security & Protection | 10 (71.4%) | 4 (28.6%) |
| Firefighting & Prevention | 0 (0.0%) | 4 (100.0%) |
| Law Enforcement | 10 (100.0%) | 0 (0.0%) |
| Food Preparation & Serving | 0 (0.0%) | 17 (100.0%) |
| Cleaning & Maintenance | 0 (0.0%) | 0 (0.0%) |
| Personal Care & Service | 0 (0.0%) | 1 (100.0%) |
| Total (Category) | 10 (31.2%) | 22 (68.8%) |
| Total (Overall) | 73 (39.5%) | 112 (60.5%) |
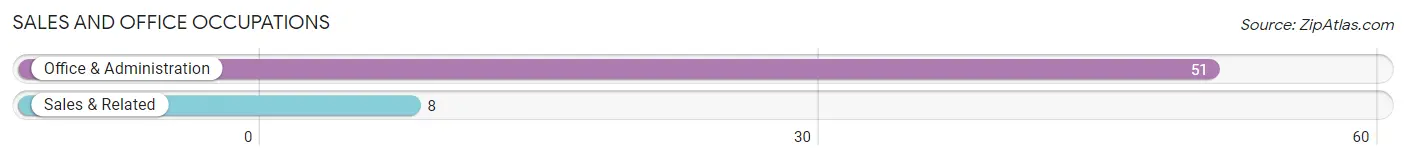
Sales and Office Occupations
The most common Sales and Office occupations in Pennington are Office & Administration (51 | 27.6%), and Sales & Related (8 | 4.3%).
Sales and Office Occupations by Sex
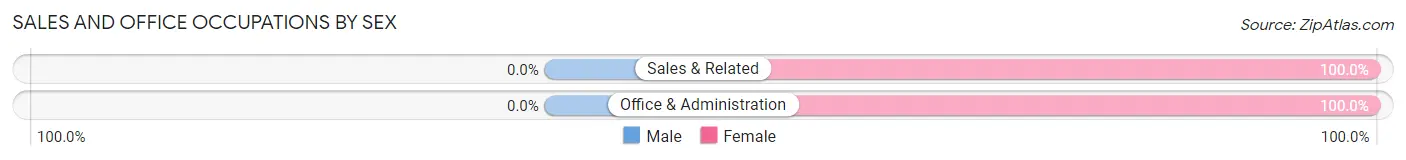
| Occupation | Male | Female |
| Sales & Related | 0 (0.0%) | 8 (100.0%) |
| Office & Administration | 0 (0.0%) | 51 (100.0%) |
| Total (Category) | 0 (0.0%) | 59 (100.0%) |
| Total (Overall) | 73 (39.5%) | 112 (60.5%) |
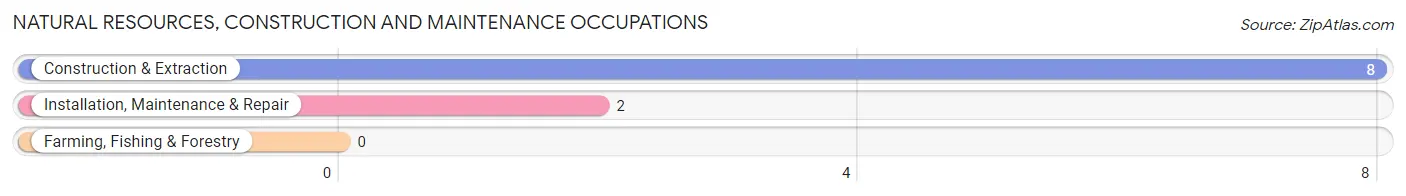
Natural Resources, Construction and Maintenance Occupations
The most common Natural Resources, Construction and Maintenance occupations in Pennington are Construction & Extraction (8 | 4.3%), and Installation, Maintenance & Repair (2 | 1.1%).
Natural Resources, Construction and Maintenance Occupations by Sex
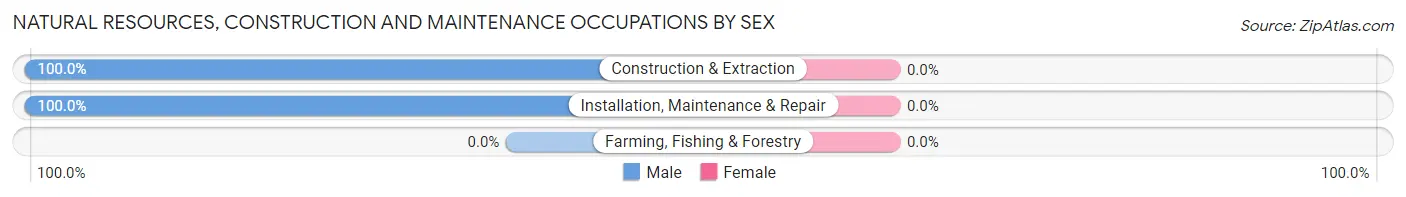
| Occupation | Male | Female |
| Farming, Fishing & Forestry | 0 (0.0%) | 0 (0.0%) |
| Construction & Extraction | 8 (100.0%) | 0 (0.0%) |
| Installation, Maintenance & Repair | 2 (100.0%) | 0 (0.0%) |
| Total (Category) | 10 (100.0%) | 0 (0.0%) |
| Total (Overall) | 73 (39.5%) | 112 (60.5%) |
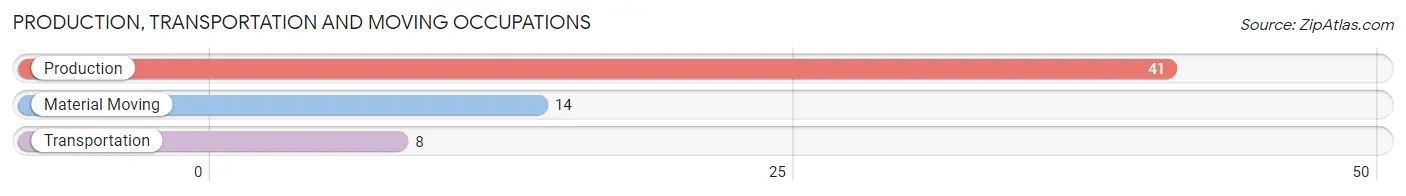
Production, Transportation and Moving Occupations
The most common Production, Transportation and Moving occupations in Pennington are Production (41 | 22.2%), Material Moving (14 | 7.6%), and Transportation (8 | 4.3%).
Production, Transportation and Moving Occupations by Sex
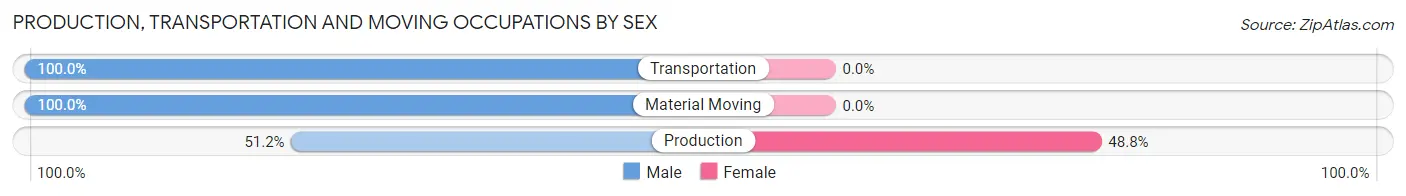
| Occupation | Male | Female |
| Production | 21 (51.2%) | 20 (48.8%) |
| Transportation | 8 (100.0%) | 0 (0.0%) |
| Material Moving | 14 (100.0%) | 0 (0.0%) |
| Total (Category) | 43 (68.2%) | 20 (31.8%) |
| Total (Overall) | 73 (39.5%) | 112 (60.5%) |
Employment Industries by Sex in Pennington
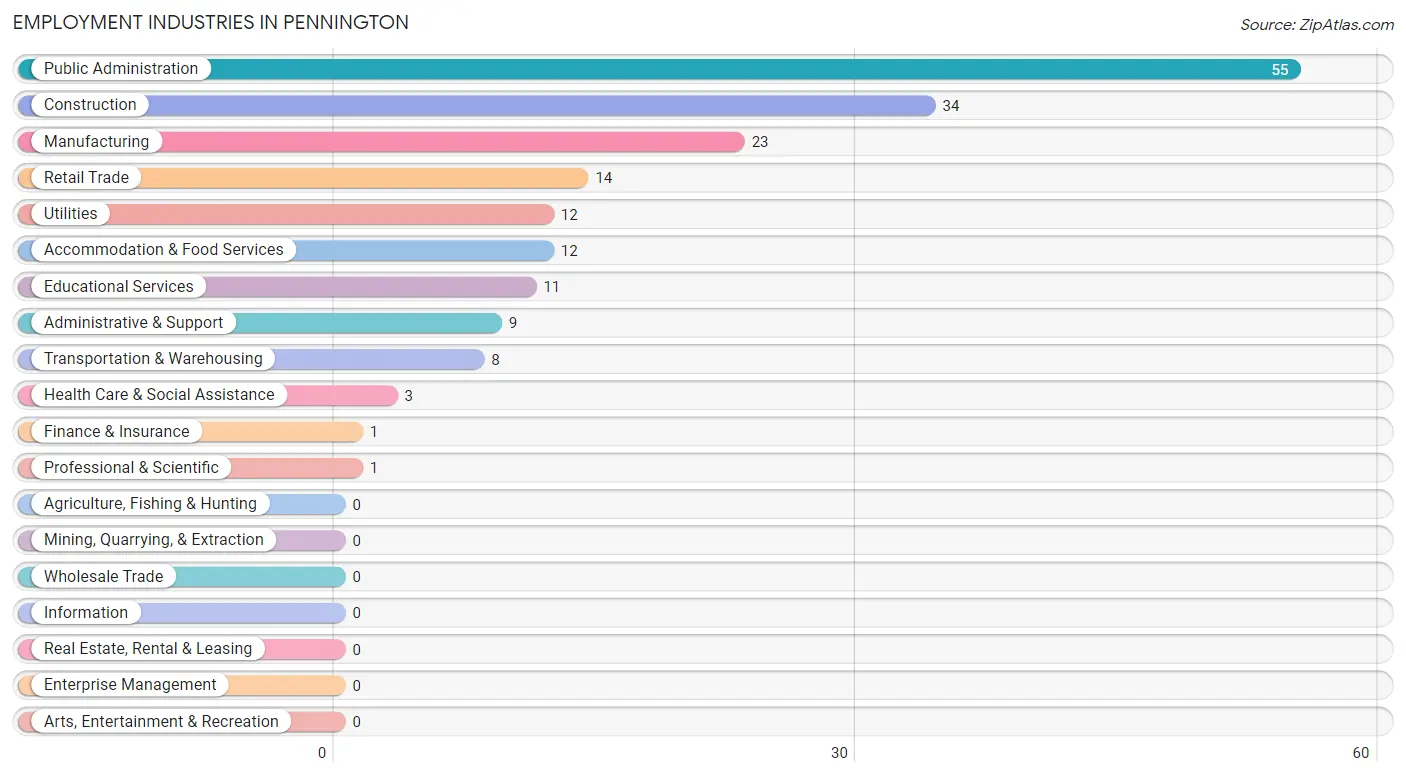
Employment Industries in Pennington
The major employment industries in Pennington include Public Administration (55 | 29.7%), Construction (34 | 18.4%), Manufacturing (23 | 12.4%), Retail Trade (14 | 7.6%), and Utilities (12 | 6.5%).
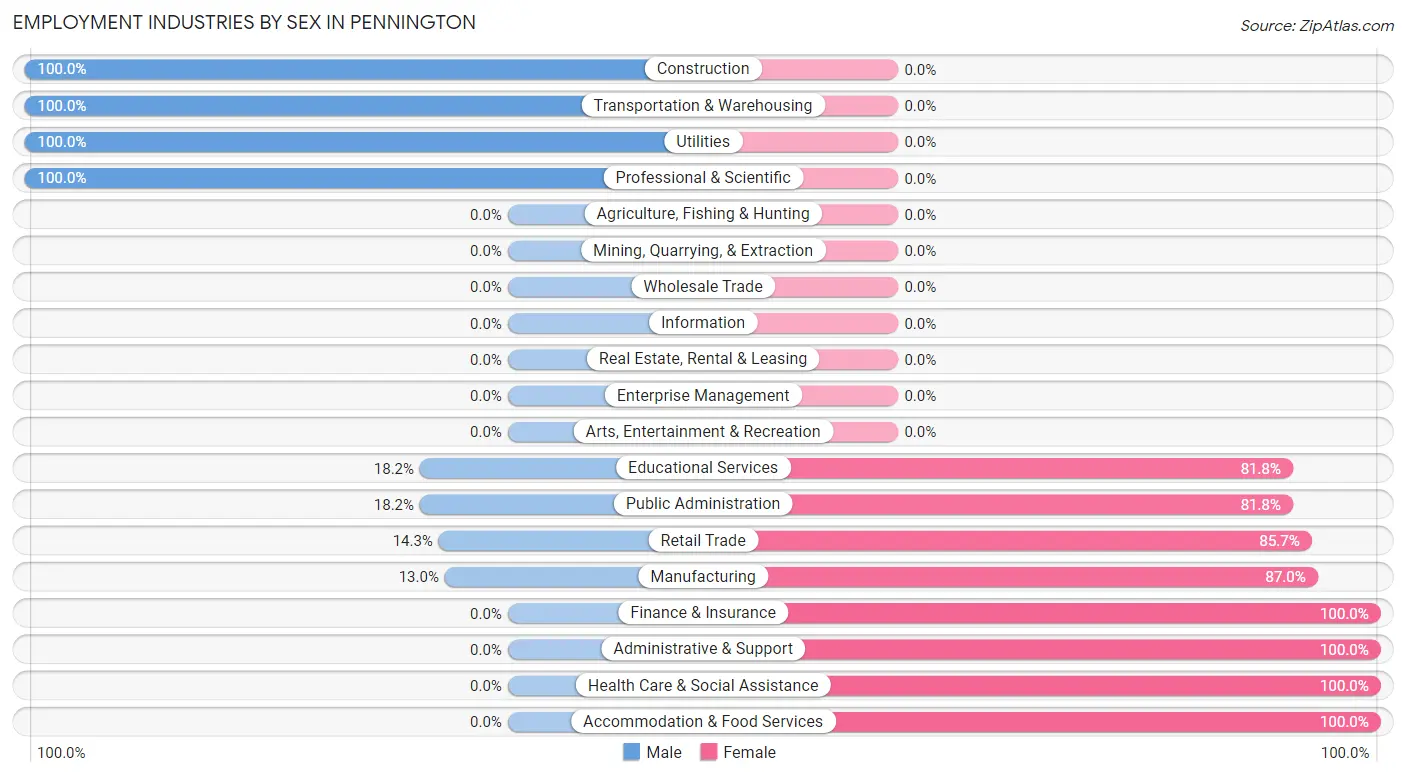
Employment Industries by Sex in Pennington
The Pennington industries that see more men than women are Construction (100.0%), Transportation & Warehousing (100.0%), and Utilities (100.0%), whereas the industries that tend to have a higher number of women are Finance & Insurance (100.0%), Administrative & Support (100.0%), and Health Care & Social Assistance (100.0%).
| Industry | Male | Female |
| Agriculture, Fishing & Hunting | 0 (0.0%) | 0 (0.0%) |
| Mining, Quarrying, & Extraction | 0 (0.0%) | 0 (0.0%) |
| Construction | 34 (100.0%) | 0 (0.0%) |
| Manufacturing | 3 (13.0%) | 20 (87.0%) |
| Wholesale Trade | 0 (0.0%) | 0 (0.0%) |
| Retail Trade | 2 (14.3%) | 12 (85.7%) |
| Transportation & Warehousing | 8 (100.0%) | 0 (0.0%) |
| Utilities | 12 (100.0%) | 0 (0.0%) |
| Information | 0 (0.0%) | 0 (0.0%) |
| Finance & Insurance | 0 (0.0%) | 1 (100.0%) |
| Real Estate, Rental & Leasing | 0 (0.0%) | 0 (0.0%) |
| Professional & Scientific | 1 (100.0%) | 0 (0.0%) |
| Enterprise Management | 0 (0.0%) | 0 (0.0%) |
| Administrative & Support | 0 (0.0%) | 9 (100.0%) |
| Educational Services | 2 (18.2%) | 9 (81.8%) |
| Health Care & Social Assistance | 0 (0.0%) | 3 (100.0%) |
| Arts, Entertainment & Recreation | 0 (0.0%) | 0 (0.0%) |
| Accommodation & Food Services | 0 (0.0%) | 12 (100.0%) |
| Public Administration | 10 (18.2%) | 45 (81.8%) |
| Total | 73 (39.5%) | 112 (60.5%) |
Education in Pennington
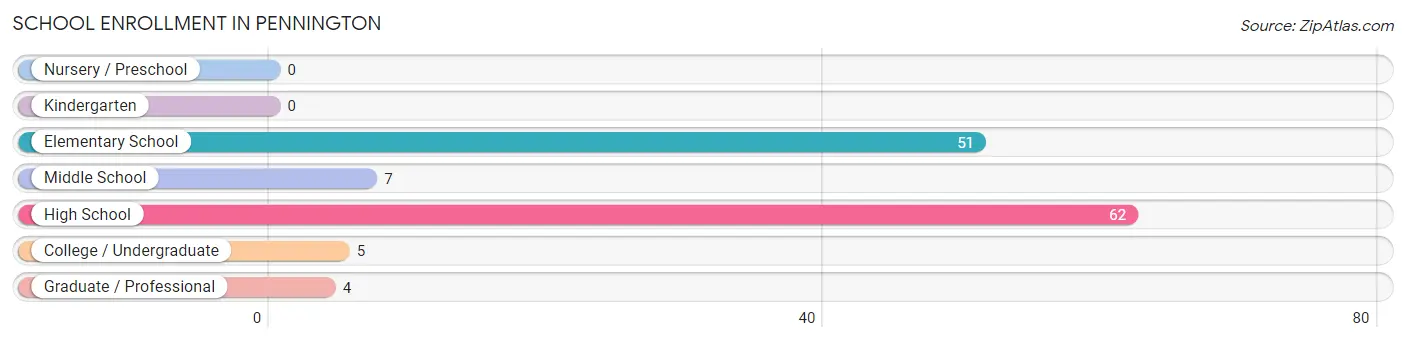
School Enrollment in Pennington
The most common levels of schooling among the 129 students in Pennington are high school (62 | 48.1%), elementary school (51 | 39.5%), and middle school (7 | 5.4%).
| School Level | # Students | % Students |
| Nursery / Preschool | 0 | 0.0% |
| Kindergarten | 0 | 0.0% |
| Elementary School | 51 | 39.5% |
| Middle School | 7 | 5.4% |
| High School | 62 | 48.1% |
| College / Undergraduate | 5 | 3.9% |
| Graduate / Professional | 4 | 3.1% |
| Total | 129 | 100.0% |
School Enrollment by Age by Funding Source in Pennington
Out of a total of 129 students who are enrolled in schools in Pennington, 69 (53.5%) attend a private institution, while the remaining 60 (46.5%) are enrolled in public schools. The age group of 10 to 14 year olds has the highest likelihood of being enrolled in private schools, with 20 (69.0% in the age bracket) enrolled. Conversely, the age group of 18 to 19 year olds has the lowest likelihood of being enrolled in a private school, with 12 (100.0% in the age bracket) attending a public institution.
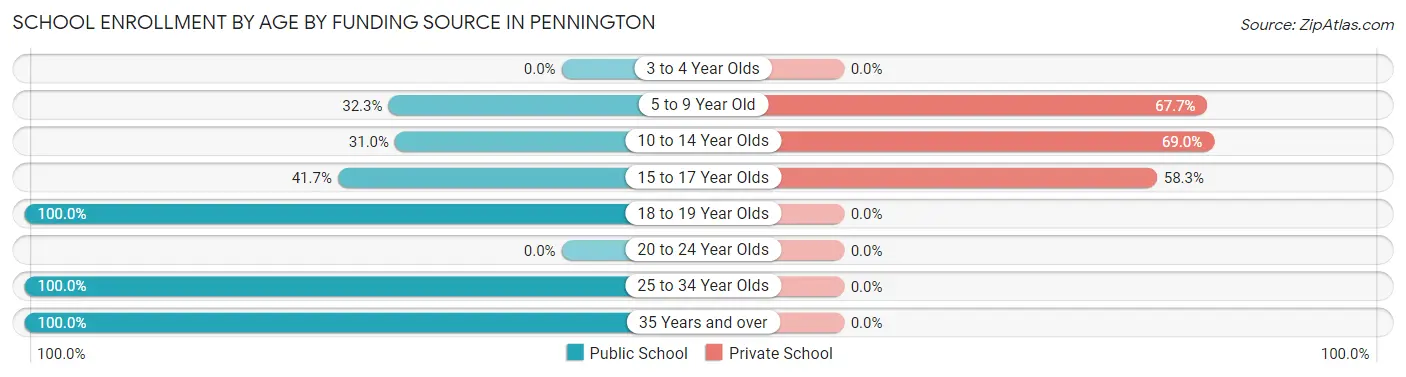
| Age Bracket | Public School | Private School |
| 3 to 4 Year Olds | 0 (0.0%) | 0 (0.0%) |
| 5 to 9 Year Old | 10 (32.3%) | 21 (67.7%) |
| 10 to 14 Year Olds | 9 (31.0%) | 20 (69.0%) |
| 15 to 17 Year Olds | 20 (41.7%) | 28 (58.3%) |
| 18 to 19 Year Olds | 12 (100.0%) | 0 (0.0%) |
| 20 to 24 Year Olds | 0 (0.0%) | 0 (0.0%) |
| 25 to 34 Year Olds | 5 (100.0%) | 0 (0.0%) |
| 35 Years and over | 4 (100.0%) | 0 (0.0%) |
| Total | 60 (46.5%) | 69 (53.5%) |
Educational Attainment by Field of Study in Pennington
Education (8 | 38.1%), science & technology (5 | 23.8%), arts & humanities (3 | 14.3%), computers & mathematics (1 | 4.8%), and bio, nature & agricultural (1 | 4.8%) are the most common fields of study among 21 individuals in Pennington who have obtained a bachelor's degree or higher.
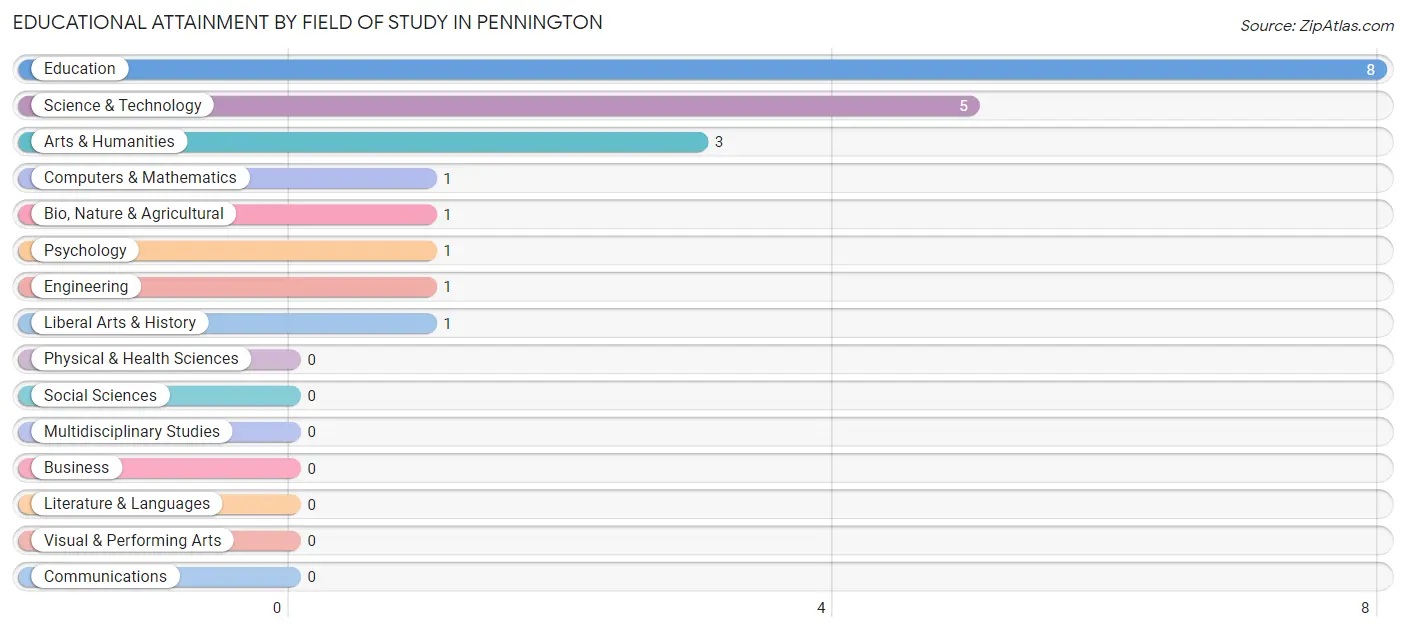
| Field of Study | # Graduates | % Graduates |
| Computers & Mathematics | 1 | 4.8% |
| Bio, Nature & Agricultural | 1 | 4.8% |
| Physical & Health Sciences | 0 | 0.0% |
| Psychology | 1 | 4.8% |
| Social Sciences | 0 | 0.0% |
| Engineering | 1 | 4.8% |
| Multidisciplinary Studies | 0 | 0.0% |
| Science & Technology | 5 | 23.8% |
| Business | 0 | 0.0% |
| Education | 8 | 38.1% |
| Literature & Languages | 0 | 0.0% |
| Liberal Arts & History | 1 | 4.8% |
| Visual & Performing Arts | 0 | 0.0% |
| Communications | 0 | 0.0% |
| Arts & Humanities | 3 | 14.3% |
| Total | 21 | 100.0% |
Transportation & Commute in Pennington
Vehicle Availability by Sex in Pennington
The most prevalent vehicle ownership categories in Pennington are males with 4 vehicles (23, accounting for 31.5%) and females with 4 vehicles (2, making up 20.5%).
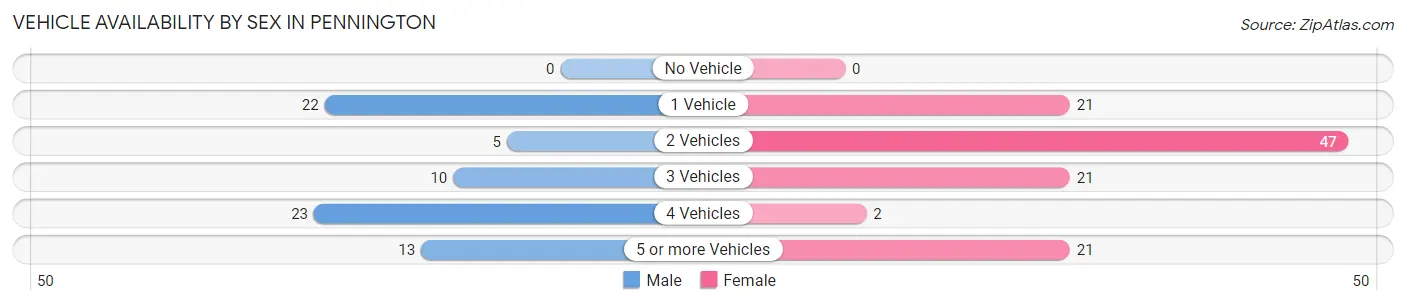
| Vehicles Available | Male | Female |
| No Vehicle | 0 (0.0%) | 0 (0.0%) |
| 1 Vehicle | 22 (30.1%) | 21 (18.8%) |
| 2 Vehicles | 5 (6.9%) | 47 (42.0%) |
| 3 Vehicles | 10 (13.7%) | 21 (18.8%) |
| 4 Vehicles | 23 (31.5%) | 2 (1.8%) |
| 5 or more Vehicles | 13 (17.8%) | 21 (18.8%) |
| Total | 73 (100.0%) | 112 (100.0%) |
Commute Time in Pennington
The most frequently occuring commute durations in Pennington are 40 to 44 minutes (45 commuters, 24.5%), 5 to 9 minutes (31 commuters, 16.9%), and less than 5 minutes (25 commuters, 13.6%).
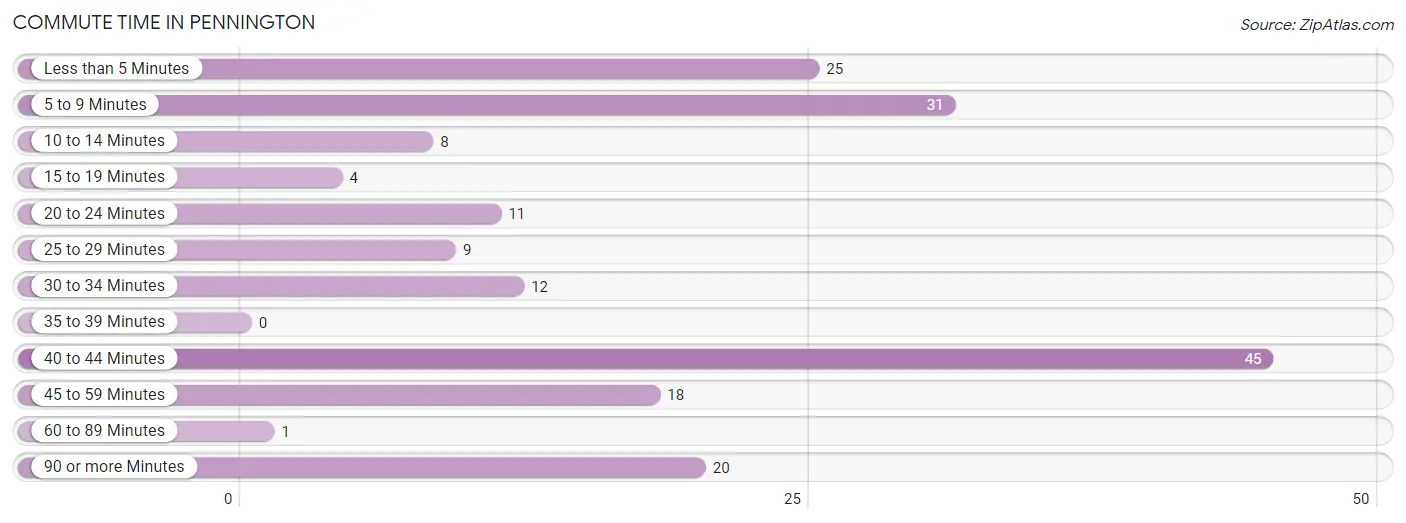
| Commute Time | # Commuters | % Commuters |
| Less than 5 Minutes | 25 | 13.6% |
| 5 to 9 Minutes | 31 | 16.9% |
| 10 to 14 Minutes | 8 | 4.3% |
| 15 to 19 Minutes | 4 | 2.2% |
| 20 to 24 Minutes | 11 | 6.0% |
| 25 to 29 Minutes | 9 | 4.9% |
| 30 to 34 Minutes | 12 | 6.5% |
| 35 to 39 Minutes | 0 | 0.0% |
| 40 to 44 Minutes | 45 | 24.5% |
| 45 to 59 Minutes | 18 | 9.8% |
| 60 to 89 Minutes | 1 | 0.5% |
| 90 or more Minutes | 20 | 10.9% |
Commute Time by Sex in Pennington
The most common commute times in Pennington are 5 to 9 minutes (20 commuters, 27.8%) for males and 40 to 44 minutes (45 commuters, 40.2%) for females.
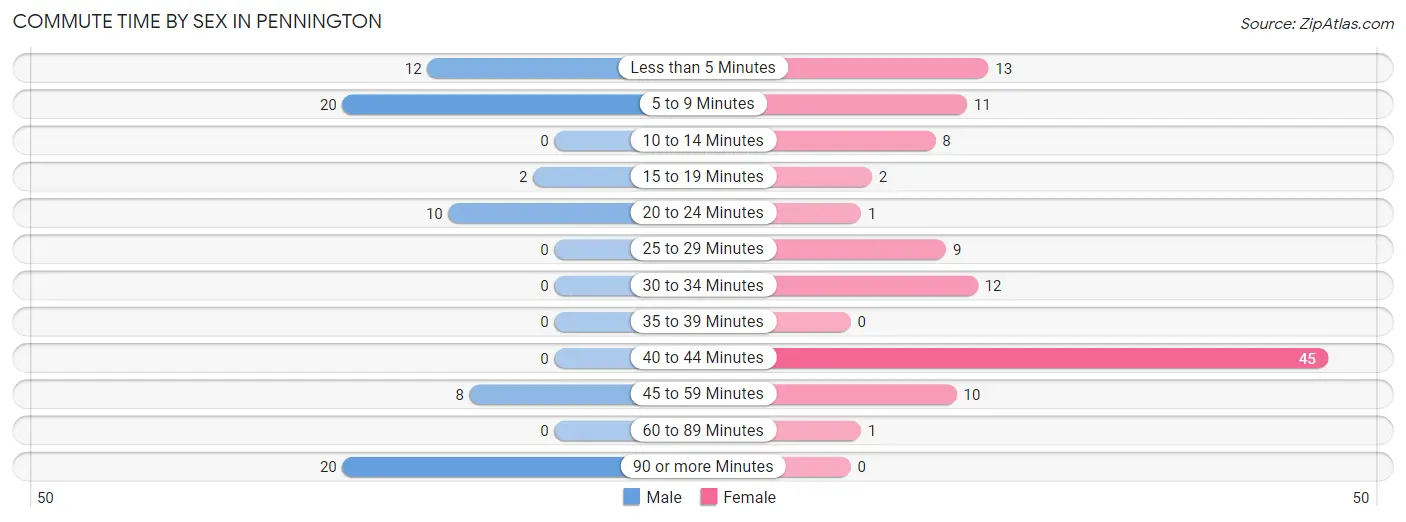
| Commute Time | Male | Female |
| Less than 5 Minutes | 12 (16.7%) | 13 (11.6%) |
| 5 to 9 Minutes | 20 (27.8%) | 11 (9.8%) |
| 10 to 14 Minutes | 0 (0.0%) | 8 (7.1%) |
| 15 to 19 Minutes | 2 (2.8%) | 2 (1.8%) |
| 20 to 24 Minutes | 10 (13.9%) | 1 (0.9%) |
| 25 to 29 Minutes | 0 (0.0%) | 9 (8.0%) |
| 30 to 34 Minutes | 0 (0.0%) | 12 (10.7%) |
| 35 to 39 Minutes | 0 (0.0%) | 0 (0.0%) |
| 40 to 44 Minutes | 0 (0.0%) | 45 (40.2%) |
| 45 to 59 Minutes | 8 (11.1%) | 10 (8.9%) |
| 60 to 89 Minutes | 0 (0.0%) | 1 (0.9%) |
| 90 or more Minutes | 20 (27.8%) | 0 (0.0%) |
Time of Departure to Work by Sex in Pennington
The most frequent times of departure to work in Pennington are 6:00 AM to 6:29 AM (23, 31.9%) for males and 12:00 AM to 4:59 AM (61, 54.5%) for females.
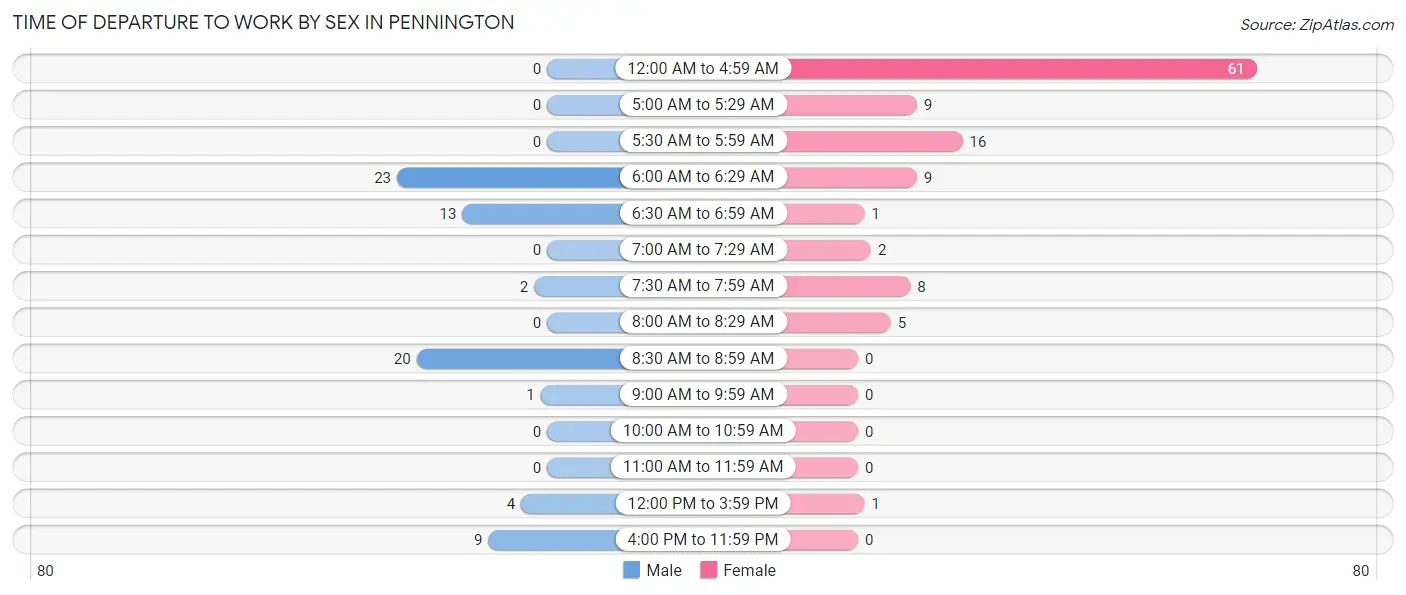
| Time of Departure | Male | Female |
| 12:00 AM to 4:59 AM | 0 (0.0%) | 61 (54.5%) |
| 5:00 AM to 5:29 AM | 0 (0.0%) | 9 (8.0%) |
| 5:30 AM to 5:59 AM | 0 (0.0%) | 16 (14.3%) |
| 6:00 AM to 6:29 AM | 23 (31.9%) | 9 (8.0%) |
| 6:30 AM to 6:59 AM | 13 (18.1%) | 1 (0.9%) |
| 7:00 AM to 7:29 AM | 0 (0.0%) | 2 (1.8%) |
| 7:30 AM to 7:59 AM | 2 (2.8%) | 8 (7.1%) |
| 8:00 AM to 8:29 AM | 0 (0.0%) | 5 (4.5%) |
| 8:30 AM to 8:59 AM | 20 (27.8%) | 0 (0.0%) |
| 9:00 AM to 9:59 AM | 1 (1.4%) | 0 (0.0%) |
| 10:00 AM to 10:59 AM | 0 (0.0%) | 0 (0.0%) |
| 11:00 AM to 11:59 AM | 0 (0.0%) | 0 (0.0%) |
| 12:00 PM to 3:59 PM | 4 (5.6%) | 1 (0.9%) |
| 4:00 PM to 11:59 PM | 9 (12.5%) | 0 (0.0%) |
| Total | 72 (100.0%) | 112 (100.0%) |
Housing Occupancy in Pennington
Occupancy by Ownership in Pennington
Of the total 254 dwellings in Pennington, owner-occupied units account for 191 (75.2%), while renter-occupied units make up 63 (24.8%).
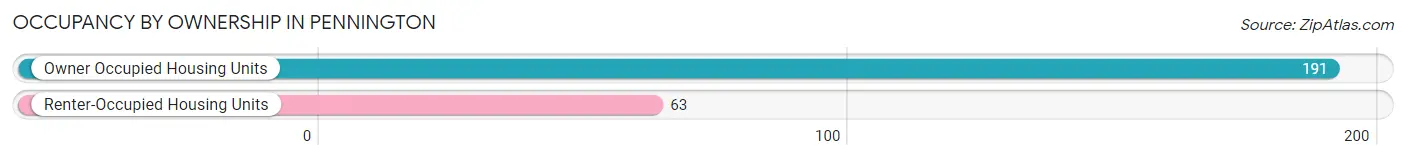
| Occupancy | # Housing Units | % Housing Units |
| Owner Occupied Housing Units | 191 | 75.2% |
| Renter-Occupied Housing Units | 63 | 24.8% |
| Total Occupied Housing Units | 254 | 100.0% |
Occupancy by Household Size in Pennington
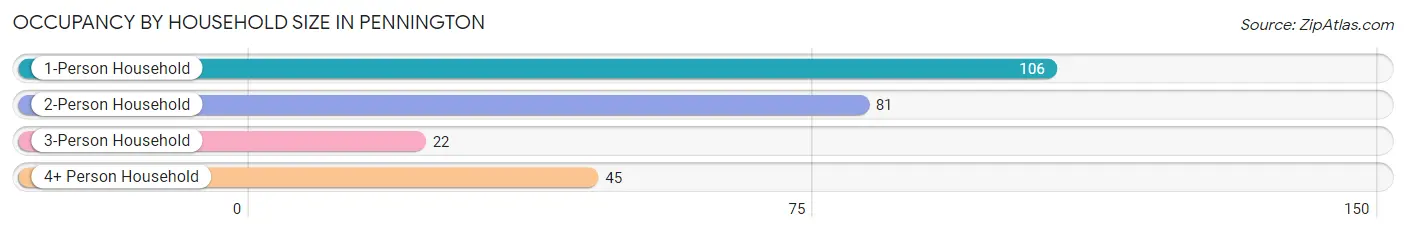
| Household Size | # Housing Units | % Housing Units |
| 1-Person Household | 106 | 41.7% |
| 2-Person Household | 81 | 31.9% |
| 3-Person Household | 22 | 8.7% |
| 4+ Person Household | 45 | 17.7% |
| Total Housing Units | 254 | 100.0% |
Occupancy by Ownership by Household Size in Pennington
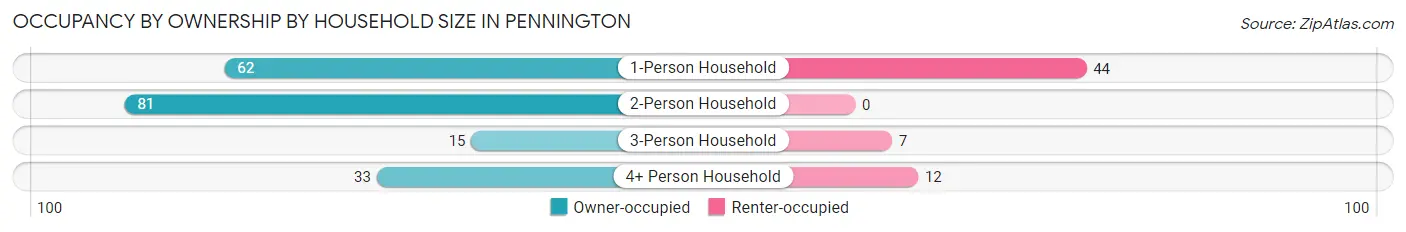
| Household Size | Owner-occupied | Renter-occupied |
| 1-Person Household | 62 (58.5%) | 44 (41.5%) |
| 2-Person Household | 81 (100.0%) | 0 (0.0%) |
| 3-Person Household | 15 (68.2%) | 7 (31.8%) |
| 4+ Person Household | 33 (73.3%) | 12 (26.7%) |
| Total Housing Units | 191 (75.2%) | 63 (24.8%) |
Occupancy by Educational Attainment in Pennington
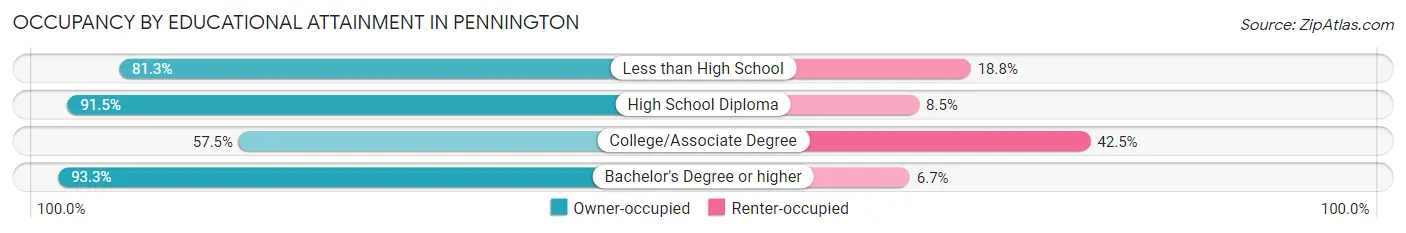
| Household Size | Owner-occupied | Renter-occupied |
| Less than High School | 26 (81.2%) | 6 (18.8%) |
| High School Diploma | 86 (91.5%) | 8 (8.5%) |
| College/Associate Degree | 65 (57.5%) | 48 (42.5%) |
| Bachelor's Degree or higher | 14 (93.3%) | 1 (6.7%) |
Occupancy by Age of Householder in Pennington
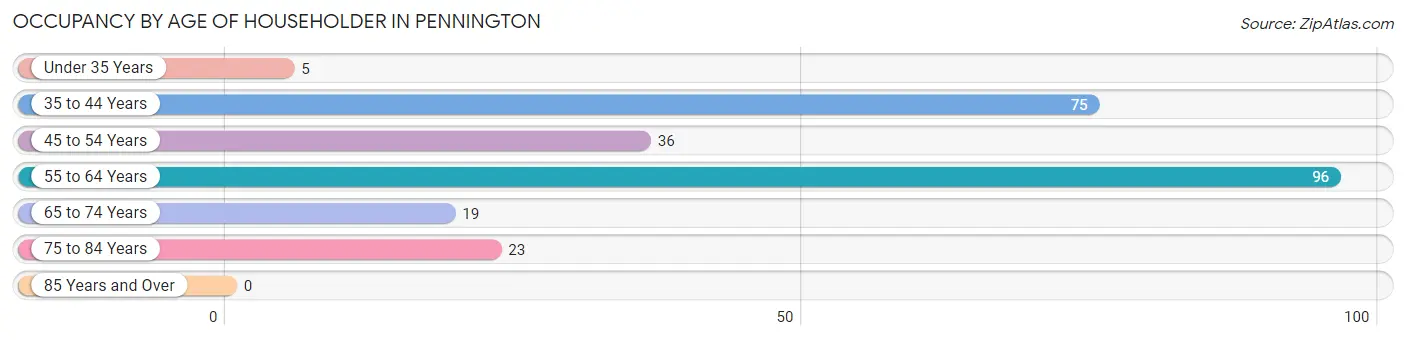
| Age Bracket | # Households | % Households |
| Under 35 Years | 5 | 2.0% |
| 35 to 44 Years | 75 | 29.5% |
| 45 to 54 Years | 36 | 14.2% |
| 55 to 64 Years | 96 | 37.8% |
| 65 to 74 Years | 19 | 7.5% |
| 75 to 84 Years | 23 | 9.1% |
| 85 Years and Over | 0 | 0.0% |
| Total | 254 | 100.0% |
Housing Finances in Pennington
Median Income by Occupancy in Pennington
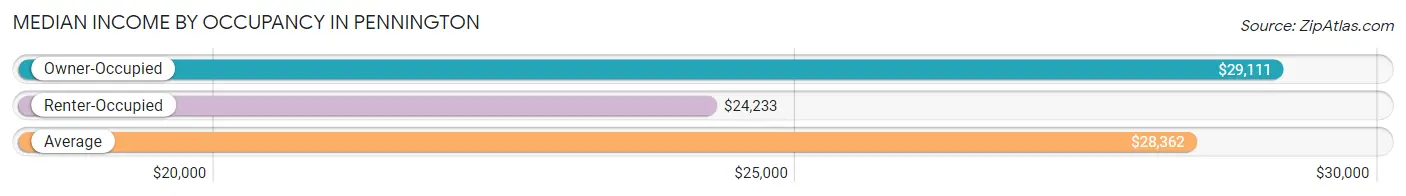
| Occupancy Type | # Households | Median Income |
| Owner-Occupied | 191 (75.2%) | $29,111 |
| Renter-Occupied | 63 (24.8%) | $24,233 |
| Average | 254 (100.0%) | $28,362 |
Occupancy by Householder Income Bracket in Pennington
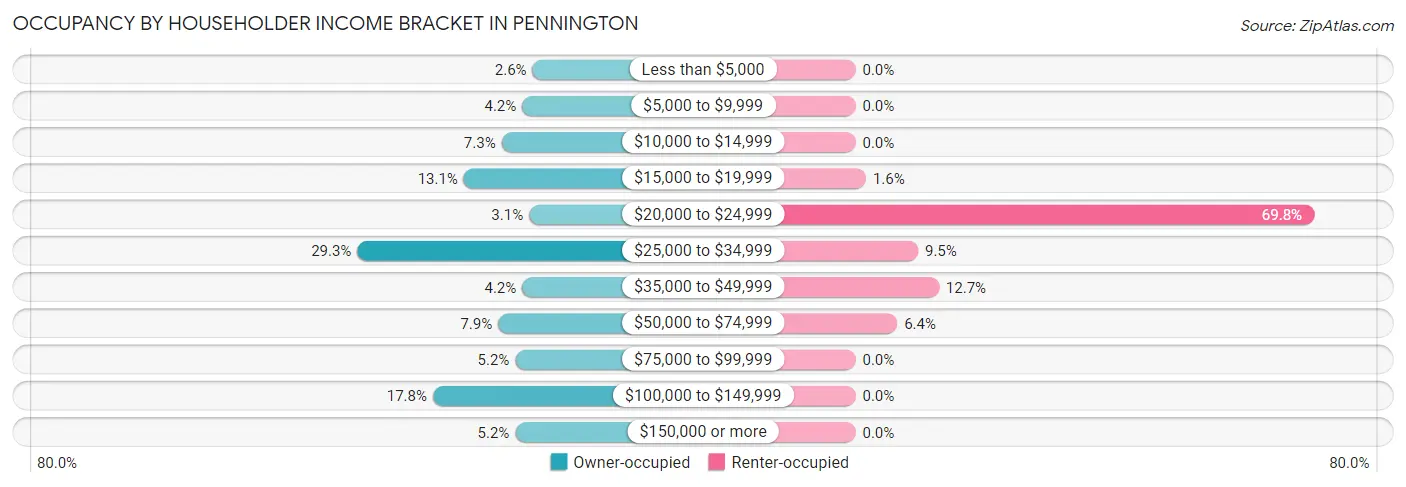
| Income Bracket | Owner-occupied | Renter-occupied |
| Less than $5,000 | 5 (2.6%) | 0 (0.0%) |
| $5,000 to $9,999 | 8 (4.2%) | 0 (0.0%) |
| $10,000 to $14,999 | 14 (7.3%) | 0 (0.0%) |
| $15,000 to $19,999 | 25 (13.1%) | 1 (1.6%) |
| $20,000 to $24,999 | 6 (3.1%) | 44 (69.8%) |
| $25,000 to $34,999 | 56 (29.3%) | 6 (9.5%) |
| $35,000 to $49,999 | 8 (4.2%) | 8 (12.7%) |
| $50,000 to $74,999 | 15 (7.9%) | 4 (6.4%) |
| $75,000 to $99,999 | 10 (5.2%) | 0 (0.0%) |
| $100,000 to $149,999 | 34 (17.8%) | 0 (0.0%) |
| $150,000 or more | 10 (5.2%) | 0 (0.0%) |
| Total | 191 (100.0%) | 63 (100.0%) |
Monthly Housing Cost Tiers in Pennington
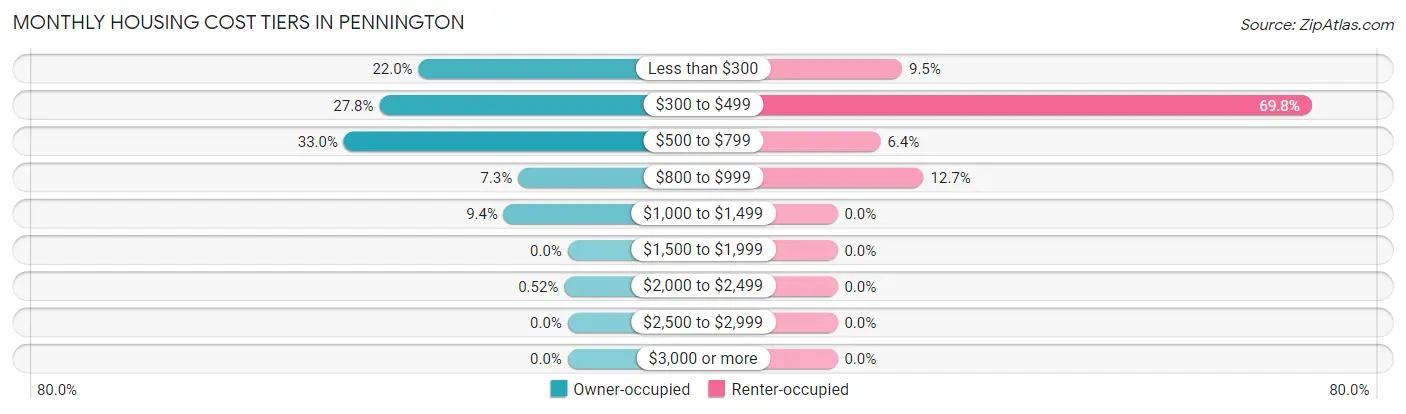
| Monthly Cost | Owner-occupied | Renter-occupied |
| Less than $300 | 42 (22.0%) | 6 (9.5%) |
| $300 to $499 | 53 (27.8%) | 44 (69.8%) |
| $500 to $799 | 63 (33.0%) | 4 (6.4%) |
| $800 to $999 | 14 (7.3%) | 8 (12.7%) |
| $1,000 to $1,499 | 18 (9.4%) | 0 (0.0%) |
| $1,500 to $1,999 | 0 (0.0%) | 0 (0.0%) |
| $2,000 to $2,499 | 1 (0.5%) | 0 (0.0%) |
| $2,500 to $2,999 | 0 (0.0%) | 0 (0.0%) |
| $3,000 or more | 0 (0.0%) | 0 (0.0%) |
| Total | 191 (100.0%) | 63 (100.0%) |
Physical Housing Characteristics in Pennington
Housing Structures in Pennington
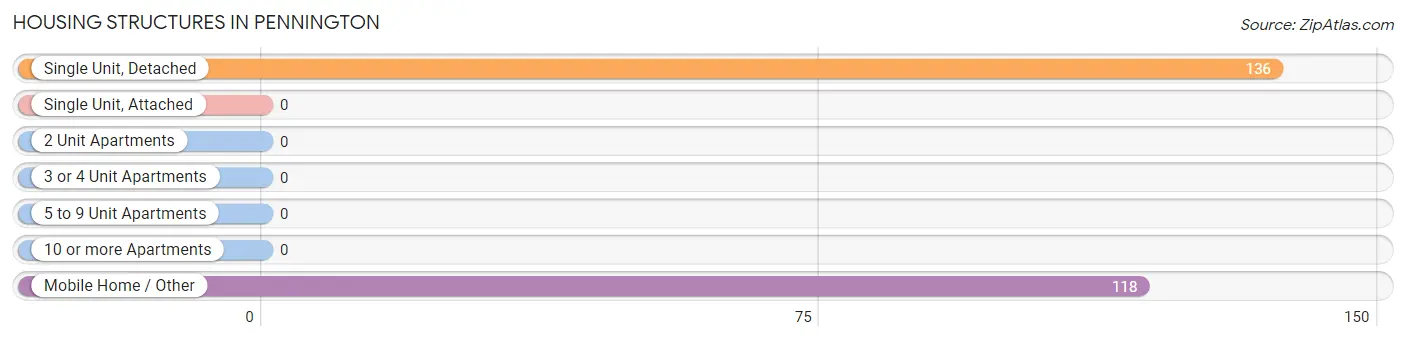
| Structure Type | # Housing Units | % Housing Units |
| Single Unit, Detached | 136 | 53.5% |
| Single Unit, Attached | 0 | 0.0% |
| 2 Unit Apartments | 0 | 0.0% |
| 3 or 4 Unit Apartments | 0 | 0.0% |
| 5 to 9 Unit Apartments | 0 | 0.0% |
| 10 or more Apartments | 0 | 0.0% |
| Mobile Home / Other | 118 | 46.5% |
| Total | 254 | 100.0% |
Housing Structures by Occupancy in Pennington
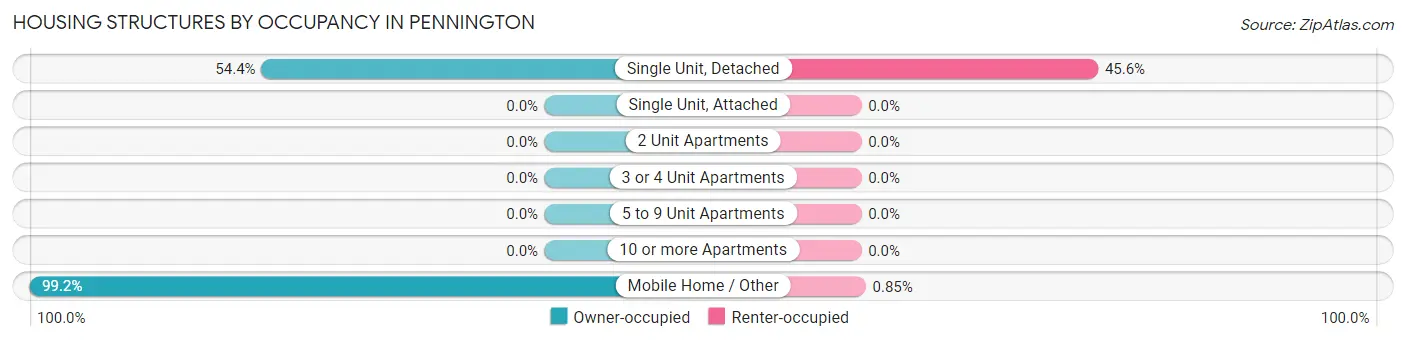
| Structure Type | Owner-occupied | Renter-occupied |
| Single Unit, Detached | 74 (54.4%) | 62 (45.6%) |
| Single Unit, Attached | 0 (0.0%) | 0 (0.0%) |
| 2 Unit Apartments | 0 (0.0%) | 0 (0.0%) |
| 3 or 4 Unit Apartments | 0 (0.0%) | 0 (0.0%) |
| 5 to 9 Unit Apartments | 0 (0.0%) | 0 (0.0%) |
| 10 or more Apartments | 0 (0.0%) | 0 (0.0%) |
| Mobile Home / Other | 117 (99.2%) | 1 (0.9%) |
| Total | 191 (75.2%) | 63 (24.8%) |
Housing Structures by Number of Rooms in Pennington
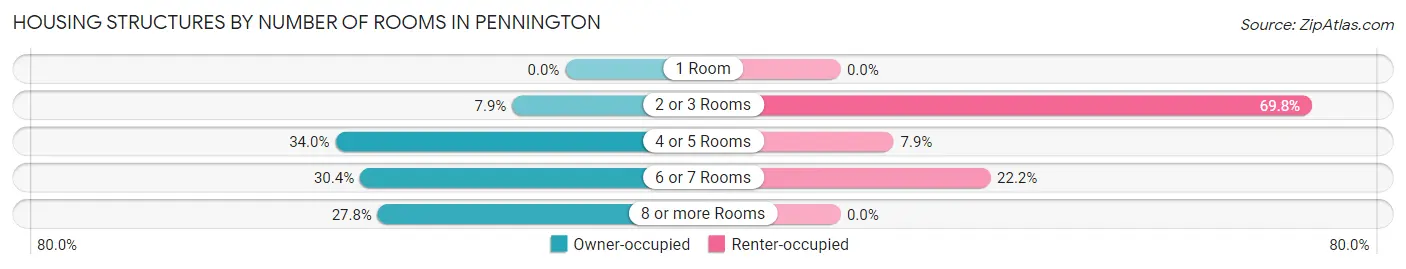
| Number of Rooms | Owner-occupied | Renter-occupied |
| 1 Room | 0 (0.0%) | 0 (0.0%) |
| 2 or 3 Rooms | 15 (7.9%) | 44 (69.8%) |
| 4 or 5 Rooms | 65 (34.0%) | 5 (7.9%) |
| 6 or 7 Rooms | 58 (30.4%) | 14 (22.2%) |
| 8 or more Rooms | 53 (27.8%) | 0 (0.0%) |
| Total | 191 (100.0%) | 63 (100.0%) |
Housing Structure by Heating Type in Pennington
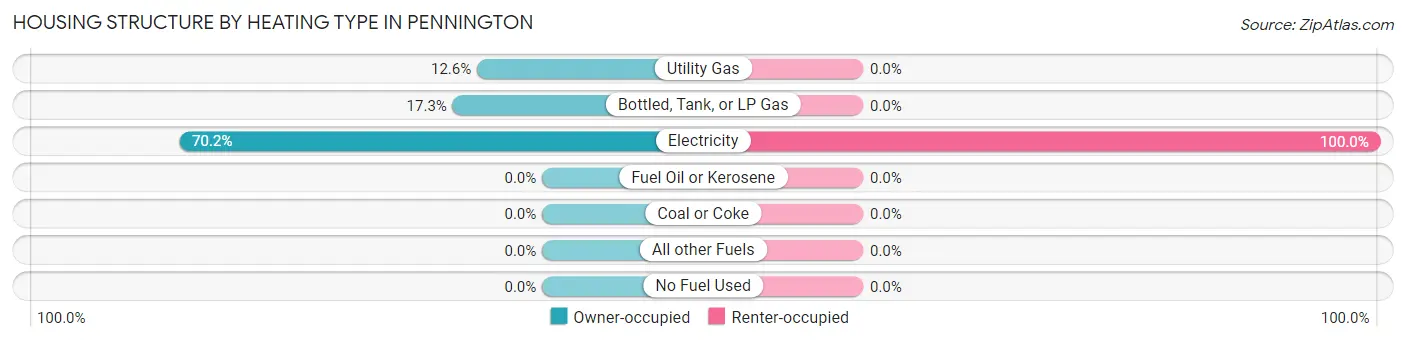
| Heating Type | Owner-occupied | Renter-occupied |
| Utility Gas | 24 (12.6%) | 0 (0.0%) |
| Bottled, Tank, or LP Gas | 33 (17.3%) | 0 (0.0%) |
| Electricity | 134 (70.2%) | 63 (100.0%) |
| Fuel Oil or Kerosene | 0 (0.0%) | 0 (0.0%) |
| Coal or Coke | 0 (0.0%) | 0 (0.0%) |
| All other Fuels | 0 (0.0%) | 0 (0.0%) |
| No Fuel Used | 0 (0.0%) | 0 (0.0%) |
| Total | 191 (100.0%) | 63 (100.0%) |
Household Vehicle Usage in Pennington
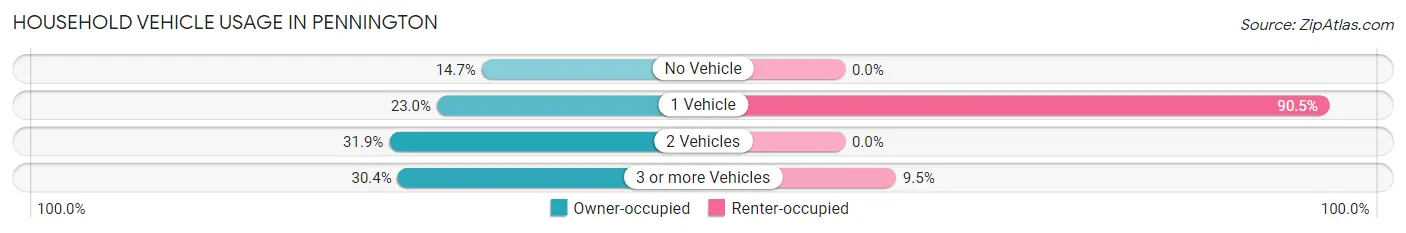
| Vehicles per Household | Owner-occupied | Renter-occupied |
| No Vehicle | 28 (14.7%) | 0 (0.0%) |
| 1 Vehicle | 44 (23.0%) | 57 (90.5%) |
| 2 Vehicles | 61 (31.9%) | 0 (0.0%) |
| 3 or more Vehicles | 58 (30.4%) | 6 (9.5%) |
| Total | 191 (100.0%) | 63 (100.0%) |
Real Estate & Mortgages in Pennington
Real Estate and Mortgage Overview in Pennington
| Characteristic | Without Mortgage | With Mortgage |
| Housing Units | 158 | 33 |
| Median Property Value | $64,000 | $0 |
| Median Household Income | - | - |
| Monthly Housing Costs | $375 | $0 |
| Real Estate Taxes | $199 | $5 |
Property Value by Mortgage Status in Pennington
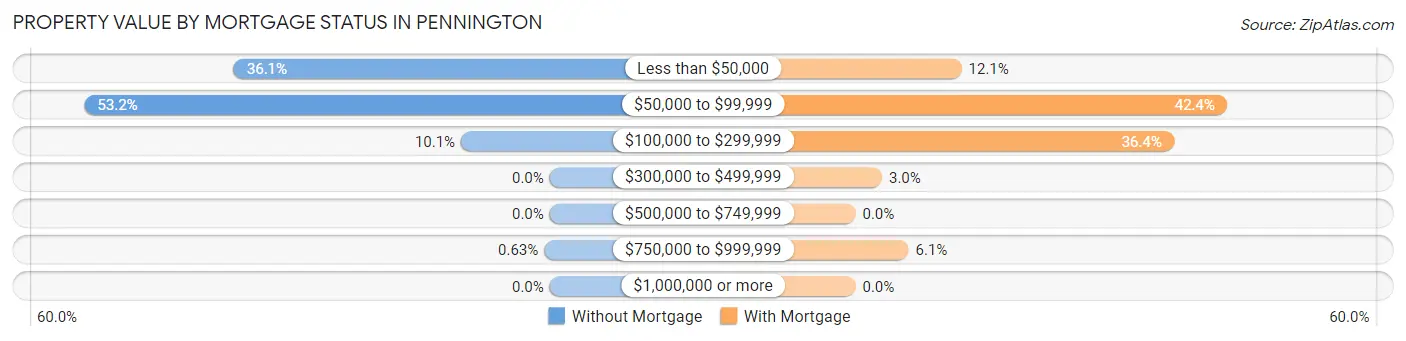
| Property Value | Without Mortgage | With Mortgage |
| Less than $50,000 | 57 (36.1%) | 4 (12.1%) |
| $50,000 to $99,999 | 84 (53.2%) | 14 (42.4%) |
| $100,000 to $299,999 | 16 (10.1%) | 12 (36.4%) |
| $300,000 to $499,999 | 0 (0.0%) | 1 (3.0%) |
| $500,000 to $749,999 | 0 (0.0%) | 0 (0.0%) |
| $750,000 to $999,999 | 1 (0.6%) | 2 (6.1%) |
| $1,000,000 or more | 0 (0.0%) | 0 (0.0%) |
| Total | 158 (100.0%) | 33 (100.0%) |
Household Income by Mortgage Status in Pennington
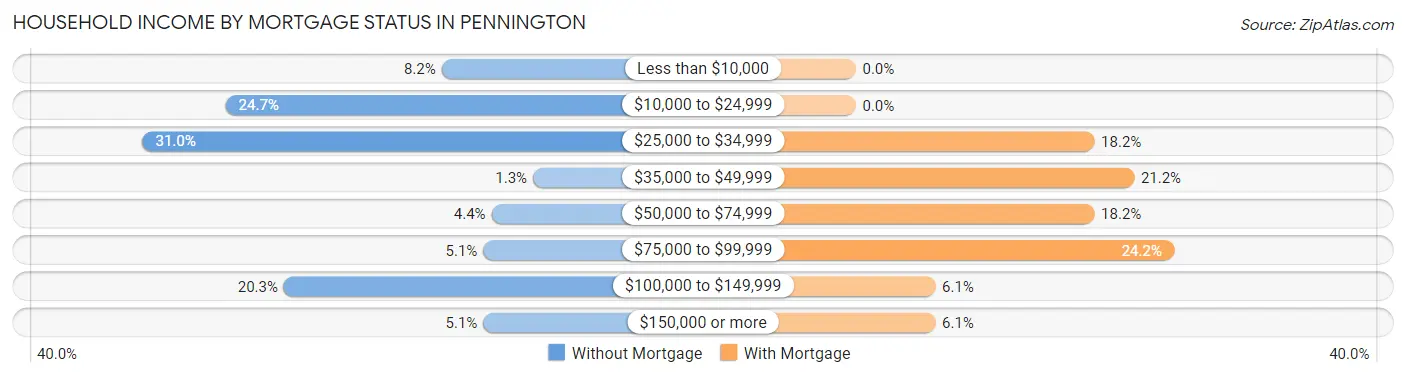
| Household Income | Without Mortgage | With Mortgage |
| Less than $10,000 | 13 (8.2%) | 0 (0.0%) |
| $10,000 to $24,999 | 39 (24.7%) | 0 (0.0%) |
| $25,000 to $34,999 | 49 (31.0%) | 6 (18.2%) |
| $35,000 to $49,999 | 2 (1.3%) | 7 (21.2%) |
| $50,000 to $74,999 | 7 (4.4%) | 6 (18.2%) |
| $75,000 to $99,999 | 8 (5.1%) | 8 (24.2%) |
| $100,000 to $149,999 | 32 (20.3%) | 2 (6.1%) |
| $150,000 or more | 8 (5.1%) | 2 (6.1%) |
| Total | 158 (100.0%) | 33 (100.0%) |
Property Value to Household Income Ratio in Pennington
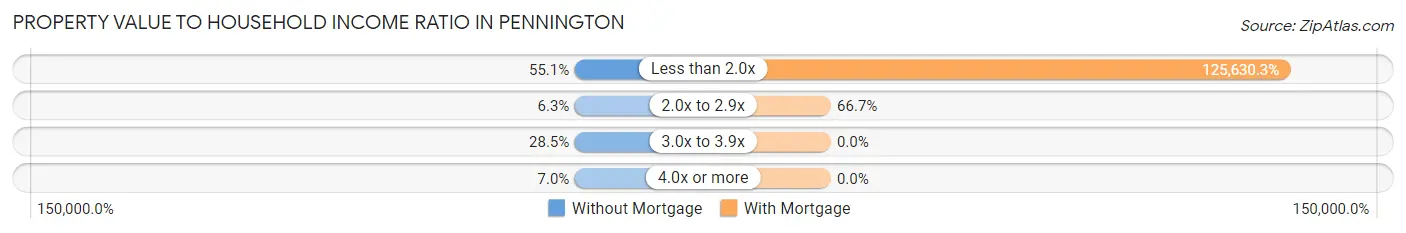
| Value-to-Income Ratio | Without Mortgage | With Mortgage |
| Less than 2.0x | 87 (55.1%) | 41,458 (125,630.3%) |
| 2.0x to 2.9x | 10 (6.3%) | 22 (66.7%) |
| 3.0x to 3.9x | 45 (28.5%) | 0 (0.0%) |
| 4.0x or more | 11 (7.0%) | 0 (0.0%) |
| Total | 158 (100.0%) | 33 (100.0%) |
Real Estate Taxes by Mortgage Status in Pennington
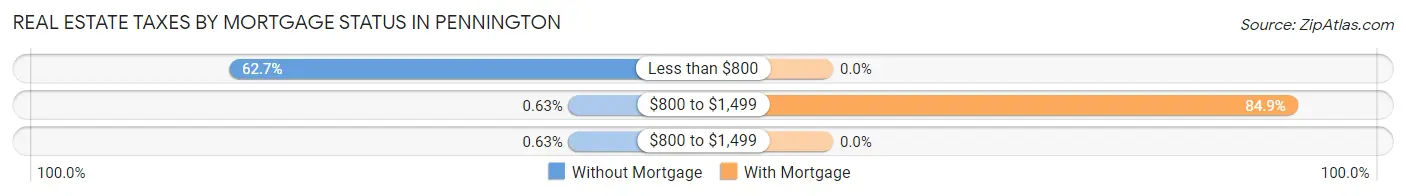
| Property Taxes | Without Mortgage | With Mortgage |
| Less than $800 | 99 (62.7%) | 0 (0.0%) |
| $800 to $1,499 | 1 (0.6%) | 28 (84.9%) |
| $800 to $1,499 | 1 (0.6%) | 0 (0.0%) |
| Total | 158 (100.0%) | 33 (100.0%) |
Health & Disability in Pennington
Health Insurance Coverage by Age in Pennington
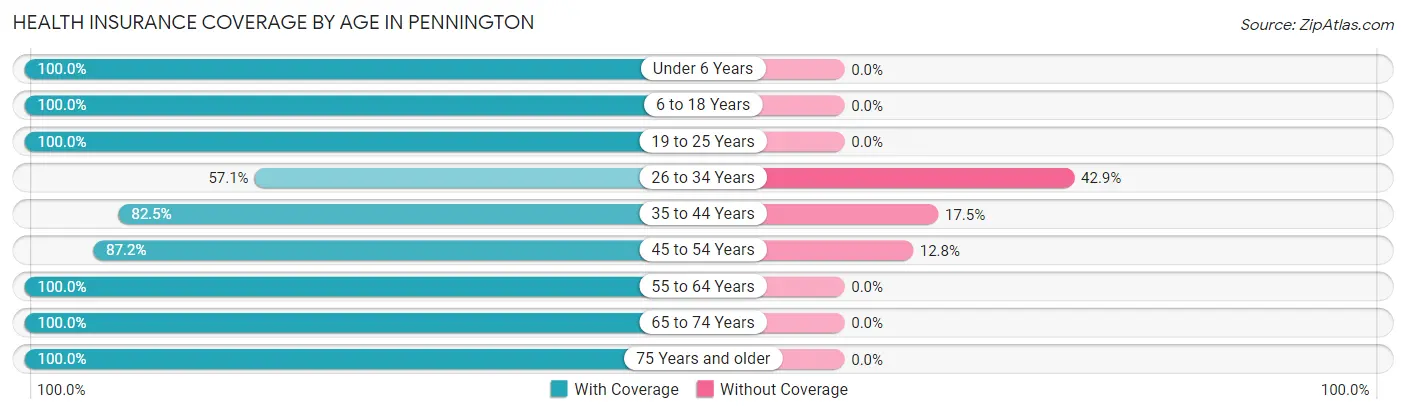
| Age Bracket | With Coverage | Without Coverage |
| Under 6 Years | 91 (100.0%) | 0 (0.0%) |
| 6 to 18 Years | 108 (100.0%) | 0 (0.0%) |
| 19 to 25 Years | 23 (100.0%) | 0 (0.0%) |
| 26 to 34 Years | 16 (57.1%) | 12 (42.9%) |
| 35 to 44 Years | 118 (82.5%) | 25 (17.5%) |
| 45 to 54 Years | 41 (87.2%) | 6 (12.8%) |
| 55 to 64 Years | 111 (100.0%) | 0 (0.0%) |
| 65 to 74 Years | 23 (100.0%) | 0 (0.0%) |
| 75 Years and older | 54 (100.0%) | 0 (0.0%) |
| Total | 585 (93.1%) | 43 (6.9%) |
Health Insurance Coverage by Citizenship Status in Pennington
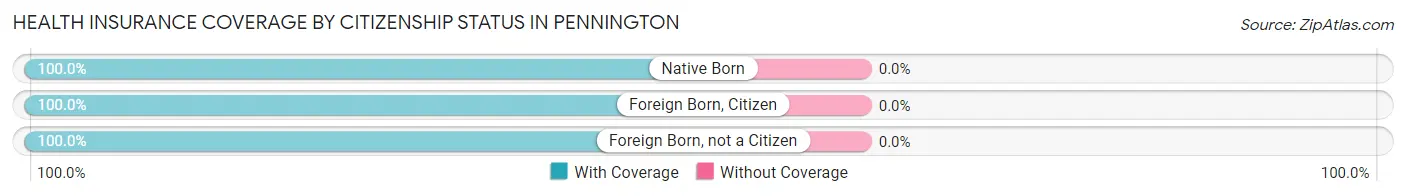
| Citizenship Status | With Coverage | Without Coverage |
| Native Born | 91 (100.0%) | 0 (0.0%) |
| Foreign Born, Citizen | 108 (100.0%) | 0 (0.0%) |
| Foreign Born, not a Citizen | 23 (100.0%) | 0 (0.0%) |
Health Insurance Coverage by Household Income in Pennington
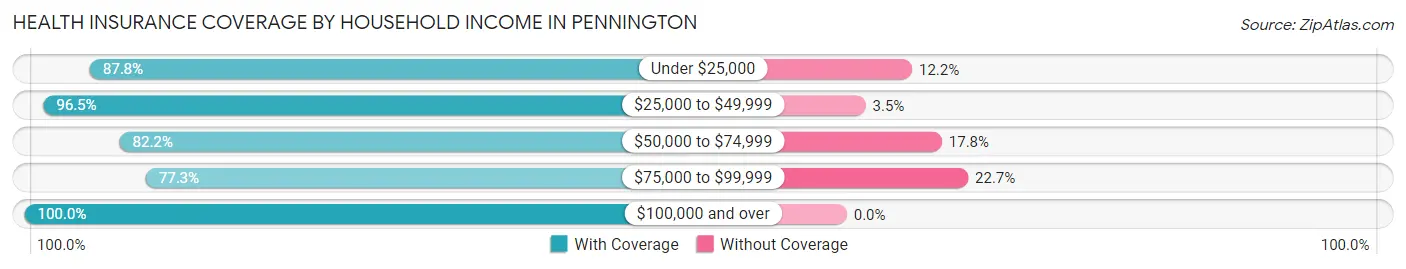
| Household Income | With Coverage | Without Coverage |
| Under $25,000 | 122 (87.8%) | 17 (12.2%) |
| $25,000 to $49,999 | 219 (96.5%) | 8 (3.5%) |
| $50,000 to $74,999 | 60 (82.2%) | 13 (17.8%) |
| $75,000 to $99,999 | 17 (77.3%) | 5 (22.7%) |
| $100,000 and over | 167 (100.0%) | 0 (0.0%) |
Public vs Private Health Insurance Coverage by Age in Pennington
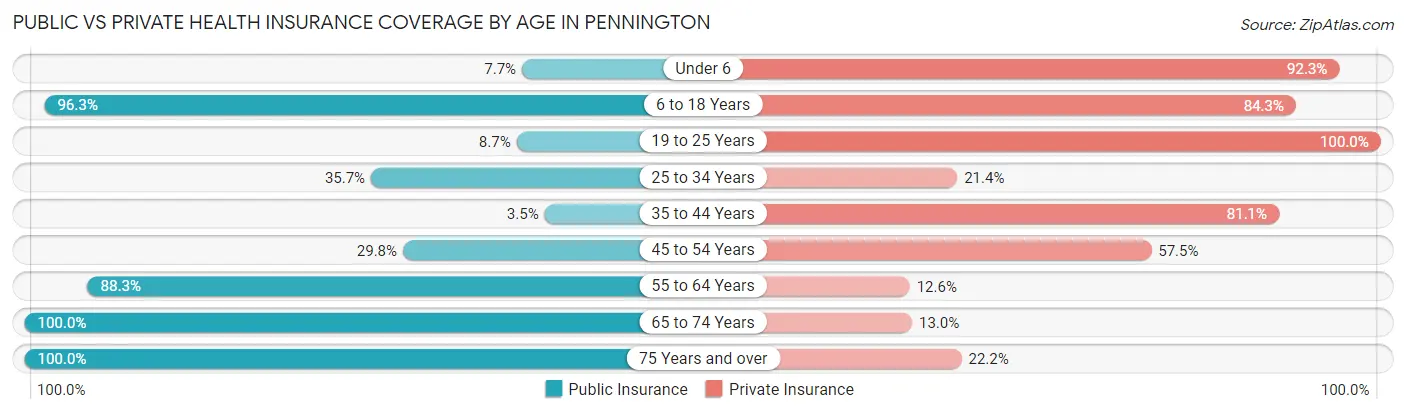
| Age Bracket | Public Insurance | Private Insurance |
| Under 6 | 7 (7.7%) | 84 (92.3%) |
| 6 to 18 Years | 104 (96.3%) | 91 (84.3%) |
| 19 to 25 Years | 2 (8.7%) | 23 (100.0%) |
| 25 to 34 Years | 10 (35.7%) | 6 (21.4%) |
| 35 to 44 Years | 5 (3.5%) | 116 (81.1%) |
| 45 to 54 Years | 14 (29.8%) | 27 (57.5%) |
| 55 to 64 Years | 98 (88.3%) | 14 (12.6%) |
| 65 to 74 Years | 23 (100.0%) | 3 (13.0%) |
| 75 Years and over | 54 (100.0%) | 12 (22.2%) |
| Total | 317 (50.5%) | 376 (59.9%) |
Disability Status by Sex by Age in Pennington
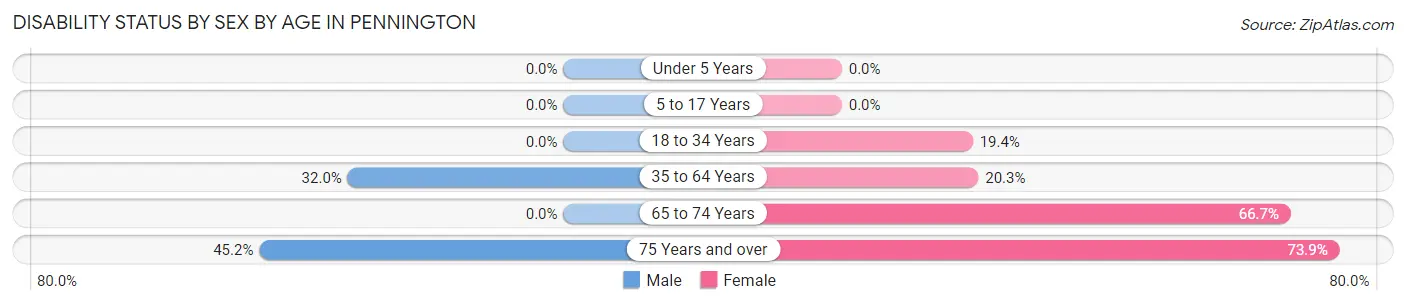
| Age Bracket | Male | Female |
| Under 5 Years | 0 (0.0%) | 0 (0.0%) |
| 5 to 17 Years | 0 (0.0%) | 0 (0.0%) |
| 18 to 34 Years | 0 (0.0%) | 7 (19.4%) |
| 35 to 64 Years | 49 (32.0%) | 30 (20.3%) |
| 65 to 74 Years | 0 (0.0%) | 14 (66.7%) |
| 75 Years and over | 14 (45.2%) | 17 (73.9%) |
Disability Class by Sex by Age in Pennington
Disability Class: Hearing Difficulty
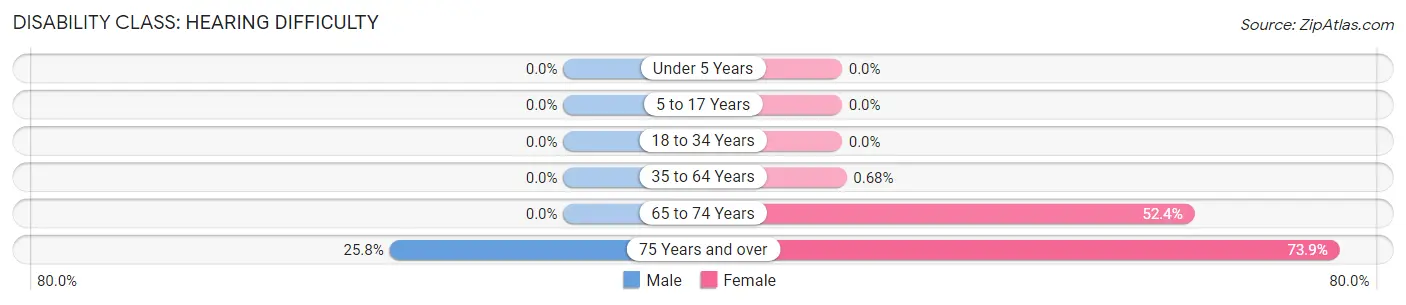
| Age Bracket | Male | Female |
| Under 5 Years | 0 (0.0%) | 0 (0.0%) |
| 5 to 17 Years | 0 (0.0%) | 0 (0.0%) |
| 18 to 34 Years | 0 (0.0%) | 0 (0.0%) |
| 35 to 64 Years | 0 (0.0%) | 1 (0.7%) |
| 65 to 74 Years | 0 (0.0%) | 11 (52.4%) |
| 75 Years and over | 8 (25.8%) | 17 (73.9%) |
Disability Class: Vision Difficulty
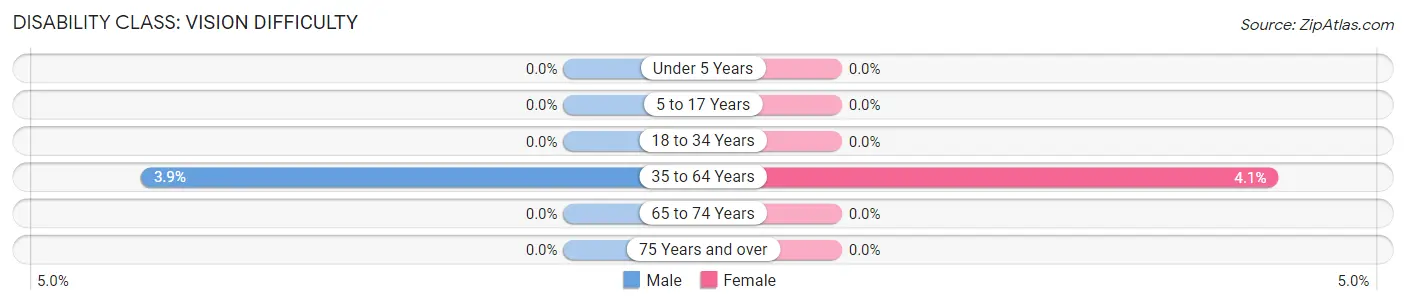
| Age Bracket | Male | Female |
| Under 5 Years | 0 (0.0%) | 0 (0.0%) |
| 5 to 17 Years | 0 (0.0%) | 0 (0.0%) |
| 18 to 34 Years | 0 (0.0%) | 0 (0.0%) |
| 35 to 64 Years | 6 (3.9%) | 6 (4.1%) |
| 65 to 74 Years | 0 (0.0%) | 0 (0.0%) |
| 75 Years and over | 0 (0.0%) | 0 (0.0%) |
Disability Class: Cognitive Difficulty
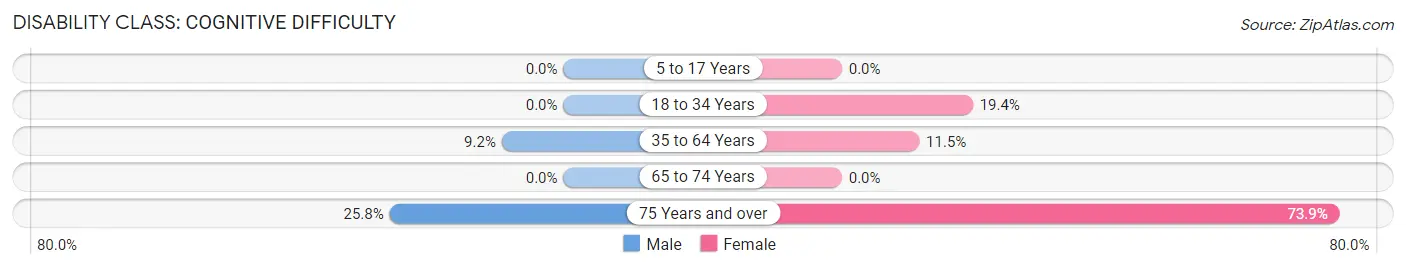
| Age Bracket | Male | Female |
| 5 to 17 Years | 0 (0.0%) | 0 (0.0%) |
| 18 to 34 Years | 0 (0.0%) | 7 (19.4%) |
| 35 to 64 Years | 14 (9.1%) | 17 (11.5%) |
| 65 to 74 Years | 0 (0.0%) | 0 (0.0%) |
| 75 Years and over | 8 (25.8%) | 17 (73.9%) |
Disability Class: Ambulatory Difficulty
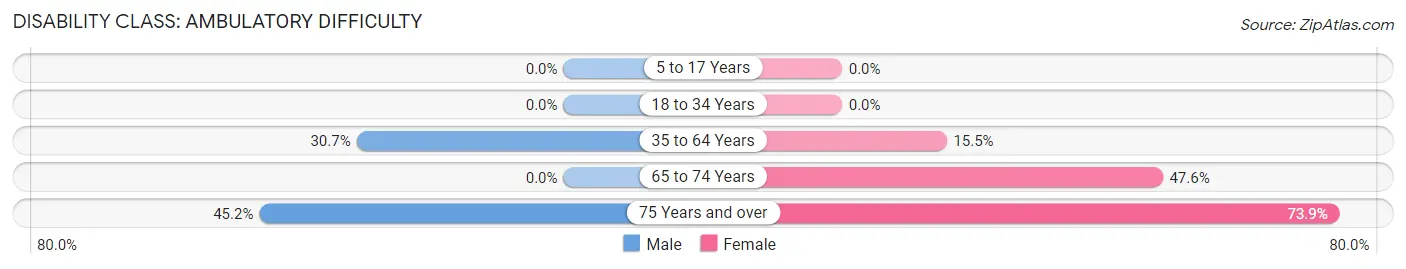
| Age Bracket | Male | Female |
| 5 to 17 Years | 0 (0.0%) | 0 (0.0%) |
| 18 to 34 Years | 0 (0.0%) | 0 (0.0%) |
| 35 to 64 Years | 47 (30.7%) | 23 (15.5%) |
| 65 to 74 Years | 0 (0.0%) | 10 (47.6%) |
| 75 Years and over | 14 (45.2%) | 17 (73.9%) |
Disability Class: Self-Care Difficulty
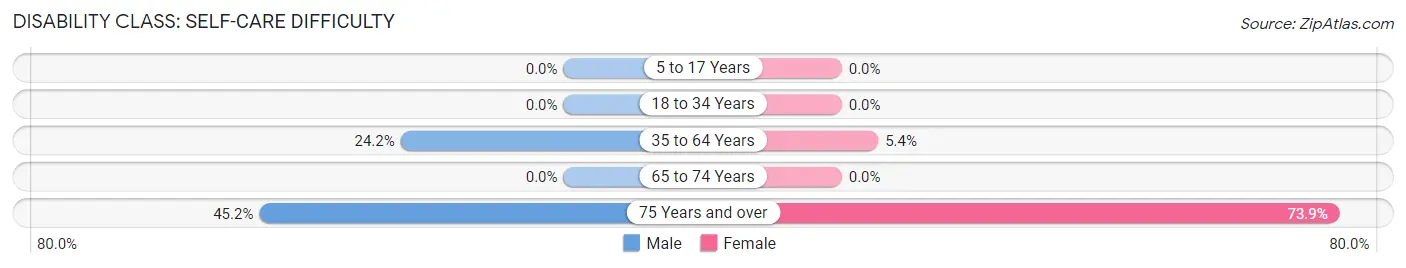
| Age Bracket | Male | Female |
| 5 to 17 Years | 0 (0.0%) | 0 (0.0%) |
| 18 to 34 Years | 0 (0.0%) | 0 (0.0%) |
| 35 to 64 Years | 37 (24.2%) | 8 (5.4%) |
| 65 to 74 Years | 0 (0.0%) | 0 (0.0%) |
| 75 Years and over | 14 (45.2%) | 17 (73.9%) |
Technology Access in Pennington
Computing Device Access in Pennington
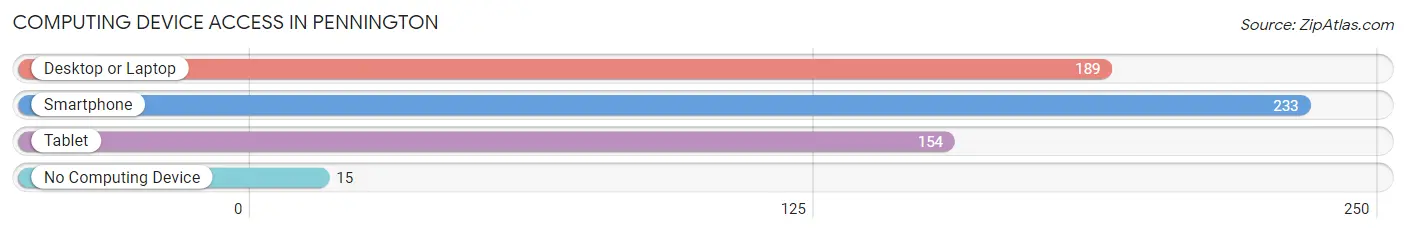
| Device Type | # Households | % Households |
| Desktop or Laptop | 189 | 74.4% |
| Smartphone | 233 | 91.7% |
| Tablet | 154 | 60.6% |
| No Computing Device | 15 | 5.9% |
| Total | 254 | 100.0% |
Internet Access in Pennington
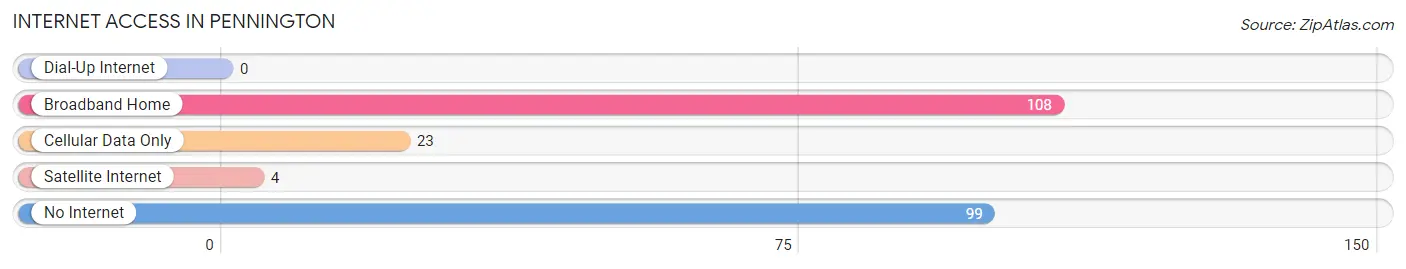
| Internet Type | # Households | % Households |
| Dial-Up Internet | 0 | 0.0% |
| Broadband Home | 108 | 42.5% |
| Cellular Data Only | 23 | 9.1% |
| Satellite Internet | 4 | 1.6% |
| No Internet | 99 | 39.0% |
| Total | 254 | 100.0% |
Pennington Summary
Pennington, Alabama is a small town located in the northwest corner of the state, near the Mississippi border. It is part of the Mobile metropolitan area and is home to a population of just over 1,000 people. The town was founded in 1819 and has a rich history that is still evident today.
Geography
Pennington is located in the northwest corner of Alabama, near the Mississippi border. It is situated in the Mobile metropolitan area and is part of the Mobile-Daphne-Fairhope Combined Statistical Area. The town is located in Washington County and is bordered by the towns of Chatom, Millry, and Fruitdale. The town is situated on the banks of the Tombigbee River and is surrounded by rolling hills and forests.
Economy
The economy of Pennington is largely based on agriculture and forestry. The town is home to several farms and timber companies, as well as a few small businesses. The town is also home to a few manufacturing companies, including a paper mill and a furniture factory. The town is also home to a few restaurants and stores, as well as a few small businesses.
Demographics
As of the 2010 census, Pennington had a population of 1,072 people. The population is largely white, with a small African American population. The median household income is $31,250, and the median age is 38. The town is home to a few churches, including the First Baptist Church of Pennington.
History
Pennington was founded in 1819 by settlers from Georgia and South Carolina. The town was named after the Pennington family, who were among the first settlers. The town was originally a farming community, but it soon became a center for timber production. The town was also home to a few small businesses, including a sawmill and a gristmill.
In the late 19th century, the town began to grow and develop. The town was home to a few stores, a post office, and a few churches. The town was also home to a few schools, including a high school. The town was also home to a few manufacturing companies, including a paper mill and a furniture factory.
In the early 20th century, the town began to decline. The timber industry began to decline, and the town's population began to decline. The town was also hit hard by the Great Depression, and many of the town's businesses closed. The town's population continued to decline until the late 20th century, when the town began to experience a resurgence. The town is now home to a few small businesses, as well as a few restaurants and stores.
Pennington is a small town with a rich history and a bright future. The town is home to a few small businesses, as well as a few churches and schools. The town is also home to a few manufacturing companies, as well as a few restaurants and stores. The town is also home to a few farms and timber companies, as well as a few small businesses. The town is also home to a few churches, including the First Baptist Church of Pennington. The town is also home to a few schools, including a high school. The town is also home to a few manufacturing companies, including a paper mill and a furniture factory. The town is also home to a few restaurants and stores, as well as a few small businesses. The town is also home to a few farms and timber companies, as well as a few small businesses. The town is also home to a few churches, including the First Baptist Church of Pennington. The town is also home to a few schools, including a high school. The town is also home to a few manufacturing companies, including a paper mill and a furniture factory. The town is also home to a few restaurants and stores, as well as a few small businesses.
Common Questions
What is Per Capita Income in Pennington?
Per Capita income in Pennington is $21,100.
What is the Median Family Income in Pennington?
Median Family Income in Pennington is $40,156.
What is the Median Household income in Pennington?
Median Household Income in Pennington is $28,362.
What is Income or Wage Gap in Pennington?
Income or Wage Gap in Pennington is 51.9%.
Women in Pennington earn 48.1 cents for every dollar earned by a man.
What is Inequality or Gini Index in Pennington?
Inequality or Gini Index in Pennington is 0.48.
What is the Total Population of Pennington?
Total Population of Pennington is 628.
What is the Total Male Population of Pennington?
Total Male Population of Pennington is 249.
What is the Total Female Population of Pennington?
Total Female Population of Pennington is 379.
What is the Ratio of Males per 100 Females in Pennington?
There are 65.70 Males per 100 Females in Pennington.
What is the Ratio of Females per 100 Males in Pennington?
There are 152.21 Females per 100 Males in Pennington.
What is the Median Population Age in Pennington?
Median Population Age in Pennington is 38.8 Years.
What is the Average Family Size in Pennington
Average Family Size in Pennington is 3.4 People.
What is the Average Household Size in Pennington
Average Household Size in Pennington is 2.5 People.
How Large is the Labor Force in Pennington?
There are 202 People in the Labor Forcein in Pennington.
What is the Percentage of People in the Labor Force in Pennington?
42.3% of People are in the Labor Force in Pennington.
What is the Unemployment Rate in Pennington?
Unemployment Rate in Pennington is 8.4%.