Forest Lake, MN Map & Demographics
Forest Lake Map
Forest Lake Overview
$44,179
PER CAPITA INCOME
$115,608
AVG FAMILY INCOME
$91,157
AVG HOUSEHOLD INCOME
21.0%
WAGE / INCOME GAP [ % ]
79.0¢/ $1
WAGE / INCOME GAP [ $ ]
0.39
INEQUALITY / GINI INDEX
20,553
TOTAL POPULATION
9,922
MALE POPULATION
10,631
FEMALE POPULATION
93.33
MALES / 100 FEMALES
107.15
FEMALES / 100 MALES
37.9
MEDIAN AGE
3.1
AVG FAMILY SIZE
2.5
AVG HOUSEHOLD SIZE
11,960
LABOR FORCE [ PEOPLE ]
73.4%
PERCENT IN LABOR FORCE
4.5%
UNEMPLOYMENT RATE
Forest Lake Zip Codes
Forest Lake Area Codes
Income in Forest Lake
Income Overview in Forest Lake
Per Capita Income in Forest Lake is $44,179, while median incomes of families and households are $115,608 and $91,157 respectively.
| Characteristic | Number | Measure |
| Per Capita Income | 20,553 | $44,179 |
| Median Family Income | 5,454 | $115,608 |
| Mean Family Income | 5,454 | $133,419 |
| Median Household Income | 8,051 | $91,157 |
| Mean Household Income | 8,051 | $111,624 |
| Income Deficit | 5,454 | $0 |
| Wage / Income Gap (%) | 20,553 | 20.98% |
| Wage / Income Gap ($) | 20,553 | 79.02¢ per $1 |
| Gini / Inequality Index | 20,553 | 0.39 |
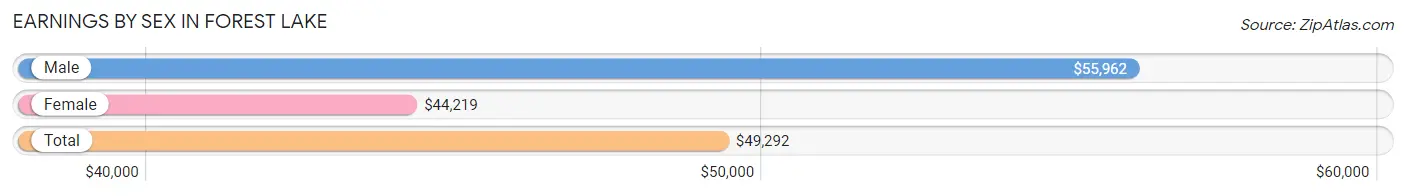
Earnings by Sex in Forest Lake
Average Earnings in Forest Lake are $49,292, $55,962 for men and $44,219 for women, a difference of 21.0%.
| Sex | Number | Average Earnings |
| Male | 6,188 (50.4%) | $55,962 |
| Female | 6,094 (49.6%) | $44,219 |
| Total | 12,282 (100.0%) | $49,292 |
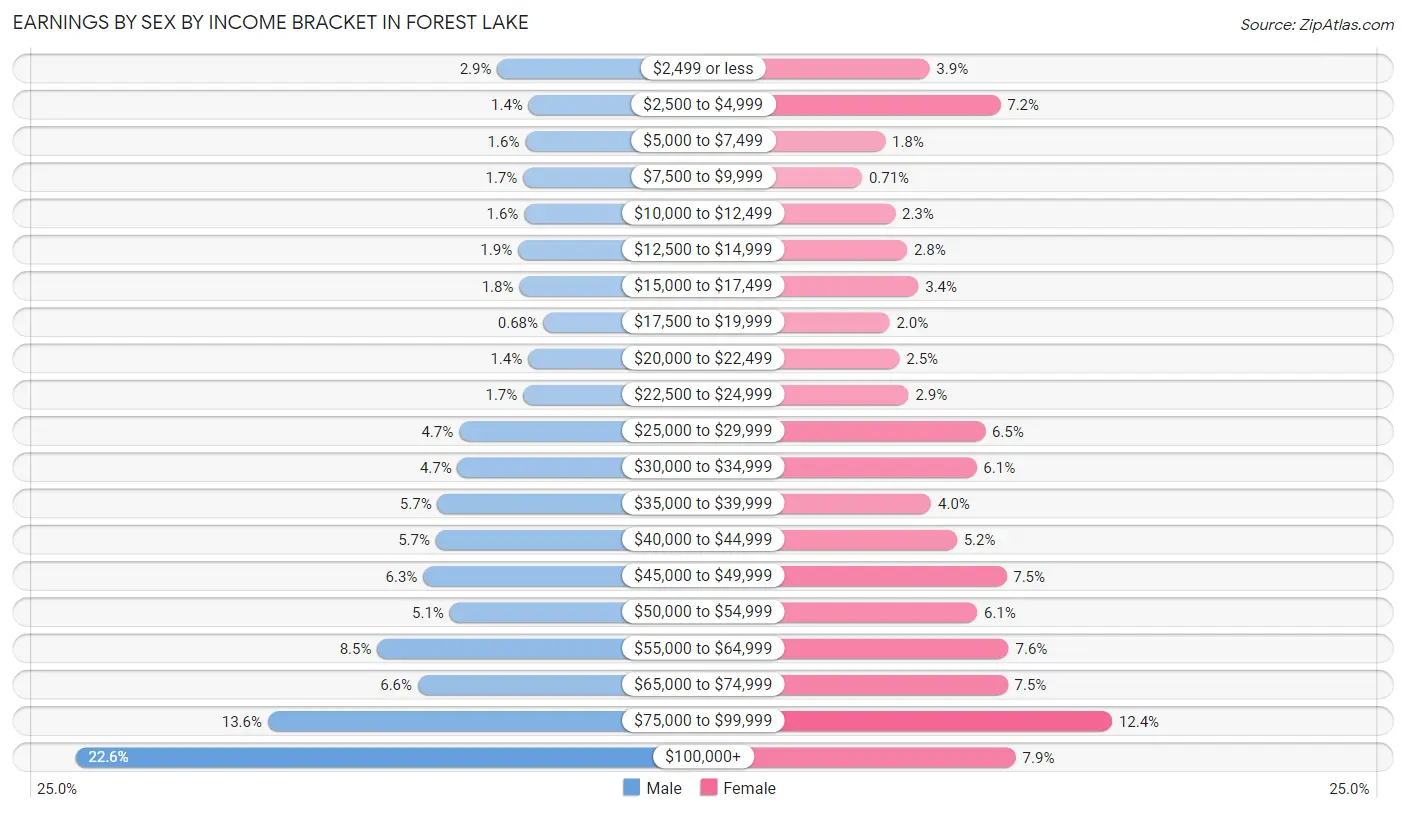
Earnings by Sex by Income Bracket in Forest Lake
The most common earnings brackets in Forest Lake are $100,000+ for men (1,400 | 22.6%) and $75,000 to $99,999 for women (757 | 12.4%).
| Income | Male | Female |
| $2,499 or less | 177 (2.9%) | 236 (3.9%) |
| $2,500 to $4,999 | 86 (1.4%) | 438 (7.2%) |
| $5,000 to $7,499 | 96 (1.5%) | 109 (1.8%) |
| $7,500 to $9,999 | 102 (1.7%) | 43 (0.7%) |
| $10,000 to $12,499 | 99 (1.6%) | 138 (2.3%) |
| $12,500 to $14,999 | 117 (1.9%) | 172 (2.8%) |
| $15,000 to $17,499 | 113 (1.8%) | 204 (3.4%) |
| $17,500 to $19,999 | 42 (0.7%) | 122 (2.0%) |
| $20,000 to $22,499 | 88 (1.4%) | 150 (2.5%) |
| $22,500 to $24,999 | 102 (1.7%) | 176 (2.9%) |
| $25,000 to $29,999 | 288 (4.6%) | 394 (6.5%) |
| $30,000 to $34,999 | 292 (4.7%) | 370 (6.1%) |
| $35,000 to $39,999 | 350 (5.7%) | 241 (4.0%) |
| $40,000 to $44,999 | 355 (5.7%) | 314 (5.1%) |
| $45,000 to $49,999 | 392 (6.3%) | 455 (7.5%) |
| $50,000 to $54,999 | 315 (5.1%) | 372 (6.1%) |
| $55,000 to $64,999 | 525 (8.5%) | 462 (7.6%) |
| $65,000 to $74,999 | 407 (6.6%) | 459 (7.5%) |
| $75,000 to $99,999 | 842 (13.6%) | 757 (12.4%) |
| $100,000+ | 1,400 (22.6%) | 482 (7.9%) |
| Total | 6,188 (100.0%) | 6,094 (100.0%) |
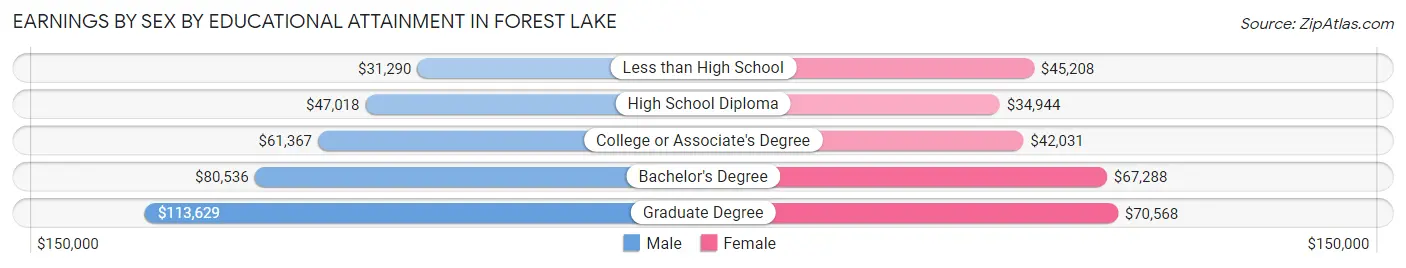
Earnings by Sex by Educational Attainment in Forest Lake
Average earnings in Forest Lake are $62,774 for men and $49,262 for women, a difference of 21.5%. Men with an educational attainment of graduate degree enjoy the highest average annual earnings of $113,629, while those with less than high school education earn the least with $31,290. Women with an educational attainment of graduate degree earn the most with the average annual earnings of $70,568, while those with high school diploma education have the smallest earnings of $34,944.
| Educational Attainment | Male Income | Female Income |
| Less than High School | $31,290 | $45,208 |
| High School Diploma | $47,018 | $34,944 |
| College or Associate's Degree | $61,367 | $42,031 |
| Bachelor's Degree | $80,536 | $67,288 |
| Graduate Degree | $113,629 | $70,568 |
| Total | $62,774 | $49,262 |
Family Income in Forest Lake
Family Income Brackets in Forest Lake
According to the Forest Lake family income data, there are 1,533 families falling into the $100,000 to $149,999 income range, which is the most common income bracket and makes up 28.1% of all families. Conversely, the $10,000 to $14,999 income bracket is the least frequent group with only 22 families (0.4%) belonging to this category.
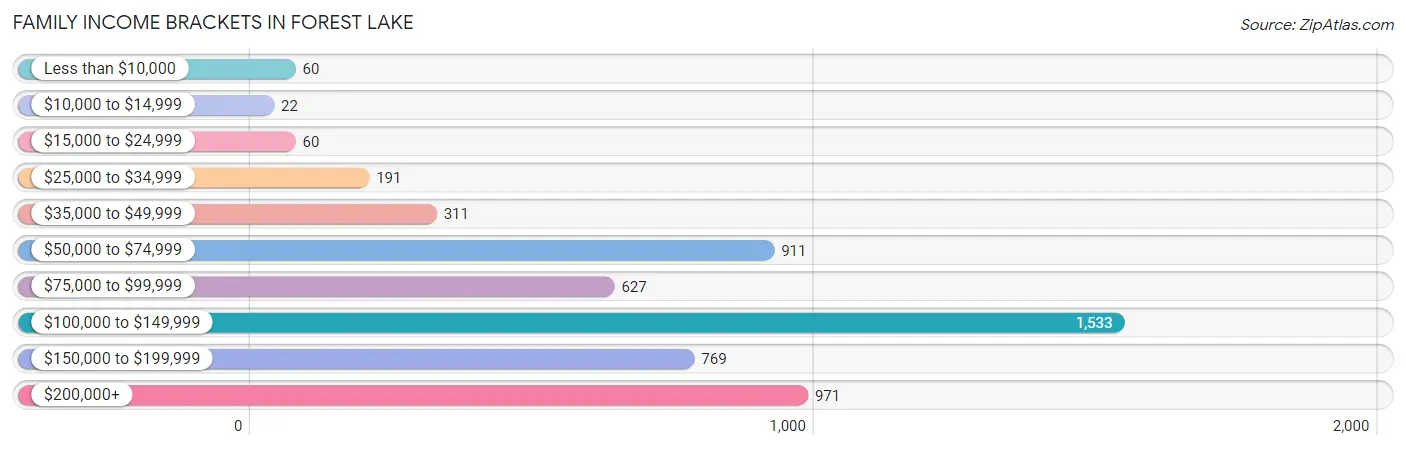
| Income Bracket | # Families | % Families |
| Less than $10,000 | 60 | 1.1% |
| $10,000 to $14,999 | 22 | 0.4% |
| $15,000 to $24,999 | 60 | 1.1% |
| $25,000 to $34,999 | 191 | 3.5% |
| $35,000 to $49,999 | 311 | 5.7% |
| $50,000 to $74,999 | 911 | 16.7% |
| $75,000 to $99,999 | 627 | 11.5% |
| $100,000 to $149,999 | 1,533 | 28.1% |
| $150,000 to $199,999 | 769 | 14.1% |
| $200,000+ | 971 | 17.8% |
Family Income by Famaliy Size in Forest Lake
4-person families (1,005 | 18.4%) account for the highest median family income in Forest Lake with $146,601 per family, while 2-person families (2,499 | 45.8%) have the highest median income of $49,188 per family member.
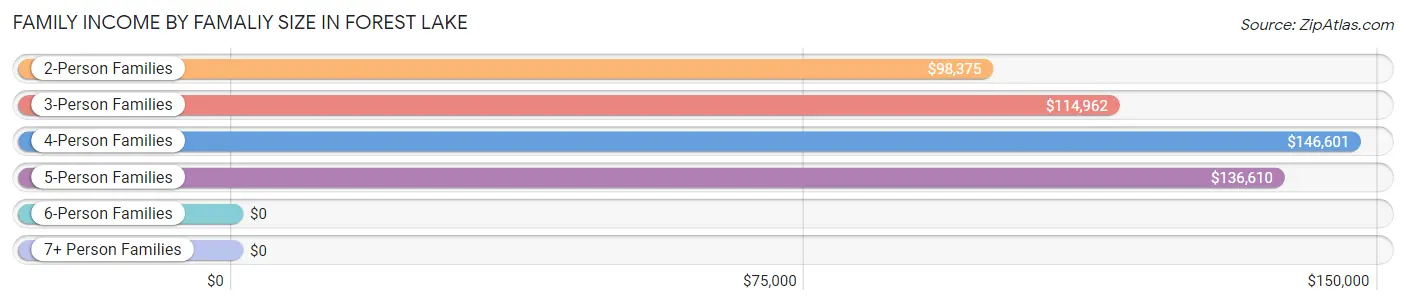
| Income Bracket | # Families | Median Income |
| 2-Person Families | 2,499 (45.8%) | $98,375 |
| 3-Person Families | 1,187 (21.8%) | $114,962 |
| 4-Person Families | 1,005 (18.4%) | $146,601 |
| 5-Person Families | 590 (10.8%) | $136,610 |
| 6-Person Families | 161 (2.9%) | $0 |
| 7+ Person Families | 12 (0.2%) | $0 |
| Total | 5,454 (100.0%) | $115,608 |
Family Income by Number of Earners in Forest Lake
The median family income in Forest Lake is $115,608, with families comprising 3+ earners (814) having the highest median family income of $190,833, while families with 1 earner (1,186) have the lowest median family income of $61,102, accounting for 14.9% and 21.7% of families, respectively.
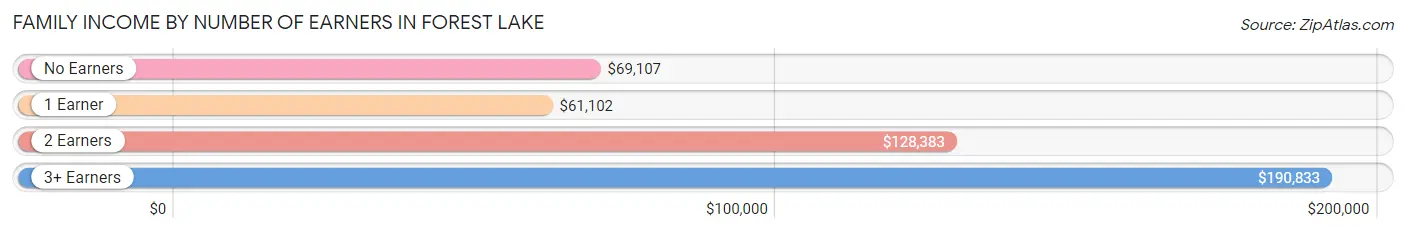
| Number of Earners | # Families | Median Income |
| No Earners | 669 (12.3%) | $69,107 |
| 1 Earner | 1,186 (21.7%) | $61,102 |
| 2 Earners | 2,785 (51.1%) | $128,383 |
| 3+ Earners | 814 (14.9%) | $190,833 |
| Total | 5,454 (100.0%) | $115,608 |
Household Income in Forest Lake
Household Income Brackets in Forest Lake
With 1,852 households falling in the category, the $100,000 to $149,999 income range is the most frequent in Forest Lake, accounting for 23.0% of all households. In contrast, only 193 households (2.4%) fall into the $10,000 to $14,999 income bracket, making it the least populous group.
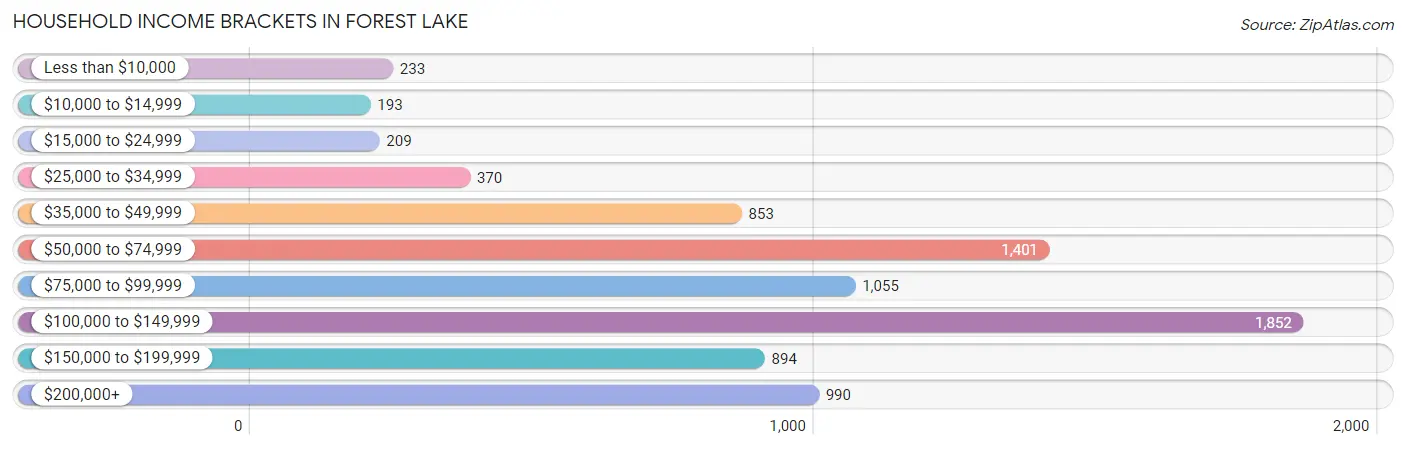
| Income Bracket | # Households | % Households |
| Less than $10,000 | 233 | 2.9% |
| $10,000 to $14,999 | 193 | 2.4% |
| $15,000 to $24,999 | 209 | 2.6% |
| $25,000 to $34,999 | 370 | 4.6% |
| $35,000 to $49,999 | 853 | 10.6% |
| $50,000 to $74,999 | 1,401 | 17.4% |
| $75,000 to $99,999 | 1,055 | 13.1% |
| $100,000 to $149,999 | 1,852 | 23.0% |
| $150,000 to $199,999 | 894 | 11.1% |
| $200,000+ | 990 | 12.3% |
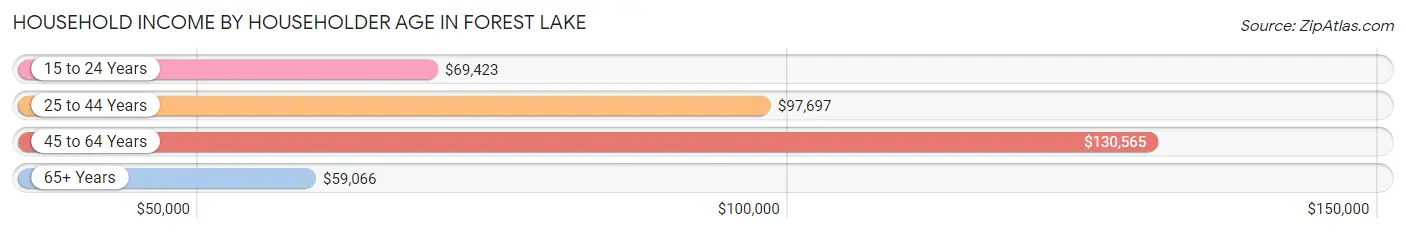
Household Income by Householder Age in Forest Lake
The median household income in Forest Lake is $91,157, with the highest median household income of $130,565 found in the 45 to 64 years age bracket for the primary householder. A total of 2,803 households (34.8%) fall into this category. Meanwhile, the 65+ years age bracket for the primary householder has the lowest median household income of $59,066, with 2,188 households (27.2%) in this group.
| Income Bracket | # Households | Median Income |
| 15 to 24 Years | 294 (3.6%) | $69,423 |
| 25 to 44 Years | 2,766 (34.4%) | $97,697 |
| 45 to 64 Years | 2,803 (34.8%) | $130,565 |
| 65+ Years | 2,188 (27.2%) | $59,066 |
| Total | 8,051 (100.0%) | $91,157 |
Poverty in Forest Lake
Income Below Poverty by Sex and Age in Forest Lake
With 6.7% poverty level for males and 5.9% for females among the residents of Forest Lake, 75 year old and over males and 12 to 14 year old females are the most vulnerable to poverty, with 71 males (16.6%) and 72 females (22.7%) in their respective age groups living below the poverty level.
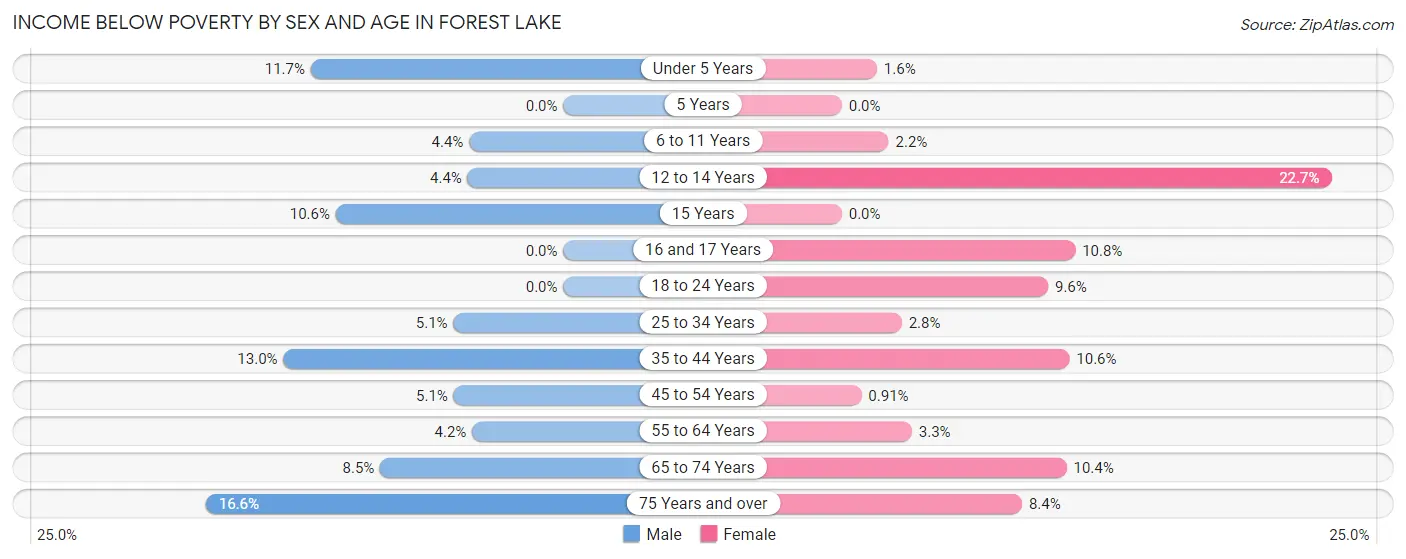
| Age Bracket | Male | Female |
| Under 5 Years | 79 (11.7%) | 10 (1.6%) |
| 5 Years | 0 (0.0%) | 0 (0.0%) |
| 6 to 11 Years | 31 (4.4%) | 22 (2.2%) |
| 12 to 14 Years | 16 (4.4%) | 72 (22.7%) |
| 15 Years | 15 (10.6%) | 0 (0.0%) |
| 16 and 17 Years | 0 (0.0%) | 38 (10.8%) |
| 18 to 24 Years | 0 (0.0%) | 93 (9.6%) |
| 25 to 34 Years | 79 (5.1%) | 39 (2.8%) |
| 35 to 44 Years | 168 (13.0%) | 124 (10.6%) |
| 45 to 54 Years | 63 (5.1%) | 13 (0.9%) |
| 55 to 64 Years | 58 (4.2%) | 38 (3.3%) |
| 65 to 74 Years | 75 (8.5%) | 104 (10.4%) |
| 75 Years and over | 71 (16.6%) | 72 (8.4%) |
| Total | 655 (6.7%) | 625 (5.9%) |
Income Above Poverty by Sex and Age in Forest Lake
According to the poverty statistics in Forest Lake, males aged 5 years and females aged 5 years are the age groups that are most secure financially, with 100.0% of males and 100.0% of females in these age groups living above the poverty line.
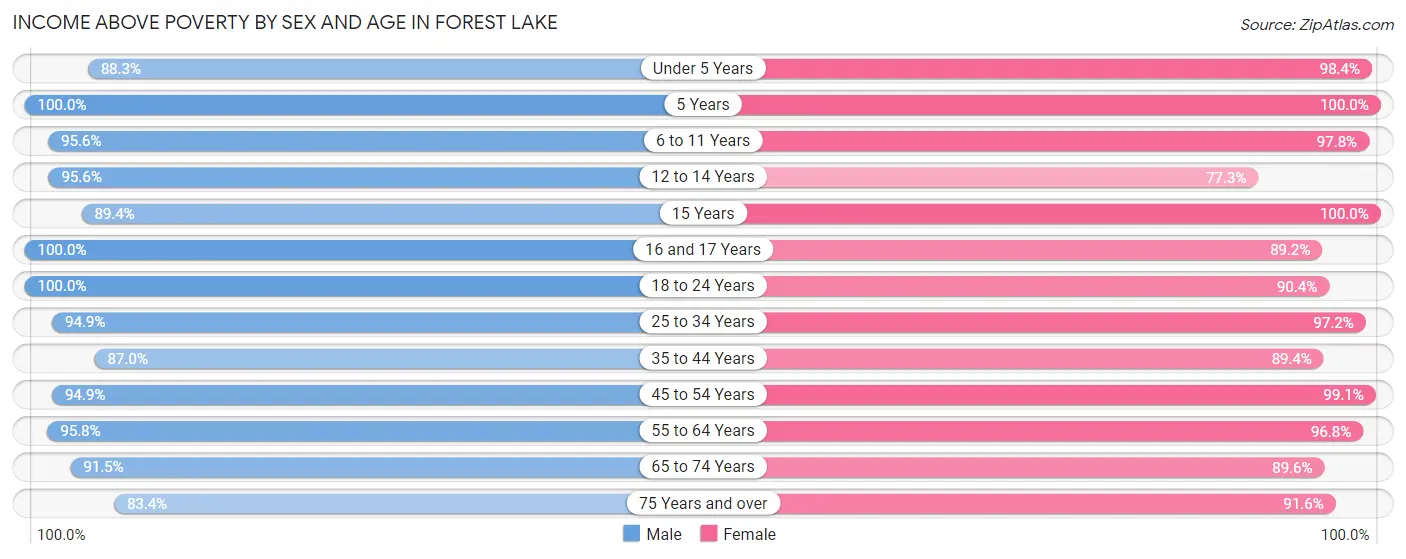
| Age Bracket | Male | Female |
| Under 5 Years | 595 (88.3%) | 605 (98.4%) |
| 5 Years | 95 (100.0%) | 89 (100.0%) |
| 6 to 11 Years | 678 (95.6%) | 993 (97.8%) |
| 12 to 14 Years | 344 (95.6%) | 245 (77.3%) |
| 15 Years | 127 (89.4%) | 162 (100.0%) |
| 16 and 17 Years | 318 (100.0%) | 313 (89.2%) |
| 18 to 24 Years | 765 (100.0%) | 879 (90.4%) |
| 25 to 34 Years | 1,470 (94.9%) | 1,362 (97.2%) |
| 35 to 44 Years | 1,125 (87.0%) | 1,050 (89.4%) |
| 45 to 54 Years | 1,174 (94.9%) | 1,417 (99.1%) |
| 55 to 64 Years | 1,314 (95.8%) | 1,131 (96.8%) |
| 65 to 74 Years | 807 (91.5%) | 893 (89.6%) |
| 75 Years and over | 357 (83.4%) | 789 (91.6%) |
| Total | 9,169 (93.3%) | 9,928 (94.1%) |
Income Below Poverty Among Married-Couple Families in Forest Lake
The poverty statistics for married-couple families in Forest Lake show that 4.4% or 188 of the total 4,274 families live below the poverty line. Families with 3 or 4 children have the highest poverty rate of 19.0%, comprising of 99 families. On the other hand, families with 5 or more children have the lowest poverty rate of 0.0%, which includes 0 families.
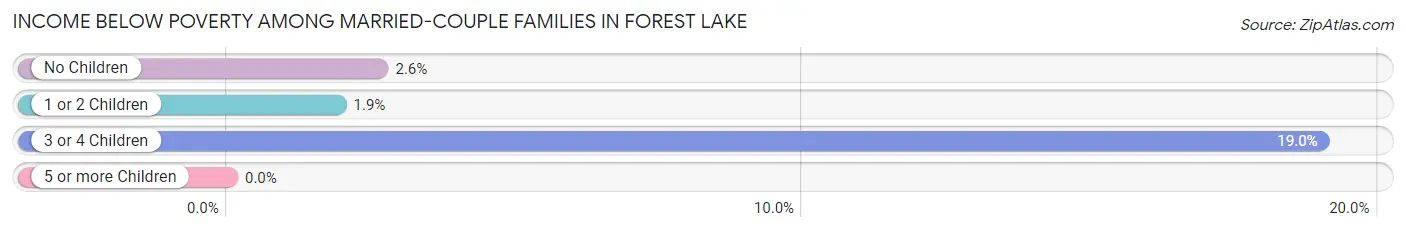
| Children | Above Poverty | Below Poverty |
| No Children | 2,457 (97.4%) | 66 (2.6%) |
| 1 or 2 Children | 1,195 (98.1%) | 23 (1.9%) |
| 3 or 4 Children | 422 (81.0%) | 99 (19.0%) |
| 5 or more Children | 12 (100.0%) | 0 (0.0%) |
| Total | 4,086 (95.6%) | 188 (4.4%) |
Income Below Poverty Among Single-Parent Households in Forest Lake
According to the poverty data in Forest Lake, 7.5% or 26 single-father households and 0.8% or 7 single-mother households are living below the poverty line. Among single-father households, those with no children have the highest poverty rate, with 15 households (8.5%) experiencing poverty. Likewise, among single-mother households, those with 1 or 2 children have the highest poverty rate, with 7 households (1.7%) falling below the poverty line.
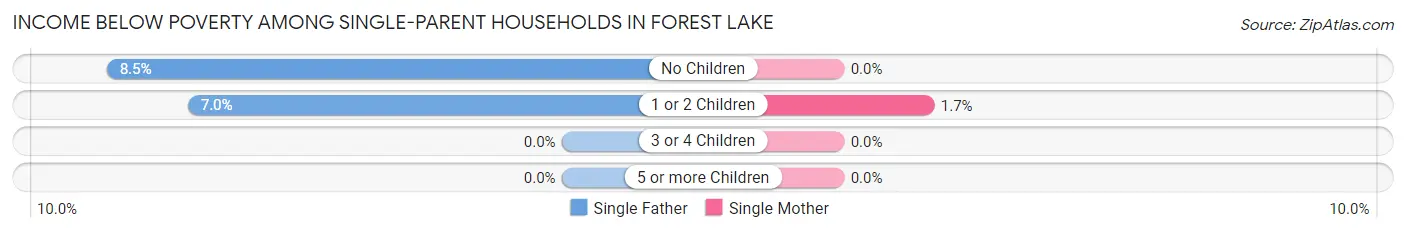
| Children | Single Father | Single Mother |
| No Children | 15 (8.5%) | 0 (0.0%) |
| 1 or 2 Children | 11 (7.0%) | 7 (1.7%) |
| 3 or 4 Children | 0 (0.0%) | 0 (0.0%) |
| 5 or more Children | 0 (0.0%) | 0 (0.0%) |
| Total | 26 (7.5%) | 7 (0.8%) |
Income Below Poverty Among Married-Couple vs Single-Parent Households in Forest Lake
The poverty data for Forest Lake shows that 188 of the married-couple family households (4.4%) and 33 of the single-parent households (2.8%) are living below the poverty level. Within the married-couple family households, those with 3 or 4 children have the highest poverty rate, with 99 households (19.0%) falling below the poverty line. Among the single-parent households, those with 1 or 2 children have the highest poverty rate, with 18 household (3.1%) living below poverty.
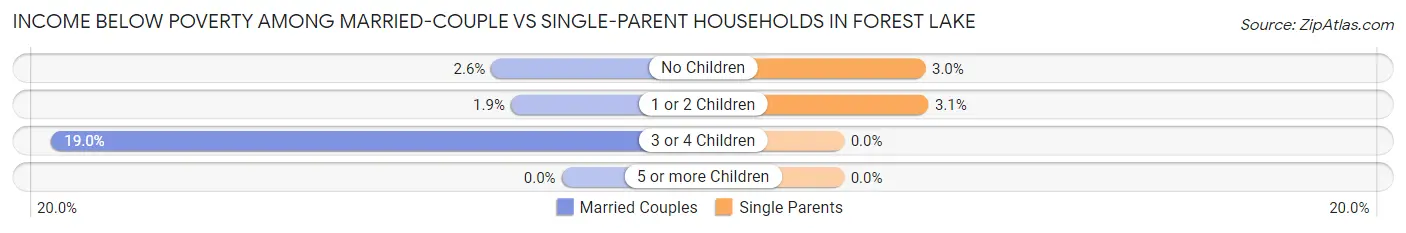
| Children | Married-Couple Families | Single-Parent Households |
| No Children | 66 (2.6%) | 15 (3.0%) |
| 1 or 2 Children | 23 (1.9%) | 18 (3.1%) |
| 3 or 4 Children | 99 (19.0%) | 0 (0.0%) |
| 5 or more Children | 0 (0.0%) | 0 (0.0%) |
| Total | 188 (4.4%) | 33 (2.8%) |
Race in Forest Lake
The most populous races in Forest Lake are White / Caucasian (17,481 | 85.1%), Two or more Races (1,307 | 6.4%), and Hispanic or Latino (1,222 | 5.9%).
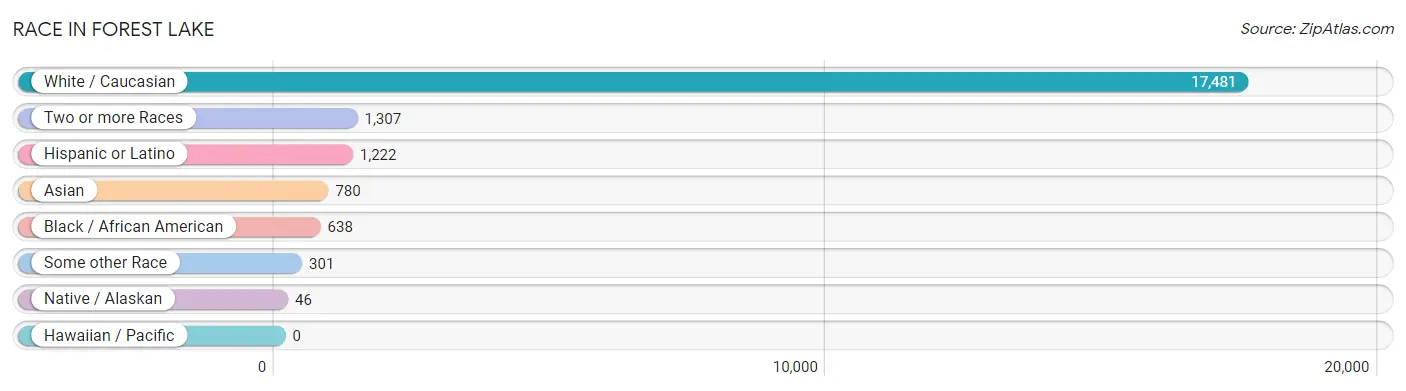
| Race | # Population | % Population |
| Asian | 780 | 3.8% |
| Black / African American | 638 | 3.1% |
| Hawaiian / Pacific | 0 | 0.0% |
| Hispanic or Latino | 1,222 | 5.9% |
| Native / Alaskan | 46 | 0.2% |
| White / Caucasian | 17,481 | 85.1% |
| Two or more Races | 1,307 | 6.4% |
| Some other Race | 301 | 1.5% |
| Total | 20,553 | 100.0% |
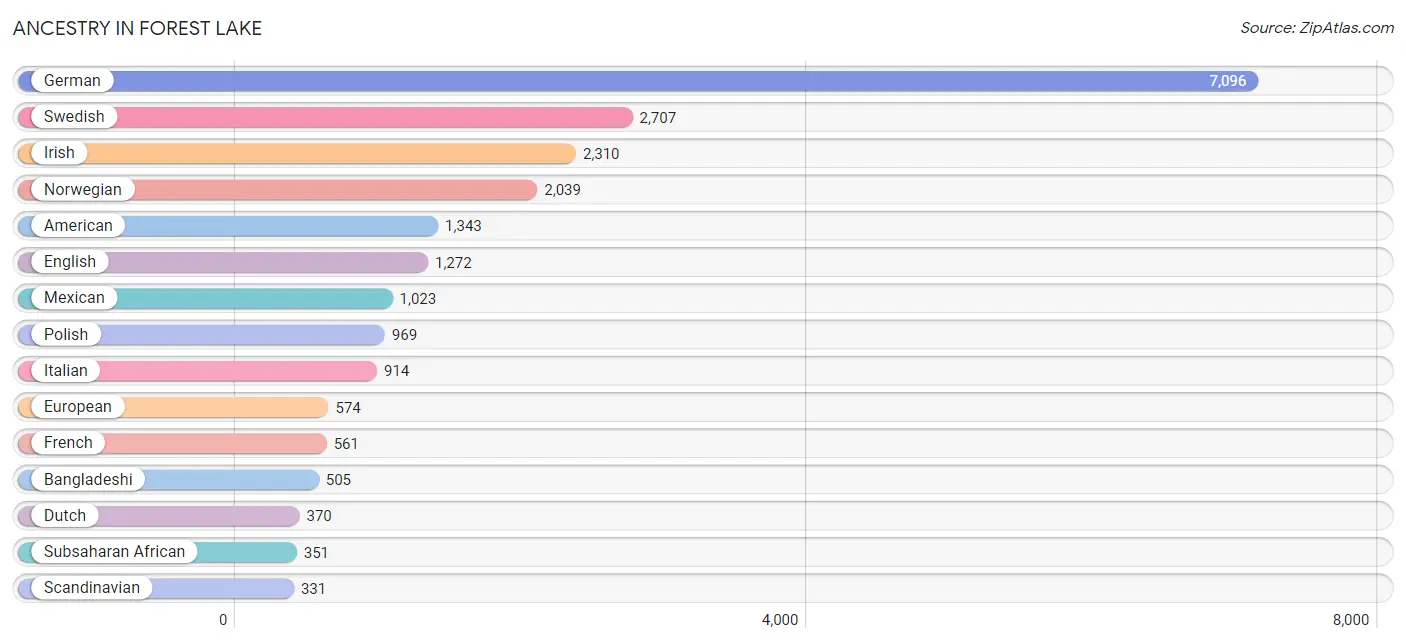
Ancestry in Forest Lake
The most populous ancestries reported in Forest Lake are German (7,096 | 34.5%), Swedish (2,707 | 13.2%), Irish (2,310 | 11.2%), Norwegian (2,039 | 9.9%), and American (1,343 | 6.5%), together accounting for 75.4% of all Forest Lake residents.
| Ancestry | # Population | % Population |
| African | 46 | 0.2% |
| American | 1,343 | 6.5% |
| Arab | 67 | 0.3% |
| Austrian | 45 | 0.2% |
| Bangladeshi | 505 | 2.5% |
| Belgian | 24 | 0.1% |
| Bhutanese | 22 | 0.1% |
| Blackfeet | 16 | 0.1% |
| British | 20 | 0.1% |
| Burmese | 119 | 0.6% |
| Central American | 150 | 0.7% |
| Central American Indian | 21 | 0.1% |
| Cherokee | 15 | 0.1% |
| Chippewa | 92 | 0.4% |
| Colombian | 14 | 0.1% |
| Cree | 8 | 0.0% |
| Croatian | 23 | 0.1% |
| Czech | 235 | 1.1% |
| Czechoslovakian | 59 | 0.3% |
| Danish | 138 | 0.7% |
| Dutch | 370 | 1.8% |
| Eastern European | 20 | 0.1% |
| Ecuadorian | 12 | 0.1% |
| English | 1,272 | 6.2% |
| Ethiopian | 305 | 1.5% |
| European | 574 | 2.8% |
| Filipino | 14 | 0.1% |
| Finnish | 165 | 0.8% |
| French | 561 | 2.7% |
| French Canadian | 324 | 1.6% |
| German | 7,096 | 34.5% |
| Greek | 23 | 0.1% |
| Guatemalan | 44 | 0.2% |
| Honduran | 22 | 0.1% |
| Hungarian | 8 | 0.0% |
| Indian (Asian) | 85 | 0.4% |
| Irish | 2,310 | 11.2% |
| Italian | 914 | 4.4% |
| Jamaican | 30 | 0.2% |
| Japanese | 27 | 0.1% |
| Lebanese | 67 | 0.3% |
| Lithuanian | 33 | 0.2% |
| Luxembourger | 5 | 0.0% |
| Mexican | 1,023 | 5.0% |
| Mexican American Indian | 168 | 0.8% |
| Northern European | 37 | 0.2% |
| Norwegian | 2,039 | 9.9% |
| Pakistani | 9 | 0.0% |
| Panamanian | 7 | 0.0% |
| Polish | 969 | 4.7% |
| Portuguese | 38 | 0.2% |
| Puerto Rican | 6 | 0.0% |
| Russian | 25 | 0.1% |
| Salvadoran | 77 | 0.4% |
| Scandinavian | 331 | 1.6% |
| Scotch-Irish | 56 | 0.3% |
| Scottish | 87 | 0.4% |
| Serbian | 13 | 0.1% |
| Slovene | 7 | 0.0% |
| South American | 26 | 0.1% |
| Spaniard | 17 | 0.1% |
| Subsaharan African | 351 | 1.7% |
| Swedish | 2,707 | 13.2% |
| Swiss | 91 | 0.4% |
| Thai | 32 | 0.2% |
| Trinidadian and Tobagonian | 11 | 0.1% |
| Turkish | 10 | 0.1% |
| Ukrainian | 5 | 0.0% |
| Welsh | 44 | 0.2% |
| Yugoslavian | 27 | 0.1% | View All 70 Rows |
Immigrants in Forest Lake
The most numerous immigrant groups reported in Forest Lake came from Central America (328 | 1.6%), Latin America (328 | 1.6%), Africa (308 | 1.5%), Mexico (248 | 1.2%), and Asia (215 | 1.1%), together accounting for 7.0% of all Forest Lake residents.
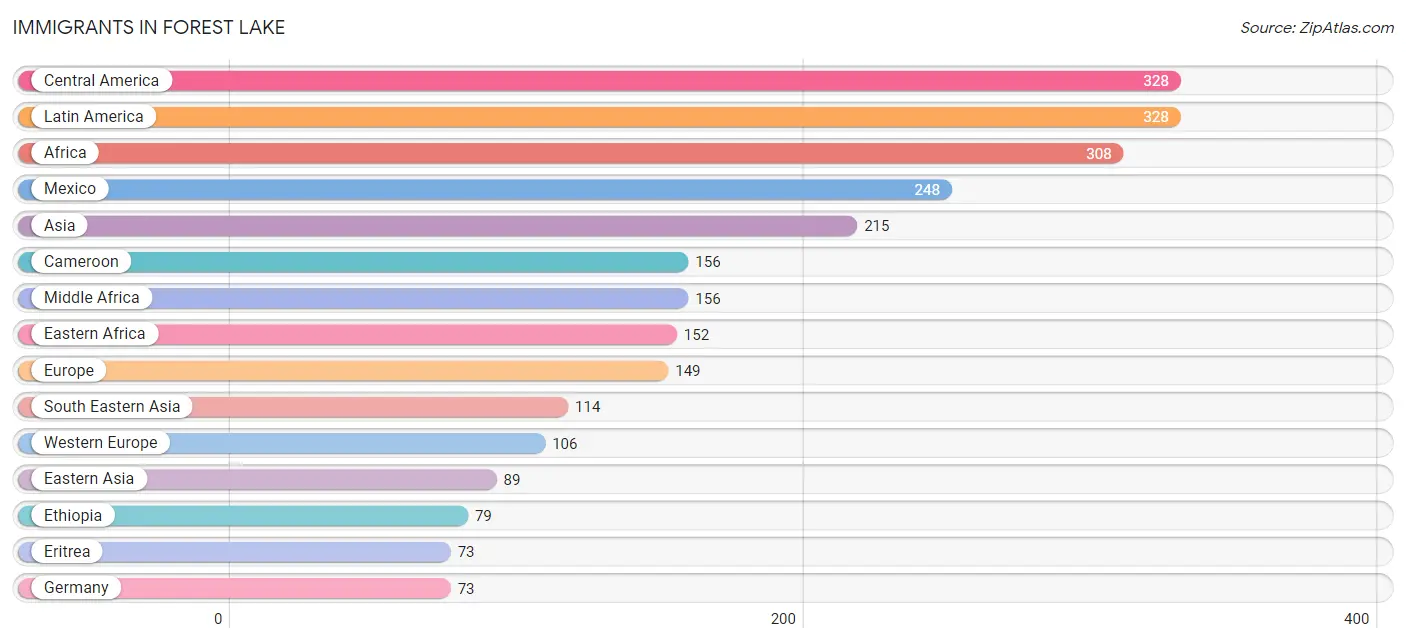
| Immigration Origin | # Population | % Population |
| Africa | 308 | 1.5% |
| Asia | 215 | 1.1% |
| Cameroon | 156 | 0.8% |
| Central America | 328 | 1.6% |
| China | 48 | 0.2% |
| Czechoslovakia | 8 | 0.0% |
| Eastern Africa | 152 | 0.7% |
| Eastern Asia | 89 | 0.4% |
| Eastern Europe | 17 | 0.1% |
| El Salvador | 21 | 0.1% |
| Eritrea | 73 | 0.4% |
| Ethiopia | 79 | 0.4% |
| Europe | 149 | 0.7% |
| Germany | 73 | 0.4% |
| Guatemala | 44 | 0.2% |
| Honduras | 8 | 0.0% |
| India | 12 | 0.1% |
| Japan | 10 | 0.1% |
| Korea | 31 | 0.2% |
| Laos | 68 | 0.3% |
| Latin America | 328 | 1.6% |
| Mexico | 248 | 1.2% |
| Middle Africa | 156 | 0.8% |
| Panama | 7 | 0.0% |
| Portugal | 26 | 0.1% |
| Russia | 9 | 0.0% |
| South Central Asia | 12 | 0.1% |
| South Eastern Asia | 114 | 0.5% |
| Southern Europe | 26 | 0.1% |
| Switzerland | 33 | 0.2% |
| Thailand | 46 | 0.2% |
| Western Europe | 106 | 0.5% | View All 32 Rows |
Sex and Age in Forest Lake
Sex and Age in Forest Lake
The most populous age groups in Forest Lake are 55 to 59 Years (860 | 8.7%) for men and 50 to 54 Years (855 | 8.0%) for women.
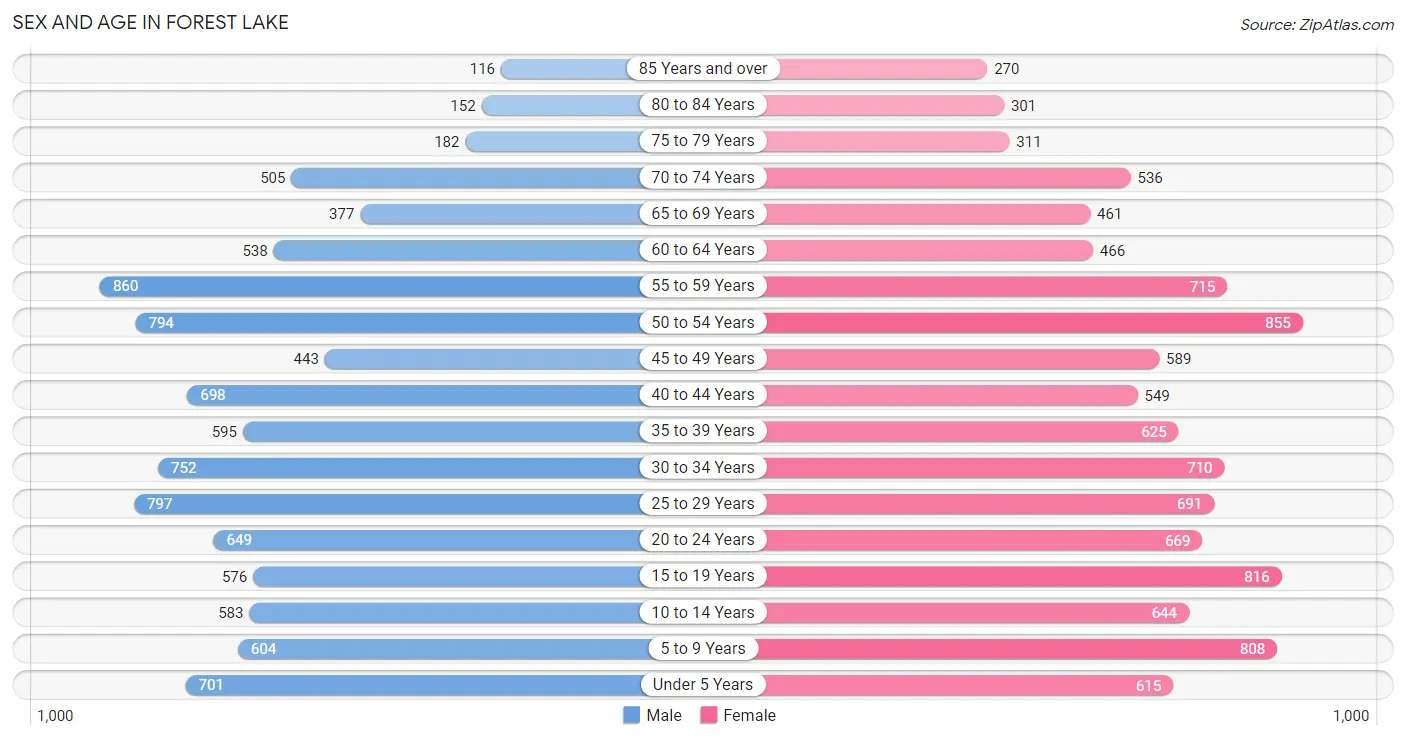
| Age Bracket | Male | Female |
| Under 5 Years | 701 (7.1%) | 615 (5.8%) |
| 5 to 9 Years | 604 (6.1%) | 808 (7.6%) |
| 10 to 14 Years | 583 (5.9%) | 644 (6.1%) |
| 15 to 19 Years | 576 (5.8%) | 816 (7.7%) |
| 20 to 24 Years | 649 (6.5%) | 669 (6.3%) |
| 25 to 29 Years | 797 (8.0%) | 691 (6.5%) |
| 30 to 34 Years | 752 (7.6%) | 710 (6.7%) |
| 35 to 39 Years | 595 (6.0%) | 625 (5.9%) |
| 40 to 44 Years | 698 (7.0%) | 549 (5.2%) |
| 45 to 49 Years | 443 (4.5%) | 589 (5.5%) |
| 50 to 54 Years | 794 (8.0%) | 855 (8.0%) |
| 55 to 59 Years | 860 (8.7%) | 715 (6.7%) |
| 60 to 64 Years | 538 (5.4%) | 466 (4.4%) |
| 65 to 69 Years | 377 (3.8%) | 461 (4.3%) |
| 70 to 74 Years | 505 (5.1%) | 536 (5.0%) |
| 75 to 79 Years | 182 (1.8%) | 311 (2.9%) |
| 80 to 84 Years | 152 (1.5%) | 301 (2.8%) |
| 85 Years and over | 116 (1.2%) | 270 (2.5%) |
| Total | 9,922 (100.0%) | 10,631 (100.0%) |
Families and Households in Forest Lake
Median Family Size in Forest Lake
The median family size in Forest Lake is 3.07 persons per family, with married-couple families (4,274 | 78.4%) accounting for the largest median family size of 3.12 persons per family. On the other hand, single male/father families (347 | 6.4%) represent the smallest median family size with 2.46 persons per family.
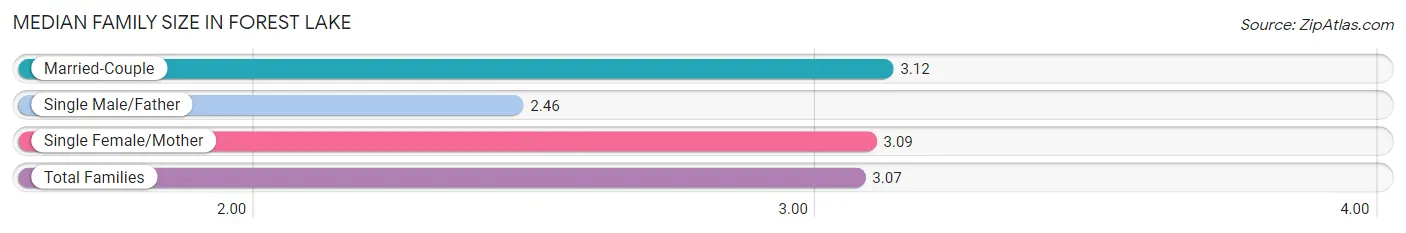
| Family Type | # Families | Family Size |
| Married-Couple | 4,274 (78.4%) | 3.12 |
| Single Male/Father | 347 (6.4%) | 2.46 |
| Single Female/Mother | 833 (15.3%) | 3.09 |
| Total Families | 5,454 (100.0%) | 3.07 |
Median Household Size in Forest Lake
The median household size in Forest Lake is 2.54 persons per household, with single female/mother households (833 | 10.3%) accounting for the largest median household size of 3.37 persons per household. non-family households (2,597 | 32.3%) represent the smallest median household size with 1.23 persons per household.
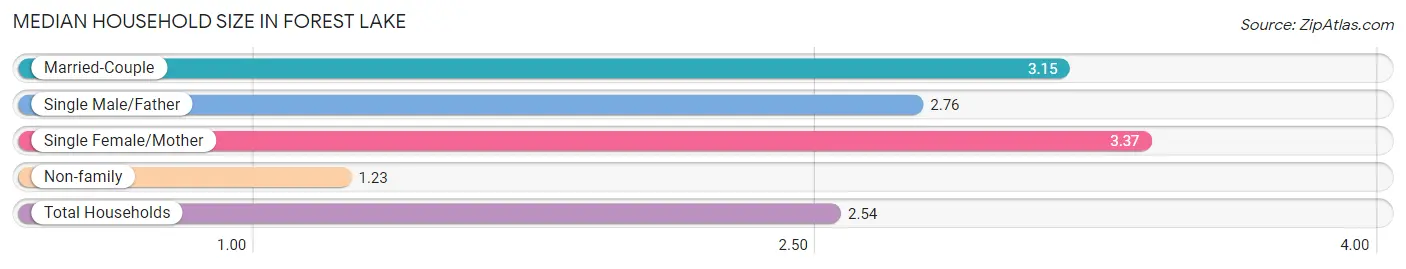
| Household Type | # Households | Household Size |
| Married-Couple | 4,274 (53.1%) | 3.15 |
| Single Male/Father | 347 (4.3%) | 2.76 |
| Single Female/Mother | 833 (10.3%) | 3.37 |
| Non-family | 2,597 (32.3%) | 1.23 |
| Total Households | 8,051 (100.0%) | 2.54 |
Household Size by Marriage Status in Forest Lake
Out of a total of 8,051 households in Forest Lake, 5,454 (67.7%) are family households, while 2,597 (32.3%) are nonfamily households. The most numerous type of family households are 2-person households, comprising 2,338, and the most common type of nonfamily households are 1-person households, comprising 2,077.
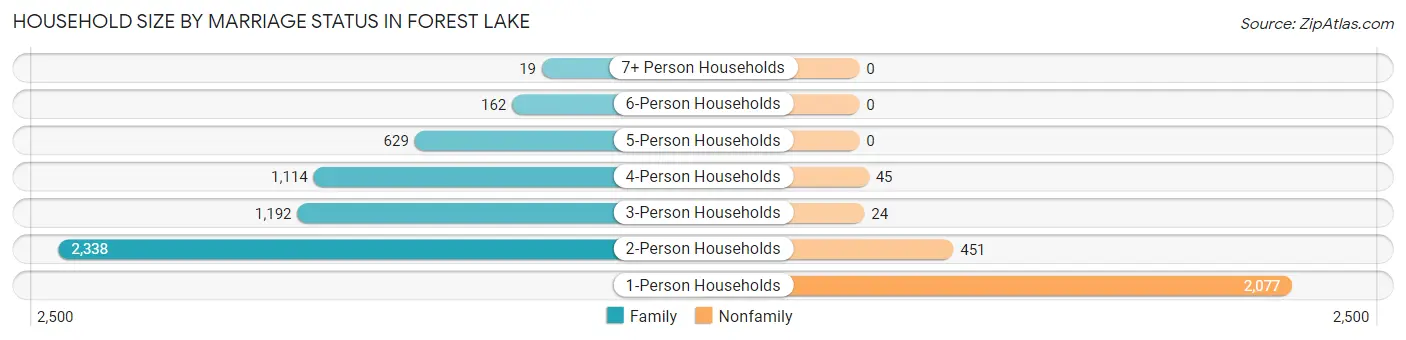
| Household Size | Family Households | Nonfamily Households |
| 1-Person Households | - | 2,077 (25.8%) |
| 2-Person Households | 2,338 (29.0%) | 451 (5.6%) |
| 3-Person Households | 1,192 (14.8%) | 24 (0.3%) |
| 4-Person Households | 1,114 (13.8%) | 45 (0.6%) |
| 5-Person Households | 629 (7.8%) | 0 (0.0%) |
| 6-Person Households | 162 (2.0%) | 0 (0.0%) |
| 7+ Person Households | 19 (0.2%) | 0 (0.0%) |
| Total | 5,454 (67.7%) | 2,597 (32.3%) |
Female Fertility in Forest Lake
Fertility by Age in Forest Lake
Average fertility rate in Forest Lake is 39.0 births per 1,000 women. Women in the age bracket of 20 to 34 years have the highest fertility rate with 69.0 births per 1,000 women. Women in the age bracket of 20 to 34 years acount for 76.1% of all women with births.
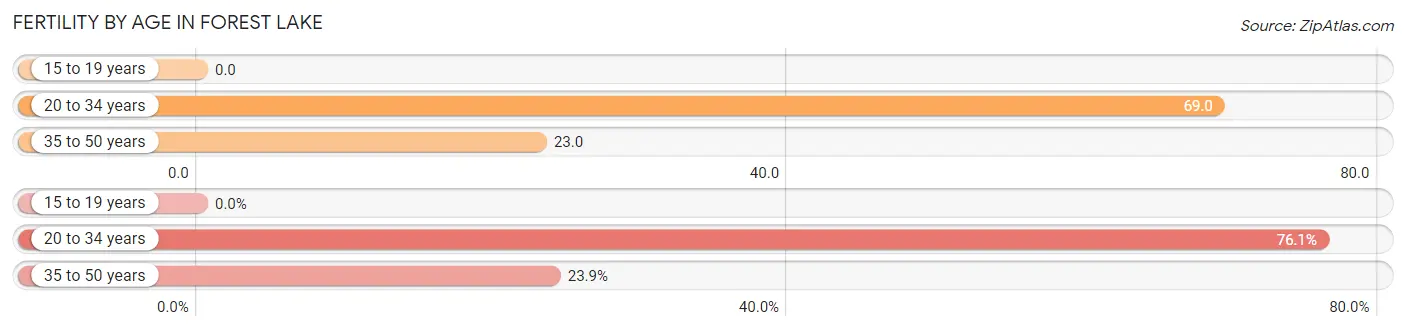
| Age Bracket | Women with Births | Births / 1,000 Women |
| 15 to 19 years | 0 (0.0%) | 0.0 |
| 20 to 34 years | 143 (76.1%) | 69.0 |
| 35 to 50 years | 45 (23.9%) | 23.0 |
| Total | 188 (100.0%) | 39.0 |
Fertility by Age by Marriage Status in Forest Lake
94.1% of women with births (188) in Forest Lake are married. The highest percentage of unmarried women with births falls into 35 to 50 years age bracket with 22.2% of them unmarried at the time of birth, while the lowest percentage of unmarried women with births belong to 20 to 34 years age bracket with 0.7% of them unmarried.
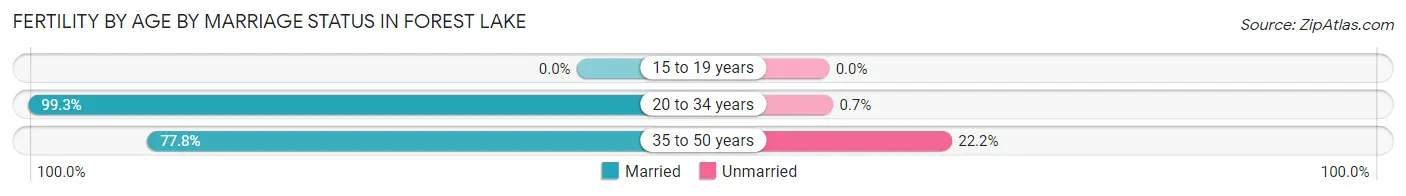
| Age Bracket | Married | Unmarried |
| 15 to 19 years | 0 (0.0%) | 0 (0.0%) |
| 20 to 34 years | 142 (99.3%) | 1 (0.7%) |
| 35 to 50 years | 35 (77.8%) | 10 (22.2%) |
| Total | 177 (94.2%) | 11 (5.9%) |
Fertility by Education in Forest Lake
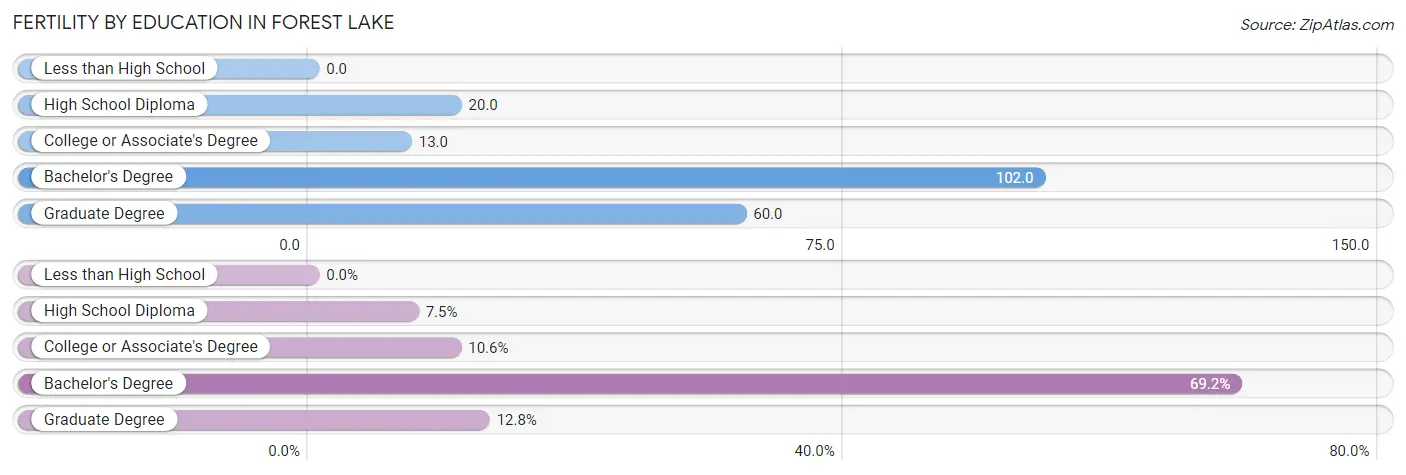
| Educational Attainment | Women with Births | Births / 1,000 Women |
| Less than High School | 0 (0.0%) | 0.0 |
| High School Diploma | 14 (7.4%) | 20.0 |
| College or Associate's Degree | 20 (10.6%) | 13.0 |
| Bachelor's Degree | 130 (69.2%) | 102.0 |
| Graduate Degree | 24 (12.8%) | 60.0 |
| Total | 188 (100.0%) | 39.0 |
Fertility by Education by Marriage Status in Forest Lake
5.9% of women with births in Forest Lake are unmarried. Women with the educational attainment of bachelor's degree are most likely to be married with 100.0% of them married at childbirth, while women with the educational attainment of college or associate's degree are least likely to be married with 50.0% of them unmarried at childbirth.
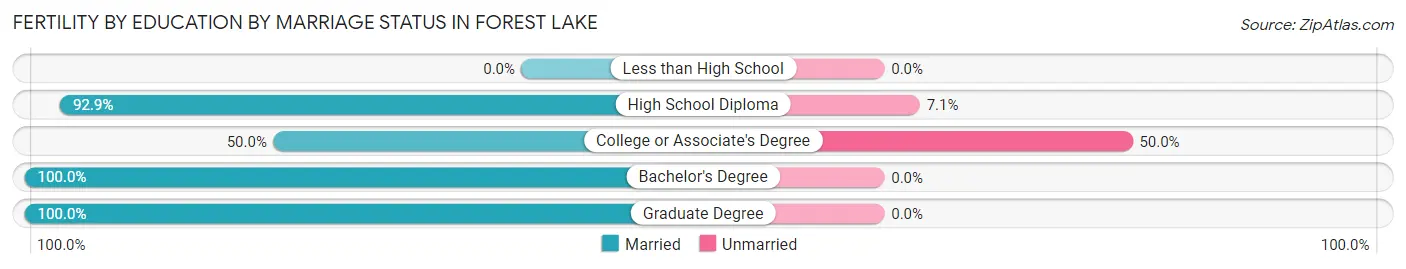
| Educational Attainment | Married | Unmarried |
| Less than High School | 0 (0.0%) | 0 (0.0%) |
| High School Diploma | 13 (92.9%) | 1 (7.1%) |
| College or Associate's Degree | 10 (50.0%) | 10 (50.0%) |
| Bachelor's Degree | 130 (100.0%) | 0 (0.0%) |
| Graduate Degree | 24 (100.0%) | 0 (0.0%) |
| Total | 177 (94.2%) | 11 (5.9%) |
Employment Characteristics in Forest Lake
Employment by Class of Employer in Forest Lake
Among the 11,089 employed individuals in Forest Lake, private company employees (7,882 | 71.1%), not-for-profit organizations (831 | 7.5%), and self-employed (not incorporated) (688 | 6.2%) make up the most common classes of employment.
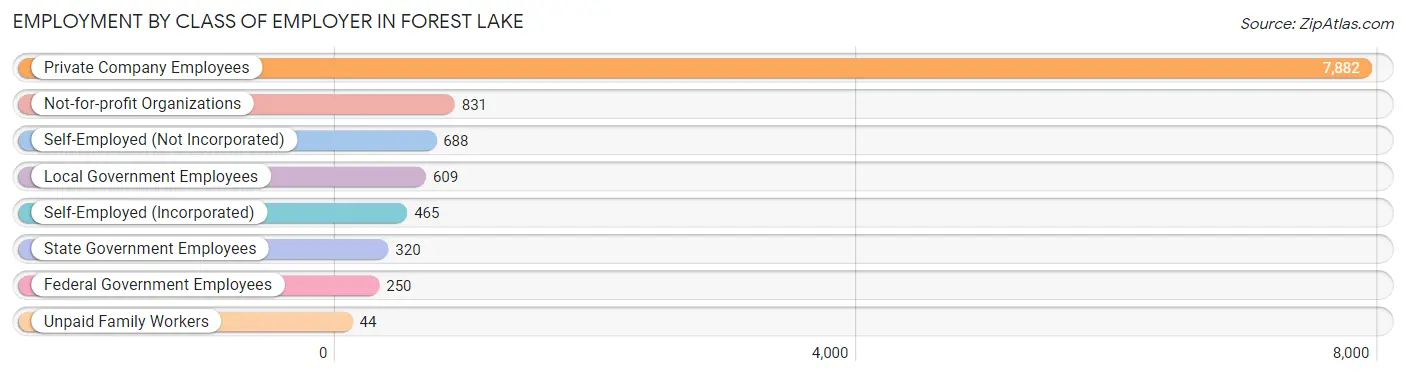
| Employer Class | # Employees | % Employees |
| Private Company Employees | 7,882 | 71.1% |
| Self-Employed (Incorporated) | 465 | 4.2% |
| Self-Employed (Not Incorporated) | 688 | 6.2% |
| Not-for-profit Organizations | 831 | 7.5% |
| Local Government Employees | 609 | 5.5% |
| State Government Employees | 320 | 2.9% |
| Federal Government Employees | 250 | 2.2% |
| Unpaid Family Workers | 44 | 0.4% |
| Total | 11,089 | 100.0% |
Employment Status by Age in Forest Lake
According to the labor force statistics for Forest Lake, out of the total population over 16 years of age (16,294), 73.4% or 11,960 individuals are in the labor force, with 4.5% or 538 of them unemployed. The age group with the highest labor force participation rate is 30 to 34 years, with 95.4% or 1,395 individuals in the labor force. Within the labor force, the 20 to 24 years age range has the highest percentage of unemployed individuals, with 17.2% or 201 of them being unemployed.
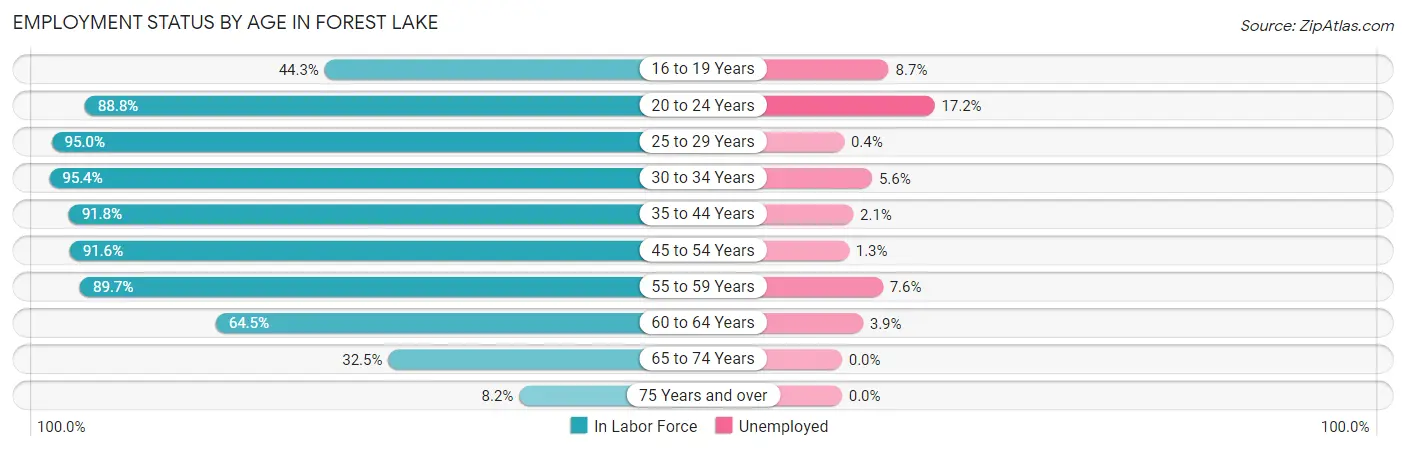
| Age Bracket | In Labor Force | Unemployed |
| 16 to 19 Years | 482 (44.3%) | 42 (8.7%) |
| 20 to 24 Years | 1,170 (88.8%) | 201 (17.2%) |
| 25 to 29 Years | 1,414 (95.0%) | 6 (0.4%) |
| 30 to 34 Years | 1,395 (95.4%) | 78 (5.6%) |
| 35 to 44 Years | 2,265 (91.8%) | 48 (2.1%) |
| 45 to 54 Years | 2,456 (91.6%) | 32 (1.3%) |
| 55 to 59 Years | 1,413 (89.7%) | 107 (7.6%) |
| 60 to 64 Years | 648 (64.5%) | 25 (3.9%) |
| 65 to 74 Years | 611 (32.5%) | 0 (0.0%) |
| 75 Years and over | 109 (8.2%) | 0 (0.0%) |
| Total | 11,960 (73.4%) | 538 (4.5%) |
Employment Status by Educational Attainment in Forest Lake
According to labor force statistics for Forest Lake, 89.8% of individuals (9,588) out of the total population between 25 and 64 years of age (10,677) are in the labor force, with 3.1% or 297 of them being unemployed. The group with the highest labor force participation rate are those with the educational attainment of bachelor's degree or higher, with 96.6% or 3,944 individuals in the labor force. Within the labor force, individuals with high school diploma education have the highest percentage of unemployment, with 6.7% or 146 of them being unemployed.
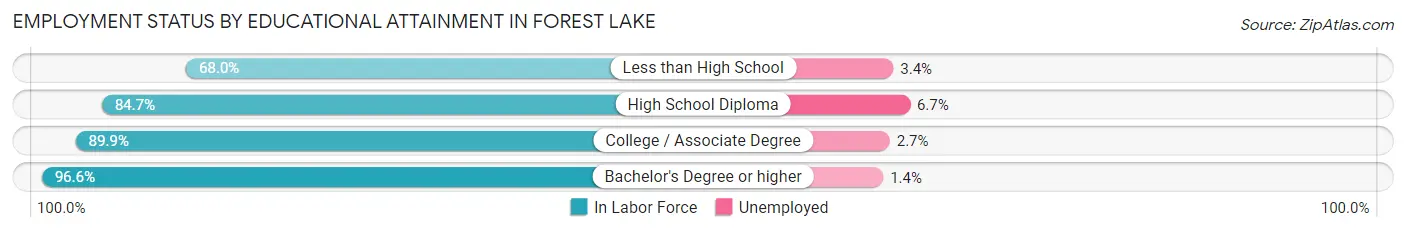
| Educational Attainment | In Labor Force | Unemployed |
| Less than High School | 472 (68.0%) | 24 (3.4%) |
| High School Diploma | 2,175 (84.7%) | 172 (6.7%) |
| College / Associate Degree | 2,995 (89.9%) | 90 (2.7%) |
| Bachelor's Degree or higher | 3,944 (96.6%) | 57 (1.4%) |
| Total | 9,588 (89.8%) | 331 (3.1%) |
Employment Occupations by Sex in Forest Lake
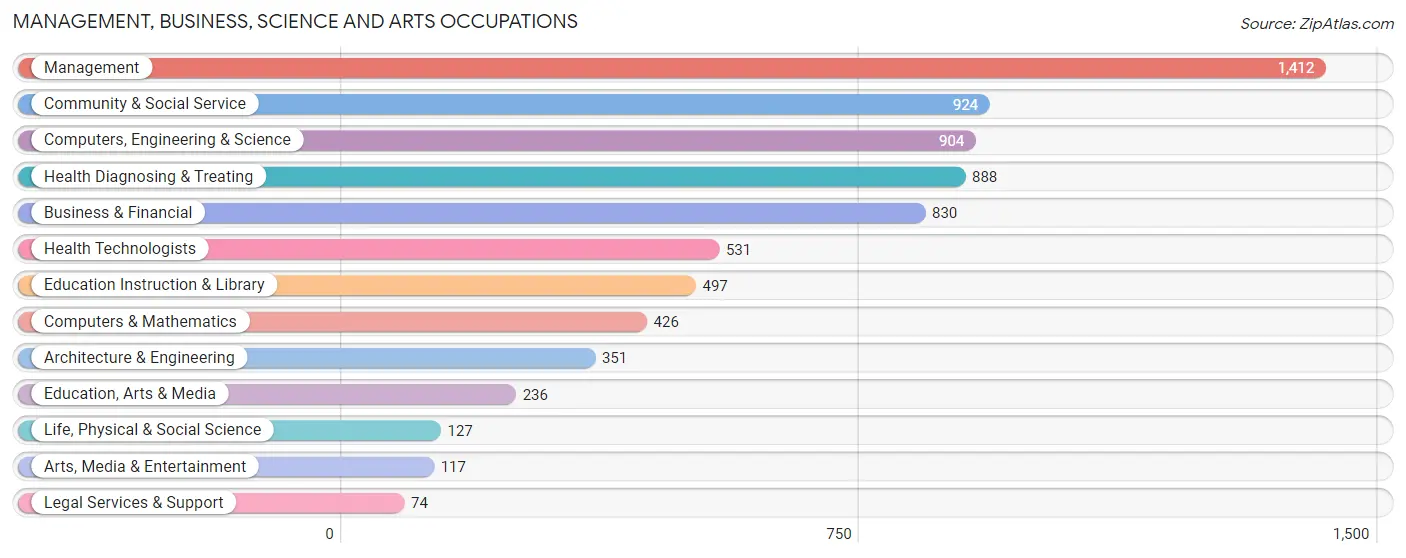
Management, Business, Science and Arts Occupations
The most common Management, Business, Science and Arts occupations in Forest Lake are Management (1,412 | 12.4%), Community & Social Service (924 | 8.1%), Computers, Engineering & Science (904 | 7.9%), Health Diagnosing & Treating (888 | 7.8%), and Business & Financial (830 | 7.3%).
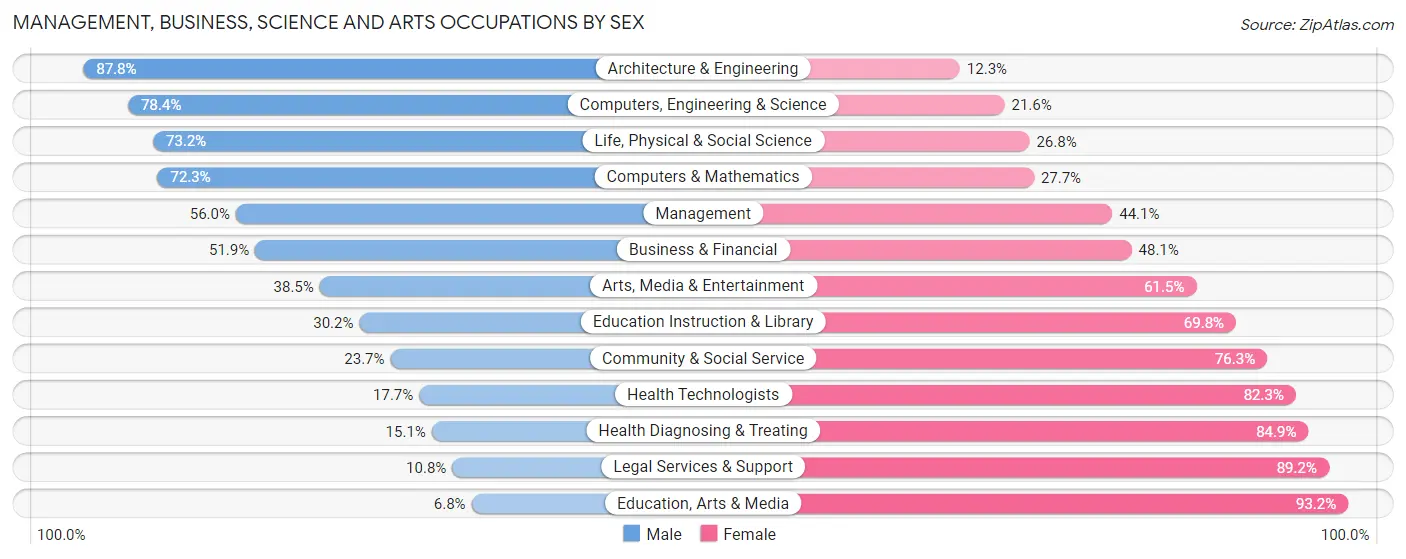
Management, Business, Science and Arts Occupations by Sex
Within the Management, Business, Science and Arts occupations in Forest Lake, the most male-oriented occupations are Architecture & Engineering (87.7%), Computers, Engineering & Science (78.4%), and Life, Physical & Social Science (73.2%), while the most female-oriented occupations are Education, Arts & Media (93.2%), Legal Services & Support (89.2%), and Health Diagnosing & Treating (84.9%).
| Occupation | Male | Female |
| Management | 790 (55.9%) | 622 (44.1%) |
| Business & Financial | 431 (51.9%) | 399 (48.1%) |
| Computers, Engineering & Science | 709 (78.4%) | 195 (21.6%) |
| Computers & Mathematics | 308 (72.3%) | 118 (27.7%) |
| Architecture & Engineering | 308 (87.7%) | 43 (12.2%) |
| Life, Physical & Social Science | 93 (73.2%) | 34 (26.8%) |
| Community & Social Service | 219 (23.7%) | 705 (76.3%) |
| Education, Arts & Media | 16 (6.8%) | 220 (93.2%) |
| Legal Services & Support | 8 (10.8%) | 66 (89.2%) |
| Education Instruction & Library | 150 (30.2%) | 347 (69.8%) |
| Arts, Media & Entertainment | 45 (38.5%) | 72 (61.5%) |
| Health Diagnosing & Treating | 134 (15.1%) | 754 (84.9%) |
| Health Technologists | 94 (17.7%) | 437 (82.3%) |
| Total (Category) | 2,283 (46.1%) | 2,675 (53.9%) |
| Total (Overall) | 5,939 (52.0%) | 5,480 (48.0%) |
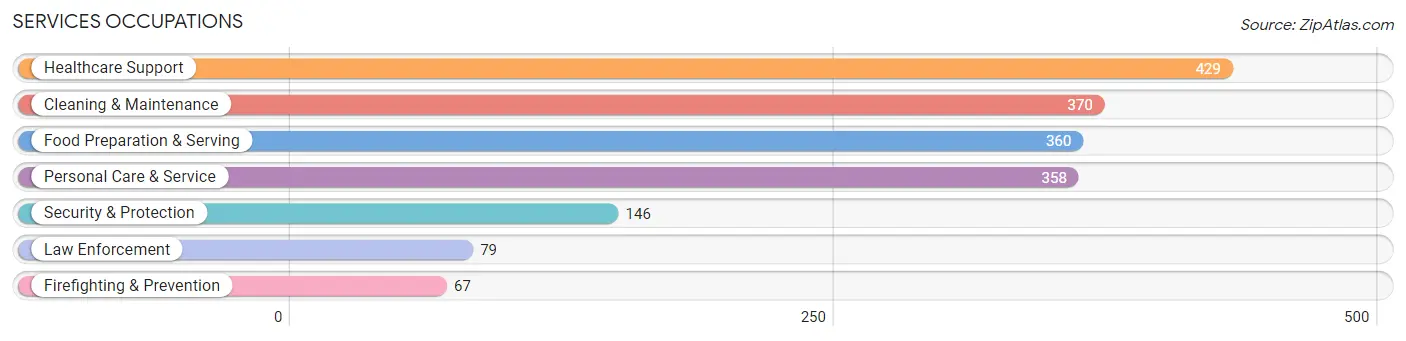
Services Occupations
The most common Services occupations in Forest Lake are Healthcare Support (429 | 3.8%), Cleaning & Maintenance (370 | 3.2%), Food Preparation & Serving (360 | 3.2%), Personal Care & Service (358 | 3.1%), and Security & Protection (146 | 1.3%).
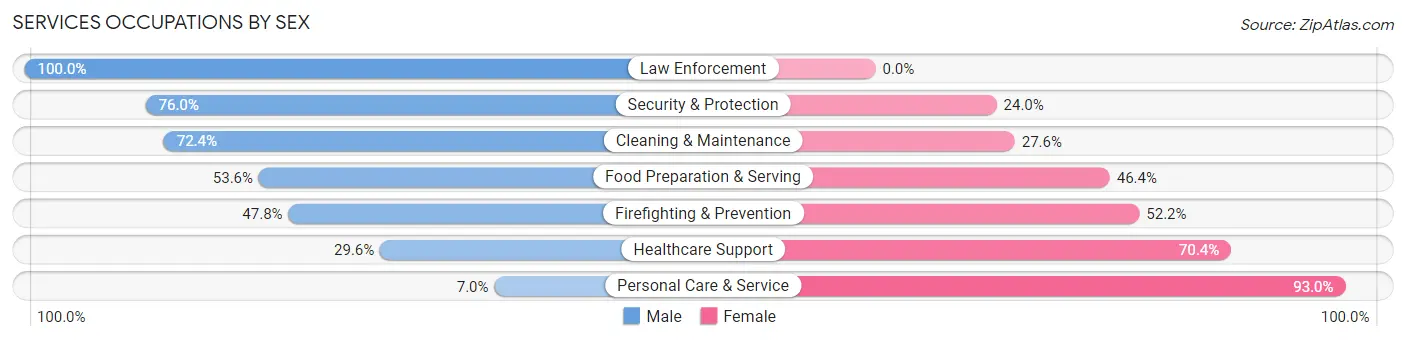
Services Occupations by Sex
Within the Services occupations in Forest Lake, the most male-oriented occupations are Law Enforcement (100.0%), Security & Protection (76.0%), and Cleaning & Maintenance (72.4%), while the most female-oriented occupations are Personal Care & Service (93.0%), Healthcare Support (70.4%), and Firefighting & Prevention (52.2%).
| Occupation | Male | Female |
| Healthcare Support | 127 (29.6%) | 302 (70.4%) |
| Security & Protection | 111 (76.0%) | 35 (24.0%) |
| Firefighting & Prevention | 32 (47.8%) | 35 (52.2%) |
| Law Enforcement | 79 (100.0%) | 0 (0.0%) |
| Food Preparation & Serving | 193 (53.6%) | 167 (46.4%) |
| Cleaning & Maintenance | 268 (72.4%) | 102 (27.6%) |
| Personal Care & Service | 25 (7.0%) | 333 (93.0%) |
| Total (Category) | 724 (43.5%) | 939 (56.5%) |
| Total (Overall) | 5,939 (52.0%) | 5,480 (48.0%) |
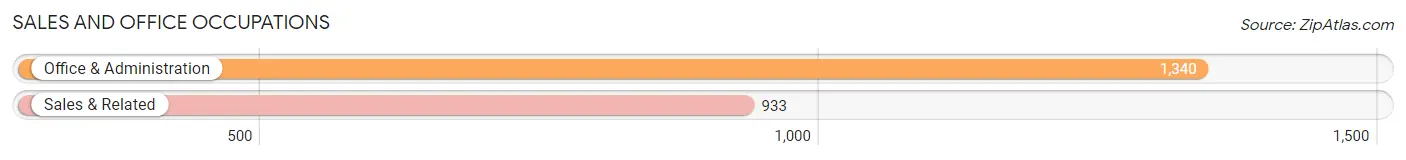
Sales and Office Occupations
The most common Sales and Office occupations in Forest Lake are Office & Administration (1,340 | 11.7%), and Sales & Related (933 | 8.2%).
Sales and Office Occupations by Sex
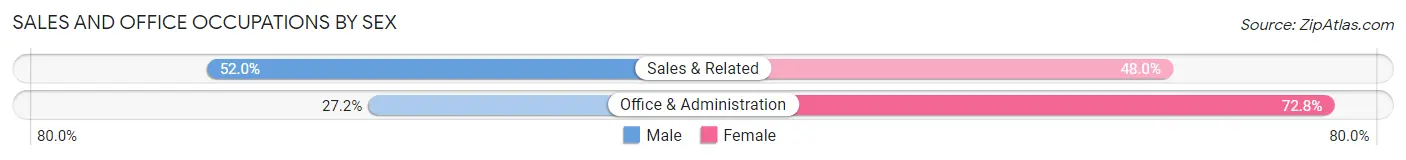
| Occupation | Male | Female |
| Sales & Related | 485 (52.0%) | 448 (48.0%) |
| Office & Administration | 364 (27.2%) | 976 (72.8%) |
| Total (Category) | 849 (37.3%) | 1,424 (62.6%) |
| Total (Overall) | 5,939 (52.0%) | 5,480 (48.0%) |
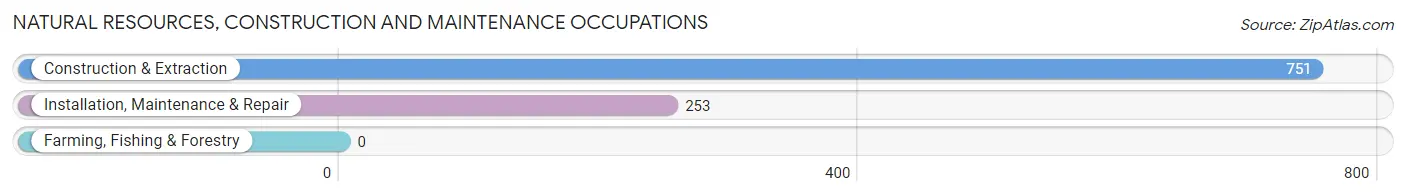
Natural Resources, Construction and Maintenance Occupations
The most common Natural Resources, Construction and Maintenance occupations in Forest Lake are Construction & Extraction (751 | 6.6%), and Installation, Maintenance & Repair (253 | 2.2%).
Natural Resources, Construction and Maintenance Occupations by Sex
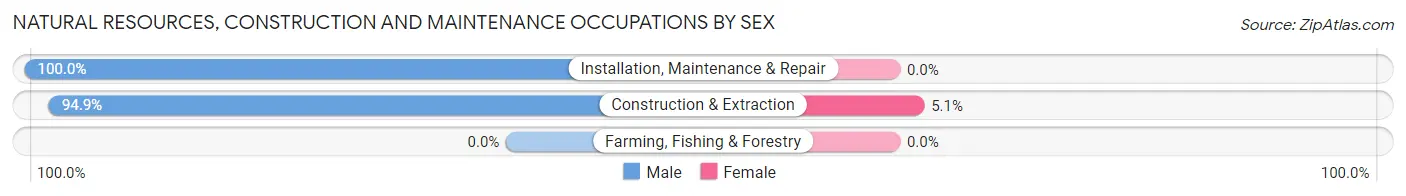
| Occupation | Male | Female |
| Farming, Fishing & Forestry | 0 (0.0%) | 0 (0.0%) |
| Construction & Extraction | 713 (94.9%) | 38 (5.1%) |
| Installation, Maintenance & Repair | 253 (100.0%) | 0 (0.0%) |
| Total (Category) | 966 (96.2%) | 38 (3.8%) |
| Total (Overall) | 5,939 (52.0%) | 5,480 (48.0%) |
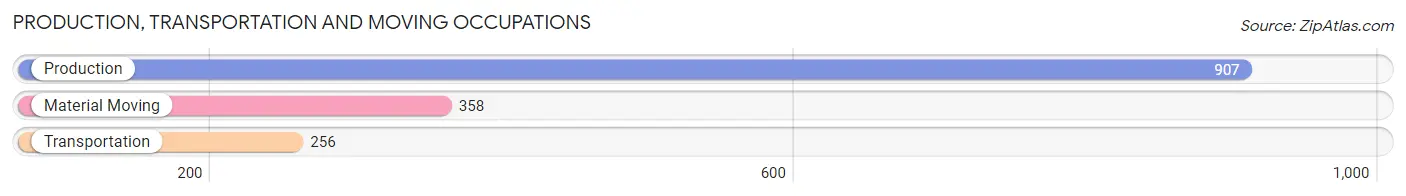
Production, Transportation and Moving Occupations
The most common Production, Transportation and Moving occupations in Forest Lake are Production (907 | 7.9%), Material Moving (358 | 3.1%), and Transportation (256 | 2.2%).
Production, Transportation and Moving Occupations by Sex
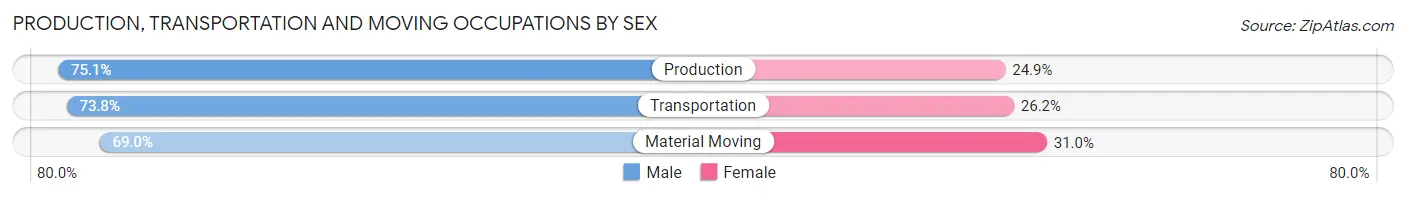
| Occupation | Male | Female |
| Production | 681 (75.1%) | 226 (24.9%) |
| Transportation | 189 (73.8%) | 67 (26.2%) |
| Material Moving | 247 (69.0%) | 111 (31.0%) |
| Total (Category) | 1,117 (73.4%) | 404 (26.6%) |
| Total (Overall) | 5,939 (52.0%) | 5,480 (48.0%) |
Employment Industries by Sex in Forest Lake
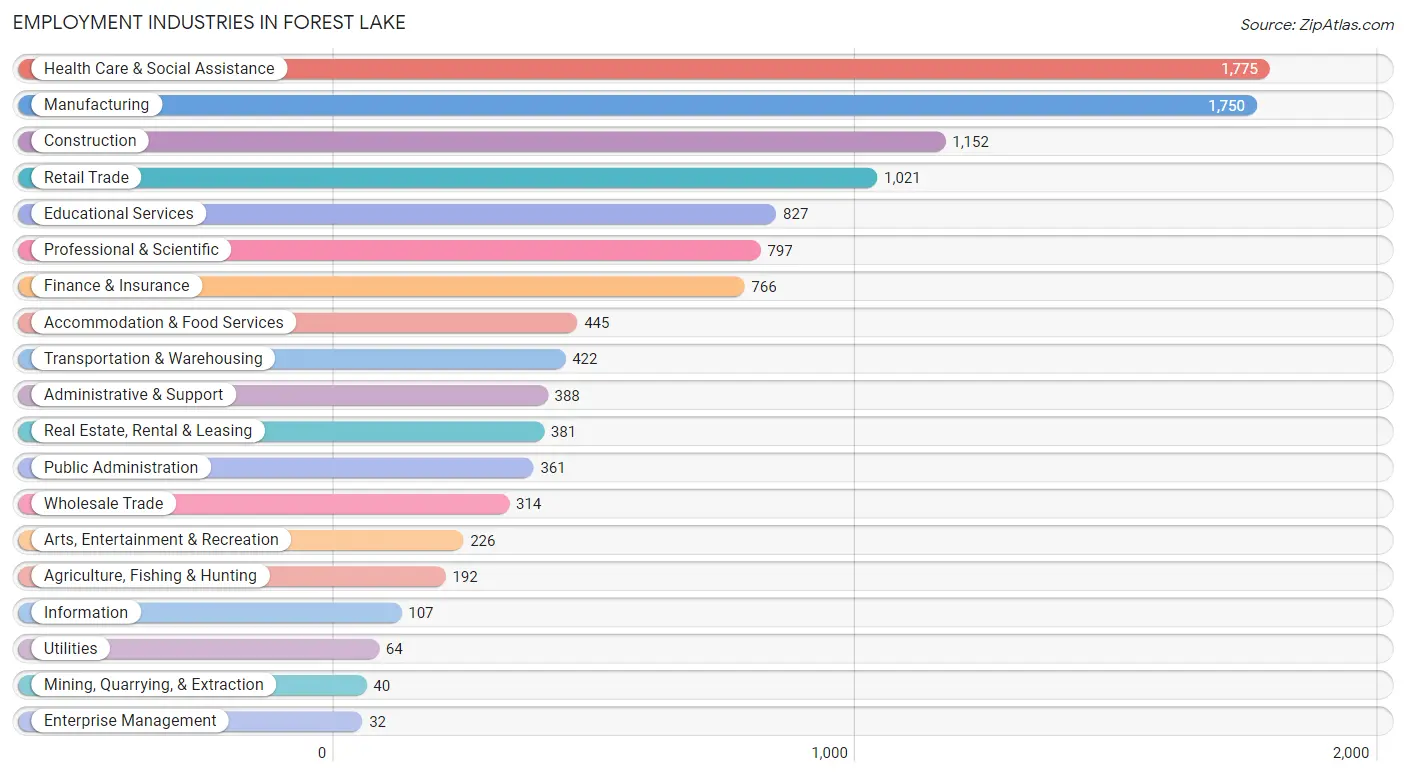
Employment Industries in Forest Lake
The major employment industries in Forest Lake include Health Care & Social Assistance (1,775 | 15.5%), Manufacturing (1,750 | 15.3%), Construction (1,152 | 10.1%), Retail Trade (1,021 | 8.9%), and Educational Services (827 | 7.2%).
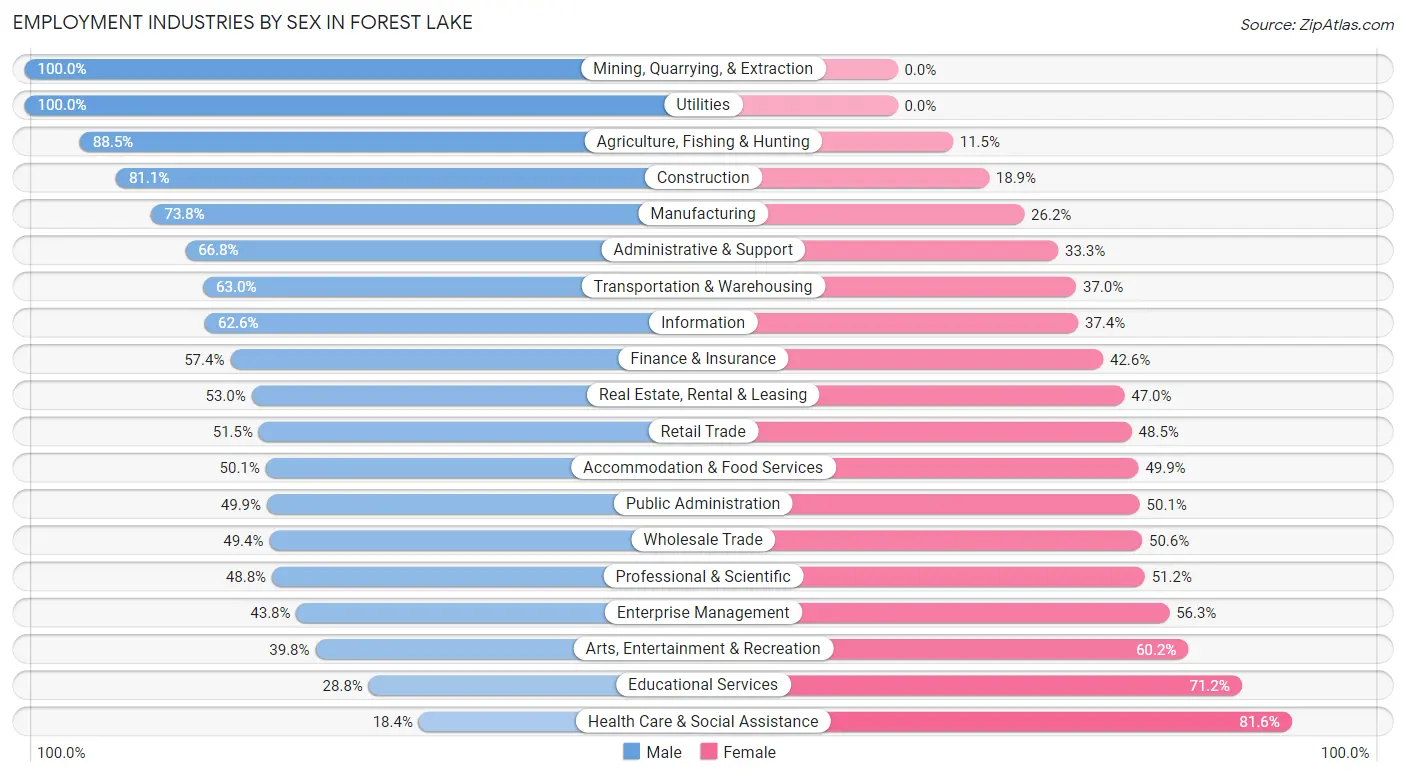
Employment Industries by Sex in Forest Lake
The Forest Lake industries that see more men than women are Mining, Quarrying, & Extraction (100.0%), Utilities (100.0%), and Agriculture, Fishing & Hunting (88.5%), whereas the industries that tend to have a higher number of women are Health Care & Social Assistance (81.6%), Educational Services (71.2%), and Arts, Entertainment & Recreation (60.2%).
| Industry | Male | Female |
| Agriculture, Fishing & Hunting | 170 (88.5%) | 22 (11.5%) |
| Mining, Quarrying, & Extraction | 40 (100.0%) | 0 (0.0%) |
| Construction | 934 (81.1%) | 218 (18.9%) |
| Manufacturing | 1,291 (73.8%) | 459 (26.2%) |
| Wholesale Trade | 155 (49.4%) | 159 (50.6%) |
| Retail Trade | 526 (51.5%) | 495 (48.5%) |
| Transportation & Warehousing | 266 (63.0%) | 156 (37.0%) |
| Utilities | 64 (100.0%) | 0 (0.0%) |
| Information | 67 (62.6%) | 40 (37.4%) |
| Finance & Insurance | 440 (57.4%) | 326 (42.6%) |
| Real Estate, Rental & Leasing | 202 (53.0%) | 179 (47.0%) |
| Professional & Scientific | 389 (48.8%) | 408 (51.2%) |
| Enterprise Management | 14 (43.8%) | 18 (56.2%) |
| Administrative & Support | 259 (66.7%) | 129 (33.3%) |
| Educational Services | 238 (28.8%) | 589 (71.2%) |
| Health Care & Social Assistance | 327 (18.4%) | 1,448 (81.6%) |
| Arts, Entertainment & Recreation | 90 (39.8%) | 136 (60.2%) |
| Accommodation & Food Services | 223 (50.1%) | 222 (49.9%) |
| Public Administration | 180 (49.9%) | 181 (50.1%) |
| Total | 5,939 (52.0%) | 5,480 (48.0%) |
Education in Forest Lake
School Enrollment in Forest Lake
The most common levels of schooling among the 5,006 students in Forest Lake are elementary school (1,261 | 25.2%), high school (1,186 | 23.7%), and middle school (979 | 19.6%).
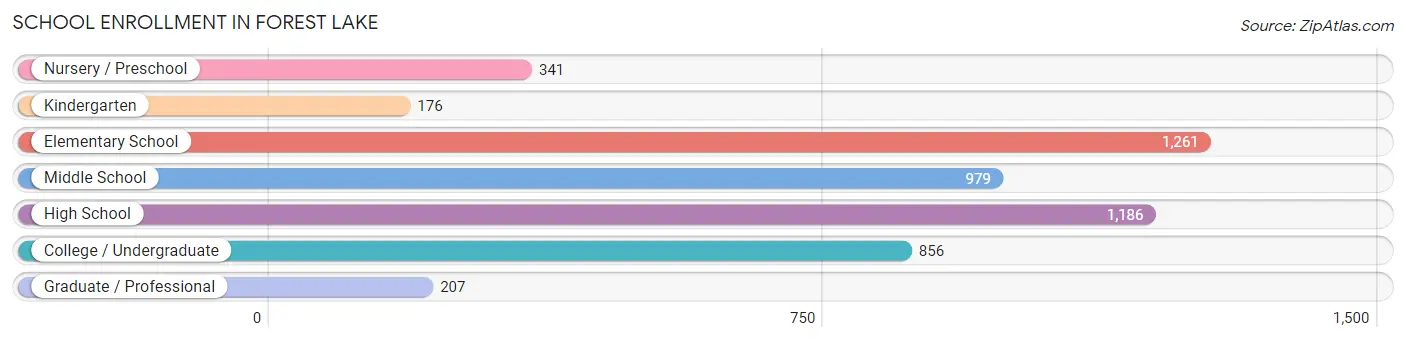
| School Level | # Students | % Students |
| Nursery / Preschool | 341 | 6.8% |
| Kindergarten | 176 | 3.5% |
| Elementary School | 1,261 | 25.2% |
| Middle School | 979 | 19.6% |
| High School | 1,186 | 23.7% |
| College / Undergraduate | 856 | 17.1% |
| Graduate / Professional | 207 | 4.1% |
| Total | 5,006 | 100.0% |
School Enrollment by Age by Funding Source in Forest Lake
Out of a total of 5,006 students who are enrolled in schools in Forest Lake, 536 (10.7%) attend a private institution, while the remaining 4,470 (89.3%) are enrolled in public schools. The age group of 25 to 34 year olds has the highest likelihood of being enrolled in private schools, with 34 (19.5% in the age bracket) enrolled. Conversely, the age group of 5 to 9 year old has the lowest likelihood of being enrolled in a private school, with 1,286 (93.6% in the age bracket) attending a public institution.
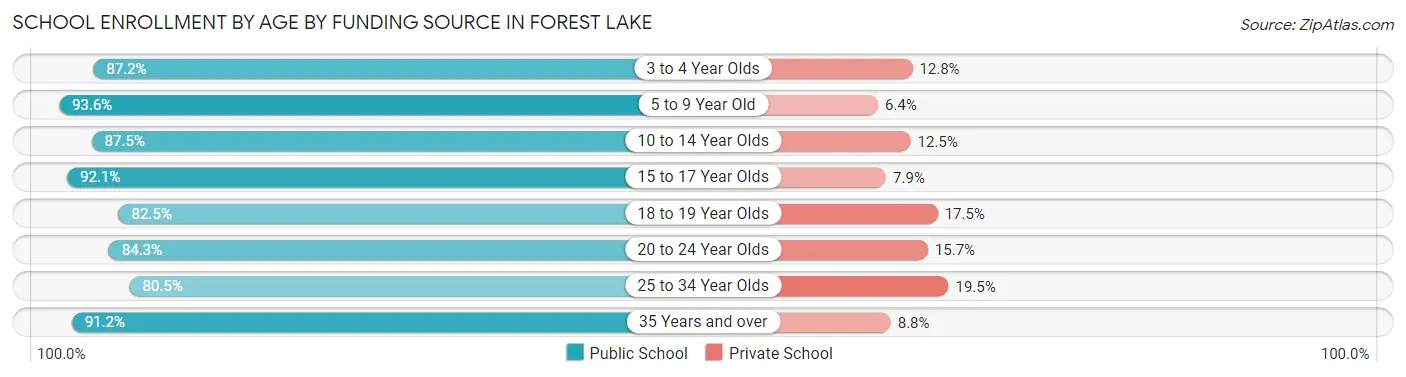
| Age Bracket | Public School | Private School |
| 3 to 4 Year Olds | 211 (87.2%) | 31 (12.8%) |
| 5 to 9 Year Old | 1,286 (93.6%) | 88 (6.4%) |
| 10 to 14 Year Olds | 1,074 (87.5%) | 153 (12.5%) |
| 15 to 17 Year Olds | 885 (92.1%) | 76 (7.9%) |
| 18 to 19 Year Olds | 311 (82.5%) | 66 (17.5%) |
| 20 to 24 Year Olds | 376 (84.3%) | 70 (15.7%) |
| 25 to 34 Year Olds | 140 (80.5%) | 34 (19.5%) |
| 35 Years and over | 187 (91.2%) | 18 (8.8%) |
| Total | 4,470 (89.3%) | 536 (10.7%) |
Educational Attainment by Field of Study in Forest Lake
Business (981 | 17.5%), education (882 | 15.7%), science & technology (812 | 14.5%), social sciences (444 | 7.9%), and engineering (382 | 6.8%) are the most common fields of study among 5,611 individuals in Forest Lake who have obtained a bachelor's degree or higher.
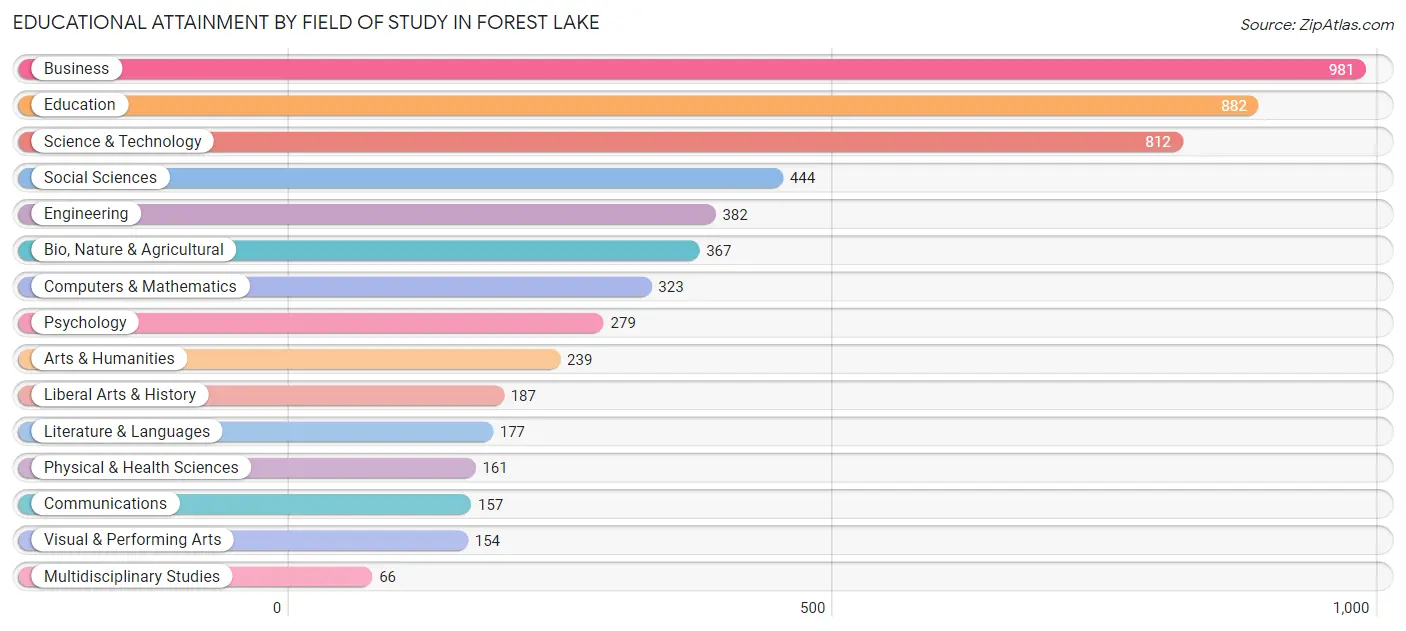
| Field of Study | # Graduates | % Graduates |
| Computers & Mathematics | 323 | 5.8% |
| Bio, Nature & Agricultural | 367 | 6.5% |
| Physical & Health Sciences | 161 | 2.9% |
| Psychology | 279 | 5.0% |
| Social Sciences | 444 | 7.9% |
| Engineering | 382 | 6.8% |
| Multidisciplinary Studies | 66 | 1.2% |
| Science & Technology | 812 | 14.5% |
| Business | 981 | 17.5% |
| Education | 882 | 15.7% |
| Literature & Languages | 177 | 3.2% |
| Liberal Arts & History | 187 | 3.3% |
| Visual & Performing Arts | 154 | 2.7% |
| Communications | 157 | 2.8% |
| Arts & Humanities | 239 | 4.3% |
| Total | 5,611 | 100.0% |
Transportation & Commute in Forest Lake
Vehicle Availability by Sex in Forest Lake
The most prevalent vehicle ownership categories in Forest Lake are males with 2 vehicles (2,725, accounting for 47.1%) and females with 2 vehicles (2,549, making up 51.5%).
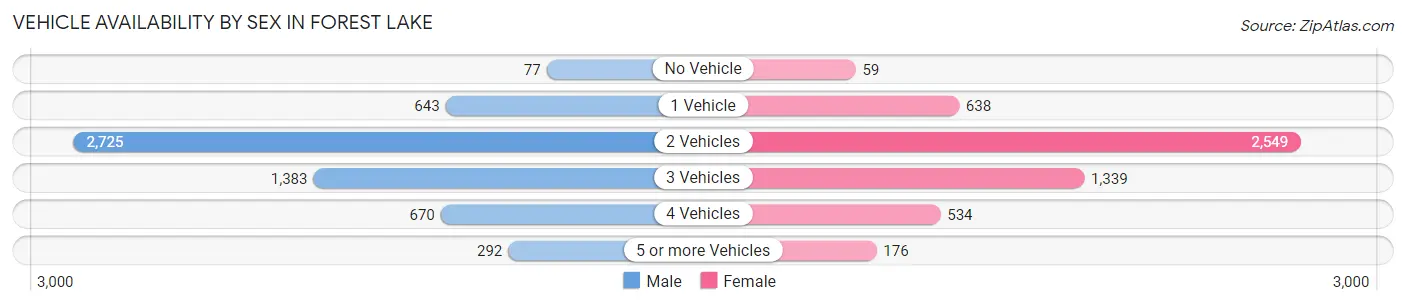
| Vehicles Available | Male | Female |
| No Vehicle | 77 (1.3%) | 59 (1.1%) |
| 1 Vehicle | 643 (11.1%) | 638 (12.0%) |
| 2 Vehicles | 2,725 (47.1%) | 2,549 (48.1%) |
| 3 Vehicles | 1,383 (23.9%) | 1,339 (25.3%) |
| 4 Vehicles | 670 (11.6%) | 534 (10.1%) |
| 5 or more Vehicles | 292 (5.0%) | 176 (3.3%) |
| Total | 5,790 (100.0%) | 5,295 (100.0%) |
Commute Time in Forest Lake
The most frequently occuring commute durations in Forest Lake are 30 to 34 minutes (1,425 commuters, 14.8%), 5 to 9 minutes (1,228 commuters, 12.7%), and 10 to 14 minutes (1,074 commuters, 11.2%).
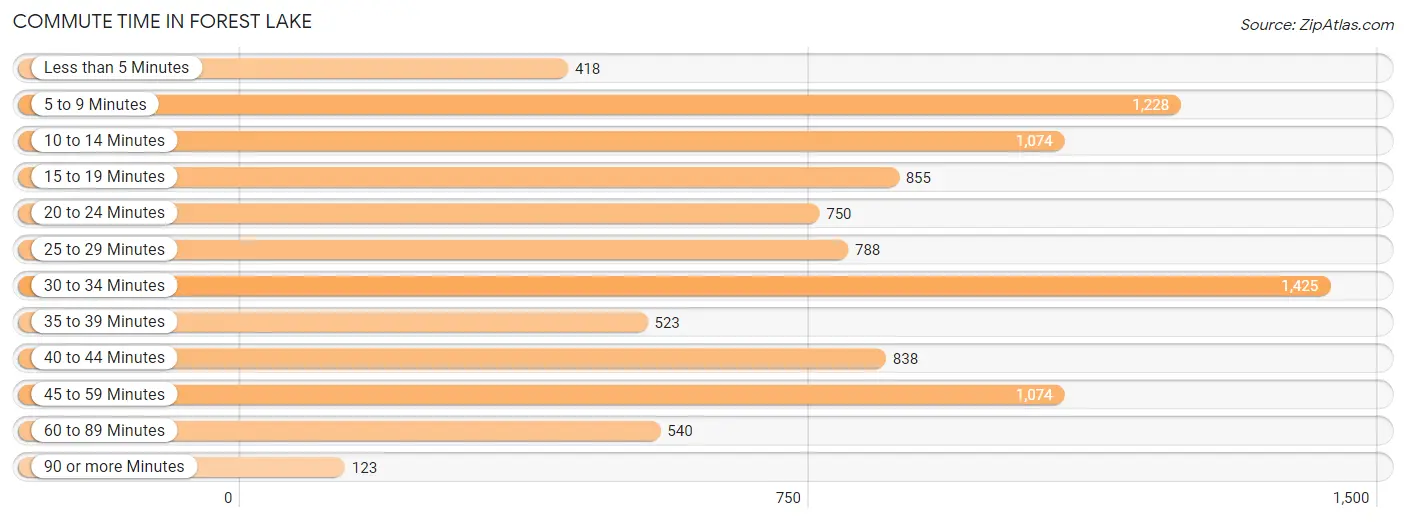
| Commute Time | # Commuters | % Commuters |
| Less than 5 Minutes | 418 | 4.3% |
| 5 to 9 Minutes | 1,228 | 12.7% |
| 10 to 14 Minutes | 1,074 | 11.2% |
| 15 to 19 Minutes | 855 | 8.9% |
| 20 to 24 Minutes | 750 | 7.8% |
| 25 to 29 Minutes | 788 | 8.2% |
| 30 to 34 Minutes | 1,425 | 14.8% |
| 35 to 39 Minutes | 523 | 5.4% |
| 40 to 44 Minutes | 838 | 8.7% |
| 45 to 59 Minutes | 1,074 | 11.2% |
| 60 to 89 Minutes | 540 | 5.6% |
| 90 or more Minutes | 123 | 1.3% |
Commute Time by Sex in Forest Lake
The most common commute times in Forest Lake are 30 to 34 minutes (766 commuters, 14.8%) for males and 30 to 34 minutes (659 commuters, 14.8%) for females.
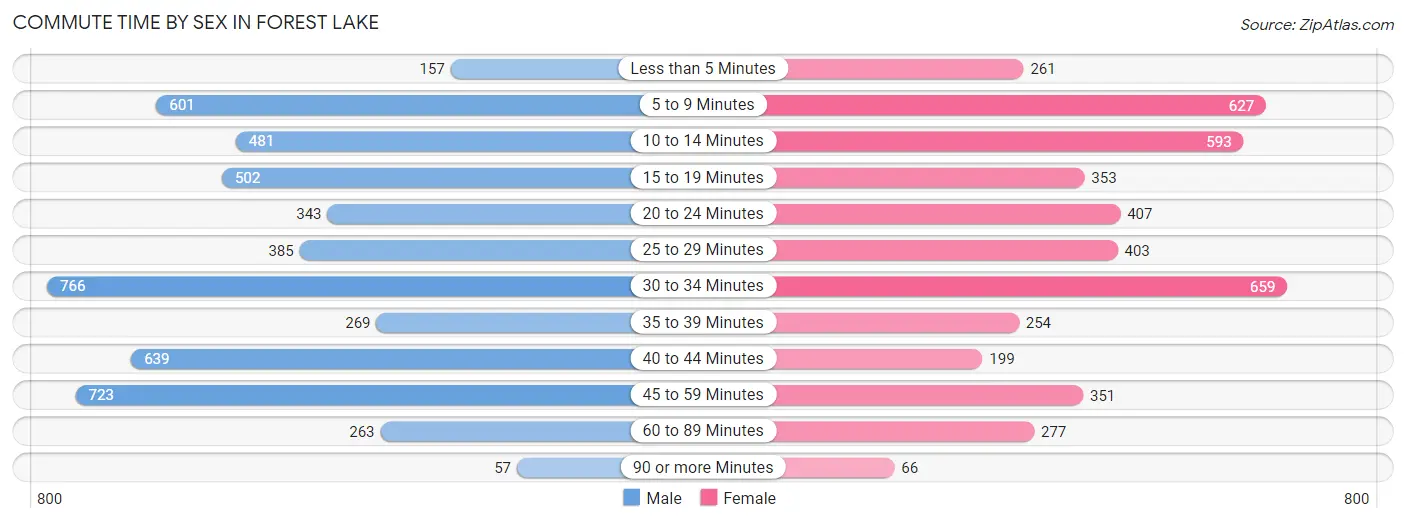
| Commute Time | Male | Female |
| Less than 5 Minutes | 157 (3.0%) | 261 (5.9%) |
| 5 to 9 Minutes | 601 (11.6%) | 627 (14.1%) |
| 10 to 14 Minutes | 481 (9.3%) | 593 (13.3%) |
| 15 to 19 Minutes | 502 (9.7%) | 353 (7.9%) |
| 20 to 24 Minutes | 343 (6.6%) | 407 (9.1%) |
| 25 to 29 Minutes | 385 (7.4%) | 403 (9.1%) |
| 30 to 34 Minutes | 766 (14.8%) | 659 (14.8%) |
| 35 to 39 Minutes | 269 (5.2%) | 254 (5.7%) |
| 40 to 44 Minutes | 639 (12.3%) | 199 (4.5%) |
| 45 to 59 Minutes | 723 (13.9%) | 351 (7.9%) |
| 60 to 89 Minutes | 263 (5.1%) | 277 (6.2%) |
| 90 or more Minutes | 57 (1.1%) | 66 (1.5%) |
Time of Departure to Work by Sex in Forest Lake
The most frequent times of departure to work in Forest Lake are 6:00 AM to 6:29 AM (831, 16.0%) for males and 7:00 AM to 7:29 AM (715, 16.1%) for females.
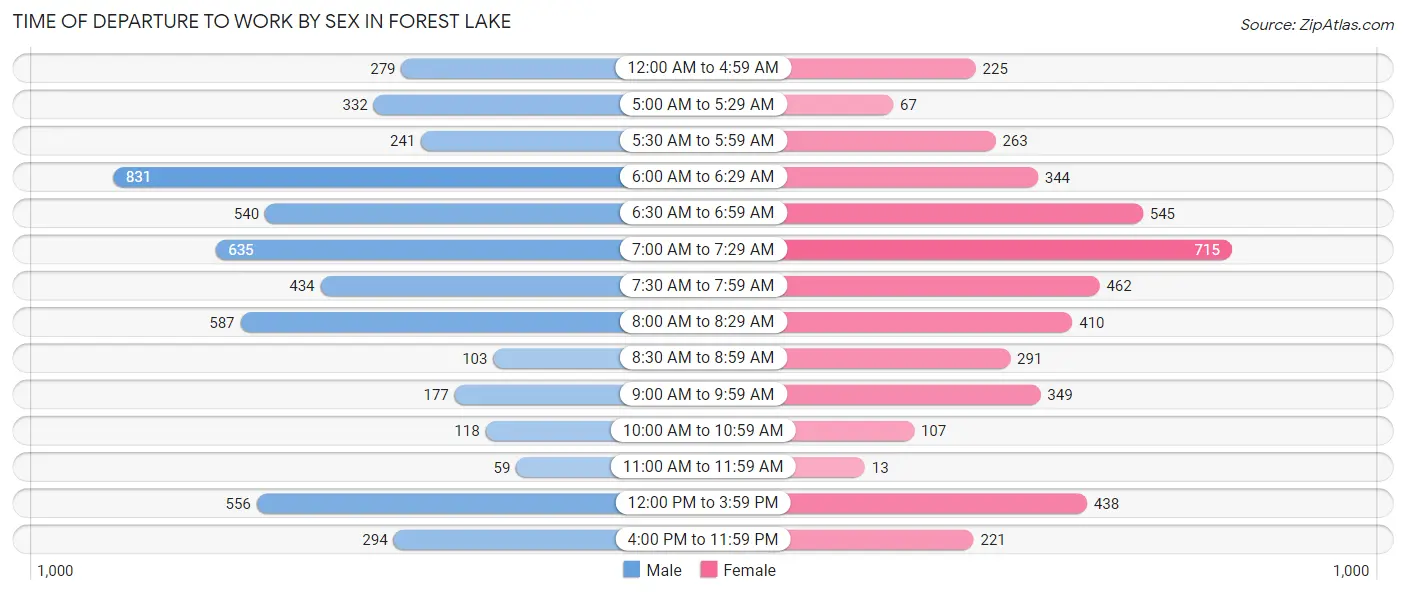
| Time of Departure | Male | Female |
| 12:00 AM to 4:59 AM | 279 (5.4%) | 225 (5.1%) |
| 5:00 AM to 5:29 AM | 332 (6.4%) | 67 (1.5%) |
| 5:30 AM to 5:59 AM | 241 (4.6%) | 263 (5.9%) |
| 6:00 AM to 6:29 AM | 831 (16.0%) | 344 (7.7%) |
| 6:30 AM to 6:59 AM | 540 (10.4%) | 545 (12.2%) |
| 7:00 AM to 7:29 AM | 635 (12.2%) | 715 (16.1%) |
| 7:30 AM to 7:59 AM | 434 (8.4%) | 462 (10.4%) |
| 8:00 AM to 8:29 AM | 587 (11.3%) | 410 (9.2%) |
| 8:30 AM to 8:59 AM | 103 (2.0%) | 291 (6.5%) |
| 9:00 AM to 9:59 AM | 177 (3.4%) | 349 (7.8%) |
| 10:00 AM to 10:59 AM | 118 (2.3%) | 107 (2.4%) |
| 11:00 AM to 11:59 AM | 59 (1.1%) | 13 (0.3%) |
| 12:00 PM to 3:59 PM | 556 (10.7%) | 438 (9.8%) |
| 4:00 PM to 11:59 PM | 294 (5.7%) | 221 (5.0%) |
| Total | 5,186 (100.0%) | 4,450 (100.0%) |
Housing Occupancy in Forest Lake
Occupancy by Ownership in Forest Lake
Of the total 8,051 dwellings in Forest Lake, owner-occupied units account for 5,887 (73.1%), while renter-occupied units make up 2,164 (26.9%).
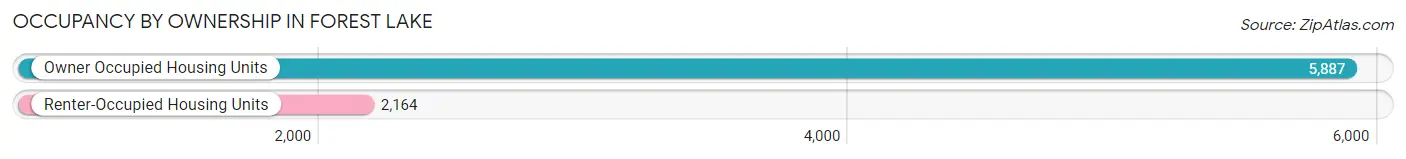
| Occupancy | # Housing Units | % Housing Units |
| Owner Occupied Housing Units | 5,887 | 73.1% |
| Renter-Occupied Housing Units | 2,164 | 26.9% |
| Total Occupied Housing Units | 8,051 | 100.0% |
Occupancy by Household Size in Forest Lake
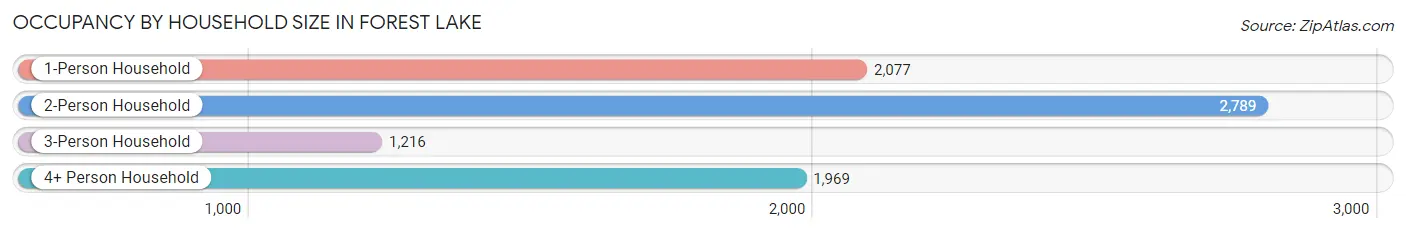
| Household Size | # Housing Units | % Housing Units |
| 1-Person Household | 2,077 | 25.8% |
| 2-Person Household | 2,789 | 34.6% |
| 3-Person Household | 1,216 | 15.1% |
| 4+ Person Household | 1,969 | 24.5% |
| Total Housing Units | 8,051 | 100.0% |
Occupancy by Ownership by Household Size in Forest Lake
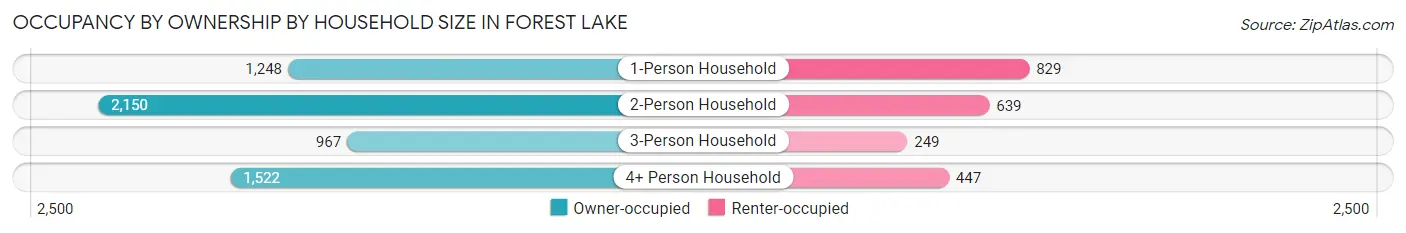
| Household Size | Owner-occupied | Renter-occupied |
| 1-Person Household | 1,248 (60.1%) | 829 (39.9%) |
| 2-Person Household | 2,150 (77.1%) | 639 (22.9%) |
| 3-Person Household | 967 (79.5%) | 249 (20.5%) |
| 4+ Person Household | 1,522 (77.3%) | 447 (22.7%) |
| Total Housing Units | 5,887 (73.1%) | 2,164 (26.9%) |
Occupancy by Educational Attainment in Forest Lake
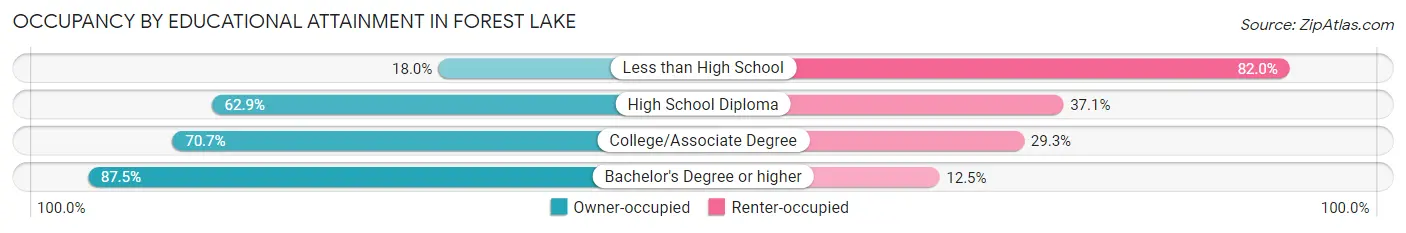
| Household Size | Owner-occupied | Renter-occupied |
| Less than High School | 60 (18.0%) | 273 (82.0%) |
| High School Diploma | 1,216 (62.9%) | 717 (37.1%) |
| College/Associate Degree | 1,895 (70.7%) | 785 (29.3%) |
| Bachelor's Degree or higher | 2,716 (87.5%) | 389 (12.5%) |
Occupancy by Age of Householder in Forest Lake
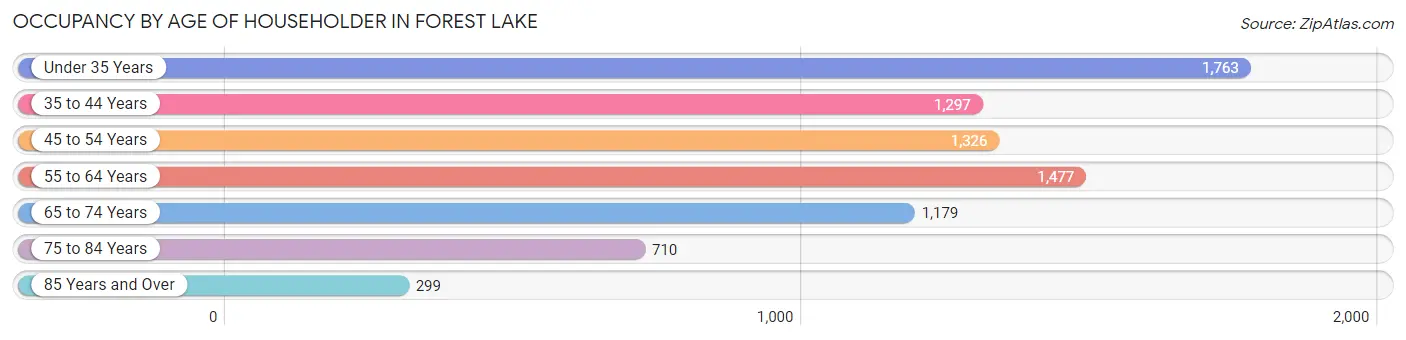
| Age Bracket | # Households | % Households |
| Under 35 Years | 1,763 | 21.9% |
| 35 to 44 Years | 1,297 | 16.1% |
| 45 to 54 Years | 1,326 | 16.5% |
| 55 to 64 Years | 1,477 | 18.3% |
| 65 to 74 Years | 1,179 | 14.6% |
| 75 to 84 Years | 710 | 8.8% |
| 85 Years and Over | 299 | 3.7% |
| Total | 8,051 | 100.0% |
Housing Finances in Forest Lake
Median Income by Occupancy in Forest Lake
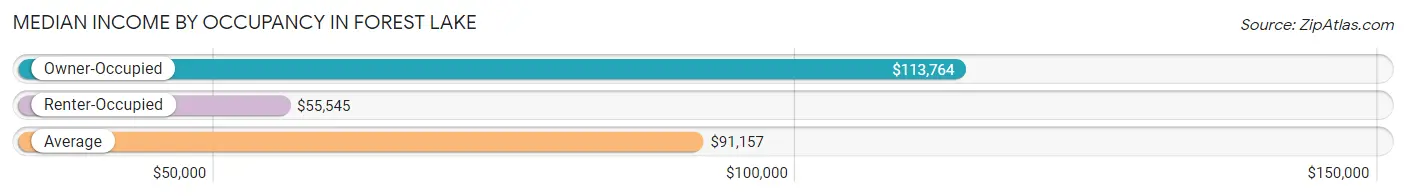
| Occupancy Type | # Households | Median Income |
| Owner-Occupied | 5,887 (73.1%) | $113,764 |
| Renter-Occupied | 2,164 (26.9%) | $55,545 |
| Average | 8,051 (100.0%) | $91,157 |
Occupancy by Householder Income Bracket in Forest Lake
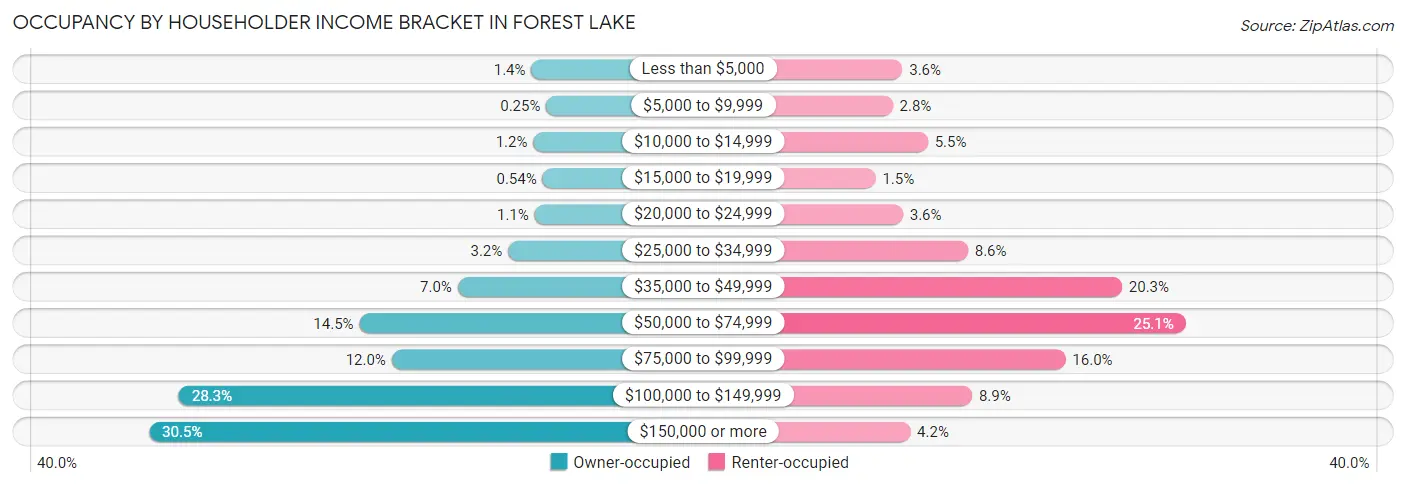
| Income Bracket | Owner-occupied | Renter-occupied |
| Less than $5,000 | 82 (1.4%) | 77 (3.6%) |
| $5,000 to $9,999 | 15 (0.3%) | 61 (2.8%) |
| $10,000 to $14,999 | 73 (1.2%) | 119 (5.5%) |
| $15,000 to $19,999 | 32 (0.5%) | 33 (1.5%) |
| $20,000 to $24,999 | 67 (1.1%) | 78 (3.6%) |
| $25,000 to $34,999 | 186 (3.2%) | 185 (8.6%) |
| $35,000 to $49,999 | 412 (7.0%) | 439 (20.3%) |
| $50,000 to $74,999 | 853 (14.5%) | 544 (25.1%) |
| $75,000 to $99,999 | 708 (12.0%) | 346 (16.0%) |
| $100,000 to $149,999 | 1,663 (28.2%) | 192 (8.9%) |
| $150,000 or more | 1,796 (30.5%) | 90 (4.2%) |
| Total | 5,887 (100.0%) | 2,164 (100.0%) |
Monthly Housing Cost Tiers in Forest Lake
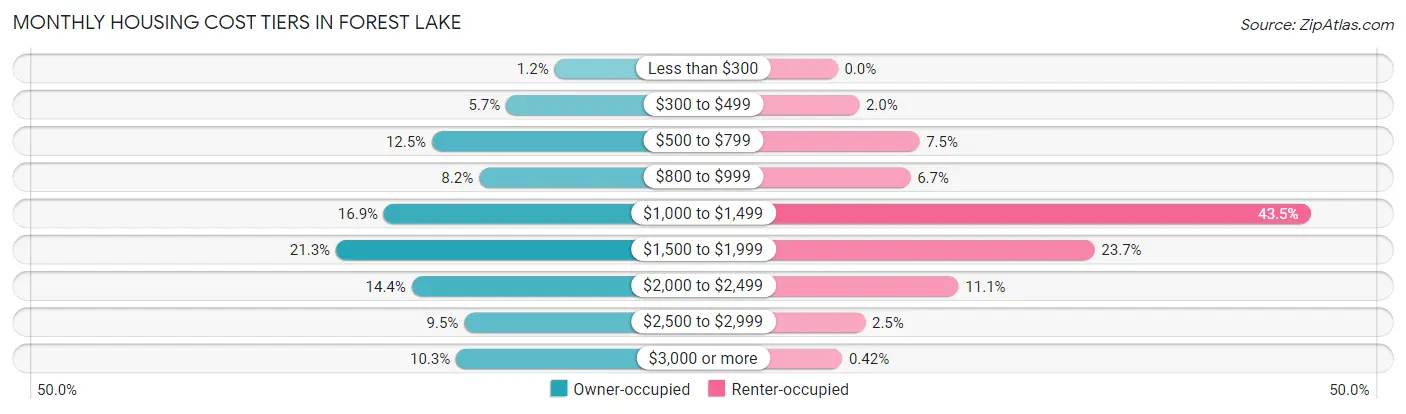
| Monthly Cost | Owner-occupied | Renter-occupied |
| Less than $300 | 72 (1.2%) | 0 (0.0%) |
| $300 to $499 | 334 (5.7%) | 43 (2.0%) |
| $500 to $799 | 736 (12.5%) | 163 (7.5%) |
| $800 to $999 | 481 (8.2%) | 145 (6.7%) |
| $1,000 to $1,499 | 996 (16.9%) | 942 (43.5%) |
| $1,500 to $1,999 | 1,256 (21.3%) | 512 (23.7%) |
| $2,000 to $2,499 | 846 (14.4%) | 241 (11.1%) |
| $2,500 to $2,999 | 561 (9.5%) | 55 (2.5%) |
| $3,000 or more | 605 (10.3%) | 9 (0.4%) |
| Total | 5,887 (100.0%) | 2,164 (100.0%) |
Physical Housing Characteristics in Forest Lake
Housing Structures in Forest Lake
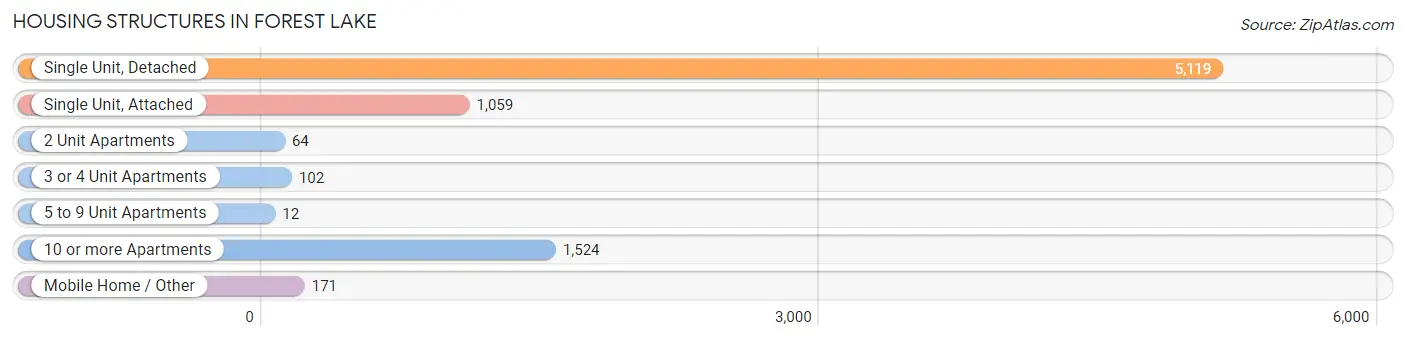
| Structure Type | # Housing Units | % Housing Units |
| Single Unit, Detached | 5,119 | 63.6% |
| Single Unit, Attached | 1,059 | 13.2% |
| 2 Unit Apartments | 64 | 0.8% |
| 3 or 4 Unit Apartments | 102 | 1.3% |
| 5 to 9 Unit Apartments | 12 | 0.2% |
| 10 or more Apartments | 1,524 | 18.9% |
| Mobile Home / Other | 171 | 2.1% |
| Total | 8,051 | 100.0% |
Housing Structures by Occupancy in Forest Lake
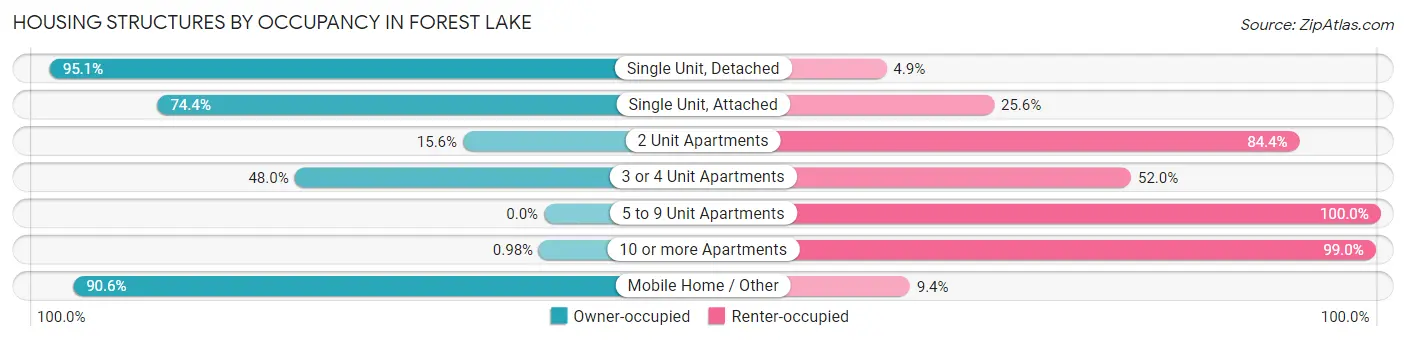
| Structure Type | Owner-occupied | Renter-occupied |
| Single Unit, Detached | 4,870 (95.1%) | 249 (4.9%) |
| Single Unit, Attached | 788 (74.4%) | 271 (25.6%) |
| 2 Unit Apartments | 10 (15.6%) | 54 (84.4%) |
| 3 or 4 Unit Apartments | 49 (48.0%) | 53 (52.0%) |
| 5 to 9 Unit Apartments | 0 (0.0%) | 12 (100.0%) |
| 10 or more Apartments | 15 (1.0%) | 1,509 (99.0%) |
| Mobile Home / Other | 155 (90.6%) | 16 (9.4%) |
| Total | 5,887 (73.1%) | 2,164 (26.9%) |
Housing Structures by Number of Rooms in Forest Lake
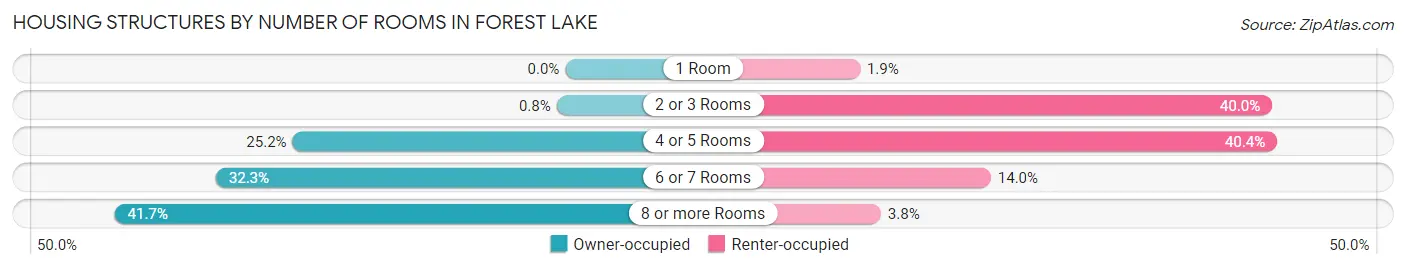
| Number of Rooms | Owner-occupied | Renter-occupied |
| 1 Room | 0 (0.0%) | 40 (1.8%) |
| 2 or 3 Rooms | 47 (0.8%) | 865 (40.0%) |
| 4 or 5 Rooms | 1,485 (25.2%) | 875 (40.4%) |
| 6 or 7 Rooms | 1,902 (32.3%) | 302 (14.0%) |
| 8 or more Rooms | 2,453 (41.7%) | 82 (3.8%) |
| Total | 5,887 (100.0%) | 2,164 (100.0%) |
Housing Structure by Heating Type in Forest Lake
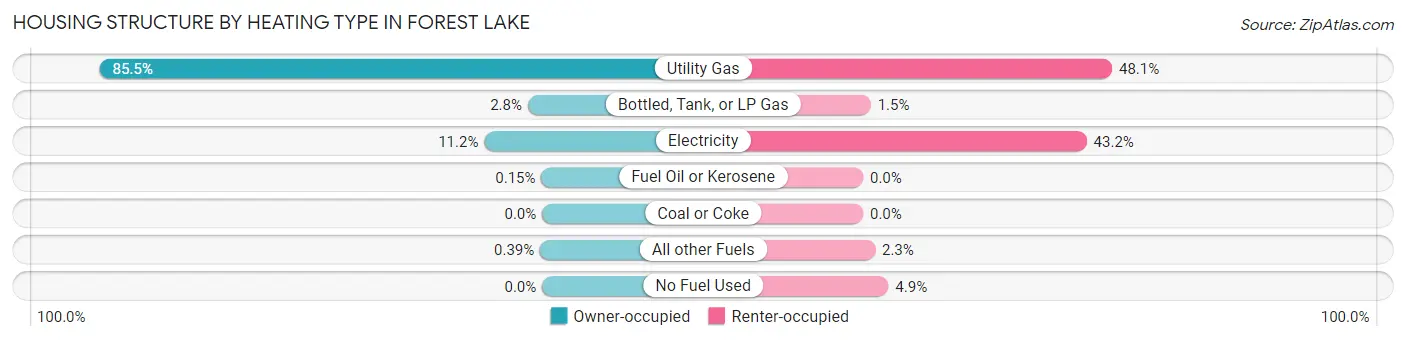
| Heating Type | Owner-occupied | Renter-occupied |
| Utility Gas | 5,034 (85.5%) | 1,041 (48.1%) |
| Bottled, Tank, or LP Gas | 163 (2.8%) | 32 (1.5%) |
| Electricity | 658 (11.2%) | 935 (43.2%) |
| Fuel Oil or Kerosene | 9 (0.2%) | 0 (0.0%) |
| Coal or Coke | 0 (0.0%) | 0 (0.0%) |
| All other Fuels | 23 (0.4%) | 50 (2.3%) |
| No Fuel Used | 0 (0.0%) | 106 (4.9%) |
| Total | 5,887 (100.0%) | 2,164 (100.0%) |
Household Vehicle Usage in Forest Lake
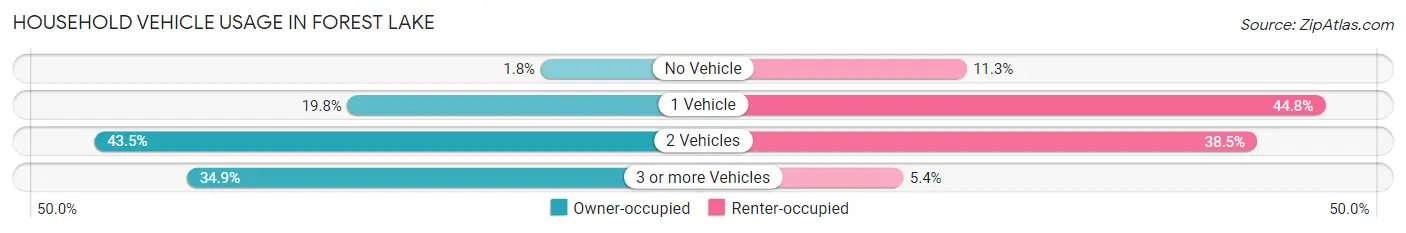
| Vehicles per Household | Owner-occupied | Renter-occupied |
| No Vehicle | 106 (1.8%) | 245 (11.3%) |
| 1 Vehicle | 1,168 (19.8%) | 970 (44.8%) |
| 2 Vehicles | 2,561 (43.5%) | 832 (38.5%) |
| 3 or more Vehicles | 2,052 (34.9%) | 117 (5.4%) |
| Total | 5,887 (100.0%) | 2,164 (100.0%) |
Real Estate & Mortgages in Forest Lake
Real Estate and Mortgage Overview in Forest Lake
| Characteristic | Without Mortgage | With Mortgage |
| Housing Units | 1,720 | 4,167 |
| Median Property Value | $360,700 | $356,300 |
| Median Household Income | $91,324 | $1,243 |
| Monthly Housing Costs | $736 | $605 |
| Real Estate Taxes | $3,398 | $0 |
Property Value by Mortgage Status in Forest Lake
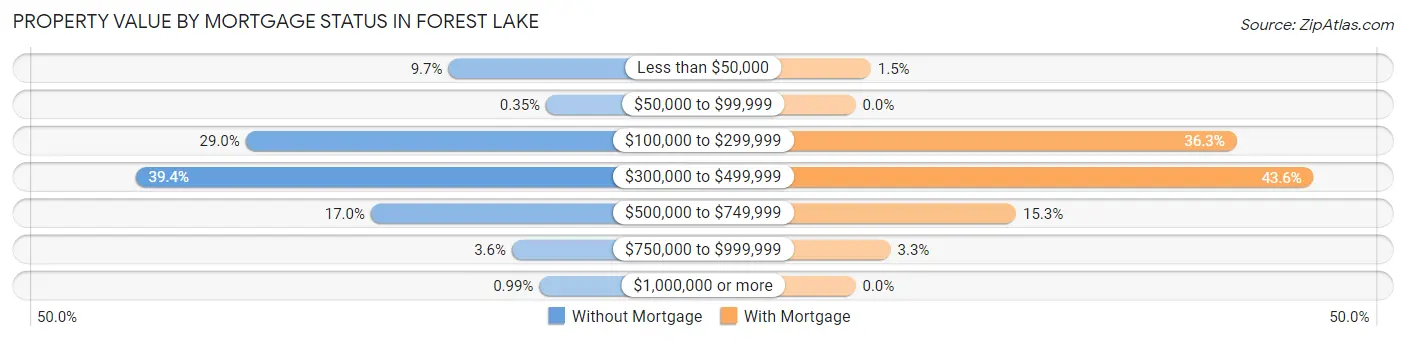
| Property Value | Without Mortgage | With Mortgage |
| Less than $50,000 | 166 (9.7%) | 61 (1.5%) |
| $50,000 to $99,999 | 6 (0.4%) | 0 (0.0%) |
| $100,000 to $299,999 | 498 (28.9%) | 1,512 (36.3%) |
| $300,000 to $499,999 | 678 (39.4%) | 1,818 (43.6%) |
| $500,000 to $749,999 | 293 (17.0%) | 637 (15.3%) |
| $750,000 to $999,999 | 62 (3.6%) | 139 (3.3%) |
| $1,000,000 or more | 17 (1.0%) | 0 (0.0%) |
| Total | 1,720 (100.0%) | 4,167 (100.0%) |
Household Income by Mortgage Status in Forest Lake
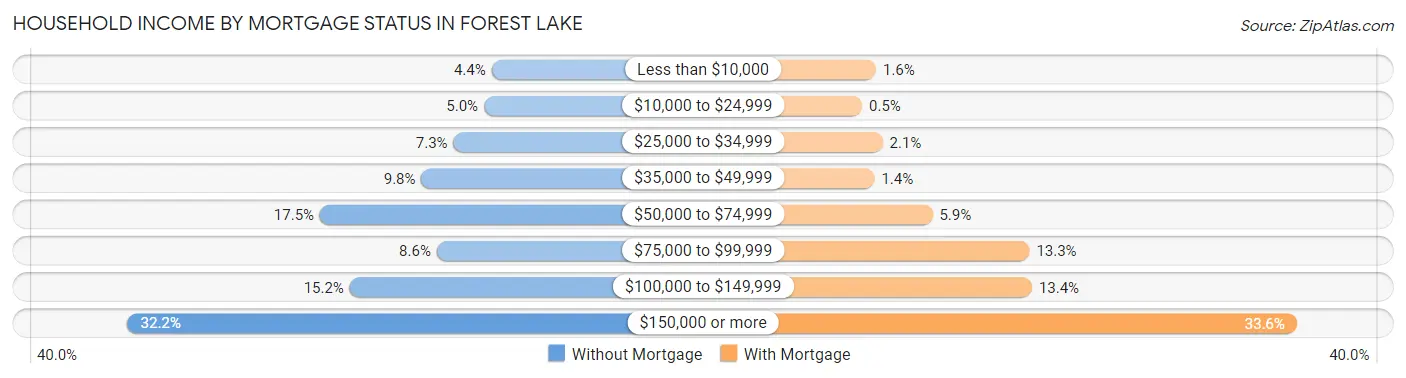
| Household Income | Without Mortgage | With Mortgage |
| Less than $10,000 | 76 (4.4%) | 65 (1.6%) |
| $10,000 to $24,999 | 86 (5.0%) | 21 (0.5%) |
| $25,000 to $34,999 | 126 (7.3%) | 86 (2.1%) |
| $35,000 to $49,999 | 168 (9.8%) | 60 (1.4%) |
| $50,000 to $74,999 | 301 (17.5%) | 244 (5.9%) |
| $75,000 to $99,999 | 148 (8.6%) | 552 (13.3%) |
| $100,000 to $149,999 | 262 (15.2%) | 560 (13.4%) |
| $150,000 or more | 553 (32.2%) | 1,401 (33.6%) |
| Total | 1,720 (100.0%) | 4,167 (100.0%) |
Property Value to Household Income Ratio in Forest Lake
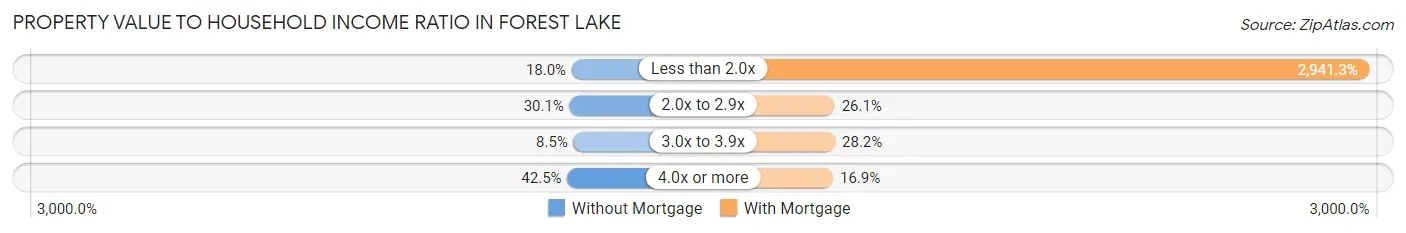
| Value-to-Income Ratio | Without Mortgage | With Mortgage |
| Less than 2.0x | 309 (18.0%) | 122,565 (2,941.3%) |
| 2.0x to 2.9x | 518 (30.1%) | 1,086 (26.1%) |
| 3.0x to 3.9x | 146 (8.5%) | 1,174 (28.2%) |
| 4.0x or more | 731 (42.5%) | 703 (16.9%) |
| Total | 1,720 (100.0%) | 4,167 (100.0%) |
Real Estate Taxes by Mortgage Status in Forest Lake
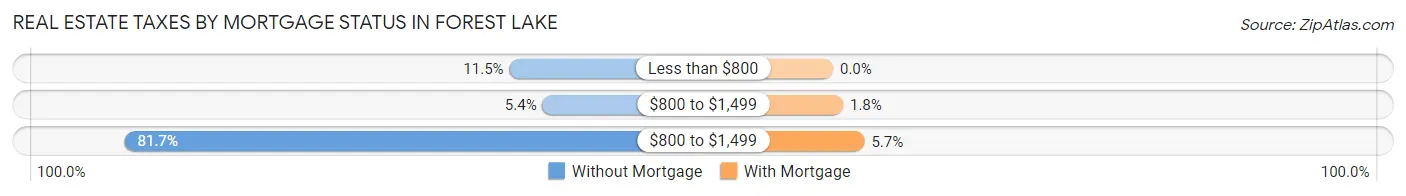
| Property Taxes | Without Mortgage | With Mortgage |
| Less than $800 | 197 (11.5%) | 0 (0.0%) |
| $800 to $1,499 | 93 (5.4%) | 76 (1.8%) |
| $800 to $1,499 | 1,406 (81.7%) | 239 (5.7%) |
| Total | 1,720 (100.0%) | 4,167 (100.0%) |
Health & Disability in Forest Lake
Health Insurance Coverage by Age in Forest Lake
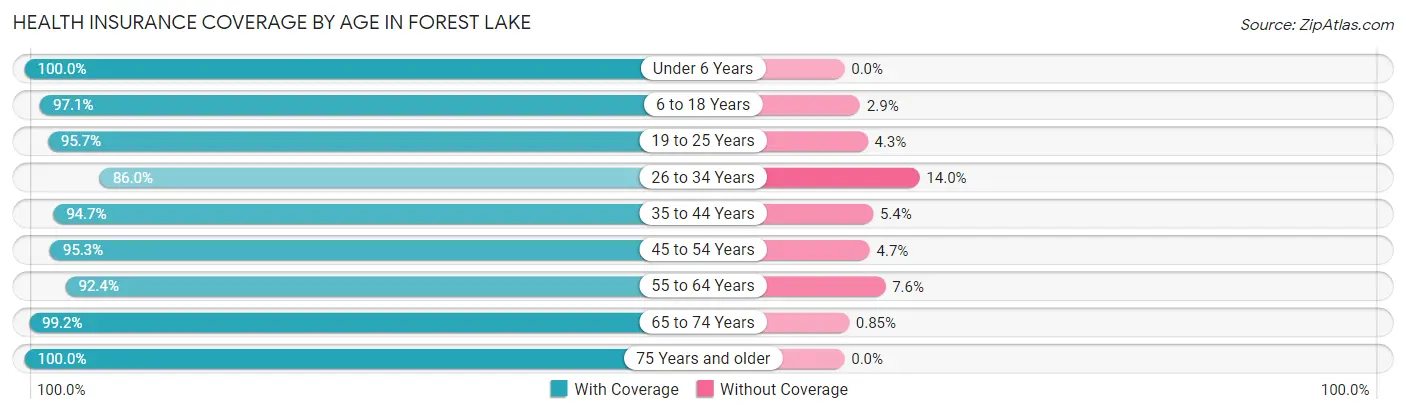
| Age Bracket | With Coverage | Without Coverage |
| Under 6 Years | 1,500 (100.0%) | 0 (0.0%) |
| 6 to 18 Years | 3,440 (97.1%) | 103 (2.9%) |
| 19 to 25 Years | 1,766 (95.7%) | 80 (4.3%) |
| 26 to 34 Years | 2,344 (86.0%) | 382 (14.0%) |
| 35 to 44 Years | 2,335 (94.7%) | 132 (5.3%) |
| 45 to 54 Years | 2,541 (95.3%) | 126 (4.7%) |
| 55 to 64 Years | 2,347 (92.4%) | 194 (7.6%) |
| 65 to 74 Years | 1,863 (99.2%) | 16 (0.9%) |
| 75 Years and older | 1,289 (100.0%) | 0 (0.0%) |
| Total | 19,425 (95.0%) | 1,033 (5.1%) |
Health Insurance Coverage by Citizenship Status in Forest Lake
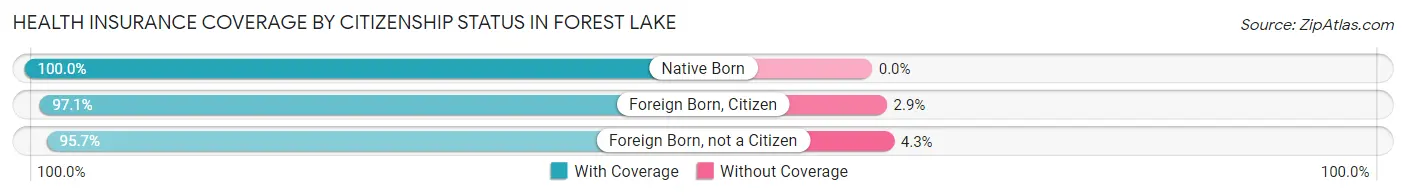
| Citizenship Status | With Coverage | Without Coverage |
| Native Born | 1,500 (100.0%) | 0 (0.0%) |
| Foreign Born, Citizen | 3,440 (97.1%) | 103 (2.9%) |
| Foreign Born, not a Citizen | 1,766 (95.7%) | 80 (4.3%) |
Health Insurance Coverage by Household Income in Forest Lake
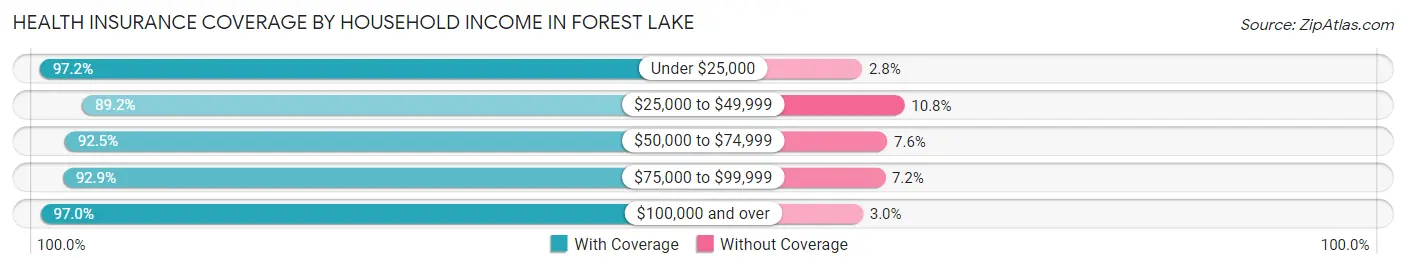
| Household Income | With Coverage | Without Coverage |
| Under $25,000 | 821 (97.2%) | 24 (2.8%) |
| $25,000 to $49,999 | 2,183 (89.2%) | 264 (10.8%) |
| $50,000 to $74,999 | 2,817 (92.4%) | 230 (7.5%) |
| $75,000 to $99,999 | 2,079 (92.8%) | 160 (7.1%) |
| $100,000 and over | 11,497 (97.0%) | 354 (3.0%) |
Public vs Private Health Insurance Coverage by Age in Forest Lake
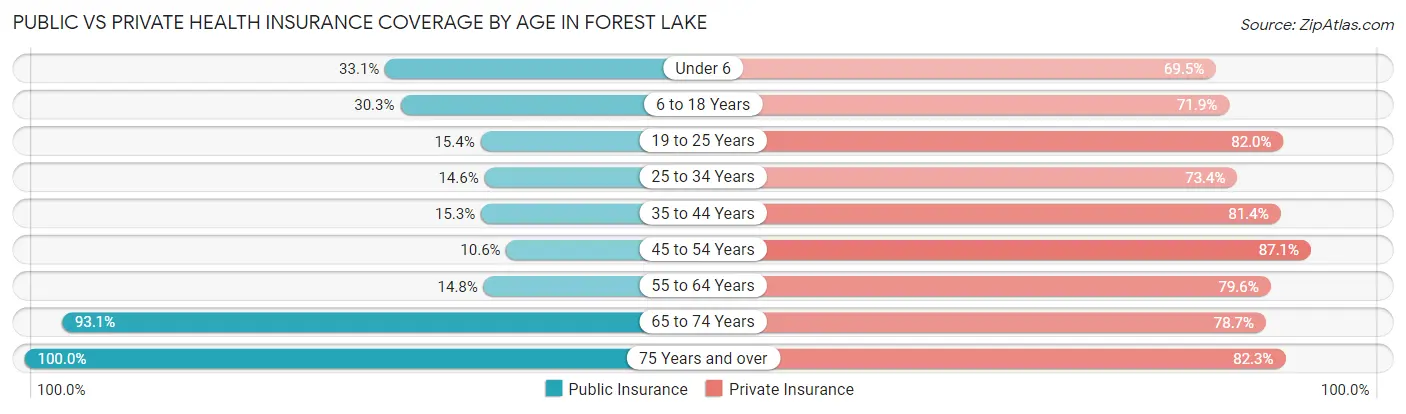
| Age Bracket | Public Insurance | Private Insurance |
| Under 6 | 496 (33.1%) | 1,042 (69.5%) |
| 6 to 18 Years | 1,072 (30.3%) | 2,547 (71.9%) |
| 19 to 25 Years | 284 (15.4%) | 1,513 (82.0%) |
| 25 to 34 Years | 399 (14.6%) | 2,001 (73.4%) |
| 35 to 44 Years | 377 (15.3%) | 2,009 (81.4%) |
| 45 to 54 Years | 282 (10.6%) | 2,322 (87.1%) |
| 55 to 64 Years | 376 (14.8%) | 2,022 (79.6%) |
| 65 to 74 Years | 1,749 (93.1%) | 1,479 (78.7%) |
| 75 Years and over | 1,289 (100.0%) | 1,061 (82.3%) |
| Total | 6,324 (30.9%) | 15,996 (78.2%) |
Disability Status by Sex by Age in Forest Lake
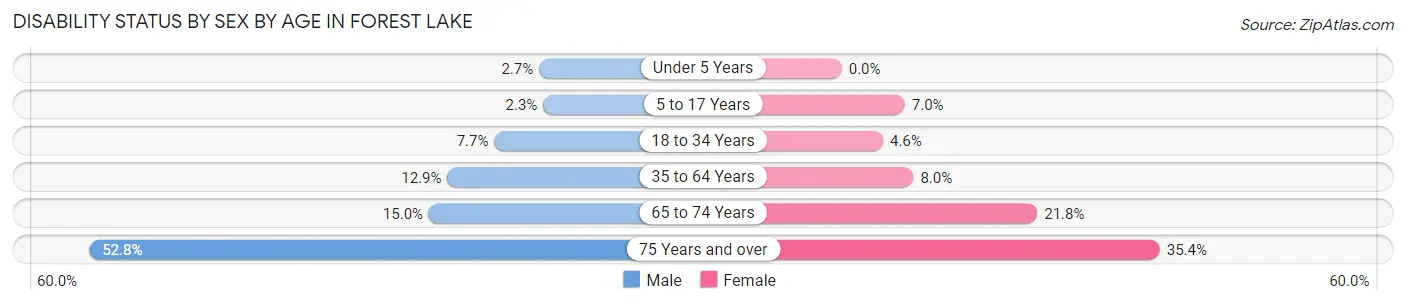
| Age Bracket | Male | Female |
| Under 5 Years | 19 (2.7%) | 0 (0.0%) |
| 5 to 17 Years | 37 (2.2%) | 138 (7.0%) |
| 18 to 34 Years | 178 (7.7%) | 109 (4.6%) |
| 35 to 64 Years | 504 (12.9%) | 301 (8.0%) |
| 65 to 74 Years | 132 (15.0%) | 217 (21.8%) |
| 75 Years and over | 226 (52.8%) | 305 (35.4%) |
Disability Class by Sex by Age in Forest Lake
Disability Class: Hearing Difficulty
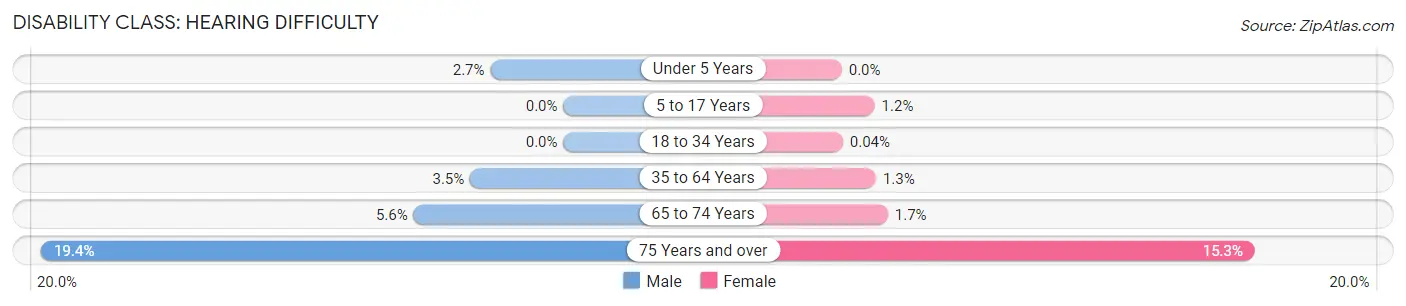
| Age Bracket | Male | Female |
| Under 5 Years | 19 (2.7%) | 0 (0.0%) |
| 5 to 17 Years | 0 (0.0%) | 24 (1.2%) |
| 18 to 34 Years | 0 (0.0%) | 1 (0.0%) |
| 35 to 64 Years | 135 (3.5%) | 48 (1.3%) |
| 65 to 74 Years | 49 (5.6%) | 17 (1.7%) |
| 75 Years and over | 83 (19.4%) | 132 (15.3%) |
Disability Class: Vision Difficulty
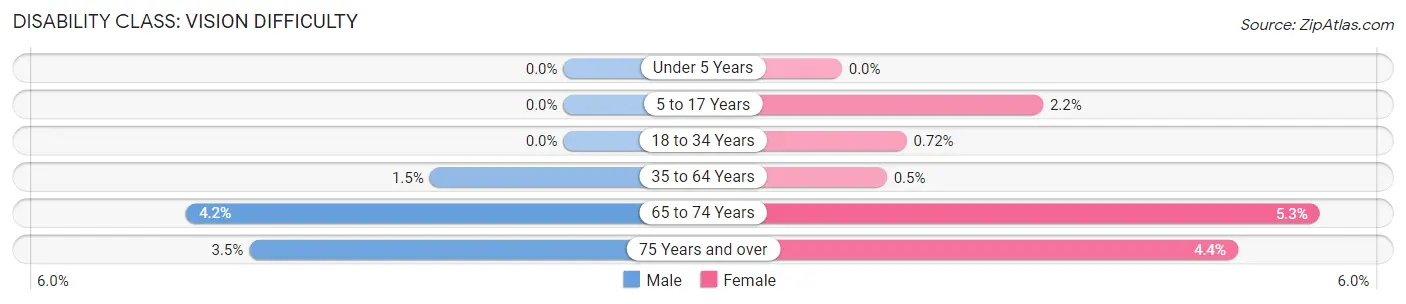
| Age Bracket | Male | Female |
| Under 5 Years | 0 (0.0%) | 0 (0.0%) |
| 5 to 17 Years | 0 (0.0%) | 44 (2.2%) |
| 18 to 34 Years | 0 (0.0%) | 17 (0.7%) |
| 35 to 64 Years | 58 (1.5%) | 19 (0.5%) |
| 65 to 74 Years | 37 (4.2%) | 53 (5.3%) |
| 75 Years and over | 15 (3.5%) | 38 (4.4%) |
Disability Class: Cognitive Difficulty
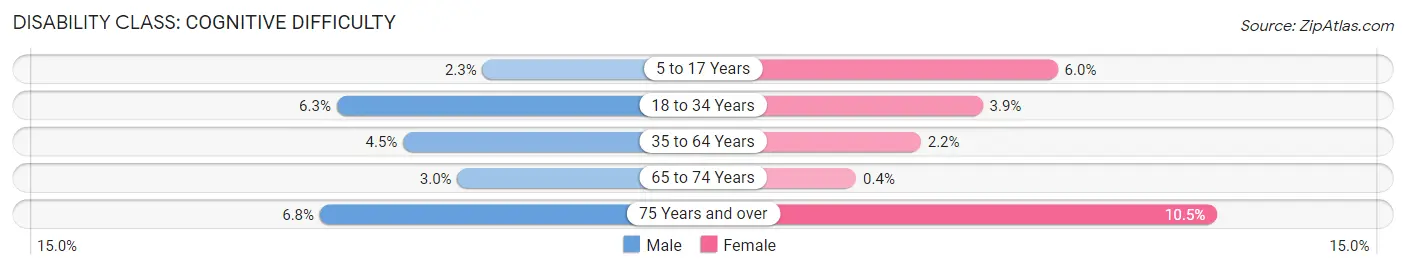
| Age Bracket | Male | Female |
| 5 to 17 Years | 37 (2.2%) | 118 (6.0%) |
| 18 to 34 Years | 146 (6.3%) | 93 (3.9%) |
| 35 to 64 Years | 174 (4.5%) | 83 (2.2%) |
| 65 to 74 Years | 26 (2.9%) | 4 (0.4%) |
| 75 Years and over | 29 (6.8%) | 90 (10.4%) |
Disability Class: Ambulatory Difficulty
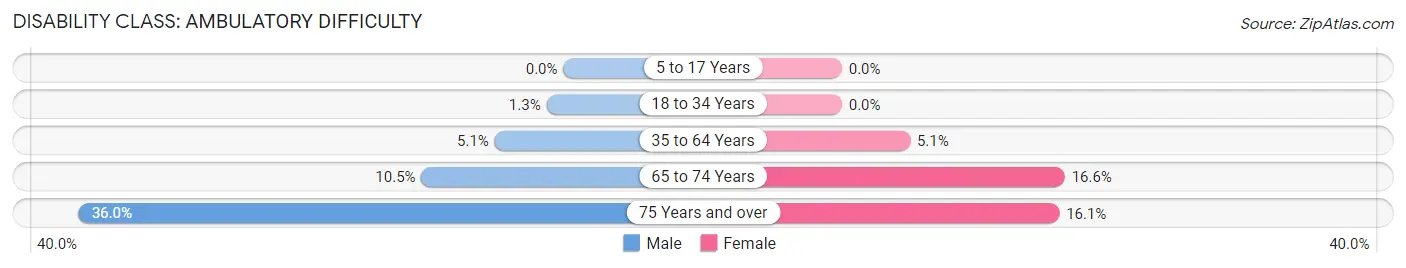
| Age Bracket | Male | Female |
| 5 to 17 Years | 0 (0.0%) | 0 (0.0%) |
| 18 to 34 Years | 29 (1.3%) | 0 (0.0%) |
| 35 to 64 Years | 199 (5.1%) | 191 (5.1%) |
| 65 to 74 Years | 93 (10.5%) | 165 (16.6%) |
| 75 Years and over | 154 (36.0%) | 139 (16.1%) |
Disability Class: Self-Care Difficulty
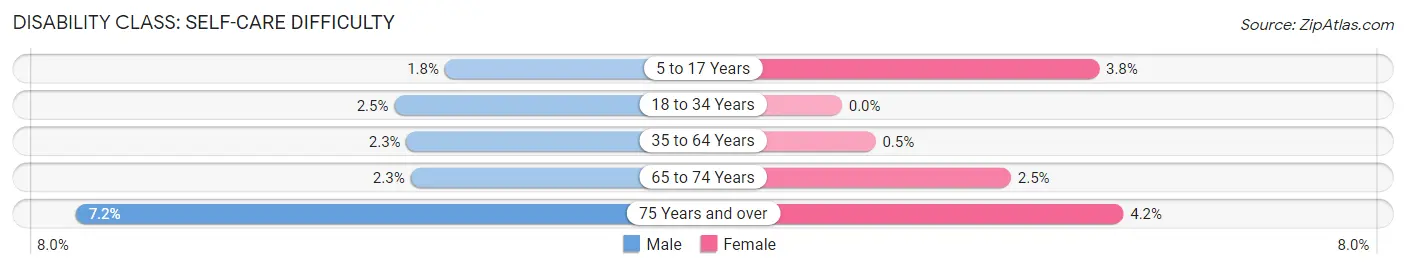
| Age Bracket | Male | Female |
| 5 to 17 Years | 29 (1.8%) | 75 (3.8%) |
| 18 to 34 Years | 58 (2.5%) | 0 (0.0%) |
| 35 to 64 Years | 91 (2.3%) | 19 (0.5%) |
| 65 to 74 Years | 20 (2.3%) | 25 (2.5%) |
| 75 Years and over | 31 (7.2%) | 36 (4.2%) |
Technology Access in Forest Lake
Computing Device Access in Forest Lake
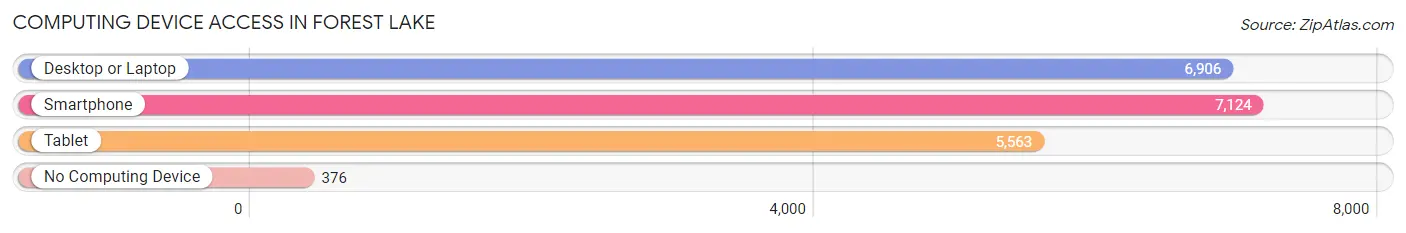
| Device Type | # Households | % Households |
| Desktop or Laptop | 6,906 | 85.8% |
| Smartphone | 7,124 | 88.5% |
| Tablet | 5,563 | 69.1% |
| No Computing Device | 376 | 4.7% |
| Total | 8,051 | 100.0% |
Internet Access in Forest Lake
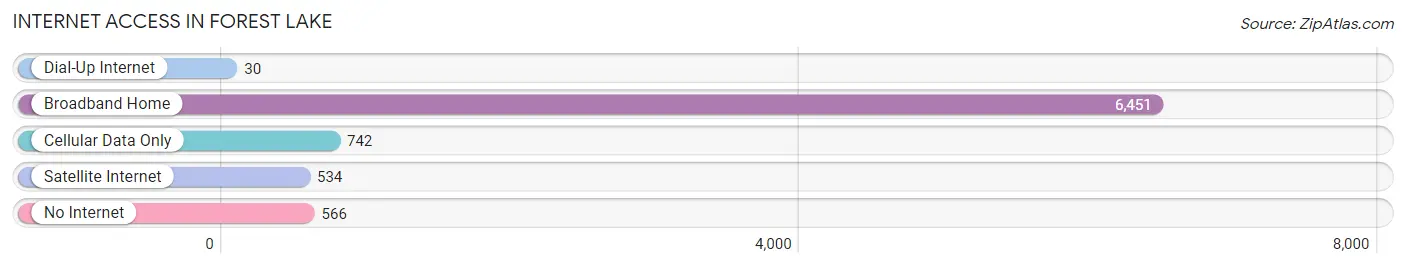
| Internet Type | # Households | % Households |
| Dial-Up Internet | 30 | 0.4% |
| Broadband Home | 6,451 | 80.1% |
| Cellular Data Only | 742 | 9.2% |
| Satellite Internet | 534 | 6.6% |
| No Internet | 566 | 7.0% |
| Total | 8,051 | 100.0% |
Forest Lake Summary
Lake Forest, Minnesota is a small city located in Washington County, Minnesota. It is situated on the north shore of Forest Lake, a large lake that is part of the St. Croix River watershed. The city is located approximately 25 miles northeast of Minneapolis and is part of the Twin Cities metropolitan area. As of the 2010 census, the population of Lake Forest was 8,921.
History
The area that is now Lake Forest was originally inhabited by the Ojibwe people. The first European settlers arrived in the area in the early 1800s. The first permanent settlement was established in 1844 by a group of Swedish immigrants. The settlement was named Forest Lake after the nearby lake.
In 1858, the first post office was established in the area. The town was officially incorporated in 1887. In the early 1900s, the town began to grow rapidly as the railroad was extended to the area. This allowed for the development of the lumber industry, which was a major source of employment for the town.
In the 1950s, the town began to experience a population boom as people moved to the area from the Twin Cities. This growth continued into the 1960s and 1970s, and the town was eventually incorporated as a city in 1974.
Geography
Lake Forest is located in Washington County, Minnesota. It is situated on the north shore of Forest Lake, a large lake that is part of the St. Croix River watershed. The city is located approximately 25 miles northeast of Minneapolis and is part of the Twin Cities metropolitan area.
The city has a total area of 8.2 square miles, of which 7.9 square miles is land and 0.3 square miles is water. The terrain is mostly flat, with some rolling hills in the northern part of the city.
Economy
The economy of Lake Forest is largely based on the service industry. The city is home to several large employers, including the Forest Lake Area School District, the Forest Lake Area Chamber of Commerce, and the Forest Lake Area Community Center.
The city is also home to several small businesses, including restaurants, retail stores, and professional services. The city is also home to several manufacturing companies, including a paper mill and a plastics factory.
Demographics
As of the 2010 census, the population of Lake Forest was 8,921. The racial makeup of the city was 94.2% White, 1.2% African American, 0.4% Native American, 1.7% Asian, 0.1% Pacific Islander, 0.9% from other races, and 1.5% from two or more races. Hispanic or Latino of any race were 2.7% of the population.
The median income for a household in the city was $60,945, and the median income for a family was $71,945. The per capita income for the city was $27,945. About 4.2% of families and 5.7% of the population were below the poverty line, including 6.3% of those under age 18 and 5.2% of those age 65 or over.
Common Questions
What is Per Capita Income in Forest Lake?
Per Capita income in Forest Lake is $44,179.
What is the Median Family Income in Forest Lake?
Median Family Income in Forest Lake is $115,608.
What is the Median Household income in Forest Lake?
Median Household Income in Forest Lake is $91,157.
What is Income or Wage Gap in Forest Lake?
Income or Wage Gap in Forest Lake is 21.0%.
Women in Forest Lake earn 79.0 cents for every dollar earned by a man.
What is Inequality or Gini Index in Forest Lake?
Inequality or Gini Index in Forest Lake is 0.39.
What is the Total Population of Forest Lake?
Total Population of Forest Lake is 20,553.
What is the Total Male Population of Forest Lake?
Total Male Population of Forest Lake is 9,922.
What is the Total Female Population of Forest Lake?
Total Female Population of Forest Lake is 10,631.
What is the Ratio of Males per 100 Females in Forest Lake?
There are 93.33 Males per 100 Females in Forest Lake.
What is the Ratio of Females per 100 Males in Forest Lake?
There are 107.15 Females per 100 Males in Forest Lake.
What is the Median Population Age in Forest Lake?
Median Population Age in Forest Lake is 37.9 Years.
What is the Average Family Size in Forest Lake
Average Family Size in Forest Lake is 3.1 People.
What is the Average Household Size in Forest Lake
Average Household Size in Forest Lake is 2.5 People.
How Large is the Labor Force in Forest Lake?
There are 11,960 People in the Labor Forcein in Forest Lake.
What is the Percentage of People in the Labor Force in Forest Lake?
73.4% of People are in the Labor Force in Forest Lake.
What is the Unemployment Rate in Forest Lake?
Unemployment Rate in Forest Lake is 4.5%.