Cornelius, OR Map & Demographics
Cornelius Map
Cornelius Overview
$34,549
PER CAPITA INCOME
$76,530
AVG FAMILY INCOME
$83,051
AVG HOUSEHOLD INCOME
22.3%
WAGE / INCOME GAP [ % ]
77.7¢/ $1
WAGE / INCOME GAP [ $ ]
0.40
INEQUALITY / GINI INDEX
13,245
TOTAL POPULATION
6,459
MALE POPULATION
6,786
FEMALE POPULATION
95.18
MALES / 100 FEMALES
105.06
FEMALES / 100 MALES
37.4
MEDIAN AGE
3.3
AVG FAMILY SIZE
3.0
AVG HOUSEHOLD SIZE
7,081
LABOR FORCE [ PEOPLE ]
67.3%
PERCENT IN LABOR FORCE
4.4%
UNEMPLOYMENT RATE
Cornelius Zip Codes
Income in Cornelius
Income Overview in Cornelius
Per Capita Income in Cornelius is $34,549, while median incomes of families and households are $76,530 and $83,051 respectively.
| Characteristic | Number | Measure |
| Per Capita Income | 13,245 | $34,549 |
| Median Family Income | 3,300 | $76,530 |
| Mean Family Income | 3,300 | $104,834 |
| Median Household Income | 4,382 | $83,051 |
| Mean Household Income | 4,382 | $106,679 |
| Income Deficit | 3,300 | $0 |
| Wage / Income Gap (%) | 13,245 | 22.30% |
| Wage / Income Gap ($) | 13,245 | 77.70¢ per $1 |
| Gini / Inequality Index | 13,245 | 0.40 |
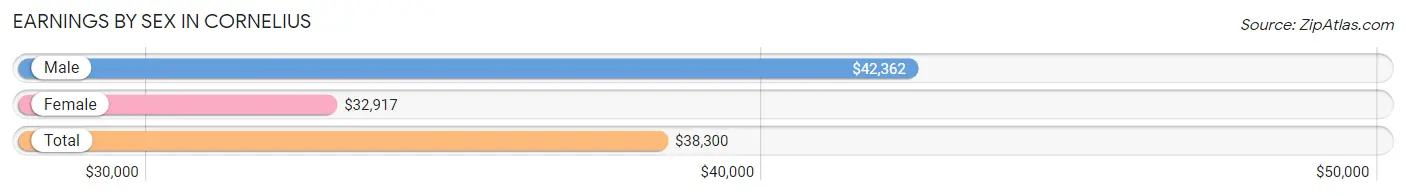
Earnings by Sex in Cornelius
Average Earnings in Cornelius are $38,300, $42,362 for men and $32,917 for women, a difference of 22.3%.
| Sex | Number | Average Earnings |
| Male | 4,009 (55.2%) | $42,362 |
| Female | 3,250 (44.8%) | $32,917 |
| Total | 7,259 (100.0%) | $38,300 |
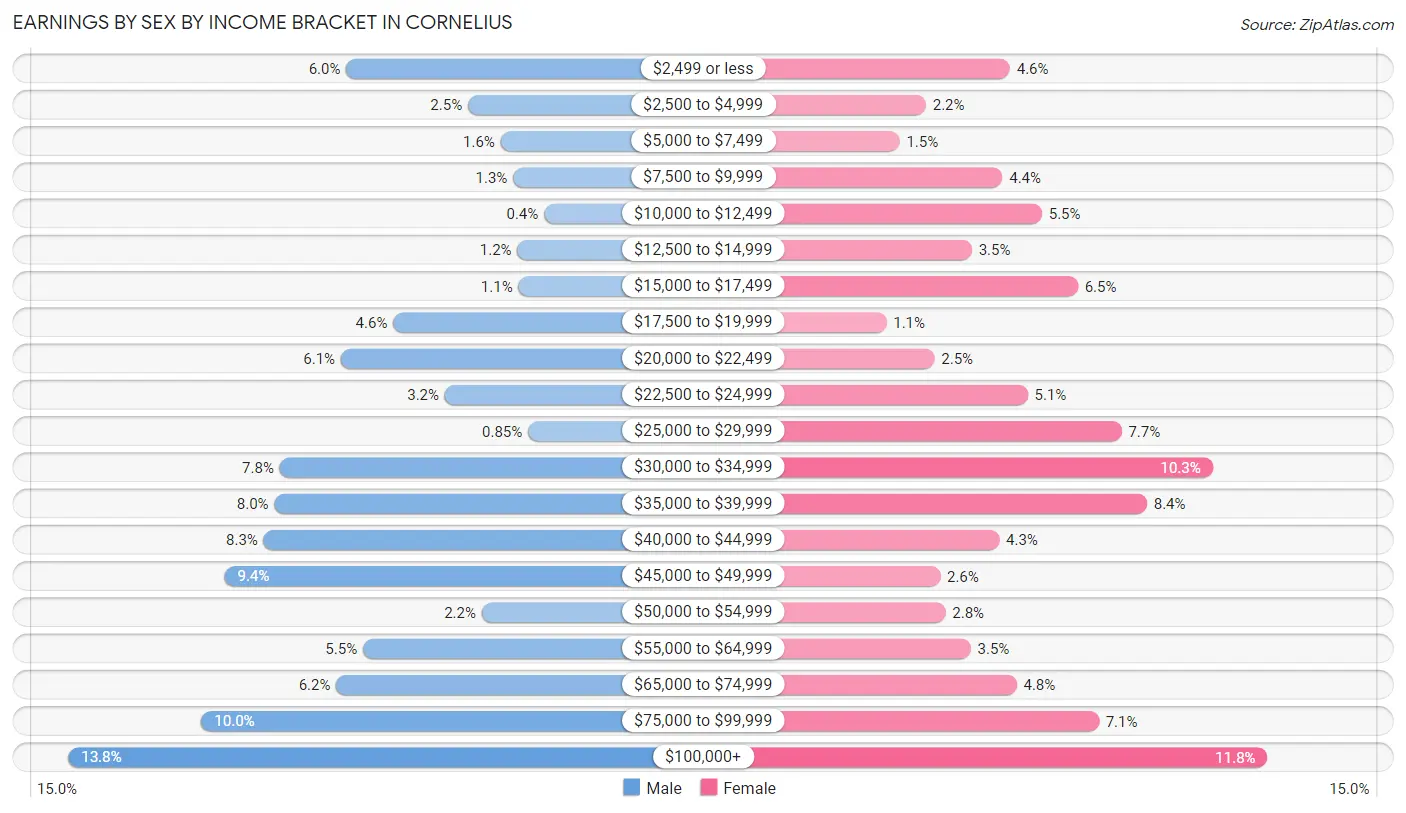
Earnings by Sex by Income Bracket in Cornelius
The most common earnings brackets in Cornelius are $100,000+ for men (552 | 13.8%) and $100,000+ for women (384 | 11.8%).
| Income | Male | Female |
| $2,499 or less | 239 (6.0%) | 149 (4.6%) |
| $2,500 to $4,999 | 102 (2.5%) | 72 (2.2%) |
| $5,000 to $7,499 | 65 (1.6%) | 48 (1.5%) |
| $7,500 to $9,999 | 51 (1.3%) | 142 (4.4%) |
| $10,000 to $12,499 | 16 (0.4%) | 178 (5.5%) |
| $12,500 to $14,999 | 46 (1.1%) | 114 (3.5%) |
| $15,000 to $17,499 | 45 (1.1%) | 211 (6.5%) |
| $17,500 to $19,999 | 186 (4.6%) | 36 (1.1%) |
| $20,000 to $22,499 | 245 (6.1%) | 80 (2.5%) |
| $22,500 to $24,999 | 128 (3.2%) | 165 (5.1%) |
| $25,000 to $29,999 | 34 (0.9%) | 251 (7.7%) |
| $30,000 to $34,999 | 314 (7.8%) | 334 (10.3%) |
| $35,000 to $39,999 | 320 (8.0%) | 274 (8.4%) |
| $40,000 to $44,999 | 332 (8.3%) | 139 (4.3%) |
| $45,000 to $49,999 | 376 (9.4%) | 85 (2.6%) |
| $50,000 to $54,999 | 86 (2.1%) | 90 (2.8%) |
| $55,000 to $64,999 | 220 (5.5%) | 113 (3.5%) |
| $65,000 to $74,999 | 250 (6.2%) | 155 (4.8%) |
| $75,000 to $99,999 | 402 (10.0%) | 230 (7.1%) |
| $100,000+ | 552 (13.8%) | 384 (11.8%) |
| Total | 4,009 (100.0%) | 3,250 (100.0%) |
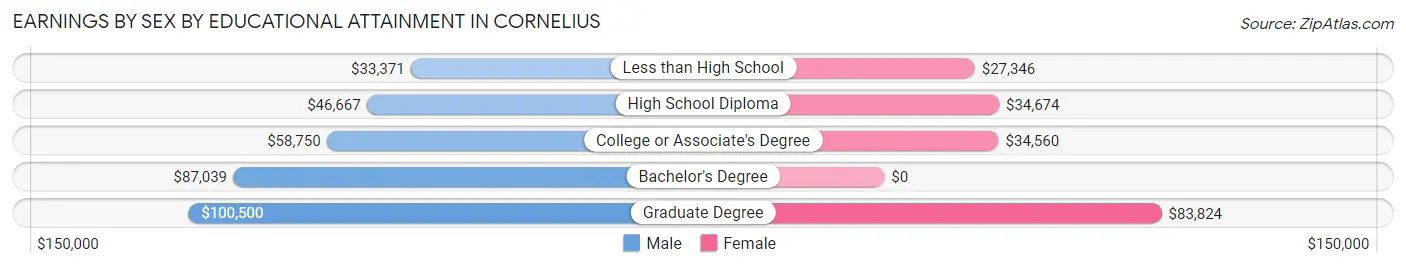
Earnings by Sex by Educational Attainment in Cornelius
Average earnings in Cornelius are $46,354 for men and $34,671 for women, a difference of 25.2%. Men with an educational attainment of graduate degree enjoy the highest average annual earnings of $100,500, while those with less than high school education earn the least with $33,371. Women with an educational attainment of graduate degree earn the most with the average annual earnings of $83,824, while those with less than high school education have the smallest earnings of $27,346.
| Educational Attainment | Male Income | Female Income |
| Less than High School | $33,371 | $27,346 |
| High School Diploma | $46,667 | $34,674 |
| College or Associate's Degree | $58,750 | $34,560 |
| Bachelor's Degree | $87,039 | $0 |
| Graduate Degree | $100,500 | $83,824 |
| Total | $46,354 | $34,671 |
Family Income in Cornelius
Family Income Brackets in Cornelius
According to the Cornelius family income data, there are 551 families falling into the $35,000 to $49,999 income range, which is the most common income bracket and makes up 16.7% of all families. Conversely, the $10,000 to $14,999 income bracket is the least frequent group with only 7 families (0.2%) belonging to this category.
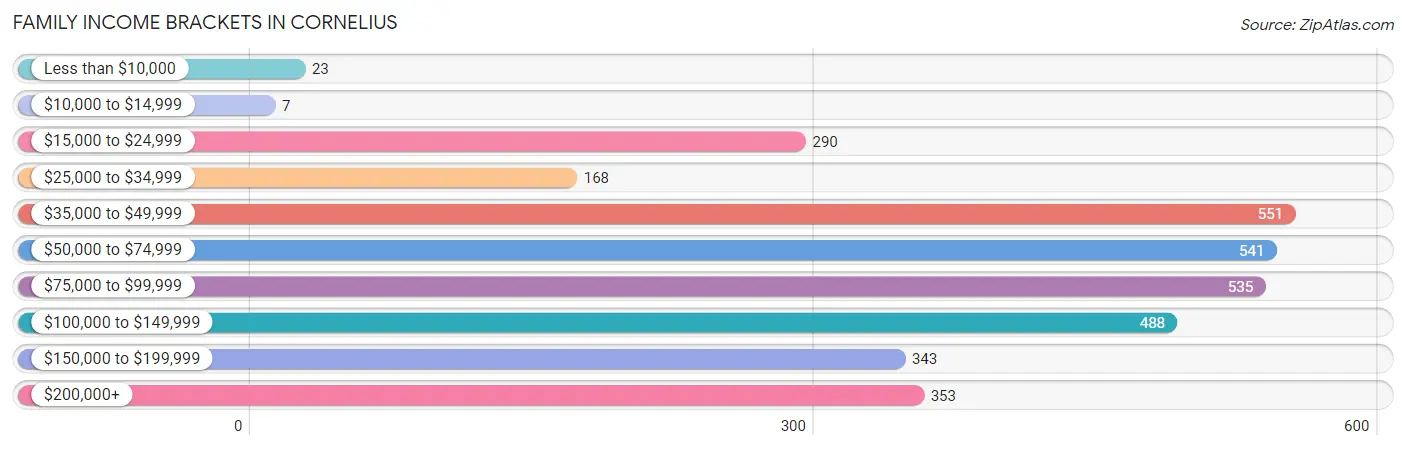
| Income Bracket | # Families | % Families |
| Less than $10,000 | 23 | 0.7% |
| $10,000 to $14,999 | 7 | 0.2% |
| $15,000 to $24,999 | 290 | 8.8% |
| $25,000 to $34,999 | 168 | 5.1% |
| $35,000 to $49,999 | 551 | 16.7% |
| $50,000 to $74,999 | 541 | 16.4% |
| $75,000 to $99,999 | 535 | 16.2% |
| $100,000 to $149,999 | 488 | 14.8% |
| $150,000 to $199,999 | 343 | 10.4% |
| $200,000+ | 353 | 10.7% |
Family Income by Famaliy Size in Cornelius
5-person families (446 | 13.5%) account for the highest median family income in Cornelius with $129,643 per family, while 2-person families (1,511 | 45.8%) have the highest median income of $32,598 per family member.
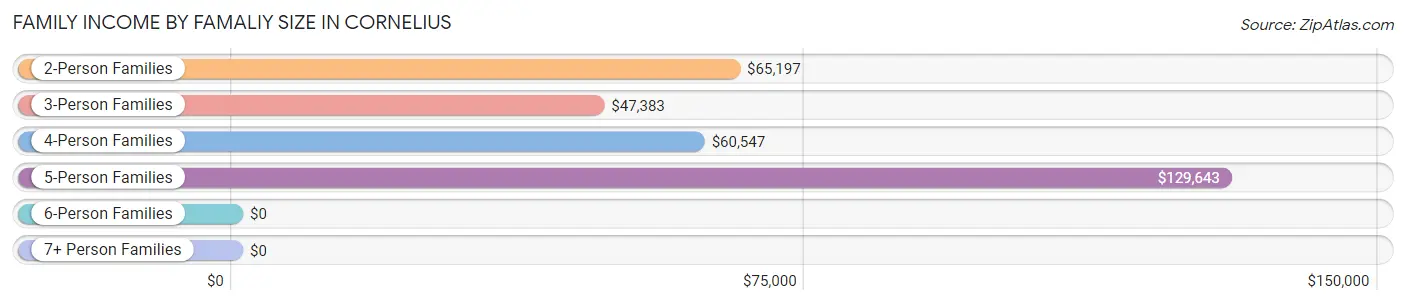
| Income Bracket | # Families | Median Income |
| 2-Person Families | 1,511 (45.8%) | $65,197 |
| 3-Person Families | 642 (19.5%) | $47,383 |
| 4-Person Families | 417 (12.6%) | $60,547 |
| 5-Person Families | 446 (13.5%) | $129,643 |
| 6-Person Families | 193 (5.9%) | $0 |
| 7+ Person Families | 91 (2.8%) | $0 |
| Total | 3,300 (100.0%) | $76,530 |
Family Income by Number of Earners in Cornelius
The median family income in Cornelius is $76,530, with families comprising 3+ earners (488) having the highest median family income of $144,034, while families with no earners (200) have the lowest median family income of $42,128, accounting for 14.8% and 6.1% of families, respectively.
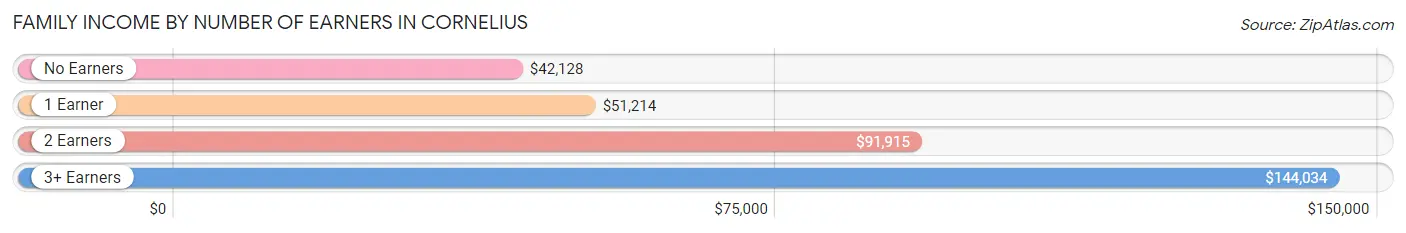
| Number of Earners | # Families | Median Income |
| No Earners | 200 (6.1%) | $42,128 |
| 1 Earner | 1,186 (35.9%) | $51,214 |
| 2 Earners | 1,426 (43.2%) | $91,915 |
| 3+ Earners | 488 (14.8%) | $144,034 |
| Total | 3,300 (100.0%) | $76,530 |
Household Income in Cornelius
Household Income Brackets in Cornelius
With 876 households falling in the category, the $50,000 to $74,999 income range is the most frequent in Cornelius, accounting for 20.0% of all households.
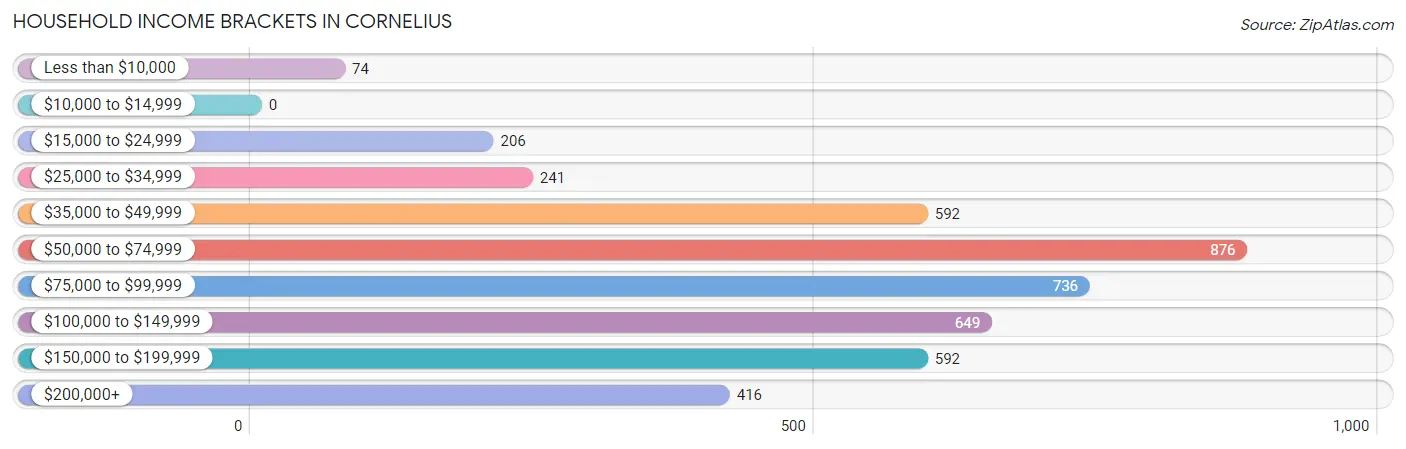
| Income Bracket | # Households | % Households |
| Less than $10,000 | 74 | 1.7% |
| $10,000 to $14,999 | 0 | 0.0% |
| $15,000 to $24,999 | 206 | 4.7% |
| $25,000 to $34,999 | 241 | 5.5% |
| $35,000 to $49,999 | 592 | 13.5% |
| $50,000 to $74,999 | 876 | 20.0% |
| $75,000 to $99,999 | 736 | 16.8% |
| $100,000 to $149,999 | 649 | 14.8% |
| $150,000 to $199,999 | 592 | 13.5% |
| $200,000+ | 416 | 9.5% |
Household Income by Householder Age in Cornelius
The median household income in Cornelius is $83,051, with the highest median household income of $98,538 found in the 65+ years age bracket for the primary householder. A total of 936 households (21.4%) fall into this category. Meanwhile, the 15 to 24 years age bracket for the primary householder has the lowest median household income of $53,214, with 142 households (3.2%) in this group.
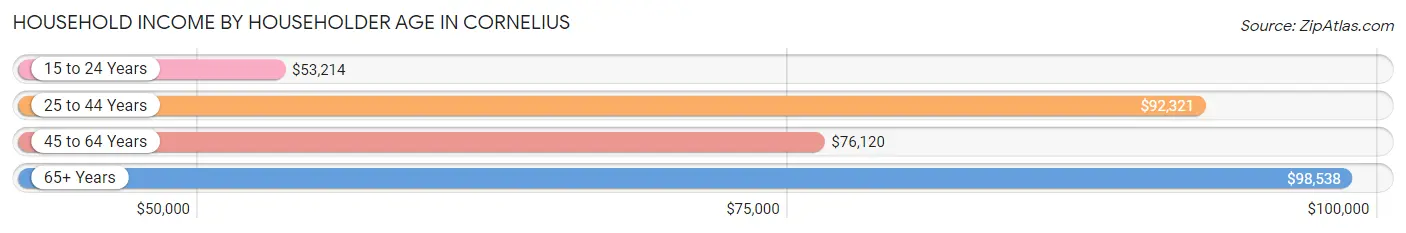
| Income Bracket | # Households | Median Income |
| 15 to 24 Years | 142 (3.2%) | $53,214 |
| 25 to 44 Years | 1,389 (31.7%) | $92,321 |
| 45 to 64 Years | 1,915 (43.7%) | $76,120 |
| 65+ Years | 936 (21.4%) | $98,538 |
| Total | 4,382 (100.0%) | $83,051 |
Poverty in Cornelius
Income Below Poverty by Sex and Age in Cornelius
With 6.1% poverty level for males and 12.6% for females among the residents of Cornelius, 75 year old and over males and 18 to 24 year old females are the most vulnerable to poverty, with 17 males (15.2%) and 280 females (50.2%) in their respective age groups living below the poverty level.
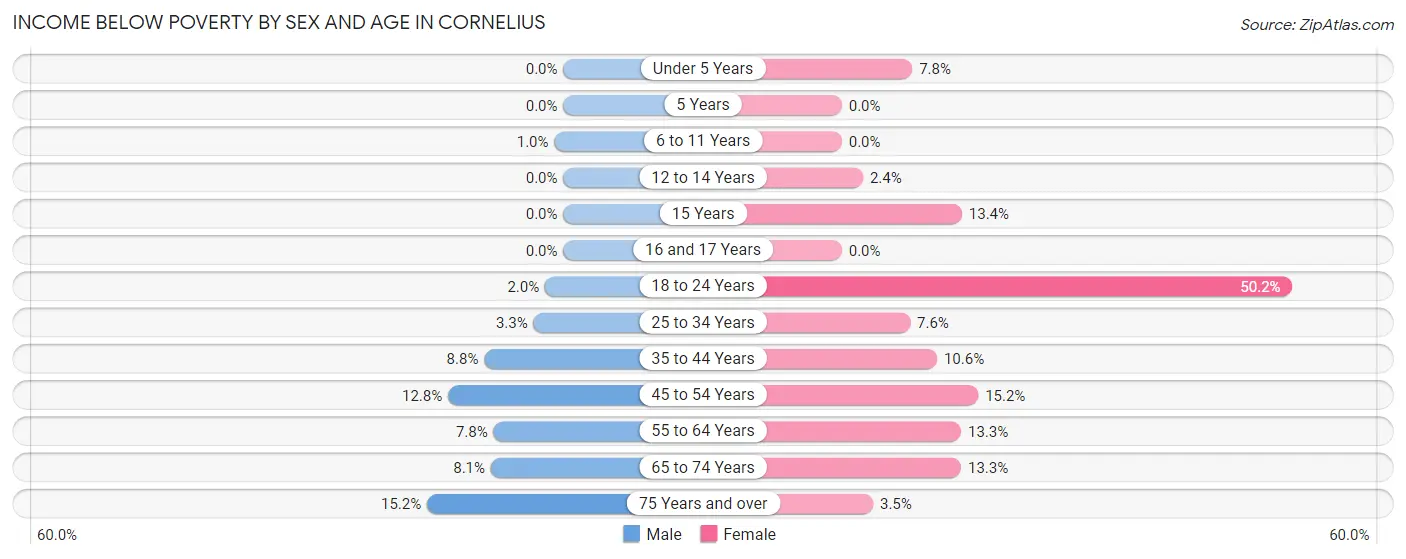
| Age Bracket | Male | Female |
| Under 5 Years | 0 (0.0%) | 29 (7.8%) |
| 5 Years | 0 (0.0%) | 0 (0.0%) |
| 6 to 11 Years | 6 (1.0%) | 0 (0.0%) |
| 12 to 14 Years | 0 (0.0%) | 9 (2.4%) |
| 15 Years | 0 (0.0%) | 23 (13.4%) |
| 16 and 17 Years | 0 (0.0%) | 0 (0.0%) |
| 18 to 24 Years | 16 (2.0%) | 280 (50.2%) |
| 25 to 34 Years | 28 (3.3%) | 58 (7.6%) |
| 35 to 44 Years | 72 (8.8%) | 119 (10.6%) |
| 45 to 54 Years | 159 (12.8%) | 134 (15.2%) |
| 55 to 64 Years | 60 (7.8%) | 96 (13.3%) |
| 65 to 74 Years | 38 (8.1%) | 98 (13.3%) |
| 75 Years and over | 17 (15.2%) | 7 (3.5%) |
| Total | 396 (6.1%) | 853 (12.6%) |
Income Above Poverty by Sex and Age in Cornelius
According to the poverty statistics in Cornelius, males aged under 5 years and females aged 5 years are the age groups that are most secure financially, with 100.0% of males and 100.0% of females in these age groups living above the poverty line.
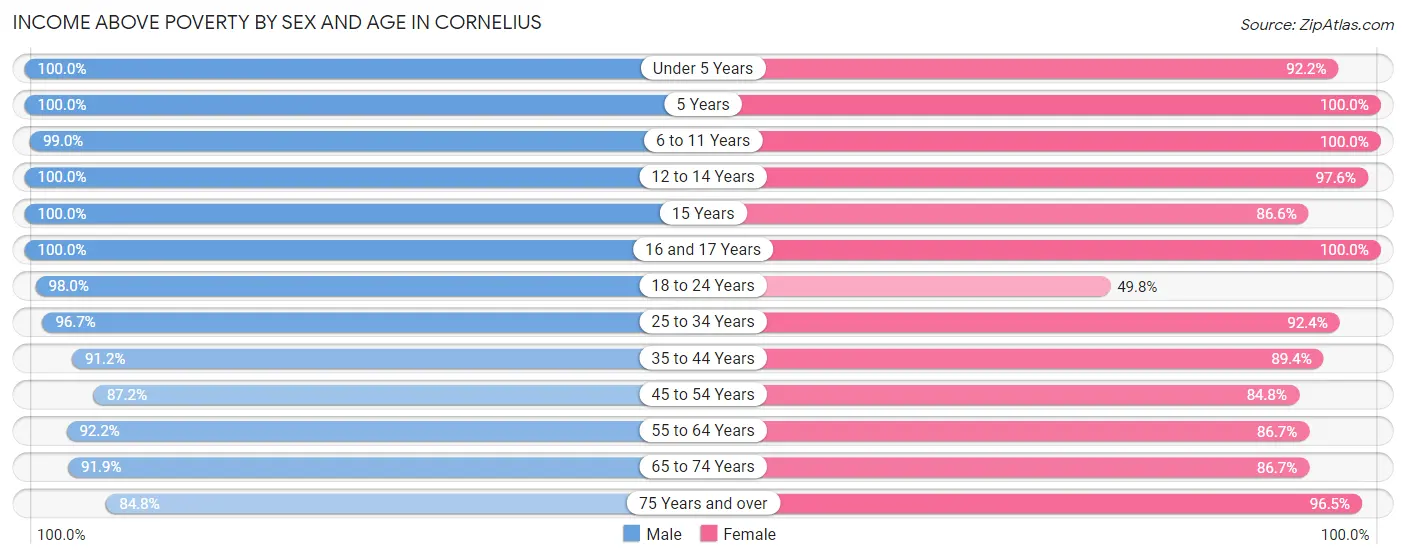
| Age Bracket | Male | Female |
| Under 5 Years | 197 (100.0%) | 341 (92.2%) |
| 5 Years | 8 (100.0%) | 53 (100.0%) |
| 6 to 11 Years | 597 (99.0%) | 590 (100.0%) |
| 12 to 14 Years | 171 (100.0%) | 373 (97.6%) |
| 15 Years | 169 (100.0%) | 149 (86.6%) |
| 16 and 17 Years | 251 (100.0%) | 209 (100.0%) |
| 18 to 24 Years | 770 (98.0%) | 278 (49.8%) |
| 25 to 34 Years | 816 (96.7%) | 704 (92.4%) |
| 35 to 44 Years | 745 (91.2%) | 1,004 (89.4%) |
| 45 to 54 Years | 1,079 (87.2%) | 748 (84.8%) |
| 55 to 64 Years | 712 (92.2%) | 627 (86.7%) |
| 65 to 74 Years | 433 (91.9%) | 640 (86.7%) |
| 75 Years and over | 95 (84.8%) | 194 (96.5%) |
| Total | 6,043 (93.9%) | 5,910 (87.4%) |
Income Below Poverty Among Married-Couple Families in Cornelius
The poverty statistics for married-couple families in Cornelius show that 8.2% or 191 of the total 2,318 families live below the poverty line. Families with no children have the highest poverty rate of 12.6%, comprising of 169 families. On the other hand, families with 3 or 4 children have the lowest poverty rate of 1.8%, which includes 6 families.
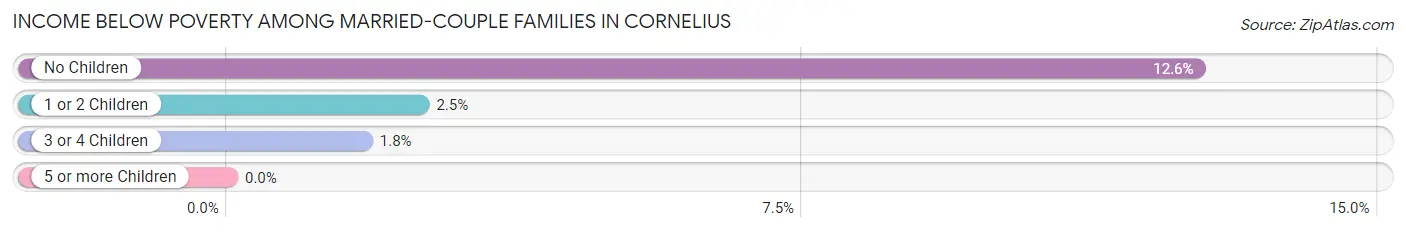
| Children | Above Poverty | Below Poverty |
| No Children | 1,169 (87.4%) | 169 (12.6%) |
| 1 or 2 Children | 624 (97.5%) | 16 (2.5%) |
| 3 or 4 Children | 334 (98.2%) | 6 (1.8%) |
| 5 or more Children | 0 (0.0%) | 0 (0.0%) |
| Total | 2,127 (91.8%) | 191 (8.2%) |
Income Below Poverty Among Single-Parent Households in Cornelius
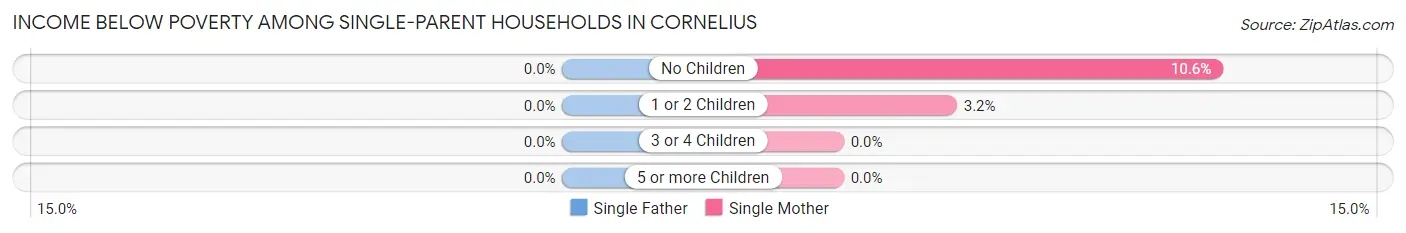
| Children | Single Father | Single Mother |
| No Children | 0 (0.0%) | 44 (10.6%) |
| 1 or 2 Children | 0 (0.0%) | 8 (3.2%) |
| 3 or 4 Children | 0 (0.0%) | 0 (0.0%) |
| 5 or more Children | 0 (0.0%) | 0 (0.0%) |
| Total | 0 (0.0%) | 52 (7.2%) |
Income Below Poverty Among Married-Couple vs Single-Parent Households in Cornelius
The poverty data for Cornelius shows that 191 of the married-couple family households (8.2%) and 52 of the single-parent households (5.3%) are living below the poverty level. Within the married-couple family households, those with no children have the highest poverty rate, with 169 households (12.6%) falling below the poverty line. Among the single-parent households, those with no children have the highest poverty rate, with 44 household (10.3%) living below poverty.
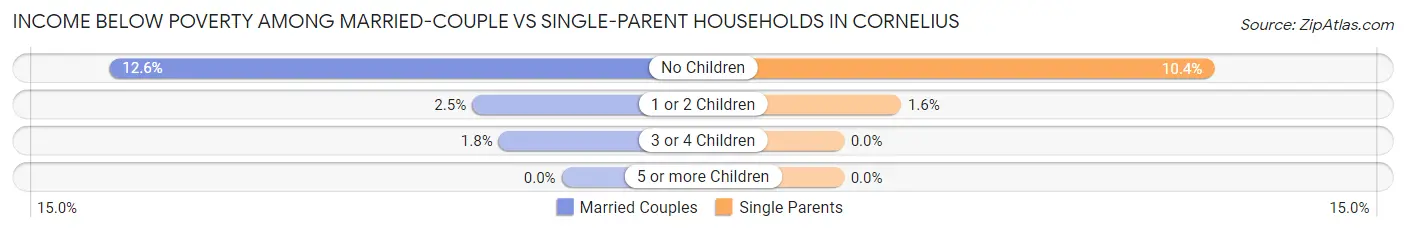
| Children | Married-Couple Families | Single-Parent Households |
| No Children | 169 (12.6%) | 44 (10.3%) |
| 1 or 2 Children | 16 (2.5%) | 8 (1.6%) |
| 3 or 4 Children | 6 (1.8%) | 0 (0.0%) |
| 5 or more Children | 0 (0.0%) | 0 (0.0%) |
| Total | 191 (8.2%) | 52 (5.3%) |
Race in Cornelius
The most populous races in Cornelius are White / Caucasian (8,440 | 63.7%), Hispanic or Latino (6,383 | 48.2%), and Some other Race (3,195 | 24.1%).
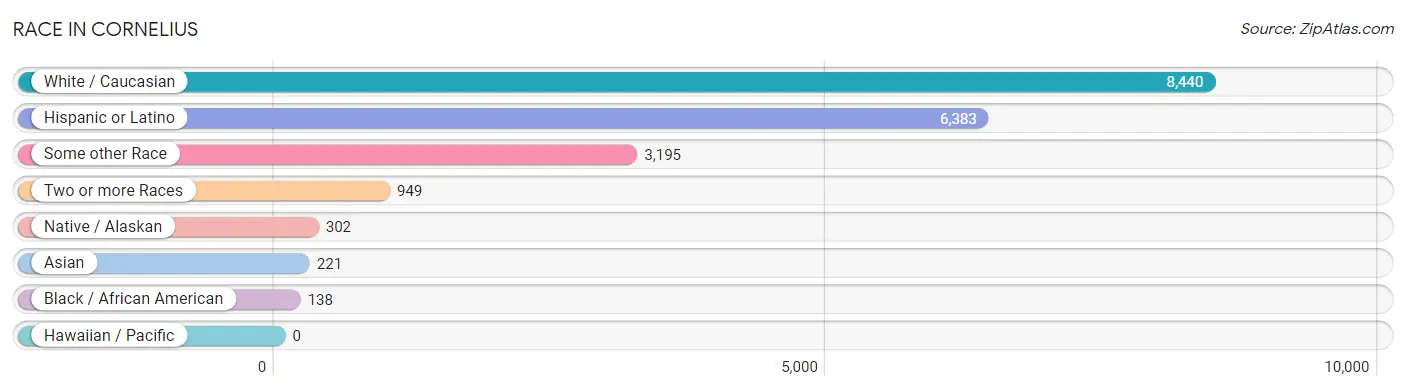
| Race | # Population | % Population |
| Asian | 221 | 1.7% |
| Black / African American | 138 | 1.0% |
| Hawaiian / Pacific | 0 | 0.0% |
| Hispanic or Latino | 6,383 | 48.2% |
| Native / Alaskan | 302 | 2.3% |
| White / Caucasian | 8,440 | 63.7% |
| Two or more Races | 949 | 7.2% |
| Some other Race | 3,195 | 24.1% |
| Total | 13,245 | 100.0% |
Ancestry in Cornelius
The most populous ancestries reported in Cornelius are Mexican (5,822 | 44.0%), German (1,264 | 9.5%), English (944 | 7.1%), American (841 | 6.4%), and Irish (781 | 5.9%), together accounting for 72.9% of all Cornelius residents.
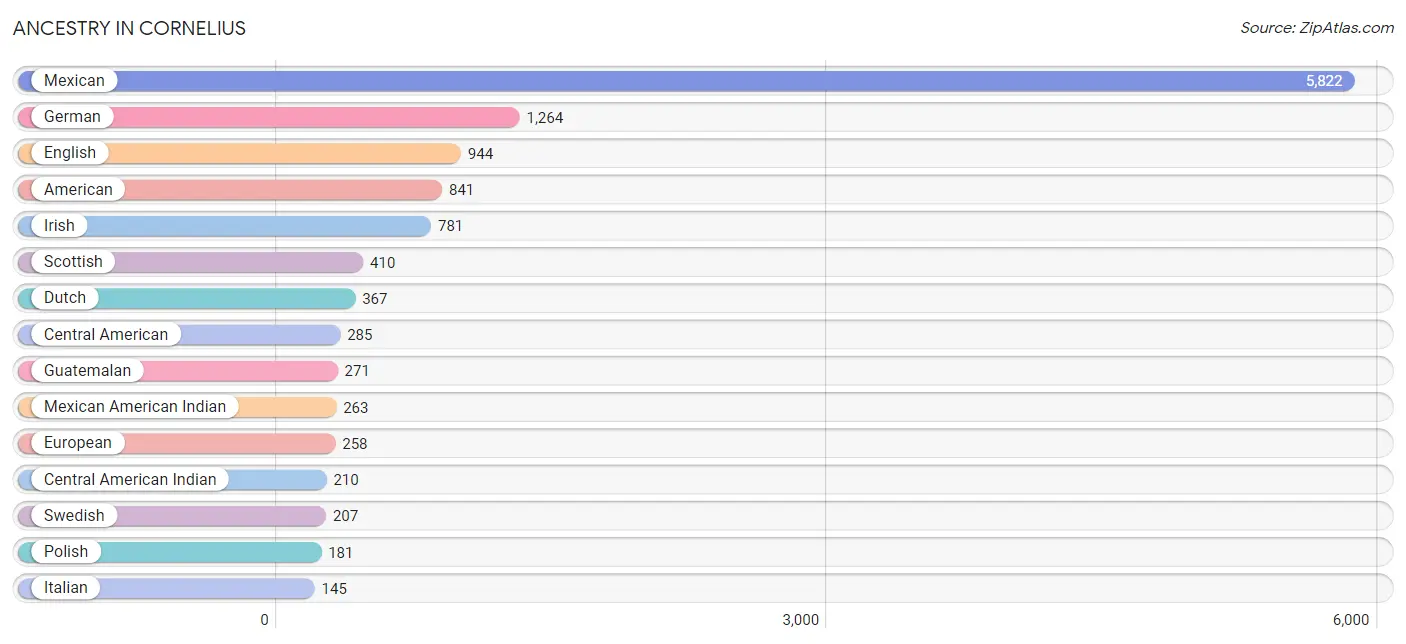
| Ancestry | # Population | % Population |
| American | 841 | 6.4% |
| Belgian | 35 | 0.3% |
| Bhutanese | 61 | 0.5% |
| British | 17 | 0.1% |
| Canadian | 47 | 0.4% |
| Celtic | 17 | 0.1% |
| Central American | 285 | 2.1% |
| Central American Indian | 210 | 1.6% |
| Chippewa | 8 | 0.1% |
| Cree | 12 | 0.1% |
| Danish | 15 | 0.1% |
| Dutch | 367 | 2.8% |
| English | 944 | 7.1% |
| Estonian | 21 | 0.2% |
| European | 258 | 1.9% |
| Filipino | 5 | 0.0% |
| Finnish | 26 | 0.2% |
| French | 92 | 0.7% |
| French Canadian | 55 | 0.4% |
| German | 1,264 | 9.5% |
| Greek | 22 | 0.2% |
| Guamanian / Chamorro | 16 | 0.1% |
| Guatemalan | 271 | 2.1% |
| Indian (Asian) | 21 | 0.2% |
| Irish | 781 | 5.9% |
| Italian | 145 | 1.1% |
| Korean | 138 | 1.0% |
| Luxembourger | 37 | 0.3% |
| Mexican | 5,822 | 44.0% |
| Mexican American Indian | 263 | 2.0% |
| Norwegian | 77 | 0.6% |
| Pakistani | 8 | 0.1% |
| Paraguayan | 27 | 0.2% |
| Peruvian | 8 | 0.1% |
| Polish | 181 | 1.4% |
| Portuguese | 25 | 0.2% |
| Puerto Rican | 97 | 0.7% |
| Romanian | 5 | 0.0% |
| Russian | 10 | 0.1% |
| Salvadoran | 14 | 0.1% |
| Scandinavian | 22 | 0.2% |
| Scotch-Irish | 109 | 0.8% |
| Scottish | 410 | 3.1% |
| Sioux | 7 | 0.1% |
| Slovak | 21 | 0.2% |
| Somali | 66 | 0.5% |
| South American | 35 | 0.3% |
| Spaniard | 19 | 0.1% |
| Sri Lankan | 107 | 0.8% |
| Subsaharan African | 66 | 0.5% |
| Swedish | 207 | 1.6% |
| Swiss | 51 | 0.4% |
| Thai | 42 | 0.3% | View All 53 Rows |
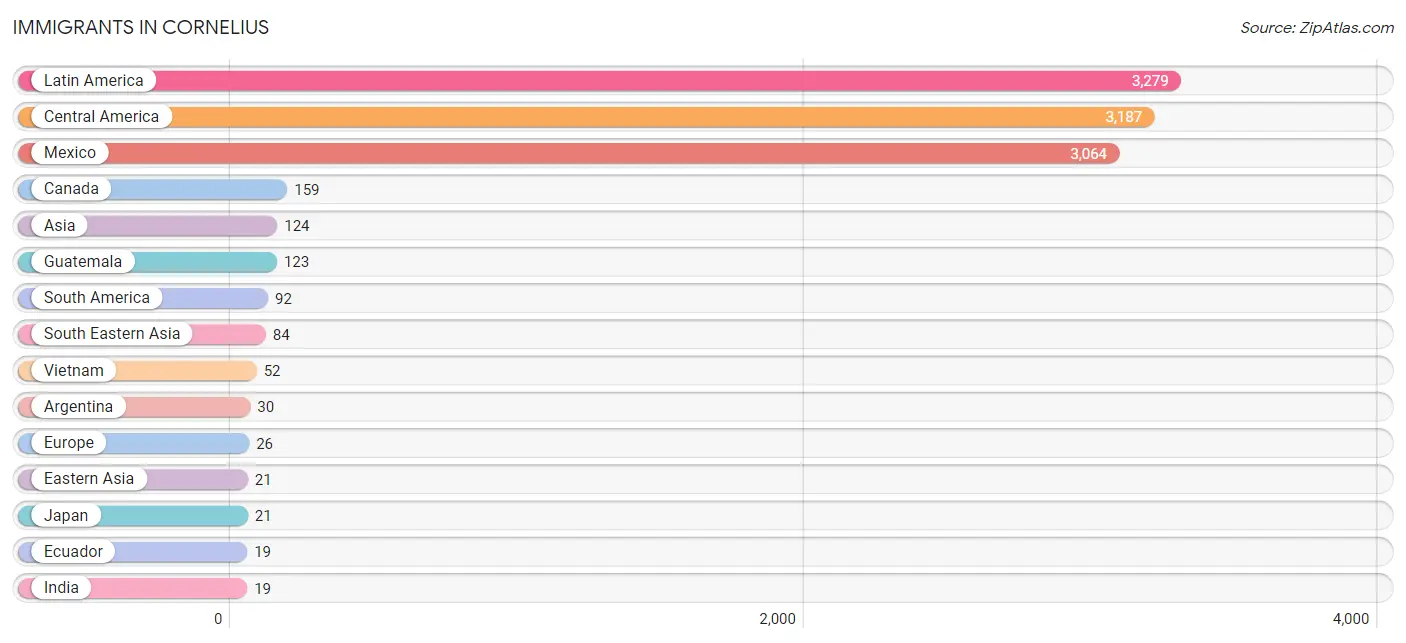
Immigrants in Cornelius
The most numerous immigrant groups reported in Cornelius came from Latin America (3,279 | 24.8%), Central America (3,187 | 24.1%), Mexico (3,064 | 23.1%), Canada (159 | 1.2%), and Asia (124 | 0.9%), together accounting for 74.1% of all Cornelius residents.
| Immigration Origin | # Population | % Population |
| Argentina | 30 | 0.2% |
| Asia | 124 | 0.9% |
| Canada | 159 | 1.2% |
| Central America | 3,187 | 24.1% |
| Eastern Asia | 21 | 0.2% |
| Eastern Europe | 5 | 0.0% |
| Ecuador | 19 | 0.1% |
| England | 9 | 0.1% |
| Europe | 26 | 0.2% |
| Guatemala | 123 | 0.9% |
| India | 19 | 0.1% |
| Japan | 21 | 0.2% |
| Latin America | 3,279 | 24.8% |
| Mexico | 3,064 | 23.1% |
| Northern Europe | 9 | 0.1% |
| Philippines | 17 | 0.1% |
| Romania | 5 | 0.0% |
| South America | 92 | 0.7% |
| South Central Asia | 19 | 0.1% |
| South Eastern Asia | 84 | 0.6% |
| Southern Europe | 12 | 0.1% |
| Spain | 12 | 0.1% |
| Thailand | 15 | 0.1% |
| Venezuela | 16 | 0.1% |
| Vietnam | 52 | 0.4% | View All 25 Rows |
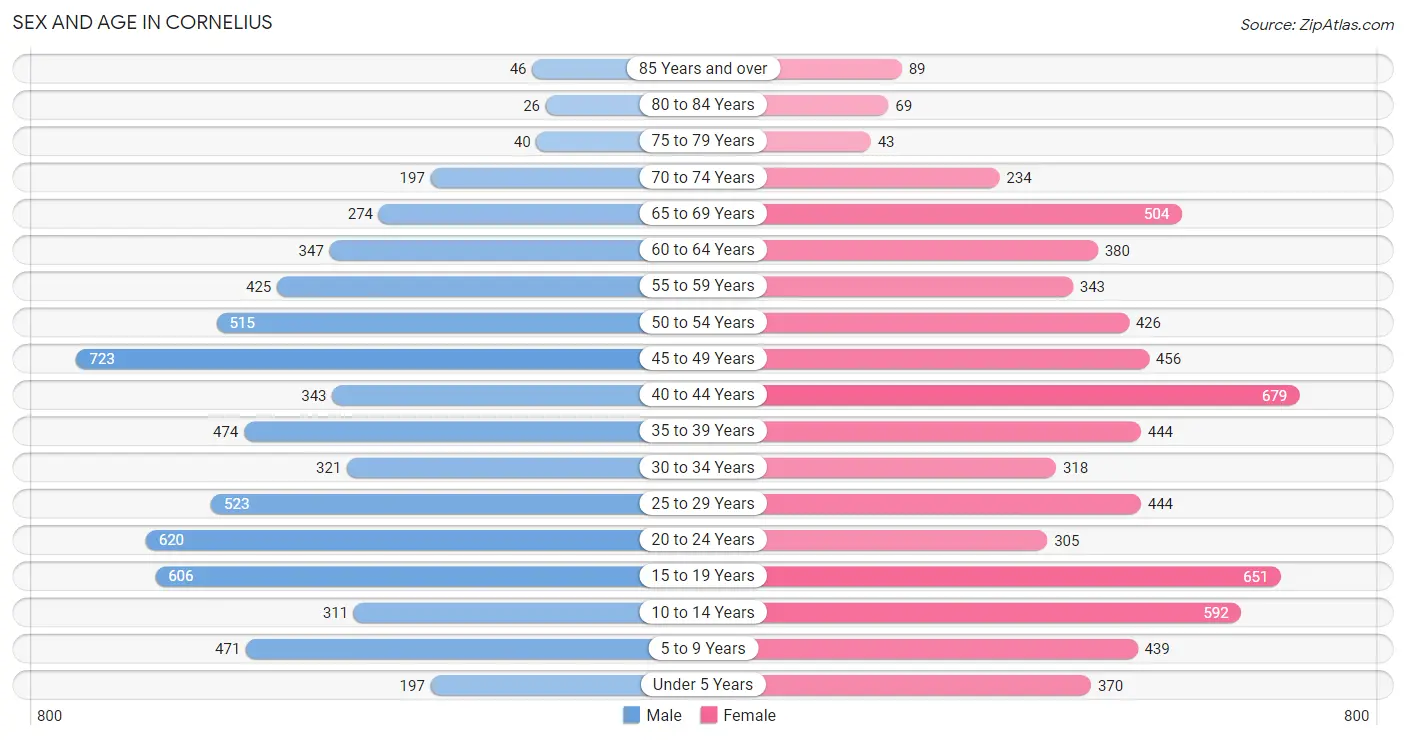
Sex and Age in Cornelius
Sex and Age in Cornelius
The most populous age groups in Cornelius are 45 to 49 Years (723 | 11.2%) for men and 40 to 44 Years (679 | 10.0%) for women.
| Age Bracket | Male | Female |
| Under 5 Years | 197 (3.0%) | 370 (5.4%) |
| 5 to 9 Years | 471 (7.3%) | 439 (6.5%) |
| 10 to 14 Years | 311 (4.8%) | 592 (8.7%) |
| 15 to 19 Years | 606 (9.4%) | 651 (9.6%) |
| 20 to 24 Years | 620 (9.6%) | 305 (4.5%) |
| 25 to 29 Years | 523 (8.1%) | 444 (6.5%) |
| 30 to 34 Years | 321 (5.0%) | 318 (4.7%) |
| 35 to 39 Years | 474 (7.3%) | 444 (6.5%) |
| 40 to 44 Years | 343 (5.3%) | 679 (10.0%) |
| 45 to 49 Years | 723 (11.2%) | 456 (6.7%) |
| 50 to 54 Years | 515 (8.0%) | 426 (6.3%) |
| 55 to 59 Years | 425 (6.6%) | 343 (5.1%) |
| 60 to 64 Years | 347 (5.4%) | 380 (5.6%) |
| 65 to 69 Years | 274 (4.2%) | 504 (7.4%) |
| 70 to 74 Years | 197 (3.0%) | 234 (3.5%) |
| 75 to 79 Years | 40 (0.6%) | 43 (0.6%) |
| 80 to 84 Years | 26 (0.4%) | 69 (1.0%) |
| 85 Years and over | 46 (0.7%) | 89 (1.3%) |
| Total | 6,459 (100.0%) | 6,786 (100.0%) |
Families and Households in Cornelius
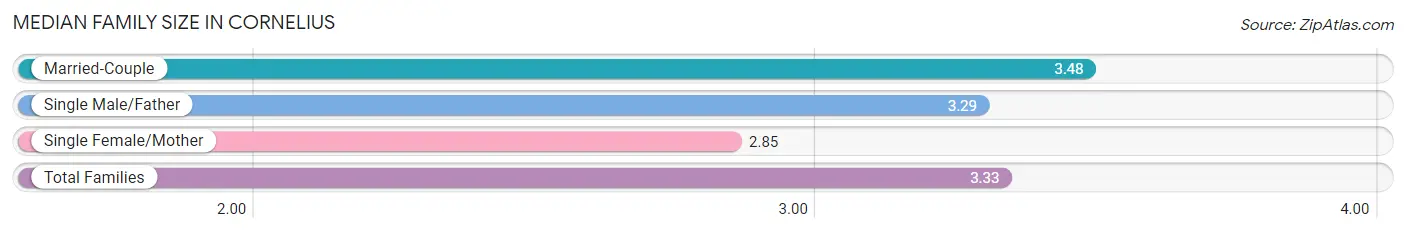
Median Family Size in Cornelius
The median family size in Cornelius is 3.33 persons per family, with married-couple families (2,318 | 70.2%) accounting for the largest median family size of 3.48 persons per family. On the other hand, single female/mother families (726 | 22.0%) represent the smallest median family size with 2.85 persons per family.
| Family Type | # Families | Family Size |
| Married-Couple | 2,318 (70.2%) | 3.48 |
| Single Male/Father | 256 (7.8%) | 3.29 |
| Single Female/Mother | 726 (22.0%) | 2.85 |
| Total Families | 3,300 (100.0%) | 3.33 |
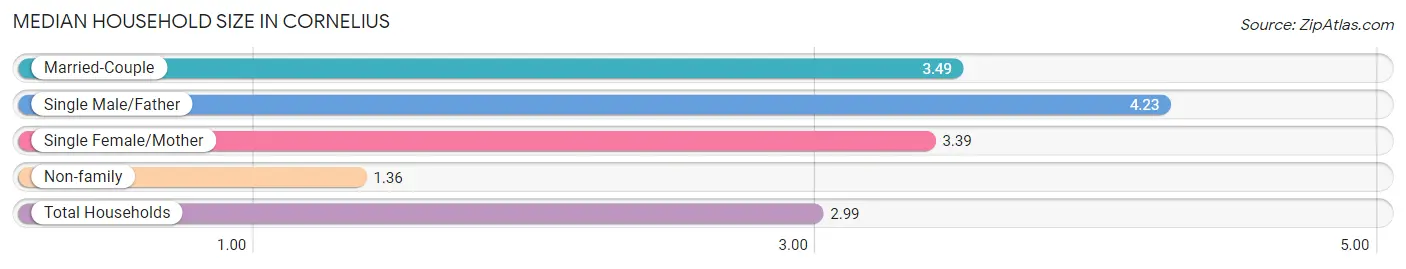
Median Household Size in Cornelius
The median household size in Cornelius is 2.99 persons per household, with single male/father households (256 | 5.8%) accounting for the largest median household size of 4.23 persons per household. non-family households (1,082 | 24.7%) represent the smallest median household size with 1.36 persons per household.
| Household Type | # Households | Household Size |
| Married-Couple | 2,318 (52.9%) | 3.49 |
| Single Male/Father | 256 (5.8%) | 4.23 |
| Single Female/Mother | 726 (16.6%) | 3.39 |
| Non-family | 1,082 (24.7%) | 1.36 |
| Total Households | 4,382 (100.0%) | 2.99 |
Household Size by Marriage Status in Cornelius
Out of a total of 4,382 households in Cornelius, 3,300 (75.3%) are family households, while 1,082 (24.7%) are nonfamily households. The most numerous type of family households are 2-person households, comprising 1,154, and the most common type of nonfamily households are 1-person households, comprising 802.
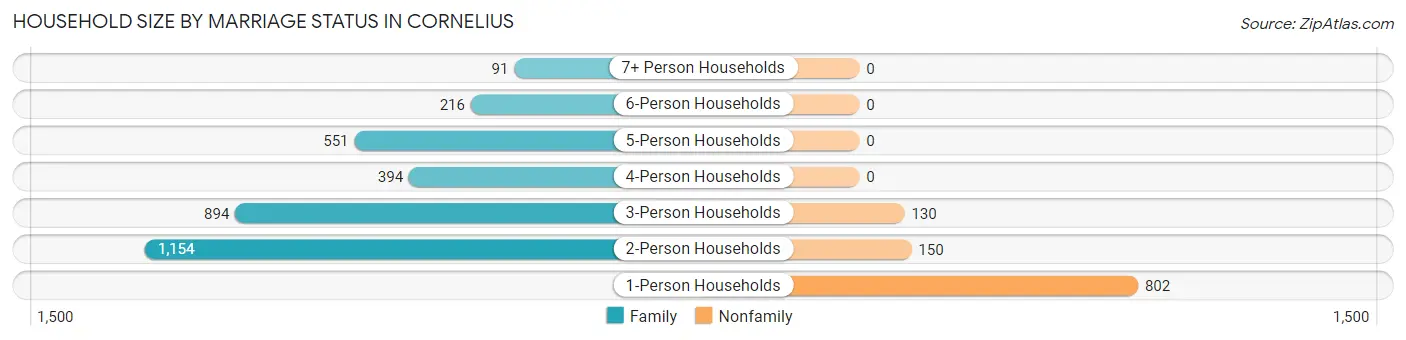
| Household Size | Family Households | Nonfamily Households |
| 1-Person Households | - | 802 (18.3%) |
| 2-Person Households | 1,154 (26.3%) | 150 (3.4%) |
| 3-Person Households | 894 (20.4%) | 130 (3.0%) |
| 4-Person Households | 394 (9.0%) | 0 (0.0%) |
| 5-Person Households | 551 (12.6%) | 0 (0.0%) |
| 6-Person Households | 216 (4.9%) | 0 (0.0%) |
| 7+ Person Households | 91 (2.1%) | 0 (0.0%) |
| Total | 3,300 (75.3%) | 1,082 (24.7%) |
Female Fertility in Cornelius
Fertility by Age in Cornelius
Average fertility rate in Cornelius is 44.0 births per 1,000 women. Women in the age bracket of 20 to 34 years have the highest fertility rate with 105.0 births per 1,000 women. Women in the age bracket of 20 to 34 years acount for 75.7% of all women with births.
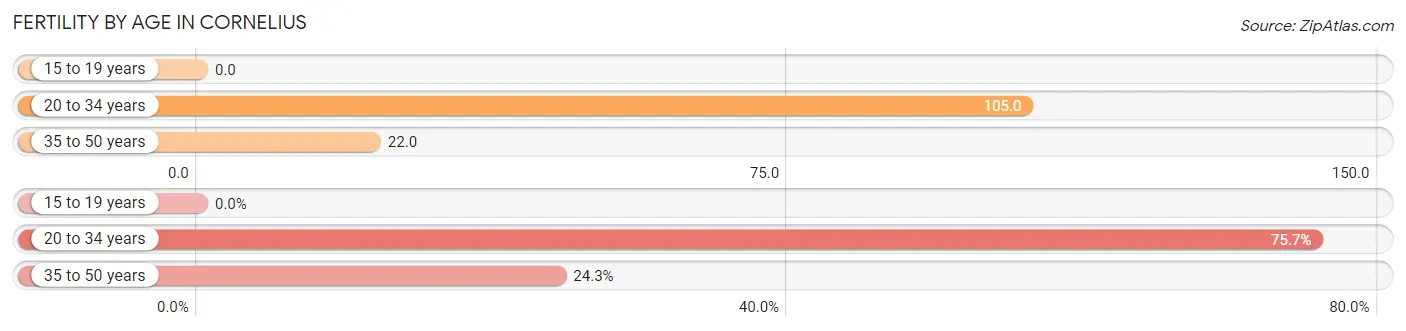
| Age Bracket | Women with Births | Births / 1,000 Women |
| 15 to 19 years | 0 (0.0%) | 0.0 |
| 20 to 34 years | 112 (75.7%) | 105.0 |
| 35 to 50 years | 36 (24.3%) | 22.0 |
| Total | 148 (100.0%) | 44.0 |
Fertility by Age by Marriage Status in Cornelius
68.2% of women with births (148) in Cornelius are married. The highest percentage of unmarried women with births falls into 35 to 50 years age bracket with 100.0% of them unmarried at the time of birth, while the lowest percentage of unmarried women with births belong to 20 to 34 years age bracket with 9.8% of them unmarried.
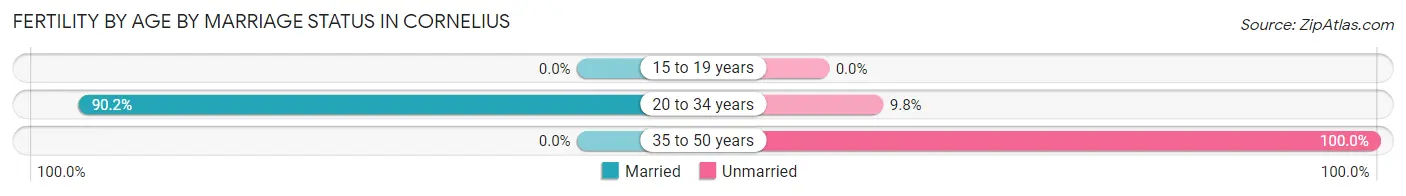
| Age Bracket | Married | Unmarried |
| 15 to 19 years | 0 (0.0%) | 0 (0.0%) |
| 20 to 34 years | 101 (90.2%) | 11 (9.8%) |
| 35 to 50 years | 0 (0.0%) | 36 (100.0%) |
| Total | 101 (68.2%) | 47 (31.8%) |
Fertility by Education in Cornelius
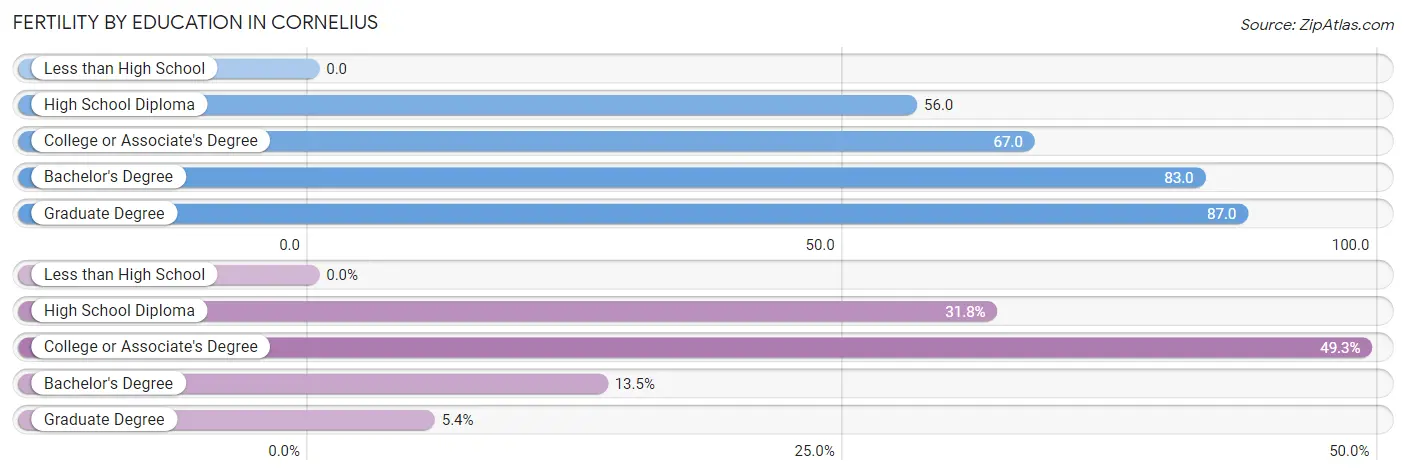
| Educational Attainment | Women with Births | Births / 1,000 Women |
| Less than High School | 0 (0.0%) | 0.0 |
| High School Diploma | 47 (31.8%) | 56.0 |
| College or Associate's Degree | 73 (49.3%) | 67.0 |
| Bachelor's Degree | 20 (13.5%) | 83.0 |
| Graduate Degree | 8 (5.4%) | 87.0 |
| Total | 148 (100.0%) | 44.0 |
Fertility by Education by Marriage Status in Cornelius
31.8% of women with births in Cornelius are unmarried. Women with the educational attainment of college or associate's degree are most likely to be married with 100.0% of them married at childbirth, while women with the educational attainment of high school diploma are least likely to be married with 100.0% of them unmarried at childbirth.
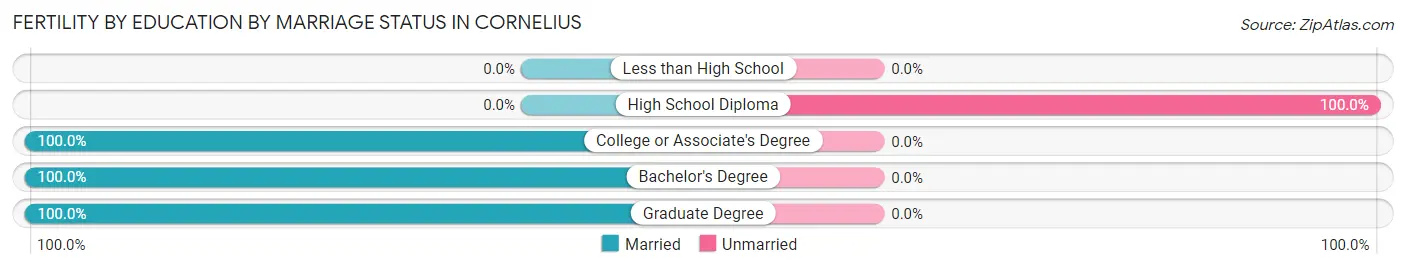
| Educational Attainment | Married | Unmarried |
| Less than High School | 0 (0.0%) | 0 (0.0%) |
| High School Diploma | 0 (0.0%) | 47 (100.0%) |
| College or Associate's Degree | 73 (100.0%) | 0 (0.0%) |
| Bachelor's Degree | 20 (100.0%) | 0 (0.0%) |
| Graduate Degree | 8 (100.0%) | 0 (0.0%) |
| Total | 101 (68.2%) | 47 (31.8%) |
Employment Characteristics in Cornelius
Employment by Class of Employer in Cornelius
Among the 6,630 employed individuals in Cornelius, private company employees (5,210 | 78.6%), local government employees (509 | 7.7%), and not-for-profit organizations (491 | 7.4%) make up the most common classes of employment.
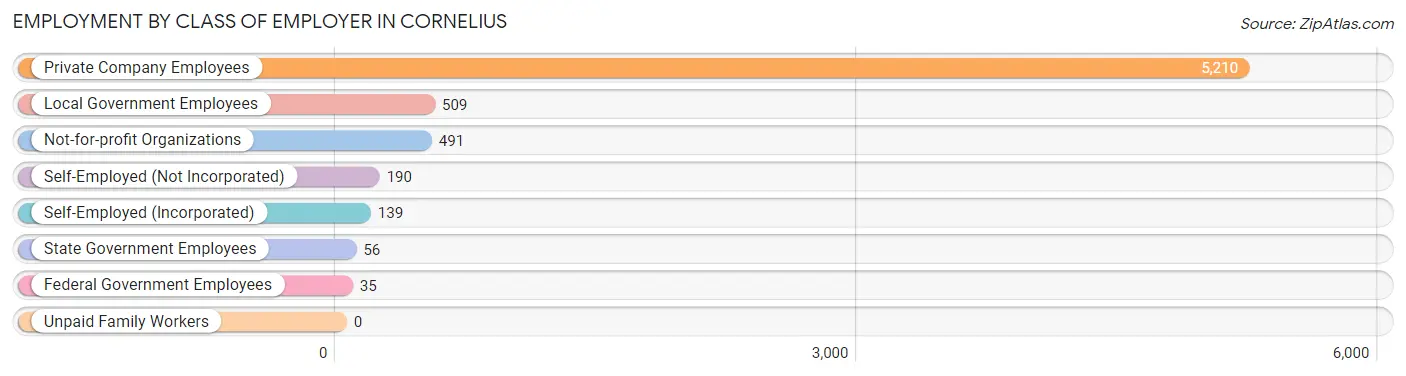
| Employer Class | # Employees | % Employees |
| Private Company Employees | 5,210 | 78.6% |
| Self-Employed (Incorporated) | 139 | 2.1% |
| Self-Employed (Not Incorporated) | 190 | 2.9% |
| Not-for-profit Organizations | 491 | 7.4% |
| Local Government Employees | 509 | 7.7% |
| State Government Employees | 56 | 0.8% |
| Federal Government Employees | 35 | 0.5% |
| Unpaid Family Workers | 0 | 0.0% |
| Total | 6,630 | 100.0% |
Employment Status by Age in Cornelius
According to the labor force statistics for Cornelius, out of the total population over 16 years of age (10,521), 67.3% or 7,081 individuals are in the labor force, with 4.4% or 312 of them unemployed. The age group with the highest labor force participation rate is 35 to 44 years, with 87.4% or 1,696 individuals in the labor force. Within the labor force, the 16 to 19 years age range has the highest percentage of unemployed individuals, with 29.6% or 74 of them being unemployed.
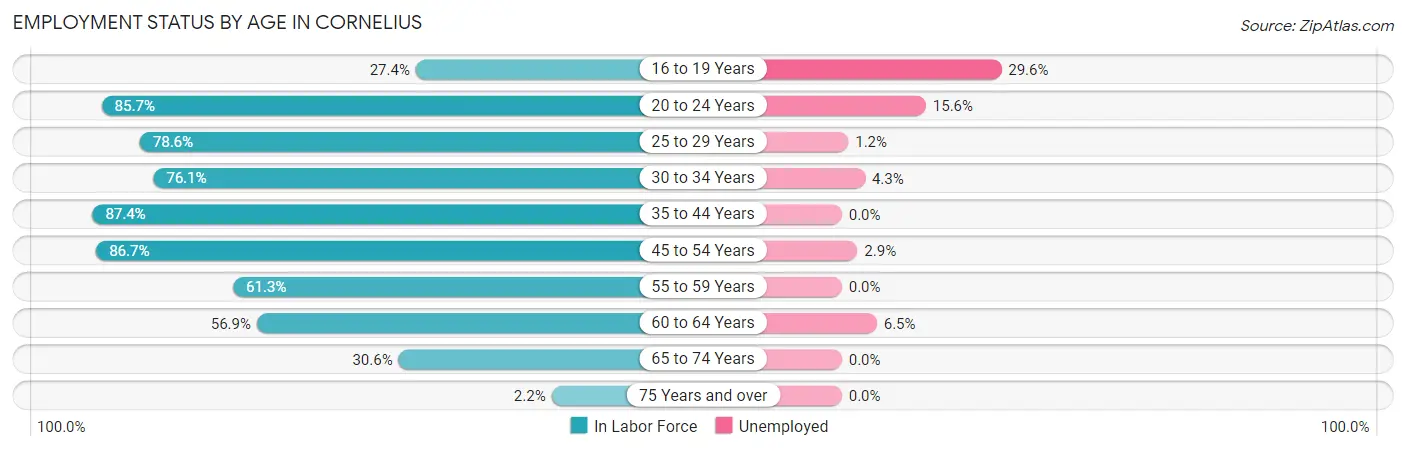
| Age Bracket | In Labor Force | Unemployed |
| 16 to 19 Years | 250 (27.4%) | 74 (29.6%) |
| 20 to 24 Years | 793 (85.7%) | 124 (15.6%) |
| 25 to 29 Years | 760 (78.6%) | 9 (1.2%) |
| 30 to 34 Years | 486 (76.1%) | 21 (4.3%) |
| 35 to 44 Years | 1,696 (87.4%) | 0 (0.0%) |
| 45 to 54 Years | 1,838 (86.7%) | 53 (2.9%) |
| 55 to 59 Years | 471 (61.3%) | 0 (0.0%) |
| 60 to 64 Years | 414 (56.9%) | 27 (6.5%) |
| 65 to 74 Years | 370 (30.6%) | 0 (0.0%) |
| 75 Years and over | 7 (2.2%) | 0 (0.0%) |
| Total | 7,081 (67.3%) | 312 (4.4%) |
Employment Status by Educational Attainment in Cornelius
According to labor force statistics for Cornelius, 79.1% of individuals (5,664) out of the total population between 25 and 64 years of age (7,161) are in the labor force, with 2.0% or 113 of them being unemployed. The group with the highest labor force participation rate are those with the educational attainment of bachelor's degree or higher, with 87.6% or 774 individuals in the labor force. Within the labor force, individuals with high school diploma education have the highest percentage of unemployment, with 3.3% or 51 of them being unemployed.
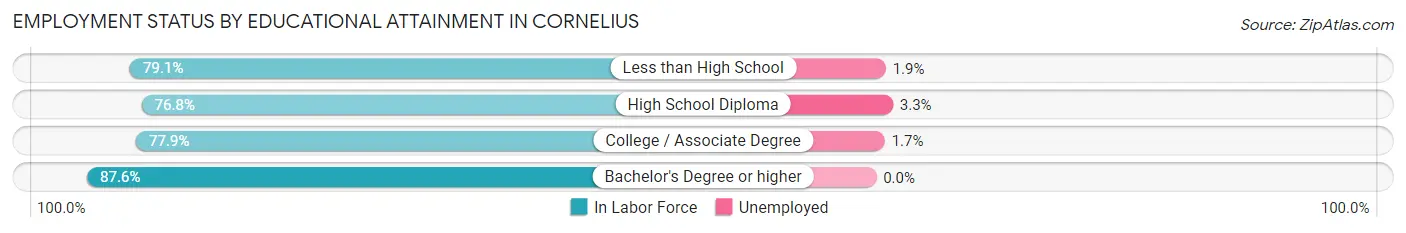
| Educational Attainment | In Labor Force | Unemployed |
| Less than High School | 1,558 (79.1%) | 37 (1.9%) |
| High School Diploma | 1,536 (76.8%) | 66 (3.3%) |
| College / Associate Degree | 1,797 (77.9%) | 39 (1.7%) |
| Bachelor's Degree or higher | 774 (87.6%) | 0 (0.0%) |
| Total | 5,664 (79.1%) | 143 (2.0%) |
Employment Occupations by Sex in Cornelius
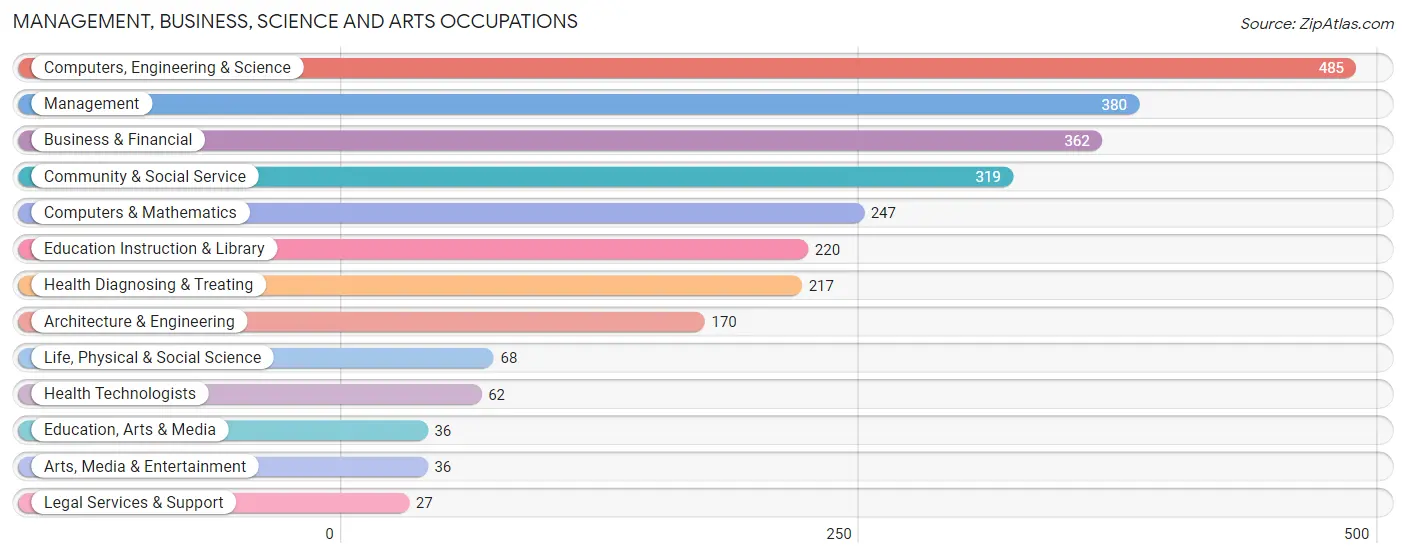
Management, Business, Science and Arts Occupations
The most common Management, Business, Science and Arts occupations in Cornelius are Computers, Engineering & Science (485 | 7.2%), Management (380 | 5.6%), Business & Financial (362 | 5.3%), Community & Social Service (319 | 4.7%), and Computers & Mathematics (247 | 3.6%).
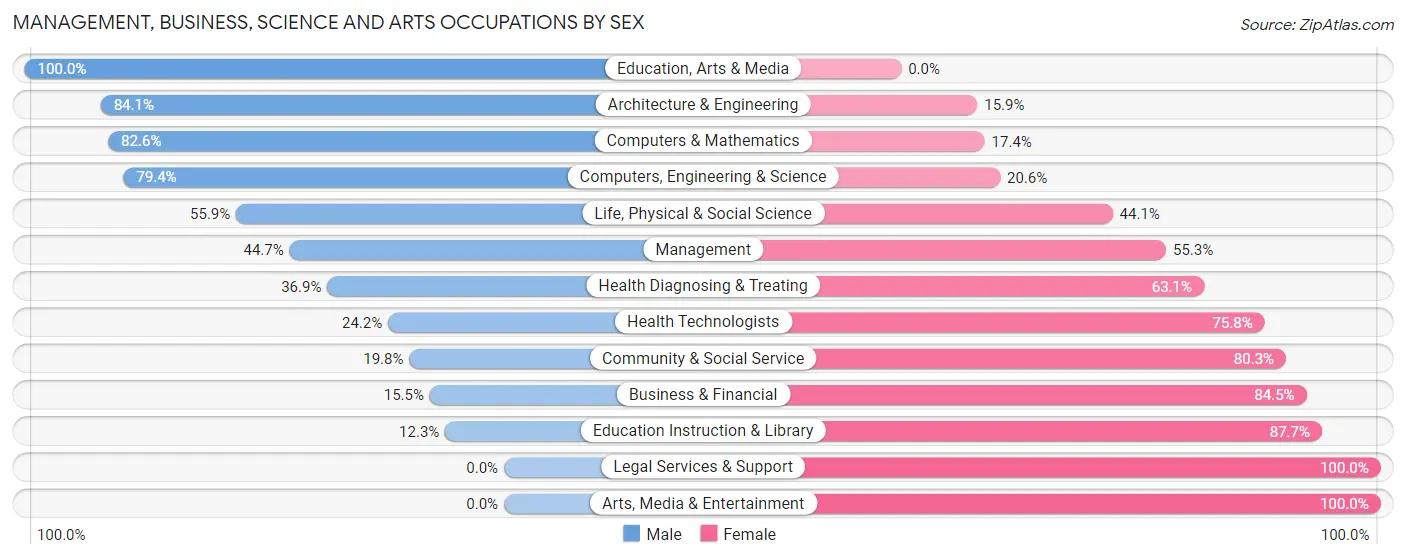
Management, Business, Science and Arts Occupations by Sex
Within the Management, Business, Science and Arts occupations in Cornelius, the most male-oriented occupations are Education, Arts & Media (100.0%), Architecture & Engineering (84.1%), and Computers & Mathematics (82.6%), while the most female-oriented occupations are Legal Services & Support (100.0%), Arts, Media & Entertainment (100.0%), and Education Instruction & Library (87.7%).
| Occupation | Male | Female |
| Management | 170 (44.7%) | 210 (55.3%) |
| Business & Financial | 56 (15.5%) | 306 (84.5%) |
| Computers, Engineering & Science | 385 (79.4%) | 100 (20.6%) |
| Computers & Mathematics | 204 (82.6%) | 43 (17.4%) |
| Architecture & Engineering | 143 (84.1%) | 27 (15.9%) |
| Life, Physical & Social Science | 38 (55.9%) | 30 (44.1%) |
| Community & Social Service | 63 (19.8%) | 256 (80.2%) |
| Education, Arts & Media | 36 (100.0%) | 0 (0.0%) |
| Legal Services & Support | 0 (0.0%) | 27 (100.0%) |
| Education Instruction & Library | 27 (12.3%) | 193 (87.7%) |
| Arts, Media & Entertainment | 0 (0.0%) | 36 (100.0%) |
| Health Diagnosing & Treating | 80 (36.9%) | 137 (63.1%) |
| Health Technologists | 15 (24.2%) | 47 (75.8%) |
| Total (Category) | 754 (42.8%) | 1,009 (57.2%) |
| Total (Overall) | 3,744 (55.2%) | 3,032 (44.8%) |
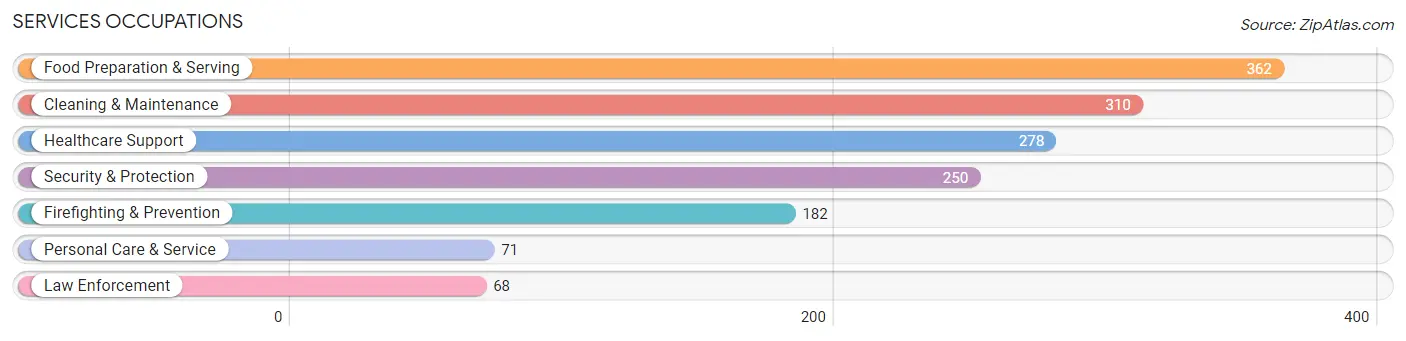
Services Occupations
The most common Services occupations in Cornelius are Food Preparation & Serving (362 | 5.3%), Cleaning & Maintenance (310 | 4.6%), Healthcare Support (278 | 4.1%), Security & Protection (250 | 3.7%), and Firefighting & Prevention (182 | 2.7%).
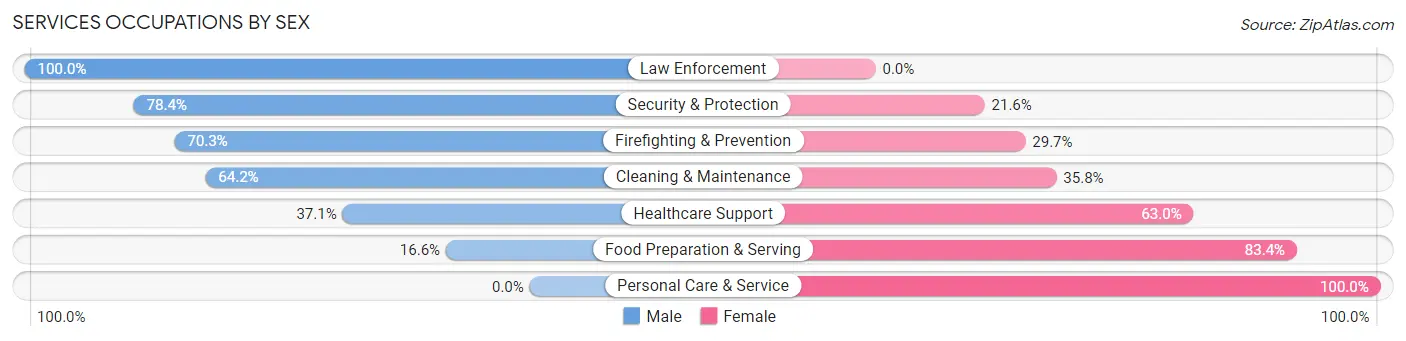
Services Occupations by Sex
Within the Services occupations in Cornelius, the most male-oriented occupations are Law Enforcement (100.0%), Security & Protection (78.4%), and Firefighting & Prevention (70.3%), while the most female-oriented occupations are Personal Care & Service (100.0%), Food Preparation & Serving (83.4%), and Healthcare Support (62.9%).
| Occupation | Male | Female |
| Healthcare Support | 103 (37.0%) | 175 (62.9%) |
| Security & Protection | 196 (78.4%) | 54 (21.6%) |
| Firefighting & Prevention | 128 (70.3%) | 54 (29.7%) |
| Law Enforcement | 68 (100.0%) | 0 (0.0%) |
| Food Preparation & Serving | 60 (16.6%) | 302 (83.4%) |
| Cleaning & Maintenance | 199 (64.2%) | 111 (35.8%) |
| Personal Care & Service | 0 (0.0%) | 71 (100.0%) |
| Total (Category) | 558 (43.9%) | 713 (56.1%) |
| Total (Overall) | 3,744 (55.2%) | 3,032 (44.8%) |
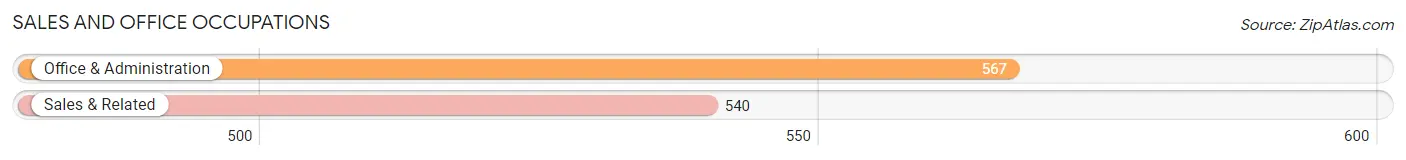
Sales and Office Occupations
The most common Sales and Office occupations in Cornelius are Office & Administration (567 | 8.4%), and Sales & Related (540 | 8.0%).
Sales and Office Occupations by Sex
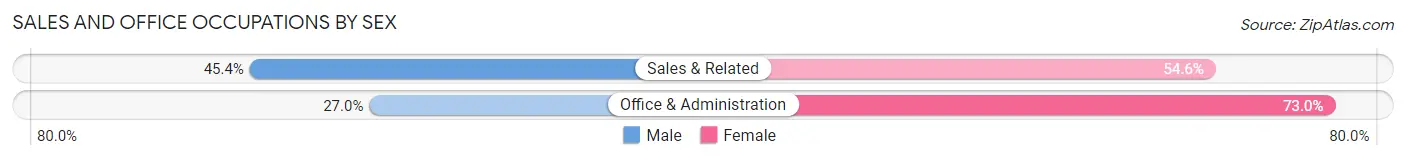
| Occupation | Male | Female |
| Sales & Related | 245 (45.4%) | 295 (54.6%) |
| Office & Administration | 153 (27.0%) | 414 (73.0%) |
| Total (Category) | 398 (35.9%) | 709 (64.0%) |
| Total (Overall) | 3,744 (55.2%) | 3,032 (44.8%) |
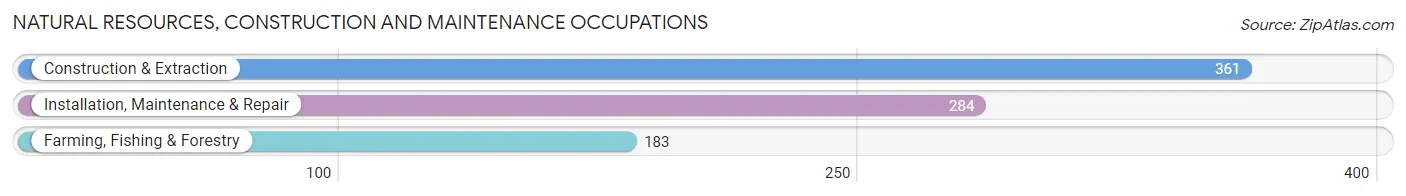
Natural Resources, Construction and Maintenance Occupations
The most common Natural Resources, Construction and Maintenance occupations in Cornelius are Construction & Extraction (361 | 5.3%), Installation, Maintenance & Repair (284 | 4.2%), and Farming, Fishing & Forestry (183 | 2.7%).
Natural Resources, Construction and Maintenance Occupations by Sex
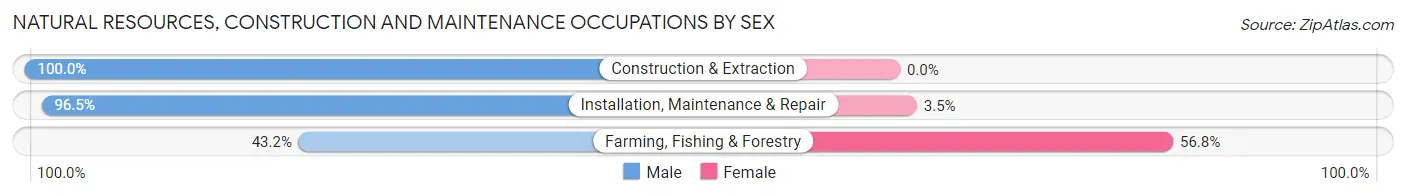
| Occupation | Male | Female |
| Farming, Fishing & Forestry | 79 (43.2%) | 104 (56.8%) |
| Construction & Extraction | 361 (100.0%) | 0 (0.0%) |
| Installation, Maintenance & Repair | 274 (96.5%) | 10 (3.5%) |
| Total (Category) | 714 (86.2%) | 114 (13.8%) |
| Total (Overall) | 3,744 (55.2%) | 3,032 (44.8%) |
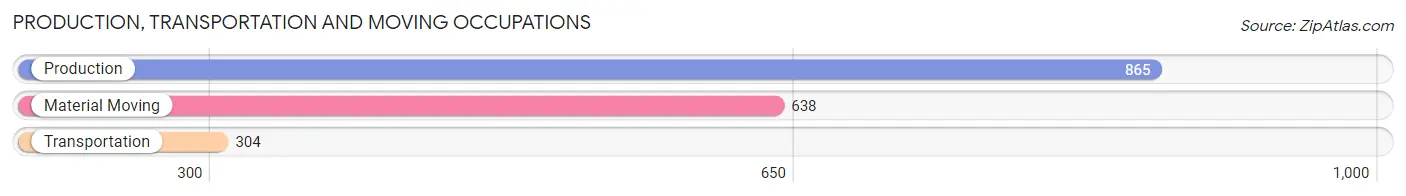
Production, Transportation and Moving Occupations
The most common Production, Transportation and Moving occupations in Cornelius are Production (865 | 12.8%), Material Moving (638 | 9.4%), and Transportation (304 | 4.5%).
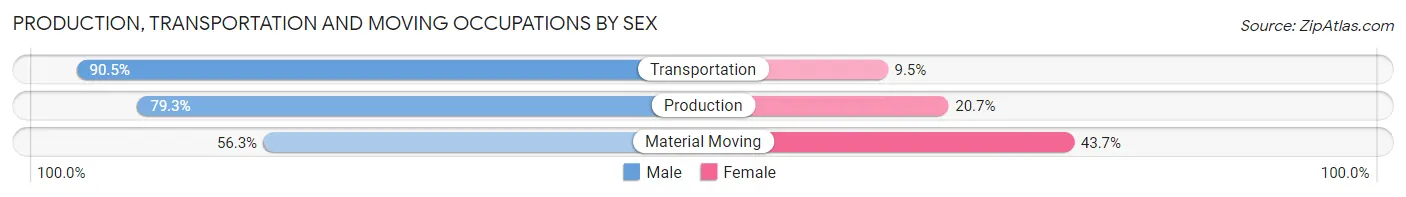
Production, Transportation and Moving Occupations by Sex
| Occupation | Male | Female |
| Production | 686 (79.3%) | 179 (20.7%) |
| Transportation | 275 (90.5%) | 29 (9.5%) |
| Material Moving | 359 (56.3%) | 279 (43.7%) |
| Total (Category) | 1,320 (73.1%) | 487 (27.0%) |
| Total (Overall) | 3,744 (55.2%) | 3,032 (44.8%) |
Employment Industries by Sex in Cornelius
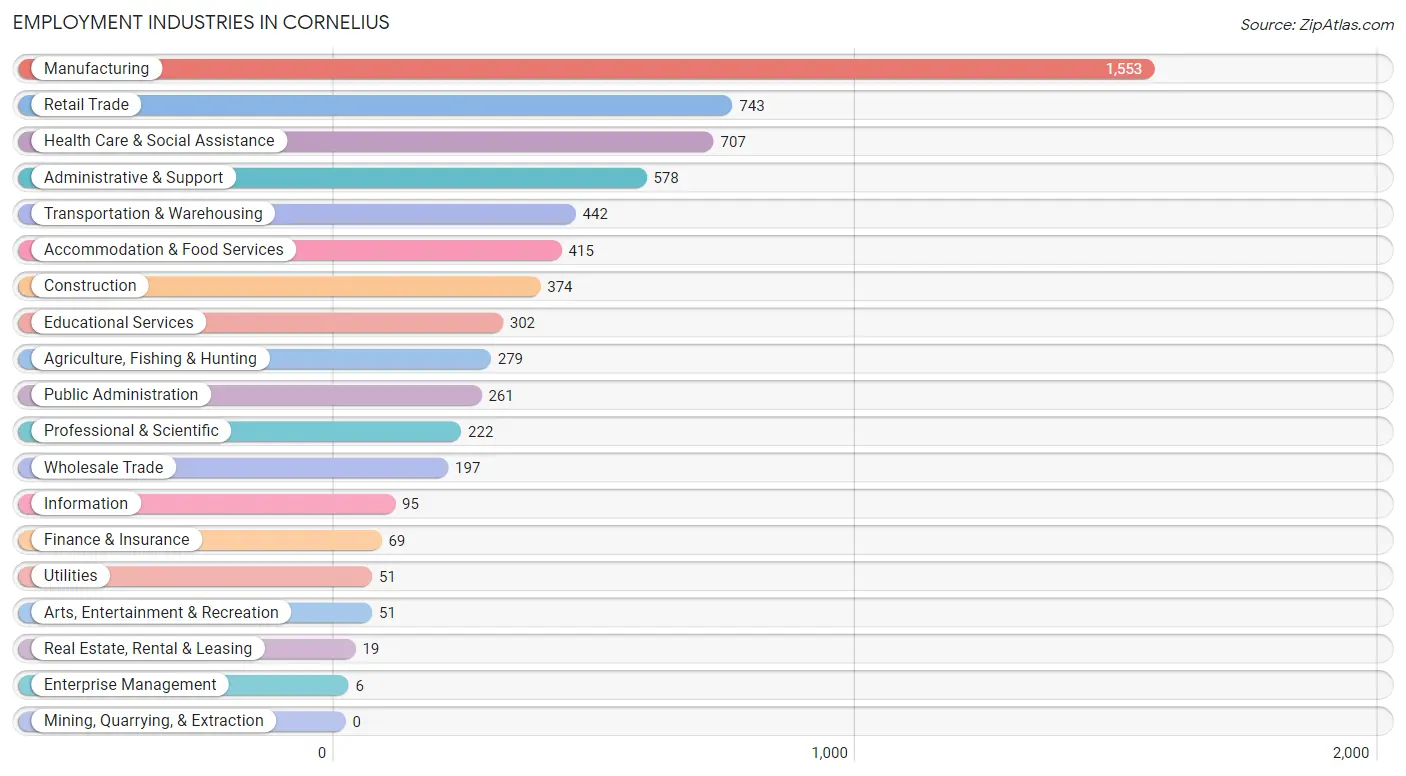
Employment Industries in Cornelius
The major employment industries in Cornelius include Manufacturing (1,553 | 22.9%), Retail Trade (743 | 11.0%), Health Care & Social Assistance (707 | 10.4%), Administrative & Support (578 | 8.5%), and Transportation & Warehousing (442 | 6.5%).
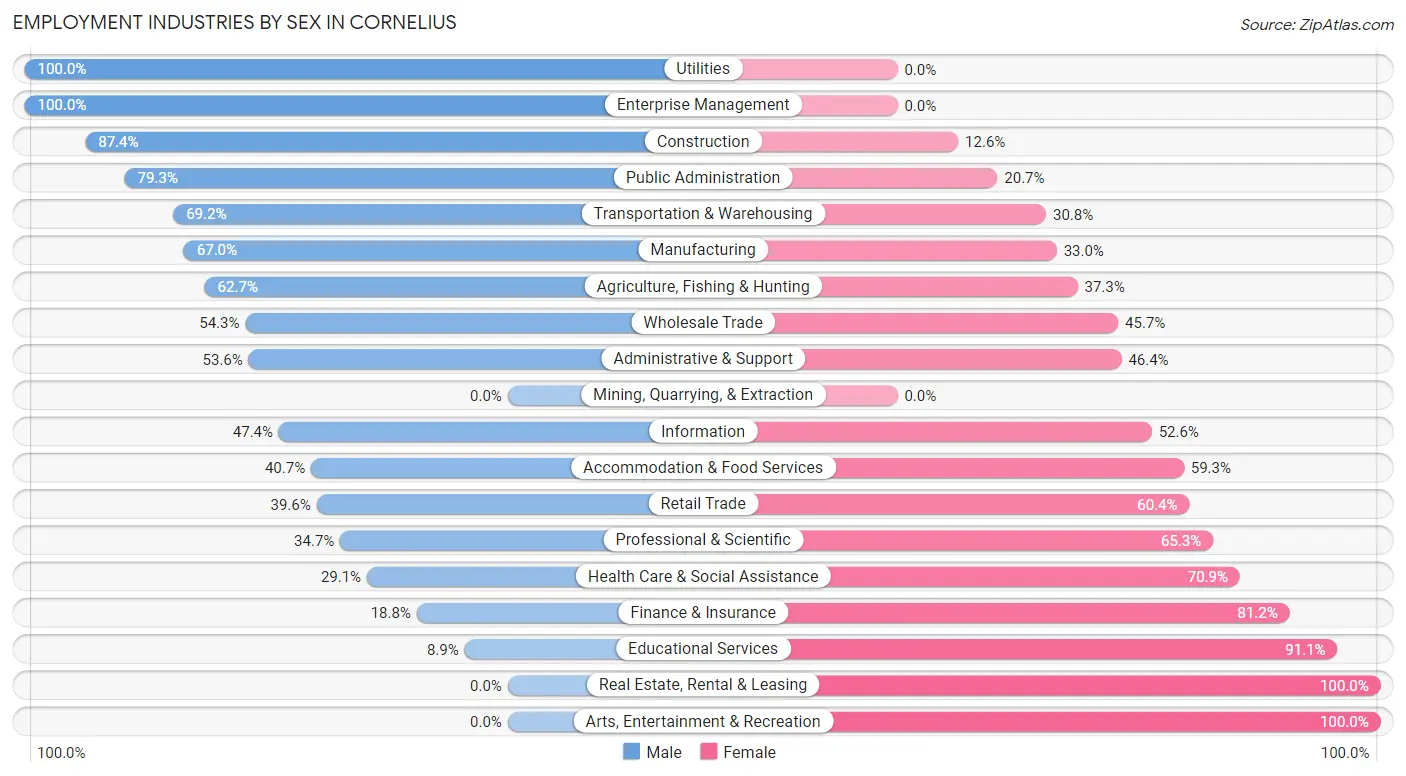
Employment Industries by Sex in Cornelius
The Cornelius industries that see more men than women are Utilities (100.0%), Enterprise Management (100.0%), and Construction (87.4%), whereas the industries that tend to have a higher number of women are Real Estate, Rental & Leasing (100.0%), Arts, Entertainment & Recreation (100.0%), and Educational Services (91.1%).
| Industry | Male | Female |
| Agriculture, Fishing & Hunting | 175 (62.7%) | 104 (37.3%) |
| Mining, Quarrying, & Extraction | 0 (0.0%) | 0 (0.0%) |
| Construction | 327 (87.4%) | 47 (12.6%) |
| Manufacturing | 1,041 (67.0%) | 512 (33.0%) |
| Wholesale Trade | 107 (54.3%) | 90 (45.7%) |
| Retail Trade | 294 (39.6%) | 449 (60.4%) |
| Transportation & Warehousing | 306 (69.2%) | 136 (30.8%) |
| Utilities | 51 (100.0%) | 0 (0.0%) |
| Information | 45 (47.4%) | 50 (52.6%) |
| Finance & Insurance | 13 (18.8%) | 56 (81.2%) |
| Real Estate, Rental & Leasing | 0 (0.0%) | 19 (100.0%) |
| Professional & Scientific | 77 (34.7%) | 145 (65.3%) |
| Enterprise Management | 6 (100.0%) | 0 (0.0%) |
| Administrative & Support | 310 (53.6%) | 268 (46.4%) |
| Educational Services | 27 (8.9%) | 275 (91.1%) |
| Health Care & Social Assistance | 206 (29.1%) | 501 (70.9%) |
| Arts, Entertainment & Recreation | 0 (0.0%) | 51 (100.0%) |
| Accommodation & Food Services | 169 (40.7%) | 246 (59.3%) |
| Public Administration | 207 (79.3%) | 54 (20.7%) |
| Total | 3,744 (55.2%) | 3,032 (44.8%) |
Education in Cornelius
School Enrollment in Cornelius
The most common levels of schooling among the 3,456 students in Cornelius are high school (1,092 | 31.6%), elementary school (831 | 24.0%), and middle school (703 | 20.3%).
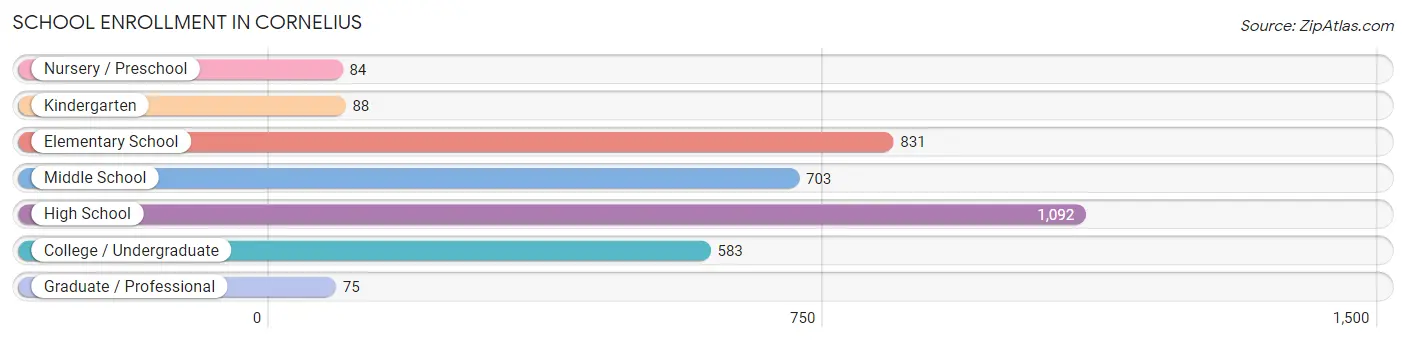
| School Level | # Students | % Students |
| Nursery / Preschool | 84 | 2.4% |
| Kindergarten | 88 | 2.5% |
| Elementary School | 831 | 24.0% |
| Middle School | 703 | 20.3% |
| High School | 1,092 | 31.6% |
| College / Undergraduate | 583 | 16.9% |
| Graduate / Professional | 75 | 2.2% |
| Total | 3,456 | 100.0% |
School Enrollment by Age by Funding Source in Cornelius
Out of a total of 3,456 students who are enrolled in schools in Cornelius, 259 (7.5%) attend a private institution, while the remaining 3,197 (92.5%) are enrolled in public schools. The age group of 3 to 4 year olds has the highest likelihood of being enrolled in private schools, with 29 (44.6% in the age bracket) enrolled. Conversely, the age group of 15 to 17 year olds has the lowest likelihood of being enrolled in a private school, with 811 (100.0% in the age bracket) attending a public institution.
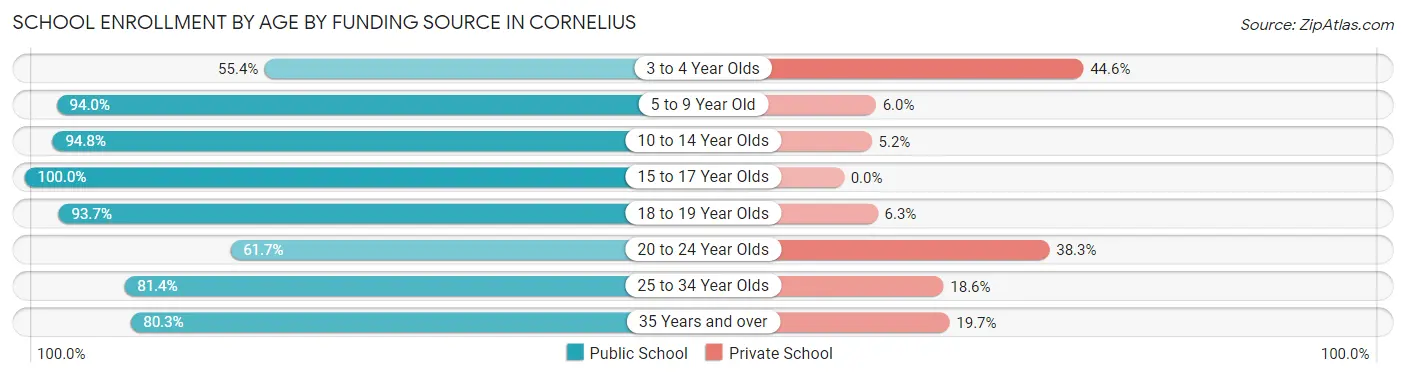
| Age Bracket | Public School | Private School |
| 3 to 4 Year Olds | 36 (55.4%) | 29 (44.6%) |
| 5 to 9 Year Old | 851 (94.0%) | 54 (6.0%) |
| 10 to 14 Year Olds | 856 (94.8%) | 47 (5.2%) |
| 15 to 17 Year Olds | 811 (100.0%) | 0 (0.0%) |
| 18 to 19 Year Olds | 341 (93.7%) | 23 (6.3%) |
| 20 to 24 Year Olds | 87 (61.7%) | 54 (38.3%) |
| 25 to 34 Year Olds | 114 (81.4%) | 26 (18.6%) |
| 35 Years and over | 102 (80.3%) | 25 (19.7%) |
| Total | 3,197 (92.5%) | 259 (7.5%) |
Educational Attainment by Field of Study in Cornelius
Liberal arts & history (287 | 21.5%), business (223 | 16.7%), education (165 | 12.4%), science & technology (133 | 10.0%), and arts & humanities (109 | 8.2%) are the most common fields of study among 1,332 individuals in Cornelius who have obtained a bachelor's degree or higher.
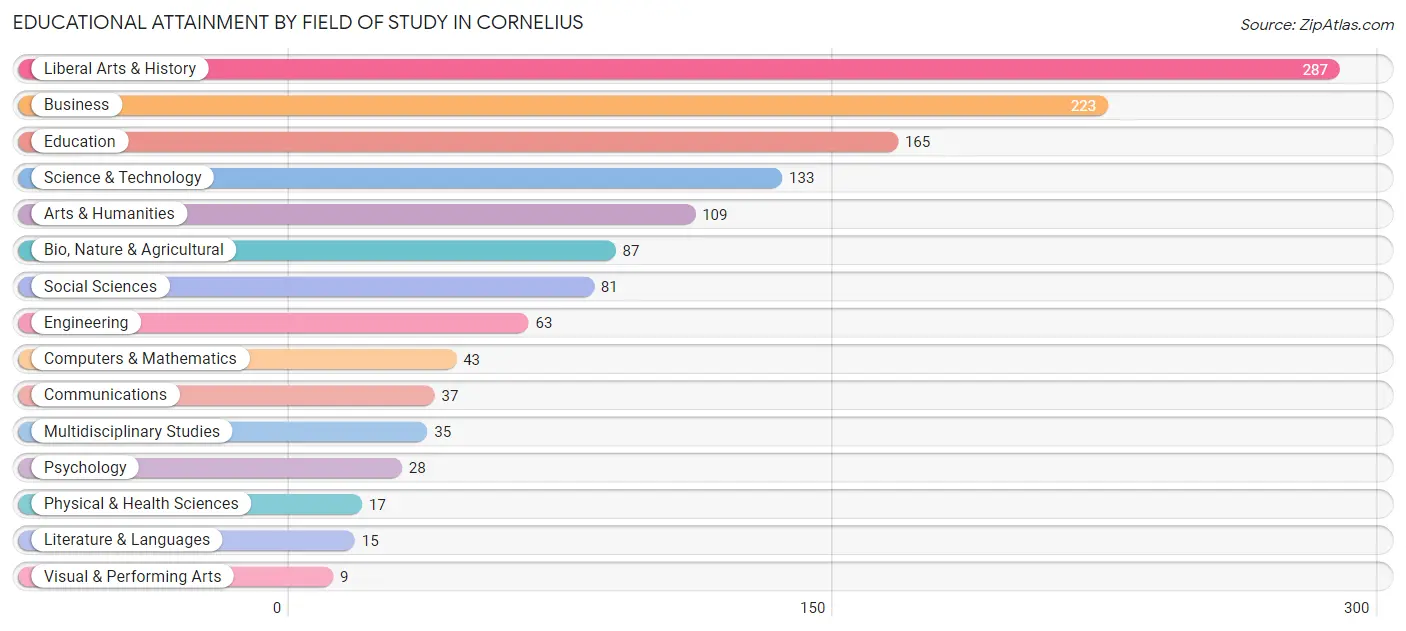
| Field of Study | # Graduates | % Graduates |
| Computers & Mathematics | 43 | 3.2% |
| Bio, Nature & Agricultural | 87 | 6.5% |
| Physical & Health Sciences | 17 | 1.3% |
| Psychology | 28 | 2.1% |
| Social Sciences | 81 | 6.1% |
| Engineering | 63 | 4.7% |
| Multidisciplinary Studies | 35 | 2.6% |
| Science & Technology | 133 | 10.0% |
| Business | 223 | 16.7% |
| Education | 165 | 12.4% |
| Literature & Languages | 15 | 1.1% |
| Liberal Arts & History | 287 | 21.5% |
| Visual & Performing Arts | 9 | 0.7% |
| Communications | 37 | 2.8% |
| Arts & Humanities | 109 | 8.2% |
| Total | 1,332 | 100.0% |
Transportation & Commute in Cornelius
Vehicle Availability by Sex in Cornelius
The most prevalent vehicle ownership categories in Cornelius are males with 2 vehicles (1,646, accounting for 45.3%) and females with 2 vehicles (1,115, making up 55.4%).
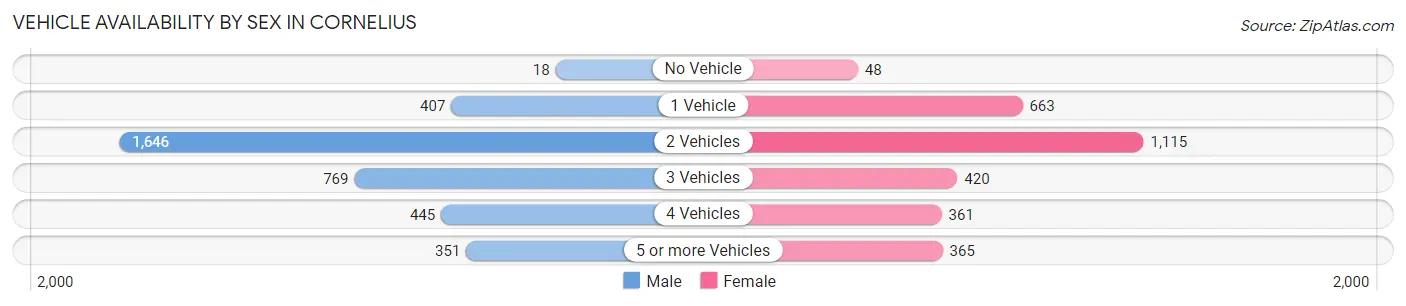
| Vehicles Available | Male | Female |
| No Vehicle | 18 (0.5%) | 48 (1.6%) |
| 1 Vehicle | 407 (11.2%) | 663 (22.3%) |
| 2 Vehicles | 1,646 (45.3%) | 1,115 (37.5%) |
| 3 Vehicles | 769 (21.1%) | 420 (14.1%) |
| 4 Vehicles | 445 (12.2%) | 361 (12.1%) |
| 5 or more Vehicles | 351 (9.7%) | 365 (12.3%) |
| Total | 3,636 (100.0%) | 2,972 (100.0%) |
Commute Time in Cornelius
The most frequently occuring commute durations in Cornelius are 20 to 24 minutes (841 commuters, 13.5%), 10 to 14 minutes (830 commuters, 13.4%), and 15 to 19 minutes (783 commuters, 12.6%).
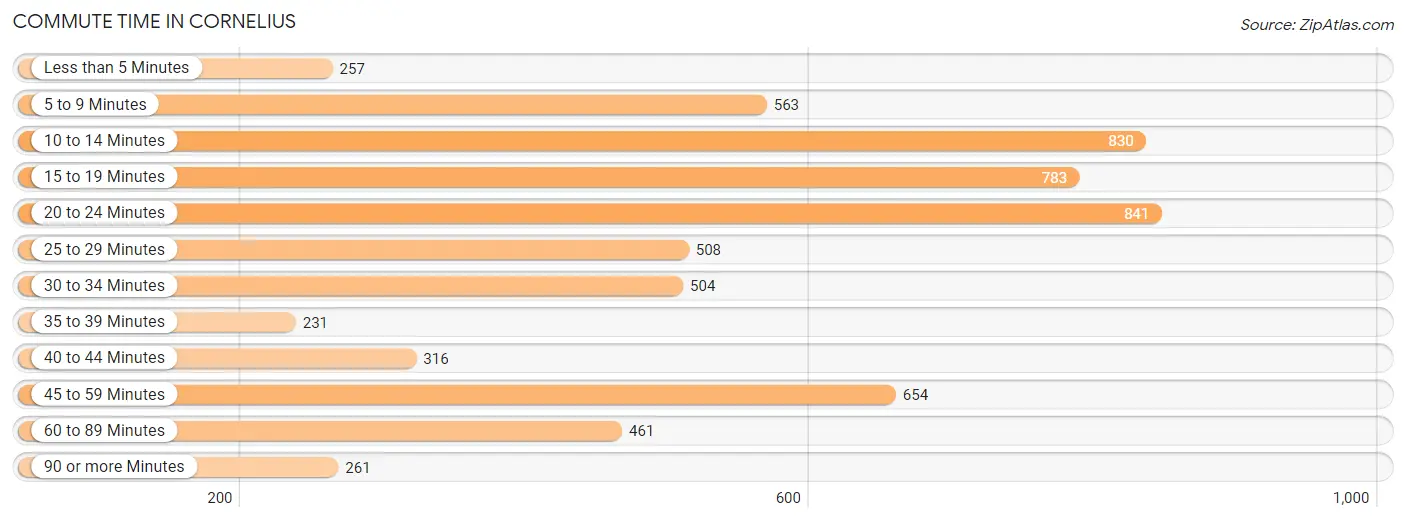
| Commute Time | # Commuters | % Commuters |
| Less than 5 Minutes | 257 | 4.1% |
| 5 to 9 Minutes | 563 | 9.1% |
| 10 to 14 Minutes | 830 | 13.4% |
| 15 to 19 Minutes | 783 | 12.6% |
| 20 to 24 Minutes | 841 | 13.5% |
| 25 to 29 Minutes | 508 | 8.2% |
| 30 to 34 Minutes | 504 | 8.1% |
| 35 to 39 Minutes | 231 | 3.7% |
| 40 to 44 Minutes | 316 | 5.1% |
| 45 to 59 Minutes | 654 | 10.5% |
| 60 to 89 Minutes | 461 | 7.4% |
| 90 or more Minutes | 261 | 4.2% |
Commute Time by Sex in Cornelius
The most common commute times in Cornelius are 10 to 14 minutes (573 commuters, 16.5%) for males and 45 to 59 minutes (361 commuters, 13.2%) for females.
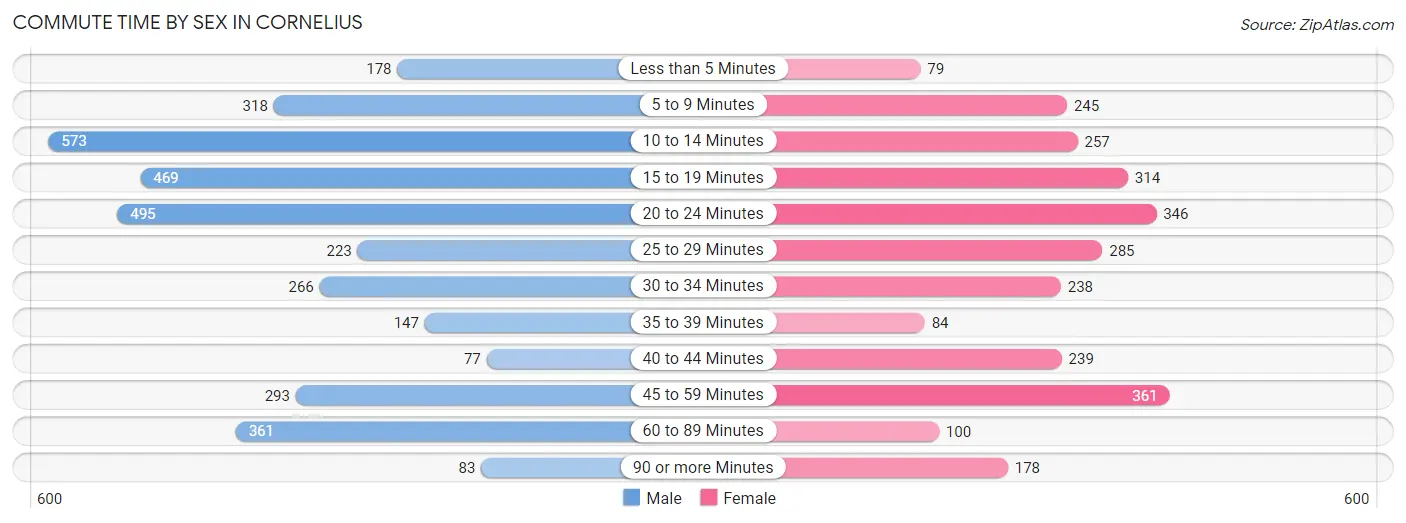
| Commute Time | Male | Female |
| Less than 5 Minutes | 178 (5.1%) | 79 (2.9%) |
| 5 to 9 Minutes | 318 (9.1%) | 245 (9.0%) |
| 10 to 14 Minutes | 573 (16.5%) | 257 (9.4%) |
| 15 to 19 Minutes | 469 (13.5%) | 314 (11.5%) |
| 20 to 24 Minutes | 495 (14.2%) | 346 (12.7%) |
| 25 to 29 Minutes | 223 (6.4%) | 285 (10.4%) |
| 30 to 34 Minutes | 266 (7.6%) | 238 (8.7%) |
| 35 to 39 Minutes | 147 (4.2%) | 84 (3.1%) |
| 40 to 44 Minutes | 77 (2.2%) | 239 (8.8%) |
| 45 to 59 Minutes | 293 (8.4%) | 361 (13.2%) |
| 60 to 89 Minutes | 361 (10.4%) | 100 (3.7%) |
| 90 or more Minutes | 83 (2.4%) | 178 (6.5%) |
Time of Departure to Work by Sex in Cornelius
The most frequent times of departure to work in Cornelius are 7:00 AM to 7:29 AM (631, 18.1%) for males and 6:30 AM to 6:59 AM (712, 26.1%) for females.
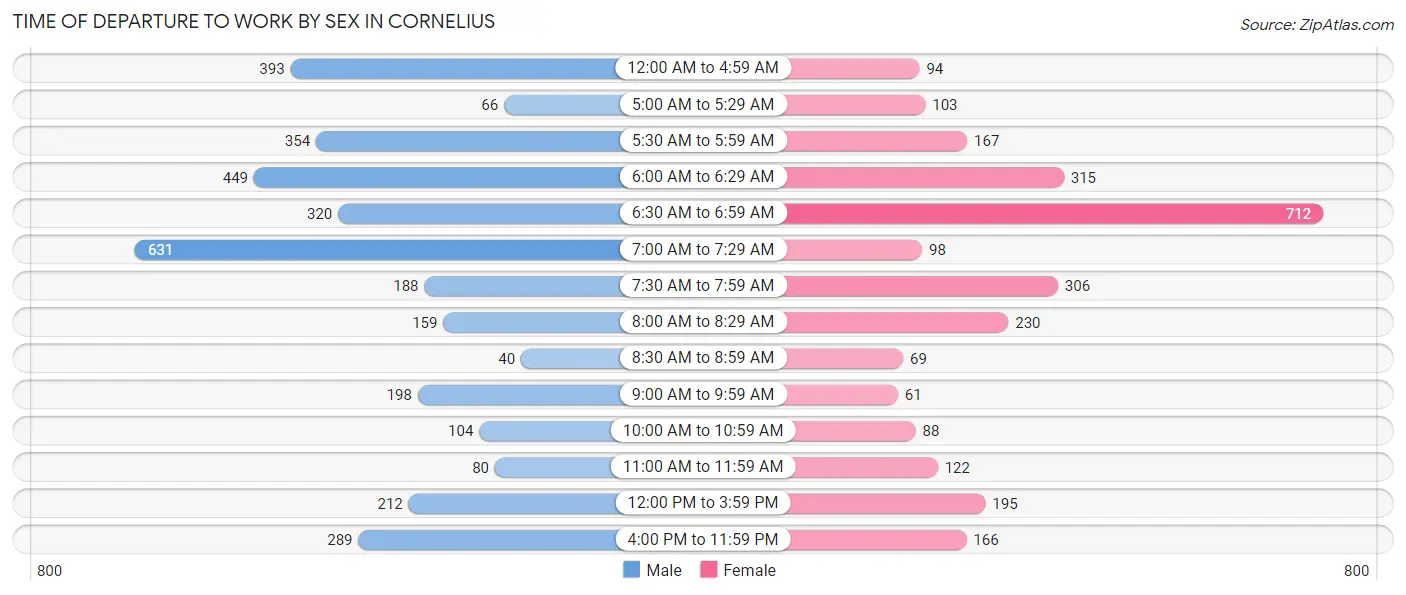
| Time of Departure | Male | Female |
| 12:00 AM to 4:59 AM | 393 (11.3%) | 94 (3.5%) |
| 5:00 AM to 5:29 AM | 66 (1.9%) | 103 (3.8%) |
| 5:30 AM to 5:59 AM | 354 (10.2%) | 167 (6.1%) |
| 6:00 AM to 6:29 AM | 449 (12.9%) | 315 (11.6%) |
| 6:30 AM to 6:59 AM | 320 (9.2%) | 712 (26.1%) |
| 7:00 AM to 7:29 AM | 631 (18.1%) | 98 (3.6%) |
| 7:30 AM to 7:59 AM | 188 (5.4%) | 306 (11.2%) |
| 8:00 AM to 8:29 AM | 159 (4.6%) | 230 (8.4%) |
| 8:30 AM to 8:59 AM | 40 (1.1%) | 69 (2.5%) |
| 9:00 AM to 9:59 AM | 198 (5.7%) | 61 (2.2%) |
| 10:00 AM to 10:59 AM | 104 (3.0%) | 88 (3.2%) |
| 11:00 AM to 11:59 AM | 80 (2.3%) | 122 (4.5%) |
| 12:00 PM to 3:59 PM | 212 (6.1%) | 195 (7.1%) |
| 4:00 PM to 11:59 PM | 289 (8.3%) | 166 (6.1%) |
| Total | 3,483 (100.0%) | 2,726 (100.0%) |
Housing Occupancy in Cornelius
Occupancy by Ownership in Cornelius
Of the total 4,382 dwellings in Cornelius, owner-occupied units account for 3,242 (74.0%), while renter-occupied units make up 1,140 (26.0%).
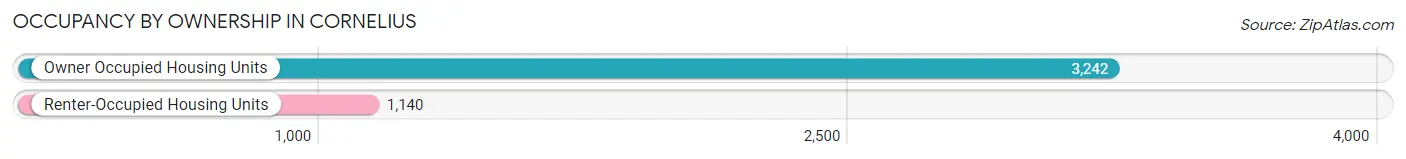
| Occupancy | # Housing Units | % Housing Units |
| Owner Occupied Housing Units | 3,242 | 74.0% |
| Renter-Occupied Housing Units | 1,140 | 26.0% |
| Total Occupied Housing Units | 4,382 | 100.0% |
Occupancy by Household Size in Cornelius
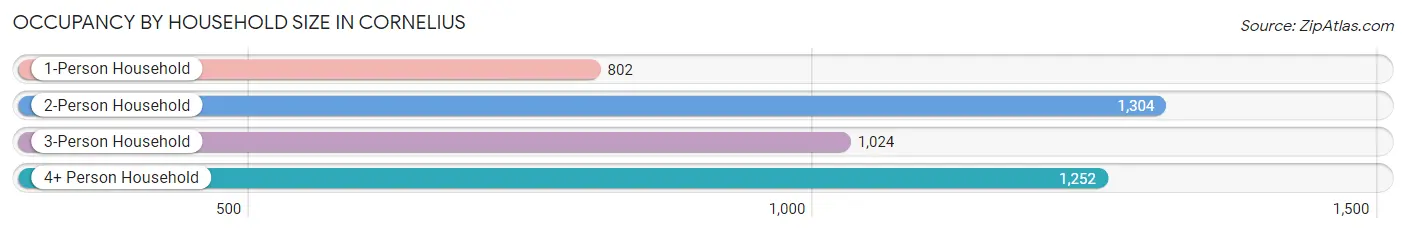
| Household Size | # Housing Units | % Housing Units |
| 1-Person Household | 802 | 18.3% |
| 2-Person Household | 1,304 | 29.8% |
| 3-Person Household | 1,024 | 23.4% |
| 4+ Person Household | 1,252 | 28.6% |
| Total Housing Units | 4,382 | 100.0% |
Occupancy by Ownership by Household Size in Cornelius
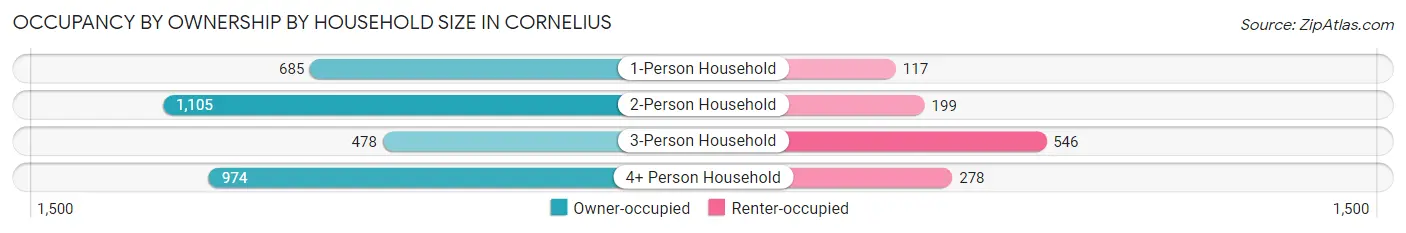
| Household Size | Owner-occupied | Renter-occupied |
| 1-Person Household | 685 (85.4%) | 117 (14.6%) |
| 2-Person Household | 1,105 (84.7%) | 199 (15.3%) |
| 3-Person Household | 478 (46.7%) | 546 (53.3%) |
| 4+ Person Household | 974 (77.8%) | 278 (22.2%) |
| Total Housing Units | 3,242 (74.0%) | 1,140 (26.0%) |
Occupancy by Educational Attainment in Cornelius
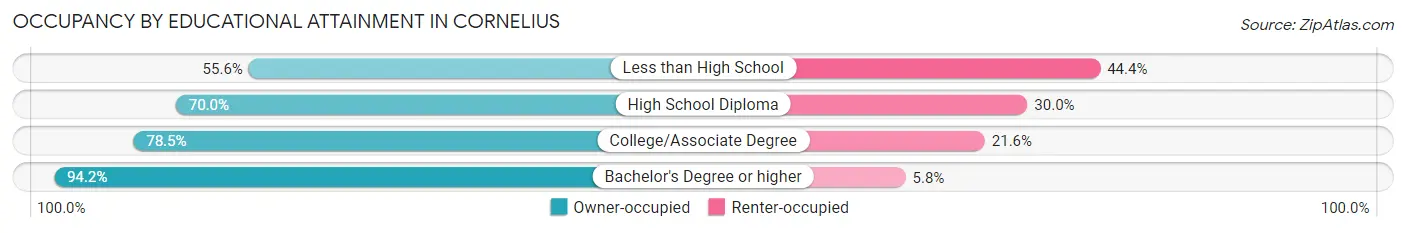
| Household Size | Owner-occupied | Renter-occupied |
| Less than High School | 588 (55.6%) | 470 (44.4%) |
| High School Diploma | 668 (70.0%) | 286 (30.0%) |
| College/Associate Degree | 1,227 (78.4%) | 337 (21.5%) |
| Bachelor's Degree or higher | 759 (94.2%) | 47 (5.8%) |
Occupancy by Age of Householder in Cornelius
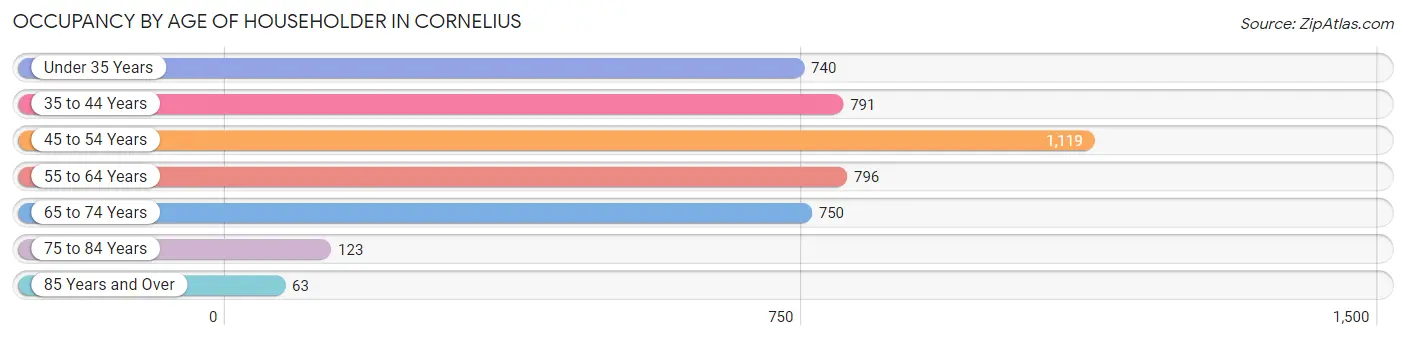
| Age Bracket | # Households | % Households |
| Under 35 Years | 740 | 16.9% |
| 35 to 44 Years | 791 | 18.0% |
| 45 to 54 Years | 1,119 | 25.5% |
| 55 to 64 Years | 796 | 18.2% |
| 65 to 74 Years | 750 | 17.1% |
| 75 to 84 Years | 123 | 2.8% |
| 85 Years and Over | 63 | 1.4% |
| Total | 4,382 | 100.0% |
Housing Finances in Cornelius
Median Income by Occupancy in Cornelius
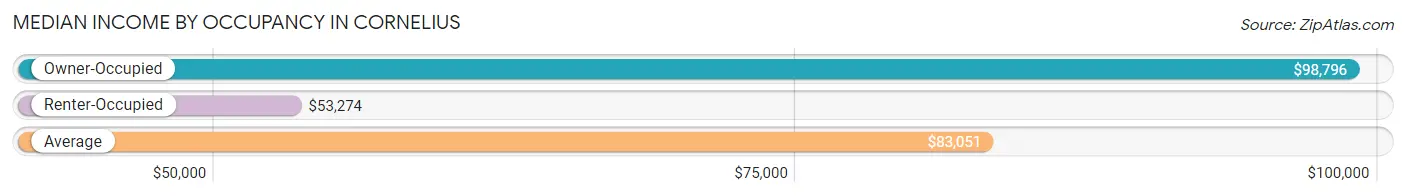
| Occupancy Type | # Households | Median Income |
| Owner-Occupied | 3,242 (74.0%) | $98,796 |
| Renter-Occupied | 1,140 (26.0%) | $53,274 |
| Average | 4,382 (100.0%) | $83,051 |
Occupancy by Householder Income Bracket in Cornelius
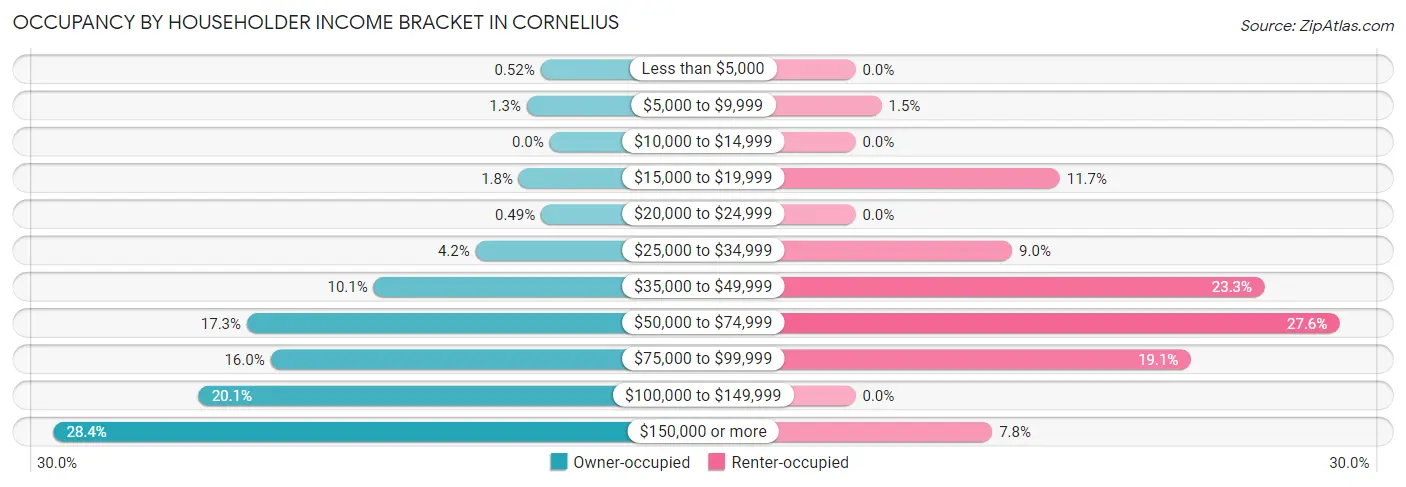
| Income Bracket | Owner-occupied | Renter-occupied |
| Less than $5,000 | 17 (0.5%) | 0 (0.0%) |
| $5,000 to $9,999 | 42 (1.3%) | 17 (1.5%) |
| $10,000 to $14,999 | 0 (0.0%) | 0 (0.0%) |
| $15,000 to $19,999 | 57 (1.8%) | 133 (11.7%) |
| $20,000 to $24,999 | 16 (0.5%) | 0 (0.0%) |
| $25,000 to $34,999 | 137 (4.2%) | 102 (8.9%) |
| $35,000 to $49,999 | 326 (10.1%) | 266 (23.3%) |
| $50,000 to $74,999 | 561 (17.3%) | 315 (27.6%) |
| $75,000 to $99,999 | 517 (16.0%) | 218 (19.1%) |
| $100,000 to $149,999 | 650 (20.1%) | 0 (0.0%) |
| $150,000 or more | 919 (28.3%) | 89 (7.8%) |
| Total | 3,242 (100.0%) | 1,140 (100.0%) |
Monthly Housing Cost Tiers in Cornelius
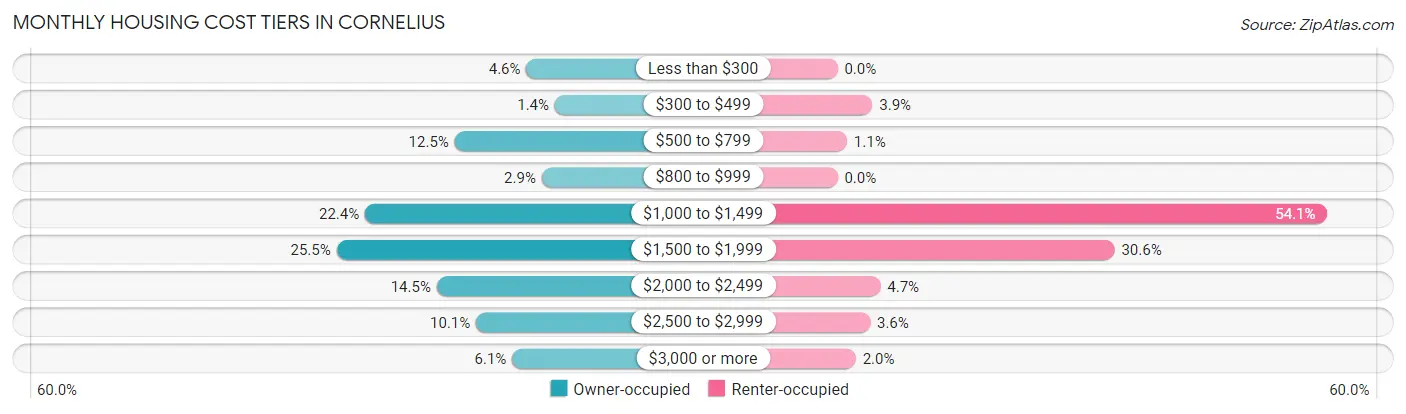
| Monthly Cost | Owner-occupied | Renter-occupied |
| Less than $300 | 148 (4.6%) | 0 (0.0%) |
| $300 to $499 | 46 (1.4%) | 44 (3.9%) |
| $500 to $799 | 405 (12.5%) | 12 (1.1%) |
| $800 to $999 | 93 (2.9%) | 0 (0.0%) |
| $1,000 to $1,499 | 726 (22.4%) | 617 (54.1%) |
| $1,500 to $1,999 | 828 (25.5%) | 349 (30.6%) |
| $2,000 to $2,499 | 469 (14.5%) | 54 (4.7%) |
| $2,500 to $2,999 | 328 (10.1%) | 41 (3.6%) |
| $3,000 or more | 199 (6.1%) | 23 (2.0%) |
| Total | 3,242 (100.0%) | 1,140 (100.0%) |
Physical Housing Characteristics in Cornelius
Housing Structures in Cornelius
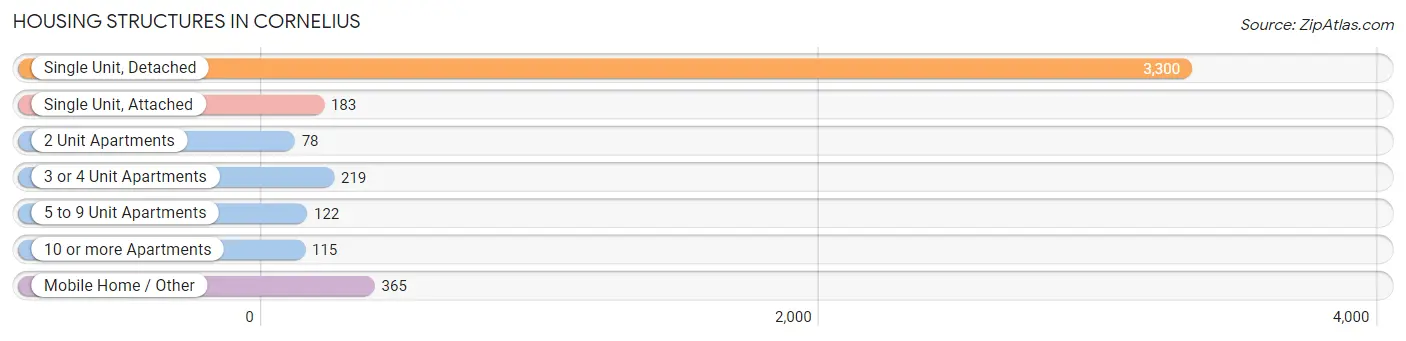
| Structure Type | # Housing Units | % Housing Units |
| Single Unit, Detached | 3,300 | 75.3% |
| Single Unit, Attached | 183 | 4.2% |
| 2 Unit Apartments | 78 | 1.8% |
| 3 or 4 Unit Apartments | 219 | 5.0% |
| 5 to 9 Unit Apartments | 122 | 2.8% |
| 10 or more Apartments | 115 | 2.6% |
| Mobile Home / Other | 365 | 8.3% |
| Total | 4,382 | 100.0% |
Housing Structures by Occupancy in Cornelius
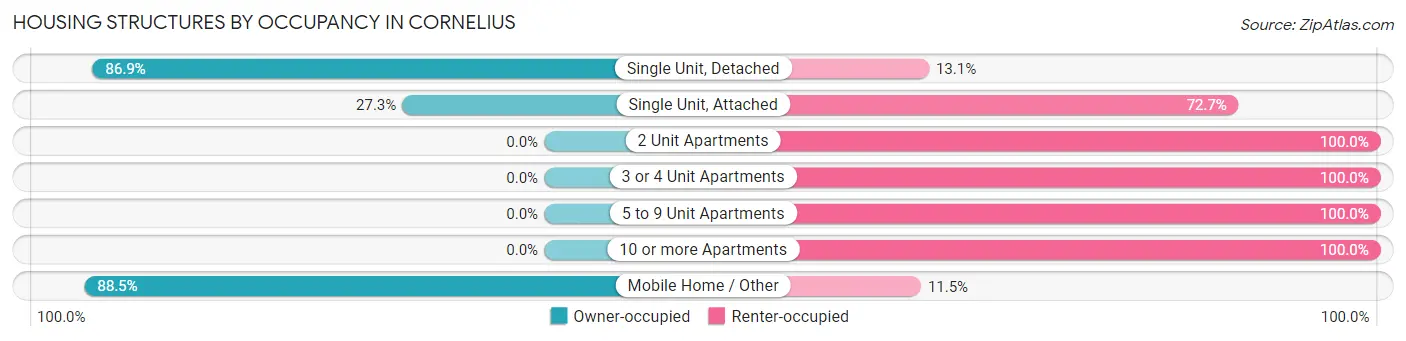
| Structure Type | Owner-occupied | Renter-occupied |
| Single Unit, Detached | 2,869 (86.9%) | 431 (13.1%) |
| Single Unit, Attached | 50 (27.3%) | 133 (72.7%) |
| 2 Unit Apartments | 0 (0.0%) | 78 (100.0%) |
| 3 or 4 Unit Apartments | 0 (0.0%) | 219 (100.0%) |
| 5 to 9 Unit Apartments | 0 (0.0%) | 122 (100.0%) |
| 10 or more Apartments | 0 (0.0%) | 115 (100.0%) |
| Mobile Home / Other | 323 (88.5%) | 42 (11.5%) |
| Total | 3,242 (74.0%) | 1,140 (26.0%) |
Housing Structures by Number of Rooms in Cornelius
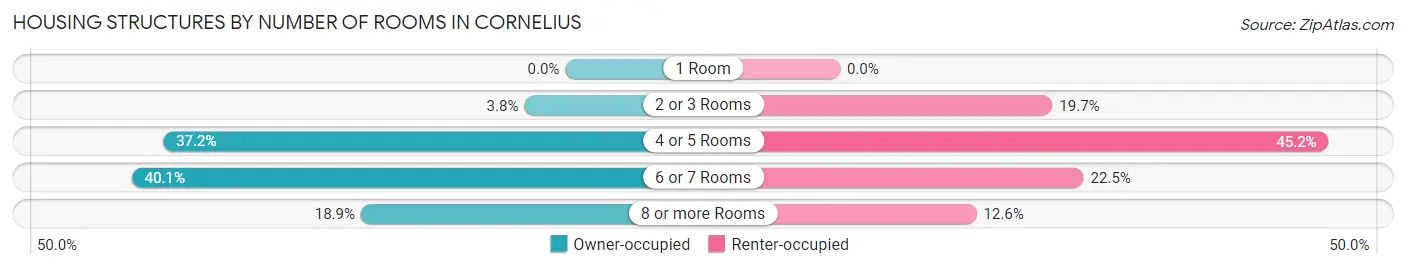
| Number of Rooms | Owner-occupied | Renter-occupied |
| 1 Room | 0 (0.0%) | 0 (0.0%) |
| 2 or 3 Rooms | 123 (3.8%) | 224 (19.7%) |
| 4 or 5 Rooms | 1,206 (37.2%) | 515 (45.2%) |
| 6 or 7 Rooms | 1,300 (40.1%) | 257 (22.5%) |
| 8 or more Rooms | 613 (18.9%) | 144 (12.6%) |
| Total | 3,242 (100.0%) | 1,140 (100.0%) |
Housing Structure by Heating Type in Cornelius
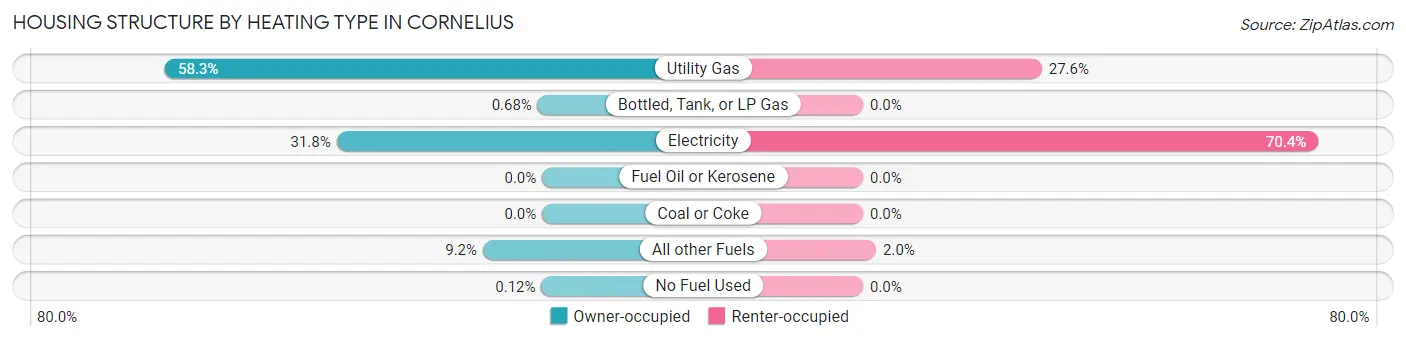
| Heating Type | Owner-occupied | Renter-occupied |
| Utility Gas | 1,889 (58.3%) | 315 (27.6%) |
| Bottled, Tank, or LP Gas | 22 (0.7%) | 0 (0.0%) |
| Electricity | 1,030 (31.8%) | 802 (70.4%) |
| Fuel Oil or Kerosene | 0 (0.0%) | 0 (0.0%) |
| Coal or Coke | 0 (0.0%) | 0 (0.0%) |
| All other Fuels | 297 (9.2%) | 23 (2.0%) |
| No Fuel Used | 4 (0.1%) | 0 (0.0%) |
| Total | 3,242 (100.0%) | 1,140 (100.0%) |
Household Vehicle Usage in Cornelius
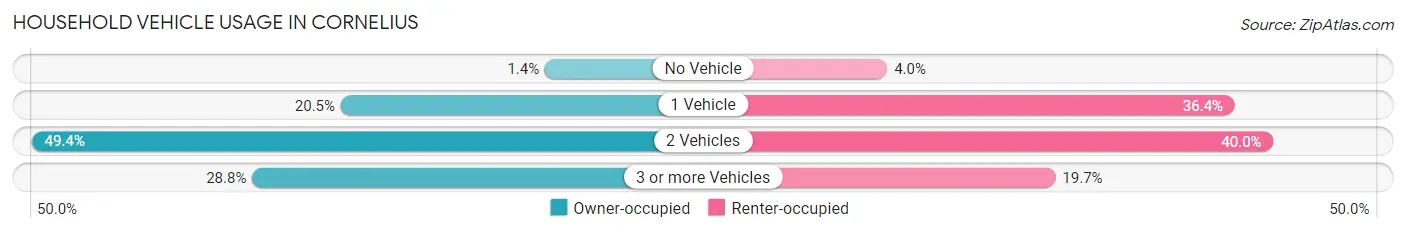
| Vehicles per Household | Owner-occupied | Renter-occupied |
| No Vehicle | 46 (1.4%) | 45 (4.0%) |
| 1 Vehicle | 664 (20.5%) | 415 (36.4%) |
| 2 Vehicles | 1,600 (49.3%) | 456 (40.0%) |
| 3 or more Vehicles | 932 (28.7%) | 224 (19.7%) |
| Total | 3,242 (100.0%) | 1,140 (100.0%) |
Real Estate & Mortgages in Cornelius
Real Estate and Mortgage Overview in Cornelius
| Characteristic | Without Mortgage | With Mortgage |
| Housing Units | 720 | 2,522 |
| Median Property Value | $345,600 | $382,600 |
| Median Household Income | $70,962 | $899 |
| Monthly Housing Costs | $636 | $165 |
| Real Estate Taxes | $3,338 | $35 |
Property Value by Mortgage Status in Cornelius
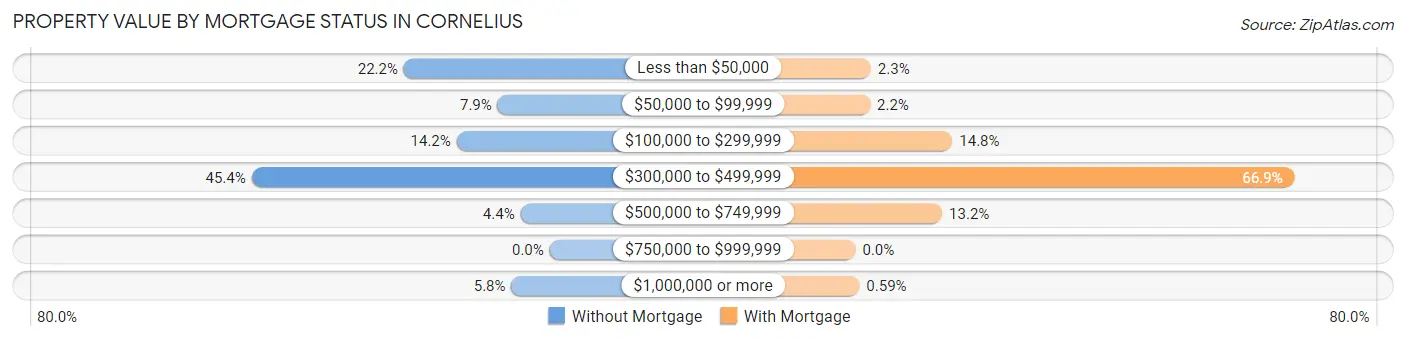
| Property Value | Without Mortgage | With Mortgage |
| Less than $50,000 | 160 (22.2%) | 59 (2.3%) |
| $50,000 to $99,999 | 57 (7.9%) | 56 (2.2%) |
| $100,000 to $299,999 | 102 (14.2%) | 372 (14.7%) |
| $300,000 to $499,999 | 327 (45.4%) | 1,687 (66.9%) |
| $500,000 to $749,999 | 32 (4.4%) | 333 (13.2%) |
| $750,000 to $999,999 | 0 (0.0%) | 0 (0.0%) |
| $1,000,000 or more | 42 (5.8%) | 15 (0.6%) |
| Total | 720 (100.0%) | 2,522 (100.0%) |
Household Income by Mortgage Status in Cornelius
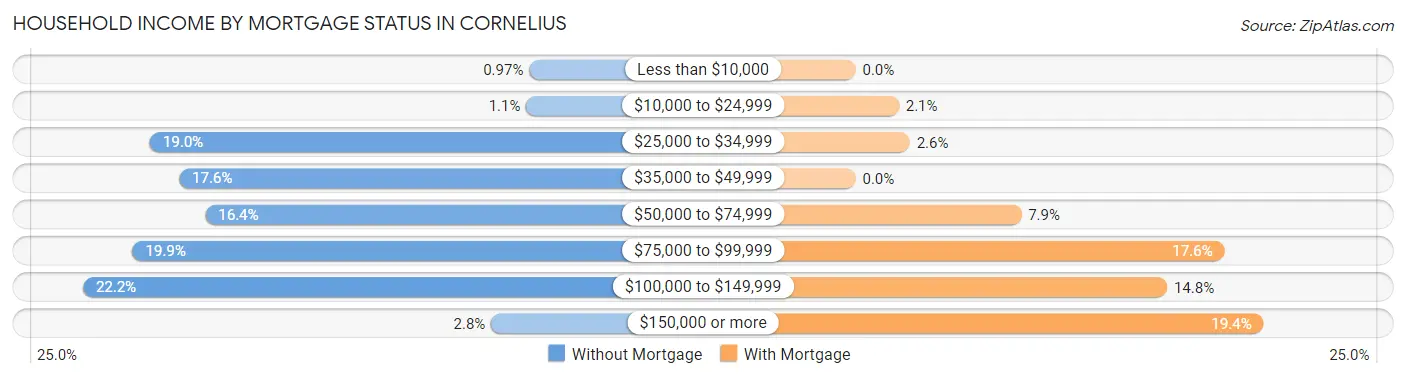
| Household Income | Without Mortgage | With Mortgage |
| Less than $10,000 | 7 (1.0%) | 0 (0.0%) |
| $10,000 to $24,999 | 8 (1.1%) | 52 (2.1%) |
| $25,000 to $34,999 | 137 (19.0%) | 65 (2.6%) |
| $35,000 to $49,999 | 127 (17.6%) | 0 (0.0%) |
| $50,000 to $74,999 | 118 (16.4%) | 199 (7.9%) |
| $75,000 to $99,999 | 143 (19.9%) | 443 (17.6%) |
| $100,000 to $149,999 | 160 (22.2%) | 374 (14.8%) |
| $150,000 or more | 20 (2.8%) | 490 (19.4%) |
| Total | 720 (100.0%) | 2,522 (100.0%) |
Property Value to Household Income Ratio in Cornelius
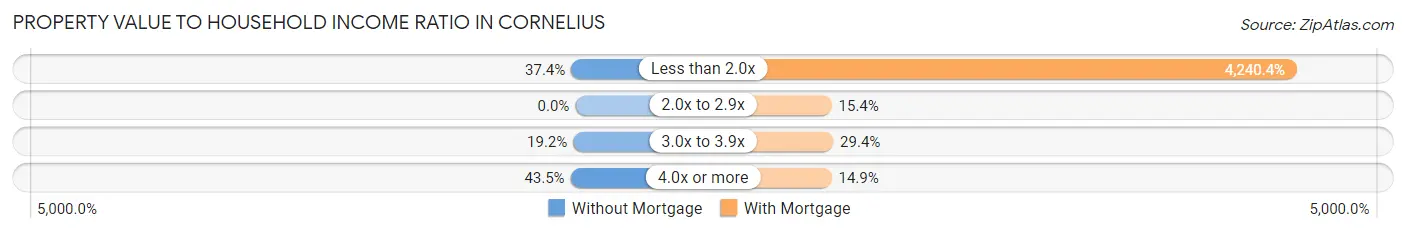
| Value-to-Income Ratio | Without Mortgage | With Mortgage |
| Less than 2.0x | 269 (37.4%) | 106,944 (4,240.4%) |
| 2.0x to 2.9x | 0 (0.0%) | 389 (15.4%) |
| 3.0x to 3.9x | 138 (19.2%) | 741 (29.4%) |
| 4.0x or more | 313 (43.5%) | 375 (14.9%) |
| Total | 720 (100.0%) | 2,522 (100.0%) |
Real Estate Taxes by Mortgage Status in Cornelius
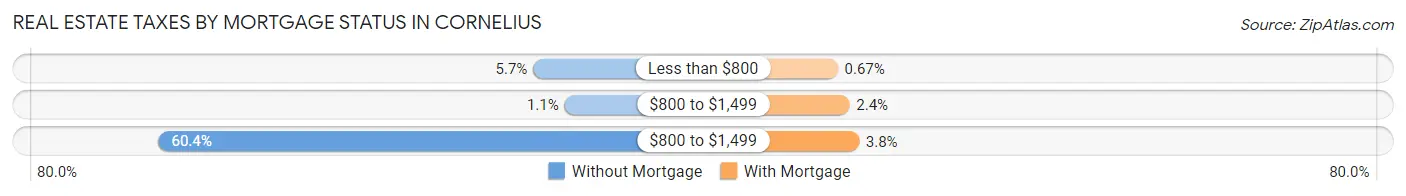
| Property Taxes | Without Mortgage | With Mortgage |
| Less than $800 | 41 (5.7%) | 17 (0.7%) |
| $800 to $1,499 | 8 (1.1%) | 60 (2.4%) |
| $800 to $1,499 | 435 (60.4%) | 95 (3.8%) |
| Total | 720 (100.0%) | 2,522 (100.0%) |
Health & Disability in Cornelius
Health Insurance Coverage by Age in Cornelius
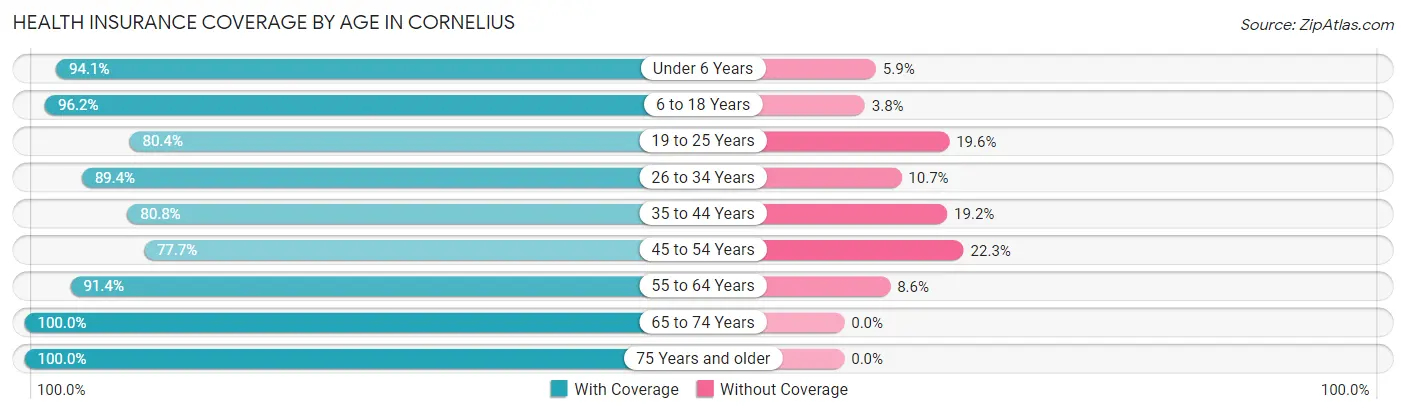
| Age Bracket | With Coverage | Without Coverage |
| Under 6 Years | 591 (94.1%) | 37 (5.9%) |
| 6 to 18 Years | 2,612 (96.2%) | 104 (3.8%) |
| 19 to 25 Years | 1,221 (80.4%) | 297 (19.6%) |
| 26 to 34 Years | 1,149 (89.3%) | 137 (10.6%) |
| 35 to 44 Years | 1,568 (80.8%) | 372 (19.2%) |
| 45 to 54 Years | 1,648 (77.7%) | 472 (22.3%) |
| 55 to 64 Years | 1,367 (91.4%) | 128 (8.6%) |
| 65 to 74 Years | 1,209 (100.0%) | 0 (0.0%) |
| 75 Years and older | 313 (100.0%) | 0 (0.0%) |
| Total | 11,678 (88.3%) | 1,547 (11.7%) |
Health Insurance Coverage by Citizenship Status in Cornelius
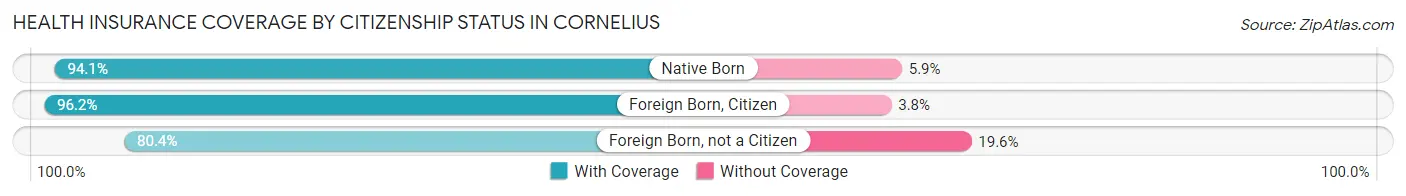
| Citizenship Status | With Coverage | Without Coverage |
| Native Born | 591 (94.1%) | 37 (5.9%) |
| Foreign Born, Citizen | 2,612 (96.2%) | 104 (3.8%) |
| Foreign Born, not a Citizen | 1,221 (80.4%) | 297 (19.6%) |
Health Insurance Coverage by Household Income in Cornelius
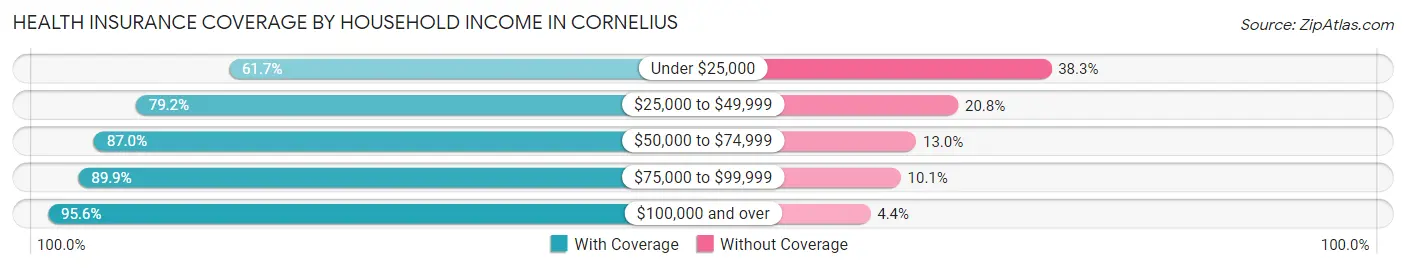
| Household Income | With Coverage | Without Coverage |
| Under $25,000 | 414 (61.7%) | 257 (38.3%) |
| $25,000 to $49,999 | 1,713 (79.2%) | 451 (20.8%) |
| $50,000 to $74,999 | 2,430 (87.0%) | 362 (13.0%) |
| $75,000 to $99,999 | 2,222 (89.9%) | 249 (10.1%) |
| $100,000 and over | 4,776 (95.6%) | 220 (4.4%) |
Public vs Private Health Insurance Coverage by Age in Cornelius
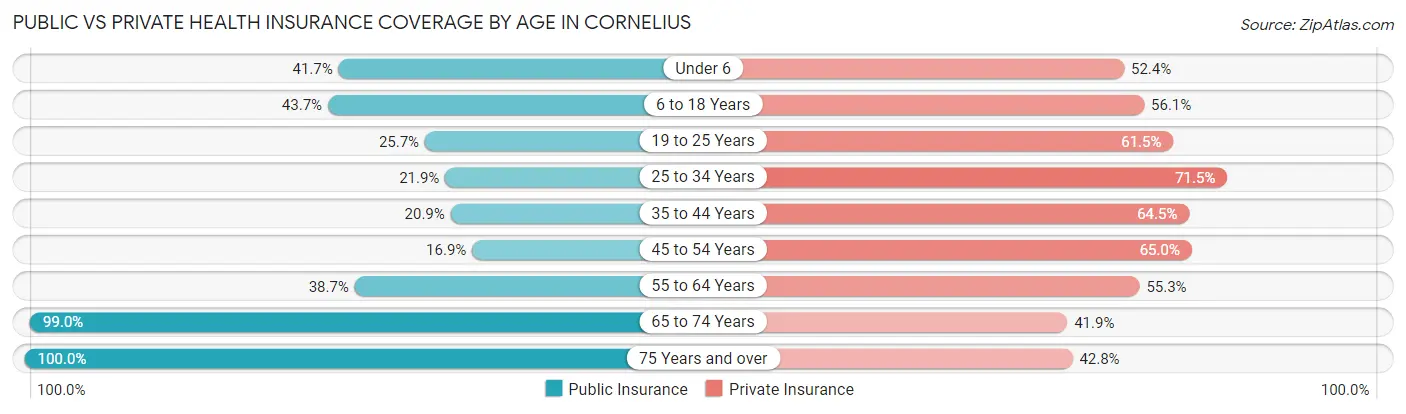
| Age Bracket | Public Insurance | Private Insurance |
| Under 6 | 262 (41.7%) | 329 (52.4%) |
| 6 to 18 Years | 1,187 (43.7%) | 1,524 (56.1%) |
| 19 to 25 Years | 390 (25.7%) | 934 (61.5%) |
| 25 to 34 Years | 282 (21.9%) | 920 (71.5%) |
| 35 to 44 Years | 406 (20.9%) | 1,251 (64.5%) |
| 45 to 54 Years | 359 (16.9%) | 1,377 (64.9%) |
| 55 to 64 Years | 579 (38.7%) | 826 (55.2%) |
| 65 to 74 Years | 1,197 (99.0%) | 506 (41.8%) |
| 75 Years and over | 313 (100.0%) | 134 (42.8%) |
| Total | 4,975 (37.6%) | 7,801 (59.0%) |
Disability Status by Sex by Age in Cornelius
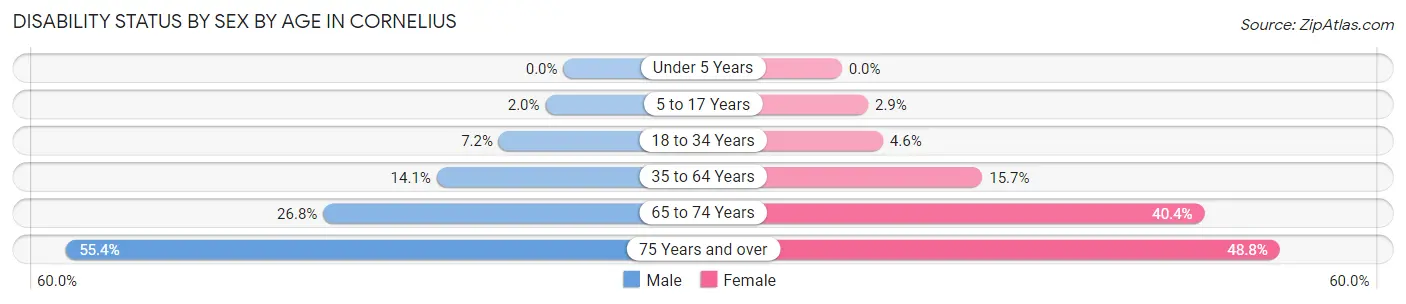
| Age Bracket | Male | Female |
| Under 5 Years | 0 (0.0%) | 0 (0.0%) |
| 5 to 17 Years | 24 (2.0%) | 41 (2.9%) |
| 18 to 34 Years | 118 (7.2%) | 61 (4.6%) |
| 35 to 64 Years | 399 (14.1%) | 427 (15.7%) |
| 65 to 74 Years | 126 (26.8%) | 298 (40.4%) |
| 75 Years and over | 62 (55.4%) | 98 (48.8%) |
Disability Class by Sex by Age in Cornelius
Disability Class: Hearing Difficulty
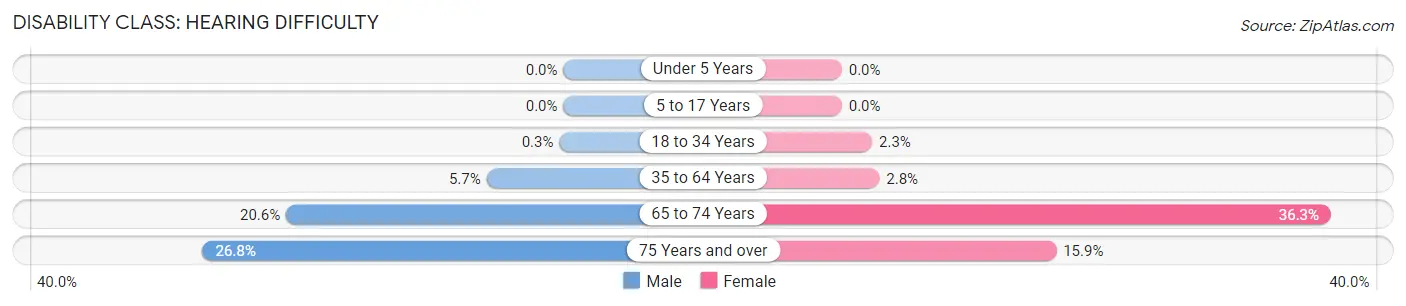
| Age Bracket | Male | Female |
| Under 5 Years | 0 (0.0%) | 0 (0.0%) |
| 5 to 17 Years | 0 (0.0%) | 0 (0.0%) |
| 18 to 34 Years | 5 (0.3%) | 30 (2.2%) |
| 35 to 64 Years | 161 (5.7%) | 76 (2.8%) |
| 65 to 74 Years | 97 (20.6%) | 268 (36.3%) |
| 75 Years and over | 30 (26.8%) | 32 (15.9%) |
Disability Class: Vision Difficulty
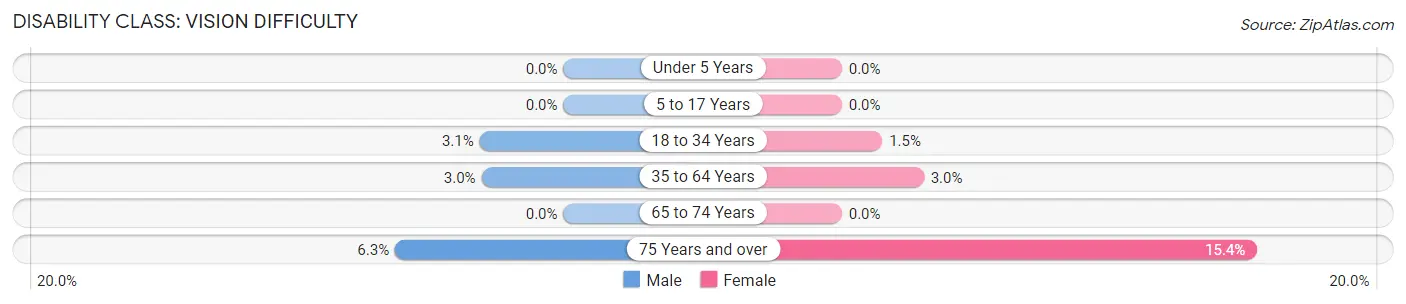
| Age Bracket | Male | Female |
| Under 5 Years | 0 (0.0%) | 0 (0.0%) |
| 5 to 17 Years | 0 (0.0%) | 0 (0.0%) |
| 18 to 34 Years | 51 (3.1%) | 20 (1.5%) |
| 35 to 64 Years | 86 (3.0%) | 83 (3.0%) |
| 65 to 74 Years | 0 (0.0%) | 0 (0.0%) |
| 75 Years and over | 7 (6.2%) | 31 (15.4%) |
Disability Class: Cognitive Difficulty
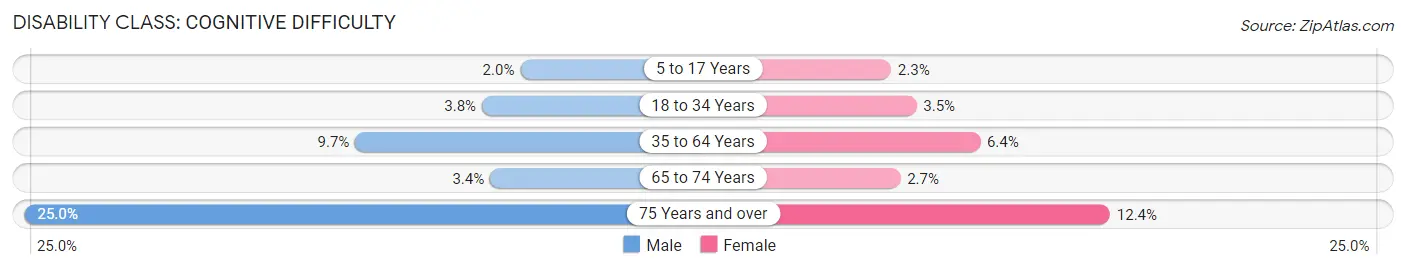
| Age Bracket | Male | Female |
| 5 to 17 Years | 24 (2.0%) | 32 (2.3%) |
| 18 to 34 Years | 62 (3.8%) | 46 (3.5%) |
| 35 to 64 Years | 273 (9.7%) | 175 (6.4%) |
| 65 to 74 Years | 16 (3.4%) | 20 (2.7%) |
| 75 Years and over | 28 (25.0%) | 25 (12.4%) |
Disability Class: Ambulatory Difficulty
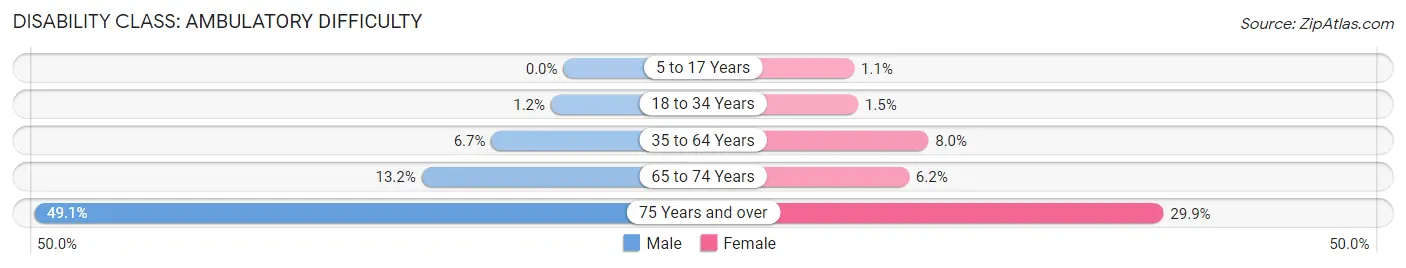
| Age Bracket | Male | Female |
| 5 to 17 Years | 0 (0.0%) | 16 (1.1%) |
| 18 to 34 Years | 19 (1.2%) | 20 (1.5%) |
| 35 to 64 Years | 189 (6.7%) | 219 (8.0%) |
| 65 to 74 Years | 62 (13.2%) | 46 (6.2%) |
| 75 Years and over | 55 (49.1%) | 60 (29.8%) |
Disability Class: Self-Care Difficulty
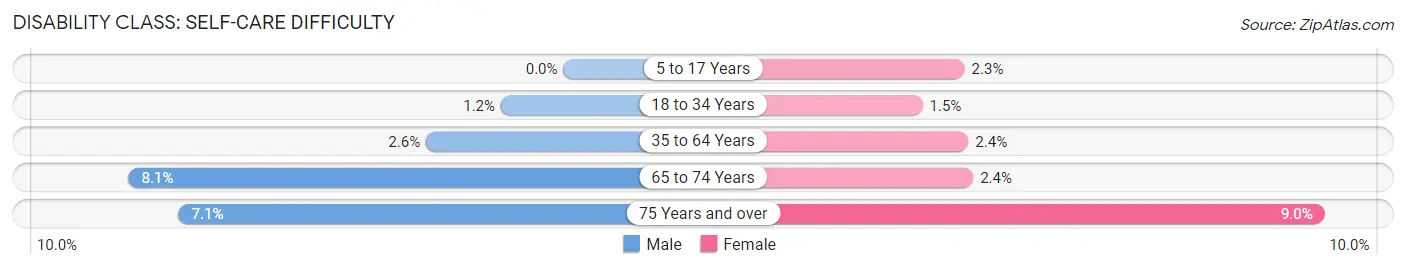
| Age Bracket | Male | Female |
| 5 to 17 Years | 0 (0.0%) | 32 (2.3%) |
| 18 to 34 Years | 19 (1.2%) | 20 (1.5%) |
| 35 to 64 Years | 72 (2.5%) | 64 (2.4%) |
| 65 to 74 Years | 38 (8.1%) | 18 (2.4%) |
| 75 Years and over | 8 (7.1%) | 18 (9.0%) |
Technology Access in Cornelius
Computing Device Access in Cornelius
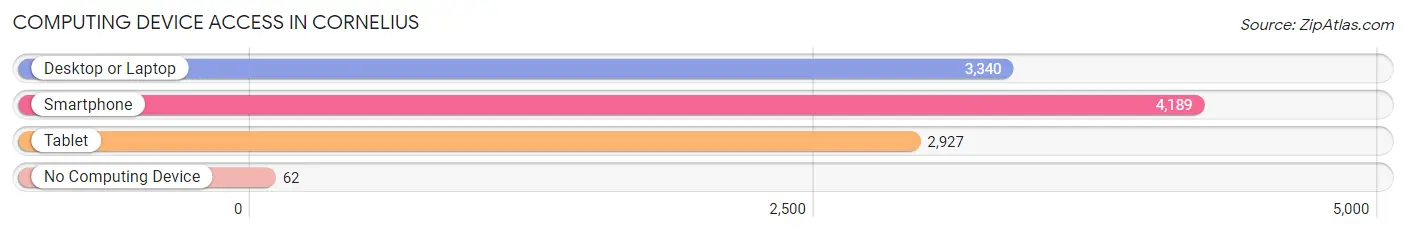
| Device Type | # Households | % Households |
| Desktop or Laptop | 3,340 | 76.2% |
| Smartphone | 4,189 | 95.6% |
| Tablet | 2,927 | 66.8% |
| No Computing Device | 62 | 1.4% |
| Total | 4,382 | 100.0% |
Internet Access in Cornelius
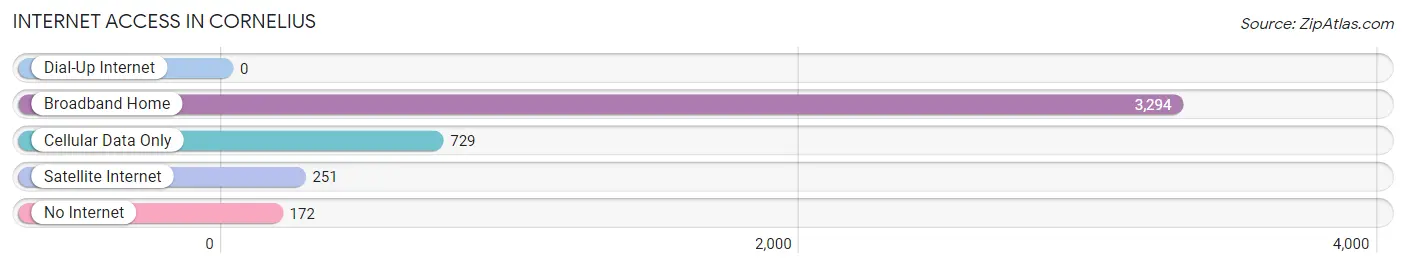
| Internet Type | # Households | % Households |
| Dial-Up Internet | 0 | 0.0% |
| Broadband Home | 3,294 | 75.2% |
| Cellular Data Only | 729 | 16.6% |
| Satellite Internet | 251 | 5.7% |
| No Internet | 172 | 3.9% |
| Total | 4,382 | 100.0% |
Cornelius Summary
Cornelius, Oregon is a small city located in Washington County, Oregon, United States. It is part of the Portland metropolitan area and is located about 20 miles west of downtown Portland. The city has a population of approximately 11,000 people and is known for its small-town charm and rural atmosphere.
History
The area that is now Cornelius was first settled in the late 1800s by a group of German immigrants. The town was originally named “Corneliusville” after Cornelius Schuebel, one of the original settlers. The town was officially incorporated in 1893 and was named after Cornelius Schuebel.
The town grew slowly over the years, but it was not until the 1950s that it began to experience significant growth. This was due to the construction of the Cornelius Dam, which provided irrigation and hydroelectric power to the area. The dam also created a lake, which is now a popular recreational area.
Geography
Cornelius is located in the Tualatin Valley, which is part of the Willamette Valley. The city is situated on the banks of the Tualatin River and is surrounded by rolling hills and farmland. The city is located about 20 miles west of downtown Portland and is bordered by the cities of Hillsboro, Forest Grove, and Beaverton.
The climate in Cornelius is mild and temperate, with warm summers and cool winters. The average annual temperature is around 50 degrees Fahrenheit. The city receives an average of 37 inches of precipitation per year, with most of it falling in the winter months.
Economy
The economy of Cornelius is largely based on agriculture and light manufacturing. The city is home to several large farms, which produce a variety of crops, including wheat, corn, and hay. The city is also home to several light manufacturing companies, which produce a variety of products, including furniture, clothing, and electronics.
Cornelius is also home to several small businesses, including restaurants, retail stores, and service providers. The city is also home to several large employers, including Intel, Nike, and Tektronix.
Demographics
As of the 2010 census, the population of Cornelius was 11,000. The racial makeup of the city was 79.3% White, 8.2% Hispanic or Latino, 6.2% Asian, and 4.3% African American. The median household income was $50,000, and the median home value was $250,000.
Cornelius is a small city with a rural atmosphere and a strong sense of community. The city is home to several parks and recreational areas, as well as a variety of cultural and educational institutions. The city is also home to several churches and religious organizations. The city is a great place to live for those who enjoy a small-town atmosphere and a slower pace of life.
Common Questions
What is Per Capita Income in Cornelius?
Per Capita income in Cornelius is $34,549.
What is the Median Family Income in Cornelius?
Median Family Income in Cornelius is $76,530.
What is the Median Household income in Cornelius?
Median Household Income in Cornelius is $83,051.
What is Income or Wage Gap in Cornelius?
Income or Wage Gap in Cornelius is 22.3%.
Women in Cornelius earn 77.7 cents for every dollar earned by a man.
What is Inequality or Gini Index in Cornelius?
Inequality or Gini Index in Cornelius is 0.40.
What is the Total Population of Cornelius?
Total Population of Cornelius is 13,245.
What is the Total Male Population of Cornelius?
Total Male Population of Cornelius is 6,459.
What is the Total Female Population of Cornelius?
Total Female Population of Cornelius is 6,786.
What is the Ratio of Males per 100 Females in Cornelius?
There are 95.18 Males per 100 Females in Cornelius.
What is the Ratio of Females per 100 Males in Cornelius?
There are 105.06 Females per 100 Males in Cornelius.
What is the Median Population Age in Cornelius?
Median Population Age in Cornelius is 37.4 Years.
What is the Average Family Size in Cornelius
Average Family Size in Cornelius is 3.3 People.
What is the Average Household Size in Cornelius
Average Household Size in Cornelius is 3.0 People.
How Large is the Labor Force in Cornelius?
There are 7,081 People in the Labor Forcein in Cornelius.
What is the Percentage of People in the Labor Force in Cornelius?
67.3% of People are in the Labor Force in Cornelius.
What is the Unemployment Rate in Cornelius?
Unemployment Rate in Cornelius is 4.4%.