North Kensington, MD Map & Demographics
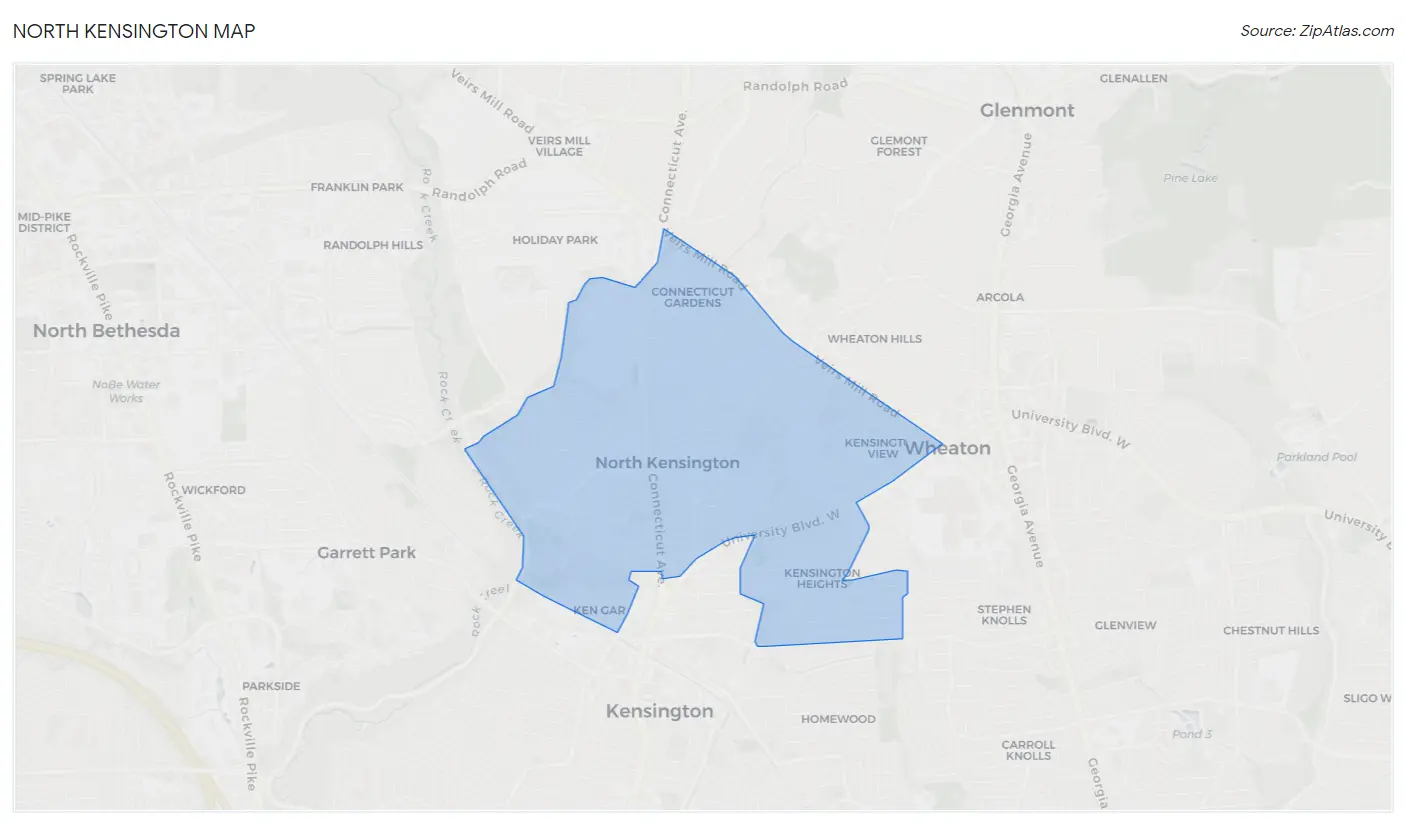
North Kensington Map
North Kensington Overview
$64,175
PER CAPITA INCOME
$144,821
AVG FAMILY INCOME
$122,838
AVG HOUSEHOLD INCOME
8.1%
WAGE / INCOME GAP [ % ]
91.9¢/ $1
WAGE / INCOME GAP [ $ ]
0.43
INEQUALITY / GINI INDEX
8,473
TOTAL POPULATION
4,022
MALE POPULATION
4,451
FEMALE POPULATION
90.36
MALES / 100 FEMALES
110.67
FEMALES / 100 MALES
42.9
MEDIAN AGE
3.0
AVG FAMILY SIZE
2.4
AVG HOUSEHOLD SIZE
5,107
LABOR FORCE [ PEOPLE ]
73.4%
PERCENT IN LABOR FORCE
2.6%
UNEMPLOYMENT RATE
Income in North Kensington
Income Overview in North Kensington
Per Capita Income in North Kensington is $64,175, while median incomes of families and households are $144,821 and $122,838 respectively.
| Characteristic | Number | Measure |
| Per Capita Income | 8,473 | $64,175 |
| Median Family Income | 2,241 | $144,821 |
| Mean Family Income | 2,241 | $177,008 |
| Median Household Income | 3,494 | $122,838 |
| Mean Household Income | 3,494 | $154,468 |
| Income Deficit | 2,241 | $0 |
| Wage / Income Gap (%) | 8,473 | 8.14% |
| Wage / Income Gap ($) | 8,473 | 91.86¢ per $1 |
| Gini / Inequality Index | 8,473 | 0.43 |
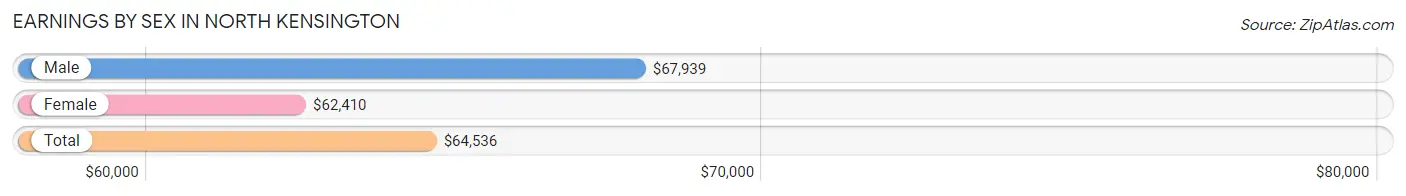
Earnings by Sex in North Kensington
Average Earnings in North Kensington are $64,536, $67,939 for men and $62,410 for women, a difference of 8.1%.
| Sex | Number | Average Earnings |
| Male | 2,649 (50.4%) | $67,939 |
| Female | 2,608 (49.6%) | $62,410 |
| Total | 5,257 (100.0%) | $64,536 |
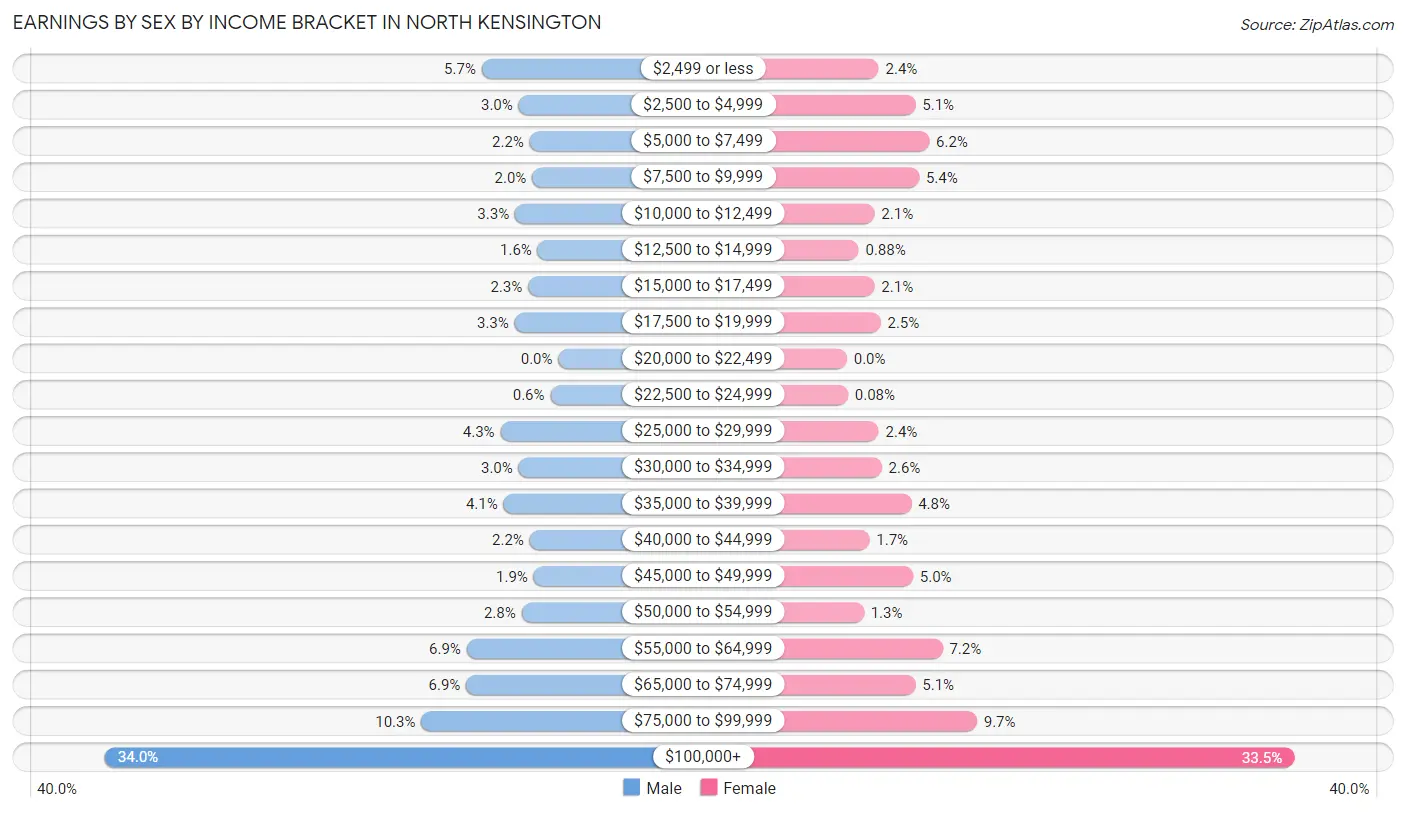
Earnings by Sex by Income Bracket in North Kensington
The most common earnings brackets in North Kensington are $100,000+ for men (900 | 34.0%) and $100,000+ for women (874 | 33.5%).
| Income | Male | Female |
| $2,499 or less | 152 (5.7%) | 62 (2.4%) |
| $2,500 to $4,999 | 79 (3.0%) | 134 (5.1%) |
| $5,000 to $7,499 | 57 (2.1%) | 161 (6.2%) |
| $7,500 to $9,999 | 52 (2.0%) | 141 (5.4%) |
| $10,000 to $12,499 | 86 (3.3%) | 54 (2.1%) |
| $12,500 to $14,999 | 41 (1.5%) | 23 (0.9%) |
| $15,000 to $17,499 | 60 (2.3%) | 54 (2.1%) |
| $17,500 to $19,999 | 87 (3.3%) | 66 (2.5%) |
| $20,000 to $22,499 | 0 (0.0%) | 0 (0.0%) |
| $22,500 to $24,999 | 16 (0.6%) | 2 (0.1%) |
| $25,000 to $29,999 | 115 (4.3%) | 62 (2.4%) |
| $30,000 to $34,999 | 79 (3.0%) | 68 (2.6%) |
| $35,000 to $39,999 | 109 (4.1%) | 126 (4.8%) |
| $40,000 to $44,999 | 57 (2.1%) | 44 (1.7%) |
| $45,000 to $49,999 | 49 (1.8%) | 129 (5.0%) |
| $50,000 to $54,999 | 73 (2.8%) | 33 (1.3%) |
| $55,000 to $64,999 | 182 (6.9%) | 187 (7.2%) |
| $65,000 to $74,999 | 183 (6.9%) | 134 (5.1%) |
| $75,000 to $99,999 | 272 (10.3%) | 254 (9.7%) |
| $100,000+ | 900 (34.0%) | 874 (33.5%) |
| Total | 2,649 (100.0%) | 2,608 (100.0%) |
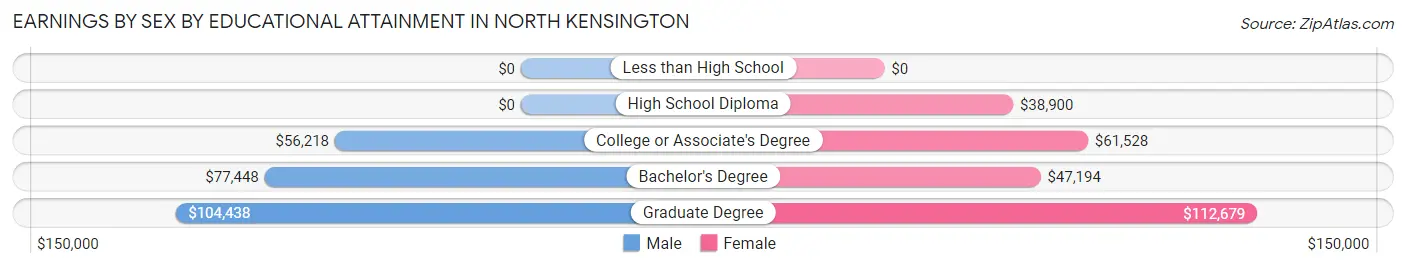
Earnings by Sex by Educational Attainment in North Kensington
Average earnings in North Kensington are $70,938 for men and $71,552 for women, a difference of 0.9%. Men with an educational attainment of graduate degree enjoy the highest average annual earnings of $104,438, while those with college or associate's degree education earn the least with $56,218. Women with an educational attainment of graduate degree earn the most with the average annual earnings of $112,679, while those with high school diploma education have the smallest earnings of $38,900.
| Educational Attainment | Male Income | Female Income |
| Less than High School | - | - |
| High School Diploma | - | - |
| College or Associate's Degree | $56,218 | $61,528 |
| Bachelor's Degree | $77,448 | $47,194 |
| Graduate Degree | $104,438 | $112,679 |
| Total | $70,938 | $71,552 |
Family Income in North Kensington
Family Income Brackets in North Kensington
According to the North Kensington family income data, there are 692 families falling into the $200,000+ income range, which is the most common income bracket and makes up 30.9% of all families. Conversely, the $10,000 to $14,999 income bracket is the least frequent group with only 7 families (0.3%) belonging to this category.
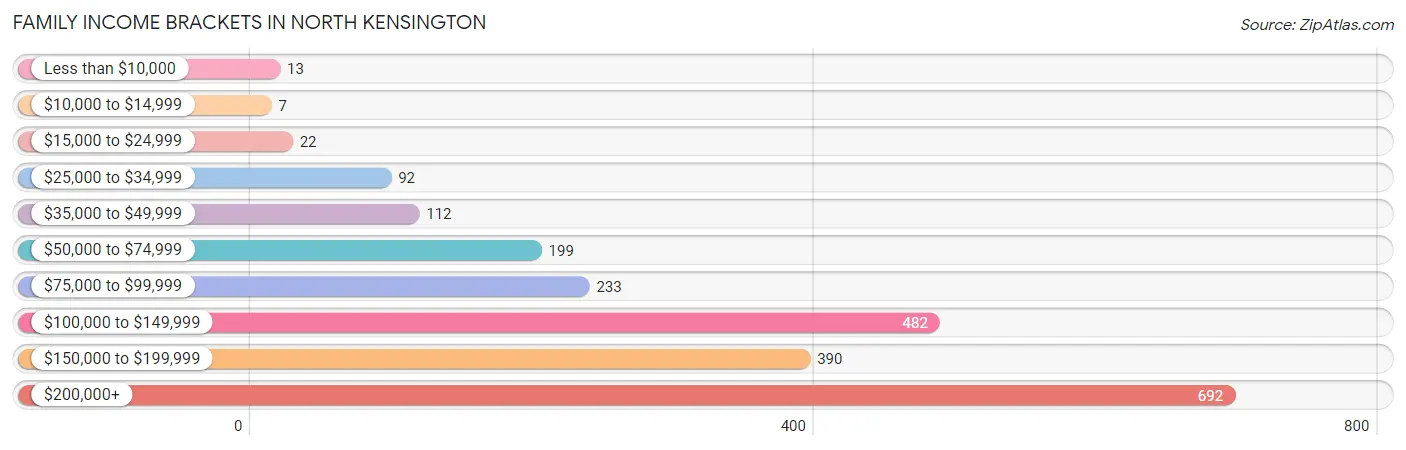
| Income Bracket | # Families | % Families |
| Less than $10,000 | 13 | 0.6% |
| $10,000 to $14,999 | 7 | 0.3% |
| $15,000 to $24,999 | 22 | 1.0% |
| $25,000 to $34,999 | 92 | 4.1% |
| $35,000 to $49,999 | 112 | 5.0% |
| $50,000 to $74,999 | 199 | 8.9% |
| $75,000 to $99,999 | 233 | 10.4% |
| $100,000 to $149,999 | 482 | 21.5% |
| $150,000 to $199,999 | 390 | 17.4% |
| $200,000+ | 692 | 30.9% |
Family Income by Famaliy Size in North Kensington
4-person families (301 | 13.4%) account for the highest median family income in North Kensington with $205,114 per family, while 2-person families (1,091 | 48.7%) have the highest median income of $67,514 per family member.
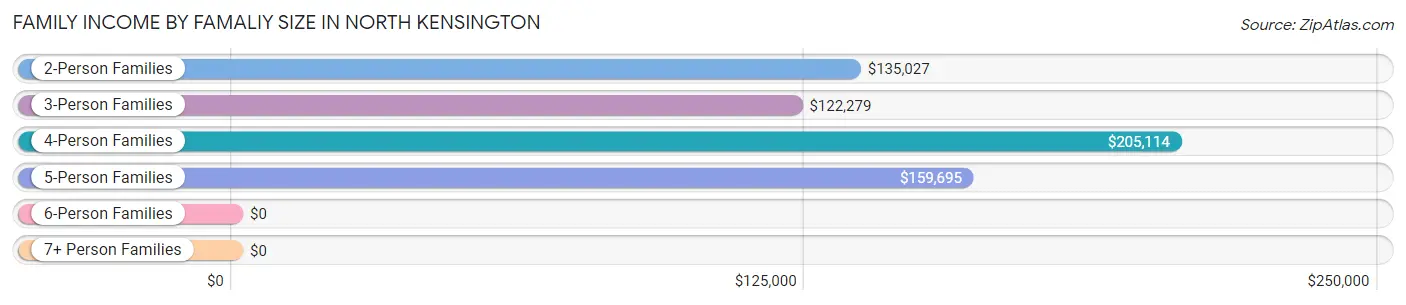
| Income Bracket | # Families | Median Income |
| 2-Person Families | 1,091 (48.7%) | $135,027 |
| 3-Person Families | 622 (27.8%) | $122,279 |
| 4-Person Families | 301 (13.4%) | $205,114 |
| 5-Person Families | 198 (8.8%) | $159,695 |
| 6-Person Families | 7 (0.3%) | $0 |
| 7+ Person Families | 22 (1.0%) | $0 |
| Total | 2,241 (100.0%) | $144,821 |
Family Income by Number of Earners in North Kensington
The median family income in North Kensington is $144,821, with families comprising 3+ earners (245) having the highest median family income of $190,893, while families with no earners (160) have the lowest median family income of $91,364, accounting for 10.9% and 7.1% of families, respectively.
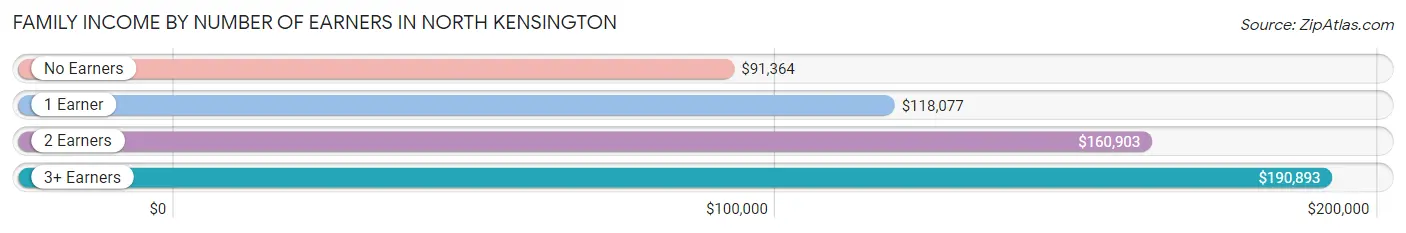
| Number of Earners | # Families | Median Income |
| No Earners | 160 (7.1%) | $91,364 |
| 1 Earner | 404 (18.0%) | $118,077 |
| 2 Earners | 1,432 (63.9%) | $160,903 |
| 3+ Earners | 245 (10.9%) | $190,893 |
| Total | 2,241 (100.0%) | $144,821 |
Household Income in North Kensington
Household Income Brackets in North Kensington
With 839 households falling in the category, the $200,000+ income range is the most frequent in North Kensington, accounting for 24.0% of all households. In contrast, only 31 households (0.9%) fall into the less than $10,000 income bracket, making it the least populous group.
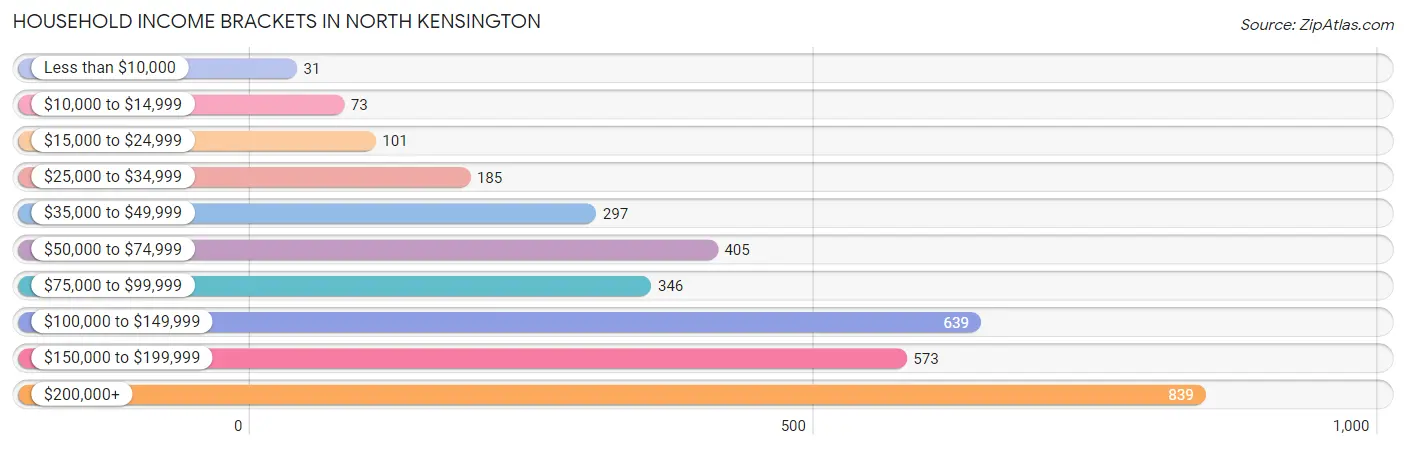
| Income Bracket | # Households | % Households |
| Less than $10,000 | 31 | 0.9% |
| $10,000 to $14,999 | 73 | 2.1% |
| $15,000 to $24,999 | 101 | 2.9% |
| $25,000 to $34,999 | 185 | 5.3% |
| $35,000 to $49,999 | 297 | 8.5% |
| $50,000 to $74,999 | 405 | 11.6% |
| $75,000 to $99,999 | 346 | 9.9% |
| $100,000 to $149,999 | 639 | 18.3% |
| $150,000 to $199,999 | 573 | 16.4% |
| $200,000+ | 839 | 24.0% |
Household Income by Householder Age in North Kensington
The median household income in North Kensington is $122,838, with the highest median household income of $162,639 found in the 25 to 44 years age bracket for the primary householder. A total of 998 households (28.6%) fall into this category. Meanwhile, the 15 to 24 years age bracket for the primary householder has the lowest median household income of $0, with 37 households (1.1%) in this group.
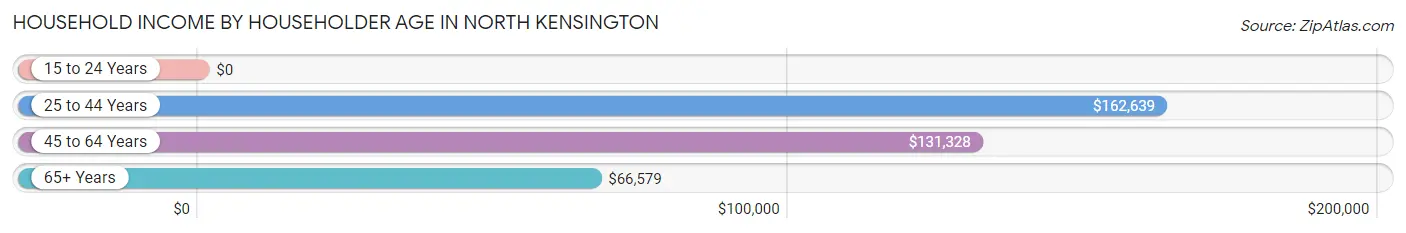
| Income Bracket | # Households | Median Income |
| 15 to 24 Years | 37 (1.1%) | $0 |
| 25 to 44 Years | 998 (28.6%) | $162,639 |
| 45 to 64 Years | 1,423 (40.7%) | $131,328 |
| 65+ Years | 1,036 (29.6%) | $66,579 |
| Total | 3,494 (100.0%) | $122,838 |
Poverty in North Kensington
Income Below Poverty by Sex and Age in North Kensington
With 3.2% poverty level for males and 2.9% for females among the residents of North Kensington, 16 and 17 year old males and 65 to 74 year old females are the most vulnerable to poverty, with 13 males (17.3%) and 64 females (14.8%) in their respective age groups living below the poverty level.
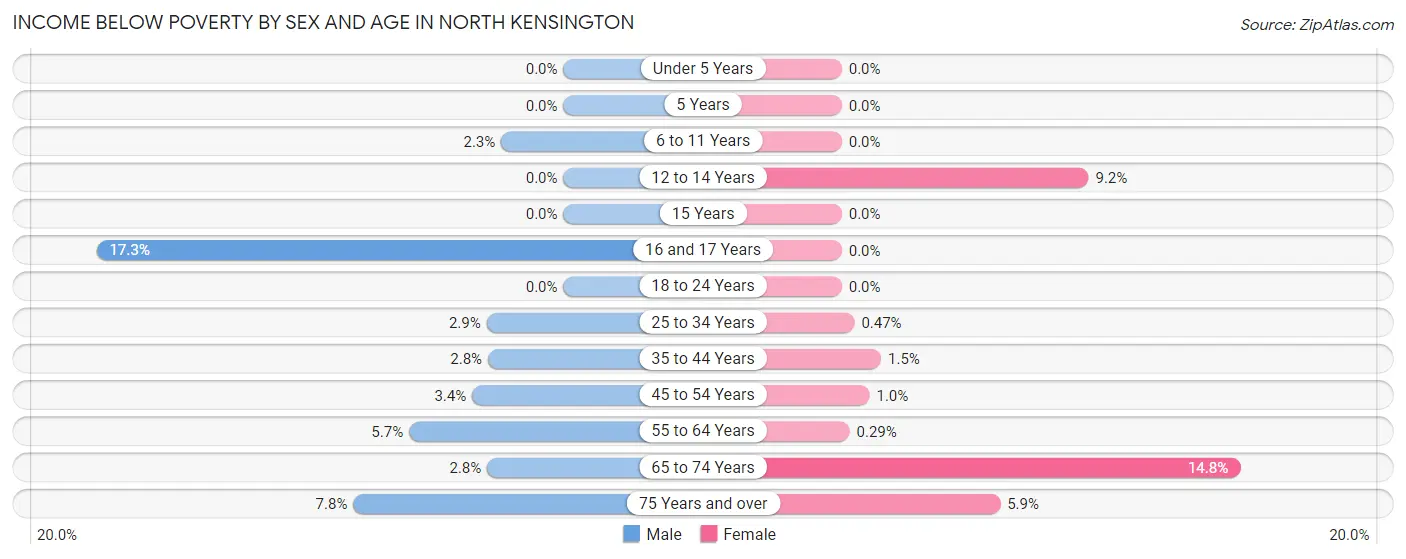
| Age Bracket | Male | Female |
| Under 5 Years | 0 (0.0%) | 0 (0.0%) |
| 5 Years | 0 (0.0%) | 0 (0.0%) |
| 6 to 11 Years | 7 (2.3%) | 0 (0.0%) |
| 12 to 14 Years | 0 (0.0%) | 12 (9.2%) |
| 15 Years | 0 (0.0%) | 0 (0.0%) |
| 16 and 17 Years | 13 (17.3%) | 0 (0.0%) |
| 18 to 24 Years | 0 (0.0%) | 0 (0.0%) |
| 25 to 34 Years | 14 (2.9%) | 2 (0.5%) |
| 35 to 44 Years | 19 (2.8%) | 10 (1.5%) |
| 45 to 54 Years | 17 (3.4%) | 6 (1.0%) |
| 55 to 64 Years | 33 (5.7%) | 2 (0.3%) |
| 65 to 74 Years | 14 (2.8%) | 64 (14.8%) |
| 75 Years and over | 11 (7.8%) | 28 (5.9%) |
| Total | 128 (3.2%) | 124 (2.9%) |
Income Above Poverty by Sex and Age in North Kensington
According to the poverty statistics in North Kensington, males aged under 5 years and females aged under 5 years are the age groups that are most secure financially, with 100.0% of males and 100.0% of females in these age groups living above the poverty line.
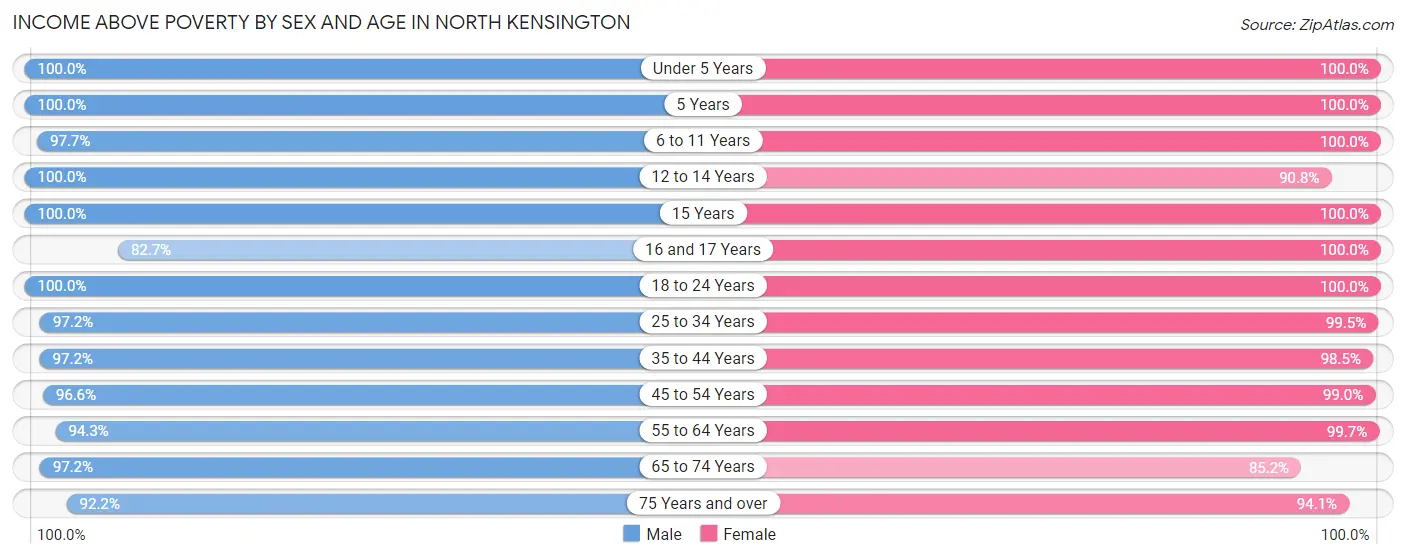
| Age Bracket | Male | Female |
| Under 5 Years | 282 (100.0%) | 255 (100.0%) |
| 5 Years | 65 (100.0%) | 19 (100.0%) |
| 6 to 11 Years | 296 (97.7%) | 293 (100.0%) |
| 12 to 14 Years | 123 (100.0%) | 119 (90.8%) |
| 15 Years | 19 (100.0%) | 25 (100.0%) |
| 16 and 17 Years | 62 (82.7%) | 62 (100.0%) |
| 18 to 24 Years | 229 (100.0%) | 247 (100.0%) |
| 25 to 34 Years | 478 (97.2%) | 426 (99.5%) |
| 35 to 44 Years | 659 (97.2%) | 674 (98.5%) |
| 45 to 54 Years | 484 (96.6%) | 577 (99.0%) |
| 55 to 64 Years | 543 (94.3%) | 680 (99.7%) |
| 65 to 74 Years | 480 (97.2%) | 369 (85.2%) |
| 75 Years and over | 130 (92.2%) | 448 (94.1%) |
| Total | 3,850 (96.8%) | 4,194 (97.1%) |
Income Below Poverty Among Married-Couple Families in North Kensington
The poverty statistics for married-couple families in North Kensington show that 1.8% or 32 of the total 1,731 families live below the poverty line. Families with no children have the highest poverty rate of 2.4%, comprising of 25 families. On the other hand, families with 3 or 4 children have the lowest poverty rate of 0.0%, which includes 0 families.
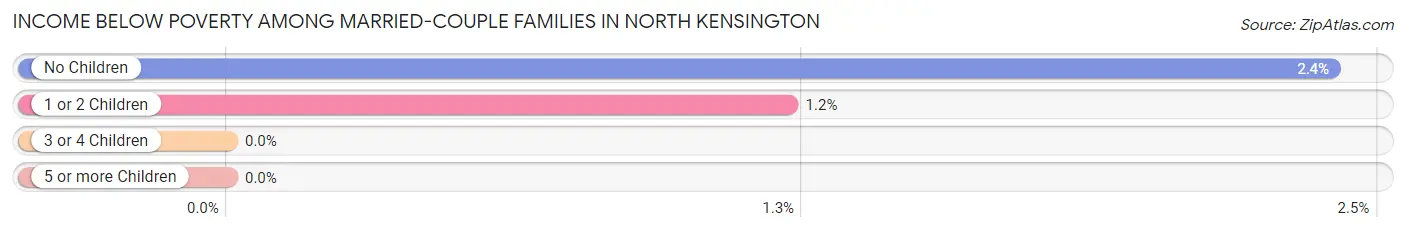
| Children | Above Poverty | Below Poverty |
| No Children | 1,018 (97.6%) | 25 (2.4%) |
| 1 or 2 Children | 569 (98.8%) | 7 (1.2%) |
| 3 or 4 Children | 112 (100.0%) | 0 (0.0%) |
| 5 or more Children | 0 (0.0%) | 0 (0.0%) |
| Total | 1,699 (98.2%) | 32 (1.8%) |
Income Below Poverty Among Single-Parent Households in North Kensington
According to the poverty data in North Kensington, 5.7% or 7 single-father households and 1.3% or 5 single-mother households are living below the poverty line. Among single-father households, those with 1 or 2 children have the highest poverty rate, with 7 households (11.3%) experiencing poverty. Likewise, among single-mother households, those with 1 or 2 children have the highest poverty rate, with 5 households (4.0%) falling below the poverty line.
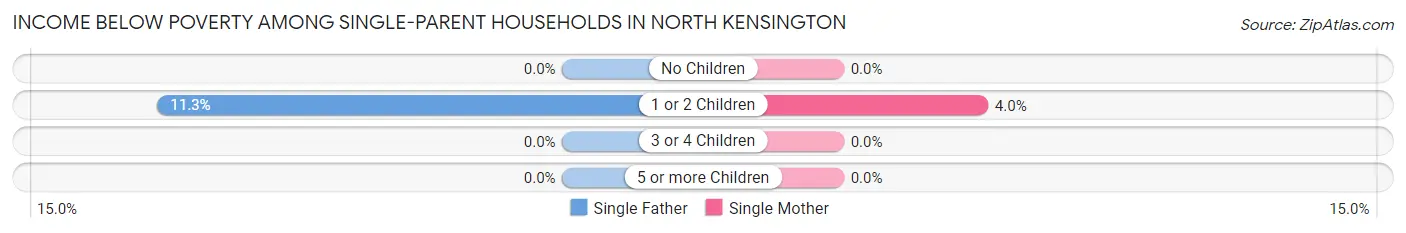
| Children | Single Father | Single Mother |
| No Children | 0 (0.0%) | 0 (0.0%) |
| 1 or 2 Children | 7 (11.3%) | 5 (4.0%) |
| 3 or 4 Children | 0 (0.0%) | 0 (0.0%) |
| 5 or more Children | 0 (0.0%) | 0 (0.0%) |
| Total | 7 (5.7%) | 5 (1.3%) |
Income Below Poverty Among Married-Couple vs Single-Parent Households in North Kensington
The poverty data for North Kensington shows that 32 of the married-couple family households (1.8%) and 12 of the single-parent households (2.4%) are living below the poverty level. Within the married-couple family households, those with no children have the highest poverty rate, with 25 households (2.4%) falling below the poverty line. Among the single-parent households, those with 1 or 2 children have the highest poverty rate, with 12 household (6.5%) living below poverty.
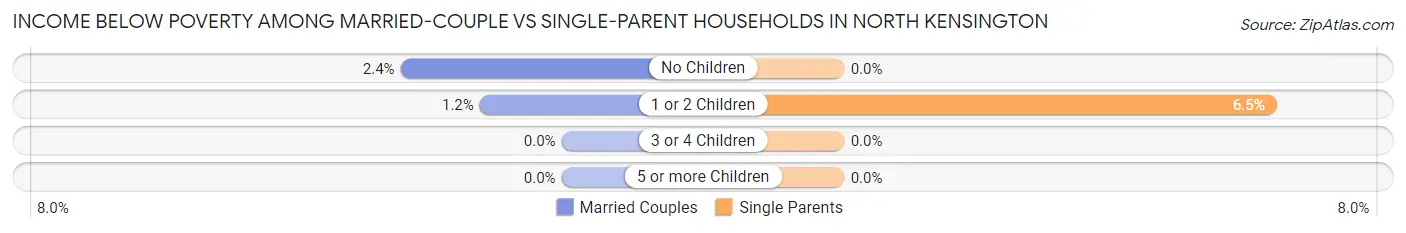
| Children | Married-Couple Families | Single-Parent Households |
| No Children | 25 (2.4%) | 0 (0.0%) |
| 1 or 2 Children | 7 (1.2%) | 12 (6.5%) |
| 3 or 4 Children | 0 (0.0%) | 0 (0.0%) |
| 5 or more Children | 0 (0.0%) | 0 (0.0%) |
| Total | 32 (1.8%) | 12 (2.4%) |
Race in North Kensington
The most populous races in North Kensington are White / Caucasian (5,304 | 62.6%), Hispanic or Latino (1,990 | 23.5%), and Two or more Races (1,146 | 13.5%).
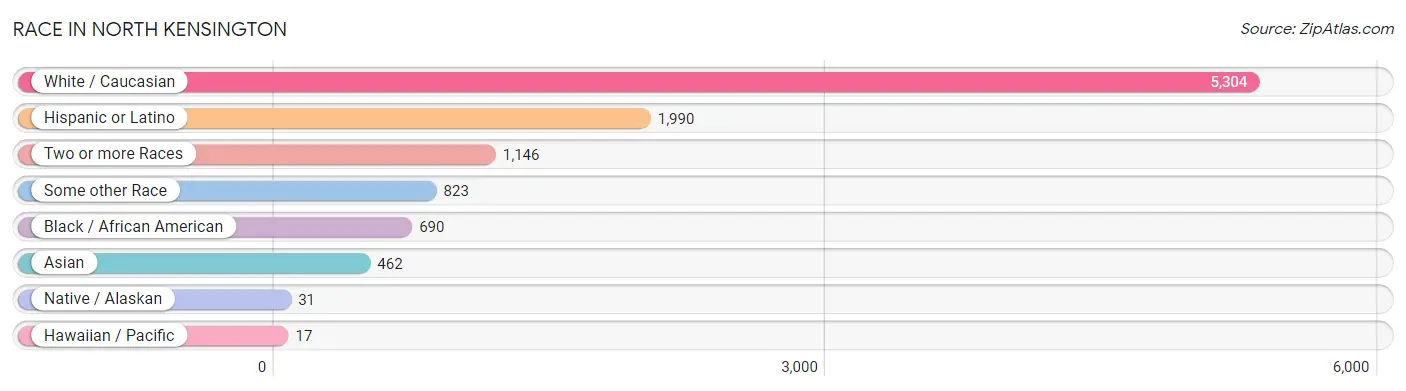
| Race | # Population | % Population |
| Asian | 462 | 5.4% |
| Black / African American | 690 | 8.1% |
| Hawaiian / Pacific | 17 | 0.2% |
| Hispanic or Latino | 1,990 | 23.5% |
| Native / Alaskan | 31 | 0.4% |
| White / Caucasian | 5,304 | 62.6% |
| Two or more Races | 1,146 | 13.5% |
| Some other Race | 823 | 9.7% |
| Total | 8,473 | 100.0% |
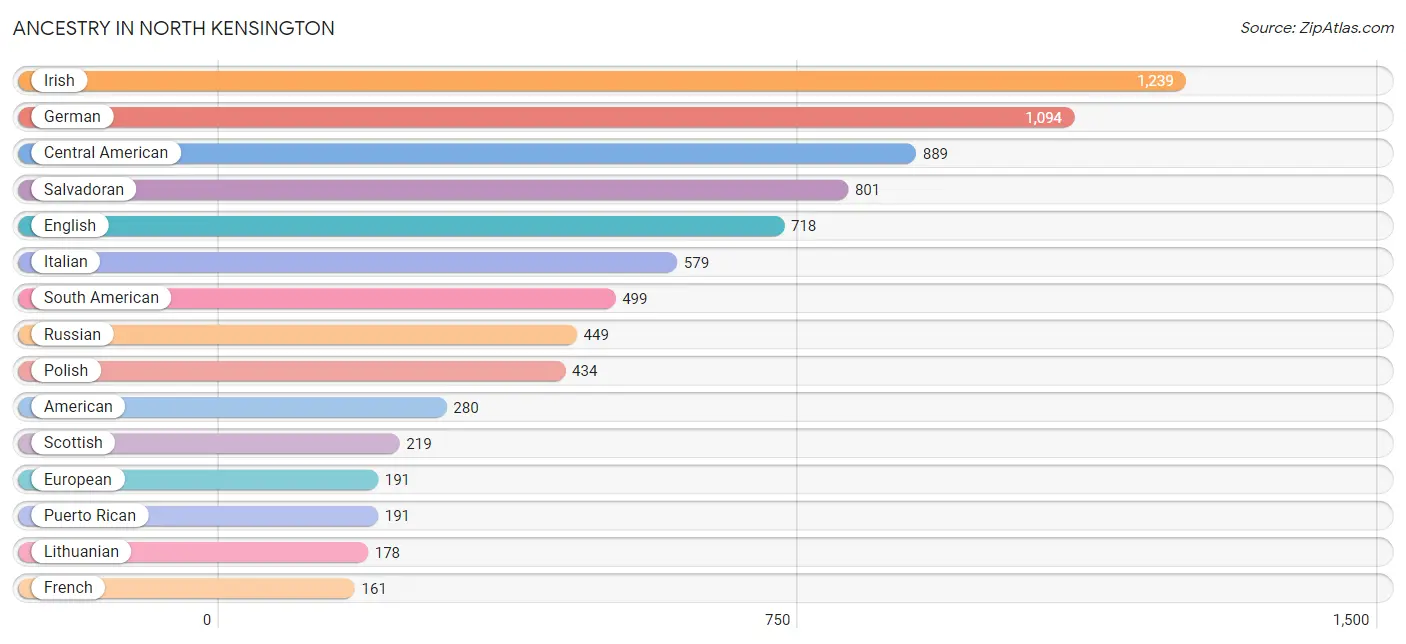
Ancestry in North Kensington
The most populous ancestries reported in North Kensington are Irish (1,239 | 14.6%), German (1,094 | 12.9%), Central American (889 | 10.5%), Salvadoran (801 | 9.5%), and English (718 | 8.5%), together accounting for 55.9% of all North Kensington residents.
| Ancestry | # Population | % Population |
| African | 82 | 1.0% |
| American | 280 | 3.3% |
| Apache | 6 | 0.1% |
| Arab | 94 | 1.1% |
| Argentinean | 102 | 1.2% |
| Armenian | 10 | 0.1% |
| Assyrian / Chaldean / Syriac | 21 | 0.3% |
| Australian | 9 | 0.1% |
| Austrian | 4 | 0.1% |
| Bhutanese | 48 | 0.6% |
| Bolivian | 92 | 1.1% |
| Brazilian | 57 | 0.7% |
| British | 66 | 0.8% |
| Bulgarian | 45 | 0.5% |
| Burmese | 91 | 1.1% |
| Cambodian | 40 | 0.5% |
| Canadian | 7 | 0.1% |
| Celtic | 7 | 0.1% |
| Central American | 889 | 10.5% |
| Chilean | 3 | 0.0% |
| Colombian | 115 | 1.4% |
| Costa Rican | 4 | 0.1% |
| Cuban | 30 | 0.4% |
| Czech | 44 | 0.5% |
| Czechoslovakian | 15 | 0.2% |
| Danish | 19 | 0.2% |
| Dominican | 60 | 0.7% |
| Dutch | 87 | 1.0% |
| Eastern European | 40 | 0.5% |
| Egyptian | 29 | 0.3% |
| English | 718 | 8.5% |
| Estonian | 17 | 0.2% |
| Ethiopian | 38 | 0.4% |
| European | 191 | 2.2% |
| Filipino | 22 | 0.3% |
| Finnish | 8 | 0.1% |
| French | 161 | 1.9% |
| French Canadian | 27 | 0.3% |
| German | 1,094 | 12.9% |
| Greek | 60 | 0.7% |
| Guatemalan | 18 | 0.2% |
| Honduran | 32 | 0.4% |
| Hungarian | 26 | 0.3% |
| Indian (Asian) | 81 | 1.0% |
| Indonesian | 24 | 0.3% |
| Iranian | 48 | 0.6% |
| Irish | 1,239 | 14.6% |
| Iroquois | 62 | 0.7% |
| Italian | 579 | 6.8% |
| Jamaican | 6 | 0.1% |
| Japanese | 26 | 0.3% |
| Korean | 70 | 0.8% |
| Laotian | 6 | 0.1% |
| Lebanese | 57 | 0.7% |
| Liberian | 17 | 0.2% |
| Lithuanian | 178 | 2.1% |
| Luxembourger | 11 | 0.1% |
| Mexican | 143 | 1.7% |
| Moroccan | 17 | 0.2% |
| Nicaraguan | 19 | 0.2% |
| Norwegian | 80 | 0.9% |
| Pakistani | 15 | 0.2% |
| Panamanian | 15 | 0.2% |
| Peruvian | 129 | 1.5% |
| Polish | 434 | 5.1% |
| Portuguese | 58 | 0.7% |
| Puerto Rican | 191 | 2.2% |
| Russian | 449 | 5.3% |
| Salvadoran | 801 | 9.5% |
| Scandinavian | 9 | 0.1% |
| Scotch-Irish | 102 | 1.2% |
| Scottish | 219 | 2.6% |
| Slavic | 8 | 0.1% |
| Slovak | 4 | 0.1% |
| Slovene | 10 | 0.1% |
| South American | 499 | 5.9% |
| South American Indian | 50 | 0.6% |
| Spaniard | 18 | 0.2% |
| Spanish | 35 | 0.4% |
| Sri Lankan | 27 | 0.3% |
| Subsaharan African | 147 | 1.7% |
| Swedish | 70 | 0.8% |
| Swiss | 60 | 0.7% |
| Thai | 96 | 1.1% |
| Trinidadian and Tobagonian | 25 | 0.3% |
| Turkish | 6 | 0.1% |
| Ukrainian | 90 | 1.1% |
| Venezuelan | 58 | 0.7% |
| Welsh | 84 | 1.0% |
| West Indian | 23 | 0.3% | View All 90 Rows |
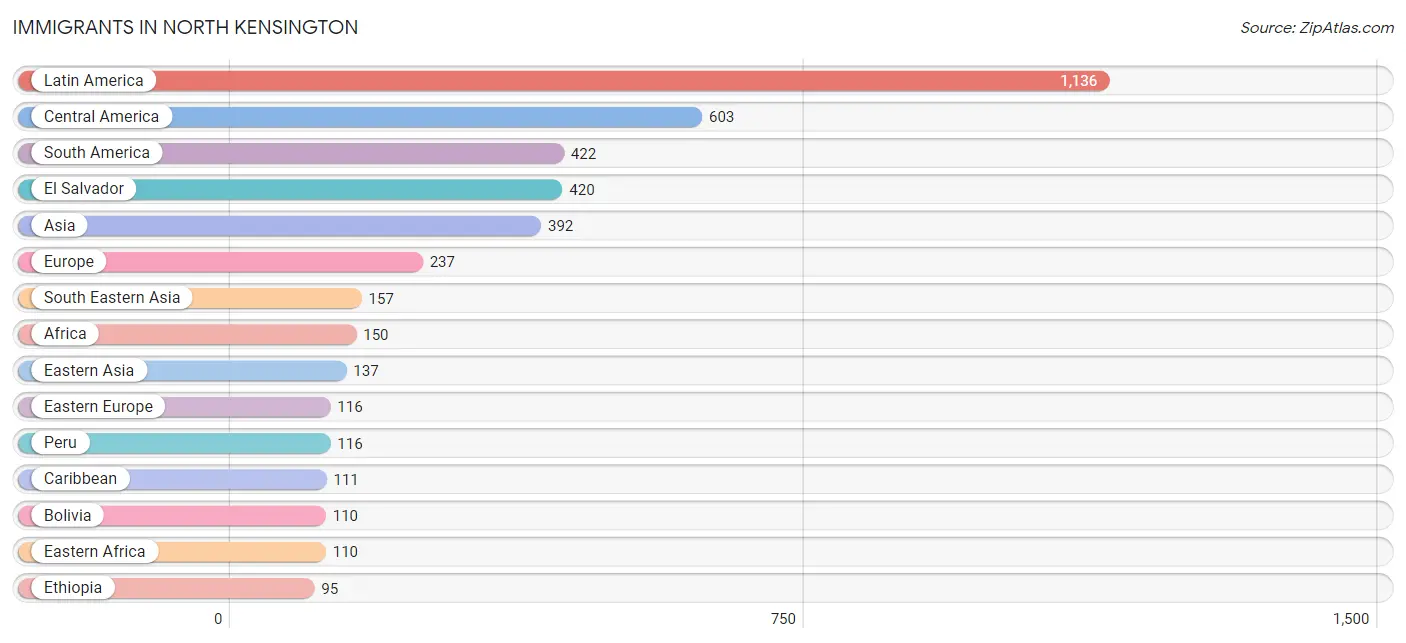
Immigrants in North Kensington
The most numerous immigrant groups reported in North Kensington came from Latin America (1,136 | 13.4%), Central America (603 | 7.1%), South America (422 | 5.0%), El Salvador (420 | 5.0%), and Asia (392 | 4.6%), together accounting for 35.1% of all North Kensington residents.
| Immigration Origin | # Population | % Population |
| Africa | 150 | 1.8% |
| Argentina | 54 | 0.6% |
| Asia | 392 | 4.6% |
| Bolivia | 110 | 1.3% |
| Brazil | 18 | 0.2% |
| Bulgaria | 25 | 0.3% |
| Cambodia | 26 | 0.3% |
| Caribbean | 111 | 1.3% |
| Central America | 603 | 7.1% |
| Chile | 20 | 0.2% |
| China | 46 | 0.5% |
| Colombia | 66 | 0.8% |
| Congo | 6 | 0.1% |
| Costa Rica | 12 | 0.1% |
| Cuba | 30 | 0.4% |
| Dominican Republic | 35 | 0.4% |
| Eastern Africa | 110 | 1.3% |
| Eastern Asia | 137 | 1.6% |
| Eastern Europe | 116 | 1.4% |
| El Salvador | 420 | 5.0% |
| Eritrea | 15 | 0.2% |
| Ethiopia | 95 | 1.1% |
| Europe | 237 | 2.8% |
| France | 21 | 0.3% |
| Germany | 25 | 0.3% |
| Greece | 13 | 0.2% |
| Guatemala | 56 | 0.7% |
| Haiti | 11 | 0.1% |
| Honduras | 17 | 0.2% |
| India | 36 | 0.4% |
| Indonesia | 6 | 0.1% |
| Iran | 16 | 0.2% |
| Italy | 18 | 0.2% |
| Jamaica | 10 | 0.1% |
| Jordan | 7 | 0.1% |
| Korea | 91 | 1.1% |
| Latin America | 1,136 | 13.4% |
| Lebanon | 7 | 0.1% |
| Liberia | 17 | 0.2% |
| Malaysia | 7 | 0.1% |
| Mexico | 57 | 0.7% |
| Middle Africa | 6 | 0.1% |
| Morocco | 17 | 0.2% |
| Nepal | 7 | 0.1% |
| Netherlands | 8 | 0.1% |
| Nicaragua | 19 | 0.2% |
| Northern Africa | 17 | 0.2% |
| Pakistan | 25 | 0.3% |
| Panama | 22 | 0.3% |
| Peru | 116 | 1.4% |
| Philippines | 37 | 0.4% |
| Portugal | 26 | 0.3% |
| Russia | 69 | 0.8% |
| South America | 422 | 5.0% |
| South Central Asia | 84 | 1.0% |
| South Eastern Asia | 157 | 1.8% |
| Southern Europe | 57 | 0.7% |
| Switzerland | 10 | 0.1% |
| Thailand | 9 | 0.1% |
| Trinidad and Tobago | 25 | 0.3% |
| Venezuela | 38 | 0.4% |
| Vietnam | 61 | 0.7% |
| Western Africa | 17 | 0.2% |
| Western Asia | 14 | 0.2% |
| Western Europe | 64 | 0.8% | View All 65 Rows |
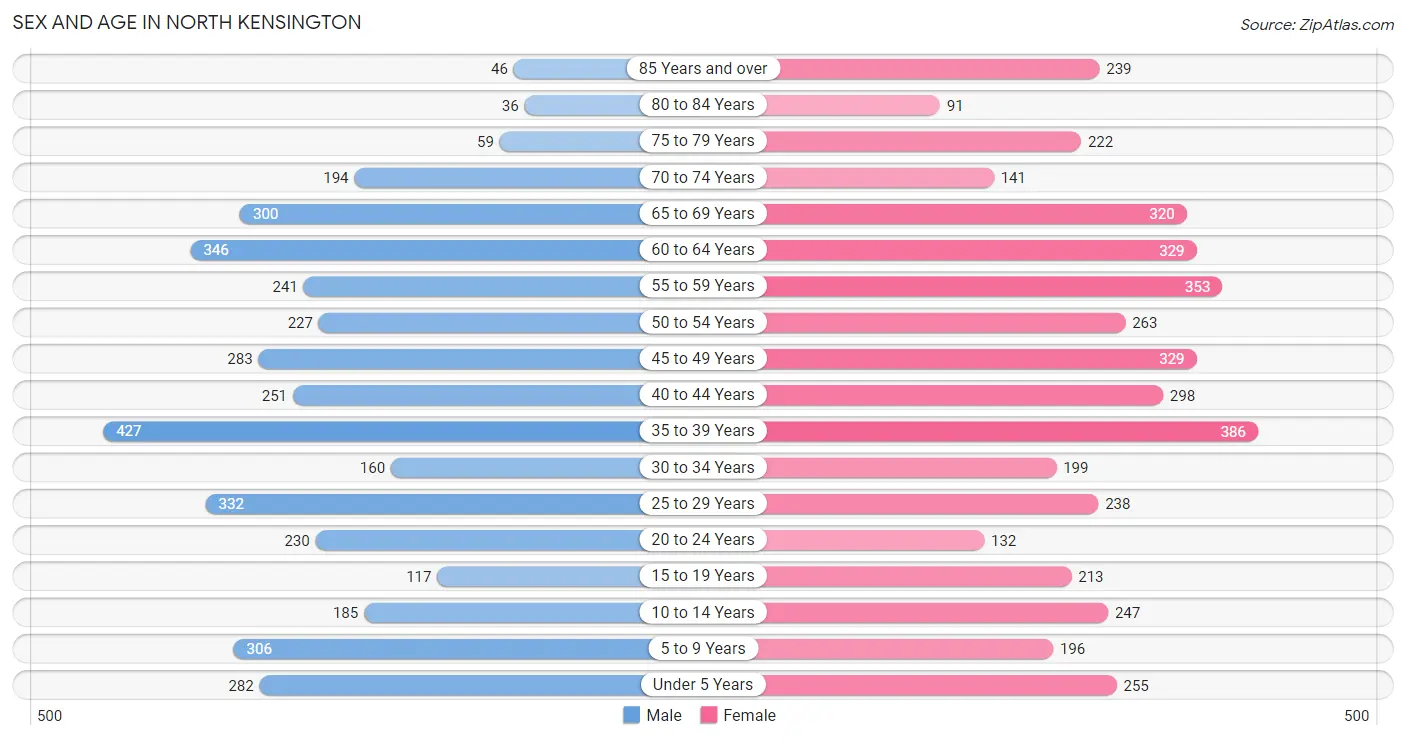
Sex and Age in North Kensington
Sex and Age in North Kensington
The most populous age groups in North Kensington are 35 to 39 Years (427 | 10.6%) for men and 35 to 39 Years (386 | 8.7%) for women.
| Age Bracket | Male | Female |
| Under 5 Years | 282 (7.0%) | 255 (5.7%) |
| 5 to 9 Years | 306 (7.6%) | 196 (4.4%) |
| 10 to 14 Years | 185 (4.6%) | 247 (5.6%) |
| 15 to 19 Years | 117 (2.9%) | 213 (4.8%) |
| 20 to 24 Years | 230 (5.7%) | 132 (3.0%) |
| 25 to 29 Years | 332 (8.3%) | 238 (5.3%) |
| 30 to 34 Years | 160 (4.0%) | 199 (4.5%) |
| 35 to 39 Years | 427 (10.6%) | 386 (8.7%) |
| 40 to 44 Years | 251 (6.2%) | 298 (6.7%) |
| 45 to 49 Years | 283 (7.0%) | 329 (7.4%) |
| 50 to 54 Years | 227 (5.6%) | 263 (5.9%) |
| 55 to 59 Years | 241 (6.0%) | 353 (7.9%) |
| 60 to 64 Years | 346 (8.6%) | 329 (7.4%) |
| 65 to 69 Years | 300 (7.5%) | 320 (7.2%) |
| 70 to 74 Years | 194 (4.8%) | 141 (3.2%) |
| 75 to 79 Years | 59 (1.5%) | 222 (5.0%) |
| 80 to 84 Years | 36 (0.9%) | 91 (2.0%) |
| 85 Years and over | 46 (1.1%) | 239 (5.4%) |
| Total | 4,022 (100.0%) | 4,451 (100.0%) |
Families and Households in North Kensington
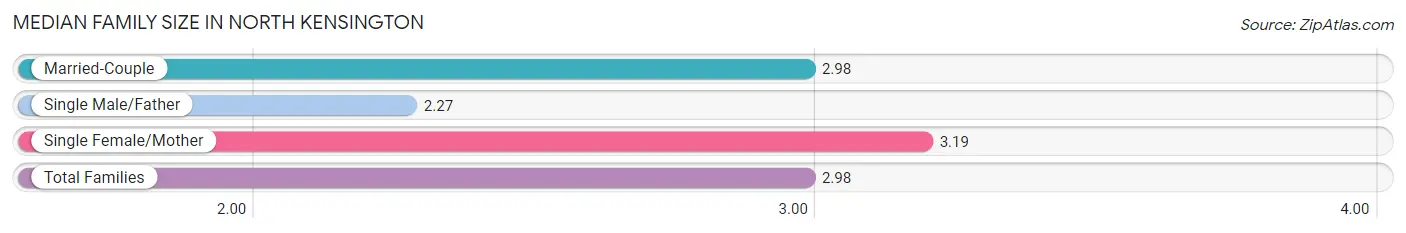
Median Family Size in North Kensington
The median family size in North Kensington is 2.98 persons per family, with single female/mother families (388 | 17.3%) accounting for the largest median family size of 3.19 persons per family. On the other hand, single male/father families (122 | 5.4%) represent the smallest median family size with 2.27 persons per family.
| Family Type | # Families | Family Size |
| Married-Couple | 1,731 (77.2%) | 2.98 |
| Single Male/Father | 122 (5.4%) | 2.27 |
| Single Female/Mother | 388 (17.3%) | 3.19 |
| Total Families | 2,241 (100.0%) | 2.98 |
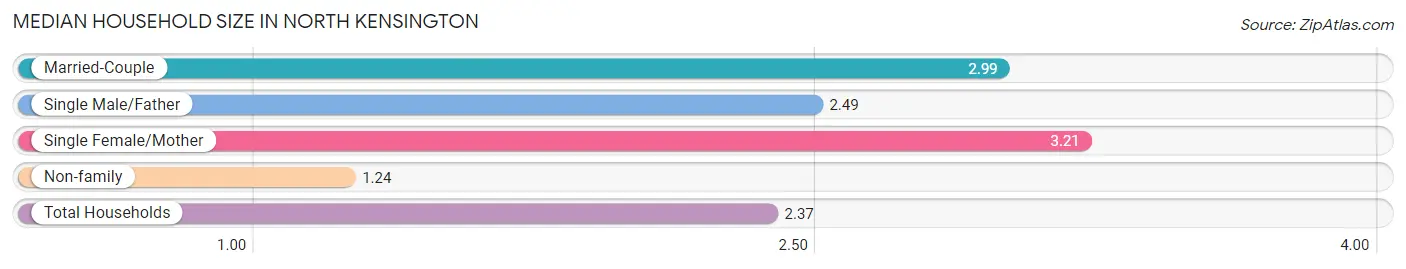
Median Household Size in North Kensington
The median household size in North Kensington is 2.37 persons per household, with single female/mother households (388 | 11.1%) accounting for the largest median household size of 3.21 persons per household. non-family households (1,253 | 35.9%) represent the smallest median household size with 1.24 persons per household.
| Household Type | # Households | Household Size |
| Married-Couple | 1,731 (49.5%) | 2.99 |
| Single Male/Father | 122 (3.5%) | 2.49 |
| Single Female/Mother | 388 (11.1%) | 3.21 |
| Non-family | 1,253 (35.9%) | 1.24 |
| Total Households | 3,494 (100.0%) | 2.37 |
Household Size by Marriage Status in North Kensington
Out of a total of 3,494 households in North Kensington, 2,241 (64.1%) are family households, while 1,253 (35.9%) are nonfamily households. The most numerous type of family households are 2-person households, comprising 1,054, and the most common type of nonfamily households are 1-person households, comprising 1,043.
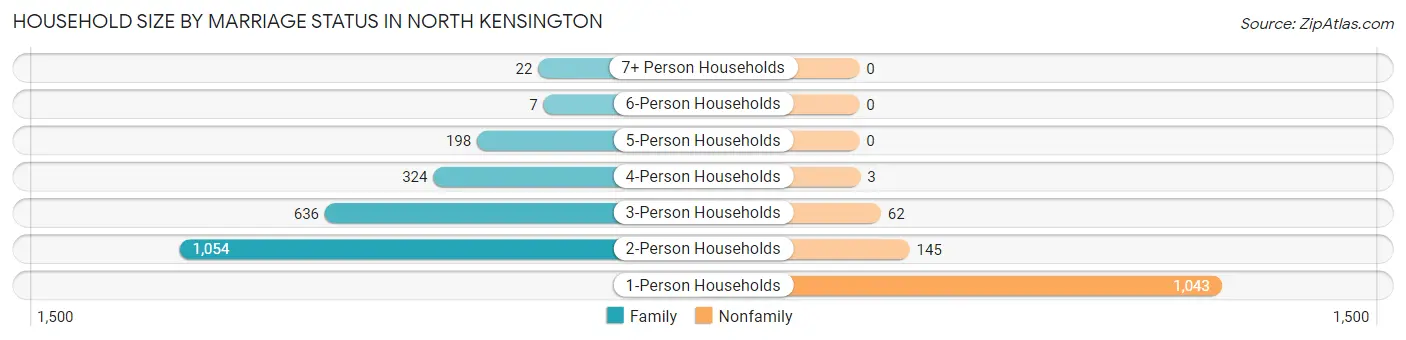
| Household Size | Family Households | Nonfamily Households |
| 1-Person Households | - | 1,043 (29.8%) |
| 2-Person Households | 1,054 (30.2%) | 145 (4.2%) |
| 3-Person Households | 636 (18.2%) | 62 (1.8%) |
| 4-Person Households | 324 (9.3%) | 3 (0.1%) |
| 5-Person Households | 198 (5.7%) | 0 (0.0%) |
| 6-Person Households | 7 (0.2%) | 0 (0.0%) |
| 7+ Person Households | 22 (0.6%) | 0 (0.0%) |
| Total | 2,241 (64.1%) | 1,253 (35.9%) |
Female Fertility in North Kensington
Fertility by Age in North Kensington
Average fertility rate in North Kensington is 28.0 births per 1,000 women. Women in the age bracket of 20 to 34 years have the highest fertility rate with 32.0 births per 1,000 women. Women in the age bracket of 35 to 50 years acount for 65.4% of all women with births.
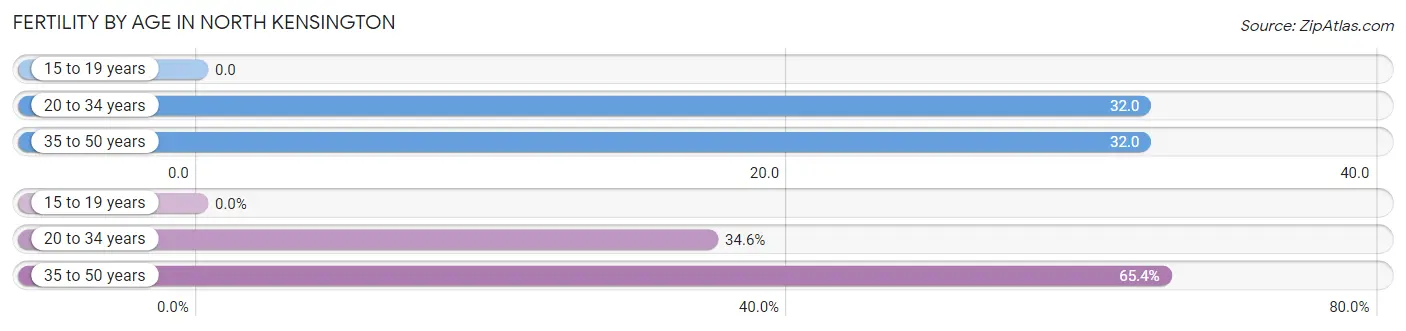
| Age Bracket | Women with Births | Births / 1,000 Women |
| 15 to 19 years | 0 (0.0%) | 0.0 |
| 20 to 34 years | 18 (34.6%) | 32.0 |
| 35 to 50 years | 34 (65.4%) | 32.0 |
| Total | 52 (100.0%) | 28.0 |
Fertility by Age by Marriage Status in North Kensington
86.5% of women with births (52) in North Kensington are married. The highest percentage of unmarried women with births falls into 35 to 50 years age bracket with 20.6% of them unmarried at the time of birth, while the lowest percentage of unmarried women with births belong to 20 to 34 years age bracket with 0.0% of them unmarried.
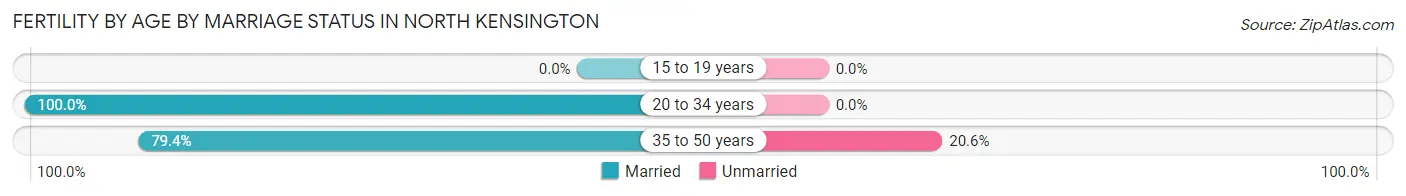
| Age Bracket | Married | Unmarried |
| 15 to 19 years | 0 (0.0%) | 0 (0.0%) |
| 20 to 34 years | 18 (100.0%) | 0 (0.0%) |
| 35 to 50 years | 27 (79.4%) | 7 (20.6%) |
| Total | 45 (86.5%) | 7 (13.5%) |
Fertility by Education in North Kensington
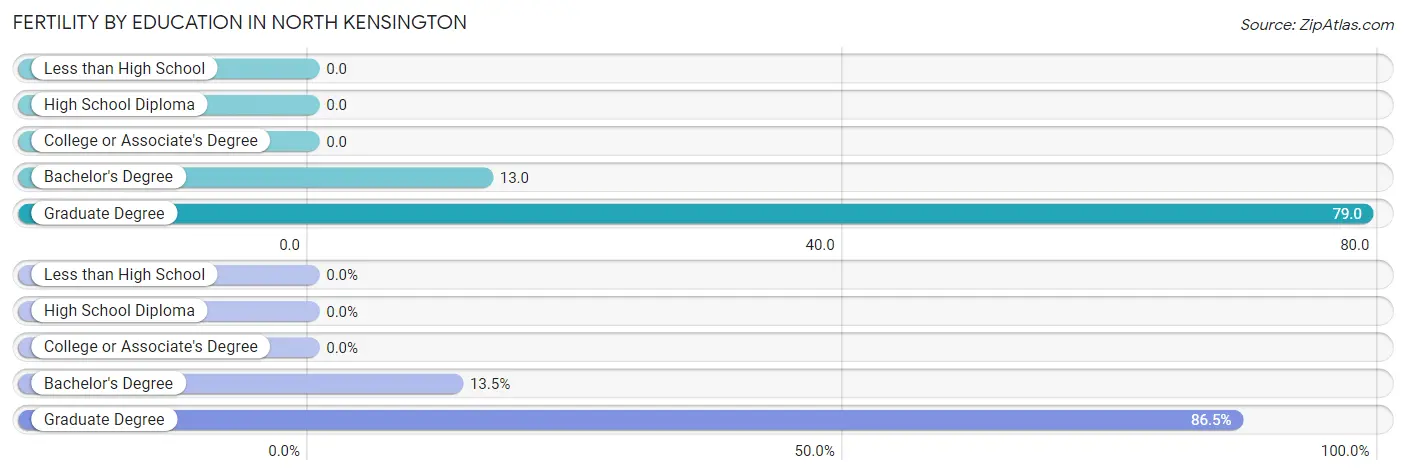
| Educational Attainment | Women with Births | Births / 1,000 Women |
| Less than High School | 0 (0.0%) | 0.0 |
| High School Diploma | 0 (0.0%) | 0.0 |
| College or Associate's Degree | 0 (0.0%) | 0.0 |
| Bachelor's Degree | 7 (13.5%) | 13.0 |
| Graduate Degree | 45 (86.5%) | 79.0 |
| Total | 52 (100.0%) | 28.0 |
Fertility by Education by Marriage Status in North Kensington
13.5% of women with births in North Kensington are unmarried. Women with the educational attainment of bachelor's degree are most likely to be married with 100.0% of them married at childbirth, while women with the educational attainment of graduate degree are least likely to be married with 15.6% of them unmarried at childbirth.
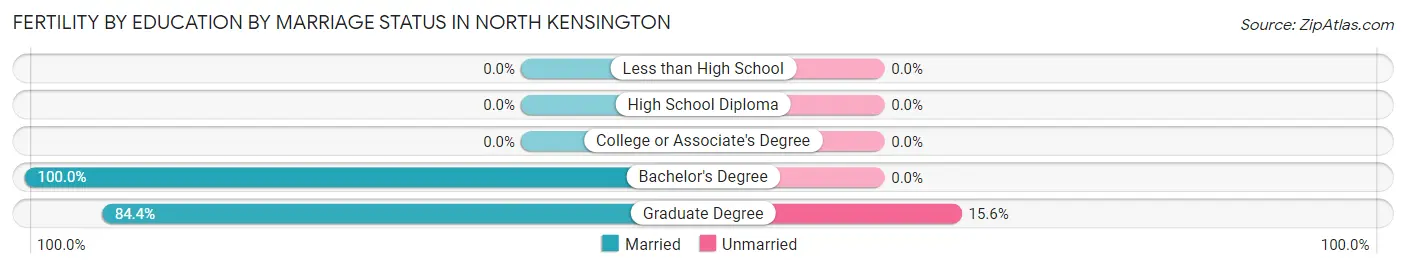
| Educational Attainment | Married | Unmarried |
| Less than High School | 0 (0.0%) | 0 (0.0%) |
| High School Diploma | 0 (0.0%) | 0 (0.0%) |
| College or Associate's Degree | 0 (0.0%) | 0 (0.0%) |
| Bachelor's Degree | 7 (100.0%) | 0 (0.0%) |
| Graduate Degree | 38 (84.4%) | 7 (15.6%) |
| Total | 45 (86.5%) | 7 (13.5%) |
Employment Characteristics in North Kensington
Employment by Class of Employer in North Kensington
Among the 4,872 employed individuals in North Kensington, private company employees (2,589 | 53.1%), not-for-profit organizations (818 | 16.8%), and federal government employees (711 | 14.6%) make up the most common classes of employment.
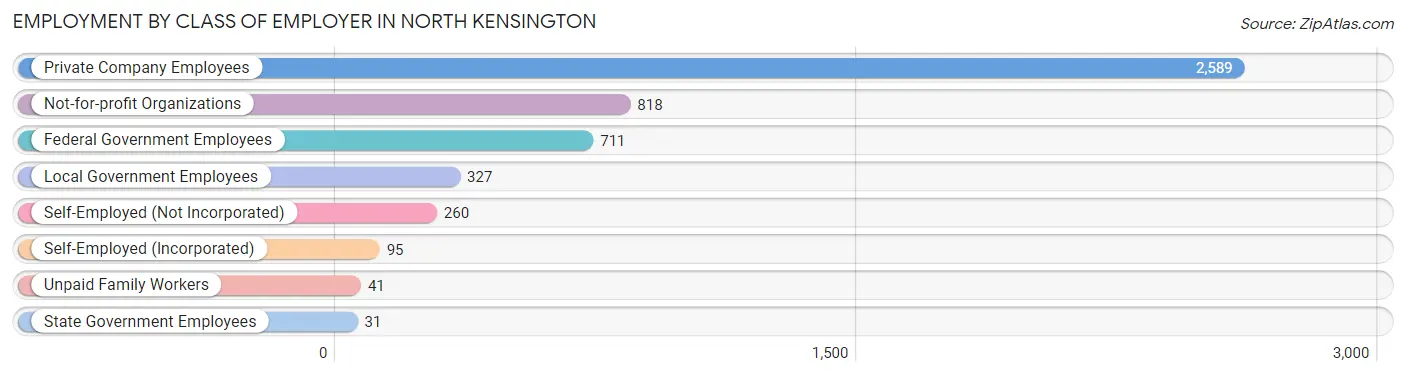
| Employer Class | # Employees | % Employees |
| Private Company Employees | 2,589 | 53.1% |
| Self-Employed (Incorporated) | 95 | 1.9% |
| Self-Employed (Not Incorporated) | 260 | 5.3% |
| Not-for-profit Organizations | 818 | 16.8% |
| Local Government Employees | 327 | 6.7% |
| State Government Employees | 31 | 0.6% |
| Federal Government Employees | 711 | 14.6% |
| Unpaid Family Workers | 41 | 0.8% |
| Total | 4,872 | 100.0% |
Employment Status by Age in North Kensington
According to the labor force statistics for North Kensington, out of the total population over 16 years of age (6,958), 73.4% or 5,107 individuals are in the labor force, with 2.6% or 133 of them unemployed. The age group with the highest labor force participation rate is 25 to 29 years, with 95.6% or 545 individuals in the labor force. Within the labor force, the 30 to 34 years age range has the highest percentage of unemployed individuals, with 8.2% or 24 of them being unemployed.
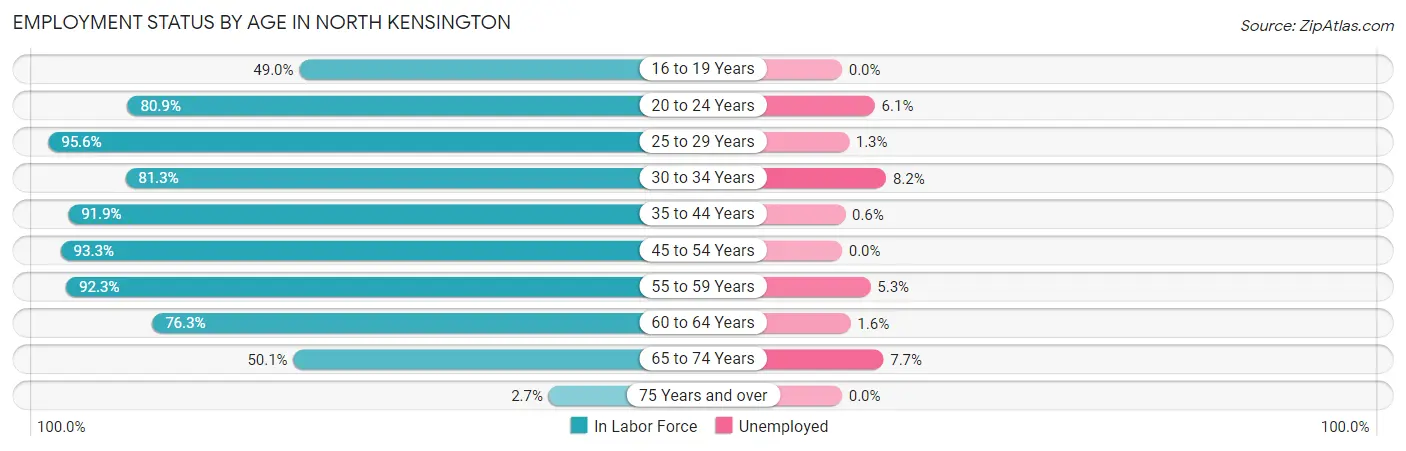
| Age Bracket | In Labor Force | Unemployed |
| 16 to 19 Years | 140 (49.0%) | 0 (0.0%) |
| 20 to 24 Years | 293 (80.9%) | 18 (6.1%) |
| 25 to 29 Years | 545 (95.6%) | 7 (1.3%) |
| 30 to 34 Years | 292 (81.3%) | 24 (8.2%) |
| 35 to 44 Years | 1,252 (91.9%) | 8 (0.6%) |
| 45 to 54 Years | 1,028 (93.3%) | 0 (0.0%) |
| 55 to 59 Years | 548 (92.3%) | 29 (5.3%) |
| 60 to 64 Years | 515 (76.3%) | 8 (1.6%) |
| 65 to 74 Years | 478 (50.1%) | 37 (7.7%) |
| 75 Years and over | 19 (2.7%) | 0 (0.0%) |
| Total | 5,107 (73.4%) | 133 (2.6%) |
Employment Status by Educational Attainment in North Kensington
According to labor force statistics for North Kensington, 89.6% of individuals (4,177) out of the total population between 25 and 64 years of age (4,662) are in the labor force, with 1.8% or 75 of them being unemployed. The group with the highest labor force participation rate are those with the educational attainment of bachelor's degree or higher, with 94.3% or 2,745 individuals in the labor force. Within the labor force, individuals with college / associate degree education have the highest percentage of unemployment, with 3.6% or 26 of them being unemployed.
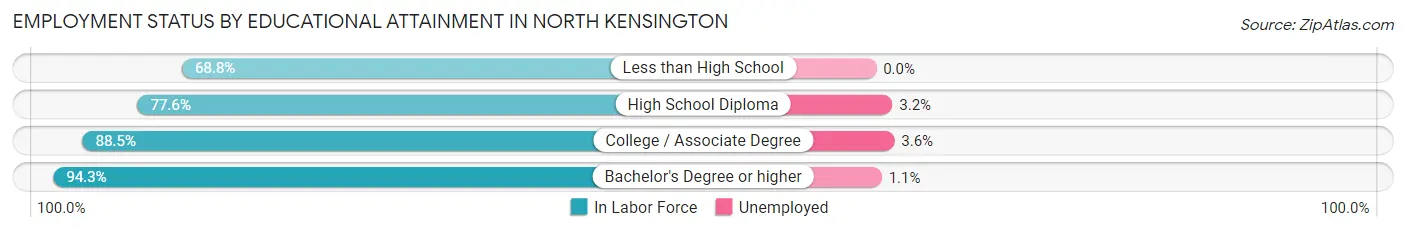
| Educational Attainment | In Labor Force | Unemployed |
| Less than High School | 117 (68.8%) | 0 (0.0%) |
| High School Diploma | 587 (77.6%) | 24 (3.2%) |
| College / Associate Degree | 730 (88.5%) | 30 (3.6%) |
| Bachelor's Degree or higher | 2,745 (94.3%) | 32 (1.1%) |
| Total | 4,177 (89.6%) | 84 (1.8%) |
Employment Occupations by Sex in North Kensington
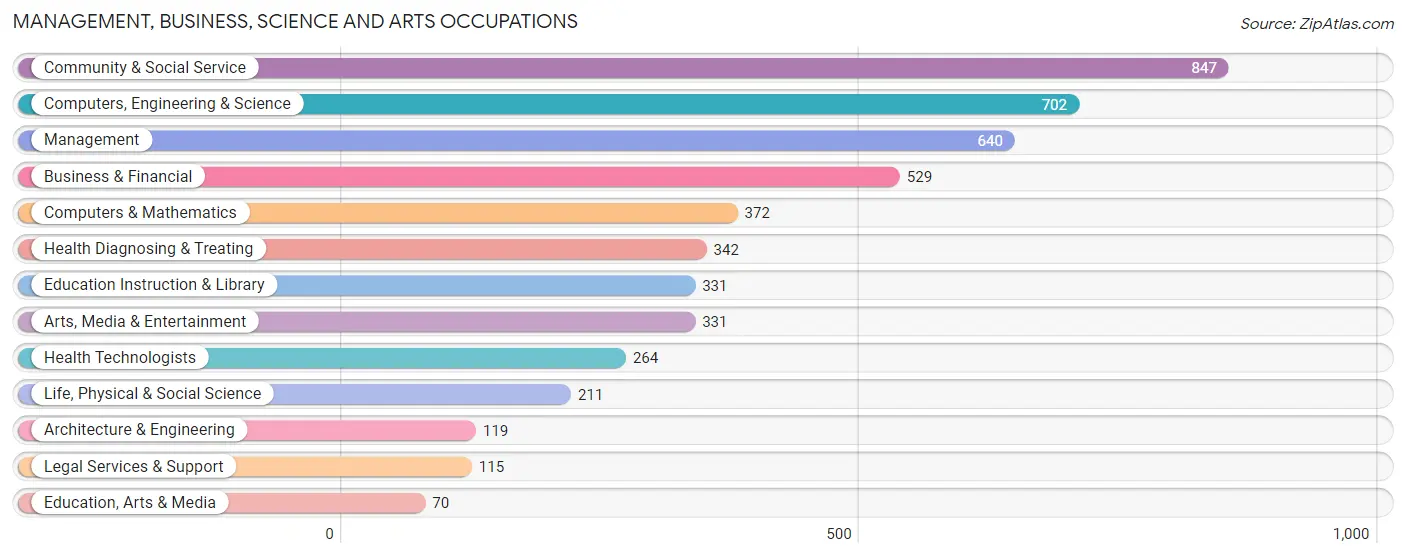
Management, Business, Science and Arts Occupations
The most common Management, Business, Science and Arts occupations in North Kensington are Community & Social Service (847 | 17.2%), Computers, Engineering & Science (702 | 14.2%), Management (640 | 13.0%), Business & Financial (529 | 10.7%), and Computers & Mathematics (372 | 7.5%).
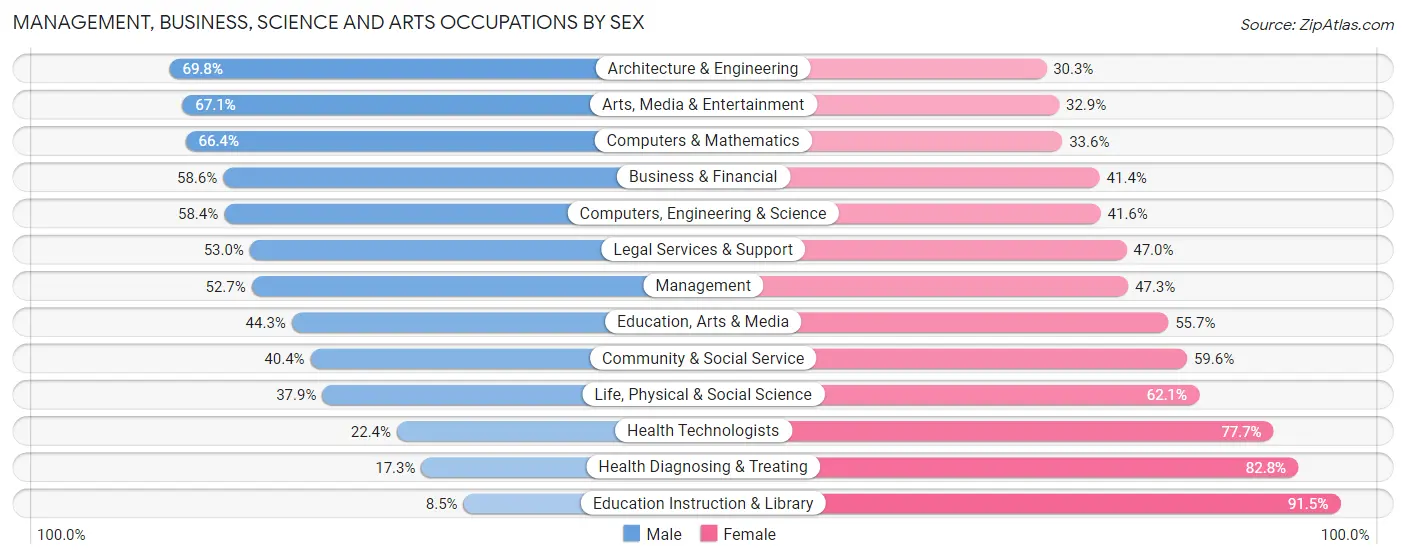
Management, Business, Science and Arts Occupations by Sex
Within the Management, Business, Science and Arts occupations in North Kensington, the most male-oriented occupations are Architecture & Engineering (69.8%), Arts, Media & Entertainment (67.1%), and Computers & Mathematics (66.4%), while the most female-oriented occupations are Education Instruction & Library (91.5%), Health Diagnosing & Treating (82.8%), and Health Technologists (77.6%).
| Occupation | Male | Female |
| Management | 337 (52.7%) | 303 (47.3%) |
| Business & Financial | 310 (58.6%) | 219 (41.4%) |
| Computers, Engineering & Science | 410 (58.4%) | 292 (41.6%) |
| Computers & Mathematics | 247 (66.4%) | 125 (33.6%) |
| Architecture & Engineering | 83 (69.8%) | 36 (30.2%) |
| Life, Physical & Social Science | 80 (37.9%) | 131 (62.1%) |
| Community & Social Service | 342 (40.4%) | 505 (59.6%) |
| Education, Arts & Media | 31 (44.3%) | 39 (55.7%) |
| Legal Services & Support | 61 (53.0%) | 54 (47.0%) |
| Education Instruction & Library | 28 (8.5%) | 303 (91.5%) |
| Arts, Media & Entertainment | 222 (67.1%) | 109 (32.9%) |
| Health Diagnosing & Treating | 59 (17.2%) | 283 (82.8%) |
| Health Technologists | 59 (22.4%) | 205 (77.6%) |
| Total (Category) | 1,458 (47.6%) | 1,602 (52.3%) |
| Total (Overall) | 2,435 (49.4%) | 2,495 (50.6%) |
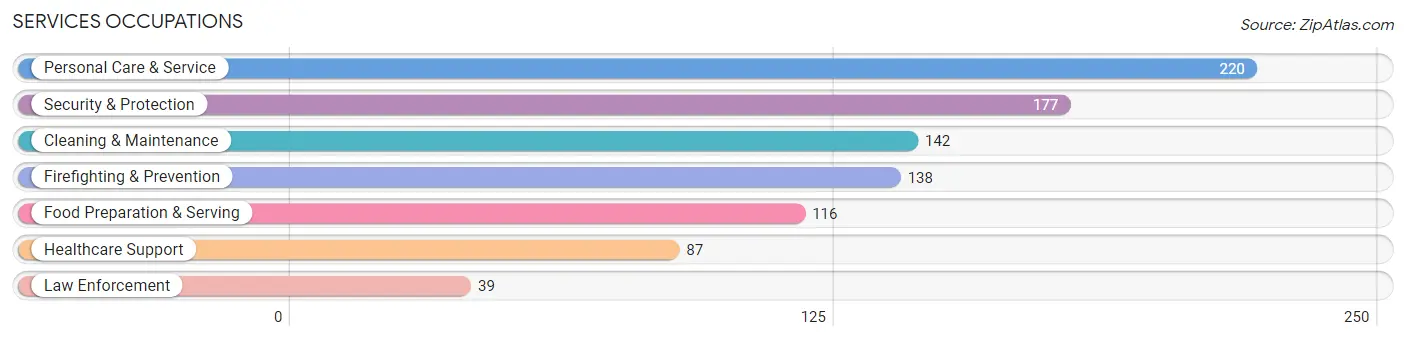
Services Occupations
The most common Services occupations in North Kensington are Personal Care & Service (220 | 4.5%), Security & Protection (177 | 3.6%), Cleaning & Maintenance (142 | 2.9%), Firefighting & Prevention (138 | 2.8%), and Food Preparation & Serving (116 | 2.4%).
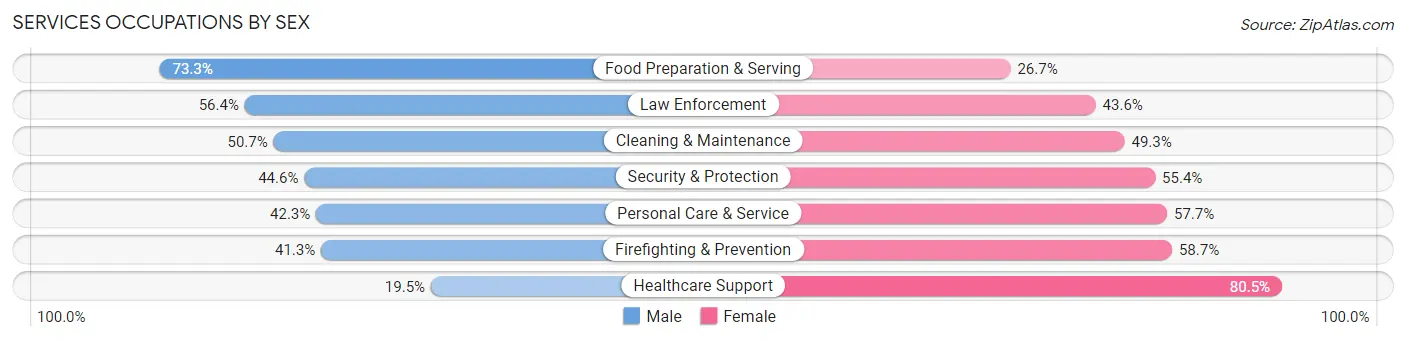
Services Occupations by Sex
Within the Services occupations in North Kensington, the most male-oriented occupations are Food Preparation & Serving (73.3%), Law Enforcement (56.4%), and Cleaning & Maintenance (50.7%), while the most female-oriented occupations are Healthcare Support (80.5%), Firefighting & Prevention (58.7%), and Personal Care & Service (57.7%).
| Occupation | Male | Female |
| Healthcare Support | 17 (19.5%) | 70 (80.5%) |
| Security & Protection | 79 (44.6%) | 98 (55.4%) |
| Firefighting & Prevention | 57 (41.3%) | 81 (58.7%) |
| Law Enforcement | 22 (56.4%) | 17 (43.6%) |
| Food Preparation & Serving | 85 (73.3%) | 31 (26.7%) |
| Cleaning & Maintenance | 72 (50.7%) | 70 (49.3%) |
| Personal Care & Service | 93 (42.3%) | 127 (57.7%) |
| Total (Category) | 346 (46.6%) | 396 (53.4%) |
| Total (Overall) | 2,435 (49.4%) | 2,495 (50.6%) |
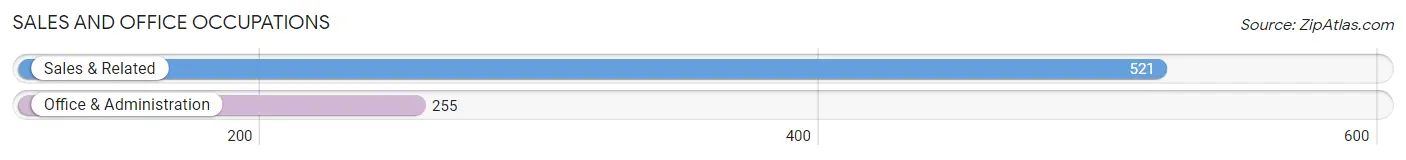
Sales and Office Occupations
The most common Sales and Office occupations in North Kensington are Sales & Related (521 | 10.6%), and Office & Administration (255 | 5.2%).
Sales and Office Occupations by Sex
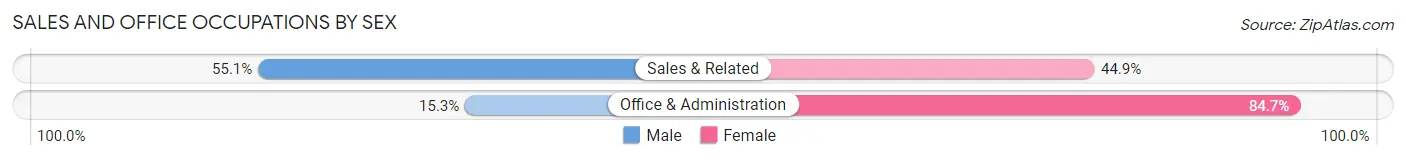
| Occupation | Male | Female |
| Sales & Related | 287 (55.1%) | 234 (44.9%) |
| Office & Administration | 39 (15.3%) | 216 (84.7%) |
| Total (Category) | 326 (42.0%) | 450 (58.0%) |
| Total (Overall) | 2,435 (49.4%) | 2,495 (50.6%) |
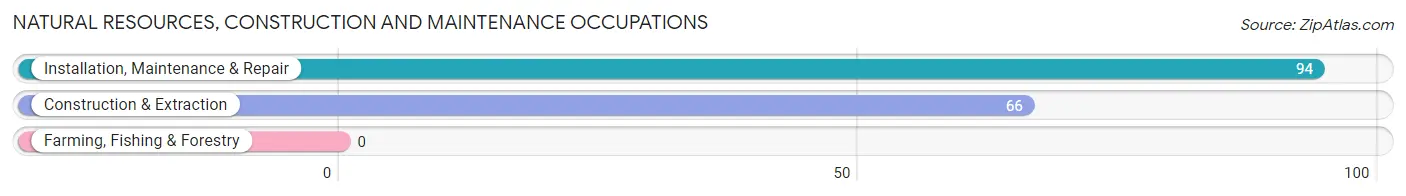
Natural Resources, Construction and Maintenance Occupations
The most common Natural Resources, Construction and Maintenance occupations in North Kensington are Installation, Maintenance & Repair (94 | 1.9%), and Construction & Extraction (66 | 1.3%).
Natural Resources, Construction and Maintenance Occupations by Sex
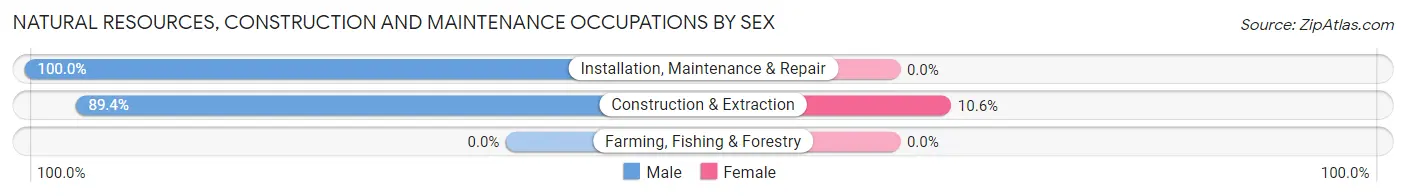
| Occupation | Male | Female |
| Farming, Fishing & Forestry | 0 (0.0%) | 0 (0.0%) |
| Construction & Extraction | 59 (89.4%) | 7 (10.6%) |
| Installation, Maintenance & Repair | 94 (100.0%) | 0 (0.0%) |
| Total (Category) | 153 (95.6%) | 7 (4.4%) |
| Total (Overall) | 2,435 (49.4%) | 2,495 (50.6%) |
Production, Transportation and Moving Occupations
The most common Production, Transportation and Moving occupations in North Kensington are Production (100 | 2.0%), Material Moving (56 | 1.1%), and Transportation (36 | 0.7%).
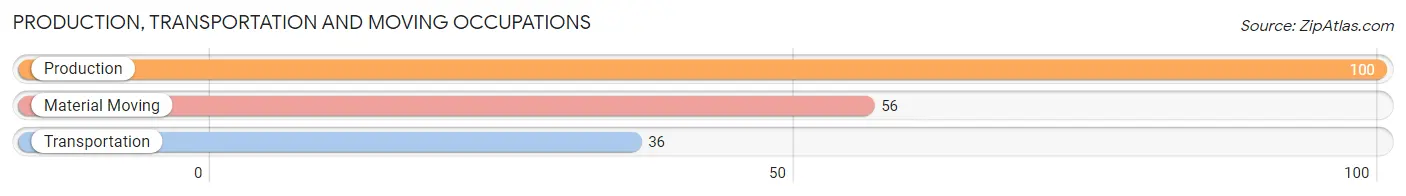
Production, Transportation and Moving Occupations by Sex
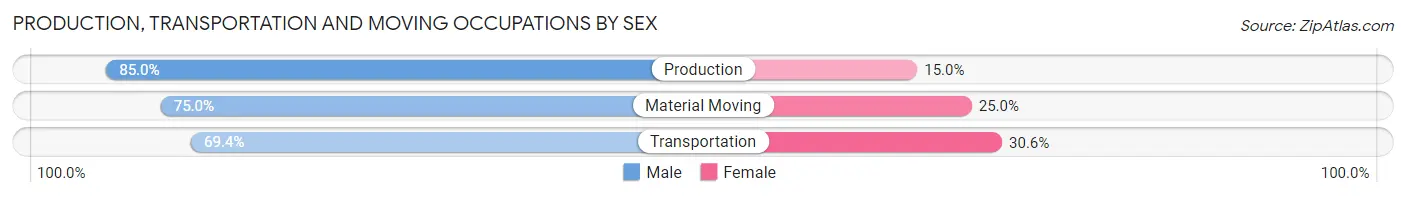
| Occupation | Male | Female |
| Production | 85 (85.0%) | 15 (15.0%) |
| Transportation | 25 (69.4%) | 11 (30.6%) |
| Material Moving | 42 (75.0%) | 14 (25.0%) |
| Total (Category) | 152 (79.2%) | 40 (20.8%) |
| Total (Overall) | 2,435 (49.4%) | 2,495 (50.6%) |
Employment Industries by Sex in North Kensington
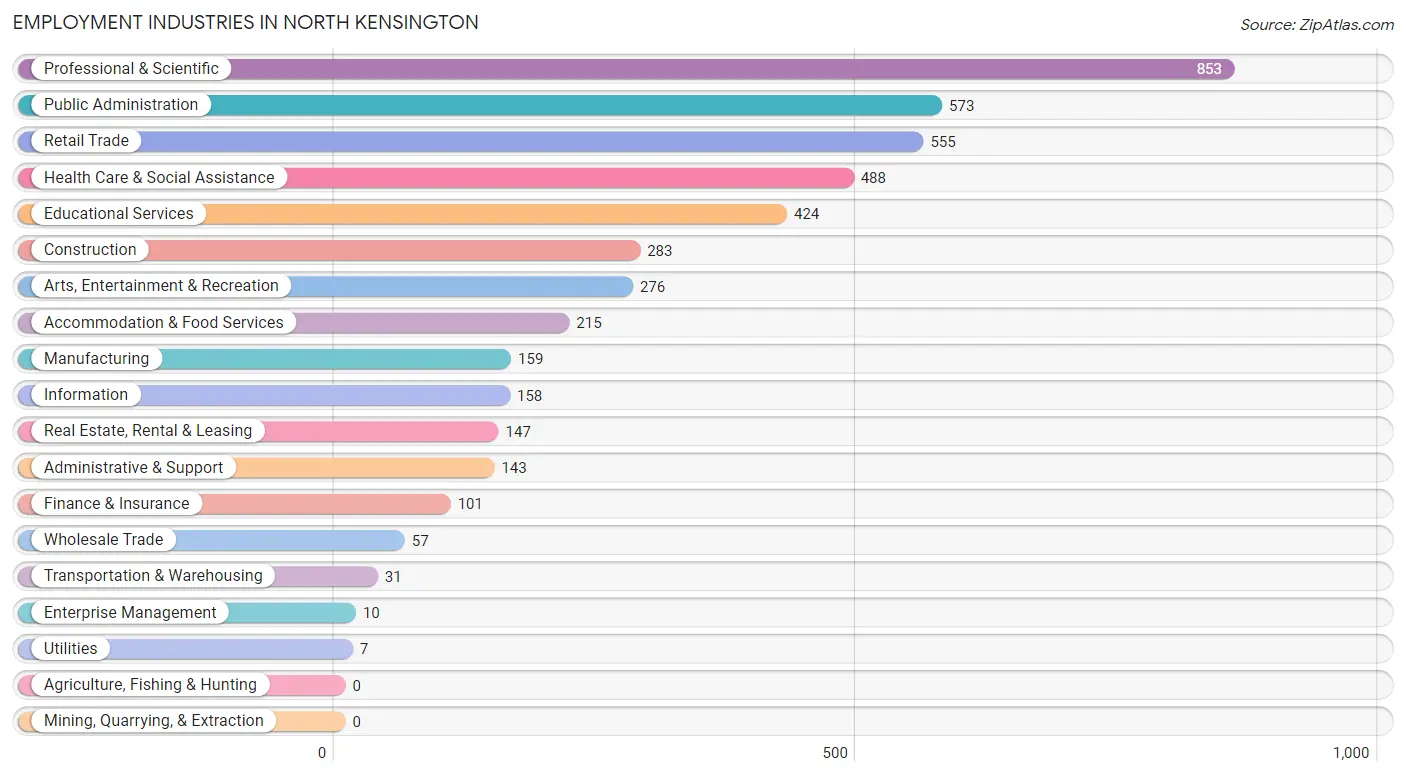
Employment Industries in North Kensington
The major employment industries in North Kensington include Professional & Scientific (853 | 17.3%), Public Administration (573 | 11.6%), Retail Trade (555 | 11.3%), Health Care & Social Assistance (488 | 9.9%), and Educational Services (424 | 8.6%).
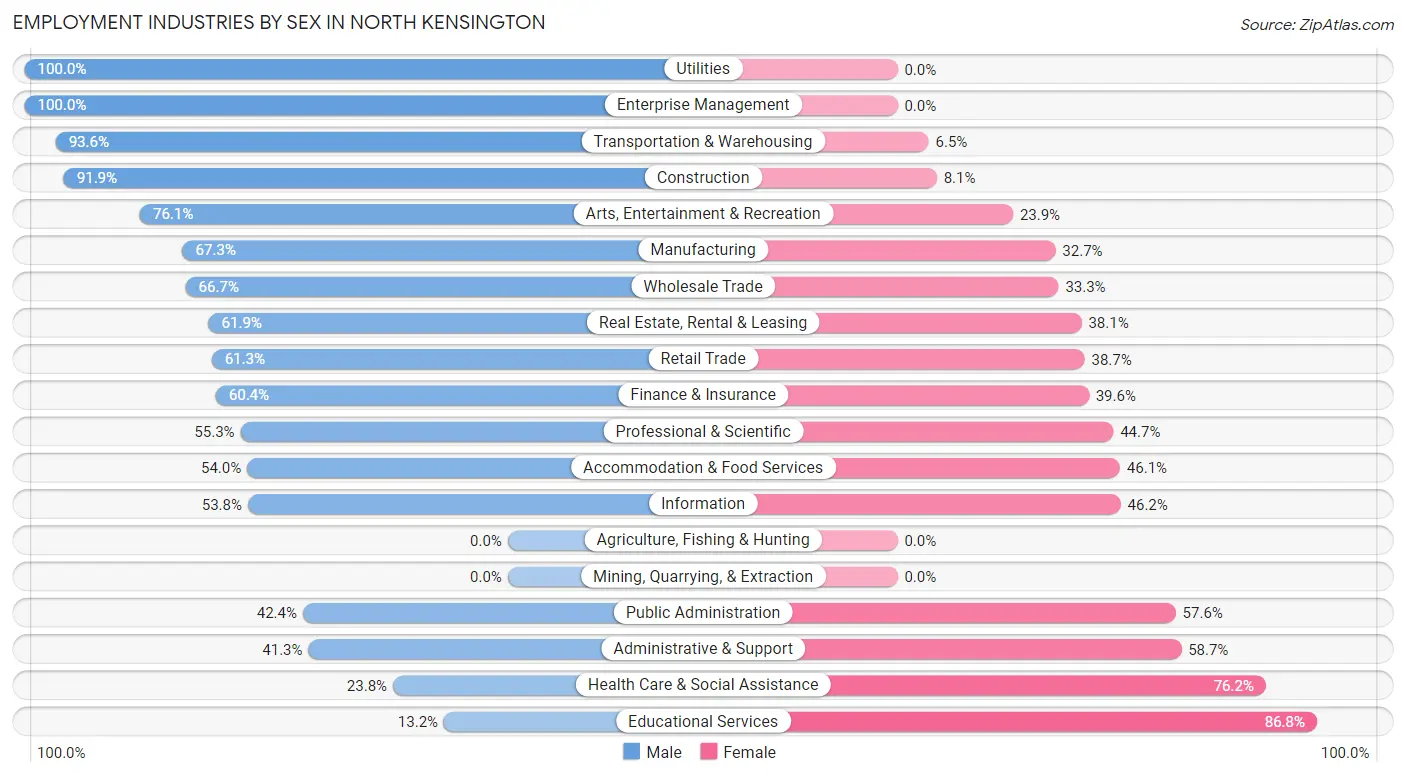
Employment Industries by Sex in North Kensington
The North Kensington industries that see more men than women are Utilities (100.0%), Enterprise Management (100.0%), and Transportation & Warehousing (93.5%), whereas the industries that tend to have a higher number of women are Educational Services (86.8%), Health Care & Social Assistance (76.2%), and Administrative & Support (58.7%).
| Industry | Male | Female |
| Agriculture, Fishing & Hunting | 0 (0.0%) | 0 (0.0%) |
| Mining, Quarrying, & Extraction | 0 (0.0%) | 0 (0.0%) |
| Construction | 260 (91.9%) | 23 (8.1%) |
| Manufacturing | 107 (67.3%) | 52 (32.7%) |
| Wholesale Trade | 38 (66.7%) | 19 (33.3%) |
| Retail Trade | 340 (61.3%) | 215 (38.7%) |
| Transportation & Warehousing | 29 (93.5%) | 2 (6.5%) |
| Utilities | 7 (100.0%) | 0 (0.0%) |
| Information | 85 (53.8%) | 73 (46.2%) |
| Finance & Insurance | 61 (60.4%) | 40 (39.6%) |
| Real Estate, Rental & Leasing | 91 (61.9%) | 56 (38.1%) |
| Professional & Scientific | 472 (55.3%) | 381 (44.7%) |
| Enterprise Management | 10 (100.0%) | 0 (0.0%) |
| Administrative & Support | 59 (41.3%) | 84 (58.7%) |
| Educational Services | 56 (13.2%) | 368 (86.8%) |
| Health Care & Social Assistance | 116 (23.8%) | 372 (76.2%) |
| Arts, Entertainment & Recreation | 210 (76.1%) | 66 (23.9%) |
| Accommodation & Food Services | 116 (53.9%) | 99 (46.1%) |
| Public Administration | 243 (42.4%) | 330 (57.6%) |
| Total | 2,435 (49.4%) | 2,495 (50.6%) |
Education in North Kensington
School Enrollment in North Kensington
The most common levels of schooling among the 1,740 students in North Kensington are elementary school (370 | 21.3%), college / undergraduate (323 | 18.6%), and middle school (301 | 17.3%).
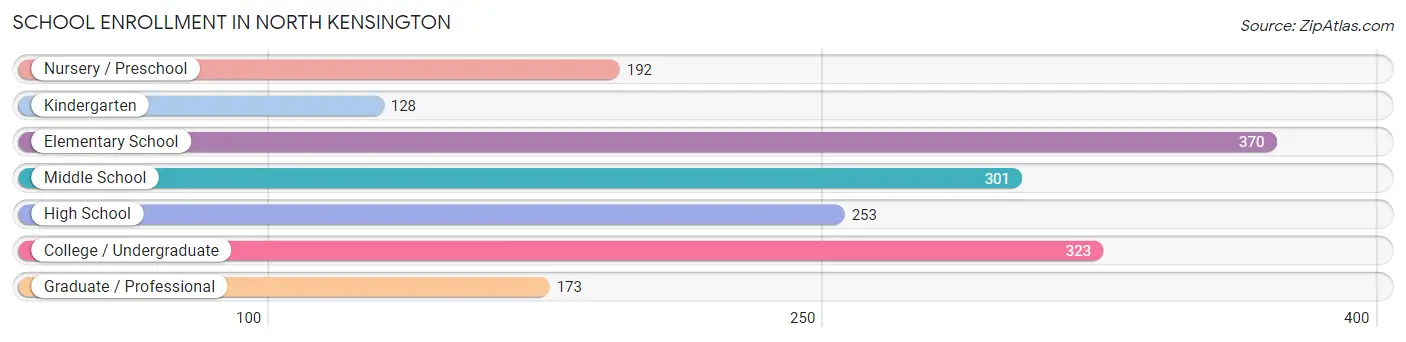
| School Level | # Students | % Students |
| Nursery / Preschool | 192 | 11.0% |
| Kindergarten | 128 | 7.4% |
| Elementary School | 370 | 21.3% |
| Middle School | 301 | 17.3% |
| High School | 253 | 14.5% |
| College / Undergraduate | 323 | 18.6% |
| Graduate / Professional | 173 | 9.9% |
| Total | 1,740 | 100.0% |
School Enrollment by Age by Funding Source in North Kensington
Out of a total of 1,740 students who are enrolled in schools in North Kensington, 677 (38.9%) attend a private institution, while the remaining 1,063 (61.1%) are enrolled in public schools. The age group of 3 to 4 year olds has the highest likelihood of being enrolled in private schools, with 126 (83.4% in the age bracket) enrolled. Conversely, the age group of 18 to 19 year olds has the lowest likelihood of being enrolled in a private school, with 130 (100.0% in the age bracket) attending a public institution.
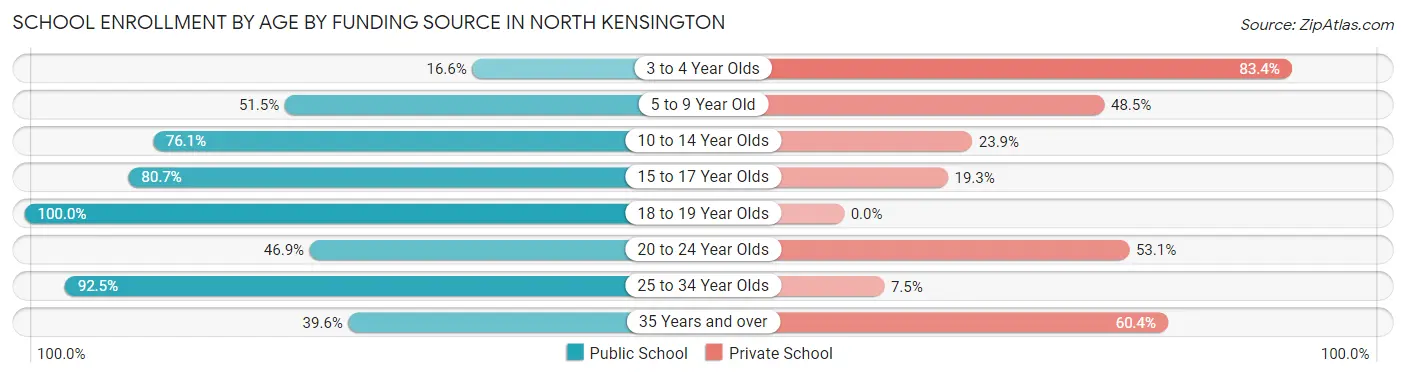
| Age Bracket | Public School | Private School |
| 3 to 4 Year Olds | 25 (16.6%) | 126 (83.4%) |
| 5 to 9 Year Old | 257 (51.5%) | 242 (48.5%) |
| 10 to 14 Year Olds | 290 (76.1%) | 91 (23.9%) |
| 15 to 17 Year Olds | 146 (80.7%) | 35 (19.3%) |
| 18 to 19 Year Olds | 130 (100.0%) | 0 (0.0%) |
| 20 to 24 Year Olds | 97 (46.9%) | 110 (53.1%) |
| 25 to 34 Year Olds | 74 (92.5%) | 6 (7.5%) |
| 35 Years and over | 44 (39.6%) | 67 (60.4%) |
| Total | 1,063 (61.1%) | 677 (38.9%) |
Educational Attainment by Field of Study in North Kensington
Social sciences (754 | 17.1%), business (687 | 15.5%), visual & performing arts (378 | 8.6%), liberal arts & history (375 | 8.5%), and bio, nature & agricultural (338 | 7.6%) are the most common fields of study among 4,417 individuals in North Kensington who have obtained a bachelor's degree or higher.
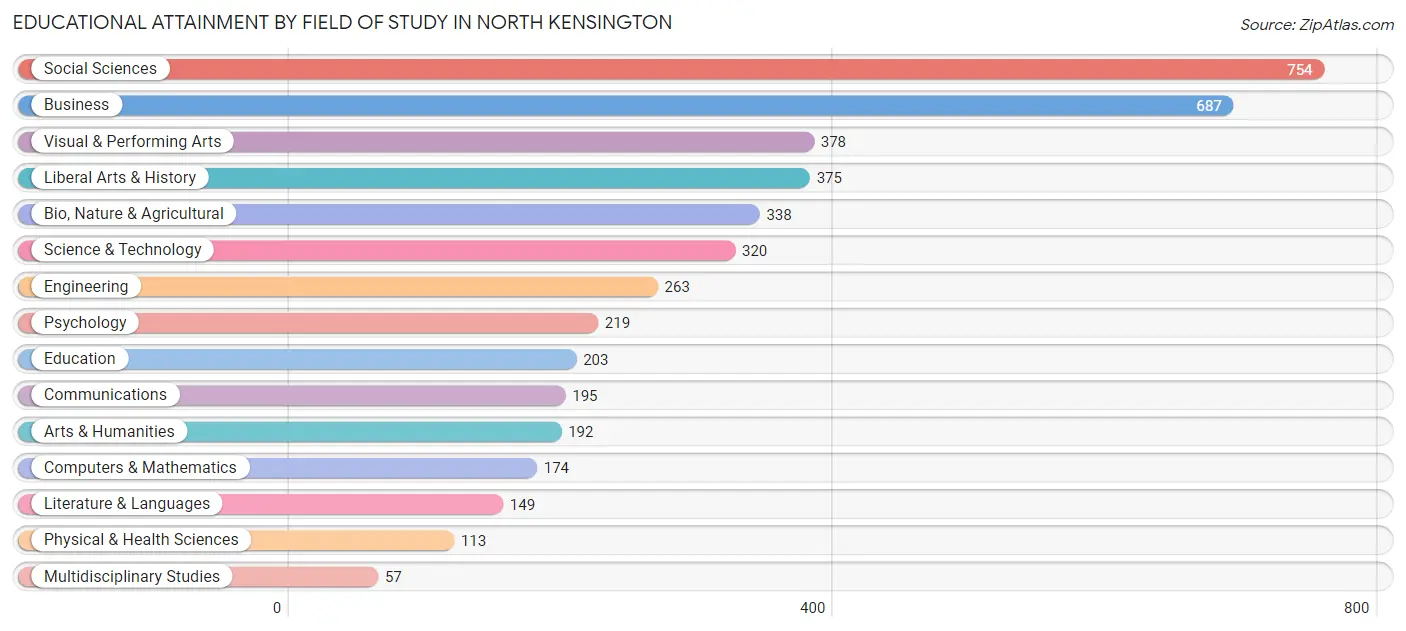
| Field of Study | # Graduates | % Graduates |
| Computers & Mathematics | 174 | 3.9% |
| Bio, Nature & Agricultural | 338 | 7.6% |
| Physical & Health Sciences | 113 | 2.6% |
| Psychology | 219 | 5.0% |
| Social Sciences | 754 | 17.1% |
| Engineering | 263 | 5.9% |
| Multidisciplinary Studies | 57 | 1.3% |
| Science & Technology | 320 | 7.2% |
| Business | 687 | 15.5% |
| Education | 203 | 4.6% |
| Literature & Languages | 149 | 3.4% |
| Liberal Arts & History | 375 | 8.5% |
| Visual & Performing Arts | 378 | 8.6% |
| Communications | 195 | 4.4% |
| Arts & Humanities | 192 | 4.3% |
| Total | 4,417 | 100.0% |
Transportation & Commute in North Kensington
Vehicle Availability by Sex in North Kensington
The most prevalent vehicle ownership categories in North Kensington are males with 2 vehicles (1,415, accounting for 58.1%) and females with 2 vehicles (1,258, making up 58.1%).
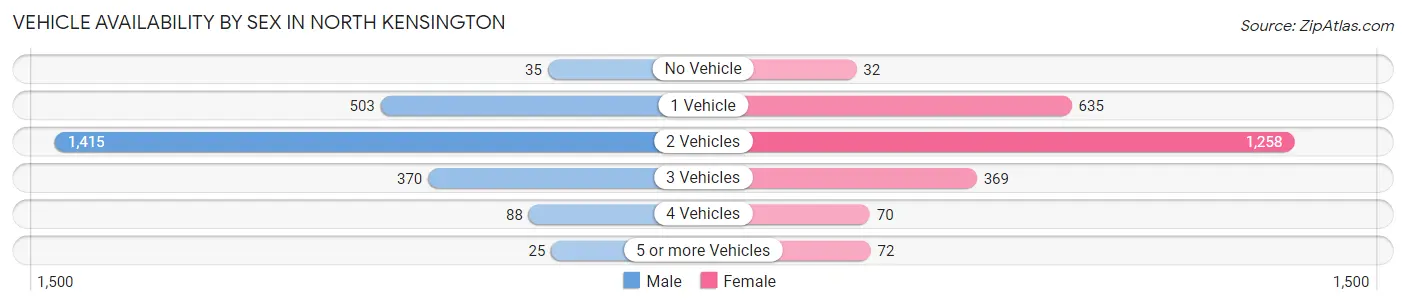
| Vehicles Available | Male | Female |
| No Vehicle | 35 (1.4%) | 32 (1.3%) |
| 1 Vehicle | 503 (20.6%) | 635 (26.1%) |
| 2 Vehicles | 1,415 (58.1%) | 1,258 (51.6%) |
| 3 Vehicles | 370 (15.2%) | 369 (15.1%) |
| 4 Vehicles | 88 (3.6%) | 70 (2.9%) |
| 5 or more Vehicles | 25 (1.0%) | 72 (3.0%) |
| Total | 2,436 (100.0%) | 2,436 (100.0%) |
Commute Time in North Kensington
The most frequently occuring commute durations in North Kensington are 30 to 34 minutes (809 commuters, 21.0%), 20 to 24 minutes (486 commuters, 12.6%), and 60 to 89 minutes (421 commuters, 10.9%).
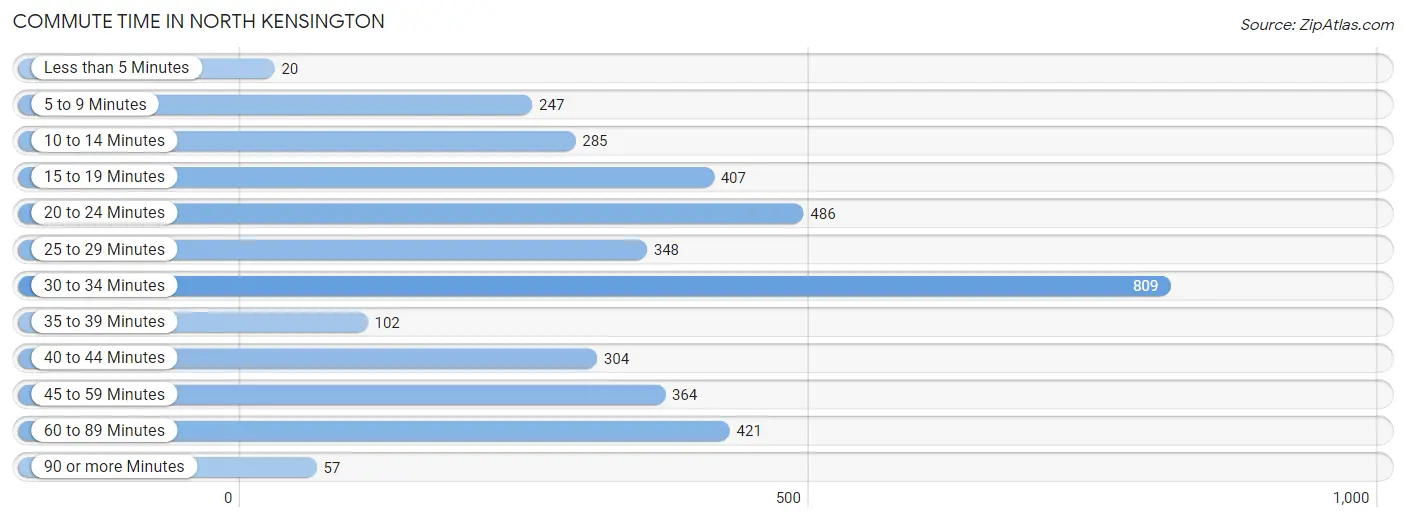
| Commute Time | # Commuters | % Commuters |
| Less than 5 Minutes | 20 | 0.5% |
| 5 to 9 Minutes | 247 | 6.4% |
| 10 to 14 Minutes | 285 | 7.4% |
| 15 to 19 Minutes | 407 | 10.6% |
| 20 to 24 Minutes | 486 | 12.6% |
| 25 to 29 Minutes | 348 | 9.0% |
| 30 to 34 Minutes | 809 | 21.0% |
| 35 to 39 Minutes | 102 | 2.6% |
| 40 to 44 Minutes | 304 | 7.9% |
| 45 to 59 Minutes | 364 | 9.5% |
| 60 to 89 Minutes | 421 | 10.9% |
| 90 or more Minutes | 57 | 1.5% |
Commute Time by Sex in North Kensington
The most common commute times in North Kensington are 30 to 34 minutes (375 commuters, 19.0%) for males and 30 to 34 minutes (434 commuters, 23.1%) for females.
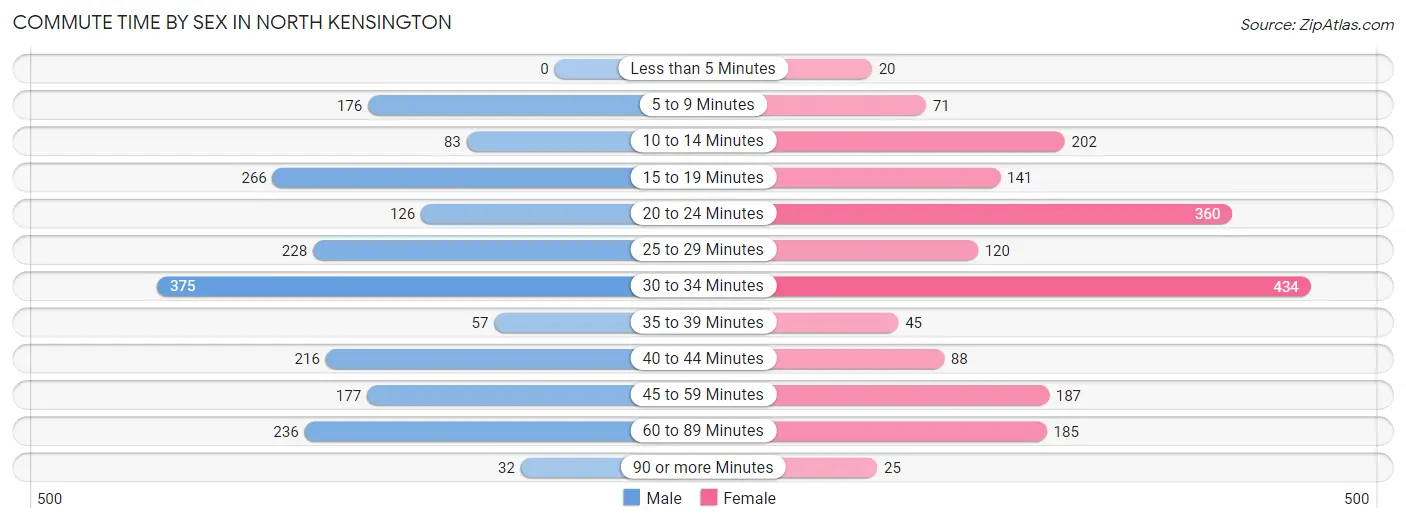
| Commute Time | Male | Female |
| Less than 5 Minutes | 0 (0.0%) | 20 (1.1%) |
| 5 to 9 Minutes | 176 (8.9%) | 71 (3.8%) |
| 10 to 14 Minutes | 83 (4.2%) | 202 (10.8%) |
| 15 to 19 Minutes | 266 (13.5%) | 141 (7.5%) |
| 20 to 24 Minutes | 126 (6.4%) | 360 (19.2%) |
| 25 to 29 Minutes | 228 (11.6%) | 120 (6.4%) |
| 30 to 34 Minutes | 375 (19.0%) | 434 (23.1%) |
| 35 to 39 Minutes | 57 (2.9%) | 45 (2.4%) |
| 40 to 44 Minutes | 216 (11.0%) | 88 (4.7%) |
| 45 to 59 Minutes | 177 (9.0%) | 187 (10.0%) |
| 60 to 89 Minutes | 236 (12.0%) | 185 (9.9%) |
| 90 or more Minutes | 32 (1.6%) | 25 (1.3%) |
Time of Departure to Work by Sex in North Kensington
The most frequent times of departure to work in North Kensington are 7:00 AM to 7:29 AM (306, 15.5%) for males and 7:30 AM to 7:59 AM (327, 17.4%) for females.
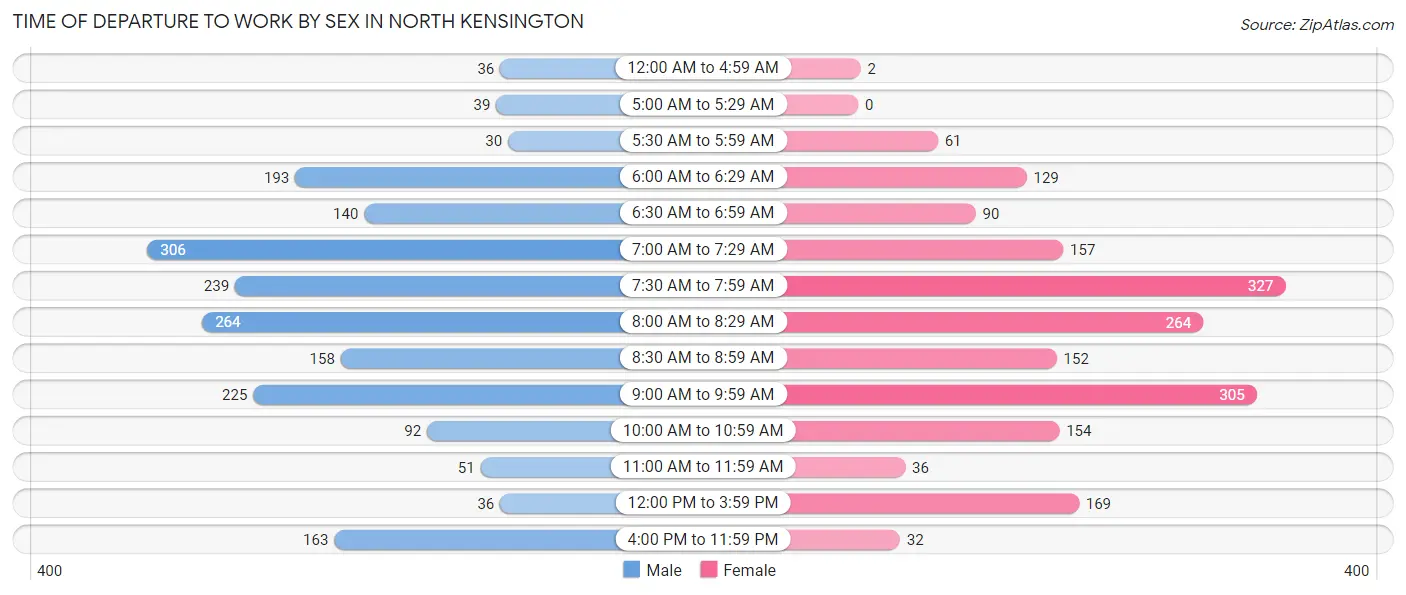
| Time of Departure | Male | Female |
| 12:00 AM to 4:59 AM | 36 (1.8%) | 2 (0.1%) |
| 5:00 AM to 5:29 AM | 39 (2.0%) | 0 (0.0%) |
| 5:30 AM to 5:59 AM | 30 (1.5%) | 61 (3.3%) |
| 6:00 AM to 6:29 AM | 193 (9.8%) | 129 (6.9%) |
| 6:30 AM to 6:59 AM | 140 (7.1%) | 90 (4.8%) |
| 7:00 AM to 7:29 AM | 306 (15.5%) | 157 (8.4%) |
| 7:30 AM to 7:59 AM | 239 (12.1%) | 327 (17.4%) |
| 8:00 AM to 8:29 AM | 264 (13.4%) | 264 (14.1%) |
| 8:30 AM to 8:59 AM | 158 (8.0%) | 152 (8.1%) |
| 9:00 AM to 9:59 AM | 225 (11.4%) | 305 (16.2%) |
| 10:00 AM to 10:59 AM | 92 (4.7%) | 154 (8.2%) |
| 11:00 AM to 11:59 AM | 51 (2.6%) | 36 (1.9%) |
| 12:00 PM to 3:59 PM | 36 (1.8%) | 169 (9.0%) |
| 4:00 PM to 11:59 PM | 163 (8.3%) | 32 (1.7%) |
| Total | 1,972 (100.0%) | 1,878 (100.0%) |
Housing Occupancy in North Kensington
Occupancy by Ownership in North Kensington
Of the total 3,494 dwellings in North Kensington, owner-occupied units account for 2,902 (83.1%), while renter-occupied units make up 592 (16.9%).
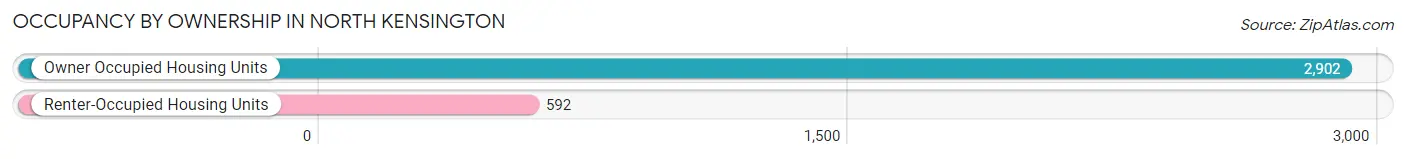
| Occupancy | # Housing Units | % Housing Units |
| Owner Occupied Housing Units | 2,902 | 83.1% |
| Renter-Occupied Housing Units | 592 | 16.9% |
| Total Occupied Housing Units | 3,494 | 100.0% |
Occupancy by Household Size in North Kensington
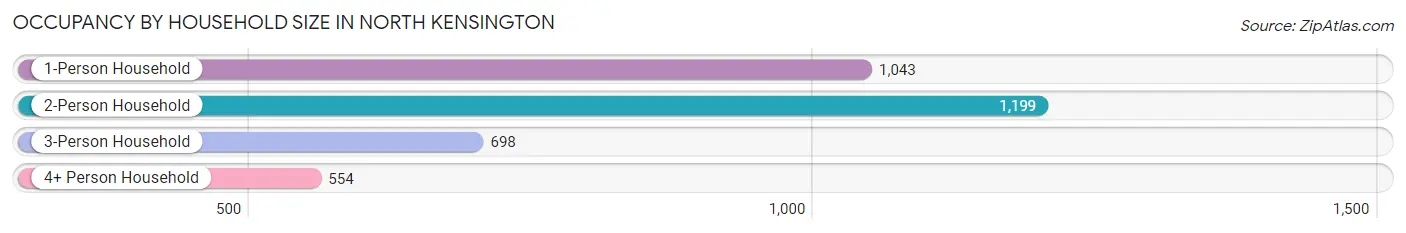
| Household Size | # Housing Units | % Housing Units |
| 1-Person Household | 1,043 | 29.8% |
| 2-Person Household | 1,199 | 34.3% |
| 3-Person Household | 698 | 20.0% |
| 4+ Person Household | 554 | 15.9% |
| Total Housing Units | 3,494 | 100.0% |
Occupancy by Ownership by Household Size in North Kensington
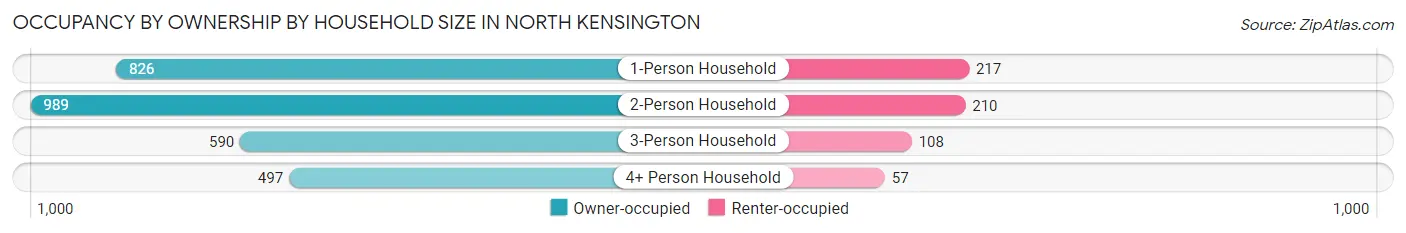
| Household Size | Owner-occupied | Renter-occupied |
| 1-Person Household | 826 (79.2%) | 217 (20.8%) |
| 2-Person Household | 989 (82.5%) | 210 (17.5%) |
| 3-Person Household | 590 (84.5%) | 108 (15.5%) |
| 4+ Person Household | 497 (89.7%) | 57 (10.3%) |
| Total Housing Units | 2,902 (83.1%) | 592 (16.9%) |
Occupancy by Educational Attainment in North Kensington
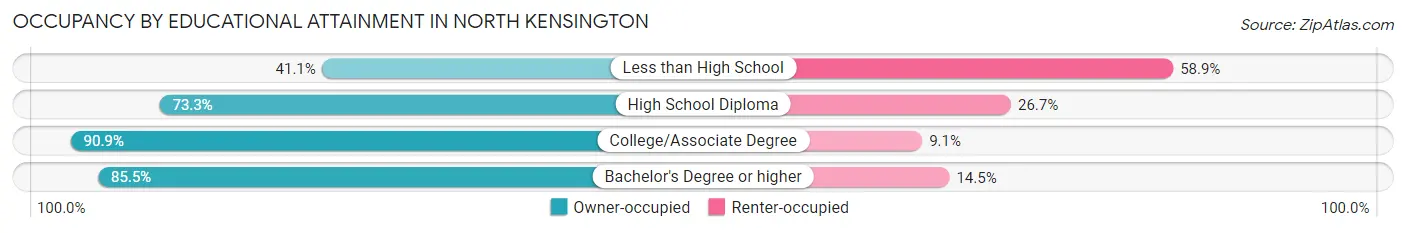
| Household Size | Owner-occupied | Renter-occupied |
| Less than High School | 37 (41.1%) | 53 (58.9%) |
| High School Diploma | 422 (73.3%) | 154 (26.7%) |
| College/Associate Degree | 438 (90.9%) | 44 (9.1%) |
| Bachelor's Degree or higher | 2,005 (85.5%) | 341 (14.5%) |
Occupancy by Age of Householder in North Kensington
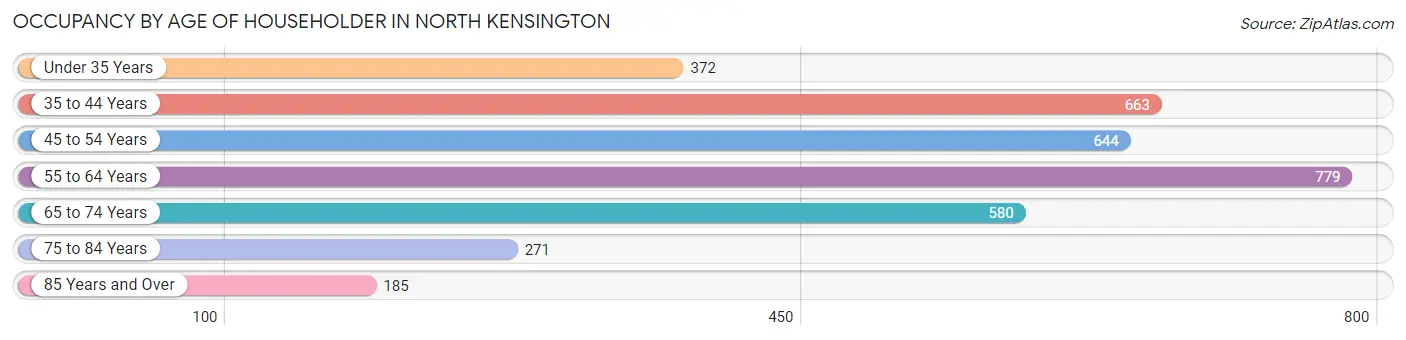
| Age Bracket | # Households | % Households |
| Under 35 Years | 372 | 10.6% |
| 35 to 44 Years | 663 | 19.0% |
| 45 to 54 Years | 644 | 18.4% |
| 55 to 64 Years | 779 | 22.3% |
| 65 to 74 Years | 580 | 16.6% |
| 75 to 84 Years | 271 | 7.8% |
| 85 Years and Over | 185 | 5.3% |
| Total | 3,494 | 100.0% |
Housing Finances in North Kensington
Median Income by Occupancy in North Kensington
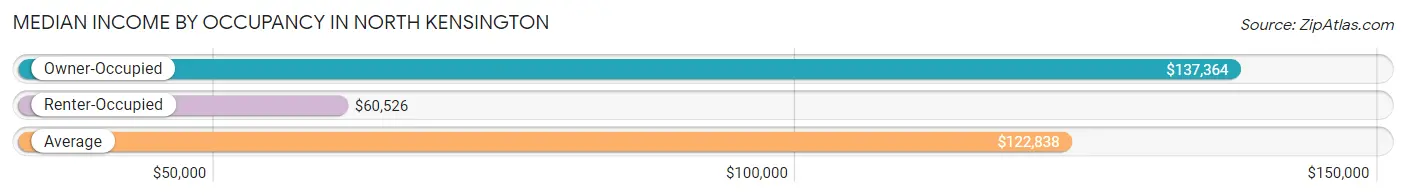
| Occupancy Type | # Households | Median Income |
| Owner-Occupied | 2,902 (83.1%) | $137,364 |
| Renter-Occupied | 592 (16.9%) | $60,526 |
| Average | 3,494 (100.0%) | $122,838 |
Occupancy by Householder Income Bracket in North Kensington
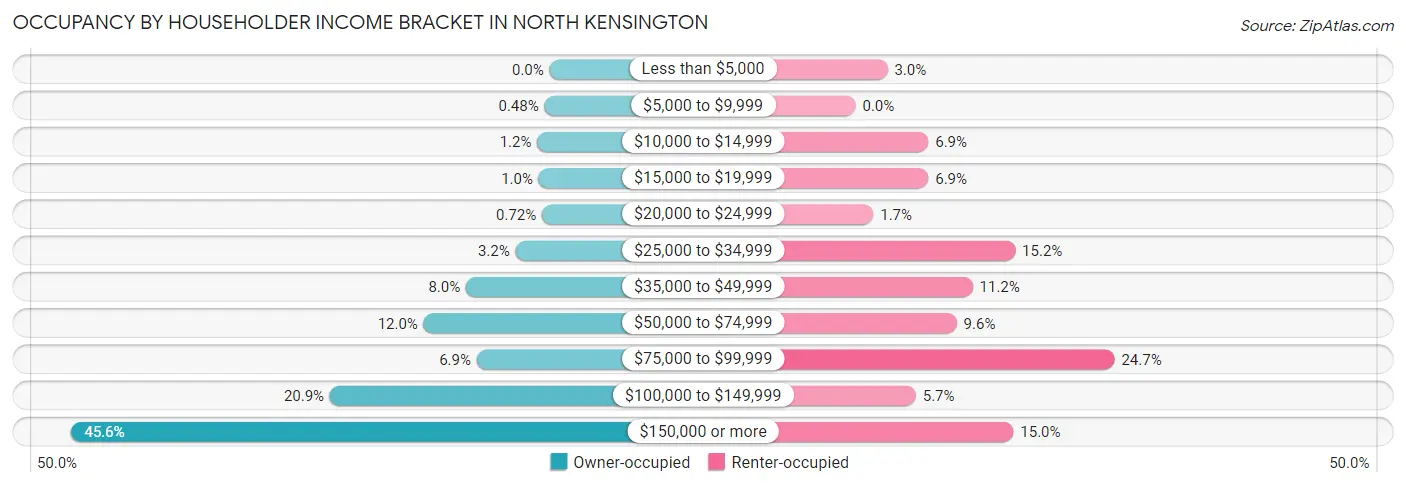
| Income Bracket | Owner-occupied | Renter-occupied |
| Less than $5,000 | 0 (0.0%) | 18 (3.0%) |
| $5,000 to $9,999 | 14 (0.5%) | 0 (0.0%) |
| $10,000 to $14,999 | 34 (1.2%) | 41 (6.9%) |
| $15,000 to $19,999 | 30 (1.0%) | 41 (6.9%) |
| $20,000 to $24,999 | 21 (0.7%) | 10 (1.7%) |
| $25,000 to $34,999 | 94 (3.2%) | 90 (15.2%) |
| $35,000 to $49,999 | 231 (8.0%) | 66 (11.2%) |
| $50,000 to $74,999 | 348 (12.0%) | 57 (9.6%) |
| $75,000 to $99,999 | 201 (6.9%) | 146 (24.7%) |
| $100,000 to $149,999 | 607 (20.9%) | 34 (5.7%) |
| $150,000 or more | 1,322 (45.6%) | 89 (15.0%) |
| Total | 2,902 (100.0%) | 592 (100.0%) |
Monthly Housing Cost Tiers in North Kensington
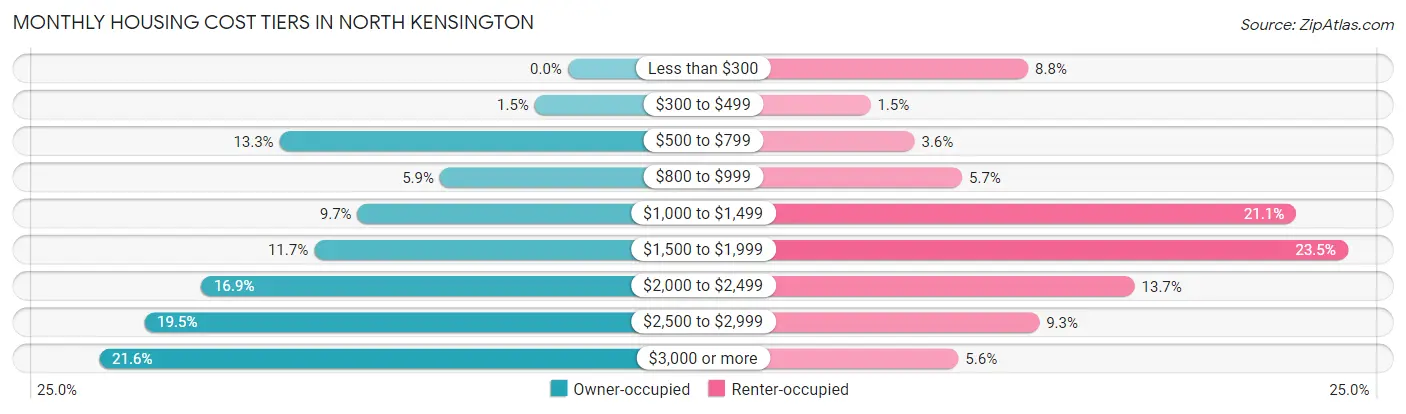
| Monthly Cost | Owner-occupied | Renter-occupied |
| Less than $300 | 0 (0.0%) | 52 (8.8%) |
| $300 to $499 | 44 (1.5%) | 9 (1.5%) |
| $500 to $799 | 385 (13.3%) | 21 (3.5%) |
| $800 to $999 | 171 (5.9%) | 34 (5.7%) |
| $1,000 to $1,499 | 281 (9.7%) | 125 (21.1%) |
| $1,500 to $1,999 | 339 (11.7%) | 139 (23.5%) |
| $2,000 to $2,499 | 490 (16.9%) | 81 (13.7%) |
| $2,500 to $2,999 | 566 (19.5%) | 55 (9.3%) |
| $3,000 or more | 626 (21.6%) | 33 (5.6%) |
| Total | 2,902 (100.0%) | 592 (100.0%) |
Physical Housing Characteristics in North Kensington
Housing Structures in North Kensington
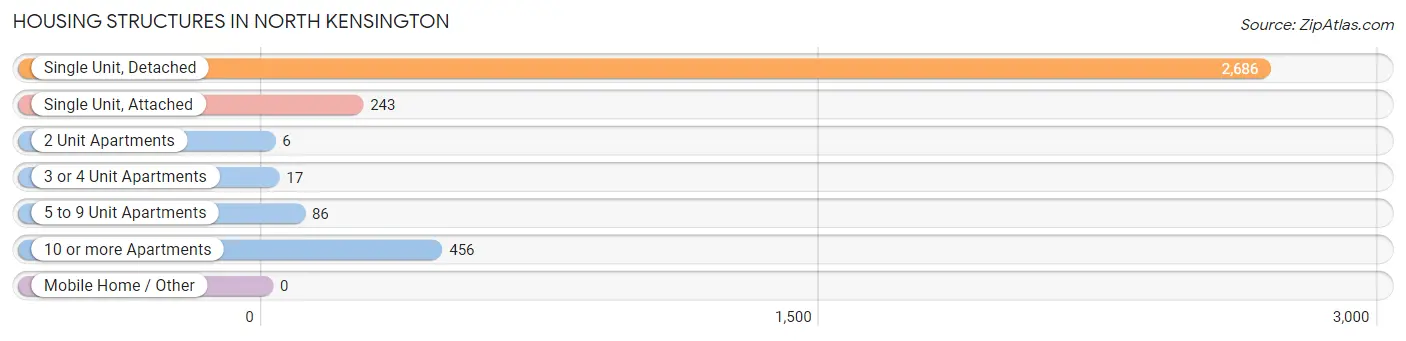
| Structure Type | # Housing Units | % Housing Units |
| Single Unit, Detached | 2,686 | 76.9% |
| Single Unit, Attached | 243 | 7.0% |
| 2 Unit Apartments | 6 | 0.2% |
| 3 or 4 Unit Apartments | 17 | 0.5% |
| 5 to 9 Unit Apartments | 86 | 2.5% |
| 10 or more Apartments | 456 | 13.1% |
| Mobile Home / Other | 0 | 0.0% |
| Total | 3,494 | 100.0% |
Housing Structures by Occupancy in North Kensington
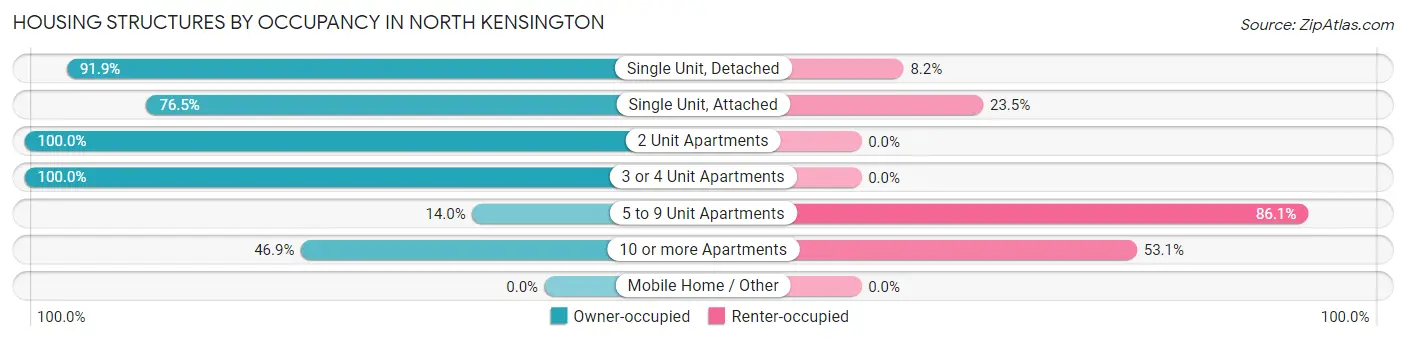
| Structure Type | Owner-occupied | Renter-occupied |
| Single Unit, Detached | 2,467 (91.8%) | 219 (8.2%) |
| Single Unit, Attached | 186 (76.5%) | 57 (23.5%) |
| 2 Unit Apartments | 6 (100.0%) | 0 (0.0%) |
| 3 or 4 Unit Apartments | 17 (100.0%) | 0 (0.0%) |
| 5 to 9 Unit Apartments | 12 (14.0%) | 74 (86.1%) |
| 10 or more Apartments | 214 (46.9%) | 242 (53.1%) |
| Mobile Home / Other | 0 (0.0%) | 0 (0.0%) |
| Total | 2,902 (83.1%) | 592 (16.9%) |
Housing Structures by Number of Rooms in North Kensington
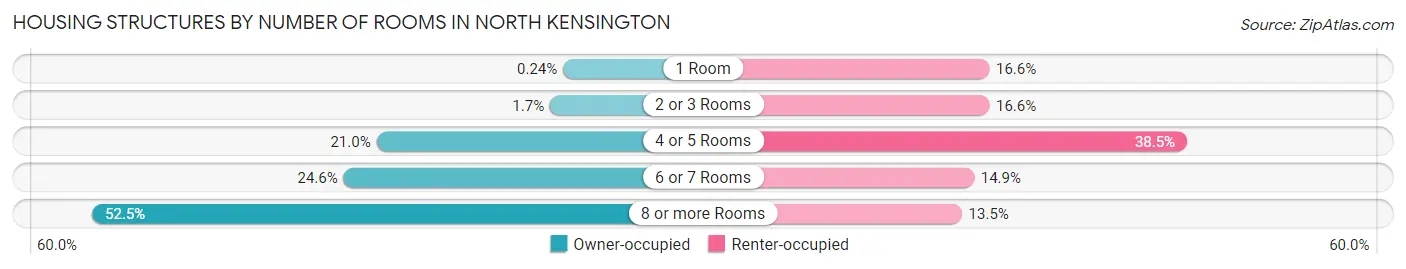
| Number of Rooms | Owner-occupied | Renter-occupied |
| 1 Room | 7 (0.2%) | 98 (16.6%) |
| 2 or 3 Rooms | 49 (1.7%) | 98 (16.6%) |
| 4 or 5 Rooms | 608 (20.9%) | 228 (38.5%) |
| 6 or 7 Rooms | 714 (24.6%) | 88 (14.9%) |
| 8 or more Rooms | 1,524 (52.5%) | 80 (13.5%) |
| Total | 2,902 (100.0%) | 592 (100.0%) |
Housing Structure by Heating Type in North Kensington
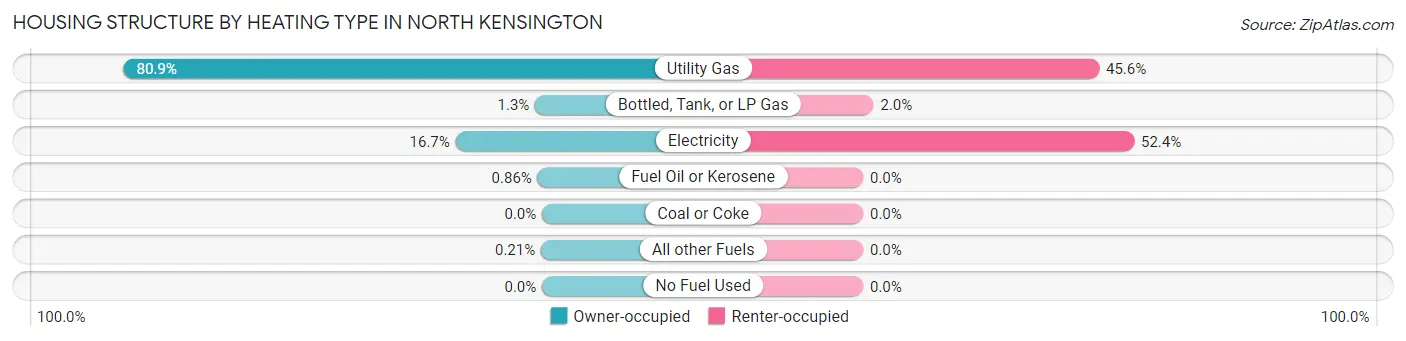
| Heating Type | Owner-occupied | Renter-occupied |
| Utility Gas | 2,347 (80.9%) | 270 (45.6%) |
| Bottled, Tank, or LP Gas | 39 (1.3%) | 12 (2.0%) |
| Electricity | 485 (16.7%) | 310 (52.4%) |
| Fuel Oil or Kerosene | 25 (0.9%) | 0 (0.0%) |
| Coal or Coke | 0 (0.0%) | 0 (0.0%) |
| All other Fuels | 6 (0.2%) | 0 (0.0%) |
| No Fuel Used | 0 (0.0%) | 0 (0.0%) |
| Total | 2,902 (100.0%) | 592 (100.0%) |
Household Vehicle Usage in North Kensington
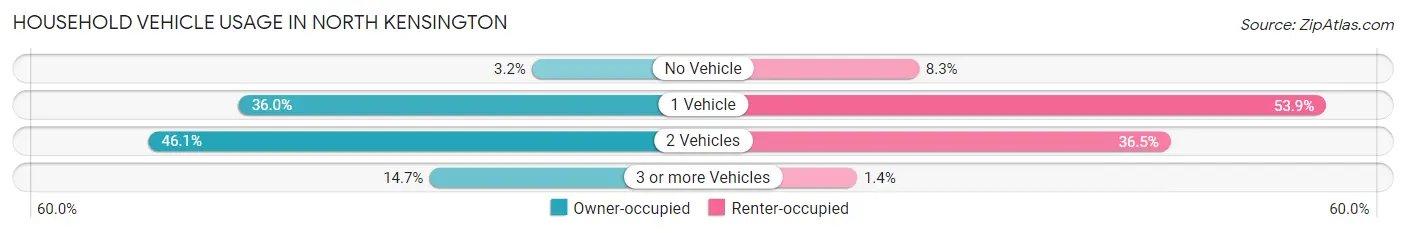
| Vehicles per Household | Owner-occupied | Renter-occupied |
| No Vehicle | 93 (3.2%) | 49 (8.3%) |
| 1 Vehicle | 1,045 (36.0%) | 319 (53.9%) |
| 2 Vehicles | 1,338 (46.1%) | 216 (36.5%) |
| 3 or more Vehicles | 426 (14.7%) | 8 (1.3%) |
| Total | 2,902 (100.0%) | 592 (100.0%) |
Real Estate & Mortgages in North Kensington
Real Estate and Mortgage Overview in North Kensington
| Characteristic | Without Mortgage | With Mortgage |
| Housing Units | 632 | 2,270 |
| Median Property Value | $475,200 | $570,000 |
| Median Household Income | $100,357 | $1,074 |
| Monthly Housing Costs | $735 | $620 |
| Real Estate Taxes | $4,376 | $13 |
Property Value by Mortgage Status in North Kensington
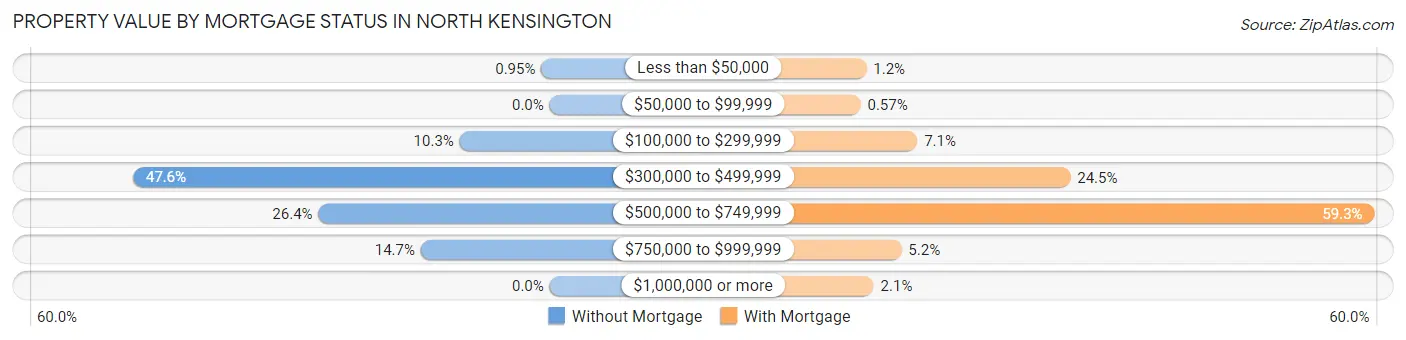
| Property Value | Without Mortgage | With Mortgage |
| Less than $50,000 | 6 (0.9%) | 28 (1.2%) |
| $50,000 to $99,999 | 0 (0.0%) | 13 (0.6%) |
| $100,000 to $299,999 | 65 (10.3%) | 160 (7.0%) |
| $300,000 to $499,999 | 301 (47.6%) | 557 (24.5%) |
| $500,000 to $749,999 | 167 (26.4%) | 1,346 (59.3%) |
| $750,000 to $999,999 | 93 (14.7%) | 119 (5.2%) |
| $1,000,000 or more | 0 (0.0%) | 47 (2.1%) |
| Total | 632 (100.0%) | 2,270 (100.0%) |
Household Income by Mortgage Status in North Kensington
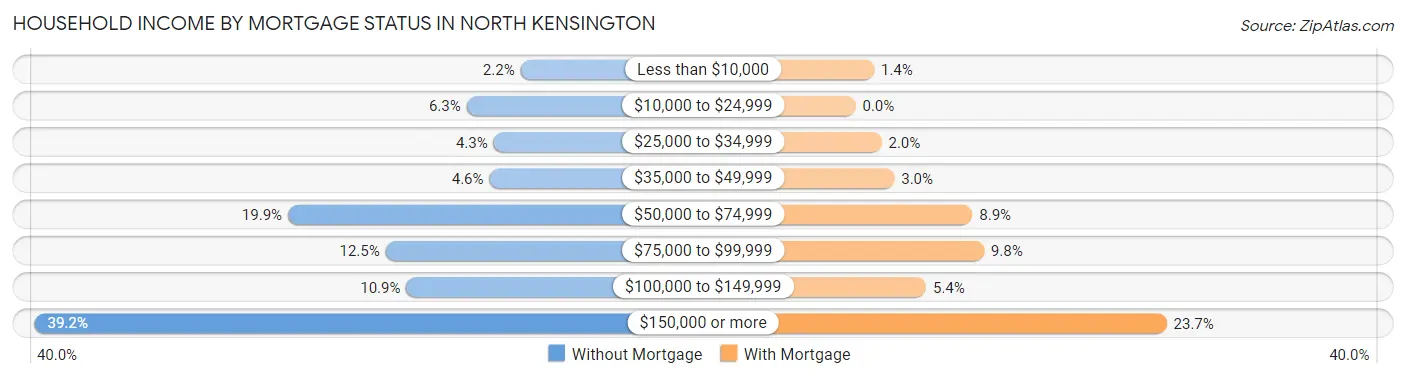
| Household Income | Without Mortgage | With Mortgage |
| Less than $10,000 | 14 (2.2%) | 32 (1.4%) |
| $10,000 to $24,999 | 40 (6.3%) | 0 (0.0%) |
| $25,000 to $34,999 | 27 (4.3%) | 45 (2.0%) |
| $35,000 to $49,999 | 29 (4.6%) | 67 (2.9%) |
| $50,000 to $74,999 | 126 (19.9%) | 202 (8.9%) |
| $75,000 to $99,999 | 79 (12.5%) | 222 (9.8%) |
| $100,000 to $149,999 | 69 (10.9%) | 122 (5.4%) |
| $150,000 or more | 248 (39.2%) | 538 (23.7%) |
| Total | 632 (100.0%) | 2,270 (100.0%) |
Property Value to Household Income Ratio in North Kensington
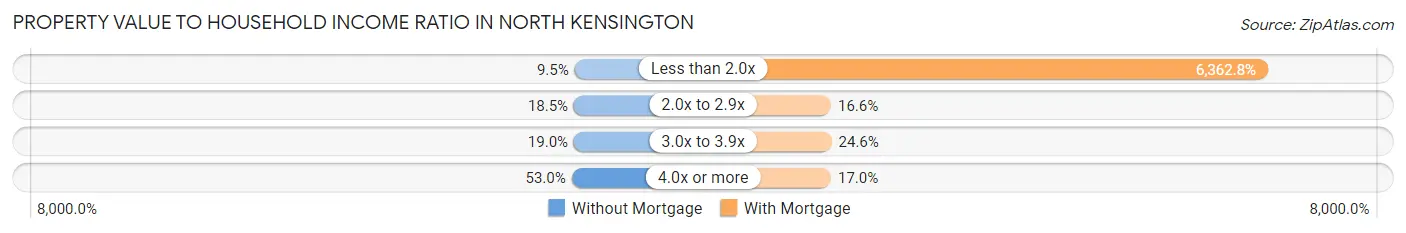
| Value-to-Income Ratio | Without Mortgage | With Mortgage |
| Less than 2.0x | 60 (9.5%) | 144,435 (6,362.8%) |
| 2.0x to 2.9x | 117 (18.5%) | 377 (16.6%) |
| 3.0x to 3.9x | 120 (19.0%) | 558 (24.6%) |
| 4.0x or more | 335 (53.0%) | 385 (17.0%) |
| Total | 632 (100.0%) | 2,270 (100.0%) |
Real Estate Taxes by Mortgage Status in North Kensington
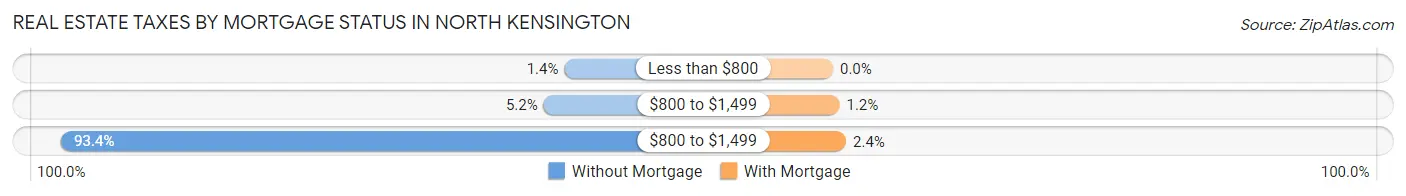
| Property Taxes | Without Mortgage | With Mortgage |
| Less than $800 | 9 (1.4%) | 0 (0.0%) |
| $800 to $1,499 | 33 (5.2%) | 27 (1.2%) |
| $800 to $1,499 | 590 (93.3%) | 54 (2.4%) |
| Total | 632 (100.0%) | 2,270 (100.0%) |
Health & Disability in North Kensington
Health Insurance Coverage by Age in North Kensington
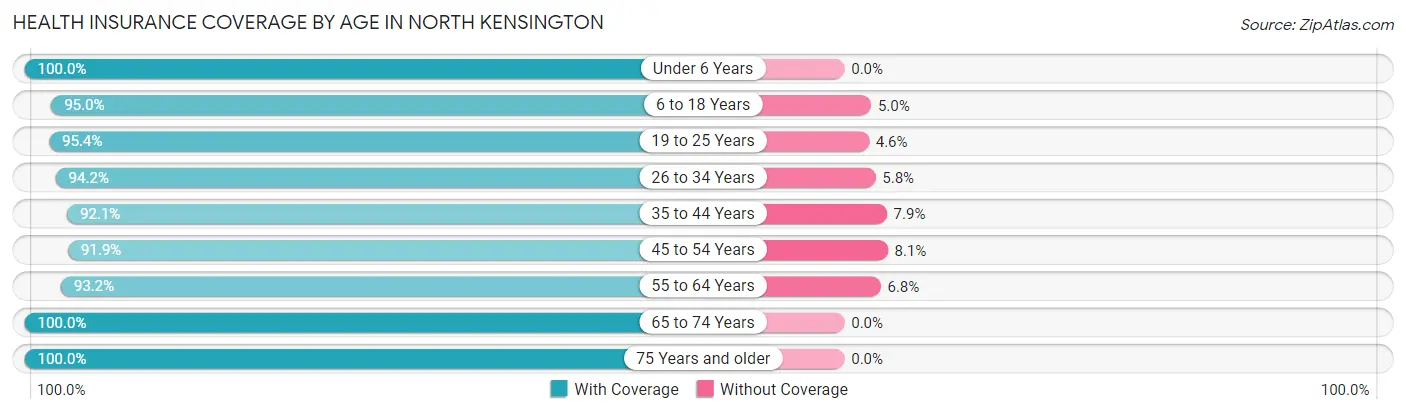
| Age Bracket | With Coverage | Without Coverage |
| Under 6 Years | 621 (100.0%) | 0 (0.0%) |
| 6 to 18 Years | 1,070 (95.0%) | 56 (5.0%) |
| 19 to 25 Years | 376 (95.4%) | 18 (4.6%) |
| 26 to 34 Years | 846 (94.2%) | 52 (5.8%) |
| 35 to 44 Years | 1,247 (92.1%) | 107 (7.9%) |
| 45 to 54 Years | 967 (91.9%) | 85 (8.1%) |
| 55 to 64 Years | 1,173 (93.2%) | 85 (6.8%) |
| 65 to 74 Years | 927 (100.0%) | 0 (0.0%) |
| 75 Years and older | 617 (100.0%) | 0 (0.0%) |
| Total | 7,844 (95.1%) | 403 (4.9%) |
Health Insurance Coverage by Citizenship Status in North Kensington
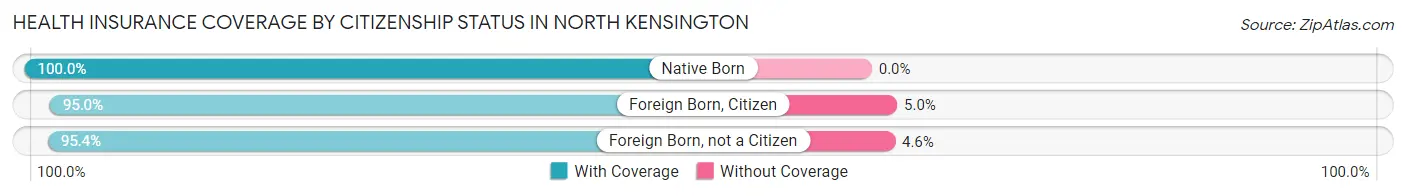
| Citizenship Status | With Coverage | Without Coverage |
| Native Born | 621 (100.0%) | 0 (0.0%) |
| Foreign Born, Citizen | 1,070 (95.0%) | 56 (5.0%) |
| Foreign Born, not a Citizen | 376 (95.4%) | 18 (4.6%) |
Health Insurance Coverage by Household Income in North Kensington
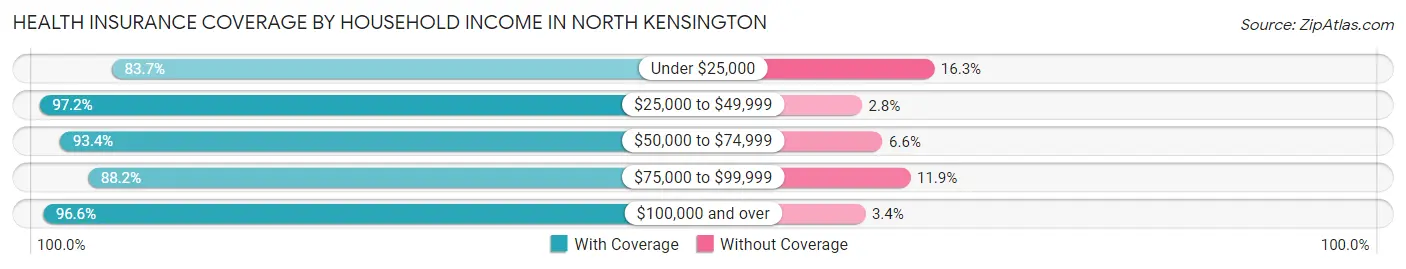
| Household Income | With Coverage | Without Coverage |
| Under $25,000 | 241 (83.7%) | 47 (16.3%) |
| $25,000 to $49,999 | 953 (97.2%) | 27 (2.8%) |
| $50,000 to $74,999 | 564 (93.4%) | 40 (6.6%) |
| $75,000 to $99,999 | 751 (88.1%) | 101 (11.8%) |
| $100,000 and over | 5,328 (96.6%) | 188 (3.4%) |
Public vs Private Health Insurance Coverage by Age in North Kensington
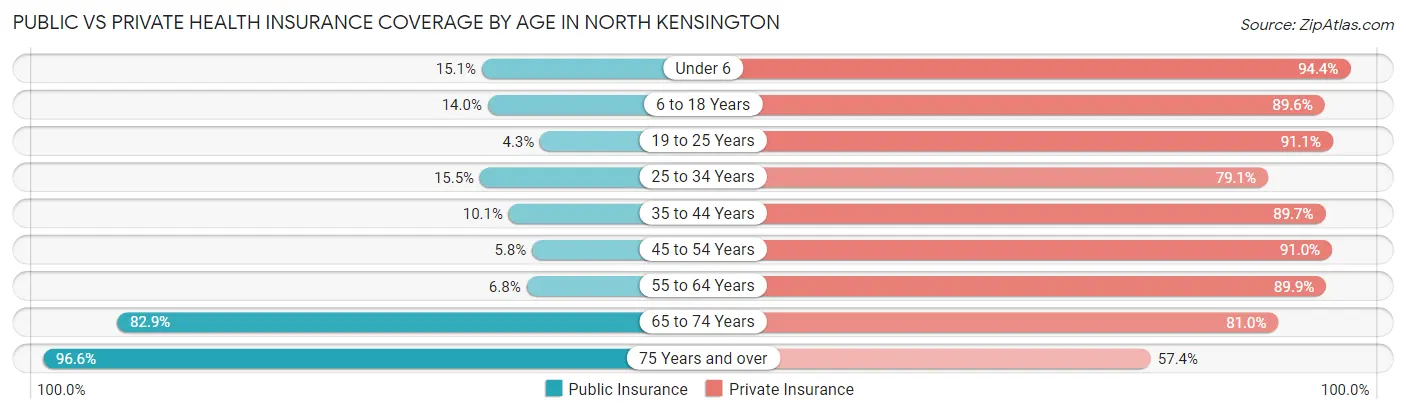
| Age Bracket | Public Insurance | Private Insurance |
| Under 6 | 94 (15.1%) | 586 (94.4%) |
| 6 to 18 Years | 158 (14.0%) | 1,009 (89.6%) |
| 19 to 25 Years | 17 (4.3%) | 359 (91.1%) |
| 25 to 34 Years | 139 (15.5%) | 710 (79.1%) |
| 35 to 44 Years | 137 (10.1%) | 1,215 (89.7%) |
| 45 to 54 Years | 61 (5.8%) | 957 (91.0%) |
| 55 to 64 Years | 86 (6.8%) | 1,131 (89.9%) |
| 65 to 74 Years | 768 (82.9%) | 751 (81.0%) |
| 75 Years and over | 596 (96.6%) | 354 (57.4%) |
| Total | 2,056 (24.9%) | 7,072 (85.8%) |
Disability Status by Sex by Age in North Kensington
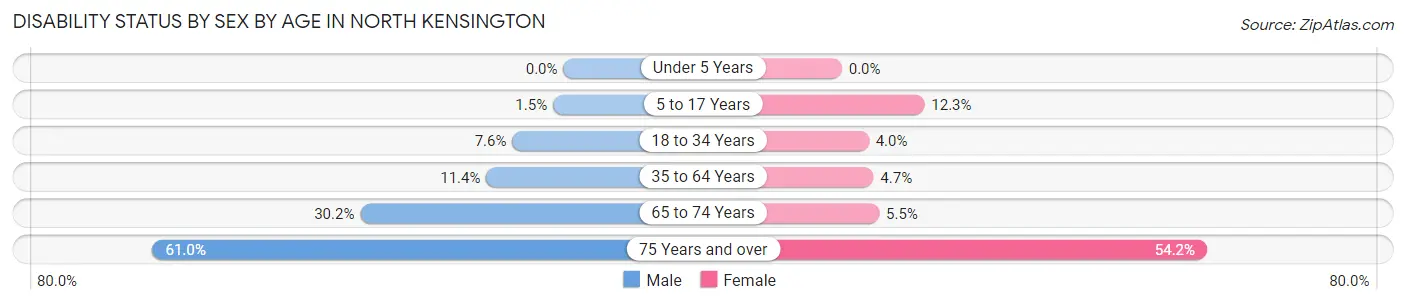
| Age Bracket | Male | Female |
| Under 5 Years | 0 (0.0%) | 0 (0.0%) |
| 5 to 17 Years | 9 (1.5%) | 65 (12.3%) |
| 18 to 34 Years | 54 (7.6%) | 27 (4.0%) |
| 35 to 64 Years | 197 (11.4%) | 91 (4.7%) |
| 65 to 74 Years | 149 (30.2%) | 24 (5.5%) |
| 75 Years and over | 86 (61.0%) | 258 (54.2%) |
Disability Class by Sex by Age in North Kensington
Disability Class: Hearing Difficulty
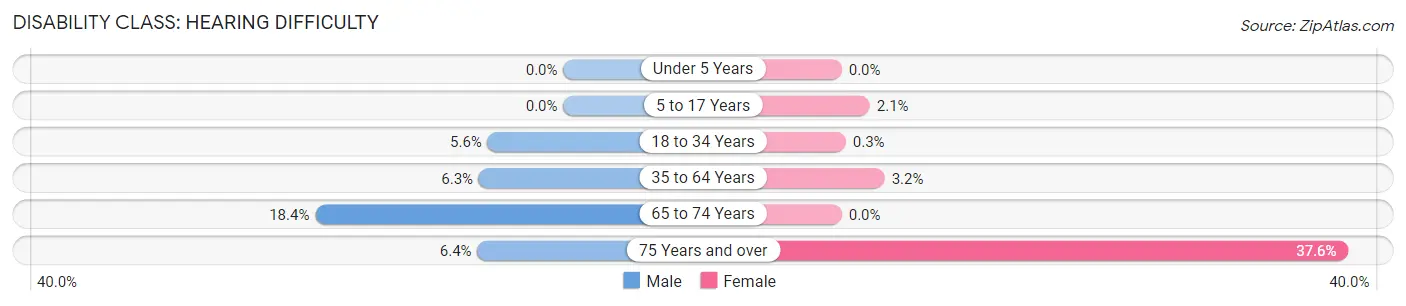
| Age Bracket | Male | Female |
| Under 5 Years | 0 (0.0%) | 0 (0.0%) |
| 5 to 17 Years | 0 (0.0%) | 11 (2.1%) |
| 18 to 34 Years | 40 (5.6%) | 2 (0.3%) |
| 35 to 64 Years | 108 (6.3%) | 62 (3.2%) |
| 65 to 74 Years | 91 (18.4%) | 0 (0.0%) |
| 75 Years and over | 9 (6.4%) | 179 (37.6%) |
Disability Class: Vision Difficulty
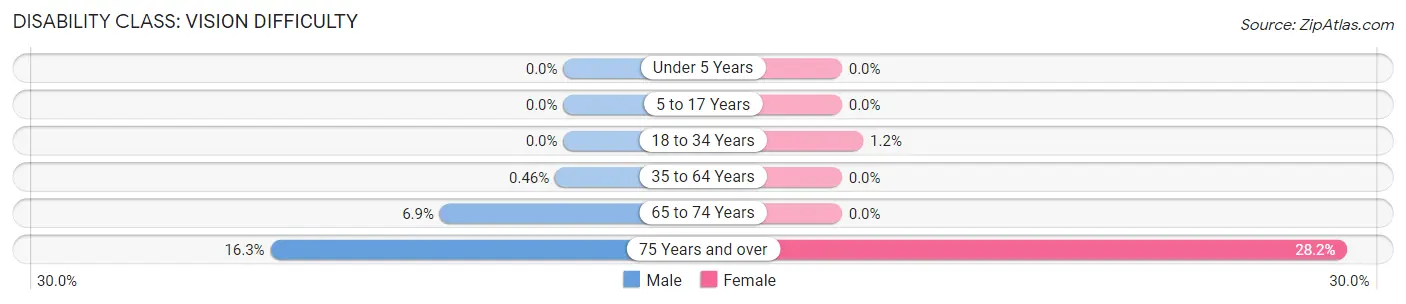
| Age Bracket | Male | Female |
| Under 5 Years | 0 (0.0%) | 0 (0.0%) |
| 5 to 17 Years | 0 (0.0%) | 0 (0.0%) |
| 18 to 34 Years | 0 (0.0%) | 8 (1.2%) |
| 35 to 64 Years | 8 (0.5%) | 0 (0.0%) |
| 65 to 74 Years | 34 (6.9%) | 0 (0.0%) |
| 75 Years and over | 23 (16.3%) | 134 (28.1%) |
Disability Class: Cognitive Difficulty
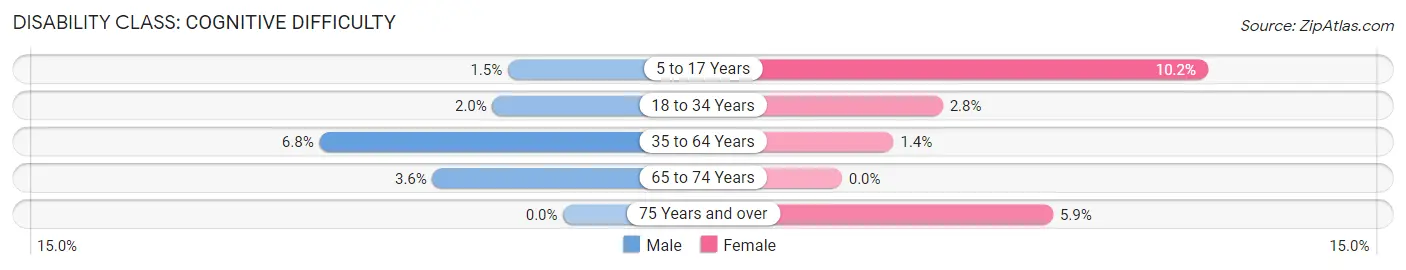
| Age Bracket | Male | Female |
| 5 to 17 Years | 9 (1.5%) | 54 (10.2%) |
| 18 to 34 Years | 14 (2.0%) | 19 (2.8%) |
| 35 to 64 Years | 117 (6.8%) | 28 (1.4%) |
| 65 to 74 Years | 18 (3.6%) | 0 (0.0%) |
| 75 Years and over | 0 (0.0%) | 28 (5.9%) |
Disability Class: Ambulatory Difficulty
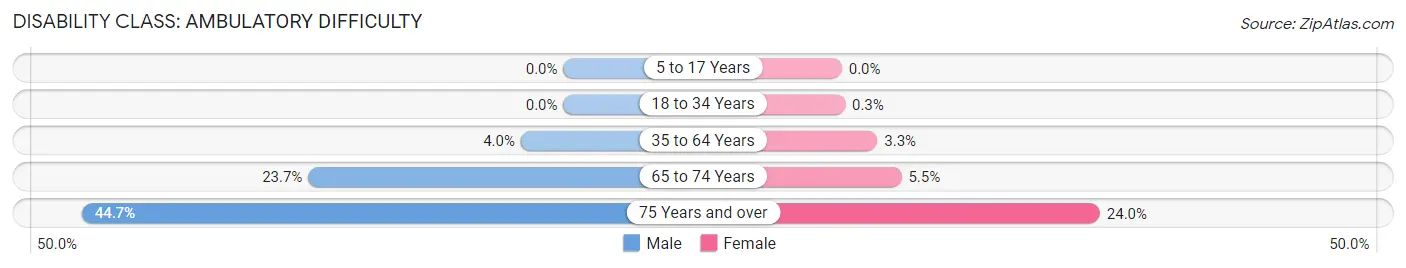
| Age Bracket | Male | Female |
| 5 to 17 Years | 0 (0.0%) | 0 (0.0%) |
| 18 to 34 Years | 0 (0.0%) | 2 (0.3%) |
| 35 to 64 Years | 68 (4.0%) | 64 (3.3%) |
| 65 to 74 Years | 117 (23.7%) | 24 (5.5%) |
| 75 Years and over | 63 (44.7%) | 114 (23.9%) |
Disability Class: Self-Care Difficulty
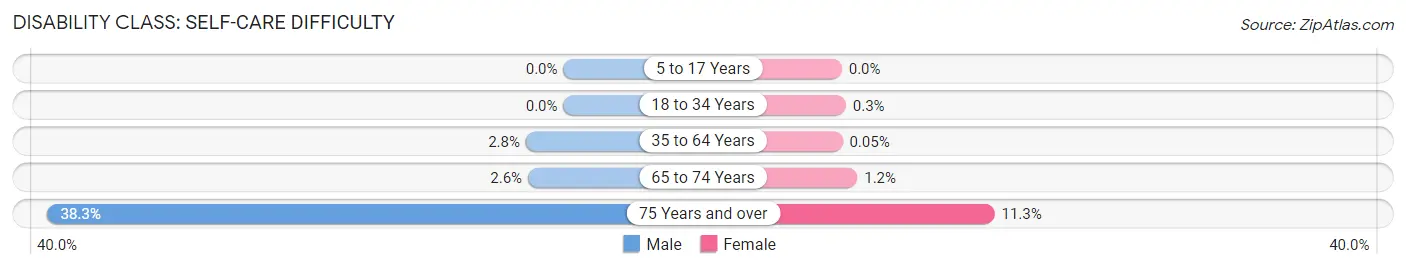
| Age Bracket | Male | Female |
| 5 to 17 Years | 0 (0.0%) | 0 (0.0%) |
| 18 to 34 Years | 0 (0.0%) | 2 (0.3%) |
| 35 to 64 Years | 48 (2.8%) | 1 (0.1%) |
| 65 to 74 Years | 13 (2.6%) | 5 (1.1%) |
| 75 Years and over | 54 (38.3%) | 54 (11.3%) |
Technology Access in North Kensington
Computing Device Access in North Kensington
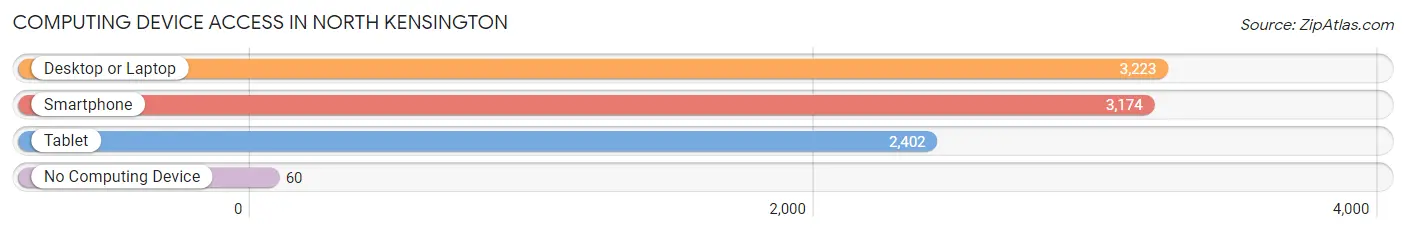
| Device Type | # Households | % Households |
| Desktop or Laptop | 3,223 | 92.2% |
| Smartphone | 3,174 | 90.8% |
| Tablet | 2,402 | 68.8% |
| No Computing Device | 60 | 1.7% |
| Total | 3,494 | 100.0% |
Internet Access in North Kensington
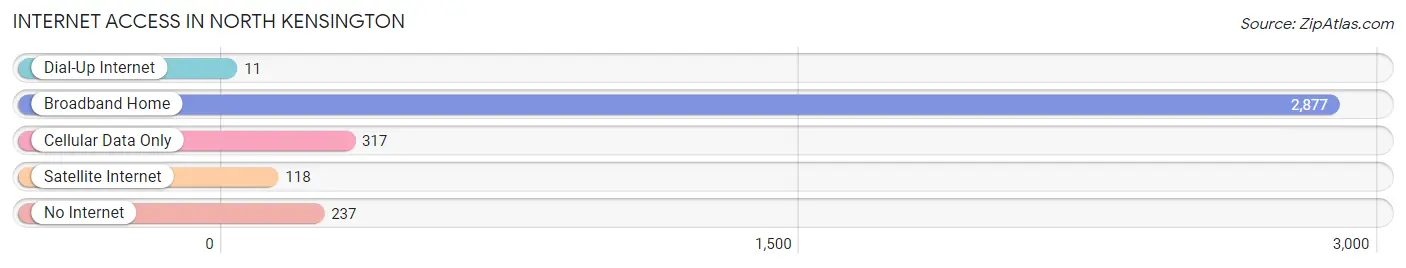
| Internet Type | # Households | % Households |
| Dial-Up Internet | 11 | 0.3% |
| Broadband Home | 2,877 | 82.3% |
| Cellular Data Only | 317 | 9.1% |
| Satellite Internet | 118 | 3.4% |
| No Internet | 237 | 6.8% |
| Total | 3,494 | 100.0% |
North Kensington Summary
North Kensington is a small, unincorporated community located in Montgomery County, Maryland. It is situated in the northern part of the county, just south of the Potomac River and is bordered by the towns of Rockville, Gaithersburg, and Germantown. The community is home to a diverse population of approximately 4,000 people, and is known for its small-town charm and close-knit community.
History
North Kensington was first settled in the late 1700s by German and English immigrants. The area was originally known as “Kensington” and was part of a larger tract of land known as “The Manor of North Kensington.” The area was primarily used for farming and was home to a number of small businesses, including a blacksmith shop, a general store, and a post office.
In the late 1800s, the area began to experience rapid growth as the Washington, D.C. metropolitan area expanded. The area was annexed by the City of Rockville in 1892 and was officially incorporated as the Town of North Kensington in 1895.
Geography
North Kensington is located in the northern part of Montgomery County, Maryland. It is bordered by the towns of Rockville, Gaithersburg, and Germantown. The community is situated on a plateau, with an elevation of approximately 500 feet above sea level. The area is characterized by rolling hills and wooded areas, with a number of small streams and creeks running through the area.
Economy
North Kensington is primarily a residential community, with a small commercial district located along the main thoroughfare of Rockville Pike. The area is home to a number of small businesses, including restaurants, retail stores, and professional services. The community is also home to a number of corporate offices, including the headquarters of the National Institutes of Health and the National Institute of Standards and Technology.
Demographics
As of the 2010 census, North Kensington had a population of 4,000 people. The racial makeup of the community was 79.3% White, 11.2% African American, 4.2% Asian, and 5.3% Hispanic or Latino. The median household income was $90,000, and the median home value was $400,000.
North Kensington is a diverse community, with a variety of cultures and backgrounds represented. The area is home to a number of churches, synagogues, and mosques, as well as a variety of cultural and recreational activities. The community is served by the Montgomery County Public Schools system, and is home to a number of private schools.
Common Questions
What is Per Capita Income in North Kensington?
Per Capita income in North Kensington is $64,175.
What is the Median Family Income in North Kensington?
Median Family Income in North Kensington is $144,821.
What is the Median Household income in North Kensington?
Median Household Income in North Kensington is $122,838.
What is Income or Wage Gap in North Kensington?
Income or Wage Gap in North Kensington is 8.1%.
Women in North Kensington earn 91.9 cents for every dollar earned by a man.
What is Inequality or Gini Index in North Kensington?
Inequality or Gini Index in North Kensington is 0.43.
What is the Total Population of North Kensington?
Total Population of North Kensington is 8,473.
What is the Total Male Population of North Kensington?
Total Male Population of North Kensington is 4,022.
What is the Total Female Population of North Kensington?
Total Female Population of North Kensington is 4,451.
What is the Ratio of Males per 100 Females in North Kensington?
There are 90.36 Males per 100 Females in North Kensington.
What is the Ratio of Females per 100 Males in North Kensington?
There are 110.67 Females per 100 Males in North Kensington.
What is the Median Population Age in North Kensington?
Median Population Age in North Kensington is 42.9 Years.
What is the Average Family Size in North Kensington
Average Family Size in North Kensington is 3.0 People.
What is the Average Household Size in North Kensington
Average Household Size in North Kensington is 2.4 People.
How Large is the Labor Force in North Kensington?
There are 5,107 People in the Labor Forcein in North Kensington.
What is the Percentage of People in the Labor Force in North Kensington?
73.4% of People are in the Labor Force in North Kensington.
What is the Unemployment Rate in North Kensington?
Unemployment Rate in North Kensington is 2.6%.