Barrington, IL Map & Demographics
Barrington Map
Barrington Overview
$73,446
PER CAPITA INCOME
$191,897
AVG FAMILY INCOME
$160,171
AVG HOUSEHOLD INCOME
48.8%
WAGE / INCOME GAP [ % ]
51.2¢/ $1
WAGE / INCOME GAP [ $ ]
0.47
INEQUALITY / GINI INDEX
11,244
TOTAL POPULATION
5,296
MALE POPULATION
5,948
FEMALE POPULATION
89.04
MALES / 100 FEMALES
112.31
FEMALES / 100 MALES
42.4
MEDIAN AGE
3.1
AVG FAMILY SIZE
2.6
AVG HOUSEHOLD SIZE
4,960
LABOR FORCE [ PEOPLE ]
59.4%
PERCENT IN LABOR FORCE
3.9%
UNEMPLOYMENT RATE
Barrington Zip Codes
Income in Barrington
Income Overview in Barrington
Per Capita Income in Barrington is $73,446, while median incomes of families and households are $191,897 and $160,171 respectively.
| Characteristic | Number | Measure |
| Per Capita Income | 11,244 | $73,446 |
| Median Family Income | 3,204 | $191,897 |
| Mean Family Income | 3,204 | $230,078 |
| Median Household Income | 4,265 | $160,171 |
| Mean Household Income | 4,265 | $191,841 |
| Income Deficit | 3,204 | $0 |
| Wage / Income Gap (%) | 11,244 | 48.81% |
| Wage / Income Gap ($) | 11,244 | 51.19¢ per $1 |
| Gini / Inequality Index | 11,244 | 0.47 |
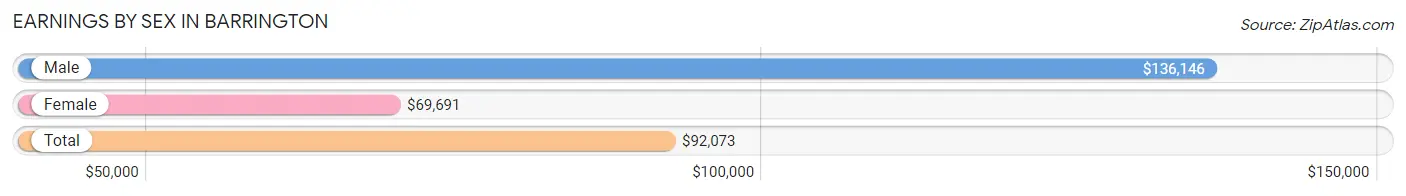
Earnings by Sex in Barrington
Average Earnings in Barrington are $92,073, $136,146 for men and $69,691 for women, a difference of 48.8%.
| Sex | Number | Average Earnings |
| Male | 2,885 (53.5%) | $136,146 |
| Female | 2,511 (46.5%) | $69,691 |
| Total | 5,396 (100.0%) | $92,073 |
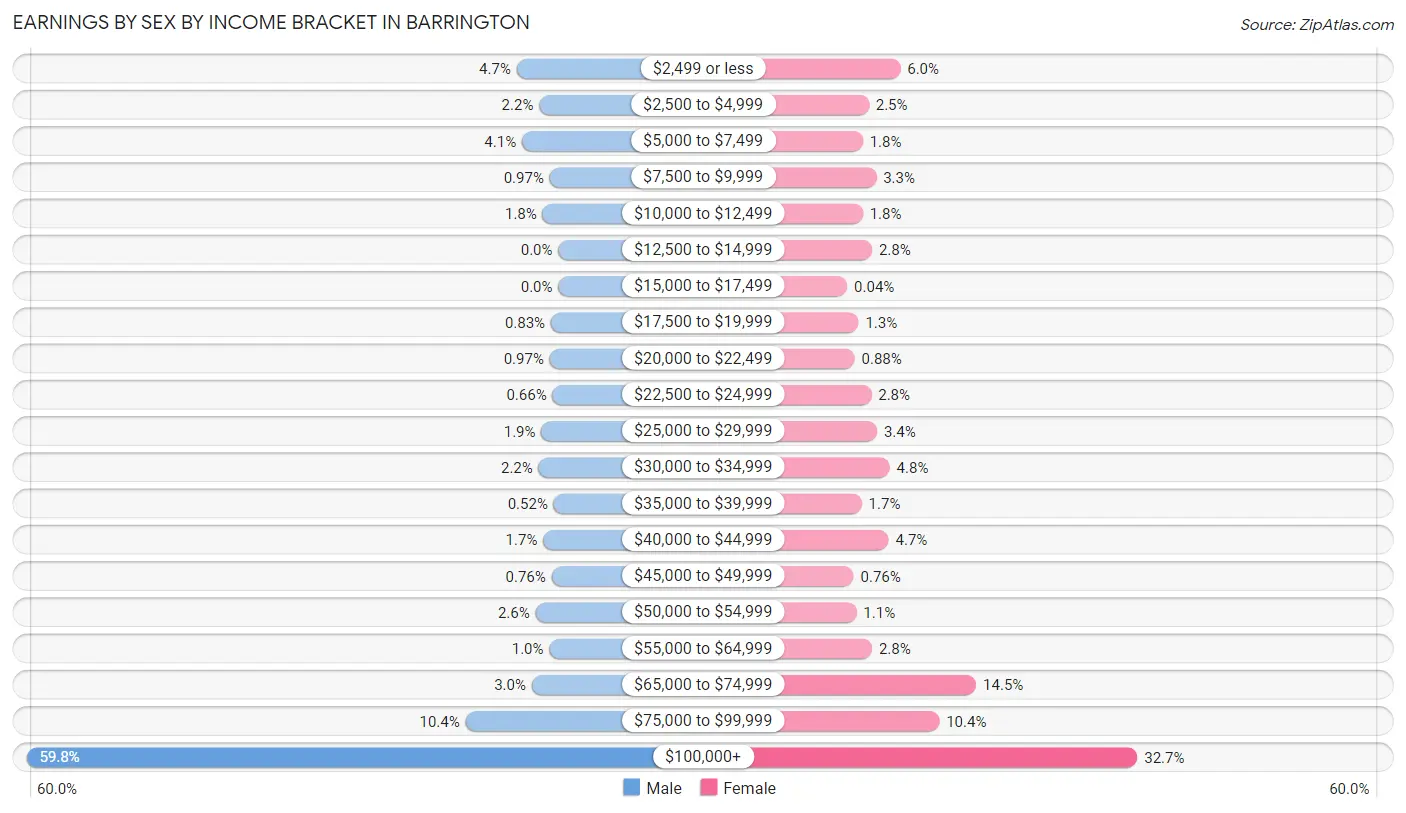
Earnings by Sex by Income Bracket in Barrington
The most common earnings brackets in Barrington are $100,000+ for men (1,725 | 59.8%) and $100,000+ for women (820 | 32.7%).
| Income | Male | Female |
| $2,499 or less | 135 (4.7%) | 151 (6.0%) |
| $2,500 to $4,999 | 62 (2.1%) | 62 (2.5%) |
| $5,000 to $7,499 | 118 (4.1%) | 45 (1.8%) |
| $7,500 to $9,999 | 28 (1.0%) | 83 (3.3%) |
| $10,000 to $12,499 | 51 (1.8%) | 45 (1.8%) |
| $12,500 to $14,999 | 0 (0.0%) | 71 (2.8%) |
| $15,000 to $17,499 | 0 (0.0%) | 1 (0.0%) |
| $17,500 to $19,999 | 24 (0.8%) | 33 (1.3%) |
| $20,000 to $22,499 | 28 (1.0%) | 22 (0.9%) |
| $22,500 to $24,999 | 19 (0.7%) | 69 (2.8%) |
| $25,000 to $29,999 | 55 (1.9%) | 85 (3.4%) |
| $30,000 to $34,999 | 64 (2.2%) | 121 (4.8%) |
| $35,000 to $39,999 | 15 (0.5%) | 42 (1.7%) |
| $40,000 to $44,999 | 49 (1.7%) | 118 (4.7%) |
| $45,000 to $49,999 | 22 (0.8%) | 19 (0.8%) |
| $50,000 to $54,999 | 74 (2.6%) | 27 (1.1%) |
| $55,000 to $64,999 | 29 (1.0%) | 71 (2.8%) |
| $65,000 to $74,999 | 86 (3.0%) | 365 (14.5%) |
| $75,000 to $99,999 | 301 (10.4%) | 261 (10.4%) |
| $100,000+ | 1,725 (59.8%) | 820 (32.7%) |
| Total | 2,885 (100.0%) | 2,511 (100.0%) |
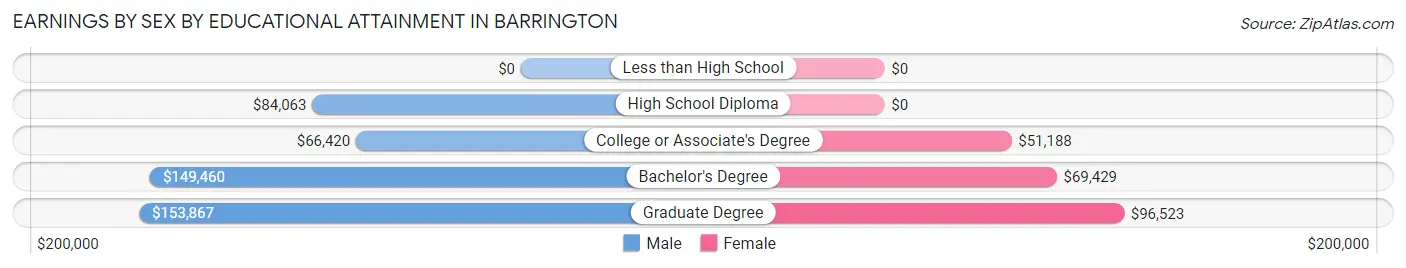
Earnings by Sex by Educational Attainment in Barrington
Average earnings in Barrington are $142,076 for men and $71,173 for women, a difference of 49.9%. Men with an educational attainment of graduate degree enjoy the highest average annual earnings of $153,867, while those with college or associate's degree education earn the least with $66,420. Women with an educational attainment of graduate degree earn the most with the average annual earnings of $96,523, while those with college or associate's degree education have the smallest earnings of $51,188.
| Educational Attainment | Male Income | Female Income |
| Less than High School | - | - |
| High School Diploma | $84,063 | $0 |
| College or Associate's Degree | $66,420 | $51,188 |
| Bachelor's Degree | $149,460 | $69,429 |
| Graduate Degree | $153,867 | $96,523 |
| Total | $142,076 | $71,173 |
Family Income in Barrington
Family Income Brackets in Barrington
According to the Barrington family income data, there are 1,573 families falling into the $200,000+ income range, which is the most common income bracket and makes up 49.1% of all families. Conversely, the $10,000 to $14,999 income bracket is the least frequent group with only 16 families (0.5%) belonging to this category.
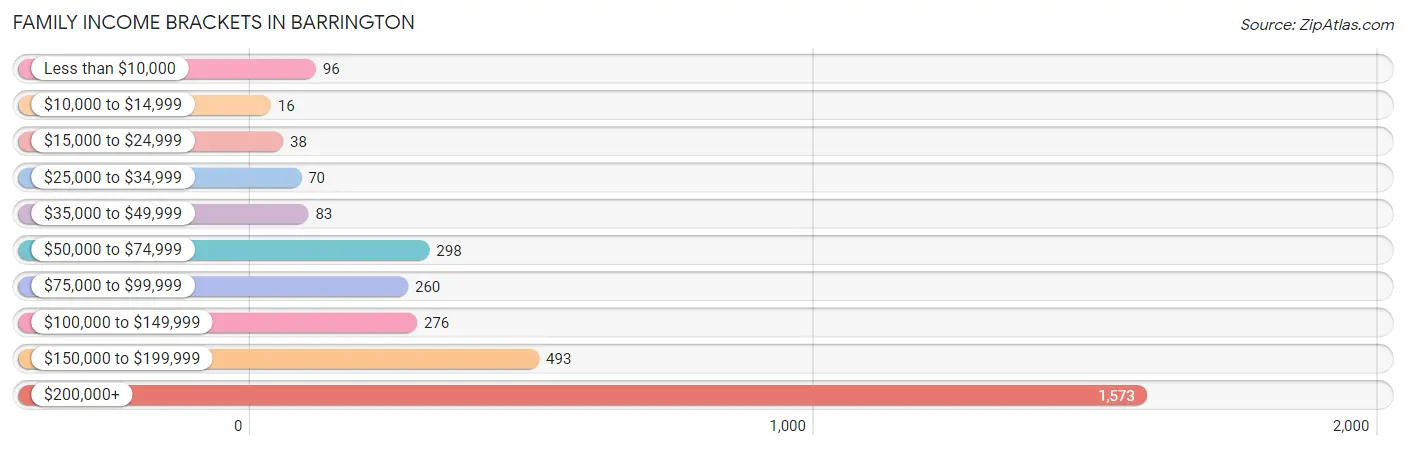
| Income Bracket | # Families | % Families |
| Less than $10,000 | 96 | 3.0% |
| $10,000 to $14,999 | 16 | 0.5% |
| $15,000 to $24,999 | 38 | 1.2% |
| $25,000 to $34,999 | 70 | 2.2% |
| $35,000 to $49,999 | 83 | 2.6% |
| $50,000 to $74,999 | 298 | 9.3% |
| $75,000 to $99,999 | 260 | 8.1% |
| $100,000 to $149,999 | 276 | 8.6% |
| $150,000 to $199,999 | 493 | 15.4% |
| $200,000+ | 1,573 | 49.1% |
Family Income by Famaliy Size in Barrington
4-person families (754 | 23.5%) account for the highest median family income in Barrington with $250,001 per family, while 2-person families (1,515 | 47.3%) have the highest median income of $68,914 per family member.
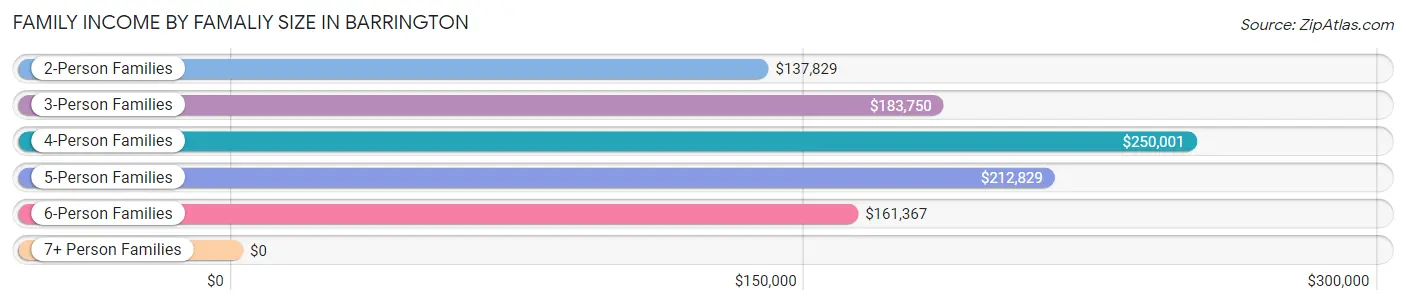
| Income Bracket | # Families | Median Income |
| 2-Person Families | 1,515 (47.3%) | $137,829 |
| 3-Person Families | 540 (16.9%) | $183,750 |
| 4-Person Families | 754 (23.5%) | $250,001 |
| 5-Person Families | 295 (9.2%) | $212,829 |
| 6-Person Families | 84 (2.6%) | $161,367 |
| 7+ Person Families | 16 (0.5%) | $0 |
| Total | 3,204 (100.0%) | $191,897 |
Family Income by Number of Earners in Barrington
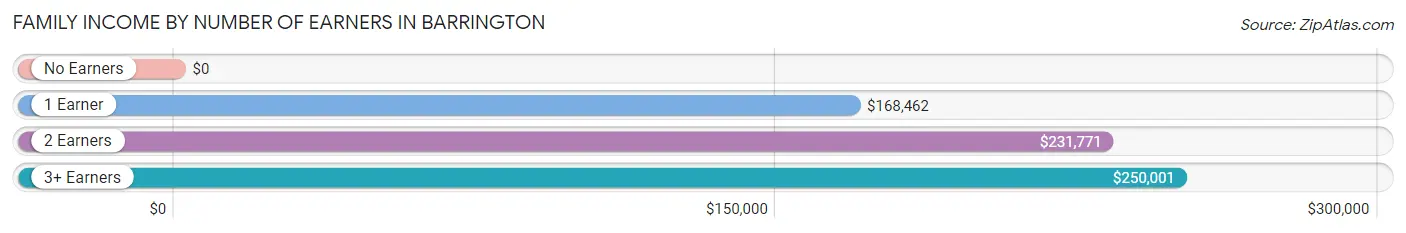
| Number of Earners | # Families | Median Income |
| No Earners | 367 (11.5%) | $0 |
| 1 Earner | 1,176 (36.7%) | $168,462 |
| 2 Earners | 1,450 (45.3%) | $231,771 |
| 3+ Earners | 211 (6.6%) | $250,001 |
| Total | 3,204 (100.0%) | $191,897 |
Household Income in Barrington
Household Income Brackets in Barrington
With 1,625 households falling in the category, the $200,000+ income range is the most frequent in Barrington, accounting for 38.1% of all households. In contrast, only 21 households (0.5%) fall into the $10,000 to $14,999 income bracket, making it the least populous group.
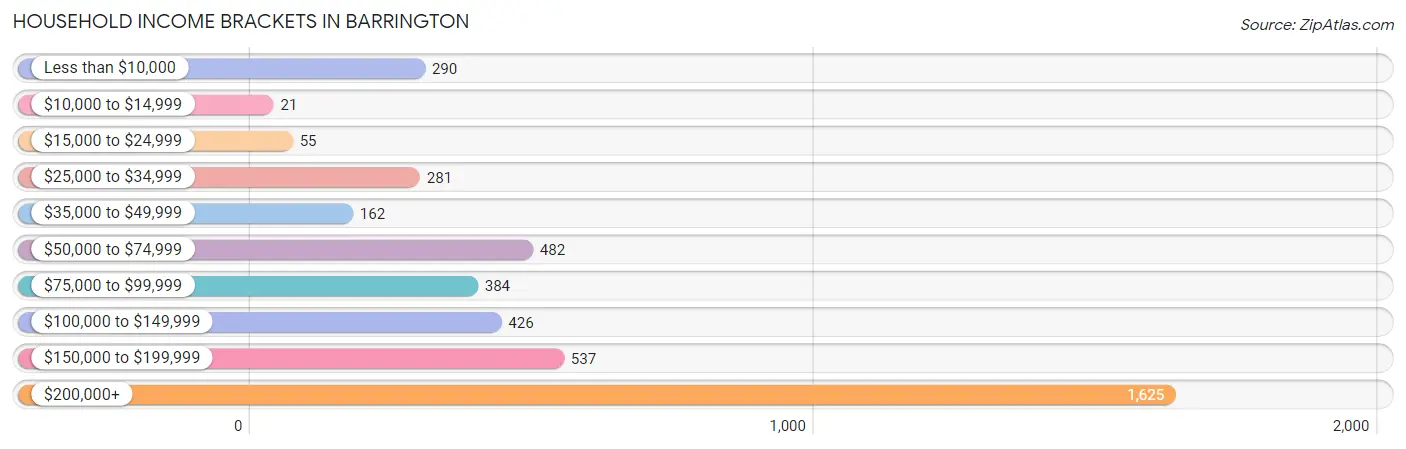
| Income Bracket | # Households | % Households |
| Less than $10,000 | 290 | 6.8% |
| $10,000 to $14,999 | 21 | 0.5% |
| $15,000 to $24,999 | 55 | 1.3% |
| $25,000 to $34,999 | 281 | 6.6% |
| $35,000 to $49,999 | 162 | 3.8% |
| $50,000 to $74,999 | 482 | 11.3% |
| $75,000 to $99,999 | 384 | 9.0% |
| $100,000 to $149,999 | 426 | 10.0% |
| $150,000 to $199,999 | 537 | 12.6% |
| $200,000+ | 1,625 | 38.1% |
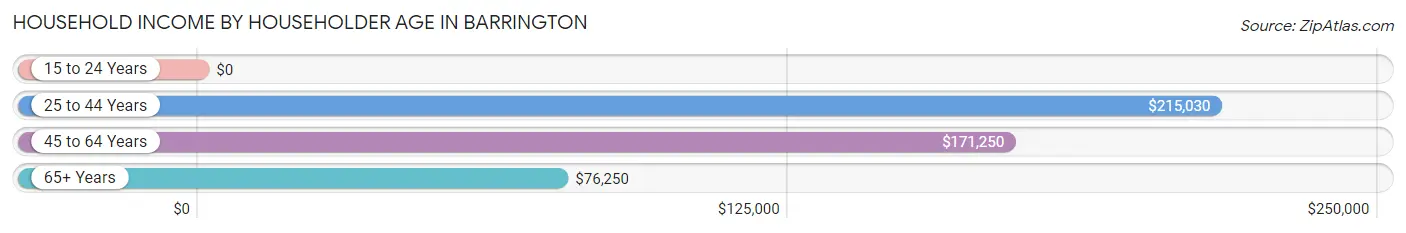
Household Income by Householder Age in Barrington
The median household income in Barrington is $160,171, with the highest median household income of $215,030 found in the 25 to 44 years age bracket for the primary householder. A total of 1,157 households (27.1%) fall into this category.
| Income Bracket | # Households | Median Income |
| 15 to 24 Years | 0 (0.0%) | $0 |
| 25 to 44 Years | 1,157 (27.1%) | $215,030 |
| 45 to 64 Years | 1,849 (43.3%) | $171,250 |
| 65+ Years | 1,259 (29.5%) | $76,250 |
| Total | 4,265 (100.0%) | $160,171 |
Poverty in Barrington
Income Below Poverty by Sex and Age in Barrington
With 5.4% poverty level for males and 5.0% for females among the residents of Barrington, 75 year old and over males and 75 year old and over females are the most vulnerable to poverty, with 98 males (21.9%) and 178 females (29.7%) in their respective age groups living below the poverty level.
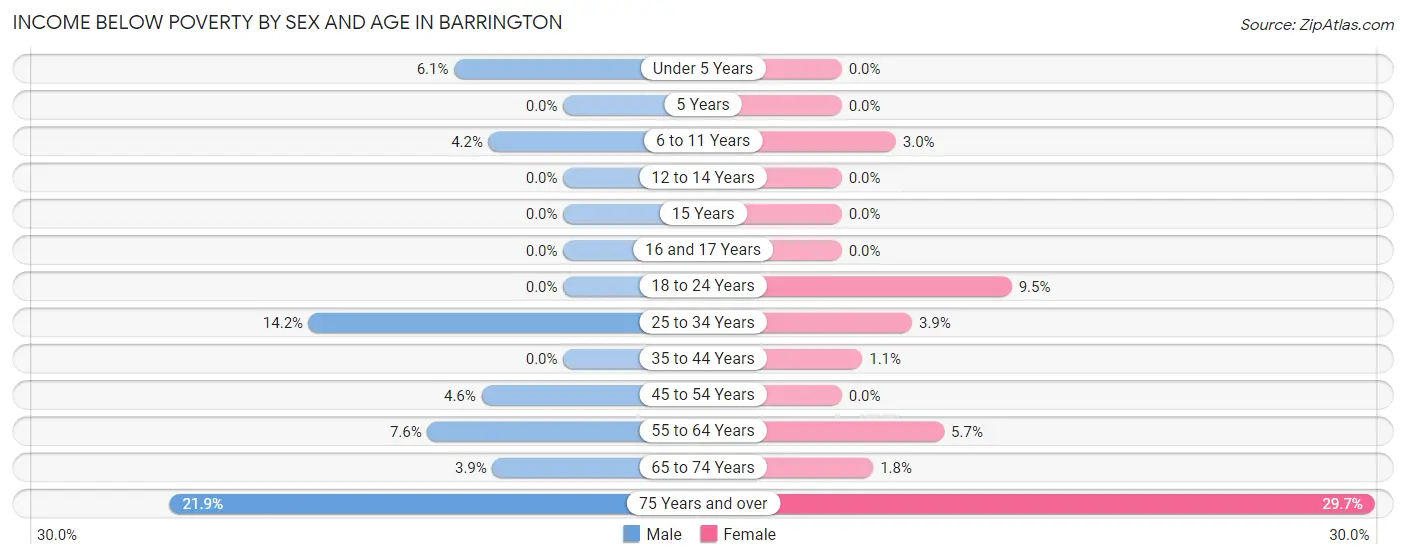
| Age Bracket | Male | Female |
| Under 5 Years | 15 (6.1%) | 0 (0.0%) |
| 5 Years | 0 (0.0%) | 0 (0.0%) |
| 6 to 11 Years | 32 (4.2%) | 18 (3.0%) |
| 12 to 14 Years | 0 (0.0%) | 0 (0.0%) |
| 15 Years | 0 (0.0%) | 0 (0.0%) |
| 16 and 17 Years | 0 (0.0%) | 0 (0.0%) |
| 18 to 24 Years | 0 (0.0%) | 21 (9.5%) |
| 25 to 34 Years | 34 (14.2%) | 14 (3.9%) |
| 35 to 44 Years | 0 (0.0%) | 10 (1.1%) |
| 45 to 54 Years | 28 (4.5%) | 0 (0.0%) |
| 55 to 64 Years | 63 (7.6%) | 34 (5.7%) |
| 65 to 74 Years | 16 (3.9%) | 11 (1.8%) |
| 75 Years and over | 98 (21.9%) | 178 (29.7%) |
| Total | 286 (5.4%) | 286 (5.0%) |
Income Above Poverty by Sex and Age in Barrington
According to the poverty statistics in Barrington, males aged 5 years and females aged under 5 years are the age groups that are most secure financially, with 100.0% of males and 100.0% of females in these age groups living above the poverty line.
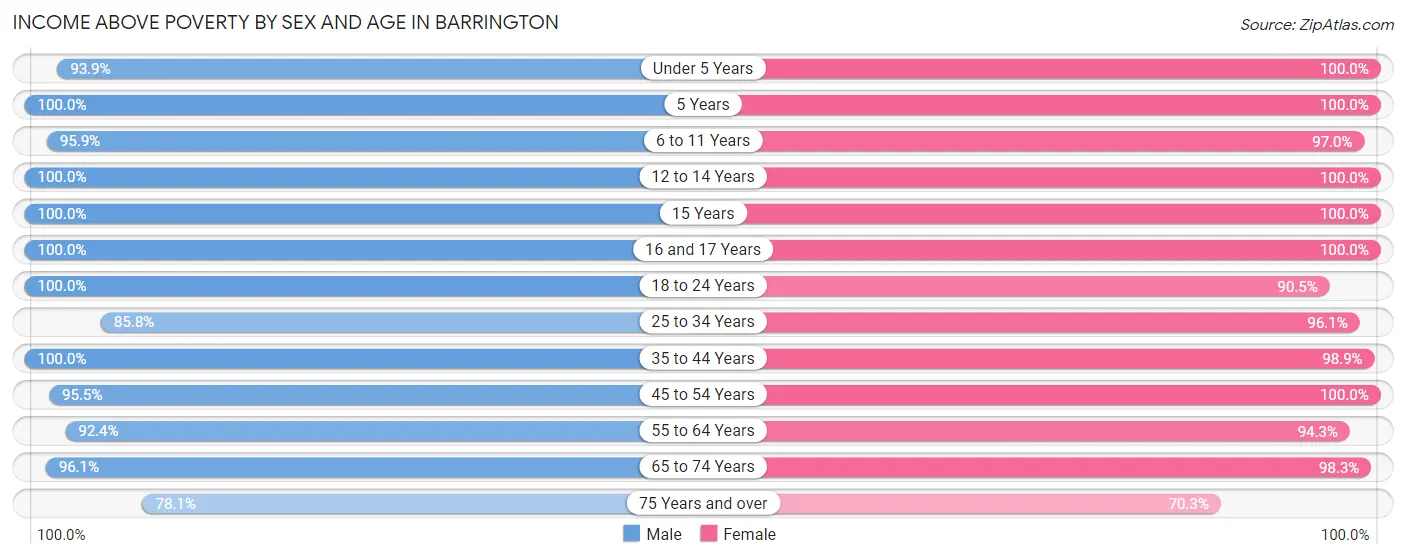
| Age Bracket | Male | Female |
| Under 5 Years | 232 (93.9%) | 269 (100.0%) |
| 5 Years | 50 (100.0%) | 68 (100.0%) |
| 6 to 11 Years | 740 (95.9%) | 580 (97.0%) |
| 12 to 14 Years | 294 (100.0%) | 367 (100.0%) |
| 15 Years | 93 (100.0%) | 135 (100.0%) |
| 16 and 17 Years | 168 (100.0%) | 188 (100.0%) |
| 18 to 24 Years | 237 (100.0%) | 201 (90.5%) |
| 25 to 34 Years | 206 (85.8%) | 344 (96.1%) |
| 35 to 44 Years | 872 (100.0%) | 868 (98.9%) |
| 45 to 54 Years | 588 (95.5%) | 861 (100.0%) |
| 55 to 64 Years | 770 (92.4%) | 562 (94.3%) |
| 65 to 74 Years | 390 (96.1%) | 616 (98.3%) |
| 75 Years and over | 349 (78.1%) | 422 (70.3%) |
| Total | 4,989 (94.6%) | 5,481 (95.0%) |
Income Below Poverty Among Married-Couple Families in Barrington
The poverty statistics for married-couple families in Barrington show that 3.5% or 91 of the total 2,595 families live below the poverty line. Families with no children have the highest poverty rate of 6.0%, comprising of 76 families. On the other hand, families with 1 or 2 children have the lowest poverty rate of 0.0%, which includes 0 families.
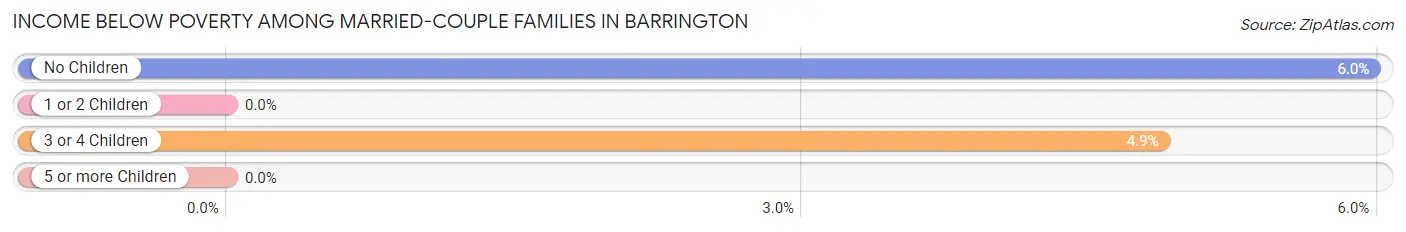
| Children | Above Poverty | Below Poverty |
| No Children | 1,196 (94.0%) | 76 (6.0%) |
| 1 or 2 Children | 999 (100.0%) | 0 (0.0%) |
| 3 or 4 Children | 293 (95.1%) | 15 (4.9%) |
| 5 or more Children | 16 (100.0%) | 0 (0.0%) |
| Total | 2,504 (96.5%) | 91 (3.5%) |
Income Below Poverty Among Single-Parent Households in Barrington
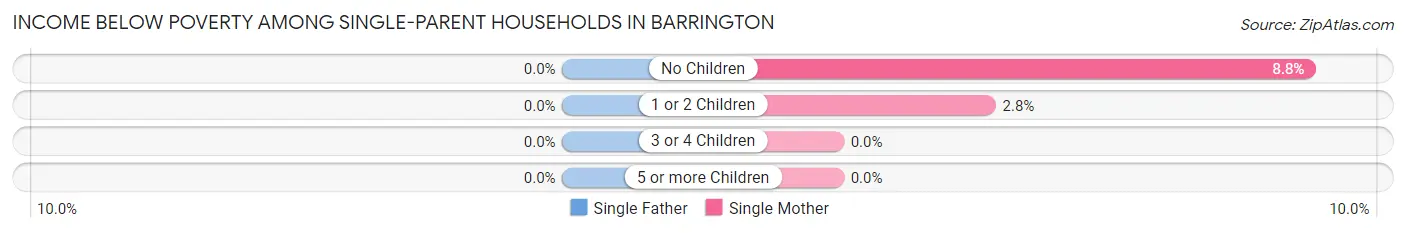
| Children | Single Father | Single Mother |
| No Children | 0 (0.0%) | 11 (8.8%) |
| 1 or 2 Children | 0 (0.0%) | 9 (2.8%) |
| 3 or 4 Children | 0 (0.0%) | 0 (0.0%) |
| 5 or more Children | 0 (0.0%) | 0 (0.0%) |
| Total | 0 (0.0%) | 20 (4.3%) |
Income Below Poverty Among Married-Couple vs Single-Parent Households in Barrington
The poverty data for Barrington shows that 91 of the married-couple family households (3.5%) and 20 of the single-parent households (3.3%) are living below the poverty level. Within the married-couple family households, those with no children have the highest poverty rate, with 76 households (6.0%) falling below the poverty line. Among the single-parent households, those with no children have the highest poverty rate, with 11 household (6.6%) living below poverty.
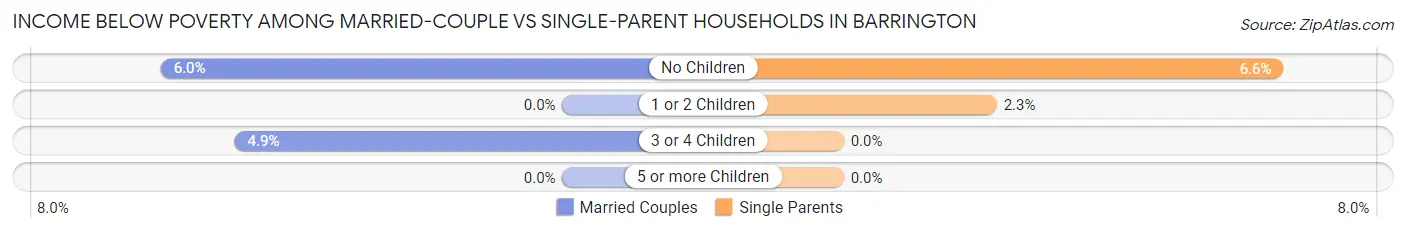
| Children | Married-Couple Families | Single-Parent Households |
| No Children | 76 (6.0%) | 11 (6.6%) |
| 1 or 2 Children | 0 (0.0%) | 9 (2.3%) |
| 3 or 4 Children | 15 (4.9%) | 0 (0.0%) |
| 5 or more Children | 0 (0.0%) | 0 (0.0%) |
| Total | 91 (3.5%) | 20 (3.3%) |
Race in Barrington
The most populous races in Barrington are White / Caucasian (9,612 | 85.5%), Asian (1,009 | 9.0%), and Two or more Races (333 | 3.0%).
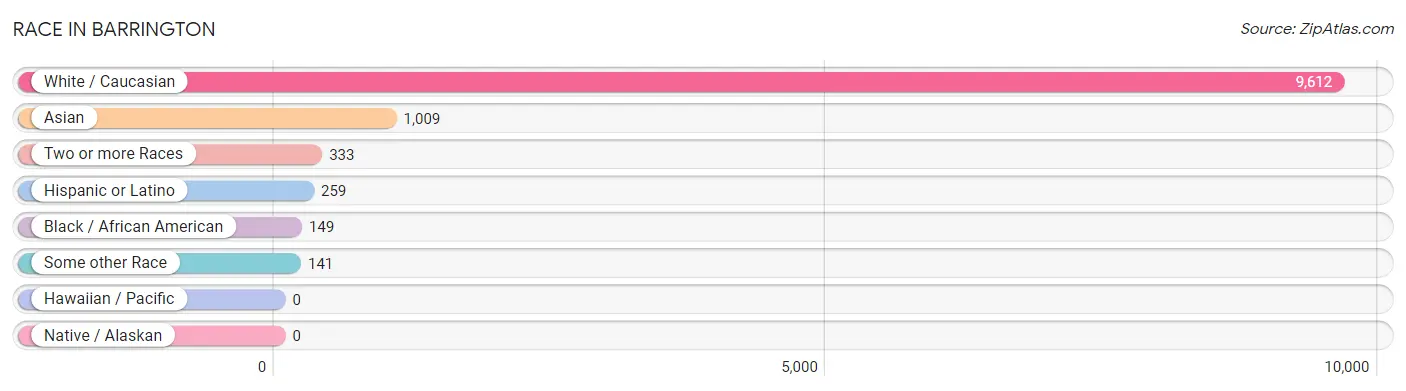
| Race | # Population | % Population |
| Asian | 1,009 | 9.0% |
| Black / African American | 149 | 1.3% |
| Hawaiian / Pacific | 0 | 0.0% |
| Hispanic or Latino | 259 | 2.3% |
| Native / Alaskan | 0 | 0.0% |
| White / Caucasian | 9,612 | 85.5% |
| Two or more Races | 333 | 3.0% |
| Some other Race | 141 | 1.3% |
| Total | 11,244 | 100.0% |
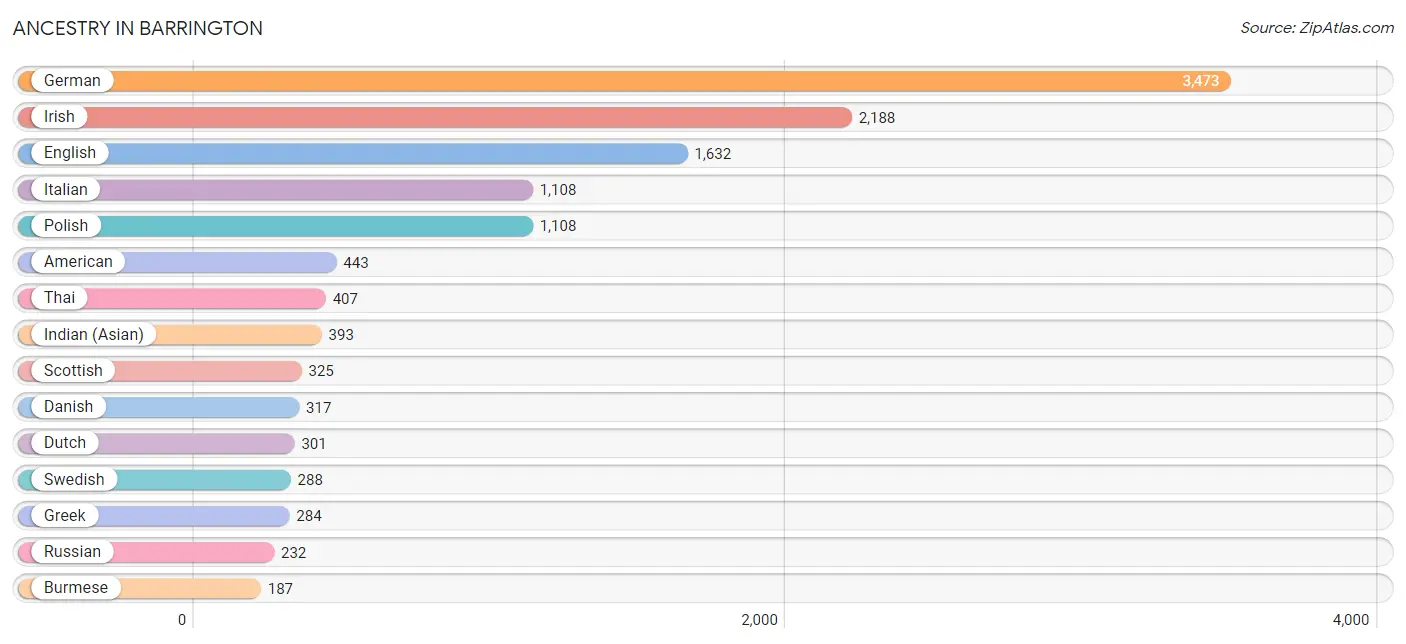
Ancestry in Barrington
The most populous ancestries reported in Barrington are German (3,473 | 30.9%), Irish (2,188 | 19.5%), English (1,632 | 14.5%), Italian (1,108 | 9.9%), and Polish (1,108 | 9.9%), together accounting for 84.6% of all Barrington residents.
| Ancestry | # Population | % Population |
| American | 443 | 3.9% |
| Armenian | 24 | 0.2% |
| Austrian | 67 | 0.6% |
| Belgian | 57 | 0.5% |
| Bhutanese | 13 | 0.1% |
| British | 108 | 1.0% |
| Burmese | 187 | 1.7% |
| Canadian | 27 | 0.2% |
| Carpatho Rusyn | 13 | 0.1% |
| Central American | 29 | 0.3% |
| Croatian | 103 | 0.9% |
| Cuban | 66 | 0.6% |
| Czech | 137 | 1.2% |
| Danish | 317 | 2.8% |
| Dutch | 301 | 2.7% |
| Eastern European | 87 | 0.8% |
| English | 1,632 | 14.5% |
| European | 183 | 1.6% |
| Filipino | 45 | 0.4% |
| Finnish | 40 | 0.4% |
| French | 83 | 0.7% |
| French Canadian | 23 | 0.2% |
| German | 3,473 | 30.9% |
| Greek | 284 | 2.5% |
| Guatemalan | 14 | 0.1% |
| Hungarian | 56 | 0.5% |
| Icelander | 126 | 1.1% |
| Indian (Asian) | 393 | 3.5% |
| Irish | 2,188 | 19.5% |
| Italian | 1,108 | 9.9% |
| Jamaican | 11 | 0.1% |
| Korean | 171 | 1.5% |
| Lithuanian | 135 | 1.2% |
| Malaysian | 9 | 0.1% |
| Mexican | 77 | 0.7% |
| Mongolian | 17 | 0.2% |
| Northern European | 25 | 0.2% |
| Norwegian | 187 | 1.7% |
| Pakistani | 9 | 0.1% |
| Polish | 1,108 | 9.9% |
| Portuguese | 14 | 0.1% |
| Russian | 232 | 2.1% |
| Salvadoran | 15 | 0.1% |
| Scandinavian | 53 | 0.5% |
| Scotch-Irish | 137 | 1.2% |
| Scottish | 325 | 2.9% |
| Serbian | 35 | 0.3% |
| Slovak | 65 | 0.6% |
| South African | 35 | 0.3% |
| Spanish | 47 | 0.4% |
| Subsaharan African | 36 | 0.3% |
| Swedish | 288 | 2.6% |
| Swiss | 31 | 0.3% |
| Thai | 407 | 3.6% |
| Turkish | 15 | 0.1% |
| Ugandan | 1 | 0.0% |
| Ukrainian | 145 | 1.3% | View All 57 Rows |
Immigrants in Barrington
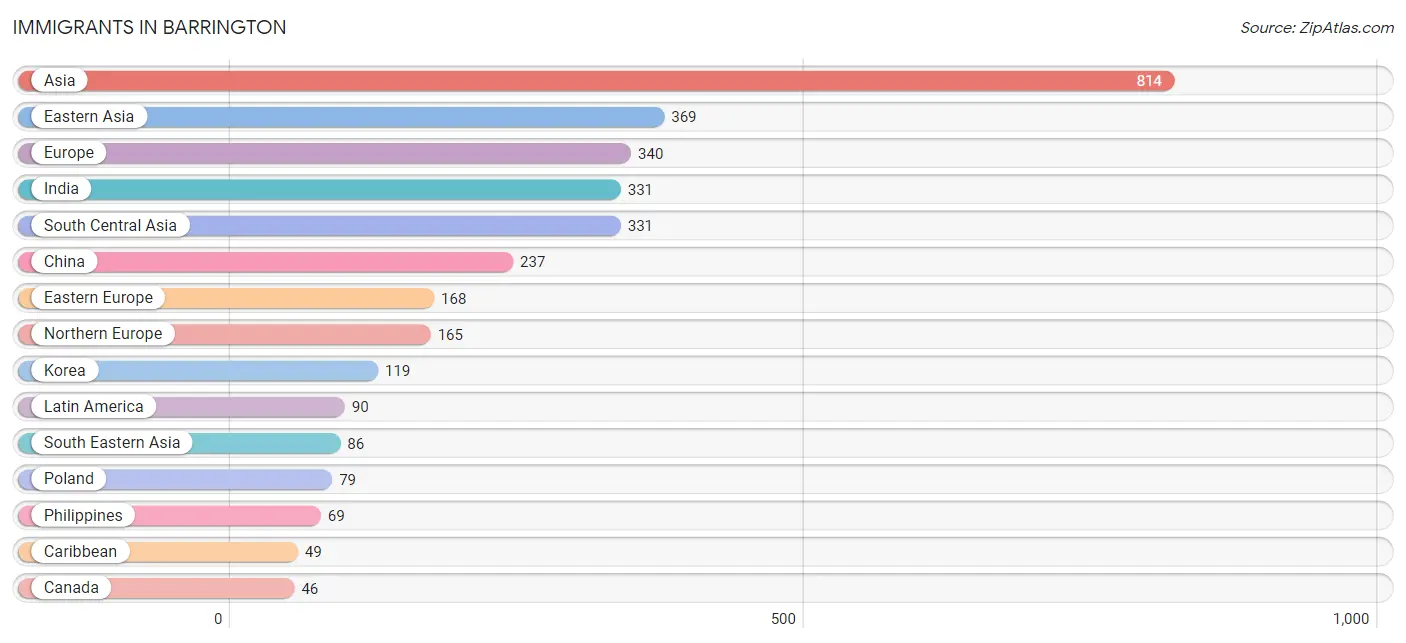
The most numerous immigrant groups reported in Barrington came from Asia (814 | 7.2%), Eastern Asia (369 | 3.3%), Europe (340 | 3.0%), India (331 | 2.9%), and South Central Asia (331 | 2.9%), together accounting for 19.4% of all Barrington residents.
| Immigration Origin | # Population | % Population |
| Africa | 36 | 0.3% |
| Asia | 814 | 7.2% |
| Australia | 18 | 0.2% |
| Brazil | 12 | 0.1% |
| Canada | 46 | 0.4% |
| Caribbean | 49 | 0.4% |
| Central America | 29 | 0.3% |
| China | 237 | 2.1% |
| Cuba | 14 | 0.1% |
| Czechoslovakia | 38 | 0.3% |
| Denmark | 9 | 0.1% |
| Eastern Africa | 1 | 0.0% |
| Eastern Asia | 369 | 3.3% |
| Eastern Europe | 168 | 1.5% |
| El Salvador | 15 | 0.1% |
| Europe | 340 | 3.0% |
| Germany | 7 | 0.1% |
| Guatemala | 14 | 0.1% |
| India | 331 | 2.9% |
| Ireland | 44 | 0.4% |
| Jamaica | 35 | 0.3% |
| Japan | 13 | 0.1% |
| Korea | 119 | 1.1% |
| Kuwait | 8 | 0.1% |
| Latin America | 90 | 0.8% |
| Northern Europe | 165 | 1.5% |
| Norway | 20 | 0.2% |
| Oceania | 18 | 0.2% |
| Philippines | 69 | 0.6% |
| Poland | 79 | 0.7% |
| Russia | 37 | 0.3% |
| Singapore | 17 | 0.2% |
| South Africa | 35 | 0.3% |
| South America | 12 | 0.1% |
| South Central Asia | 331 | 2.9% |
| South Eastern Asia | 86 | 0.8% |
| Syria | 11 | 0.1% |
| Taiwan | 25 | 0.2% |
| Uganda | 1 | 0.0% |
| Ukraine | 14 | 0.1% |
| Western Asia | 28 | 0.3% |
| Western Europe | 7 | 0.1% | View All 42 Rows |
Sex and Age in Barrington
Sex and Age in Barrington
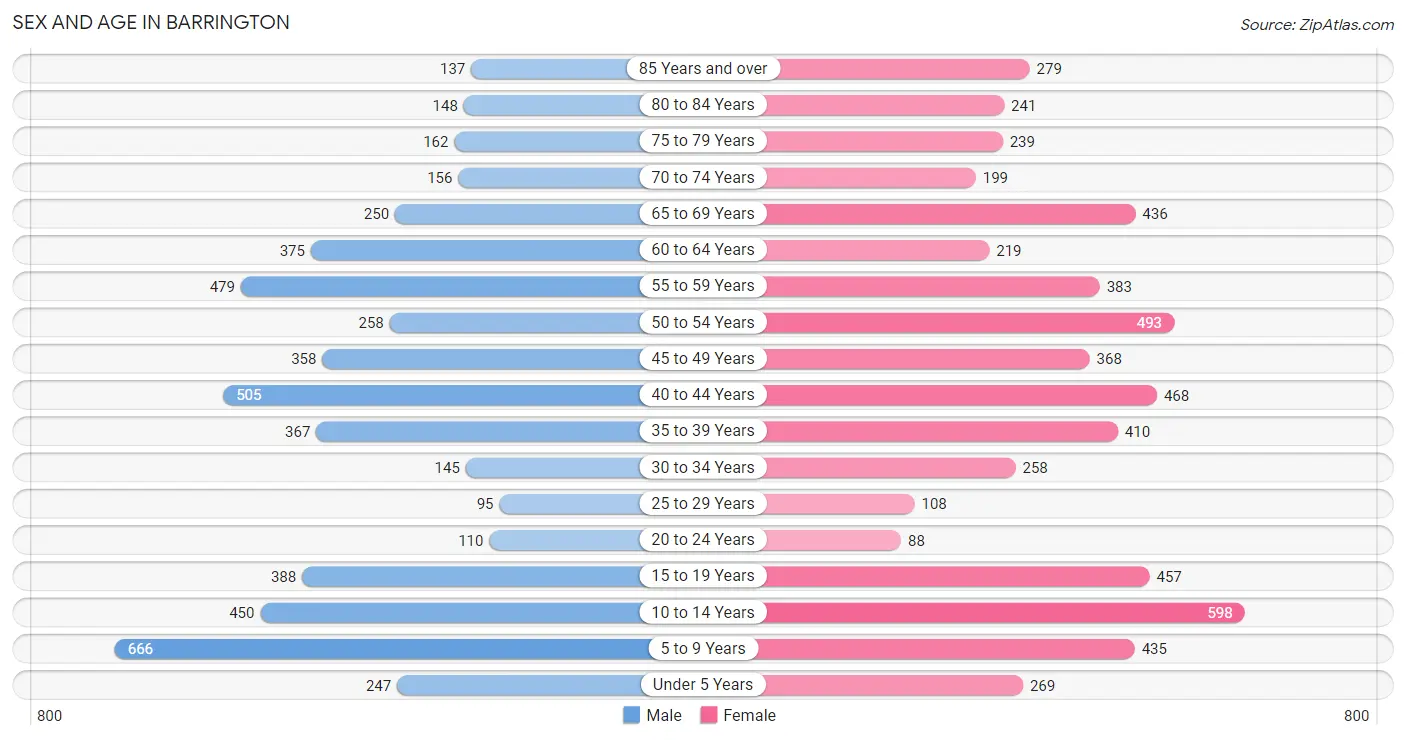
The most populous age groups in Barrington are 5 to 9 Years (666 | 12.6%) for men and 10 to 14 Years (598 | 10.1%) for women.
| Age Bracket | Male | Female |
| Under 5 Years | 247 (4.7%) | 269 (4.5%) |
| 5 to 9 Years | 666 (12.6%) | 435 (7.3%) |
| 10 to 14 Years | 450 (8.5%) | 598 (10.1%) |
| 15 to 19 Years | 388 (7.3%) | 457 (7.7%) |
| 20 to 24 Years | 110 (2.1%) | 88 (1.5%) |
| 25 to 29 Years | 95 (1.8%) | 108 (1.8%) |
| 30 to 34 Years | 145 (2.7%) | 258 (4.3%) |
| 35 to 39 Years | 367 (6.9%) | 410 (6.9%) |
| 40 to 44 Years | 505 (9.5%) | 468 (7.9%) |
| 45 to 49 Years | 358 (6.8%) | 368 (6.2%) |
| 50 to 54 Years | 258 (4.9%) | 493 (8.3%) |
| 55 to 59 Years | 479 (9.0%) | 383 (6.4%) |
| 60 to 64 Years | 375 (7.1%) | 219 (3.7%) |
| 65 to 69 Years | 250 (4.7%) | 436 (7.3%) |
| 70 to 74 Years | 156 (2.9%) | 199 (3.4%) |
| 75 to 79 Years | 162 (3.1%) | 239 (4.0%) |
| 80 to 84 Years | 148 (2.8%) | 241 (4.1%) |
| 85 Years and over | 137 (2.6%) | 279 (4.7%) |
| Total | 5,296 (100.0%) | 5,948 (100.0%) |
Families and Households in Barrington
Median Family Size in Barrington
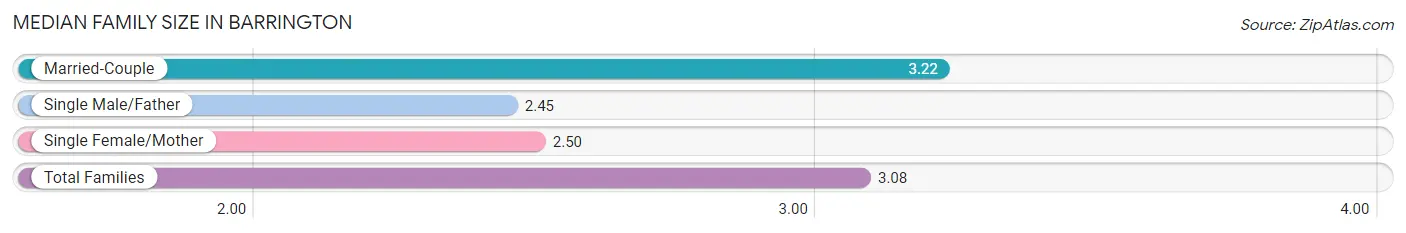
The median family size in Barrington is 3.08 persons per family, with married-couple families (2,595 | 81.0%) accounting for the largest median family size of 3.22 persons per family. On the other hand, single male/father families (140 | 4.4%) represent the smallest median family size with 2.45 persons per family.
| Family Type | # Families | Family Size |
| Married-Couple | 2,595 (81.0%) | 3.22 |
| Single Male/Father | 140 (4.4%) | 2.45 |
| Single Female/Mother | 469 (14.6%) | 2.50 |
| Total Families | 3,204 (100.0%) | 3.08 |
Median Household Size in Barrington
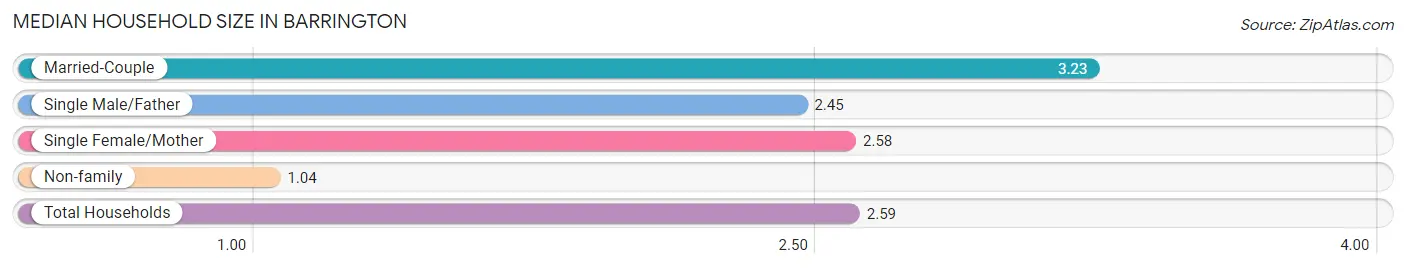
The median household size in Barrington is 2.59 persons per household, with married-couple households (2,595 | 60.8%) accounting for the largest median household size of 3.23 persons per household. non-family households (1,061 | 24.9%) represent the smallest median household size with 1.04 persons per household.
| Household Type | # Households | Household Size |
| Married-Couple | 2,595 (60.8%) | 3.23 |
| Single Male/Father | 140 (3.3%) | 2.45 |
| Single Female/Mother | 469 (11.0%) | 2.58 |
| Non-family | 1,061 (24.9%) | 1.04 |
| Total Households | 4,265 (100.0%) | 2.59 |
Household Size by Marriage Status in Barrington
Out of a total of 4,265 households in Barrington, 3,204 (75.1%) are family households, while 1,061 (24.9%) are nonfamily households. The most numerous type of family households are 2-person households, comprising 1,489, and the most common type of nonfamily households are 1-person households, comprising 1,027.
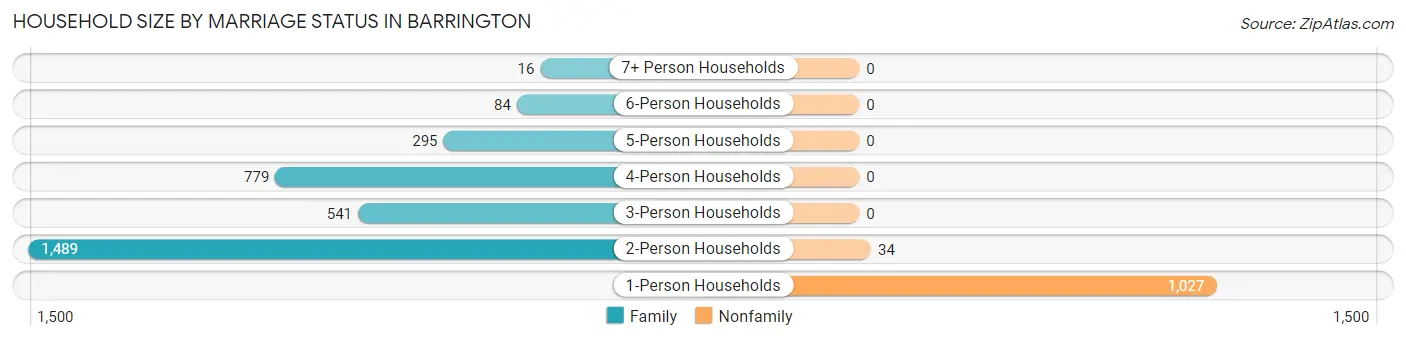
| Household Size | Family Households | Nonfamily Households |
| 1-Person Households | - | 1,027 (24.1%) |
| 2-Person Households | 1,489 (34.9%) | 34 (0.8%) |
| 3-Person Households | 541 (12.7%) | 0 (0.0%) |
| 4-Person Households | 779 (18.3%) | 0 (0.0%) |
| 5-Person Households | 295 (6.9%) | 0 (0.0%) |
| 6-Person Households | 84 (2.0%) | 0 (0.0%) |
| 7+ Person Households | 16 (0.4%) | 0 (0.0%) |
| Total | 3,204 (75.1%) | 1,061 (24.9%) |
Female Fertility in Barrington
Fertility by Age in Barrington
Average fertility rate in Barrington is 78.0 births per 1,000 women. Women in the age bracket of 20 to 34 years have the highest fertility rate with 156.0 births per 1,000 women. Women in the age bracket of 35 to 50 years acount for 58.5% of all women with births.
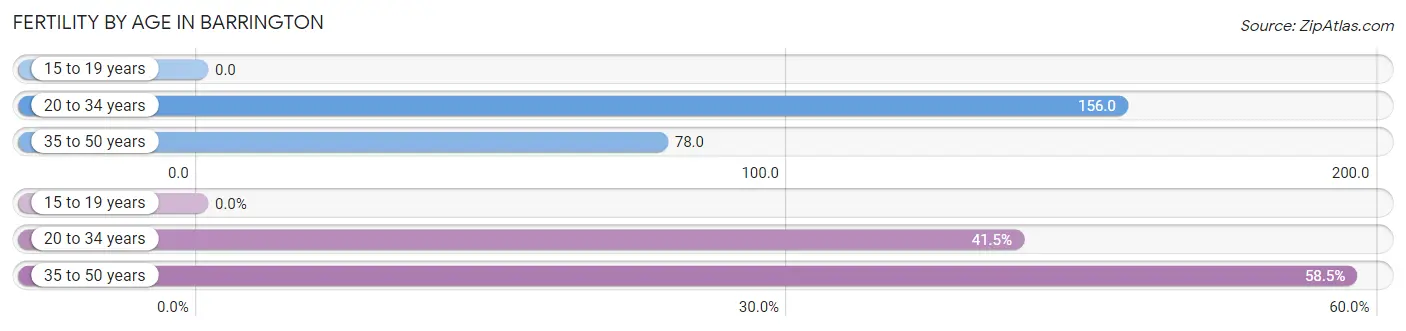
| Age Bracket | Women with Births | Births / 1,000 Women |
| 15 to 19 years | 0 (0.0%) | 0.0 |
| 20 to 34 years | 71 (41.5%) | 156.0 |
| 35 to 50 years | 100 (58.5%) | 78.0 |
| Total | 171 (100.0%) | 78.0 |
Fertility by Age by Marriage Status in Barrington
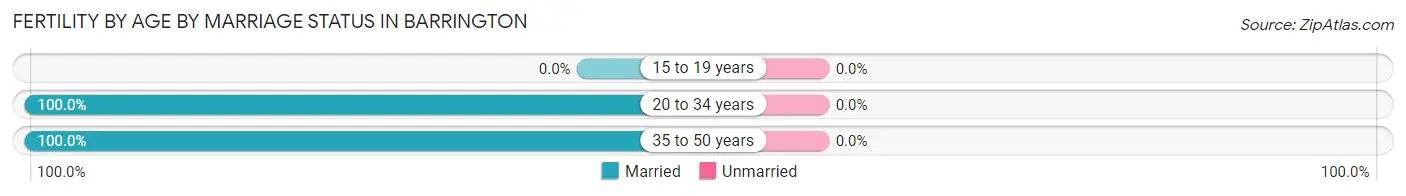
| Age Bracket | Married | Unmarried |
| 15 to 19 years | 0 (0.0%) | 0 (0.0%) |
| 20 to 34 years | 71 (100.0%) | 0 (0.0%) |
| 35 to 50 years | 100 (100.0%) | 0 (0.0%) |
| Total | 171 (100.0%) | 0 (0.0%) |
Fertility by Education in Barrington
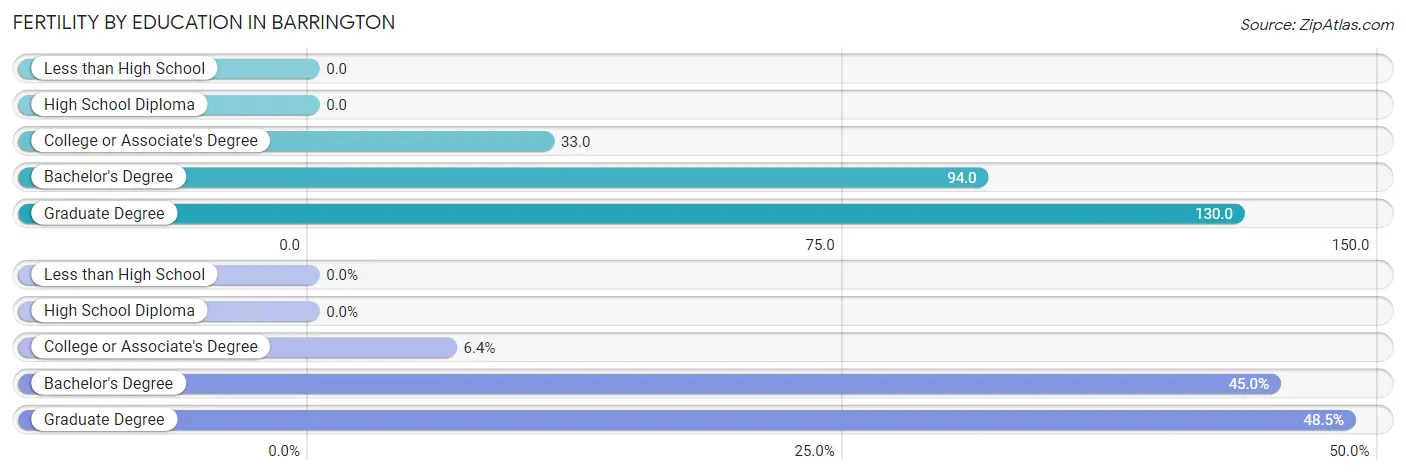
| Educational Attainment | Women with Births | Births / 1,000 Women |
| Less than High School | 0 (0.0%) | 0.0 |
| High School Diploma | 0 (0.0%) | 0.0 |
| College or Associate's Degree | 11 (6.4%) | 33.0 |
| Bachelor's Degree | 77 (45.0%) | 94.0 |
| Graduate Degree | 83 (48.5%) | 130.0 |
| Total | 171 (100.0%) | 78.0 |
Fertility by Education by Marriage Status in Barrington
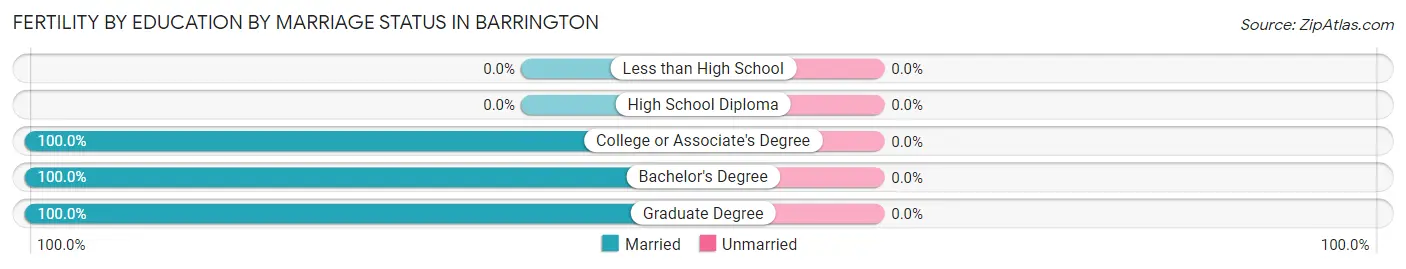
| Educational Attainment | Married | Unmarried |
| Less than High School | 0 (0.0%) | 0 (0.0%) |
| High School Diploma | 0 (0.0%) | 0 (0.0%) |
| College or Associate's Degree | 11 (100.0%) | 0 (0.0%) |
| Bachelor's Degree | 77 (100.0%) | 0 (0.0%) |
| Graduate Degree | 83 (100.0%) | 0 (0.0%) |
| Total | 171 (100.0%) | 0 (0.0%) |
Employment Characteristics in Barrington
Employment by Class of Employer in Barrington
Among the 4,693 employed individuals in Barrington, private company employees (3,358 | 71.6%), local government employees (429 | 9.1%), and self-employed (incorporated) (424 | 9.0%) make up the most common classes of employment.
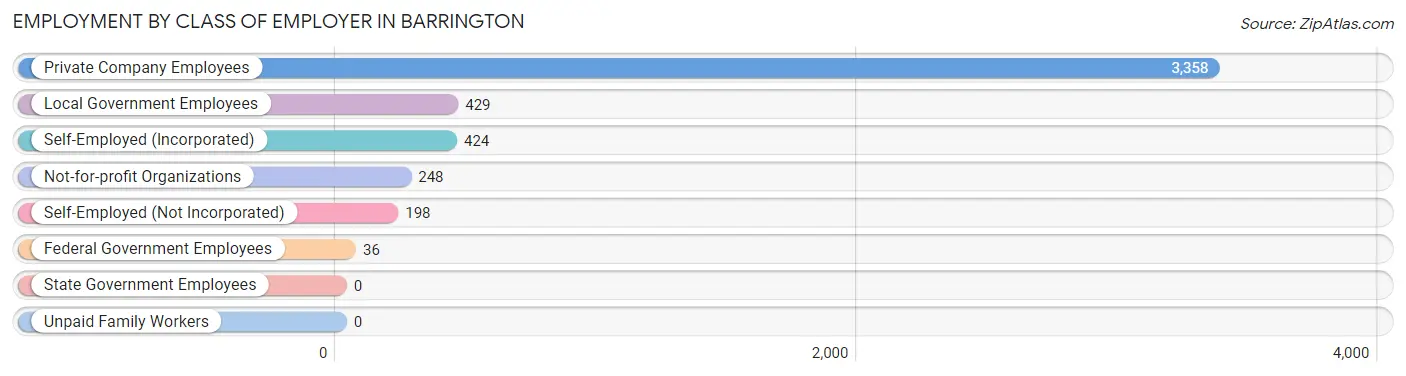
| Employer Class | # Employees | % Employees |
| Private Company Employees | 3,358 | 71.6% |
| Self-Employed (Incorporated) | 424 | 9.0% |
| Self-Employed (Not Incorporated) | 198 | 4.2% |
| Not-for-profit Organizations | 248 | 5.3% |
| Local Government Employees | 429 | 9.1% |
| State Government Employees | 0 | 0.0% |
| Federal Government Employees | 36 | 0.8% |
| Unpaid Family Workers | 0 | 0.0% |
| Total | 4,693 | 100.0% |
Employment Status by Age in Barrington
According to the labor force statistics for Barrington, out of the total population over 16 years of age (8,351), 59.4% or 4,960 individuals are in the labor force, with 3.9% or 193 of them unemployed. The age group with the highest labor force participation rate is 25 to 29 years, with 90.6% or 184 individuals in the labor force. Within the labor force, the 20 to 24 years age range has the highest percentage of unemployed individuals, with 14.8% or 9 of them being unemployed.
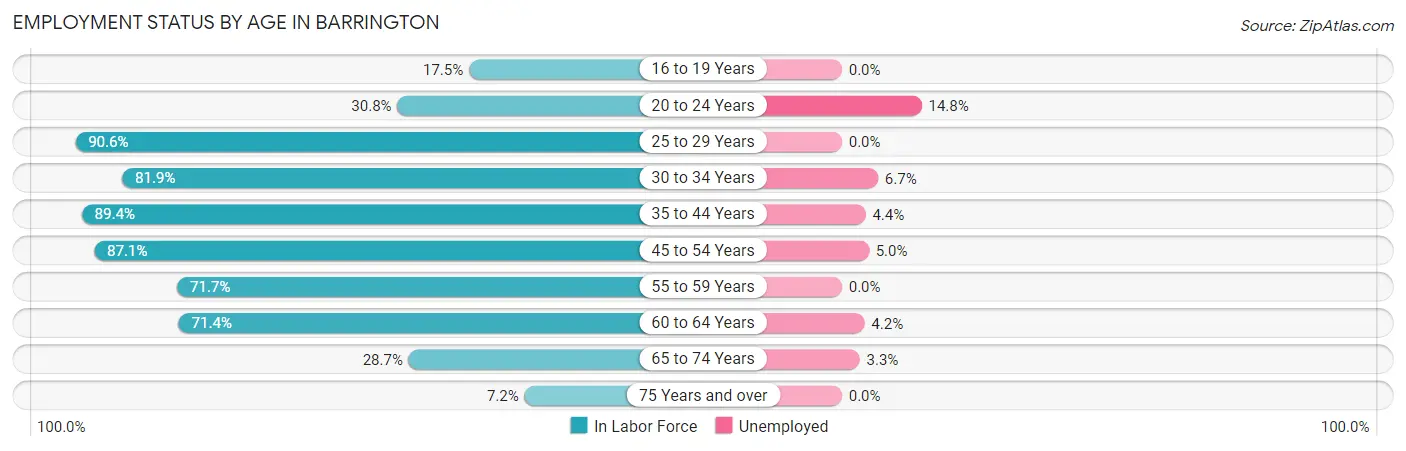
| Age Bracket | In Labor Force | Unemployed |
| 16 to 19 Years | 108 (17.5%) | 0 (0.0%) |
| 20 to 24 Years | 61 (30.8%) | 9 (14.8%) |
| 25 to 29 Years | 184 (90.6%) | 0 (0.0%) |
| 30 to 34 Years | 330 (81.9%) | 22 (6.7%) |
| 35 to 44 Years | 1,564 (89.4%) | 69 (4.4%) |
| 45 to 54 Years | 1,286 (87.1%) | 64 (5.0%) |
| 55 to 59 Years | 618 (71.7%) | 0 (0.0%) |
| 60 to 64 Years | 424 (71.4%) | 18 (4.2%) |
| 65 to 74 Years | 299 (28.7%) | 10 (3.3%) |
| 75 Years and over | 87 (7.2%) | 0 (0.0%) |
| Total | 4,960 (59.4%) | 193 (3.9%) |
Employment Status by Educational Attainment in Barrington
According to labor force statistics for Barrington, 83.3% of individuals (4,406) out of the total population between 25 and 64 years of age (5,289) are in the labor force, with 3.9% or 172 of them being unemployed. The group with the highest labor force participation rate are those with the educational attainment of bachelor's degree or higher, with 88.3% or 3,625 individuals in the labor force. Within the labor force, individuals with college / associate degree education have the highest percentage of unemployment, with 4.2% or 28 of them being unemployed.
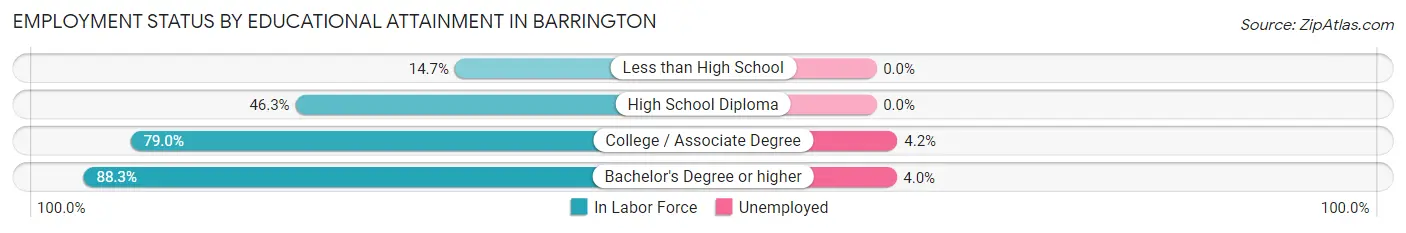
| Educational Attainment | In Labor Force | Unemployed |
| Less than High School | 21 (14.7%) | 0 (0.0%) |
| High School Diploma | 87 (46.3%) | 0 (0.0%) |
| College / Associate Degree | 674 (79.0%) | 36 (4.2%) |
| Bachelor's Degree or higher | 3,625 (88.3%) | 164 (4.0%) |
| Total | 4,406 (83.3%) | 206 (3.9%) |
Employment Occupations by Sex in Barrington
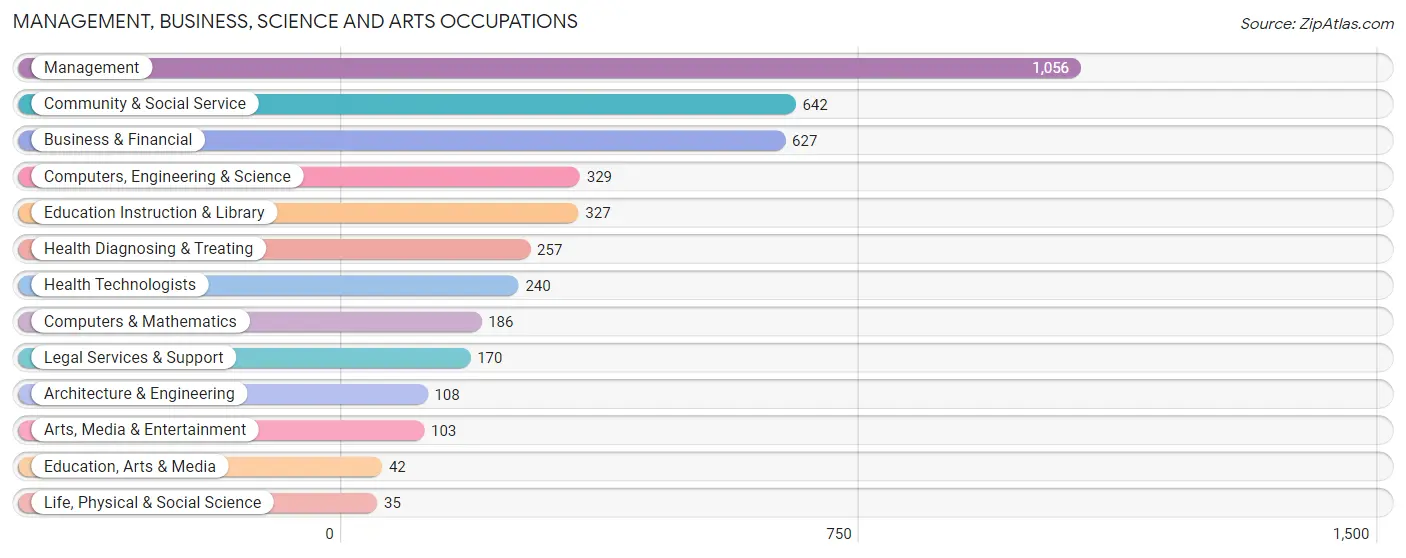
Management, Business, Science and Arts Occupations
The most common Management, Business, Science and Arts occupations in Barrington are Management (1,056 | 22.1%), Community & Social Service (642 | 13.5%), Business & Financial (627 | 13.1%), Computers, Engineering & Science (329 | 6.9%), and Education Instruction & Library (327 | 6.9%).
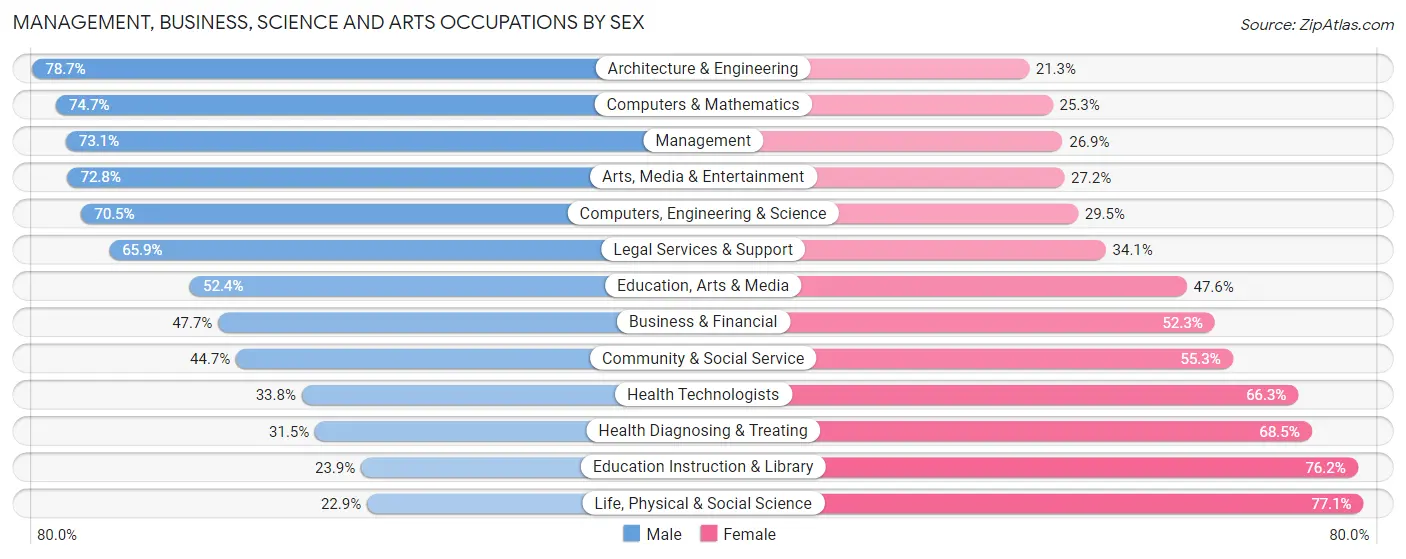
Management, Business, Science and Arts Occupations by Sex
Within the Management, Business, Science and Arts occupations in Barrington, the most male-oriented occupations are Architecture & Engineering (78.7%), Computers & Mathematics (74.7%), and Management (73.1%), while the most female-oriented occupations are Life, Physical & Social Science (77.1%), Education Instruction & Library (76.1%), and Health Diagnosing & Treating (68.5%).
| Occupation | Male | Female |
| Management | 772 (73.1%) | 284 (26.9%) |
| Business & Financial | 299 (47.7%) | 328 (52.3%) |
| Computers, Engineering & Science | 232 (70.5%) | 97 (29.5%) |
| Computers & Mathematics | 139 (74.7%) | 47 (25.3%) |
| Architecture & Engineering | 85 (78.7%) | 23 (21.3%) |
| Life, Physical & Social Science | 8 (22.9%) | 27 (77.1%) |
| Community & Social Service | 287 (44.7%) | 355 (55.3%) |
| Education, Arts & Media | 22 (52.4%) | 20 (47.6%) |
| Legal Services & Support | 112 (65.9%) | 58 (34.1%) |
| Education Instruction & Library | 78 (23.8%) | 249 (76.1%) |
| Arts, Media & Entertainment | 75 (72.8%) | 28 (27.2%) |
| Health Diagnosing & Treating | 81 (31.5%) | 176 (68.5%) |
| Health Technologists | 81 (33.8%) | 159 (66.2%) |
| Total (Category) | 1,671 (57.4%) | 1,240 (42.6%) |
| Total (Overall) | 2,614 (54.8%) | 2,157 (45.2%) |
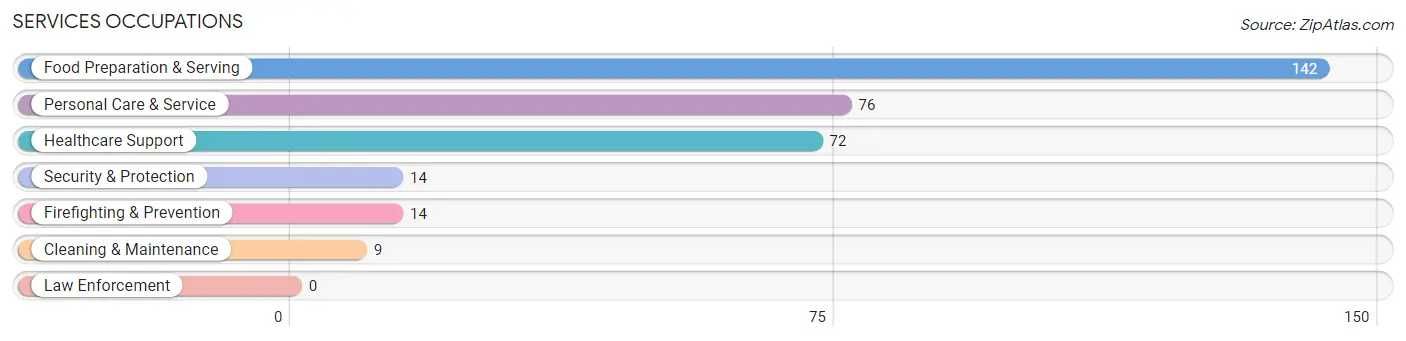
Services Occupations
The most common Services occupations in Barrington are Food Preparation & Serving (142 | 3.0%), Personal Care & Service (76 | 1.6%), Healthcare Support (72 | 1.5%), Security & Protection (14 | 0.3%), and Firefighting & Prevention (14 | 0.3%).
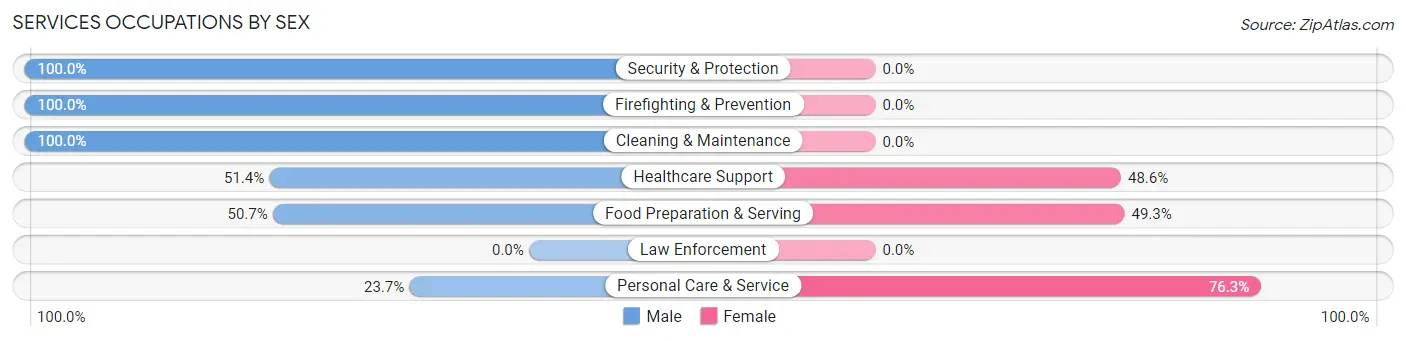
Services Occupations by Sex
Within the Services occupations in Barrington, the most male-oriented occupations are Security & Protection (100.0%), Firefighting & Prevention (100.0%), and Cleaning & Maintenance (100.0%), while the most female-oriented occupations are Personal Care & Service (76.3%), Food Preparation & Serving (49.3%), and Healthcare Support (48.6%).
| Occupation | Male | Female |
| Healthcare Support | 37 (51.4%) | 35 (48.6%) |
| Security & Protection | 14 (100.0%) | 0 (0.0%) |
| Firefighting & Prevention | 14 (100.0%) | 0 (0.0%) |
| Law Enforcement | 0 (0.0%) | 0 (0.0%) |
| Food Preparation & Serving | 72 (50.7%) | 70 (49.3%) |
| Cleaning & Maintenance | 9 (100.0%) | 0 (0.0%) |
| Personal Care & Service | 18 (23.7%) | 58 (76.3%) |
| Total (Category) | 150 (47.9%) | 163 (52.1%) |
| Total (Overall) | 2,614 (54.8%) | 2,157 (45.2%) |
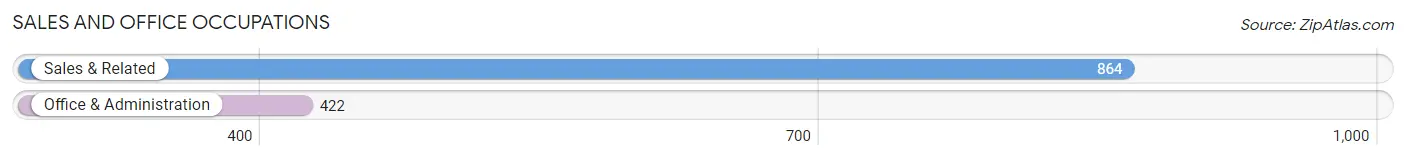
Sales and Office Occupations
The most common Sales and Office occupations in Barrington are Sales & Related (864 | 18.1%), and Office & Administration (422 | 8.8%).
Sales and Office Occupations by Sex
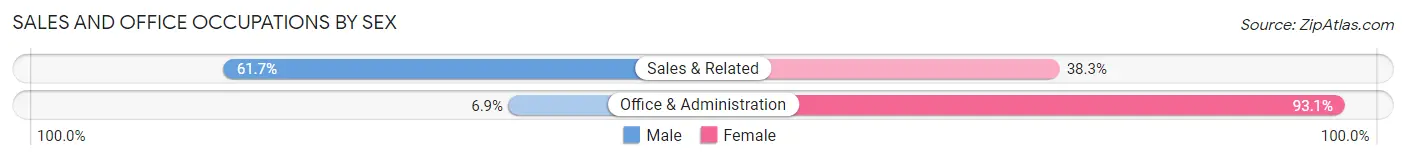
| Occupation | Male | Female |
| Sales & Related | 533 (61.7%) | 331 (38.3%) |
| Office & Administration | 29 (6.9%) | 393 (93.1%) |
| Total (Category) | 562 (43.7%) | 724 (56.3%) |
| Total (Overall) | 2,614 (54.8%) | 2,157 (45.2%) |
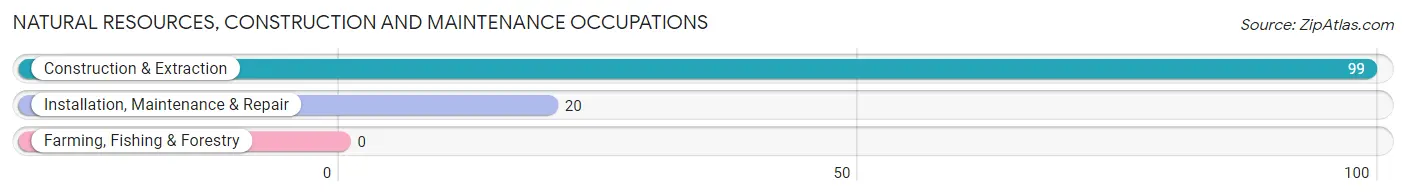
Natural Resources, Construction and Maintenance Occupations
The most common Natural Resources, Construction and Maintenance occupations in Barrington are Construction & Extraction (99 | 2.1%), and Installation, Maintenance & Repair (20 | 0.4%).
Natural Resources, Construction and Maintenance Occupations by Sex
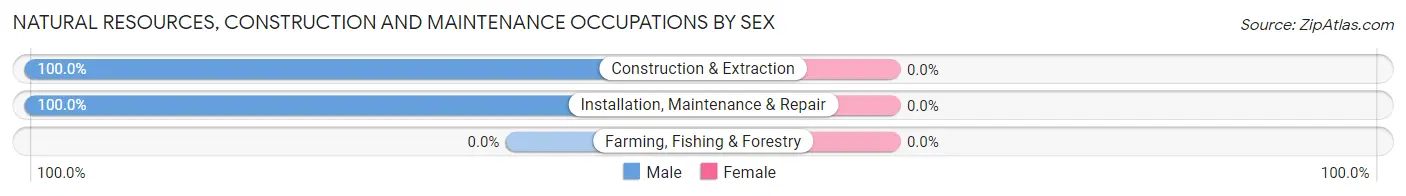
| Occupation | Male | Female |
| Farming, Fishing & Forestry | 0 (0.0%) | 0 (0.0%) |
| Construction & Extraction | 99 (100.0%) | 0 (0.0%) |
| Installation, Maintenance & Repair | 20 (100.0%) | 0 (0.0%) |
| Total (Category) | 119 (100.0%) | 0 (0.0%) |
| Total (Overall) | 2,614 (54.8%) | 2,157 (45.2%) |
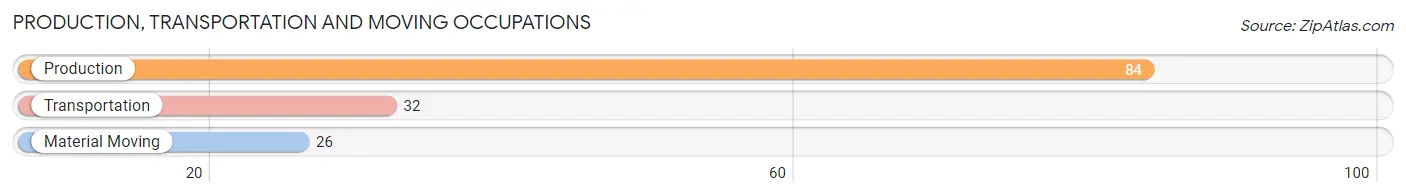
Production, Transportation and Moving Occupations
The most common Production, Transportation and Moving occupations in Barrington are Production (84 | 1.8%), Transportation (32 | 0.7%), and Material Moving (26 | 0.5%).
Production, Transportation and Moving Occupations by Sex
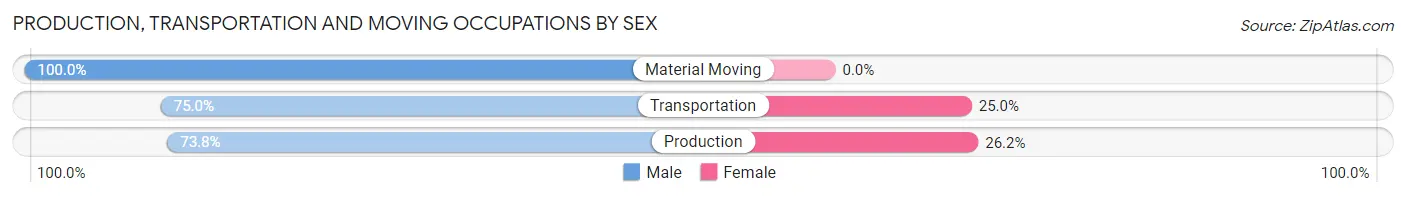
| Occupation | Male | Female |
| Production | 62 (73.8%) | 22 (26.2%) |
| Transportation | 24 (75.0%) | 8 (25.0%) |
| Material Moving | 26 (100.0%) | 0 (0.0%) |
| Total (Category) | 112 (78.9%) | 30 (21.1%) |
| Total (Overall) | 2,614 (54.8%) | 2,157 (45.2%) |
Employment Industries by Sex in Barrington
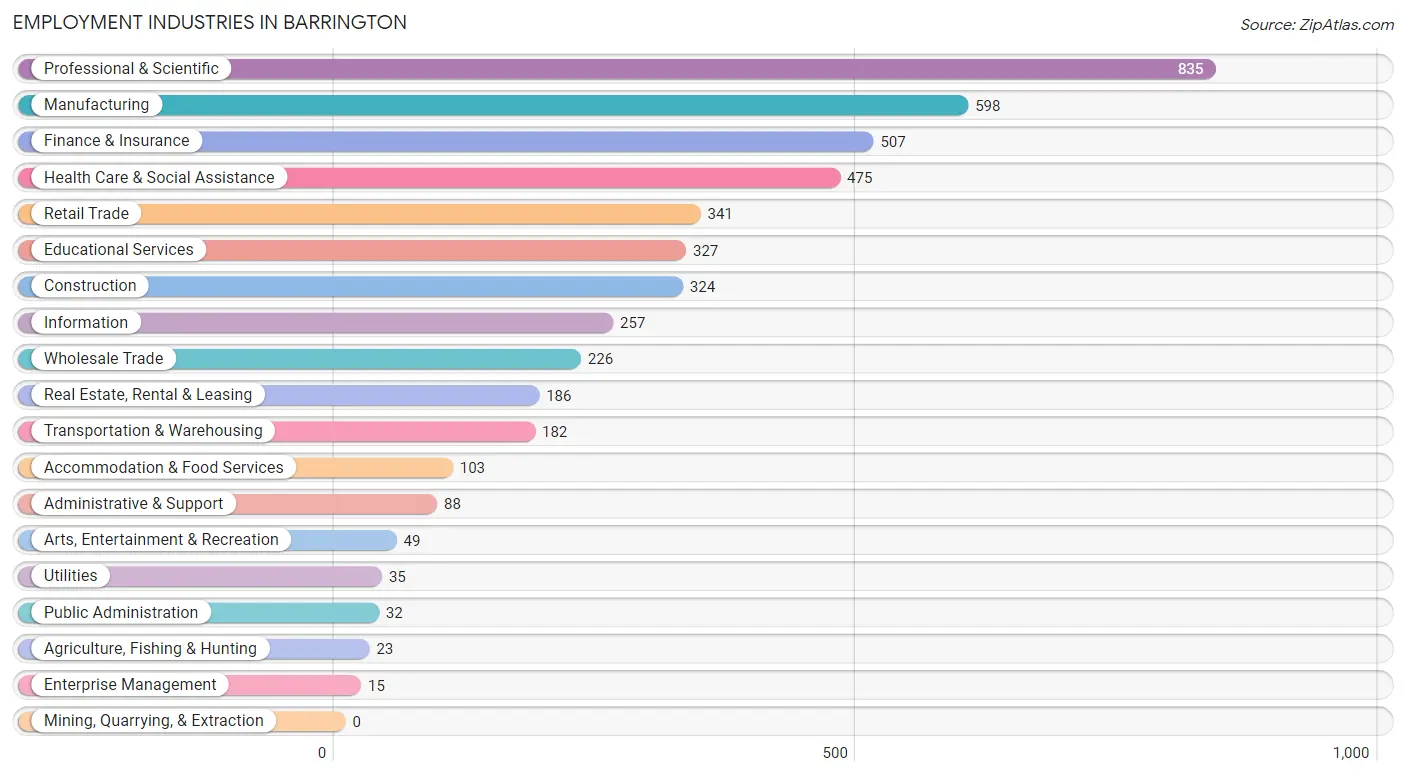
Employment Industries in Barrington
The major employment industries in Barrington include Professional & Scientific (835 | 17.5%), Manufacturing (598 | 12.5%), Finance & Insurance (507 | 10.6%), Health Care & Social Assistance (475 | 10.0%), and Retail Trade (341 | 7.1%).
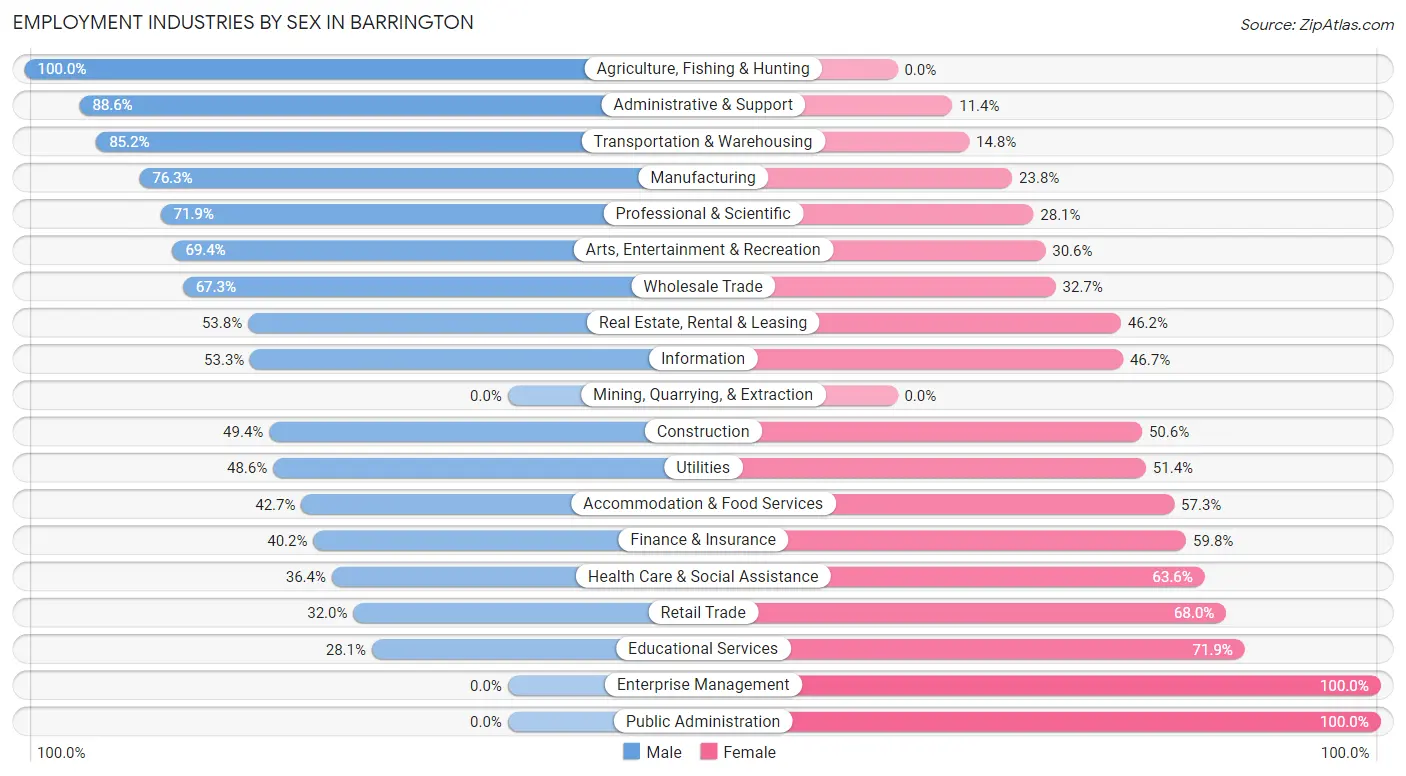
Employment Industries by Sex in Barrington
The Barrington industries that see more men than women are Agriculture, Fishing & Hunting (100.0%), Administrative & Support (88.6%), and Transportation & Warehousing (85.2%), whereas the industries that tend to have a higher number of women are Enterprise Management (100.0%), Public Administration (100.0%), and Educational Services (71.9%).
| Industry | Male | Female |
| Agriculture, Fishing & Hunting | 23 (100.0%) | 0 (0.0%) |
| Mining, Quarrying, & Extraction | 0 (0.0%) | 0 (0.0%) |
| Construction | 160 (49.4%) | 164 (50.6%) |
| Manufacturing | 456 (76.2%) | 142 (23.7%) |
| Wholesale Trade | 152 (67.3%) | 74 (32.7%) |
| Retail Trade | 109 (32.0%) | 232 (68.0%) |
| Transportation & Warehousing | 155 (85.2%) | 27 (14.8%) |
| Utilities | 17 (48.6%) | 18 (51.4%) |
| Information | 137 (53.3%) | 120 (46.7%) |
| Finance & Insurance | 204 (40.2%) | 303 (59.8%) |
| Real Estate, Rental & Leasing | 100 (53.8%) | 86 (46.2%) |
| Professional & Scientific | 600 (71.9%) | 235 (28.1%) |
| Enterprise Management | 0 (0.0%) | 15 (100.0%) |
| Administrative & Support | 78 (88.6%) | 10 (11.4%) |
| Educational Services | 92 (28.1%) | 235 (71.9%) |
| Health Care & Social Assistance | 173 (36.4%) | 302 (63.6%) |
| Arts, Entertainment & Recreation | 34 (69.4%) | 15 (30.6%) |
| Accommodation & Food Services | 44 (42.7%) | 59 (57.3%) |
| Public Administration | 0 (0.0%) | 32 (100.0%) |
| Total | 2,614 (54.8%) | 2,157 (45.2%) |
Education in Barrington
School Enrollment in Barrington
The most common levels of schooling among the 3,495 students in Barrington are elementary school (997 | 28.5%), middle school (834 | 23.9%), and high school (796 | 22.8%).
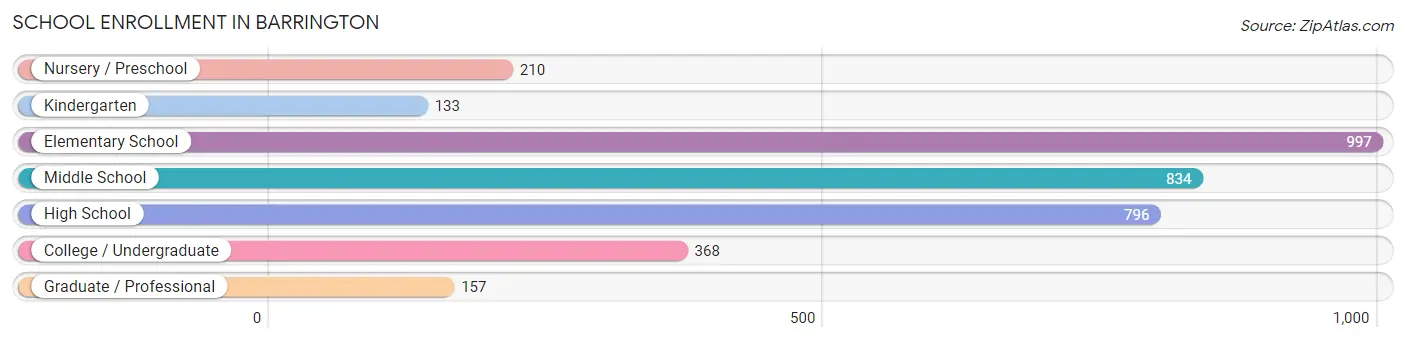
| School Level | # Students | % Students |
| Nursery / Preschool | 210 | 6.0% |
| Kindergarten | 133 | 3.8% |
| Elementary School | 997 | 28.5% |
| Middle School | 834 | 23.9% |
| High School | 796 | 22.8% |
| College / Undergraduate | 368 | 10.5% |
| Graduate / Professional | 157 | 4.5% |
| Total | 3,495 | 100.0% |
School Enrollment by Age by Funding Source in Barrington
Out of a total of 3,495 students who are enrolled in schools in Barrington, 692 (19.8%) attend a private institution, while the remaining 2,803 (80.2%) are enrolled in public schools. The age group of 35 years and over has the highest likelihood of being enrolled in private schools, with 138 (81.7% in the age bracket) enrolled. Conversely, the age group of 15 to 17 year olds has the lowest likelihood of being enrolled in a private school, with 584 (100.0% in the age bracket) attending a public institution.
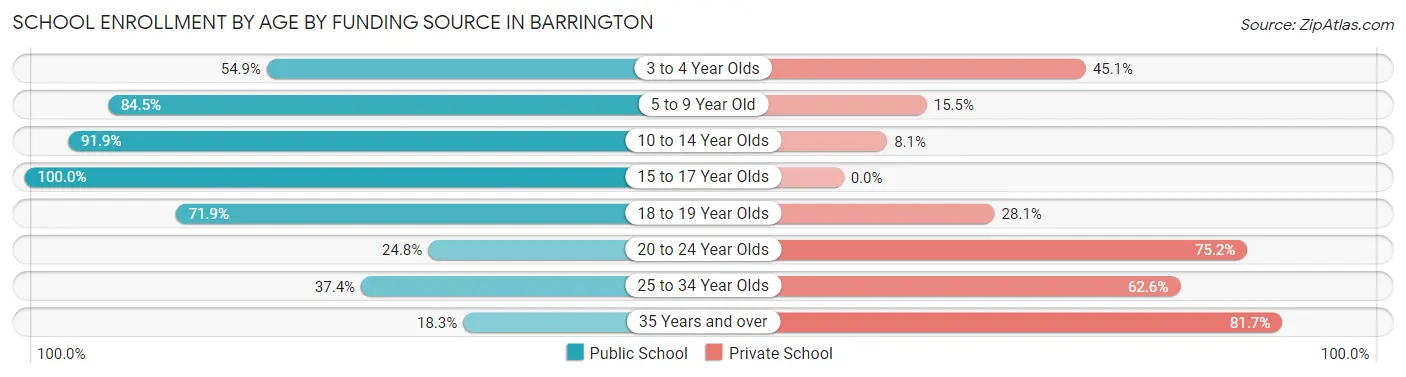
| Age Bracket | Public School | Private School |
| 3 to 4 Year Olds | 73 (54.9%) | 60 (45.1%) |
| 5 to 9 Year Old | 917 (84.5%) | 168 (15.5%) |
| 10 to 14 Year Olds | 963 (91.9%) | 85 (8.1%) |
| 15 to 17 Year Olds | 584 (100.0%) | 0 (0.0%) |
| 18 to 19 Year Olds | 161 (71.9%) | 63 (28.1%) |
| 20 to 24 Year Olds | 40 (24.8%) | 121 (75.2%) |
| 25 to 34 Year Olds | 34 (37.4%) | 57 (62.6%) |
| 35 Years and over | 31 (18.3%) | 138 (81.7%) |
| Total | 2,803 (80.2%) | 692 (19.8%) |
Educational Attainment by Field of Study in Barrington
Business (1,500 | 25.1%), engineering (568 | 9.5%), education (544 | 9.1%), social sciences (456 | 7.6%), and literature & languages (420 | 7.0%) are the most common fields of study among 5,979 individuals in Barrington who have obtained a bachelor's degree or higher.
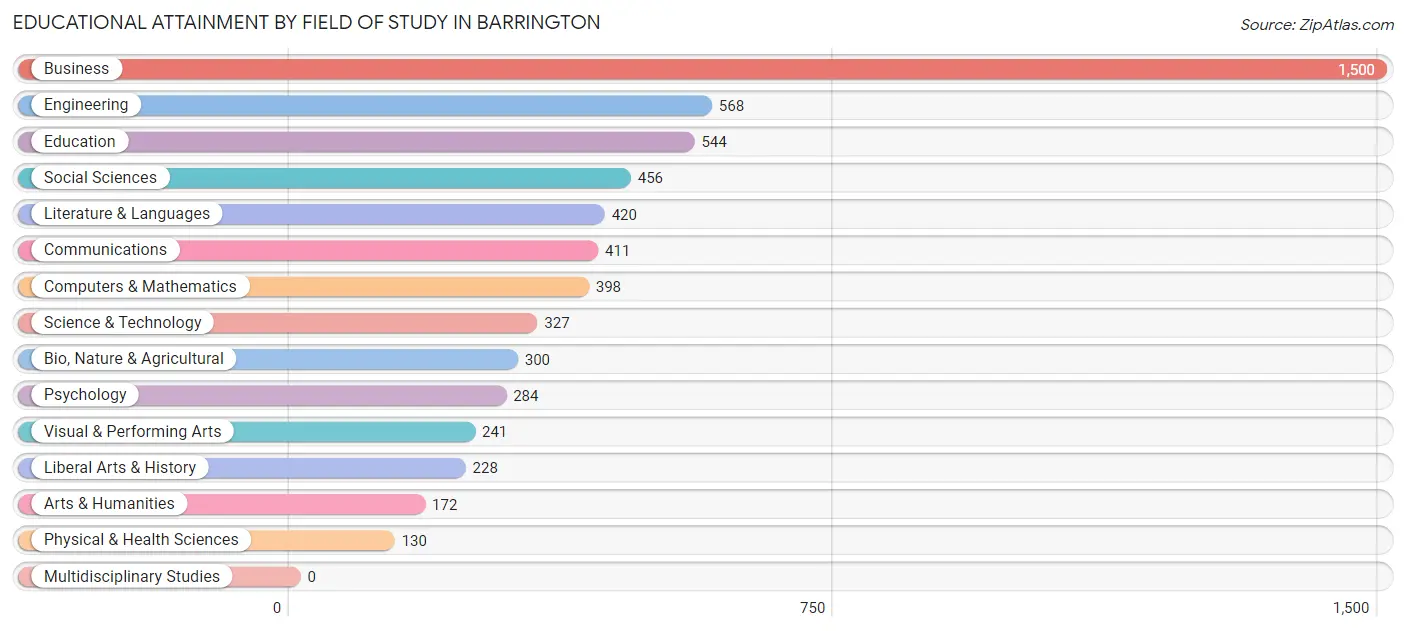
| Field of Study | # Graduates | % Graduates |
| Computers & Mathematics | 398 | 6.7% |
| Bio, Nature & Agricultural | 300 | 5.0% |
| Physical & Health Sciences | 130 | 2.2% |
| Psychology | 284 | 4.8% |
| Social Sciences | 456 | 7.6% |
| Engineering | 568 | 9.5% |
| Multidisciplinary Studies | 0 | 0.0% |
| Science & Technology | 327 | 5.5% |
| Business | 1,500 | 25.1% |
| Education | 544 | 9.1% |
| Literature & Languages | 420 | 7.0% |
| Liberal Arts & History | 228 | 3.8% |
| Visual & Performing Arts | 241 | 4.0% |
| Communications | 411 | 6.9% |
| Arts & Humanities | 172 | 2.9% |
| Total | 5,979 | 100.0% |
Transportation & Commute in Barrington
Vehicle Availability by Sex in Barrington
The most prevalent vehicle ownership categories in Barrington are males with 2 vehicles (1,532, accounting for 59.4%) and females with 2 vehicles (1,190, making up 72.5%).
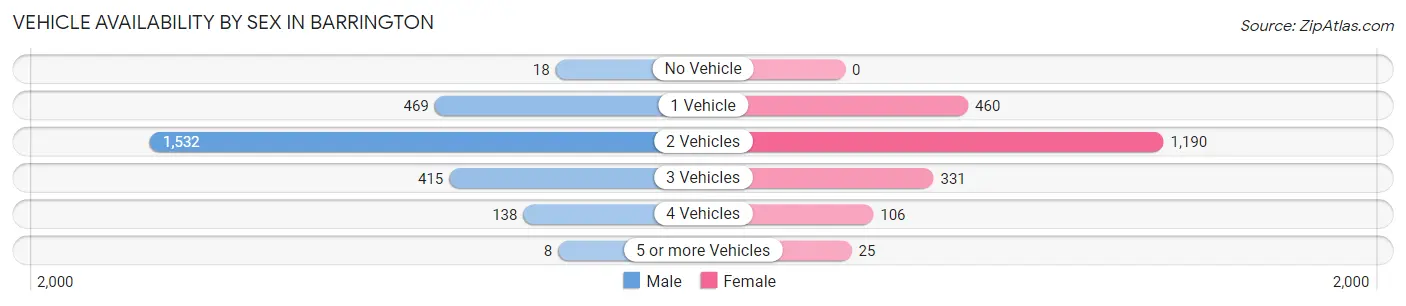
| Vehicles Available | Male | Female |
| No Vehicle | 18 (0.7%) | 0 (0.0%) |
| 1 Vehicle | 469 (18.2%) | 460 (21.8%) |
| 2 Vehicles | 1,532 (59.4%) | 1,190 (56.3%) |
| 3 Vehicles | 415 (16.1%) | 331 (15.7%) |
| 4 Vehicles | 138 (5.3%) | 106 (5.0%) |
| 5 or more Vehicles | 8 (0.3%) | 25 (1.2%) |
| Total | 2,580 (100.0%) | 2,112 (100.0%) |
Commute Time in Barrington
The most frequently occuring commute durations in Barrington are 30 to 34 minutes (602 commuters, 17.4%), 45 to 59 minutes (571 commuters, 16.5%), and 15 to 19 minutes (497 commuters, 14.4%).
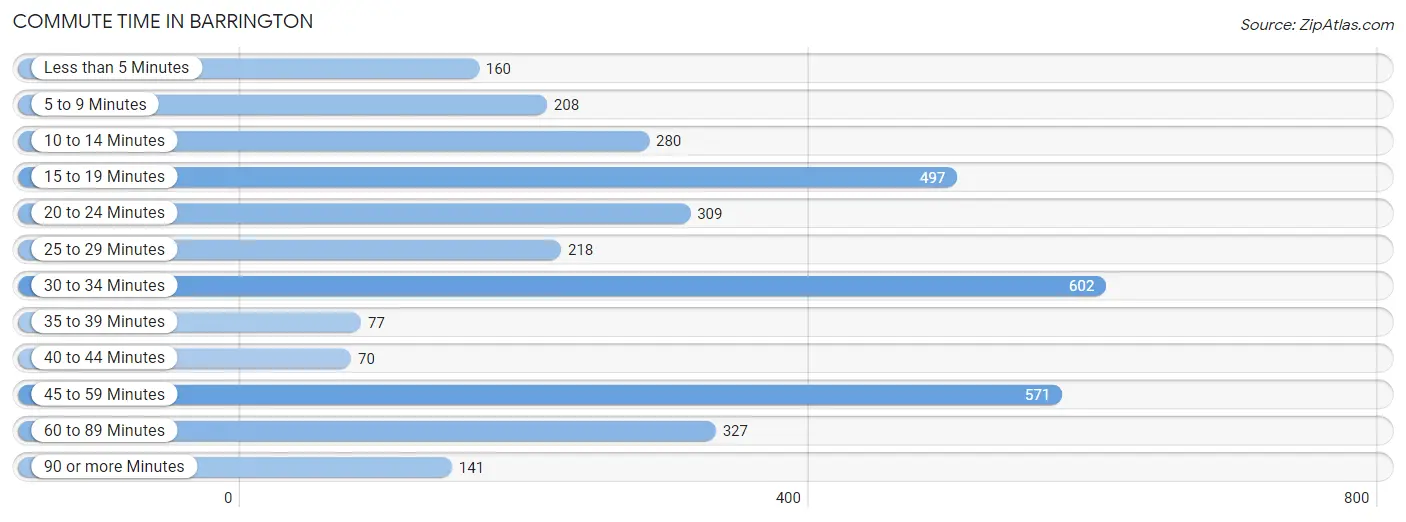
| Commute Time | # Commuters | % Commuters |
| Less than 5 Minutes | 160 | 4.6% |
| 5 to 9 Minutes | 208 | 6.0% |
| 10 to 14 Minutes | 280 | 8.1% |
| 15 to 19 Minutes | 497 | 14.4% |
| 20 to 24 Minutes | 309 | 8.9% |
| 25 to 29 Minutes | 218 | 6.3% |
| 30 to 34 Minutes | 602 | 17.4% |
| 35 to 39 Minutes | 77 | 2.2% |
| 40 to 44 Minutes | 70 | 2.0% |
| 45 to 59 Minutes | 571 | 16.5% |
| 60 to 89 Minutes | 327 | 9.5% |
| 90 or more Minutes | 141 | 4.1% |
Commute Time by Sex in Barrington
The most common commute times in Barrington are 45 to 59 minutes (358 commuters, 19.2%) for males and 30 to 34 minutes (257 commuters, 16.1%) for females.
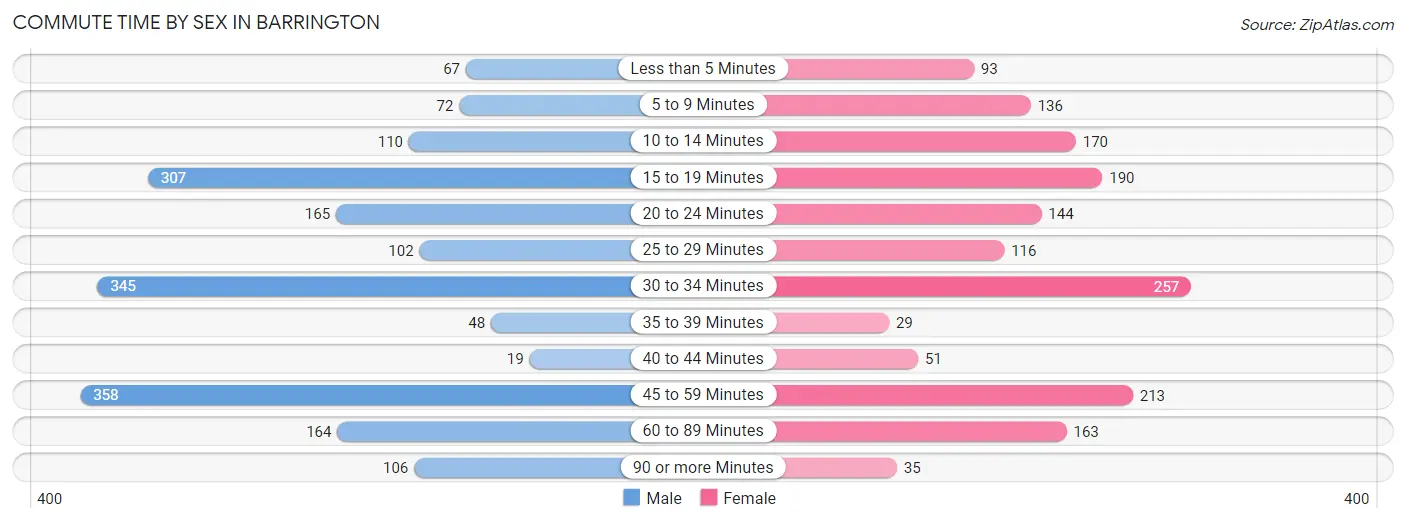
| Commute Time | Male | Female |
| Less than 5 Minutes | 67 (3.6%) | 93 (5.8%) |
| 5 to 9 Minutes | 72 (3.9%) | 136 (8.5%) |
| 10 to 14 Minutes | 110 (5.9%) | 170 (10.6%) |
| 15 to 19 Minutes | 307 (16.5%) | 190 (11.9%) |
| 20 to 24 Minutes | 165 (8.9%) | 144 (9.0%) |
| 25 to 29 Minutes | 102 (5.5%) | 116 (7.3%) |
| 30 to 34 Minutes | 345 (18.5%) | 257 (16.1%) |
| 35 to 39 Minutes | 48 (2.6%) | 29 (1.8%) |
| 40 to 44 Minutes | 19 (1.0%) | 51 (3.2%) |
| 45 to 59 Minutes | 358 (19.2%) | 213 (13.3%) |
| 60 to 89 Minutes | 164 (8.8%) | 163 (10.2%) |
| 90 or more Minutes | 106 (5.7%) | 35 (2.2%) |
Time of Departure to Work by Sex in Barrington
The most frequent times of departure to work in Barrington are 8:00 AM to 8:29 AM (338, 18.1%) for males and 9:00 AM to 9:59 AM (330, 20.7%) for females.
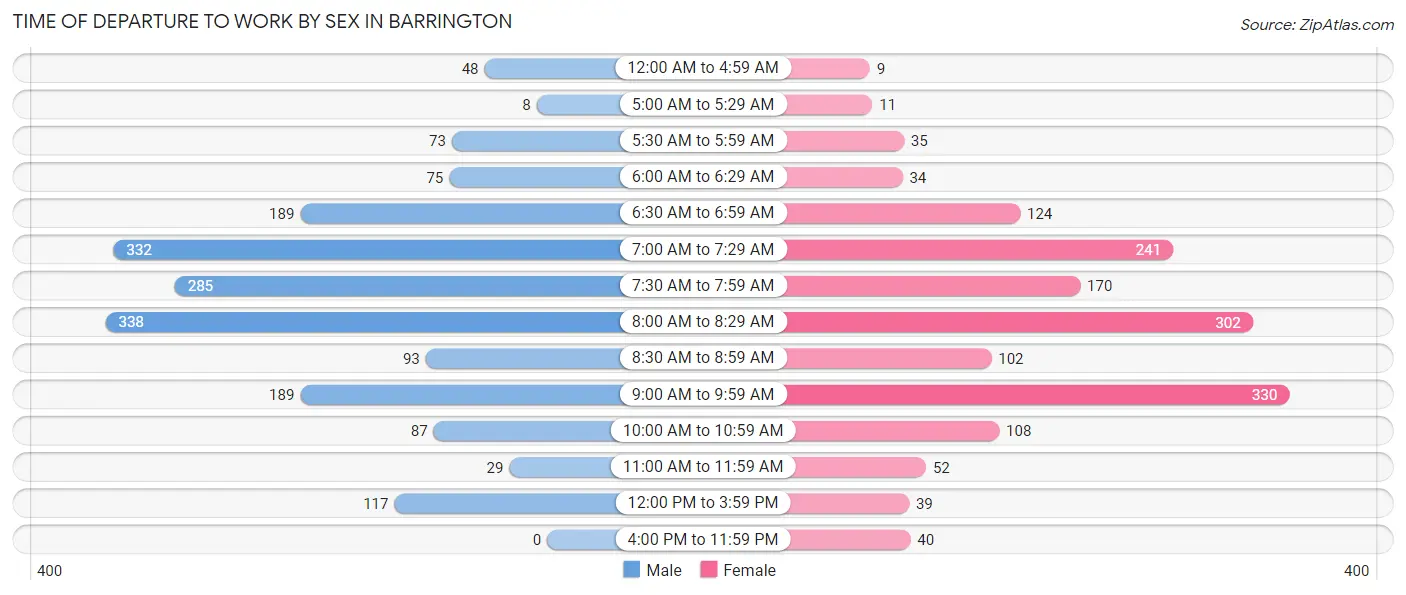
| Time of Departure | Male | Female |
| 12:00 AM to 4:59 AM | 48 (2.6%) | 9 (0.6%) |
| 5:00 AM to 5:29 AM | 8 (0.4%) | 11 (0.7%) |
| 5:30 AM to 5:59 AM | 73 (3.9%) | 35 (2.2%) |
| 6:00 AM to 6:29 AM | 75 (4.0%) | 34 (2.1%) |
| 6:30 AM to 6:59 AM | 189 (10.1%) | 124 (7.8%) |
| 7:00 AM to 7:29 AM | 332 (17.8%) | 241 (15.1%) |
| 7:30 AM to 7:59 AM | 285 (15.3%) | 170 (10.6%) |
| 8:00 AM to 8:29 AM | 338 (18.1%) | 302 (18.9%) |
| 8:30 AM to 8:59 AM | 93 (5.0%) | 102 (6.4%) |
| 9:00 AM to 9:59 AM | 189 (10.1%) | 330 (20.7%) |
| 10:00 AM to 10:59 AM | 87 (4.7%) | 108 (6.8%) |
| 11:00 AM to 11:59 AM | 29 (1.6%) | 52 (3.3%) |
| 12:00 PM to 3:59 PM | 117 (6.3%) | 39 (2.4%) |
| 4:00 PM to 11:59 PM | 0 (0.0%) | 40 (2.5%) |
| Total | 1,863 (100.0%) | 1,597 (100.0%) |
Housing Occupancy in Barrington
Occupancy by Ownership in Barrington
Of the total 4,265 dwellings in Barrington, owner-occupied units account for 3,329 (78.0%), while renter-occupied units make up 936 (22.0%).
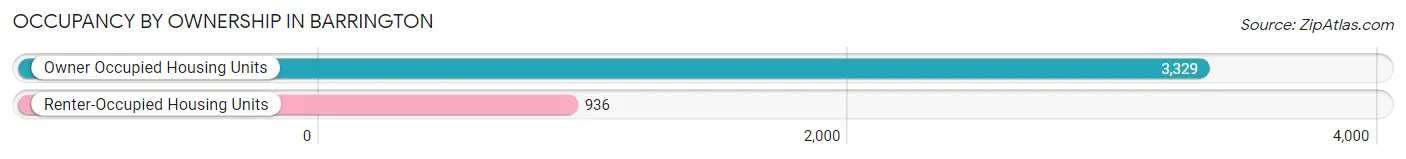
| Occupancy | # Housing Units | % Housing Units |
| Owner Occupied Housing Units | 3,329 | 78.0% |
| Renter-Occupied Housing Units | 936 | 22.0% |
| Total Occupied Housing Units | 4,265 | 100.0% |
Occupancy by Household Size in Barrington
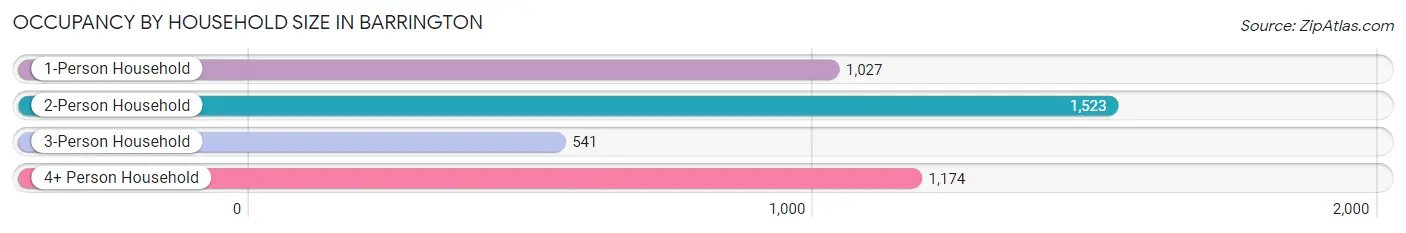
| Household Size | # Housing Units | % Housing Units |
| 1-Person Household | 1,027 | 24.1% |
| 2-Person Household | 1,523 | 35.7% |
| 3-Person Household | 541 | 12.7% |
| 4+ Person Household | 1,174 | 27.5% |
| Total Housing Units | 4,265 | 100.0% |
Occupancy by Ownership by Household Size in Barrington
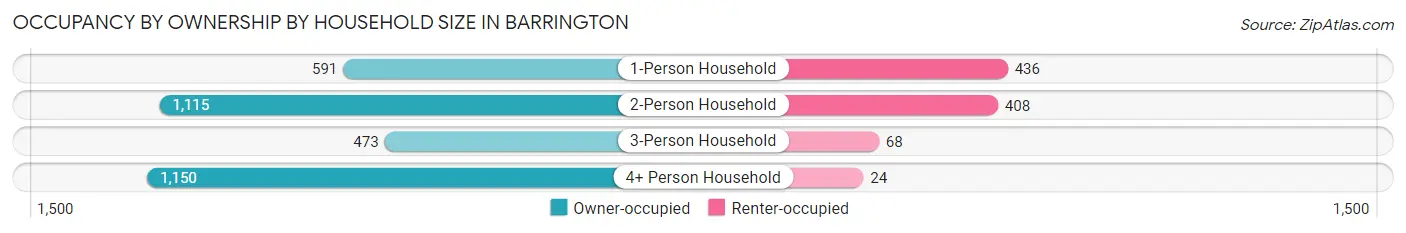
| Household Size | Owner-occupied | Renter-occupied |
| 1-Person Household | 591 (57.6%) | 436 (42.4%) |
| 2-Person Household | 1,115 (73.2%) | 408 (26.8%) |
| 3-Person Household | 473 (87.4%) | 68 (12.6%) |
| 4+ Person Household | 1,150 (98.0%) | 24 (2.0%) |
| Total Housing Units | 3,329 (78.0%) | 936 (22.0%) |
Occupancy by Educational Attainment in Barrington
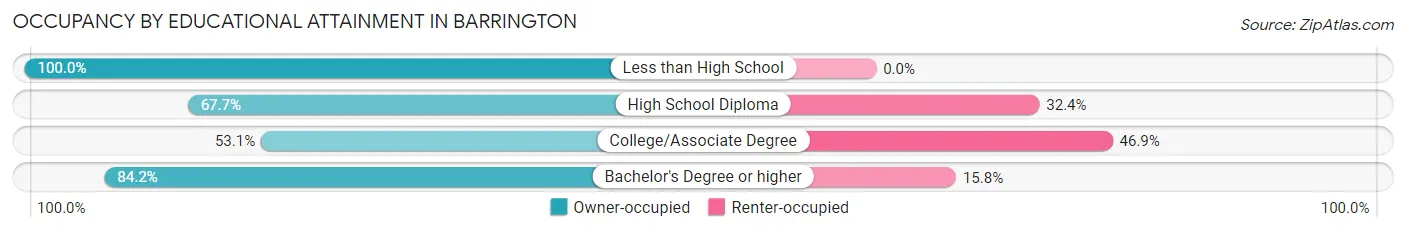
| Household Size | Owner-occupied | Renter-occupied |
| Less than High School | 64 (100.0%) | 0 (0.0%) |
| High School Diploma | 115 (67.6%) | 55 (32.4%) |
| College/Associate Degree | 416 (53.1%) | 367 (46.9%) |
| Bachelor's Degree or higher | 2,734 (84.2%) | 514 (15.8%) |
Occupancy by Age of Householder in Barrington
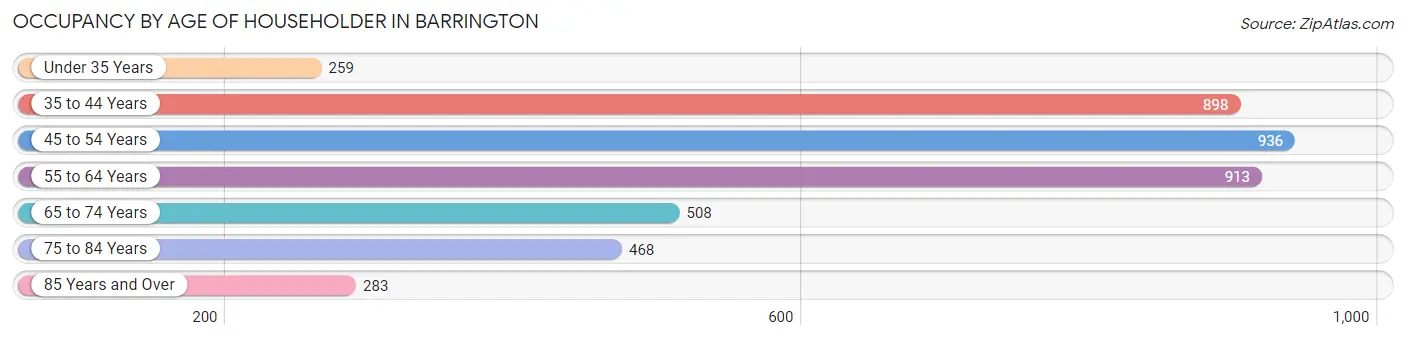
| Age Bracket | # Households | % Households |
| Under 35 Years | 259 | 6.1% |
| 35 to 44 Years | 898 | 21.1% |
| 45 to 54 Years | 936 | 22.0% |
| 55 to 64 Years | 913 | 21.4% |
| 65 to 74 Years | 508 | 11.9% |
| 75 to 84 Years | 468 | 11.0% |
| 85 Years and Over | 283 | 6.6% |
| Total | 4,265 | 100.0% |
Housing Finances in Barrington
Median Income by Occupancy in Barrington
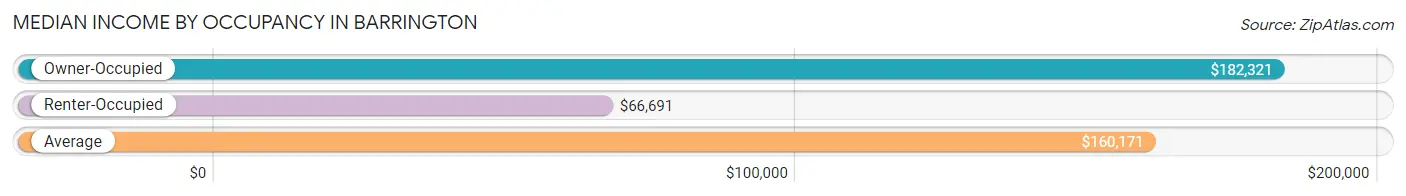
| Occupancy Type | # Households | Median Income |
| Owner-Occupied | 3,329 (78.0%) | $182,321 |
| Renter-Occupied | 936 (22.0%) | $66,691 |
| Average | 4,265 (100.0%) | $160,171 |
Occupancy by Householder Income Bracket in Barrington
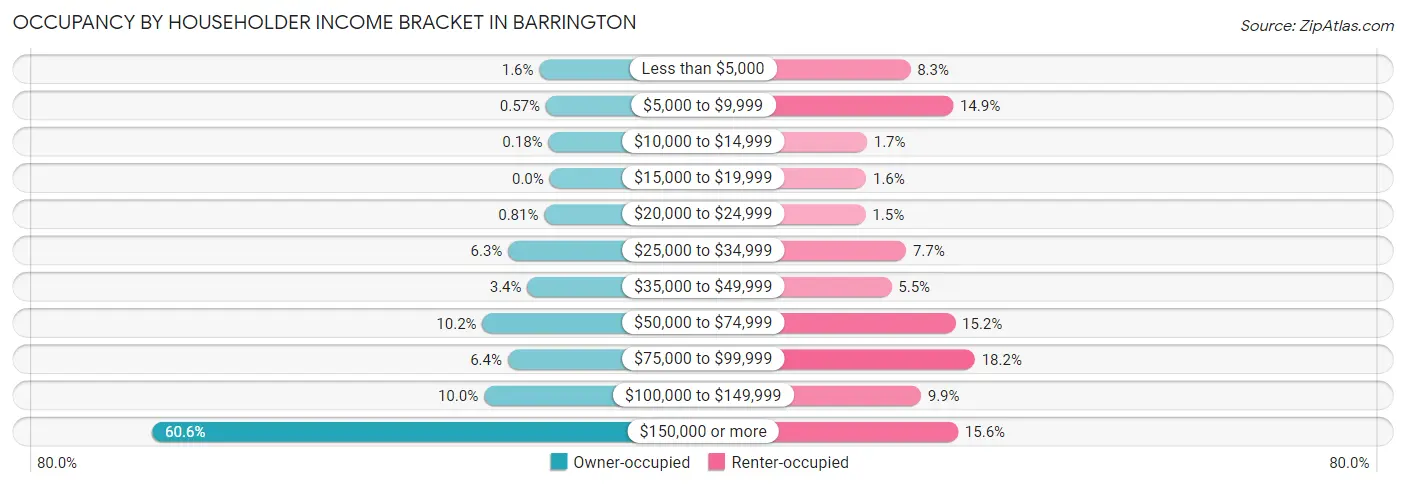
| Income Bracket | Owner-occupied | Renter-occupied |
| Less than $5,000 | 52 (1.6%) | 78 (8.3%) |
| $5,000 to $9,999 | 19 (0.6%) | 139 (14.8%) |
| $10,000 to $14,999 | 6 (0.2%) | 16 (1.7%) |
| $15,000 to $19,999 | 0 (0.0%) | 15 (1.6%) |
| $20,000 to $24,999 | 27 (0.8%) | 14 (1.5%) |
| $25,000 to $34,999 | 210 (6.3%) | 72 (7.7%) |
| $35,000 to $49,999 | 113 (3.4%) | 51 (5.4%) |
| $50,000 to $74,999 | 341 (10.2%) | 142 (15.2%) |
| $75,000 to $99,999 | 212 (6.4%) | 170 (18.2%) |
| $100,000 to $149,999 | 333 (10.0%) | 93 (9.9%) |
| $150,000 or more | 2,016 (60.6%) | 146 (15.6%) |
| Total | 3,329 (100.0%) | 936 (100.0%) |
Monthly Housing Cost Tiers in Barrington
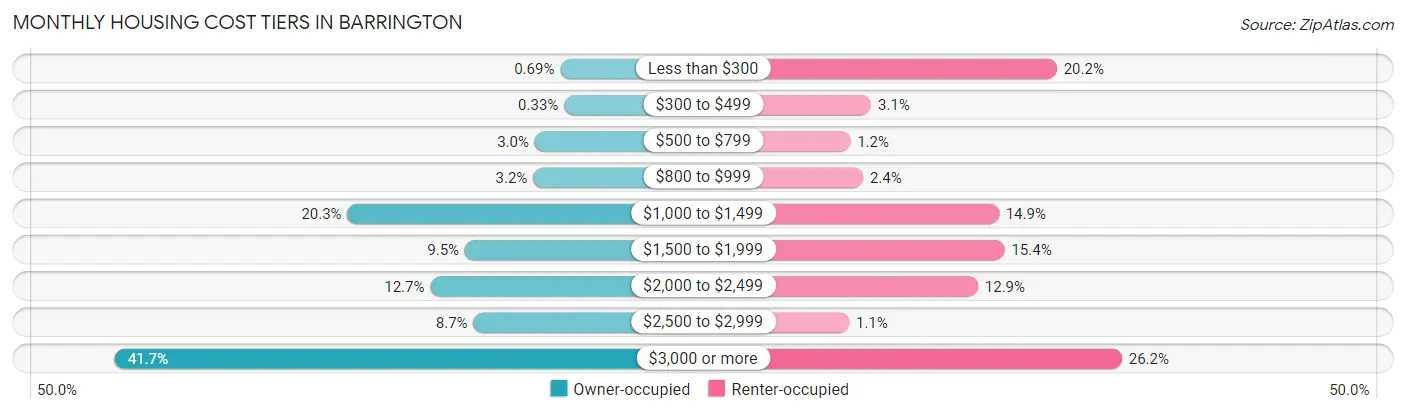
| Monthly Cost | Owner-occupied | Renter-occupied |
| Less than $300 | 23 (0.7%) | 189 (20.2%) |
| $300 to $499 | 11 (0.3%) | 29 (3.1%) |
| $500 to $799 | 101 (3.0%) | 11 (1.2%) |
| $800 to $999 | 106 (3.2%) | 22 (2.4%) |
| $1,000 to $1,499 | 675 (20.3%) | 139 (14.8%) |
| $1,500 to $1,999 | 315 (9.5%) | 144 (15.4%) |
| $2,000 to $2,499 | 421 (12.7%) | 121 (12.9%) |
| $2,500 to $2,999 | 289 (8.7%) | 10 (1.1%) |
| $3,000 or more | 1,388 (41.7%) | 245 (26.2%) |
| Total | 3,329 (100.0%) | 936 (100.0%) |
Physical Housing Characteristics in Barrington
Housing Structures in Barrington
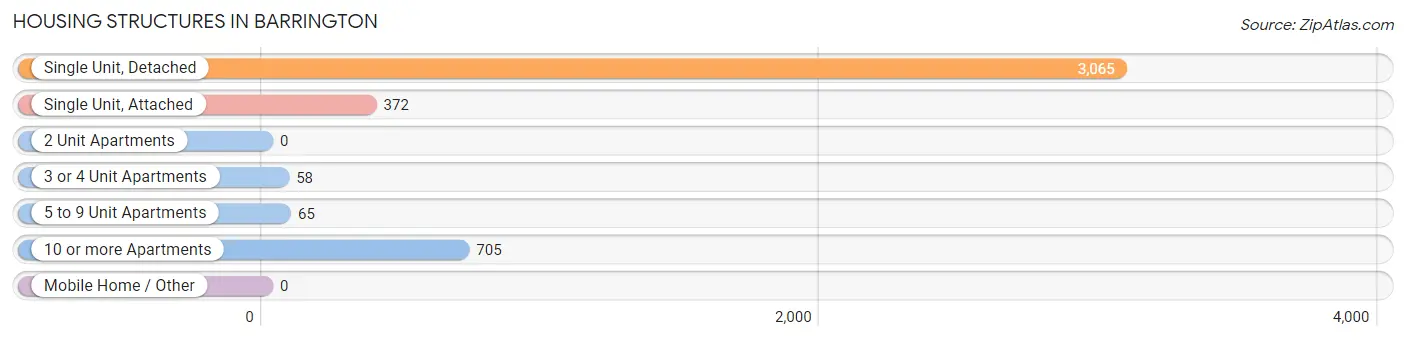
| Structure Type | # Housing Units | % Housing Units |
| Single Unit, Detached | 3,065 | 71.9% |
| Single Unit, Attached | 372 | 8.7% |
| 2 Unit Apartments | 0 | 0.0% |
| 3 or 4 Unit Apartments | 58 | 1.4% |
| 5 to 9 Unit Apartments | 65 | 1.5% |
| 10 or more Apartments | 705 | 16.5% |
| Mobile Home / Other | 0 | 0.0% |
| Total | 4,265 | 100.0% |
Housing Structures by Occupancy in Barrington
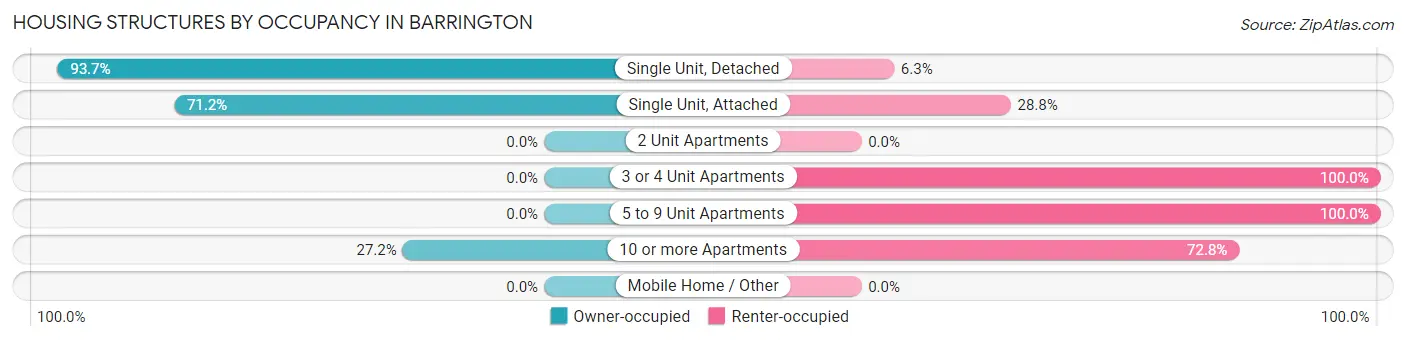
| Structure Type | Owner-occupied | Renter-occupied |
| Single Unit, Detached | 2,872 (93.7%) | 193 (6.3%) |
| Single Unit, Attached | 265 (71.2%) | 107 (28.8%) |
| 2 Unit Apartments | 0 (0.0%) | 0 (0.0%) |
| 3 or 4 Unit Apartments | 0 (0.0%) | 58 (100.0%) |
| 5 to 9 Unit Apartments | 0 (0.0%) | 65 (100.0%) |
| 10 or more Apartments | 192 (27.2%) | 513 (72.8%) |
| Mobile Home / Other | 0 (0.0%) | 0 (0.0%) |
| Total | 3,329 (78.0%) | 936 (22.0%) |
Housing Structures by Number of Rooms in Barrington
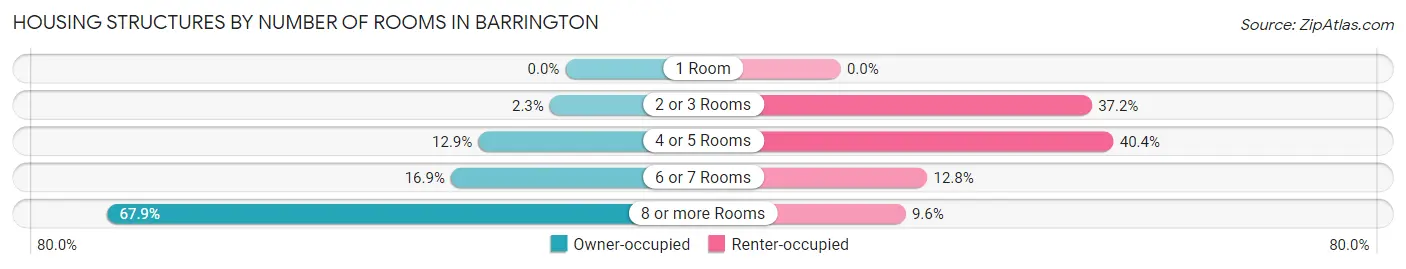
| Number of Rooms | Owner-occupied | Renter-occupied |
| 1 Room | 0 (0.0%) | 0 (0.0%) |
| 2 or 3 Rooms | 77 (2.3%) | 348 (37.2%) |
| 4 or 5 Rooms | 429 (12.9%) | 378 (40.4%) |
| 6 or 7 Rooms | 564 (16.9%) | 120 (12.8%) |
| 8 or more Rooms | 2,259 (67.9%) | 90 (9.6%) |
| Total | 3,329 (100.0%) | 936 (100.0%) |
Housing Structure by Heating Type in Barrington
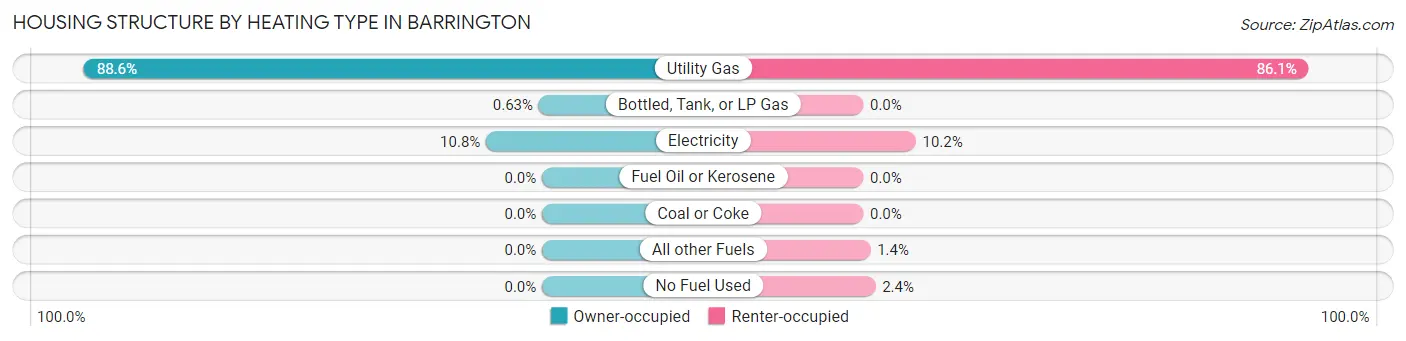
| Heating Type | Owner-occupied | Renter-occupied |
| Utility Gas | 2,948 (88.6%) | 806 (86.1%) |
| Bottled, Tank, or LP Gas | 21 (0.6%) | 0 (0.0%) |
| Electricity | 360 (10.8%) | 95 (10.2%) |
| Fuel Oil or Kerosene | 0 (0.0%) | 0 (0.0%) |
| Coal or Coke | 0 (0.0%) | 0 (0.0%) |
| All other Fuels | 0 (0.0%) | 13 (1.4%) |
| No Fuel Used | 0 (0.0%) | 22 (2.4%) |
| Total | 3,329 (100.0%) | 936 (100.0%) |
Household Vehicle Usage in Barrington
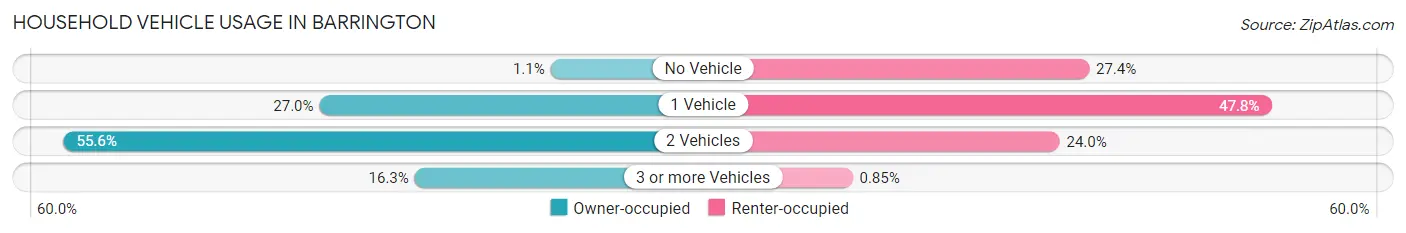
| Vehicles per Household | Owner-occupied | Renter-occupied |
| No Vehicle | 36 (1.1%) | 256 (27.4%) |
| 1 Vehicle | 898 (27.0%) | 447 (47.8%) |
| 2 Vehicles | 1,852 (55.6%) | 225 (24.0%) |
| 3 or more Vehicles | 543 (16.3%) | 8 (0.9%) |
| Total | 3,329 (100.0%) | 936 (100.0%) |
Real Estate & Mortgages in Barrington
Real Estate and Mortgage Overview in Barrington
| Characteristic | Without Mortgage | With Mortgage |
| Housing Units | 1,074 | 2,255 |
| Median Property Value | $451,700 | $578,600 |
| Median Household Income | $95,833 | $1,629 |
| Monthly Housing Costs | $1,342 | $1,388 |
| Real Estate Taxes | $8,213 | $9 |
Property Value by Mortgage Status in Barrington
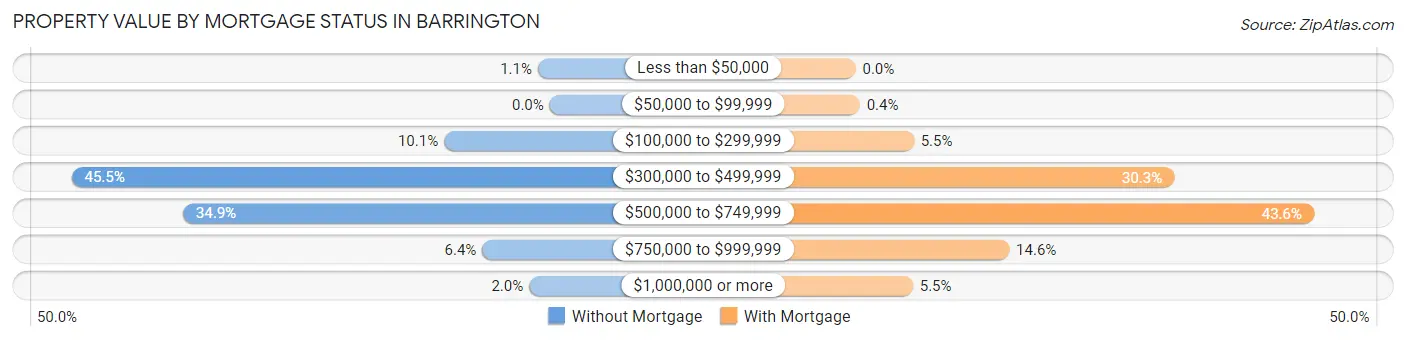
| Property Value | Without Mortgage | With Mortgage |
| Less than $50,000 | 12 (1.1%) | 0 (0.0%) |
| $50,000 to $99,999 | 0 (0.0%) | 9 (0.4%) |
| $100,000 to $299,999 | 108 (10.1%) | 125 (5.5%) |
| $300,000 to $499,999 | 489 (45.5%) | 684 (30.3%) |
| $500,000 to $749,999 | 375 (34.9%) | 984 (43.6%) |
| $750,000 to $999,999 | 69 (6.4%) | 330 (14.6%) |
| $1,000,000 or more | 21 (2.0%) | 123 (5.4%) |
| Total | 1,074 (100.0%) | 2,255 (100.0%) |
Household Income by Mortgage Status in Barrington
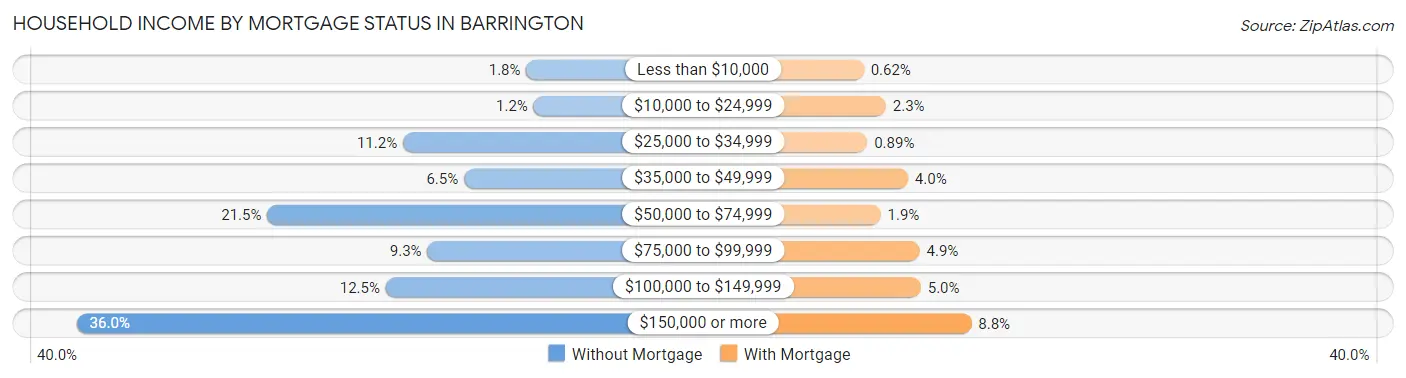
| Household Income | Without Mortgage | With Mortgage |
| Less than $10,000 | 19 (1.8%) | 14 (0.6%) |
| $10,000 to $24,999 | 13 (1.2%) | 52 (2.3%) |
| $25,000 to $34,999 | 120 (11.2%) | 20 (0.9%) |
| $35,000 to $49,999 | 70 (6.5%) | 90 (4.0%) |
| $50,000 to $74,999 | 231 (21.5%) | 43 (1.9%) |
| $75,000 to $99,999 | 100 (9.3%) | 110 (4.9%) |
| $100,000 to $149,999 | 134 (12.5%) | 112 (5.0%) |
| $150,000 or more | 387 (36.0%) | 199 (8.8%) |
| Total | 1,074 (100.0%) | 2,255 (100.0%) |
Property Value to Household Income Ratio in Barrington
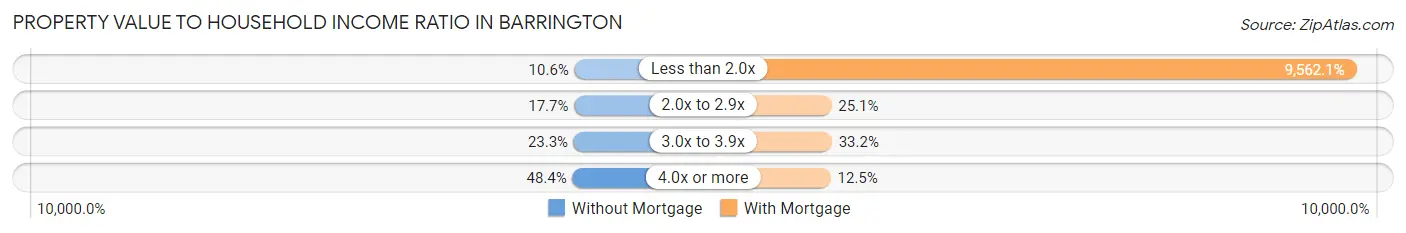
| Value-to-Income Ratio | Without Mortgage | With Mortgage |
| Less than 2.0x | 114 (10.6%) | 215,625 (9,562.1%) |
| 2.0x to 2.9x | 190 (17.7%) | 565 (25.1%) |
| 3.0x to 3.9x | 250 (23.3%) | 748 (33.2%) |
| 4.0x or more | 520 (48.4%) | 282 (12.5%) |
| Total | 1,074 (100.0%) | 2,255 (100.0%) |
Real Estate Taxes by Mortgage Status in Barrington
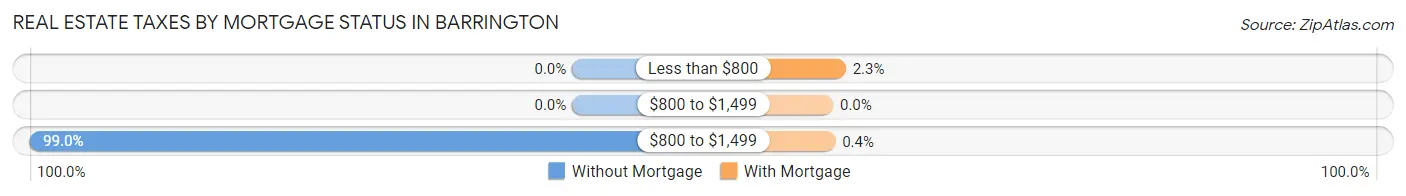
| Property Taxes | Without Mortgage | With Mortgage |
| Less than $800 | 0 (0.0%) | 52 (2.3%) |
| $800 to $1,499 | 0 (0.0%) | 0 (0.0%) |
| $800 to $1,499 | 1,063 (99.0%) | 9 (0.4%) |
| Total | 1,074 (100.0%) | 2,255 (100.0%) |
Health & Disability in Barrington
Health Insurance Coverage by Age in Barrington
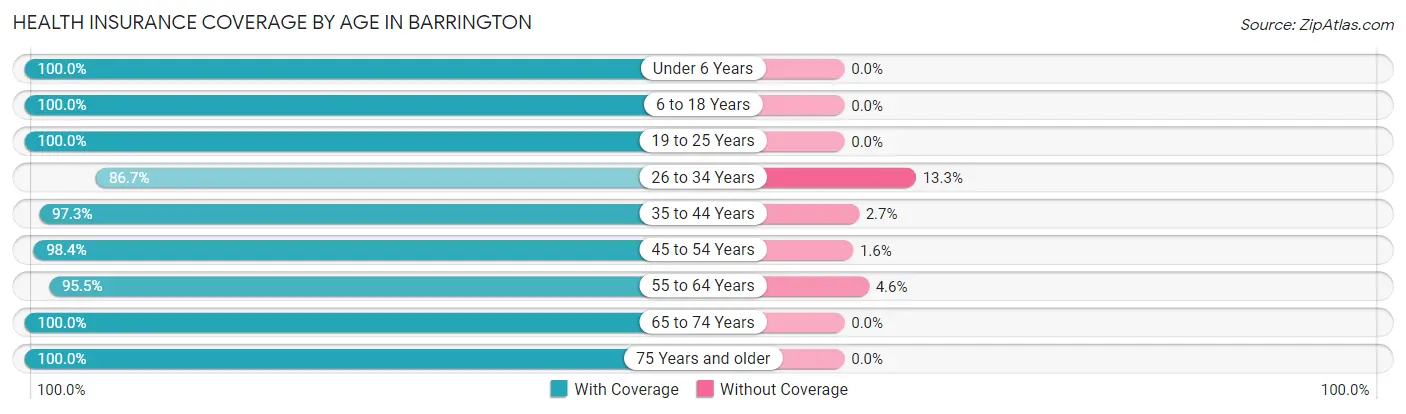
| Age Bracket | With Coverage | Without Coverage |
| Under 6 Years | 634 (100.0%) | 0 (0.0%) |
| 6 to 18 Years | 2,759 (100.0%) | 0 (0.0%) |
| 19 to 25 Years | 335 (100.0%) | 0 (0.0%) |
| 26 to 34 Years | 501 (86.7%) | 77 (13.3%) |
| 35 to 44 Years | 1,703 (97.3%) | 47 (2.7%) |
| 45 to 54 Years | 1,453 (98.4%) | 24 (1.6%) |
| 55 to 64 Years | 1,364 (95.5%) | 65 (4.5%) |
| 65 to 74 Years | 1,033 (100.0%) | 0 (0.0%) |
| 75 Years and older | 1,047 (100.0%) | 0 (0.0%) |
| Total | 10,829 (98.1%) | 213 (1.9%) |
Health Insurance Coverage by Citizenship Status in Barrington
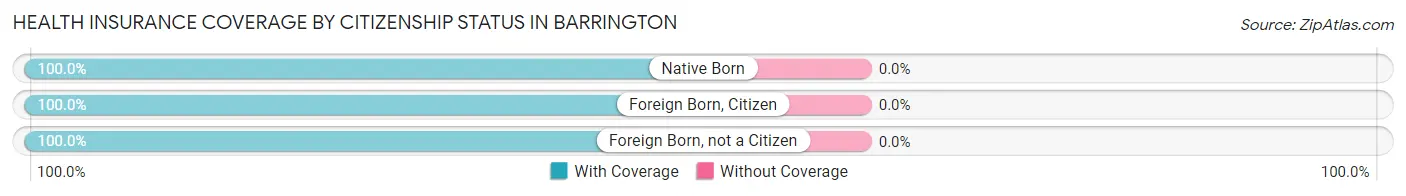
| Citizenship Status | With Coverage | Without Coverage |
| Native Born | 634 (100.0%) | 0 (0.0%) |
| Foreign Born, Citizen | 2,759 (100.0%) | 0 (0.0%) |
| Foreign Born, not a Citizen | 335 (100.0%) | 0 (0.0%) |
Health Insurance Coverage by Household Income in Barrington
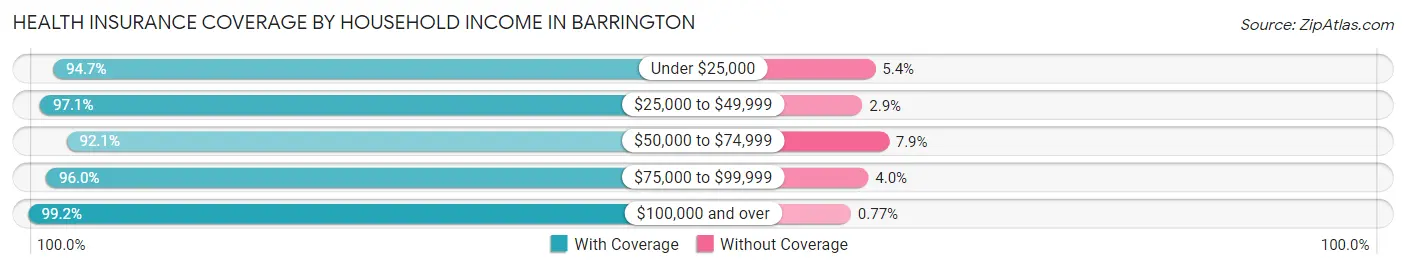
| Household Income | With Coverage | Without Coverage |
| Under $25,000 | 513 (94.7%) | 29 (5.3%) |
| $25,000 to $49,999 | 802 (97.1%) | 24 (2.9%) |
| $50,000 to $74,999 | 761 (92.1%) | 65 (7.9%) |
| $75,000 to $99,999 | 761 (96.0%) | 32 (4.0%) |
| $100,000 and over | 7,980 (99.2%) | 62 (0.8%) |
Public vs Private Health Insurance Coverage by Age in Barrington
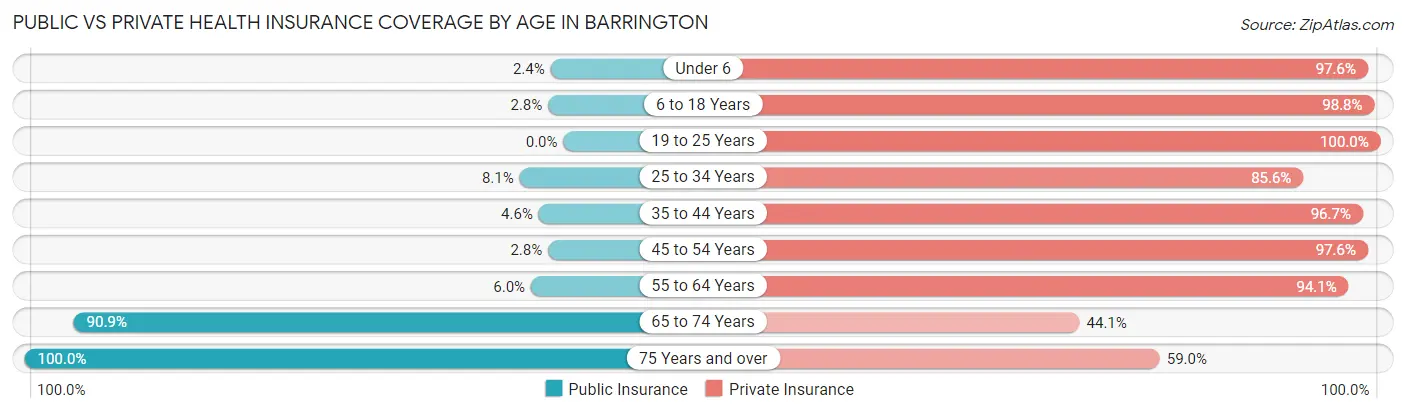
| Age Bracket | Public Insurance | Private Insurance |
| Under 6 | 15 (2.4%) | 619 (97.6%) |
| 6 to 18 Years | 78 (2.8%) | 2,727 (98.8%) |
| 19 to 25 Years | 0 (0.0%) | 335 (100.0%) |
| 25 to 34 Years | 47 (8.1%) | 495 (85.6%) |
| 35 to 44 Years | 80 (4.6%) | 1,692 (96.7%) |
| 45 to 54 Years | 42 (2.8%) | 1,442 (97.6%) |
| 55 to 64 Years | 86 (6.0%) | 1,344 (94.1%) |
| 65 to 74 Years | 939 (90.9%) | 456 (44.1%) |
| 75 Years and over | 1,047 (100.0%) | 618 (59.0%) |
| Total | 2,334 (21.1%) | 9,728 (88.1%) |
Disability Status by Sex by Age in Barrington
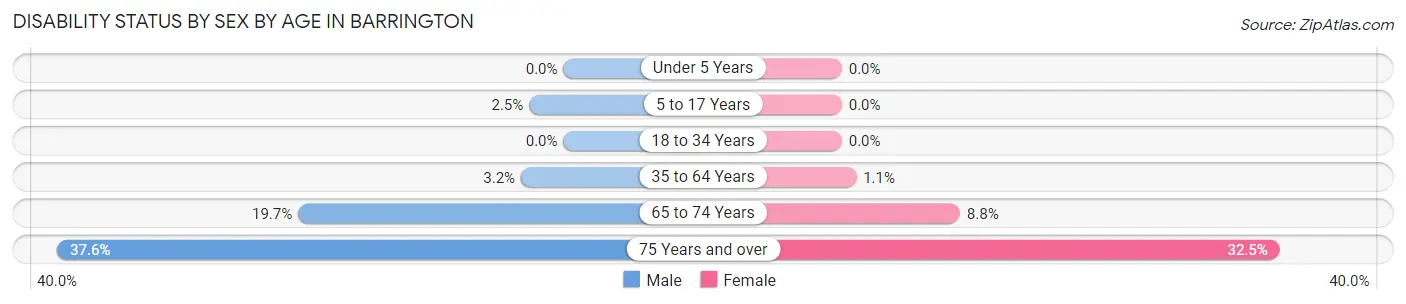
| Age Bracket | Male | Female |
| Under 5 Years | 0 (0.0%) | 0 (0.0%) |
| 5 to 17 Years | 35 (2.5%) | 0 (0.0%) |
| 18 to 34 Years | 0 (0.0%) | 0 (0.0%) |
| 35 to 64 Years | 73 (3.2%) | 25 (1.1%) |
| 65 to 74 Years | 80 (19.7%) | 55 (8.8%) |
| 75 Years and over | 168 (37.6%) | 195 (32.5%) |
Disability Class by Sex by Age in Barrington
Disability Class: Hearing Difficulty
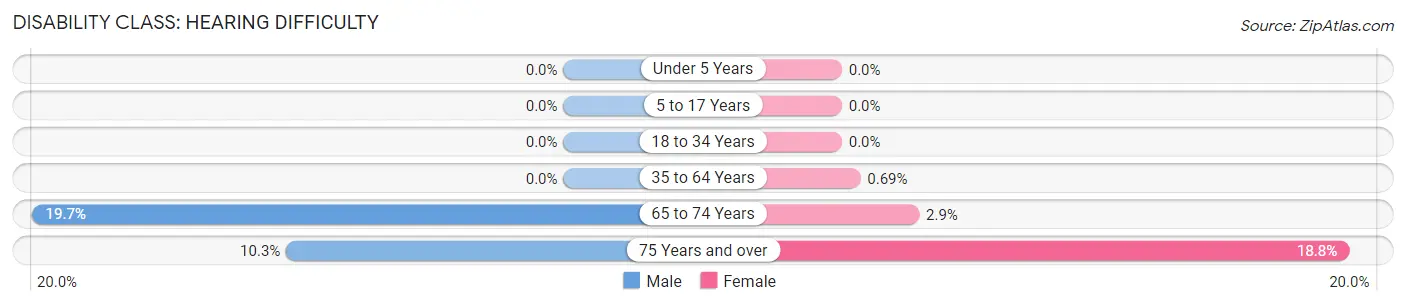
| Age Bracket | Male | Female |
| Under 5 Years | 0 (0.0%) | 0 (0.0%) |
| 5 to 17 Years | 0 (0.0%) | 0 (0.0%) |
| 18 to 34 Years | 0 (0.0%) | 0 (0.0%) |
| 35 to 64 Years | 0 (0.0%) | 16 (0.7%) |
| 65 to 74 Years | 80 (19.7%) | 18 (2.9%) |
| 75 Years and over | 46 (10.3%) | 113 (18.8%) |
Disability Class: Vision Difficulty
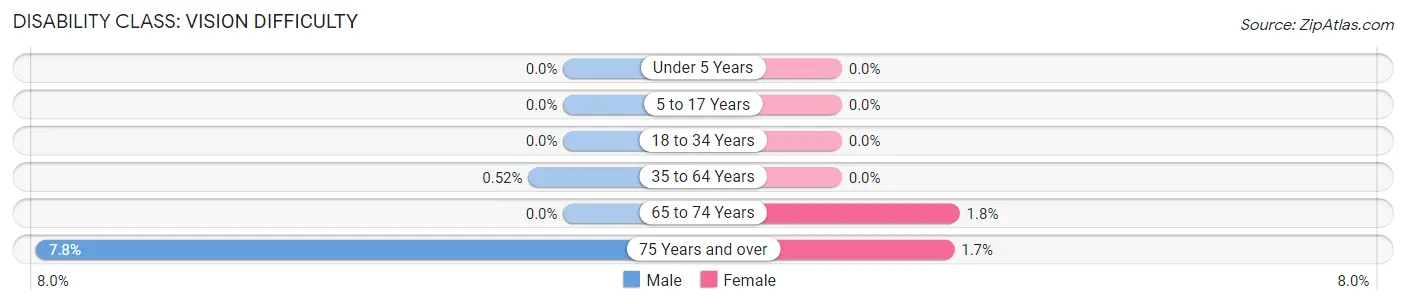
| Age Bracket | Male | Female |
| Under 5 Years | 0 (0.0%) | 0 (0.0%) |
| 5 to 17 Years | 0 (0.0%) | 0 (0.0%) |
| 18 to 34 Years | 0 (0.0%) | 0 (0.0%) |
| 35 to 64 Years | 12 (0.5%) | 0 (0.0%) |
| 65 to 74 Years | 0 (0.0%) | 11 (1.8%) |
| 75 Years and over | 35 (7.8%) | 10 (1.7%) |
Disability Class: Cognitive Difficulty
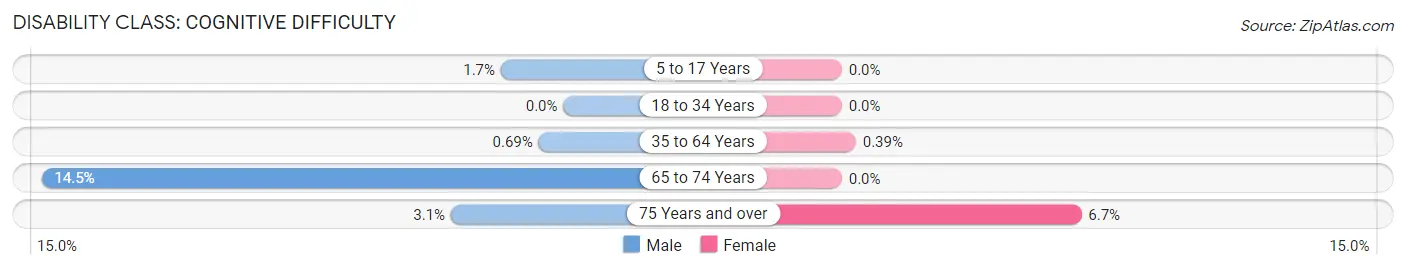
| Age Bracket | Male | Female |
| 5 to 17 Years | 24 (1.7%) | 0 (0.0%) |
| 18 to 34 Years | 0 (0.0%) | 0 (0.0%) |
| 35 to 64 Years | 16 (0.7%) | 9 (0.4%) |
| 65 to 74 Years | 59 (14.5%) | 0 (0.0%) |
| 75 Years and over | 14 (3.1%) | 40 (6.7%) |
Disability Class: Ambulatory Difficulty
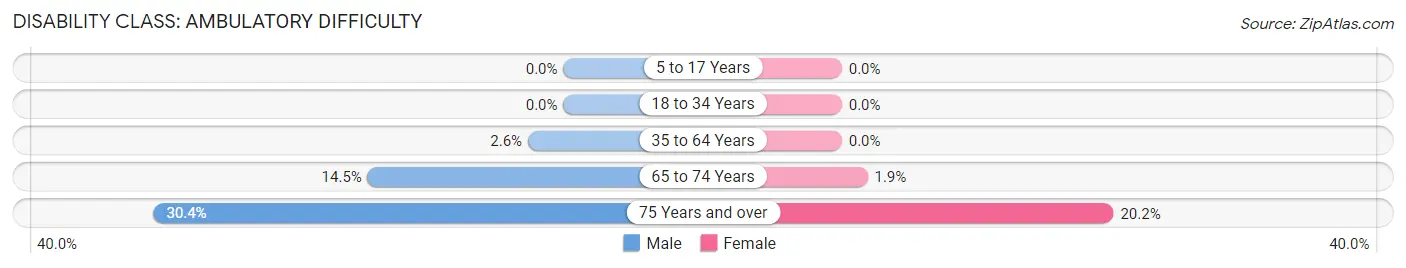
| Age Bracket | Male | Female |
| 5 to 17 Years | 0 (0.0%) | 0 (0.0%) |
| 18 to 34 Years | 0 (0.0%) | 0 (0.0%) |
| 35 to 64 Years | 61 (2.6%) | 0 (0.0%) |
| 65 to 74 Years | 59 (14.5%) | 12 (1.9%) |
| 75 Years and over | 136 (30.4%) | 121 (20.2%) |
Disability Class: Self-Care Difficulty
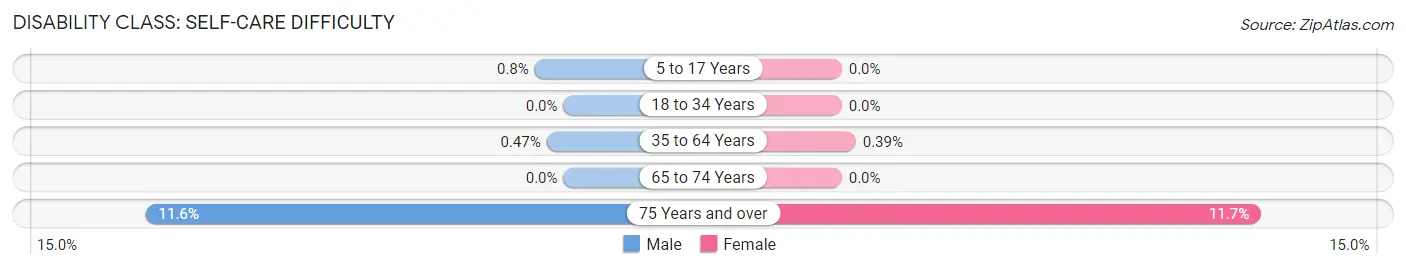
| Age Bracket | Male | Female |
| 5 to 17 Years | 11 (0.8%) | 0 (0.0%) |
| 18 to 34 Years | 0 (0.0%) | 0 (0.0%) |
| 35 to 64 Years | 11 (0.5%) | 9 (0.4%) |
| 65 to 74 Years | 0 (0.0%) | 0 (0.0%) |
| 75 Years and over | 52 (11.6%) | 70 (11.7%) |
Technology Access in Barrington
Computing Device Access in Barrington
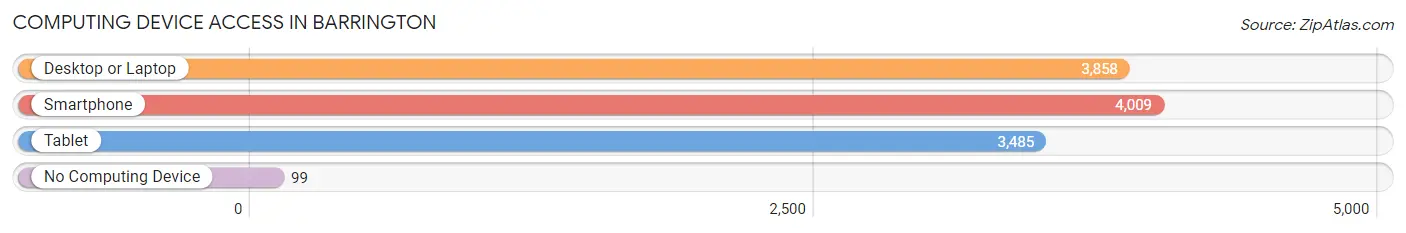
| Device Type | # Households | % Households |
| Desktop or Laptop | 3,858 | 90.5% |
| Smartphone | 4,009 | 94.0% |
| Tablet | 3,485 | 81.7% |
| No Computing Device | 99 | 2.3% |
| Total | 4,265 | 100.0% |
Internet Access in Barrington
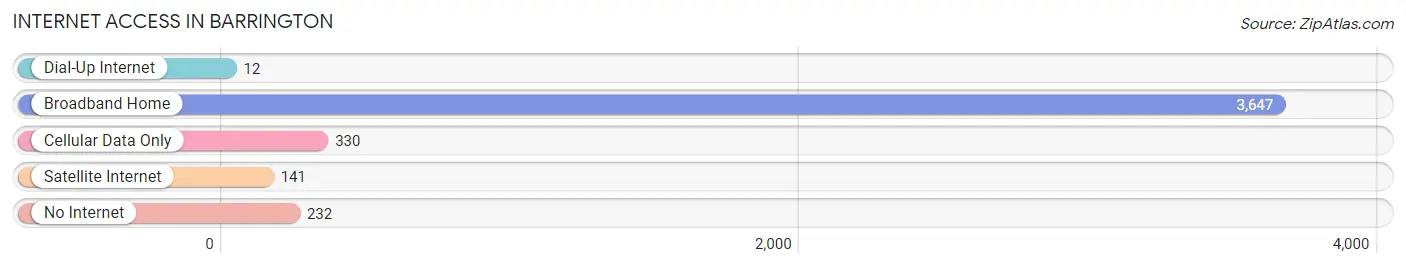
| Internet Type | # Households | % Households |
| Dial-Up Internet | 12 | 0.3% |
| Broadband Home | 3,647 | 85.5% |
| Cellular Data Only | 330 | 7.7% |
| Satellite Internet | 141 | 3.3% |
| No Internet | 232 | 5.4% |
| Total | 4,265 | 100.0% |
Barrington Summary
Barrington, Illinois is a village located in Cook and Lake Counties, approximately 32 miles northwest of Chicago. It is a part of the Chicago metropolitan area and is considered a suburb of the city. The village has a population of 10,327 as of the 2010 census, and is known for its affluent and educated population.
History
Barrington was first settled in 1834 by settlers from New England. The village was originally known as Barrington Center, and was incorporated in 1865. The village was named after Barrington, Rhode Island, the hometown of one of the original settlers.
In the late 19th century, Barrington was a popular summer destination for wealthy Chicagoans, who built large estates in the area. The village was also home to several large farms, which provided produce to the city.
Geography
Barrington is located in Cook and Lake Counties, approximately 32 miles northwest of Chicago. It is bordered by Lake Zurich to the north, Deer Park to the east, South Barrington to the south, and Inverness to the west. The village covers an area of 8.3 square miles, and is located in the Fox River Valley.
The village is located in a hilly region, with elevations ranging from 690 to 890 feet above sea level. The highest point in the village is located at the intersection of Lake Zurich Road and Old Sutton Road.
Economy
Barrington is a wealthy village, with a median household income of $118,890 as of the 2010 census. The village is home to several large businesses, including Barrington Bank & Trust, Barrington Research Associates, and Barrington Medical Center.
The village is also home to several retail stores, restaurants, and other businesses. The village is served by the Metra commuter rail line, which provides access to downtown Chicago.
Demographics
As of the 2010 census, Barrington had a population of 10,327. The racial makeup of the village was 94.2% White, 1.2% African American, 0.2% Native American, 2.7% Asian, 0.1% Pacific Islander, 0.7% from other races, and 1.0% from two or more races. Hispanic or Latino of any race were 3.2% of the population.
The median age in Barrington was 44.2 years, with 25.2% of the population under the age of 18, and 8.2% over the age of 65. The village is highly educated, with 92.2% of the population over the age of 25 having a bachelor's degree or higher.
Conclusion
Barrington, Illinois is a village located in Cook and Lake Counties, approximately 32 miles northwest of Chicago. It is a part of the Chicago metropolitan area and is considered a suburb of the city. The village has a population of 10,327 as of the 2010 census, and is known for its affluent and educated population. Barrington is located in a hilly region, with elevations ranging from 690 to 890 feet above sea level. The village is home to several large businesses, and is served by the Metra commuter rail line. The village is highly educated, with 92.2% of the population over the age of 25 having a bachelor's degree or higher.
Common Questions
What is Per Capita Income in Barrington?
Per Capita income in Barrington is $73,446.
What is the Median Family Income in Barrington?
Median Family Income in Barrington is $191,897.
What is the Median Household income in Barrington?
Median Household Income in Barrington is $160,171.
What is Income or Wage Gap in Barrington?
Income or Wage Gap in Barrington is 48.8%.
Women in Barrington earn 51.2 cents for every dollar earned by a man.
What is Inequality or Gini Index in Barrington?
Inequality or Gini Index in Barrington is 0.47.
What is the Total Population of Barrington?
Total Population of Barrington is 11,244.
What is the Total Male Population of Barrington?
Total Male Population of Barrington is 5,296.
What is the Total Female Population of Barrington?
Total Female Population of Barrington is 5,948.
What is the Ratio of Males per 100 Females in Barrington?
There are 89.04 Males per 100 Females in Barrington.
What is the Ratio of Females per 100 Males in Barrington?
There are 112.31 Females per 100 Males in Barrington.
What is the Median Population Age in Barrington?
Median Population Age in Barrington is 42.4 Years.
What is the Average Family Size in Barrington
Average Family Size in Barrington is 3.1 People.
What is the Average Household Size in Barrington
Average Household Size in Barrington is 2.6 People.
How Large is the Labor Force in Barrington?
There are 4,960 People in the Labor Forcein in Barrington.
What is the Percentage of People in the Labor Force in Barrington?
59.4% of People are in the Labor Force in Barrington.
What is the Unemployment Rate in Barrington?
Unemployment Rate in Barrington is 3.9%.