La Harpe, KS Map & Demographics
La Harpe Map
La Harpe Overview
$26,287
PER CAPITA INCOME
$56,667
AVG FAMILY INCOME
$39,722
AVG HOUSEHOLD INCOME
0.35
INEQUALITY / GINI INDEX
555
TOTAL POPULATION
303
MALE POPULATION
252
FEMALE POPULATION
120.24
MALES / 100 FEMALES
83.17
FEMALES / 100 MALES
52.5
MEDIAN AGE
2.4
AVG FAMILY SIZE
2.1
AVG HOUSEHOLD SIZE
300
LABOR FORCE [ PEOPLE ]
60.6%
PERCENT IN LABOR FORCE
3.3%
UNEMPLOYMENT RATE
La Harpe Zip Codes
La Harpe Area Codes
Income in La Harpe
Income Overview in La Harpe
Per Capita Income in La Harpe is $26,287, while median incomes of families and households are $56,667 and $39,722 respectively.
| Characteristic | Number | Measure |
| Per Capita Income | 555 | $26,287 |
| Median Family Income | 200 | $56,667 |
| Mean Family Income | 200 | $67,195 |
| Median Household Income | 266 | $39,722 |
| Mean Household Income | 266 | $58,267 |
| Income Deficit | 200 | $0 |
| Wage / Income Gap (%) | 555 | 0.00% |
| Wage / Income Gap ($) | 555 | 100.00¢ per $1 |
| Gini / Inequality Index | 555 | 0.35 |
Earnings by Sex in La Harpe
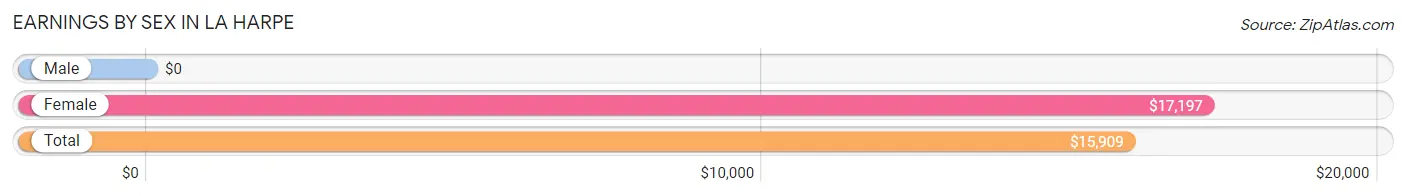
| Sex | Number | Average Earnings |
| Male | 182 (59.9%) | $0 |
| Female | 122 (40.1%) | $17,197 |
| Total | 304 (100.0%) | $15,909 |
Earnings by Sex by Income Bracket in La Harpe
The most common earnings brackets in La Harpe are $2,500 to $4,999 for men (57 | 31.3%) and $15,000 to $17,499 for women (33 | 27.1%).
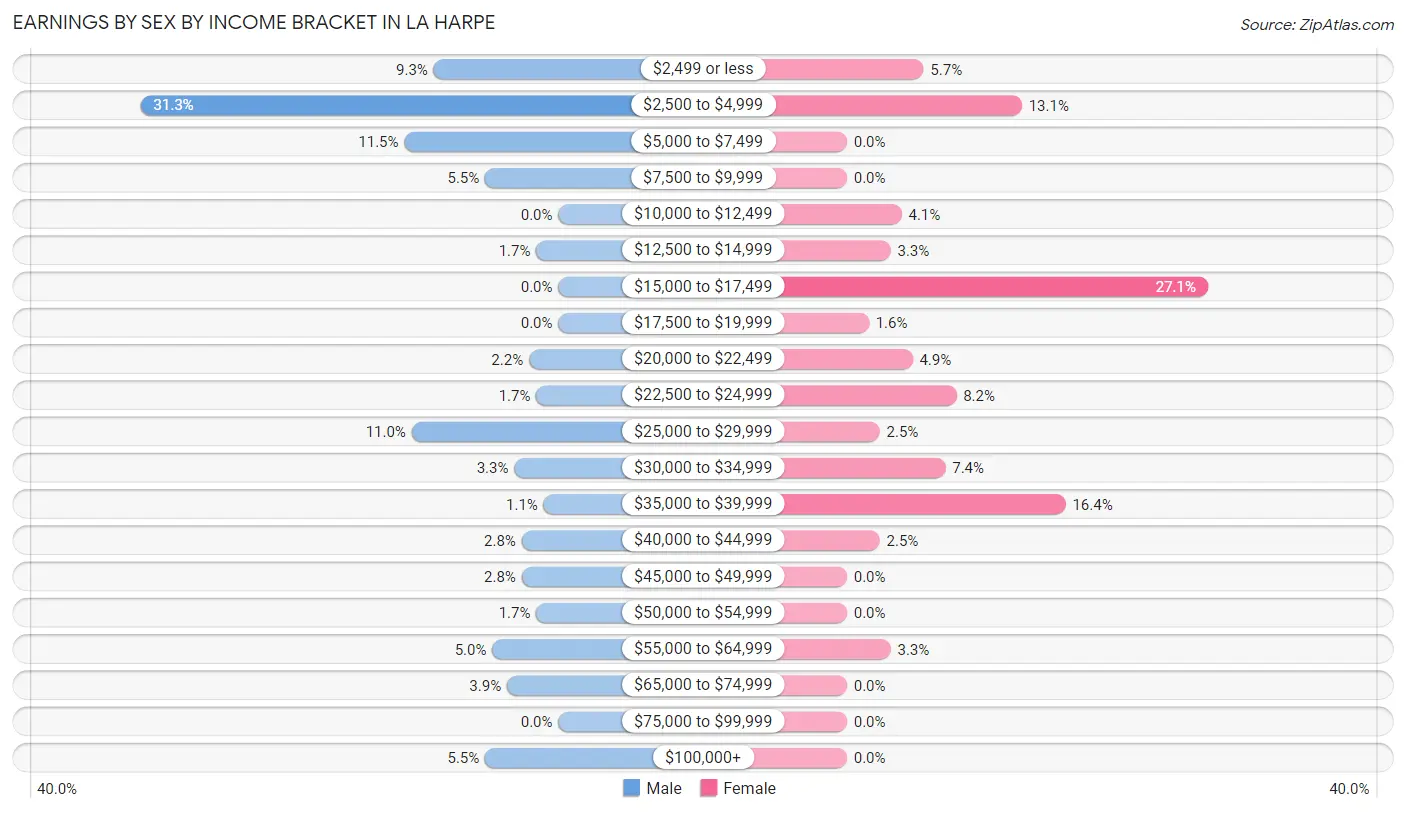
| Income | Male | Female |
| $2,499 or less | 17 (9.3%) | 7 (5.7%) |
| $2,500 to $4,999 | 57 (31.3%) | 16 (13.1%) |
| $5,000 to $7,499 | 21 (11.5%) | 0 (0.0%) |
| $7,500 to $9,999 | 10 (5.5%) | 0 (0.0%) |
| $10,000 to $12,499 | 0 (0.0%) | 5 (4.1%) |
| $12,500 to $14,999 | 3 (1.7%) | 4 (3.3%) |
| $15,000 to $17,499 | 0 (0.0%) | 33 (27.1%) |
| $17,500 to $19,999 | 0 (0.0%) | 2 (1.6%) |
| $20,000 to $22,499 | 4 (2.2%) | 6 (4.9%) |
| $22,500 to $24,999 | 3 (1.7%) | 10 (8.2%) |
| $25,000 to $29,999 | 20 (11.0%) | 3 (2.5%) |
| $30,000 to $34,999 | 6 (3.3%) | 9 (7.4%) |
| $35,000 to $39,999 | 2 (1.1%) | 20 (16.4%) |
| $40,000 to $44,999 | 5 (2.8%) | 3 (2.5%) |
| $45,000 to $49,999 | 5 (2.8%) | 0 (0.0%) |
| $50,000 to $54,999 | 3 (1.7%) | 0 (0.0%) |
| $55,000 to $64,999 | 9 (5.0%) | 4 (3.3%) |
| $65,000 to $74,999 | 7 (3.8%) | 0 (0.0%) |
| $75,000 to $99,999 | 0 (0.0%) | 0 (0.0%) |
| $100,000+ | 10 (5.5%) | 0 (0.0%) |
| Total | 182 (100.0%) | 122 (100.0%) |
Earnings by Sex by Educational Attainment in La Harpe
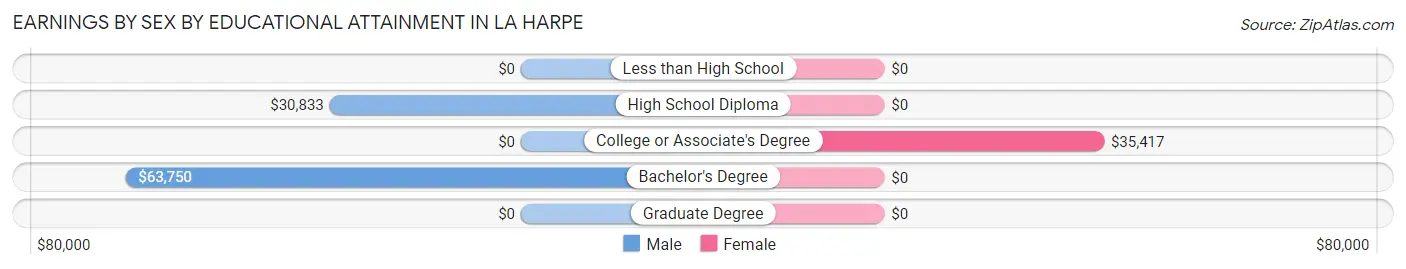
| Educational Attainment | Male Income | Female Income |
| Less than High School | - | - |
| High School Diploma | $30,833 | $0 |
| College or Associate's Degree | - | - |
| Bachelor's Degree | $63,750 | $0 |
| Graduate Degree | - | - |
| Total | - | - |
Family Income in La Harpe
Family Income Brackets in La Harpe
According to the La Harpe family income data, there are 60 families falling into the $100,000 to $149,999 income range, which is the most common income bracket and makes up 30.0% of all families.
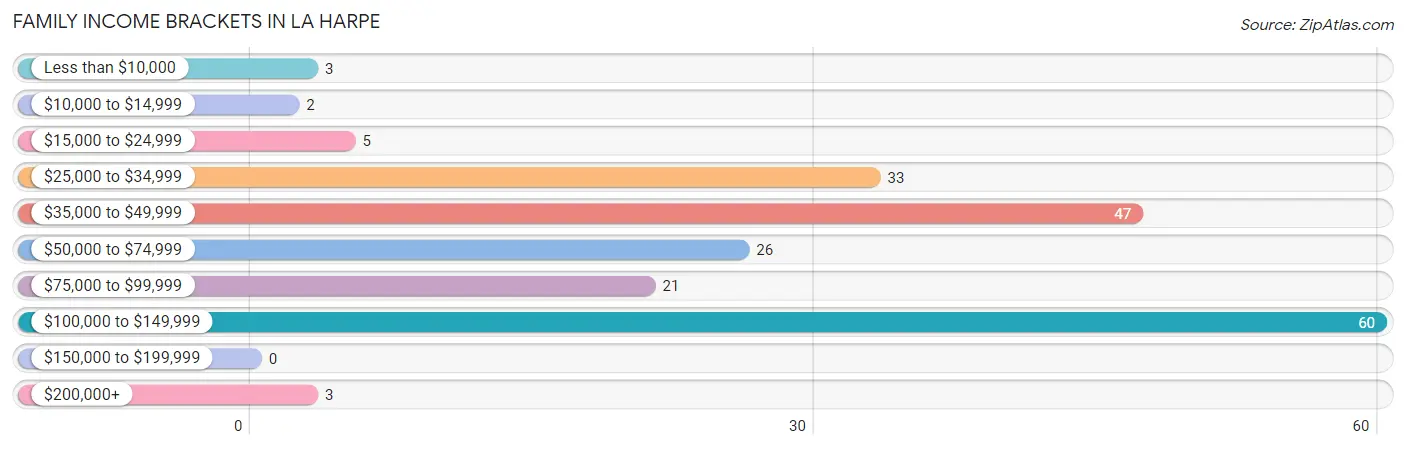
| Income Bracket | # Families | % Families |
| Less than $10,000 | 3 | 1.5% |
| $10,000 to $14,999 | 2 | 1.0% |
| $15,000 to $24,999 | 5 | 2.5% |
| $25,000 to $34,999 | 33 | 16.5% |
| $35,000 to $49,999 | 47 | 23.5% |
| $50,000 to $74,999 | 26 | 13.0% |
| $75,000 to $99,999 | 21 | 10.5% |
| $100,000 to $149,999 | 60 | 30.0% |
| $150,000 to $199,999 | 0 | 0.0% |
| $200,000+ | 3 | 1.5% |
Family Income by Famaliy Size in La Harpe
4-person families (11 | 5.5%) account for the highest median family income in La Harpe with $118,750 per family, while 4-person families (11 | 5.5%) have the highest median income of $29,688 per family member.
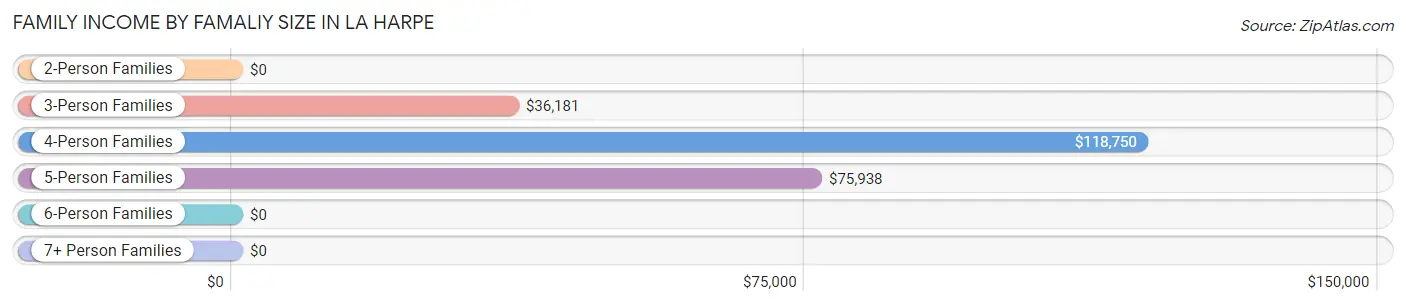
| Income Bracket | # Families | Median Income |
| 2-Person Families | 127 (63.5%) | $0 |
| 3-Person Families | 47 (23.5%) | $36,181 |
| 4-Person Families | 11 (5.5%) | $118,750 |
| 5-Person Families | 15 (7.5%) | $75,938 |
| 6-Person Families | 0 (0.0%) | $0 |
| 7+ Person Families | 0 (0.0%) | $0 |
| Total | 200 (100.0%) | $56,667 |
Family Income by Number of Earners in La Harpe
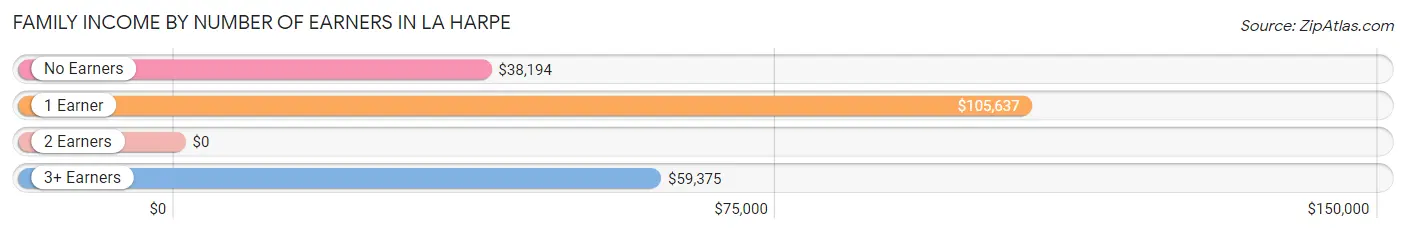
| Number of Earners | # Families | Median Income |
| No Earners | 50 (25.0%) | $38,194 |
| 1 Earner | 85 (42.5%) | $105,637 |
| 2 Earners | 36 (18.0%) | $0 |
| 3+ Earners | 29 (14.5%) | $59,375 |
| Total | 200 (100.0%) | $56,667 |
Household Income in La Harpe
Household Income Brackets in La Harpe
With 60 households falling in the category, the $100,000 to $149,999 income range is the most frequent in La Harpe, accounting for 22.6% of all households.
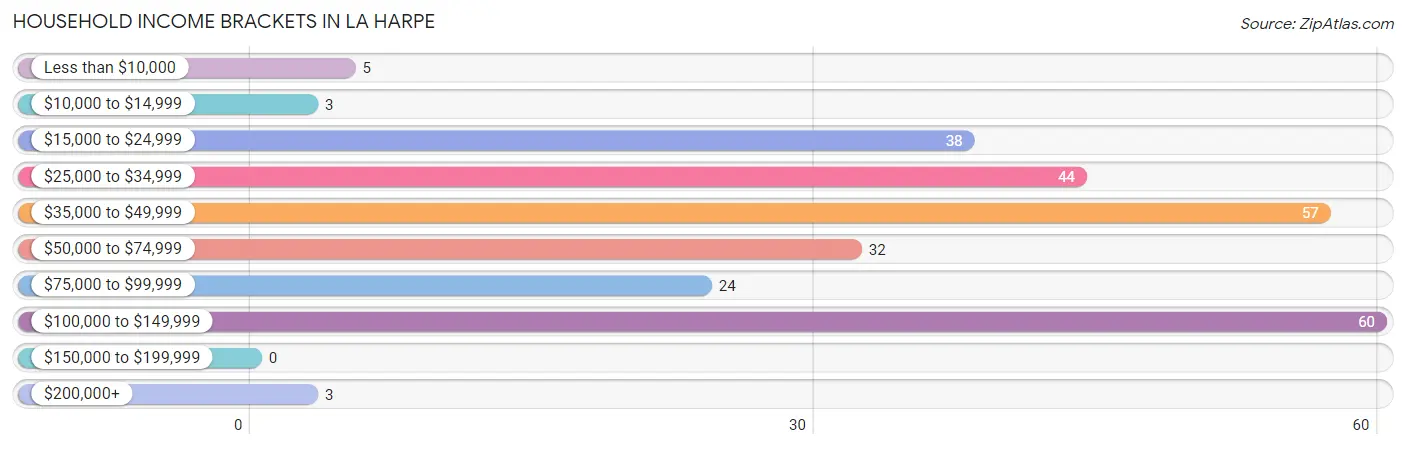
| Income Bracket | # Households | % Households |
| Less than $10,000 | 5 | 1.9% |
| $10,000 to $14,999 | 3 | 1.1% |
| $15,000 to $24,999 | 38 | 14.3% |
| $25,000 to $34,999 | 44 | 16.5% |
| $35,000 to $49,999 | 57 | 21.4% |
| $50,000 to $74,999 | 32 | 12.0% |
| $75,000 to $99,999 | 24 | 9.0% |
| $100,000 to $149,999 | 60 | 22.6% |
| $150,000 to $199,999 | 0 | 0.0% |
| $200,000+ | 3 | 1.1% |
Household Income by Householder Age in La Harpe
The median household income in La Harpe is $39,722, with the highest median household income of $77,188 found in the 65+ years age bracket for the primary householder. A total of 111 households (41.7%) fall into this category. Meanwhile, the 15 to 24 years age bracket for the primary householder has the lowest median household income of $0, with 3 households (1.1%) in this group.
| Income Bracket | # Households | Median Income |
| 15 to 24 Years | 3 (1.1%) | $0 |
| 25 to 44 Years | 34 (12.8%) | $75,714 |
| 45 to 64 Years | 118 (44.4%) | $34,000 |
| 65+ Years | 111 (41.7%) | $77,188 |
| Total | 266 (100.0%) | $39,722 |
Poverty in La Harpe
Income Below Poverty by Sex and Age in La Harpe
With 4.6% poverty level for males and 6.8% for females among the residents of La Harpe, 12 to 14 year old males and 25 to 34 year old females are the most vulnerable to poverty, with 2 males (33.3%) and 1 females (20.0%) in their respective age groups living below the poverty level.
| Age Bracket | Male | Female |
| Under 5 Years | 0 (0.0%) | 0 (0.0%) |
| 5 Years | 0 (0.0%) | 0 (0.0%) |
| 6 to 11 Years | 2 (15.4%) | 0 (0.0%) |
| 12 to 14 Years | 2 (33.3%) | 0 (0.0%) |
| 15 Years | 0 (0.0%) | 0 (0.0%) |
| 16 and 17 Years | 0 (0.0%) | 0 (0.0%) |
| 18 to 24 Years | 0 (0.0%) | 2 (5.3%) |
| 25 to 34 Years | 4 (28.6%) | 1 (20.0%) |
| 35 to 44 Years | 0 (0.0%) | 2 (7.7%) |
| 45 to 54 Years | 0 (0.0%) | 8 (19.5%) |
| 55 to 64 Years | 6 (10.0%) | 3 (5.8%) |
| 65 to 74 Years | 0 (0.0%) | 1 (4.5%) |
| 75 Years and over | 0 (0.0%) | 0 (0.0%) |
| Total | 14 (4.6%) | 17 (6.8%) |
Income Above Poverty by Sex and Age in La Harpe
According to the poverty statistics in La Harpe, males aged 15 years and females aged under 5 years are the age groups that are most secure financially, with 100.0% of males and 100.0% of females in these age groups living above the poverty line.
| Age Bracket | Male | Female |
| Under 5 Years | 0 (0.0%) | 5 (100.0%) |
| 5 Years | 0 (0.0%) | 0 (0.0%) |
| 6 to 11 Years | 11 (84.6%) | 18 (100.0%) |
| 12 to 14 Years | 4 (66.7%) | 15 (100.0%) |
| 15 Years | 3 (100.0%) | 0 (0.0%) |
| 16 and 17 Years | 28 (100.0%) | 1 (100.0%) |
| 18 to 24 Years | 38 (100.0%) | 36 (94.7%) |
| 25 to 34 Years | 10 (71.4%) | 4 (80.0%) |
| 35 to 44 Years | 21 (100.0%) | 24 (92.3%) |
| 45 to 54 Years | 25 (100.0%) | 33 (80.5%) |
| 55 to 64 Years | 54 (90.0%) | 49 (94.2%) |
| 65 to 74 Years | 84 (100.0%) | 21 (95.5%) |
| 75 Years and over | 11 (100.0%) | 29 (100.0%) |
| Total | 289 (95.4%) | 235 (93.2%) |
Income Below Poverty Among Married-Couple Families in La Harpe
The poverty statistics for married-couple families in La Harpe show that 2.2% or 3 of the total 137 families live below the poverty line. Families with no children have the highest poverty rate of 2.6%, comprising of 3 families. On the other hand, families with 1 or 2 children have the lowest poverty rate of 0.0%, which includes 0 families.
| Children | Above Poverty | Below Poverty |
| No Children | 113 (97.4%) | 3 (2.6%) |
| 1 or 2 Children | 21 (100.0%) | 0 (0.0%) |
| 3 or 4 Children | 0 (0.0%) | 0 (0.0%) |
| 5 or more Children | 0 (0.0%) | 0 (0.0%) |
| Total | 134 (97.8%) | 3 (2.2%) |
Income Below Poverty Among Single-Parent Households in La Harpe
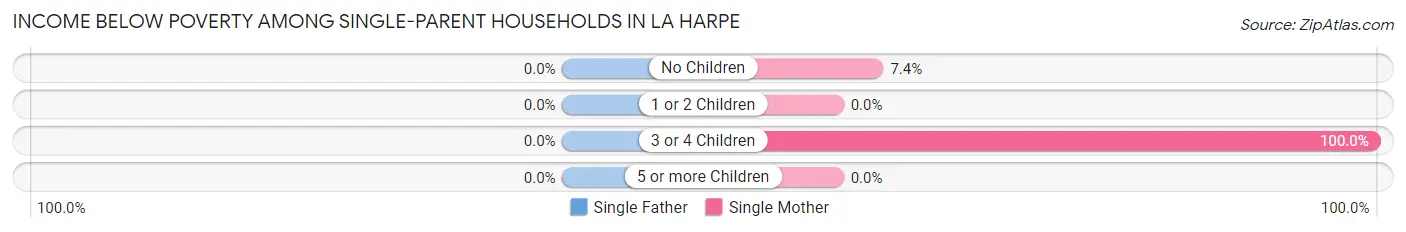
| Children | Single Father | Single Mother |
| No Children | 0 (0.0%) | 2 (7.4%) |
| 1 or 2 Children | 0 (0.0%) | 0 (0.0%) |
| 3 or 4 Children | 0 (0.0%) | 1 (100.0%) |
| 5 or more Children | 0 (0.0%) | 0 (0.0%) |
| Total | 0 (0.0%) | 3 (4.8%) |
Income Below Poverty Among Married-Couple vs Single-Parent Households in La Harpe
The poverty data for La Harpe shows that 3 of the married-couple family households (2.2%) and 3 of the single-parent households (4.8%) are living below the poverty level. Within the married-couple family households, those with no children have the highest poverty rate, with 3 households (2.6%) falling below the poverty line. Among the single-parent households, those with 3 or 4 children have the highest poverty rate, with 1 household (100.0%) living below poverty.
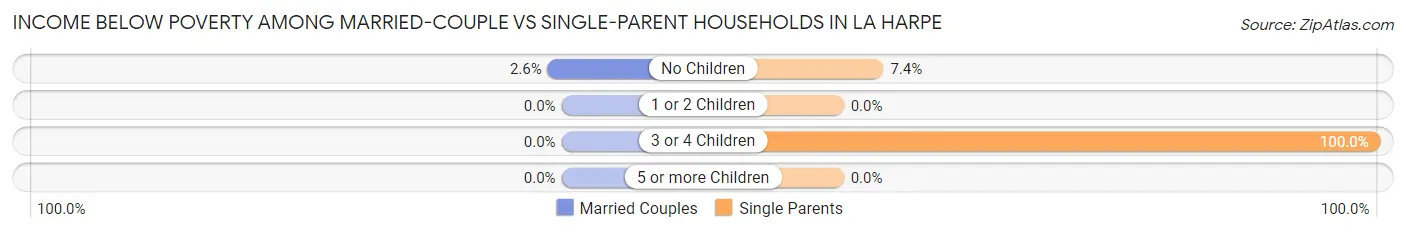
| Children | Married-Couple Families | Single-Parent Households |
| No Children | 3 (2.6%) | 2 (7.4%) |
| 1 or 2 Children | 0 (0.0%) | 0 (0.0%) |
| 3 or 4 Children | 0 (0.0%) | 1 (100.0%) |
| 5 or more Children | 0 (0.0%) | 0 (0.0%) |
| Total | 3 (2.2%) | 3 (4.8%) |
Race in La Harpe
The most populous races in La Harpe are White / Caucasian (522 | 94.1%), Asian (17 | 3.1%), and Two or more Races (13 | 2.3%).
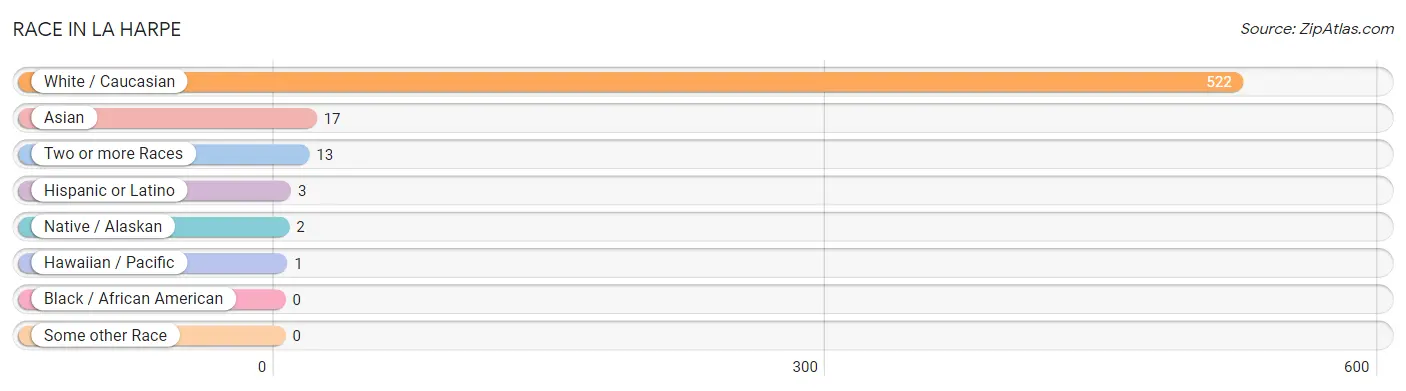
| Race | # Population | % Population |
| Asian | 17 | 3.1% |
| Black / African American | 0 | 0.0% |
| Hawaiian / Pacific | 1 | 0.2% |
| Hispanic or Latino | 3 | 0.5% |
| Native / Alaskan | 2 | 0.4% |
| White / Caucasian | 522 | 94.1% |
| Two or more Races | 13 | 2.3% |
| Some other Race | 0 | 0.0% |
| Total | 555 | 100.0% |
Ancestry in La Harpe
The most populous ancestries reported in La Harpe are German (125 | 22.5%), American (74 | 13.3%), Irish (66 | 11.9%), Swedish (34 | 6.1%), and English (33 | 5.9%), together accounting for 59.8% of all La Harpe residents.
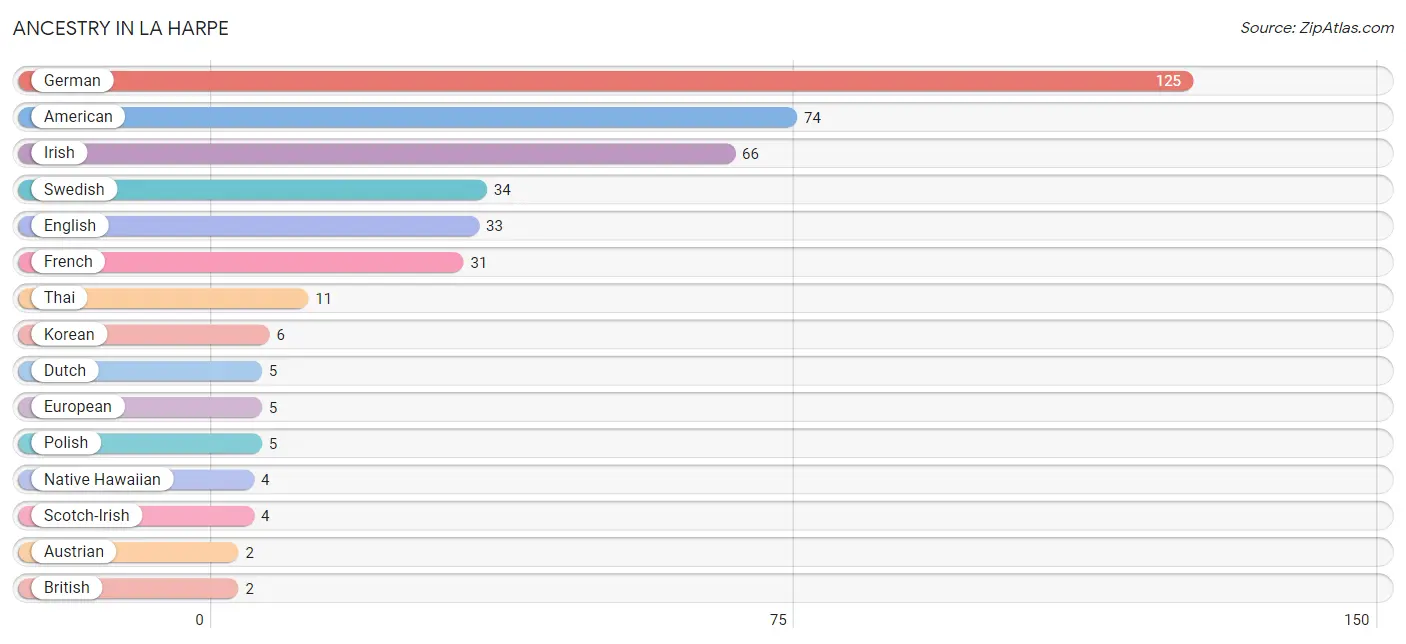
| Ancestry | # Population | % Population |
| American | 74 | 13.3% |
| Austrian | 2 | 0.4% |
| British | 2 | 0.4% |
| Cuban | 2 | 0.4% |
| Czech | 2 | 0.4% |
| Dutch | 5 | 0.9% |
| English | 33 | 5.9% |
| European | 5 | 0.9% |
| French | 31 | 5.6% |
| German | 125 | 22.5% |
| Indian (Asian) | 1 | 0.2% |
| Irish | 66 | 11.9% |
| Korean | 6 | 1.1% |
| Mexican | 1 | 0.2% |
| Native Hawaiian | 4 | 0.7% |
| Norwegian | 2 | 0.4% |
| Polish | 5 | 0.9% |
| Portuguese | 2 | 0.4% |
| Russian | 1 | 0.2% |
| Samoan | 1 | 0.2% |
| Scotch-Irish | 4 | 0.7% |
| Swedish | 34 | 6.1% |
| Thai | 11 | 2.0% | View All 23 Rows |
Immigrants in La Harpe
The most numerous immigrant groups reported in La Harpe came from Asia (17 | 3.1%), India (11 | 2.0%), South Central Asia (11 | 2.0%), Philippines (6 | 1.1%), and South Eastern Asia (6 | 1.1%), together accounting for 9.2% of all La Harpe residents.
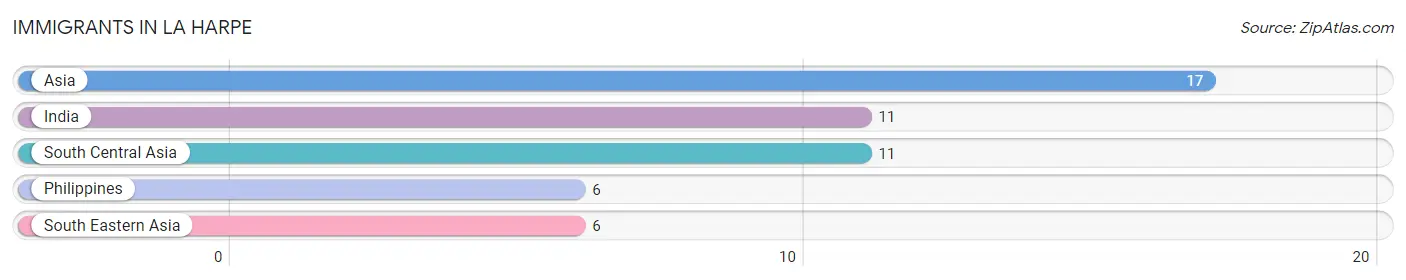
| Immigration Origin | # Population | % Population |
| Asia | 17 | 3.1% |
| India | 11 | 2.0% |
| Philippines | 6 | 1.1% |
| South Central Asia | 11 | 2.0% |
| South Eastern Asia | 6 | 1.1% | View All 5 Rows |
Sex and Age in La Harpe
Sex and Age in La Harpe
The most populous age groups in La Harpe are 65 to 69 Years (75 | 24.7%) for men and 60 to 64 Years (35 | 13.9%) for women.
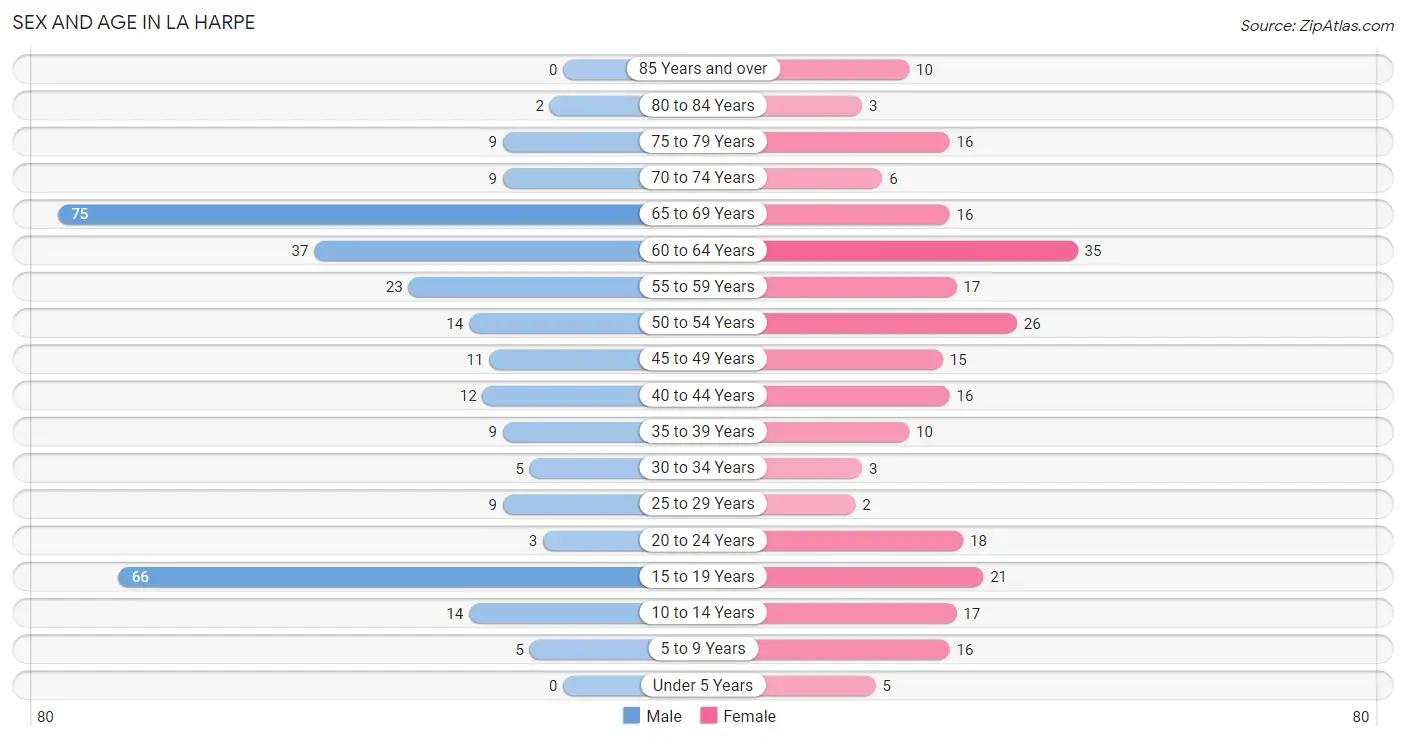
| Age Bracket | Male | Female |
| Under 5 Years | 0 (0.0%) | 5 (2.0%) |
| 5 to 9 Years | 5 (1.7%) | 16 (6.4%) |
| 10 to 14 Years | 14 (4.6%) | 17 (6.8%) |
| 15 to 19 Years | 66 (21.8%) | 21 (8.3%) |
| 20 to 24 Years | 3 (1.0%) | 18 (7.1%) |
| 25 to 29 Years | 9 (3.0%) | 2 (0.8%) |
| 30 to 34 Years | 5 (1.7%) | 3 (1.2%) |
| 35 to 39 Years | 9 (3.0%) | 10 (4.0%) |
| 40 to 44 Years | 12 (4.0%) | 16 (6.4%) |
| 45 to 49 Years | 11 (3.6%) | 15 (5.9%) |
| 50 to 54 Years | 14 (4.6%) | 26 (10.3%) |
| 55 to 59 Years | 23 (7.6%) | 17 (6.8%) |
| 60 to 64 Years | 37 (12.2%) | 35 (13.9%) |
| 65 to 69 Years | 75 (24.7%) | 16 (6.4%) |
| 70 to 74 Years | 9 (3.0%) | 6 (2.4%) |
| 75 to 79 Years | 9 (3.0%) | 16 (6.4%) |
| 80 to 84 Years | 2 (0.7%) | 3 (1.2%) |
| 85 Years and over | 0 (0.0%) | 10 (4.0%) |
| Total | 303 (100.0%) | 252 (100.0%) |
Families and Households in La Harpe
Median Family Size in La Harpe
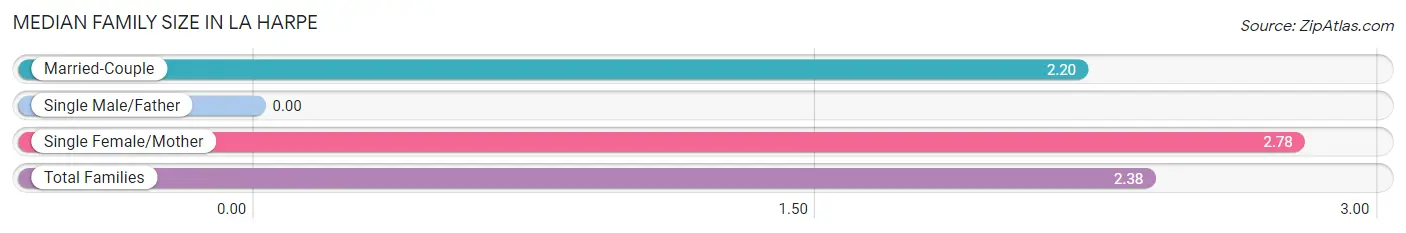
| Family Type | # Families | Family Size |
| Married-Couple | 137 (68.5%) | 2.20 |
| Single Male/Father | 0 (0.0%) | - |
| Single Female/Mother | 63 (31.5%) | 2.78 |
| Total Families | 200 (100.0%) | 2.38 |
Median Household Size in La Harpe
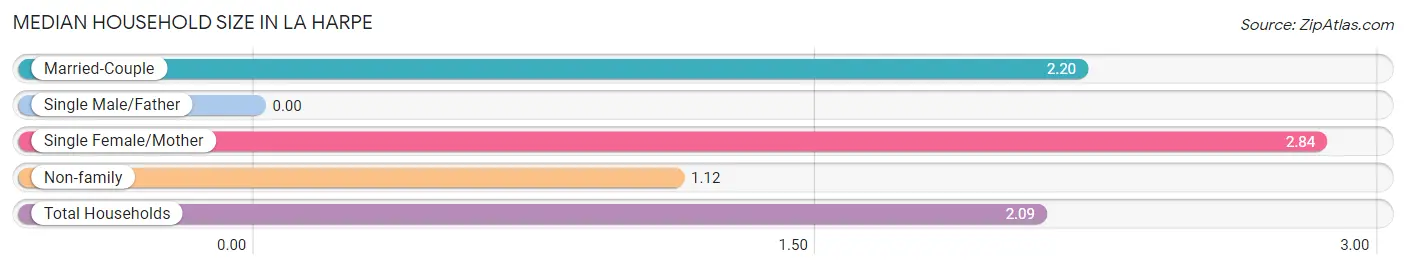
| Household Type | # Households | Household Size |
| Married-Couple | 137 (51.5%) | 2.20 |
| Single Male/Father | 0 (0.0%) | - |
| Single Female/Mother | 63 (23.7%) | 2.84 |
| Non-family | 66 (24.8%) | 1.12 |
| Total Households | 266 (100.0%) | 2.09 |
Household Size by Marriage Status in La Harpe
Out of a total of 266 households in La Harpe, 200 (75.2%) are family households, while 66 (24.8%) are nonfamily households. The most numerous type of family households are 2-person households, comprising 125, and the most common type of nonfamily households are 1-person households, comprising 56.
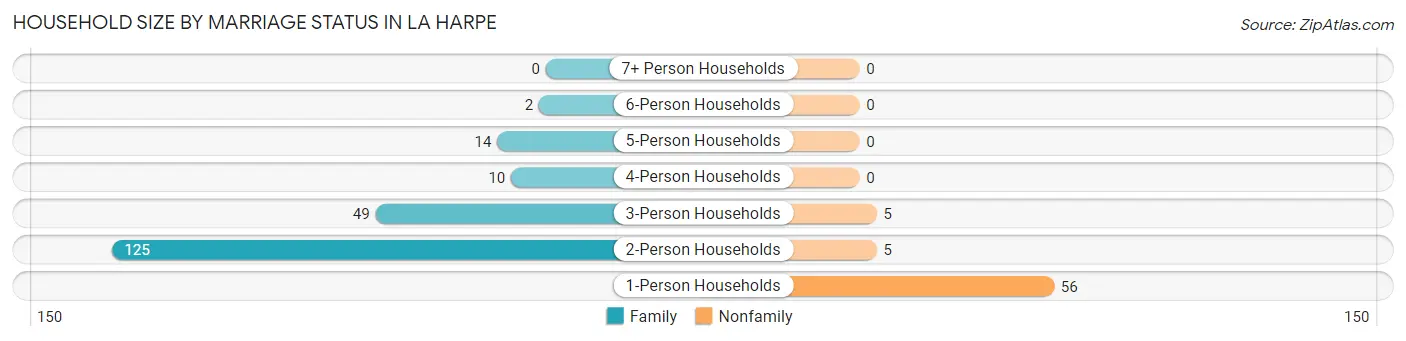
| Household Size | Family Households | Nonfamily Households |
| 1-Person Households | - | 56 (21.0%) |
| 2-Person Households | 125 (47.0%) | 5 (1.9%) |
| 3-Person Households | 49 (18.4%) | 5 (1.9%) |
| 4-Person Households | 10 (3.8%) | 0 (0.0%) |
| 5-Person Households | 14 (5.3%) | 0 (0.0%) |
| 6-Person Households | 2 (0.7%) | 0 (0.0%) |
| 7+ Person Households | 0 (0.0%) | 0 (0.0%) |
| Total | 200 (75.2%) | 66 (24.8%) |
Female Fertility in La Harpe
Fertility by Age in La Harpe
| Age Bracket | Women with Births | Births / 1,000 Women |
| 15 to 19 years | 0 (0.0%) | 0.0 |
| 20 to 34 years | 0 (0.0%) | 0.0 |
| 35 to 50 years | 0 (0.0%) | 0.0 |
| Total | 0 (0.0%) | 0.0 |
Fertility by Age by Marriage Status in La Harpe
| Age Bracket | Married | Unmarried |
| 15 to 19 years | 0 (0.0%) | 0 (0.0%) |
| 20 to 34 years | 0 (0.0%) | 0 (0.0%) |
| 35 to 50 years | 0 (0.0%) | 0 (0.0%) |
| Total | 0 (0.0%) | 0 (0.0%) |
Fertility by Education in La Harpe
| Educational Attainment | Women with Births | Births / 1,000 Women |
| Less than High School | 0 (0.0%) | 0.0 |
| High School Diploma | 0 (0.0%) | 0.0 |
| College or Associate's Degree | 0 (0.0%) | 0.0 |
| Bachelor's Degree | 0 (0.0%) | 0.0 |
| Graduate Degree | 0 (0.0%) | 0.0 |
| Total | 0 (0.0%) | 0.0 |
Fertility by Education by Marriage Status in La Harpe
| Educational Attainment | Married | Unmarried |
| Less than High School | 0 (0.0%) | 0 (0.0%) |
| High School Diploma | 0 (0.0%) | 0 (0.0%) |
| College or Associate's Degree | 0 (0.0%) | 0 (0.0%) |
| Bachelor's Degree | 0 (0.0%) | 0 (0.0%) |
| Graduate Degree | 0 (0.0%) | 0 (0.0%) |
| Total | 0 (0.0%) | 0 (0.0%) |
Employment Characteristics in La Harpe
Employment by Class of Employer in La Harpe
Among the 284 employed individuals in La Harpe, private company employees (173 | 60.9%), local government employees (84 | 29.6%), and self-employed (not incorporated) (12 | 4.2%) make up the most common classes of employment.
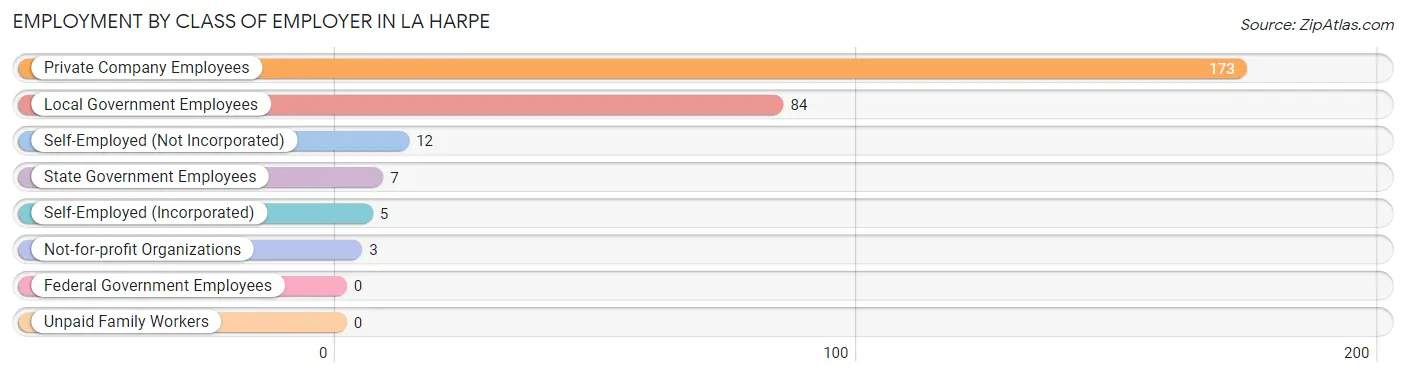
| Employer Class | # Employees | % Employees |
| Private Company Employees | 173 | 60.9% |
| Self-Employed (Incorporated) | 5 | 1.8% |
| Self-Employed (Not Incorporated) | 12 | 4.2% |
| Not-for-profit Organizations | 3 | 1.1% |
| Local Government Employees | 84 | 29.6% |
| State Government Employees | 7 | 2.5% |
| Federal Government Employees | 0 | 0.0% |
| Unpaid Family Workers | 0 | 0.0% |
| Total | 284 | 100.0% |
Employment Status by Age in La Harpe
According to the labor force statistics for La Harpe, out of the total population over 16 years of age (495), 60.6% or 300 individuals are in the labor force, with 3.3% or 10 of them unemployed. The age group with the highest labor force participation rate is 20 to 24 years, with 100.0% or 21 individuals in the labor force. Within the labor force, the 55 to 59 years age range has the highest percentage of unemployed individuals, with 38.9% or 7 of them being unemployed.
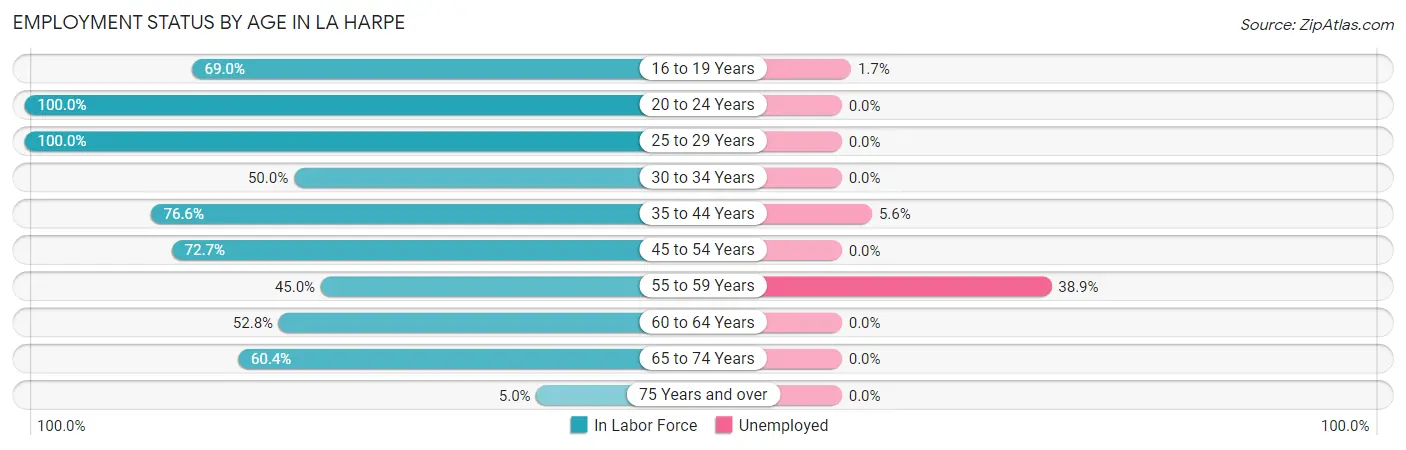
| Age Bracket | In Labor Force | Unemployed |
| 16 to 19 Years | 58 (69.0%) | 1 (1.7%) |
| 20 to 24 Years | 21 (100.0%) | 0 (0.0%) |
| 25 to 29 Years | 11 (100.0%) | 0 (0.0%) |
| 30 to 34 Years | 4 (50.0%) | 0 (0.0%) |
| 35 to 44 Years | 36 (76.6%) | 2 (5.6%) |
| 45 to 54 Years | 48 (72.7%) | 0 (0.0%) |
| 55 to 59 Years | 18 (45.0%) | 7 (38.9%) |
| 60 to 64 Years | 38 (52.8%) | 0 (0.0%) |
| 65 to 74 Years | 64 (60.4%) | 0 (0.0%) |
| 75 Years and over | 2 (5.0%) | 0 (0.0%) |
| Total | 300 (60.6%) | 10 (3.3%) |
Employment Status by Educational Attainment in La Harpe
According to labor force statistics for La Harpe, 63.5% of individuals (155) out of the total population between 25 and 64 years of age (244) are in the labor force, with 5.8% or 9 of them being unemployed. The group with the highest labor force participation rate are those with the educational attainment of bachelor's degree or higher, with 89.3% or 25 individuals in the labor force. Within the labor force, individuals with bachelor's degree or higher education have the highest percentage of unemployment, with 28.0% or 7 of them being unemployed.
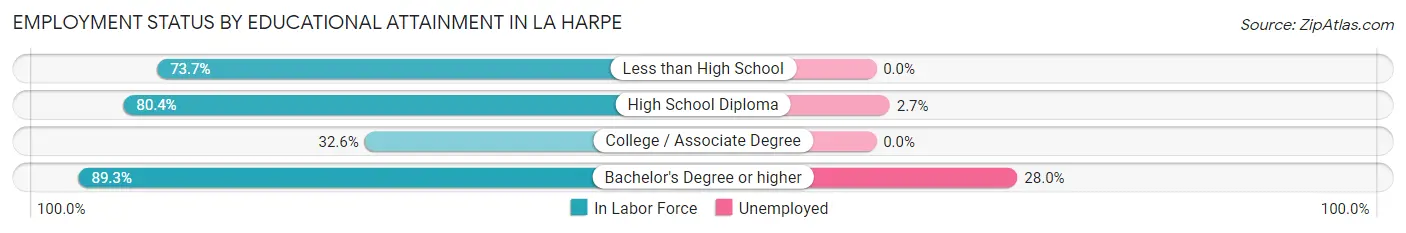
| Educational Attainment | In Labor Force | Unemployed |
| Less than High School | 28 (73.7%) | 0 (0.0%) |
| High School Diploma | 74 (80.4%) | 2 (2.7%) |
| College / Associate Degree | 28 (32.6%) | 0 (0.0%) |
| Bachelor's Degree or higher | 25 (89.3%) | 8 (28.0%) |
| Total | 155 (63.5%) | 14 (5.8%) |
Employment Occupations by Sex in La Harpe
Management, Business, Science and Arts Occupations
The most common Management, Business, Science and Arts occupations in La Harpe are Community & Social Service (56 | 19.3%), Education Instruction & Library (56 | 19.3%), Business & Financial (14 | 4.8%), Management (7 | 2.4%), and Health Diagnosing & Treating (6 | 2.1%).
Management, Business, Science and Arts Occupations by Sex
Within the Management, Business, Science and Arts occupations in La Harpe, the most male-oriented occupations are Management (100.0%), Computers, Engineering & Science (100.0%), and Architecture & Engineering (100.0%), while the most female-oriented occupations are Business & Financial (100.0%), Health Diagnosing & Treating (100.0%), and Community & Social Service (5.4%).
| Occupation | Male | Female |
| Management | 7 (100.0%) | 0 (0.0%) |
| Business & Financial | 0 (0.0%) | 14 (100.0%) |
| Computers, Engineering & Science | 1 (100.0%) | 0 (0.0%) |
| Computers & Mathematics | 0 (0.0%) | 0 (0.0%) |
| Architecture & Engineering | 1 (100.0%) | 0 (0.0%) |
| Life, Physical & Social Science | 0 (0.0%) | 0 (0.0%) |
| Community & Social Service | 53 (94.6%) | 3 (5.4%) |
| Education, Arts & Media | 0 (0.0%) | 0 (0.0%) |
| Legal Services & Support | 0 (0.0%) | 0 (0.0%) |
| Education Instruction & Library | 53 (94.6%) | 3 (5.4%) |
| Arts, Media & Entertainment | 0 (0.0%) | 0 (0.0%) |
| Health Diagnosing & Treating | 0 (0.0%) | 6 (100.0%) |
| Health Technologists | 0 (0.0%) | 0 (0.0%) |
| Total (Category) | 61 (72.6%) | 23 (27.4%) |
| Total (Overall) | 175 (60.3%) | 115 (39.7%) |
Services Occupations
The most common Services occupations in La Harpe are Food Preparation & Serving (34 | 11.7%), Healthcare Support (20 | 6.9%), Cleaning & Maintenance (19 | 6.6%), Personal Care & Service (4 | 1.4%), and Security & Protection (3 | 1.0%).
Services Occupations by Sex
Within the Services occupations in La Harpe, the most male-oriented occupations are Food Preparation & Serving (41.2%), and Cleaning & Maintenance (36.8%), while the most female-oriented occupations are Healthcare Support (100.0%), Security & Protection (100.0%), and Law Enforcement (100.0%).
| Occupation | Male | Female |
| Healthcare Support | 0 (0.0%) | 20 (100.0%) |
| Security & Protection | 0 (0.0%) | 3 (100.0%) |
| Firefighting & Prevention | 0 (0.0%) | 0 (0.0%) |
| Law Enforcement | 0 (0.0%) | 3 (100.0%) |
| Food Preparation & Serving | 14 (41.2%) | 20 (58.8%) |
| Cleaning & Maintenance | 7 (36.8%) | 12 (63.2%) |
| Personal Care & Service | 0 (0.0%) | 4 (100.0%) |
| Total (Category) | 21 (26.3%) | 59 (73.8%) |
| Total (Overall) | 175 (60.3%) | 115 (39.7%) |
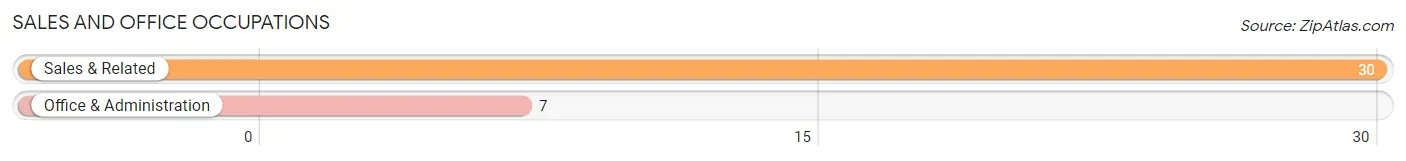
Sales and Office Occupations
The most common Sales and Office occupations in La Harpe are Sales & Related (30 | 10.3%), and Office & Administration (7 | 2.4%).
Sales and Office Occupations by Sex
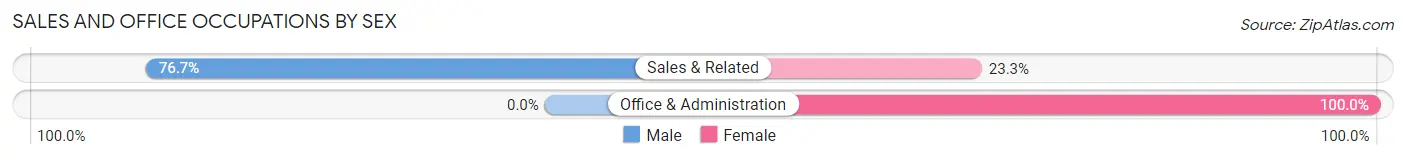
| Occupation | Male | Female |
| Sales & Related | 23 (76.7%) | 7 (23.3%) |
| Office & Administration | 0 (0.0%) | 7 (100.0%) |
| Total (Category) | 23 (62.2%) | 14 (37.8%) |
| Total (Overall) | 175 (60.3%) | 115 (39.7%) |
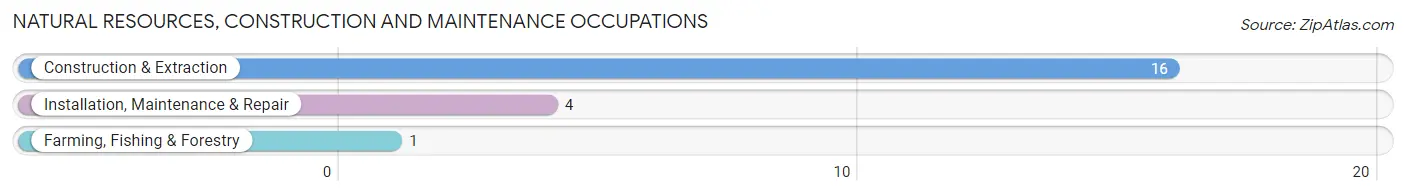
Natural Resources, Construction and Maintenance Occupations
The most common Natural Resources, Construction and Maintenance occupations in La Harpe are Construction & Extraction (16 | 5.5%), Installation, Maintenance & Repair (4 | 1.4%), and Farming, Fishing & Forestry (1 | 0.3%).
Natural Resources, Construction and Maintenance Occupations by Sex
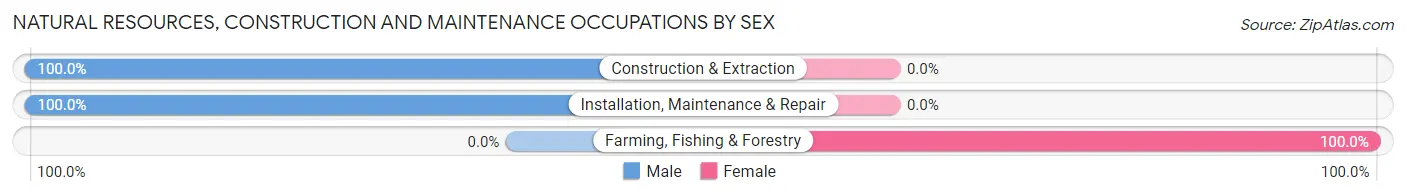
| Occupation | Male | Female |
| Farming, Fishing & Forestry | 0 (0.0%) | 1 (100.0%) |
| Construction & Extraction | 16 (100.0%) | 0 (0.0%) |
| Installation, Maintenance & Repair | 4 (100.0%) | 0 (0.0%) |
| Total (Category) | 20 (95.2%) | 1 (4.8%) |
| Total (Overall) | 175 (60.3%) | 115 (39.7%) |
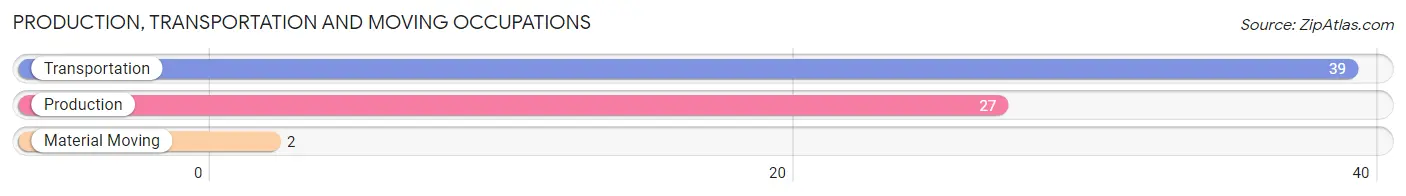
Production, Transportation and Moving Occupations
The most common Production, Transportation and Moving occupations in La Harpe are Transportation (39 | 13.5%), Production (27 | 9.3%), and Material Moving (2 | 0.7%).
Production, Transportation and Moving Occupations by Sex
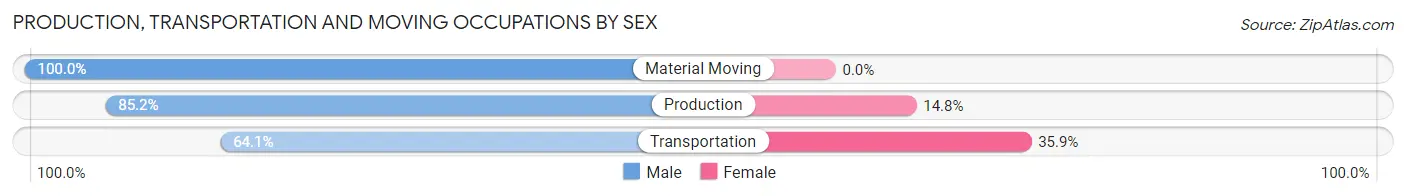
| Occupation | Male | Female |
| Production | 23 (85.2%) | 4 (14.8%) |
| Transportation | 25 (64.1%) | 14 (35.9%) |
| Material Moving | 2 (100.0%) | 0 (0.0%) |
| Total (Category) | 50 (73.5%) | 18 (26.5%) |
| Total (Overall) | 175 (60.3%) | 115 (39.7%) |
Employment Industries by Sex in La Harpe
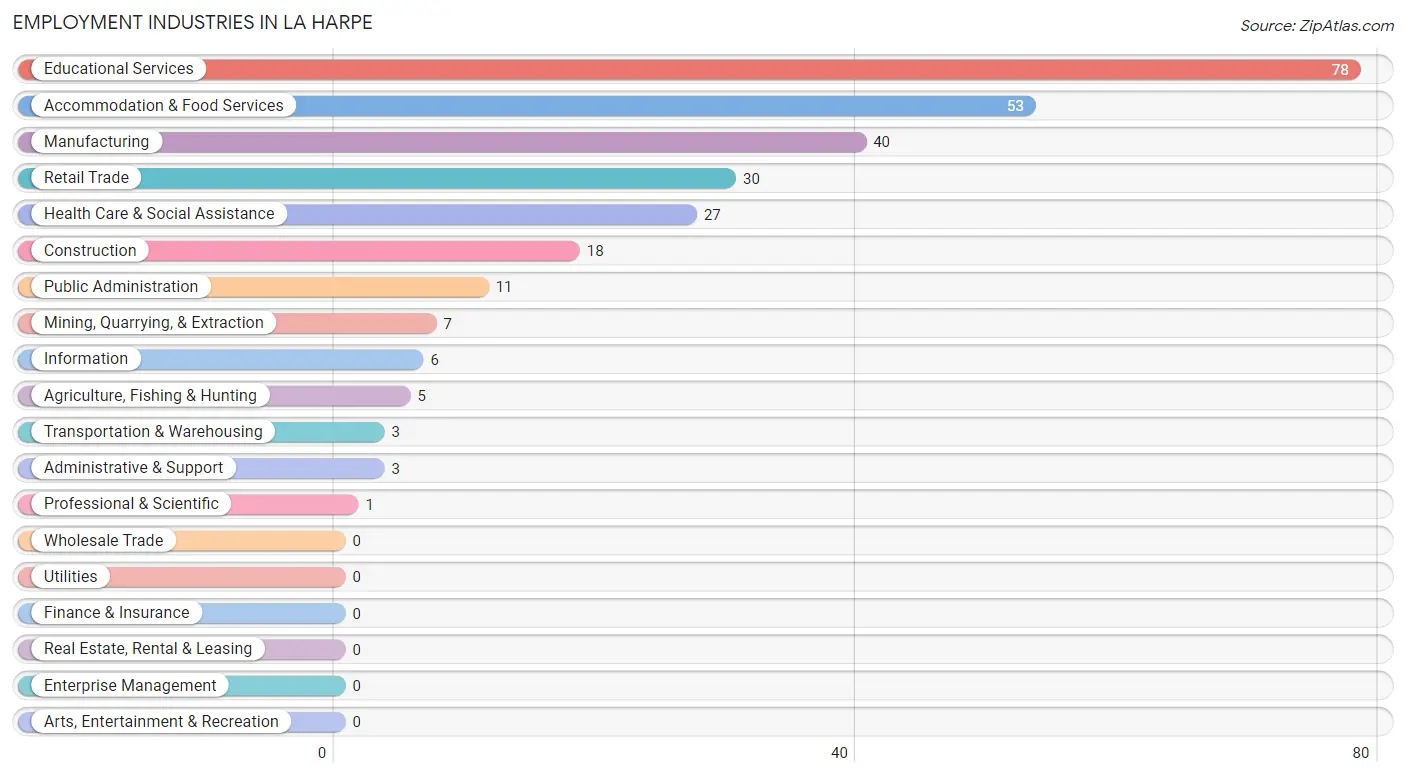
Employment Industries in La Harpe
The major employment industries in La Harpe include Educational Services (78 | 26.9%), Accommodation & Food Services (53 | 18.3%), Manufacturing (40 | 13.8%), Retail Trade (30 | 10.3%), and Health Care & Social Assistance (27 | 9.3%).
Employment Industries by Sex in La Harpe
The La Harpe industries that see more men than women are Agriculture, Fishing & Hunting (100.0%), Mining, Quarrying, & Extraction (100.0%), and Construction (100.0%), whereas the industries that tend to have a higher number of women are Health Care & Social Assistance (100.0%), Retail Trade (86.7%), and Public Administration (72.7%).
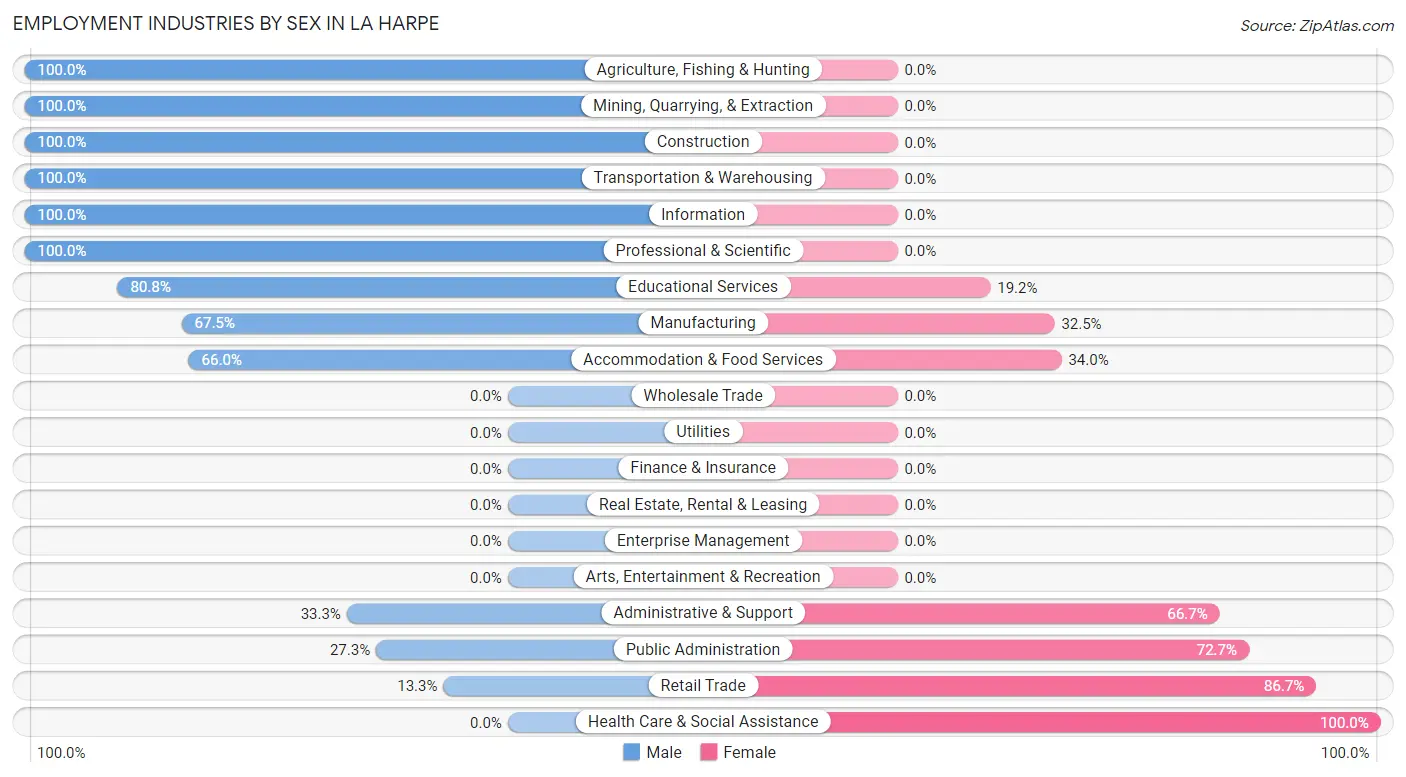
| Industry | Male | Female |
| Agriculture, Fishing & Hunting | 5 (100.0%) | 0 (0.0%) |
| Mining, Quarrying, & Extraction | 7 (100.0%) | 0 (0.0%) |
| Construction | 18 (100.0%) | 0 (0.0%) |
| Manufacturing | 27 (67.5%) | 13 (32.5%) |
| Wholesale Trade | 0 (0.0%) | 0 (0.0%) |
| Retail Trade | 4 (13.3%) | 26 (86.7%) |
| Transportation & Warehousing | 3 (100.0%) | 0 (0.0%) |
| Utilities | 0 (0.0%) | 0 (0.0%) |
| Information | 6 (100.0%) | 0 (0.0%) |
| Finance & Insurance | 0 (0.0%) | 0 (0.0%) |
| Real Estate, Rental & Leasing | 0 (0.0%) | 0 (0.0%) |
| Professional & Scientific | 1 (100.0%) | 0 (0.0%) |
| Enterprise Management | 0 (0.0%) | 0 (0.0%) |
| Administrative & Support | 1 (33.3%) | 2 (66.7%) |
| Educational Services | 63 (80.8%) | 15 (19.2%) |
| Health Care & Social Assistance | 0 (0.0%) | 27 (100.0%) |
| Arts, Entertainment & Recreation | 0 (0.0%) | 0 (0.0%) |
| Accommodation & Food Services | 35 (66.0%) | 18 (34.0%) |
| Public Administration | 3 (27.3%) | 8 (72.7%) |
| Total | 175 (60.3%) | 115 (39.7%) |
Education in La Harpe
School Enrollment in La Harpe
The most common levels of schooling among the 146 students in La Harpe are high school (82 | 56.2%), middle school (29 | 19.9%), and elementary school (17 | 11.6%).
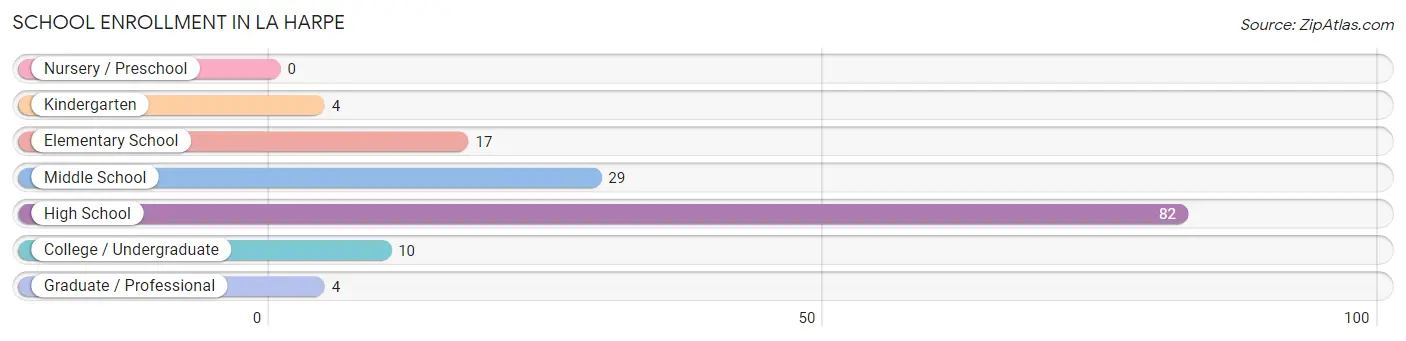
| School Level | # Students | % Students |
| Nursery / Preschool | 0 | 0.0% |
| Kindergarten | 4 | 2.7% |
| Elementary School | 17 | 11.6% |
| Middle School | 29 | 19.9% |
| High School | 82 | 56.2% |
| College / Undergraduate | 10 | 6.9% |
| Graduate / Professional | 4 | 2.7% |
| Total | 146 | 100.0% |
School Enrollment by Age by Funding Source in La Harpe
Out of a total of 146 students who are enrolled in schools in La Harpe, 8 (5.5%) attend a private institution, while the remaining 138 (94.5%) are enrolled in public schools. The age group of 35 years and over has the highest likelihood of being enrolled in private schools, with 4 (57.1% in the age bracket) enrolled. Conversely, the age group of 10 to 14 year olds has the lowest likelihood of being enrolled in a private school, with 31 (100.0% in the age bracket) attending a public institution.
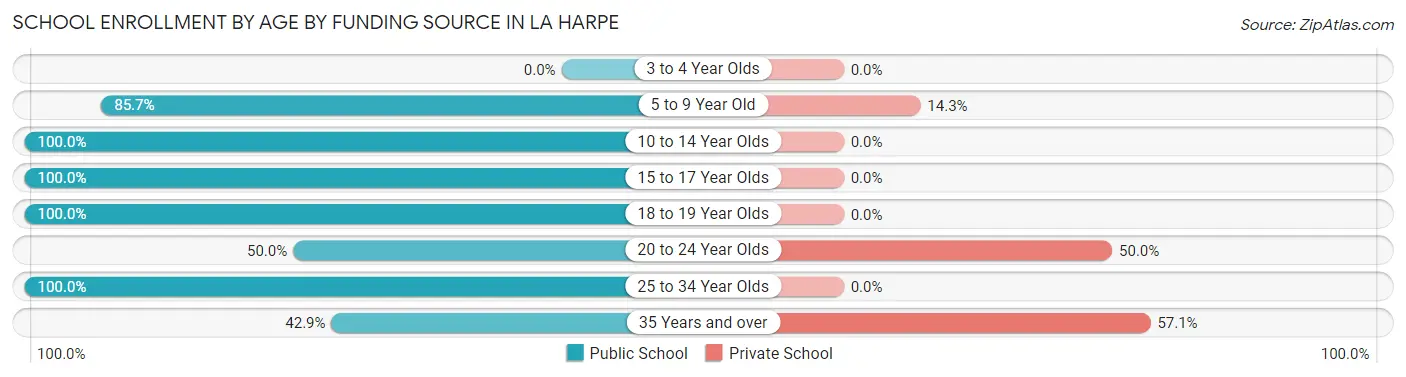
| Age Bracket | Public School | Private School |
| 3 to 4 Year Olds | 0 (0.0%) | 0 (0.0%) |
| 5 to 9 Year Old | 18 (85.7%) | 3 (14.3%) |
| 10 to 14 Year Olds | 31 (100.0%) | 0 (0.0%) |
| 15 to 17 Year Olds | 32 (100.0%) | 0 (0.0%) |
| 18 to 19 Year Olds | 50 (100.0%) | 0 (0.0%) |
| 20 to 24 Year Olds | 1 (50.0%) | 1 (50.0%) |
| 25 to 34 Year Olds | 3 (100.0%) | 0 (0.0%) |
| 35 Years and over | 3 (42.9%) | 4 (57.1%) |
| Total | 138 (94.5%) | 8 (5.5%) |
Educational Attainment by Field of Study in La Harpe
Science & technology (55 | 61.8%), business (16 | 18.0%), multidisciplinary studies (7 | 7.9%), engineering (5 | 5.6%), and education (3 | 3.4%) are the most common fields of study among 89 individuals in La Harpe who have obtained a bachelor's degree or higher.
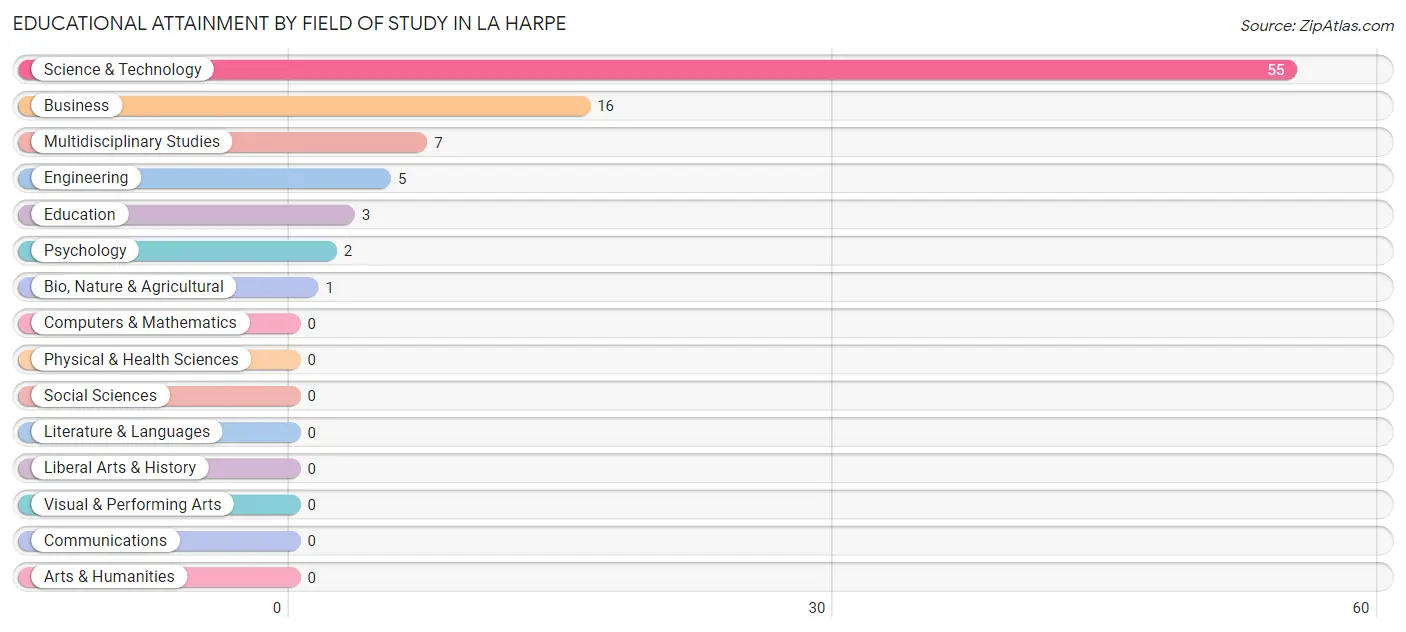
| Field of Study | # Graduates | % Graduates |
| Computers & Mathematics | 0 | 0.0% |
| Bio, Nature & Agricultural | 1 | 1.1% |
| Physical & Health Sciences | 0 | 0.0% |
| Psychology | 2 | 2.2% |
| Social Sciences | 0 | 0.0% |
| Engineering | 5 | 5.6% |
| Multidisciplinary Studies | 7 | 7.9% |
| Science & Technology | 55 | 61.8% |
| Business | 16 | 18.0% |
| Education | 3 | 3.4% |
| Literature & Languages | 0 | 0.0% |
| Liberal Arts & History | 0 | 0.0% |
| Visual & Performing Arts | 0 | 0.0% |
| Communications | 0 | 0.0% |
| Arts & Humanities | 0 | 0.0% |
| Total | 89 | 100.0% |
Transportation & Commute in La Harpe
Vehicle Availability by Sex in La Harpe
The most prevalent vehicle ownership categories in La Harpe are males with 2 vehicles (108, accounting for 63.5%) and females with 2 vehicles (67, making up 94.7%).
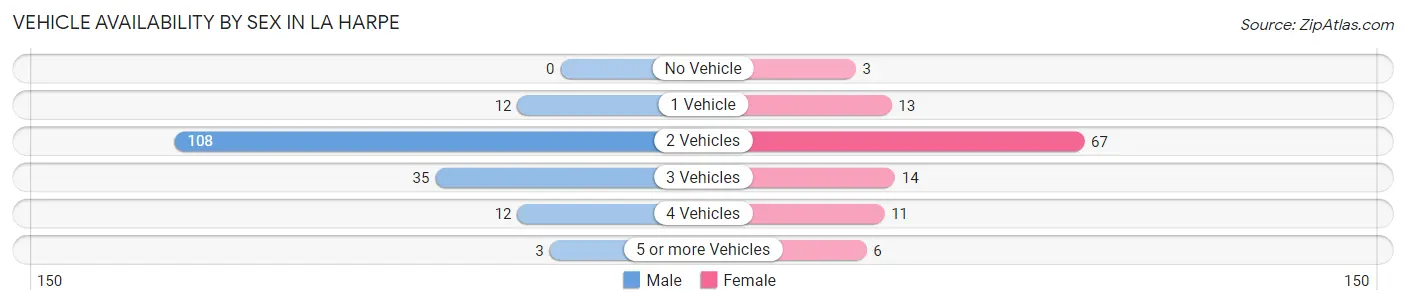
| Vehicles Available | Male | Female |
| No Vehicle | 0 (0.0%) | 3 (2.6%) |
| 1 Vehicle | 12 (7.1%) | 13 (11.4%) |
| 2 Vehicles | 108 (63.5%) | 67 (58.8%) |
| 3 Vehicles | 35 (20.6%) | 14 (12.3%) |
| 4 Vehicles | 12 (7.1%) | 11 (9.7%) |
| 5 or more Vehicles | 3 (1.8%) | 6 (5.3%) |
| Total | 170 (100.0%) | 114 (100.0%) |
Commute Time in La Harpe
The most frequently occuring commute durations in La Harpe are 15 to 19 minutes (125 commuters, 45.0%), 10 to 14 minutes (61 commuters, 21.9%), and 30 to 34 minutes (23 commuters, 8.3%).
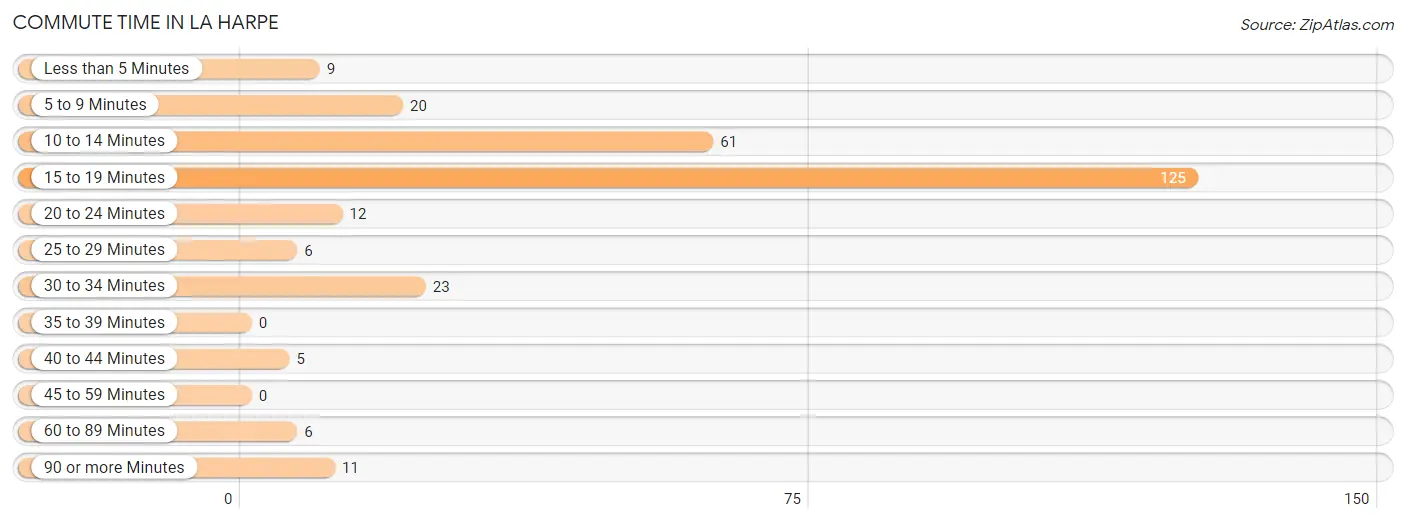
| Commute Time | # Commuters | % Commuters |
| Less than 5 Minutes | 9 | 3.2% |
| 5 to 9 Minutes | 20 | 7.2% |
| 10 to 14 Minutes | 61 | 21.9% |
| 15 to 19 Minutes | 125 | 45.0% |
| 20 to 24 Minutes | 12 | 4.3% |
| 25 to 29 Minutes | 6 | 2.2% |
| 30 to 34 Minutes | 23 | 8.3% |
| 35 to 39 Minutes | 0 | 0.0% |
| 40 to 44 Minutes | 5 | 1.8% |
| 45 to 59 Minutes | 0 | 0.0% |
| 60 to 89 Minutes | 6 | 2.2% |
| 90 or more Minutes | 11 | 4.0% |
Commute Time by Sex in La Harpe
The most common commute times in La Harpe are 15 to 19 minutes (79 commuters, 47.3%) for males and 15 to 19 minutes (46 commuters, 41.4%) for females.
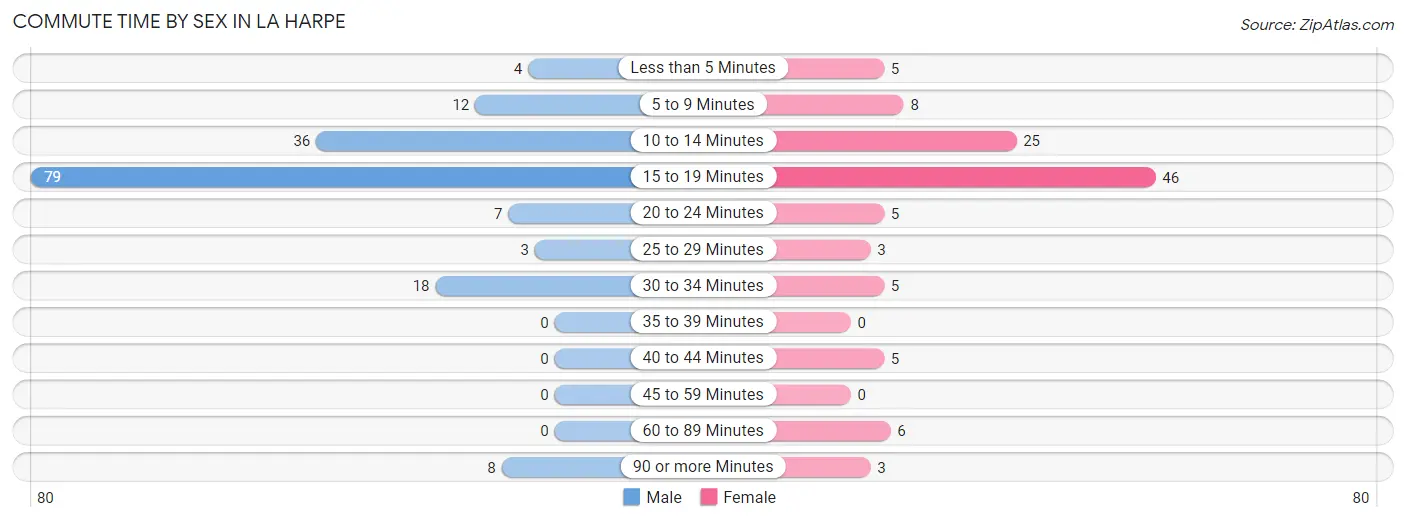
| Commute Time | Male | Female |
| Less than 5 Minutes | 4 (2.4%) | 5 (4.5%) |
| 5 to 9 Minutes | 12 (7.2%) | 8 (7.2%) |
| 10 to 14 Minutes | 36 (21.6%) | 25 (22.5%) |
| 15 to 19 Minutes | 79 (47.3%) | 46 (41.4%) |
| 20 to 24 Minutes | 7 (4.2%) | 5 (4.5%) |
| 25 to 29 Minutes | 3 (1.8%) | 3 (2.7%) |
| 30 to 34 Minutes | 18 (10.8%) | 5 (4.5%) |
| 35 to 39 Minutes | 0 (0.0%) | 0 (0.0%) |
| 40 to 44 Minutes | 0 (0.0%) | 5 (4.5%) |
| 45 to 59 Minutes | 0 (0.0%) | 0 (0.0%) |
| 60 to 89 Minutes | 0 (0.0%) | 6 (5.4%) |
| 90 or more Minutes | 8 (4.8%) | 3 (2.7%) |
Time of Departure to Work by Sex in La Harpe
The most frequent times of departure to work in La Harpe are 5:30 AM to 5:59 AM (72, 43.1%) for males and 12:00 PM to 3:59 PM (44, 39.6%) for females.
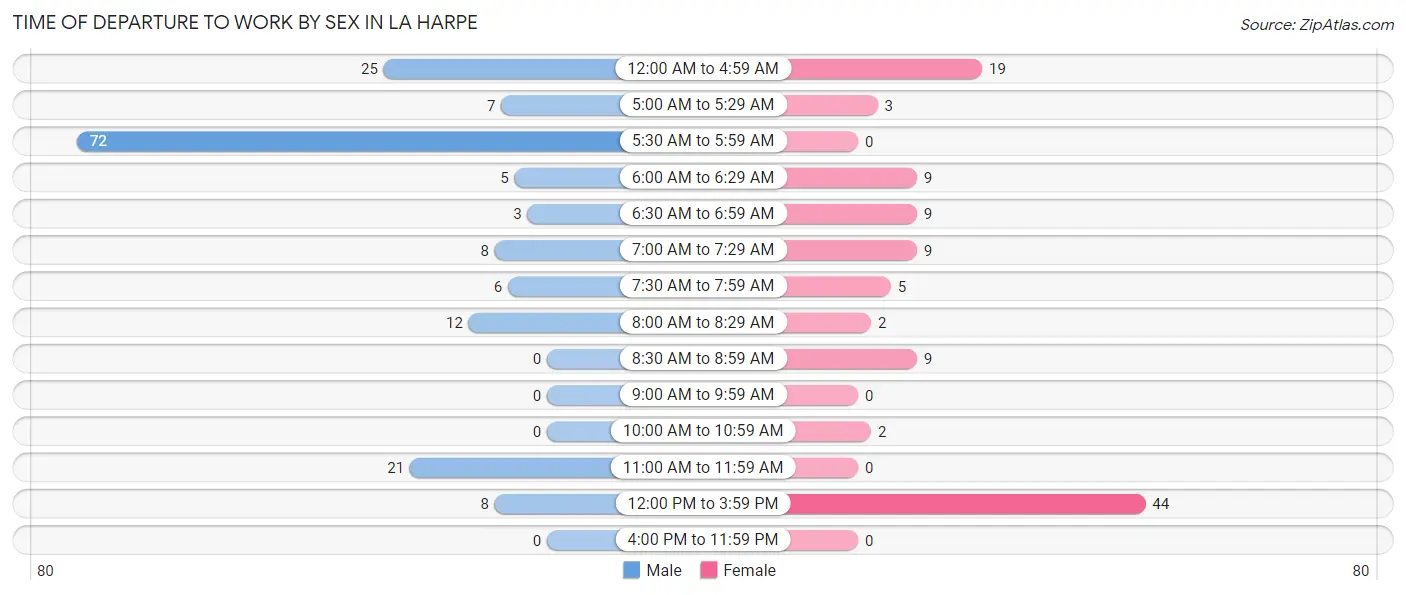
| Time of Departure | Male | Female |
| 12:00 AM to 4:59 AM | 25 (15.0%) | 19 (17.1%) |
| 5:00 AM to 5:29 AM | 7 (4.2%) | 3 (2.7%) |
| 5:30 AM to 5:59 AM | 72 (43.1%) | 0 (0.0%) |
| 6:00 AM to 6:29 AM | 5 (3.0%) | 9 (8.1%) |
| 6:30 AM to 6:59 AM | 3 (1.8%) | 9 (8.1%) |
| 7:00 AM to 7:29 AM | 8 (4.8%) | 9 (8.1%) |
| 7:30 AM to 7:59 AM | 6 (3.6%) | 5 (4.5%) |
| 8:00 AM to 8:29 AM | 12 (7.2%) | 2 (1.8%) |
| 8:30 AM to 8:59 AM | 0 (0.0%) | 9 (8.1%) |
| 9:00 AM to 9:59 AM | 0 (0.0%) | 0 (0.0%) |
| 10:00 AM to 10:59 AM | 0 (0.0%) | 2 (1.8%) |
| 11:00 AM to 11:59 AM | 21 (12.6%) | 0 (0.0%) |
| 12:00 PM to 3:59 PM | 8 (4.8%) | 44 (39.6%) |
| 4:00 PM to 11:59 PM | 0 (0.0%) | 0 (0.0%) |
| Total | 167 (100.0%) | 111 (100.0%) |
Housing Occupancy in La Harpe
Occupancy by Ownership in La Harpe
Of the total 266 dwellings in La Harpe, owner-occupied units account for 219 (82.3%), while renter-occupied units make up 47 (17.7%).
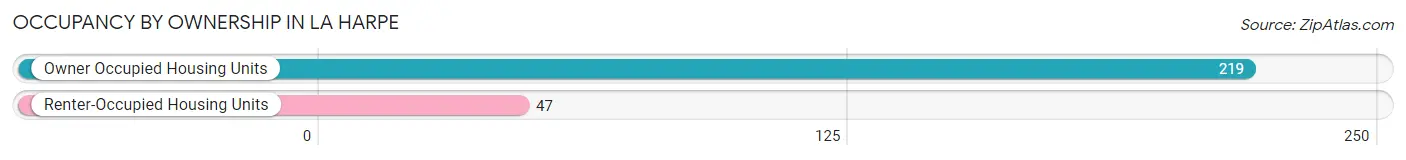
| Occupancy | # Housing Units | % Housing Units |
| Owner Occupied Housing Units | 219 | 82.3% |
| Renter-Occupied Housing Units | 47 | 17.7% |
| Total Occupied Housing Units | 266 | 100.0% |
Occupancy by Household Size in La Harpe
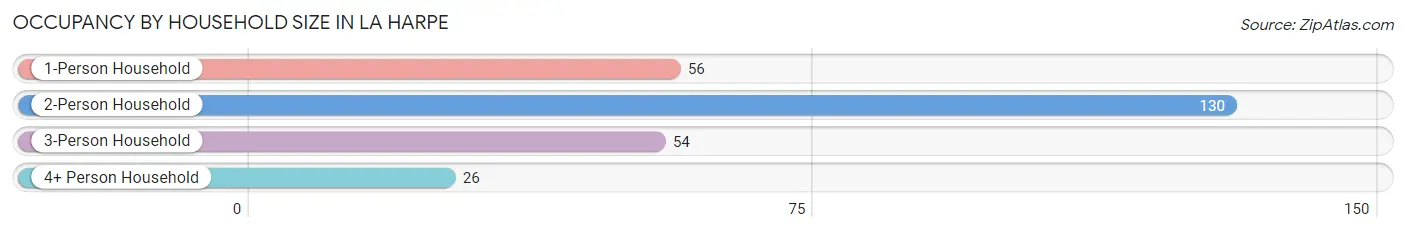
| Household Size | # Housing Units | % Housing Units |
| 1-Person Household | 56 | 21.0% |
| 2-Person Household | 130 | 48.9% |
| 3-Person Household | 54 | 20.3% |
| 4+ Person Household | 26 | 9.8% |
| Total Housing Units | 266 | 100.0% |
Occupancy by Ownership by Household Size in La Harpe
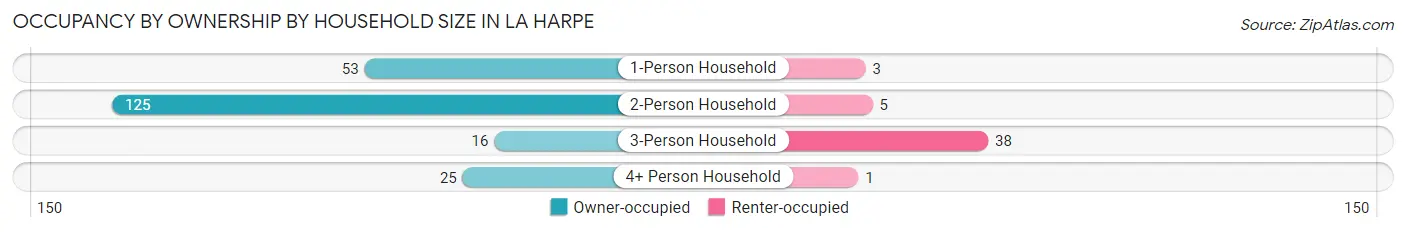
| Household Size | Owner-occupied | Renter-occupied |
| 1-Person Household | 53 (94.6%) | 3 (5.4%) |
| 2-Person Household | 125 (96.2%) | 5 (3.8%) |
| 3-Person Household | 16 (29.6%) | 38 (70.4%) |
| 4+ Person Household | 25 (96.2%) | 1 (3.8%) |
| Total Housing Units | 219 (82.3%) | 47 (17.7%) |
Occupancy by Educational Attainment in La Harpe
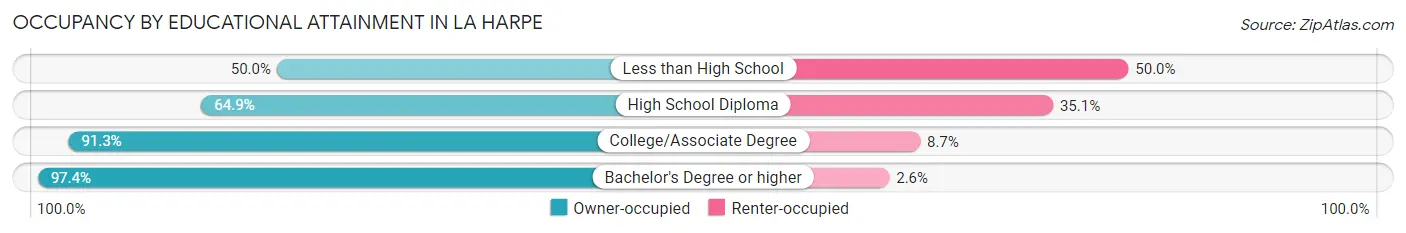
| Household Size | Owner-occupied | Renter-occupied |
| Less than High School | 10 (50.0%) | 10 (50.0%) |
| High School Diploma | 50 (64.9%) | 27 (35.1%) |
| College/Associate Degree | 84 (91.3%) | 8 (8.7%) |
| Bachelor's Degree or higher | 75 (97.4%) | 2 (2.6%) |
Occupancy by Age of Householder in La Harpe
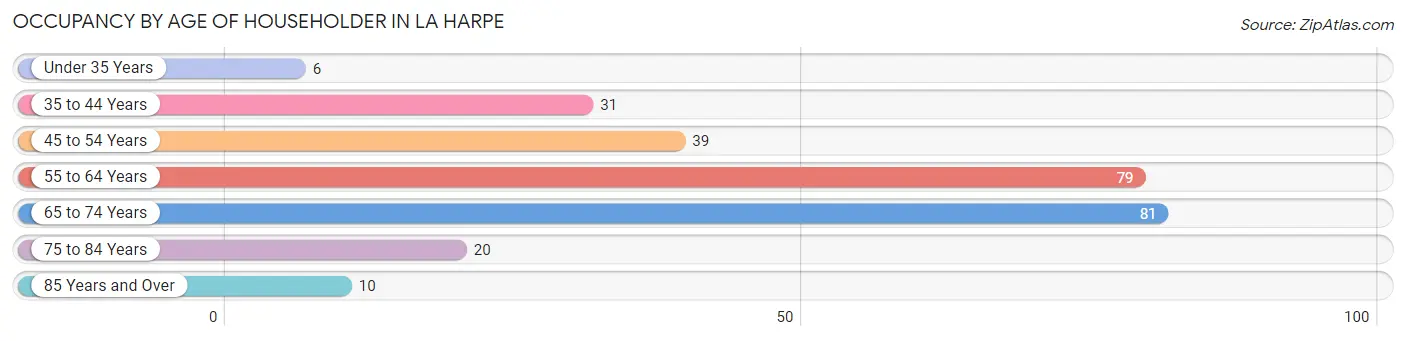
| Age Bracket | # Households | % Households |
| Under 35 Years | 6 | 2.3% |
| 35 to 44 Years | 31 | 11.7% |
| 45 to 54 Years | 39 | 14.7% |
| 55 to 64 Years | 79 | 29.7% |
| 65 to 74 Years | 81 | 30.4% |
| 75 to 84 Years | 20 | 7.5% |
| 85 Years and Over | 10 | 3.8% |
| Total | 266 | 100.0% |
Housing Finances in La Harpe
Median Income by Occupancy in La Harpe
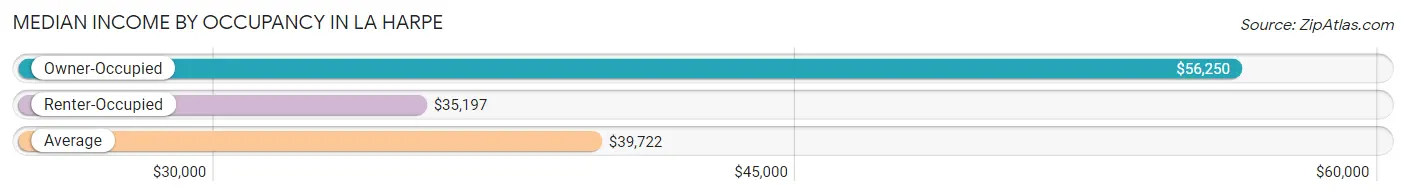
| Occupancy Type | # Households | Median Income |
| Owner-Occupied | 219 (82.3%) | $56,250 |
| Renter-Occupied | 47 (17.7%) | $35,197 |
| Average | 266 (100.0%) | $39,722 |
Occupancy by Householder Income Bracket in La Harpe
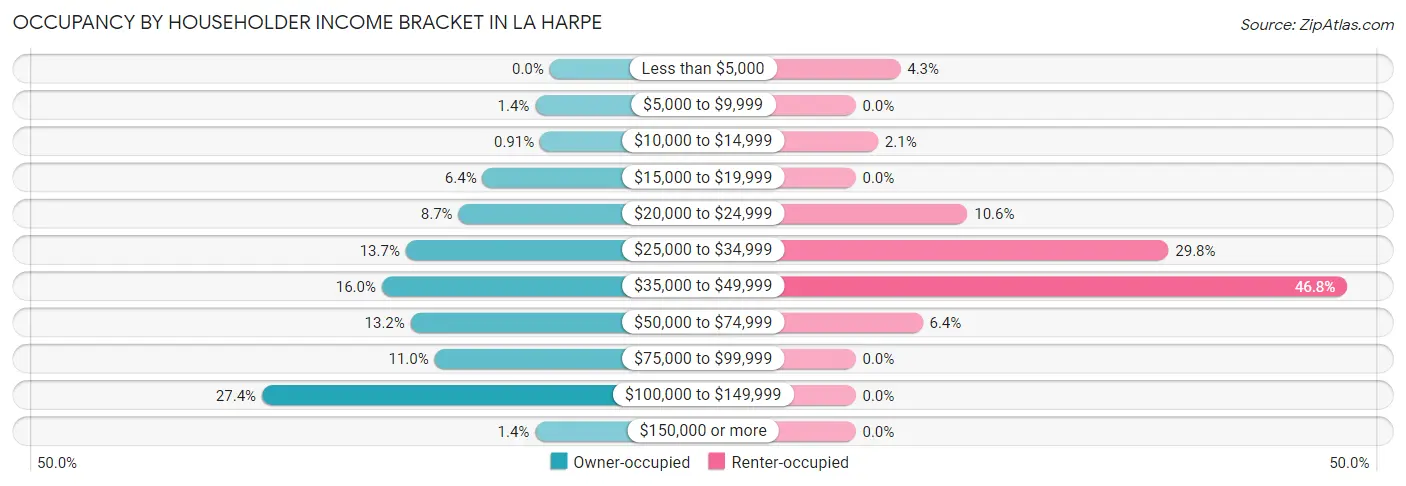
| Income Bracket | Owner-occupied | Renter-occupied |
| Less than $5,000 | 0 (0.0%) | 2 (4.3%) |
| $5,000 to $9,999 | 3 (1.4%) | 0 (0.0%) |
| $10,000 to $14,999 | 2 (0.9%) | 1 (2.1%) |
| $15,000 to $19,999 | 14 (6.4%) | 0 (0.0%) |
| $20,000 to $24,999 | 19 (8.7%) | 5 (10.6%) |
| $25,000 to $34,999 | 30 (13.7%) | 14 (29.8%) |
| $35,000 to $49,999 | 35 (16.0%) | 22 (46.8%) |
| $50,000 to $74,999 | 29 (13.2%) | 3 (6.4%) |
| $75,000 to $99,999 | 24 (11.0%) | 0 (0.0%) |
| $100,000 to $149,999 | 60 (27.4%) | 0 (0.0%) |
| $150,000 or more | 3 (1.4%) | 0 (0.0%) |
| Total | 219 (100.0%) | 47 (100.0%) |
Monthly Housing Cost Tiers in La Harpe
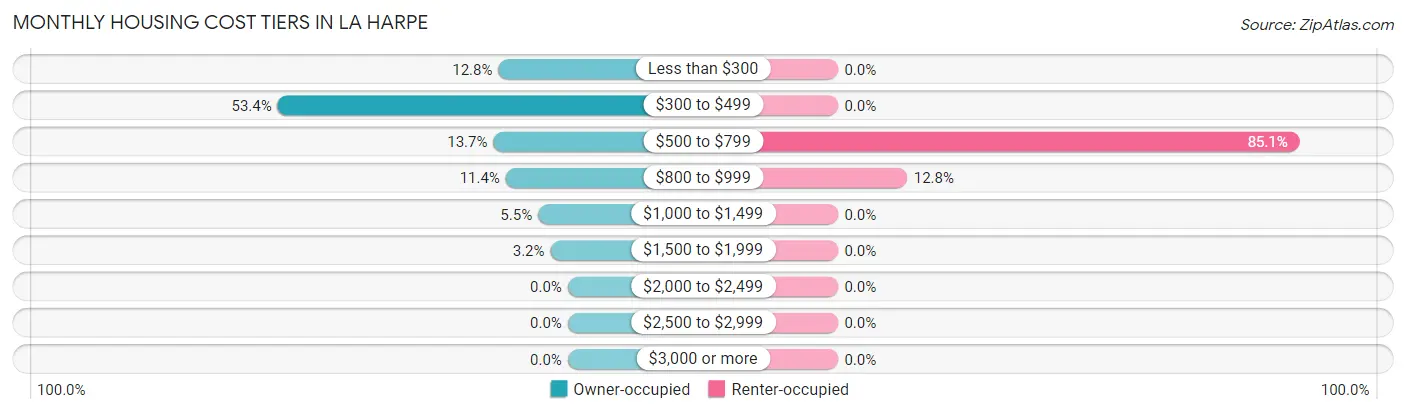
| Monthly Cost | Owner-occupied | Renter-occupied |
| Less than $300 | 28 (12.8%) | 0 (0.0%) |
| $300 to $499 | 117 (53.4%) | 0 (0.0%) |
| $500 to $799 | 30 (13.7%) | 40 (85.1%) |
| $800 to $999 | 25 (11.4%) | 6 (12.8%) |
| $1,000 to $1,499 | 12 (5.5%) | 0 (0.0%) |
| $1,500 to $1,999 | 7 (3.2%) | 0 (0.0%) |
| $2,000 to $2,499 | 0 (0.0%) | 0 (0.0%) |
| $2,500 to $2,999 | 0 (0.0%) | 0 (0.0%) |
| $3,000 or more | 0 (0.0%) | 0 (0.0%) |
| Total | 219 (100.0%) | 47 (100.0%) |
Physical Housing Characteristics in La Harpe
Housing Structures in La Harpe
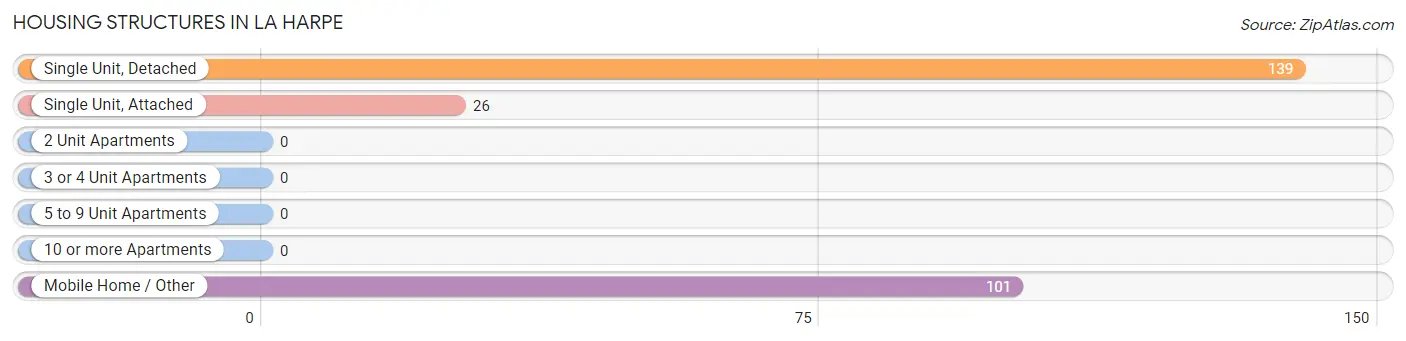
| Structure Type | # Housing Units | % Housing Units |
| Single Unit, Detached | 139 | 52.3% |
| Single Unit, Attached | 26 | 9.8% |
| 2 Unit Apartments | 0 | 0.0% |
| 3 or 4 Unit Apartments | 0 | 0.0% |
| 5 to 9 Unit Apartments | 0 | 0.0% |
| 10 or more Apartments | 0 | 0.0% |
| Mobile Home / Other | 101 | 38.0% |
| Total | 266 | 100.0% |
Housing Structures by Occupancy in La Harpe
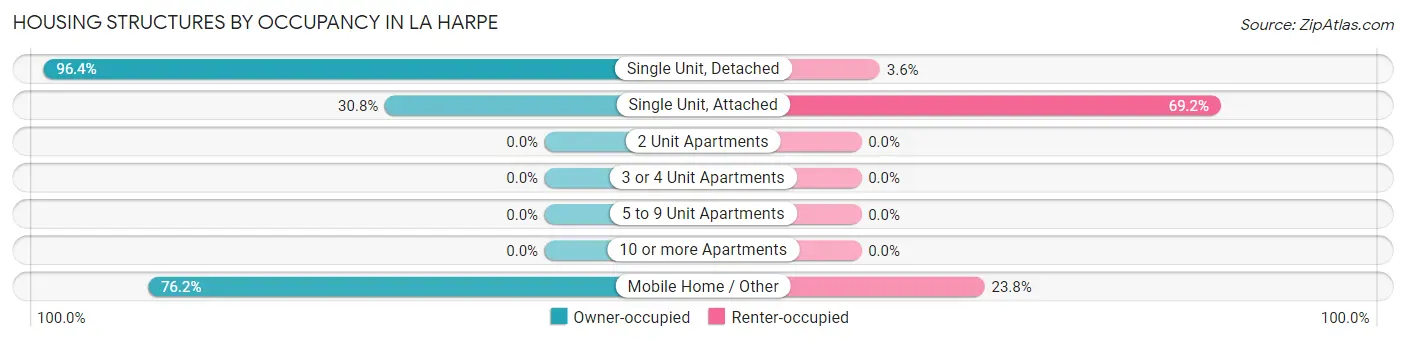
| Structure Type | Owner-occupied | Renter-occupied |
| Single Unit, Detached | 134 (96.4%) | 5 (3.6%) |
| Single Unit, Attached | 8 (30.8%) | 18 (69.2%) |
| 2 Unit Apartments | 0 (0.0%) | 0 (0.0%) |
| 3 or 4 Unit Apartments | 0 (0.0%) | 0 (0.0%) |
| 5 to 9 Unit Apartments | 0 (0.0%) | 0 (0.0%) |
| 10 or more Apartments | 0 (0.0%) | 0 (0.0%) |
| Mobile Home / Other | 77 (76.2%) | 24 (23.8%) |
| Total | 219 (82.3%) | 47 (17.7%) |
Housing Structures by Number of Rooms in La Harpe
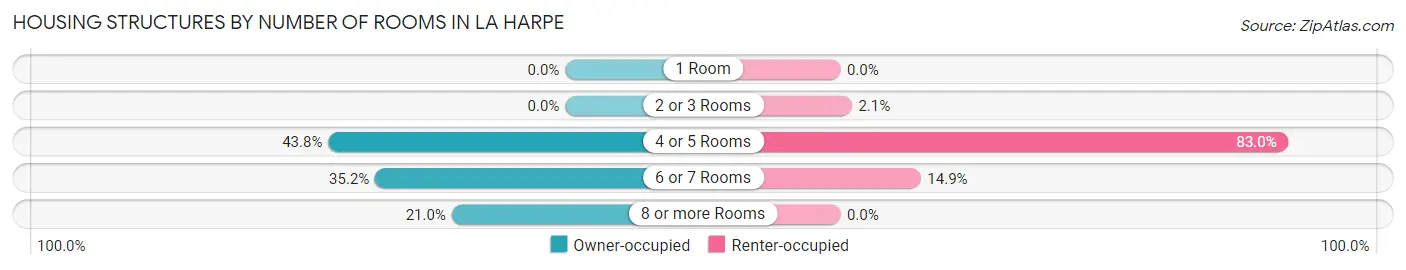
| Number of Rooms | Owner-occupied | Renter-occupied |
| 1 Room | 0 (0.0%) | 0 (0.0%) |
| 2 or 3 Rooms | 0 (0.0%) | 1 (2.1%) |
| 4 or 5 Rooms | 96 (43.8%) | 39 (83.0%) |
| 6 or 7 Rooms | 77 (35.2%) | 7 (14.9%) |
| 8 or more Rooms | 46 (21.0%) | 0 (0.0%) |
| Total | 219 (100.0%) | 47 (100.0%) |
Housing Structure by Heating Type in La Harpe
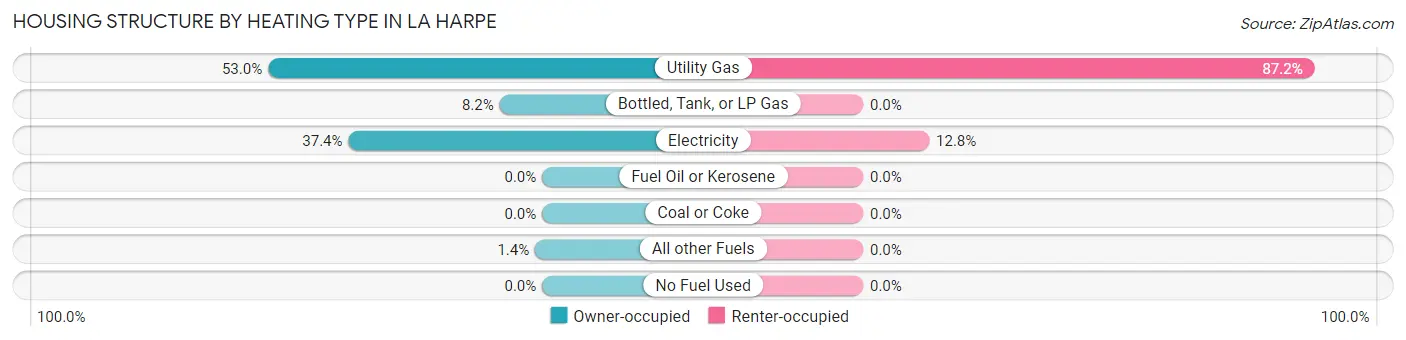
| Heating Type | Owner-occupied | Renter-occupied |
| Utility Gas | 116 (53.0%) | 41 (87.2%) |
| Bottled, Tank, or LP Gas | 18 (8.2%) | 0 (0.0%) |
| Electricity | 82 (37.4%) | 6 (12.8%) |
| Fuel Oil or Kerosene | 0 (0.0%) | 0 (0.0%) |
| Coal or Coke | 0 (0.0%) | 0 (0.0%) |
| All other Fuels | 3 (1.4%) | 0 (0.0%) |
| No Fuel Used | 0 (0.0%) | 0 (0.0%) |
| Total | 219 (100.0%) | 47 (100.0%) |
Household Vehicle Usage in La Harpe
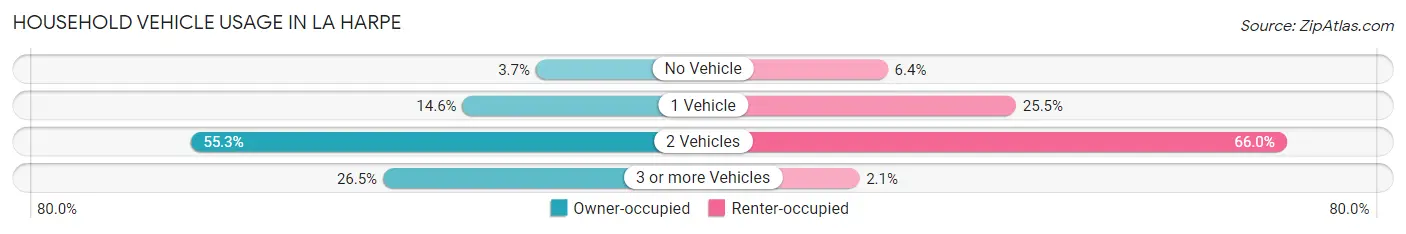
| Vehicles per Household | Owner-occupied | Renter-occupied |
| No Vehicle | 8 (3.6%) | 3 (6.4%) |
| 1 Vehicle | 32 (14.6%) | 12 (25.5%) |
| 2 Vehicles | 121 (55.2%) | 31 (66.0%) |
| 3 or more Vehicles | 58 (26.5%) | 1 (2.1%) |
| Total | 219 (100.0%) | 47 (100.0%) |
Real Estate & Mortgages in La Harpe
Real Estate and Mortgage Overview in La Harpe
| Characteristic | Without Mortgage | With Mortgage |
| Housing Units | 175 | 44 |
| Median Property Value | $54,300 | $90,000 |
| Median Household Income | - | - |
| Monthly Housing Costs | $441 | $0 |
| Real Estate Taxes | $1,051 | $0 |
Property Value by Mortgage Status in La Harpe
| Property Value | Without Mortgage | With Mortgage |
| Less than $50,000 | 61 (34.9%) | 9 (20.4%) |
| $50,000 to $99,999 | 99 (56.6%) | 17 (38.6%) |
| $100,000 to $299,999 | 12 (6.9%) | 8 (18.2%) |
| $300,000 to $499,999 | 0 (0.0%) | 10 (22.7%) |
| $500,000 to $749,999 | 0 (0.0%) | 0 (0.0%) |
| $750,000 to $999,999 | 0 (0.0%) | 0 (0.0%) |
| $1,000,000 or more | 3 (1.7%) | 0 (0.0%) |
| Total | 175 (100.0%) | 44 (100.0%) |
Household Income by Mortgage Status in La Harpe
| Household Income | Without Mortgage | With Mortgage |
| Less than $10,000 | 3 (1.7%) | 0 (0.0%) |
| $10,000 to $24,999 | 35 (20.0%) | 0 (0.0%) |
| $25,000 to $34,999 | 20 (11.4%) | 0 (0.0%) |
| $35,000 to $49,999 | 30 (17.1%) | 10 (22.7%) |
| $50,000 to $74,999 | 17 (9.7%) | 5 (11.4%) |
| $75,000 to $99,999 | 17 (9.7%) | 12 (27.3%) |
| $100,000 to $149,999 | 53 (30.3%) | 7 (15.9%) |
| $150,000 or more | 0 (0.0%) | 7 (15.9%) |
| Total | 175 (100.0%) | 44 (100.0%) |
Property Value to Household Income Ratio in La Harpe
| Value-to-Income Ratio | Without Mortgage | With Mortgage |
| Less than 2.0x | 133 (76.0%) | 66,250 (150,568.2%) |
| 2.0x to 2.9x | 30 (17.1%) | 24 (54.5%) |
| 3.0x to 3.9x | 2 (1.1%) | 7 (15.9%) |
| 4.0x or more | 10 (5.7%) | 6 (13.6%) |
| Total | 175 (100.0%) | 44 (100.0%) |
Real Estate Taxes by Mortgage Status in La Harpe
| Property Taxes | Without Mortgage | With Mortgage |
| Less than $800 | 62 (35.4%) | 0 (0.0%) |
| $800 to $1,499 | 83 (47.4%) | 12 (27.3%) |
| $800 to $1,499 | 30 (17.1%) | 11 (25.0%) |
| Total | 175 (100.0%) | 44 (100.0%) |
Health & Disability in La Harpe
Health Insurance Coverage by Age in La Harpe
| Age Bracket | With Coverage | Without Coverage |
| Under 6 Years | 4 (80.0%) | 1 (20.0%) |
| 6 to 18 Years | 53 (42.7%) | 71 (57.3%) |
| 19 to 25 Years | 24 (66.7%) | 12 (33.3%) |
| 26 to 34 Years | 13 (68.4%) | 6 (31.6%) |
| 35 to 44 Years | 28 (59.6%) | 19 (40.4%) |
| 45 to 54 Years | 63 (95.5%) | 3 (4.5%) |
| 55 to 64 Years | 107 (95.5%) | 5 (4.5%) |
| 65 to 74 Years | 106 (100.0%) | 0 (0.0%) |
| 75 Years and older | 40 (100.0%) | 0 (0.0%) |
| Total | 438 (78.9%) | 117 (21.1%) |
Health Insurance Coverage by Citizenship Status in La Harpe
| Citizenship Status | With Coverage | Without Coverage |
| Native Born | 4 (80.0%) | 1 (20.0%) |
| Foreign Born, Citizen | 53 (42.7%) | 71 (57.3%) |
| Foreign Born, not a Citizen | 24 (66.7%) | 12 (33.3%) |
Health Insurance Coverage by Household Income in La Harpe
| Household Income | With Coverage | Without Coverage |
| Under $25,000 | 52 (91.2%) | 5 (8.8%) |
| $25,000 to $49,999 | 167 (69.9%) | 72 (30.1%) |
| $50,000 to $74,999 | 82 (82.8%) | 17 (17.2%) |
| $75,000 to $99,999 | 61 (85.9%) | 10 (14.1%) |
| $100,000 and over | 76 (85.4%) | 13 (14.6%) |
Public vs Private Health Insurance Coverage by Age in La Harpe
| Age Bracket | Public Insurance | Private Insurance |
| Under 6 | 0 (0.0%) | 4 (80.0%) |
| 6 to 18 Years | 20 (16.1%) | 35 (28.2%) |
| 19 to 25 Years | 1 (2.8%) | 23 (63.9%) |
| 25 to 34 Years | 9 (47.4%) | 4 (21.0%) |
| 35 to 44 Years | 2 (4.3%) | 26 (55.3%) |
| 45 to 54 Years | 7 (10.6%) | 56 (84.9%) |
| 55 to 64 Years | 49 (43.8%) | 81 (72.3%) |
| 65 to 74 Years | 102 (96.2%) | 85 (80.2%) |
| 75 Years and over | 40 (100.0%) | 37 (92.5%) |
| Total | 230 (41.4%) | 351 (63.2%) |
Disability Status by Sex by Age in La Harpe
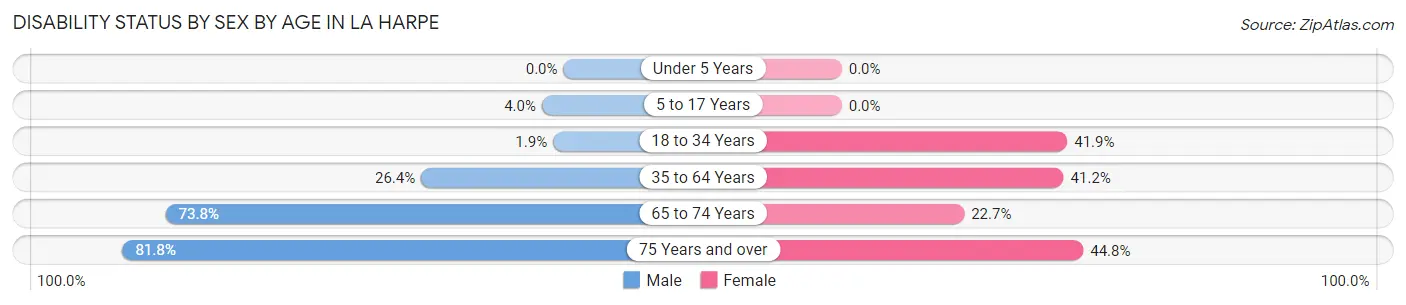
| Age Bracket | Male | Female |
| Under 5 Years | 0 (0.0%) | 0 (0.0%) |
| 5 to 17 Years | 2 (4.0%) | 0 (0.0%) |
| 18 to 34 Years | 1 (1.9%) | 18 (41.9%) |
| 35 to 64 Years | 28 (26.4%) | 49 (41.2%) |
| 65 to 74 Years | 62 (73.8%) | 5 (22.7%) |
| 75 Years and over | 9 (81.8%) | 13 (44.8%) |
Disability Class by Sex by Age in La Harpe
Disability Class: Hearing Difficulty
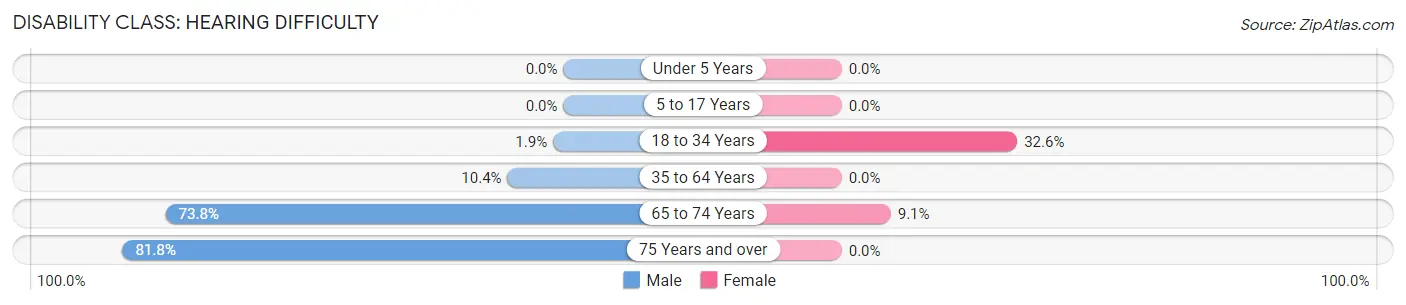
| Age Bracket | Male | Female |
| Under 5 Years | 0 (0.0%) | 0 (0.0%) |
| 5 to 17 Years | 0 (0.0%) | 0 (0.0%) |
| 18 to 34 Years | 1 (1.9%) | 14 (32.6%) |
| 35 to 64 Years | 11 (10.4%) | 0 (0.0%) |
| 65 to 74 Years | 62 (73.8%) | 2 (9.1%) |
| 75 Years and over | 9 (81.8%) | 0 (0.0%) |
Disability Class: Vision Difficulty
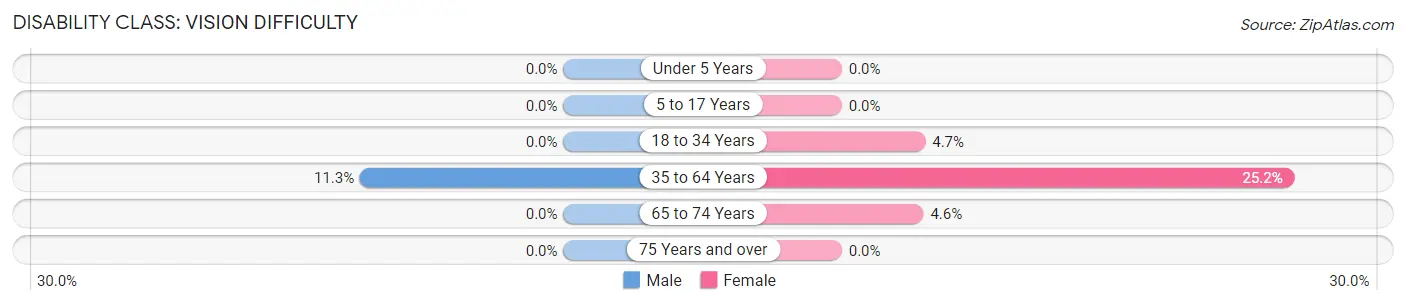
| Age Bracket | Male | Female |
| Under 5 Years | 0 (0.0%) | 0 (0.0%) |
| 5 to 17 Years | 0 (0.0%) | 0 (0.0%) |
| 18 to 34 Years | 0 (0.0%) | 2 (4.6%) |
| 35 to 64 Years | 12 (11.3%) | 30 (25.2%) |
| 65 to 74 Years | 0 (0.0%) | 1 (4.5%) |
| 75 Years and over | 0 (0.0%) | 0 (0.0%) |
Disability Class: Cognitive Difficulty
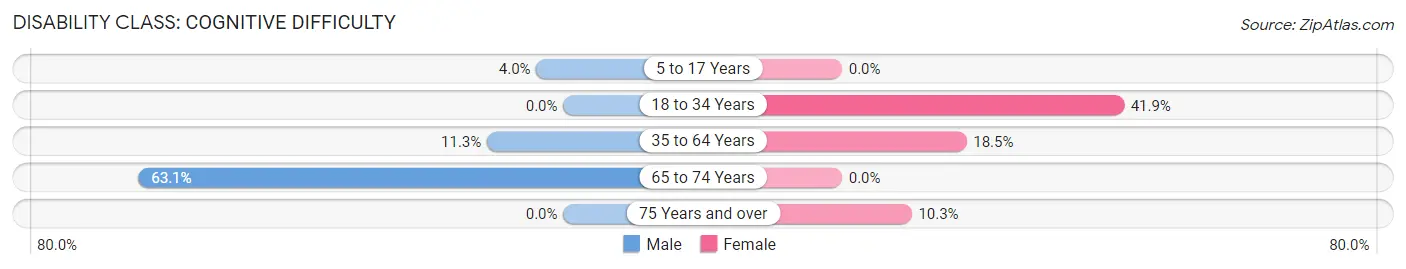
| Age Bracket | Male | Female |
| 5 to 17 Years | 2 (4.0%) | 0 (0.0%) |
| 18 to 34 Years | 0 (0.0%) | 18 (41.9%) |
| 35 to 64 Years | 12 (11.3%) | 22 (18.5%) |
| 65 to 74 Years | 53 (63.1%) | 0 (0.0%) |
| 75 Years and over | 0 (0.0%) | 3 (10.3%) |
Disability Class: Ambulatory Difficulty
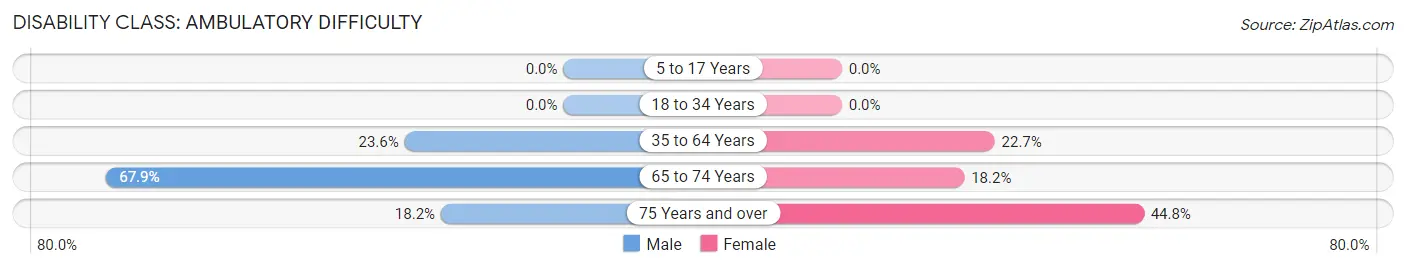
| Age Bracket | Male | Female |
| 5 to 17 Years | 0 (0.0%) | 0 (0.0%) |
| 18 to 34 Years | 0 (0.0%) | 0 (0.0%) |
| 35 to 64 Years | 25 (23.6%) | 27 (22.7%) |
| 65 to 74 Years | 57 (67.9%) | 4 (18.2%) |
| 75 Years and over | 2 (18.2%) | 13 (44.8%) |
Disability Class: Self-Care Difficulty
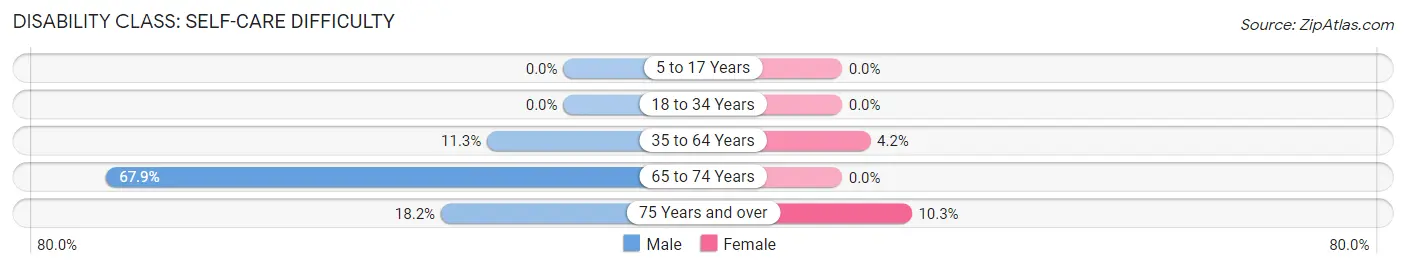
| Age Bracket | Male | Female |
| 5 to 17 Years | 0 (0.0%) | 0 (0.0%) |
| 18 to 34 Years | 0 (0.0%) | 0 (0.0%) |
| 35 to 64 Years | 12 (11.3%) | 5 (4.2%) |
| 65 to 74 Years | 57 (67.9%) | 0 (0.0%) |
| 75 Years and over | 2 (18.2%) | 3 (10.3%) |
Technology Access in La Harpe
Computing Device Access in La Harpe
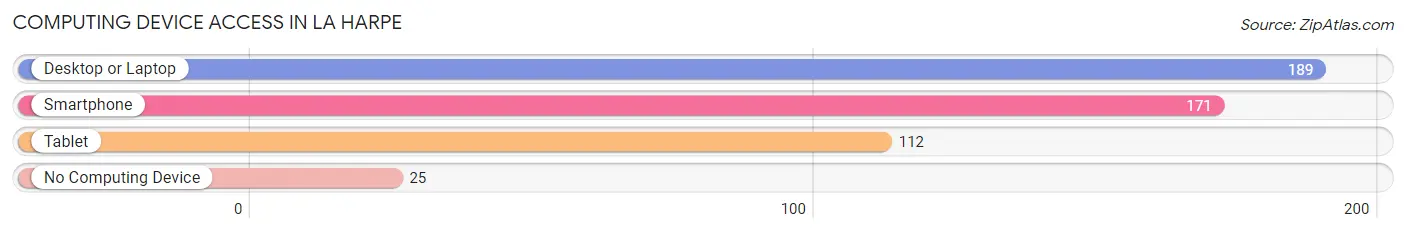
| Device Type | # Households | % Households |
| Desktop or Laptop | 189 | 71.1% |
| Smartphone | 171 | 64.3% |
| Tablet | 112 | 42.1% |
| No Computing Device | 25 | 9.4% |
| Total | 266 | 100.0% |
Internet Access in La Harpe
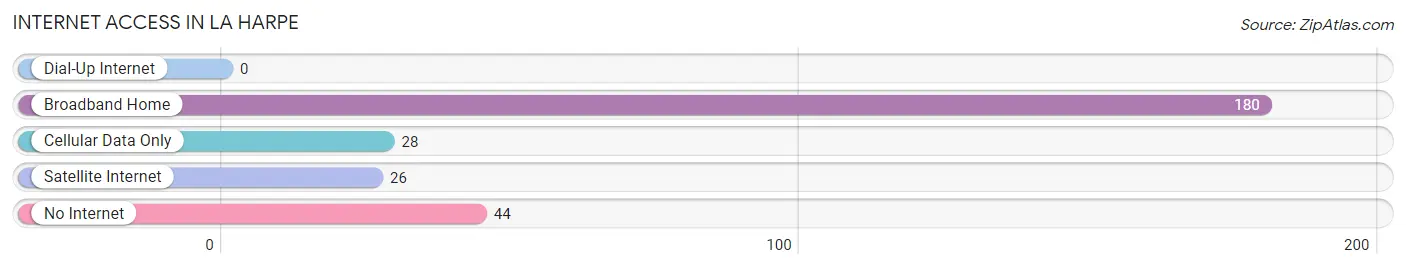
| Internet Type | # Households | % Households |
| Dial-Up Internet | 0 | 0.0% |
| Broadband Home | 180 | 67.7% |
| Cellular Data Only | 28 | 10.5% |
| Satellite Internet | 26 | 9.8% |
| No Internet | 44 | 16.5% |
| Total | 266 | 100.0% |
La Harpe Summary
La Harpe, Kansas is a small town located in the southeastern corner of the state. It is situated in the Flint Hills region of Kansas, and is part of the larger Allen County. The town was founded in 1872 and has a population of just over 500 people.
Geography
La Harpe is located in the Flint Hills region of Kansas, which is characterized by rolling hills and prairies. The town is situated in the southeastern corner of the state, and is part of the larger Allen County. La Harpe is located at an elevation of 1,068 feet above sea level. The town is located on the banks of the Neosho River, which is a tributary of the Arkansas River. The town is surrounded by a number of small towns and rural communities, including Iola, Humboldt, and Moran.
History
La Harpe was founded in 1872 by a group of settlers from France. The town was named after the French explorer Jean-Baptiste La Harpe, who explored the area in the late 1700s. The town was originally a farming community, and the settlers grew wheat, corn, and other crops. The town was also home to a number of small businesses, including a general store, a blacksmith shop, and a hotel.
In the early 1900s, the town began to experience a period of growth. The population increased from just over 200 people in 1900 to nearly 500 people by 1910. The town was also home to a number of businesses, including a bank, a newspaper, and a movie theater.
In the 1950s, the town began to experience a period of decline. The population decreased from nearly 500 people in 1950 to just over 300 people by 1960. The decline was due in part to the decline of the local farming industry, as well as the closure of several businesses.
Economy
The economy of La Harpe is largely based on agriculture. The town is home to a number of farms, which grow wheat, corn, and other crops. The town is also home to a number of small businesses, including a general store, a hardware store, and a restaurant.
Demographics
As of the 2010 census, the population of La Harpe was 514 people. The racial makeup of the town was 97.3% White, 0.6% African American, 0.2% Native American, 0.2% Asian, 0.4% from other races, and 1.3% from two or more races. The median household income was $37,500, and the median family income was $45,000.
Conclusion
La Harpe, Kansas is a small town located in the southeastern corner of the state. It is situated in the Flint Hills region of Kansas, and is part of the larger Allen County. The town was founded in 1872 and has a population of just over 500 people. The economy of La Harpe is largely based on agriculture, and the town is home to a number of small businesses. The racial makeup of the town is predominantly White, with a small percentage of African American, Native American, and Asian residents.
Common Questions
What is Per Capita Income in La Harpe?
Per Capita income in La Harpe is $26,287.
What is the Median Family Income in La Harpe?
Median Family Income in La Harpe is $56,667.
What is the Median Household income in La Harpe?
Median Household Income in La Harpe is $39,722.
What is Inequality or Gini Index in La Harpe?
Inequality or Gini Index in La Harpe is 0.35.
What is the Total Population of La Harpe?
Total Population of La Harpe is 555.
What is the Total Male Population of La Harpe?
Total Male Population of La Harpe is 303.
What is the Total Female Population of La Harpe?
Total Female Population of La Harpe is 252.
What is the Ratio of Males per 100 Females in La Harpe?
There are 120.24 Males per 100 Females in La Harpe.
What is the Ratio of Females per 100 Males in La Harpe?
There are 83.17 Females per 100 Males in La Harpe.
What is the Median Population Age in La Harpe?
Median Population Age in La Harpe is 52.5 Years.
What is the Average Family Size in La Harpe
Average Family Size in La Harpe is 2.4 People.
What is the Average Household Size in La Harpe
Average Household Size in La Harpe is 2.1 People.
How Large is the Labor Force in La Harpe?
There are 300 People in the Labor Forcein in La Harpe.
What is the Percentage of People in the Labor Force in La Harpe?
60.6% of People are in the Labor Force in La Harpe.
What is the Unemployment Rate in La Harpe?
Unemployment Rate in La Harpe is 3.3%.