Golden, CO Map & Demographics
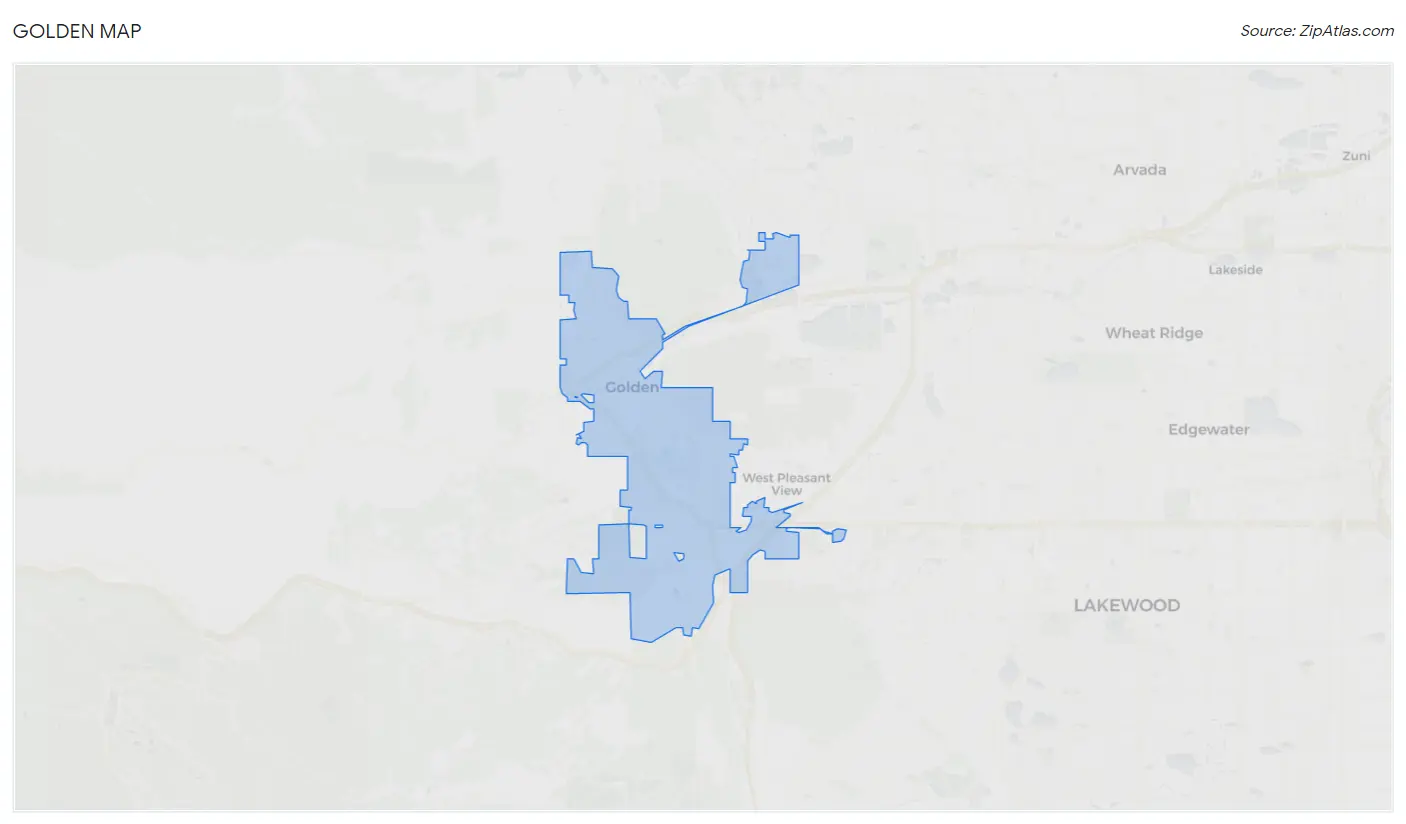
Golden Map
Golden Overview
$52,994
PER CAPITA INCOME
$125,370
AVG FAMILY INCOME
$90,990
AVG HOUSEHOLD INCOME
3.4%
WAGE / INCOME GAP [ % ]
96.6¢/ $1
WAGE / INCOME GAP [ $ ]
0.48
INEQUALITY / GINI INDEX
20,461
TOTAL POPULATION
11,954
MALE POPULATION
8,507
FEMALE POPULATION
140.52
MALES / 100 FEMALES
71.16
FEMALES / 100 MALES
35.2
MEDIAN AGE
2.9
AVG FAMILY SIZE
2.3
AVG HOUSEHOLD SIZE
11,136
LABOR FORCE [ PEOPLE ]
63.8%
PERCENT IN LABOR FORCE
4.6%
UNEMPLOYMENT RATE
Income in Golden
Income Overview in Golden
Per Capita Income in Golden is $52,994, while median incomes of families and households are $125,370 and $90,990 respectively.
| Characteristic | Number | Measure |
| Per Capita Income | 20,461 | $52,994 |
| Median Family Income | 4,274 | $125,370 |
| Mean Family Income | 4,274 | $162,049 |
| Median Household Income | 7,748 | $90,990 |
| Mean Household Income | 7,748 | $134,312 |
| Income Deficit | 4,274 | $0 |
| Wage / Income Gap (%) | 20,461 | 3.43% |
| Wage / Income Gap ($) | 20,461 | 96.57¢ per $1 |
| Gini / Inequality Index | 20,461 | 0.48 |
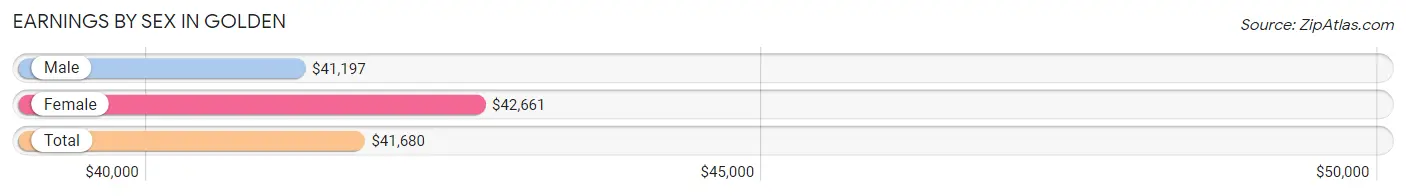
Earnings by Sex in Golden
Average Earnings in Golden are $41,680, $41,197 for men and $42,661 for women, a difference of 3.4%.
| Sex | Number | Average Earnings |
| Male | 7,558 (60.3%) | $41,197 |
| Female | 4,968 (39.7%) | $42,661 |
| Total | 12,526 (100.0%) | $41,680 |
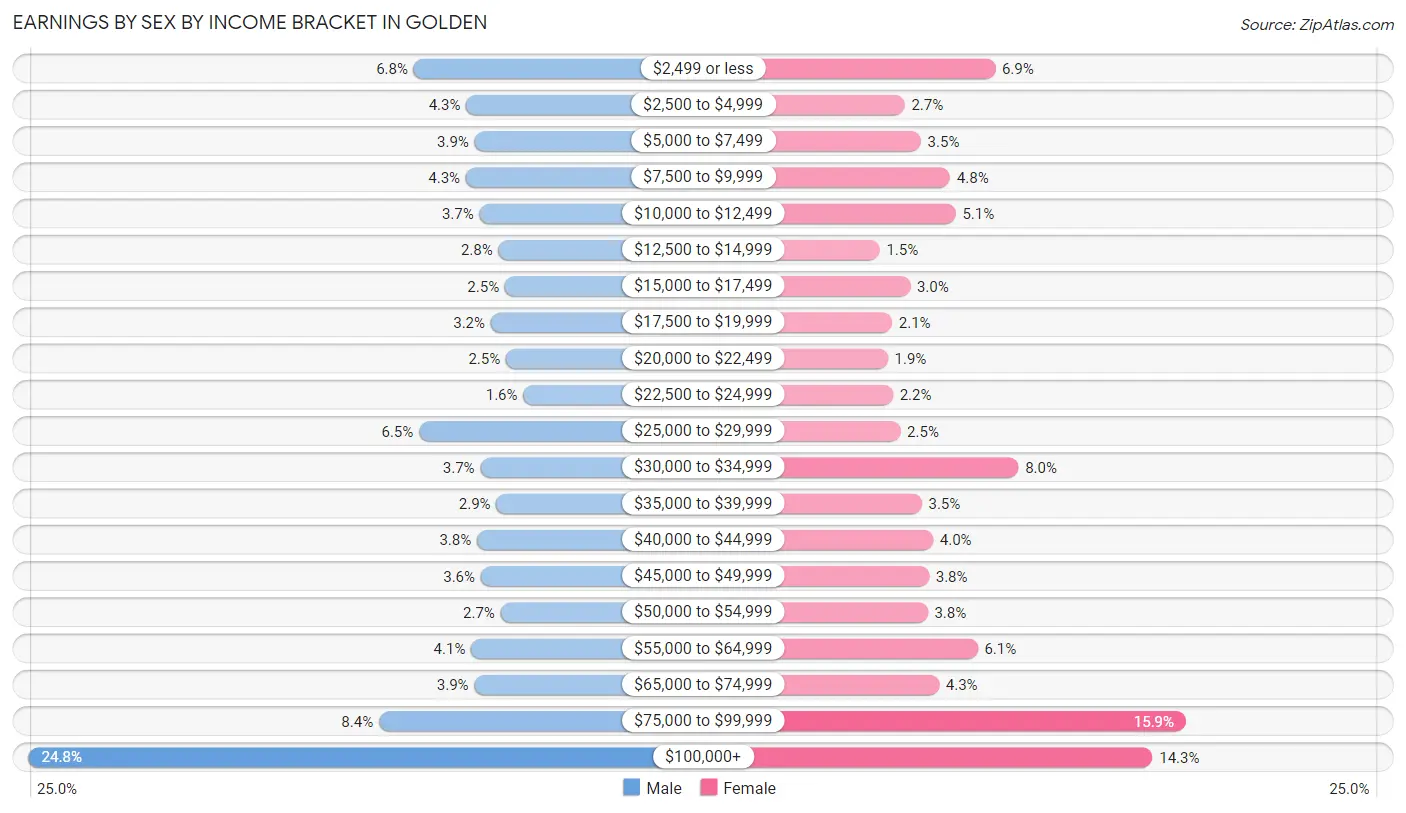
Earnings by Sex by Income Bracket in Golden
The most common earnings brackets in Golden are $100,000+ for men (1,875 | 24.8%) and $75,000 to $99,999 for women (789 | 15.9%).
| Income | Male | Female |
| $2,499 or less | 512 (6.8%) | 345 (6.9%) |
| $2,500 to $4,999 | 326 (4.3%) | 134 (2.7%) |
| $5,000 to $7,499 | 296 (3.9%) | 172 (3.5%) |
| $7,500 to $9,999 | 327 (4.3%) | 240 (4.8%) |
| $10,000 to $12,499 | 279 (3.7%) | 253 (5.1%) |
| $12,500 to $14,999 | 212 (2.8%) | 76 (1.5%) |
| $15,000 to $17,499 | 189 (2.5%) | 147 (3.0%) |
| $17,500 to $19,999 | 239 (3.2%) | 105 (2.1%) |
| $20,000 to $22,499 | 185 (2.5%) | 95 (1.9%) |
| $22,500 to $24,999 | 124 (1.6%) | 107 (2.1%) |
| $25,000 to $29,999 | 493 (6.5%) | 124 (2.5%) |
| $30,000 to $34,999 | 276 (3.6%) | 399 (8.0%) |
| $35,000 to $39,999 | 219 (2.9%) | 174 (3.5%) |
| $40,000 to $44,999 | 288 (3.8%) | 200 (4.0%) |
| $45,000 to $49,999 | 274 (3.6%) | 191 (3.8%) |
| $50,000 to $54,999 | 204 (2.7%) | 188 (3.8%) |
| $55,000 to $64,999 | 308 (4.1%) | 304 (6.1%) |
| $65,000 to $74,999 | 297 (3.9%) | 214 (4.3%) |
| $75,000 to $99,999 | 635 (8.4%) | 789 (15.9%) |
| $100,000+ | 1,875 (24.8%) | 711 (14.3%) |
| Total | 7,558 (100.0%) | 4,968 (100.0%) |
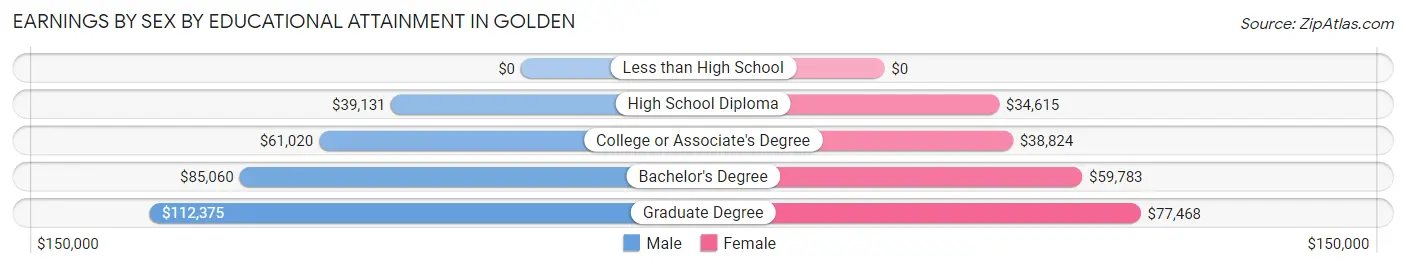
Earnings by Sex by Educational Attainment in Golden
Average earnings in Golden are $67,377 for men and $54,434 for women, a difference of 19.2%. Men with an educational attainment of graduate degree enjoy the highest average annual earnings of $112,375, while those with high school diploma education earn the least with $39,131. Women with an educational attainment of graduate degree earn the most with the average annual earnings of $77,468, while those with high school diploma education have the smallest earnings of $34,615.
| Educational Attainment | Male Income | Female Income |
| Less than High School | - | - |
| High School Diploma | $39,131 | $34,615 |
| College or Associate's Degree | $61,020 | $38,824 |
| Bachelor's Degree | $85,060 | $59,783 |
| Graduate Degree | $112,375 | $77,468 |
| Total | $67,377 | $54,434 |
Family Income in Golden
Family Income Brackets in Golden
According to the Golden family income data, there are 1,274 families falling into the $200,000+ income range, which is the most common income bracket and makes up 29.8% of all families. Conversely, the $10,000 to $14,999 income bracket is the least frequent group with only 13 families (0.3%) belonging to this category.
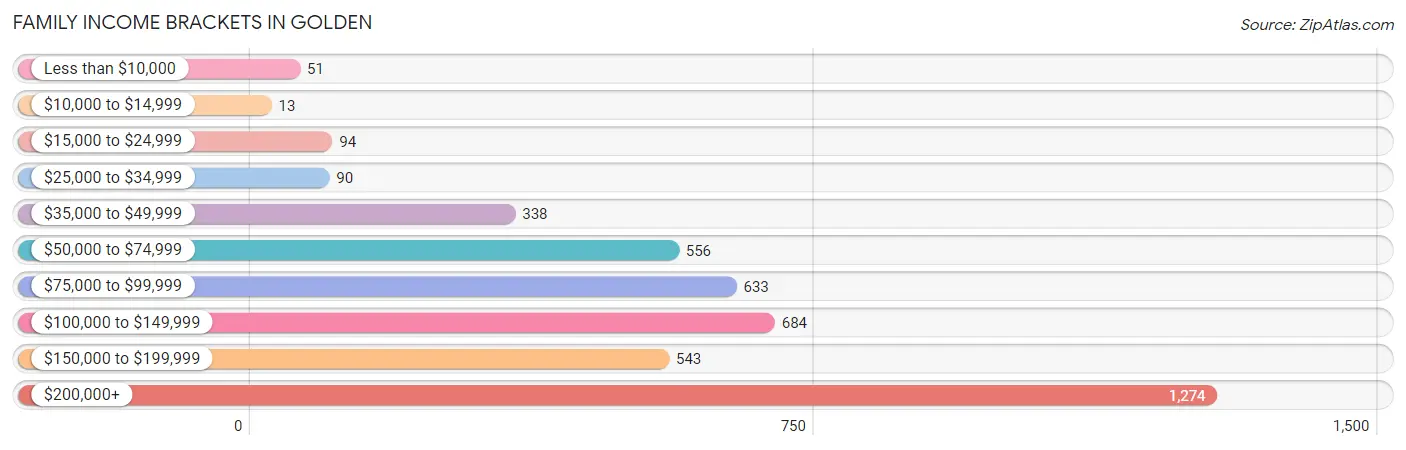
| Income Bracket | # Families | % Families |
| Less than $10,000 | 51 | 1.2% |
| $10,000 to $14,999 | 13 | 0.3% |
| $15,000 to $24,999 | 94 | 2.2% |
| $25,000 to $34,999 | 90 | 2.1% |
| $35,000 to $49,999 | 338 | 7.9% |
| $50,000 to $74,999 | 556 | 13.0% |
| $75,000 to $99,999 | 633 | 14.8% |
| $100,000 to $149,999 | 684 | 16.0% |
| $150,000 to $199,999 | 543 | 12.7% |
| $200,000+ | 1,274 | 29.8% |
Family Income by Famaliy Size in Golden
5-person families (275 | 6.4%) account for the highest median family income in Golden with $223,083 per family, while 4-person families (958 | 22.4%) have the highest median income of $51,478 per family member.
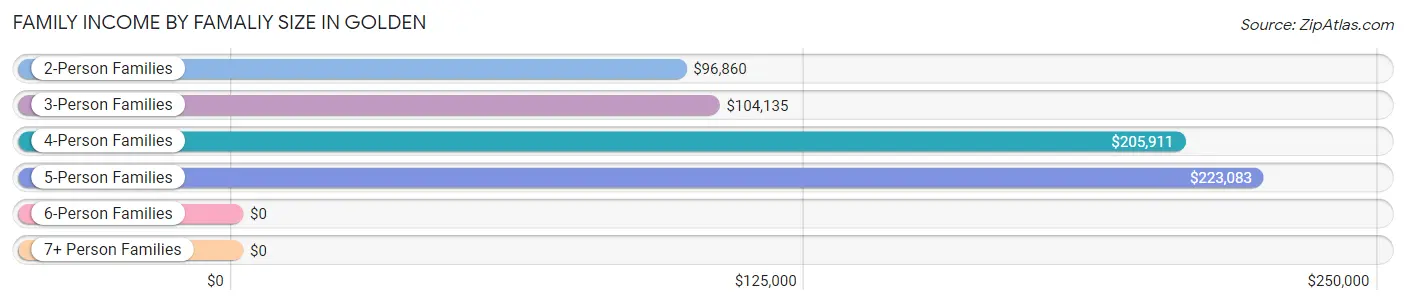
| Income Bracket | # Families | Median Income |
| 2-Person Families | 2,230 (52.2%) | $96,860 |
| 3-Person Families | 809 (18.9%) | $104,135 |
| 4-Person Families | 958 (22.4%) | $205,911 |
| 5-Person Families | 275 (6.4%) | $223,083 |
| 6-Person Families | 0 (0.0%) | $0 |
| 7+ Person Families | 2 (0.1%) | $0 |
| Total | 4,274 (100.0%) | $125,370 |
Family Income by Number of Earners in Golden
The median family income in Golden is $125,370, with families comprising 3+ earners (270) having the highest median family income of $223,667, while families with no earners (508) have the lowest median family income of $70,714, accounting for 6.3% and 11.9% of families, respectively.
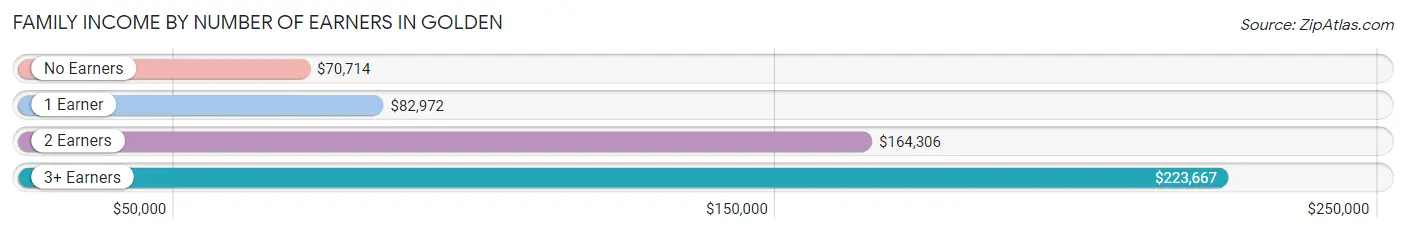
| Number of Earners | # Families | Median Income |
| No Earners | 508 (11.9%) | $70,714 |
| 1 Earner | 1,195 (28.0%) | $82,972 |
| 2 Earners | 2,301 (53.8%) | $164,306 |
| 3+ Earners | 270 (6.3%) | $223,667 |
| Total | 4,274 (100.0%) | $125,370 |
Household Income in Golden
Household Income Brackets in Golden
With 1,511 households falling in the category, the $200,000+ income range is the most frequent in Golden, accounting for 19.5% of all households. In contrast, only 108 households (1.4%) fall into the $10,000 to $14,999 income bracket, making it the least populous group.
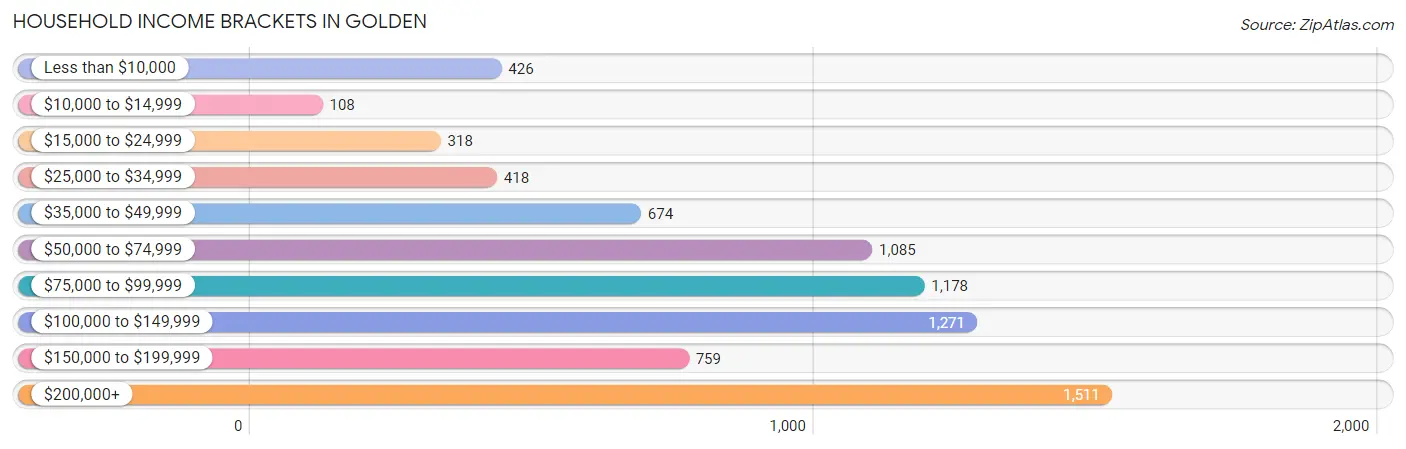
| Income Bracket | # Households | % Households |
| Less than $10,000 | 426 | 5.5% |
| $10,000 to $14,999 | 108 | 1.4% |
| $15,000 to $24,999 | 318 | 4.1% |
| $25,000 to $34,999 | 418 | 5.4% |
| $35,000 to $49,999 | 674 | 8.7% |
| $50,000 to $74,999 | 1,085 | 14.0% |
| $75,000 to $99,999 | 1,178 | 15.2% |
| $100,000 to $149,999 | 1,271 | 16.4% |
| $150,000 to $199,999 | 759 | 9.8% |
| $200,000+ | 1,511 | 19.5% |
Household Income by Householder Age in Golden
The median household income in Golden is $90,990, with the highest median household income of $107,875 found in the 25 to 44 years age bracket for the primary householder. A total of 2,554 households (33.0%) fall into this category. Meanwhile, the 15 to 24 years age bracket for the primary householder has the lowest median household income of $35,688, with 623 households (8.0%) in this group.
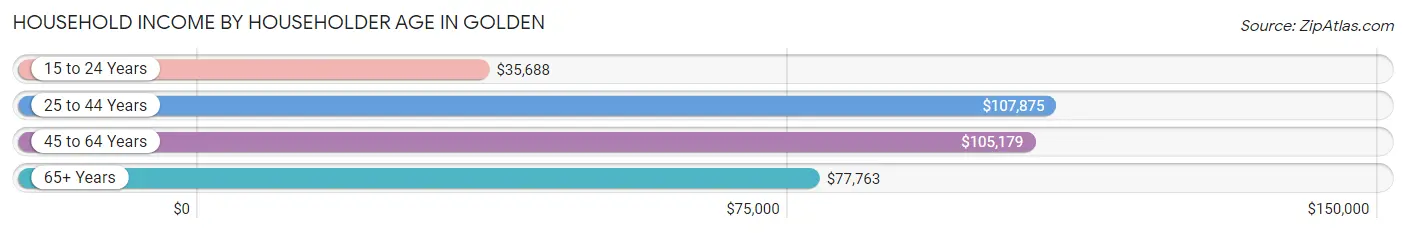
| Income Bracket | # Households | Median Income |
| 15 to 24 Years | 623 (8.0%) | $35,688 |
| 25 to 44 Years | 2,554 (33.0%) | $107,875 |
| 45 to 64 Years | 2,929 (37.8%) | $105,179 |
| 65+ Years | 1,642 (21.2%) | $77,763 |
| Total | 7,748 (100.0%) | $90,990 |
Poverty in Golden
Income Below Poverty by Sex and Age in Golden
With 12.7% poverty level for males and 7.2% for females among the residents of Golden, 18 to 24 year old males and 18 to 24 year old females are the most vulnerable to poverty, with 911 males (53.0%) and 318 females (39.6%) in their respective age groups living below the poverty level.
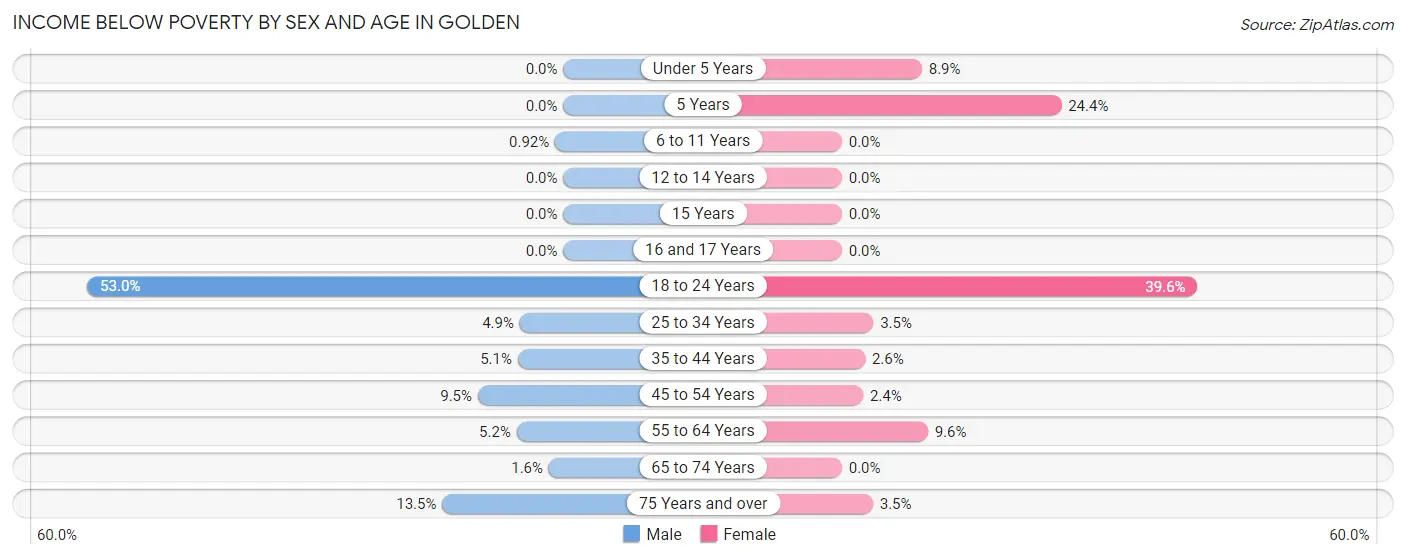
| Age Bracket | Male | Female |
| Under 5 Years | 0 (0.0%) | 18 (8.9%) |
| 5 Years | 0 (0.0%) | 11 (24.4%) |
| 6 to 11 Years | 6 (0.9%) | 0 (0.0%) |
| 12 to 14 Years | 0 (0.0%) | 0 (0.0%) |
| 15 Years | 0 (0.0%) | 0 (0.0%) |
| 16 and 17 Years | 0 (0.0%) | 0 (0.0%) |
| 18 to 24 Years | 911 (53.0%) | 318 (39.6%) |
| 25 to 34 Years | 71 (4.9%) | 36 (3.5%) |
| 35 to 44 Years | 66 (5.1%) | 32 (2.6%) |
| 45 to 54 Years | 95 (9.5%) | 28 (2.4%) |
| 55 to 64 Years | 73 (5.2%) | 103 (9.6%) |
| 65 to 74 Years | 12 (1.6%) | 0 (0.0%) |
| 75 Years and over | 50 (13.5%) | 25 (3.5%) |
| Total | 1,284 (12.7%) | 571 (7.2%) |
Income Above Poverty by Sex and Age in Golden
According to the poverty statistics in Golden, males aged under 5 years and females aged 6 to 11 years are the age groups that are most secure financially, with 100.0% of males and 100.0% of females in these age groups living above the poverty line.
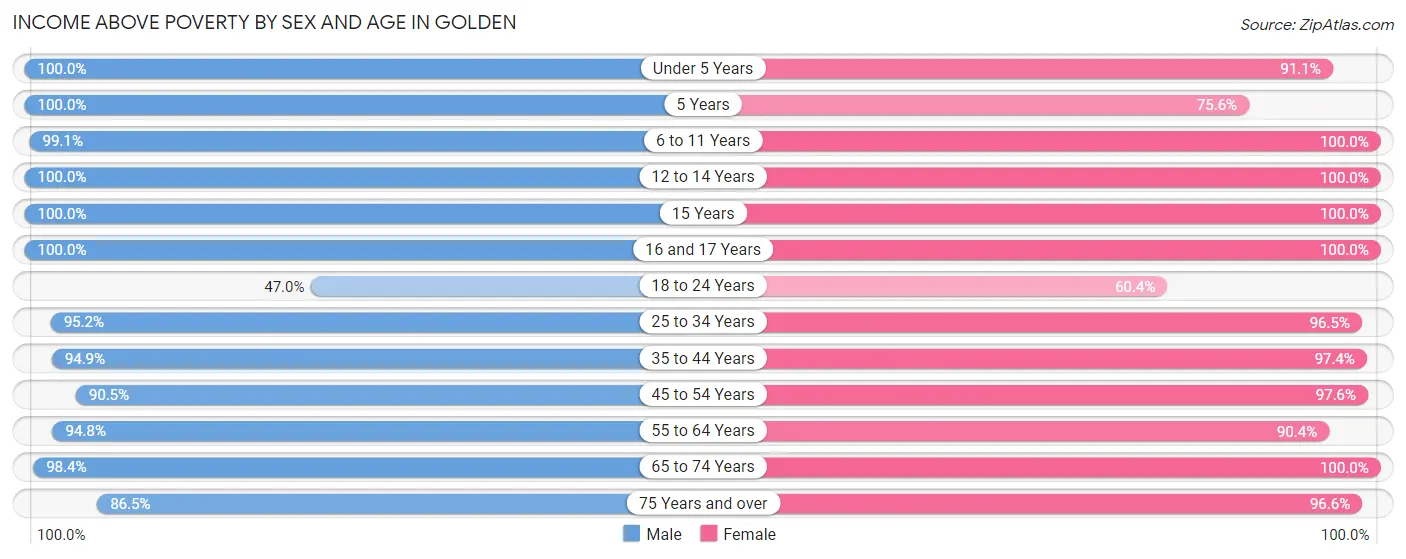
| Age Bracket | Male | Female |
| Under 5 Years | 452 (100.0%) | 184 (91.1%) |
| 5 Years | 186 (100.0%) | 34 (75.6%) |
| 6 to 11 Years | 643 (99.1%) | 487 (100.0%) |
| 12 to 14 Years | 300 (100.0%) | 370 (100.0%) |
| 15 Years | 193 (100.0%) | 92 (100.0%) |
| 16 and 17 Years | 303 (100.0%) | 62 (100.0%) |
| 18 to 24 Years | 807 (47.0%) | 485 (60.4%) |
| 25 to 34 Years | 1,392 (95.2%) | 993 (96.5%) |
| 35 to 44 Years | 1,236 (94.9%) | 1,207 (97.4%) |
| 45 to 54 Years | 903 (90.5%) | 1,156 (97.6%) |
| 55 to 64 Years | 1,334 (94.8%) | 973 (90.4%) |
| 65 to 74 Years | 734 (98.4%) | 619 (100.0%) |
| 75 Years and over | 321 (86.5%) | 700 (96.6%) |
| Total | 8,804 (87.3%) | 7,362 (92.8%) |
Income Below Poverty Among Married-Couple Families in Golden
The poverty statistics for married-couple families in Golden show that 0.9% or 29 of the total 3,299 families live below the poverty line. Families with 1 or 2 children have the highest poverty rate of 1.5%, comprising of 20 families. On the other hand, families with 3 or 4 children have the lowest poverty rate of 0.0%, which includes 0 families.
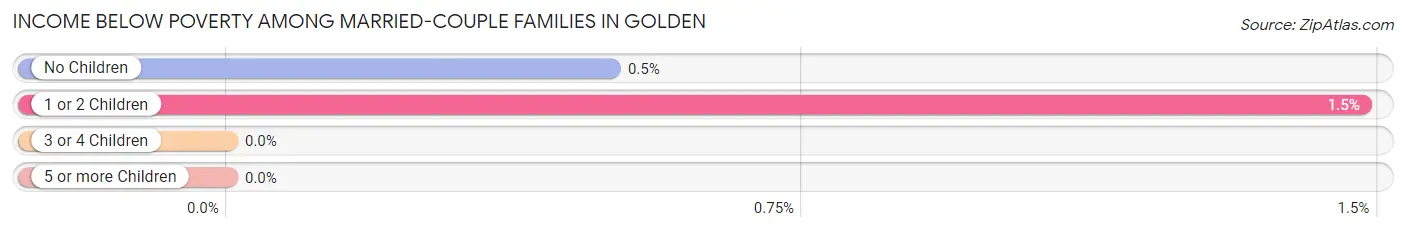
| Children | Above Poverty | Below Poverty |
| No Children | 1,783 (99.5%) | 9 (0.5%) |
| 1 or 2 Children | 1,333 (98.5%) | 20 (1.5%) |
| 3 or 4 Children | 154 (100.0%) | 0 (0.0%) |
| 5 or more Children | 0 (0.0%) | 0 (0.0%) |
| Total | 3,270 (99.1%) | 29 (0.9%) |
Income Below Poverty Among Single-Parent Households in Golden
According to the poverty data in Golden, 11.3% or 32 single-father households and 3.3% or 23 single-mother households are living below the poverty line. Among single-father households, those with no children have the highest poverty rate, with 32 households (14.2%) experiencing poverty. Likewise, among single-mother households, those with no children have the highest poverty rate, with 11 households (4.7%) falling below the poverty line.
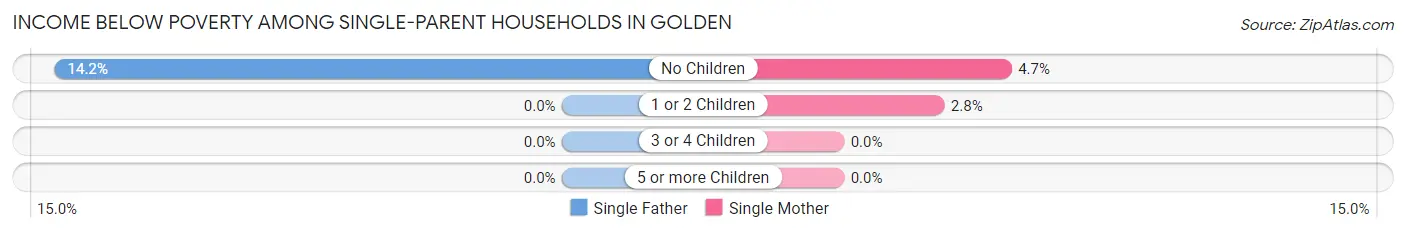
| Children | Single Father | Single Mother |
| No Children | 32 (14.2%) | 11 (4.7%) |
| 1 or 2 Children | 0 (0.0%) | 12 (2.8%) |
| 3 or 4 Children | 0 (0.0%) | 0 (0.0%) |
| 5 or more Children | 0 (0.0%) | 0 (0.0%) |
| Total | 32 (11.3%) | 23 (3.3%) |
Income Below Poverty Among Married-Couple vs Single-Parent Households in Golden
The poverty data for Golden shows that 29 of the married-couple family households (0.9%) and 55 of the single-parent households (5.6%) are living below the poverty level. Within the married-couple family households, those with 1 or 2 children have the highest poverty rate, with 20 households (1.5%) falling below the poverty line. Among the single-parent households, those with no children have the highest poverty rate, with 43 household (9.3%) living below poverty.
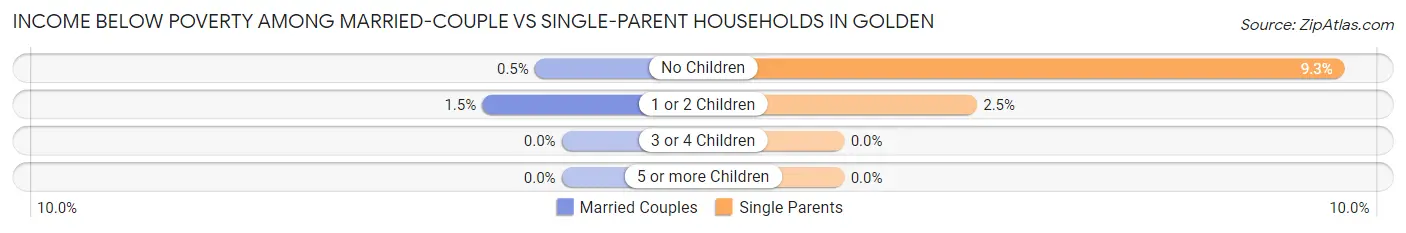
| Children | Married-Couple Families | Single-Parent Households |
| No Children | 9 (0.5%) | 43 (9.3%) |
| 1 or 2 Children | 20 (1.5%) | 12 (2.5%) |
| 3 or 4 Children | 0 (0.0%) | 0 (0.0%) |
| 5 or more Children | 0 (0.0%) | 0 (0.0%) |
| Total | 29 (0.9%) | 55 (5.6%) |
Race in Golden
The most populous races in Golden are White / Caucasian (18,177 | 88.8%), Hispanic or Latino (2,061 | 10.1%), and Two or more Races (1,282 | 6.3%).
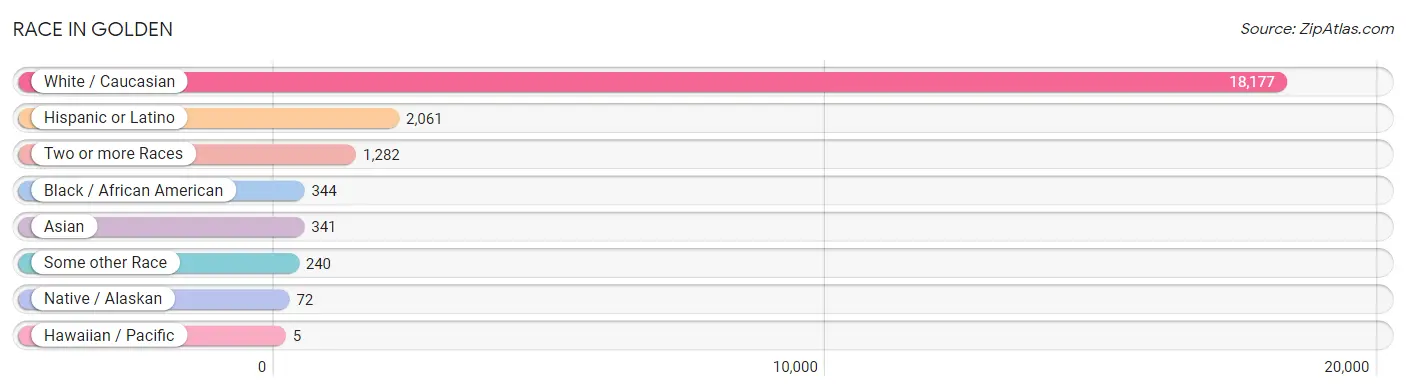
| Race | # Population | % Population |
| Asian | 341 | 1.7% |
| Black / African American | 344 | 1.7% |
| Hawaiian / Pacific | 5 | 0.0% |
| Hispanic or Latino | 2,061 | 10.1% |
| Native / Alaskan | 72 | 0.4% |
| White / Caucasian | 18,177 | 88.8% |
| Two or more Races | 1,282 | 6.3% |
| Some other Race | 240 | 1.2% |
| Total | 20,461 | 100.0% |
Ancestry in Golden
The most populous ancestries reported in Golden are German (4,028 | 19.7%), English (3,066 | 15.0%), Irish (2,386 | 11.7%), Mexican (1,313 | 6.4%), and Italian (1,160 | 5.7%), together accounting for 58.4% of all Golden residents.
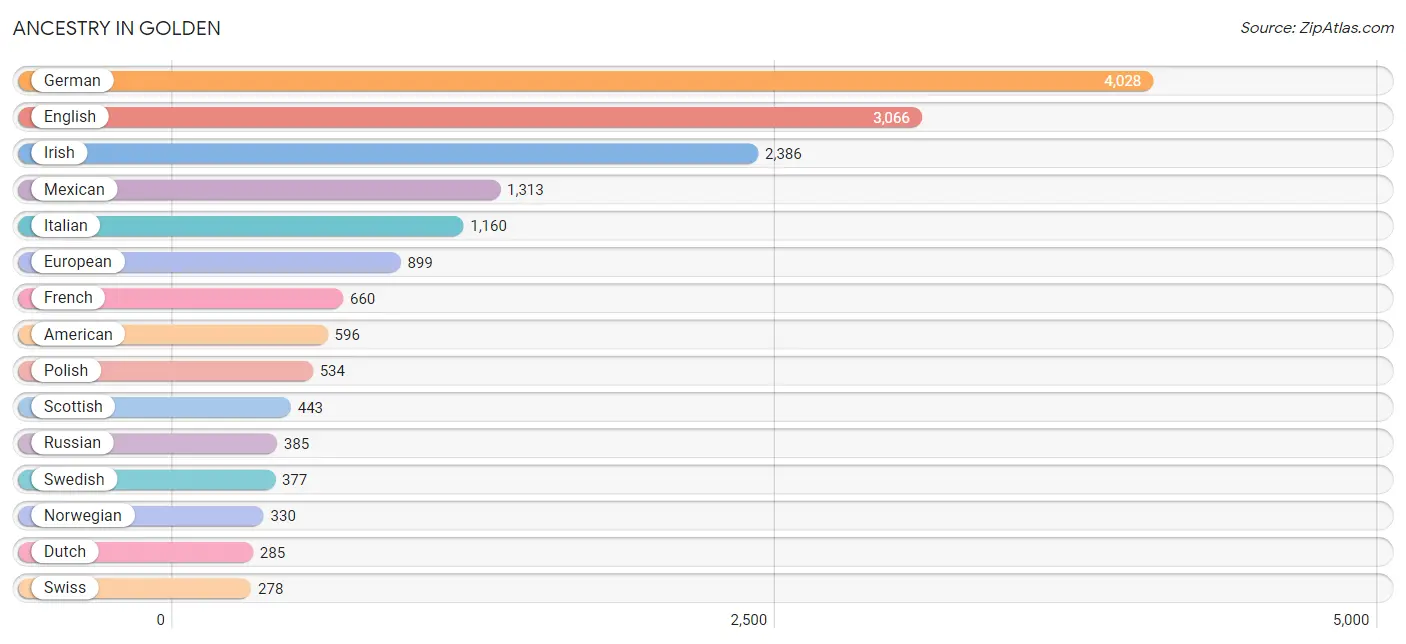
| Ancestry | # Population | % Population |
| African | 66 | 0.3% |
| Albanian | 4 | 0.0% |
| American | 596 | 2.9% |
| Apache | 136 | 0.7% |
| Arab | 30 | 0.2% |
| Austrian | 130 | 0.6% |
| Belgian | 47 | 0.2% |
| Bhutanese | 85 | 0.4% |
| Brazilian | 27 | 0.1% |
| British | 119 | 0.6% |
| Burmese | 67 | 0.3% |
| Cajun | 23 | 0.1% |
| Canadian | 11 | 0.1% |
| Celtic | 4 | 0.0% |
| Central American | 37 | 0.2% |
| Cherokee | 15 | 0.1% |
| Cheyenne | 10 | 0.1% |
| Chilean | 8 | 0.0% |
| Colombian | 1 | 0.0% |
| Croatian | 23 | 0.1% |
| Cuban | 28 | 0.1% |
| Czech | 158 | 0.8% |
| Czechoslovakian | 10 | 0.1% |
| Danish | 49 | 0.2% |
| Dutch | 285 | 1.4% |
| Eastern European | 193 | 0.9% |
| Ecuadorian | 26 | 0.1% |
| English | 3,066 | 15.0% |
| Estonian | 34 | 0.2% |
| European | 899 | 4.4% |
| Finnish | 28 | 0.1% |
| French | 660 | 3.2% |
| French Canadian | 55 | 0.3% |
| German | 4,028 | 19.7% |
| Greek | 86 | 0.4% |
| Honduran | 14 | 0.1% |
| Hopi | 17 | 0.1% |
| Hungarian | 74 | 0.4% |
| Icelander | 23 | 0.1% |
| Indian (Asian) | 262 | 1.3% |
| Iranian | 19 | 0.1% |
| Irish | 2,386 | 11.7% |
| Iroquois | 23 | 0.1% |
| Italian | 1,160 | 5.7% |
| Japanese | 8 | 0.0% |
| Korean | 76 | 0.4% |
| Laotian | 9 | 0.0% |
| Lebanese | 6 | 0.0% |
| Lithuanian | 55 | 0.3% |
| Mexican | 1,313 | 6.4% |
| Native Hawaiian | 11 | 0.1% |
| Navajo | 35 | 0.2% |
| Northern European | 12 | 0.1% |
| Norwegian | 330 | 1.6% |
| Osage | 9 | 0.0% |
| Pakistani | 19 | 0.1% |
| Palestinian | 14 | 0.1% |
| Peruvian | 8 | 0.0% |
| Polish | 534 | 2.6% |
| Portuguese | 43 | 0.2% |
| Pueblo | 21 | 0.1% |
| Puerto Rican | 55 | 0.3% |
| Romanian | 45 | 0.2% |
| Russian | 385 | 1.9% |
| Salvadoran | 23 | 0.1% |
| Scandinavian | 187 | 0.9% |
| Scotch-Irish | 258 | 1.3% |
| Scottish | 443 | 2.2% |
| Serbian | 10 | 0.1% |
| Slavic | 24 | 0.1% |
| Slovak | 21 | 0.1% |
| Slovene | 9 | 0.0% |
| South African | 13 | 0.1% |
| South American | 43 | 0.2% |
| Spaniard | 128 | 0.6% |
| Spanish | 182 | 0.9% |
| Sri Lankan | 1 | 0.0% |
| Subsaharan African | 79 | 0.4% |
| Swedish | 377 | 1.8% |
| Swiss | 278 | 1.4% |
| Thai | 42 | 0.2% |
| Ukrainian | 28 | 0.1% |
| Welsh | 155 | 0.8% |
| Yugoslavian | 5 | 0.0% | View All 84 Rows |
Immigrants in Golden
The most numerous immigrant groups reported in Golden came from Europe (453 | 2.2%), Latin America (360 | 1.8%), Central America (309 | 1.5%), Mexico (259 | 1.3%), and Asia (244 | 1.2%), together accounting for 7.9% of all Golden residents.
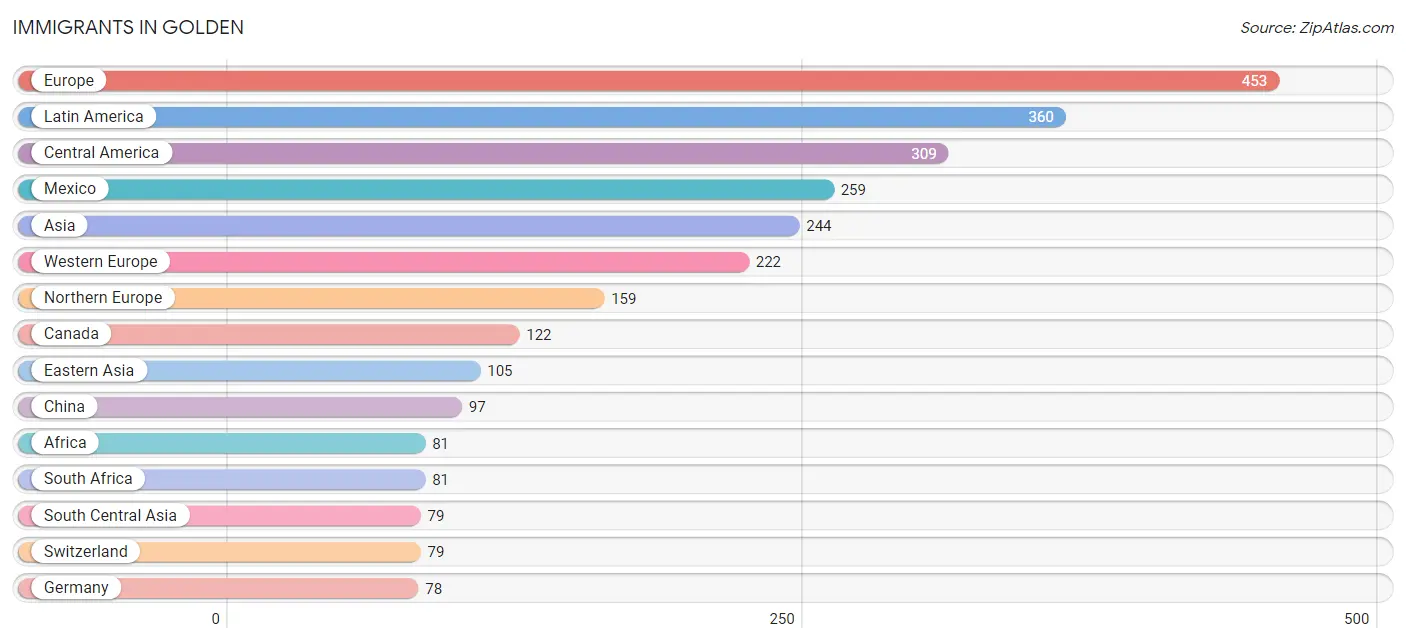
| Immigration Origin | # Population | % Population |
| Africa | 81 | 0.4% |
| Asia | 244 | 1.2% |
| Austria | 37 | 0.2% |
| Bosnia and Herzegovina | 7 | 0.0% |
| Brazil | 35 | 0.2% |
| Canada | 122 | 0.6% |
| Caribbean | 8 | 0.0% |
| Central America | 309 | 1.5% |
| Chile | 8 | 0.0% |
| China | 97 | 0.5% |
| Denmark | 15 | 0.1% |
| Eastern Asia | 105 | 0.5% |
| Eastern Europe | 43 | 0.2% |
| El Salvador | 23 | 0.1% |
| England | 26 | 0.1% |
| Europe | 453 | 2.2% |
| France | 28 | 0.1% |
| Germany | 78 | 0.4% |
| Guatemala | 6 | 0.0% |
| Haiti | 8 | 0.0% |
| Honduras | 21 | 0.1% |
| India | 21 | 0.1% |
| Indonesia | 1 | 0.0% |
| Iran | 29 | 0.1% |
| Ireland | 21 | 0.1% |
| Israel | 13 | 0.1% |
| Italy | 11 | 0.1% |
| Korea | 8 | 0.0% |
| Latin America | 360 | 1.8% |
| Lithuania | 25 | 0.1% |
| Mexico | 259 | 1.3% |
| Moldova | 11 | 0.1% |
| Nepal | 29 | 0.1% |
| Northern Europe | 159 | 0.8% |
| Norway | 25 | 0.1% |
| Philippines | 35 | 0.2% |
| Portugal | 6 | 0.0% |
| South Africa | 81 | 0.4% |
| South America | 43 | 0.2% |
| South Central Asia | 79 | 0.4% |
| South Eastern Asia | 47 | 0.2% |
| Southern Europe | 29 | 0.1% |
| Spain | 12 | 0.1% |
| Switzerland | 79 | 0.4% |
| Thailand | 11 | 0.1% |
| Western Asia | 13 | 0.1% |
| Western Europe | 222 | 1.1% | View All 47 Rows |
Sex and Age in Golden
Sex and Age in Golden
The most populous age groups in Golden are 20 to 24 Years (1,694 | 14.2%) for men and 20 to 24 Years (768 | 9.0%) for women.
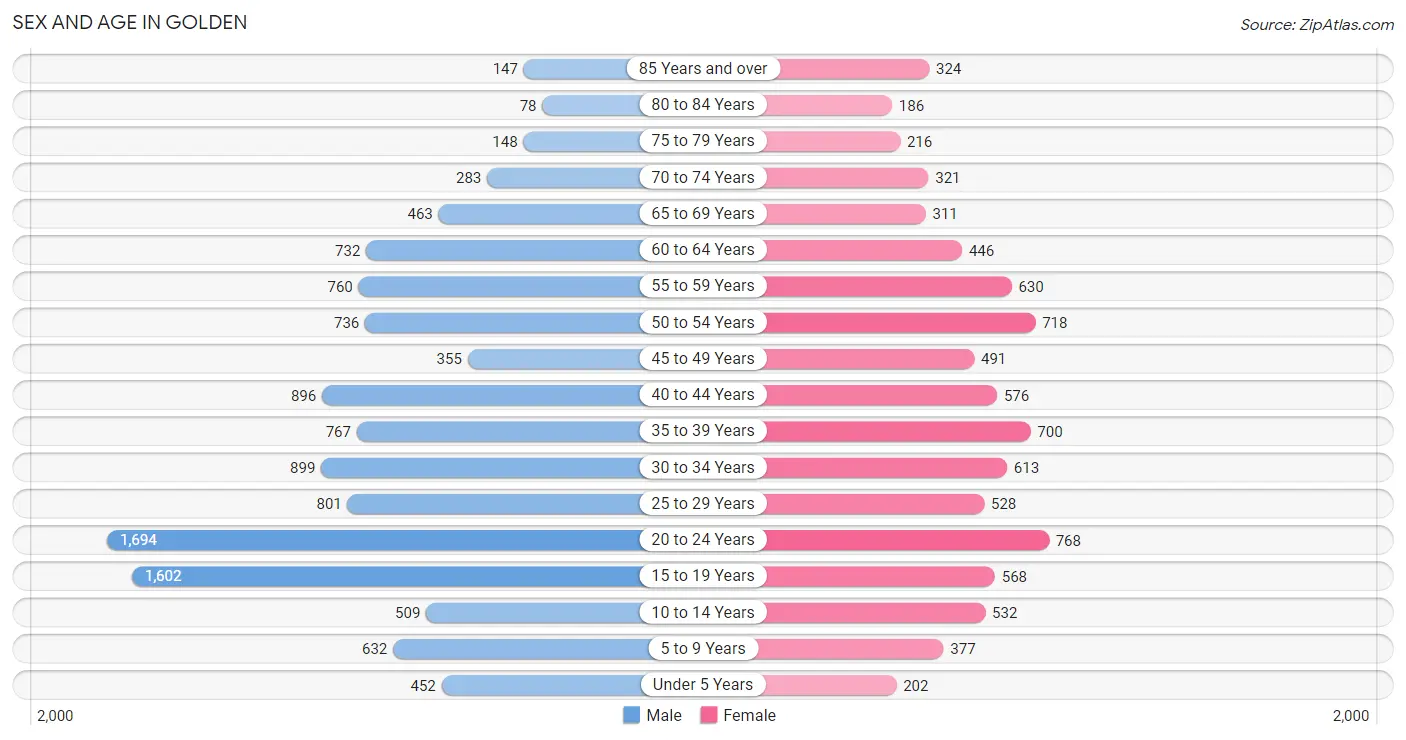
| Age Bracket | Male | Female |
| Under 5 Years | 452 (3.8%) | 202 (2.4%) |
| 5 to 9 Years | 632 (5.3%) | 377 (4.4%) |
| 10 to 14 Years | 509 (4.3%) | 532 (6.2%) |
| 15 to 19 Years | 1,602 (13.4%) | 568 (6.7%) |
| 20 to 24 Years | 1,694 (14.2%) | 768 (9.0%) |
| 25 to 29 Years | 801 (6.7%) | 528 (6.2%) |
| 30 to 34 Years | 899 (7.5%) | 613 (7.2%) |
| 35 to 39 Years | 767 (6.4%) | 700 (8.2%) |
| 40 to 44 Years | 896 (7.5%) | 576 (6.8%) |
| 45 to 49 Years | 355 (3.0%) | 491 (5.8%) |
| 50 to 54 Years | 736 (6.2%) | 718 (8.4%) |
| 55 to 59 Years | 760 (6.4%) | 630 (7.4%) |
| 60 to 64 Years | 732 (6.1%) | 446 (5.2%) |
| 65 to 69 Years | 463 (3.9%) | 311 (3.7%) |
| 70 to 74 Years | 283 (2.4%) | 321 (3.8%) |
| 75 to 79 Years | 148 (1.2%) | 216 (2.5%) |
| 80 to 84 Years | 78 (0.6%) | 186 (2.2%) |
| 85 Years and over | 147 (1.2%) | 324 (3.8%) |
| Total | 11,954 (100.0%) | 8,507 (100.0%) |
Families and Households in Golden
Median Family Size in Golden
The median family size in Golden is 2.85 persons per family, with married-couple families (3,299 | 77.2%) accounting for the largest median family size of 2.91 persons per family. On the other hand, single male/father families (284 | 6.6%) represent the smallest median family size with 2.29 persons per family.
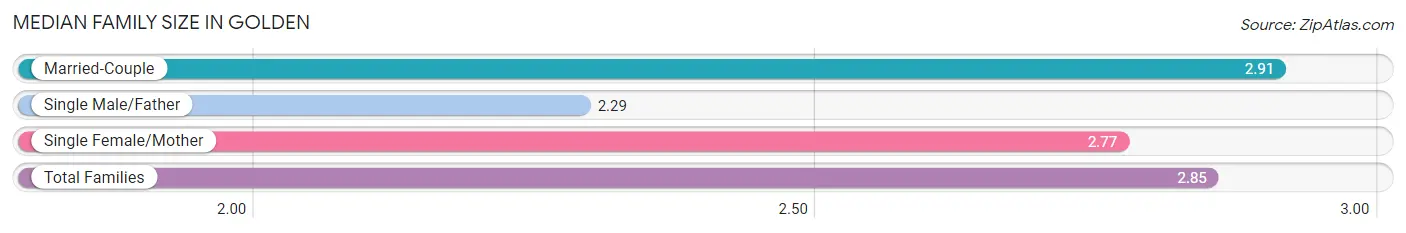
| Family Type | # Families | Family Size |
| Married-Couple | 3,299 (77.2%) | 2.91 |
| Single Male/Father | 284 (6.6%) | 2.29 |
| Single Female/Mother | 691 (16.2%) | 2.77 |
| Total Families | 4,274 (100.0%) | 2.85 |
Median Household Size in Golden
The median household size in Golden is 2.31 persons per household, with married-couple households (3,299 | 42.6%) accounting for the largest median household size of 2.96 persons per household. non-family households (3,474 | 44.8%) represent the smallest median household size with 1.58 persons per household.
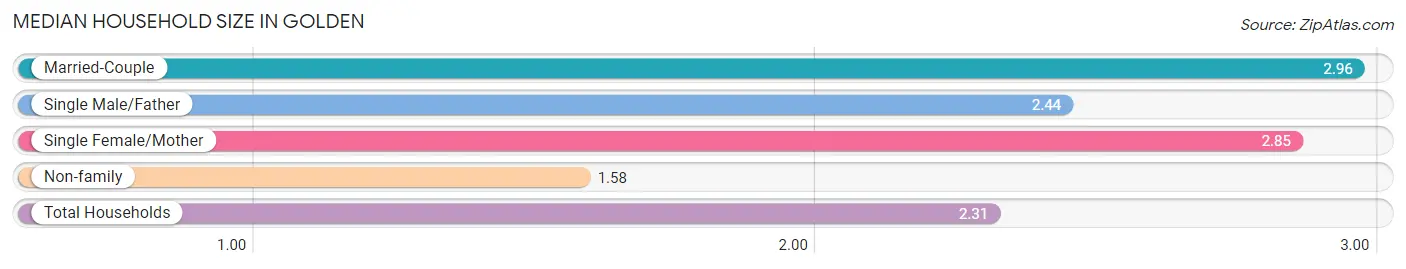
| Household Type | # Households | Household Size |
| Married-Couple | 3,299 (42.6%) | 2.96 |
| Single Male/Father | 284 (3.7%) | 2.44 |
| Single Female/Mother | 691 (8.9%) | 2.85 |
| Non-family | 3,474 (44.8%) | 1.58 |
| Total Households | 7,748 (100.0%) | 2.31 |
Household Size by Marriage Status in Golden
Out of a total of 7,748 households in Golden, 4,274 (55.2%) are family households, while 3,474 (44.8%) are nonfamily households. The most numerous type of family households are 2-person households, comprising 2,112, and the most common type of nonfamily households are 1-person households, comprising 2,469.
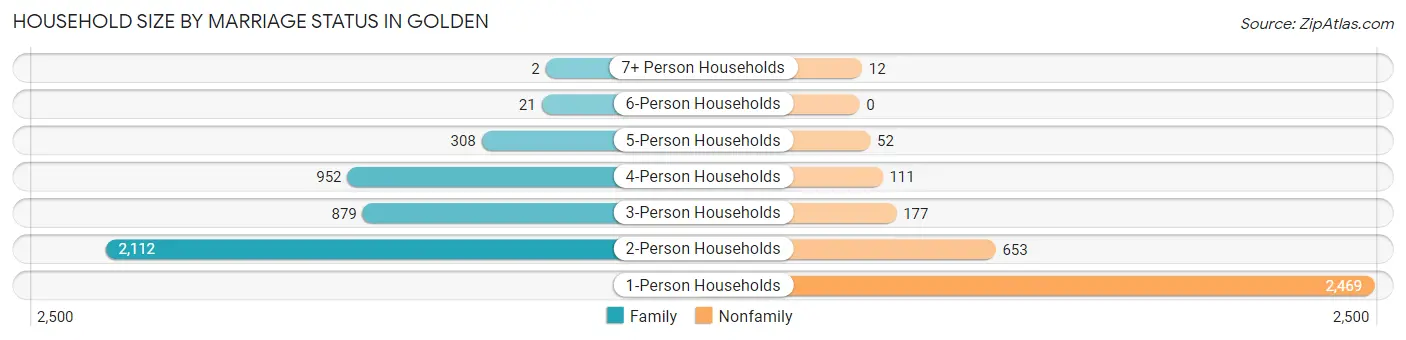
| Household Size | Family Households | Nonfamily Households |
| 1-Person Households | - | 2,469 (31.9%) |
| 2-Person Households | 2,112 (27.3%) | 653 (8.4%) |
| 3-Person Households | 879 (11.3%) | 177 (2.3%) |
| 4-Person Households | 952 (12.3%) | 111 (1.4%) |
| 5-Person Households | 308 (4.0%) | 52 (0.7%) |
| 6-Person Households | 21 (0.3%) | 0 (0.0%) |
| 7+ Person Households | 2 (0.0%) | 12 (0.2%) |
| Total | 4,274 (55.2%) | 3,474 (44.8%) |
Female Fertility in Golden
Fertility by Age in Golden
Average fertility rate in Golden is 35.0 births per 1,000 women. Women in the age bracket of 35 to 50 years have the highest fertility rate with 48.0 births per 1,000 women. Women in the age bracket of 35 to 50 years acount for 61.5% of all women with births.
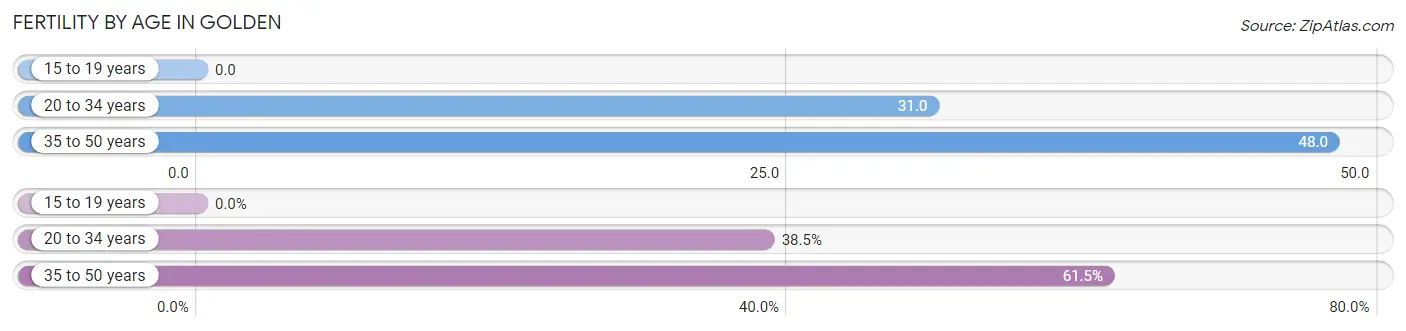
| Age Bracket | Women with Births | Births / 1,000 Women |
| 15 to 19 years | 0 (0.0%) | 0.0 |
| 20 to 34 years | 60 (38.5%) | 31.0 |
| 35 to 50 years | 96 (61.5%) | 48.0 |
| Total | 156 (100.0%) | 35.0 |
Fertility by Age by Marriage Status in Golden
94.2% of women with births (156) in Golden are married. The highest percentage of unmarried women with births falls into 20 to 34 years age bracket with 15.0% of them unmarried at the time of birth, while the lowest percentage of unmarried women with births belong to 35 to 50 years age bracket with 0.0% of them unmarried.
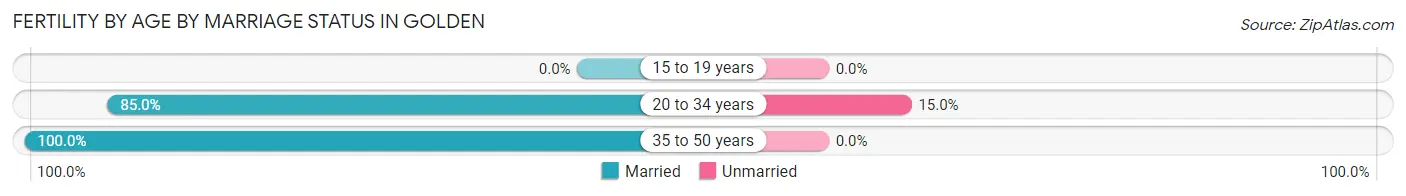
| Age Bracket | Married | Unmarried |
| 15 to 19 years | 0 (0.0%) | 0 (0.0%) |
| 20 to 34 years | 51 (85.0%) | 9 (15.0%) |
| 35 to 50 years | 96 (100.0%) | 0 (0.0%) |
| Total | 147 (94.2%) | 9 (5.8%) |
Fertility by Education in Golden
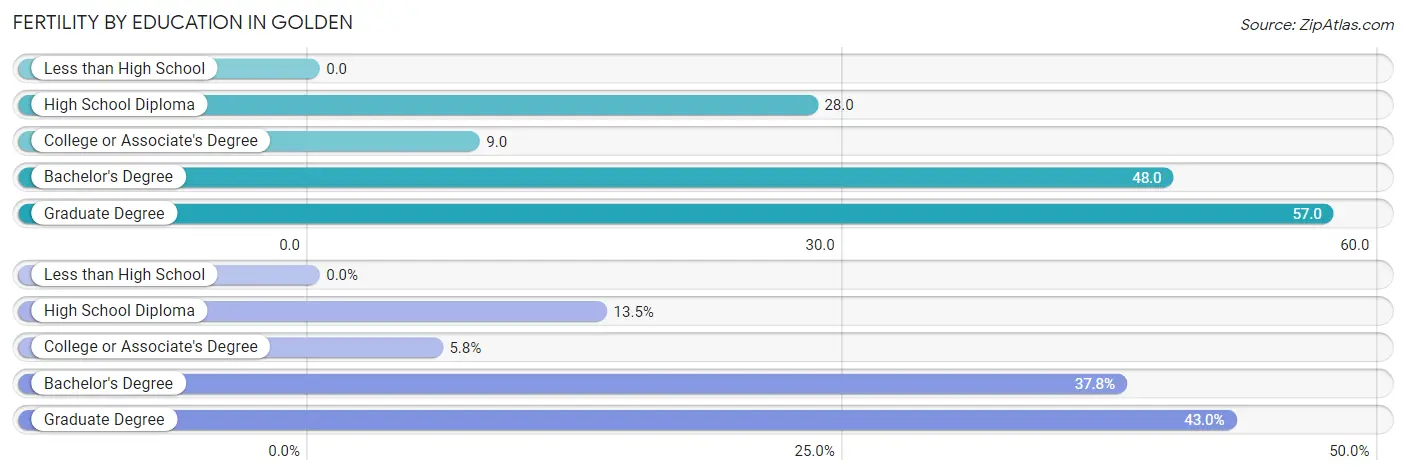
| Educational Attainment | Women with Births | Births / 1,000 Women |
| Less than High School | 0 (0.0%) | 0.0 |
| High School Diploma | 21 (13.5%) | 28.0 |
| College or Associate's Degree | 9 (5.8%) | 9.0 |
| Bachelor's Degree | 59 (37.8%) | 48.0 |
| Graduate Degree | 67 (42.9%) | 57.0 |
| Total | 156 (100.0%) | 35.0 |
Fertility by Education by Marriage Status in Golden
5.8% of women with births in Golden are unmarried. Women with the educational attainment of high school diploma are most likely to be married with 100.0% of them married at childbirth, while women with the educational attainment of college or associate's degree are least likely to be married with 100.0% of them unmarried at childbirth.
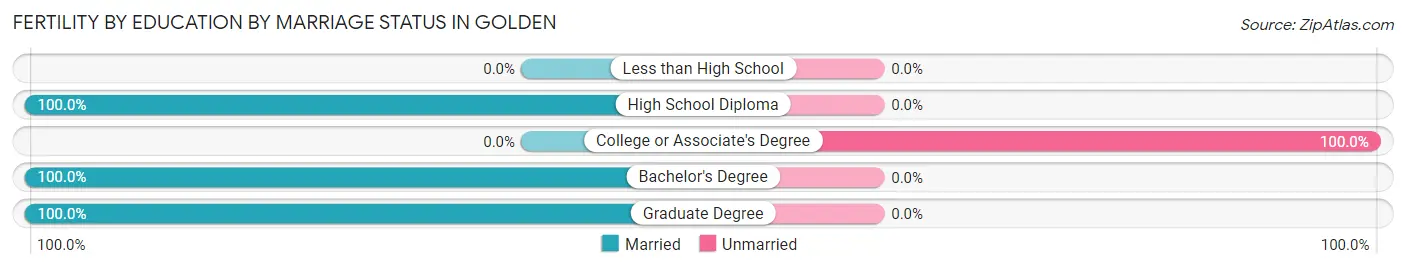
| Educational Attainment | Married | Unmarried |
| Less than High School | 0 (0.0%) | 0 (0.0%) |
| High School Diploma | 21 (100.0%) | 0 (0.0%) |
| College or Associate's Degree | 0 (0.0%) | 9 (100.0%) |
| Bachelor's Degree | 59 (100.0%) | 0 (0.0%) |
| Graduate Degree | 67 (100.0%) | 0 (0.0%) |
| Total | 147 (94.2%) | 9 (5.8%) |
Employment Characteristics in Golden
Employment by Class of Employer in Golden
Among the 10,358 employed individuals in Golden, private company employees (5,988 | 57.8%), not-for-profit organizations (1,146 | 11.1%), and state government employees (921 | 8.9%) make up the most common classes of employment.
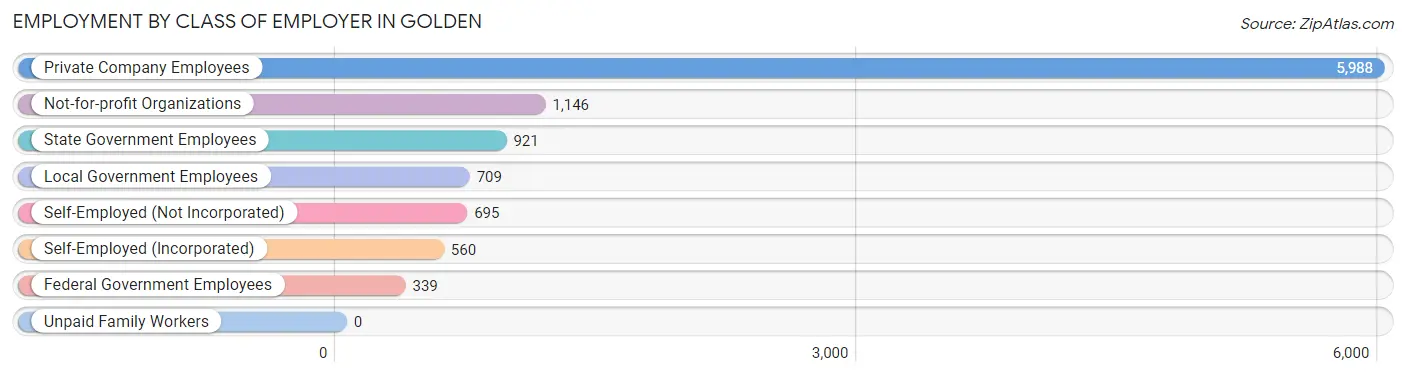
| Employer Class | # Employees | % Employees |
| Private Company Employees | 5,988 | 57.8% |
| Self-Employed (Incorporated) | 560 | 5.4% |
| Self-Employed (Not Incorporated) | 695 | 6.7% |
| Not-for-profit Organizations | 1,146 | 11.1% |
| Local Government Employees | 709 | 6.8% |
| State Government Employees | 921 | 8.9% |
| Federal Government Employees | 339 | 3.3% |
| Unpaid Family Workers | 0 | 0.0% |
| Total | 10,358 | 100.0% |
Employment Status by Age in Golden
According to the labor force statistics for Golden, out of the total population over 16 years of age (17,454), 63.8% or 11,136 individuals are in the labor force, with 4.6% or 512 of them unemployed. The age group with the highest labor force participation rate is 55 to 59 years, with 85.3% or 1,186 individuals in the labor force. Within the labor force, the 16 to 19 years age range has the highest percentage of unemployed individuals, with 8.4% or 45 of them being unemployed.
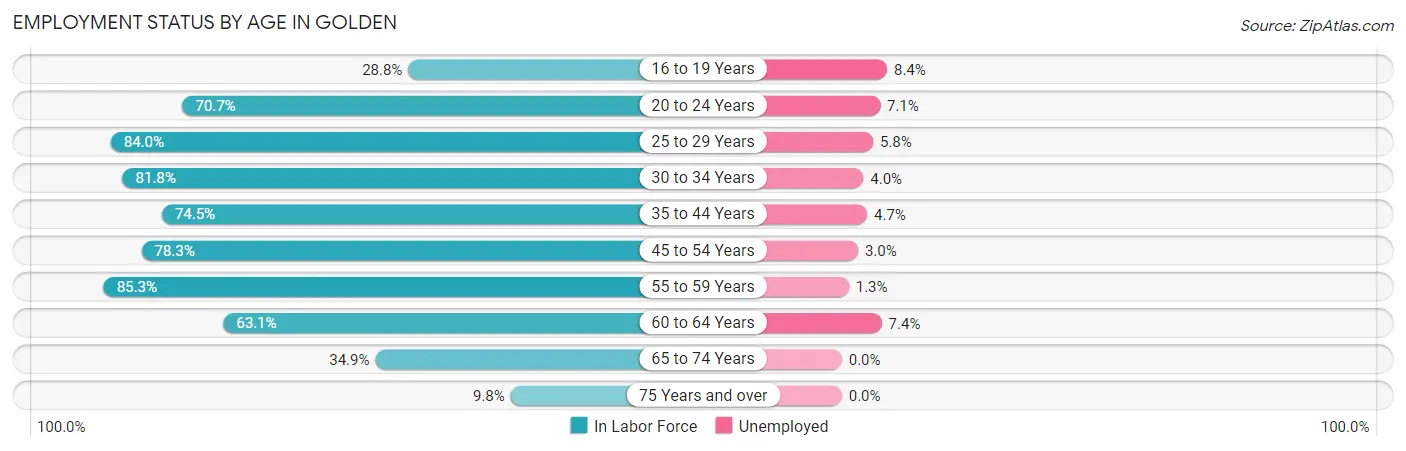
| Age Bracket | In Labor Force | Unemployed |
| 16 to 19 Years | 538 (28.8%) | 45 (8.4%) |
| 20 to 24 Years | 1,741 (70.7%) | 124 (7.1%) |
| 25 to 29 Years | 1,116 (84.0%) | 65 (5.8%) |
| 30 to 34 Years | 1,237 (81.8%) | 49 (4.0%) |
| 35 to 44 Years | 2,190 (74.5%) | 103 (4.7%) |
| 45 to 54 Years | 1,801 (78.3%) | 54 (3.0%) |
| 55 to 59 Years | 1,186 (85.3%) | 15 (1.3%) |
| 60 to 64 Years | 743 (63.1%) | 55 (7.4%) |
| 65 to 74 Years | 481 (34.9%) | 0 (0.0%) |
| 75 Years and over | 108 (9.8%) | 0 (0.0%) |
| Total | 11,136 (63.8%) | 512 (4.6%) |
Employment Status by Educational Attainment in Golden
According to labor force statistics for Golden, 77.7% of individuals (8,273) out of the total population between 25 and 64 years of age (10,648) are in the labor force, with 4.1% or 339 of them being unemployed. The group with the highest labor force participation rate are those with the educational attainment of bachelor's degree or higher, with 85.8% or 5,158 individuals in the labor force. Within the labor force, individuals with high school diploma education have the highest percentage of unemployment, with 8.8% or 128 of them being unemployed.
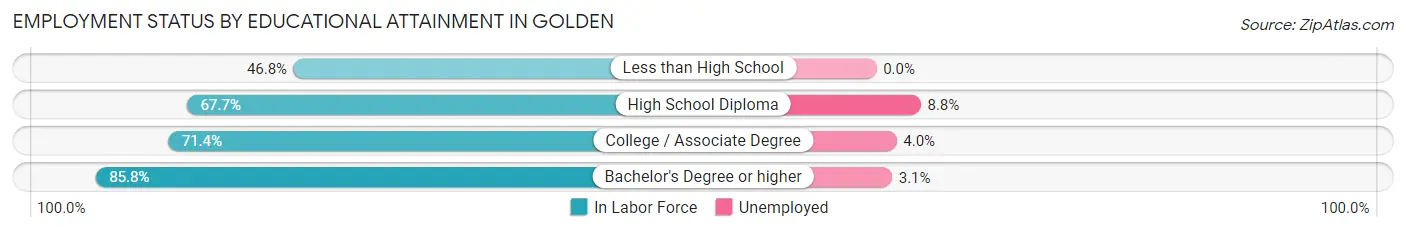
| Educational Attainment | In Labor Force | Unemployed |
| Less than High School | 223 (46.8%) | 0 (0.0%) |
| High School Diploma | 1,449 (67.7%) | 188 (8.8%) |
| College / Associate Degree | 1,442 (71.4%) | 81 (4.0%) |
| Bachelor's Degree or higher | 5,158 (85.8%) | 186 (3.1%) |
| Total | 8,273 (77.7%) | 437 (4.1%) |
Employment Occupations by Sex in Golden
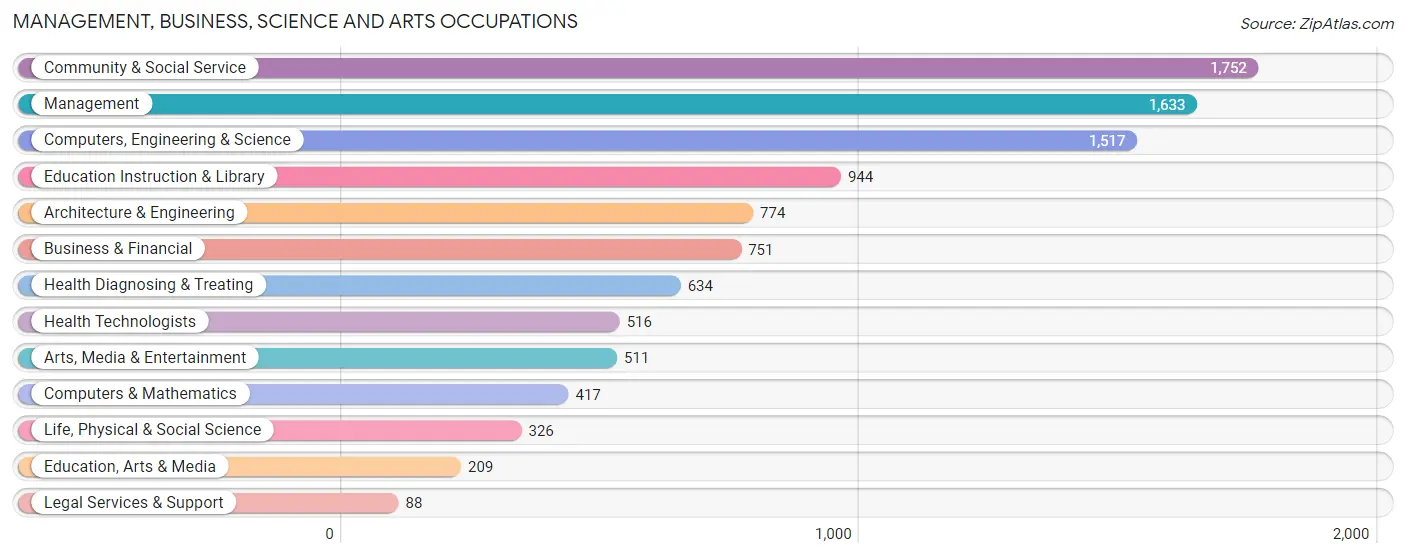
Management, Business, Science and Arts Occupations
The most common Management, Business, Science and Arts occupations in Golden are Community & Social Service (1,752 | 16.5%), Management (1,633 | 15.4%), Computers, Engineering & Science (1,517 | 14.3%), Education Instruction & Library (944 | 8.9%), and Architecture & Engineering (774 | 7.3%).
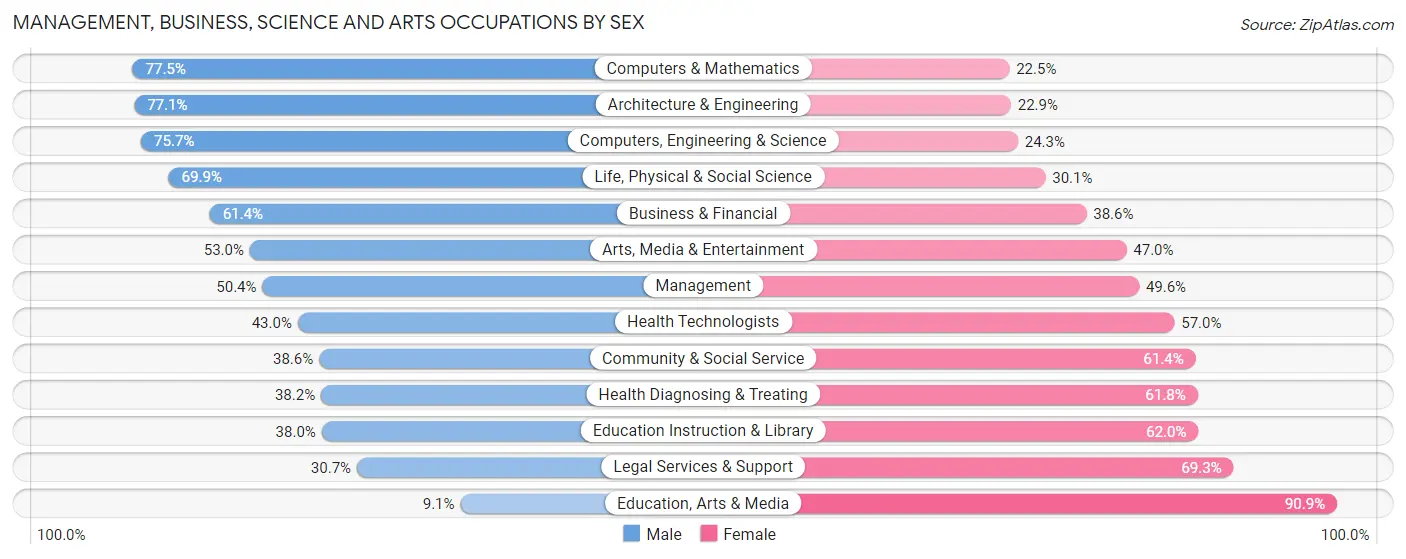
Management, Business, Science and Arts Occupations by Sex
Within the Management, Business, Science and Arts occupations in Golden, the most male-oriented occupations are Computers & Mathematics (77.5%), Architecture & Engineering (77.1%), and Computers, Engineering & Science (75.7%), while the most female-oriented occupations are Education, Arts & Media (90.9%), Legal Services & Support (69.3%), and Education Instruction & Library (62.0%).
| Occupation | Male | Female |
| Management | 823 (50.4%) | 810 (49.6%) |
| Business & Financial | 461 (61.4%) | 290 (38.6%) |
| Computers, Engineering & Science | 1,148 (75.7%) | 369 (24.3%) |
| Computers & Mathematics | 323 (77.5%) | 94 (22.5%) |
| Architecture & Engineering | 597 (77.1%) | 177 (22.9%) |
| Life, Physical & Social Science | 228 (69.9%) | 98 (30.1%) |
| Community & Social Service | 676 (38.6%) | 1,076 (61.4%) |
| Education, Arts & Media | 19 (9.1%) | 190 (90.9%) |
| Legal Services & Support | 27 (30.7%) | 61 (69.3%) |
| Education Instruction & Library | 359 (38.0%) | 585 (62.0%) |
| Arts, Media & Entertainment | 271 (53.0%) | 240 (47.0%) |
| Health Diagnosing & Treating | 242 (38.2%) | 392 (61.8%) |
| Health Technologists | 222 (43.0%) | 294 (57.0%) |
| Total (Category) | 3,350 (53.3%) | 2,937 (46.7%) |
| Total (Overall) | 6,280 (59.1%) | 4,350 (40.9%) |
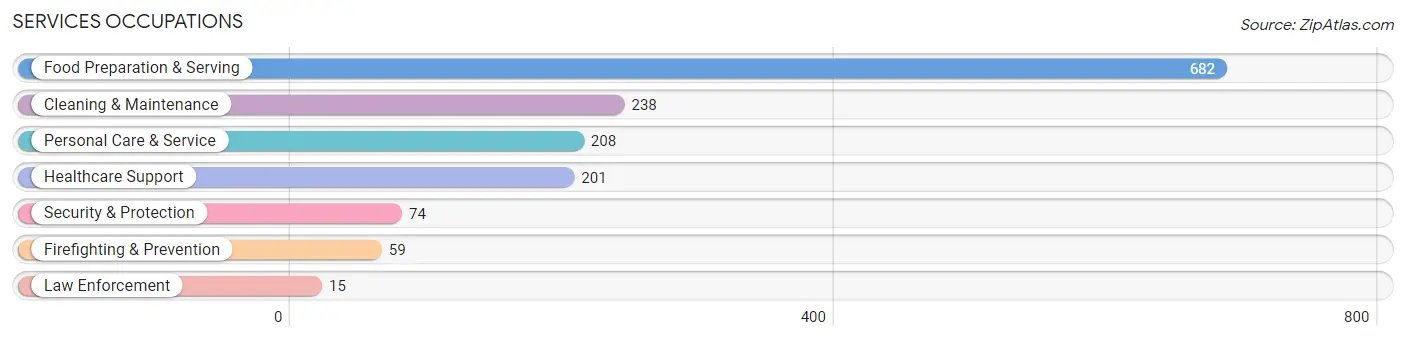
Services Occupations
The most common Services occupations in Golden are Food Preparation & Serving (682 | 6.4%), Cleaning & Maintenance (238 | 2.2%), Personal Care & Service (208 | 2.0%), Healthcare Support (201 | 1.9%), and Security & Protection (74 | 0.7%).
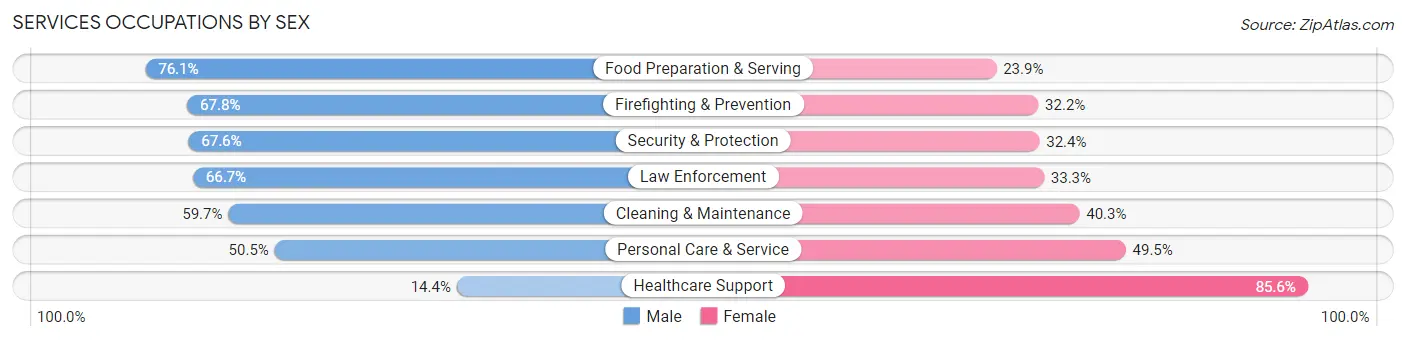
Services Occupations by Sex
Within the Services occupations in Golden, the most male-oriented occupations are Food Preparation & Serving (76.1%), Firefighting & Prevention (67.8%), and Security & Protection (67.6%), while the most female-oriented occupations are Healthcare Support (85.6%), Personal Care & Service (49.5%), and Cleaning & Maintenance (40.3%).
| Occupation | Male | Female |
| Healthcare Support | 29 (14.4%) | 172 (85.6%) |
| Security & Protection | 50 (67.6%) | 24 (32.4%) |
| Firefighting & Prevention | 40 (67.8%) | 19 (32.2%) |
| Law Enforcement | 10 (66.7%) | 5 (33.3%) |
| Food Preparation & Serving | 519 (76.1%) | 163 (23.9%) |
| Cleaning & Maintenance | 142 (59.7%) | 96 (40.3%) |
| Personal Care & Service | 105 (50.5%) | 103 (49.5%) |
| Total (Category) | 845 (60.2%) | 558 (39.8%) |
| Total (Overall) | 6,280 (59.1%) | 4,350 (40.9%) |
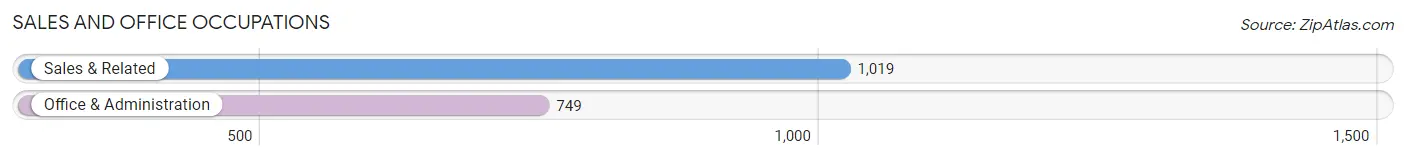
Sales and Office Occupations
The most common Sales and Office occupations in Golden are Sales & Related (1,019 | 9.6%), and Office & Administration (749 | 7.0%).
Sales and Office Occupations by Sex
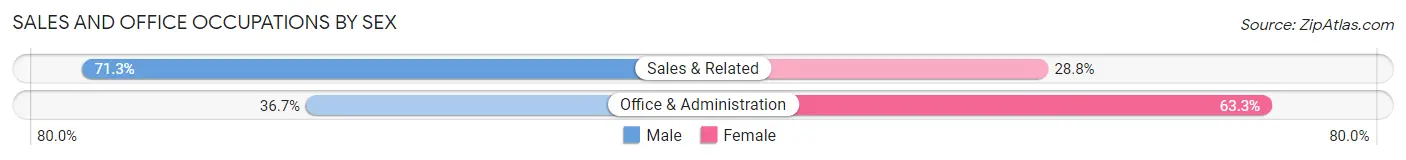
| Occupation | Male | Female |
| Sales & Related | 726 (71.3%) | 293 (28.7%) |
| Office & Administration | 275 (36.7%) | 474 (63.3%) |
| Total (Category) | 1,001 (56.6%) | 767 (43.4%) |
| Total (Overall) | 6,280 (59.1%) | 4,350 (40.9%) |
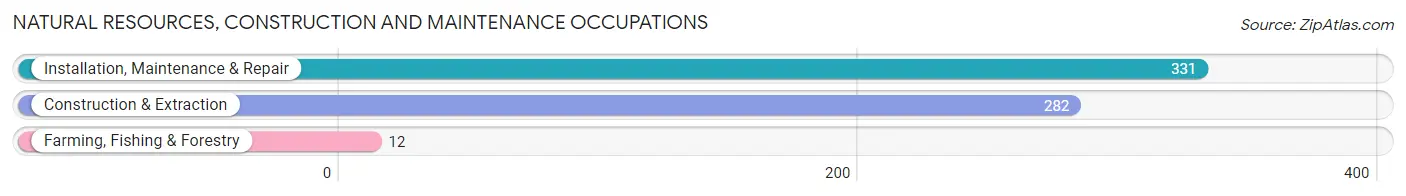
Natural Resources, Construction and Maintenance Occupations
The most common Natural Resources, Construction and Maintenance occupations in Golden are Installation, Maintenance & Repair (331 | 3.1%), Construction & Extraction (282 | 2.6%), and Farming, Fishing & Forestry (12 | 0.1%).
Natural Resources, Construction and Maintenance Occupations by Sex
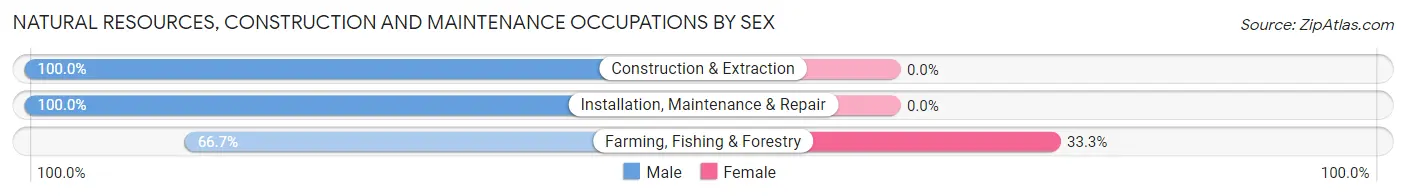
| Occupation | Male | Female |
| Farming, Fishing & Forestry | 8 (66.7%) | 4 (33.3%) |
| Construction & Extraction | 282 (100.0%) | 0 (0.0%) |
| Installation, Maintenance & Repair | 331 (100.0%) | 0 (0.0%) |
| Total (Category) | 621 (99.4%) | 4 (0.6%) |
| Total (Overall) | 6,280 (59.1%) | 4,350 (40.9%) |
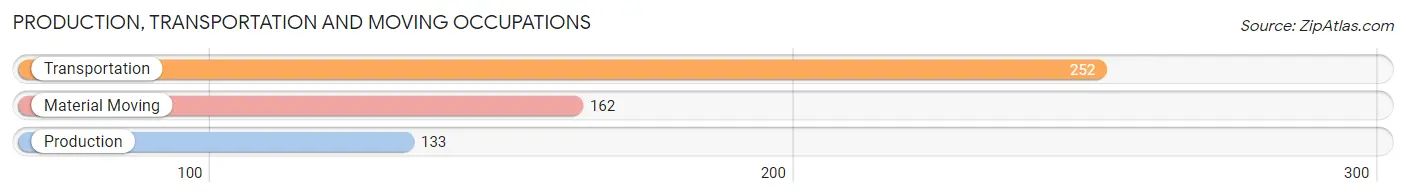
Production, Transportation and Moving Occupations
The most common Production, Transportation and Moving occupations in Golden are Transportation (252 | 2.4%), Material Moving (162 | 1.5%), and Production (133 | 1.3%).
Production, Transportation and Moving Occupations by Sex
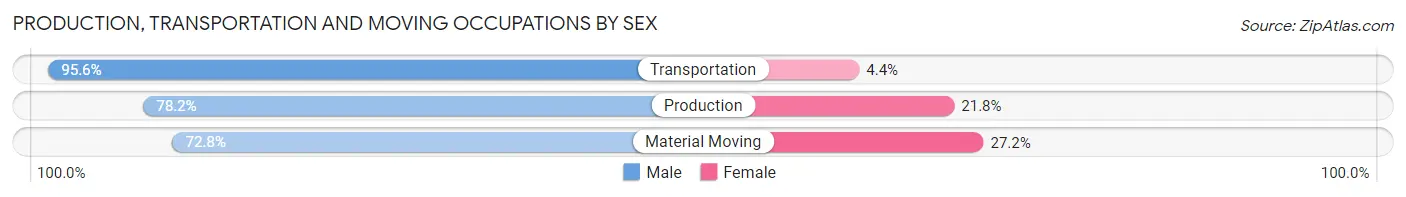
| Occupation | Male | Female |
| Production | 104 (78.2%) | 29 (21.8%) |
| Transportation | 241 (95.6%) | 11 (4.4%) |
| Material Moving | 118 (72.8%) | 44 (27.2%) |
| Total (Category) | 463 (84.6%) | 84 (15.4%) |
| Total (Overall) | 6,280 (59.1%) | 4,350 (40.9%) |
Employment Industries by Sex in Golden
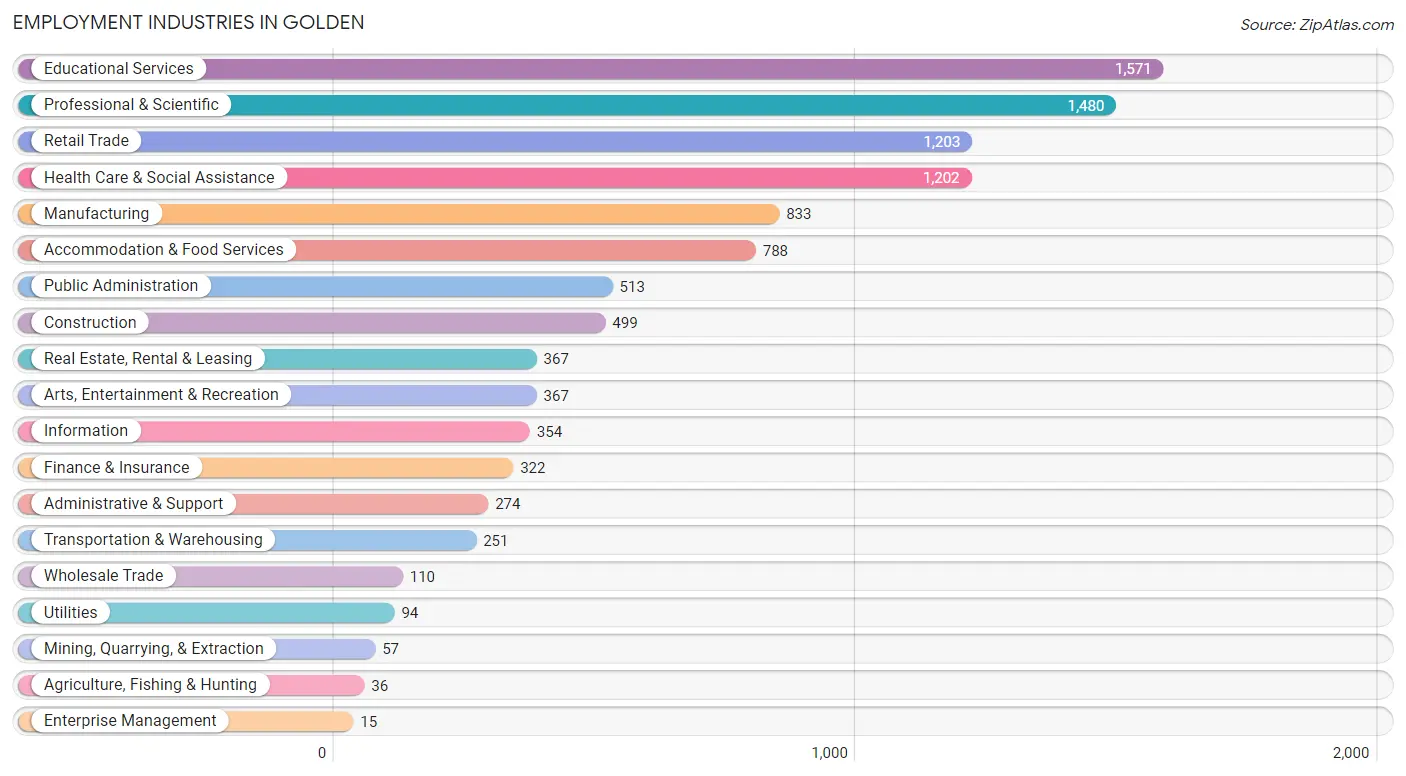
Employment Industries in Golden
The major employment industries in Golden include Educational Services (1,571 | 14.8%), Professional & Scientific (1,480 | 13.9%), Retail Trade (1,203 | 11.3%), Health Care & Social Assistance (1,202 | 11.3%), and Manufacturing (833 | 7.8%).
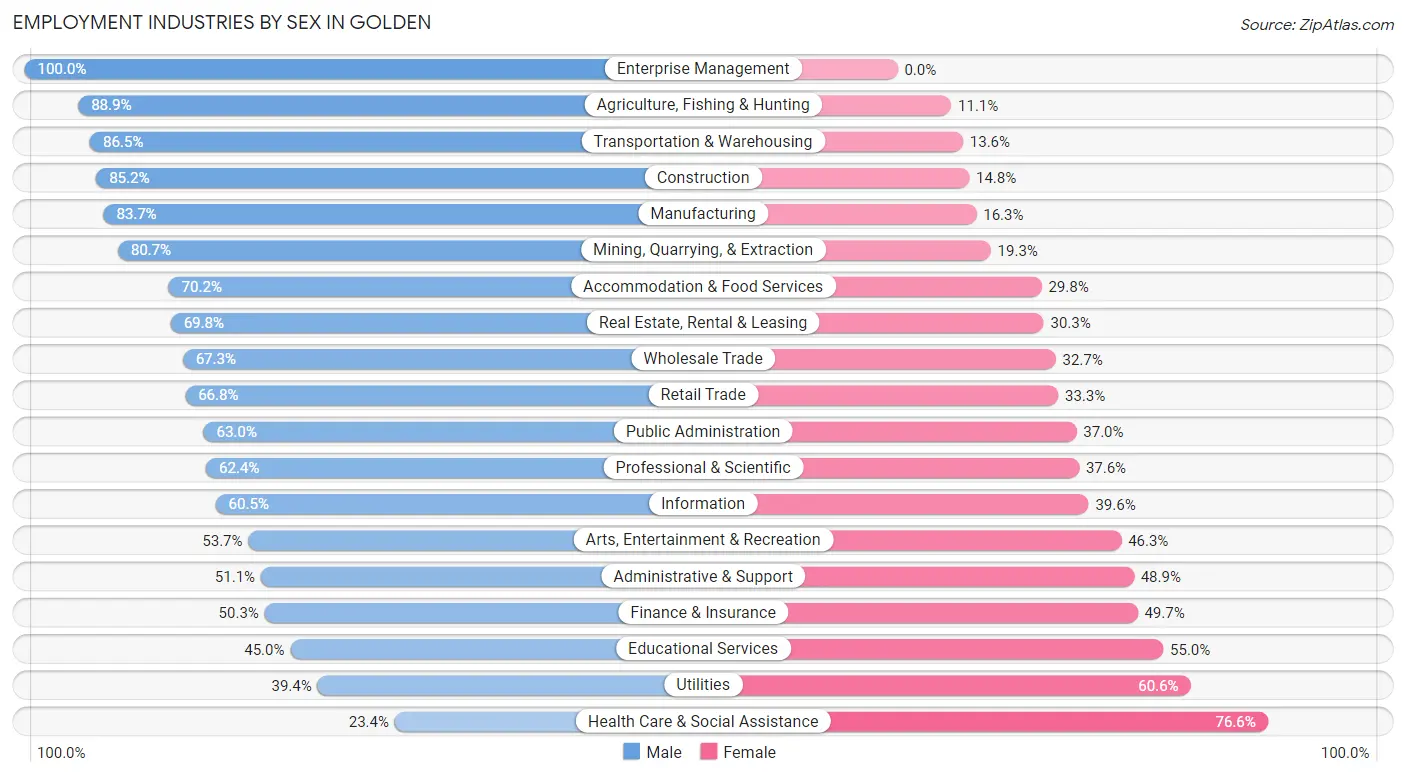
Employment Industries by Sex in Golden
The Golden industries that see more men than women are Enterprise Management (100.0%), Agriculture, Fishing & Hunting (88.9%), and Transportation & Warehousing (86.5%), whereas the industries that tend to have a higher number of women are Health Care & Social Assistance (76.6%), Utilities (60.6%), and Educational Services (55.0%).
| Industry | Male | Female |
| Agriculture, Fishing & Hunting | 32 (88.9%) | 4 (11.1%) |
| Mining, Quarrying, & Extraction | 46 (80.7%) | 11 (19.3%) |
| Construction | 425 (85.2%) | 74 (14.8%) |
| Manufacturing | 697 (83.7%) | 136 (16.3%) |
| Wholesale Trade | 74 (67.3%) | 36 (32.7%) |
| Retail Trade | 803 (66.7%) | 400 (33.3%) |
| Transportation & Warehousing | 217 (86.5%) | 34 (13.6%) |
| Utilities | 37 (39.4%) | 57 (60.6%) |
| Information | 214 (60.5%) | 140 (39.6%) |
| Finance & Insurance | 162 (50.3%) | 160 (49.7%) |
| Real Estate, Rental & Leasing | 256 (69.8%) | 111 (30.2%) |
| Professional & Scientific | 924 (62.4%) | 556 (37.6%) |
| Enterprise Management | 15 (100.0%) | 0 (0.0%) |
| Administrative & Support | 140 (51.1%) | 134 (48.9%) |
| Educational Services | 707 (45.0%) | 864 (55.0%) |
| Health Care & Social Assistance | 281 (23.4%) | 921 (76.6%) |
| Arts, Entertainment & Recreation | 197 (53.7%) | 170 (46.3%) |
| Accommodation & Food Services | 553 (70.2%) | 235 (29.8%) |
| Public Administration | 323 (63.0%) | 190 (37.0%) |
| Total | 6,280 (59.1%) | 4,350 (40.9%) |
Education in Golden
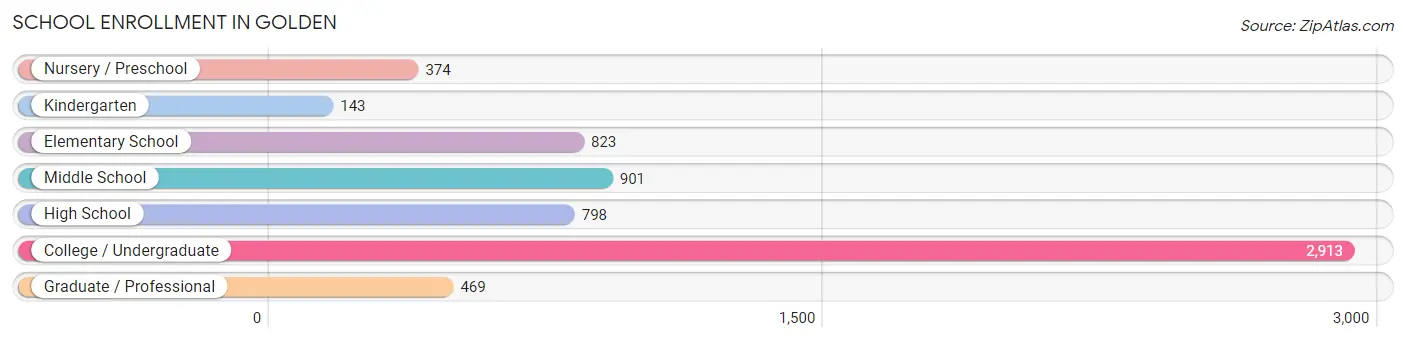
School Enrollment in Golden
The most common levels of schooling among the 6,421 students in Golden are college / undergraduate (2,913 | 45.4%), middle school (901 | 14.0%), and elementary school (823 | 12.8%).
| School Level | # Students | % Students |
| Nursery / Preschool | 374 | 5.8% |
| Kindergarten | 143 | 2.2% |
| Elementary School | 823 | 12.8% |
| Middle School | 901 | 14.0% |
| High School | 798 | 12.4% |
| College / Undergraduate | 2,913 | 45.4% |
| Graduate / Professional | 469 | 7.3% |
| Total | 6,421 | 100.0% |
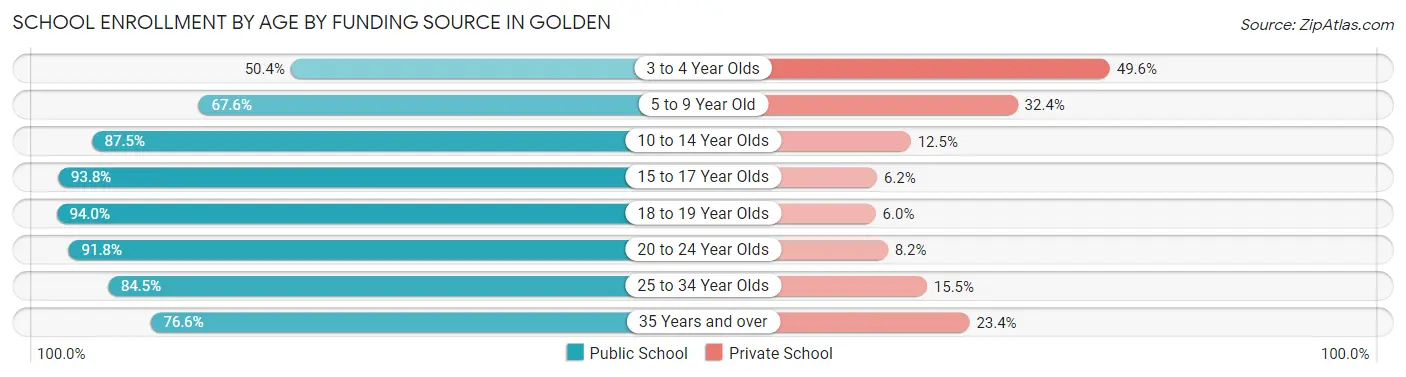
School Enrollment by Age by Funding Source in Golden
Out of a total of 6,421 students who are enrolled in schools in Golden, 931 (14.5%) attend a private institution, while the remaining 5,490 (85.5%) are enrolled in public schools. The age group of 3 to 4 year olds has the highest likelihood of being enrolled in private schools, with 114 (49.6% in the age bracket) enrolled. Conversely, the age group of 18 to 19 year olds has the lowest likelihood of being enrolled in a private school, with 1,215 (94.0% in the age bracket) attending a public institution.
| Age Bracket | Public School | Private School |
| 3 to 4 Year Olds | 116 (50.4%) | 114 (49.6%) |
| 5 to 9 Year Old | 682 (67.6%) | 327 (32.4%) |
| 10 to 14 Year Olds | 911 (87.5%) | 130 (12.5%) |
| 15 to 17 Year Olds | 619 (93.8%) | 41 (6.2%) |
| 18 to 19 Year Olds | 1,215 (94.0%) | 77 (6.0%) |
| 20 to 24 Year Olds | 1,488 (91.8%) | 133 (8.2%) |
| 25 to 34 Year Olds | 278 (84.5%) | 51 (15.5%) |
| 35 Years and over | 183 (76.6%) | 56 (23.4%) |
| Total | 5,490 (85.5%) | 931 (14.5%) |
Educational Attainment by Field of Study in Golden
Business (1,126 | 14.3%), engineering (1,061 | 13.5%), bio, nature & agricultural (896 | 11.4%), education (765 | 9.7%), and science & technology (632 | 8.0%) are the most common fields of study among 7,880 individuals in Golden who have obtained a bachelor's degree or higher.
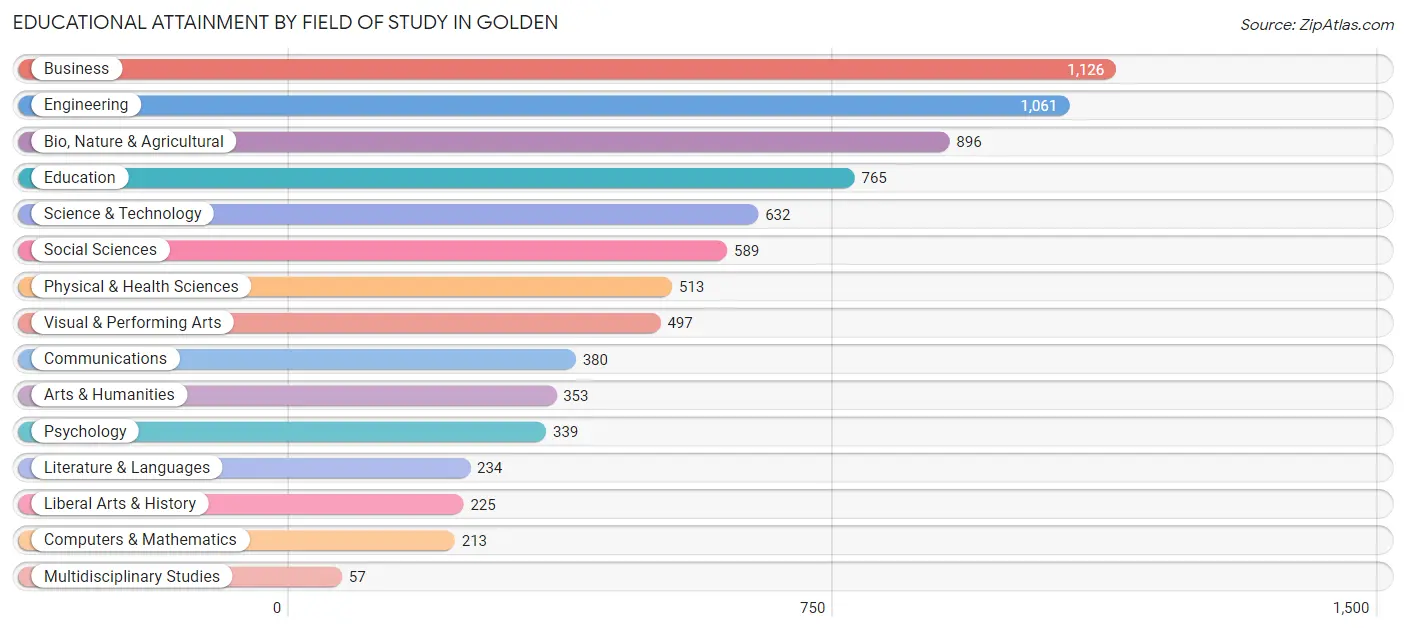
| Field of Study | # Graduates | % Graduates |
| Computers & Mathematics | 213 | 2.7% |
| Bio, Nature & Agricultural | 896 | 11.4% |
| Physical & Health Sciences | 513 | 6.5% |
| Psychology | 339 | 4.3% |
| Social Sciences | 589 | 7.5% |
| Engineering | 1,061 | 13.5% |
| Multidisciplinary Studies | 57 | 0.7% |
| Science & Technology | 632 | 8.0% |
| Business | 1,126 | 14.3% |
| Education | 765 | 9.7% |
| Literature & Languages | 234 | 3.0% |
| Liberal Arts & History | 225 | 2.9% |
| Visual & Performing Arts | 497 | 6.3% |
| Communications | 380 | 4.8% |
| Arts & Humanities | 353 | 4.5% |
| Total | 7,880 | 100.0% |
Transportation & Commute in Golden
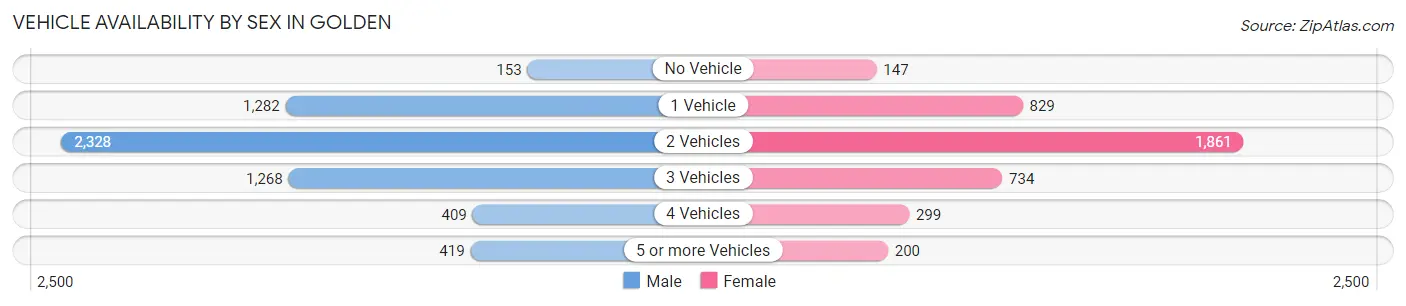
Vehicle Availability by Sex in Golden
The most prevalent vehicle ownership categories in Golden are males with 2 vehicles (2,328, accounting for 39.7%) and females with 2 vehicles (1,861, making up 57.2%).
| Vehicles Available | Male | Female |
| No Vehicle | 153 (2.6%) | 147 (3.6%) |
| 1 Vehicle | 1,282 (21.9%) | 829 (20.4%) |
| 2 Vehicles | 2,328 (39.7%) | 1,861 (45.7%) |
| 3 Vehicles | 1,268 (21.6%) | 734 (18.0%) |
| 4 Vehicles | 409 (7.0%) | 299 (7.3%) |
| 5 or more Vehicles | 419 (7.1%) | 200 (4.9%) |
| Total | 5,859 (100.0%) | 4,070 (100.0%) |
Commute Time in Golden
The most frequently occuring commute durations in Golden are 15 to 19 minutes (1,265 commuters, 16.6%), 5 to 9 minutes (1,133 commuters, 14.9%), and 30 to 34 minutes (1,131 commuters, 14.9%).
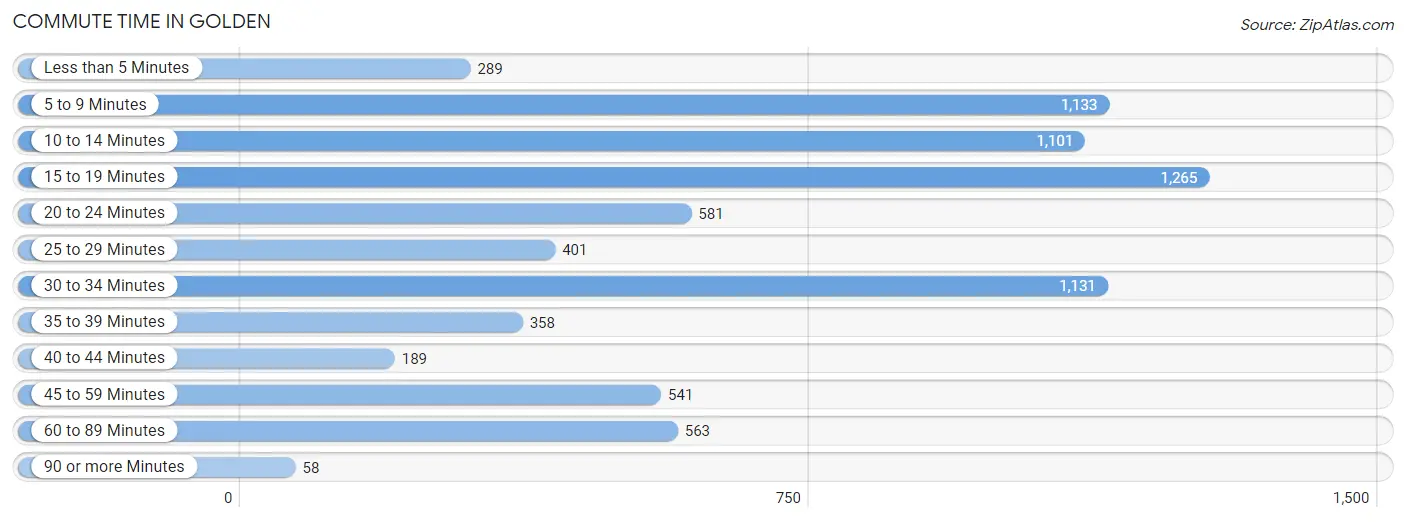
| Commute Time | # Commuters | % Commuters |
| Less than 5 Minutes | 289 | 3.8% |
| 5 to 9 Minutes | 1,133 | 14.9% |
| 10 to 14 Minutes | 1,101 | 14.5% |
| 15 to 19 Minutes | 1,265 | 16.6% |
| 20 to 24 Minutes | 581 | 7.6% |
| 25 to 29 Minutes | 401 | 5.3% |
| 30 to 34 Minutes | 1,131 | 14.9% |
| 35 to 39 Minutes | 358 | 4.7% |
| 40 to 44 Minutes | 189 | 2.5% |
| 45 to 59 Minutes | 541 | 7.1% |
| 60 to 89 Minutes | 563 | 7.4% |
| 90 or more Minutes | 58 | 0.8% |
Commute Time by Sex in Golden
The most common commute times in Golden are 30 to 34 minutes (802 commuters, 16.8%) for males and 15 to 19 minutes (523 commuters, 18.4%) for females.
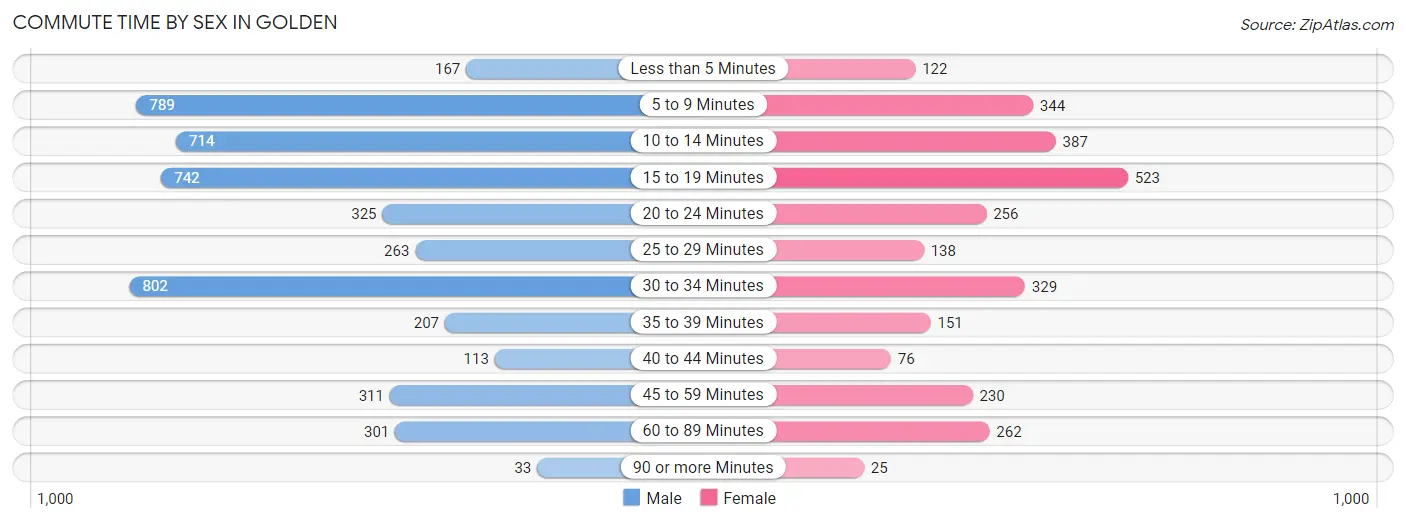
| Commute Time | Male | Female |
| Less than 5 Minutes | 167 (3.5%) | 122 (4.3%) |
| 5 to 9 Minutes | 789 (16.6%) | 344 (12.1%) |
| 10 to 14 Minutes | 714 (15.0%) | 387 (13.6%) |
| 15 to 19 Minutes | 742 (15.6%) | 523 (18.4%) |
| 20 to 24 Minutes | 325 (6.8%) | 256 (9.0%) |
| 25 to 29 Minutes | 263 (5.5%) | 138 (4.9%) |
| 30 to 34 Minutes | 802 (16.8%) | 329 (11.6%) |
| 35 to 39 Minutes | 207 (4.3%) | 151 (5.3%) |
| 40 to 44 Minutes | 113 (2.4%) | 76 (2.7%) |
| 45 to 59 Minutes | 311 (6.5%) | 230 (8.1%) |
| 60 to 89 Minutes | 301 (6.3%) | 262 (9.2%) |
| 90 or more Minutes | 33 (0.7%) | 25 (0.9%) |
Time of Departure to Work by Sex in Golden
The most frequent times of departure to work in Golden are 8:00 AM to 8:29 AM (908, 19.1%) for males and 8:00 AM to 8:29 AM (537, 18.9%) for females.
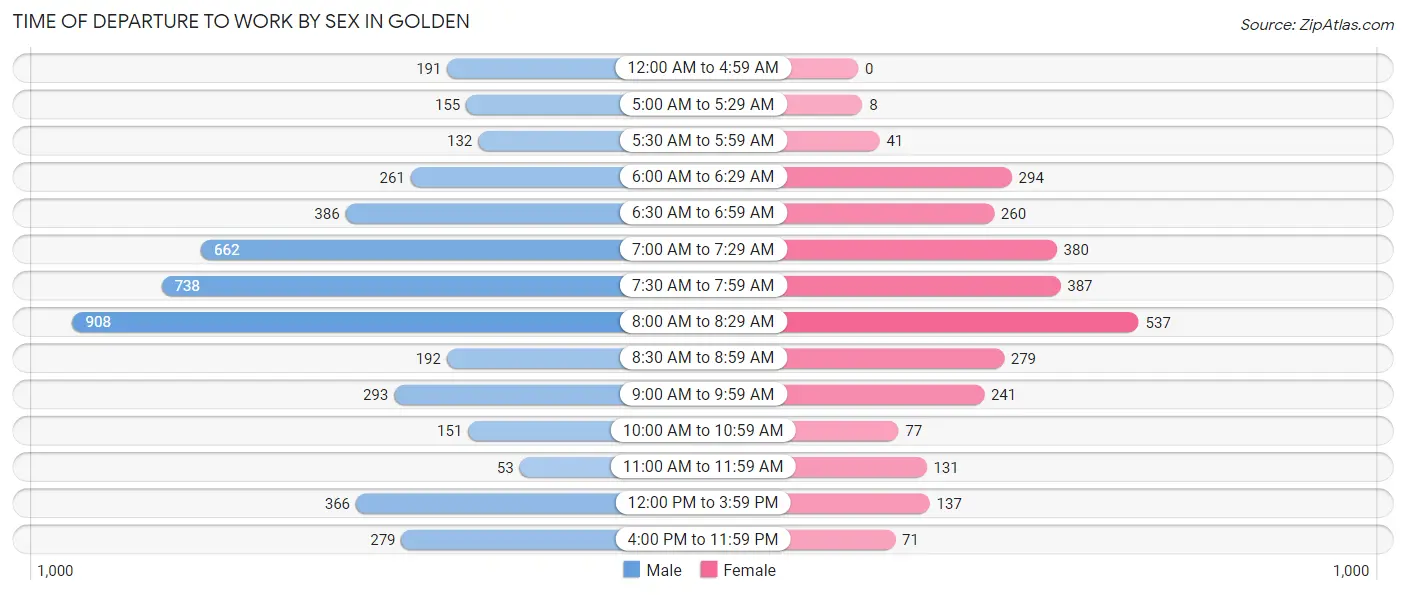
| Time of Departure | Male | Female |
| 12:00 AM to 4:59 AM | 191 (4.0%) | 0 (0.0%) |
| 5:00 AM to 5:29 AM | 155 (3.3%) | 8 (0.3%) |
| 5:30 AM to 5:59 AM | 132 (2.8%) | 41 (1.4%) |
| 6:00 AM to 6:29 AM | 261 (5.5%) | 294 (10.3%) |
| 6:30 AM to 6:59 AM | 386 (8.1%) | 260 (9.1%) |
| 7:00 AM to 7:29 AM | 662 (13.9%) | 380 (13.4%) |
| 7:30 AM to 7:59 AM | 738 (15.5%) | 387 (13.6%) |
| 8:00 AM to 8:29 AM | 908 (19.1%) | 537 (18.9%) |
| 8:30 AM to 8:59 AM | 192 (4.0%) | 279 (9.8%) |
| 9:00 AM to 9:59 AM | 293 (6.1%) | 241 (8.5%) |
| 10:00 AM to 10:59 AM | 151 (3.2%) | 77 (2.7%) |
| 11:00 AM to 11:59 AM | 53 (1.1%) | 131 (4.6%) |
| 12:00 PM to 3:59 PM | 366 (7.7%) | 137 (4.8%) |
| 4:00 PM to 11:59 PM | 279 (5.9%) | 71 (2.5%) |
| Total | 4,767 (100.0%) | 2,843 (100.0%) |
Housing Occupancy in Golden
Occupancy by Ownership in Golden
Of the total 7,748 dwellings in Golden, owner-occupied units account for 4,502 (58.1%), while renter-occupied units make up 3,246 (41.9%).
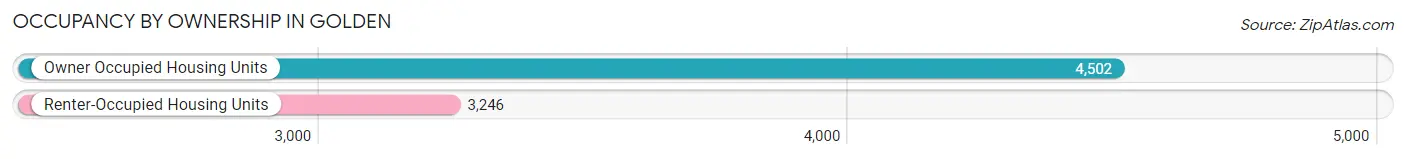
| Occupancy | # Housing Units | % Housing Units |
| Owner Occupied Housing Units | 4,502 | 58.1% |
| Renter-Occupied Housing Units | 3,246 | 41.9% |
| Total Occupied Housing Units | 7,748 | 100.0% |
Occupancy by Household Size in Golden
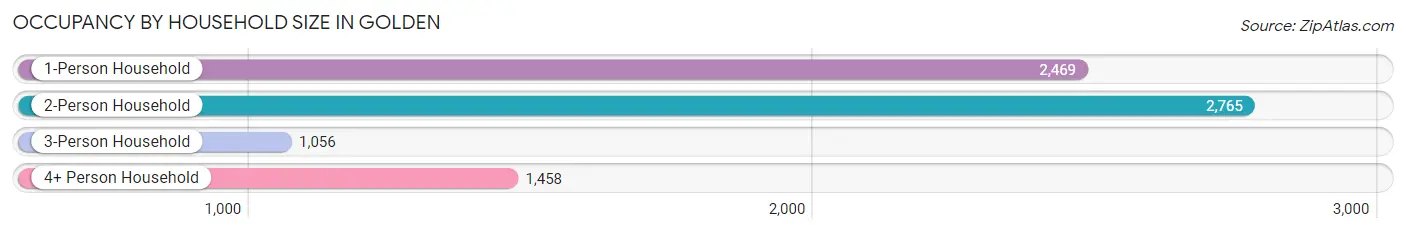
| Household Size | # Housing Units | % Housing Units |
| 1-Person Household | 2,469 | 31.9% |
| 2-Person Household | 2,765 | 35.7% |
| 3-Person Household | 1,056 | 13.6% |
| 4+ Person Household | 1,458 | 18.8% |
| Total Housing Units | 7,748 | 100.0% |
Occupancy by Ownership by Household Size in Golden
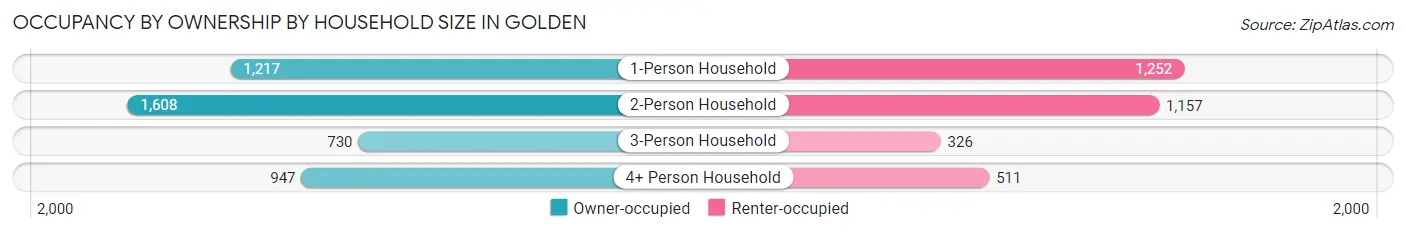
| Household Size | Owner-occupied | Renter-occupied |
| 1-Person Household | 1,217 (49.3%) | 1,252 (50.7%) |
| 2-Person Household | 1,608 (58.2%) | 1,157 (41.8%) |
| 3-Person Household | 730 (69.1%) | 326 (30.9%) |
| 4+ Person Household | 947 (64.9%) | 511 (35.0%) |
| Total Housing Units | 4,502 (58.1%) | 3,246 (41.9%) |
Occupancy by Educational Attainment in Golden
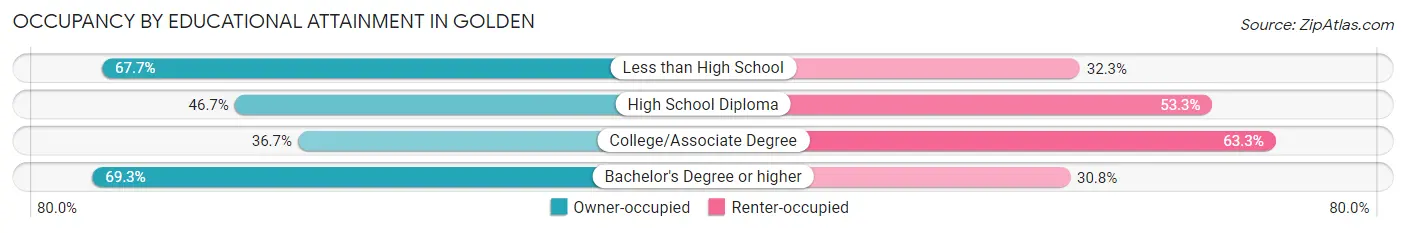
| Household Size | Owner-occupied | Renter-occupied |
| Less than High School | 132 (67.7%) | 63 (32.3%) |
| High School Diploma | 670 (46.7%) | 765 (53.3%) |
| College/Associate Degree | 604 (36.7%) | 1,043 (63.3%) |
| Bachelor's Degree or higher | 3,096 (69.3%) | 1,375 (30.7%) |
Occupancy by Age of Householder in Golden
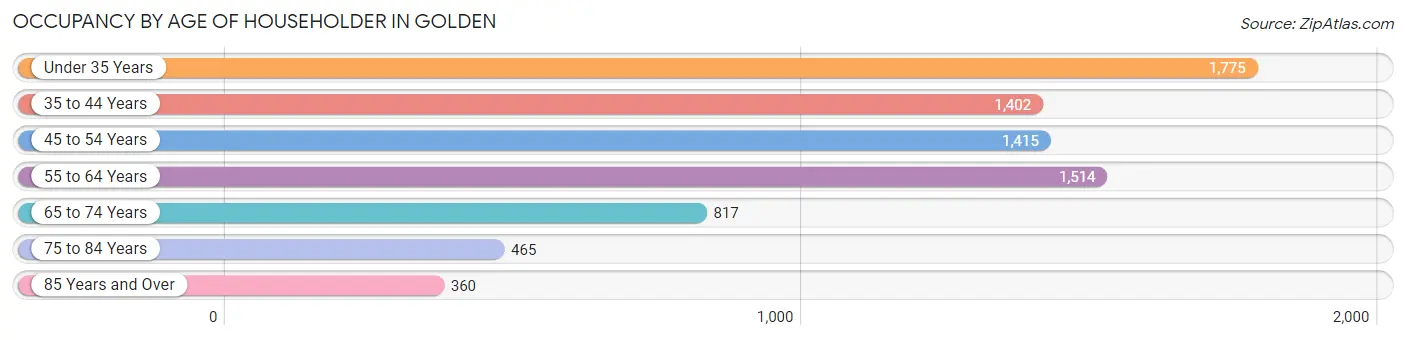
| Age Bracket | # Households | % Households |
| Under 35 Years | 1,775 | 22.9% |
| 35 to 44 Years | 1,402 | 18.1% |
| 45 to 54 Years | 1,415 | 18.3% |
| 55 to 64 Years | 1,514 | 19.5% |
| 65 to 74 Years | 817 | 10.5% |
| 75 to 84 Years | 465 | 6.0% |
| 85 Years and Over | 360 | 4.6% |
| Total | 7,748 | 100.0% |
Housing Finances in Golden
Median Income by Occupancy in Golden
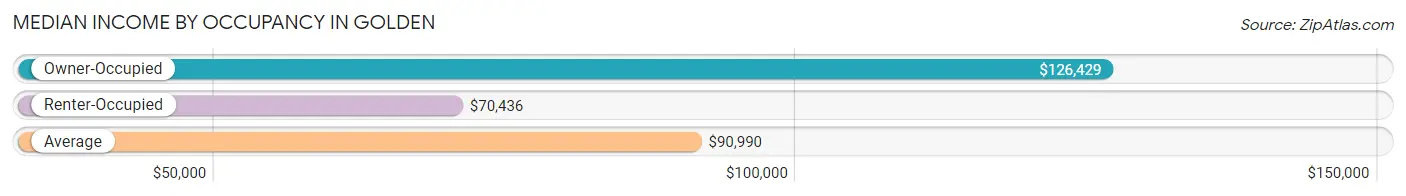
| Occupancy Type | # Households | Median Income |
| Owner-Occupied | 4,502 (58.1%) | $126,429 |
| Renter-Occupied | 3,246 (41.9%) | $70,436 |
| Average | 7,748 (100.0%) | $90,990 |
Occupancy by Householder Income Bracket in Golden
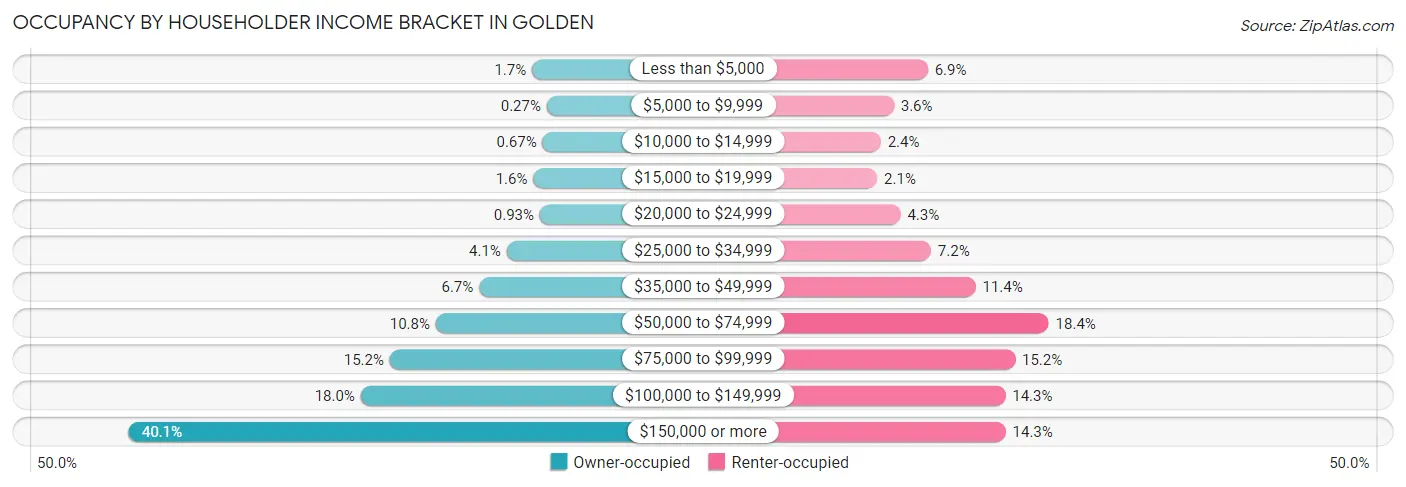
| Income Bracket | Owner-occupied | Renter-occupied |
| Less than $5,000 | 75 (1.7%) | 223 (6.9%) |
| $5,000 to $9,999 | 12 (0.3%) | 118 (3.6%) |
| $10,000 to $14,999 | 30 (0.7%) | 78 (2.4%) |
| $15,000 to $19,999 | 70 (1.5%) | 67 (2.1%) |
| $20,000 to $24,999 | 42 (0.9%) | 139 (4.3%) |
| $25,000 to $34,999 | 184 (4.1%) | 233 (7.2%) |
| $35,000 to $49,999 | 302 (6.7%) | 371 (11.4%) |
| $50,000 to $74,999 | 488 (10.8%) | 597 (18.4%) |
| $75,000 to $99,999 | 685 (15.2%) | 493 (15.2%) |
| $100,000 to $149,999 | 810 (18.0%) | 463 (14.3%) |
| $150,000 or more | 1,804 (40.1%) | 464 (14.3%) |
| Total | 4,502 (100.0%) | 3,246 (100.0%) |
Monthly Housing Cost Tiers in Golden
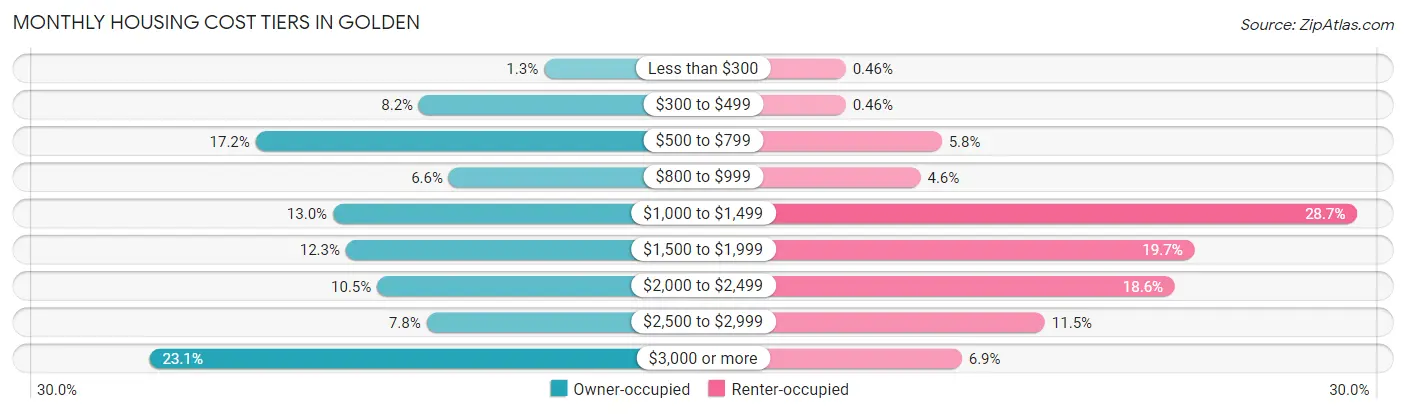
| Monthly Cost | Owner-occupied | Renter-occupied |
| Less than $300 | 59 (1.3%) | 15 (0.5%) |
| $300 to $499 | 370 (8.2%) | 15 (0.5%) |
| $500 to $799 | 776 (17.2%) | 187 (5.8%) |
| $800 to $999 | 296 (6.6%) | 149 (4.6%) |
| $1,000 to $1,499 | 584 (13.0%) | 932 (28.7%) |
| $1,500 to $1,999 | 552 (12.3%) | 640 (19.7%) |
| $2,000 to $2,499 | 474 (10.5%) | 605 (18.6%) |
| $2,500 to $2,999 | 351 (7.8%) | 372 (11.5%) |
| $3,000 or more | 1,040 (23.1%) | 223 (6.9%) |
| Total | 4,502 (100.0%) | 3,246 (100.0%) |
Physical Housing Characteristics in Golden
Housing Structures in Golden
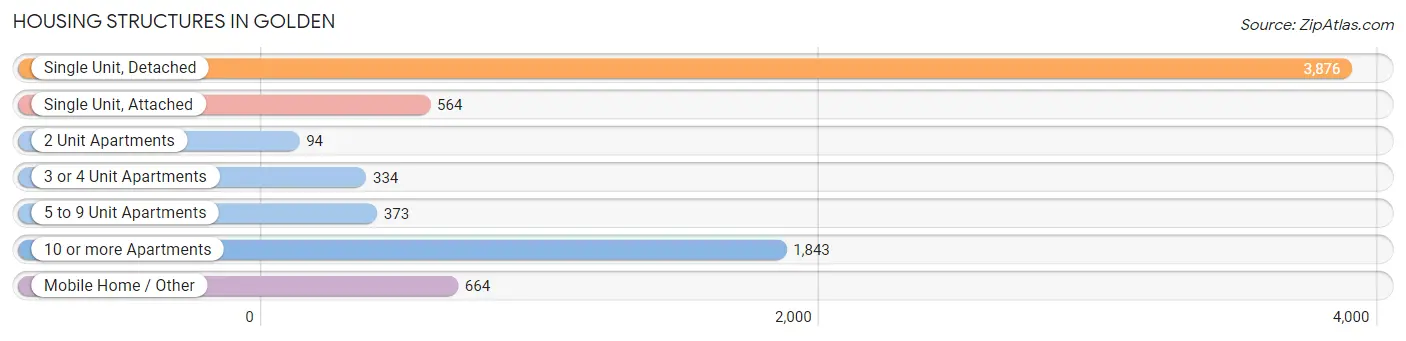
| Structure Type | # Housing Units | % Housing Units |
| Single Unit, Detached | 3,876 | 50.0% |
| Single Unit, Attached | 564 | 7.3% |
| 2 Unit Apartments | 94 | 1.2% |
| 3 or 4 Unit Apartments | 334 | 4.3% |
| 5 to 9 Unit Apartments | 373 | 4.8% |
| 10 or more Apartments | 1,843 | 23.8% |
| Mobile Home / Other | 664 | 8.6% |
| Total | 7,748 | 100.0% |
Housing Structures by Occupancy in Golden
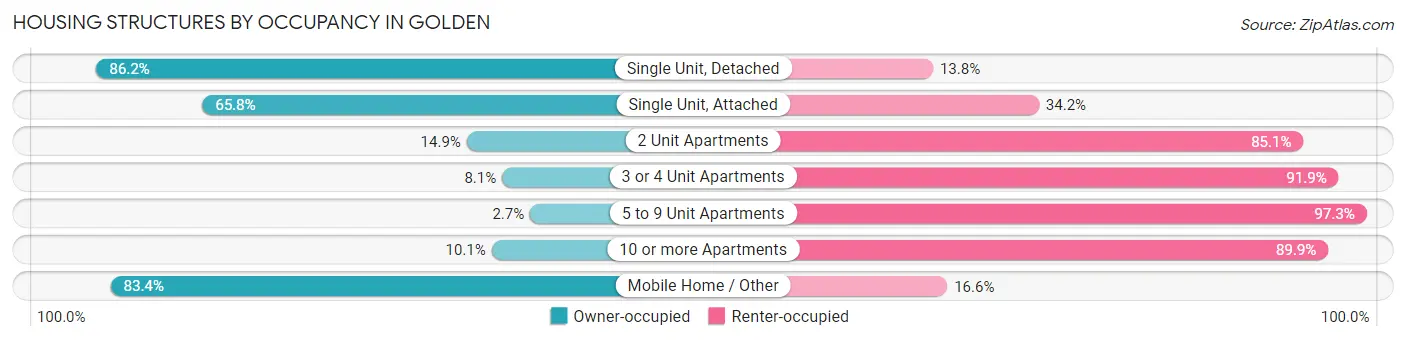
| Structure Type | Owner-occupied | Renter-occupied |
| Single Unit, Detached | 3,340 (86.2%) | 536 (13.8%) |
| Single Unit, Attached | 371 (65.8%) | 193 (34.2%) |
| 2 Unit Apartments | 14 (14.9%) | 80 (85.1%) |
| 3 or 4 Unit Apartments | 27 (8.1%) | 307 (91.9%) |
| 5 to 9 Unit Apartments | 10 (2.7%) | 363 (97.3%) |
| 10 or more Apartments | 186 (10.1%) | 1,657 (89.9%) |
| Mobile Home / Other | 554 (83.4%) | 110 (16.6%) |
| Total | 4,502 (58.1%) | 3,246 (41.9%) |
Housing Structures by Number of Rooms in Golden
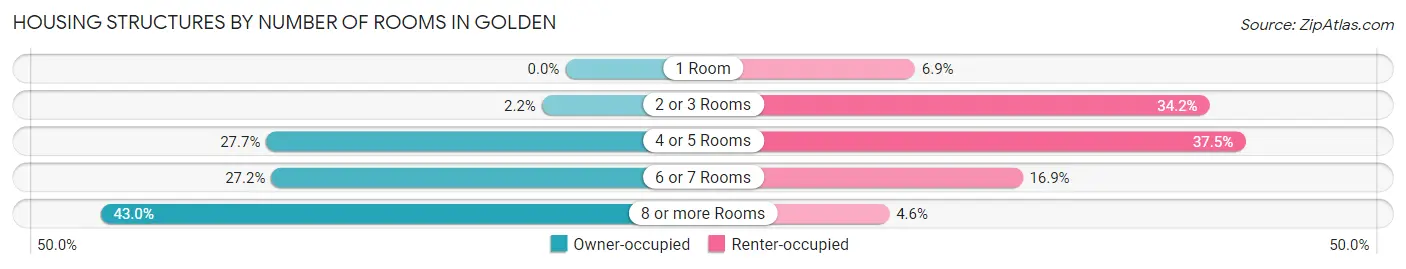
| Number of Rooms | Owner-occupied | Renter-occupied |
| 1 Room | 0 (0.0%) | 225 (6.9%) |
| 2 or 3 Rooms | 98 (2.2%) | 1,109 (34.2%) |
| 4 or 5 Rooms | 1,245 (27.7%) | 1,216 (37.5%) |
| 6 or 7 Rooms | 1,224 (27.2%) | 548 (16.9%) |
| 8 or more Rooms | 1,935 (43.0%) | 148 (4.6%) |
| Total | 4,502 (100.0%) | 3,246 (100.0%) |
Housing Structure by Heating Type in Golden
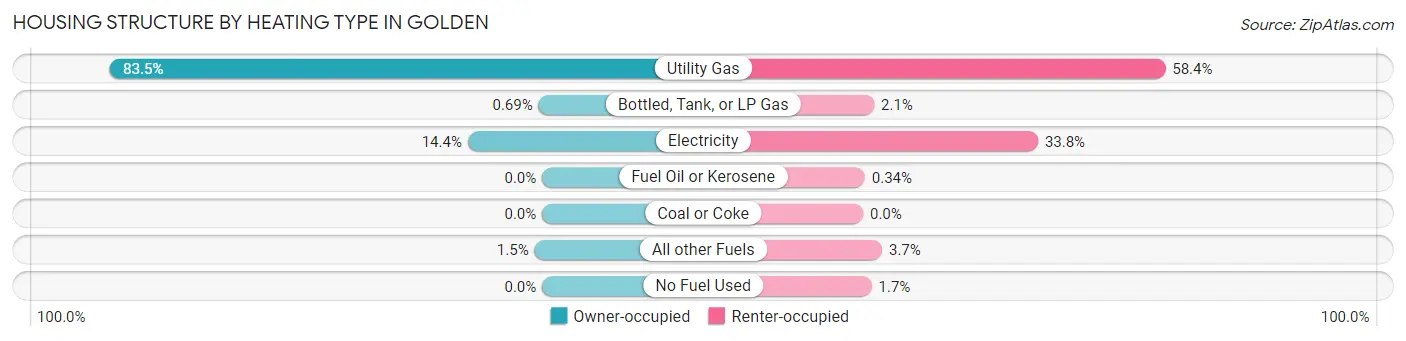
| Heating Type | Owner-occupied | Renter-occupied |
| Utility Gas | 3,758 (83.5%) | 1,896 (58.4%) |
| Bottled, Tank, or LP Gas | 31 (0.7%) | 69 (2.1%) |
| Electricity | 647 (14.4%) | 1,097 (33.8%) |
| Fuel Oil or Kerosene | 0 (0.0%) | 11 (0.3%) |
| Coal or Coke | 0 (0.0%) | 0 (0.0%) |
| All other Fuels | 66 (1.5%) | 119 (3.7%) |
| No Fuel Used | 0 (0.0%) | 54 (1.7%) |
| Total | 4,502 (100.0%) | 3,246 (100.0%) |
Household Vehicle Usage in Golden
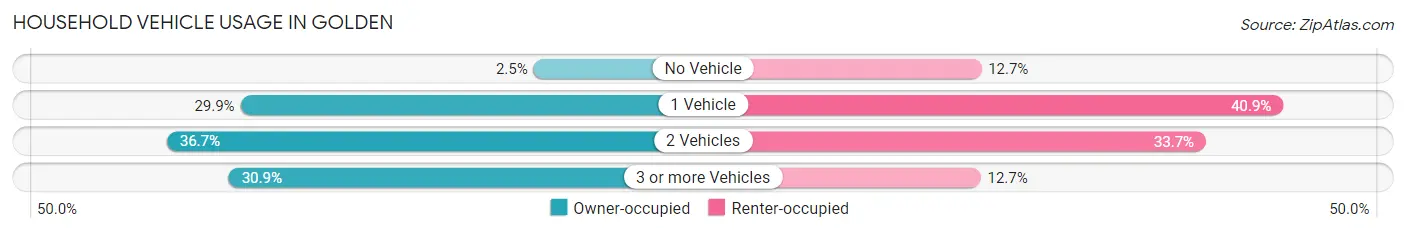
| Vehicles per Household | Owner-occupied | Renter-occupied |
| No Vehicle | 112 (2.5%) | 413 (12.7%) |
| 1 Vehicle | 1,344 (29.8%) | 1,328 (40.9%) |
| 2 Vehicles | 1,653 (36.7%) | 1,094 (33.7%) |
| 3 or more Vehicles | 1,393 (30.9%) | 411 (12.7%) |
| Total | 4,502 (100.0%) | 3,246 (100.0%) |
Real Estate & Mortgages in Golden
Real Estate and Mortgage Overview in Golden
| Characteristic | Without Mortgage | With Mortgage |
| Housing Units | 1,798 | 2,704 |
| Median Property Value | $548,900 | $767,900 |
| Median Household Income | $84,531 | $1,445 |
| Monthly Housing Costs | $701 | $1,040 |
| Real Estate Taxes | $3,038 | $0 |
Property Value by Mortgage Status in Golden
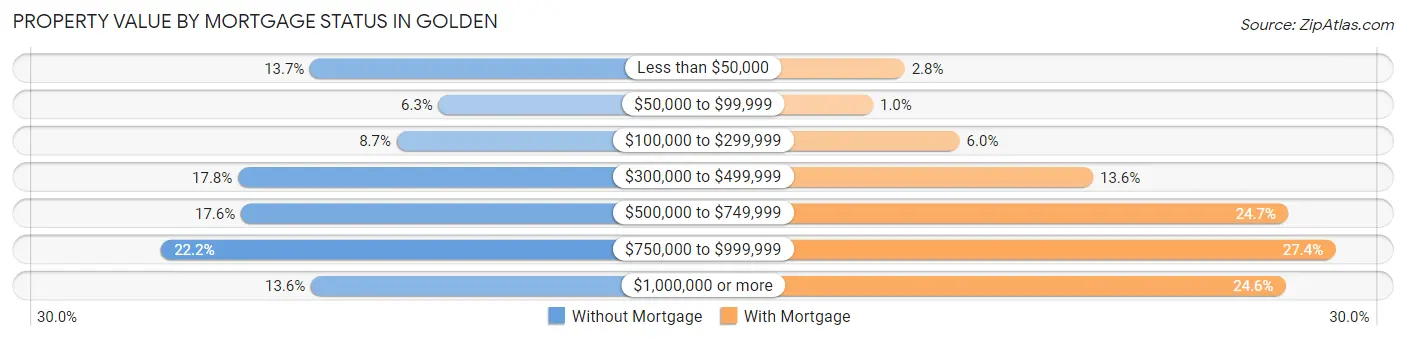
| Property Value | Without Mortgage | With Mortgage |
| Less than $50,000 | 246 (13.7%) | 76 (2.8%) |
| $50,000 to $99,999 | 114 (6.3%) | 27 (1.0%) |
| $100,000 to $299,999 | 157 (8.7%) | 161 (5.9%) |
| $300,000 to $499,999 | 320 (17.8%) | 367 (13.6%) |
| $500,000 to $749,999 | 317 (17.6%) | 668 (24.7%) |
| $750,000 to $999,999 | 399 (22.2%) | 741 (27.4%) |
| $1,000,000 or more | 245 (13.6%) | 664 (24.6%) |
| Total | 1,798 (100.0%) | 2,704 (100.0%) |
Household Income by Mortgage Status in Golden
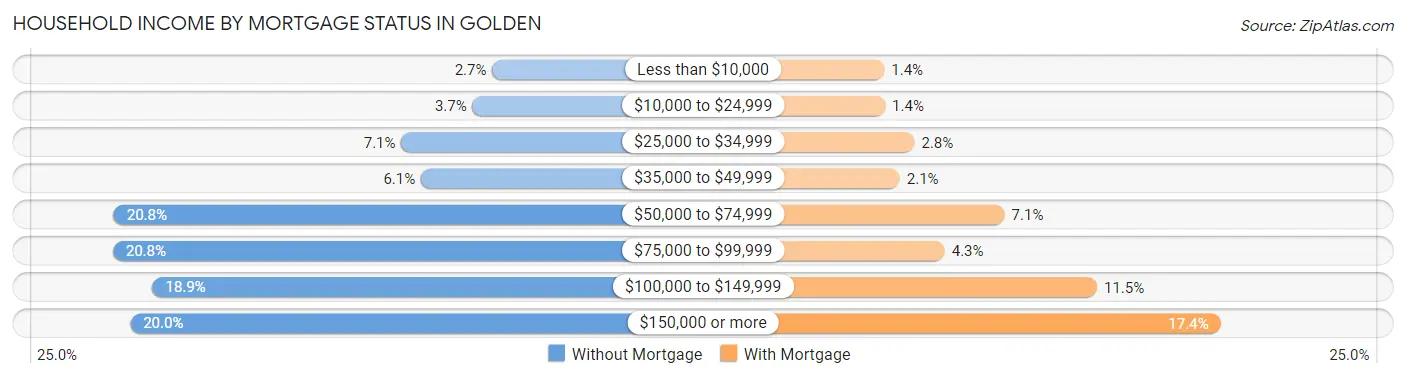
| Household Income | Without Mortgage | With Mortgage |
| Less than $10,000 | 49 (2.7%) | 37 (1.4%) |
| $10,000 to $24,999 | 66 (3.7%) | 38 (1.4%) |
| $25,000 to $34,999 | 127 (7.1%) | 76 (2.8%) |
| $35,000 to $49,999 | 110 (6.1%) | 57 (2.1%) |
| $50,000 to $74,999 | 373 (20.7%) | 192 (7.1%) |
| $75,000 to $99,999 | 374 (20.8%) | 115 (4.3%) |
| $100,000 to $149,999 | 340 (18.9%) | 311 (11.5%) |
| $150,000 or more | 359 (20.0%) | 470 (17.4%) |
| Total | 1,798 (100.0%) | 2,704 (100.0%) |
Property Value to Household Income Ratio in Golden
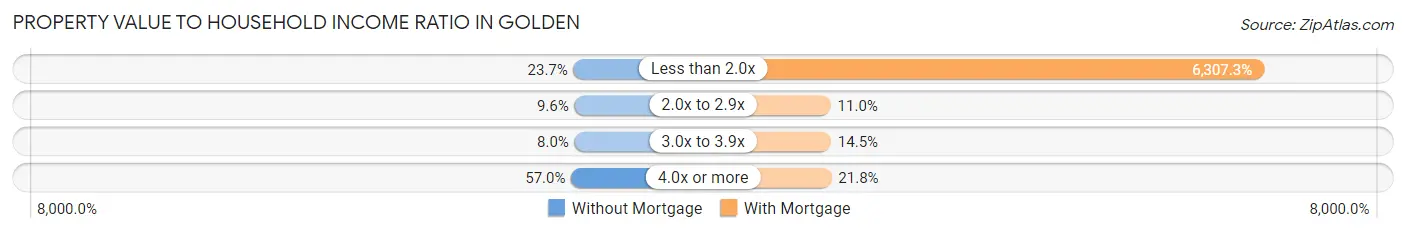
| Value-to-Income Ratio | Without Mortgage | With Mortgage |
| Less than 2.0x | 426 (23.7%) | 170,548 (6,307.2%) |
| 2.0x to 2.9x | 173 (9.6%) | 297 (11.0%) |
| 3.0x to 3.9x | 143 (8.0%) | 393 (14.5%) |
| 4.0x or more | 1,024 (57.0%) | 589 (21.8%) |
| Total | 1,798 (100.0%) | 2,704 (100.0%) |
Real Estate Taxes by Mortgage Status in Golden
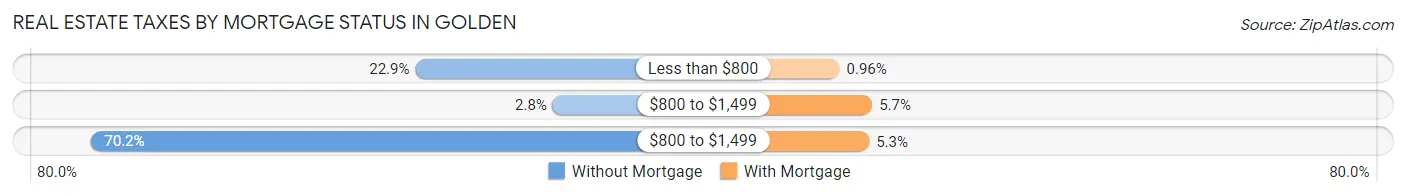
| Property Taxes | Without Mortgage | With Mortgage |
| Less than $800 | 412 (22.9%) | 26 (1.0%) |
| $800 to $1,499 | 51 (2.8%) | 155 (5.7%) |
| $800 to $1,499 | 1,263 (70.2%) | 143 (5.3%) |
| Total | 1,798 (100.0%) | 2,704 (100.0%) |
Health & Disability in Golden
Health Insurance Coverage by Age in Golden
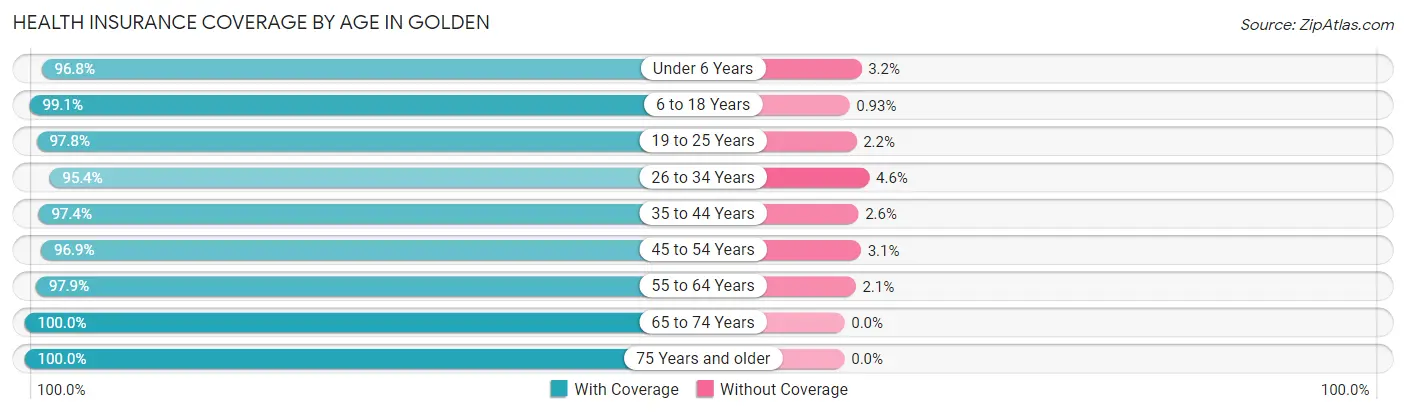
| Age Bracket | With Coverage | Without Coverage |
| Under 6 Years | 857 (96.8%) | 28 (3.2%) |
| 6 to 18 Years | 2,968 (99.1%) | 28 (0.9%) |
| 19 to 25 Years | 3,306 (97.8%) | 75 (2.2%) |
| 26 to 34 Years | 2,190 (95.4%) | 106 (4.6%) |
| 35 to 44 Years | 2,475 (97.4%) | 66 (2.6%) |
| 45 to 54 Years | 2,115 (96.9%) | 67 (3.1%) |
| 55 to 64 Years | 2,431 (97.9%) | 52 (2.1%) |
| 65 to 74 Years | 1,365 (100.0%) | 0 (0.0%) |
| 75 Years and older | 1,096 (100.0%) | 0 (0.0%) |
| Total | 18,803 (97.8%) | 422 (2.2%) |
Health Insurance Coverage by Citizenship Status in Golden
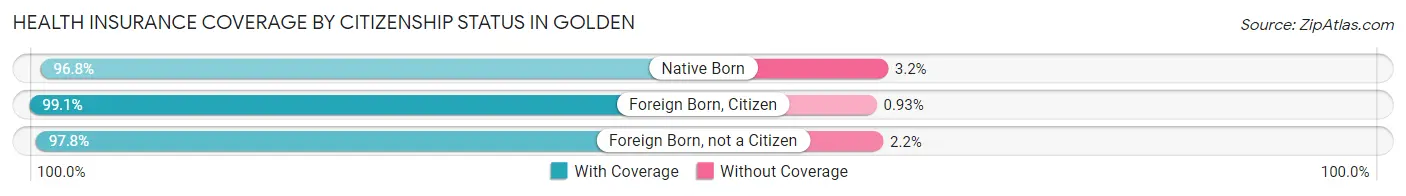
| Citizenship Status | With Coverage | Without Coverage |
| Native Born | 857 (96.8%) | 28 (3.2%) |
| Foreign Born, Citizen | 2,968 (99.1%) | 28 (0.9%) |
| Foreign Born, not a Citizen | 3,306 (97.8%) | 75 (2.2%) |
Health Insurance Coverage by Household Income in Golden
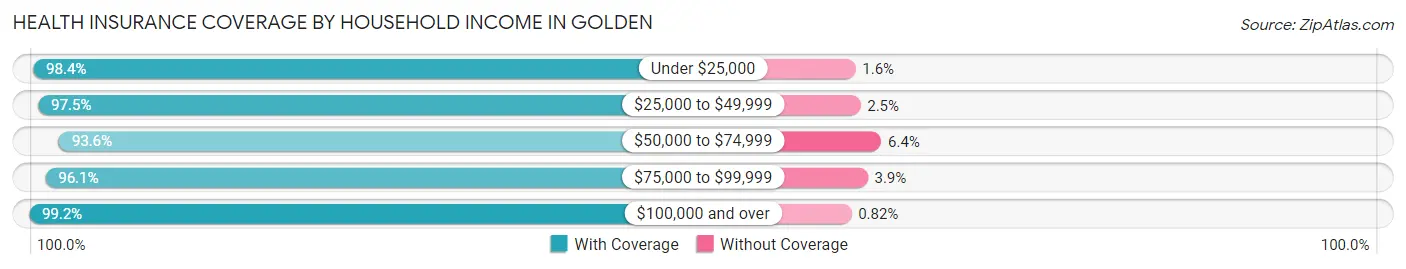
| Household Income | With Coverage | Without Coverage |
| Under $25,000 | 1,341 (98.4%) | 22 (1.6%) |
| $25,000 to $49,999 | 2,200 (97.5%) | 57 (2.5%) |
| $50,000 to $74,999 | 2,098 (93.6%) | 144 (6.4%) |
| $75,000 to $99,999 | 2,330 (96.1%) | 94 (3.9%) |
| $100,000 and over | 9,570 (99.2%) | 79 (0.8%) |
Public vs Private Health Insurance Coverage by Age in Golden
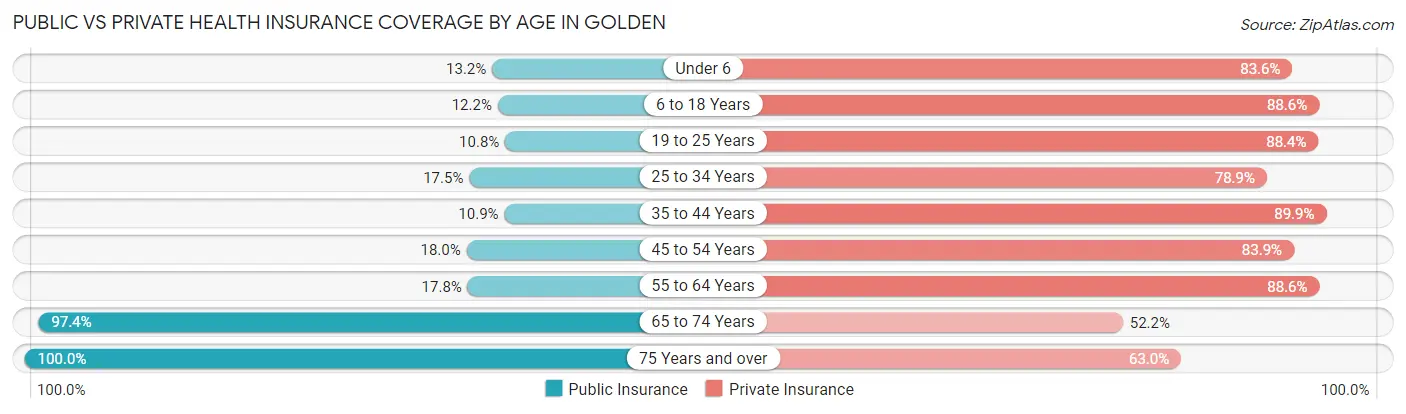
| Age Bracket | Public Insurance | Private Insurance |
| Under 6 | 117 (13.2%) | 740 (83.6%) |
| 6 to 18 Years | 365 (12.2%) | 2,654 (88.6%) |
| 19 to 25 Years | 365 (10.8%) | 2,990 (88.4%) |
| 25 to 34 Years | 401 (17.5%) | 1,811 (78.9%) |
| 35 to 44 Years | 278 (10.9%) | 2,285 (89.9%) |
| 45 to 54 Years | 392 (18.0%) | 1,831 (83.9%) |
| 55 to 64 Years | 441 (17.8%) | 2,201 (88.6%) |
| 65 to 74 Years | 1,330 (97.4%) | 712 (52.2%) |
| 75 Years and over | 1,096 (100.0%) | 690 (63.0%) |
| Total | 4,785 (24.9%) | 15,914 (82.8%) |
Disability Status by Sex by Age in Golden
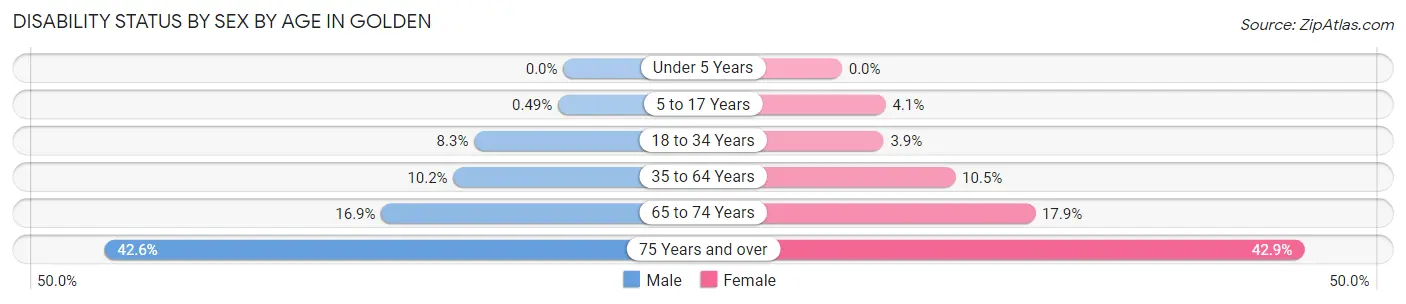
| Age Bracket | Male | Female |
| Under 5 Years | 0 (0.0%) | 0 (0.0%) |
| 5 to 17 Years | 8 (0.5%) | 43 (4.1%) |
| 18 to 34 Years | 334 (8.3%) | 84 (3.9%) |
| 35 to 64 Years | 378 (10.2%) | 368 (10.5%) |
| 65 to 74 Years | 126 (16.9%) | 111 (17.9%) |
| 75 Years and over | 158 (42.6%) | 311 (42.9%) |
Disability Class by Sex by Age in Golden
Disability Class: Hearing Difficulty
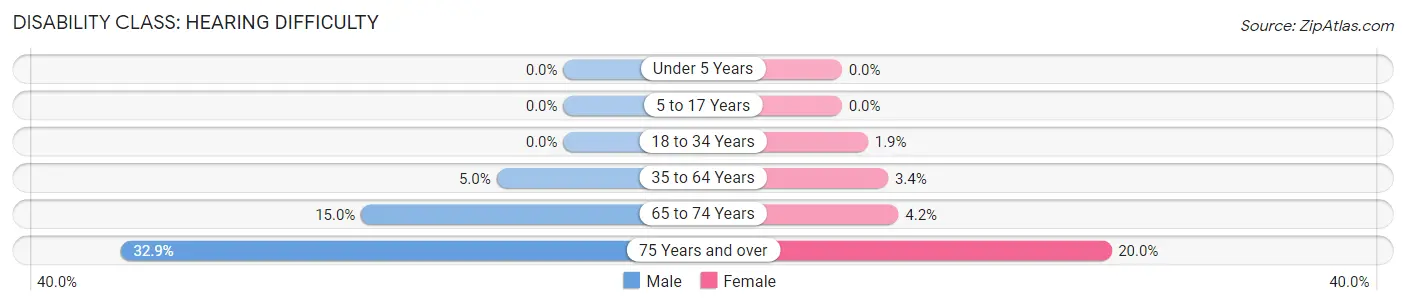
| Age Bracket | Male | Female |
| Under 5 Years | 0 (0.0%) | 0 (0.0%) |
| 5 to 17 Years | 0 (0.0%) | 0 (0.0%) |
| 18 to 34 Years | 0 (0.0%) | 42 (1.9%) |
| 35 to 64 Years | 184 (5.0%) | 120 (3.4%) |
| 65 to 74 Years | 112 (15.0%) | 26 (4.2%) |
| 75 Years and over | 122 (32.9%) | 145 (20.0%) |
Disability Class: Vision Difficulty
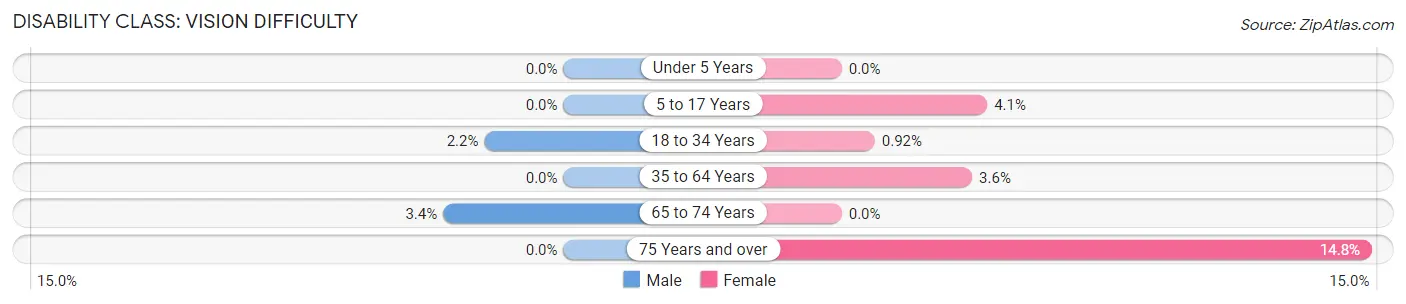
| Age Bracket | Male | Female |
| Under 5 Years | 0 (0.0%) | 0 (0.0%) |
| 5 to 17 Years | 0 (0.0%) | 43 (4.1%) |
| 18 to 34 Years | 89 (2.2%) | 20 (0.9%) |
| 35 to 64 Years | 0 (0.0%) | 127 (3.6%) |
| 65 to 74 Years | 25 (3.4%) | 0 (0.0%) |
| 75 Years and over | 0 (0.0%) | 107 (14.8%) |
Disability Class: Cognitive Difficulty
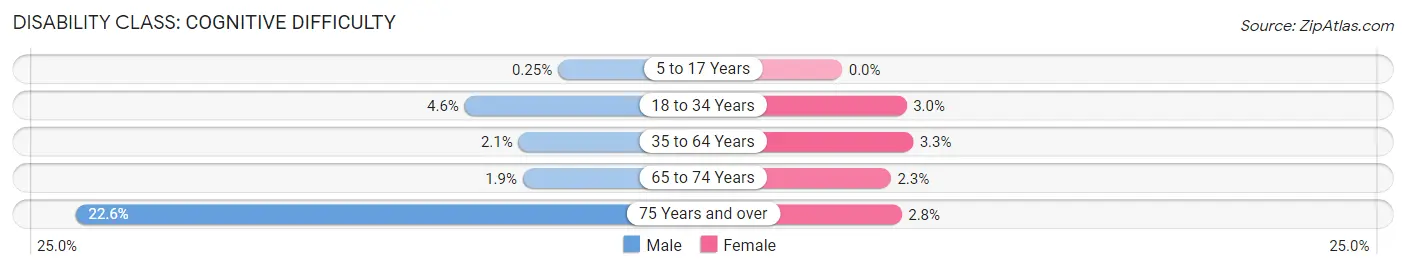
| Age Bracket | Male | Female |
| 5 to 17 Years | 4 (0.3%) | 0 (0.0%) |
| 18 to 34 Years | 185 (4.6%) | 65 (3.0%) |
| 35 to 64 Years | 77 (2.1%) | 115 (3.3%) |
| 65 to 74 Years | 14 (1.9%) | 14 (2.3%) |
| 75 Years and over | 84 (22.6%) | 20 (2.8%) |
Disability Class: Ambulatory Difficulty
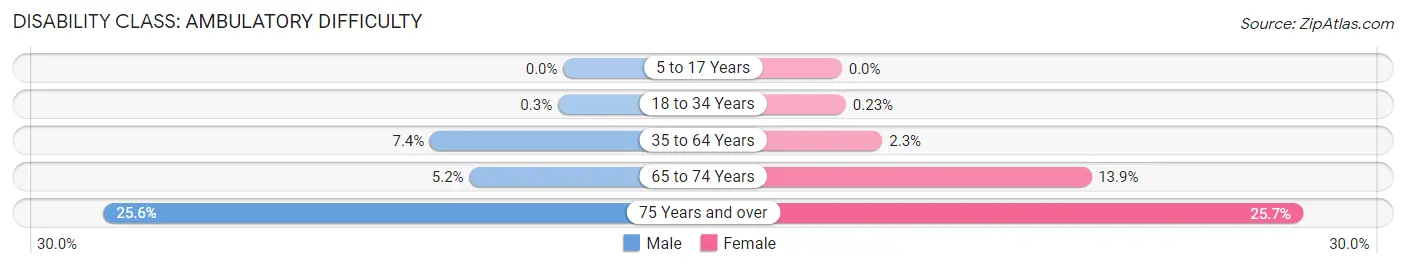
| Age Bracket | Male | Female |
| 5 to 17 Years | 0 (0.0%) | 0 (0.0%) |
| 18 to 34 Years | 12 (0.3%) | 5 (0.2%) |
| 35 to 64 Years | 275 (7.4%) | 79 (2.3%) |
| 65 to 74 Years | 39 (5.2%) | 86 (13.9%) |
| 75 Years and over | 95 (25.6%) | 186 (25.7%) |
Disability Class: Self-Care Difficulty
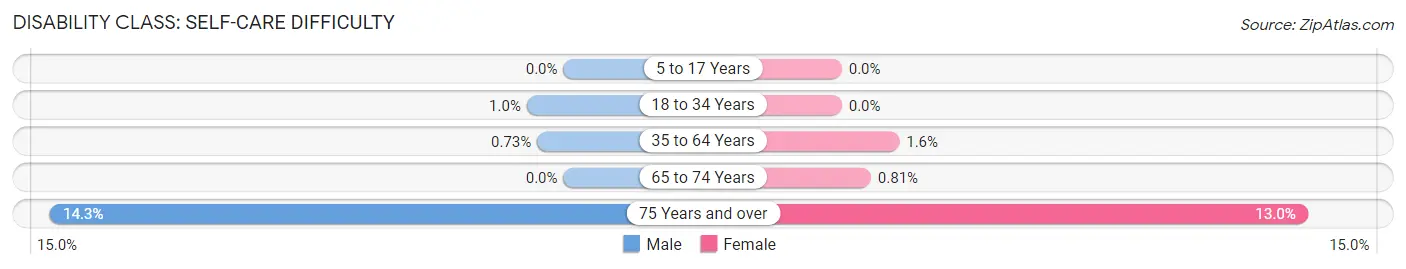
| Age Bracket | Male | Female |
| 5 to 17 Years | 0 (0.0%) | 0 (0.0%) |
| 18 to 34 Years | 41 (1.0%) | 0 (0.0%) |
| 35 to 64 Years | 27 (0.7%) | 56 (1.6%) |
| 65 to 74 Years | 0 (0.0%) | 5 (0.8%) |
| 75 Years and over | 53 (14.3%) | 94 (13.0%) |
Technology Access in Golden
Computing Device Access in Golden
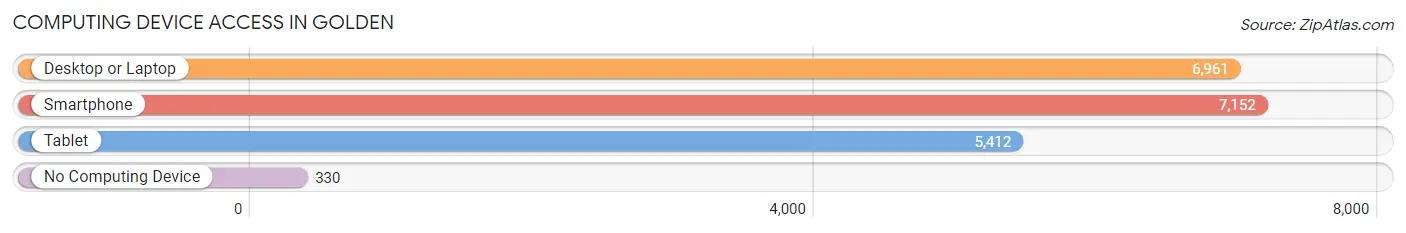
| Device Type | # Households | % Households |
| Desktop or Laptop | 6,961 | 89.8% |
| Smartphone | 7,152 | 92.3% |
| Tablet | 5,412 | 69.9% |
| No Computing Device | 330 | 4.3% |
| Total | 7,748 | 100.0% |
Internet Access in Golden
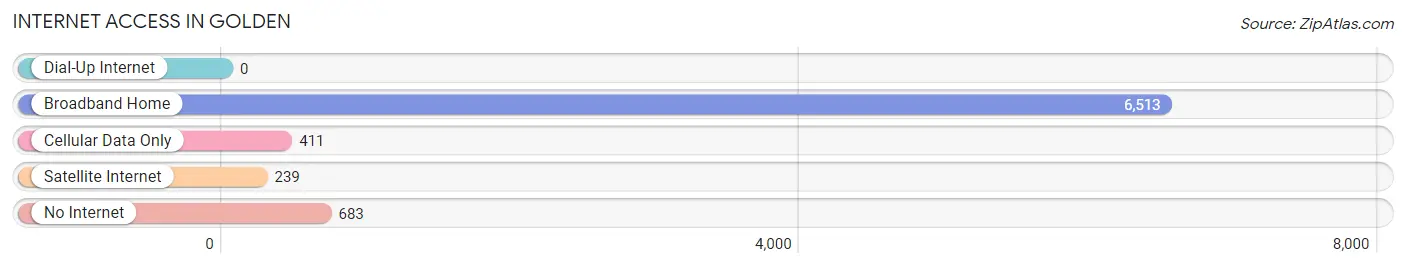
| Internet Type | # Households | % Households |
| Dial-Up Internet | 0 | 0.0% |
| Broadband Home | 6,513 | 84.1% |
| Cellular Data Only | 411 | 5.3% |
| Satellite Internet | 239 | 3.1% |
| No Internet | 683 | 8.8% |
| Total | 7,748 | 100.0% |
Golden Summary
Golden, Colorado is a city located in Jefferson County, Colorado, United States. It is the county seat of Jefferson County and is located at the base of the Rocky Mountains. The city is located along Clear Creek, a tributary of the South Platte River. The city is located approximately 15 miles west of Denver and is part of the Denver-Aurora-Lakewood Metropolitan Statistical Area.
History
The area that is now Golden was originally inhabited by Native American tribes, including the Ute, Arapaho, and Cheyenne. The first Europeans to explore the area were Spanish explorers in the late 1700s. The area was first settled by prospectors in the mid-1800s during the Colorado Gold Rush. The city was founded in 1859 and was originally named Golden City. The city was named after Thomas L. Golden, a prospector who discovered gold in the area.
The city quickly grew as prospectors flocked to the area in search of gold. The city was incorporated in 1872 and was the first capital of the Colorado Territory. The city was also the first capital of the State of Colorado when it became a state in 1876.
Geography
Golden is located in the foothills of the Rocky Mountains at an elevation of 5,675 feet. The city is located along Clear Creek, a tributary of the South Platte River. The city is located approximately 15 miles west of Denver and is part of the Denver-Aurora-Lakewood Metropolitan Statistical Area.
The city has a total area of 8.2 square miles, of which 8.1 square miles is land and 0.1 square miles is water. The city is located in a semi-arid climate zone and has an average annual precipitation of 16.5 inches.
Economy
The economy of Golden is largely based on tourism, education, and technology. The city is home to the Coors Brewing Company, which is the largest single-site brewery in the world. The city is also home to the National Renewable Energy Laboratory, which is a research facility focused on renewable energy.
The city is also home to the Colorado School of Mines, a public research university focused on engineering and applied sciences. The university is one of the top-ranked engineering schools in the country and is a major employer in the city.
Demographics
As of the 2010 census, the population of Golden was 18,867. The racial makeup of the city was 90.2% White, 2.2% African American, 0.7% Native American, 2.7% Asian, 0.1% Pacific Islander, 1.9% from other races, and 2.2% from two or more races. Hispanic or Latino of any race were 6.3% of the population.
The median household income in Golden was $68,945 and the median family income was $80,945. The per capita income for the city was $35,945. About 5.2% of families and 8.2% of the population were below the poverty line.
Common Questions
What is Per Capita Income in Golden?
Per Capita income in Golden is $52,994.
What is the Median Family Income in Golden?
Median Family Income in Golden is $125,370.
What is the Median Household income in Golden?
Median Household Income in Golden is $90,990.
What is Income or Wage Gap in Golden?
Income or Wage Gap in Golden is 3.4%.
Women in Golden earn 96.6 cents for every dollar earned by a man.
What is Inequality or Gini Index in Golden?
Inequality or Gini Index in Golden is 0.48.
What is the Total Population of Golden?
Total Population of Golden is 20,461.
What is the Total Male Population of Golden?
Total Male Population of Golden is 11,954.
What is the Total Female Population of Golden?
Total Female Population of Golden is 8,507.
What is the Ratio of Males per 100 Females in Golden?
There are 140.52 Males per 100 Females in Golden.
What is the Ratio of Females per 100 Males in Golden?
There are 71.16 Females per 100 Males in Golden.
What is the Median Population Age in Golden?
Median Population Age in Golden is 35.2 Years.
What is the Average Family Size in Golden
Average Family Size in Golden is 2.9 People.
What is the Average Household Size in Golden
Average Household Size in Golden is 2.3 People.
How Large is the Labor Force in Golden?
There are 11,136 People in the Labor Forcein in Golden.
What is the Percentage of People in the Labor Force in Golden?
63.8% of People are in the Labor Force in Golden.
What is the Unemployment Rate in Golden?
Unemployment Rate in Golden is 4.6%.