West Mayfield borough, PA Map & Demographics
West Mayfield borough Overview
$29,726
PER CAPITA INCOME
$64,412
AVG FAMILY INCOME
$52,017
AVG HOUSEHOLD INCOME
25.5%
WAGE / INCOME GAP [ % ]
74.5¢/ $1
WAGE / INCOME GAP [ $ ]
0.43
INEQUALITY / GINI INDEX
1,270
TOTAL POPULATION
595
MALE POPULATION
675
FEMALE POPULATION
88.15
MALES / 100 FEMALES
113.45
FEMALES / 100 MALES
40.4
MEDIAN AGE
2.8
AVG FAMILY SIZE
2.2
AVG HOUSEHOLD SIZE
688
LABOR FORCE [ PEOPLE ]
62.7%
PERCENT IN LABOR FORCE
8.9%
UNEMPLOYMENT RATE
Income in West Mayfield borough
Income Overview in West Mayfield borough
Per Capita Income in West Mayfield borough is $29,726, while median incomes of families and households are $64,412 and $52,017 respectively.
| Characteristic | Number | Measure |
| Per Capita Income | 1,270 | $29,726 |
| Median Family Income | 346 | $64,412 |
| Mean Family Income | 346 | $83,425 |
| Median Household Income | 569 | $52,017 |
| Mean Household Income | 569 | $67,975 |
| Income Deficit | 346 | $0 |
| Wage / Income Gap (%) | 1,270 | 25.48% |
| Wage / Income Gap ($) | 1,270 | 74.52¢ per $1 |
| Gini / Inequality Index | 1,270 | 0.43 |
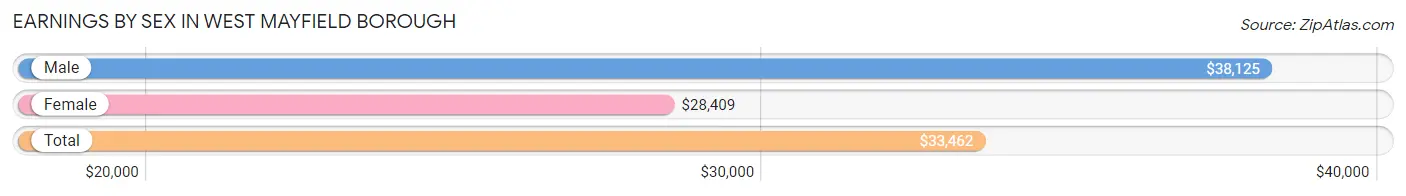
Earnings by Sex in West Mayfield borough
Average Earnings in West Mayfield borough are $33,462, $38,125 for men and $28,409 for women, a difference of 25.5%.
| Sex | Number | Average Earnings |
| Male | 354 (51.2%) | $38,125 |
| Female | 338 (48.8%) | $28,409 |
| Total | 692 (100.0%) | $33,462 |
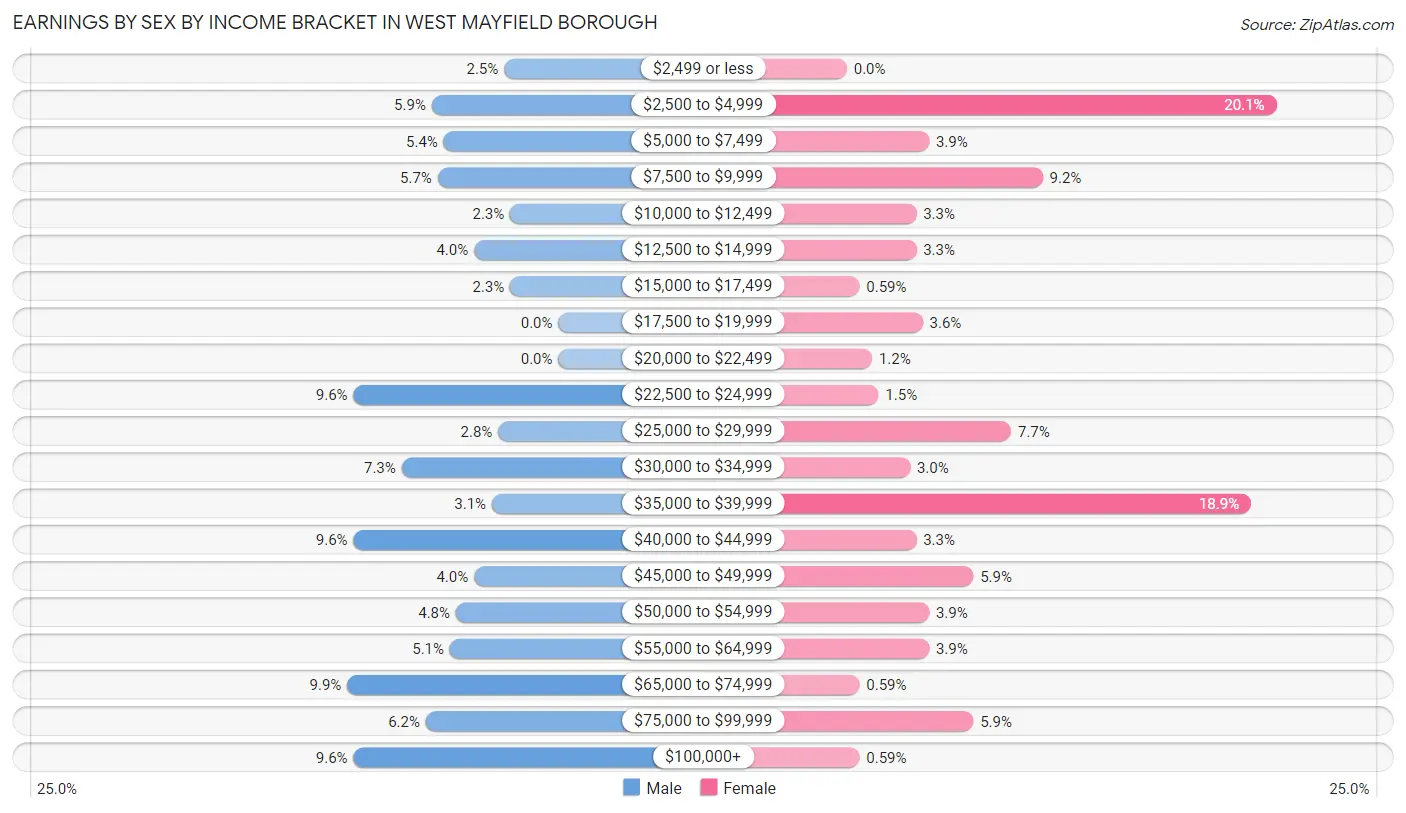
Earnings by Sex by Income Bracket in West Mayfield borough
The most common earnings brackets in West Mayfield borough are $65,000 to $74,999 for men (35 | 9.9%) and $2,500 to $4,999 for women (68 | 20.1%).
| Income | Male | Female |
| $2,499 or less | 9 (2.5%) | 0 (0.0%) |
| $2,500 to $4,999 | 21 (5.9%) | 68 (20.1%) |
| $5,000 to $7,499 | 19 (5.4%) | 13 (3.8%) |
| $7,500 to $9,999 | 20 (5.7%) | 31 (9.2%) |
| $10,000 to $12,499 | 8 (2.3%) | 11 (3.3%) |
| $12,500 to $14,999 | 14 (4.0%) | 11 (3.3%) |
| $15,000 to $17,499 | 8 (2.3%) | 2 (0.6%) |
| $17,500 to $19,999 | 0 (0.0%) | 12 (3.5%) |
| $20,000 to $22,499 | 0 (0.0%) | 4 (1.2%) |
| $22,500 to $24,999 | 34 (9.6%) | 5 (1.5%) |
| $25,000 to $29,999 | 10 (2.8%) | 26 (7.7%) |
| $30,000 to $34,999 | 26 (7.3%) | 10 (3.0%) |
| $35,000 to $39,999 | 11 (3.1%) | 64 (18.9%) |
| $40,000 to $44,999 | 34 (9.6%) | 11 (3.3%) |
| $45,000 to $49,999 | 14 (4.0%) | 20 (5.9%) |
| $50,000 to $54,999 | 17 (4.8%) | 13 (3.8%) |
| $55,000 to $64,999 | 18 (5.1%) | 13 (3.8%) |
| $65,000 to $74,999 | 35 (9.9%) | 2 (0.6%) |
| $75,000 to $99,999 | 22 (6.2%) | 20 (5.9%) |
| $100,000+ | 34 (9.6%) | 2 (0.6%) |
| Total | 354 (100.0%) | 338 (100.0%) |
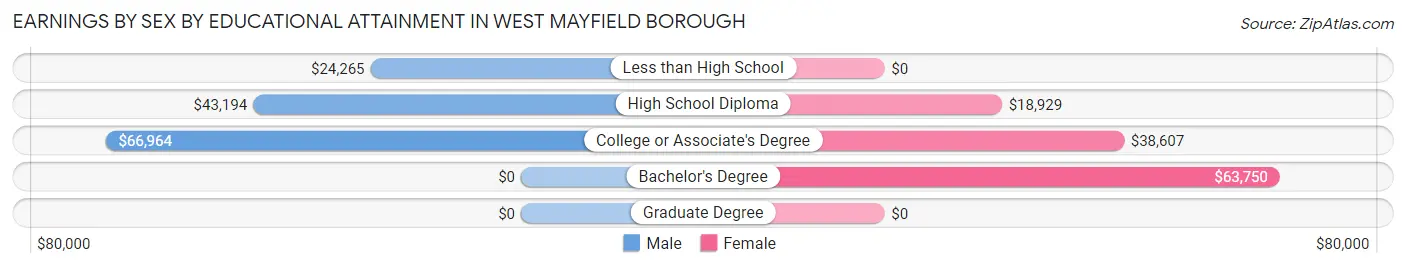
Earnings by Sex by Educational Attainment in West Mayfield borough
Average earnings in West Mayfield borough are $43,790 for men and $37,848 for women, a difference of 13.6%. Men with an educational attainment of college or associate's degree enjoy the highest average annual earnings of $66,964, while those with less than high school education earn the least with $24,265. Women with an educational attainment of bachelor's degree earn the most with the average annual earnings of $63,750, while those with high school diploma education have the smallest earnings of $18,929.
| Educational Attainment | Male Income | Female Income |
| Less than High School | $24,265 | $0 |
| High School Diploma | $43,194 | $18,929 |
| College or Associate's Degree | $66,964 | $38,607 |
| Bachelor's Degree | - | - |
| Graduate Degree | - | - |
| Total | $43,790 | $37,848 |
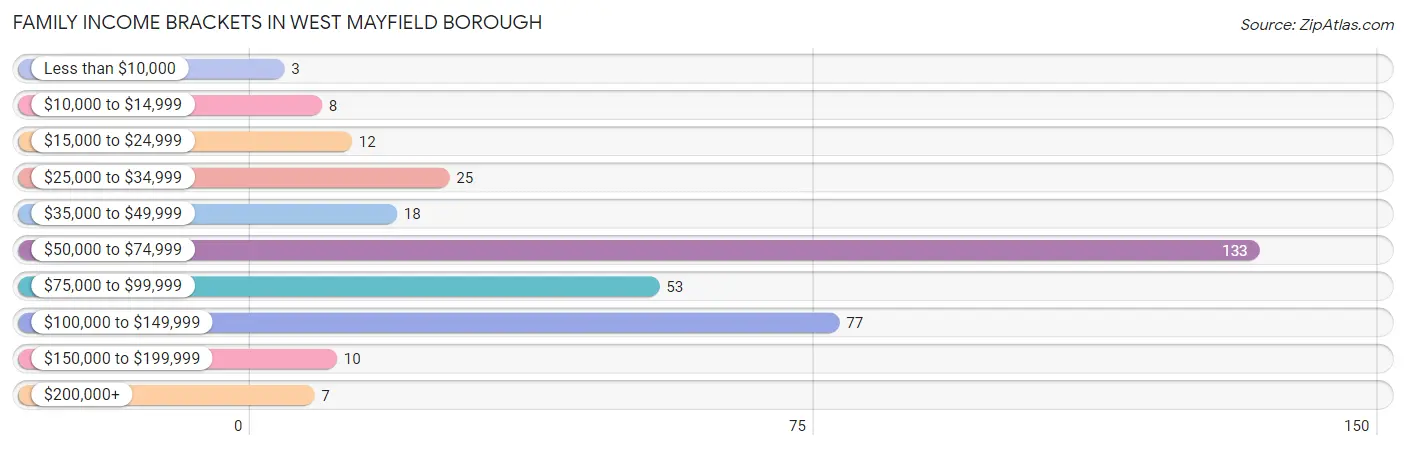
Family Income in West Mayfield borough
Family Income Brackets in West Mayfield borough
According to the West Mayfield borough family income data, there are 133 families falling into the $50,000 to $74,999 income range, which is the most common income bracket and makes up 38.4% of all families. Conversely, the less than $10,000 income bracket is the least frequent group with only 3 families (0.9%) belonging to this category.
| Income Bracket | # Families | % Families |
| Less than $10,000 | 3 | 0.9% |
| $10,000 to $14,999 | 8 | 2.3% |
| $15,000 to $24,999 | 12 | 3.5% |
| $25,000 to $34,999 | 25 | 7.2% |
| $35,000 to $49,999 | 18 | 5.2% |
| $50,000 to $74,999 | 133 | 38.4% |
| $75,000 to $99,999 | 53 | 15.3% |
| $100,000 to $149,999 | 77 | 22.3% |
| $150,000 to $199,999 | 10 | 2.9% |
| $200,000+ | 7 | 2.0% |
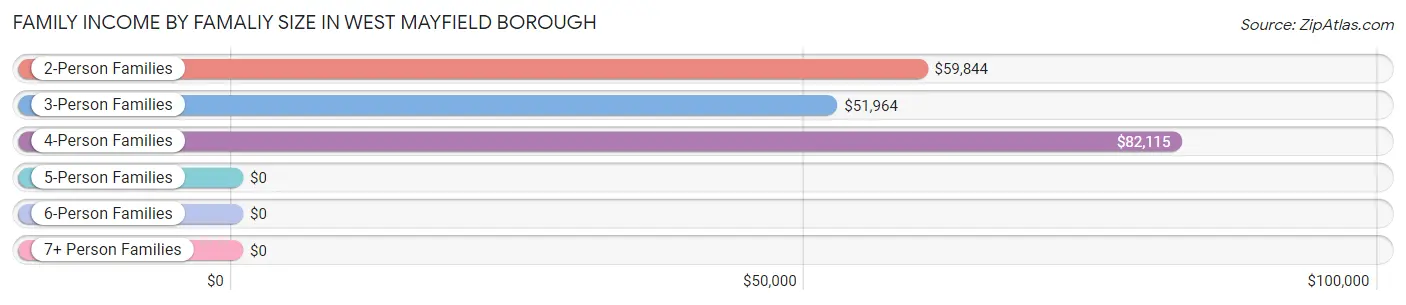
Family Income by Famaliy Size in West Mayfield borough
4-person families (72 | 20.8%) account for the highest median family income in West Mayfield borough with $82,115 per family, while 2-person families (137 | 39.6%) have the highest median income of $29,922 per family member.
| Income Bracket | # Families | Median Income |
| 2-Person Families | 137 (39.6%) | $59,844 |
| 3-Person Families | 119 (34.4%) | $51,964 |
| 4-Person Families | 72 (20.8%) | $82,115 |
| 5-Person Families | 15 (4.3%) | $0 |
| 6-Person Families | 3 (0.9%) | $0 |
| 7+ Person Families | 0 (0.0%) | $0 |
| Total | 346 (100.0%) | $64,412 |
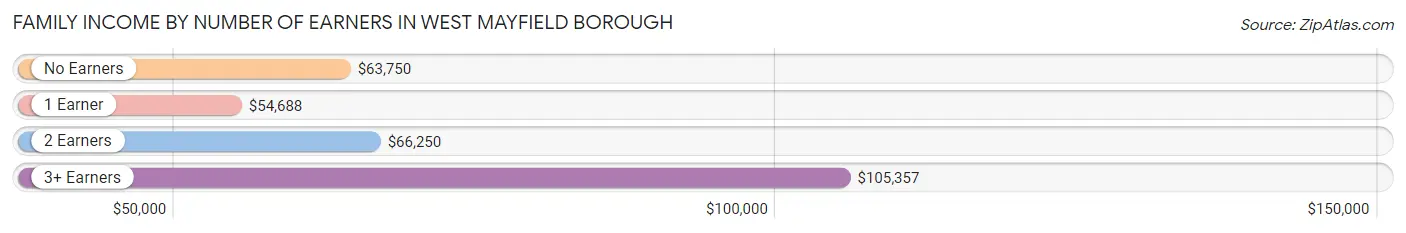
Family Income by Number of Earners in West Mayfield borough
The median family income in West Mayfield borough is $64,412, with families comprising 3+ earners (36) having the highest median family income of $105,357, while families with 1 earner (129) have the lowest median family income of $54,688, accounting for 10.4% and 37.3% of families, respectively.
| Number of Earners | # Families | Median Income |
| No Earners | 37 (10.7%) | $63,750 |
| 1 Earner | 129 (37.3%) | $54,688 |
| 2 Earners | 144 (41.6%) | $66,250 |
| 3+ Earners | 36 (10.4%) | $105,357 |
| Total | 346 (100.0%) | $64,412 |
Household Income in West Mayfield borough
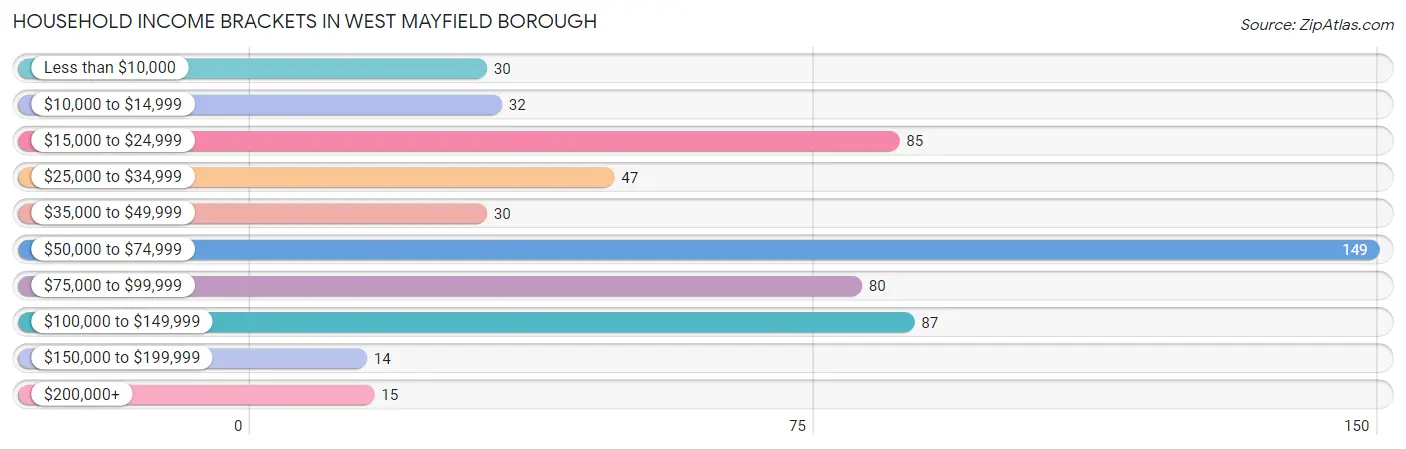
Household Income Brackets in West Mayfield borough
With 149 households falling in the category, the $50,000 to $74,999 income range is the most frequent in West Mayfield borough, accounting for 26.2% of all households. In contrast, only 14 households (2.5%) fall into the $150,000 to $199,999 income bracket, making it the least populous group.
| Income Bracket | # Households | % Households |
| Less than $10,000 | 30 | 5.3% |
| $10,000 to $14,999 | 32 | 5.6% |
| $15,000 to $24,999 | 85 | 14.9% |
| $25,000 to $34,999 | 47 | 8.3% |
| $35,000 to $49,999 | 30 | 5.3% |
| $50,000 to $74,999 | 149 | 26.2% |
| $75,000 to $99,999 | 80 | 14.1% |
| $100,000 to $149,999 | 87 | 15.3% |
| $150,000 to $199,999 | 14 | 2.5% |
| $200,000+ | 15 | 2.6% |
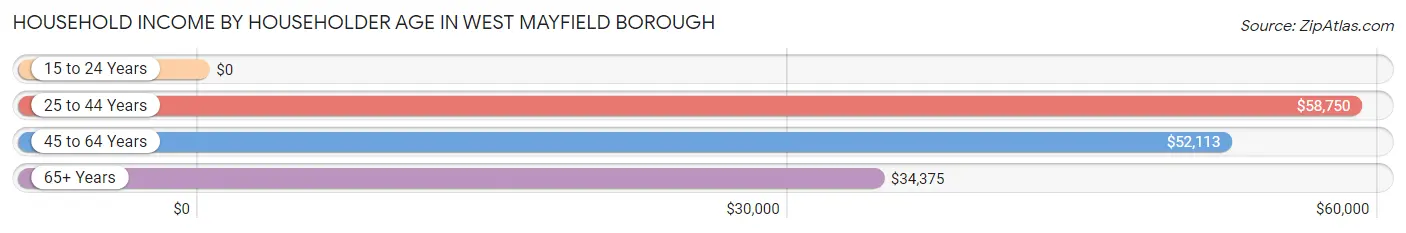
Household Income by Householder Age in West Mayfield borough
The median household income in West Mayfield borough is $52,017, with the highest median household income of $58,750 found in the 25 to 44 years age bracket for the primary householder. A total of 190 households (33.4%) fall into this category.
| Income Bracket | # Households | Median Income |
| 15 to 24 Years | 0 (0.0%) | $0 |
| 25 to 44 Years | 190 (33.4%) | $58,750 |
| 45 to 64 Years | 236 (41.5%) | $52,113 |
| 65+ Years | 143 (25.1%) | $34,375 |
| Total | 569 (100.0%) | $52,017 |
Poverty in West Mayfield borough
Income Below Poverty by Sex and Age in West Mayfield borough
With 12.2% poverty level for males and 10.0% for females among the residents of West Mayfield borough, 15 year old males and 25 to 34 year old females are the most vulnerable to poverty, with 4 males (100.0%) and 24 females (29.6%) in their respective age groups living below the poverty level.
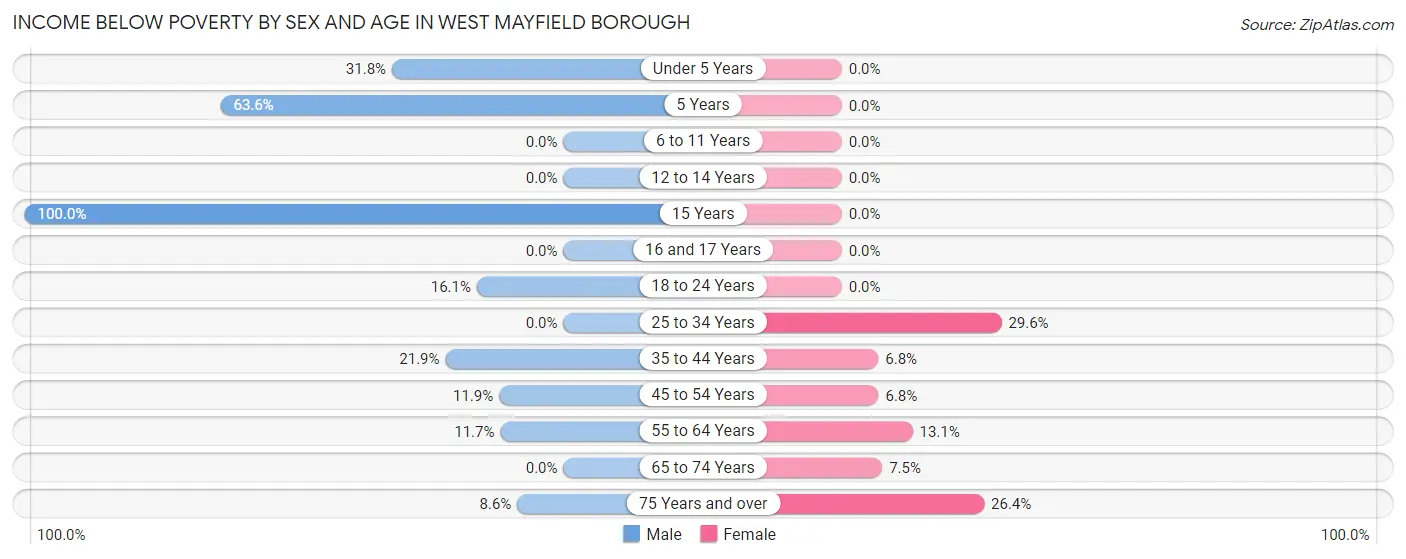
| Age Bracket | Male | Female |
| Under 5 Years | 7 (31.8%) | 0 (0.0%) |
| 5 Years | 7 (63.6%) | 0 (0.0%) |
| 6 to 11 Years | 0 (0.0%) | 0 (0.0%) |
| 12 to 14 Years | 0 (0.0%) | 0 (0.0%) |
| 15 Years | 4 (100.0%) | 0 (0.0%) |
| 16 and 17 Years | 0 (0.0%) | 0 (0.0%) |
| 18 to 24 Years | 9 (16.1%) | 0 (0.0%) |
| 25 to 34 Years | 0 (0.0%) | 24 (29.6%) |
| 35 to 44 Years | 23 (21.9%) | 4 (6.8%) |
| 45 to 54 Years | 8 (11.9%) | 9 (6.8%) |
| 55 to 64 Years | 11 (11.7%) | 13 (13.1%) |
| 65 to 74 Years | 0 (0.0%) | 3 (7.5%) |
| 75 Years and over | 3 (8.6%) | 14 (26.4%) |
| Total | 72 (12.2%) | 67 (10.0%) |
Income Above Poverty by Sex and Age in West Mayfield borough
According to the poverty statistics in West Mayfield borough, males aged 6 to 11 years and females aged under 5 years are the age groups that are most secure financially, with 100.0% of males and 100.0% of females in these age groups living above the poverty line.
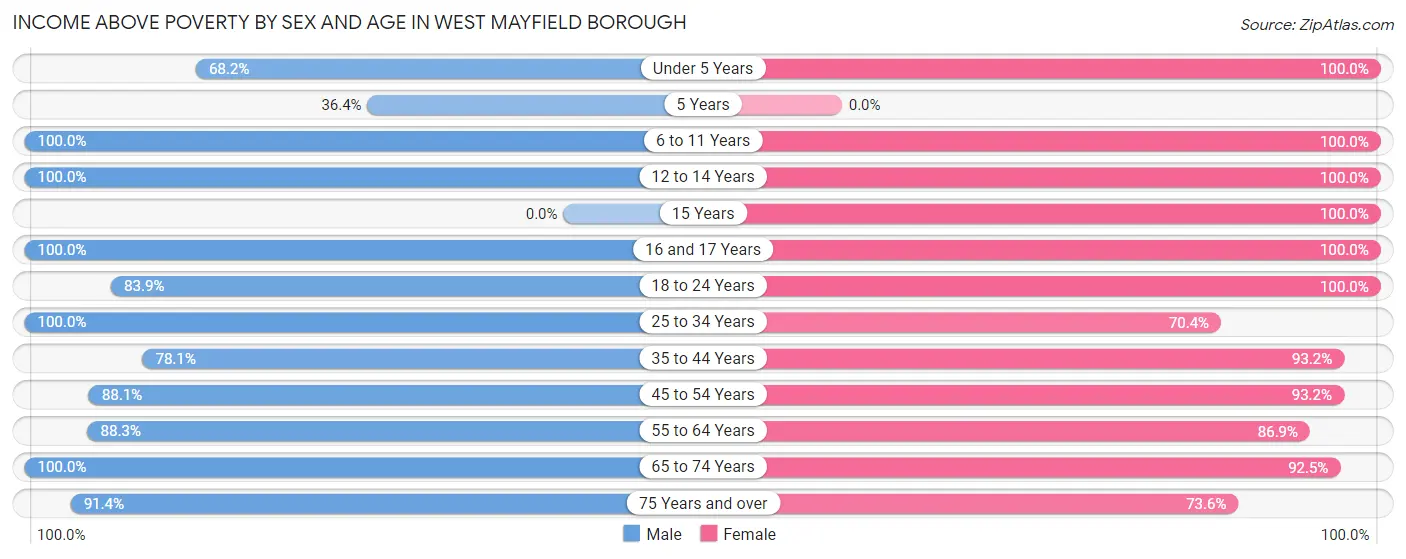
| Age Bracket | Male | Female |
| Under 5 Years | 15 (68.2%) | 27 (100.0%) |
| 5 Years | 4 (36.4%) | 0 (0.0%) |
| 6 to 11 Years | 27 (100.0%) | 37 (100.0%) |
| 12 to 14 Years | 19 (100.0%) | 8 (100.0%) |
| 15 Years | 0 (0.0%) | 13 (100.0%) |
| 16 and 17 Years | 7 (100.0%) | 62 (100.0%) |
| 18 to 24 Years | 47 (83.9%) | 62 (100.0%) |
| 25 to 34 Years | 74 (100.0%) | 57 (70.4%) |
| 35 to 44 Years | 82 (78.1%) | 55 (93.2%) |
| 45 to 54 Years | 59 (88.1%) | 123 (93.2%) |
| 55 to 64 Years | 83 (88.3%) | 86 (86.9%) |
| 65 to 74 Years | 69 (100.0%) | 37 (92.5%) |
| 75 Years and over | 32 (91.4%) | 39 (73.6%) |
| Total | 518 (87.8%) | 606 (90.0%) |
Income Below Poverty Among Married-Couple Families in West Mayfield borough
The poverty statistics for married-couple families in West Mayfield borough show that 9.6% or 19 of the total 199 families live below the poverty line. Families with no children have the highest poverty rate of 12.2%, comprising of 15 families. On the other hand, families with 3 or 4 children have the lowest poverty rate of 0.0%, which includes 0 families.
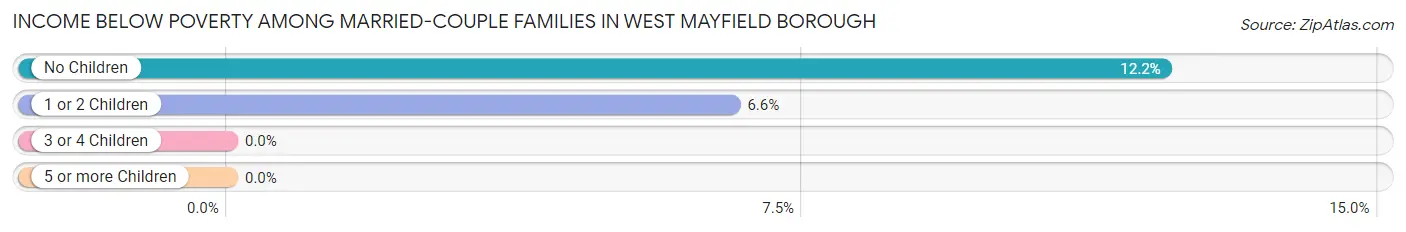
| Children | Above Poverty | Below Poverty |
| No Children | 108 (87.8%) | 15 (12.2%) |
| 1 or 2 Children | 57 (93.4%) | 4 (6.6%) |
| 3 or 4 Children | 15 (100.0%) | 0 (0.0%) |
| 5 or more Children | 0 (0.0%) | 0 (0.0%) |
| Total | 180 (90.4%) | 19 (9.6%) |
Income Below Poverty Among Single-Parent Households in West Mayfield borough
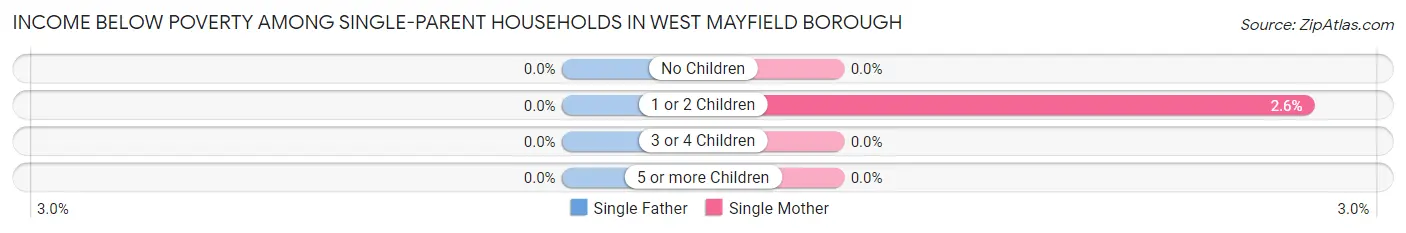
| Children | Single Father | Single Mother |
| No Children | 0 (0.0%) | 0 (0.0%) |
| 1 or 2 Children | 0 (0.0%) | 2 (2.6%) |
| 3 or 4 Children | 0 (0.0%) | 0 (0.0%) |
| 5 or more Children | 0 (0.0%) | 0 (0.0%) |
| Total | 0 (0.0%) | 2 (1.9%) |
Income Below Poverty Among Married-Couple vs Single-Parent Households in West Mayfield borough
The poverty data for West Mayfield borough shows that 19 of the married-couple family households (9.6%) and 2 of the single-parent households (1.4%) are living below the poverty level. Within the married-couple family households, those with no children have the highest poverty rate, with 15 households (12.2%) falling below the poverty line. Among the single-parent households, those with 1 or 2 children have the highest poverty rate, with 2 household (2.4%) living below poverty.
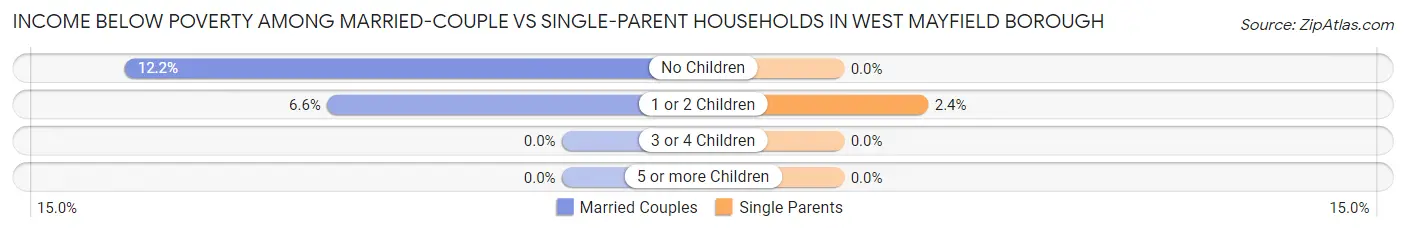
| Children | Married-Couple Families | Single-Parent Households |
| No Children | 15 (12.2%) | 0 (0.0%) |
| 1 or 2 Children | 4 (6.6%) | 2 (2.4%) |
| 3 or 4 Children | 0 (0.0%) | 0 (0.0%) |
| 5 or more Children | 0 (0.0%) | 0 (0.0%) |
| Total | 19 (9.6%) | 2 (1.4%) |
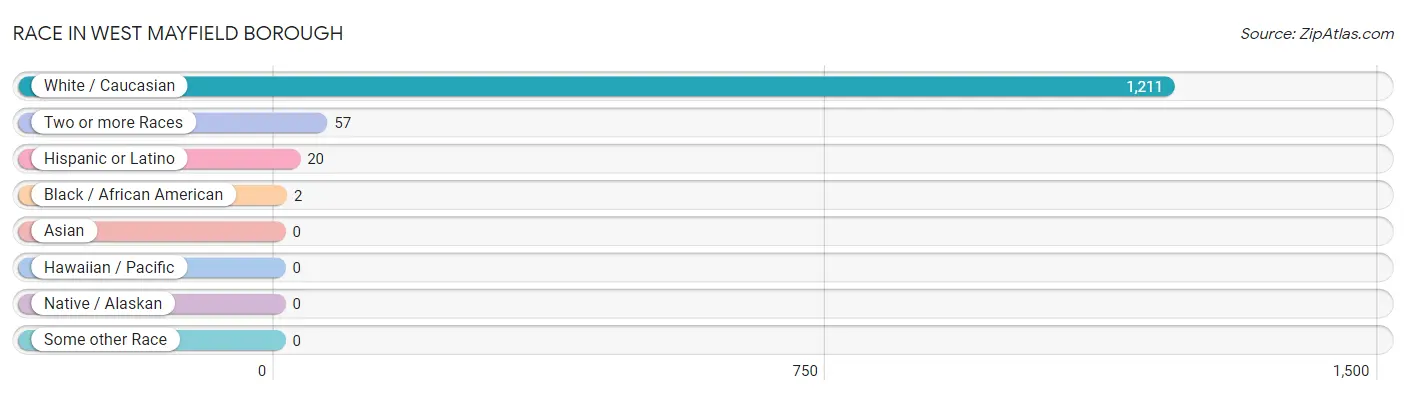
Race in West Mayfield borough
The most populous races in West Mayfield borough are White / Caucasian (1,211 | 95.4%), Two or more Races (57 | 4.5%), and Hispanic or Latino (20 | 1.6%).
| Race | # Population | % Population |
| Asian | 0 | 0.0% |
| Black / African American | 2 | 0.2% |
| Hawaiian / Pacific | 0 | 0.0% |
| Hispanic or Latino | 20 | 1.6% |
| Native / Alaskan | 0 | 0.0% |
| White / Caucasian | 1,211 | 95.4% |
| Two or more Races | 57 | 4.5% |
| Some other Race | 0 | 0.0% |
| Total | 1,270 | 100.0% |
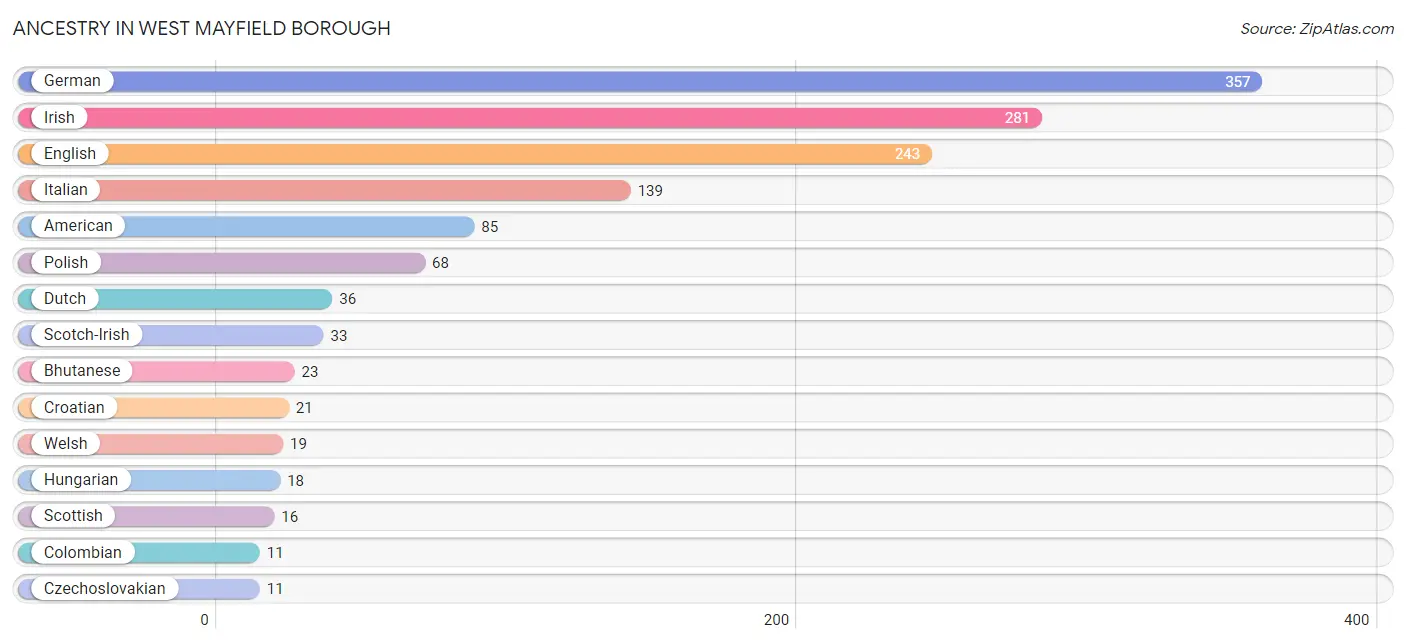
Ancestry in West Mayfield borough
The most populous ancestries reported in West Mayfield borough are German (357 | 28.1%), Irish (281 | 22.1%), English (243 | 19.1%), Italian (139 | 10.9%), and American (85 | 6.7%), together accounting for 87.0% of all West Mayfield borough residents.
| Ancestry | # Population | % Population |
| American | 85 | 6.7% |
| Austrian | 3 | 0.2% |
| Bhutanese | 23 | 1.8% |
| British | 7 | 0.5% |
| Canadian | 5 | 0.4% |
| Colombian | 11 | 0.9% |
| Croatian | 21 | 1.7% |
| Czech | 8 | 0.6% |
| Czechoslovakian | 11 | 0.9% |
| Dutch | 36 | 2.8% |
| Eastern European | 5 | 0.4% |
| English | 243 | 19.1% |
| European | 7 | 0.5% |
| French | 4 | 0.3% |
| German | 357 | 28.1% |
| Hungarian | 18 | 1.4% |
| Irish | 281 | 22.1% |
| Italian | 139 | 10.9% |
| Norwegian | 8 | 0.6% |
| Pennsylvania German | 3 | 0.2% |
| Polish | 68 | 5.3% |
| Puerto Rican | 9 | 0.7% |
| Romanian | 4 | 0.3% |
| Scotch-Irish | 33 | 2.6% |
| Scottish | 16 | 1.3% |
| Slovak | 8 | 0.6% |
| South American | 11 | 0.9% |
| Swedish | 4 | 0.3% |
| Turkish | 2 | 0.2% |
| Ukrainian | 4 | 0.3% |
| Welsh | 19 | 1.5% | View All 31 Rows |
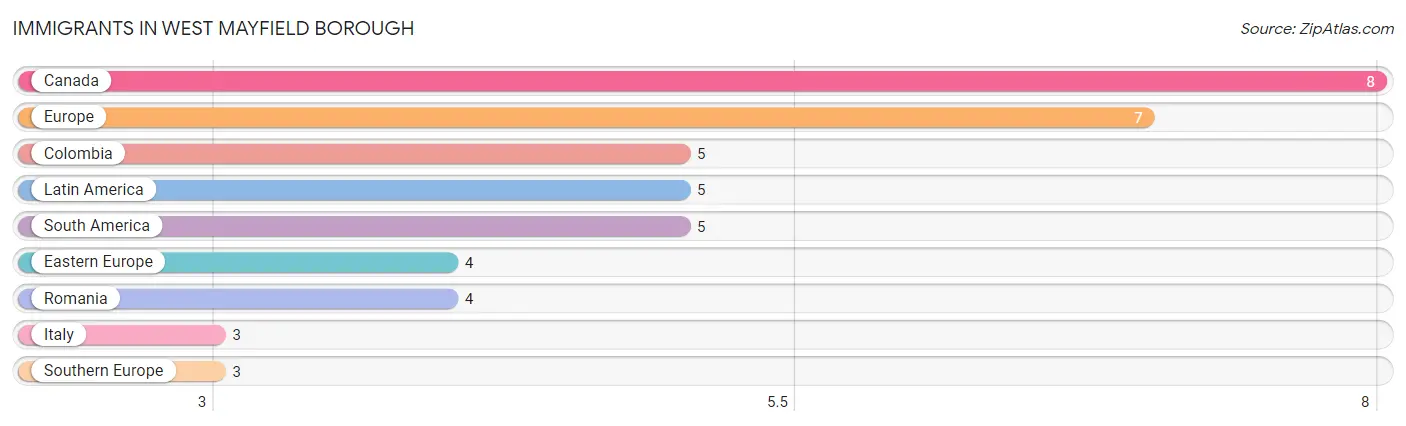
Immigrants in West Mayfield borough
The most numerous immigrant groups reported in West Mayfield borough came from Canada (8 | 0.6%), Europe (7 | 0.5%), Colombia (5 | 0.4%), Latin America (5 | 0.4%), and South America (5 | 0.4%), together accounting for 2.4% of all West Mayfield borough residents.
| Immigration Origin | # Population | % Population |
| Canada | 8 | 0.6% |
| Colombia | 5 | 0.4% |
| Eastern Europe | 4 | 0.3% |
| Europe | 7 | 0.5% |
| Italy | 3 | 0.2% |
| Latin America | 5 | 0.4% |
| Romania | 4 | 0.3% |
| South America | 5 | 0.4% |
| Southern Europe | 3 | 0.2% | View All 9 Rows |
Sex and Age in West Mayfield borough
Sex and Age in West Mayfield borough
The most populous age groups in West Mayfield borough are 55 to 59 Years (72 | 12.1%) for men and 45 to 49 Years (109 | 16.2%) for women.
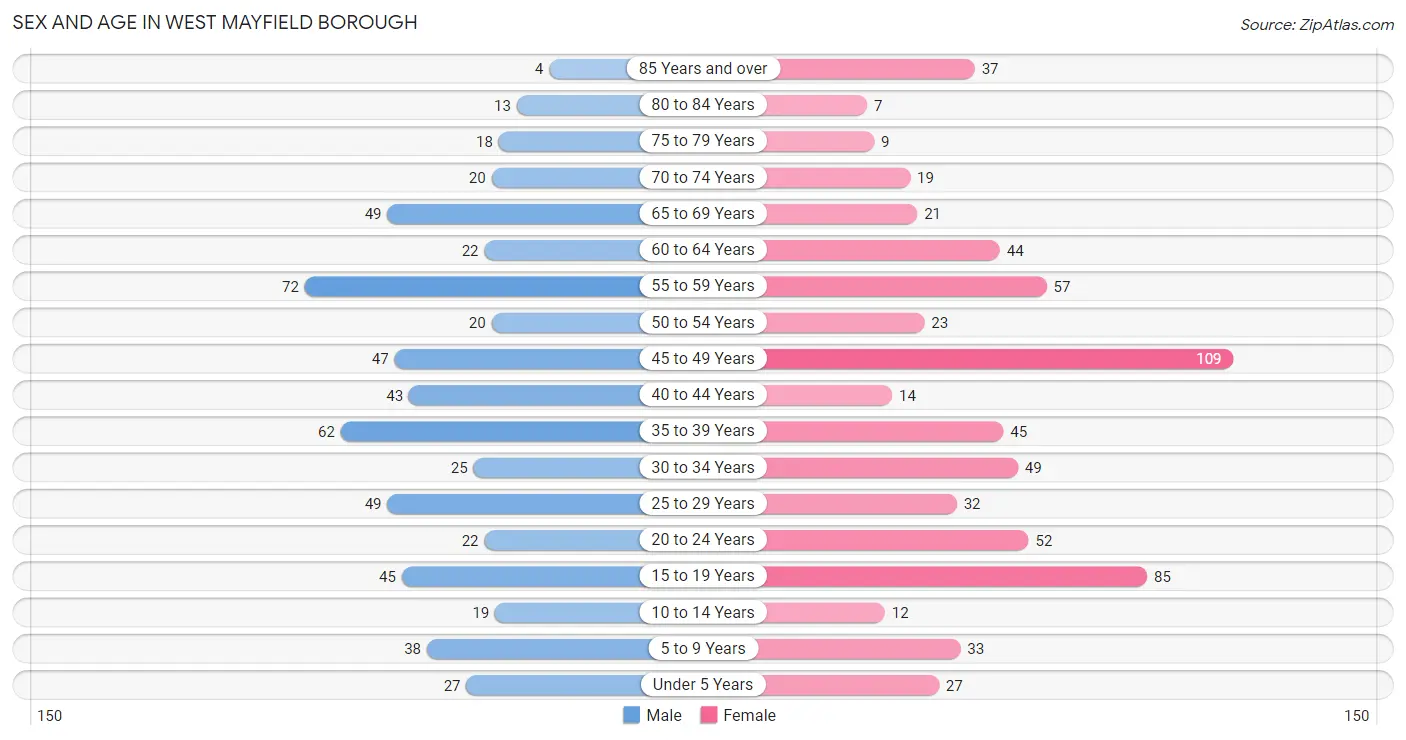
| Age Bracket | Male | Female |
| Under 5 Years | 27 (4.5%) | 27 (4.0%) |
| 5 to 9 Years | 38 (6.4%) | 33 (4.9%) |
| 10 to 14 Years | 19 (3.2%) | 12 (1.8%) |
| 15 to 19 Years | 45 (7.6%) | 85 (12.6%) |
| 20 to 24 Years | 22 (3.7%) | 52 (7.7%) |
| 25 to 29 Years | 49 (8.2%) | 32 (4.7%) |
| 30 to 34 Years | 25 (4.2%) | 49 (7.3%) |
| 35 to 39 Years | 62 (10.4%) | 45 (6.7%) |
| 40 to 44 Years | 43 (7.2%) | 14 (2.1%) |
| 45 to 49 Years | 47 (7.9%) | 109 (16.2%) |
| 50 to 54 Years | 20 (3.4%) | 23 (3.4%) |
| 55 to 59 Years | 72 (12.1%) | 57 (8.4%) |
| 60 to 64 Years | 22 (3.7%) | 44 (6.5%) |
| 65 to 69 Years | 49 (8.2%) | 21 (3.1%) |
| 70 to 74 Years | 20 (3.4%) | 19 (2.8%) |
| 75 to 79 Years | 18 (3.0%) | 9 (1.3%) |
| 80 to 84 Years | 13 (2.2%) | 7 (1.0%) |
| 85 Years and over | 4 (0.7%) | 37 (5.5%) |
| Total | 595 (100.0%) | 675 (100.0%) |
Families and Households in West Mayfield borough
Median Family Size in West Mayfield borough
The median family size in West Mayfield borough is 2.82 persons per family, with married-couple families (199 | 57.5%) accounting for the largest median family size of 2.87 persons per family. On the other hand, single male/father families (43 | 12.4%) represent the smallest median family size with 2.56 persons per family.
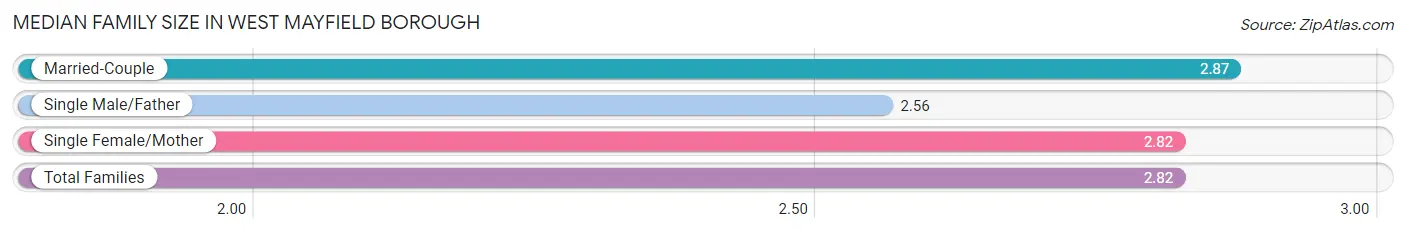
| Family Type | # Families | Family Size |
| Married-Couple | 199 (57.5%) | 2.87 |
| Single Male/Father | 43 (12.4%) | 2.56 |
| Single Female/Mother | 104 (30.1%) | 2.82 |
| Total Families | 346 (100.0%) | 2.82 |
Median Household Size in West Mayfield borough
The median household size in West Mayfield borough is 2.23 persons per household, with single male/father households (43 | 7.6%) accounting for the largest median household size of 3 persons per household. non-family households (223 | 39.2%) represent the smallest median household size with 1.22 persons per household.
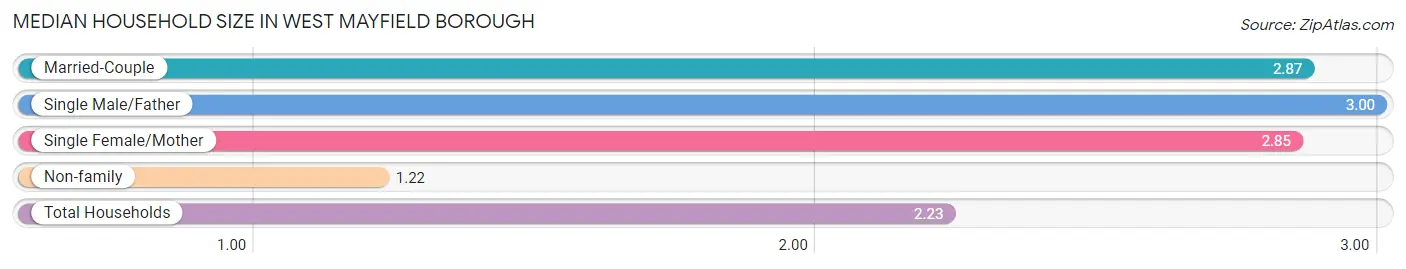
| Household Type | # Households | Household Size |
| Married-Couple | 199 (35.0%) | 2.87 |
| Single Male/Father | 43 (7.6%) | 3.00 |
| Single Female/Mother | 104 (18.3%) | 2.85 |
| Non-family | 223 (39.2%) | 1.22 |
| Total Households | 569 (100.0%) | 2.23 |
Household Size by Marriage Status in West Mayfield borough
Out of a total of 569 households in West Mayfield borough, 346 (60.8%) are family households, while 223 (39.2%) are nonfamily households. The most numerous type of family households are 2-person households, comprising 128, and the most common type of nonfamily households are 1-person households, comprising 187.
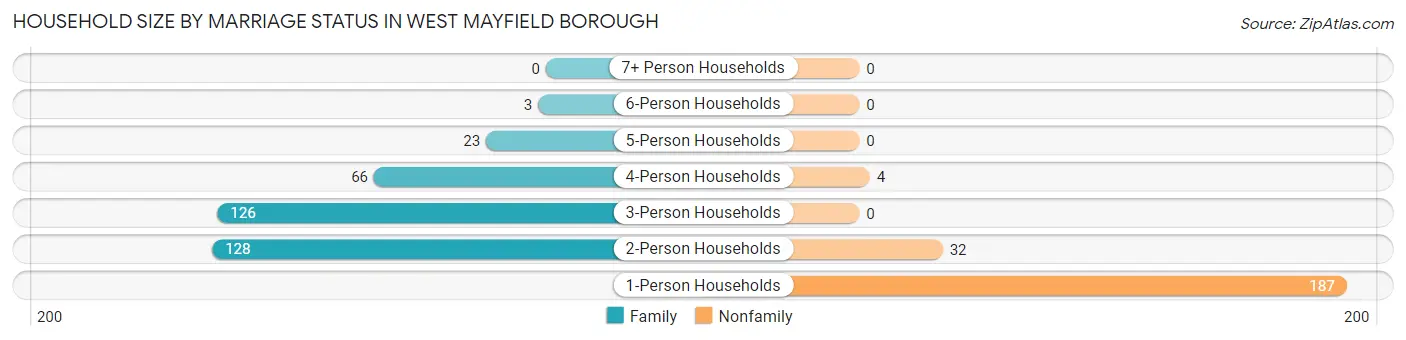
| Household Size | Family Households | Nonfamily Households |
| 1-Person Households | - | 187 (32.9%) |
| 2-Person Households | 128 (22.5%) | 32 (5.6%) |
| 3-Person Households | 126 (22.1%) | 0 (0.0%) |
| 4-Person Households | 66 (11.6%) | 4 (0.7%) |
| 5-Person Households | 23 (4.0%) | 0 (0.0%) |
| 6-Person Households | 3 (0.5%) | 0 (0.0%) |
| 7+ Person Households | 0 (0.0%) | 0 (0.0%) |
| Total | 346 (60.8%) | 223 (39.2%) |
Female Fertility in West Mayfield borough
Fertility by Age in West Mayfield borough
Average fertility rate in West Mayfield borough is 5.0 births per 1,000 women. Women in the age bracket of 20 to 34 years have the highest fertility rate with 15.0 births per 1,000 women. Women in the age bracket of 20 to 34 years acount for 100.0% of all women with births.
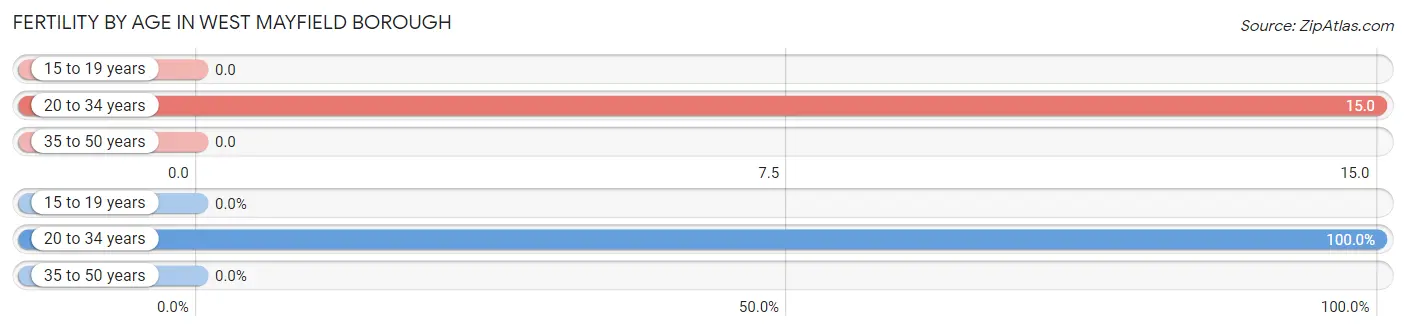
| Age Bracket | Women with Births | Births / 1,000 Women |
| 15 to 19 years | 0 (0.0%) | 0.0 |
| 20 to 34 years | 2 (100.0%) | 15.0 |
| 35 to 50 years | 0 (0.0%) | 0.0 |
| Total | 2 (100.0%) | 5.0 |
Fertility by Age by Marriage Status in West Mayfield borough
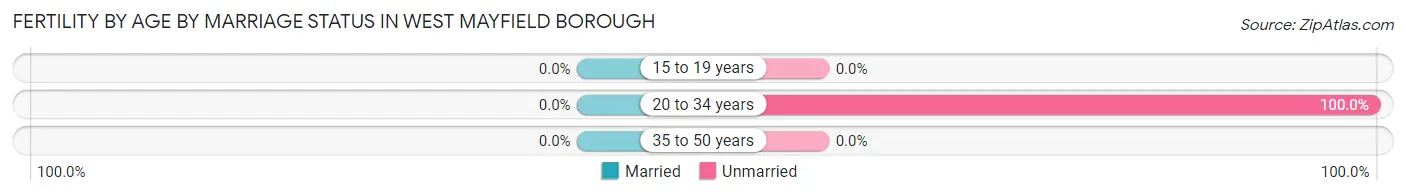
| Age Bracket | Married | Unmarried |
| 15 to 19 years | 0 (0.0%) | 0 (0.0%) |
| 20 to 34 years | 0 (0.0%) | 2 (100.0%) |
| 35 to 50 years | 0 (0.0%) | 0 (0.0%) |
| Total | 0 (0.0%) | 2 (100.0%) |
Fertility by Education in West Mayfield borough
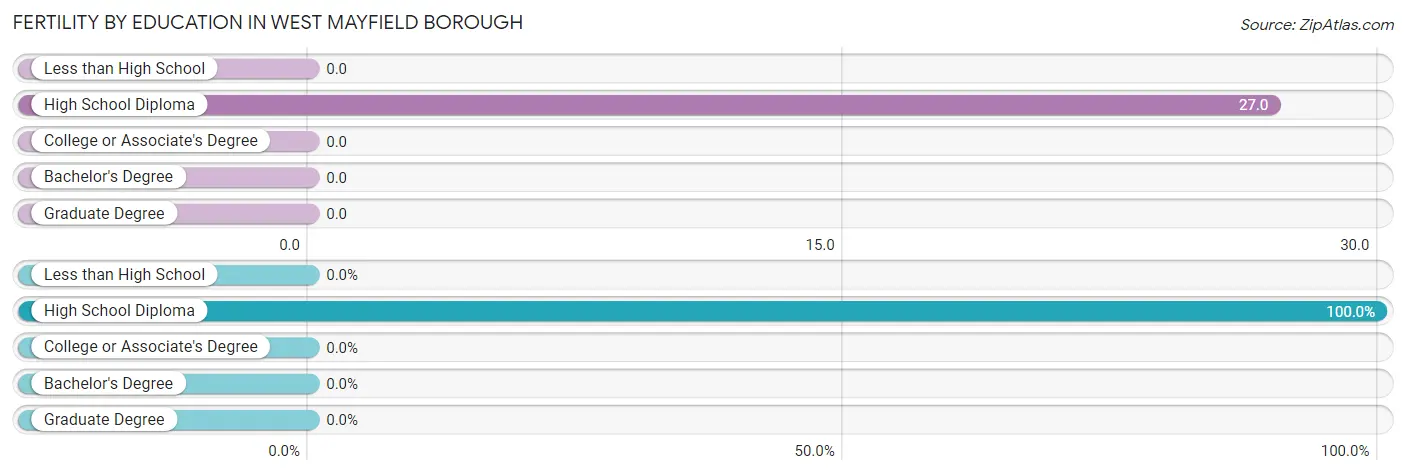
| Educational Attainment | Women with Births | Births / 1,000 Women |
| Less than High School | 0 (0.0%) | 0.0 |
| High School Diploma | 2 (100.0%) | 27.0 |
| College or Associate's Degree | 0 (0.0%) | 0.0 |
| Bachelor's Degree | 0 (0.0%) | 0.0 |
| Graduate Degree | 0 (0.0%) | 0.0 |
| Total | 2 (100.0%) | 5.0 |
Fertility by Education by Marriage Status in West Mayfield borough
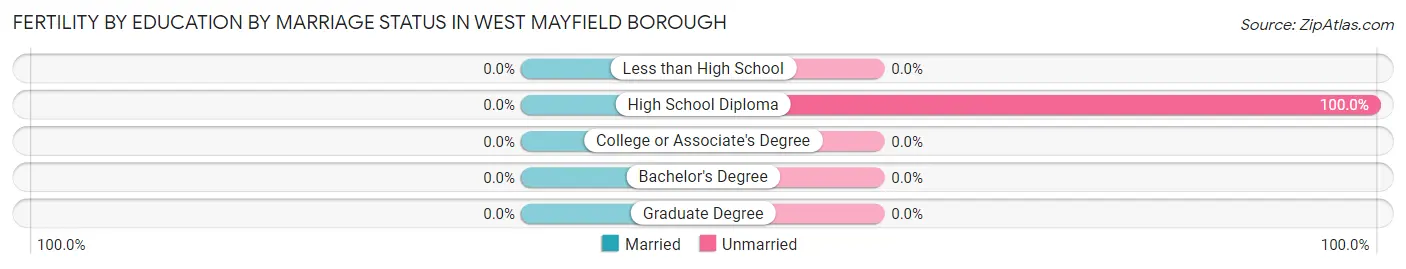
| Educational Attainment | Married | Unmarried |
| Less than High School | 0 (0.0%) | 0 (0.0%) |
| High School Diploma | 0 (0.0%) | 2 (100.0%) |
| College or Associate's Degree | 0 (0.0%) | 0 (0.0%) |
| Bachelor's Degree | 0 (0.0%) | 0 (0.0%) |
| Graduate Degree | 0 (0.0%) | 0 (0.0%) |
| Total | 0 (0.0%) | 2 (100.0%) |
Employment Characteristics in West Mayfield borough
Employment by Class of Employer in West Mayfield borough
Among the 604 employed individuals in West Mayfield borough, private company employees (460 | 76.2%), not-for-profit organizations (56 | 9.3%), and self-employed (not incorporated) (50 | 8.3%) make up the most common classes of employment.
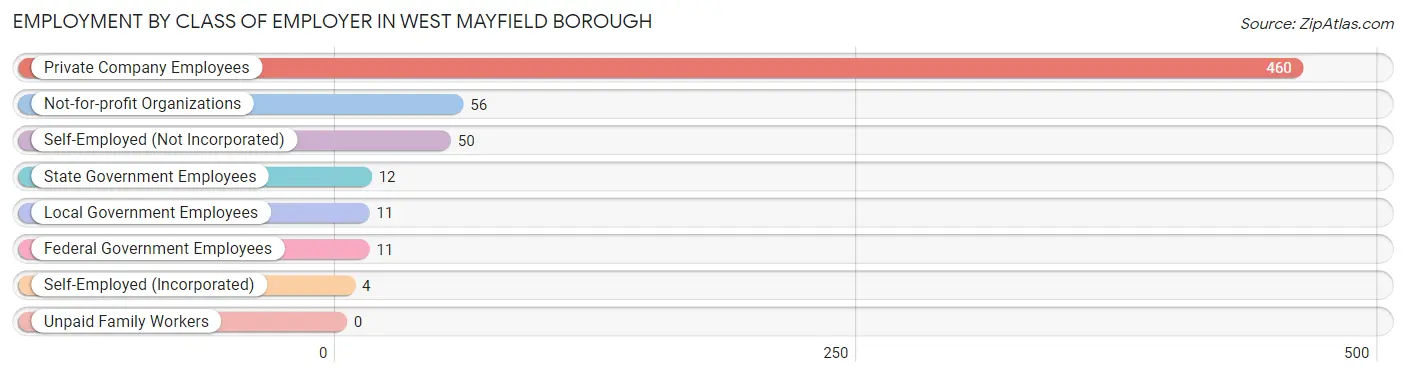
| Employer Class | # Employees | % Employees |
| Private Company Employees | 460 | 76.2% |
| Self-Employed (Incorporated) | 4 | 0.7% |
| Self-Employed (Not Incorporated) | 50 | 8.3% |
| Not-for-profit Organizations | 56 | 9.3% |
| Local Government Employees | 11 | 1.8% |
| State Government Employees | 12 | 2.0% |
| Federal Government Employees | 11 | 1.8% |
| Unpaid Family Workers | 0 | 0.0% |
| Total | 604 | 100.0% |
Employment Status by Age in West Mayfield borough
According to the labor force statistics for West Mayfield borough, out of the total population over 16 years of age (1,097), 62.7% or 688 individuals are in the labor force, with 8.9% or 61 of them unemployed. The age group with the highest labor force participation rate is 25 to 29 years, with 91.4% or 74 individuals in the labor force. Within the labor force, the 25 to 29 years age range has the highest percentage of unemployed individuals, with 20.3% or 15 of them being unemployed.
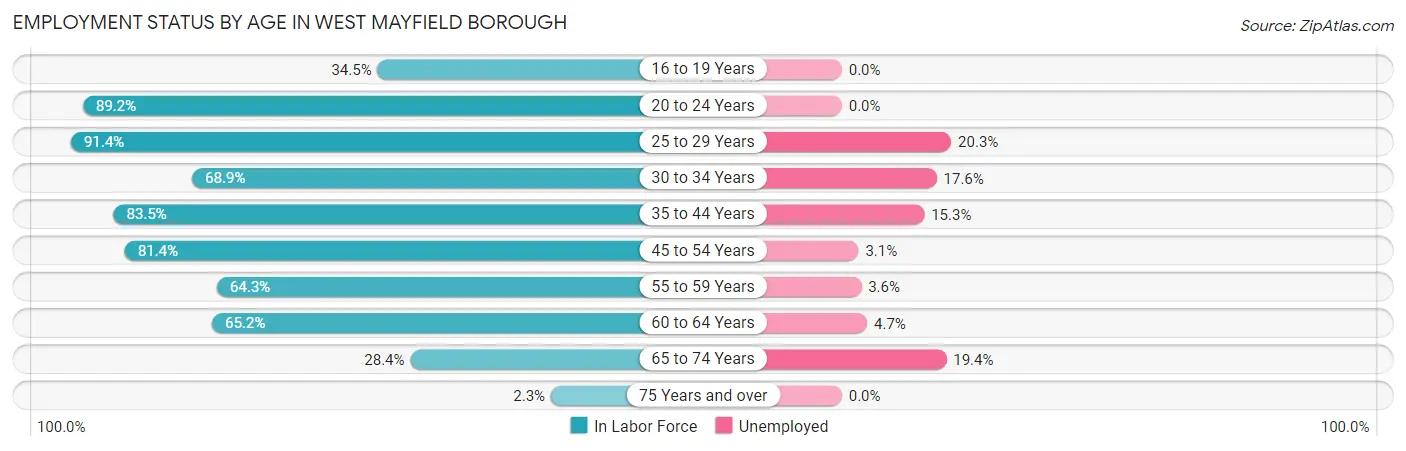
| Age Bracket | In Labor Force | Unemployed |
| 16 to 19 Years | 39 (34.5%) | 0 (0.0%) |
| 20 to 24 Years | 66 (89.2%) | 0 (0.0%) |
| 25 to 29 Years | 74 (91.4%) | 15 (20.3%) |
| 30 to 34 Years | 51 (68.9%) | 9 (17.6%) |
| 35 to 44 Years | 137 (83.5%) | 21 (15.3%) |
| 45 to 54 Years | 162 (81.4%) | 5 (3.1%) |
| 55 to 59 Years | 83 (64.3%) | 3 (3.6%) |
| 60 to 64 Years | 43 (65.2%) | 2 (4.7%) |
| 65 to 74 Years | 31 (28.4%) | 6 (19.4%) |
| 75 Years and over | 2 (2.3%) | 0 (0.0%) |
| Total | 688 (62.7%) | 61 (8.9%) |
Employment Status by Educational Attainment in West Mayfield borough
According to labor force statistics for West Mayfield borough, 77.1% of individuals (550) out of the total population between 25 and 64 years of age (713) are in the labor force, with 10.0% or 55 of them being unemployed. The group with the highest labor force participation rate are those with the educational attainment of less than high school, with 94.7% or 72 individuals in the labor force. Within the labor force, individuals with less than high school education have the highest percentage of unemployment, with 27.8% or 20 of them being unemployed.
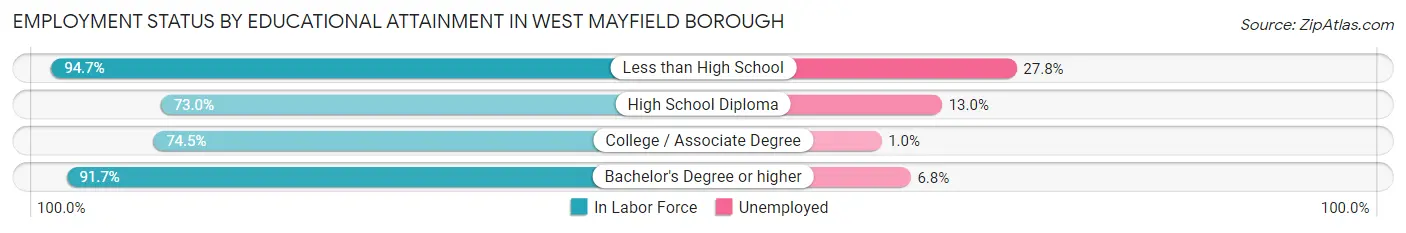
| Educational Attainment | In Labor Force | Unemployed |
| Less than High School | 72 (94.7%) | 21 (27.8%) |
| High School Diploma | 230 (73.0%) | 41 (13.0%) |
| College / Associate Degree | 204 (74.5%) | 3 (1.0%) |
| Bachelor's Degree or higher | 44 (91.7%) | 3 (6.8%) |
| Total | 550 (77.1%) | 71 (10.0%) |
Employment Occupations by Sex in West Mayfield borough
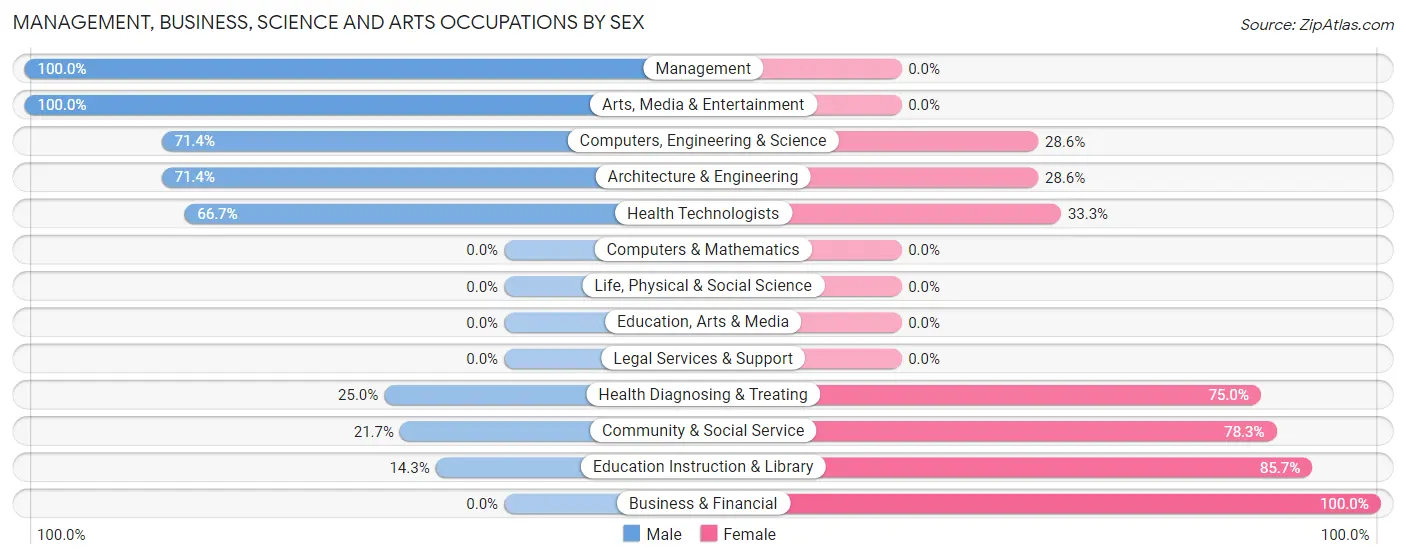
Management, Business, Science and Arts Occupations
The most common Management, Business, Science and Arts occupations in West Mayfield borough are Health Diagnosing & Treating (24 | 3.8%), Community & Social Service (23 | 3.7%), Education Instruction & Library (21 | 3.4%), Management (18 | 2.9%), and Computers, Engineering & Science (14 | 2.2%).
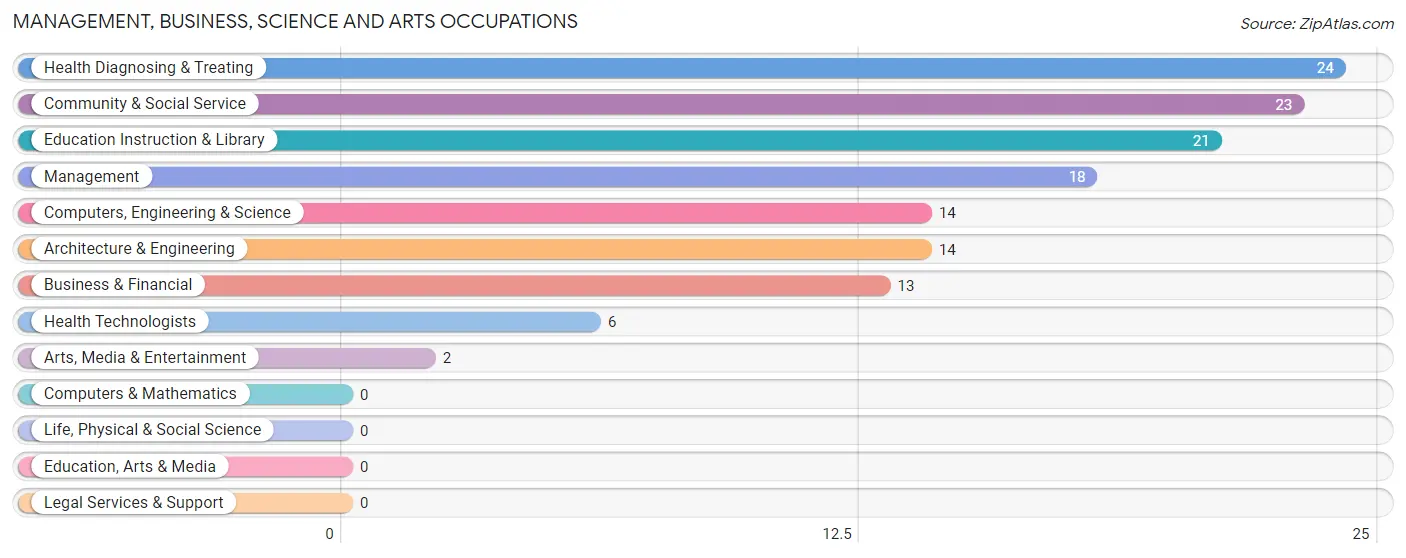
Management, Business, Science and Arts Occupations by Sex
Within the Management, Business, Science and Arts occupations in West Mayfield borough, the most male-oriented occupations are Management (100.0%), Arts, Media & Entertainment (100.0%), and Computers, Engineering & Science (71.4%), while the most female-oriented occupations are Business & Financial (100.0%), Education Instruction & Library (85.7%), and Community & Social Service (78.3%).
| Occupation | Male | Female |
| Management | 18 (100.0%) | 0 (0.0%) |
| Business & Financial | 0 (0.0%) | 13 (100.0%) |
| Computers, Engineering & Science | 10 (71.4%) | 4 (28.6%) |
| Computers & Mathematics | 0 (0.0%) | 0 (0.0%) |
| Architecture & Engineering | 10 (71.4%) | 4 (28.6%) |
| Life, Physical & Social Science | 0 (0.0%) | 0 (0.0%) |
| Community & Social Service | 5 (21.7%) | 18 (78.3%) |
| Education, Arts & Media | 0 (0.0%) | 0 (0.0%) |
| Legal Services & Support | 0 (0.0%) | 0 (0.0%) |
| Education Instruction & Library | 3 (14.3%) | 18 (85.7%) |
| Arts, Media & Entertainment | 2 (100.0%) | 0 (0.0%) |
| Health Diagnosing & Treating | 6 (25.0%) | 18 (75.0%) |
| Health Technologists | 4 (66.7%) | 2 (33.3%) |
| Total (Category) | 39 (42.4%) | 53 (57.6%) |
| Total (Overall) | 316 (50.4%) | 311 (49.6%) |
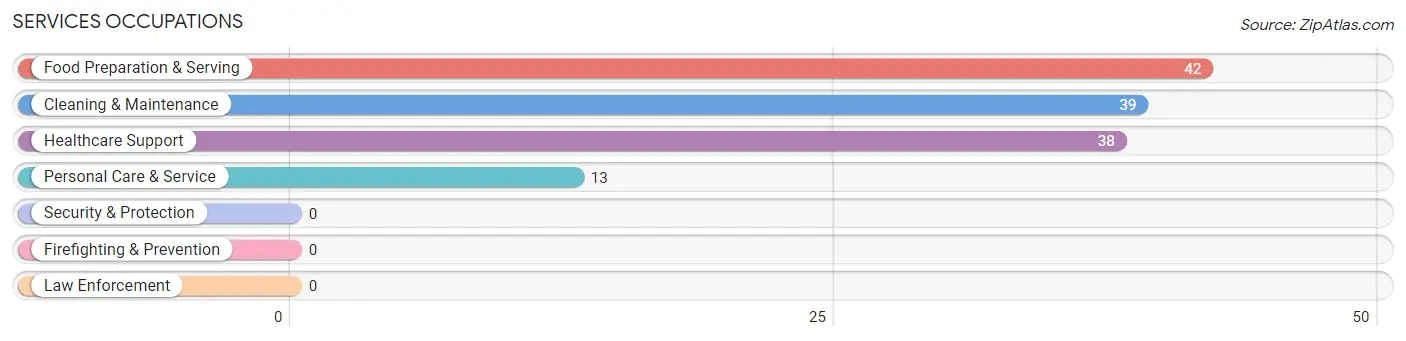
Services Occupations
The most common Services occupations in West Mayfield borough are Food Preparation & Serving (42 | 6.7%), Cleaning & Maintenance (39 | 6.2%), Healthcare Support (38 | 6.1%), and Personal Care & Service (13 | 2.1%).
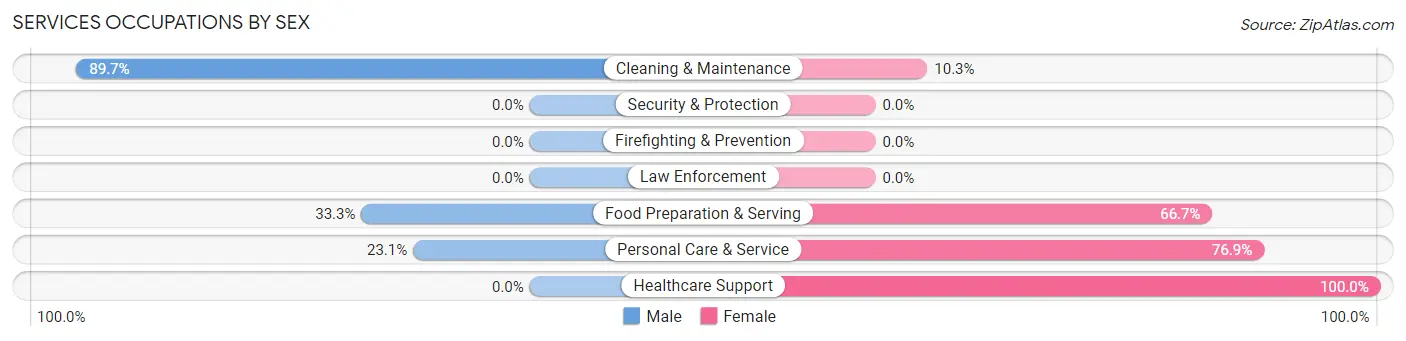
Services Occupations by Sex
Within the Services occupations in West Mayfield borough, the most male-oriented occupations are Cleaning & Maintenance (89.7%), Food Preparation & Serving (33.3%), and Personal Care & Service (23.1%), while the most female-oriented occupations are Healthcare Support (100.0%), Personal Care & Service (76.9%), and Food Preparation & Serving (66.7%).
| Occupation | Male | Female |
| Healthcare Support | 0 (0.0%) | 38 (100.0%) |
| Security & Protection | 0 (0.0%) | 0 (0.0%) |
| Firefighting & Prevention | 0 (0.0%) | 0 (0.0%) |
| Law Enforcement | 0 (0.0%) | 0 (0.0%) |
| Food Preparation & Serving | 14 (33.3%) | 28 (66.7%) |
| Cleaning & Maintenance | 35 (89.7%) | 4 (10.3%) |
| Personal Care & Service | 3 (23.1%) | 10 (76.9%) |
| Total (Category) | 52 (39.4%) | 80 (60.6%) |
| Total (Overall) | 316 (50.4%) | 311 (49.6%) |
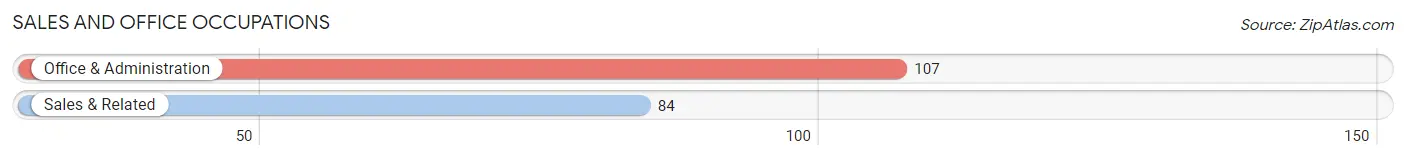
Sales and Office Occupations
The most common Sales and Office occupations in West Mayfield borough are Office & Administration (107 | 17.1%), and Sales & Related (84 | 13.4%).
Sales and Office Occupations by Sex
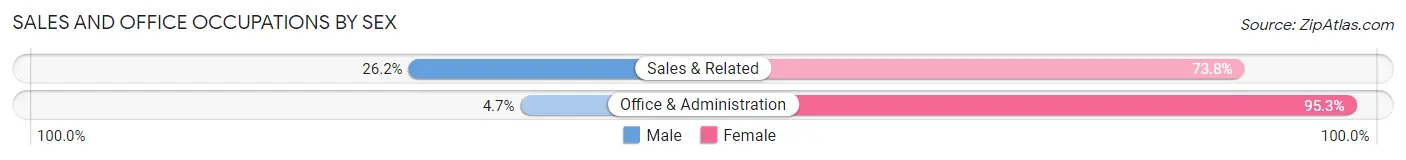
| Occupation | Male | Female |
| Sales & Related | 22 (26.2%) | 62 (73.8%) |
| Office & Administration | 5 (4.7%) | 102 (95.3%) |
| Total (Category) | 27 (14.1%) | 164 (85.9%) |
| Total (Overall) | 316 (50.4%) | 311 (49.6%) |
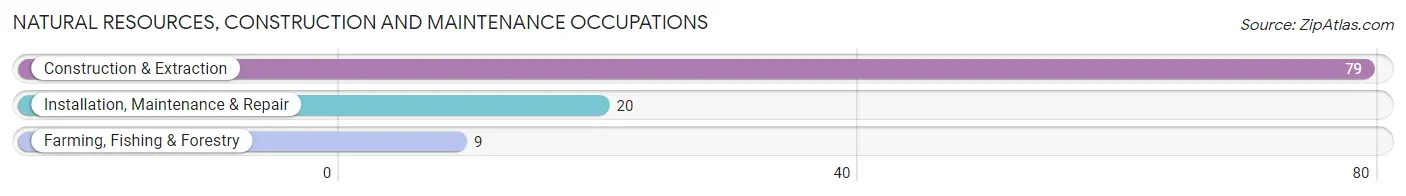
Natural Resources, Construction and Maintenance Occupations
The most common Natural Resources, Construction and Maintenance occupations in West Mayfield borough are Construction & Extraction (79 | 12.6%), Installation, Maintenance & Repair (20 | 3.2%), and Farming, Fishing & Forestry (9 | 1.4%).
Natural Resources, Construction and Maintenance Occupations by Sex
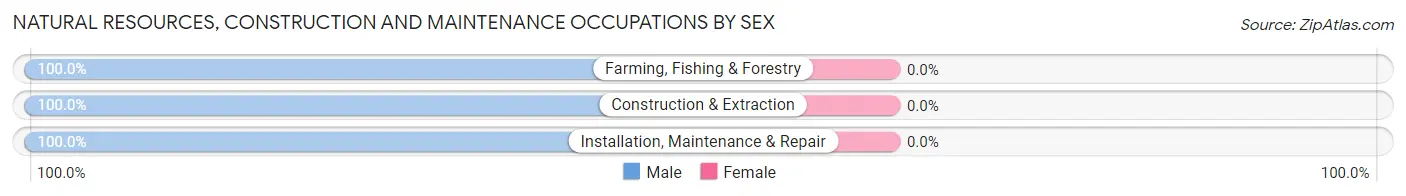
| Occupation | Male | Female |
| Farming, Fishing & Forestry | 9 (100.0%) | 0 (0.0%) |
| Construction & Extraction | 79 (100.0%) | 0 (0.0%) |
| Installation, Maintenance & Repair | 20 (100.0%) | 0 (0.0%) |
| Total (Category) | 108 (100.0%) | 0 (0.0%) |
| Total (Overall) | 316 (50.4%) | 311 (49.6%) |
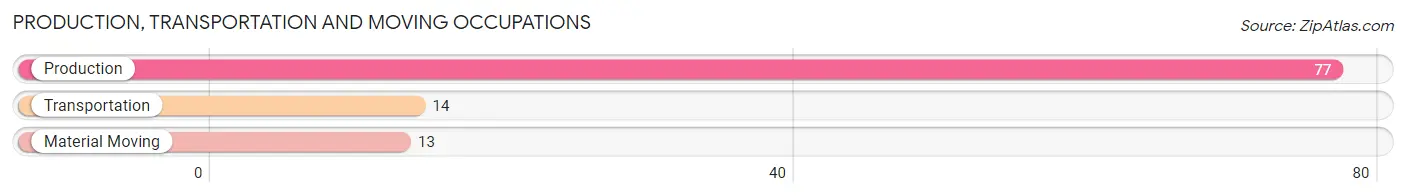
Production, Transportation and Moving Occupations
The most common Production, Transportation and Moving occupations in West Mayfield borough are Production (77 | 12.3%), Transportation (14 | 2.2%), and Material Moving (13 | 2.1%).
Production, Transportation and Moving Occupations by Sex
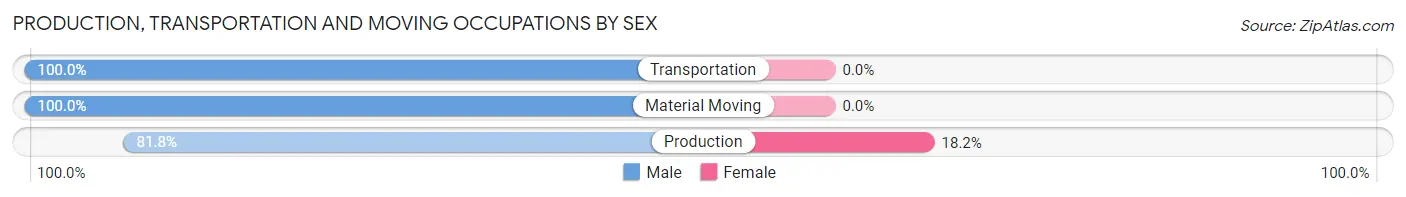
| Occupation | Male | Female |
| Production | 63 (81.8%) | 14 (18.2%) |
| Transportation | 14 (100.0%) | 0 (0.0%) |
| Material Moving | 13 (100.0%) | 0 (0.0%) |
| Total (Category) | 90 (86.5%) | 14 (13.5%) |
| Total (Overall) | 316 (50.4%) | 311 (49.6%) |
Employment Industries by Sex in West Mayfield borough
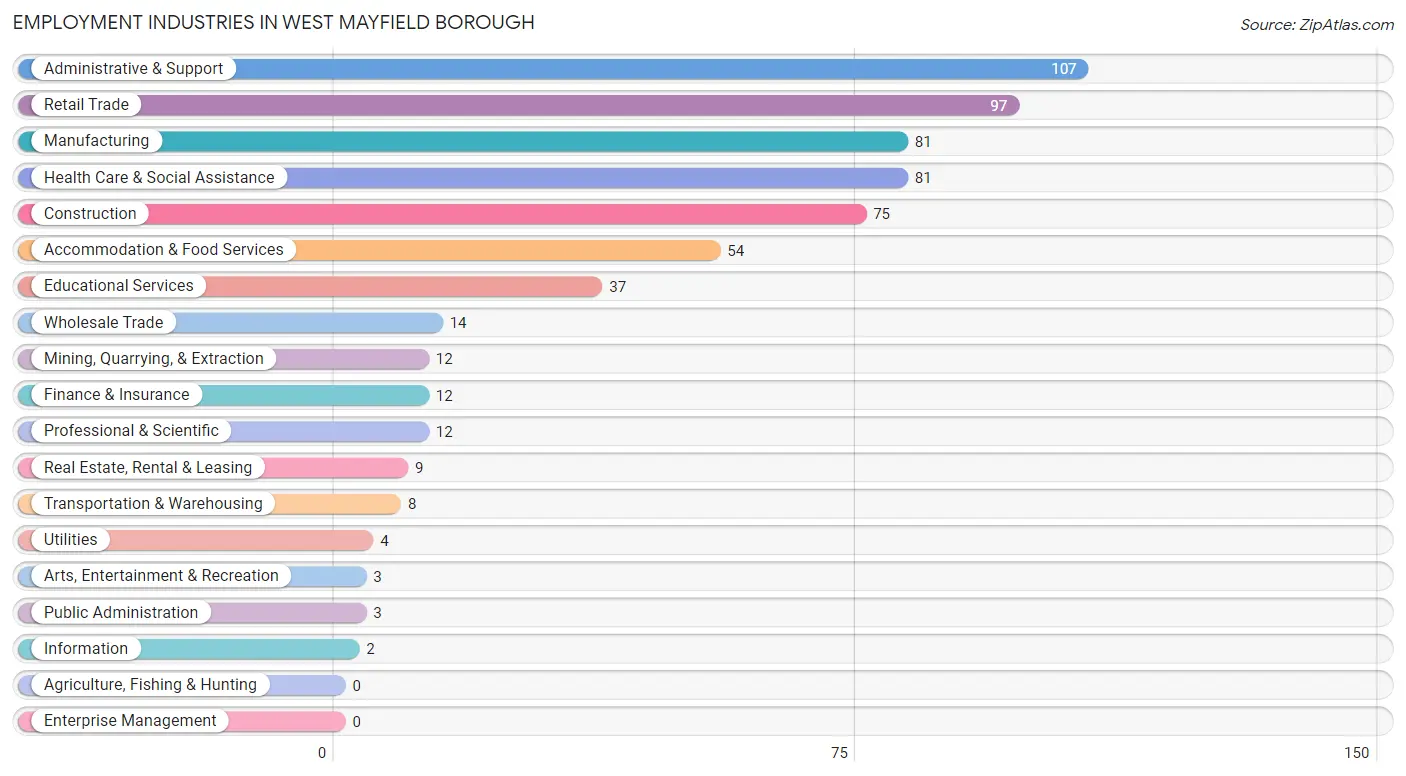
Employment Industries in West Mayfield borough
The major employment industries in West Mayfield borough include Administrative & Support (107 | 17.1%), Retail Trade (97 | 15.5%), Manufacturing (81 | 12.9%), Health Care & Social Assistance (81 | 12.9%), and Construction (75 | 12.0%).
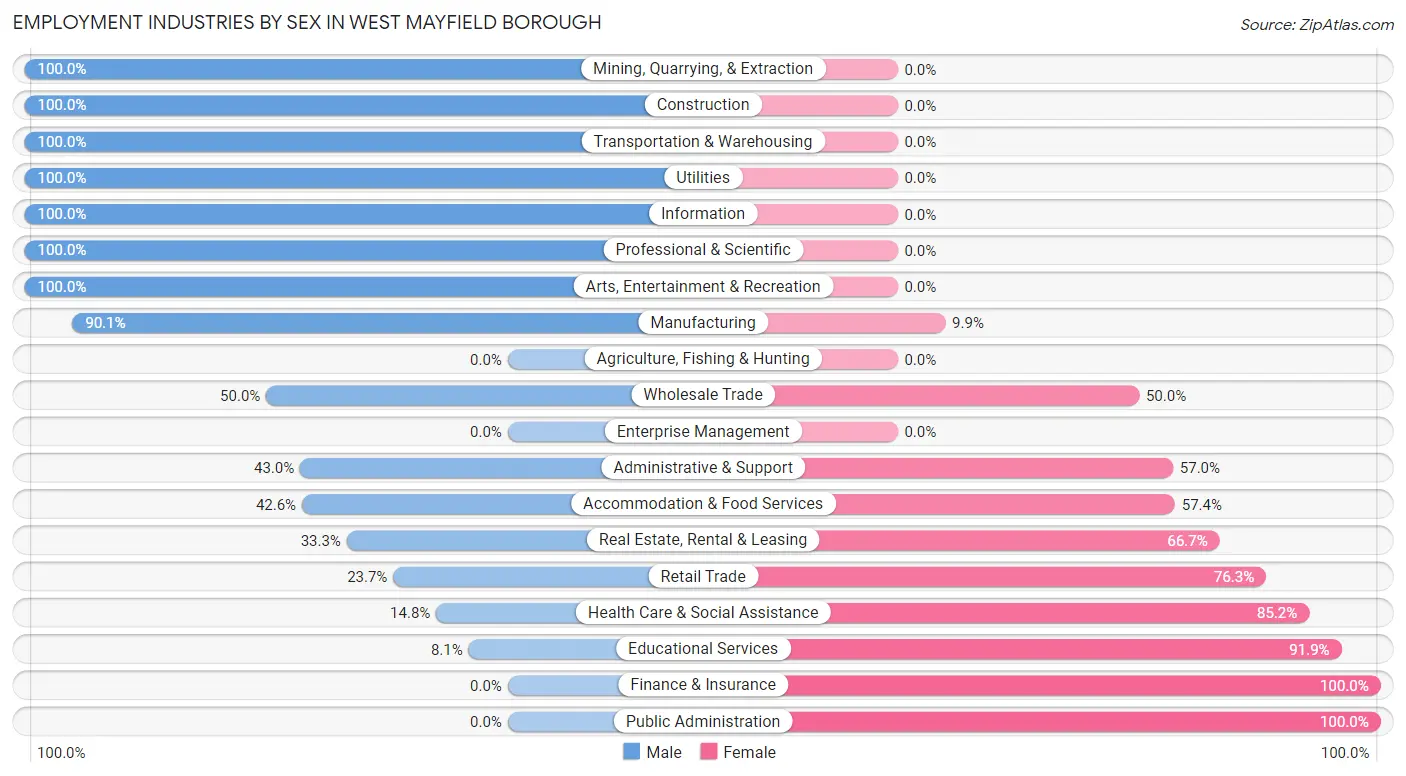
Employment Industries by Sex in West Mayfield borough
The West Mayfield borough industries that see more men than women are Mining, Quarrying, & Extraction (100.0%), Construction (100.0%), and Transportation & Warehousing (100.0%), whereas the industries that tend to have a higher number of women are Finance & Insurance (100.0%), Public Administration (100.0%), and Educational Services (91.9%).
| Industry | Male | Female |
| Agriculture, Fishing & Hunting | 0 (0.0%) | 0 (0.0%) |
| Mining, Quarrying, & Extraction | 12 (100.0%) | 0 (0.0%) |
| Construction | 75 (100.0%) | 0 (0.0%) |
| Manufacturing | 73 (90.1%) | 8 (9.9%) |
| Wholesale Trade | 7 (50.0%) | 7 (50.0%) |
| Retail Trade | 23 (23.7%) | 74 (76.3%) |
| Transportation & Warehousing | 8 (100.0%) | 0 (0.0%) |
| Utilities | 4 (100.0%) | 0 (0.0%) |
| Information | 2 (100.0%) | 0 (0.0%) |
| Finance & Insurance | 0 (0.0%) | 12 (100.0%) |
| Real Estate, Rental & Leasing | 3 (33.3%) | 6 (66.7%) |
| Professional & Scientific | 12 (100.0%) | 0 (0.0%) |
| Enterprise Management | 0 (0.0%) | 0 (0.0%) |
| Administrative & Support | 46 (43.0%) | 61 (57.0%) |
| Educational Services | 3 (8.1%) | 34 (91.9%) |
| Health Care & Social Assistance | 12 (14.8%) | 69 (85.2%) |
| Arts, Entertainment & Recreation | 3 (100.0%) | 0 (0.0%) |
| Accommodation & Food Services | 23 (42.6%) | 31 (57.4%) |
| Public Administration | 0 (0.0%) | 3 (100.0%) |
| Total | 316 (50.4%) | 311 (49.6%) |
Education in West Mayfield borough
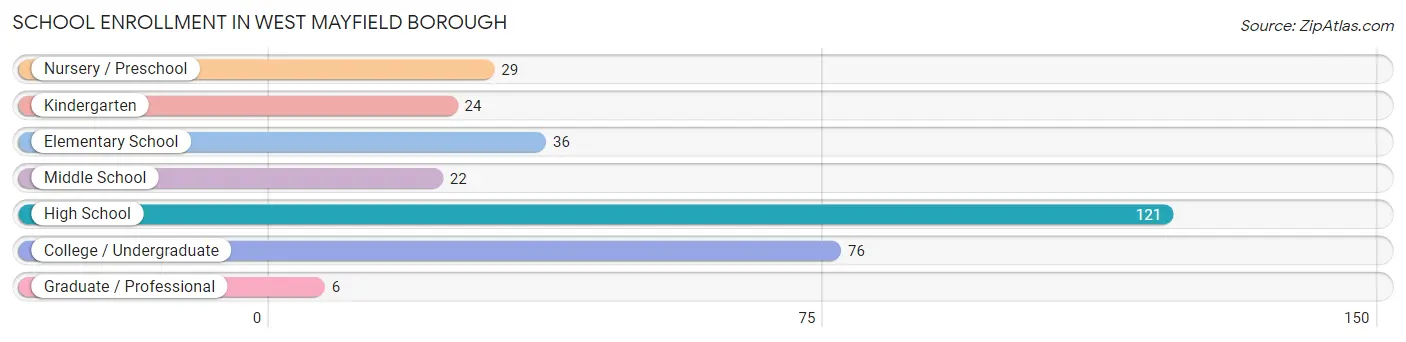
School Enrollment in West Mayfield borough
The most common levels of schooling among the 314 students in West Mayfield borough are high school (121 | 38.5%), college / undergraduate (76 | 24.2%), and elementary school (36 | 11.5%).
| School Level | # Students | % Students |
| Nursery / Preschool | 29 | 9.2% |
| Kindergarten | 24 | 7.6% |
| Elementary School | 36 | 11.5% |
| Middle School | 22 | 7.0% |
| High School | 121 | 38.5% |
| College / Undergraduate | 76 | 24.2% |
| Graduate / Professional | 6 | 1.9% |
| Total | 314 | 100.0% |
School Enrollment by Age by Funding Source in West Mayfield borough
Out of a total of 314 students who are enrolled in schools in West Mayfield borough, 16 (5.1%) attend a private institution, while the remaining 298 (94.9%) are enrolled in public schools. The age group of 25 to 34 year olds has the highest likelihood of being enrolled in private schools, with 6 (66.7% in the age bracket) enrolled. Conversely, the age group of 3 to 4 year olds has the lowest likelihood of being enrolled in a private school, with 18 (100.0% in the age bracket) attending a public institution.
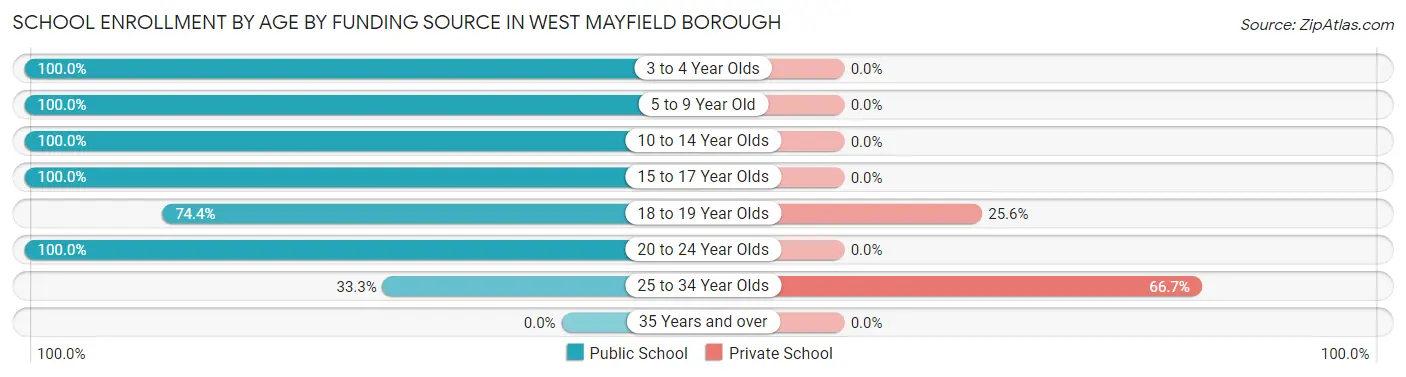
| Age Bracket | Public School | Private School |
| 3 to 4 Year Olds | 18 (100.0%) | 0 (0.0%) |
| 5 to 9 Year Old | 71 (100.0%) | 0 (0.0%) |
| 10 to 14 Year Olds | 31 (100.0%) | 0 (0.0%) |
| 15 to 17 Year Olds | 86 (100.0%) | 0 (0.0%) |
| 18 to 19 Year Olds | 29 (74.4%) | 10 (25.6%) |
| 20 to 24 Year Olds | 60 (100.0%) | 0 (0.0%) |
| 25 to 34 Year Olds | 3 (33.3%) | 6 (66.7%) |
| 35 Years and over | 0 (0.0%) | 0 (0.0%) |
| Total | 298 (94.9%) | 16 (5.1%) |
Educational Attainment by Field of Study in West Mayfield borough
Social sciences (22 | 18.0%), business (17 | 13.9%), education (17 | 13.9%), arts & humanities (15 | 12.3%), and psychology (13 | 10.7%) are the most common fields of study among 122 individuals in West Mayfield borough who have obtained a bachelor's degree or higher.
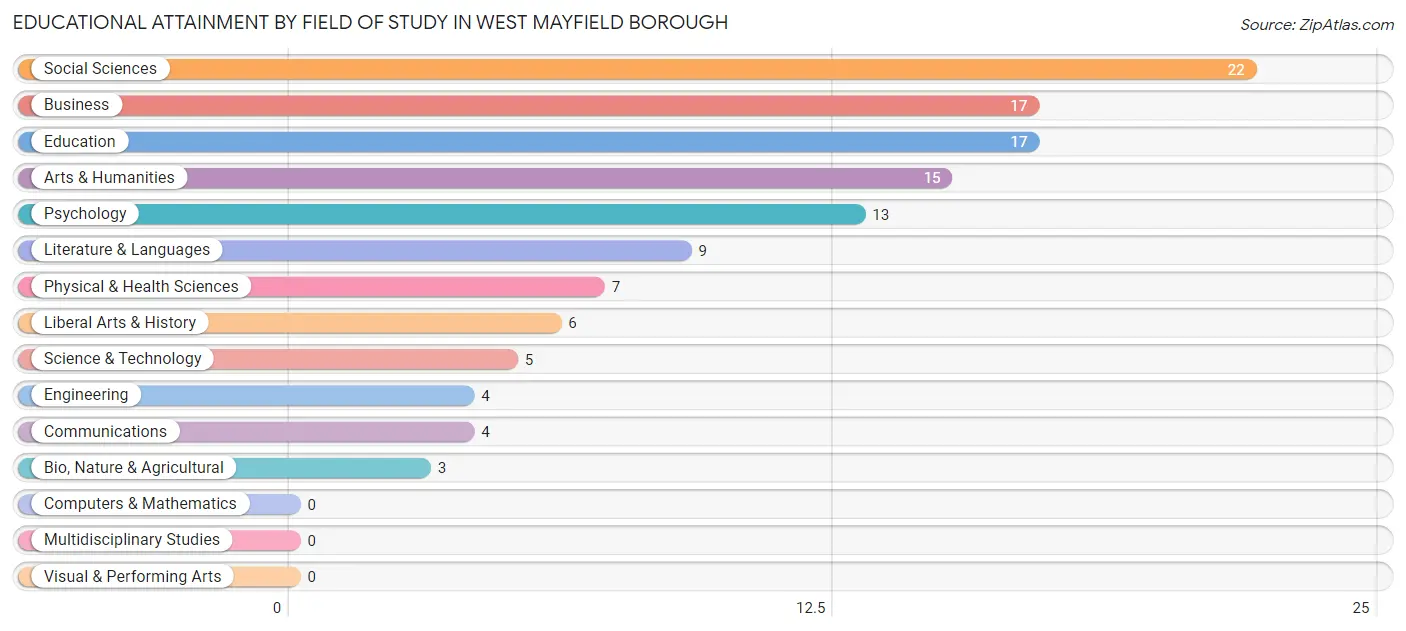
| Field of Study | # Graduates | % Graduates |
| Computers & Mathematics | 0 | 0.0% |
| Bio, Nature & Agricultural | 3 | 2.5% |
| Physical & Health Sciences | 7 | 5.7% |
| Psychology | 13 | 10.7% |
| Social Sciences | 22 | 18.0% |
| Engineering | 4 | 3.3% |
| Multidisciplinary Studies | 0 | 0.0% |
| Science & Technology | 5 | 4.1% |
| Business | 17 | 13.9% |
| Education | 17 | 13.9% |
| Literature & Languages | 9 | 7.4% |
| Liberal Arts & History | 6 | 4.9% |
| Visual & Performing Arts | 0 | 0.0% |
| Communications | 4 | 3.3% |
| Arts & Humanities | 15 | 12.3% |
| Total | 122 | 100.0% |
Transportation & Commute in West Mayfield borough
Vehicle Availability by Sex in West Mayfield borough
The most prevalent vehicle ownership categories in West Mayfield borough are males with 2 vehicles (142, accounting for 45.8%) and females with 2 vehicles (98, making up 48.3%).
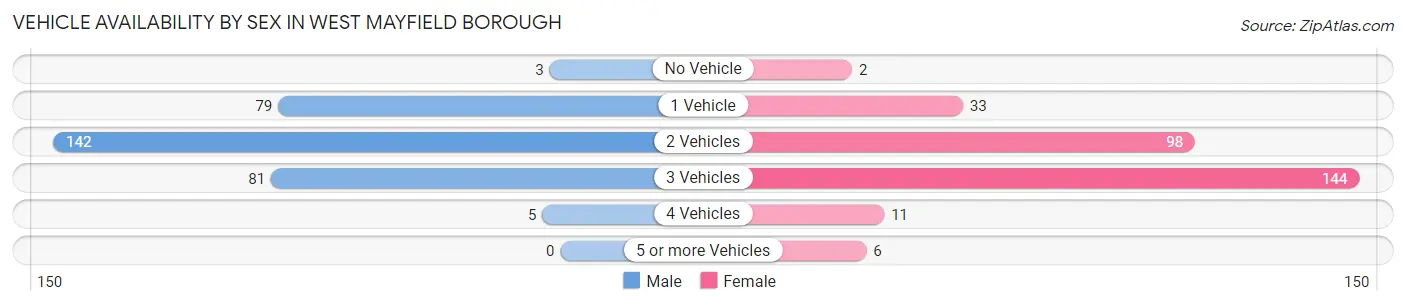
| Vehicles Available | Male | Female |
| No Vehicle | 3 (1.0%) | 2 (0.7%) |
| 1 Vehicle | 79 (25.5%) | 33 (11.2%) |
| 2 Vehicles | 142 (45.8%) | 98 (33.3%) |
| 3 Vehicles | 81 (26.1%) | 144 (49.0%) |
| 4 Vehicles | 5 (1.6%) | 11 (3.7%) |
| 5 or more Vehicles | 0 (0.0%) | 6 (2.0%) |
| Total | 310 (100.0%) | 294 (100.0%) |
Commute Time in West Mayfield borough
The most frequently occuring commute durations in West Mayfield borough are 20 to 24 minutes (144 commuters, 25.2%), 10 to 14 minutes (86 commuters, 15.0%), and 40 to 44 minutes (83 commuters, 14.5%).
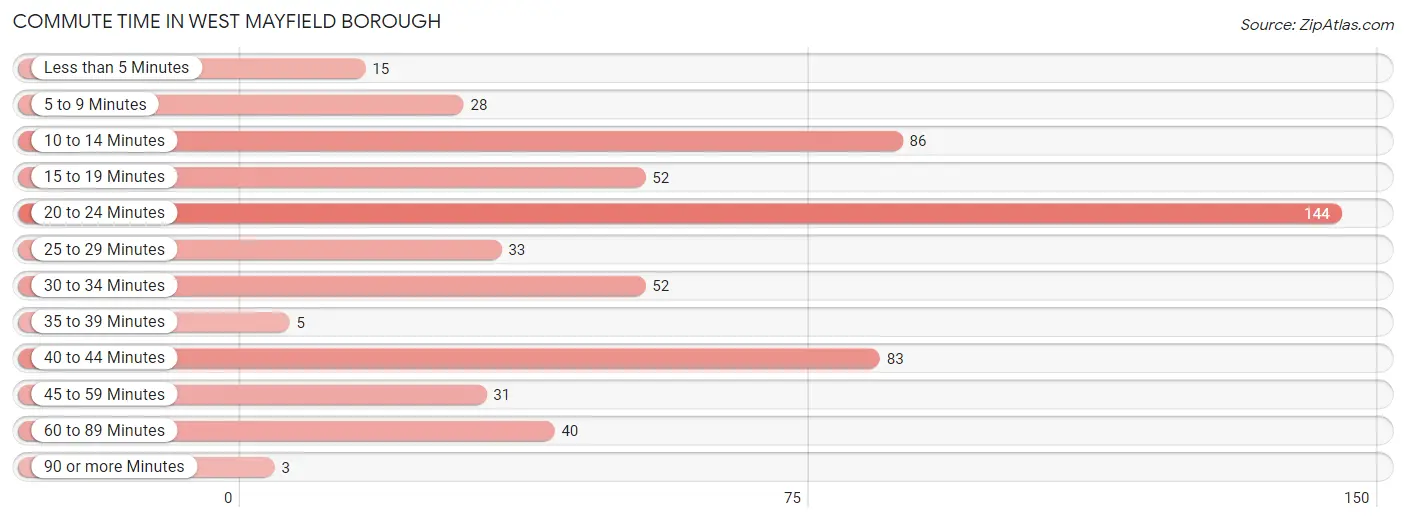
| Commute Time | # Commuters | % Commuters |
| Less than 5 Minutes | 15 | 2.6% |
| 5 to 9 Minutes | 28 | 4.9% |
| 10 to 14 Minutes | 86 | 15.0% |
| 15 to 19 Minutes | 52 | 9.1% |
| 20 to 24 Minutes | 144 | 25.2% |
| 25 to 29 Minutes | 33 | 5.8% |
| 30 to 34 Minutes | 52 | 9.1% |
| 35 to 39 Minutes | 5 | 0.9% |
| 40 to 44 Minutes | 83 | 14.5% |
| 45 to 59 Minutes | 31 | 5.4% |
| 60 to 89 Minutes | 40 | 7.0% |
| 90 or more Minutes | 3 | 0.5% |
Commute Time by Sex in West Mayfield borough
The most common commute times in West Mayfield borough are 10 to 14 minutes (68 commuters, 22.3%) for males and 20 to 24 minutes (80 commuters, 30.0%) for females.
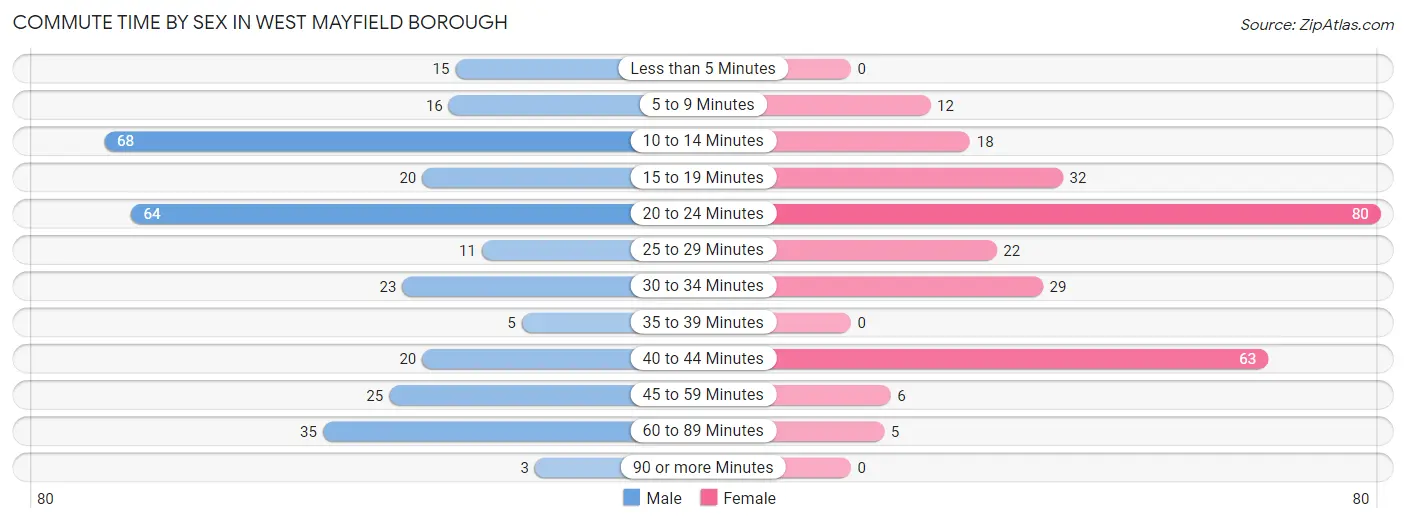
| Commute Time | Male | Female |
| Less than 5 Minutes | 15 (4.9%) | 0 (0.0%) |
| 5 to 9 Minutes | 16 (5.2%) | 12 (4.5%) |
| 10 to 14 Minutes | 68 (22.3%) | 18 (6.7%) |
| 15 to 19 Minutes | 20 (6.6%) | 32 (12.0%) |
| 20 to 24 Minutes | 64 (21.0%) | 80 (30.0%) |
| 25 to 29 Minutes | 11 (3.6%) | 22 (8.2%) |
| 30 to 34 Minutes | 23 (7.5%) | 29 (10.9%) |
| 35 to 39 Minutes | 5 (1.6%) | 0 (0.0%) |
| 40 to 44 Minutes | 20 (6.6%) | 63 (23.6%) |
| 45 to 59 Minutes | 25 (8.2%) | 6 (2.2%) |
| 60 to 89 Minutes | 35 (11.5%) | 5 (1.9%) |
| 90 or more Minutes | 3 (1.0%) | 0 (0.0%) |
Time of Departure to Work by Sex in West Mayfield borough
The most frequent times of departure to work in West Mayfield borough are 4:00 PM to 11:59 PM (73, 23.9%) for males and 12:00 PM to 3:59 PM (77, 28.8%) for females.
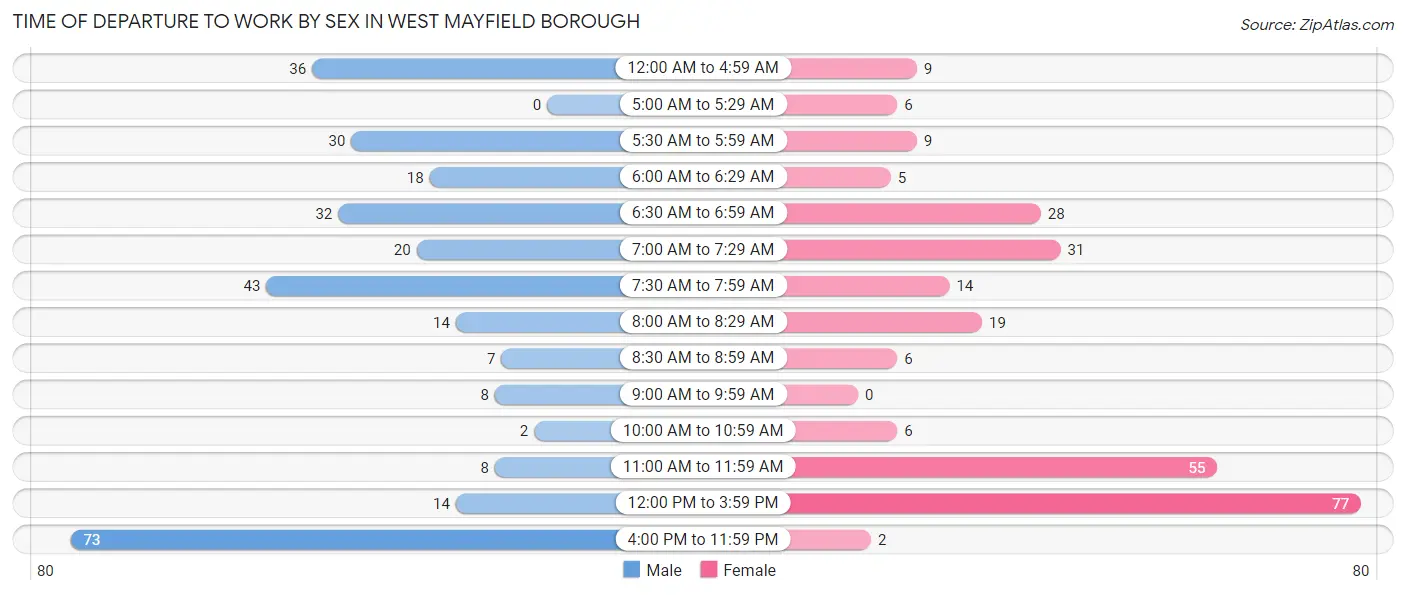
| Time of Departure | Male | Female |
| 12:00 AM to 4:59 AM | 36 (11.8%) | 9 (3.4%) |
| 5:00 AM to 5:29 AM | 0 (0.0%) | 6 (2.2%) |
| 5:30 AM to 5:59 AM | 30 (9.8%) | 9 (3.4%) |
| 6:00 AM to 6:29 AM | 18 (5.9%) | 5 (1.9%) |
| 6:30 AM to 6:59 AM | 32 (10.5%) | 28 (10.5%) |
| 7:00 AM to 7:29 AM | 20 (6.6%) | 31 (11.6%) |
| 7:30 AM to 7:59 AM | 43 (14.1%) | 14 (5.2%) |
| 8:00 AM to 8:29 AM | 14 (4.6%) | 19 (7.1%) |
| 8:30 AM to 8:59 AM | 7 (2.3%) | 6 (2.2%) |
| 9:00 AM to 9:59 AM | 8 (2.6%) | 0 (0.0%) |
| 10:00 AM to 10:59 AM | 2 (0.7%) | 6 (2.2%) |
| 11:00 AM to 11:59 AM | 8 (2.6%) | 55 (20.6%) |
| 12:00 PM to 3:59 PM | 14 (4.6%) | 77 (28.8%) |
| 4:00 PM to 11:59 PM | 73 (23.9%) | 2 (0.7%) |
| Total | 305 (100.0%) | 267 (100.0%) |
Housing Occupancy in West Mayfield borough
Occupancy by Ownership in West Mayfield borough
Of the total 569 dwellings in West Mayfield borough, owner-occupied units account for 324 (56.9%), while renter-occupied units make up 245 (43.1%).
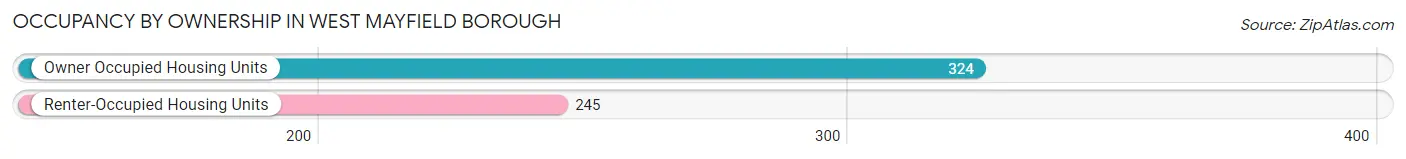
| Occupancy | # Housing Units | % Housing Units |
| Owner Occupied Housing Units | 324 | 56.9% |
| Renter-Occupied Housing Units | 245 | 43.1% |
| Total Occupied Housing Units | 569 | 100.0% |
Occupancy by Household Size in West Mayfield borough
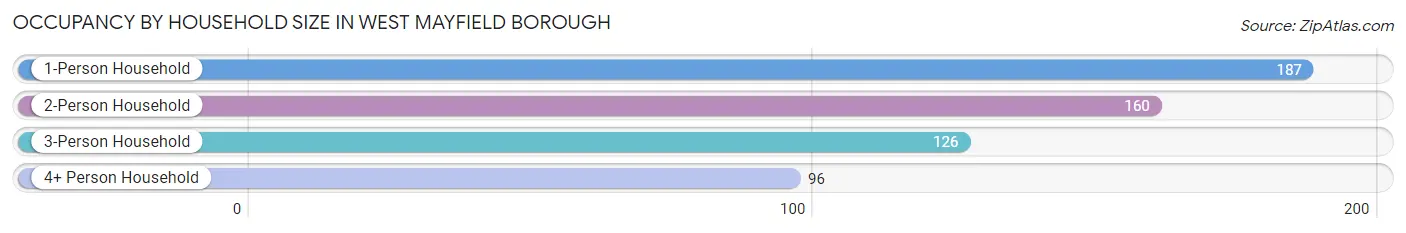
| Household Size | # Housing Units | % Housing Units |
| 1-Person Household | 187 | 32.9% |
| 2-Person Household | 160 | 28.1% |
| 3-Person Household | 126 | 22.1% |
| 4+ Person Household | 96 | 16.9% |
| Total Housing Units | 569 | 100.0% |
Occupancy by Ownership by Household Size in West Mayfield borough
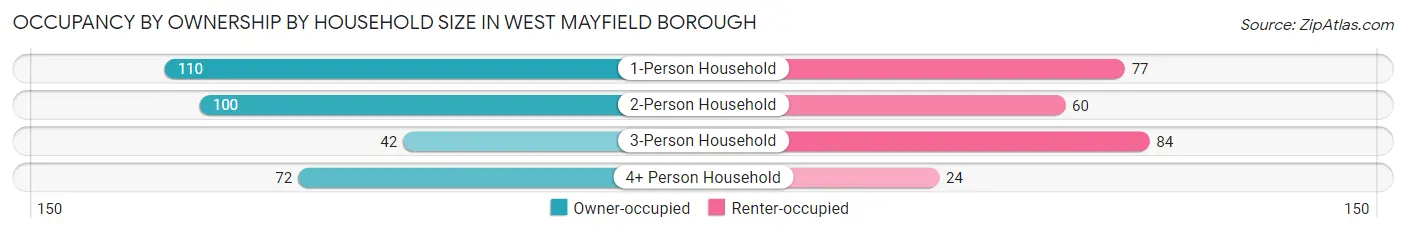
| Household Size | Owner-occupied | Renter-occupied |
| 1-Person Household | 110 (58.8%) | 77 (41.2%) |
| 2-Person Household | 100 (62.5%) | 60 (37.5%) |
| 3-Person Household | 42 (33.3%) | 84 (66.7%) |
| 4+ Person Household | 72 (75.0%) | 24 (25.0%) |
| Total Housing Units | 324 (56.9%) | 245 (43.1%) |
Occupancy by Educational Attainment in West Mayfield borough
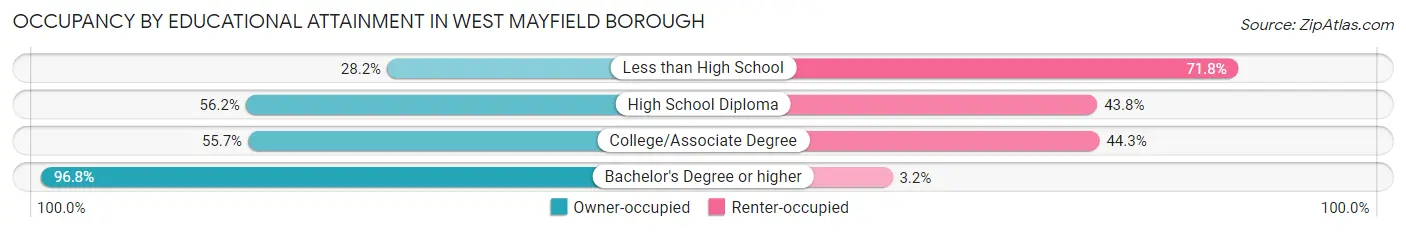
| Household Size | Owner-occupied | Renter-occupied |
| Less than High School | 20 (28.2%) | 51 (71.8%) |
| High School Diploma | 132 (56.2%) | 103 (43.8%) |
| College/Associate Degree | 112 (55.7%) | 89 (44.3%) |
| Bachelor's Degree or higher | 60 (96.8%) | 2 (3.2%) |
Occupancy by Age of Householder in West Mayfield borough
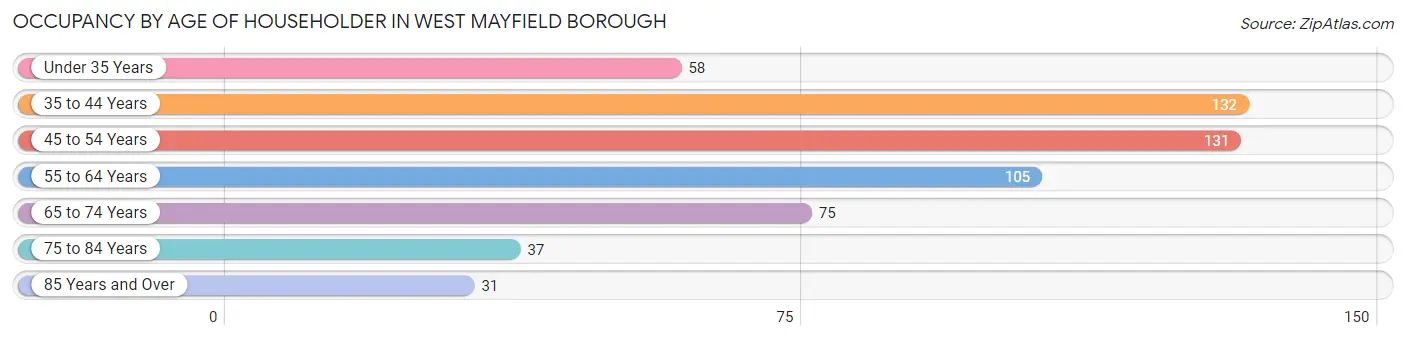
| Age Bracket | # Households | % Households |
| Under 35 Years | 58 | 10.2% |
| 35 to 44 Years | 132 | 23.2% |
| 45 to 54 Years | 131 | 23.0% |
| 55 to 64 Years | 105 | 18.4% |
| 65 to 74 Years | 75 | 13.2% |
| 75 to 84 Years | 37 | 6.5% |
| 85 Years and Over | 31 | 5.4% |
| Total | 569 | 100.0% |
Housing Finances in West Mayfield borough
Median Income by Occupancy in West Mayfield borough
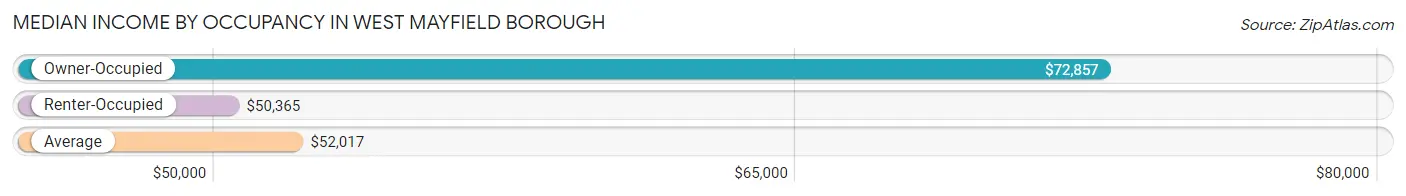
| Occupancy Type | # Households | Median Income |
| Owner-Occupied | 324 (56.9%) | $72,857 |
| Renter-Occupied | 245 (43.1%) | $50,365 |
| Average | 569 (100.0%) | $52,017 |
Occupancy by Householder Income Bracket in West Mayfield borough
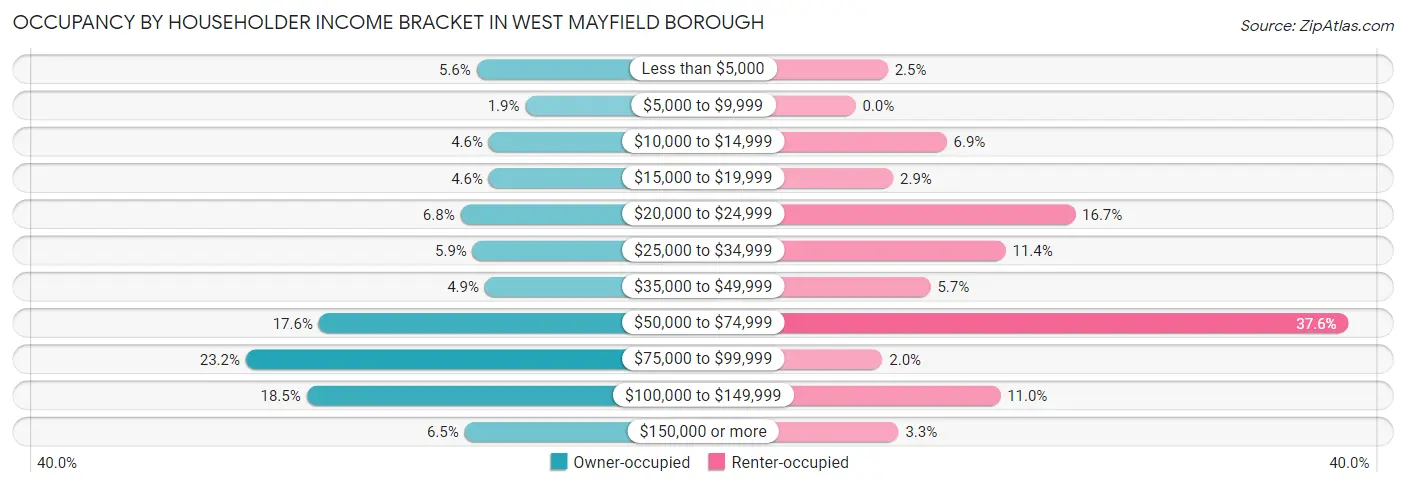
| Income Bracket | Owner-occupied | Renter-occupied |
| Less than $5,000 | 18 (5.6%) | 6 (2.5%) |
| $5,000 to $9,999 | 6 (1.8%) | 0 (0.0%) |
| $10,000 to $14,999 | 15 (4.6%) | 17 (6.9%) |
| $15,000 to $19,999 | 15 (4.6%) | 7 (2.9%) |
| $20,000 to $24,999 | 22 (6.8%) | 41 (16.7%) |
| $25,000 to $34,999 | 19 (5.9%) | 28 (11.4%) |
| $35,000 to $49,999 | 16 (4.9%) | 14 (5.7%) |
| $50,000 to $74,999 | 57 (17.6%) | 92 (37.6%) |
| $75,000 to $99,999 | 75 (23.2%) | 5 (2.0%) |
| $100,000 to $149,999 | 60 (18.5%) | 27 (11.0%) |
| $150,000 or more | 21 (6.5%) | 8 (3.3%) |
| Total | 324 (100.0%) | 245 (100.0%) |
Monthly Housing Cost Tiers in West Mayfield borough
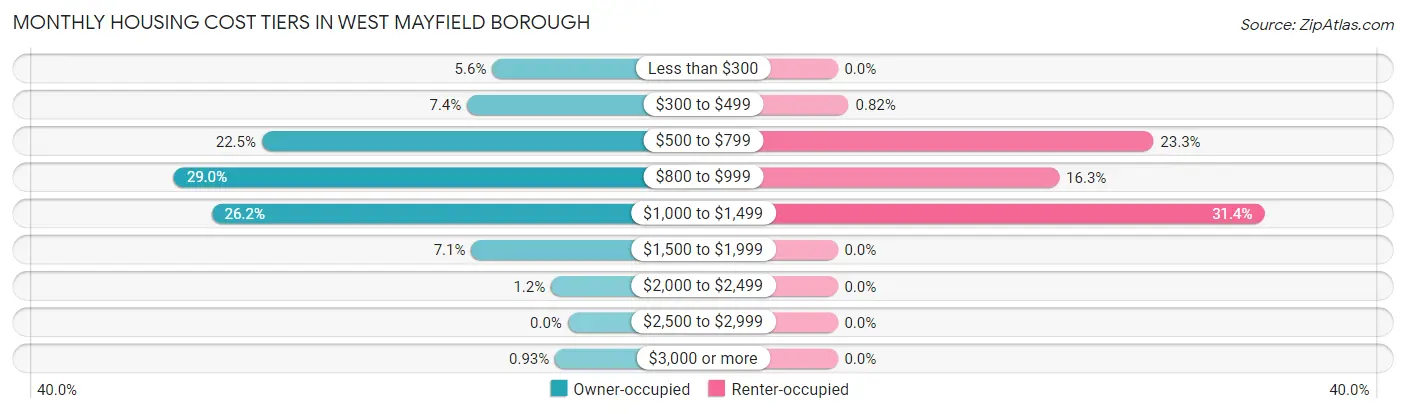
| Monthly Cost | Owner-occupied | Renter-occupied |
| Less than $300 | 18 (5.6%) | 0 (0.0%) |
| $300 to $499 | 24 (7.4%) | 2 (0.8%) |
| $500 to $799 | 73 (22.5%) | 57 (23.3%) |
| $800 to $999 | 94 (29.0%) | 40 (16.3%) |
| $1,000 to $1,499 | 85 (26.2%) | 77 (31.4%) |
| $1,500 to $1,999 | 23 (7.1%) | 0 (0.0%) |
| $2,000 to $2,499 | 4 (1.2%) | 0 (0.0%) |
| $2,500 to $2,999 | 0 (0.0%) | 0 (0.0%) |
| $3,000 or more | 3 (0.9%) | 0 (0.0%) |
| Total | 324 (100.0%) | 245 (100.0%) |
Physical Housing Characteristics in West Mayfield borough
Housing Structures in West Mayfield borough
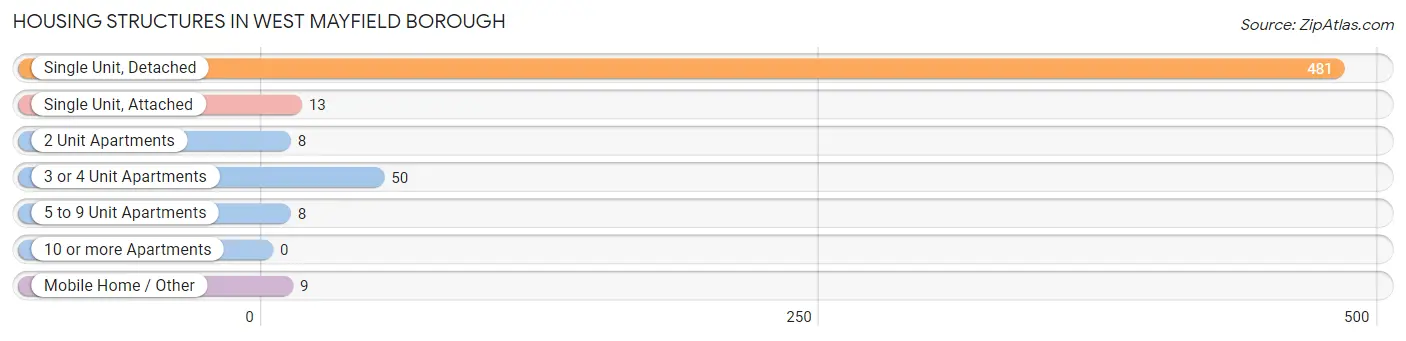
| Structure Type | # Housing Units | % Housing Units |
| Single Unit, Detached | 481 | 84.5% |
| Single Unit, Attached | 13 | 2.3% |
| 2 Unit Apartments | 8 | 1.4% |
| 3 or 4 Unit Apartments | 50 | 8.8% |
| 5 to 9 Unit Apartments | 8 | 1.4% |
| 10 or more Apartments | 0 | 0.0% |
| Mobile Home / Other | 9 | 1.6% |
| Total | 569 | 100.0% |
Housing Structures by Occupancy in West Mayfield borough
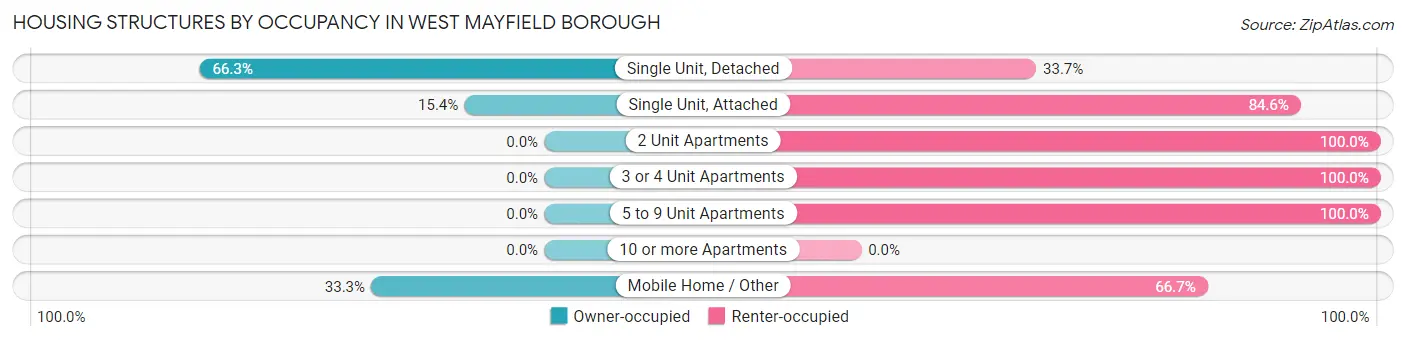
| Structure Type | Owner-occupied | Renter-occupied |
| Single Unit, Detached | 319 (66.3%) | 162 (33.7%) |
| Single Unit, Attached | 2 (15.4%) | 11 (84.6%) |
| 2 Unit Apartments | 0 (0.0%) | 8 (100.0%) |
| 3 or 4 Unit Apartments | 0 (0.0%) | 50 (100.0%) |
| 5 to 9 Unit Apartments | 0 (0.0%) | 8 (100.0%) |
| 10 or more Apartments | 0 (0.0%) | 0 (0.0%) |
| Mobile Home / Other | 3 (33.3%) | 6 (66.7%) |
| Total | 324 (56.9%) | 245 (43.1%) |
Housing Structures by Number of Rooms in West Mayfield borough
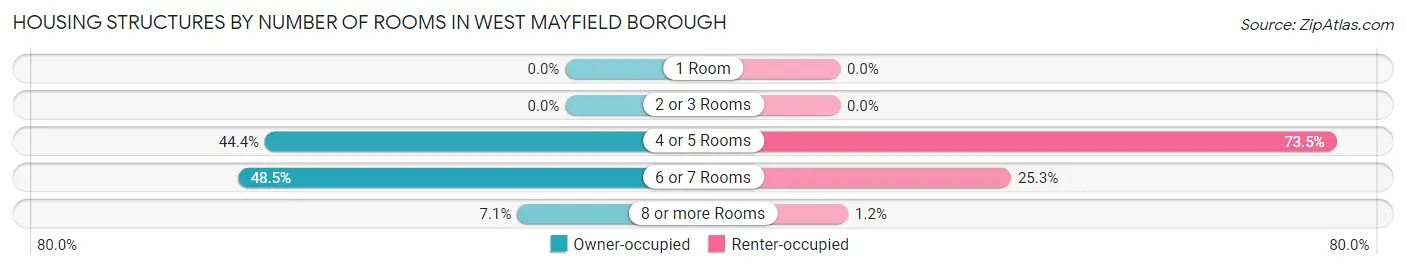
| Number of Rooms | Owner-occupied | Renter-occupied |
| 1 Room | 0 (0.0%) | 0 (0.0%) |
| 2 or 3 Rooms | 0 (0.0%) | 0 (0.0%) |
| 4 or 5 Rooms | 144 (44.4%) | 180 (73.5%) |
| 6 or 7 Rooms | 157 (48.5%) | 62 (25.3%) |
| 8 or more Rooms | 23 (7.1%) | 3 (1.2%) |
| Total | 324 (100.0%) | 245 (100.0%) |
Housing Structure by Heating Type in West Mayfield borough
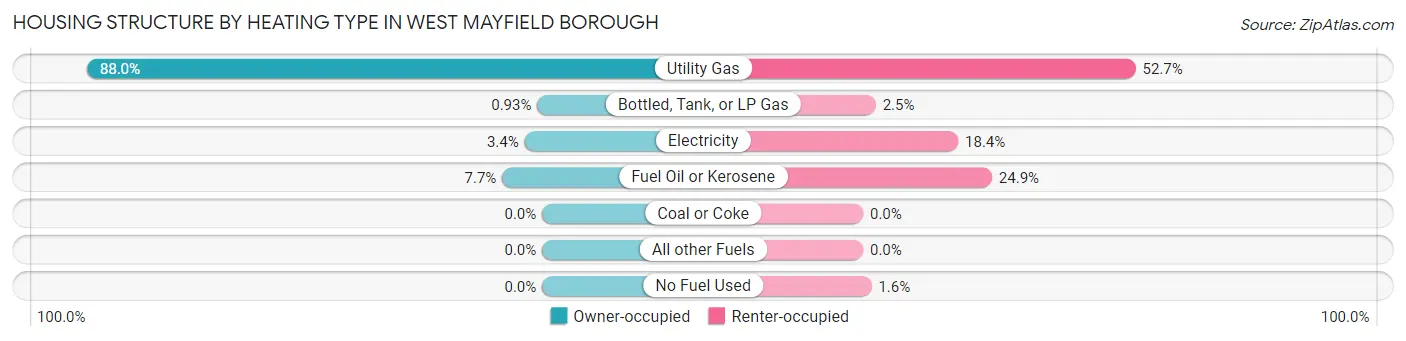
| Heating Type | Owner-occupied | Renter-occupied |
| Utility Gas | 285 (88.0%) | 129 (52.6%) |
| Bottled, Tank, or LP Gas | 3 (0.9%) | 6 (2.5%) |
| Electricity | 11 (3.4%) | 45 (18.4%) |
| Fuel Oil or Kerosene | 25 (7.7%) | 61 (24.9%) |
| Coal or Coke | 0 (0.0%) | 0 (0.0%) |
| All other Fuels | 0 (0.0%) | 0 (0.0%) |
| No Fuel Used | 0 (0.0%) | 4 (1.6%) |
| Total | 324 (100.0%) | 245 (100.0%) |
Household Vehicle Usage in West Mayfield borough
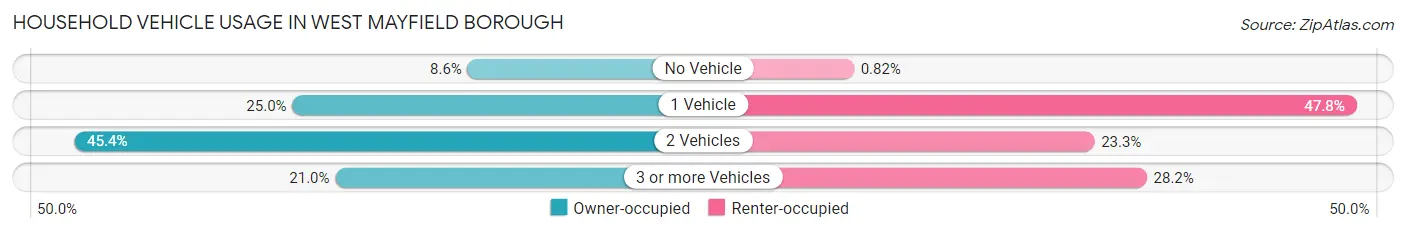
| Vehicles per Household | Owner-occupied | Renter-occupied |
| No Vehicle | 28 (8.6%) | 2 (0.8%) |
| 1 Vehicle | 81 (25.0%) | 117 (47.8%) |
| 2 Vehicles | 147 (45.4%) | 57 (23.3%) |
| 3 or more Vehicles | 68 (21.0%) | 69 (28.2%) |
| Total | 324 (100.0%) | 245 (100.0%) |
Real Estate & Mortgages in West Mayfield borough
Real Estate and Mortgage Overview in West Mayfield borough
| Characteristic | Without Mortgage | With Mortgage |
| Housing Units | 116 | 208 |
| Median Property Value | $116,700 | $125,000 |
| Median Household Income | $46,250 | $13 |
| Monthly Housing Costs | $550 | $0 |
| Real Estate Taxes | $2,025 | $0 |
Property Value by Mortgage Status in West Mayfield borough
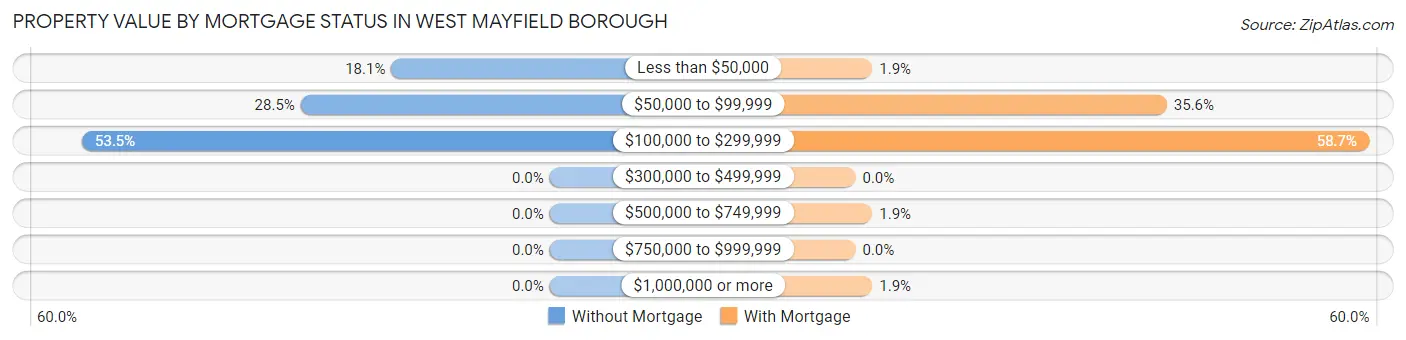
| Property Value | Without Mortgage | With Mortgage |
| Less than $50,000 | 21 (18.1%) | 4 (1.9%) |
| $50,000 to $99,999 | 33 (28.4%) | 74 (35.6%) |
| $100,000 to $299,999 | 62 (53.4%) | 122 (58.7%) |
| $300,000 to $499,999 | 0 (0.0%) | 0 (0.0%) |
| $500,000 to $749,999 | 0 (0.0%) | 4 (1.9%) |
| $750,000 to $999,999 | 0 (0.0%) | 0 (0.0%) |
| $1,000,000 or more | 0 (0.0%) | 4 (1.9%) |
| Total | 116 (100.0%) | 208 (100.0%) |
Household Income by Mortgage Status in West Mayfield borough
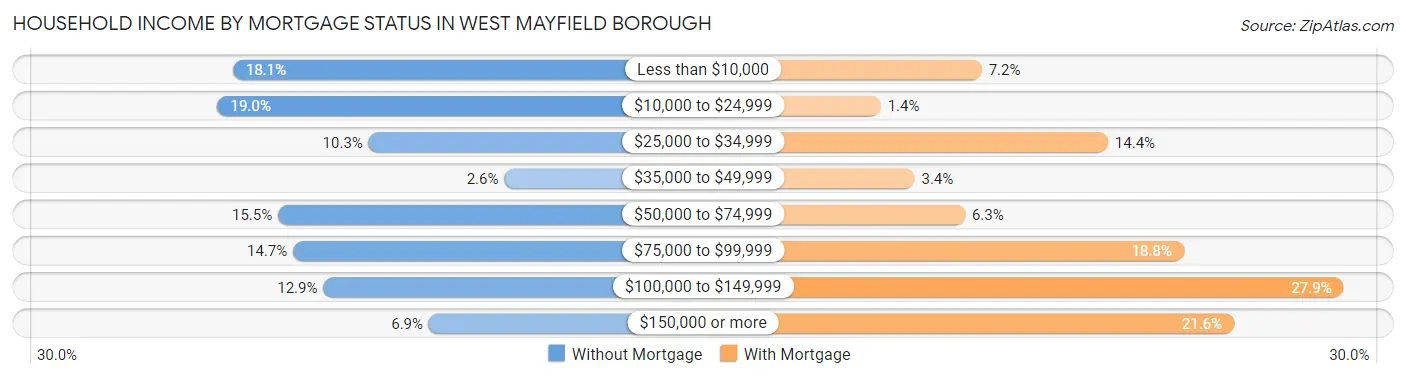
| Household Income | Without Mortgage | With Mortgage |
| Less than $10,000 | 21 (18.1%) | 15 (7.2%) |
| $10,000 to $24,999 | 22 (19.0%) | 3 (1.4%) |
| $25,000 to $34,999 | 12 (10.3%) | 30 (14.4%) |
| $35,000 to $49,999 | 3 (2.6%) | 7 (3.4%) |
| $50,000 to $74,999 | 18 (15.5%) | 13 (6.2%) |
| $75,000 to $99,999 | 17 (14.7%) | 39 (18.8%) |
| $100,000 to $149,999 | 15 (12.9%) | 58 (27.9%) |
| $150,000 or more | 8 (6.9%) | 45 (21.6%) |
| Total | 116 (100.0%) | 208 (100.0%) |
Property Value to Household Income Ratio in West Mayfield borough
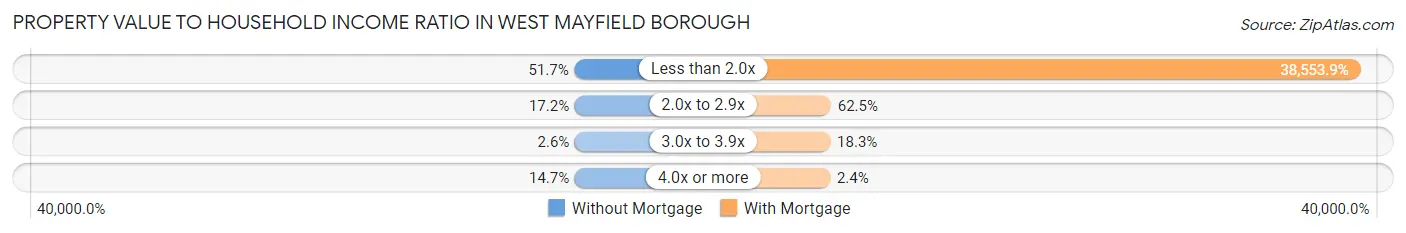
| Value-to-Income Ratio | Without Mortgage | With Mortgage |
| Less than 2.0x | 60 (51.7%) | 80,192 (38,553.8%) |
| 2.0x to 2.9x | 20 (17.2%) | 130 (62.5%) |
| 3.0x to 3.9x | 3 (2.6%) | 38 (18.3%) |
| 4.0x or more | 17 (14.7%) | 5 (2.4%) |
| Total | 116 (100.0%) | 208 (100.0%) |
Real Estate Taxes by Mortgage Status in West Mayfield borough
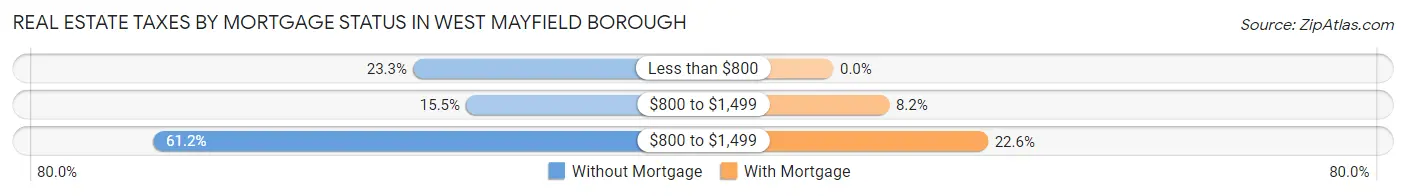
| Property Taxes | Without Mortgage | With Mortgage |
| Less than $800 | 27 (23.3%) | 0 (0.0%) |
| $800 to $1,499 | 18 (15.5%) | 17 (8.2%) |
| $800 to $1,499 | 71 (61.2%) | 47 (22.6%) |
| Total | 116 (100.0%) | 208 (100.0%) |
Health & Disability in West Mayfield borough
Health Insurance Coverage by Age in West Mayfield borough
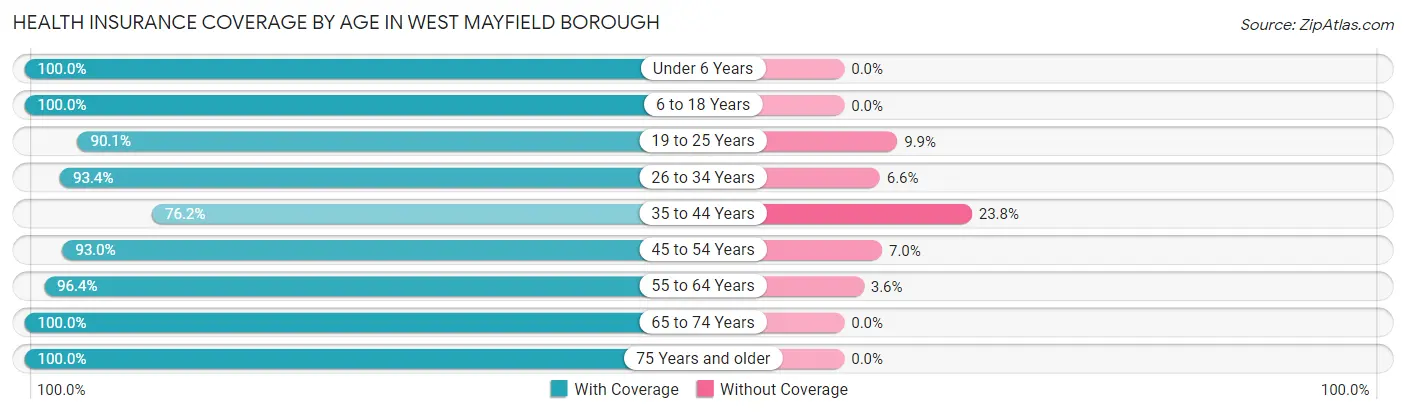
| Age Bracket | With Coverage | Without Coverage |
| Under 6 Years | 65 (100.0%) | 0 (0.0%) |
| 6 to 18 Years | 218 (100.0%) | 0 (0.0%) |
| 19 to 25 Years | 73 (90.1%) | 8 (9.9%) |
| 26 to 34 Years | 141 (93.4%) | 10 (6.6%) |
| 35 to 44 Years | 125 (76.2%) | 39 (23.8%) |
| 45 to 54 Years | 185 (93.0%) | 14 (7.0%) |
| 55 to 64 Years | 186 (96.4%) | 7 (3.6%) |
| 65 to 74 Years | 109 (100.0%) | 0 (0.0%) |
| 75 Years and older | 88 (100.0%) | 0 (0.0%) |
| Total | 1,190 (93.9%) | 78 (6.1%) |
Health Insurance Coverage by Citizenship Status in West Mayfield borough
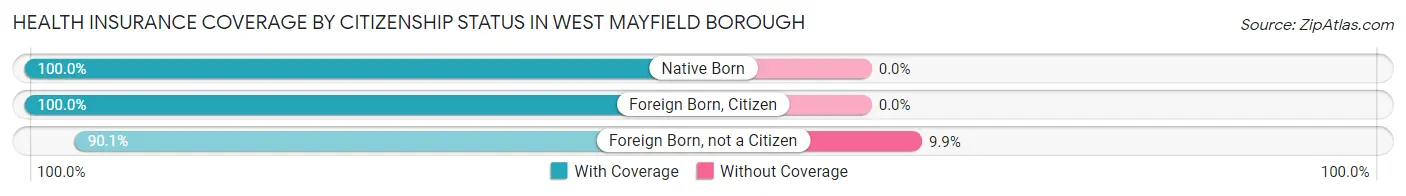
| Citizenship Status | With Coverage | Without Coverage |
| Native Born | 65 (100.0%) | 0 (0.0%) |
| Foreign Born, Citizen | 218 (100.0%) | 0 (0.0%) |
| Foreign Born, not a Citizen | 73 (90.1%) | 8 (9.9%) |
Health Insurance Coverage by Household Income in West Mayfield borough
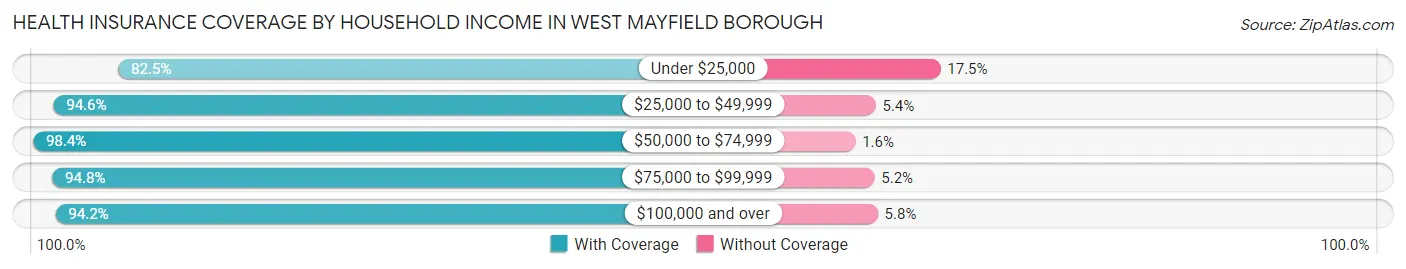
| Household Income | With Coverage | Without Coverage |
| Under $25,000 | 160 (82.5%) | 34 (17.5%) |
| $25,000 to $49,999 | 123 (94.6%) | 7 (5.4%) |
| $50,000 to $74,999 | 377 (98.4%) | 6 (1.6%) |
| $75,000 to $99,999 | 220 (94.8%) | 12 (5.2%) |
| $100,000 and over | 310 (94.2%) | 19 (5.8%) |
Public vs Private Health Insurance Coverage by Age in West Mayfield borough
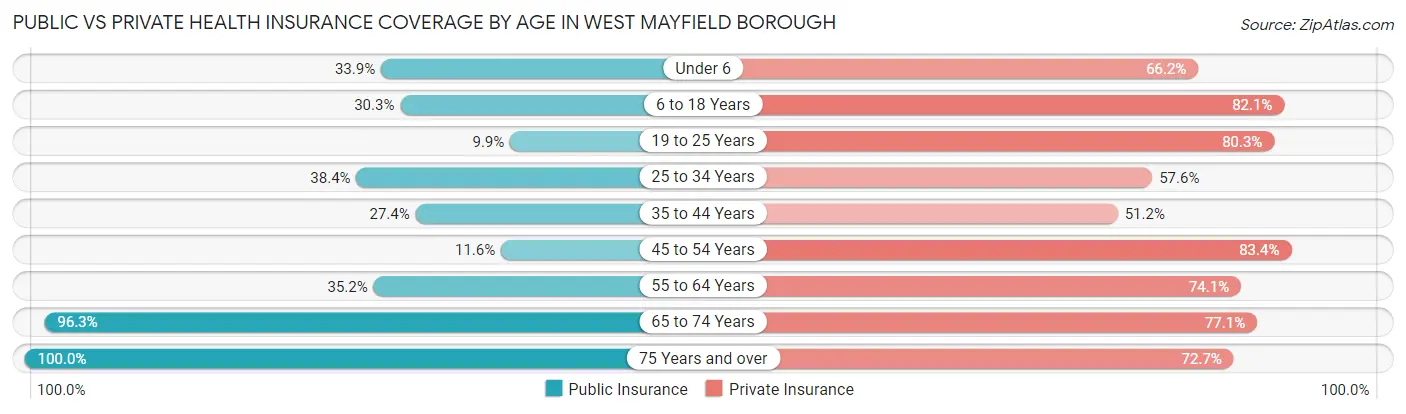
| Age Bracket | Public Insurance | Private Insurance |
| Under 6 | 22 (33.9%) | 43 (66.1%) |
| 6 to 18 Years | 66 (30.3%) | 179 (82.1%) |
| 19 to 25 Years | 8 (9.9%) | 65 (80.2%) |
| 25 to 34 Years | 58 (38.4%) | 87 (57.6%) |
| 35 to 44 Years | 45 (27.4%) | 84 (51.2%) |
| 45 to 54 Years | 23 (11.6%) | 166 (83.4%) |
| 55 to 64 Years | 68 (35.2%) | 143 (74.1%) |
| 65 to 74 Years | 105 (96.3%) | 84 (77.1%) |
| 75 Years and over | 88 (100.0%) | 64 (72.7%) |
| Total | 483 (38.1%) | 915 (72.2%) |
Disability Status by Sex by Age in West Mayfield borough
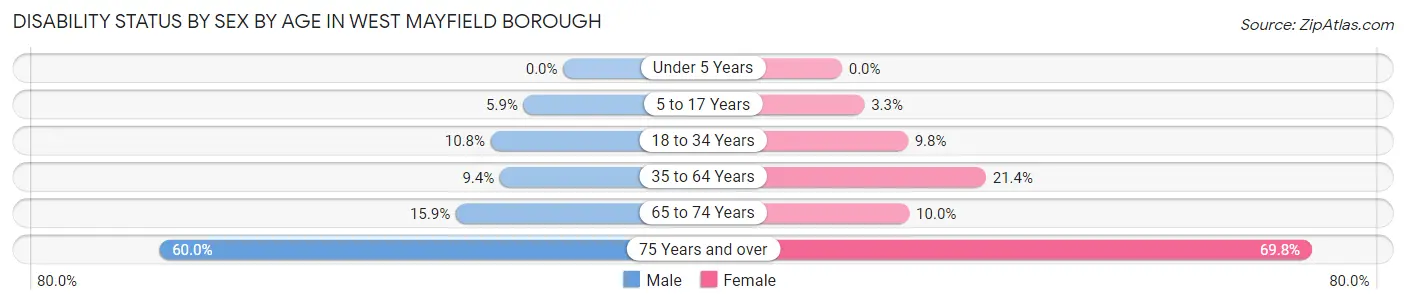
| Age Bracket | Male | Female |
| Under 5 Years | 0 (0.0%) | 0 (0.0%) |
| 5 to 17 Years | 4 (5.9%) | 4 (3.3%) |
| 18 to 34 Years | 14 (10.8%) | 14 (9.8%) |
| 35 to 64 Years | 25 (9.4%) | 62 (21.4%) |
| 65 to 74 Years | 11 (15.9%) | 4 (10.0%) |
| 75 Years and over | 21 (60.0%) | 37 (69.8%) |
Disability Class by Sex by Age in West Mayfield borough
Disability Class: Hearing Difficulty
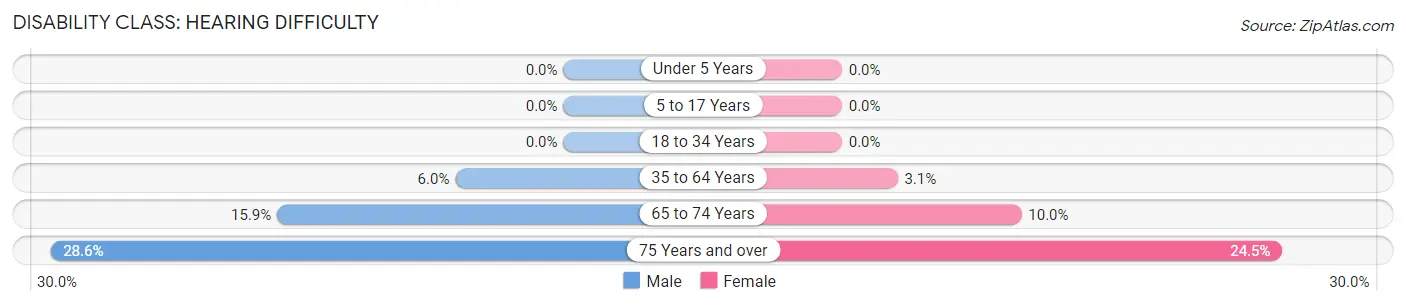
| Age Bracket | Male | Female |
| Under 5 Years | 0 (0.0%) | 0 (0.0%) |
| 5 to 17 Years | 0 (0.0%) | 0 (0.0%) |
| 18 to 34 Years | 0 (0.0%) | 0 (0.0%) |
| 35 to 64 Years | 16 (6.0%) | 9 (3.1%) |
| 65 to 74 Years | 11 (15.9%) | 4 (10.0%) |
| 75 Years and over | 10 (28.6%) | 13 (24.5%) |
Disability Class: Vision Difficulty
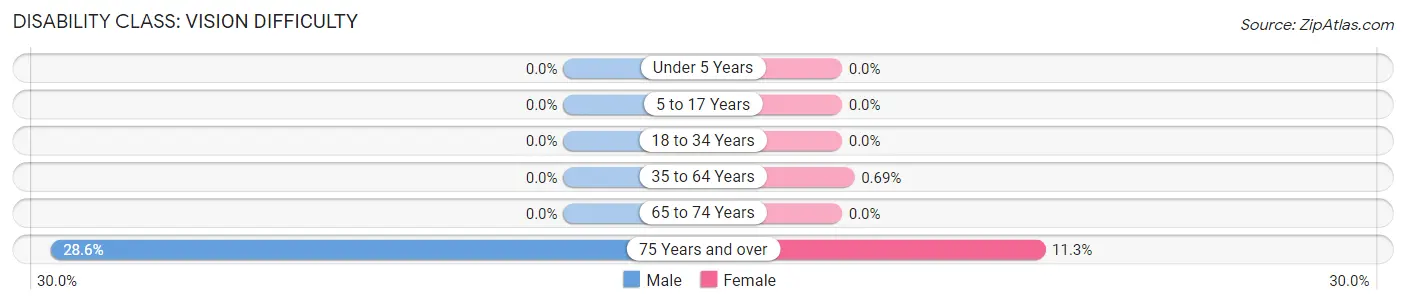
| Age Bracket | Male | Female |
| Under 5 Years | 0 (0.0%) | 0 (0.0%) |
| 5 to 17 Years | 0 (0.0%) | 0 (0.0%) |
| 18 to 34 Years | 0 (0.0%) | 0 (0.0%) |
| 35 to 64 Years | 0 (0.0%) | 2 (0.7%) |
| 65 to 74 Years | 0 (0.0%) | 0 (0.0%) |
| 75 Years and over | 10 (28.6%) | 6 (11.3%) |
Disability Class: Cognitive Difficulty
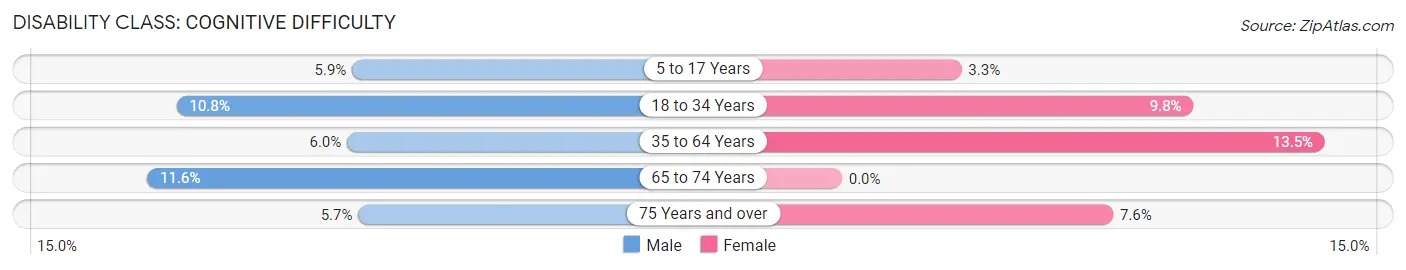
| Age Bracket | Male | Female |
| 5 to 17 Years | 4 (5.9%) | 4 (3.3%) |
| 18 to 34 Years | 14 (10.8%) | 14 (9.8%) |
| 35 to 64 Years | 16 (6.0%) | 39 (13.5%) |
| 65 to 74 Years | 8 (11.6%) | 0 (0.0%) |
| 75 Years and over | 2 (5.7%) | 4 (7.5%) |
Disability Class: Ambulatory Difficulty
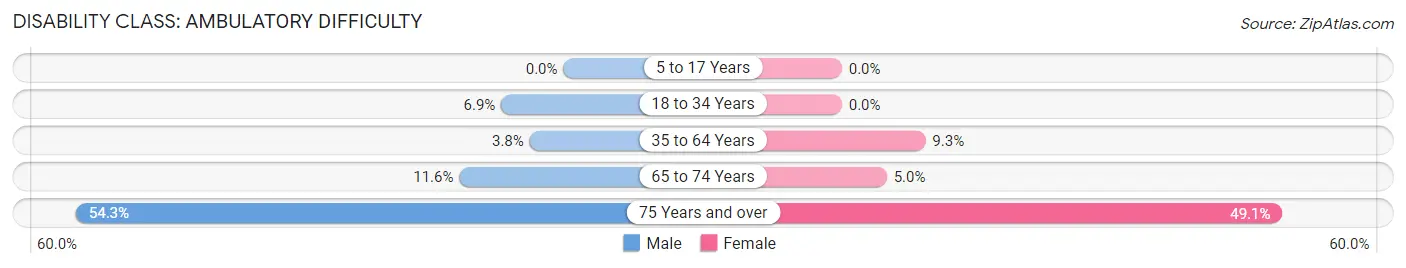
| Age Bracket | Male | Female |
| 5 to 17 Years | 0 (0.0%) | 0 (0.0%) |
| 18 to 34 Years | 9 (6.9%) | 0 (0.0%) |
| 35 to 64 Years | 10 (3.8%) | 27 (9.3%) |
| 65 to 74 Years | 8 (11.6%) | 2 (5.0%) |
| 75 Years and over | 19 (54.3%) | 26 (49.1%) |
Disability Class: Self-Care Difficulty
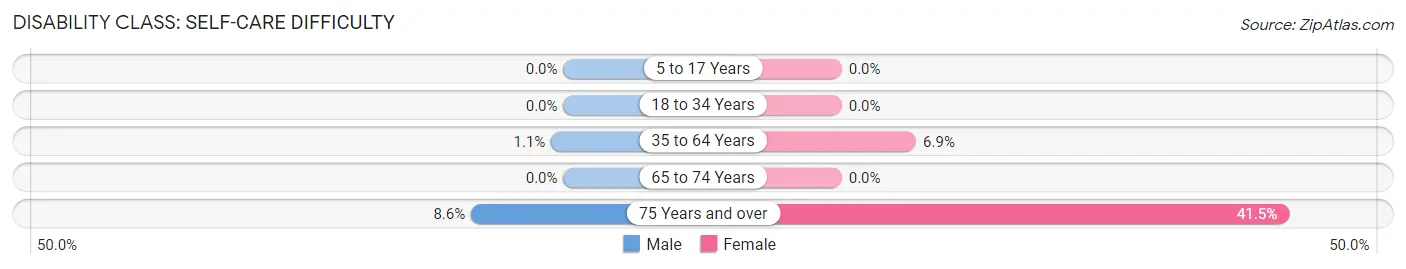
| Age Bracket | Male | Female |
| 5 to 17 Years | 0 (0.0%) | 0 (0.0%) |
| 18 to 34 Years | 0 (0.0%) | 0 (0.0%) |
| 35 to 64 Years | 3 (1.1%) | 20 (6.9%) |
| 65 to 74 Years | 0 (0.0%) | 0 (0.0%) |
| 75 Years and over | 3 (8.6%) | 22 (41.5%) |
Technology Access in West Mayfield borough
Computing Device Access in West Mayfield borough
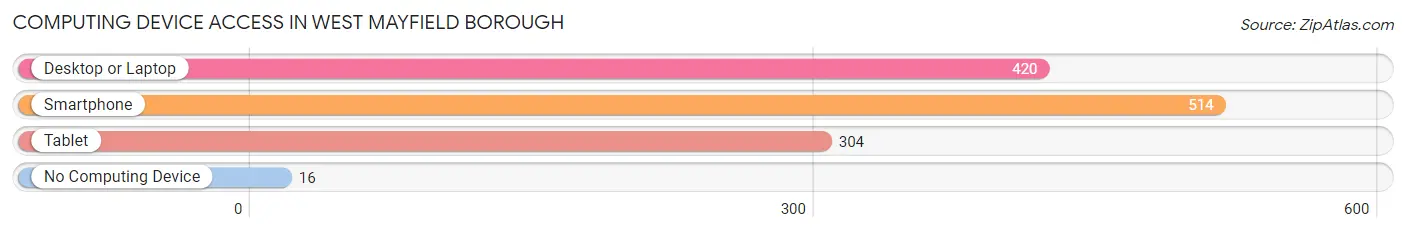
| Device Type | # Households | % Households |
| Desktop or Laptop | 420 | 73.8% |
| Smartphone | 514 | 90.3% |
| Tablet | 304 | 53.4% |
| No Computing Device | 16 | 2.8% |
| Total | 569 | 100.0% |
Internet Access in West Mayfield borough
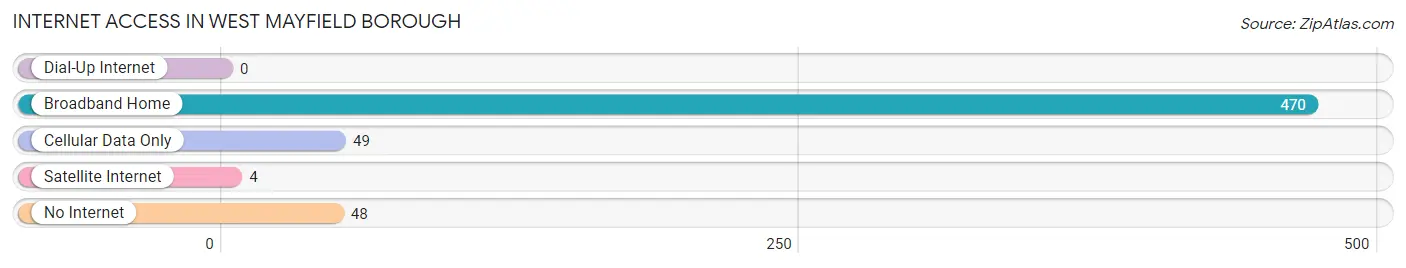
| Internet Type | # Households | % Households |
| Dial-Up Internet | 0 | 0.0% |
| Broadband Home | 470 | 82.6% |
| Cellular Data Only | 49 | 8.6% |
| Satellite Internet | 4 | 0.7% |
| No Internet | 48 | 8.4% |
| Total | 569 | 100.0% |
West Mayfield borough Summary
West Mayfield Borough is a small borough located in Beaver County, Pennsylvania. It is situated along the Ohio River, just north of the city of Beaver Falls. The borough was incorporated in 1891 and has a population of approximately 1,400 people.
Geography
West Mayfield Borough is located in the southwestern corner of Beaver County, Pennsylvania. It is situated along the Ohio River, just north of the city of Beaver Falls. The borough is bordered by Big Beaver Borough to the north, Chippewa Township to the east, and New Brighton Borough to the south. The total area of the borough is 0.6 square miles, all of which is land.
The terrain of West Mayfield Borough is mostly flat, with some rolling hills in the northern part of the borough. The Ohio River forms the western border of the borough, and the Big Beaver Creek runs through the northern part of the borough.
Economy
The economy of West Mayfield Borough is largely based on manufacturing and retail. The borough is home to several manufacturing companies, including a steel mill, a paper mill, and a plastics factory. The retail sector is also important to the local economy, with several small businesses located in the borough.
The median household income in West Mayfield Borough is $37,000, which is slightly lower than the median household income for Beaver County as a whole. The unemployment rate in the borough is also slightly higher than the county average, at 6.2%.
Demographics
As of the 2010 census, the population of West Mayfield Borough was 1,400. The racial makeup of the borough was 97.1% White, 1.1% African American, 0.4% Native American, 0.3% Asian, and 0.9% from other races. Hispanic or Latino of any race were 1.1% of the population.
The median age in West Mayfield Borough is 44.3 years, which is slightly higher than the median age for Beaver County as a whole. The median household income in the borough is $37,000, which is slightly lower than the median household income for Beaver County as a whole.
Conclusion
West Mayfield Borough is a small borough located in Beaver County, Pennsylvania. It is situated along the Ohio River, just north of the city of Beaver Falls. The borough was incorporated in 1891 and has a population of approximately 1,400 people. The economy of West Mayfield Borough is largely based on manufacturing and retail, and the median household income in the borough is $37,000. The racial makeup of the borough is 97.1% White, 1.1% African American, 0.4% Native American, 0.3% Asian, and 0.9% from other races. The median age in West Mayfield Borough is 44.3 years, which is slightly higher than the median age for Beaver County as a whole.
Common Questions
What is Per Capita Income in West Mayfield borough?
Per Capita income in West Mayfield borough is $29,726.
What is the Median Family Income in West Mayfield borough?
Median Family Income in West Mayfield borough is $64,412.
What is the Median Household income in West Mayfield borough?
Median Household Income in West Mayfield borough is $52,017.
What is Income or Wage Gap in West Mayfield borough?
Income or Wage Gap in West Mayfield borough is 25.5%.
Women in West Mayfield borough earn 74.5 cents for every dollar earned by a man.
What is Inequality or Gini Index in West Mayfield borough?
Inequality or Gini Index in West Mayfield borough is 0.43.
What is the Total Population of West Mayfield borough?
Total Population of West Mayfield borough is 1,270.
What is the Total Male Population of West Mayfield borough?
Total Male Population of West Mayfield borough is 595.
What is the Total Female Population of West Mayfield borough?
Total Female Population of West Mayfield borough is 675.
What is the Ratio of Males per 100 Females in West Mayfield borough?
There are 88.15 Males per 100 Females in West Mayfield borough.
What is the Ratio of Females per 100 Males in West Mayfield borough?
There are 113.45 Females per 100 Males in West Mayfield borough.
What is the Median Population Age in West Mayfield borough?
Median Population Age in West Mayfield borough is 40.4 Years.
What is the Average Family Size in West Mayfield borough
Average Family Size in West Mayfield borough is 2.8 People.
What is the Average Household Size in West Mayfield borough
Average Household Size in West Mayfield borough is 2.2 People.
How Large is the Labor Force in West Mayfield borough?
There are 688 People in the Labor Forcein in West Mayfield borough.
What is the Percentage of People in the Labor Force in West Mayfield borough?
62.7% of People are in the Labor Force in West Mayfield borough.
What is the Unemployment Rate in West Mayfield borough?
Unemployment Rate in West Mayfield borough is 8.9%.