Center Line, MI Map & Demographics
Center Line Map
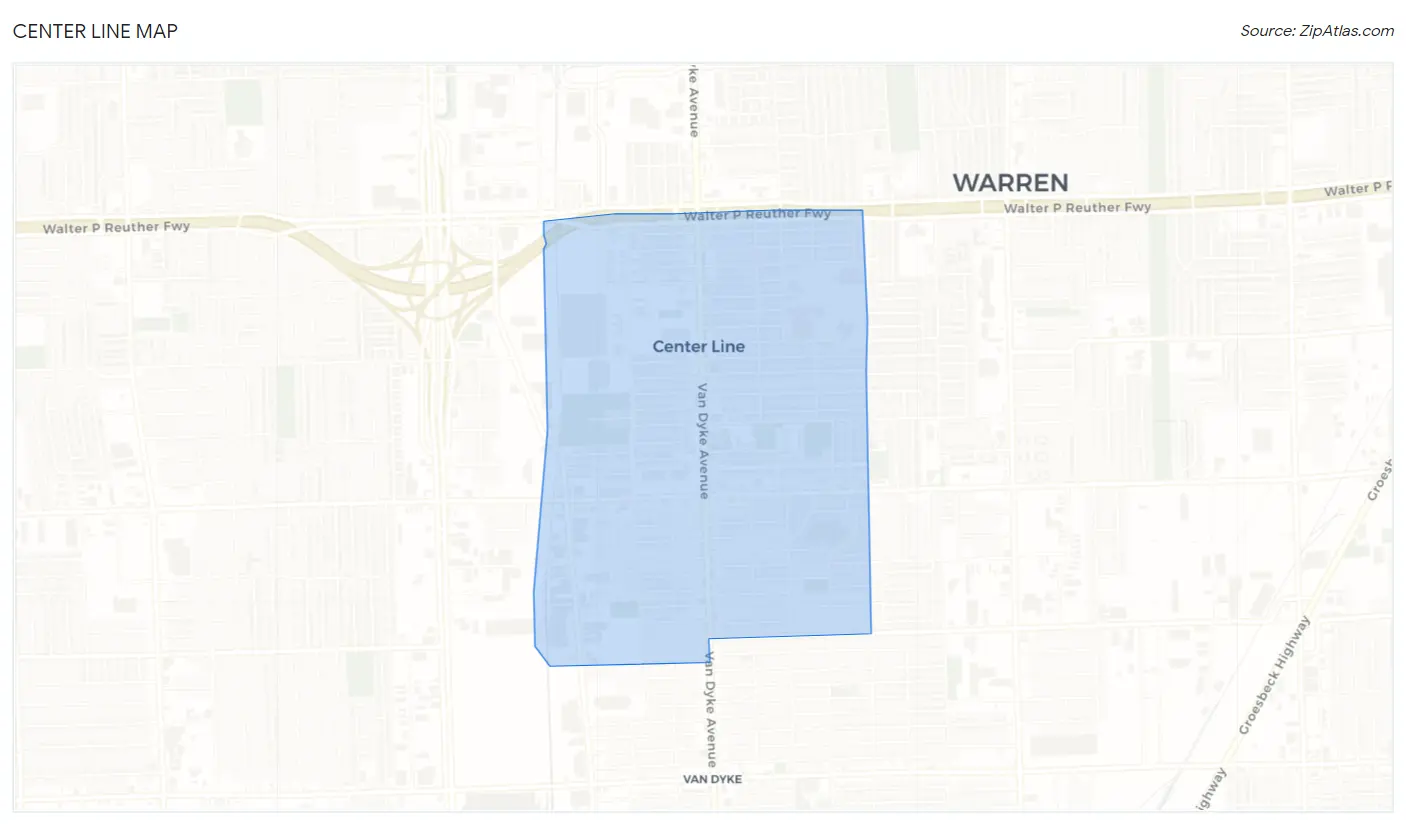
Center Line Overview
$28,967
PER CAPITA INCOME
$69,235
AVG FAMILY INCOME
$52,067
AVG HOUSEHOLD INCOME
9.3%
WAGE / INCOME GAP [ % ]
90.7¢/ $1
WAGE / INCOME GAP [ $ ]
0.41
INEQUALITY / GINI INDEX
8,493
TOTAL POPULATION
4,193
MALE POPULATION
4,300
FEMALE POPULATION
97.51
MALES / 100 FEMALES
102.55
FEMALES / 100 MALES
41.2
MEDIAN AGE
3.2
AVG FAMILY SIZE
2.2
AVG HOUSEHOLD SIZE
4,455
LABOR FORCE [ PEOPLE ]
66.0%
PERCENT IN LABOR FORCE
6.4%
UNEMPLOYMENT RATE
Center Line Zip Codes
Center Line Area Codes
Income in Center Line
Income Overview in Center Line
Per Capita Income in Center Line is $28,967, while median incomes of families and households are $69,235 and $52,067 respectively.
| Characteristic | Number | Measure |
| Per Capita Income | 8,493 | $28,967 |
| Median Family Income | 1,891 | $69,235 |
| Mean Family Income | 1,891 | $83,430 |
| Median Household Income | 3,698 | $52,067 |
| Mean Household Income | 3,698 | $63,823 |
| Income Deficit | 1,891 | $0 |
| Wage / Income Gap (%) | 8,493 | 9.29% |
| Wage / Income Gap ($) | 8,493 | 90.71¢ per $1 |
| Gini / Inequality Index | 8,493 | 0.41 |
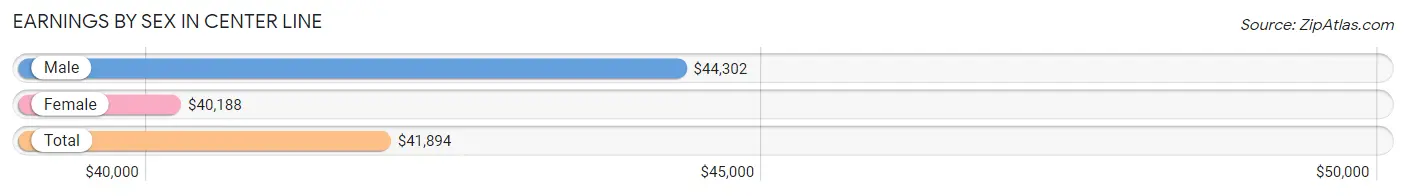
Earnings by Sex in Center Line
Average Earnings in Center Line are $41,894, $44,302 for men and $40,188 for women, a difference of 9.3%.
| Sex | Number | Average Earnings |
| Male | 2,210 (51.1%) | $44,302 |
| Female | 2,117 (48.9%) | $40,188 |
| Total | 4,327 (100.0%) | $41,894 |
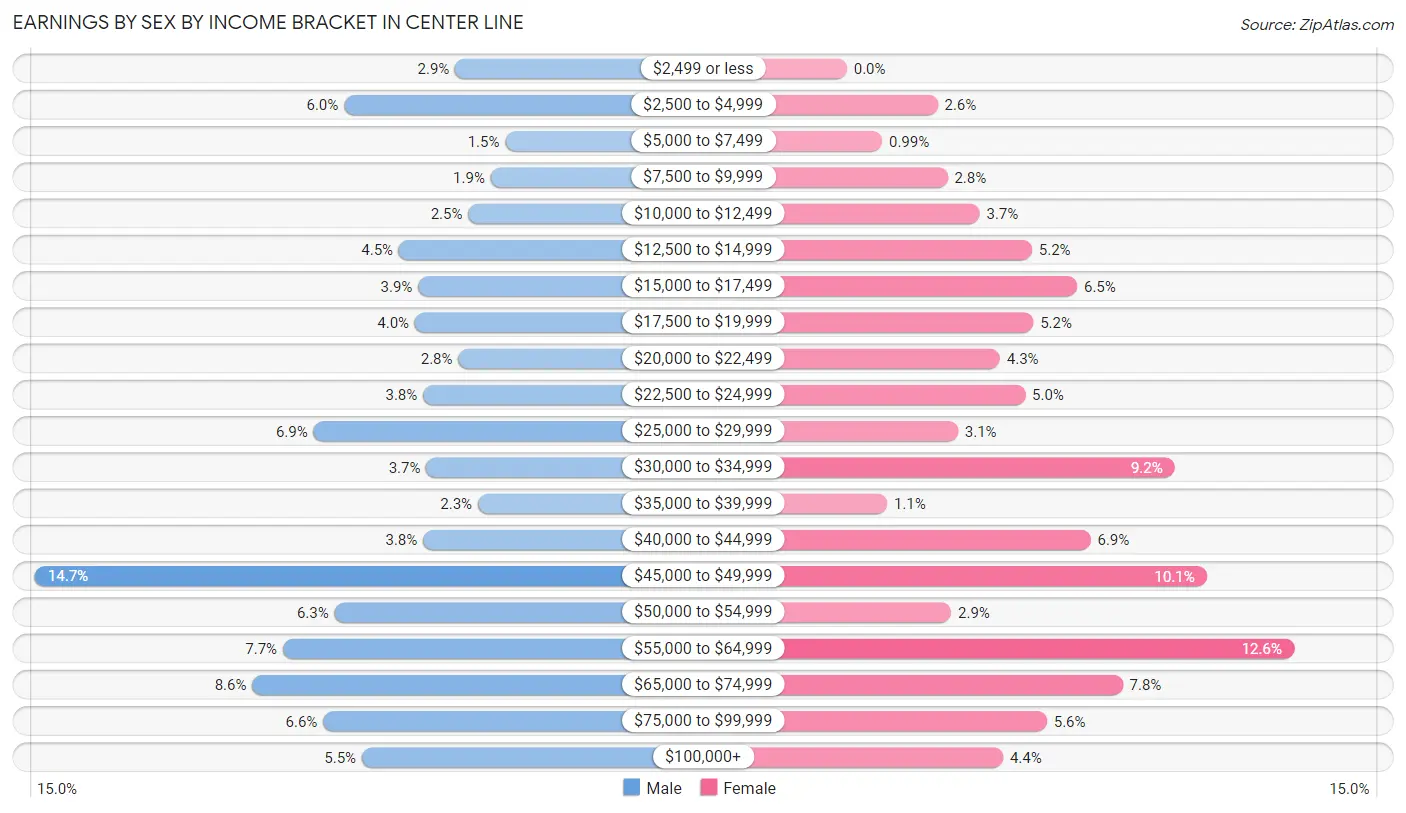
Earnings by Sex by Income Bracket in Center Line
The most common earnings brackets in Center Line are $45,000 to $49,999 for men (325 | 14.7%) and $55,000 to $64,999 for women (266 | 12.6%).
| Income | Male | Female |
| $2,499 or less | 64 (2.9%) | 0 (0.0%) |
| $2,500 to $4,999 | 133 (6.0%) | 54 (2.5%) |
| $5,000 to $7,499 | 33 (1.5%) | 21 (1.0%) |
| $7,500 to $9,999 | 42 (1.9%) | 60 (2.8%) |
| $10,000 to $12,499 | 56 (2.5%) | 79 (3.7%) |
| $12,500 to $14,999 | 99 (4.5%) | 110 (5.2%) |
| $15,000 to $17,499 | 87 (3.9%) | 137 (6.5%) |
| $17,500 to $19,999 | 89 (4.0%) | 111 (5.2%) |
| $20,000 to $22,499 | 62 (2.8%) | 91 (4.3%) |
| $22,500 to $24,999 | 84 (3.8%) | 106 (5.0%) |
| $25,000 to $29,999 | 152 (6.9%) | 66 (3.1%) |
| $30,000 to $34,999 | 82 (3.7%) | 195 (9.2%) |
| $35,000 to $39,999 | 50 (2.3%) | 24 (1.1%) |
| $40,000 to $44,999 | 84 (3.8%) | 145 (6.9%) |
| $45,000 to $49,999 | 325 (14.7%) | 214 (10.1%) |
| $50,000 to $54,999 | 139 (6.3%) | 62 (2.9%) |
| $55,000 to $64,999 | 171 (7.7%) | 266 (12.6%) |
| $65,000 to $74,999 | 190 (8.6%) | 164 (7.7%) |
| $75,000 to $99,999 | 146 (6.6%) | 119 (5.6%) |
| $100,000+ | 122 (5.5%) | 93 (4.4%) |
| Total | 2,210 (100.0%) | 2,117 (100.0%) |
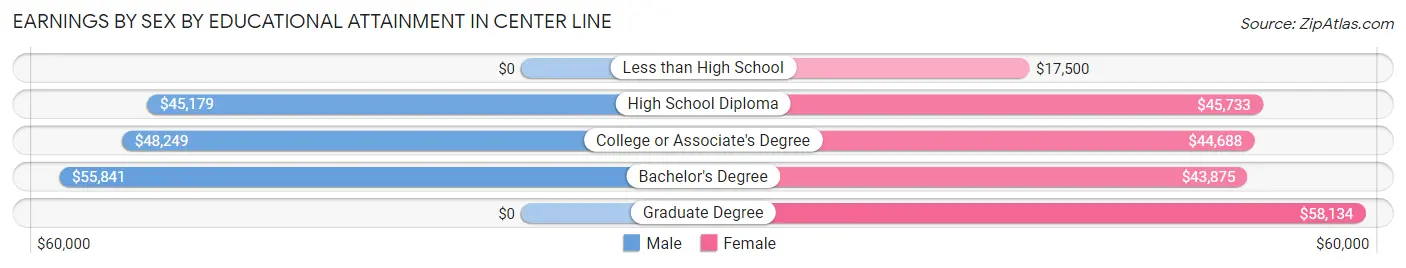
Earnings by Sex by Educational Attainment in Center Line
Average earnings in Center Line are $47,859 for men and $44,132 for women, a difference of 7.8%. Men with an educational attainment of bachelor's degree enjoy the highest average annual earnings of $55,841, while those with high school diploma education earn the least with $45,179. Women with an educational attainment of graduate degree earn the most with the average annual earnings of $58,134, while those with less than high school education have the smallest earnings of $17,500.
| Educational Attainment | Male Income | Female Income |
| Less than High School | - | - |
| High School Diploma | $45,179 | $45,733 |
| College or Associate's Degree | $48,249 | $44,688 |
| Bachelor's Degree | $55,841 | $43,875 |
| Graduate Degree | - | - |
| Total | $47,859 | $44,132 |
Family Income in Center Line
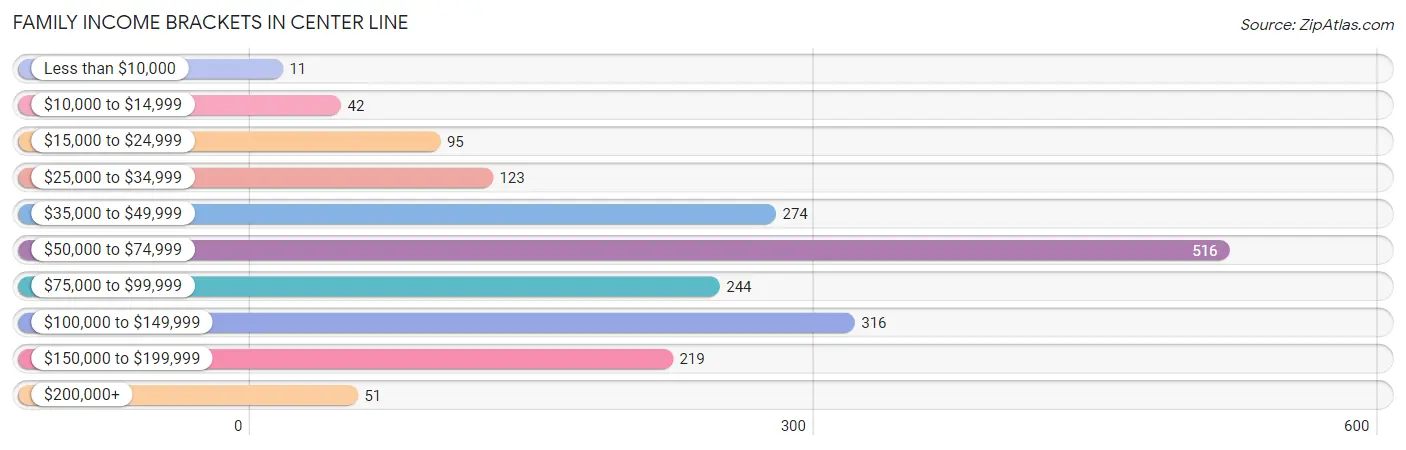
Family Income Brackets in Center Line
According to the Center Line family income data, there are 516 families falling into the $50,000 to $74,999 income range, which is the most common income bracket and makes up 27.3% of all families. Conversely, the less than $10,000 income bracket is the least frequent group with only 11 families (0.6%) belonging to this category.
| Income Bracket | # Families | % Families |
| Less than $10,000 | 11 | 0.6% |
| $10,000 to $14,999 | 42 | 2.2% |
| $15,000 to $24,999 | 95 | 5.0% |
| $25,000 to $34,999 | 123 | 6.5% |
| $35,000 to $49,999 | 274 | 14.5% |
| $50,000 to $74,999 | 516 | 27.3% |
| $75,000 to $99,999 | 244 | 12.9% |
| $100,000 to $149,999 | 316 | 16.7% |
| $150,000 to $199,999 | 219 | 11.6% |
| $200,000+ | 51 | 2.7% |
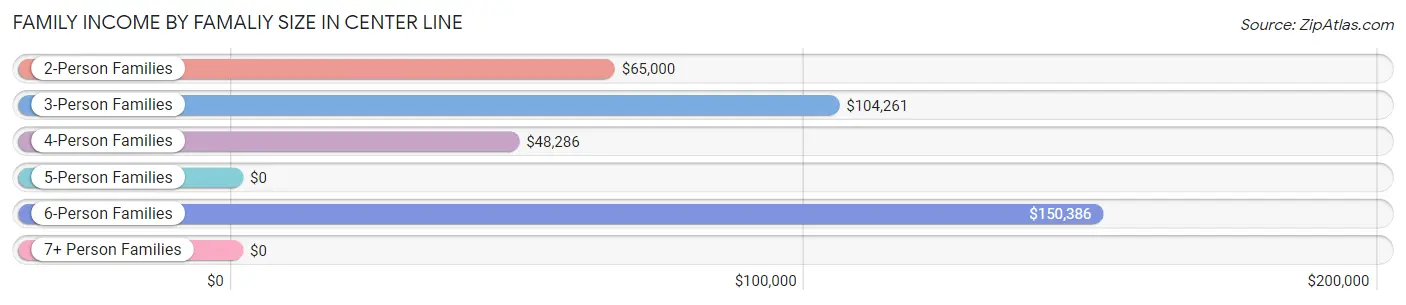
Family Income by Famaliy Size in Center Line
6-person families (186 | 9.8%) account for the highest median family income in Center Line with $150,386 per family, while 3-person families (375 | 19.8%) have the highest median income of $34,754 per family member.
| Income Bracket | # Families | Median Income |
| 2-Person Families | 932 (49.3%) | $65,000 |
| 3-Person Families | 375 (19.8%) | $104,261 |
| 4-Person Families | 340 (18.0%) | $48,286 |
| 5-Person Families | 13 (0.7%) | $0 |
| 6-Person Families | 186 (9.8%) | $150,386 |
| 7+ Person Families | 45 (2.4%) | $0 |
| Total | 1,891 (100.0%) | $69,235 |
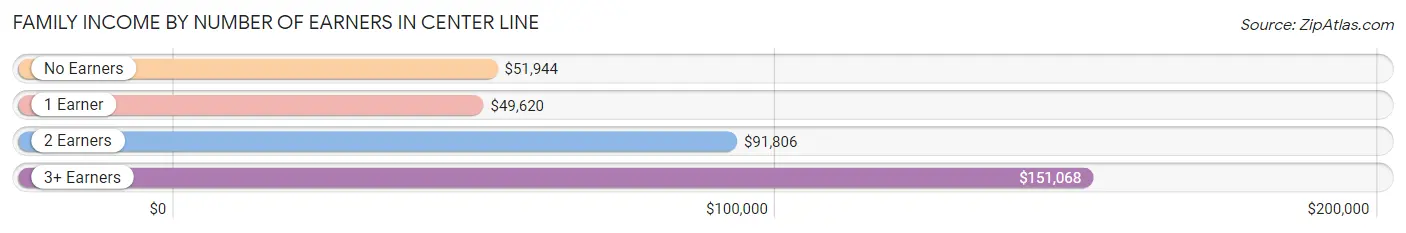
Family Income by Number of Earners in Center Line
The median family income in Center Line is $69,235, with families comprising 3+ earners (280) having the highest median family income of $151,068, while families with 1 earner (564) have the lowest median family income of $49,620, accounting for 14.8% and 29.8% of families, respectively.
| Number of Earners | # Families | Median Income |
| No Earners | 308 (16.3%) | $51,944 |
| 1 Earner | 564 (29.8%) | $49,620 |
| 2 Earners | 739 (39.1%) | $91,806 |
| 3+ Earners | 280 (14.8%) | $151,068 |
| Total | 1,891 (100.0%) | $69,235 |
Household Income in Center Line
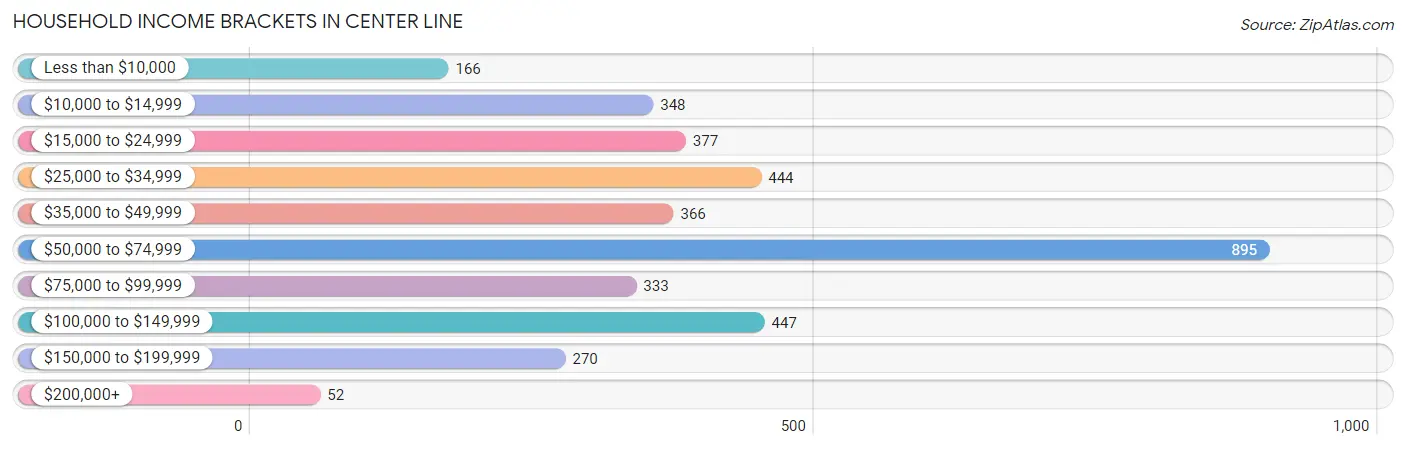
Household Income Brackets in Center Line
With 895 households falling in the category, the $50,000 to $74,999 income range is the most frequent in Center Line, accounting for 24.2% of all households. In contrast, only 52 households (1.4%) fall into the $200,000+ income bracket, making it the least populous group.
| Income Bracket | # Households | % Households |
| Less than $10,000 | 166 | 4.5% |
| $10,000 to $14,999 | 348 | 9.4% |
| $15,000 to $24,999 | 377 | 10.2% |
| $25,000 to $34,999 | 444 | 12.0% |
| $35,000 to $49,999 | 366 | 9.9% |
| $50,000 to $74,999 | 895 | 24.2% |
| $75,000 to $99,999 | 333 | 9.0% |
| $100,000 to $149,999 | 447 | 12.1% |
| $150,000 to $199,999 | 270 | 7.3% |
| $200,000+ | 52 | 1.4% |
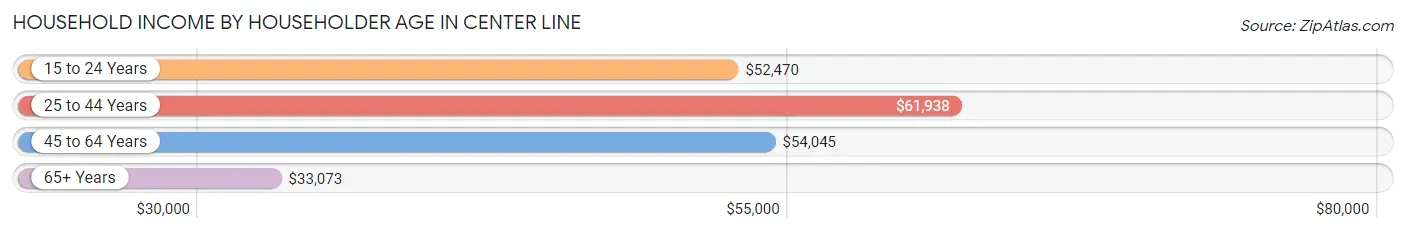
Household Income by Householder Age in Center Line
The median household income in Center Line is $52,067, with the highest median household income of $61,938 found in the 25 to 44 years age bracket for the primary householder. A total of 1,146 households (31.0%) fall into this category. Meanwhile, the 65+ years age bracket for the primary householder has the lowest median household income of $33,073, with 766 households (20.7%) in this group.
| Income Bracket | # Households | Median Income |
| 15 to 24 Years | 143 (3.9%) | $52,470 |
| 25 to 44 Years | 1,146 (31.0%) | $61,938 |
| 45 to 64 Years | 1,643 (44.4%) | $54,045 |
| 65+ Years | 766 (20.7%) | $33,073 |
| Total | 3,698 (100.0%) | $52,067 |
Poverty in Center Line
Income Below Poverty by Sex and Age in Center Line
With 9.5% poverty level for males and 10.0% for females among the residents of Center Line, 55 to 64 year old males and 35 to 44 year old females are the most vulnerable to poverty, with 159 males (28.0%) and 95 females (17.9%) in their respective age groups living below the poverty level.
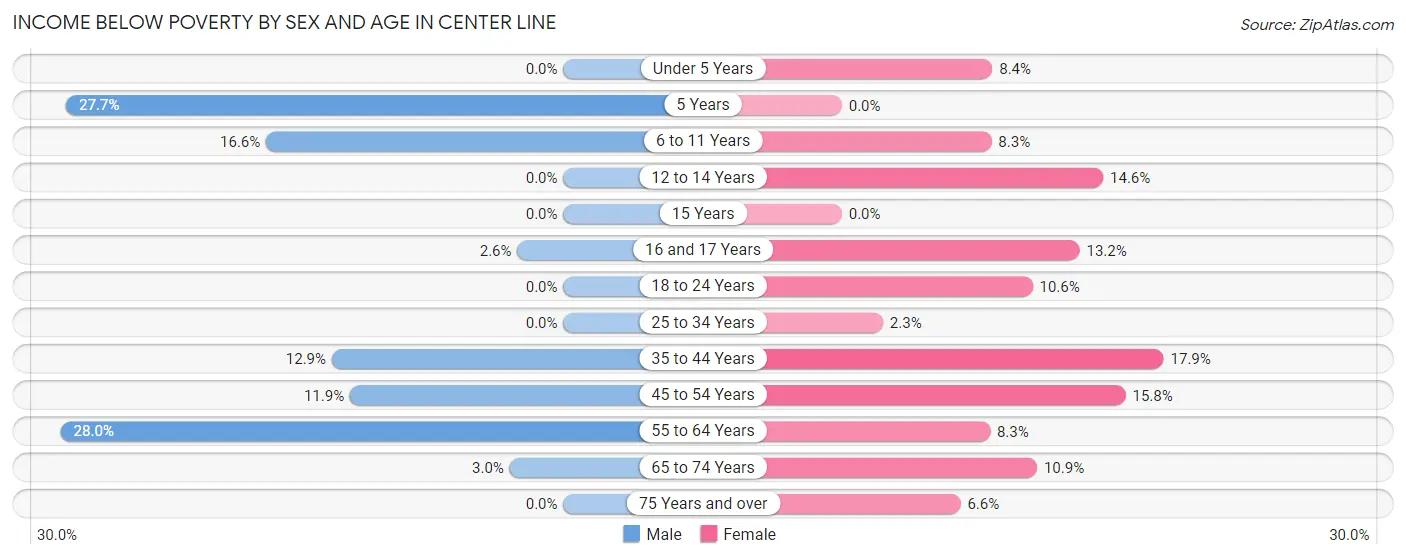
| Age Bracket | Male | Female |
| Under 5 Years | 0 (0.0%) | 14 (8.4%) |
| 5 Years | 18 (27.7%) | 0 (0.0%) |
| 6 to 11 Years | 69 (16.6%) | 31 (8.3%) |
| 12 to 14 Years | 0 (0.0%) | 8 (14.5%) |
| 15 Years | 0 (0.0%) | 0 (0.0%) |
| 16 and 17 Years | 3 (2.6%) | 18 (13.2%) |
| 18 to 24 Years | 0 (0.0%) | 24 (10.6%) |
| 25 to 34 Years | 0 (0.0%) | 15 (2.3%) |
| 35 to 44 Years | 58 (12.9%) | 95 (17.9%) |
| 45 to 54 Years | 70 (11.9%) | 118 (15.8%) |
| 55 to 64 Years | 159 (28.0%) | 41 (8.3%) |
| 65 to 74 Years | 12 (3.0%) | 40 (10.9%) |
| 75 Years and over | 0 (0.0%) | 17 (6.6%) |
| Total | 389 (9.5%) | 421 (10.0%) |
Income Above Poverty by Sex and Age in Center Line
According to the poverty statistics in Center Line, males aged under 5 years and females aged 5 years are the age groups that are most secure financially, with 100.0% of males and 100.0% of females in these age groups living above the poverty line.
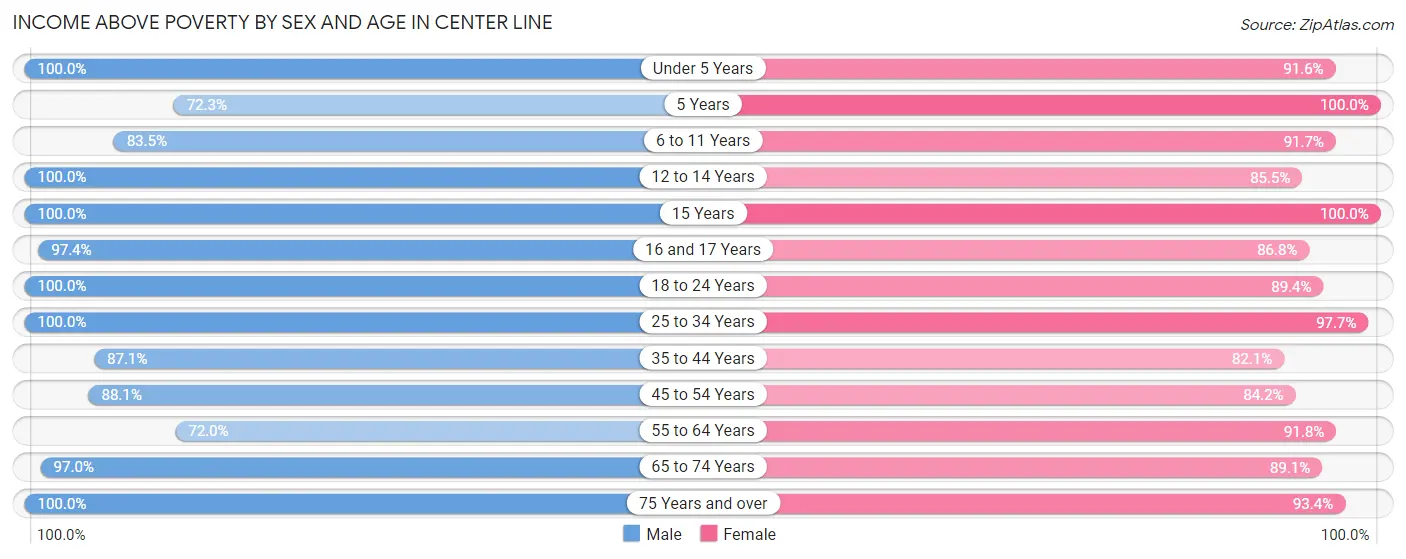
| Age Bracket | Male | Female |
| Under 5 Years | 208 (100.0%) | 153 (91.6%) |
| 5 Years | 47 (72.3%) | 35 (100.0%) |
| 6 to 11 Years | 348 (83.5%) | 341 (91.7%) |
| 12 to 14 Years | 203 (100.0%) | 47 (85.5%) |
| 15 Years | 21 (100.0%) | 148 (100.0%) |
| 16 and 17 Years | 114 (97.4%) | 118 (86.8%) |
| 18 to 24 Years | 289 (100.0%) | 202 (89.4%) |
| 25 to 34 Years | 599 (100.0%) | 639 (97.7%) |
| 35 to 44 Years | 392 (87.1%) | 435 (82.1%) |
| 45 to 54 Years | 519 (88.1%) | 629 (84.2%) |
| 55 to 64 Years | 409 (72.0%) | 456 (91.7%) |
| 65 to 74 Years | 389 (97.0%) | 328 (89.1%) |
| 75 Years and over | 151 (100.0%) | 240 (93.4%) |
| Total | 3,689 (90.5%) | 3,771 (90.0%) |
Income Below Poverty Among Married-Couple Families in Center Line
The poverty statistics for married-couple families in Center Line show that 2.4% or 29 of the total 1,210 families live below the poverty line. Families with 3 or 4 children have the highest poverty rate of 18.2%, comprising of 18 families. On the other hand, families with 1 or 2 children have the lowest poverty rate of 0.0%, which includes 0 families.
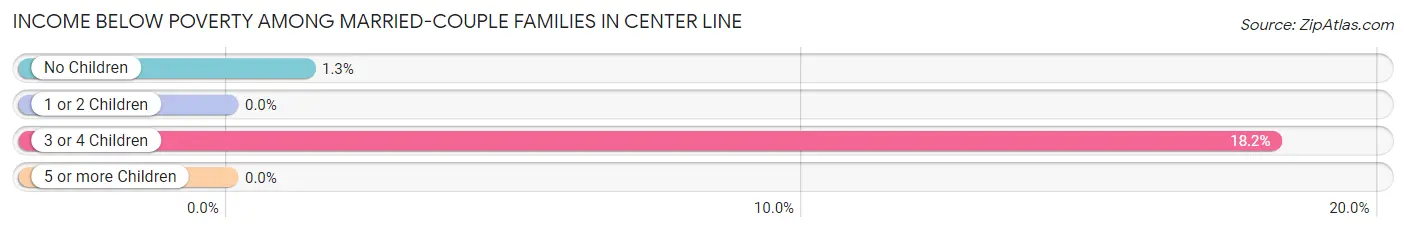
| Children | Above Poverty | Below Poverty |
| No Children | 812 (98.7%) | 11 (1.3%) |
| 1 or 2 Children | 288 (100.0%) | 0 (0.0%) |
| 3 or 4 Children | 81 (81.8%) | 18 (18.2%) |
| 5 or more Children | 0 (0.0%) | 0 (0.0%) |
| Total | 1,181 (97.6%) | 29 (2.4%) |
Income Below Poverty Among Single-Parent Households in Center Line
According to the poverty data in Center Line, 8.8% or 13 single-father households and 2.4% or 13 single-mother households are living below the poverty line. Among single-father households, those with 1 or 2 children have the highest poverty rate, with 13 households (22.0%) experiencing poverty. Likewise, among single-mother households, those with 5 or more children have the highest poverty rate, with 3 households (100.0%) falling below the poverty line.
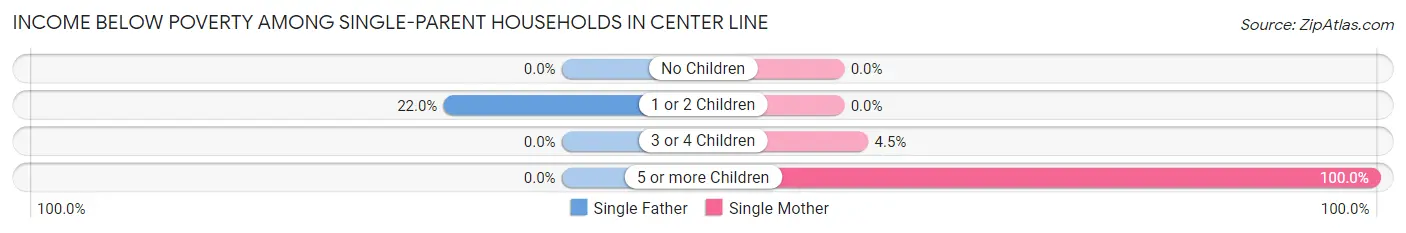
| Children | Single Father | Single Mother |
| No Children | 0 (0.0%) | 0 (0.0%) |
| 1 or 2 Children | 13 (22.0%) | 0 (0.0%) |
| 3 or 4 Children | 0 (0.0%) | 10 (4.5%) |
| 5 or more Children | 0 (0.0%) | 3 (100.0%) |
| Total | 13 (8.8%) | 13 (2.4%) |
Income Below Poverty Among Married-Couple vs Single-Parent Households in Center Line
The poverty data for Center Line shows that 29 of the married-couple family households (2.4%) and 26 of the single-parent households (3.8%) are living below the poverty level. Within the married-couple family households, those with 3 or 4 children have the highest poverty rate, with 18 households (18.2%) falling below the poverty line. Among the single-parent households, those with 5 or more children have the highest poverty rate, with 3 household (100.0%) living below poverty.
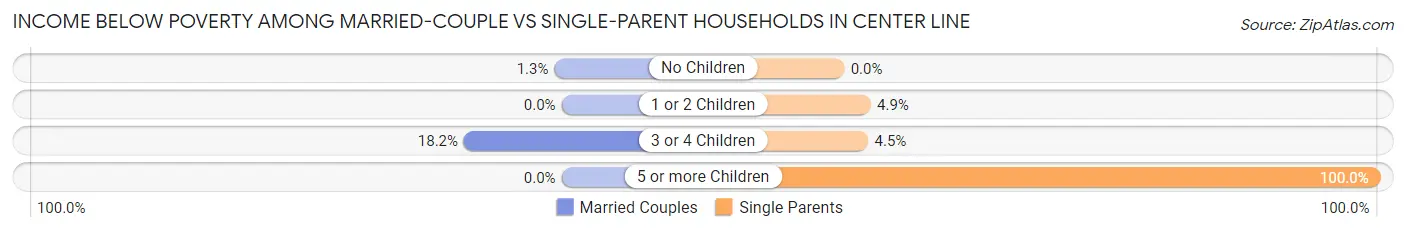
| Children | Married-Couple Families | Single-Parent Households |
| No Children | 11 (1.3%) | 0 (0.0%) |
| 1 or 2 Children | 0 (0.0%) | 13 (4.9%) |
| 3 or 4 Children | 18 (18.2%) | 10 (4.5%) |
| 5 or more Children | 0 (0.0%) | 3 (100.0%) |
| Total | 29 (2.4%) | 26 (3.8%) |
Race in Center Line
The most populous races in Center Line are White / Caucasian (4,885 | 57.5%), Black / African American (2,628 | 30.9%), and Asian (480 | 5.7%).
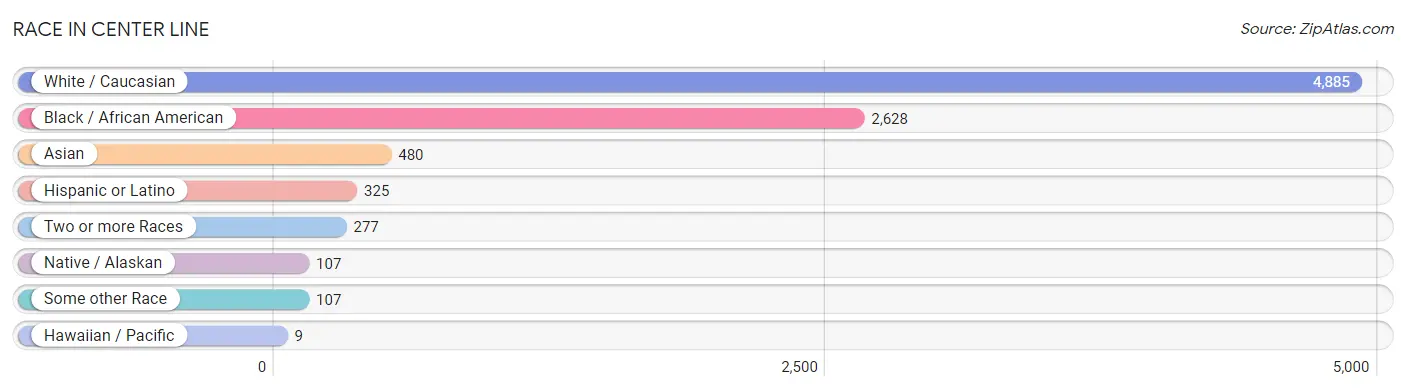
| Race | # Population | % Population |
| Asian | 480 | 5.7% |
| Black / African American | 2,628 | 30.9% |
| Hawaiian / Pacific | 9 | 0.1% |
| Hispanic or Latino | 325 | 3.8% |
| Native / Alaskan | 107 | 1.3% |
| White / Caucasian | 4,885 | 57.5% |
| Two or more Races | 277 | 3.3% |
| Some other Race | 107 | 1.3% |
| Total | 8,493 | 100.0% |
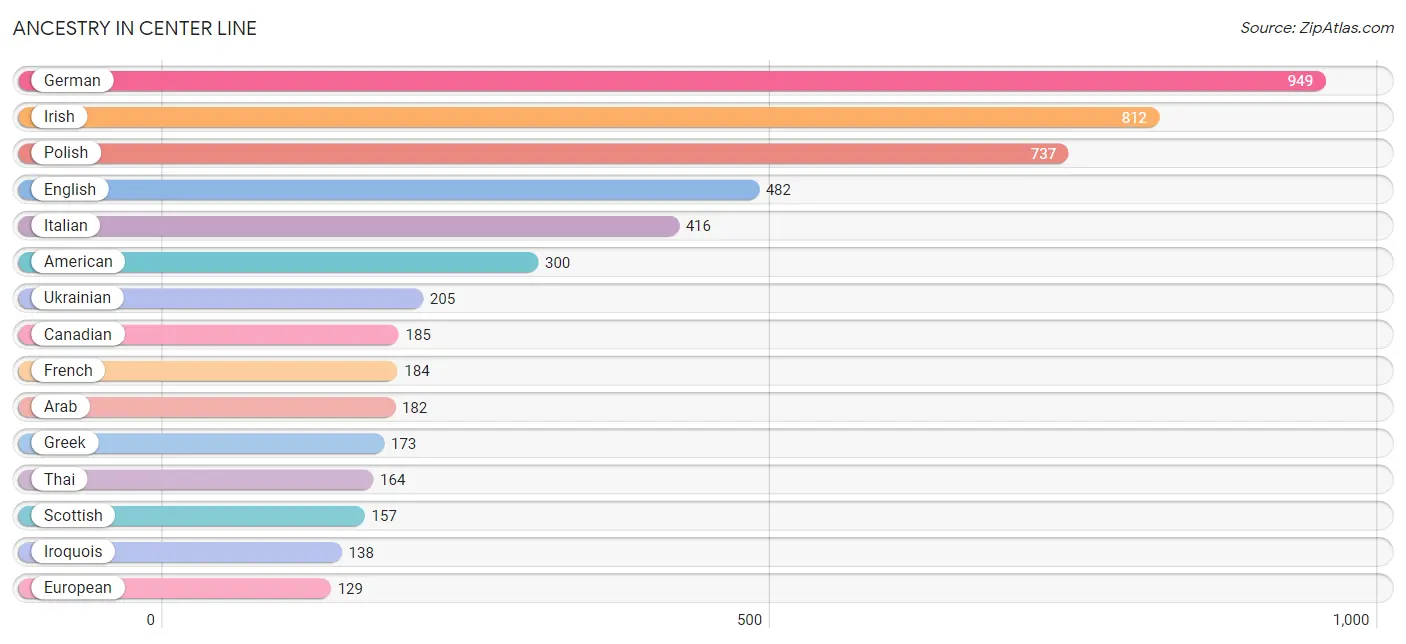
Ancestry in Center Line
The most populous ancestries reported in Center Line are German (949 | 11.2%), Irish (812 | 9.6%), Polish (737 | 8.7%), English (482 | 5.7%), and Italian (416 | 4.9%), together accounting for 40.0% of all Center Line residents.
| Ancestry | # Population | % Population |
| African | 11 | 0.1% |
| American | 300 | 3.5% |
| Arab | 182 | 2.1% |
| Argentinean | 84 | 1.0% |
| Assyrian / Chaldean / Syriac | 23 | 0.3% |
| Austrian | 7 | 0.1% |
| Belgian | 41 | 0.5% |
| Bhutanese | 25 | 0.3% |
| Brazilian | 9 | 0.1% |
| British | 13 | 0.2% |
| Bulgarian | 42 | 0.5% |
| Canadian | 185 | 2.2% |
| Central American | 89 | 1.1% |
| Cherokee | 12 | 0.1% |
| Chippewa | 33 | 0.4% |
| Croatian | 34 | 0.4% |
| Cuban | 29 | 0.3% |
| Czech | 29 | 0.3% |
| Danish | 33 | 0.4% |
| Dutch | 110 | 1.3% |
| Egyptian | 17 | 0.2% |
| English | 482 | 5.7% |
| European | 129 | 1.5% |
| Finnish | 61 | 0.7% |
| French | 184 | 2.2% |
| French Canadian | 33 | 0.4% |
| German | 949 | 11.2% |
| Greek | 173 | 2.0% |
| Indian (Asian) | 7 | 0.1% |
| Iraqi | 100 | 1.2% |
| Irish | 812 | 9.6% |
| Iroquois | 138 | 1.6% |
| Italian | 416 | 4.9% |
| Korean | 107 | 1.3% |
| Lebanese | 58 | 0.7% |
| Lithuanian | 21 | 0.3% |
| Mexican | 30 | 0.4% |
| Native Hawaiian | 9 | 0.1% |
| Nicaraguan | 89 | 1.1% |
| Nigerian | 11 | 0.1% |
| Norwegian | 128 | 1.5% |
| Polish | 737 | 8.7% |
| Portuguese | 13 | 0.2% |
| Puerto Rican | 93 | 1.1% |
| Romanian | 33 | 0.4% |
| Russian | 48 | 0.6% |
| Scandinavian | 15 | 0.2% |
| Scotch-Irish | 47 | 0.5% |
| Scottish | 157 | 1.8% |
| Seminole | 32 | 0.4% |
| South American | 84 | 1.0% |
| Sri Lankan | 54 | 0.6% |
| Subsaharan African | 11 | 0.1% |
| Swedish | 78 | 0.9% |
| Thai | 164 | 1.9% |
| Ukrainian | 205 | 2.4% |
| Vietnamese | 91 | 1.1% |
| Welsh | 53 | 0.6% |
| Yugoslavian | 7 | 0.1% | View All 59 Rows |
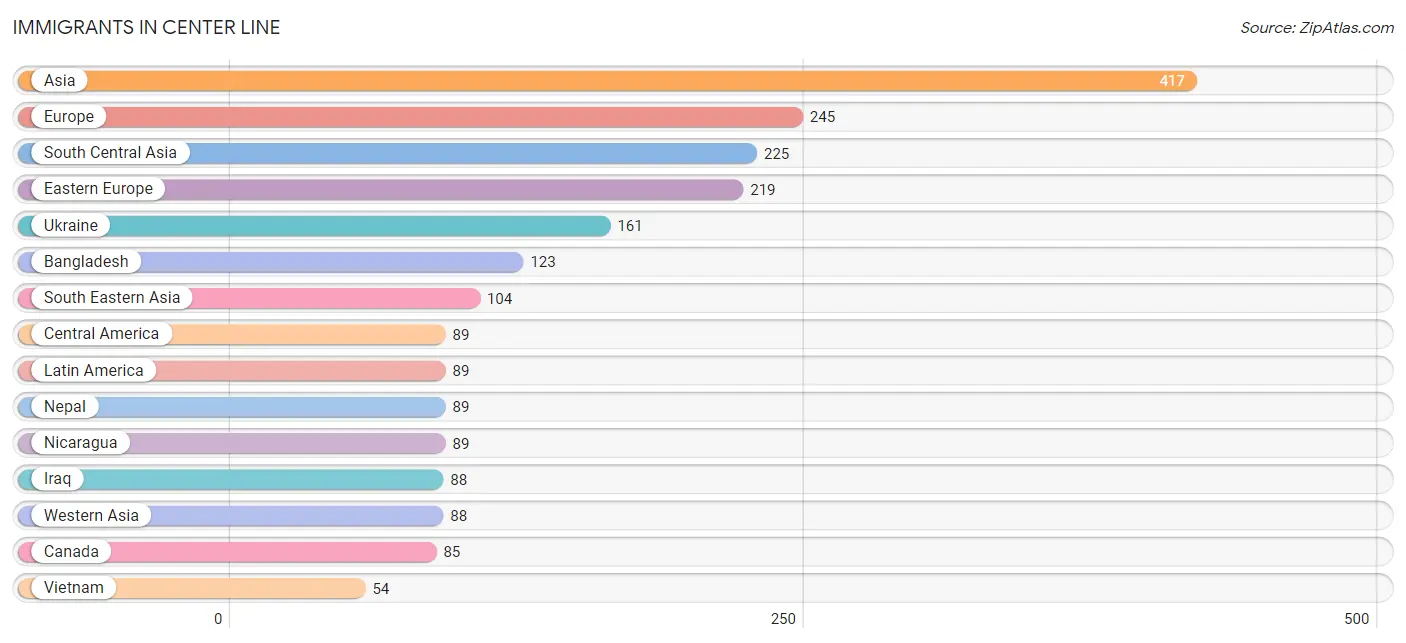
Immigrants in Center Line
The most numerous immigrant groups reported in Center Line came from Asia (417 | 4.9%), Europe (245 | 2.9%), South Central Asia (225 | 2.6%), Eastern Europe (219 | 2.6%), and Ukraine (161 | 1.9%), together accounting for 14.9% of all Center Line residents.
| Immigration Origin | # Population | % Population |
| Africa | 28 | 0.3% |
| Asia | 417 | 4.9% |
| Bangladesh | 123 | 1.5% |
| Bulgaria | 21 | 0.3% |
| Canada | 85 | 1.0% |
| Central America | 89 | 1.1% |
| Croatia | 15 | 0.2% |
| Eastern Europe | 219 | 2.6% |
| Egypt | 17 | 0.2% |
| Europe | 245 | 2.9% |
| Germany | 10 | 0.1% |
| Iraq | 88 | 1.0% |
| Latin America | 89 | 1.1% |
| Nepal | 89 | 1.1% |
| Nicaragua | 89 | 1.1% |
| Nigeria | 11 | 0.1% |
| Northern Africa | 17 | 0.2% |
| Northern Europe | 16 | 0.2% |
| Pakistan | 13 | 0.2% |
| Philippines | 50 | 0.6% |
| Poland | 9 | 0.1% |
| Scotland | 16 | 0.2% |
| South Central Asia | 225 | 2.6% |
| South Eastern Asia | 104 | 1.2% |
| Ukraine | 161 | 1.9% |
| Vietnam | 54 | 0.6% |
| Western Africa | 11 | 0.1% |
| Western Asia | 88 | 1.0% |
| Western Europe | 10 | 0.1% | View All 29 Rows |
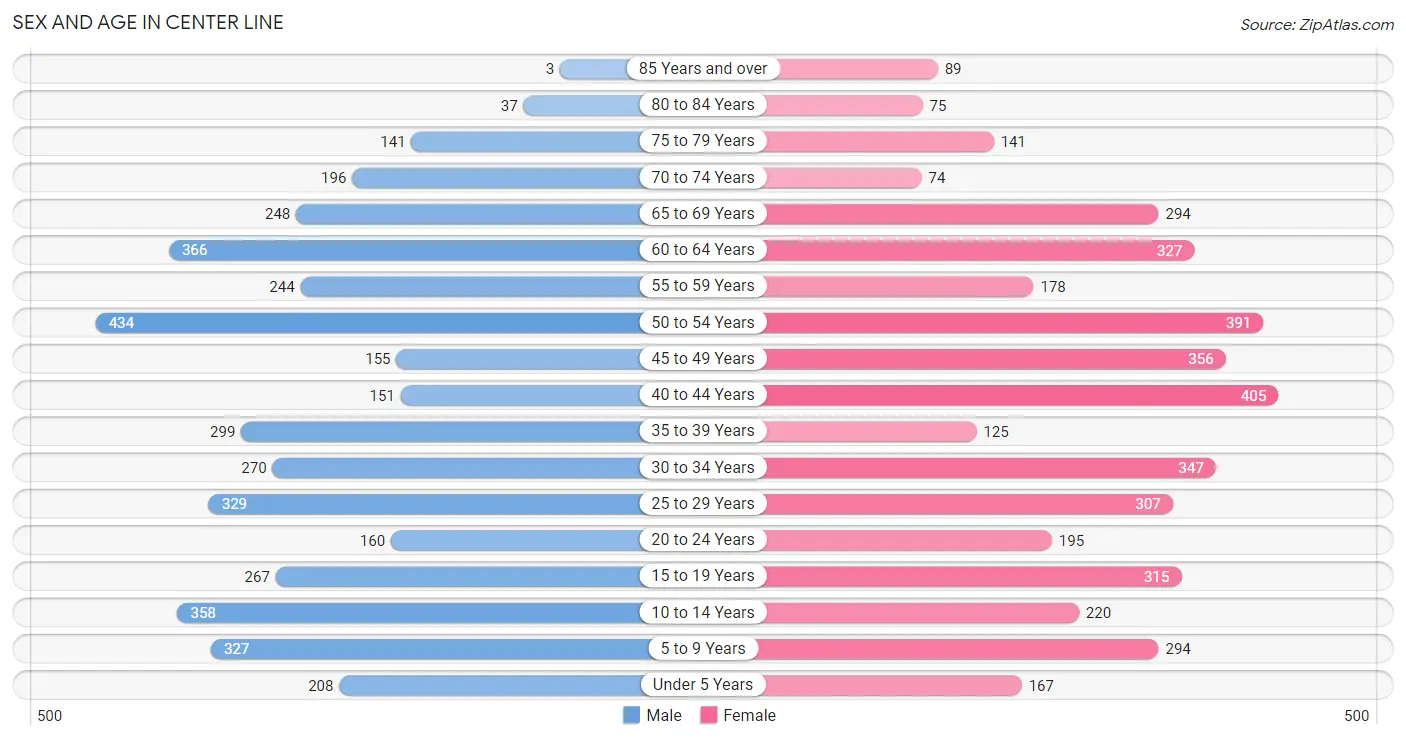
Sex and Age in Center Line
Sex and Age in Center Line
The most populous age groups in Center Line are 50 to 54 Years (434 | 10.3%) for men and 40 to 44 Years (405 | 9.4%) for women.
| Age Bracket | Male | Female |
| Under 5 Years | 208 (5.0%) | 167 (3.9%) |
| 5 to 9 Years | 327 (7.8%) | 294 (6.8%) |
| 10 to 14 Years | 358 (8.5%) | 220 (5.1%) |
| 15 to 19 Years | 267 (6.4%) | 315 (7.3%) |
| 20 to 24 Years | 160 (3.8%) | 195 (4.5%) |
| 25 to 29 Years | 329 (7.9%) | 307 (7.1%) |
| 30 to 34 Years | 270 (6.4%) | 347 (8.1%) |
| 35 to 39 Years | 299 (7.1%) | 125 (2.9%) |
| 40 to 44 Years | 151 (3.6%) | 405 (9.4%) |
| 45 to 49 Years | 155 (3.7%) | 356 (8.3%) |
| 50 to 54 Years | 434 (10.3%) | 391 (9.1%) |
| 55 to 59 Years | 244 (5.8%) | 178 (4.1%) |
| 60 to 64 Years | 366 (8.7%) | 327 (7.6%) |
| 65 to 69 Years | 248 (5.9%) | 294 (6.8%) |
| 70 to 74 Years | 196 (4.7%) | 74 (1.7%) |
| 75 to 79 Years | 141 (3.4%) | 141 (3.3%) |
| 80 to 84 Years | 37 (0.9%) | 75 (1.7%) |
| 85 Years and over | 3 (0.1%) | 89 (2.1%) |
| Total | 4,193 (100.0%) | 4,300 (100.0%) |
Families and Households in Center Line
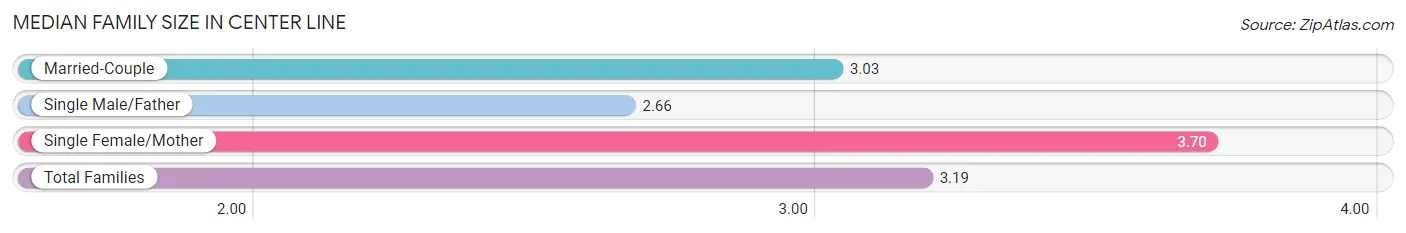
Median Family Size in Center Line
The median family size in Center Line is 3.19 persons per family, with single female/mother families (533 | 28.2%) accounting for the largest median family size of 3.7 persons per family. On the other hand, single male/father families (148 | 7.8%) represent the smallest median family size with 2.66 persons per family.
| Family Type | # Families | Family Size |
| Married-Couple | 1,210 (64.0%) | 3.03 |
| Single Male/Father | 148 (7.8%) | 2.66 |
| Single Female/Mother | 533 (28.2%) | 3.70 |
| Total Families | 1,891 (100.0%) | 3.19 |
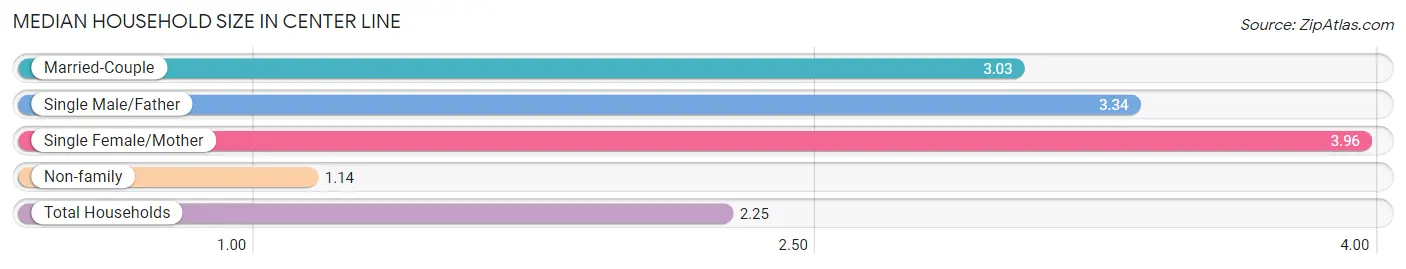
Median Household Size in Center Line
The median household size in Center Line is 2.25 persons per household, with single female/mother households (533 | 14.4%) accounting for the largest median household size of 3.96 persons per household. non-family households (1,807 | 48.9%) represent the smallest median household size with 1.14 persons per household.
| Household Type | # Households | Household Size |
| Married-Couple | 1,210 (32.7%) | 3.03 |
| Single Male/Father | 148 (4.0%) | 3.34 |
| Single Female/Mother | 533 (14.4%) | 3.96 |
| Non-family | 1,807 (48.9%) | 1.14 |
| Total Households | 3,698 (100.0%) | 2.25 |
Household Size by Marriage Status in Center Line
Out of a total of 3,698 households in Center Line, 1,891 (51.1%) are family households, while 1,807 (48.9%) are nonfamily households. The most numerous type of family households are 2-person households, comprising 932, and the most common type of nonfamily households are 1-person households, comprising 1,572.
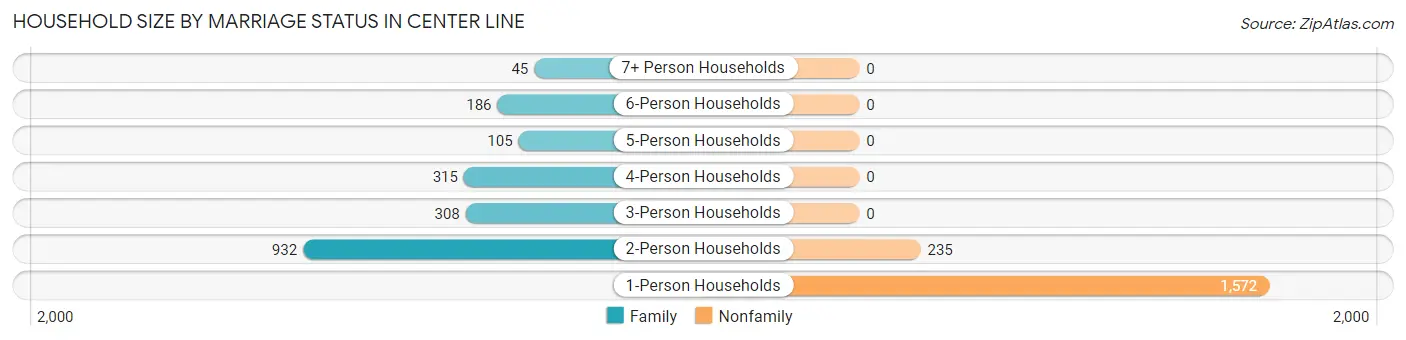
| Household Size | Family Households | Nonfamily Households |
| 1-Person Households | - | 1,572 (42.5%) |
| 2-Person Households | 932 (25.2%) | 235 (6.4%) |
| 3-Person Households | 308 (8.3%) | 0 (0.0%) |
| 4-Person Households | 315 (8.5%) | 0 (0.0%) |
| 5-Person Households | 105 (2.8%) | 0 (0.0%) |
| 6-Person Households | 186 (5.0%) | 0 (0.0%) |
| 7+ Person Households | 45 (1.2%) | 0 (0.0%) |
| Total | 1,891 (51.1%) | 1,807 (48.9%) |
Female Fertility in Center Line
Fertility by Age in Center Line
Average fertility rate in Center Line is 37.0 births per 1,000 women. Women in the age bracket of 20 to 34 years have the highest fertility rate with 90.0 births per 1,000 women. Women in the age bracket of 20 to 34 years acount for 100.0% of all women with births.
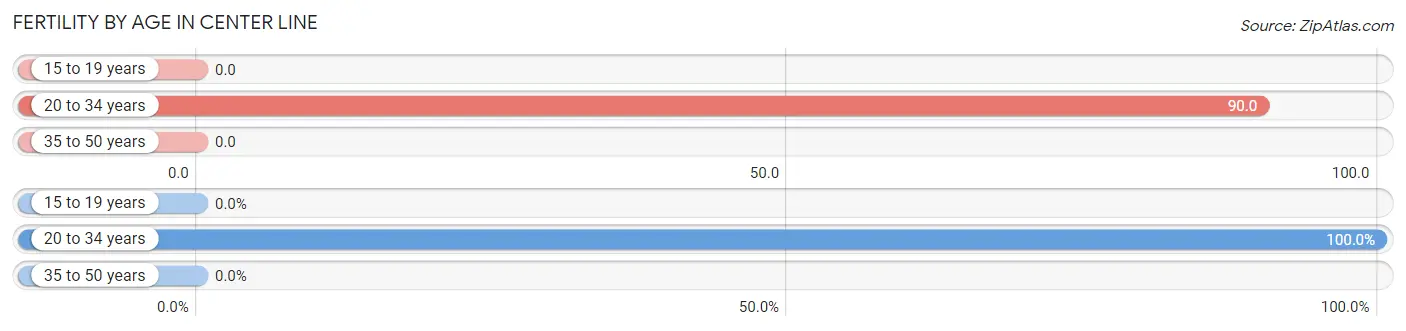
| Age Bracket | Women with Births | Births / 1,000 Women |
| 15 to 19 years | 0 (0.0%) | 0.0 |
| 20 to 34 years | 76 (100.0%) | 90.0 |
| 35 to 50 years | 0 (0.0%) | 0.0 |
| Total | 76 (100.0%) | 37.0 |
Fertility by Age by Marriage Status in Center Line
68.4% of women with births (76) in Center Line are married. The highest percentage of unmarried women with births falls into 20 to 34 years age bracket with 31.6% of them unmarried at the time of birth, while the lowest percentage of unmarried women with births belong to 20 to 34 years age bracket with 31.6% of them unmarried.
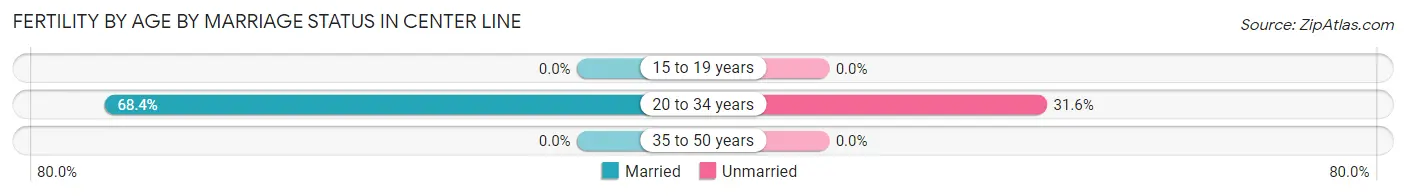
| Age Bracket | Married | Unmarried |
| 15 to 19 years | 0 (0.0%) | 0 (0.0%) |
| 20 to 34 years | 52 (68.4%) | 24 (31.6%) |
| 35 to 50 years | 0 (0.0%) | 0 (0.0%) |
| Total | 52 (68.4%) | 24 (31.6%) |
Fertility by Education in Center Line
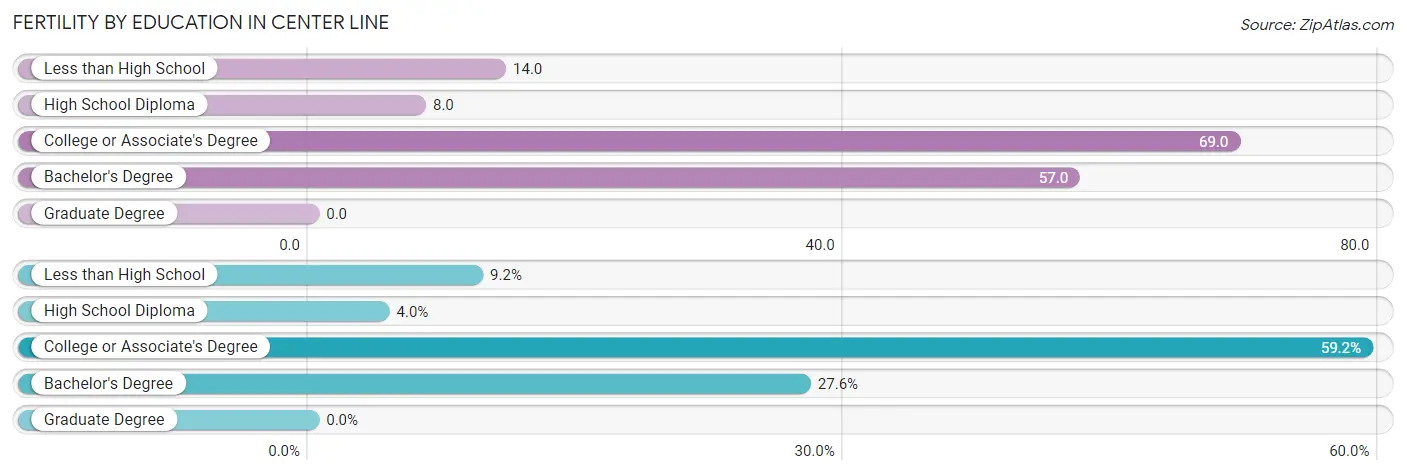
| Educational Attainment | Women with Births | Births / 1,000 Women |
| Less than High School | 7 (9.2%) | 14.0 |
| High School Diploma | 3 (4.0%) | 8.0 |
| College or Associate's Degree | 45 (59.2%) | 69.0 |
| Bachelor's Degree | 21 (27.6%) | 57.0 |
| Graduate Degree | 0 (0.0%) | 0.0 |
| Total | 76 (100.0%) | 37.0 |
Fertility by Education by Marriage Status in Center Line
31.6% of women with births in Center Line are unmarried. Women with the educational attainment of less than high school are most likely to be married with 100.0% of them married at childbirth, while women with the educational attainment of high school diploma are least likely to be married with 100.0% of them unmarried at childbirth.
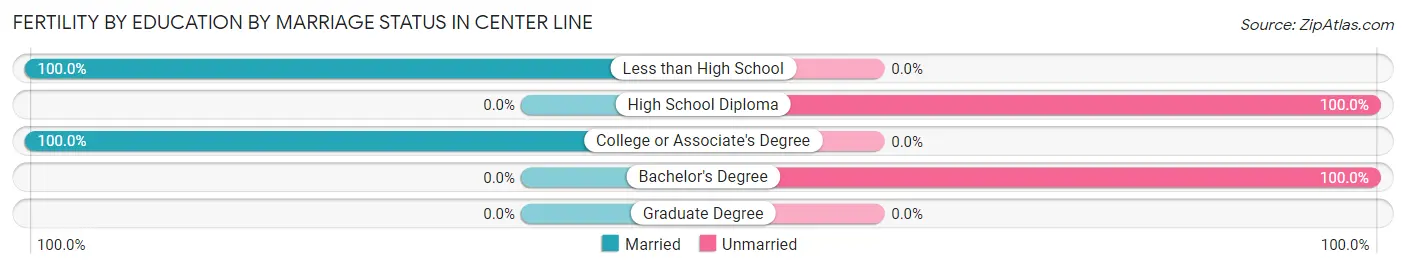
| Educational Attainment | Married | Unmarried |
| Less than High School | 7 (100.0%) | 0 (0.0%) |
| High School Diploma | 0 (0.0%) | 3 (100.0%) |
| College or Associate's Degree | 45 (100.0%) | 0 (0.0%) |
| Bachelor's Degree | 0 (0.0%) | 21 (100.0%) |
| Graduate Degree | 0 (0.0%) | 0 (0.0%) |
| Total | 52 (68.4%) | 24 (31.6%) |
Employment Characteristics in Center Line
Employment by Class of Employer in Center Line
Among the 3,984 employed individuals in Center Line, private company employees (2,829 | 71.0%), local government employees (470 | 11.8%), and not-for-profit organizations (394 | 9.9%) make up the most common classes of employment.
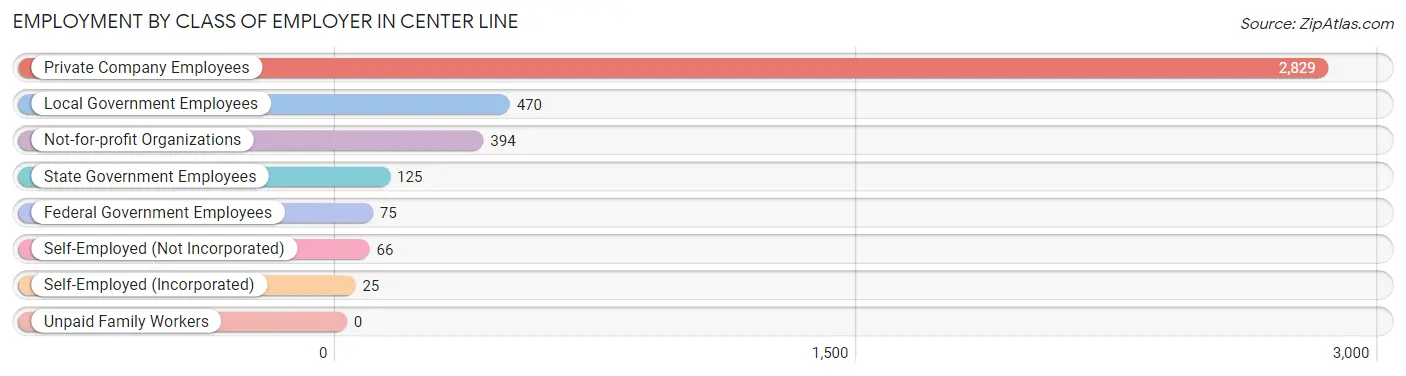
| Employer Class | # Employees | % Employees |
| Private Company Employees | 2,829 | 71.0% |
| Self-Employed (Incorporated) | 25 | 0.6% |
| Self-Employed (Not Incorporated) | 66 | 1.7% |
| Not-for-profit Organizations | 394 | 9.9% |
| Local Government Employees | 470 | 11.8% |
| State Government Employees | 125 | 3.1% |
| Federal Government Employees | 75 | 1.9% |
| Unpaid Family Workers | 0 | 0.0% |
| Total | 3,984 | 100.0% |
Employment Status by Age in Center Line
According to the labor force statistics for Center Line, out of the total population over 16 years of age (6,750), 66.0% or 4,455 individuals are in the labor force, with 6.4% or 285 of them unemployed. The age group with the highest labor force participation rate is 20 to 24 years, with 93.8% or 333 individuals in the labor force. Within the labor force, the 16 to 19 years age range has the highest percentage of unemployed individuals, with 35.3% or 71 of them being unemployed.
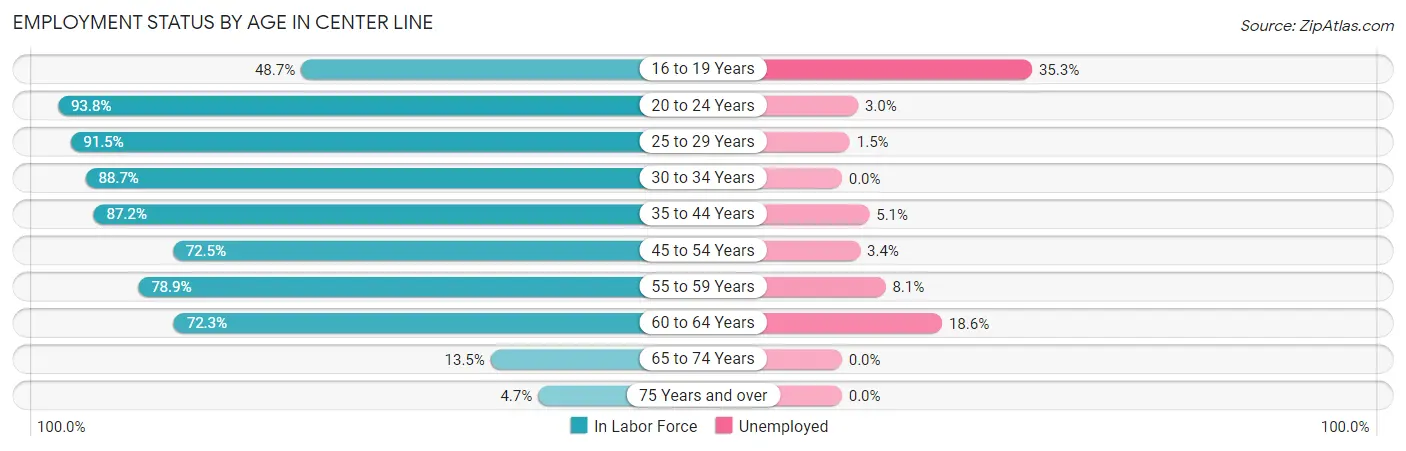
| Age Bracket | In Labor Force | Unemployed |
| 16 to 19 Years | 201 (48.7%) | 71 (35.3%) |
| 20 to 24 Years | 333 (93.8%) | 10 (3.0%) |
| 25 to 29 Years | 582 (91.5%) | 9 (1.5%) |
| 30 to 34 Years | 547 (88.7%) | 0 (0.0%) |
| 35 to 44 Years | 855 (87.2%) | 44 (5.1%) |
| 45 to 54 Years | 969 (72.5%) | 33 (3.4%) |
| 55 to 59 Years | 333 (78.9%) | 27 (8.1%) |
| 60 to 64 Years | 501 (72.3%) | 93 (18.6%) |
| 65 to 74 Years | 110 (13.5%) | 0 (0.0%) |
| 75 Years and over | 23 (4.7%) | 0 (0.0%) |
| Total | 4,455 (66.0%) | 285 (6.4%) |
Employment Status by Educational Attainment in Center Line
According to labor force statistics for Center Line, 80.8% of individuals (3,785) out of the total population between 25 and 64 years of age (4,684) are in the labor force, with 5.4% or 204 of them being unemployed. The group with the highest labor force participation rate are those with the educational attainment of bachelor's degree or higher, with 96.8% or 900 individuals in the labor force. Within the labor force, individuals with college / associate degree education have the highest percentage of unemployment, with 8.9% or 155 of them being unemployed.
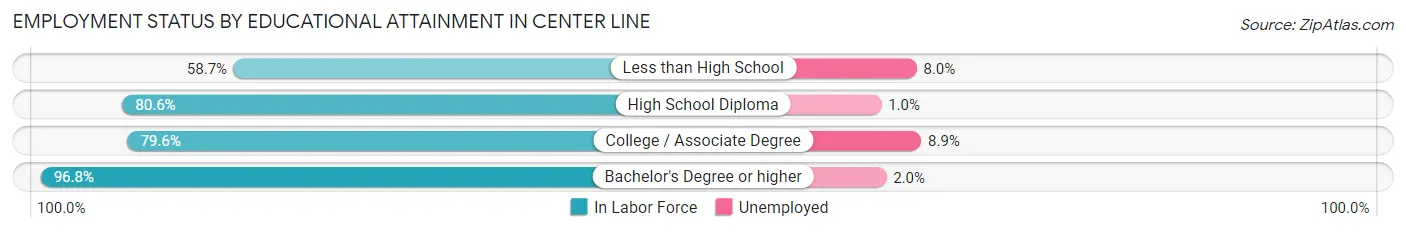
| Educational Attainment | In Labor Force | Unemployed |
| Less than High School | 313 (58.7%) | 43 (8.0%) |
| High School Diploma | 835 (80.6%) | 10 (1.0%) |
| College / Associate Degree | 1,739 (79.6%) | 194 (8.9%) |
| Bachelor's Degree or higher | 900 (96.8%) | 19 (2.0%) |
| Total | 3,785 (80.8%) | 253 (5.4%) |
Employment Occupations by Sex in Center Line
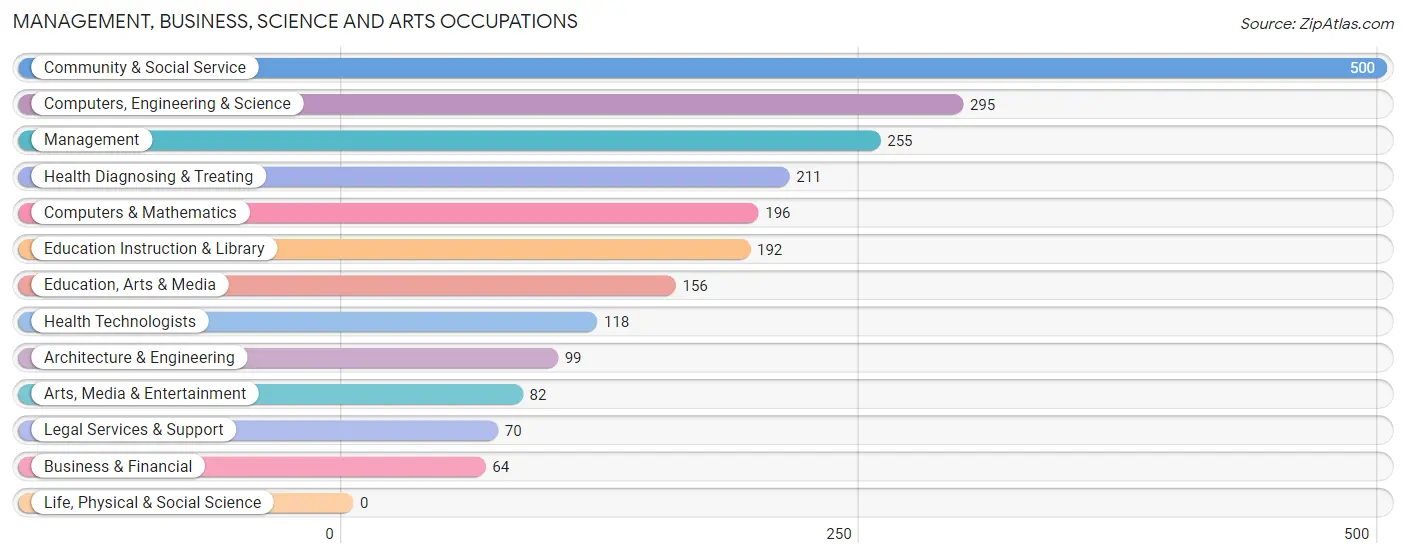
Management, Business, Science and Arts Occupations
The most common Management, Business, Science and Arts occupations in Center Line are Community & Social Service (500 | 12.0%), Computers, Engineering & Science (295 | 7.1%), Management (255 | 6.1%), Health Diagnosing & Treating (211 | 5.1%), and Computers & Mathematics (196 | 4.7%).
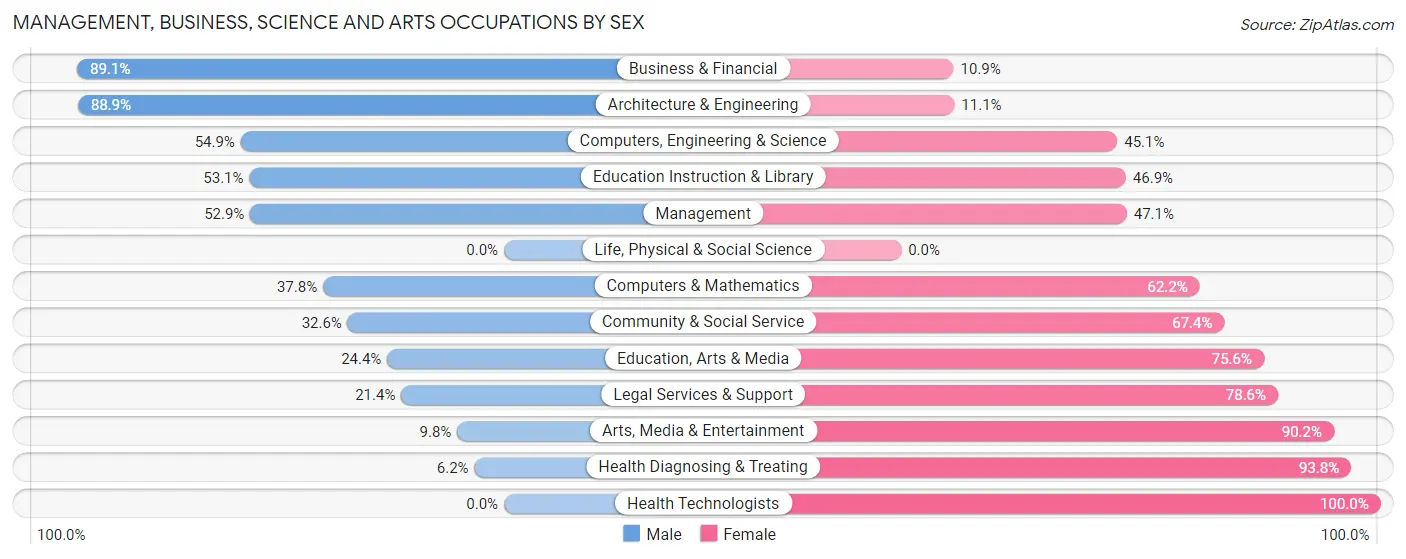
Management, Business, Science and Arts Occupations by Sex
Within the Management, Business, Science and Arts occupations in Center Line, the most male-oriented occupations are Business & Financial (89.1%), Architecture & Engineering (88.9%), and Computers, Engineering & Science (54.9%), while the most female-oriented occupations are Health Technologists (100.0%), Health Diagnosing & Treating (93.8%), and Arts, Media & Entertainment (90.2%).
| Occupation | Male | Female |
| Management | 135 (52.9%) | 120 (47.1%) |
| Business & Financial | 57 (89.1%) | 7 (10.9%) |
| Computers, Engineering & Science | 162 (54.9%) | 133 (45.1%) |
| Computers & Mathematics | 74 (37.8%) | 122 (62.2%) |
| Architecture & Engineering | 88 (88.9%) | 11 (11.1%) |
| Life, Physical & Social Science | 0 (0.0%) | 0 (0.0%) |
| Community & Social Service | 163 (32.6%) | 337 (67.4%) |
| Education, Arts & Media | 38 (24.4%) | 118 (75.6%) |
| Legal Services & Support | 15 (21.4%) | 55 (78.6%) |
| Education Instruction & Library | 102 (53.1%) | 90 (46.9%) |
| Arts, Media & Entertainment | 8 (9.8%) | 74 (90.2%) |
| Health Diagnosing & Treating | 13 (6.2%) | 198 (93.8%) |
| Health Technologists | 0 (0.0%) | 118 (100.0%) |
| Total (Category) | 530 (40.0%) | 795 (60.0%) |
| Total (Overall) | 2,112 (50.7%) | 2,055 (49.3%) |
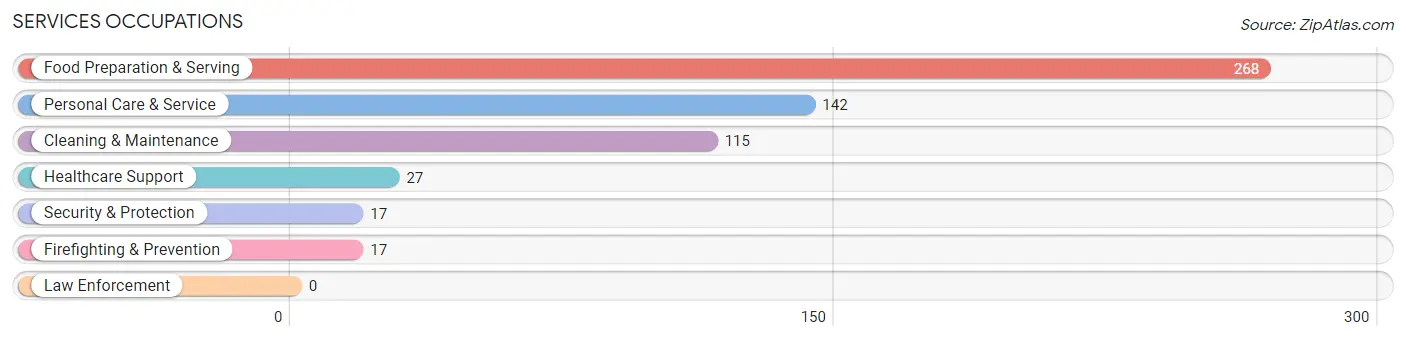
Services Occupations
The most common Services occupations in Center Line are Food Preparation & Serving (268 | 6.4%), Personal Care & Service (142 | 3.4%), Cleaning & Maintenance (115 | 2.8%), Healthcare Support (27 | 0.6%), and Security & Protection (17 | 0.4%).
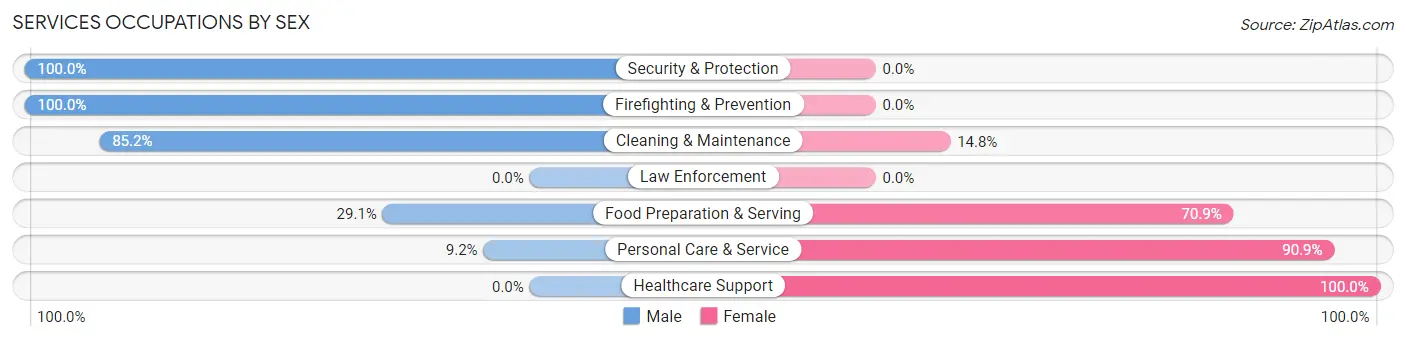
Services Occupations by Sex
Within the Services occupations in Center Line, the most male-oriented occupations are Security & Protection (100.0%), Firefighting & Prevention (100.0%), and Cleaning & Maintenance (85.2%), while the most female-oriented occupations are Healthcare Support (100.0%), Personal Care & Service (90.8%), and Food Preparation & Serving (70.9%).
| Occupation | Male | Female |
| Healthcare Support | 0 (0.0%) | 27 (100.0%) |
| Security & Protection | 17 (100.0%) | 0 (0.0%) |
| Firefighting & Prevention | 17 (100.0%) | 0 (0.0%) |
| Law Enforcement | 0 (0.0%) | 0 (0.0%) |
| Food Preparation & Serving | 78 (29.1%) | 190 (70.9%) |
| Cleaning & Maintenance | 98 (85.2%) | 17 (14.8%) |
| Personal Care & Service | 13 (9.1%) | 129 (90.8%) |
| Total (Category) | 206 (36.2%) | 363 (63.8%) |
| Total (Overall) | 2,112 (50.7%) | 2,055 (49.3%) |
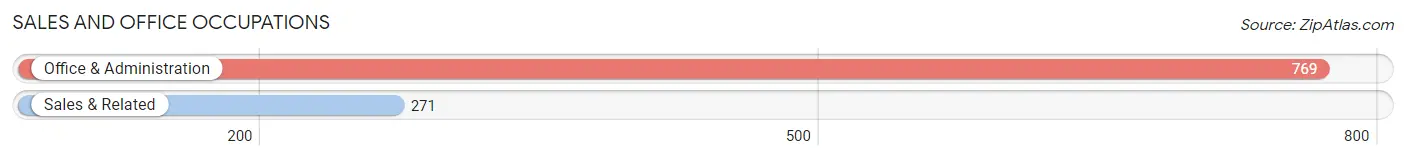
Sales and Office Occupations
The most common Sales and Office occupations in Center Line are Office & Administration (769 | 18.4%), and Sales & Related (271 | 6.5%).
Sales and Office Occupations by Sex
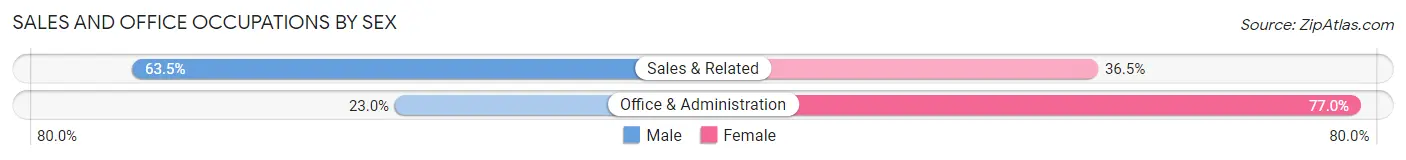
| Occupation | Male | Female |
| Sales & Related | 172 (63.5%) | 99 (36.5%) |
| Office & Administration | 177 (23.0%) | 592 (77.0%) |
| Total (Category) | 349 (33.6%) | 691 (66.4%) |
| Total (Overall) | 2,112 (50.7%) | 2,055 (49.3%) |
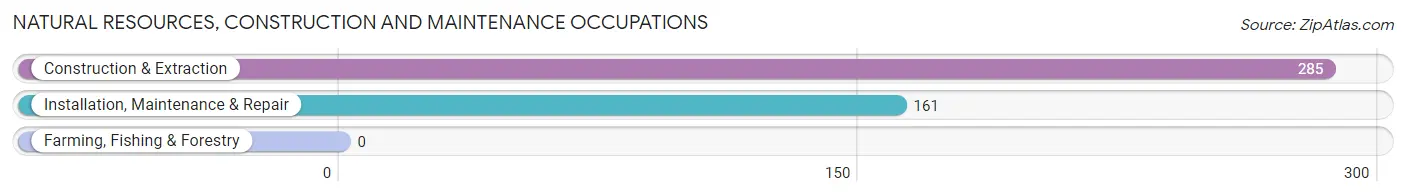
Natural Resources, Construction and Maintenance Occupations
The most common Natural Resources, Construction and Maintenance occupations in Center Line are Construction & Extraction (285 | 6.8%), and Installation, Maintenance & Repair (161 | 3.9%).
Natural Resources, Construction and Maintenance Occupations by Sex
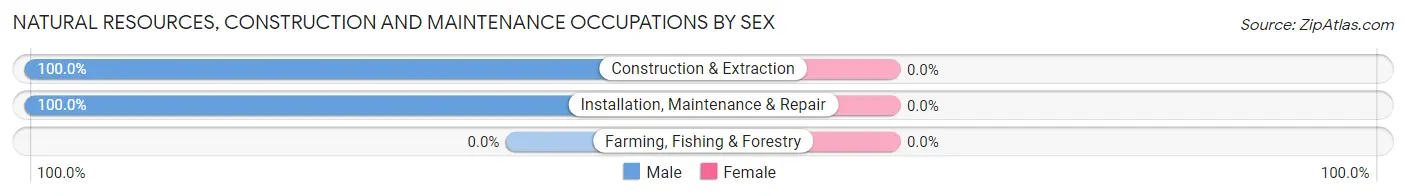
| Occupation | Male | Female |
| Farming, Fishing & Forestry | 0 (0.0%) | 0 (0.0%) |
| Construction & Extraction | 285 (100.0%) | 0 (0.0%) |
| Installation, Maintenance & Repair | 161 (100.0%) | 0 (0.0%) |
| Total (Category) | 446 (100.0%) | 0 (0.0%) |
| Total (Overall) | 2,112 (50.7%) | 2,055 (49.3%) |
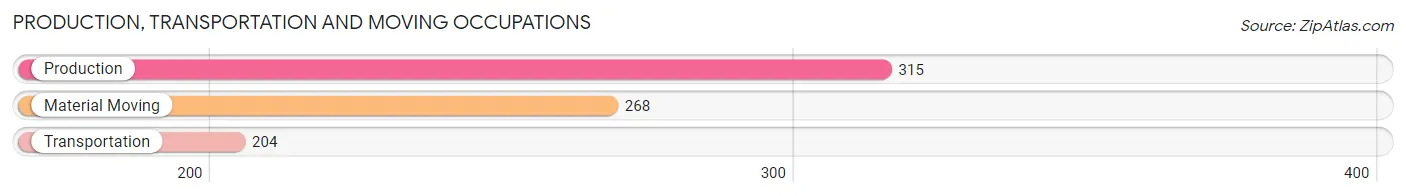
Production, Transportation and Moving Occupations
The most common Production, Transportation and Moving occupations in Center Line are Production (315 | 7.6%), Material Moving (268 | 6.4%), and Transportation (204 | 4.9%).
Production, Transportation and Moving Occupations by Sex
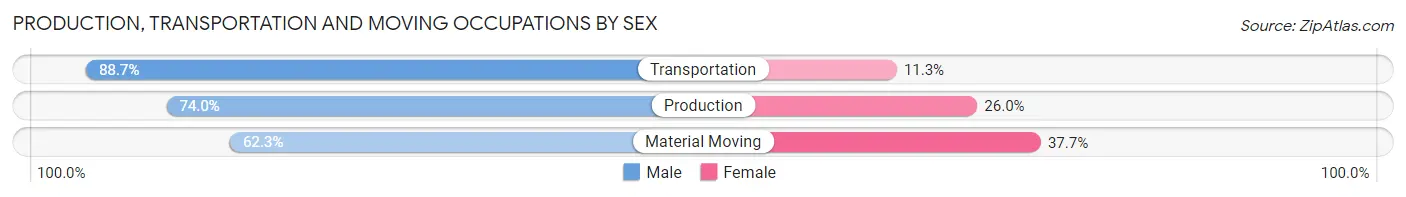
| Occupation | Male | Female |
| Production | 233 (74.0%) | 82 (26.0%) |
| Transportation | 181 (88.7%) | 23 (11.3%) |
| Material Moving | 167 (62.3%) | 101 (37.7%) |
| Total (Category) | 581 (73.8%) | 206 (26.2%) |
| Total (Overall) | 2,112 (50.7%) | 2,055 (49.3%) |
Employment Industries by Sex in Center Line
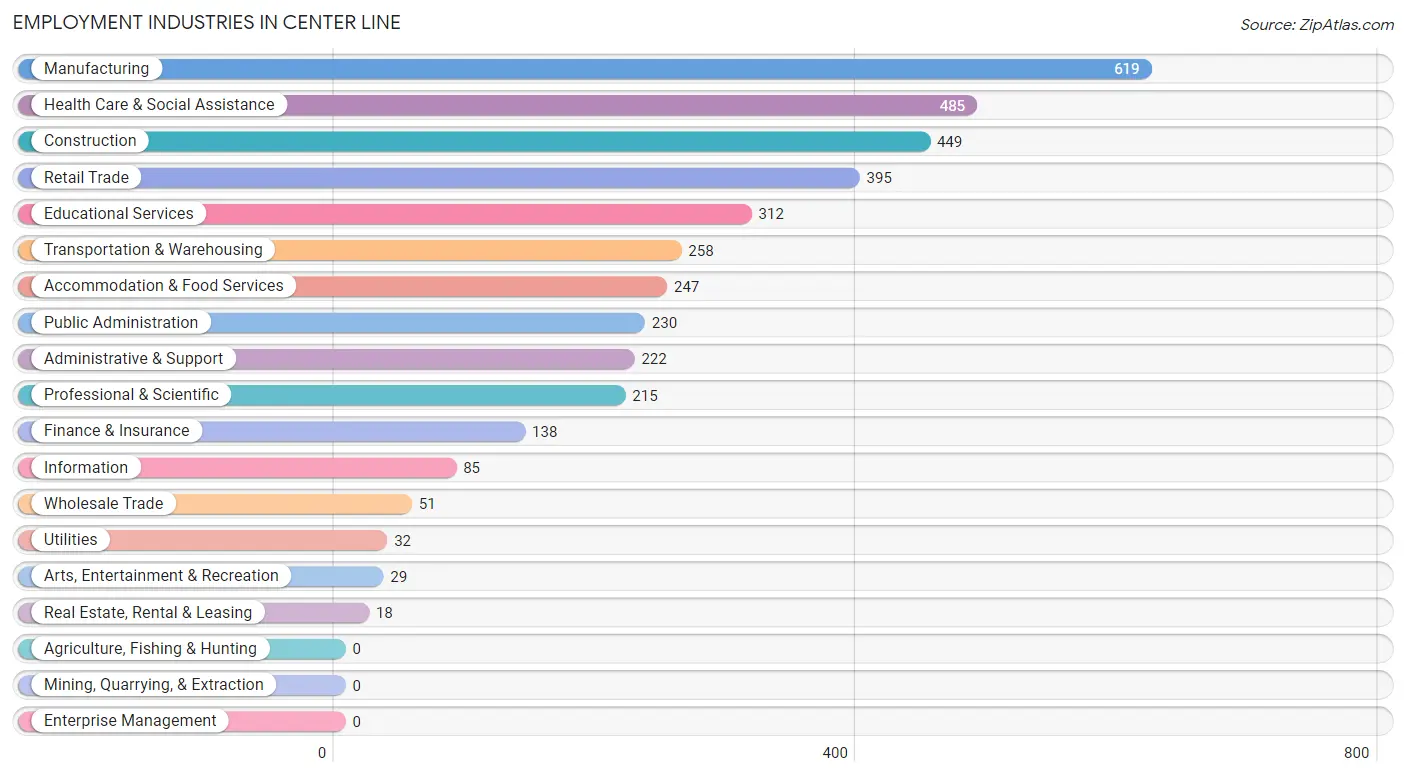
Employment Industries in Center Line
The major employment industries in Center Line include Manufacturing (619 | 14.8%), Health Care & Social Assistance (485 | 11.6%), Construction (449 | 10.8%), Retail Trade (395 | 9.5%), and Educational Services (312 | 7.5%).
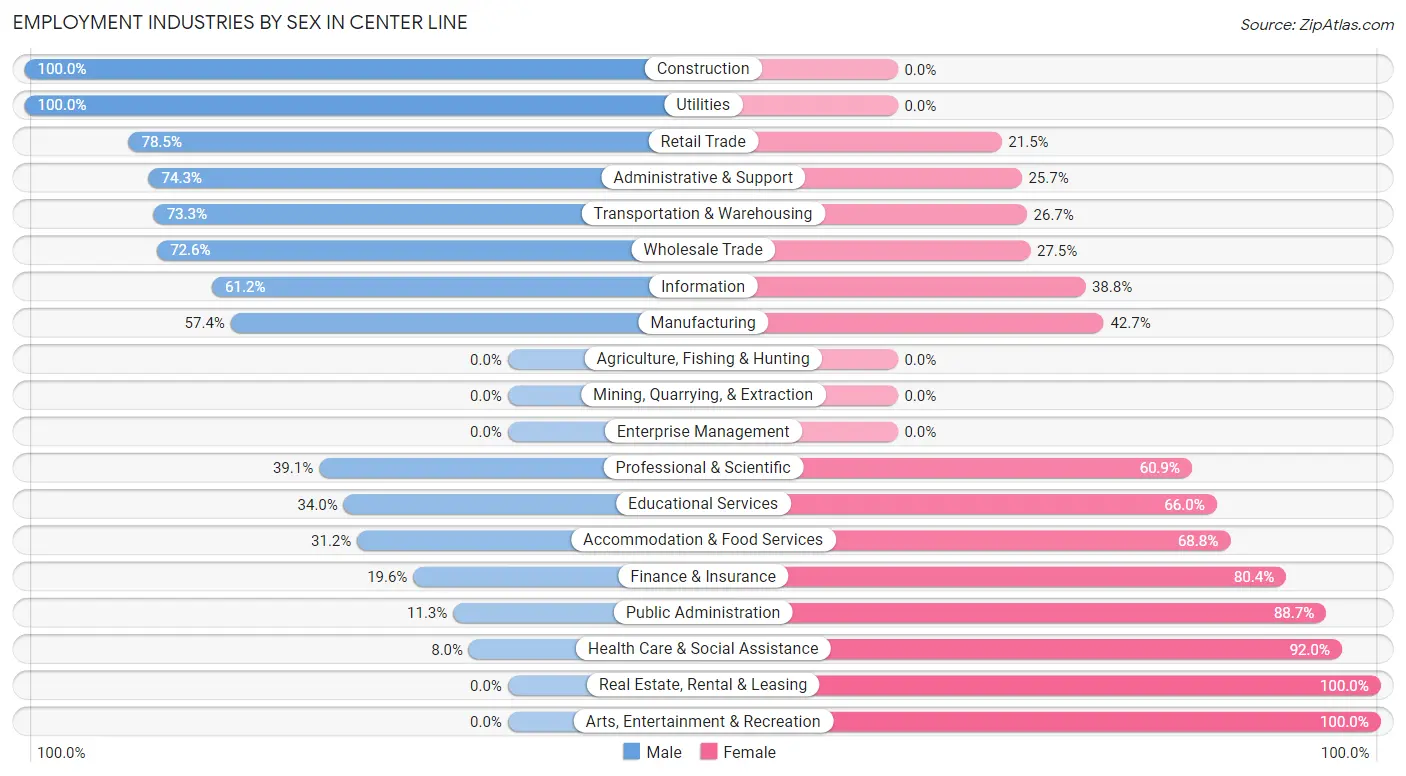
Employment Industries by Sex in Center Line
The Center Line industries that see more men than women are Construction (100.0%), Utilities (100.0%), and Retail Trade (78.5%), whereas the industries that tend to have a higher number of women are Real Estate, Rental & Leasing (100.0%), Arts, Entertainment & Recreation (100.0%), and Health Care & Social Assistance (92.0%).
| Industry | Male | Female |
| Agriculture, Fishing & Hunting | 0 (0.0%) | 0 (0.0%) |
| Mining, Quarrying, & Extraction | 0 (0.0%) | 0 (0.0%) |
| Construction | 449 (100.0%) | 0 (0.0%) |
| Manufacturing | 355 (57.4%) | 264 (42.6%) |
| Wholesale Trade | 37 (72.6%) | 14 (27.5%) |
| Retail Trade | 310 (78.5%) | 85 (21.5%) |
| Transportation & Warehousing | 189 (73.3%) | 69 (26.7%) |
| Utilities | 32 (100.0%) | 0 (0.0%) |
| Information | 52 (61.2%) | 33 (38.8%) |
| Finance & Insurance | 27 (19.6%) | 111 (80.4%) |
| Real Estate, Rental & Leasing | 0 (0.0%) | 18 (100.0%) |
| Professional & Scientific | 84 (39.1%) | 131 (60.9%) |
| Enterprise Management | 0 (0.0%) | 0 (0.0%) |
| Administrative & Support | 165 (74.3%) | 57 (25.7%) |
| Educational Services | 106 (34.0%) | 206 (66.0%) |
| Health Care & Social Assistance | 39 (8.0%) | 446 (92.0%) |
| Arts, Entertainment & Recreation | 0 (0.0%) | 29 (100.0%) |
| Accommodation & Food Services | 77 (31.2%) | 170 (68.8%) |
| Public Administration | 26 (11.3%) | 204 (88.7%) |
| Total | 2,112 (50.7%) | 2,055 (49.3%) |
Education in Center Line
School Enrollment in Center Line
The most common levels of schooling among the 1,745 students in Center Line are middle school (528 | 30.3%), high school (462 | 26.5%), and college / undergraduate (304 | 17.4%).
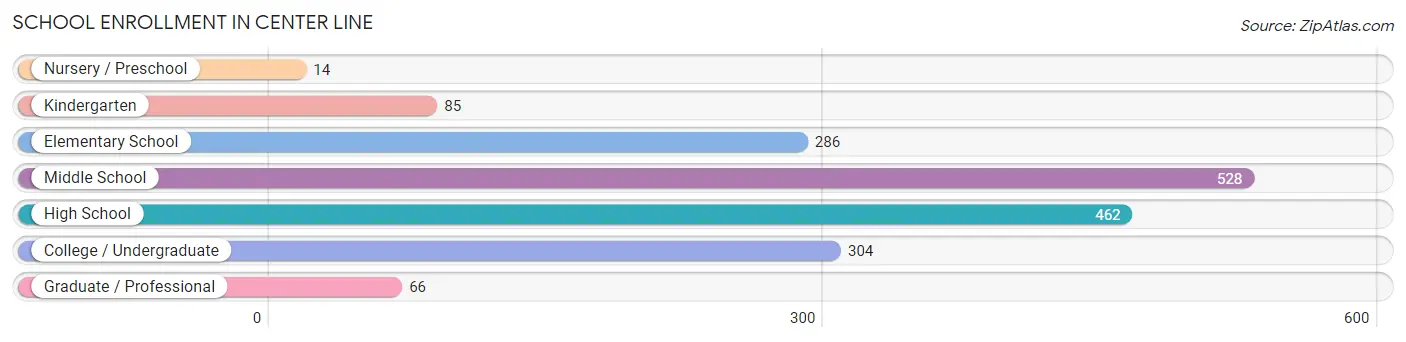
| School Level | # Students | % Students |
| Nursery / Preschool | 14 | 0.8% |
| Kindergarten | 85 | 4.9% |
| Elementary School | 286 | 16.4% |
| Middle School | 528 | 30.3% |
| High School | 462 | 26.5% |
| College / Undergraduate | 304 | 17.4% |
| Graduate / Professional | 66 | 3.8% |
| Total | 1,745 | 100.0% |
School Enrollment by Age by Funding Source in Center Line
Out of a total of 1,745 students who are enrolled in schools in Center Line, 126 (7.2%) attend a private institution, while the remaining 1,619 (92.8%) are enrolled in public schools. The age group of 35 years and over has the highest likelihood of being enrolled in private schools, with 32 (100.0% in the age bracket) enrolled. Conversely, the age group of 25 to 34 year olds has the lowest likelihood of being enrolled in a private school, with 64 (100.0% in the age bracket) attending a public institution.
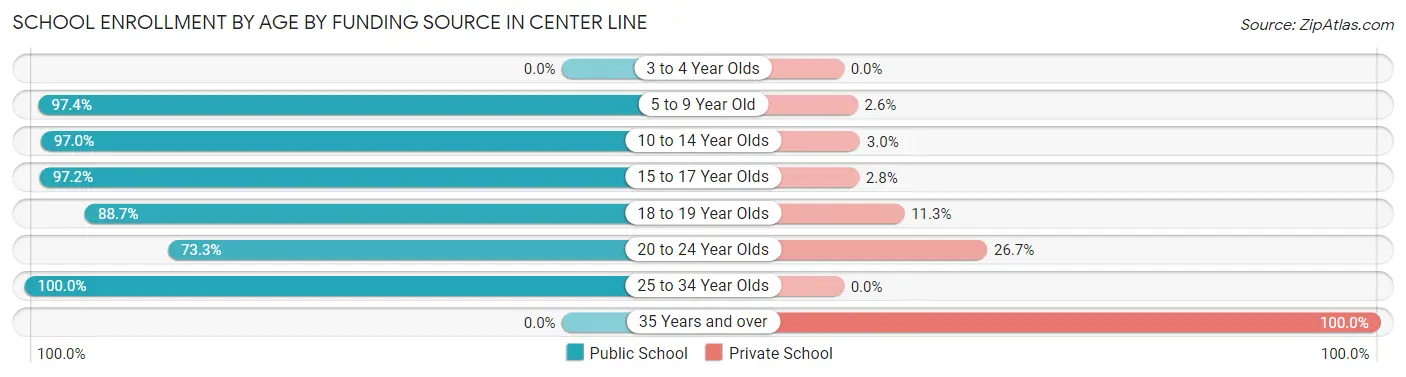
| Age Bracket | Public School | Private School |
| 3 to 4 Year Olds | 0 (0.0%) | 0 (0.0%) |
| 5 to 9 Year Old | 375 (97.4%) | 10 (2.6%) |
| 10 to 14 Year Olds | 546 (97.0%) | 17 (3.0%) |
| 15 to 17 Year Olds | 410 (97.2%) | 12 (2.8%) |
| 18 to 19 Year Olds | 118 (88.7%) | 15 (11.3%) |
| 20 to 24 Year Olds | 107 (73.3%) | 39 (26.7%) |
| 25 to 34 Year Olds | 64 (100.0%) | 0 (0.0%) |
| 35 Years and over | 0 (0.0%) | 32 (100.0%) |
| Total | 1,619 (92.8%) | 126 (7.2%) |
Educational Attainment by Field of Study in Center Line
Arts & humanities (264 | 24.0%), education (170 | 15.5%), science & technology (112 | 10.2%), social sciences (102 | 9.3%), and business (95 | 8.6%) are the most common fields of study among 1,099 individuals in Center Line who have obtained a bachelor's degree or higher.
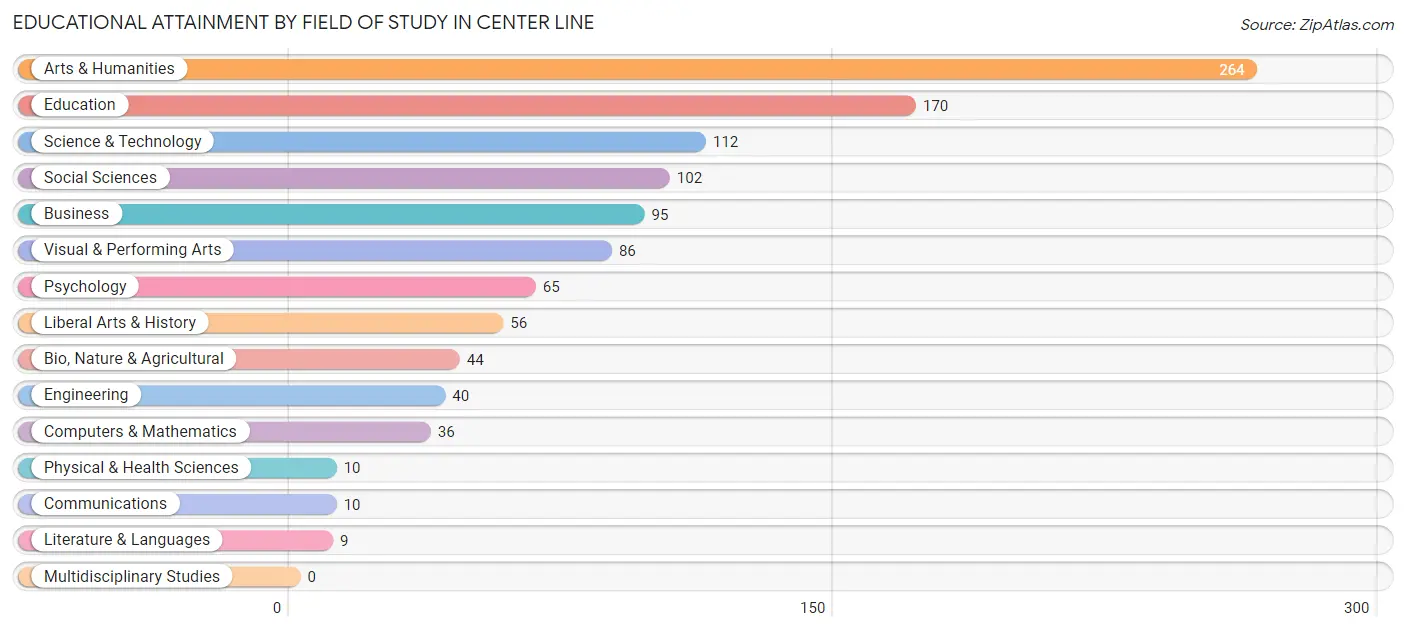
| Field of Study | # Graduates | % Graduates |
| Computers & Mathematics | 36 | 3.3% |
| Bio, Nature & Agricultural | 44 | 4.0% |
| Physical & Health Sciences | 10 | 0.9% |
| Psychology | 65 | 5.9% |
| Social Sciences | 102 | 9.3% |
| Engineering | 40 | 3.6% |
| Multidisciplinary Studies | 0 | 0.0% |
| Science & Technology | 112 | 10.2% |
| Business | 95 | 8.6% |
| Education | 170 | 15.5% |
| Literature & Languages | 9 | 0.8% |
| Liberal Arts & History | 56 | 5.1% |
| Visual & Performing Arts | 86 | 7.8% |
| Communications | 10 | 0.9% |
| Arts & Humanities | 264 | 24.0% |
| Total | 1,099 | 100.0% |
Transportation & Commute in Center Line
Vehicle Availability by Sex in Center Line
The most prevalent vehicle ownership categories in Center Line are males with 2 vehicles (972, accounting for 46.0%) and females with 2 vehicles (742, making up 51.9%).
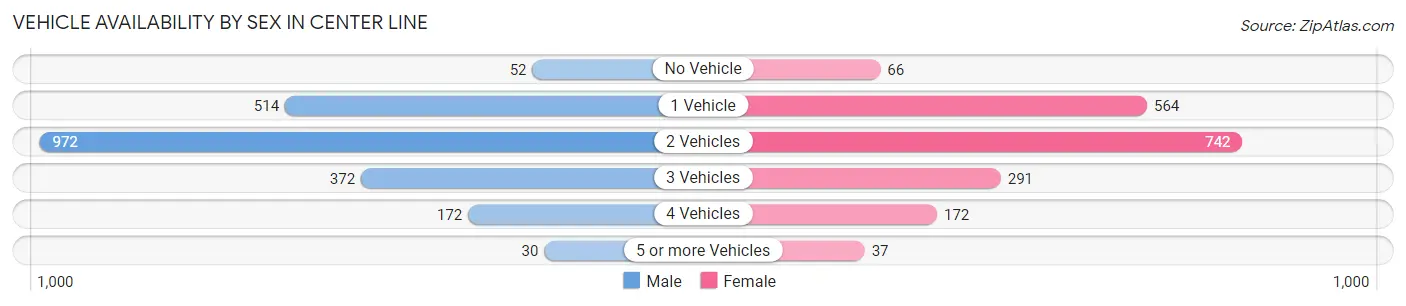
| Vehicles Available | Male | Female |
| No Vehicle | 52 (2.5%) | 66 (3.5%) |
| 1 Vehicle | 514 (24.3%) | 564 (30.1%) |
| 2 Vehicles | 972 (46.0%) | 742 (39.6%) |
| 3 Vehicles | 372 (17.6%) | 291 (15.5%) |
| 4 Vehicles | 172 (8.1%) | 172 (9.2%) |
| 5 or more Vehicles | 30 (1.4%) | 37 (2.0%) |
| Total | 2,112 (100.0%) | 1,872 (100.0%) |
Commute Time in Center Line
The most frequently occuring commute durations in Center Line are 20 to 24 minutes (650 commuters, 17.0%), 10 to 14 minutes (609 commuters, 16.0%), and 30 to 34 minutes (512 commuters, 13.4%).
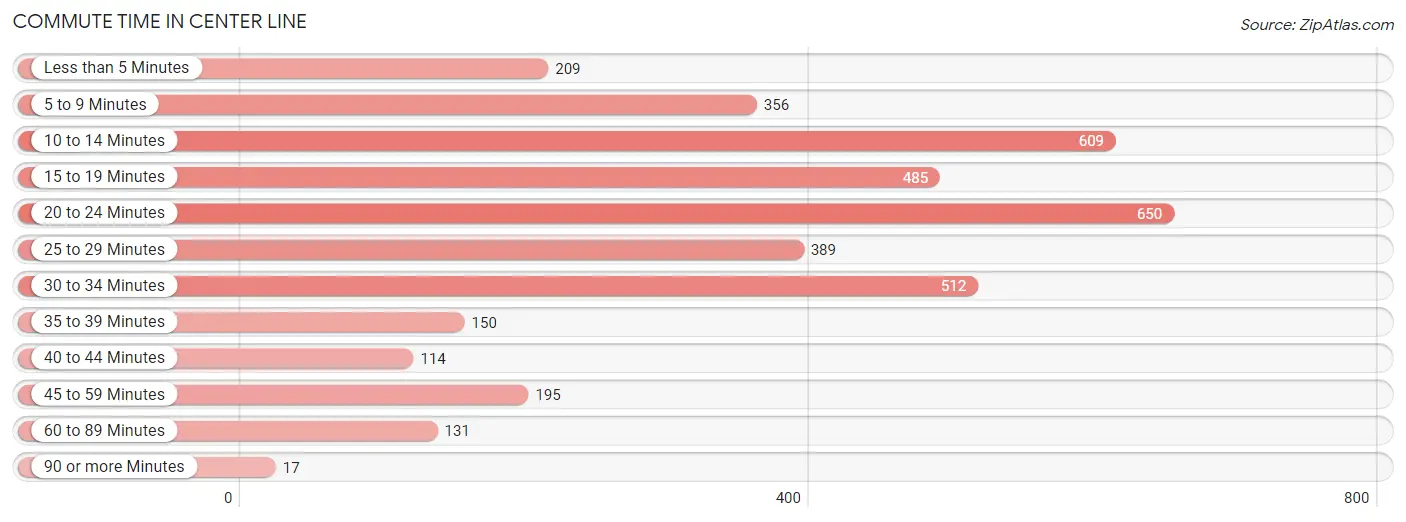
| Commute Time | # Commuters | % Commuters |
| Less than 5 Minutes | 209 | 5.5% |
| 5 to 9 Minutes | 356 | 9.3% |
| 10 to 14 Minutes | 609 | 16.0% |
| 15 to 19 Minutes | 485 | 12.7% |
| 20 to 24 Minutes | 650 | 17.0% |
| 25 to 29 Minutes | 389 | 10.2% |
| 30 to 34 Minutes | 512 | 13.4% |
| 35 to 39 Minutes | 150 | 3.9% |
| 40 to 44 Minutes | 114 | 3.0% |
| 45 to 59 Minutes | 195 | 5.1% |
| 60 to 89 Minutes | 131 | 3.4% |
| 90 or more Minutes | 17 | 0.4% |
Commute Time by Sex in Center Line
The most common commute times in Center Line are 30 to 34 minutes (373 commuters, 17.9%) for males and 20 to 24 minutes (417 commuters, 24.0%) for females.
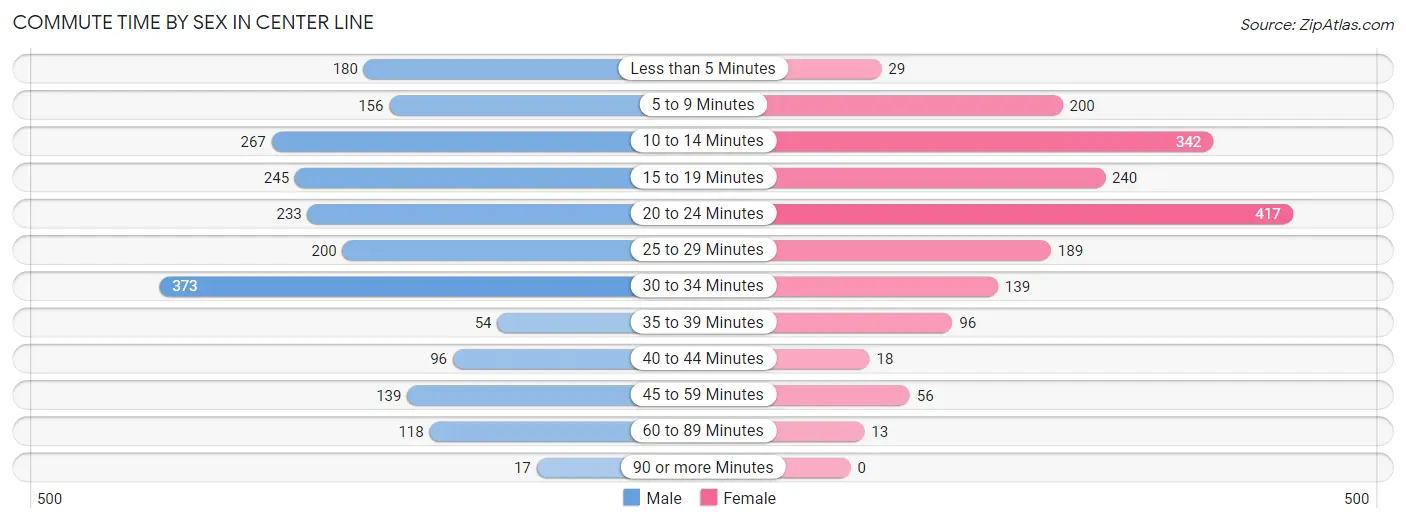
| Commute Time | Male | Female |
| Less than 5 Minutes | 180 (8.7%) | 29 (1.7%) |
| 5 to 9 Minutes | 156 (7.5%) | 200 (11.5%) |
| 10 to 14 Minutes | 267 (12.9%) | 342 (19.7%) |
| 15 to 19 Minutes | 245 (11.8%) | 240 (13.8%) |
| 20 to 24 Minutes | 233 (11.2%) | 417 (24.0%) |
| 25 to 29 Minutes | 200 (9.6%) | 189 (10.9%) |
| 30 to 34 Minutes | 373 (17.9%) | 139 (8.0%) |
| 35 to 39 Minutes | 54 (2.6%) | 96 (5.5%) |
| 40 to 44 Minutes | 96 (4.6%) | 18 (1.0%) |
| 45 to 59 Minutes | 139 (6.7%) | 56 (3.2%) |
| 60 to 89 Minutes | 118 (5.7%) | 13 (0.7%) |
| 90 or more Minutes | 17 (0.8%) | 0 (0.0%) |
Time of Departure to Work by Sex in Center Line
The most frequent times of departure to work in Center Line are 8:00 AM to 8:29 AM (312, 15.0%) for males and 8:00 AM to 8:29 AM (394, 22.7%) for females.
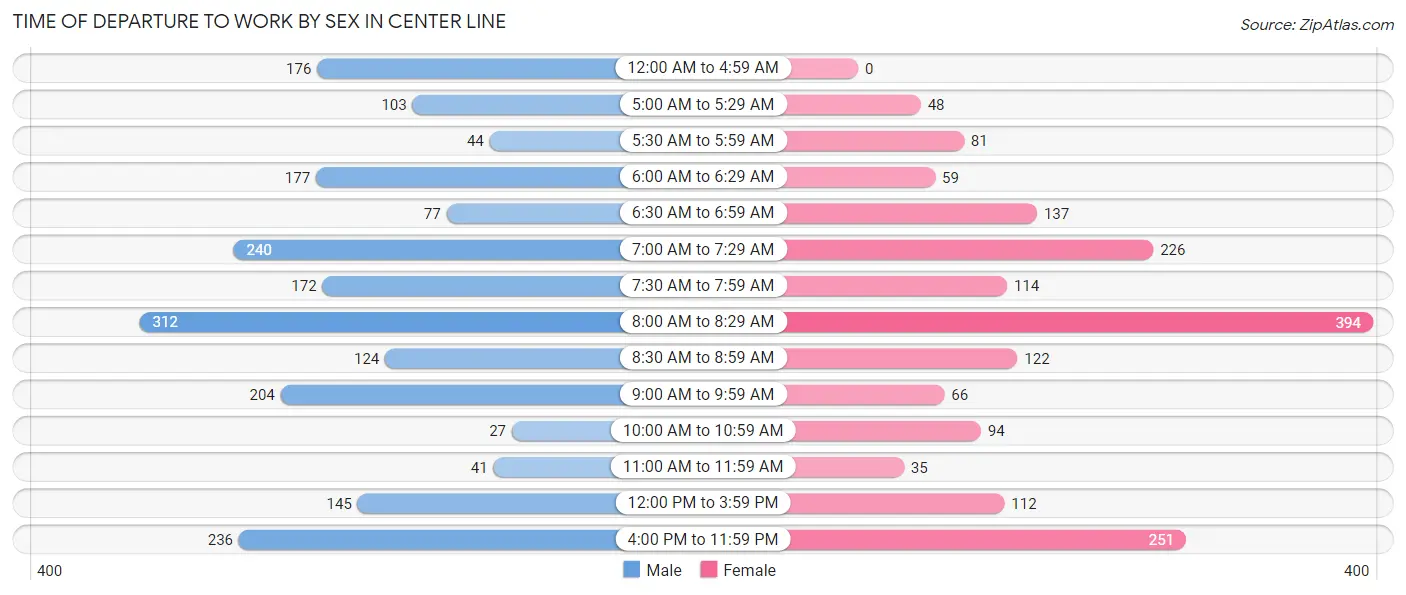
| Time of Departure | Male | Female |
| 12:00 AM to 4:59 AM | 176 (8.5%) | 0 (0.0%) |
| 5:00 AM to 5:29 AM | 103 (5.0%) | 48 (2.8%) |
| 5:30 AM to 5:59 AM | 44 (2.1%) | 81 (4.7%) |
| 6:00 AM to 6:29 AM | 177 (8.5%) | 59 (3.4%) |
| 6:30 AM to 6:59 AM | 77 (3.7%) | 137 (7.9%) |
| 7:00 AM to 7:29 AM | 240 (11.6%) | 226 (13.0%) |
| 7:30 AM to 7:59 AM | 172 (8.3%) | 114 (6.6%) |
| 8:00 AM to 8:29 AM | 312 (15.0%) | 394 (22.7%) |
| 8:30 AM to 8:59 AM | 124 (6.0%) | 122 (7.0%) |
| 9:00 AM to 9:59 AM | 204 (9.8%) | 66 (3.8%) |
| 10:00 AM to 10:59 AM | 27 (1.3%) | 94 (5.4%) |
| 11:00 AM to 11:59 AM | 41 (2.0%) | 35 (2.0%) |
| 12:00 PM to 3:59 PM | 145 (7.0%) | 112 (6.4%) |
| 4:00 PM to 11:59 PM | 236 (11.4%) | 251 (14.4%) |
| Total | 2,078 (100.0%) | 1,739 (100.0%) |
Housing Occupancy in Center Line
Occupancy by Ownership in Center Line
Of the total 3,698 dwellings in Center Line, owner-occupied units account for 2,045 (55.3%), while renter-occupied units make up 1,653 (44.7%).
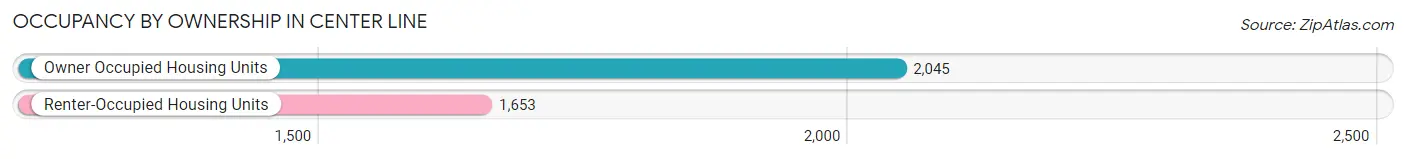
| Occupancy | # Housing Units | % Housing Units |
| Owner Occupied Housing Units | 2,045 | 55.3% |
| Renter-Occupied Housing Units | 1,653 | 44.7% |
| Total Occupied Housing Units | 3,698 | 100.0% |
Occupancy by Household Size in Center Line
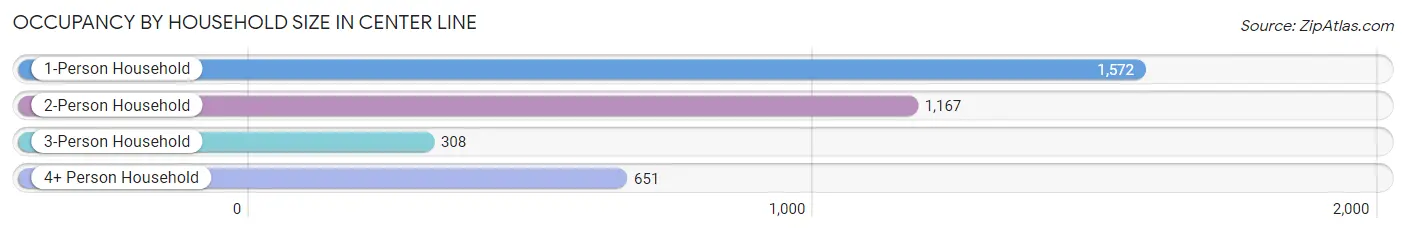
| Household Size | # Housing Units | % Housing Units |
| 1-Person Household | 1,572 | 42.5% |
| 2-Person Household | 1,167 | 31.6% |
| 3-Person Household | 308 | 8.3% |
| 4+ Person Household | 651 | 17.6% |
| Total Housing Units | 3,698 | 100.0% |
Occupancy by Ownership by Household Size in Center Line
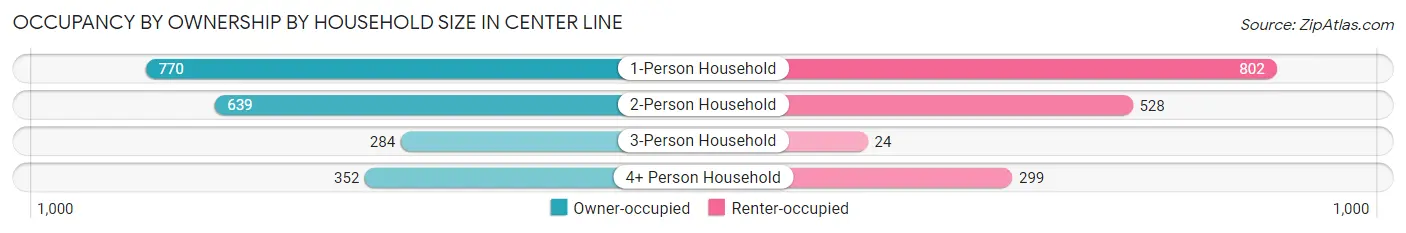
| Household Size | Owner-occupied | Renter-occupied |
| 1-Person Household | 770 (49.0%) | 802 (51.0%) |
| 2-Person Household | 639 (54.8%) | 528 (45.2%) |
| 3-Person Household | 284 (92.2%) | 24 (7.8%) |
| 4+ Person Household | 352 (54.1%) | 299 (45.9%) |
| Total Housing Units | 2,045 (55.3%) | 1,653 (44.7%) |
Occupancy by Educational Attainment in Center Line
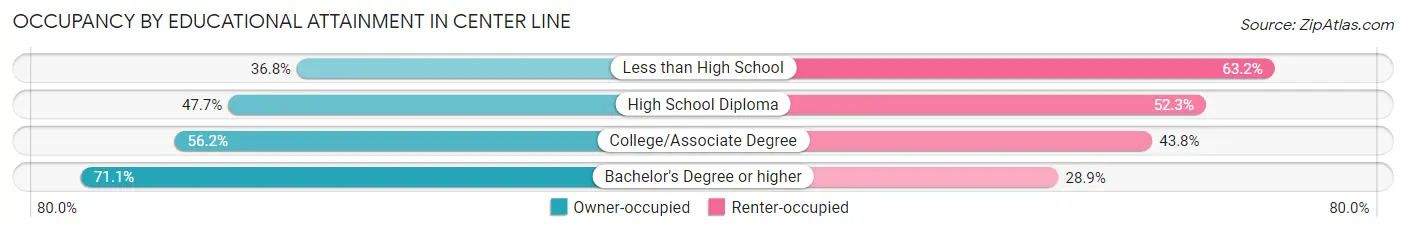
| Household Size | Owner-occupied | Renter-occupied |
| Less than High School | 113 (36.8%) | 194 (63.2%) |
| High School Diploma | 473 (47.7%) | 518 (52.3%) |
| College/Associate Degree | 931 (56.2%) | 726 (43.8%) |
| Bachelor's Degree or higher | 528 (71.1%) | 215 (28.9%) |
Occupancy by Age of Householder in Center Line
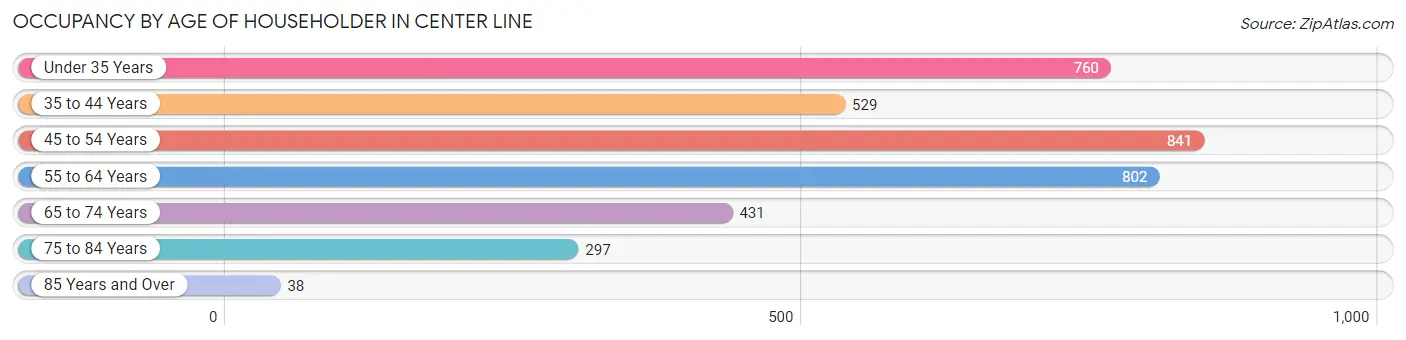
| Age Bracket | # Households | % Households |
| Under 35 Years | 760 | 20.5% |
| 35 to 44 Years | 529 | 14.3% |
| 45 to 54 Years | 841 | 22.7% |
| 55 to 64 Years | 802 | 21.7% |
| 65 to 74 Years | 431 | 11.7% |
| 75 to 84 Years | 297 | 8.0% |
| 85 Years and Over | 38 | 1.0% |
| Total | 3,698 | 100.0% |
Housing Finances in Center Line
Median Income by Occupancy in Center Line
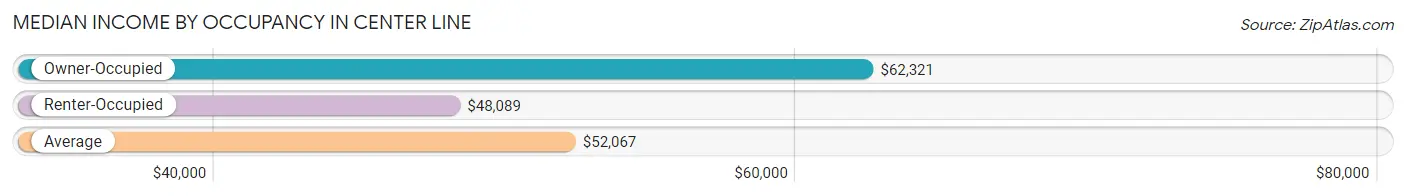
| Occupancy Type | # Households | Median Income |
| Owner-Occupied | 2,045 (55.3%) | $62,321 |
| Renter-Occupied | 1,653 (44.7%) | $48,089 |
| Average | 3,698 (100.0%) | $52,067 |
Occupancy by Householder Income Bracket in Center Line
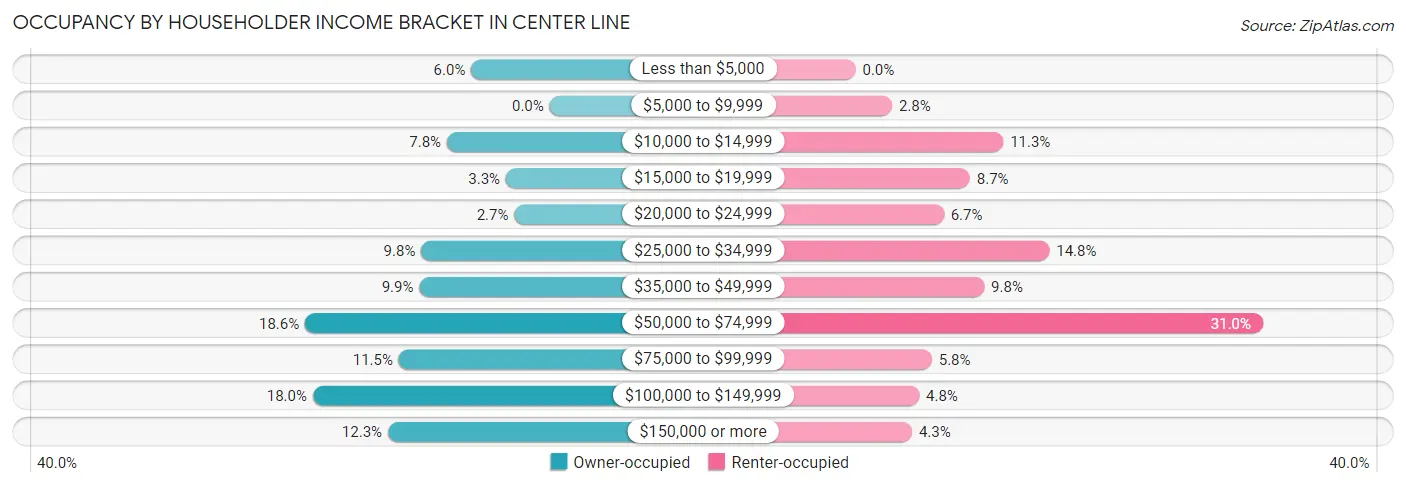
| Income Bracket | Owner-occupied | Renter-occupied |
| Less than $5,000 | 122 (6.0%) | 0 (0.0%) |
| $5,000 to $9,999 | 0 (0.0%) | 46 (2.8%) |
| $10,000 to $14,999 | 160 (7.8%) | 186 (11.3%) |
| $15,000 to $19,999 | 68 (3.3%) | 144 (8.7%) |
| $20,000 to $24,999 | 55 (2.7%) | 111 (6.7%) |
| $25,000 to $34,999 | 200 (9.8%) | 244 (14.8%) |
| $35,000 to $49,999 | 203 (9.9%) | 162 (9.8%) |
| $50,000 to $74,999 | 381 (18.6%) | 513 (31.0%) |
| $75,000 to $99,999 | 235 (11.5%) | 96 (5.8%) |
| $100,000 to $149,999 | 369 (18.0%) | 80 (4.8%) |
| $150,000 or more | 252 (12.3%) | 71 (4.3%) |
| Total | 2,045 (100.0%) | 1,653 (100.0%) |
Monthly Housing Cost Tiers in Center Line
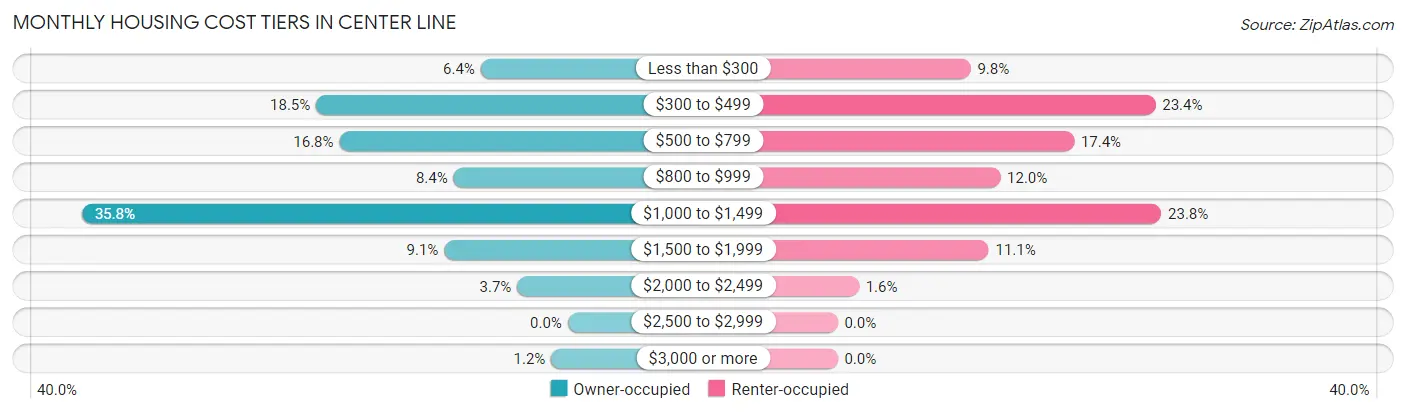
| Monthly Cost | Owner-occupied | Renter-occupied |
| Less than $300 | 131 (6.4%) | 162 (9.8%) |
| $300 to $499 | 379 (18.5%) | 387 (23.4%) |
| $500 to $799 | 344 (16.8%) | 288 (17.4%) |
| $800 to $999 | 172 (8.4%) | 198 (12.0%) |
| $1,000 to $1,499 | 732 (35.8%) | 394 (23.8%) |
| $1,500 to $1,999 | 186 (9.1%) | 184 (11.1%) |
| $2,000 to $2,499 | 76 (3.7%) | 26 (1.6%) |
| $2,500 to $2,999 | 0 (0.0%) | 0 (0.0%) |
| $3,000 or more | 25 (1.2%) | 0 (0.0%) |
| Total | 2,045 (100.0%) | 1,653 (100.0%) |
Physical Housing Characteristics in Center Line
Housing Structures in Center Line
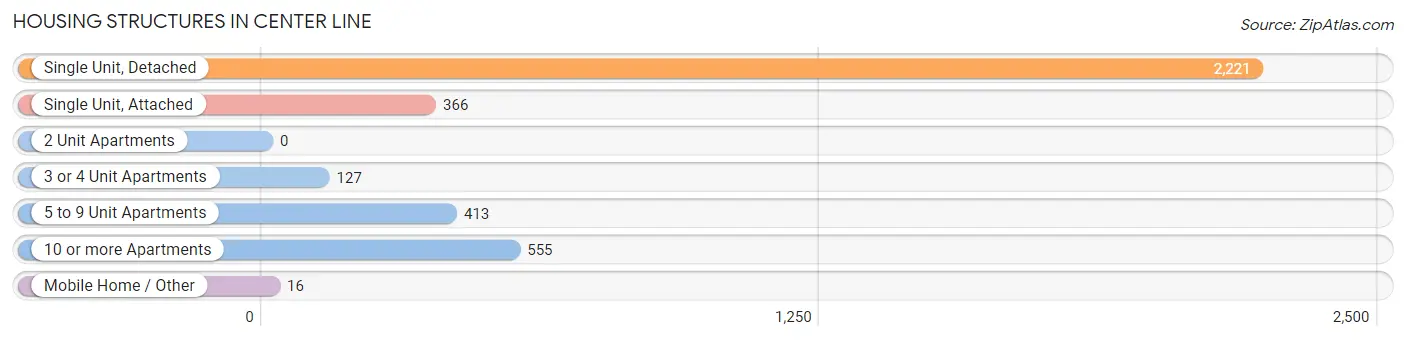
| Structure Type | # Housing Units | % Housing Units |
| Single Unit, Detached | 2,221 | 60.1% |
| Single Unit, Attached | 366 | 9.9% |
| 2 Unit Apartments | 0 | 0.0% |
| 3 or 4 Unit Apartments | 127 | 3.4% |
| 5 to 9 Unit Apartments | 413 | 11.2% |
| 10 or more Apartments | 555 | 15.0% |
| Mobile Home / Other | 16 | 0.4% |
| Total | 3,698 | 100.0% |
Housing Structures by Occupancy in Center Line
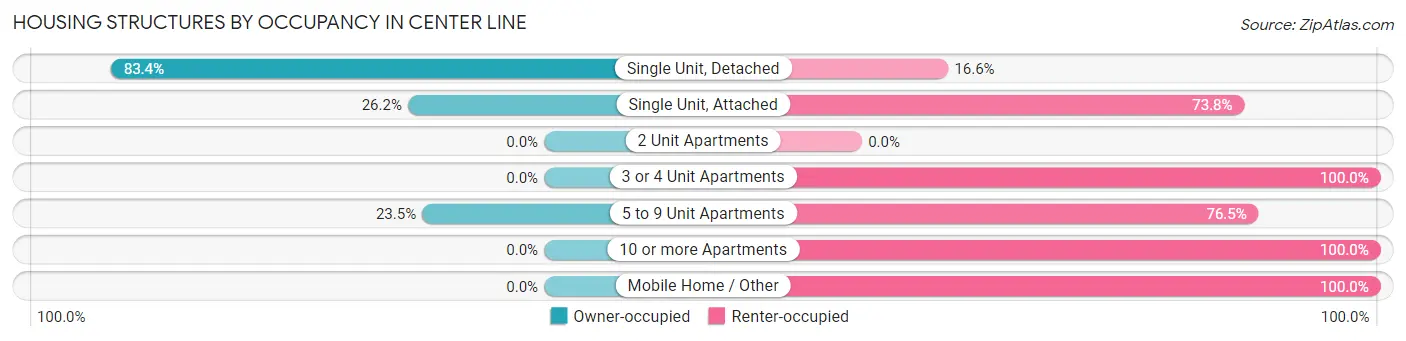
| Structure Type | Owner-occupied | Renter-occupied |
| Single Unit, Detached | 1,852 (83.4%) | 369 (16.6%) |
| Single Unit, Attached | 96 (26.2%) | 270 (73.8%) |
| 2 Unit Apartments | 0 (0.0%) | 0 (0.0%) |
| 3 or 4 Unit Apartments | 0 (0.0%) | 127 (100.0%) |
| 5 to 9 Unit Apartments | 97 (23.5%) | 316 (76.5%) |
| 10 or more Apartments | 0 (0.0%) | 555 (100.0%) |
| Mobile Home / Other | 0 (0.0%) | 16 (100.0%) |
| Total | 2,045 (55.3%) | 1,653 (44.7%) |
Housing Structures by Number of Rooms in Center Line
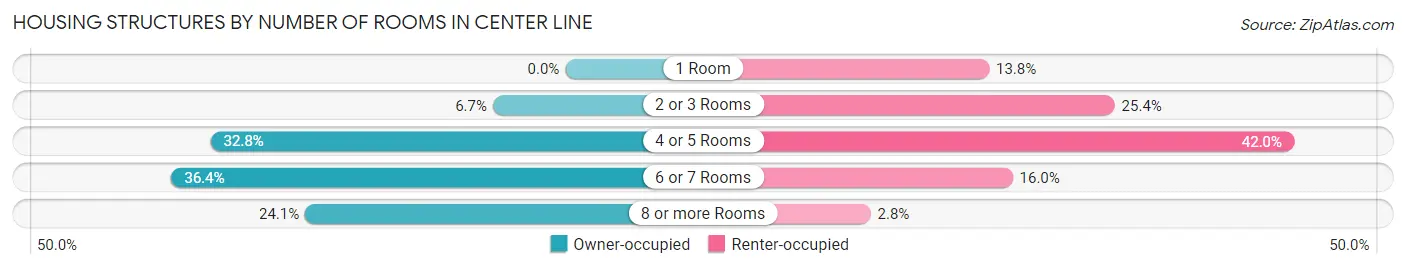
| Number of Rooms | Owner-occupied | Renter-occupied |
| 1 Room | 0 (0.0%) | 228 (13.8%) |
| 2 or 3 Rooms | 137 (6.7%) | 420 (25.4%) |
| 4 or 5 Rooms | 671 (32.8%) | 694 (42.0%) |
| 6 or 7 Rooms | 745 (36.4%) | 264 (16.0%) |
| 8 or more Rooms | 492 (24.1%) | 47 (2.8%) |
| Total | 2,045 (100.0%) | 1,653 (100.0%) |
Housing Structure by Heating Type in Center Line
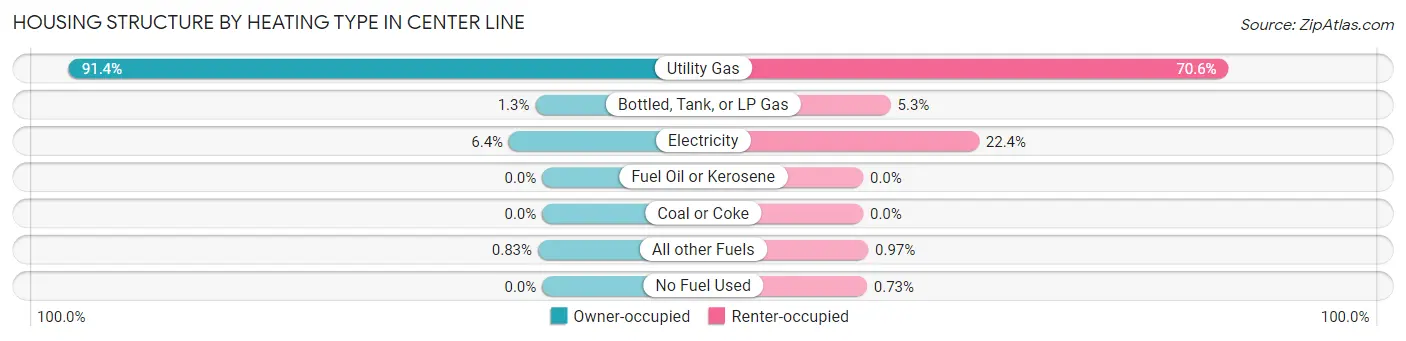
| Heating Type | Owner-occupied | Renter-occupied |
| Utility Gas | 1,870 (91.4%) | 1,167 (70.6%) |
| Bottled, Tank, or LP Gas | 27 (1.3%) | 88 (5.3%) |
| Electricity | 131 (6.4%) | 370 (22.4%) |
| Fuel Oil or Kerosene | 0 (0.0%) | 0 (0.0%) |
| Coal or Coke | 0 (0.0%) | 0 (0.0%) |
| All other Fuels | 17 (0.8%) | 16 (1.0%) |
| No Fuel Used | 0 (0.0%) | 12 (0.7%) |
| Total | 2,045 (100.0%) | 1,653 (100.0%) |
Household Vehicle Usage in Center Line
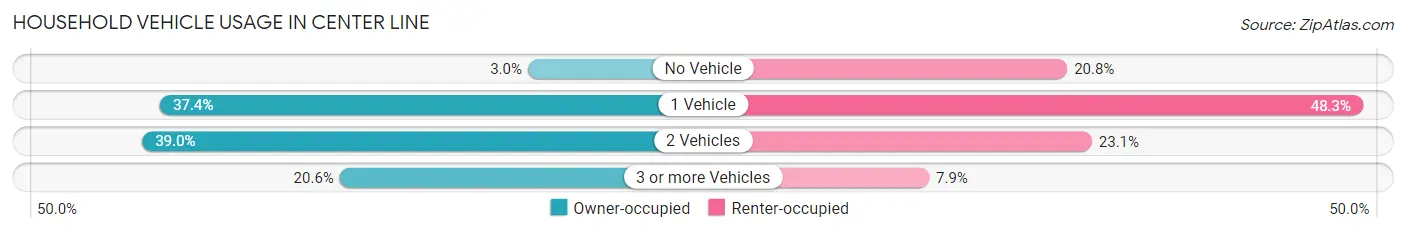
| Vehicles per Household | Owner-occupied | Renter-occupied |
| No Vehicle | 62 (3.0%) | 343 (20.7%) |
| 1 Vehicle | 764 (37.4%) | 799 (48.3%) |
| 2 Vehicles | 798 (39.0%) | 381 (23.1%) |
| 3 or more Vehicles | 421 (20.6%) | 130 (7.9%) |
| Total | 2,045 (100.0%) | 1,653 (100.0%) |
Real Estate & Mortgages in Center Line
Real Estate and Mortgage Overview in Center Line
| Characteristic | Without Mortgage | With Mortgage |
| Housing Units | 763 | 1,282 |
| Median Property Value | $99,400 | $154,900 |
| Median Household Income | $42,837 | $245 |
| Monthly Housing Costs | $466 | $7 |
| Real Estate Taxes | $2,093 | $100 |
Property Value by Mortgage Status in Center Line
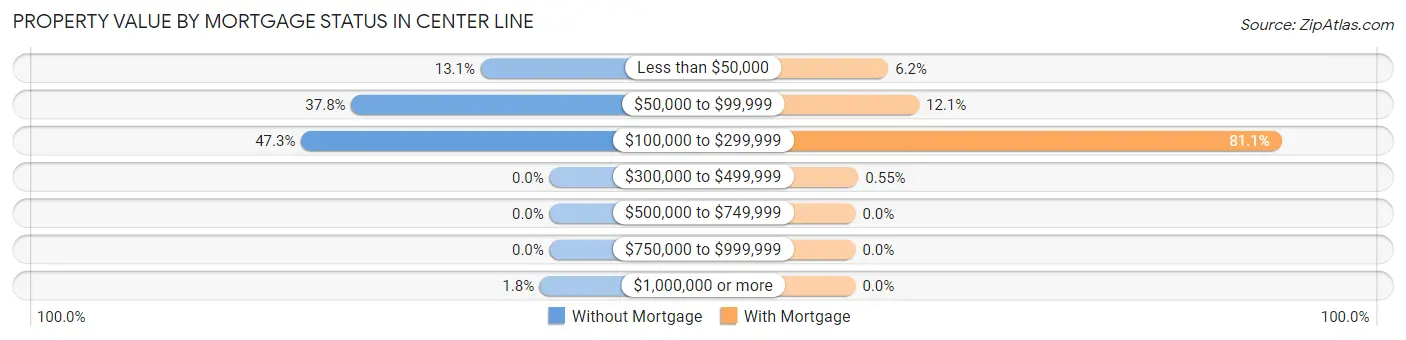
| Property Value | Without Mortgage | With Mortgage |
| Less than $50,000 | 100 (13.1%) | 80 (6.2%) |
| $50,000 to $99,999 | 288 (37.8%) | 155 (12.1%) |
| $100,000 to $299,999 | 361 (47.3%) | 1,040 (81.1%) |
| $300,000 to $499,999 | 0 (0.0%) | 7 (0.5%) |
| $500,000 to $749,999 | 0 (0.0%) | 0 (0.0%) |
| $750,000 to $999,999 | 0 (0.0%) | 0 (0.0%) |
| $1,000,000 or more | 14 (1.8%) | 0 (0.0%) |
| Total | 763 (100.0%) | 1,282 (100.0%) |
Household Income by Mortgage Status in Center Line
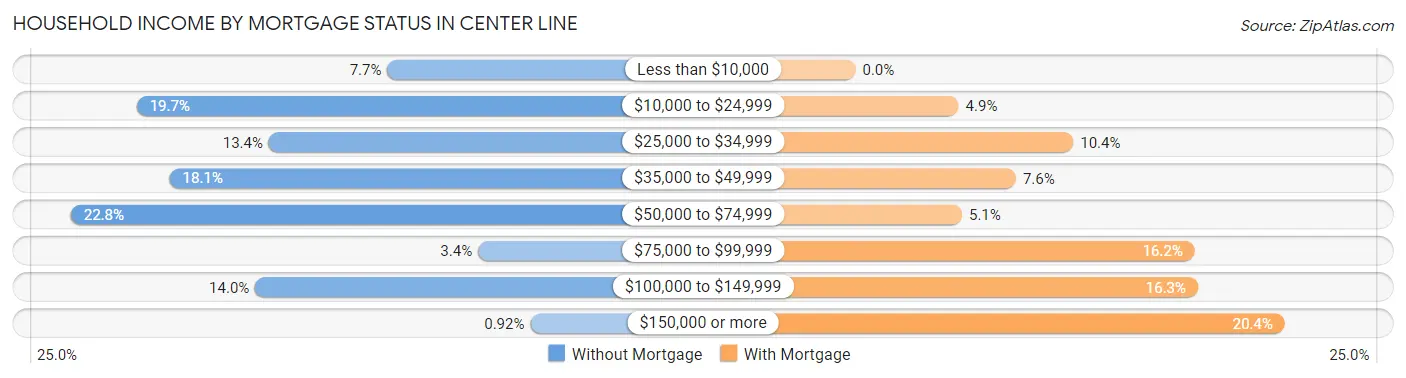
| Household Income | Without Mortgage | With Mortgage |
| Less than $10,000 | 59 (7.7%) | 0 (0.0%) |
| $10,000 to $24,999 | 150 (19.7%) | 63 (4.9%) |
| $25,000 to $34,999 | 102 (13.4%) | 133 (10.4%) |
| $35,000 to $49,999 | 138 (18.1%) | 98 (7.6%) |
| $50,000 to $74,999 | 174 (22.8%) | 65 (5.1%) |
| $75,000 to $99,999 | 26 (3.4%) | 207 (16.2%) |
| $100,000 to $149,999 | 107 (14.0%) | 209 (16.3%) |
| $150,000 or more | 7 (0.9%) | 262 (20.4%) |
| Total | 763 (100.0%) | 1,282 (100.0%) |
Property Value to Household Income Ratio in Center Line
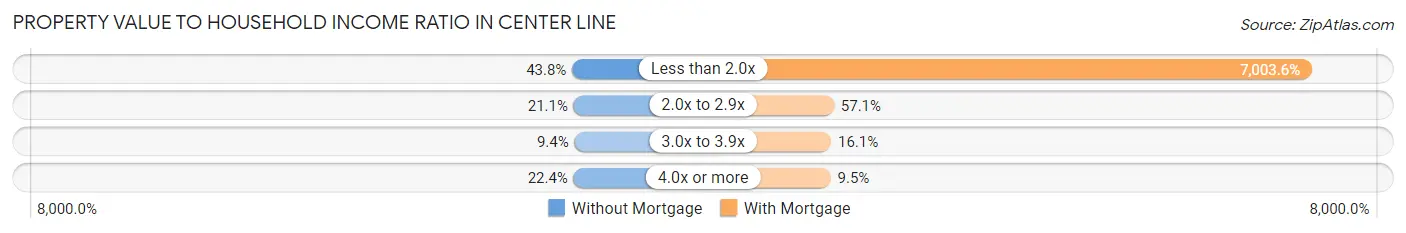
| Value-to-Income Ratio | Without Mortgage | With Mortgage |
| Less than 2.0x | 334 (43.8%) | 89,786 (7,003.6%) |
| 2.0x to 2.9x | 161 (21.1%) | 732 (57.1%) |
| 3.0x to 3.9x | 72 (9.4%) | 206 (16.1%) |
| 4.0x or more | 171 (22.4%) | 122 (9.5%) |
| Total | 763 (100.0%) | 1,282 (100.0%) |
Real Estate Taxes by Mortgage Status in Center Line
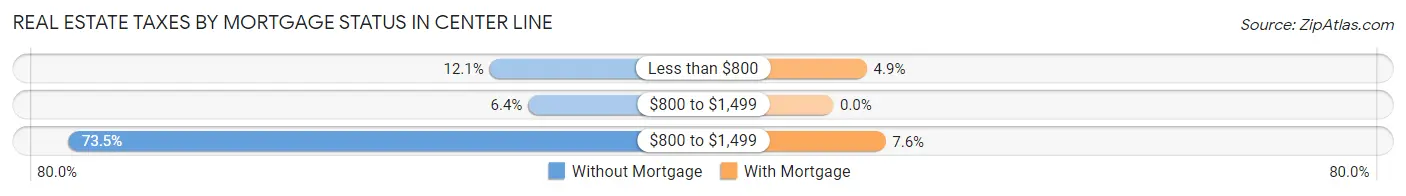
| Property Taxes | Without Mortgage | With Mortgage |
| Less than $800 | 92 (12.1%) | 63 (4.9%) |
| $800 to $1,499 | 49 (6.4%) | 0 (0.0%) |
| $800 to $1,499 | 561 (73.5%) | 98 (7.6%) |
| Total | 763 (100.0%) | 1,282 (100.0%) |
Health & Disability in Center Line
Health Insurance Coverage by Age in Center Line
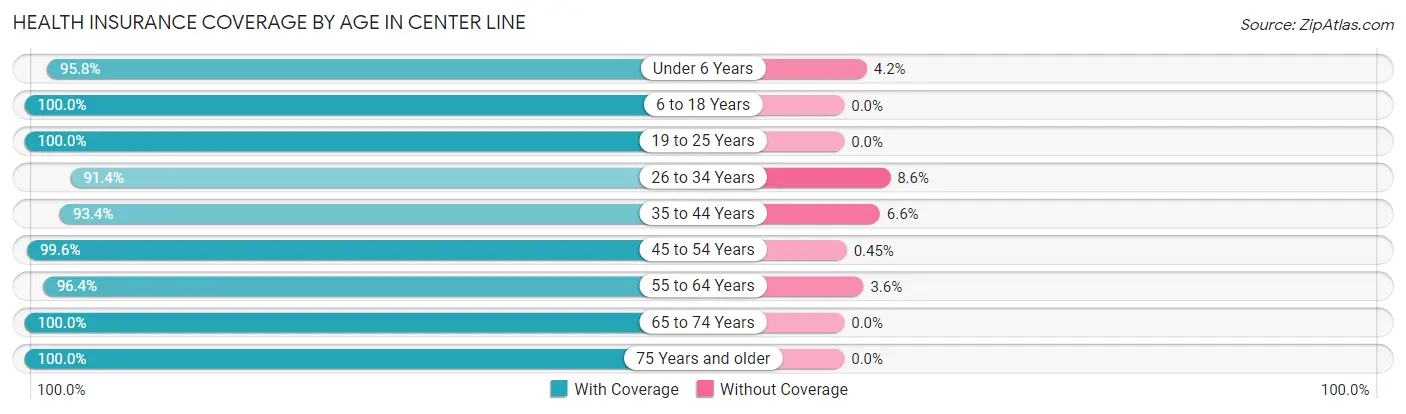
| Age Bracket | With Coverage | Without Coverage |
| Under 6 Years | 455 (95.8%) | 20 (4.2%) |
| 6 to 18 Years | 1,581 (100.0%) | 0 (0.0%) |
| 19 to 25 Years | 540 (100.0%) | 0 (0.0%) |
| 26 to 34 Years | 1,068 (91.4%) | 100 (8.6%) |
| 35 to 44 Years | 915 (93.4%) | 65 (6.6%) |
| 45 to 54 Years | 1,330 (99.6%) | 6 (0.4%) |
| 55 to 64 Years | 1,027 (96.4%) | 38 (3.6%) |
| 65 to 74 Years | 769 (100.0%) | 0 (0.0%) |
| 75 Years and older | 408 (100.0%) | 0 (0.0%) |
| Total | 8,093 (97.3%) | 229 (2.8%) |
Health Insurance Coverage by Citizenship Status in Center Line
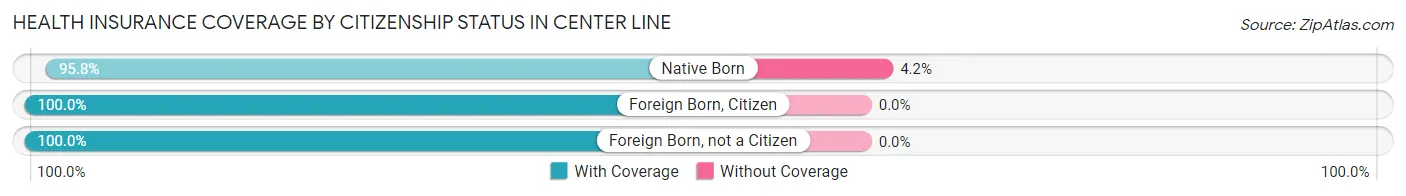
| Citizenship Status | With Coverage | Without Coverage |
| Native Born | 455 (95.8%) | 20 (4.2%) |
| Foreign Born, Citizen | 1,581 (100.0%) | 0 (0.0%) |
| Foreign Born, not a Citizen | 540 (100.0%) | 0 (0.0%) |
Health Insurance Coverage by Household Income in Center Line
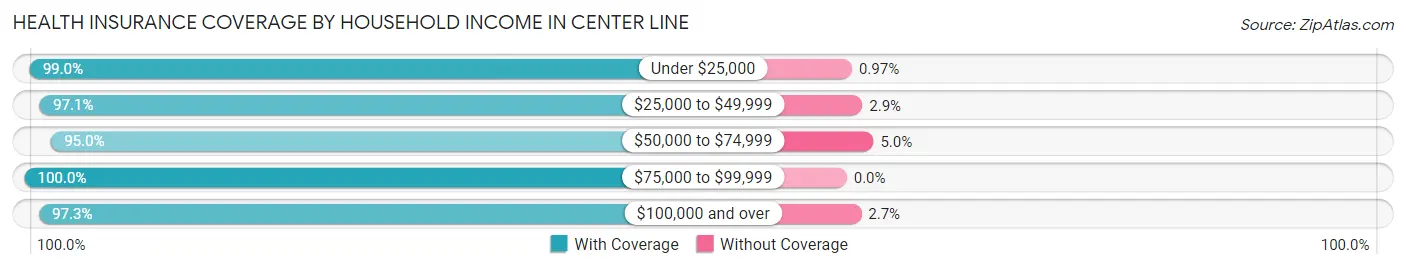
| Household Income | With Coverage | Without Coverage |
| Under $25,000 | 1,118 (99.0%) | 11 (1.0%) |
| $25,000 to $49,999 | 1,599 (97.1%) | 48 (2.9%) |
| $50,000 to $74,999 | 1,919 (95.0%) | 101 (5.0%) |
| $75,000 to $99,999 | 993 (100.0%) | 0 (0.0%) |
| $100,000 and over | 2,464 (97.3%) | 69 (2.7%) |
Public vs Private Health Insurance Coverage by Age in Center Line
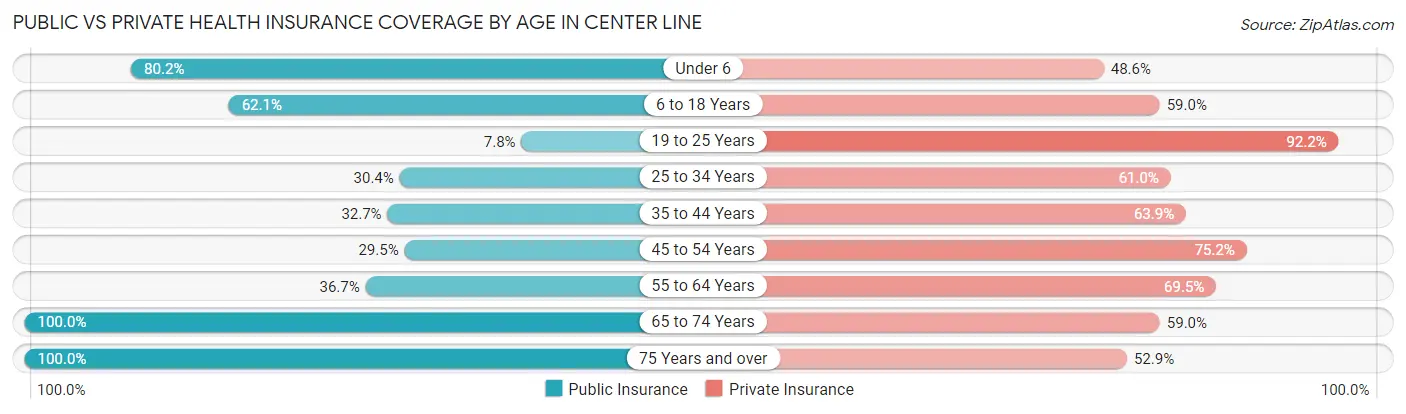
| Age Bracket | Public Insurance | Private Insurance |
| Under 6 | 381 (80.2%) | 231 (48.6%) |
| 6 to 18 Years | 982 (62.1%) | 933 (59.0%) |
| 19 to 25 Years | 42 (7.8%) | 498 (92.2%) |
| 25 to 34 Years | 355 (30.4%) | 713 (61.0%) |
| 35 to 44 Years | 320 (32.7%) | 626 (63.9%) |
| 45 to 54 Years | 394 (29.5%) | 1,004 (75.1%) |
| 55 to 64 Years | 391 (36.7%) | 740 (69.5%) |
| 65 to 74 Years | 769 (100.0%) | 454 (59.0%) |
| 75 Years and over | 408 (100.0%) | 216 (52.9%) |
| Total | 4,042 (48.6%) | 5,415 (65.1%) |
Disability Status by Sex by Age in Center Line
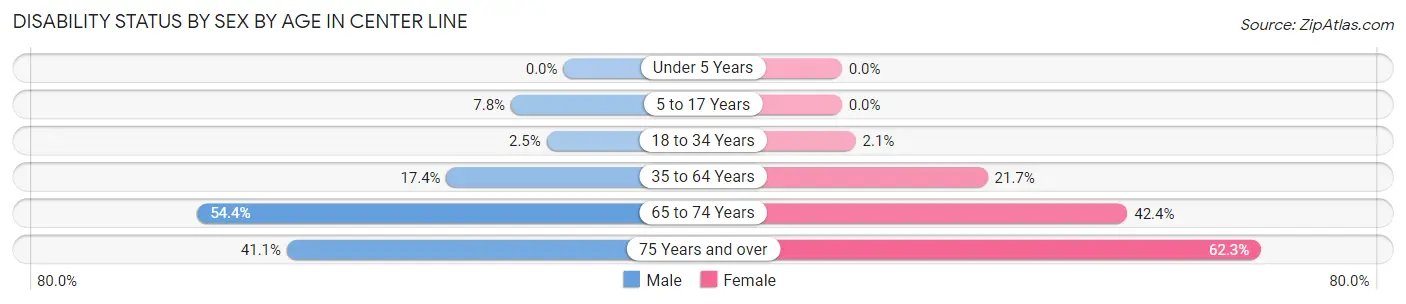
| Age Bracket | Male | Female |
| Under 5 Years | 0 (0.0%) | 0 (0.0%) |
| 5 to 17 Years | 64 (7.8%) | 0 (0.0%) |
| 18 to 34 Years | 22 (2.5%) | 18 (2.1%) |
| 35 to 64 Years | 279 (17.4%) | 384 (21.6%) |
| 65 to 74 Years | 218 (54.4%) | 156 (42.4%) |
| 75 Years and over | 62 (41.1%) | 160 (62.3%) |
Disability Class by Sex by Age in Center Line
Disability Class: Hearing Difficulty
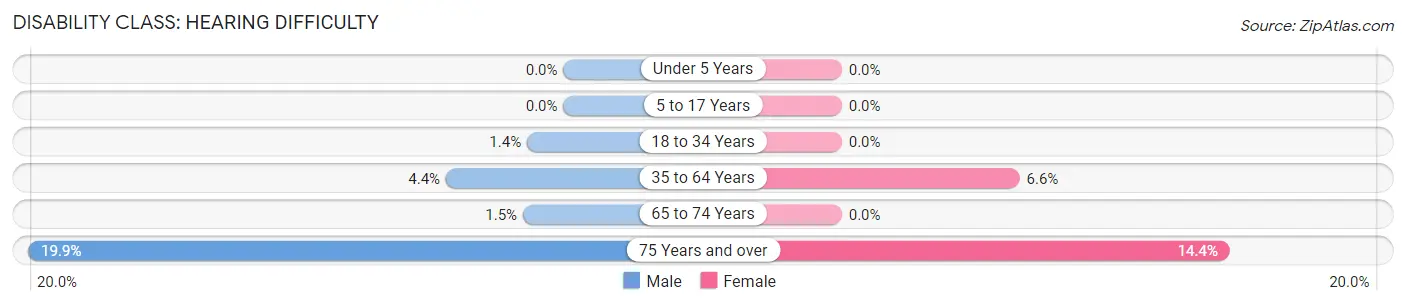
| Age Bracket | Male | Female |
| Under 5 Years | 0 (0.0%) | 0 (0.0%) |
| 5 to 17 Years | 0 (0.0%) | 0 (0.0%) |
| 18 to 34 Years | 12 (1.3%) | 0 (0.0%) |
| 35 to 64 Years | 70 (4.4%) | 117 (6.6%) |
| 65 to 74 Years | 6 (1.5%) | 0 (0.0%) |
| 75 Years and over | 30 (19.9%) | 37 (14.4%) |
Disability Class: Vision Difficulty
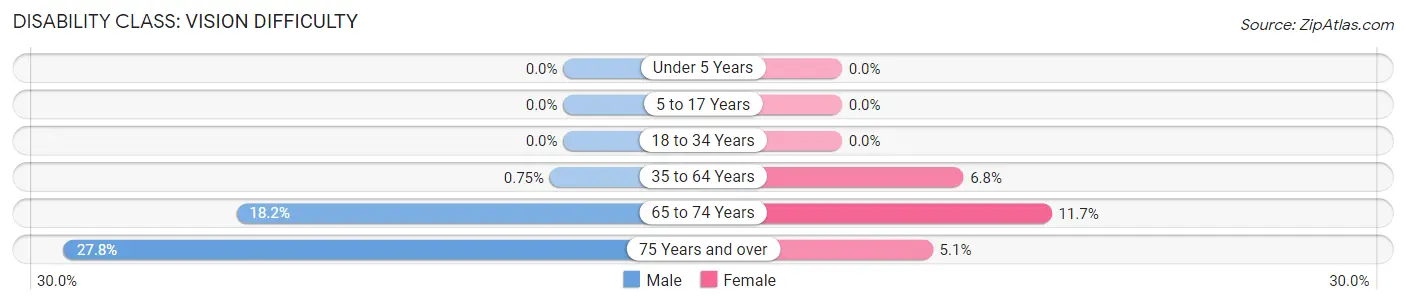
| Age Bracket | Male | Female |
| Under 5 Years | 0 (0.0%) | 0 (0.0%) |
| 5 to 17 Years | 0 (0.0%) | 0 (0.0%) |
| 18 to 34 Years | 0 (0.0%) | 0 (0.0%) |
| 35 to 64 Years | 12 (0.7%) | 120 (6.8%) |
| 65 to 74 Years | 73 (18.2%) | 43 (11.7%) |
| 75 Years and over | 42 (27.8%) | 13 (5.1%) |
Disability Class: Cognitive Difficulty
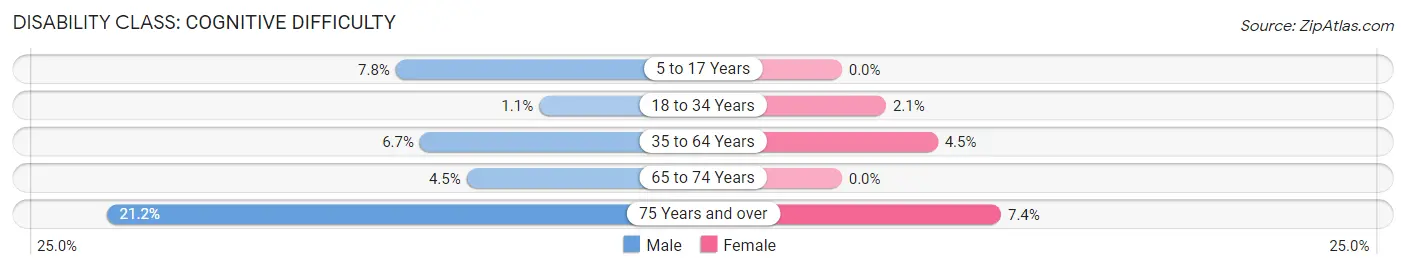
| Age Bracket | Male | Female |
| 5 to 17 Years | 64 (7.8%) | 0 (0.0%) |
| 18 to 34 Years | 10 (1.1%) | 18 (2.1%) |
| 35 to 64 Years | 107 (6.7%) | 79 (4.4%) |
| 65 to 74 Years | 18 (4.5%) | 0 (0.0%) |
| 75 Years and over | 32 (21.2%) | 19 (7.4%) |
Disability Class: Ambulatory Difficulty
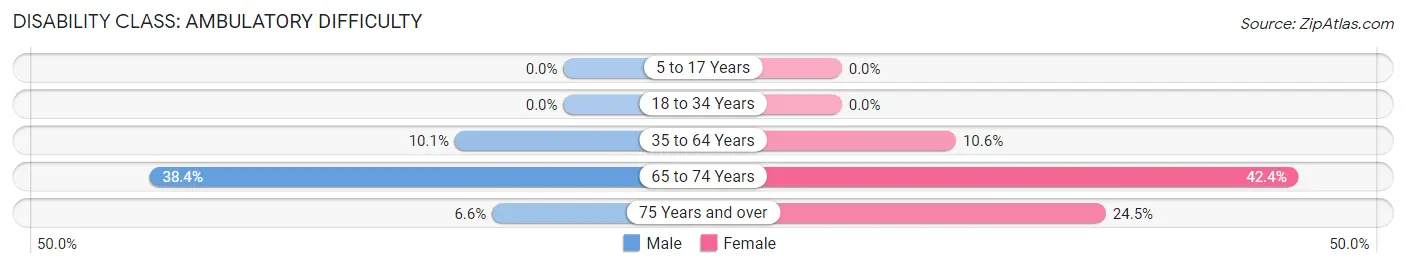
| Age Bracket | Male | Female |
| 5 to 17 Years | 0 (0.0%) | 0 (0.0%) |
| 18 to 34 Years | 0 (0.0%) | 0 (0.0%) |
| 35 to 64 Years | 162 (10.1%) | 188 (10.6%) |
| 65 to 74 Years | 154 (38.4%) | 156 (42.4%) |
| 75 Years and over | 10 (6.6%) | 63 (24.5%) |
Disability Class: Self-Care Difficulty
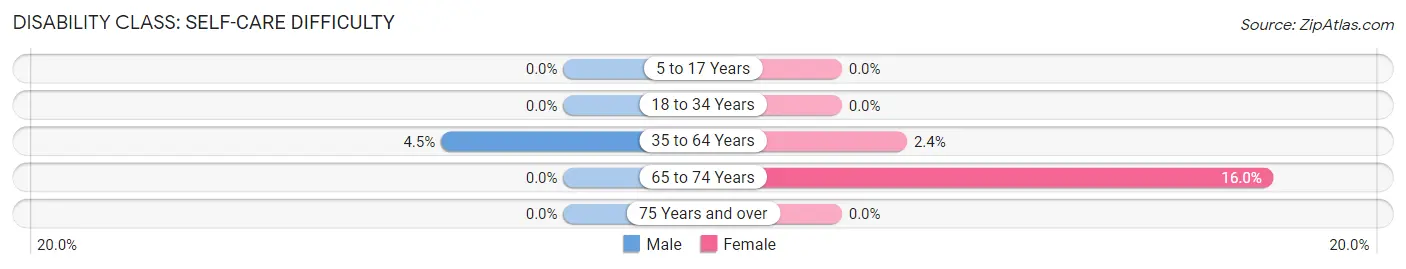
| Age Bracket | Male | Female |
| 5 to 17 Years | 0 (0.0%) | 0 (0.0%) |
| 18 to 34 Years | 0 (0.0%) | 0 (0.0%) |
| 35 to 64 Years | 73 (4.5%) | 43 (2.4%) |
| 65 to 74 Years | 0 (0.0%) | 59 (16.0%) |
| 75 Years and over | 0 (0.0%) | 0 (0.0%) |
Technology Access in Center Line
Computing Device Access in Center Line
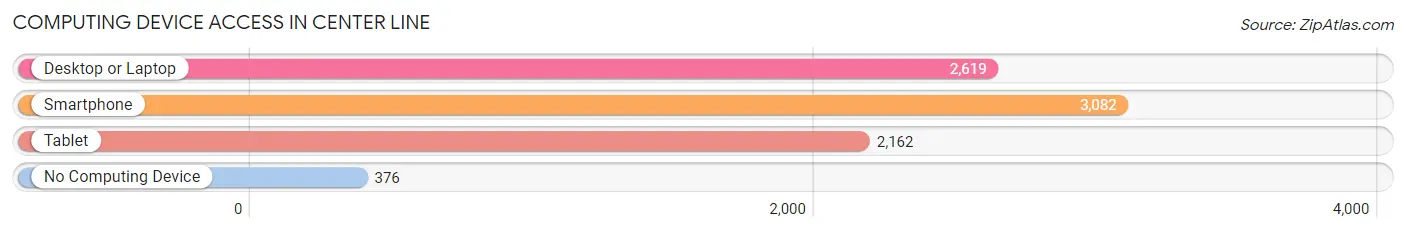
| Device Type | # Households | % Households |
| Desktop or Laptop | 2,619 | 70.8% |
| Smartphone | 3,082 | 83.3% |
| Tablet | 2,162 | 58.5% |
| No Computing Device | 376 | 10.2% |
| Total | 3,698 | 100.0% |
Internet Access in Center Line
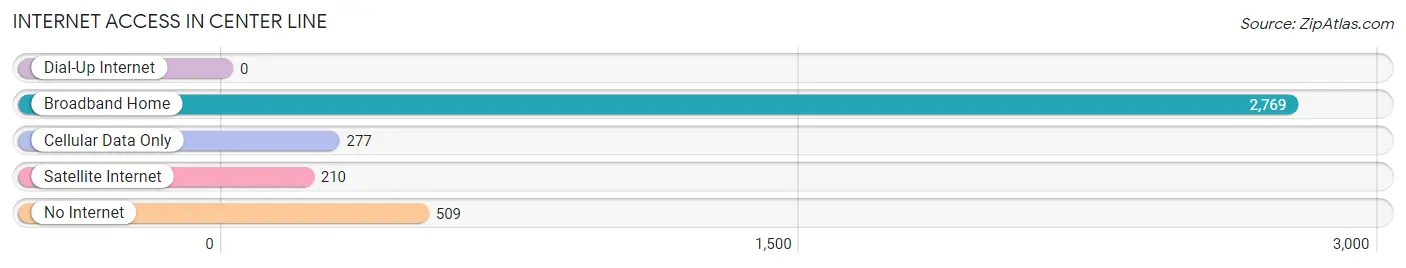
| Internet Type | # Households | % Households |
| Dial-Up Internet | 0 | 0.0% |
| Broadband Home | 2,769 | 74.9% |
| Cellular Data Only | 277 | 7.5% |
| Satellite Internet | 210 | 5.7% |
| No Internet | 509 | 13.8% |
| Total | 3,698 | 100.0% |
Center Line Summary
Introduction
Center Line is a city located in Macomb County, Michigan. It is a suburb of Detroit and is part of the Metro Detroit area. The city has a population of 8,257 as of the 2010 census. Center Line is known for its small-town charm and its close proximity to the city of Detroit.
History
The area that is now Center Line was first settled in the early 1800s by European settlers. The area was originally known as "Center Line Station" due to its location on the center line of the Detroit and Milwaukee Railroad. The area was incorporated as a village in 1925 and was later incorporated as a city in 1936.
The city of Center Line was originally a farming community, but it began to grow in the 1950s and 1960s as Detroit's population increased. The city was home to many factories and businesses, including the Center Line Tool and Die Company, which was founded in the 1950s. The city also had a large Polish population, which was reflected in the city's culture and architecture.
Geography
Center Line is located in Macomb County, Michigan. It is situated on the western edge of the Detroit metropolitan area. The city is bordered by the cities of Warren and Sterling Heights to the north, and by the cities of Madison Heights and Hazel Park to the south. The city is located on the banks of the Clinton River, which flows through the city.
The city has a total area of 2.3 square miles, all of which is land. The city has a humid continental climate, with hot, humid summers and cold, snowy winters.
Economy
The economy of Center Line is largely based on manufacturing and retail. The city is home to several factories and businesses, including the Center Line Tool and Die Company, which produces automotive parts. The city is also home to several retail stores, including a Walmart Supercenter and a Target.
The city also has a large Polish population, which is reflected in the city's economy. The city is home to several Polish restaurants, bakeries, and grocery stores.
Demographics
As of the 2010 census, the city of Center Line had a population of 8,257. The racial makeup of the city was 79.2% White, 14.2% African American, 0.4% Native American, 1.2% Asian, and 4.9% from other races. Hispanic or Latino of any race were 6.2% of the population.
The median household income in Center Line was $41,945, and the median family income was $50,945. The per capita income in the city was $20,945.
Conclusion
Center Line is a city located in Macomb County, Michigan. It is a suburb of Detroit and is part of the Metro Detroit area. The city has a population of 8,257 as of the 2010 census. Center Line is known for its small-town charm and its close proximity to the city of Detroit. The city's economy is largely based on manufacturing and retail, and it has a large Polish population. The city has a humid continental climate, with hot, humid summers and cold, snowy winters.
Common Questions
What is Per Capita Income in Center Line?
Per Capita income in Center Line is $28,967.
What is the Median Family Income in Center Line?
Median Family Income in Center Line is $69,235.
What is the Median Household income in Center Line?
Median Household Income in Center Line is $52,067.
What is Income or Wage Gap in Center Line?
Income or Wage Gap in Center Line is 9.3%.
Women in Center Line earn 90.7 cents for every dollar earned by a man.
What is Inequality or Gini Index in Center Line?
Inequality or Gini Index in Center Line is 0.41.
What is the Total Population of Center Line?
Total Population of Center Line is 8,493.
What is the Total Male Population of Center Line?
Total Male Population of Center Line is 4,193.
What is the Total Female Population of Center Line?
Total Female Population of Center Line is 4,300.
What is the Ratio of Males per 100 Females in Center Line?
There are 97.51 Males per 100 Females in Center Line.
What is the Ratio of Females per 100 Males in Center Line?
There are 102.55 Females per 100 Males in Center Line.
What is the Median Population Age in Center Line?
Median Population Age in Center Line is 41.2 Years.
What is the Average Family Size in Center Line
Average Family Size in Center Line is 3.2 People.
What is the Average Household Size in Center Line
Average Household Size in Center Line is 2.2 People.
How Large is the Labor Force in Center Line?
There are 4,455 People in the Labor Forcein in Center Line.
What is the Percentage of People in the Labor Force in Center Line?
66.0% of People are in the Labor Force in Center Line.
What is the Unemployment Rate in Center Line?
Unemployment Rate in Center Line is 6.4%.