Grand Ledge, MI Map & Demographics
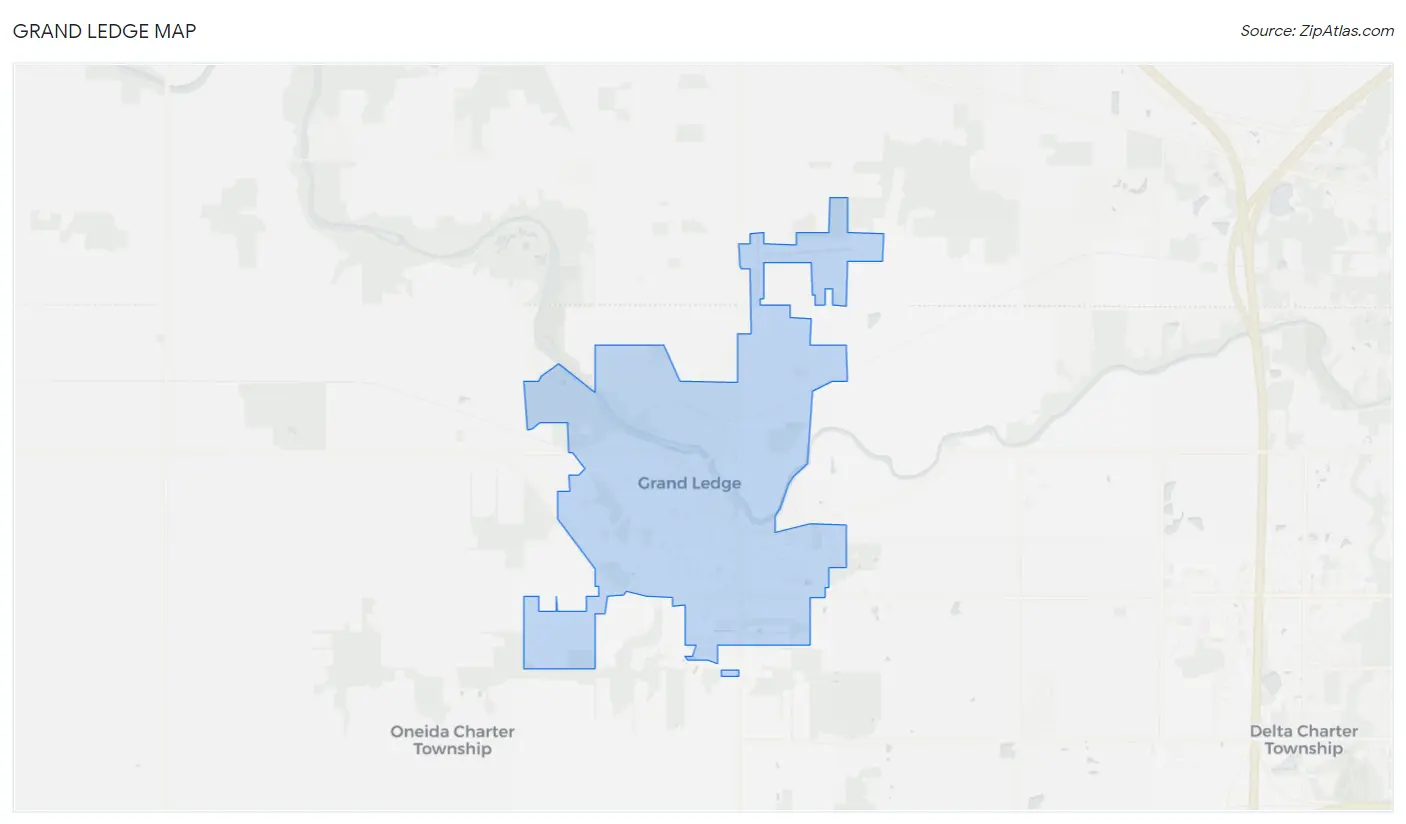
Grand Ledge Map
Grand Ledge Overview
$42,917
PER CAPITA INCOME
$89,965
AVG FAMILY INCOME
$71,179
AVG HOUSEHOLD INCOME
10.9%
WAGE / INCOME GAP [ % ]
89.1¢/ $1
WAGE / INCOME GAP [ $ ]
0.43
INEQUALITY / GINI INDEX
7,795
TOTAL POPULATION
3,739
MALE POPULATION
4,056
FEMALE POPULATION
92.18
MALES / 100 FEMALES
108.48
FEMALES / 100 MALES
41.9
MEDIAN AGE
2.8
AVG FAMILY SIZE
2.2
AVG HOUSEHOLD SIZE
4,096
LABOR FORCE [ PEOPLE ]
64.3%
PERCENT IN LABOR FORCE
5.4%
UNEMPLOYMENT RATE
Grand Ledge Zip Codes
Grand Ledge Area Codes
Income in Grand Ledge
Income Overview in Grand Ledge
Per Capita Income in Grand Ledge is $42,917, while median incomes of families and households are $89,965 and $71,179 respectively.
| Characteristic | Number | Measure |
| Per Capita Income | 7,795 | $42,917 |
| Median Family Income | 2,156 | $89,965 |
| Mean Family Income | 2,156 | $117,920 |
| Median Household Income | 3,526 | $71,179 |
| Mean Household Income | 3,526 | $95,083 |
| Income Deficit | 2,156 | $0 |
| Wage / Income Gap (%) | 7,795 | 10.88% |
| Wage / Income Gap ($) | 7,795 | 89.12¢ per $1 |
| Gini / Inequality Index | 7,795 | 0.43 |
Earnings by Sex in Grand Ledge
Average Earnings in Grand Ledge are $44,569, $46,130 for men and $41,112 for women, a difference of 10.9%.
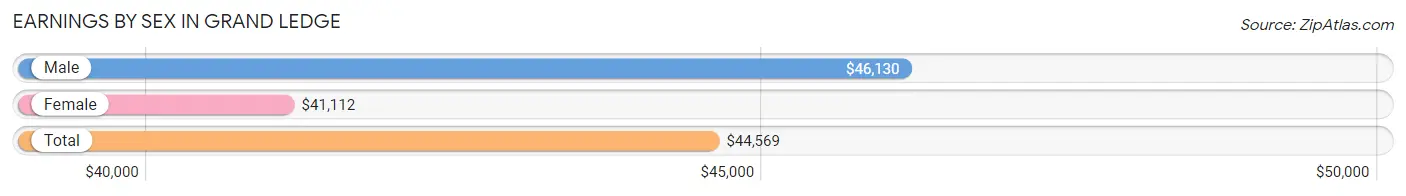
| Sex | Number | Average Earnings |
| Male | 1,952 (47.3%) | $46,130 |
| Female | 2,177 (52.7%) | $41,112 |
| Total | 4,129 (100.0%) | $44,569 |
Earnings by Sex by Income Bracket in Grand Ledge
The most common earnings brackets in Grand Ledge are $55,000 to $64,999 for men (269 | 13.8%) and $100,000+ for women (243 | 11.2%).
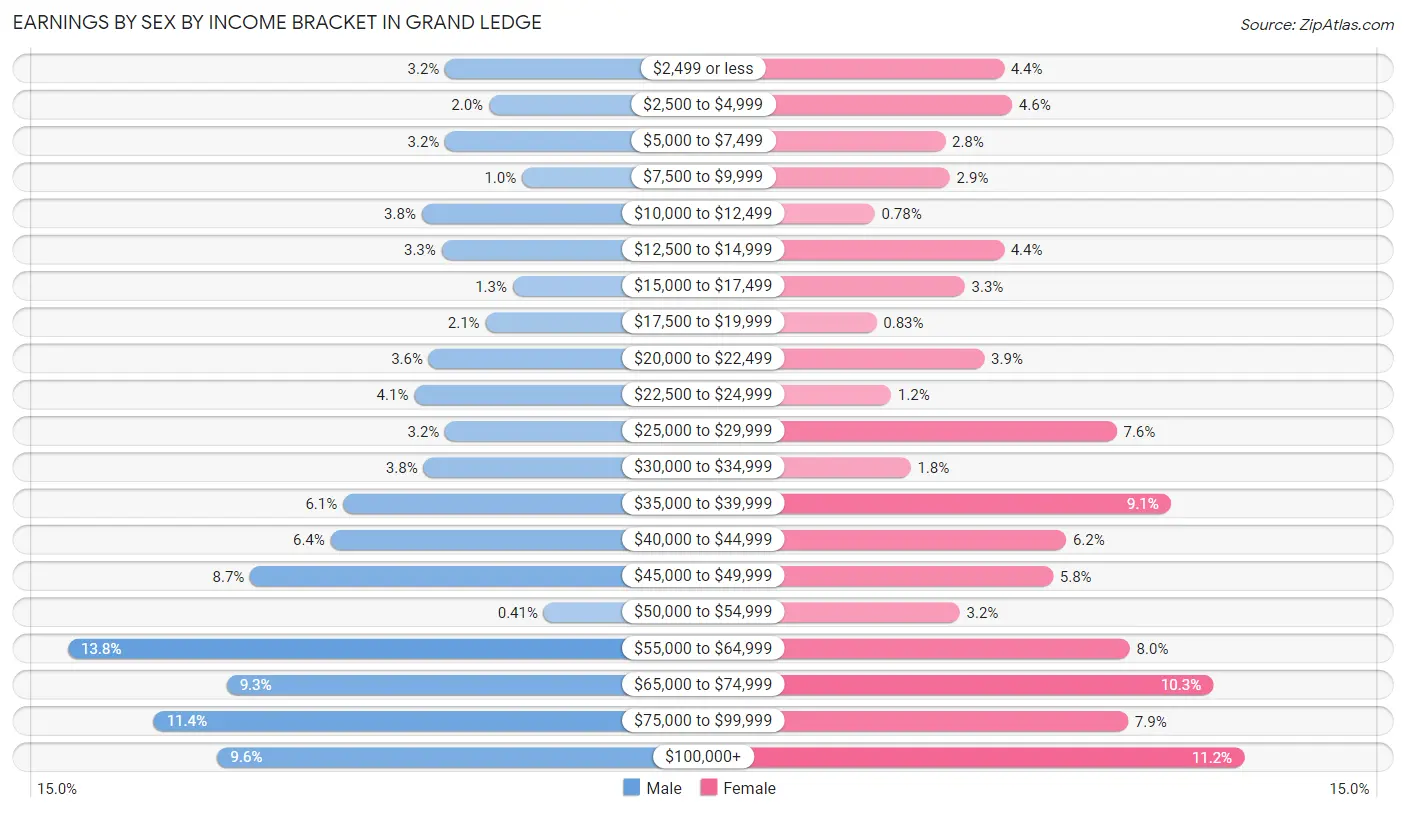
| Income | Male | Female |
| $2,499 or less | 62 (3.2%) | 96 (4.4%) |
| $2,500 to $4,999 | 38 (1.9%) | 101 (4.6%) |
| $5,000 to $7,499 | 62 (3.2%) | 60 (2.8%) |
| $7,500 to $9,999 | 20 (1.0%) | 63 (2.9%) |
| $10,000 to $12,499 | 75 (3.8%) | 17 (0.8%) |
| $12,500 to $14,999 | 64 (3.3%) | 96 (4.4%) |
| $15,000 to $17,499 | 25 (1.3%) | 72 (3.3%) |
| $17,500 to $19,999 | 40 (2.1%) | 18 (0.8%) |
| $20,000 to $22,499 | 71 (3.6%) | 84 (3.9%) |
| $22,500 to $24,999 | 79 (4.1%) | 27 (1.2%) |
| $25,000 to $29,999 | 62 (3.2%) | 165 (7.6%) |
| $30,000 to $34,999 | 74 (3.8%) | 39 (1.8%) |
| $35,000 to $39,999 | 118 (6.0%) | 198 (9.1%) |
| $40,000 to $44,999 | 125 (6.4%) | 134 (6.2%) |
| $45,000 to $49,999 | 169 (8.7%) | 126 (5.8%) |
| $50,000 to $54,999 | 8 (0.4%) | 69 (3.2%) |
| $55,000 to $64,999 | 269 (13.8%) | 173 (8.0%) |
| $65,000 to $74,999 | 182 (9.3%) | 224 (10.3%) |
| $75,000 to $99,999 | 222 (11.4%) | 172 (7.9%) |
| $100,000+ | 187 (9.6%) | 243 (11.2%) |
| Total | 1,952 (100.0%) | 2,177 (100.0%) |
Earnings by Sex by Educational Attainment in Grand Ledge
Average earnings in Grand Ledge are $55,058 for men and $48,021 for women, a difference of 12.8%. Men with an educational attainment of graduate degree enjoy the highest average annual earnings of $71,625, while those with high school diploma education earn the least with $42,565. Women with an educational attainment of graduate degree earn the most with the average annual earnings of $67,350, while those with high school diploma education have the smallest earnings of $29,485.
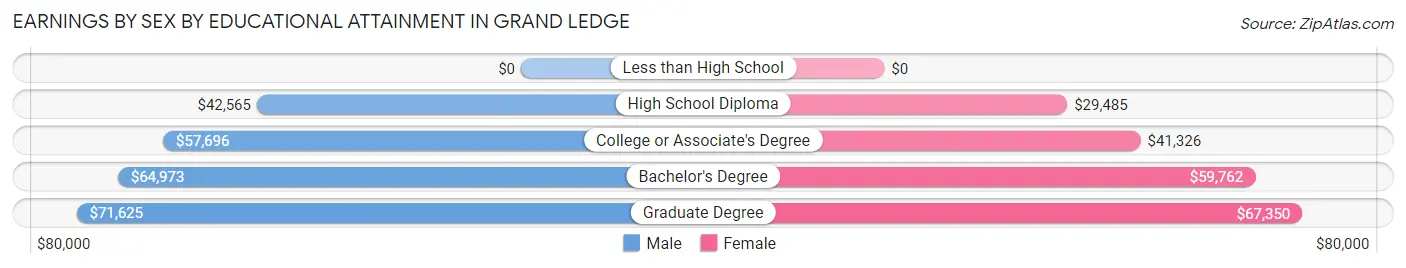
| Educational Attainment | Male Income | Female Income |
| Less than High School | - | - |
| High School Diploma | $42,565 | $29,485 |
| College or Associate's Degree | $57,696 | $41,326 |
| Bachelor's Degree | $64,973 | $59,762 |
| Graduate Degree | $71,625 | $67,350 |
| Total | $55,058 | $48,021 |
Family Income in Grand Ledge
Family Income Brackets in Grand Ledge
According to the Grand Ledge family income data, there are 558 families falling into the $100,000 to $149,999 income range, which is the most common income bracket and makes up 25.9% of all families.
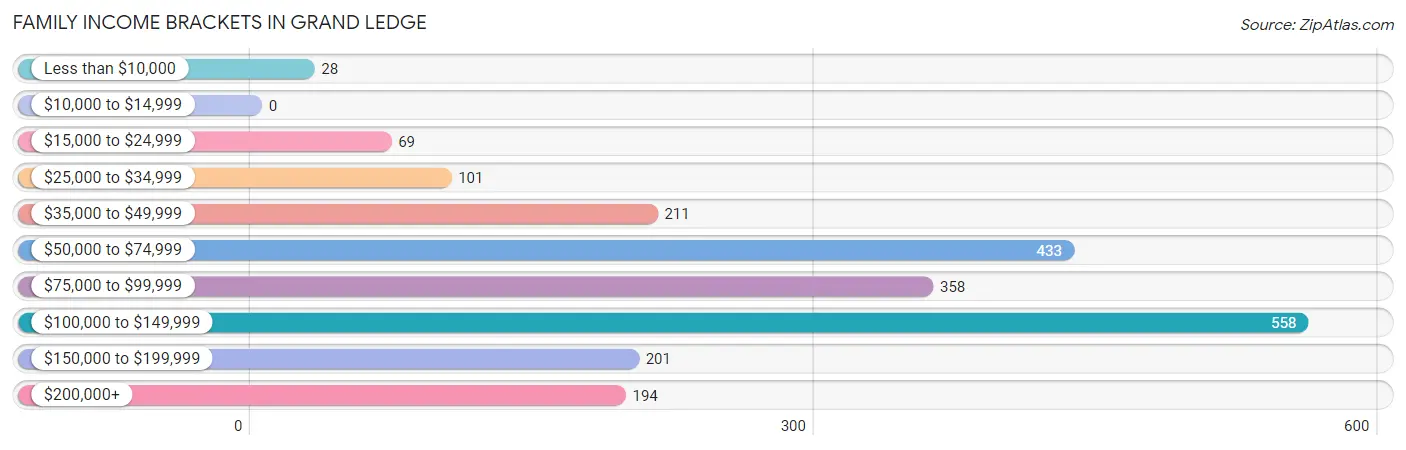
| Income Bracket | # Families | % Families |
| Less than $10,000 | 28 | 1.3% |
| $10,000 to $14,999 | 0 | 0.0% |
| $15,000 to $24,999 | 69 | 3.2% |
| $25,000 to $34,999 | 101 | 4.7% |
| $35,000 to $49,999 | 211 | 9.8% |
| $50,000 to $74,999 | 433 | 20.1% |
| $75,000 to $99,999 | 358 | 16.6% |
| $100,000 to $149,999 | 558 | 25.9% |
| $150,000 to $199,999 | 201 | 9.3% |
| $200,000+ | 194 | 9.0% |
Family Income by Famaliy Size in Grand Ledge
5-person families (62 | 2.9%) account for the highest median family income in Grand Ledge with $123,393 per family, while 2-person families (1,153 | 53.5%) have the highest median income of $43,566 per family member.
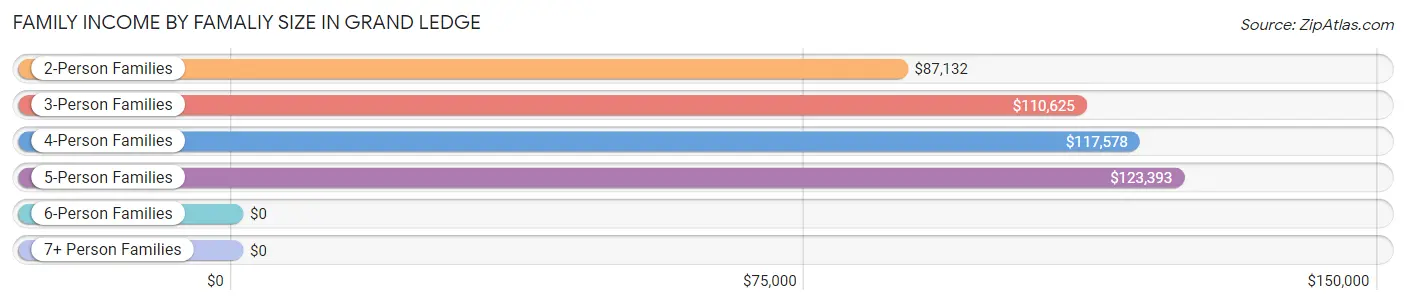
| Income Bracket | # Families | Median Income |
| 2-Person Families | 1,153 (53.5%) | $87,132 |
| 3-Person Families | 528 (24.5%) | $110,625 |
| 4-Person Families | 395 (18.3%) | $117,578 |
| 5-Person Families | 62 (2.9%) | $123,393 |
| 6-Person Families | 18 (0.8%) | $0 |
| 7+ Person Families | 0 (0.0%) | $0 |
| Total | 2,156 (100.0%) | $89,965 |
Family Income by Number of Earners in Grand Ledge
The median family income in Grand Ledge is $89,965, with families comprising 3+ earners (146) having the highest median family income of $150,900, while families with no earners (332) have the lowest median family income of $55,556, accounting for 6.8% and 15.4% of families, respectively.
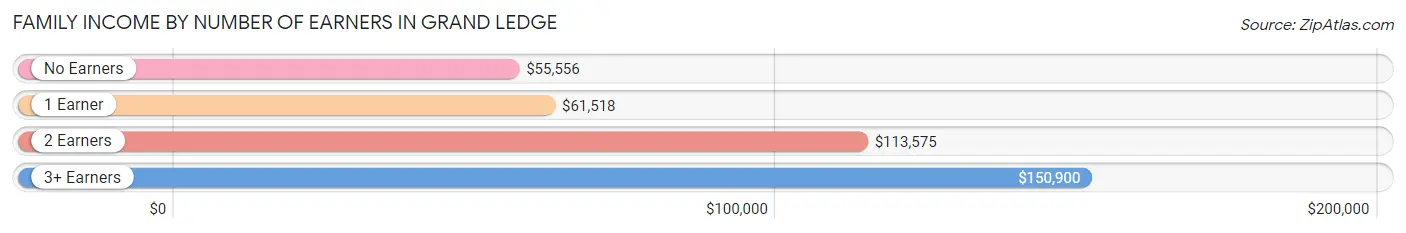
| Number of Earners | # Families | Median Income |
| No Earners | 332 (15.4%) | $55,556 |
| 1 Earner | 749 (34.7%) | $61,518 |
| 2 Earners | 929 (43.1%) | $113,575 |
| 3+ Earners | 146 (6.8%) | $150,900 |
| Total | 2,156 (100.0%) | $89,965 |
Household Income in Grand Ledge
Household Income Brackets in Grand Ledge
With 843 households falling in the category, the $50,000 to $74,999 income range is the most frequent in Grand Ledge, accounting for 23.9% of all households. In contrast, only 56 households (1.6%) fall into the less than $10,000 income bracket, making it the least populous group.
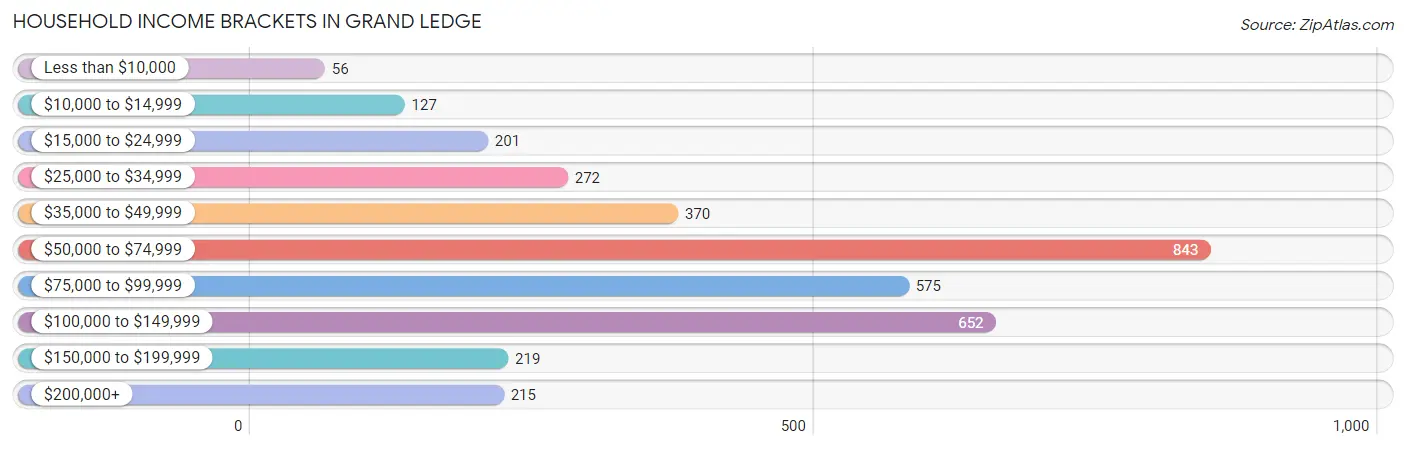
| Income Bracket | # Households | % Households |
| Less than $10,000 | 56 | 1.6% |
| $10,000 to $14,999 | 127 | 3.6% |
| $15,000 to $24,999 | 201 | 5.7% |
| $25,000 to $34,999 | 272 | 7.7% |
| $35,000 to $49,999 | 370 | 10.5% |
| $50,000 to $74,999 | 843 | 23.9% |
| $75,000 to $99,999 | 575 | 16.3% |
| $100,000 to $149,999 | 652 | 18.5% |
| $150,000 to $199,999 | 219 | 6.2% |
| $200,000+ | 215 | 6.1% |
Household Income by Householder Age in Grand Ledge
The median household income in Grand Ledge is $71,179, with the highest median household income of $87,250 found in the 45 to 64 years age bracket for the primary householder. A total of 1,193 households (33.8%) fall into this category. Meanwhile, the 65+ years age bracket for the primary householder has the lowest median household income of $59,297, with 1,158 households (32.8%) in this group.
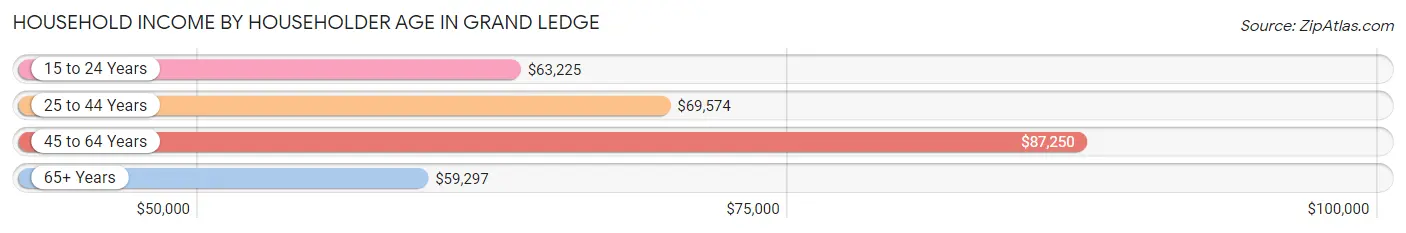
| Income Bracket | # Households | Median Income |
| 15 to 24 Years | 101 (2.9%) | $63,225 |
| 25 to 44 Years | 1,074 (30.5%) | $69,574 |
| 45 to 64 Years | 1,193 (33.8%) | $87,250 |
| 65+ Years | 1,158 (32.8%) | $59,297 |
| Total | 3,526 (100.0%) | $71,179 |
Poverty in Grand Ledge
Income Below Poverty by Sex and Age in Grand Ledge
With 5.9% poverty level for males and 5.9% for females among the residents of Grand Ledge, 5 year old males and 18 to 24 year old females are the most vulnerable to poverty, with 19 males (22.6%) and 51 females (15.2%) in their respective age groups living below the poverty level.
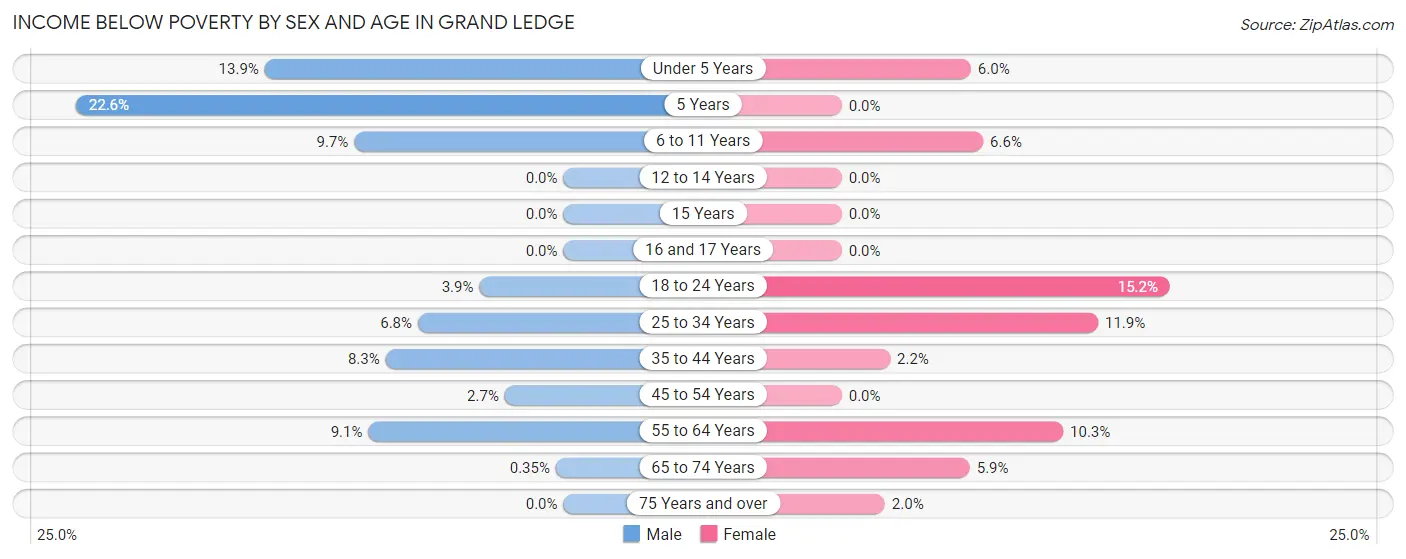
| Age Bracket | Male | Female |
| Under 5 Years | 23 (13.9%) | 10 (6.0%) |
| 5 Years | 19 (22.6%) | 0 (0.0%) |
| 6 to 11 Years | 33 (9.7%) | 21 (6.6%) |
| 12 to 14 Years | 0 (0.0%) | 0 (0.0%) |
| 15 Years | 0 (0.0%) | 0 (0.0%) |
| 16 and 17 Years | 0 (0.0%) | 0 (0.0%) |
| 18 to 24 Years | 11 (3.9%) | 51 (15.2%) |
| 25 to 34 Years | 31 (6.8%) | 46 (11.9%) |
| 35 to 44 Years | 35 (8.3%) | 13 (2.2%) |
| 45 to 54 Years | 11 (2.7%) | 0 (0.0%) |
| 55 to 64 Years | 56 (9.0%) | 58 (10.3%) |
| 65 to 74 Years | 1 (0.4%) | 30 (5.9%) |
| 75 Years and over | 0 (0.0%) | 9 (2.0%) |
| Total | 220 (5.9%) | 238 (5.9%) |
Income Above Poverty by Sex and Age in Grand Ledge
According to the poverty statistics in Grand Ledge, males aged 12 to 14 years and females aged 5 years are the age groups that are most secure financially, with 100.0% of males and 100.0% of females in these age groups living above the poverty line.
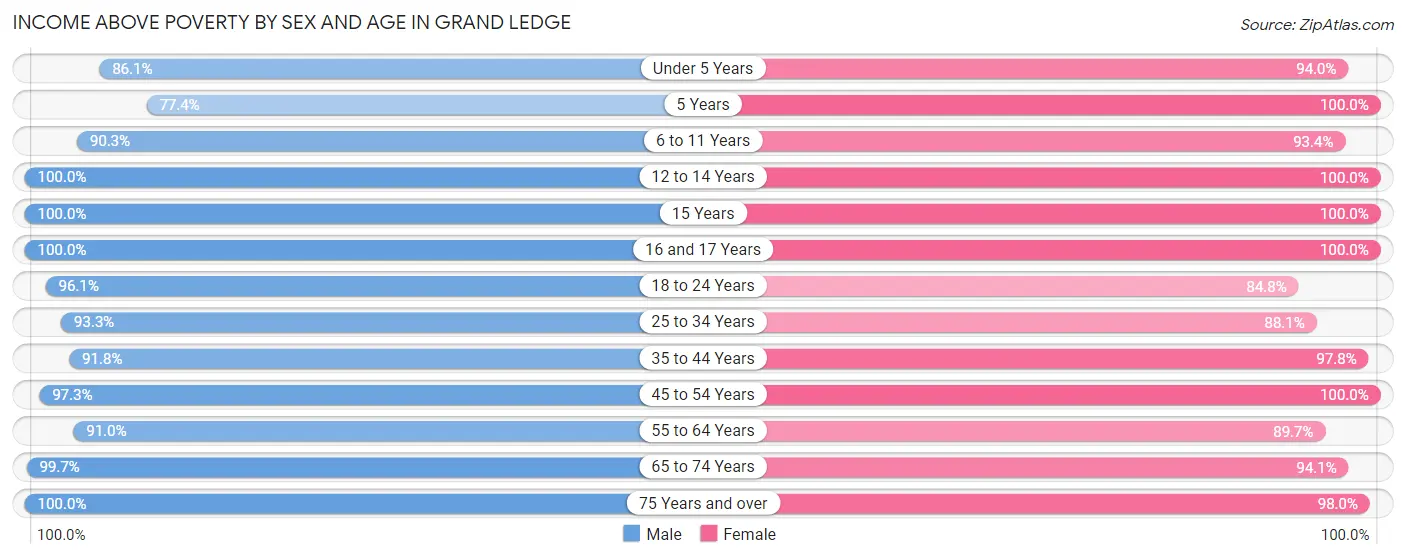
| Age Bracket | Male | Female |
| Under 5 Years | 143 (86.1%) | 157 (94.0%) |
| 5 Years | 65 (77.4%) | 24 (100.0%) |
| 6 to 11 Years | 307 (90.3%) | 299 (93.4%) |
| 12 to 14 Years | 174 (100.0%) | 68 (100.0%) |
| 15 Years | 40 (100.0%) | 32 (100.0%) |
| 16 and 17 Years | 92 (100.0%) | 102 (100.0%) |
| 18 to 24 Years | 271 (96.1%) | 284 (84.8%) |
| 25 to 34 Years | 428 (93.2%) | 341 (88.1%) |
| 35 to 44 Years | 389 (91.7%) | 567 (97.8%) |
| 45 to 54 Years | 393 (97.3%) | 491 (100.0%) |
| 55 to 64 Years | 563 (90.9%) | 507 (89.7%) |
| 65 to 74 Years | 287 (99.7%) | 475 (94.1%) |
| 75 Years and over | 367 (100.0%) | 441 (98.0%) |
| Total | 3,519 (94.1%) | 3,788 (94.1%) |
Income Below Poverty Among Married-Couple Families in Grand Ledge
The poverty statistics for married-couple families in Grand Ledge show that 1.1% or 18 of the total 1,609 families live below the poverty line. Families with 1 or 2 children have the highest poverty rate of 3.7%, comprising of 18 families. On the other hand, families with no children have the lowest poverty rate of 0.0%, which includes 0 families.
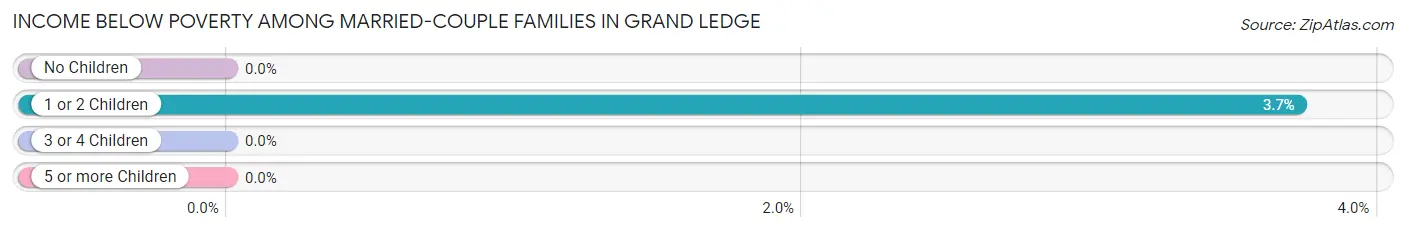
| Children | Above Poverty | Below Poverty |
| No Children | 1,064 (100.0%) | 0 (0.0%) |
| 1 or 2 Children | 466 (96.3%) | 18 (3.7%) |
| 3 or 4 Children | 61 (100.0%) | 0 (0.0%) |
| 5 or more Children | 0 (0.0%) | 0 (0.0%) |
| Total | 1,591 (98.9%) | 18 (1.1%) |
Income Below Poverty Among Single-Parent Households in Grand Ledge
According to the poverty data in Grand Ledge, 20.3% or 27 single-father households and 4.3% or 18 single-mother households are living below the poverty line. Among single-father households, those with 3 or 4 children have the highest poverty rate, with 19 households (100.0%) experiencing poverty. Likewise, among single-mother households, those with no children have the highest poverty rate, with 10 households (11.4%) falling below the poverty line.
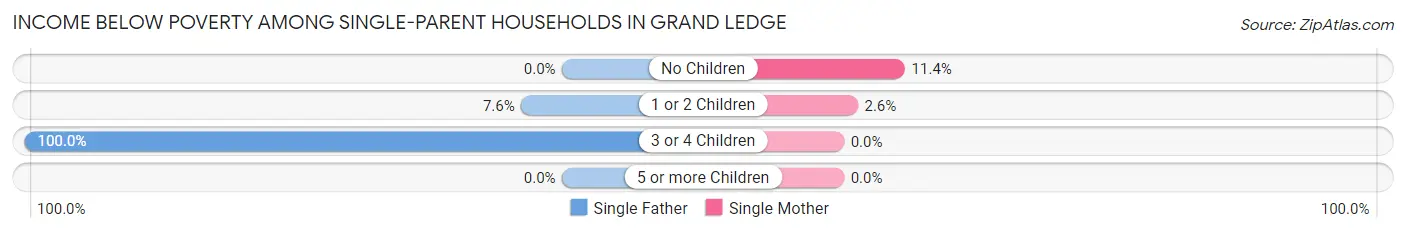
| Children | Single Father | Single Mother |
| No Children | 0 (0.0%) | 10 (11.4%) |
| 1 or 2 Children | 8 (7.6%) | 8 (2.6%) |
| 3 or 4 Children | 19 (100.0%) | 0 (0.0%) |
| 5 or more Children | 0 (0.0%) | 0 (0.0%) |
| Total | 27 (20.3%) | 18 (4.3%) |
Income Below Poverty Among Married-Couple vs Single-Parent Households in Grand Ledge
The poverty data for Grand Ledge shows that 18 of the married-couple family households (1.1%) and 45 of the single-parent households (8.2%) are living below the poverty level. Within the married-couple family households, those with 1 or 2 children have the highest poverty rate, with 18 households (3.7%) falling below the poverty line. Among the single-parent households, those with 3 or 4 children have the highest poverty rate, with 19 household (54.3%) living below poverty.
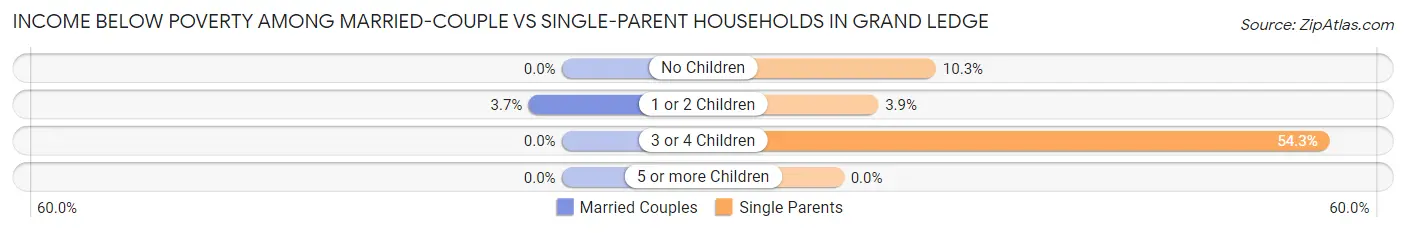
| Children | Married-Couple Families | Single-Parent Households |
| No Children | 0 (0.0%) | 10 (10.3%) |
| 1 or 2 Children | 18 (3.7%) | 16 (3.9%) |
| 3 or 4 Children | 0 (0.0%) | 19 (54.3%) |
| 5 or more Children | 0 (0.0%) | 0 (0.0%) |
| Total | 18 (1.1%) | 45 (8.2%) |
Race in Grand Ledge
The most populous races in Grand Ledge are White / Caucasian (7,367 | 94.5%), Hispanic or Latino (359 | 4.6%), and Two or more Races (307 | 3.9%).
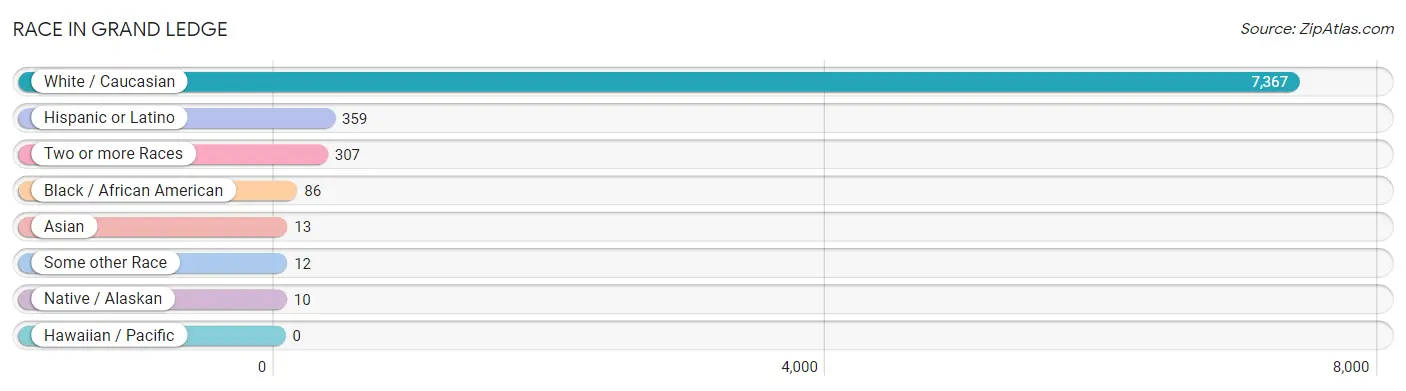
| Race | # Population | % Population |
| Asian | 13 | 0.2% |
| Black / African American | 86 | 1.1% |
| Hawaiian / Pacific | 0 | 0.0% |
| Hispanic or Latino | 359 | 4.6% |
| Native / Alaskan | 10 | 0.1% |
| White / Caucasian | 7,367 | 94.5% |
| Two or more Races | 307 | 3.9% |
| Some other Race | 12 | 0.2% |
| Total | 7,795 | 100.0% |
Ancestry in Grand Ledge
The most populous ancestries reported in Grand Ledge are German (1,832 | 23.5%), Irish (1,433 | 18.4%), English (1,277 | 16.4%), American (422 | 5.4%), and Dutch (368 | 4.7%), together accounting for 68.4% of all Grand Ledge residents.
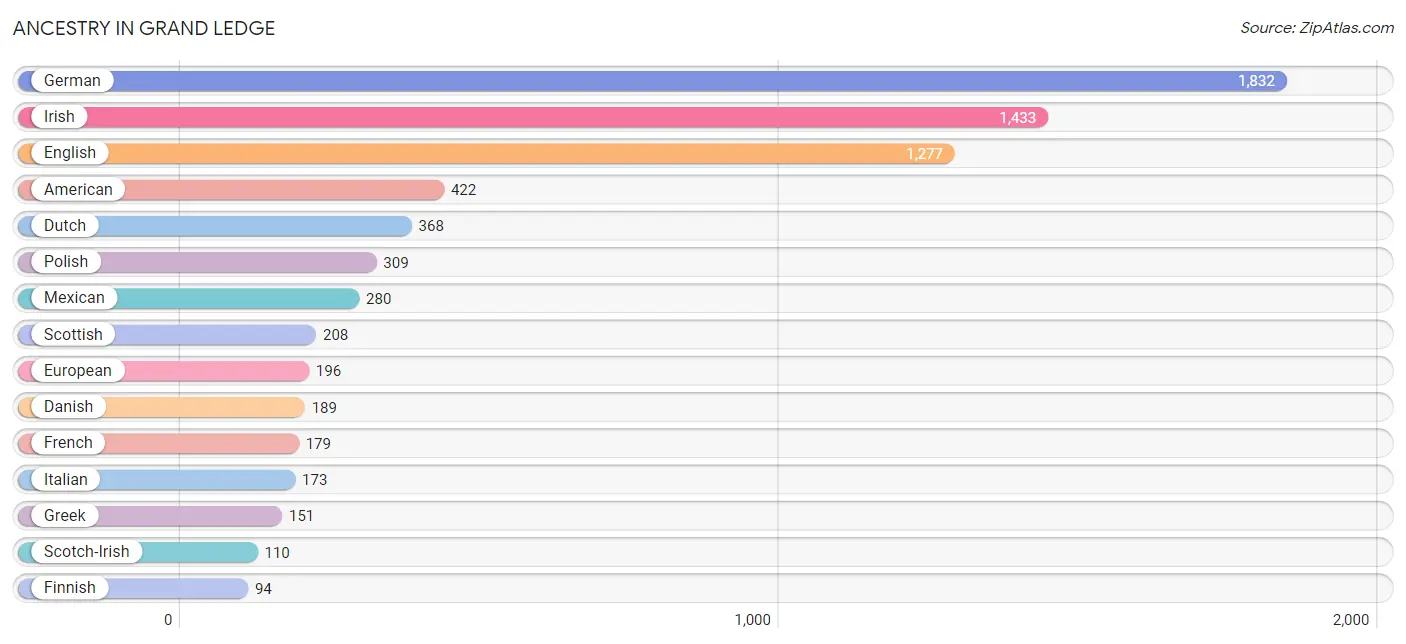
| Ancestry | # Population | % Population |
| American | 422 | 5.4% |
| Arab | 25 | 0.3% |
| Austrian | 12 | 0.2% |
| Belgian | 35 | 0.4% |
| Blackfeet | 45 | 0.6% |
| British | 14 | 0.2% |
| Burmese | 8 | 0.1% |
| Canadian | 62 | 0.8% |
| Cape Verdean | 4 | 0.1% |
| Central American | 56 | 0.7% |
| Cherokee | 7 | 0.1% |
| Chippewa | 9 | 0.1% |
| Croatian | 7 | 0.1% |
| Cuban | 16 | 0.2% |
| Czech | 6 | 0.1% |
| Danish | 189 | 2.4% |
| Dutch | 368 | 4.7% |
| Eastern European | 8 | 0.1% |
| English | 1,277 | 16.4% |
| European | 196 | 2.5% |
| Finnish | 94 | 1.2% |
| French | 179 | 2.3% |
| French Canadian | 92 | 1.2% |
| German | 1,832 | 23.5% |
| Greek | 151 | 1.9% |
| Guatemalan | 56 | 0.7% |
| Hungarian | 18 | 0.2% |
| Indian (Asian) | 10 | 0.1% |
| Irish | 1,433 | 18.4% |
| Italian | 173 | 2.2% |
| Korean | 3 | 0.0% |
| Lebanese | 12 | 0.2% |
| Luxembourger | 8 | 0.1% |
| Macedonian | 12 | 0.2% |
| Mexican | 280 | 3.6% |
| Mongolian | 14 | 0.2% |
| Northern European | 11 | 0.1% |
| Norwegian | 82 | 1.1% |
| Palestinian | 13 | 0.2% |
| Pennsylvania German | 14 | 0.2% |
| Polish | 309 | 4.0% |
| Potawatomi | 17 | 0.2% |
| Romanian | 10 | 0.1% |
| Russian | 23 | 0.3% |
| Scandinavian | 7 | 0.1% |
| Scotch-Irish | 110 | 1.4% |
| Scottish | 208 | 2.7% |
| Serbian | 13 | 0.2% |
| Spaniard | 7 | 0.1% |
| Subsaharan African | 4 | 0.1% |
| Swedish | 47 | 0.6% |
| Swiss | 20 | 0.3% |
| Welsh | 14 | 0.2% | View All 53 Rows |
Immigrants in Grand Ledge
The most numerous immigrant groups reported in Grand Ledge came from Asia (40 | 0.5%), Central America (36 | 0.5%), Guatemala (36 | 0.5%), Latin America (36 | 0.5%), and South Eastern Asia (17 | 0.2%), together accounting for 2.1% of all Grand Ledge residents.
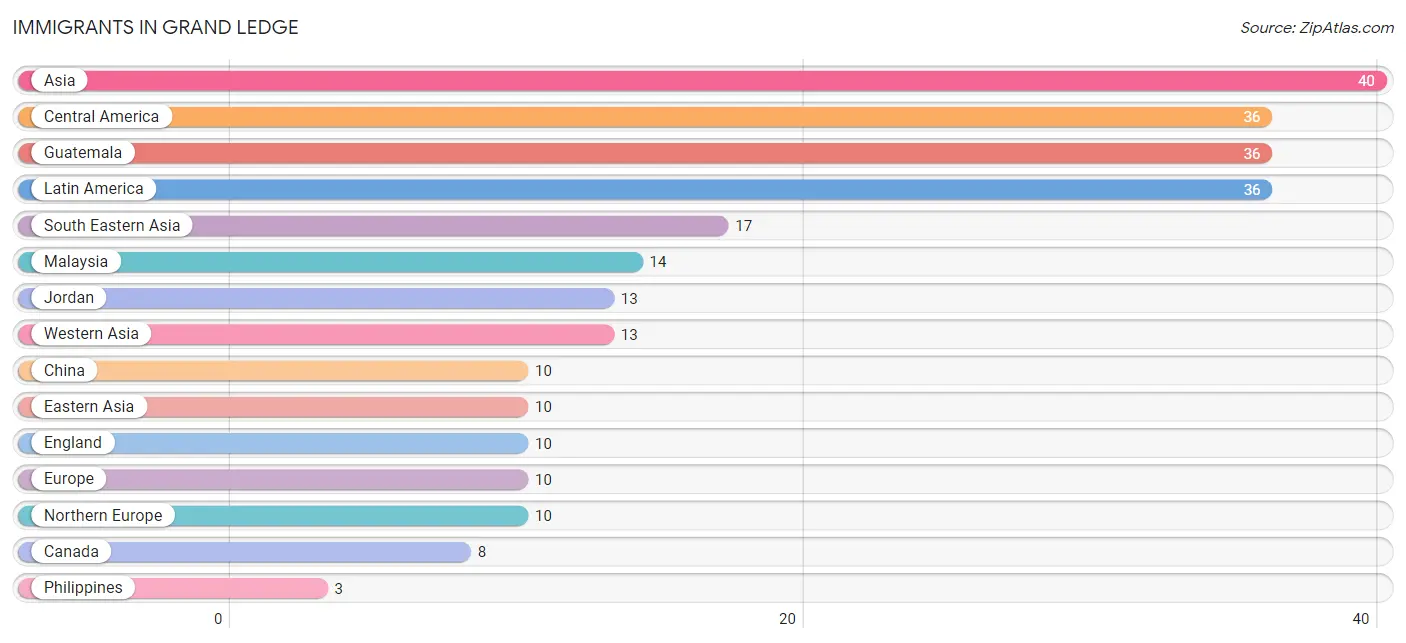
| Immigration Origin | # Population | % Population |
| Asia | 40 | 0.5% |
| Canada | 8 | 0.1% |
| Central America | 36 | 0.5% |
| China | 10 | 0.1% |
| Eastern Asia | 10 | 0.1% |
| England | 10 | 0.1% |
| Europe | 10 | 0.1% |
| Guatemala | 36 | 0.5% |
| Jordan | 13 | 0.2% |
| Latin America | 36 | 0.5% |
| Malaysia | 14 | 0.2% |
| Northern Europe | 10 | 0.1% |
| Philippines | 3 | 0.0% |
| South Eastern Asia | 17 | 0.2% |
| Western Asia | 13 | 0.2% | View All 15 Rows |
Sex and Age in Grand Ledge
Sex and Age in Grand Ledge
The most populous age groups in Grand Ledge are 55 to 59 Years (357 | 9.6%) for men and 35 to 39 Years (387 | 9.5%) for women.
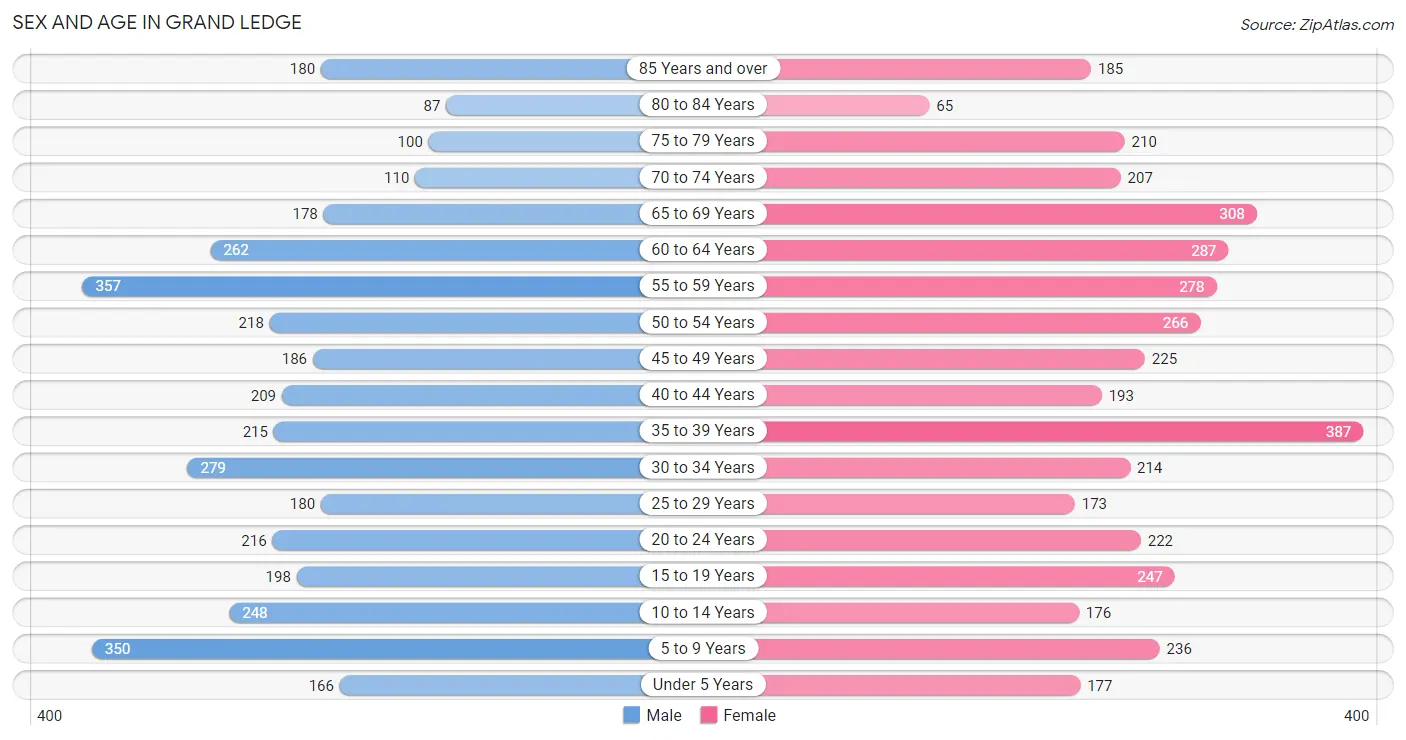
| Age Bracket | Male | Female |
| Under 5 Years | 166 (4.4%) | 177 (4.4%) |
| 5 to 9 Years | 350 (9.4%) | 236 (5.8%) |
| 10 to 14 Years | 248 (6.6%) | 176 (4.3%) |
| 15 to 19 Years | 198 (5.3%) | 247 (6.1%) |
| 20 to 24 Years | 216 (5.8%) | 222 (5.5%) |
| 25 to 29 Years | 180 (4.8%) | 173 (4.3%) |
| 30 to 34 Years | 279 (7.5%) | 214 (5.3%) |
| 35 to 39 Years | 215 (5.8%) | 387 (9.5%) |
| 40 to 44 Years | 209 (5.6%) | 193 (4.8%) |
| 45 to 49 Years | 186 (5.0%) | 225 (5.6%) |
| 50 to 54 Years | 218 (5.8%) | 266 (6.6%) |
| 55 to 59 Years | 357 (9.6%) | 278 (6.9%) |
| 60 to 64 Years | 262 (7.0%) | 287 (7.1%) |
| 65 to 69 Years | 178 (4.8%) | 308 (7.6%) |
| 70 to 74 Years | 110 (2.9%) | 207 (5.1%) |
| 75 to 79 Years | 100 (2.7%) | 210 (5.2%) |
| 80 to 84 Years | 87 (2.3%) | 65 (1.6%) |
| 85 Years and over | 180 (4.8%) | 185 (4.6%) |
| Total | 3,739 (100.0%) | 4,056 (100.0%) |
Families and Households in Grand Ledge
Median Family Size in Grand Ledge
The median family size in Grand Ledge is 2.76 persons per family, with married-couple families (1,609 | 74.6%) accounting for the largest median family size of 2.79 persons per family. On the other hand, single male/father families (133 | 6.2%) represent the smallest median family size with 2.65 persons per family.
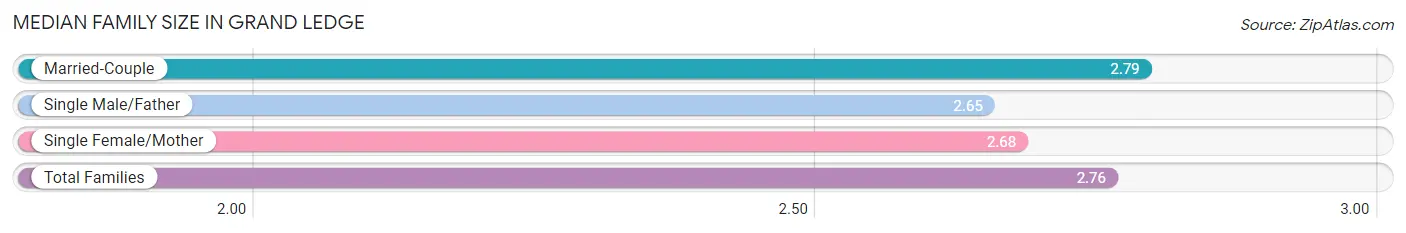
| Family Type | # Families | Family Size |
| Married-Couple | 1,609 (74.6%) | 2.79 |
| Single Male/Father | 133 (6.2%) | 2.65 |
| Single Female/Mother | 414 (19.2%) | 2.68 |
| Total Families | 2,156 (100.0%) | 2.76 |
Median Household Size in Grand Ledge
The median household size in Grand Ledge is 2.20 persons per household, with single female/mother households (414 | 11.7%) accounting for the largest median household size of 2.98 persons per household. non-family households (1,370 | 38.9%) represent the smallest median household size with 1.16 persons per household.
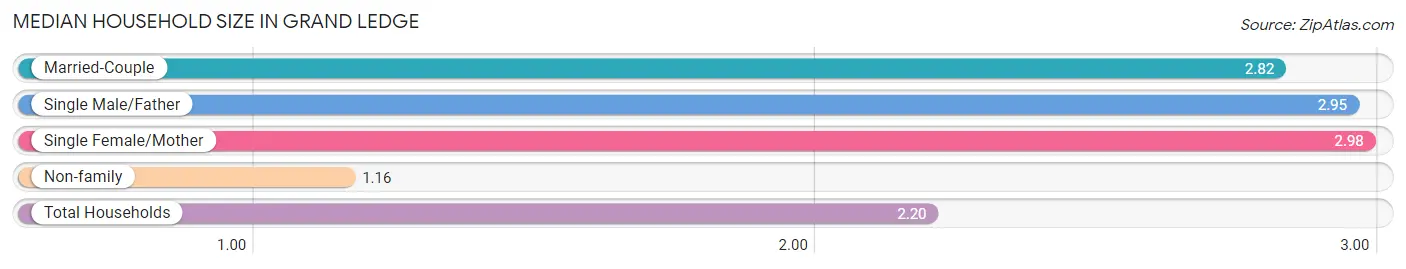
| Household Type | # Households | Household Size |
| Married-Couple | 1,609 (45.6%) | 2.82 |
| Single Male/Father | 133 (3.8%) | 2.95 |
| Single Female/Mother | 414 (11.7%) | 2.98 |
| Non-family | 1,370 (38.9%) | 1.16 |
| Total Households | 3,526 (100.0%) | 2.20 |
Household Size by Marriage Status in Grand Ledge
Out of a total of 3,526 households in Grand Ledge, 2,156 (61.2%) are family households, while 1,370 (38.9%) are nonfamily households. The most numerous type of family households are 2-person households, comprising 1,056, and the most common type of nonfamily households are 1-person households, comprising 1,155.
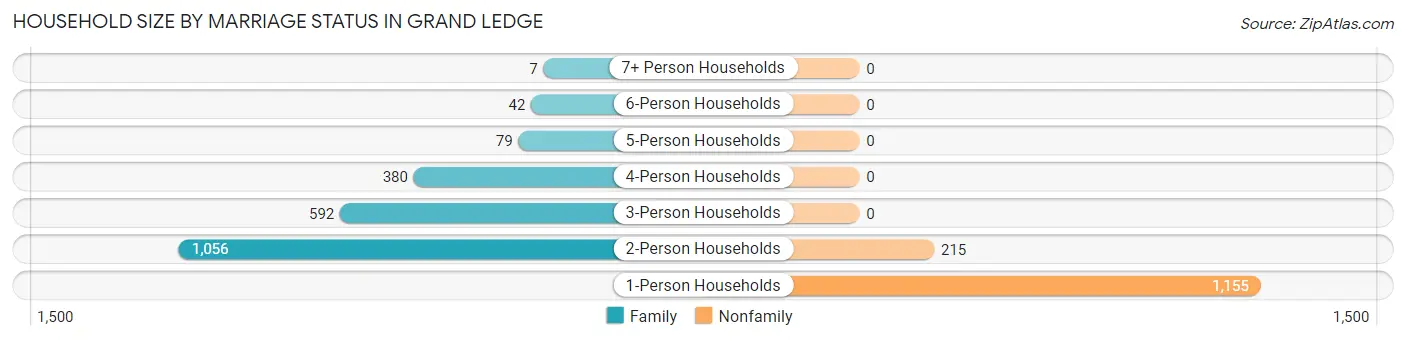
| Household Size | Family Households | Nonfamily Households |
| 1-Person Households | - | 1,155 (32.8%) |
| 2-Person Households | 1,056 (29.9%) | 215 (6.1%) |
| 3-Person Households | 592 (16.8%) | 0 (0.0%) |
| 4-Person Households | 380 (10.8%) | 0 (0.0%) |
| 5-Person Households | 79 (2.2%) | 0 (0.0%) |
| 6-Person Households | 42 (1.2%) | 0 (0.0%) |
| 7+ Person Households | 7 (0.2%) | 0 (0.0%) |
| Total | 2,156 (61.2%) | 1,370 (38.9%) |
Female Fertility in Grand Ledge
Fertility by Age in Grand Ledge
Average fertility rate in Grand Ledge is 64.0 births per 1,000 women. Women in the age bracket of 20 to 34 years have the highest fertility rate with 181.0 births per 1,000 women. Women in the age bracket of 20 to 34 years acount for 100.0% of all women with births.
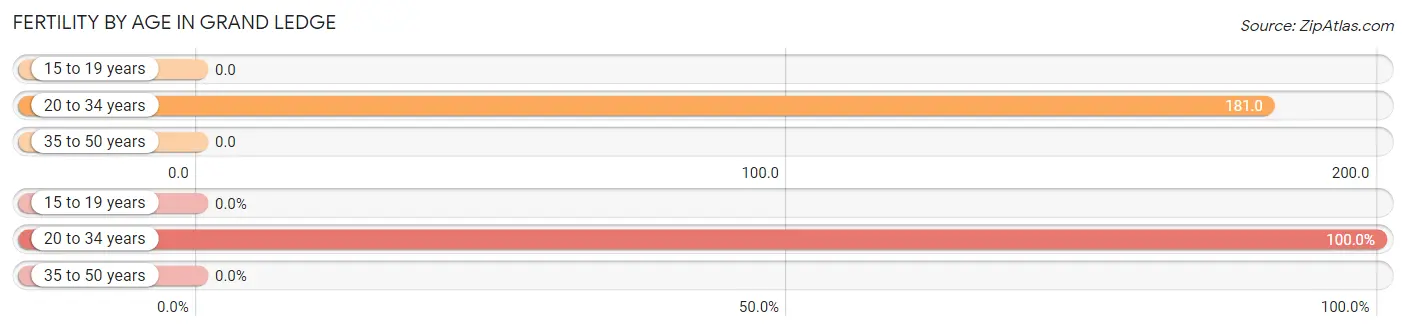
| Age Bracket | Women with Births | Births / 1,000 Women |
| 15 to 19 years | 0 (0.0%) | 0.0 |
| 20 to 34 years | 110 (100.0%) | 181.0 |
| 35 to 50 years | 0 (0.0%) | 0.0 |
| Total | 110 (100.0%) | 64.0 |
Fertility by Age by Marriage Status in Grand Ledge
24.5% of women with births (110) in Grand Ledge are married. The highest percentage of unmarried women with births falls into 20 to 34 years age bracket with 75.4% of them unmarried at the time of birth, while the lowest percentage of unmarried women with births belong to 20 to 34 years age bracket with 75.4% of them unmarried.
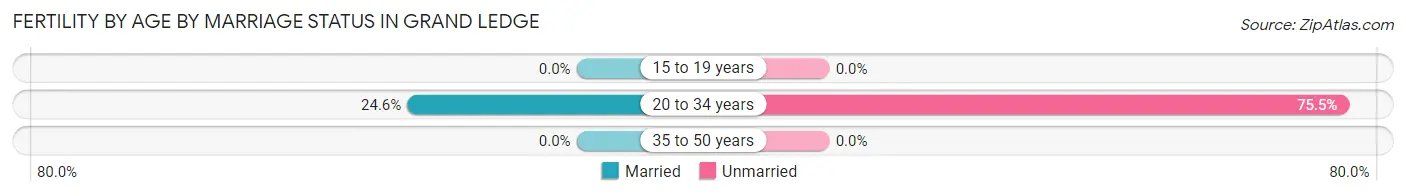
| Age Bracket | Married | Unmarried |
| 15 to 19 years | 0 (0.0%) | 0 (0.0%) |
| 20 to 34 years | 27 (24.5%) | 83 (75.4%) |
| 35 to 50 years | 0 (0.0%) | 0 (0.0%) |
| Total | 27 (24.5%) | 83 (75.4%) |
Fertility by Education in Grand Ledge
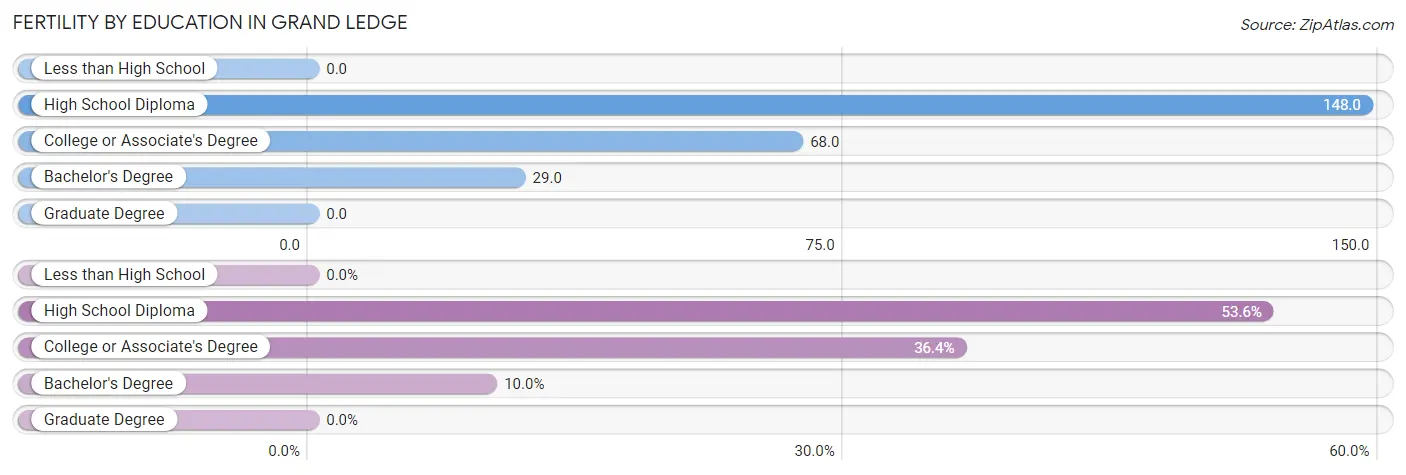
| Educational Attainment | Women with Births | Births / 1,000 Women |
| Less than High School | 0 (0.0%) | 0.0 |
| High School Diploma | 59 (53.6%) | 148.0 |
| College or Associate's Degree | 40 (36.4%) | 68.0 |
| Bachelor's Degree | 11 (10.0%) | 29.0 |
| Graduate Degree | 0 (0.0%) | 0.0 |
| Total | 110 (100.0%) | 64.0 |
Fertility by Education by Marriage Status in Grand Ledge
75.4% of women with births in Grand Ledge are unmarried. Women with the educational attainment of bachelor's degree are most likely to be married with 100.0% of them married at childbirth, while women with the educational attainment of high school diploma are least likely to be married with 100.0% of them unmarried at childbirth.
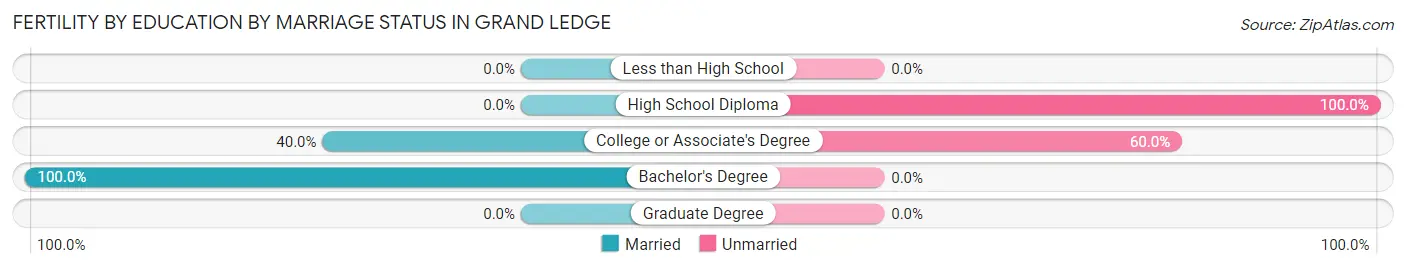
| Educational Attainment | Married | Unmarried |
| Less than High School | 0 (0.0%) | 0 (0.0%) |
| High School Diploma | 0 (0.0%) | 59 (100.0%) |
| College or Associate's Degree | 16 (40.0%) | 24 (60.0%) |
| Bachelor's Degree | 11 (100.0%) | 0 (0.0%) |
| Graduate Degree | 0 (0.0%) | 0 (0.0%) |
| Total | 27 (24.5%) | 83 (75.4%) |
Employment Characteristics in Grand Ledge
Employment by Class of Employer in Grand Ledge
Among the 3,779 employed individuals in Grand Ledge, private company employees (2,407 | 63.7%), local government employees (426 | 11.3%), and not-for-profit organizations (333 | 8.8%) make up the most common classes of employment.
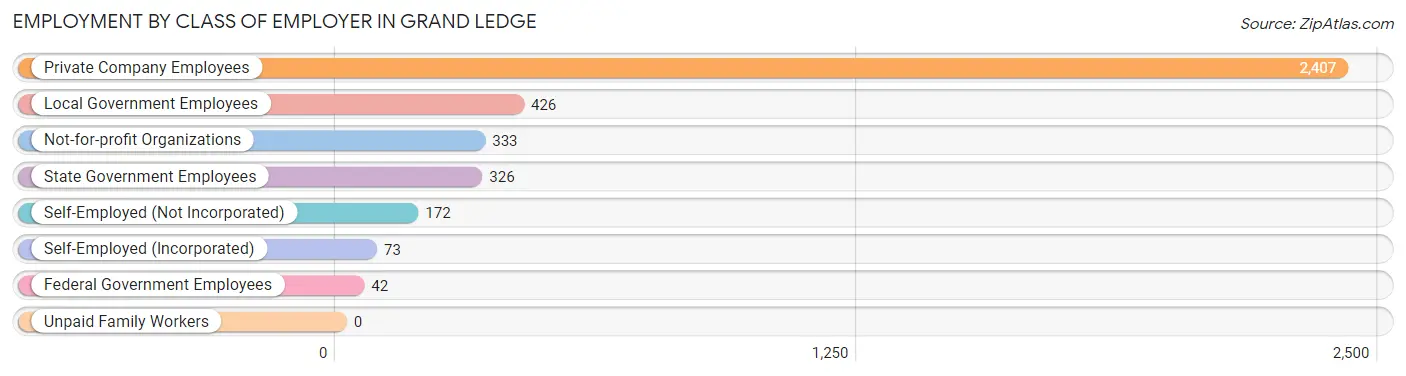
| Employer Class | # Employees | % Employees |
| Private Company Employees | 2,407 | 63.7% |
| Self-Employed (Incorporated) | 73 | 1.9% |
| Self-Employed (Not Incorporated) | 172 | 4.5% |
| Not-for-profit Organizations | 333 | 8.8% |
| Local Government Employees | 426 | 11.3% |
| State Government Employees | 326 | 8.6% |
| Federal Government Employees | 42 | 1.1% |
| Unpaid Family Workers | 0 | 0.0% |
| Total | 3,779 | 100.0% |
Employment Status by Age in Grand Ledge
According to the labor force statistics for Grand Ledge, out of the total population over 16 years of age (6,370), 64.3% or 4,096 individuals are in the labor force, with 5.4% or 221 of them unemployed. The age group with the highest labor force participation rate is 25 to 29 years, with 96.9% or 342 individuals in the labor force. Within the labor force, the 16 to 19 years age range has the highest percentage of unemployed individuals, with 27.5% or 47 of them being unemployed.
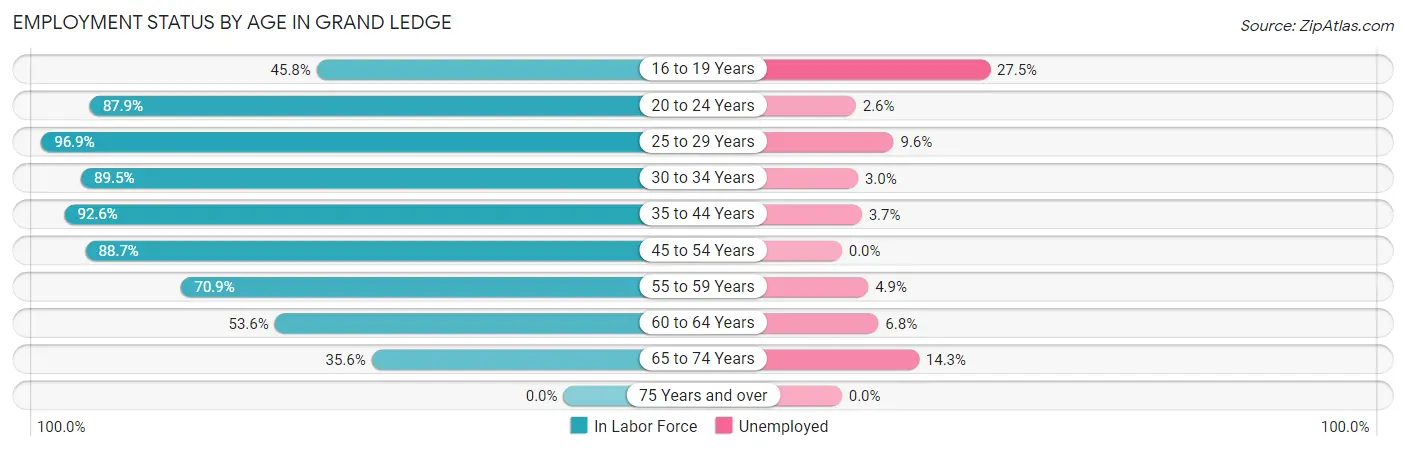
| Age Bracket | In Labor Force | Unemployed |
| 16 to 19 Years | 171 (45.8%) | 47 (27.5%) |
| 20 to 24 Years | 385 (87.9%) | 10 (2.6%) |
| 25 to 29 Years | 342 (96.9%) | 33 (9.6%) |
| 30 to 34 Years | 441 (89.5%) | 13 (3.0%) |
| 35 to 44 Years | 930 (92.6%) | 34 (3.7%) |
| 45 to 54 Years | 794 (88.7%) | 0 (0.0%) |
| 55 to 59 Years | 450 (70.9%) | 22 (4.9%) |
| 60 to 64 Years | 294 (53.6%) | 20 (6.8%) |
| 65 to 74 Years | 286 (35.6%) | 41 (14.3%) |
| 75 Years and over | 0 (0.0%) | 0 (0.0%) |
| Total | 4,096 (64.3%) | 221 (5.4%) |
Employment Status by Educational Attainment in Grand Ledge
According to labor force statistics for Grand Ledge, 82.7% of individuals (3,249) out of the total population between 25 and 64 years of age (3,929) are in the labor force, with 3.8% or 123 of them being unemployed. The group with the highest labor force participation rate are those with the educational attainment of bachelor's degree or higher, with 94.2% or 1,306 individuals in the labor force. Within the labor force, individuals with bachelor's degree or higher education have the highest percentage of unemployment, with 5.4% or 71 of them being unemployed.
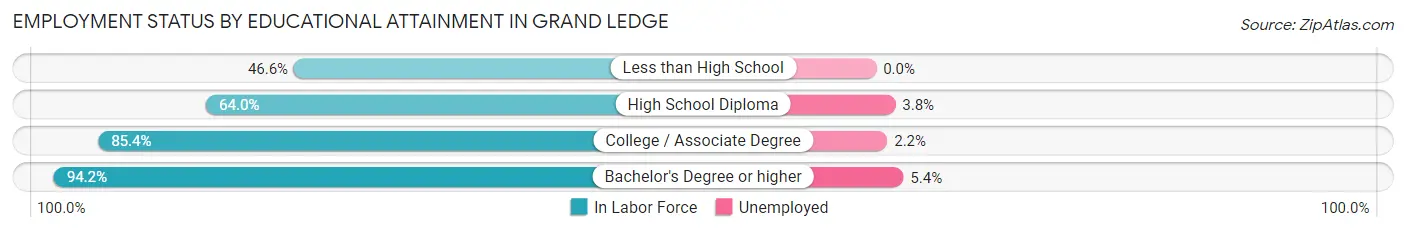
| Educational Attainment | In Labor Force | Unemployed |
| Less than High School | 27 (46.6%) | 0 (0.0%) |
| High School Diploma | 606 (64.0%) | 36 (3.8%) |
| College / Associate Degree | 1,313 (85.4%) | 34 (2.2%) |
| Bachelor's Degree or higher | 1,306 (94.2%) | 75 (5.4%) |
| Total | 3,249 (82.7%) | 149 (3.8%) |
Employment Occupations by Sex in Grand Ledge
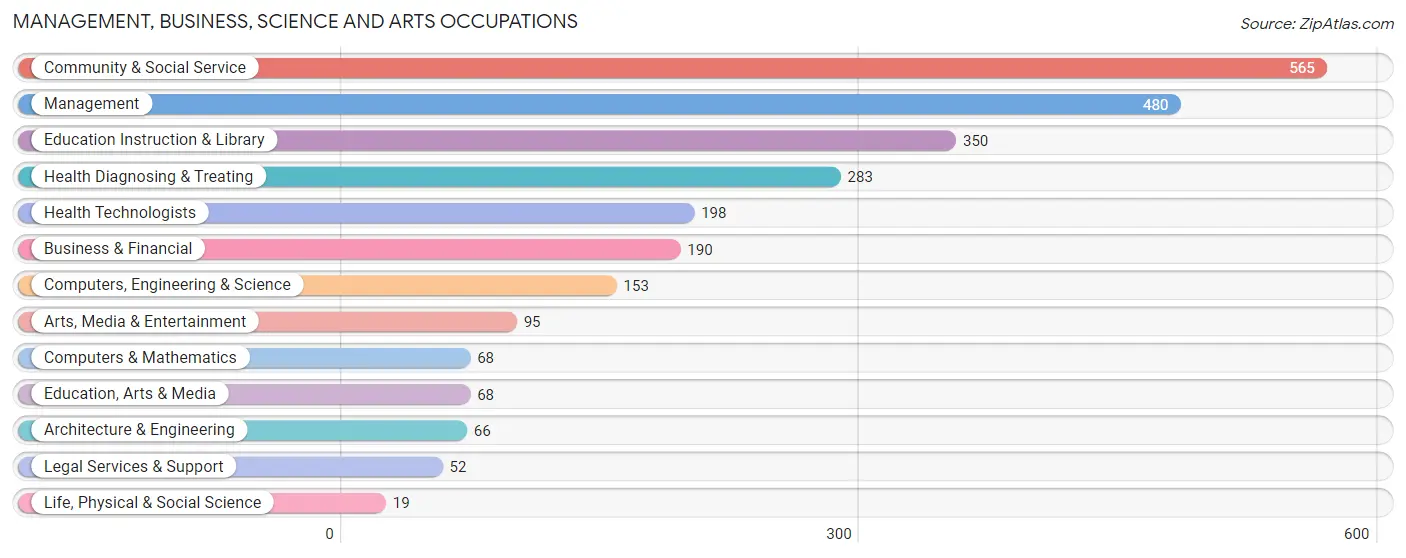
Management, Business, Science and Arts Occupations
The most common Management, Business, Science and Arts occupations in Grand Ledge are Community & Social Service (565 | 14.6%), Management (480 | 12.4%), Education Instruction & Library (350 | 9.1%), Health Diagnosing & Treating (283 | 7.3%), and Health Technologists (198 | 5.1%).
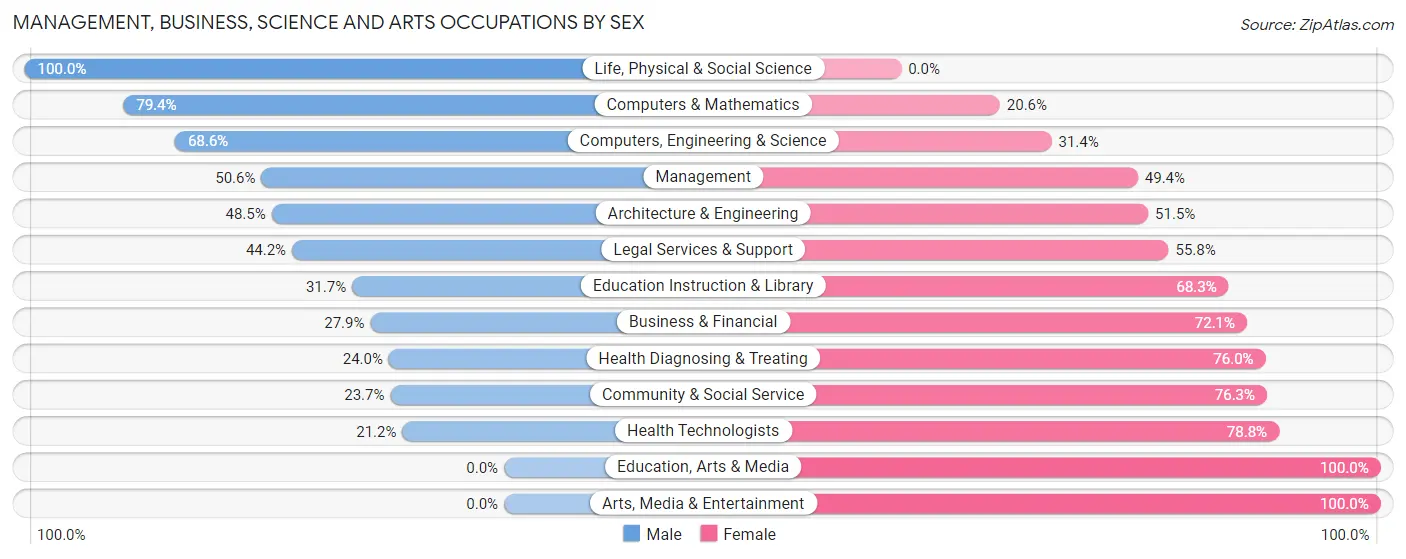
Management, Business, Science and Arts Occupations by Sex
Within the Management, Business, Science and Arts occupations in Grand Ledge, the most male-oriented occupations are Life, Physical & Social Science (100.0%), Computers & Mathematics (79.4%), and Computers, Engineering & Science (68.6%), while the most female-oriented occupations are Education, Arts & Media (100.0%), Arts, Media & Entertainment (100.0%), and Health Technologists (78.8%).
| Occupation | Male | Female |
| Management | 243 (50.6%) | 237 (49.4%) |
| Business & Financial | 53 (27.9%) | 137 (72.1%) |
| Computers, Engineering & Science | 105 (68.6%) | 48 (31.4%) |
| Computers & Mathematics | 54 (79.4%) | 14 (20.6%) |
| Architecture & Engineering | 32 (48.5%) | 34 (51.5%) |
| Life, Physical & Social Science | 19 (100.0%) | 0 (0.0%) |
| Community & Social Service | 134 (23.7%) | 431 (76.3%) |
| Education, Arts & Media | 0 (0.0%) | 68 (100.0%) |
| Legal Services & Support | 23 (44.2%) | 29 (55.8%) |
| Education Instruction & Library | 111 (31.7%) | 239 (68.3%) |
| Arts, Media & Entertainment | 0 (0.0%) | 95 (100.0%) |
| Health Diagnosing & Treating | 68 (24.0%) | 215 (76.0%) |
| Health Technologists | 42 (21.2%) | 156 (78.8%) |
| Total (Category) | 603 (36.1%) | 1,068 (63.9%) |
| Total (Overall) | 1,829 (47.4%) | 2,030 (52.6%) |
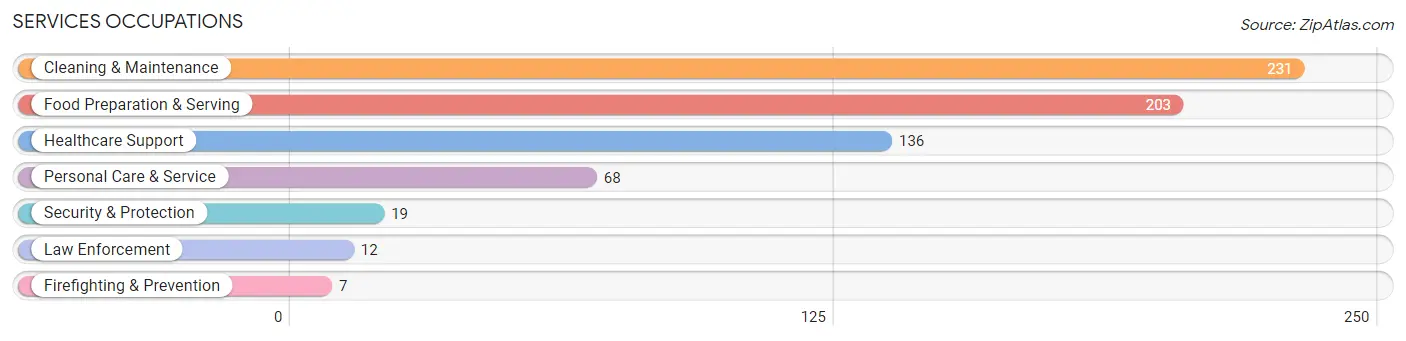
Services Occupations
The most common Services occupations in Grand Ledge are Cleaning & Maintenance (231 | 6.0%), Food Preparation & Serving (203 | 5.3%), Healthcare Support (136 | 3.5%), Personal Care & Service (68 | 1.8%), and Security & Protection (19 | 0.5%).
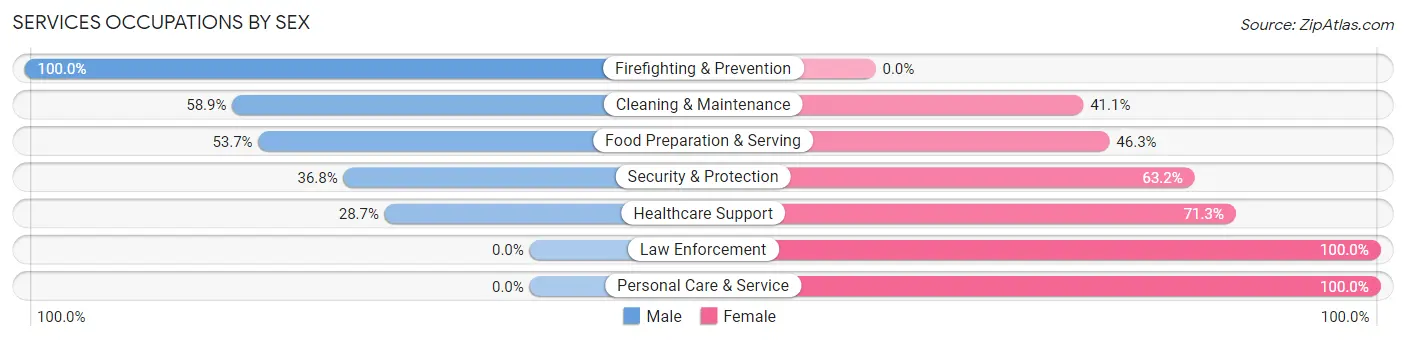
Services Occupations by Sex
Within the Services occupations in Grand Ledge, the most male-oriented occupations are Firefighting & Prevention (100.0%), Cleaning & Maintenance (58.9%), and Food Preparation & Serving (53.7%), while the most female-oriented occupations are Law Enforcement (100.0%), Personal Care & Service (100.0%), and Healthcare Support (71.3%).
| Occupation | Male | Female |
| Healthcare Support | 39 (28.7%) | 97 (71.3%) |
| Security & Protection | 7 (36.8%) | 12 (63.2%) |
| Firefighting & Prevention | 7 (100.0%) | 0 (0.0%) |
| Law Enforcement | 0 (0.0%) | 12 (100.0%) |
| Food Preparation & Serving | 109 (53.7%) | 94 (46.3%) |
| Cleaning & Maintenance | 136 (58.9%) | 95 (41.1%) |
| Personal Care & Service | 0 (0.0%) | 68 (100.0%) |
| Total (Category) | 291 (44.3%) | 366 (55.7%) |
| Total (Overall) | 1,829 (47.4%) | 2,030 (52.6%) |
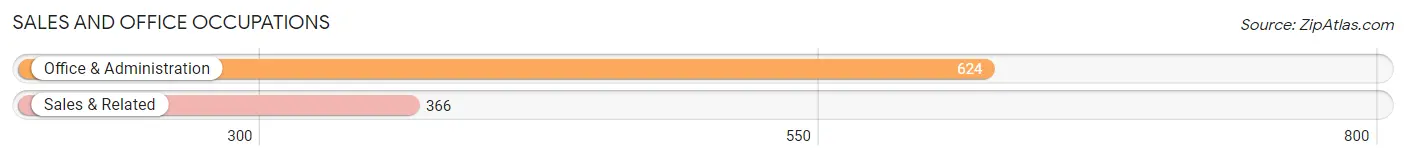
Sales and Office Occupations
The most common Sales and Office occupations in Grand Ledge are Office & Administration (624 | 16.2%), and Sales & Related (366 | 9.5%).
Sales and Office Occupations by Sex
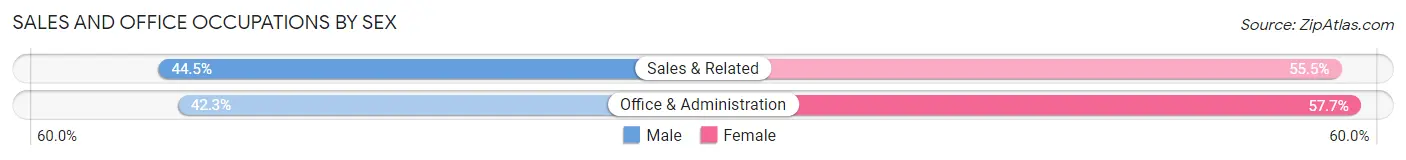
| Occupation | Male | Female |
| Sales & Related | 163 (44.5%) | 203 (55.5%) |
| Office & Administration | 264 (42.3%) | 360 (57.7%) |
| Total (Category) | 427 (43.1%) | 563 (56.9%) |
| Total (Overall) | 1,829 (47.4%) | 2,030 (52.6%) |
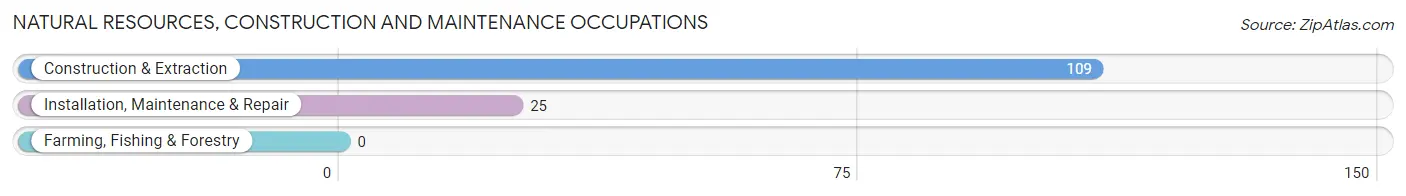
Natural Resources, Construction and Maintenance Occupations
The most common Natural Resources, Construction and Maintenance occupations in Grand Ledge are Construction & Extraction (109 | 2.8%), and Installation, Maintenance & Repair (25 | 0.6%).
Natural Resources, Construction and Maintenance Occupations by Sex
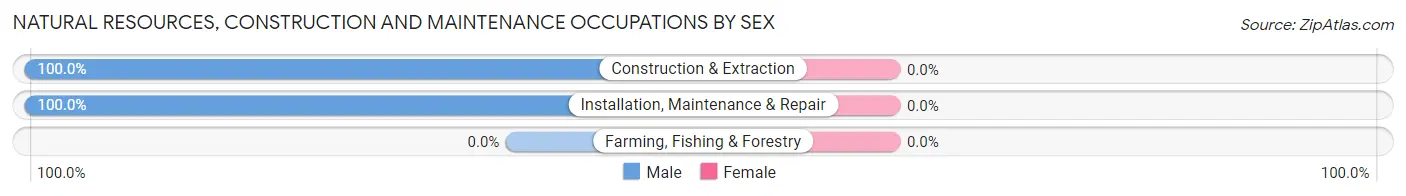
| Occupation | Male | Female |
| Farming, Fishing & Forestry | 0 (0.0%) | 0 (0.0%) |
| Construction & Extraction | 109 (100.0%) | 0 (0.0%) |
| Installation, Maintenance & Repair | 25 (100.0%) | 0 (0.0%) |
| Total (Category) | 134 (100.0%) | 0 (0.0%) |
| Total (Overall) | 1,829 (47.4%) | 2,030 (52.6%) |
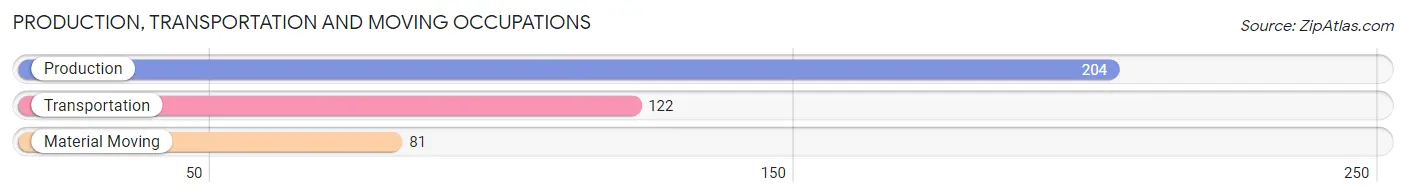
Production, Transportation and Moving Occupations
The most common Production, Transportation and Moving occupations in Grand Ledge are Production (204 | 5.3%), Transportation (122 | 3.2%), and Material Moving (81 | 2.1%).
Production, Transportation and Moving Occupations by Sex
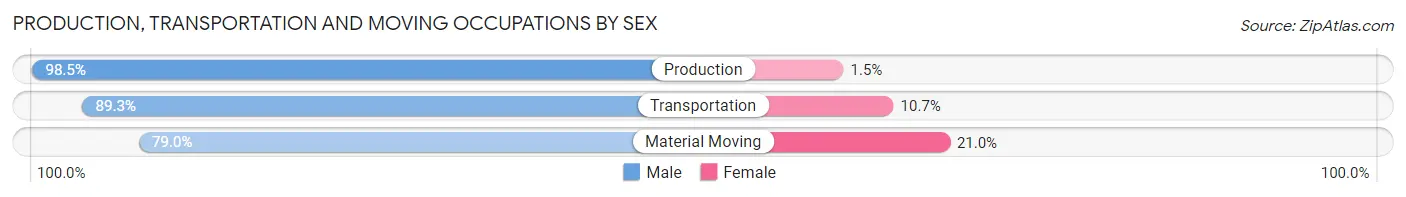
| Occupation | Male | Female |
| Production | 201 (98.5%) | 3 (1.5%) |
| Transportation | 109 (89.3%) | 13 (10.7%) |
| Material Moving | 64 (79.0%) | 17 (21.0%) |
| Total (Category) | 374 (91.9%) | 33 (8.1%) |
| Total (Overall) | 1,829 (47.4%) | 2,030 (52.6%) |
Employment Industries by Sex in Grand Ledge
Employment Industries in Grand Ledge
The major employment industries in Grand Ledge include Retail Trade (520 | 13.5%), Health Care & Social Assistance (502 | 13.0%), Educational Services (496 | 12.9%), Manufacturing (393 | 10.2%), and Accommodation & Food Services (366 | 9.5%).
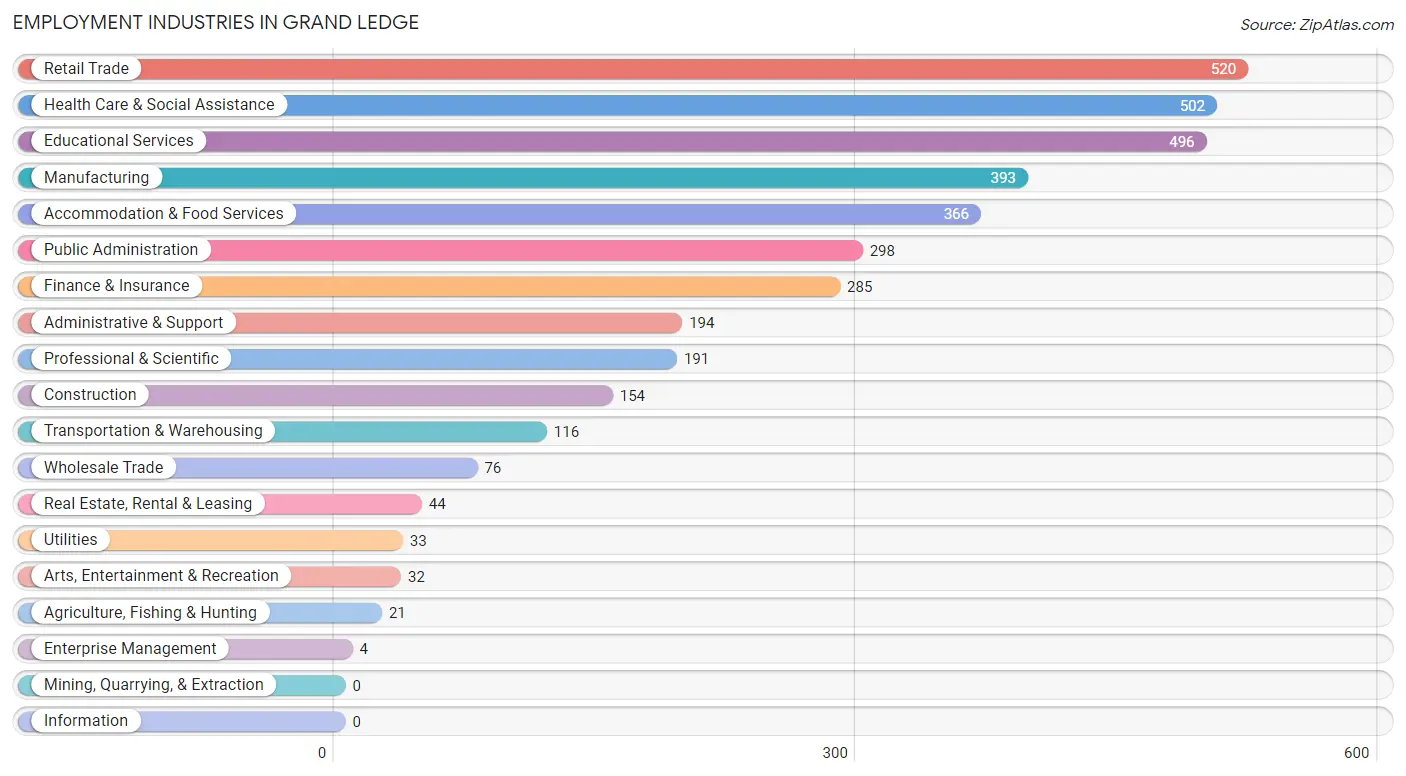
Employment Industries by Sex in Grand Ledge
The Grand Ledge industries that see more men than women are Agriculture, Fishing & Hunting (100.0%), Manufacturing (94.9%), and Construction (93.5%), whereas the industries that tend to have a higher number of women are Enterprise Management (100.0%), Arts, Entertainment & Recreation (100.0%), and Health Care & Social Assistance (83.9%).
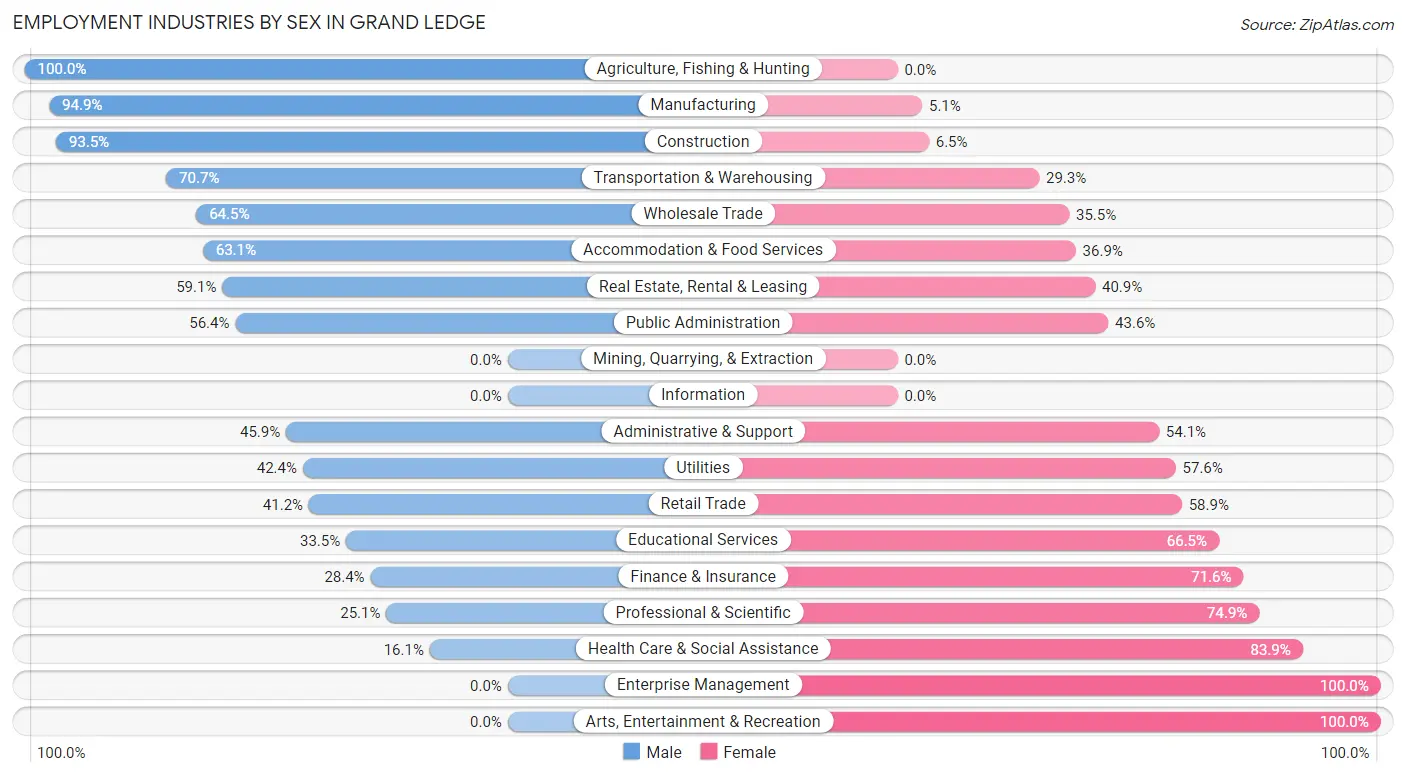
| Industry | Male | Female |
| Agriculture, Fishing & Hunting | 21 (100.0%) | 0 (0.0%) |
| Mining, Quarrying, & Extraction | 0 (0.0%) | 0 (0.0%) |
| Construction | 144 (93.5%) | 10 (6.5%) |
| Manufacturing | 373 (94.9%) | 20 (5.1%) |
| Wholesale Trade | 49 (64.5%) | 27 (35.5%) |
| Retail Trade | 214 (41.1%) | 306 (58.9%) |
| Transportation & Warehousing | 82 (70.7%) | 34 (29.3%) |
| Utilities | 14 (42.4%) | 19 (57.6%) |
| Information | 0 (0.0%) | 0 (0.0%) |
| Finance & Insurance | 81 (28.4%) | 204 (71.6%) |
| Real Estate, Rental & Leasing | 26 (59.1%) | 18 (40.9%) |
| Professional & Scientific | 48 (25.1%) | 143 (74.9%) |
| Enterprise Management | 0 (0.0%) | 4 (100.0%) |
| Administrative & Support | 89 (45.9%) | 105 (54.1%) |
| Educational Services | 166 (33.5%) | 330 (66.5%) |
| Health Care & Social Assistance | 81 (16.1%) | 421 (83.9%) |
| Arts, Entertainment & Recreation | 0 (0.0%) | 32 (100.0%) |
| Accommodation & Food Services | 231 (63.1%) | 135 (36.9%) |
| Public Administration | 168 (56.4%) | 130 (43.6%) |
| Total | 1,829 (47.4%) | 2,030 (52.6%) |
Education in Grand Ledge
School Enrollment in Grand Ledge
The most common levels of schooling among the 1,721 students in Grand Ledge are elementary school (459 | 26.7%), high school (376 | 21.8%), and middle school (333 | 19.4%).
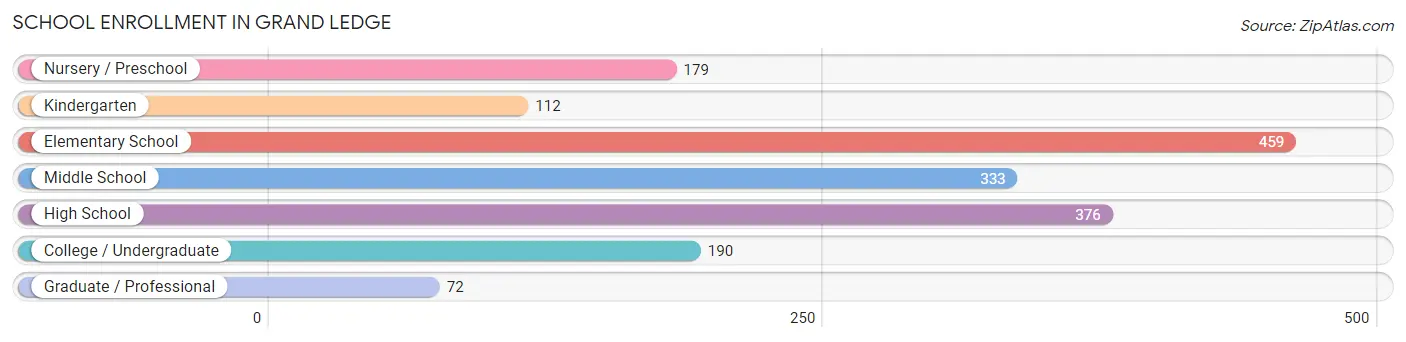
| School Level | # Students | % Students |
| Nursery / Preschool | 179 | 10.4% |
| Kindergarten | 112 | 6.5% |
| Elementary School | 459 | 26.7% |
| Middle School | 333 | 19.4% |
| High School | 376 | 21.8% |
| College / Undergraduate | 190 | 11.0% |
| Graduate / Professional | 72 | 4.2% |
| Total | 1,721 | 100.0% |
School Enrollment by Age by Funding Source in Grand Ledge
Out of a total of 1,721 students who are enrolled in schools in Grand Ledge, 361 (21.0%) attend a private institution, while the remaining 1,360 (79.0%) are enrolled in public schools. The age group of 20 to 24 year olds has the highest likelihood of being enrolled in private schools, with 87 (72.5% in the age bracket) enrolled. Conversely, the age group of 18 to 19 year olds has the lowest likelihood of being enrolled in a private school, with 92 (100.0% in the age bracket) attending a public institution.
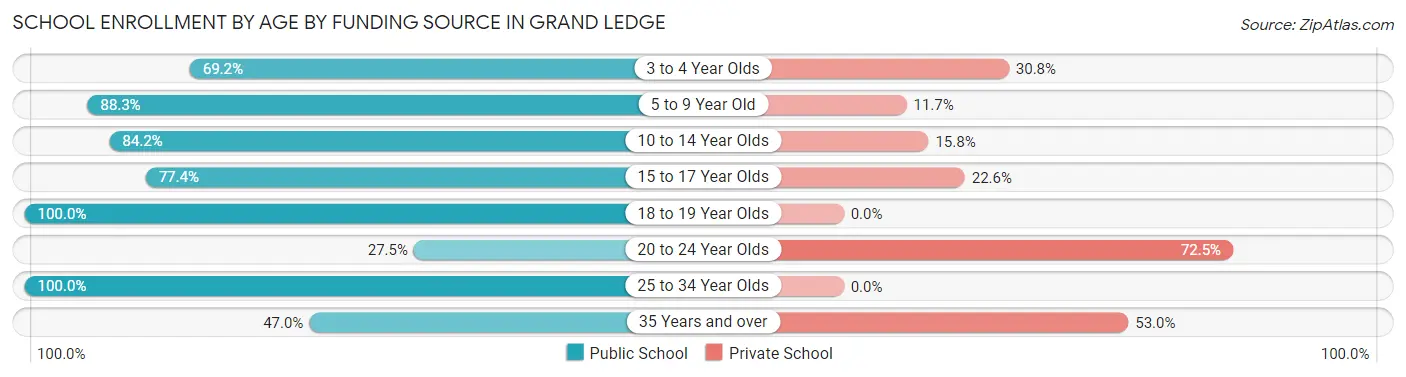
| Age Bracket | Public School | Private School |
| 3 to 4 Year Olds | 81 (69.2%) | 36 (30.8%) |
| 5 to 9 Year Old | 505 (88.3%) | 67 (11.7%) |
| 10 to 14 Year Olds | 357 (84.2%) | 67 (15.8%) |
| 15 to 17 Year Olds | 206 (77.4%) | 60 (22.6%) |
| 18 to 19 Year Olds | 92 (100.0%) | 0 (0.0%) |
| 20 to 24 Year Olds | 33 (27.5%) | 87 (72.5%) |
| 25 to 34 Year Olds | 47 (100.0%) | 0 (0.0%) |
| 35 Years and over | 39 (47.0%) | 44 (53.0%) |
| Total | 1,360 (79.0%) | 361 (21.0%) |
Educational Attainment by Field of Study in Grand Ledge
Education (382 | 18.8%), business (369 | 18.2%), arts & humanities (263 | 13.0%), science & technology (175 | 8.6%), and social sciences (168 | 8.3%) are the most common fields of study among 2,031 individuals in Grand Ledge who have obtained a bachelor's degree or higher.
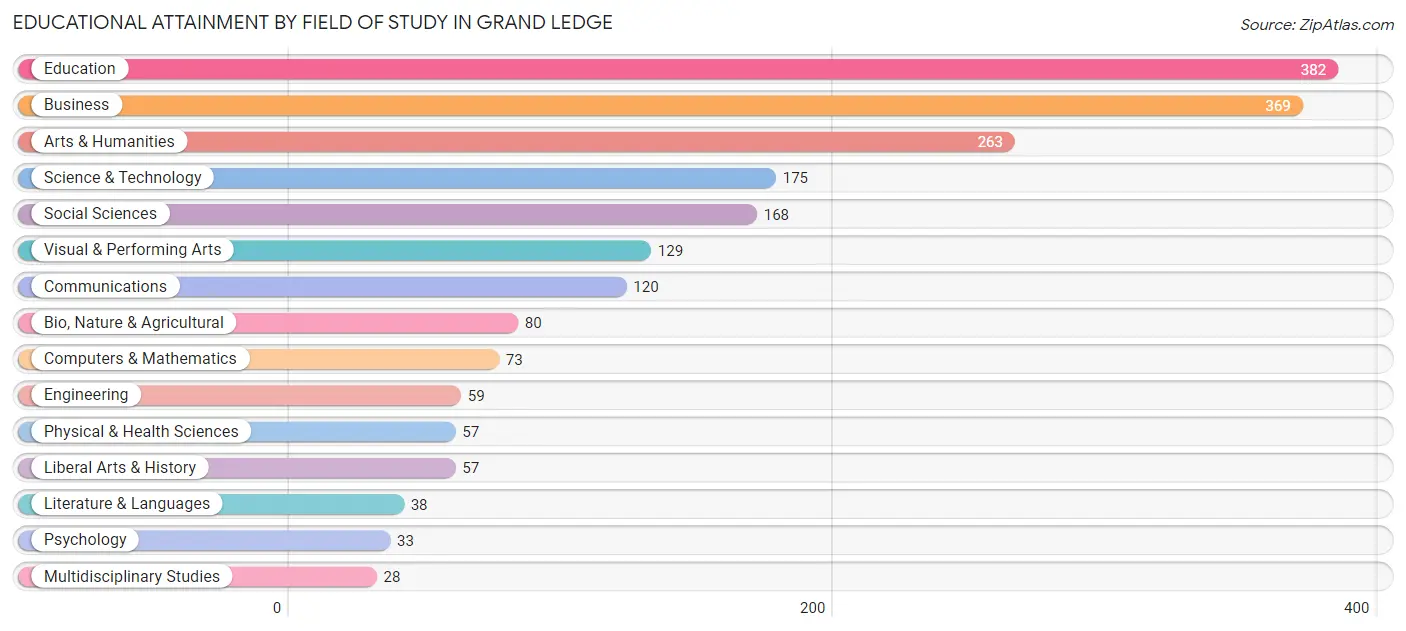
| Field of Study | # Graduates | % Graduates |
| Computers & Mathematics | 73 | 3.6% |
| Bio, Nature & Agricultural | 80 | 3.9% |
| Physical & Health Sciences | 57 | 2.8% |
| Psychology | 33 | 1.6% |
| Social Sciences | 168 | 8.3% |
| Engineering | 59 | 2.9% |
| Multidisciplinary Studies | 28 | 1.4% |
| Science & Technology | 175 | 8.6% |
| Business | 369 | 18.2% |
| Education | 382 | 18.8% |
| Literature & Languages | 38 | 1.9% |
| Liberal Arts & History | 57 | 2.8% |
| Visual & Performing Arts | 129 | 6.4% |
| Communications | 120 | 5.9% |
| Arts & Humanities | 263 | 13.0% |
| Total | 2,031 | 100.0% |
Transportation & Commute in Grand Ledge
Vehicle Availability by Sex in Grand Ledge
The most prevalent vehicle ownership categories in Grand Ledge are males with 2 vehicles (1,019, accounting for 56.1%) and females with 2 vehicles (951, making up 51.9%).
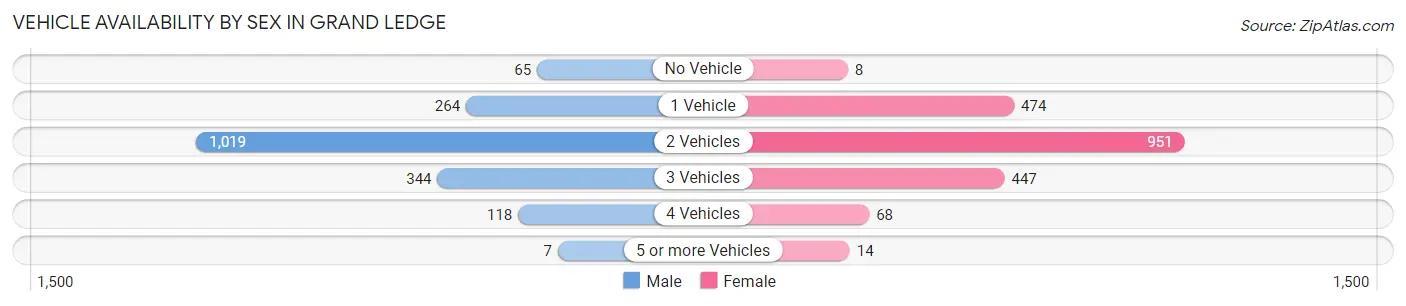
| Vehicles Available | Male | Female |
| No Vehicle | 65 (3.6%) | 8 (0.4%) |
| 1 Vehicle | 264 (14.5%) | 474 (24.2%) |
| 2 Vehicles | 1,019 (56.1%) | 951 (48.5%) |
| 3 Vehicles | 344 (18.9%) | 447 (22.8%) |
| 4 Vehicles | 118 (6.5%) | 68 (3.5%) |
| 5 or more Vehicles | 7 (0.4%) | 14 (0.7%) |
| Total | 1,817 (100.0%) | 1,962 (100.0%) |
Commute Time in Grand Ledge
The most frequently occuring commute durations in Grand Ledge are 20 to 24 minutes (660 commuters, 19.7%), 15 to 19 minutes (603 commuters, 18.0%), and 5 to 9 minutes (557 commuters, 16.6%).
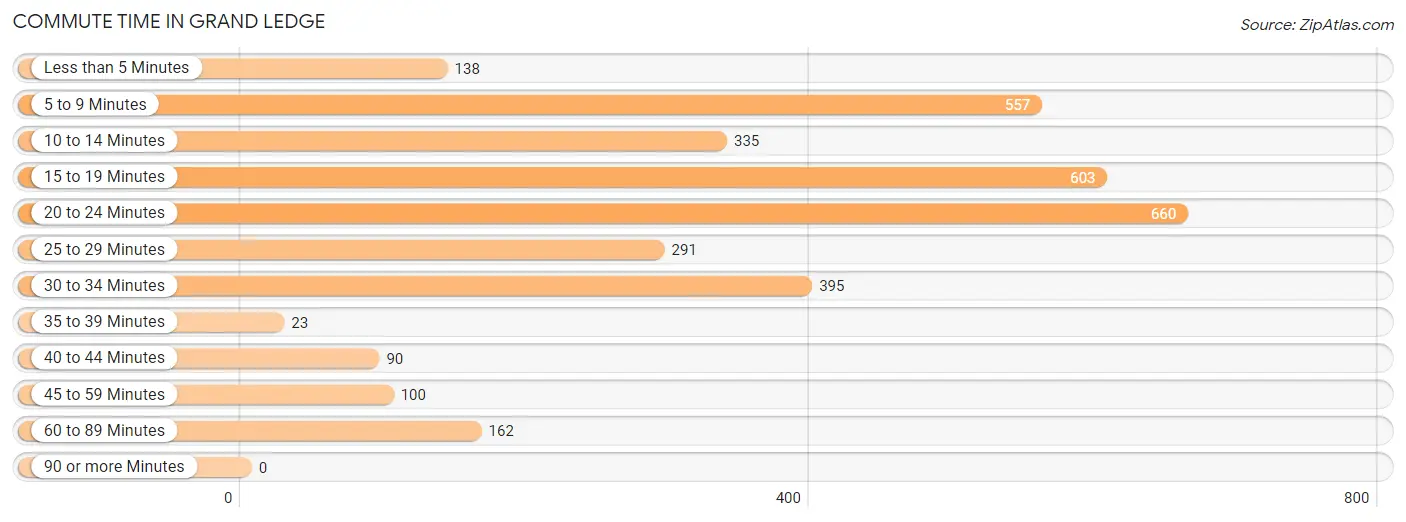
| Commute Time | # Commuters | % Commuters |
| Less than 5 Minutes | 138 | 4.1% |
| 5 to 9 Minutes | 557 | 16.6% |
| 10 to 14 Minutes | 335 | 10.0% |
| 15 to 19 Minutes | 603 | 18.0% |
| 20 to 24 Minutes | 660 | 19.7% |
| 25 to 29 Minutes | 291 | 8.7% |
| 30 to 34 Minutes | 395 | 11.8% |
| 35 to 39 Minutes | 23 | 0.7% |
| 40 to 44 Minutes | 90 | 2.7% |
| 45 to 59 Minutes | 100 | 3.0% |
| 60 to 89 Minutes | 162 | 4.8% |
| 90 or more Minutes | 0 | 0.0% |
Commute Time by Sex in Grand Ledge
The most common commute times in Grand Ledge are 5 to 9 minutes (291 commuters, 17.4%) for males and 20 to 24 minutes (396 commuters, 23.6%) for females.
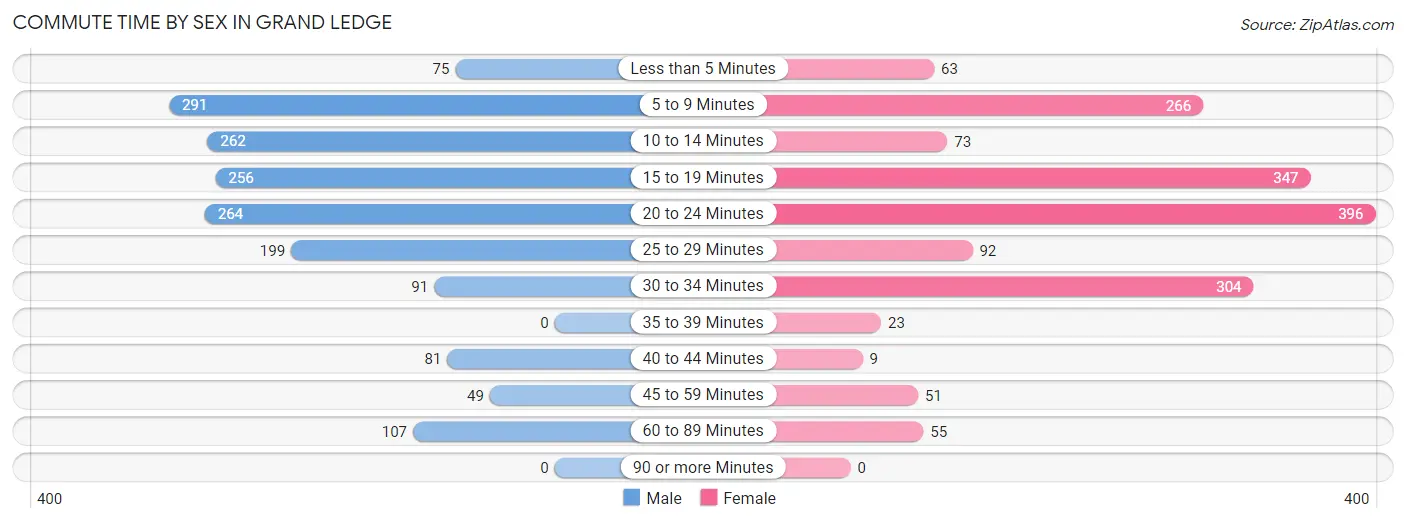
| Commute Time | Male | Female |
| Less than 5 Minutes | 75 (4.5%) | 63 (3.7%) |
| 5 to 9 Minutes | 291 (17.4%) | 266 (15.8%) |
| 10 to 14 Minutes | 262 (15.6%) | 73 (4.3%) |
| 15 to 19 Minutes | 256 (15.3%) | 347 (20.7%) |
| 20 to 24 Minutes | 264 (15.8%) | 396 (23.6%) |
| 25 to 29 Minutes | 199 (11.9%) | 92 (5.5%) |
| 30 to 34 Minutes | 91 (5.4%) | 304 (18.1%) |
| 35 to 39 Minutes | 0 (0.0%) | 23 (1.4%) |
| 40 to 44 Minutes | 81 (4.8%) | 9 (0.5%) |
| 45 to 59 Minutes | 49 (2.9%) | 51 (3.0%) |
| 60 to 89 Minutes | 107 (6.4%) | 55 (3.3%) |
| 90 or more Minutes | 0 (0.0%) | 0 (0.0%) |
Time of Departure to Work by Sex in Grand Ledge
The most frequent times of departure to work in Grand Ledge are 8:00 AM to 8:29 AM (231, 13.8%) for males and 8:00 AM to 8:29 AM (302, 18.0%) for females.
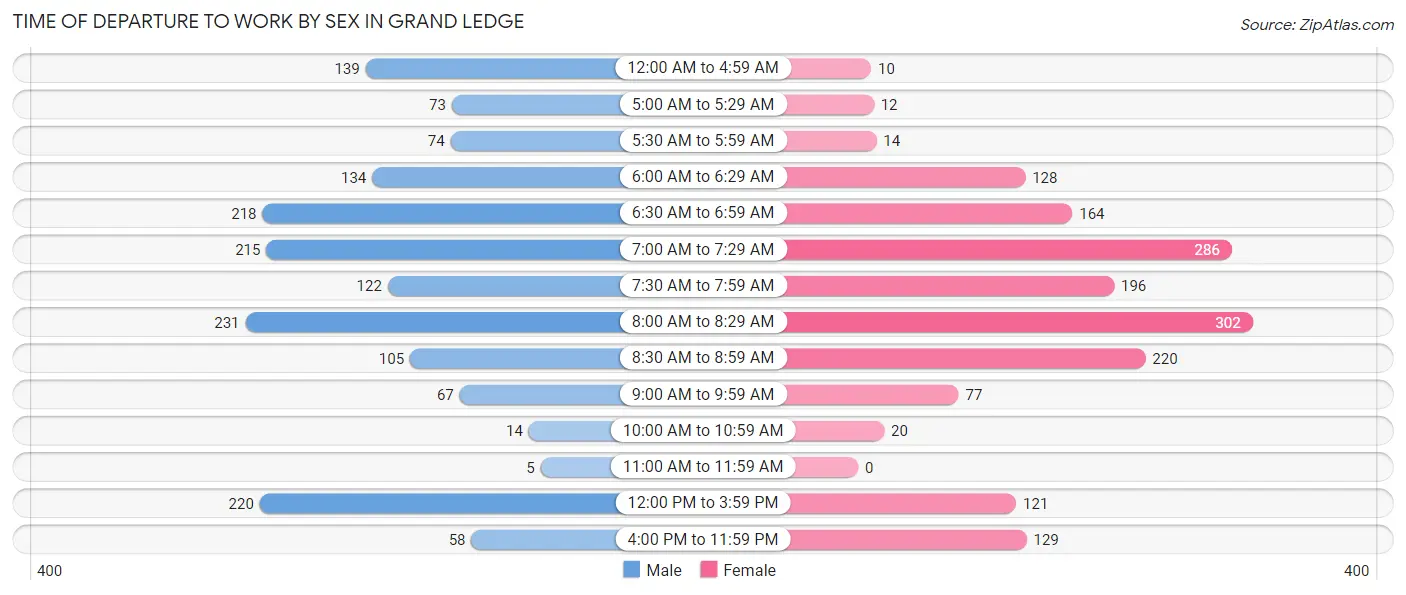
| Time of Departure | Male | Female |
| 12:00 AM to 4:59 AM | 139 (8.3%) | 10 (0.6%) |
| 5:00 AM to 5:29 AM | 73 (4.4%) | 12 (0.7%) |
| 5:30 AM to 5:59 AM | 74 (4.4%) | 14 (0.8%) |
| 6:00 AM to 6:29 AM | 134 (8.0%) | 128 (7.6%) |
| 6:30 AM to 6:59 AM | 218 (13.0%) | 164 (9.8%) |
| 7:00 AM to 7:29 AM | 215 (12.8%) | 286 (17.0%) |
| 7:30 AM to 7:59 AM | 122 (7.3%) | 196 (11.7%) |
| 8:00 AM to 8:29 AM | 231 (13.8%) | 302 (18.0%) |
| 8:30 AM to 8:59 AM | 105 (6.3%) | 220 (13.1%) |
| 9:00 AM to 9:59 AM | 67 (4.0%) | 77 (4.6%) |
| 10:00 AM to 10:59 AM | 14 (0.8%) | 20 (1.2%) |
| 11:00 AM to 11:59 AM | 5 (0.3%) | 0 (0.0%) |
| 12:00 PM to 3:59 PM | 220 (13.1%) | 121 (7.2%) |
| 4:00 PM to 11:59 PM | 58 (3.5%) | 129 (7.7%) |
| Total | 1,675 (100.0%) | 1,679 (100.0%) |
Housing Occupancy in Grand Ledge
Occupancy by Ownership in Grand Ledge
Of the total 3,526 dwellings in Grand Ledge, owner-occupied units account for 2,297 (65.1%), while renter-occupied units make up 1,229 (34.9%).
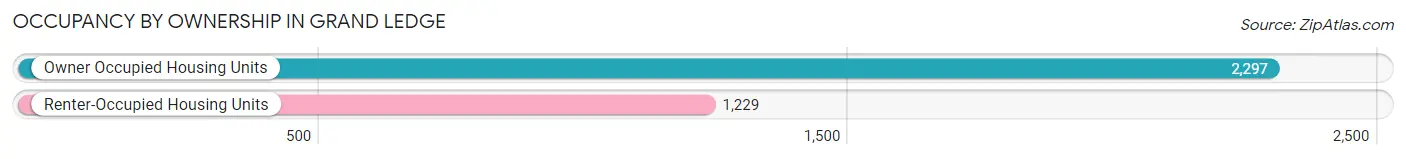
| Occupancy | # Housing Units | % Housing Units |
| Owner Occupied Housing Units | 2,297 | 65.1% |
| Renter-Occupied Housing Units | 1,229 | 34.9% |
| Total Occupied Housing Units | 3,526 | 100.0% |
Occupancy by Household Size in Grand Ledge
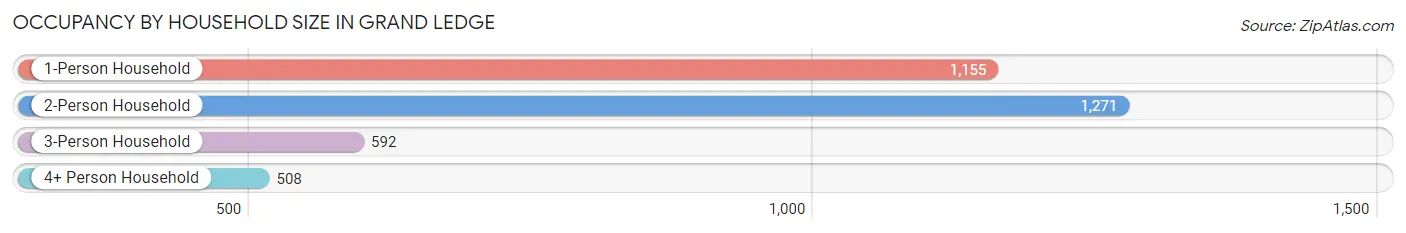
| Household Size | # Housing Units | % Housing Units |
| 1-Person Household | 1,155 | 32.8% |
| 2-Person Household | 1,271 | 36.0% |
| 3-Person Household | 592 | 16.8% |
| 4+ Person Household | 508 | 14.4% |
| Total Housing Units | 3,526 | 100.0% |
Occupancy by Ownership by Household Size in Grand Ledge
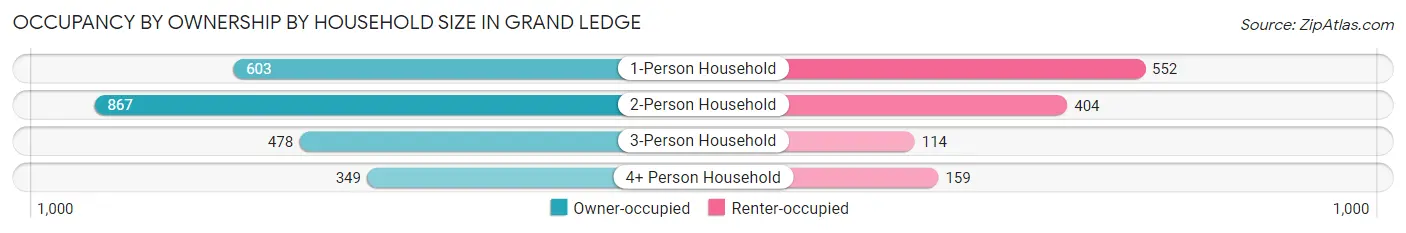
| Household Size | Owner-occupied | Renter-occupied |
| 1-Person Household | 603 (52.2%) | 552 (47.8%) |
| 2-Person Household | 867 (68.2%) | 404 (31.8%) |
| 3-Person Household | 478 (80.7%) | 114 (19.3%) |
| 4+ Person Household | 349 (68.7%) | 159 (31.3%) |
| Total Housing Units | 2,297 (65.1%) | 1,229 (34.9%) |
Occupancy by Educational Attainment in Grand Ledge
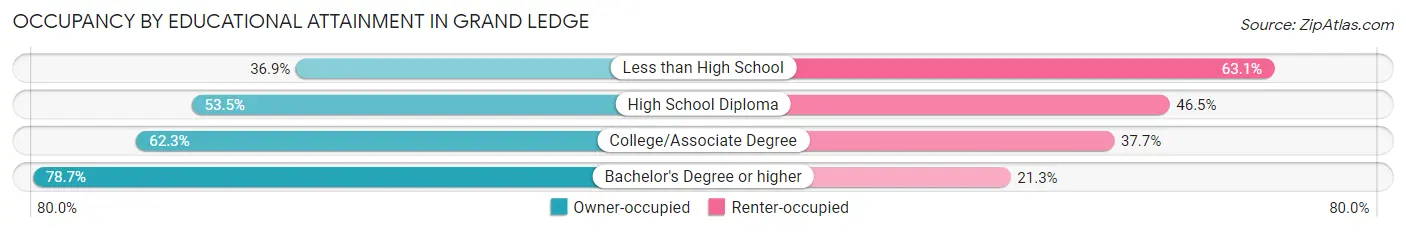
| Household Size | Owner-occupied | Renter-occupied |
| Less than High School | 24 (36.9%) | 41 (63.1%) |
| High School Diploma | 397 (53.5%) | 345 (46.5%) |
| College/Associate Degree | 1,000 (62.3%) | 606 (37.7%) |
| Bachelor's Degree or higher | 876 (78.7%) | 237 (21.3%) |
Occupancy by Age of Householder in Grand Ledge
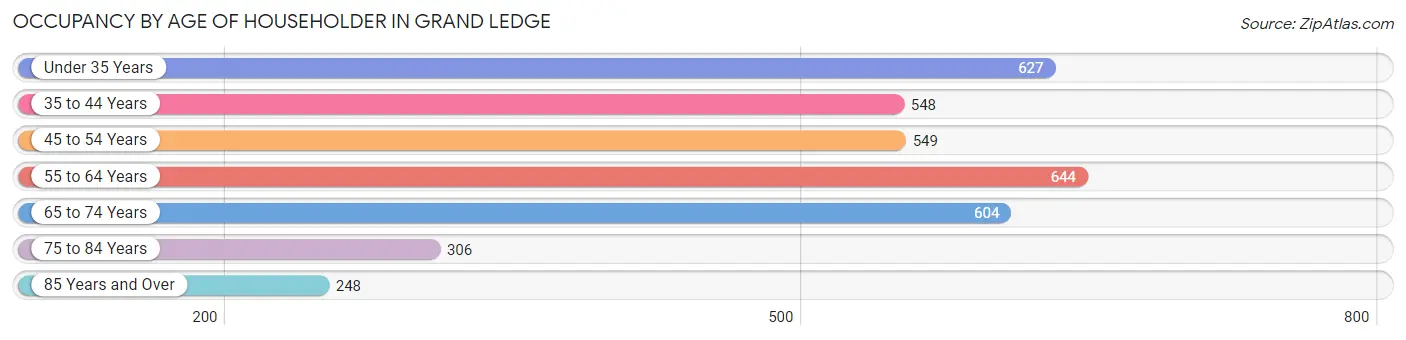
| Age Bracket | # Households | % Households |
| Under 35 Years | 627 | 17.8% |
| 35 to 44 Years | 548 | 15.5% |
| 45 to 54 Years | 549 | 15.6% |
| 55 to 64 Years | 644 | 18.3% |
| 65 to 74 Years | 604 | 17.1% |
| 75 to 84 Years | 306 | 8.7% |
| 85 Years and Over | 248 | 7.0% |
| Total | 3,526 | 100.0% |
Housing Finances in Grand Ledge
Median Income by Occupancy in Grand Ledge
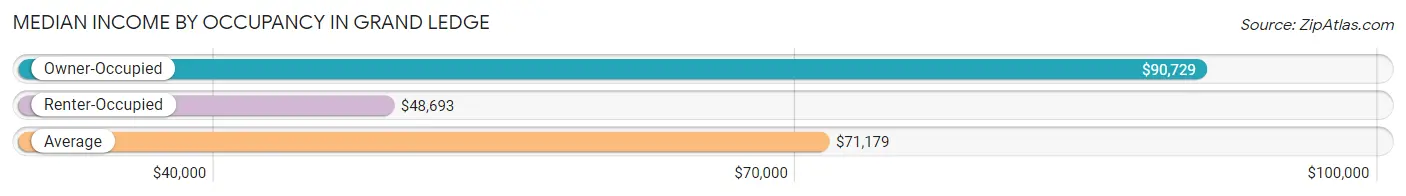
| Occupancy Type | # Households | Median Income |
| Owner-Occupied | 2,297 (65.1%) | $90,729 |
| Renter-Occupied | 1,229 (34.9%) | $48,693 |
| Average | 3,526 (100.0%) | $71,179 |
Occupancy by Householder Income Bracket in Grand Ledge
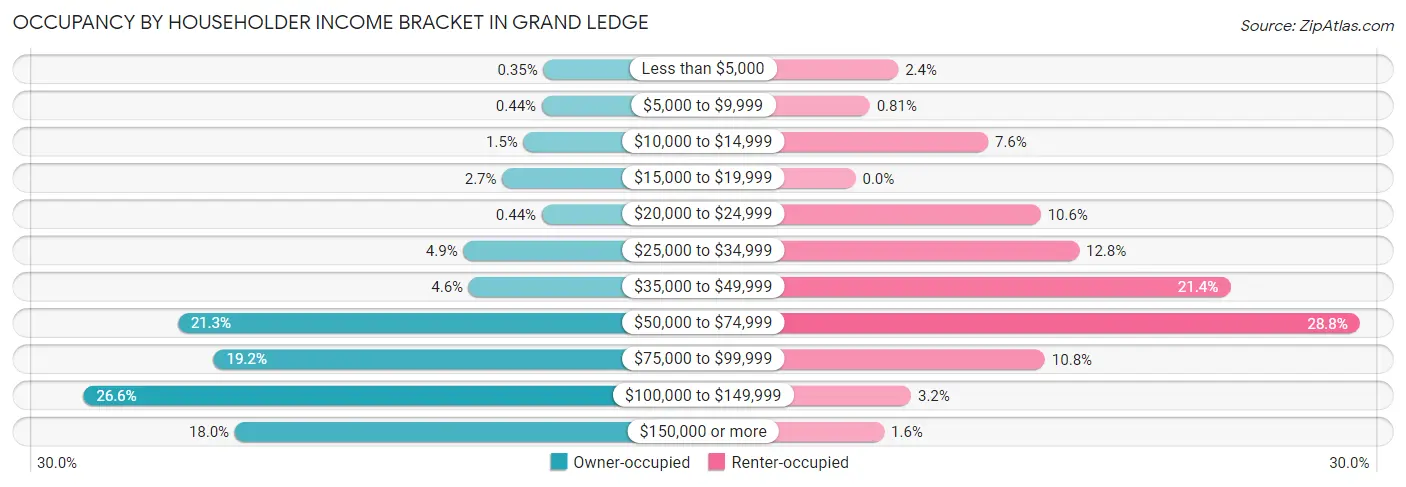
| Income Bracket | Owner-occupied | Renter-occupied |
| Less than $5,000 | 8 (0.4%) | 30 (2.4%) |
| $5,000 to $9,999 | 10 (0.4%) | 10 (0.8%) |
| $10,000 to $14,999 | 34 (1.5%) | 93 (7.6%) |
| $15,000 to $19,999 | 62 (2.7%) | 0 (0.0%) |
| $20,000 to $24,999 | 10 (0.4%) | 130 (10.6%) |
| $25,000 to $34,999 | 113 (4.9%) | 157 (12.8%) |
| $35,000 to $49,999 | 106 (4.6%) | 263 (21.4%) |
| $50,000 to $74,999 | 488 (21.2%) | 354 (28.8%) |
| $75,000 to $99,999 | 441 (19.2%) | 133 (10.8%) |
| $100,000 to $149,999 | 612 (26.6%) | 39 (3.2%) |
| $150,000 or more | 413 (18.0%) | 20 (1.6%) |
| Total | 2,297 (100.0%) | 1,229 (100.0%) |
Monthly Housing Cost Tiers in Grand Ledge
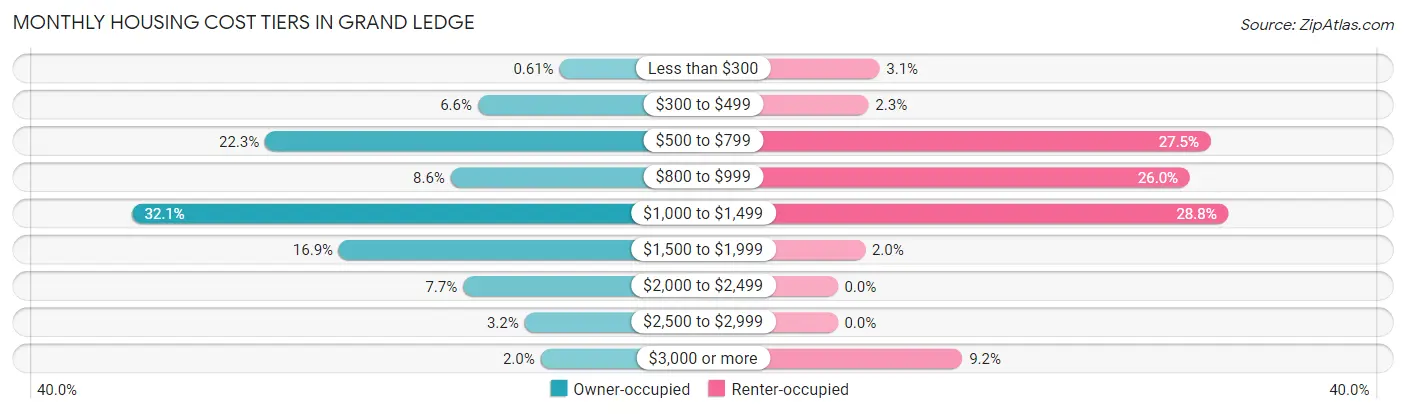
| Monthly Cost | Owner-occupied | Renter-occupied |
| Less than $300 | 14 (0.6%) | 38 (3.1%) |
| $300 to $499 | 152 (6.6%) | 28 (2.3%) |
| $500 to $799 | 512 (22.3%) | 338 (27.5%) |
| $800 to $999 | 198 (8.6%) | 319 (26.0%) |
| $1,000 to $1,499 | 738 (32.1%) | 354 (28.8%) |
| $1,500 to $1,999 | 387 (16.9%) | 25 (2.0%) |
| $2,000 to $2,499 | 177 (7.7%) | 0 (0.0%) |
| $2,500 to $2,999 | 73 (3.2%) | 0 (0.0%) |
| $3,000 or more | 46 (2.0%) | 113 (9.2%) |
| Total | 2,297 (100.0%) | 1,229 (100.0%) |
Physical Housing Characteristics in Grand Ledge
Housing Structures in Grand Ledge
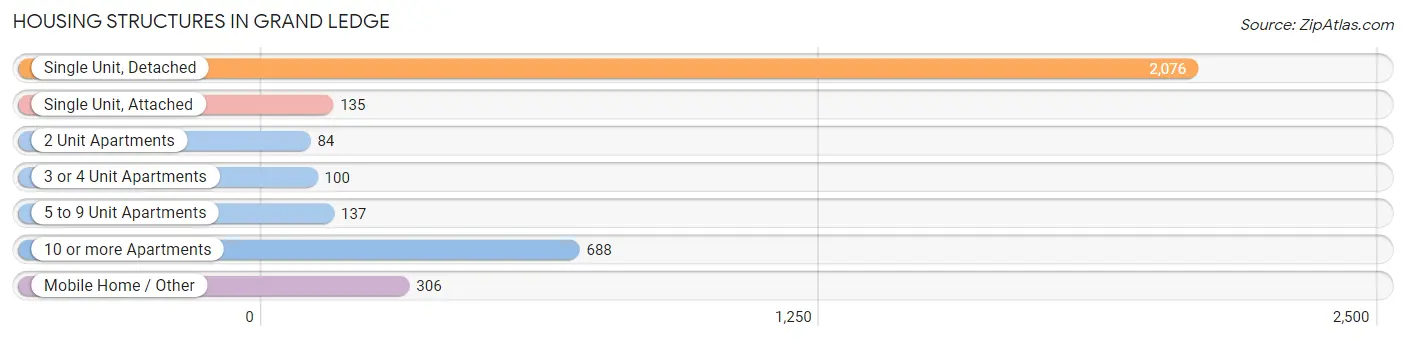
| Structure Type | # Housing Units | % Housing Units |
| Single Unit, Detached | 2,076 | 58.9% |
| Single Unit, Attached | 135 | 3.8% |
| 2 Unit Apartments | 84 | 2.4% |
| 3 or 4 Unit Apartments | 100 | 2.8% |
| 5 to 9 Unit Apartments | 137 | 3.9% |
| 10 or more Apartments | 688 | 19.5% |
| Mobile Home / Other | 306 | 8.7% |
| Total | 3,526 | 100.0% |
Housing Structures by Occupancy in Grand Ledge
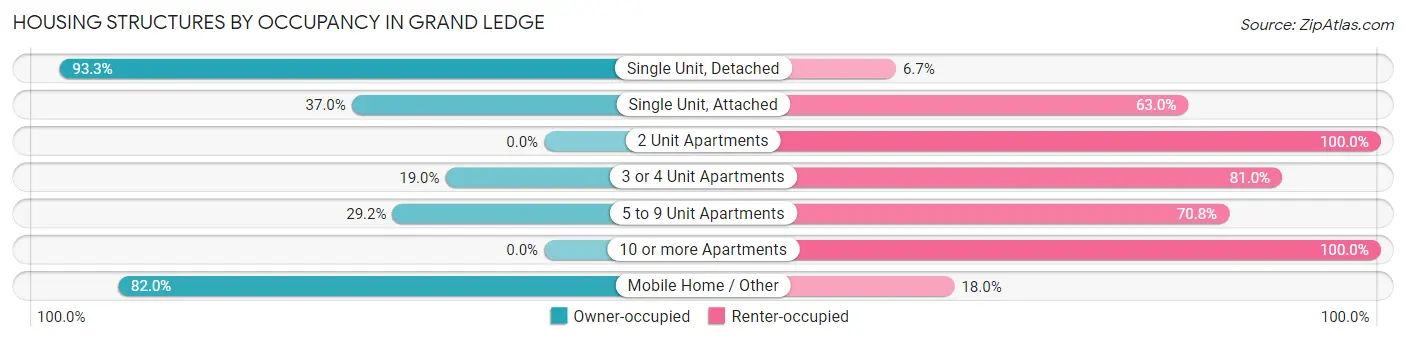
| Structure Type | Owner-occupied | Renter-occupied |
| Single Unit, Detached | 1,937 (93.3%) | 139 (6.7%) |
| Single Unit, Attached | 50 (37.0%) | 85 (63.0%) |
| 2 Unit Apartments | 0 (0.0%) | 84 (100.0%) |
| 3 or 4 Unit Apartments | 19 (19.0%) | 81 (81.0%) |
| 5 to 9 Unit Apartments | 40 (29.2%) | 97 (70.8%) |
| 10 or more Apartments | 0 (0.0%) | 688 (100.0%) |
| Mobile Home / Other | 251 (82.0%) | 55 (18.0%) |
| Total | 2,297 (65.1%) | 1,229 (34.9%) |
Housing Structures by Number of Rooms in Grand Ledge
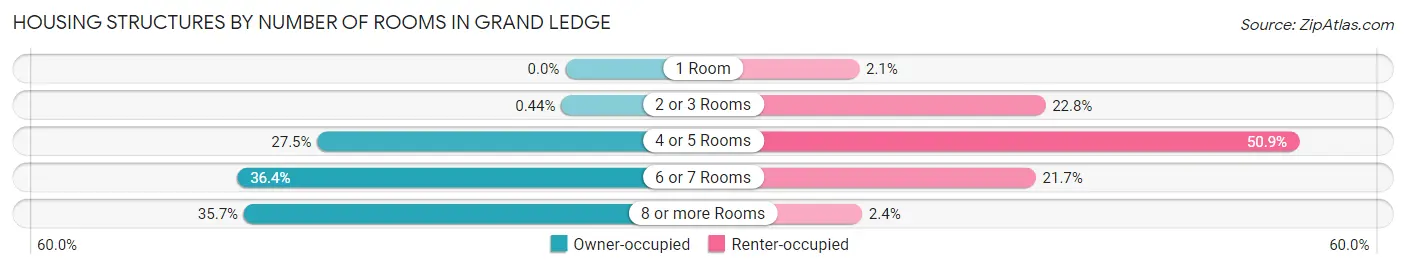
| Number of Rooms | Owner-occupied | Renter-occupied |
| 1 Room | 0 (0.0%) | 26 (2.1%) |
| 2 or 3 Rooms | 10 (0.4%) | 280 (22.8%) |
| 4 or 5 Rooms | 632 (27.5%) | 626 (50.9%) |
| 6 or 7 Rooms | 836 (36.4%) | 267 (21.7%) |
| 8 or more Rooms | 819 (35.7%) | 30 (2.4%) |
| Total | 2,297 (100.0%) | 1,229 (100.0%) |
Housing Structure by Heating Type in Grand Ledge
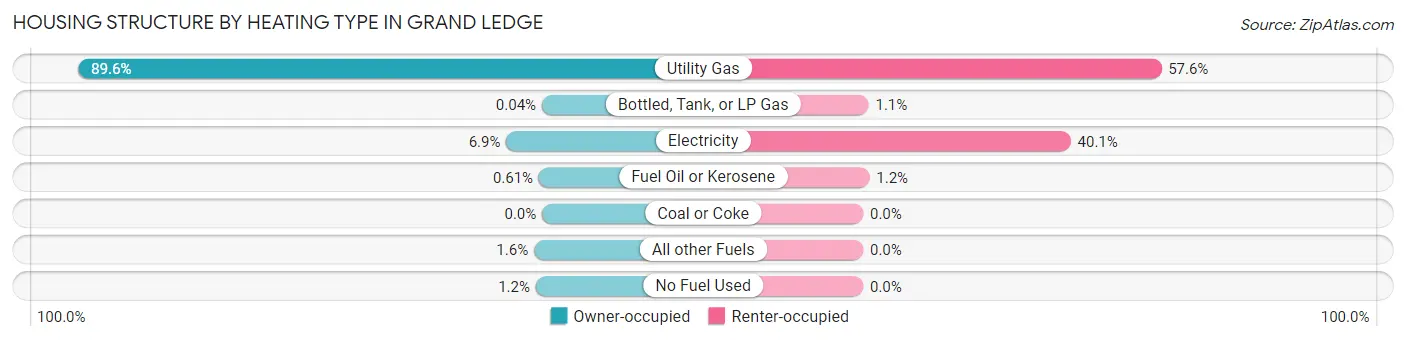
| Heating Type | Owner-occupied | Renter-occupied |
| Utility Gas | 2,059 (89.6%) | 708 (57.6%) |
| Bottled, Tank, or LP Gas | 1 (0.0%) | 13 (1.1%) |
| Electricity | 159 (6.9%) | 493 (40.1%) |
| Fuel Oil or Kerosene | 14 (0.6%) | 15 (1.2%) |
| Coal or Coke | 0 (0.0%) | 0 (0.0%) |
| All other Fuels | 36 (1.6%) | 0 (0.0%) |
| No Fuel Used | 28 (1.2%) | 0 (0.0%) |
| Total | 2,297 (100.0%) | 1,229 (100.0%) |
Household Vehicle Usage in Grand Ledge
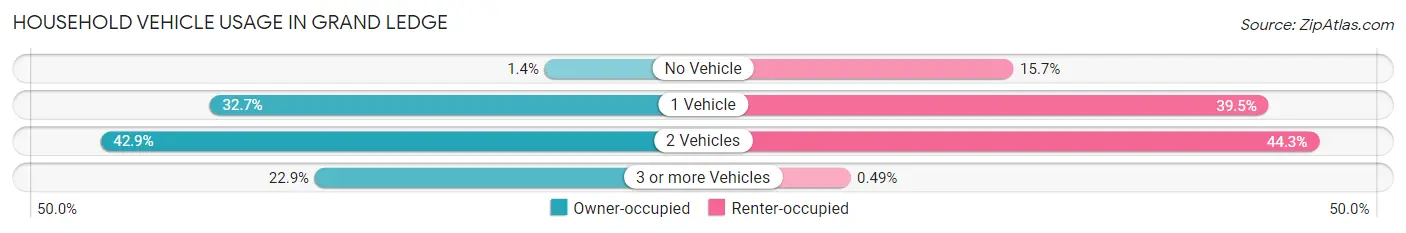
| Vehicles per Household | Owner-occupied | Renter-occupied |
| No Vehicle | 33 (1.4%) | 193 (15.7%) |
| 1 Vehicle | 752 (32.7%) | 486 (39.5%) |
| 2 Vehicles | 986 (42.9%) | 544 (44.3%) |
| 3 or more Vehicles | 526 (22.9%) | 6 (0.5%) |
| Total | 2,297 (100.0%) | 1,229 (100.0%) |
Real Estate & Mortgages in Grand Ledge
Real Estate and Mortgage Overview in Grand Ledge
| Characteristic | Without Mortgage | With Mortgage |
| Housing Units | 825 | 1,472 |
| Median Property Value | $161,300 | $196,200 |
| Median Household Income | $65,391 | $325 |
| Monthly Housing Costs | $662 | $46 |
| Real Estate Taxes | $2,749 | $20 |
Property Value by Mortgage Status in Grand Ledge
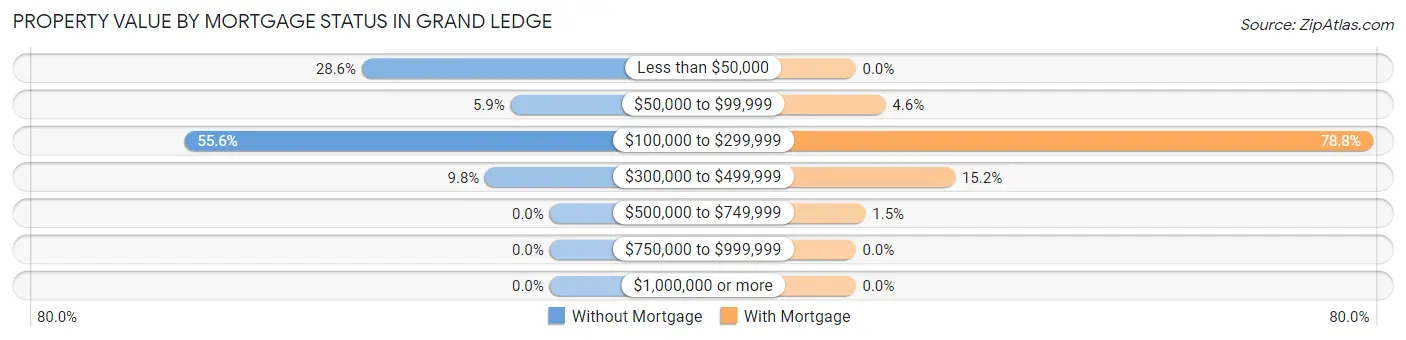
| Property Value | Without Mortgage | With Mortgage |
| Less than $50,000 | 236 (28.6%) | 0 (0.0%) |
| $50,000 to $99,999 | 49 (5.9%) | 67 (4.5%) |
| $100,000 to $299,999 | 459 (55.6%) | 1,160 (78.8%) |
| $300,000 to $499,999 | 81 (9.8%) | 223 (15.1%) |
| $500,000 to $749,999 | 0 (0.0%) | 22 (1.5%) |
| $750,000 to $999,999 | 0 (0.0%) | 0 (0.0%) |
| $1,000,000 or more | 0 (0.0%) | 0 (0.0%) |
| Total | 825 (100.0%) | 1,472 (100.0%) |
Household Income by Mortgage Status in Grand Ledge
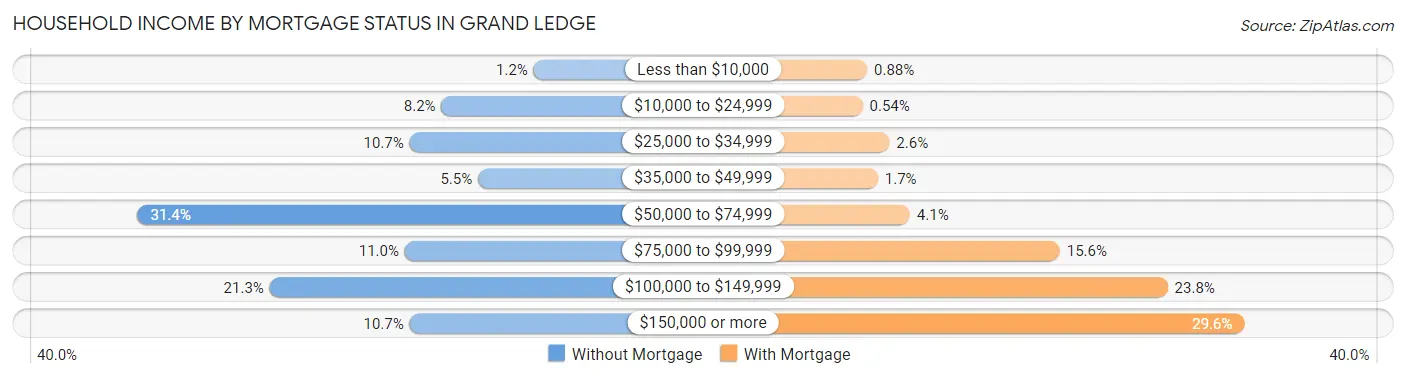
| Household Income | Without Mortgage | With Mortgage |
| Less than $10,000 | 10 (1.2%) | 13 (0.9%) |
| $10,000 to $24,999 | 68 (8.2%) | 8 (0.5%) |
| $25,000 to $34,999 | 88 (10.7%) | 38 (2.6%) |
| $35,000 to $49,999 | 45 (5.4%) | 25 (1.7%) |
| $50,000 to $74,999 | 259 (31.4%) | 61 (4.1%) |
| $75,000 to $99,999 | 91 (11.0%) | 229 (15.6%) |
| $100,000 to $149,999 | 176 (21.3%) | 350 (23.8%) |
| $150,000 or more | 88 (10.7%) | 436 (29.6%) |
| Total | 825 (100.0%) | 1,472 (100.0%) |
Property Value to Household Income Ratio in Grand Ledge
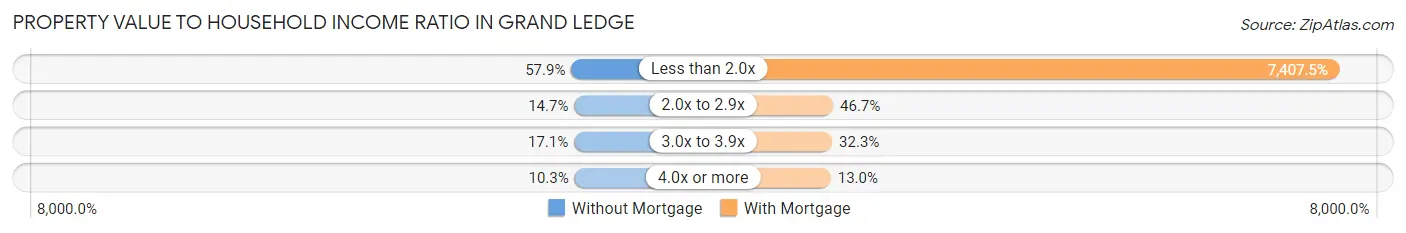
| Value-to-Income Ratio | Without Mortgage | With Mortgage |
| Less than 2.0x | 478 (57.9%) | 109,038 (7,407.5%) |
| 2.0x to 2.9x | 121 (14.7%) | 687 (46.7%) |
| 3.0x to 3.9x | 141 (17.1%) | 476 (32.3%) |
| 4.0x or more | 85 (10.3%) | 191 (13.0%) |
| Total | 825 (100.0%) | 1,472 (100.0%) |
Real Estate Taxes by Mortgage Status in Grand Ledge
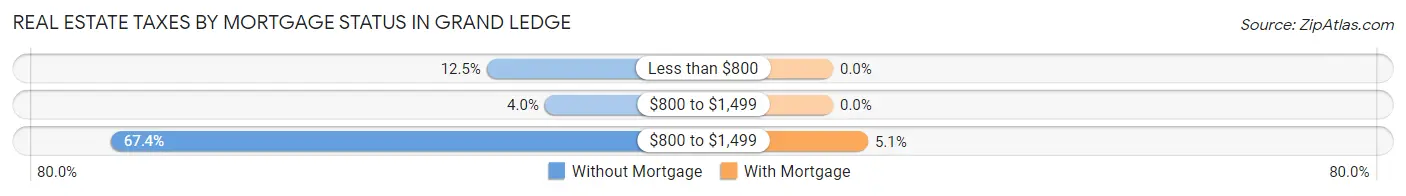
| Property Taxes | Without Mortgage | With Mortgage |
| Less than $800 | 103 (12.5%) | 0 (0.0%) |
| $800 to $1,499 | 33 (4.0%) | 0 (0.0%) |
| $800 to $1,499 | 556 (67.4%) | 75 (5.1%) |
| Total | 825 (100.0%) | 1,472 (100.0%) |
Health & Disability in Grand Ledge
Health Insurance Coverage by Age in Grand Ledge
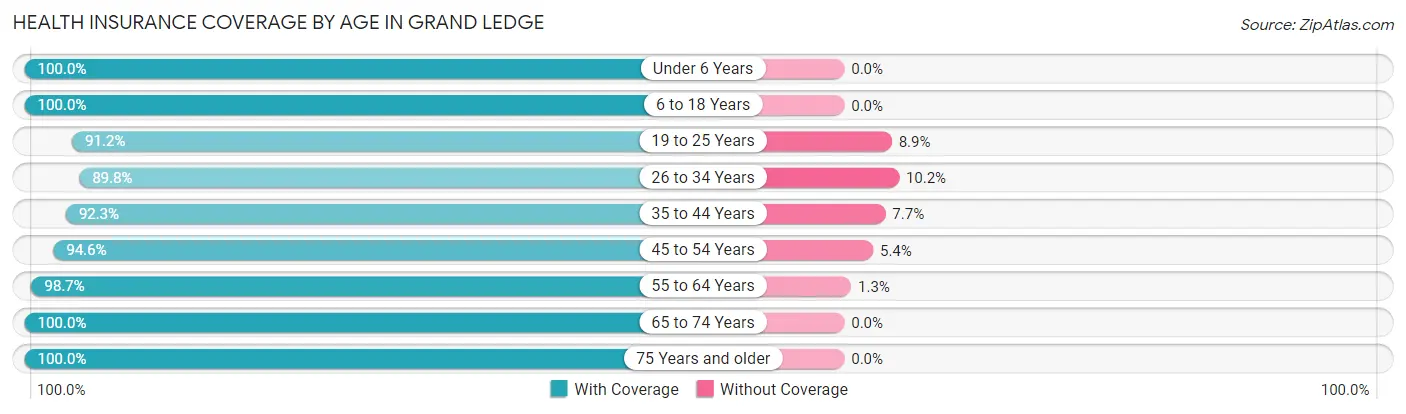
| Age Bracket | With Coverage | Without Coverage |
| Under 6 Years | 451 (100.0%) | 0 (0.0%) |
| 6 to 18 Years | 1,228 (100.0%) | 0 (0.0%) |
| 19 to 25 Years | 649 (91.1%) | 63 (8.8%) |
| 26 to 34 Years | 608 (89.8%) | 69 (10.2%) |
| 35 to 44 Years | 927 (92.3%) | 77 (7.7%) |
| 45 to 54 Years | 847 (94.6%) | 48 (5.4%) |
| 55 to 64 Years | 1,169 (98.7%) | 15 (1.3%) |
| 65 to 74 Years | 793 (100.0%) | 0 (0.0%) |
| 75 Years and older | 817 (100.0%) | 0 (0.0%) |
| Total | 7,489 (96.5%) | 272 (3.5%) |
Health Insurance Coverage by Citizenship Status in Grand Ledge
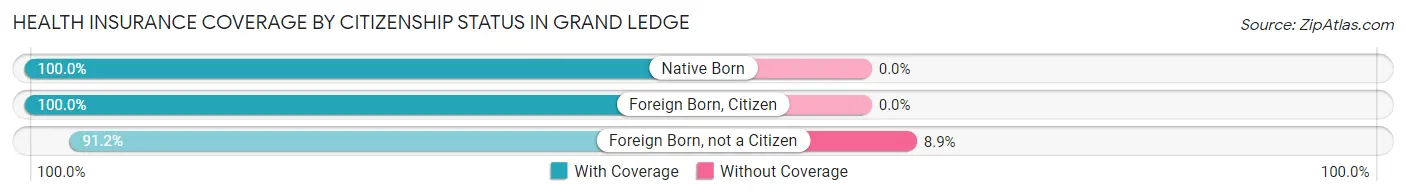
| Citizenship Status | With Coverage | Without Coverage |
| Native Born | 451 (100.0%) | 0 (0.0%) |
| Foreign Born, Citizen | 1,228 (100.0%) | 0 (0.0%) |
| Foreign Born, not a Citizen | 649 (91.1%) | 63 (8.8%) |
Health Insurance Coverage by Household Income in Grand Ledge
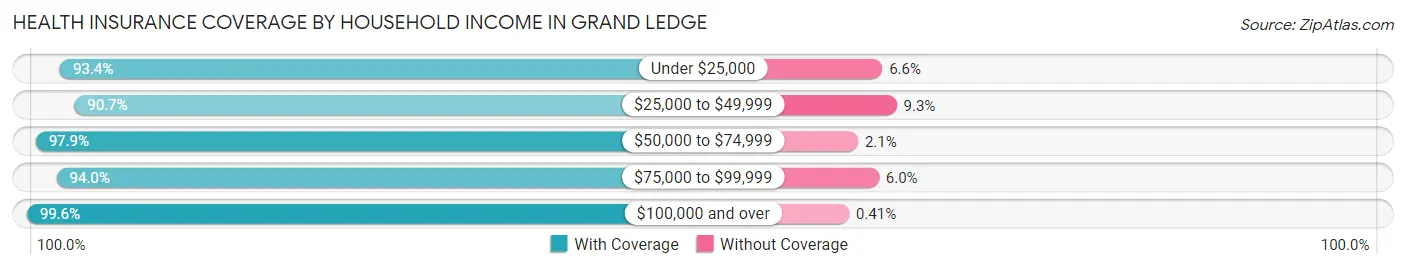
| Household Income | With Coverage | Without Coverage |
| Under $25,000 | 492 (93.4%) | 35 (6.6%) |
| $25,000 to $49,999 | 1,059 (90.7%) | 109 (9.3%) |
| $50,000 to $74,999 | 1,737 (97.9%) | 37 (2.1%) |
| $75,000 to $99,999 | 1,237 (94.0%) | 79 (6.0%) |
| $100,000 and over | 2,931 (99.6%) | 12 (0.4%) |
Public vs Private Health Insurance Coverage by Age in Grand Ledge
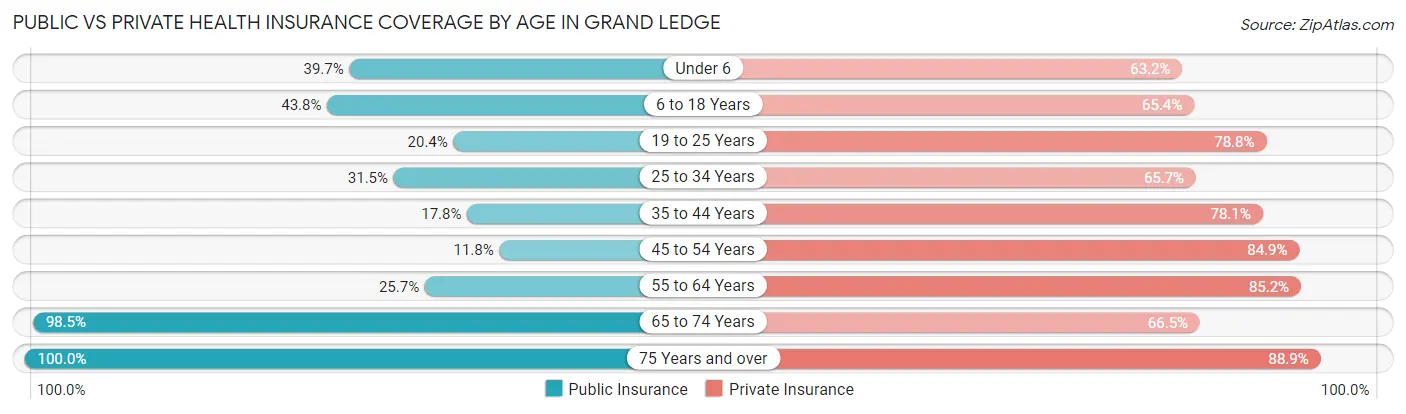
| Age Bracket | Public Insurance | Private Insurance |
| Under 6 | 179 (39.7%) | 285 (63.2%) |
| 6 to 18 Years | 538 (43.8%) | 803 (65.4%) |
| 19 to 25 Years | 145 (20.4%) | 561 (78.8%) |
| 25 to 34 Years | 213 (31.5%) | 445 (65.7%) |
| 35 to 44 Years | 179 (17.8%) | 784 (78.1%) |
| 45 to 54 Years | 106 (11.8%) | 760 (84.9%) |
| 55 to 64 Years | 304 (25.7%) | 1,009 (85.2%) |
| 65 to 74 Years | 781 (98.5%) | 527 (66.5%) |
| 75 Years and over | 817 (100.0%) | 726 (88.9%) |
| Total | 3,262 (42.0%) | 5,900 (76.0%) |
Disability Status by Sex by Age in Grand Ledge
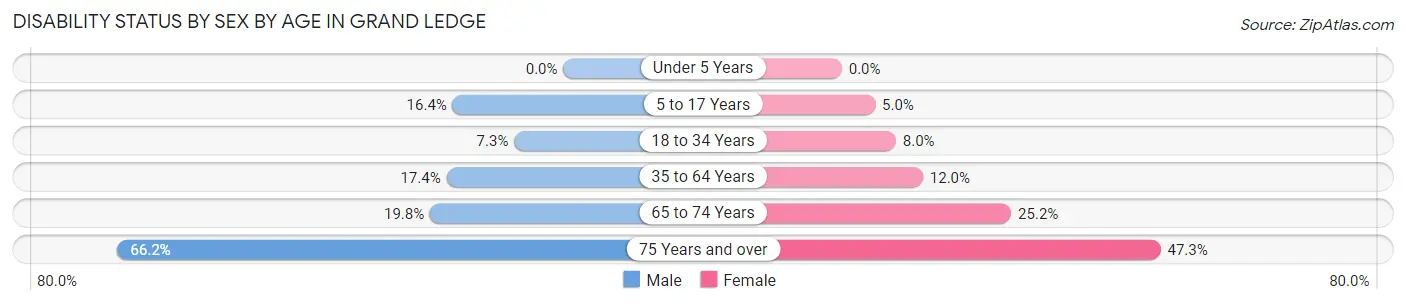
| Age Bracket | Male | Female |
| Under 5 Years | 0 (0.0%) | 0 (0.0%) |
| 5 to 17 Years | 120 (16.4%) | 27 (5.0%) |
| 18 to 34 Years | 53 (7.3%) | 58 (8.0%) |
| 35 to 64 Years | 251 (17.3%) | 197 (12.0%) |
| 65 to 74 Years | 57 (19.8%) | 127 (25.2%) |
| 75 Years and over | 243 (66.2%) | 213 (47.3%) |
Disability Class by Sex by Age in Grand Ledge
Disability Class: Hearing Difficulty
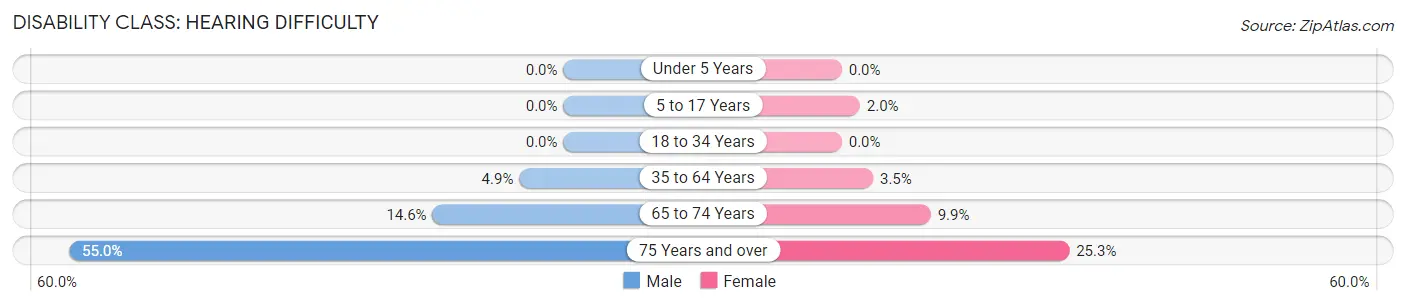
| Age Bracket | Male | Female |
| Under 5 Years | 0 (0.0%) | 0 (0.0%) |
| 5 to 17 Years | 0 (0.0%) | 11 (2.0%) |
| 18 to 34 Years | 0 (0.0%) | 0 (0.0%) |
| 35 to 64 Years | 71 (4.9%) | 57 (3.5%) |
| 65 to 74 Years | 42 (14.6%) | 50 (9.9%) |
| 75 Years and over | 202 (55.0%) | 114 (25.3%) |
Disability Class: Vision Difficulty
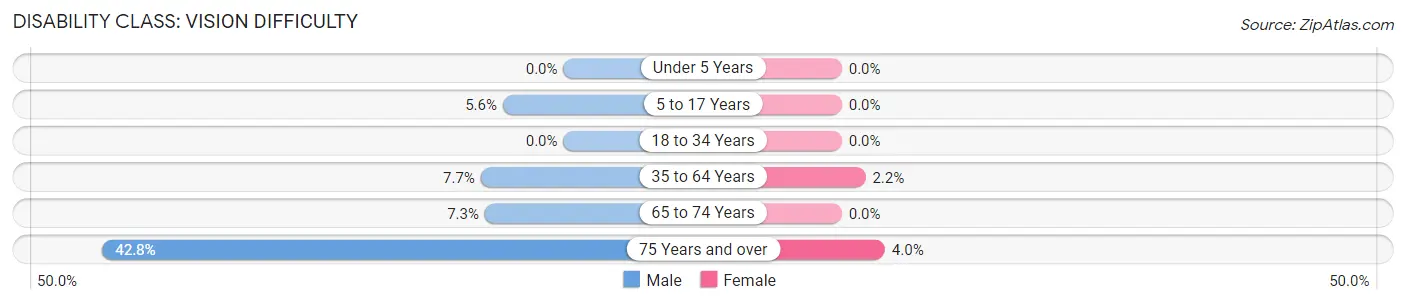
| Age Bracket | Male | Female |
| Under 5 Years | 0 (0.0%) | 0 (0.0%) |
| 5 to 17 Years | 41 (5.6%) | 0 (0.0%) |
| 18 to 34 Years | 0 (0.0%) | 0 (0.0%) |
| 35 to 64 Years | 111 (7.7%) | 36 (2.2%) |
| 65 to 74 Years | 21 (7.3%) | 0 (0.0%) |
| 75 Years and over | 157 (42.8%) | 18 (4.0%) |
Disability Class: Cognitive Difficulty
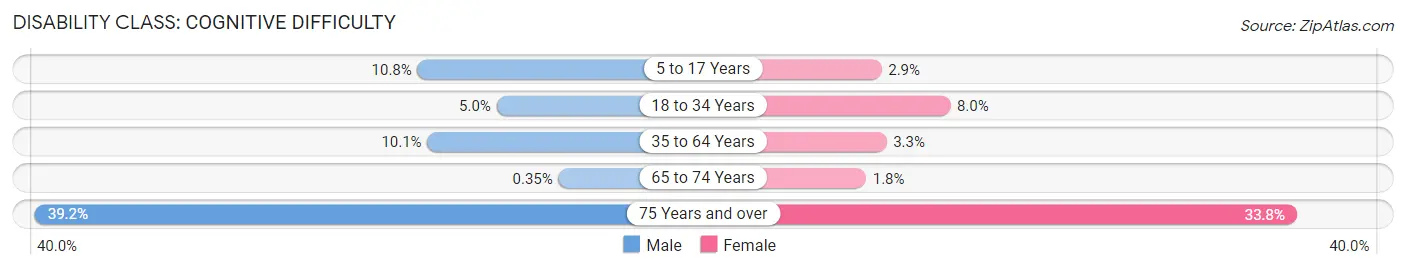
| Age Bracket | Male | Female |
| 5 to 17 Years | 79 (10.8%) | 16 (2.9%) |
| 18 to 34 Years | 36 (5.0%) | 58 (8.0%) |
| 35 to 64 Years | 146 (10.1%) | 54 (3.3%) |
| 65 to 74 Years | 1 (0.4%) | 9 (1.8%) |
| 75 Years and over | 144 (39.2%) | 152 (33.8%) |
Disability Class: Ambulatory Difficulty
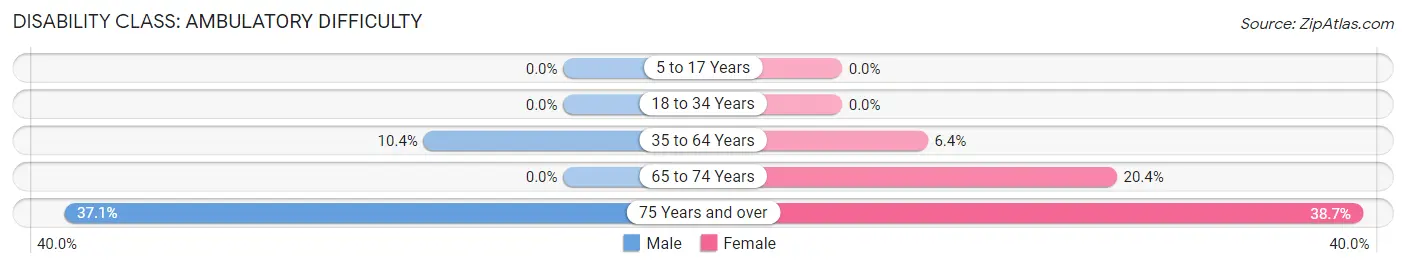
| Age Bracket | Male | Female |
| 5 to 17 Years | 0 (0.0%) | 0 (0.0%) |
| 18 to 34 Years | 0 (0.0%) | 0 (0.0%) |
| 35 to 64 Years | 150 (10.4%) | 104 (6.4%) |
| 65 to 74 Years | 0 (0.0%) | 103 (20.4%) |
| 75 Years and over | 136 (37.1%) | 174 (38.7%) |
Disability Class: Self-Care Difficulty
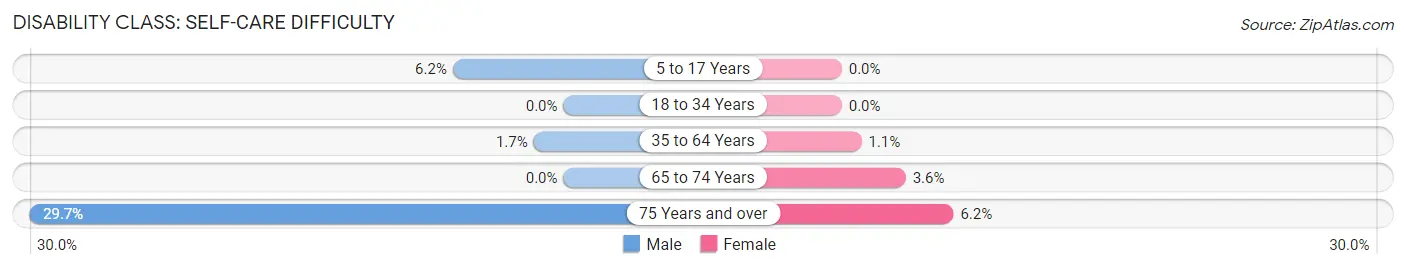
| Age Bracket | Male | Female |
| 5 to 17 Years | 45 (6.2%) | 0 (0.0%) |
| 18 to 34 Years | 0 (0.0%) | 0 (0.0%) |
| 35 to 64 Years | 24 (1.7%) | 18 (1.1%) |
| 65 to 74 Years | 0 (0.0%) | 18 (3.6%) |
| 75 Years and over | 109 (29.7%) | 28 (6.2%) |
Technology Access in Grand Ledge
Computing Device Access in Grand Ledge
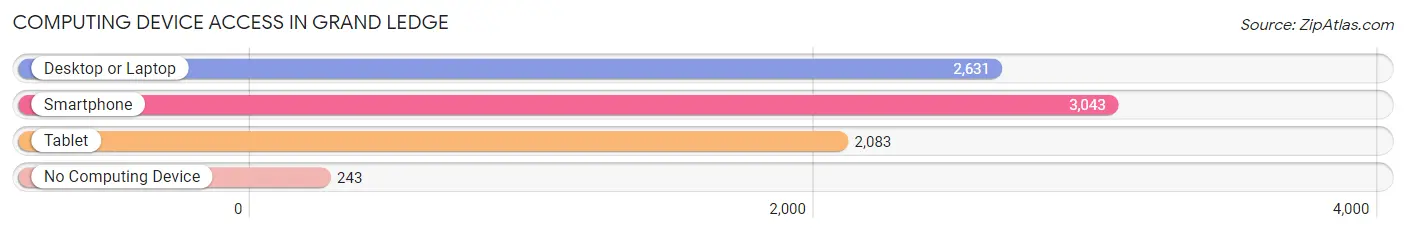
| Device Type | # Households | % Households |
| Desktop or Laptop | 2,631 | 74.6% |
| Smartphone | 3,043 | 86.3% |
| Tablet | 2,083 | 59.1% |
| No Computing Device | 243 | 6.9% |
| Total | 3,526 | 100.0% |
Internet Access in Grand Ledge
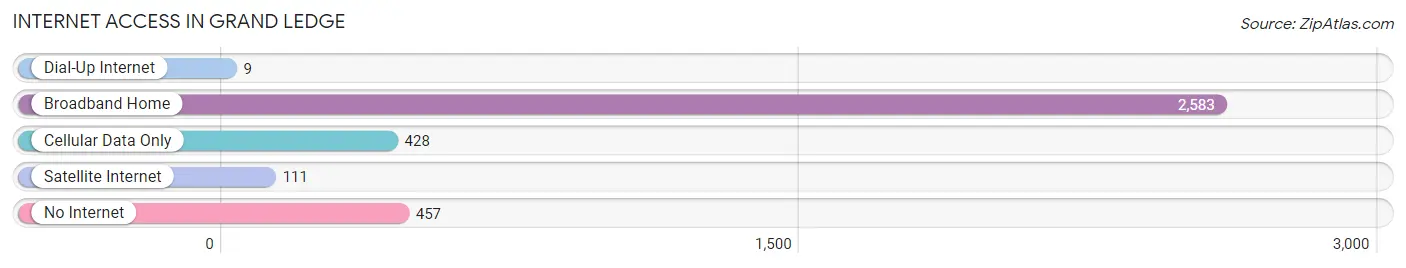
| Internet Type | # Households | % Households |
| Dial-Up Internet | 9 | 0.3% |
| Broadband Home | 2,583 | 73.3% |
| Cellular Data Only | 428 | 12.1% |
| Satellite Internet | 111 | 3.2% |
| No Internet | 457 | 13.0% |
| Total | 3,526 | 100.0% |
Grand Ledge Summary
Grand Ledge is a city located in Eaton County, Michigan, United States. It is situated along the Grand River, approximately 10 miles (16 km) west of Lansing, the state capital. As of the 2010 census, the city population was 7,805.
History
Grand Ledge was first settled in 1836 by a group of settlers from New York. The city was named for the 300-foot (91 m) high sandstone ledges along the Grand River. The ledges provided a safe crossing for Native Americans and early settlers. The first permanent settler was William H. Pashby, who arrived in 1837.
The city was incorporated in 1871. In the late 19th century, Grand Ledge was a popular summer resort destination for wealthy families from Detroit and Lansing. The city was home to several large resorts, including the Grand Ledge Hotel, which was built in 1876 and burned down in 1891.
Geography
Grand Ledge is located at 42°45′N 84°45′W (42.75, -84.75). According to the United States Census Bureau, the city has a total area of 4.50 square miles (11.67 km2), of which 4.45 square miles (11.53 km2) is land and 0.05 square miles (0.14 km2) is water.
Economy
Grand Ledge is home to several large employers, including Eaton Corporation, a global power management company; Grand Ledge Public Schools; and the Grand Ledge Medical Center. The city also has a vibrant downtown area, with several restaurants, shops, and other businesses.
Demographics
As of the census of 2010, there were 7,805 people, 3,093 households, and 2,072 families residing in the city. The population density was 1,746.2 people per square mile (675.2/km2). There were 3,309 housing units at an average density of 741.2 per square mile (286.2/km2). The racial makeup of the city was 94.2% White, 1.3% African American, 0.4% Native American, 1.2% Asian, 0.1% Pacific Islander, 1.2% from other races, and 1.6% from two or more races. Hispanic or Latino of any race were 3.3% of the population.
There were 3,093 households, out of which 33.2% had children under the age of 18 living with them, 51.2% were married couples living together, 11.7% had a female householder with no husband present, and 32.7% were non-families. 27.2% of all households were made up of individuals, and 10.2% had someone living alone who was 65 years of age or older. The average household size was 2.51 and the average family size was 3.06.
In the city, the population was spread out, with 25.9% under the age of 18, 8.2% from 18 to 24, 28.7% from 25 to 44, 24.2% from 45 to 64, and 13.0% who were 65 years of age or older. The median age was 37 years. For every 100 females, there were 93.2 males. For every 100 females age 18 and over, there were 89.3 males.
The median income for a household in the city was $45,945, and the median income for a family was $54,917. Males had a median income of $41,945 versus $30,917 for females. The per capita income for the city was $22,945. About 4.2% of families and 6.2% of the population were below the poverty line, including 8.2% of those under age 18 and 4.2% of those age 65 or over.
Common Questions
What is Per Capita Income in Grand Ledge?
Per Capita income in Grand Ledge is $42,917.
What is the Median Family Income in Grand Ledge?
Median Family Income in Grand Ledge is $89,965.
What is the Median Household income in Grand Ledge?
Median Household Income in Grand Ledge is $71,179.
What is Income or Wage Gap in Grand Ledge?
Income or Wage Gap in Grand Ledge is 10.9%.
Women in Grand Ledge earn 89.1 cents for every dollar earned by a man.
What is Inequality or Gini Index in Grand Ledge?
Inequality or Gini Index in Grand Ledge is 0.43.
What is the Total Population of Grand Ledge?
Total Population of Grand Ledge is 7,795.
What is the Total Male Population of Grand Ledge?
Total Male Population of Grand Ledge is 3,739.
What is the Total Female Population of Grand Ledge?
Total Female Population of Grand Ledge is 4,056.
What is the Ratio of Males per 100 Females in Grand Ledge?
There are 92.18 Males per 100 Females in Grand Ledge.
What is the Ratio of Females per 100 Males in Grand Ledge?
There are 108.48 Females per 100 Males in Grand Ledge.
What is the Median Population Age in Grand Ledge?
Median Population Age in Grand Ledge is 41.9 Years.
What is the Average Family Size in Grand Ledge
Average Family Size in Grand Ledge is 2.8 People.
What is the Average Household Size in Grand Ledge
Average Household Size in Grand Ledge is 2.2 People.
How Large is the Labor Force in Grand Ledge?
There are 4,096 People in the Labor Forcein in Grand Ledge.
What is the Percentage of People in the Labor Force in Grand Ledge?
64.3% of People are in the Labor Force in Grand Ledge.
What is the Unemployment Rate in Grand Ledge?
Unemployment Rate in Grand Ledge is 5.4%.