Mount Pulaski, IL Map & Demographics
Mount Pulaski Map
Mount Pulaski Overview
$31,399
PER CAPITA INCOME
$77,708
AVG FAMILY INCOME
$67,970
AVG HOUSEHOLD INCOME
27.3%
WAGE / INCOME GAP [ % ]
72.7¢/ $1
WAGE / INCOME GAP [ $ ]
0.37
INEQUALITY / GINI INDEX
1,636
TOTAL POPULATION
701
MALE POPULATION
935
FEMALE POPULATION
74.97
MALES / 100 FEMALES
133.38
FEMALES / 100 MALES
41.7
MEDIAN AGE
2.9
AVG FAMILY SIZE
2.3
AVG HOUSEHOLD SIZE
736
LABOR FORCE [ PEOPLE ]
61.0%
PERCENT IN LABOR FORCE
6.5%
UNEMPLOYMENT RATE
Mount Pulaski Zip Codes
Mount Pulaski Area Codes
Income in Mount Pulaski
Income Overview in Mount Pulaski
Per Capita Income in Mount Pulaski is $31,399, while median incomes of families and households are $77,708 and $67,970 respectively.
| Characteristic | Number | Measure |
| Per Capita Income | 1,636 | $31,399 |
| Median Family Income | 428 | $77,708 |
| Mean Family Income | 428 | $92,226 |
| Median Household Income | 671 | $67,970 |
| Mean Household Income | 671 | $74,748 |
| Income Deficit | 428 | $0 |
| Wage / Income Gap (%) | 1,636 | 27.29% |
| Wage / Income Gap ($) | 1,636 | 72.71¢ per $1 |
| Gini / Inequality Index | 1,636 | 0.37 |
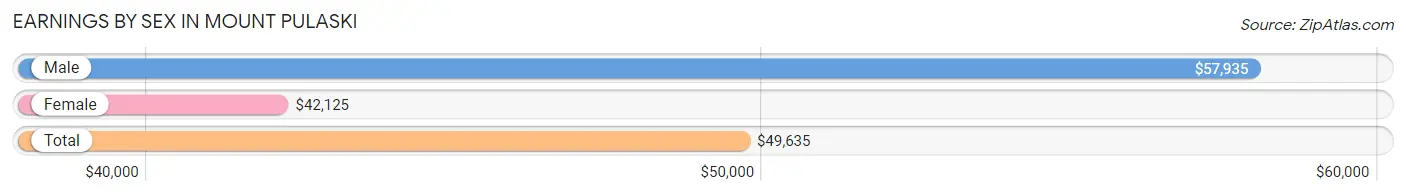
Earnings by Sex in Mount Pulaski
Average Earnings in Mount Pulaski are $49,635, $57,935 for men and $42,125 for women, a difference of 27.3%.
| Sex | Number | Average Earnings |
| Male | 342 (46.0%) | $57,935 |
| Female | 401 (54.0%) | $42,125 |
| Total | 743 (100.0%) | $49,635 |
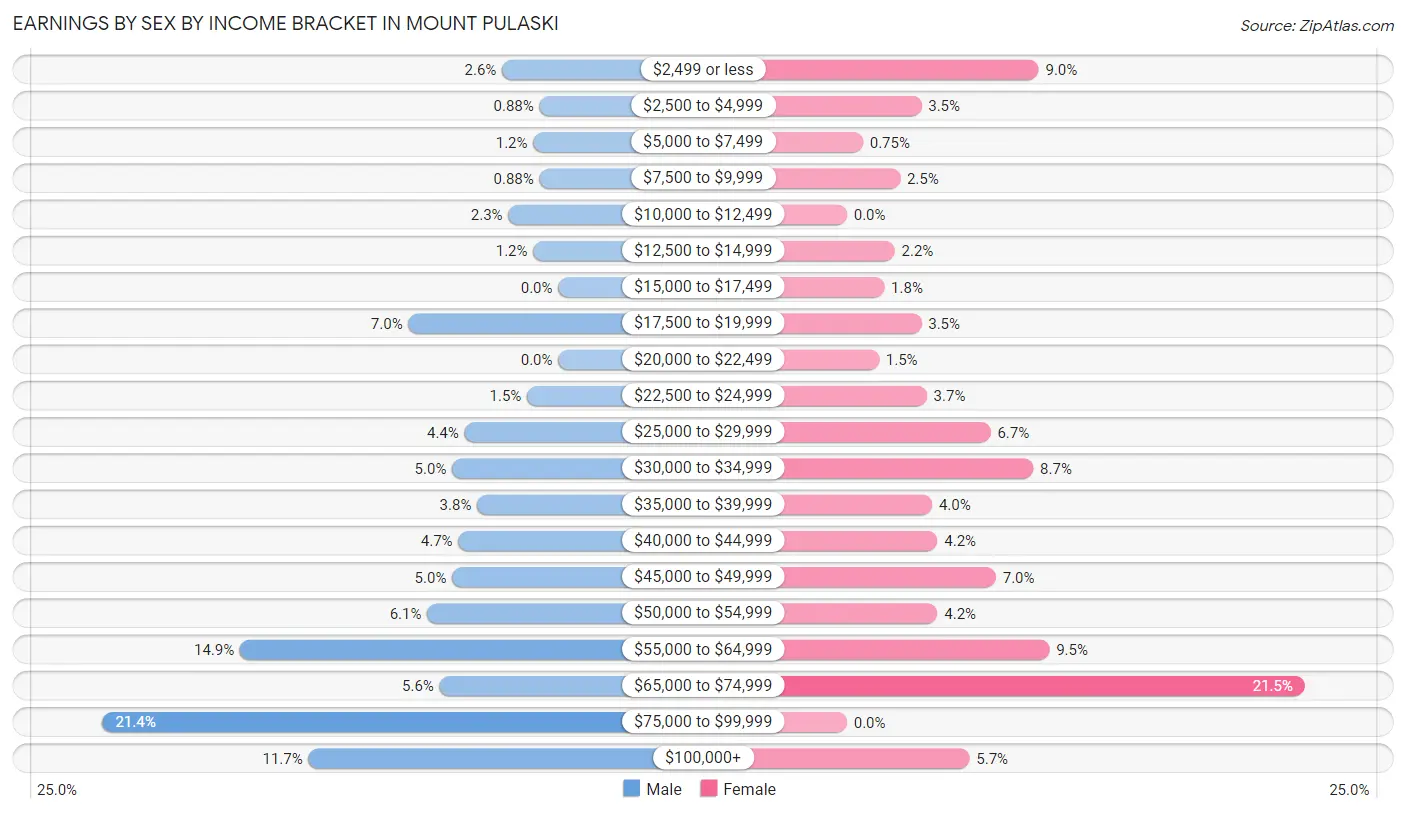
Earnings by Sex by Income Bracket in Mount Pulaski
The most common earnings brackets in Mount Pulaski are $75,000 to $99,999 for men (73 | 21.3%) and $65,000 to $74,999 for women (86 | 21.4%).
| Income | Male | Female |
| $2,499 or less | 9 (2.6%) | 36 (9.0%) |
| $2,500 to $4,999 | 3 (0.9%) | 14 (3.5%) |
| $5,000 to $7,499 | 4 (1.2%) | 3 (0.7%) |
| $7,500 to $9,999 | 3 (0.9%) | 10 (2.5%) |
| $10,000 to $12,499 | 8 (2.3%) | 0 (0.0%) |
| $12,500 to $14,999 | 4 (1.2%) | 9 (2.2%) |
| $15,000 to $17,499 | 0 (0.0%) | 7 (1.8%) |
| $17,500 to $19,999 | 24 (7.0%) | 14 (3.5%) |
| $20,000 to $22,499 | 0 (0.0%) | 6 (1.5%) |
| $22,500 to $24,999 | 5 (1.5%) | 15 (3.7%) |
| $25,000 to $29,999 | 15 (4.4%) | 27 (6.7%) |
| $30,000 to $34,999 | 17 (5.0%) | 35 (8.7%) |
| $35,000 to $39,999 | 13 (3.8%) | 16 (4.0%) |
| $40,000 to $44,999 | 16 (4.7%) | 17 (4.2%) |
| $45,000 to $49,999 | 17 (5.0%) | 28 (7.0%) |
| $50,000 to $54,999 | 21 (6.1%) | 17 (4.2%) |
| $55,000 to $64,999 | 51 (14.9%) | 38 (9.5%) |
| $65,000 to $74,999 | 19 (5.6%) | 86 (21.4%) |
| $75,000 to $99,999 | 73 (21.3%) | 0 (0.0%) |
| $100,000+ | 40 (11.7%) | 23 (5.7%) |
| Total | 342 (100.0%) | 401 (100.0%) |
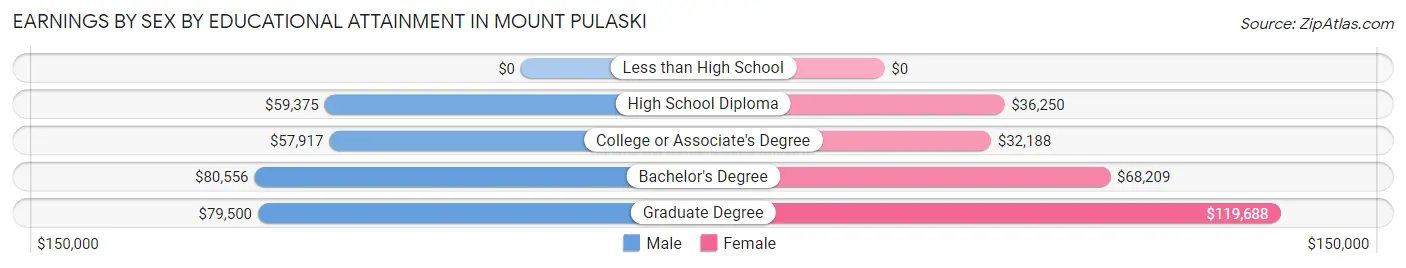
Earnings by Sex by Educational Attainment in Mount Pulaski
Average earnings in Mount Pulaski are $60,313 for men and $47,115 for women, a difference of 21.9%. Men with an educational attainment of bachelor's degree enjoy the highest average annual earnings of $80,556, while those with college or associate's degree education earn the least with $57,917. Women with an educational attainment of graduate degree earn the most with the average annual earnings of $119,688, while those with college or associate's degree education have the smallest earnings of $32,188.
| Educational Attainment | Male Income | Female Income |
| Less than High School | - | - |
| High School Diploma | $59,375 | $36,250 |
| College or Associate's Degree | $57,917 | $32,188 |
| Bachelor's Degree | $80,556 | $68,209 |
| Graduate Degree | $79,500 | $119,688 |
| Total | $60,313 | $47,115 |
Family Income in Mount Pulaski
Family Income Brackets in Mount Pulaski
According to the Mount Pulaski family income data, there are 111 families falling into the $100,000 to $149,999 income range, which is the most common income bracket and makes up 25.9% of all families.
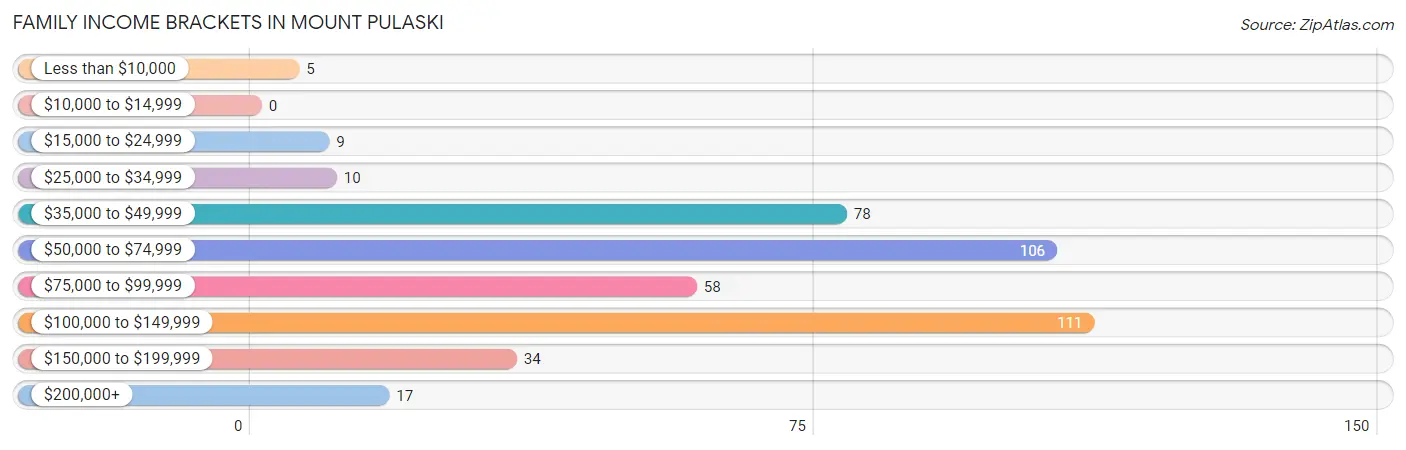
| Income Bracket | # Families | % Families |
| Less than $10,000 | 5 | 1.2% |
| $10,000 to $14,999 | 0 | 0.0% |
| $15,000 to $24,999 | 9 | 2.1% |
| $25,000 to $34,999 | 10 | 2.3% |
| $35,000 to $49,999 | 78 | 18.2% |
| $50,000 to $74,999 | 106 | 24.8% |
| $75,000 to $99,999 | 58 | 13.6% |
| $100,000 to $149,999 | 111 | 25.9% |
| $150,000 to $199,999 | 34 | 7.9% |
| $200,000+ | 17 | 4.0% |
Family Income by Famaliy Size in Mount Pulaski
5-person families (34 | 7.9%) account for the highest median family income in Mount Pulaski with $114,063 per family, while 3-person families (42 | 9.8%) have the highest median income of $37,833 per family member.
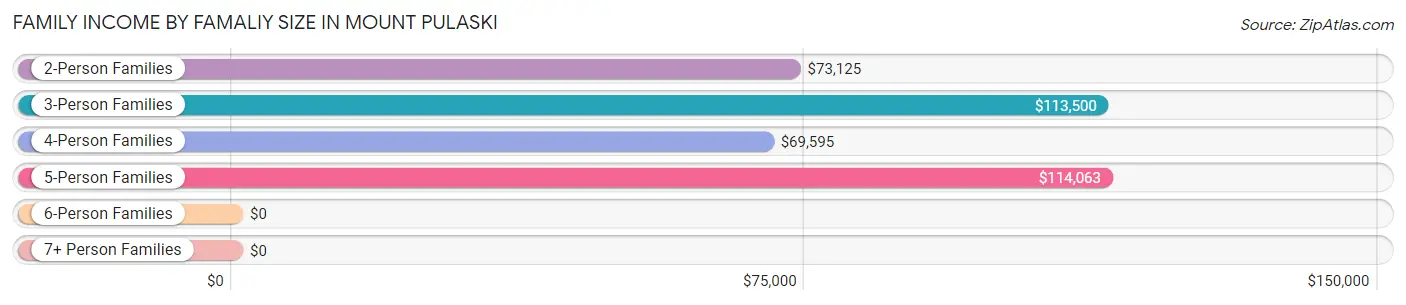
| Income Bracket | # Families | Median Income |
| 2-Person Families | 205 (47.9%) | $73,125 |
| 3-Person Families | 42 (9.8%) | $113,500 |
| 4-Person Families | 144 (33.6%) | $69,595 |
| 5-Person Families | 34 (7.9%) | $114,063 |
| 6-Person Families | 0 (0.0%) | $0 |
| 7+ Person Families | 3 (0.7%) | $0 |
| Total | 428 (100.0%) | $77,708 |
Family Income by Number of Earners in Mount Pulaski
The median family income in Mount Pulaski is $77,708, with families comprising 3+ earners (27) having the highest median family income of $130,750, while families with no earners (79) have the lowest median family income of $44,735, accounting for 6.3% and 18.5% of families, respectively.
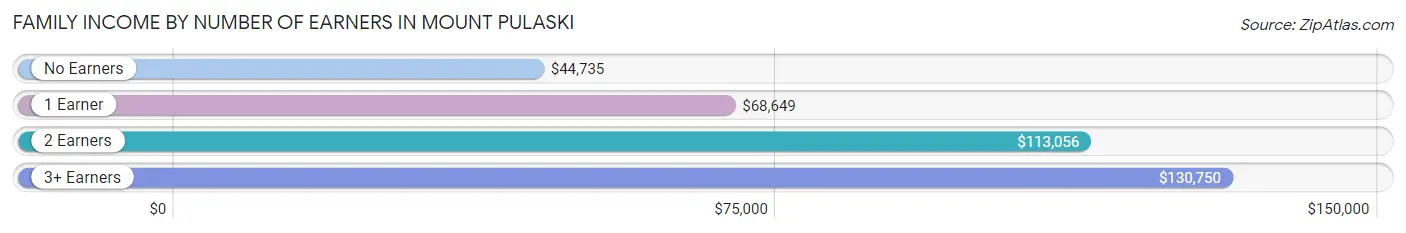
| Number of Earners | # Families | Median Income |
| No Earners | 79 (18.5%) | $44,735 |
| 1 Earner | 138 (32.2%) | $68,649 |
| 2 Earners | 184 (43.0%) | $113,056 |
| 3+ Earners | 27 (6.3%) | $130,750 |
| Total | 428 (100.0%) | $77,708 |
Household Income in Mount Pulaski
Household Income Brackets in Mount Pulaski
With 170 households falling in the category, the $50,000 to $74,999 income range is the most frequent in Mount Pulaski, accounting for 25.3% of all households. In contrast, only 17 households (2.5%) fall into the $200,000+ income bracket, making it the least populous group.
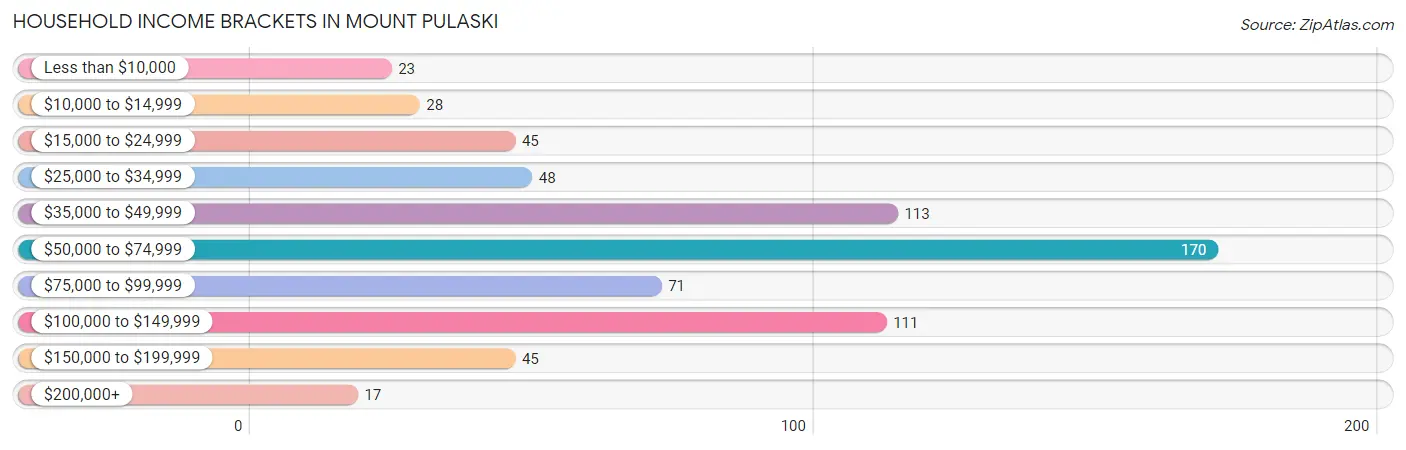
| Income Bracket | # Households | % Households |
| Less than $10,000 | 23 | 3.4% |
| $10,000 to $14,999 | 28 | 4.2% |
| $15,000 to $24,999 | 45 | 6.7% |
| $25,000 to $34,999 | 48 | 7.2% |
| $35,000 to $49,999 | 113 | 16.8% |
| $50,000 to $74,999 | 170 | 25.3% |
| $75,000 to $99,999 | 71 | 10.6% |
| $100,000 to $149,999 | 111 | 16.5% |
| $150,000 to $199,999 | 45 | 6.7% |
| $200,000+ | 17 | 2.5% |
Household Income by Householder Age in Mount Pulaski
The median household income in Mount Pulaski is $67,970, with the highest median household income of $80,000 found in the 45 to 64 years age bracket for the primary householder. A total of 248 households (37.0%) fall into this category. Meanwhile, the 15 to 24 years age bracket for the primary householder has the lowest median household income of $0, with 27 households (4.0%) in this group.
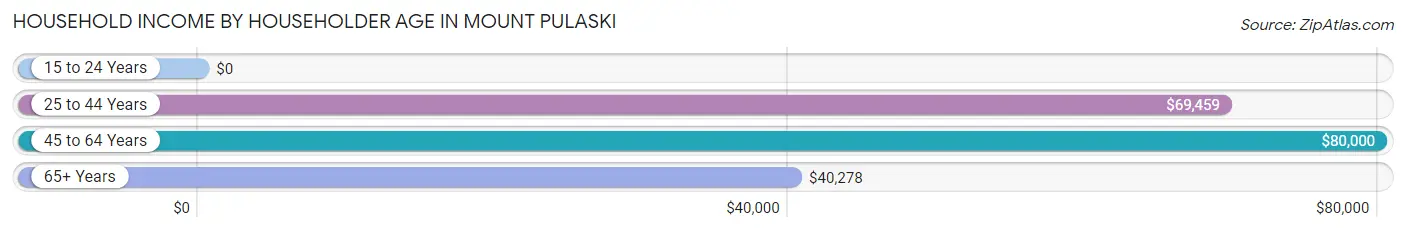
| Income Bracket | # Households | Median Income |
| 15 to 24 Years | 27 (4.0%) | $0 |
| 25 to 44 Years | 224 (33.4%) | $69,459 |
| 45 to 64 Years | 248 (37.0%) | $80,000 |
| 65+ Years | 172 (25.6%) | $40,278 |
| Total | 671 (100.0%) | $67,970 |
Poverty in Mount Pulaski
Income Below Poverty by Sex and Age in Mount Pulaski
With 4.5% poverty level for males and 6.3% for females among the residents of Mount Pulaski, 55 to 64 year old males and 16 and 17 year old females are the most vulnerable to poverty, with 17 males (14.7%) and 7 females (50.0%) in their respective age groups living below the poverty level.
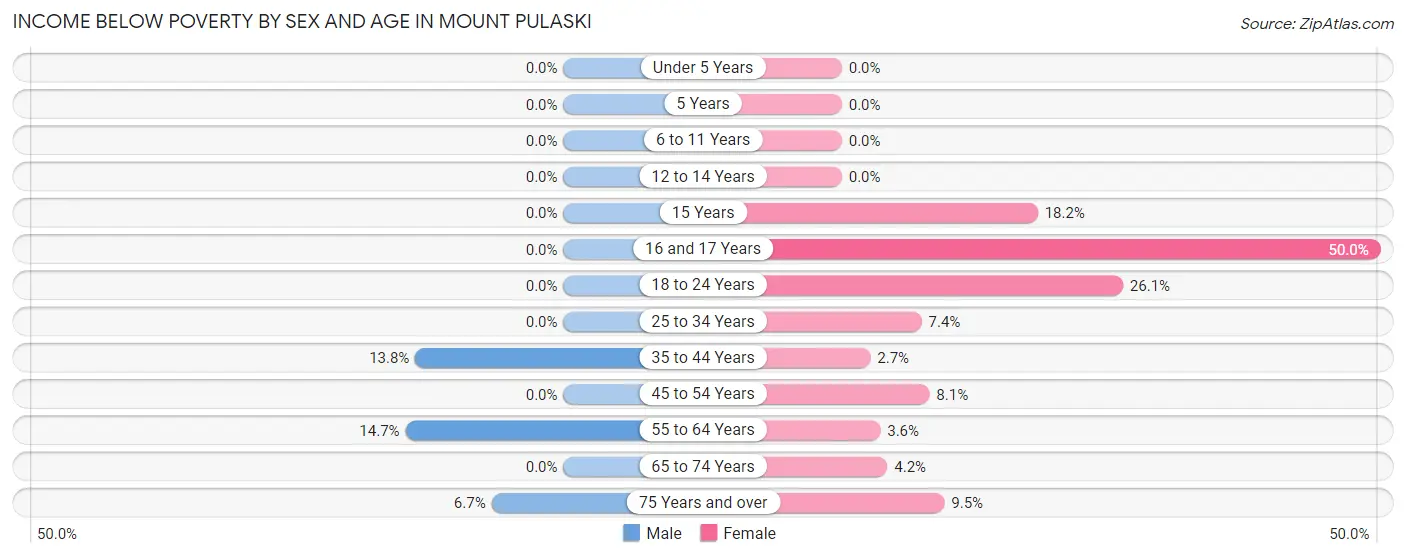
| Age Bracket | Male | Female |
| Under 5 Years | 0 (0.0%) | 0 (0.0%) |
| 5 Years | 0 (0.0%) | 0 (0.0%) |
| 6 to 11 Years | 0 (0.0%) | 0 (0.0%) |
| 12 to 14 Years | 0 (0.0%) | 0 (0.0%) |
| 15 Years | 0 (0.0%) | 2 (18.2%) |
| 16 and 17 Years | 0 (0.0%) | 7 (50.0%) |
| 18 to 24 Years | 0 (0.0%) | 12 (26.1%) |
| 25 to 34 Years | 0 (0.0%) | 6 (7.4%) |
| 35 to 44 Years | 11 (13.8%) | 4 (2.6%) |
| 45 to 54 Years | 0 (0.0%) | 10 (8.1%) |
| 55 to 64 Years | 17 (14.7%) | 3 (3.6%) |
| 65 to 74 Years | 0 (0.0%) | 3 (4.2%) |
| 75 Years and over | 3 (6.7%) | 10 (9.5%) |
| Total | 31 (4.5%) | 57 (6.3%) |
Income Above Poverty by Sex and Age in Mount Pulaski
According to the poverty statistics in Mount Pulaski, males aged under 5 years and females aged under 5 years are the age groups that are most secure financially, with 100.0% of males and 100.0% of females in these age groups living above the poverty line.
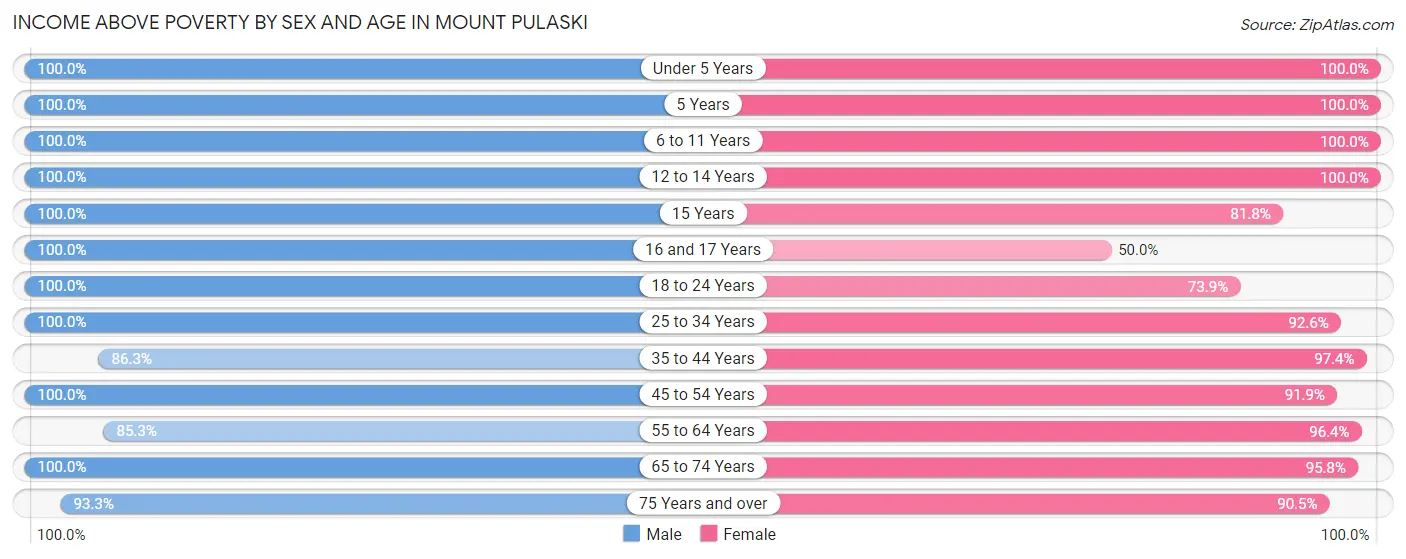
| Age Bracket | Male | Female |
| Under 5 Years | 28 (100.0%) | 86 (100.0%) |
| 5 Years | 7 (100.0%) | 17 (100.0%) |
| 6 to 11 Years | 132 (100.0%) | 99 (100.0%) |
| 12 to 14 Years | 3 (100.0%) | 18 (100.0%) |
| 15 Years | 29 (100.0%) | 9 (81.8%) |
| 16 and 17 Years | 5 (100.0%) | 7 (50.0%) |
| 18 to 24 Years | 47 (100.0%) | 34 (73.9%) |
| 25 to 34 Years | 54 (100.0%) | 75 (92.6%) |
| 35 to 44 Years | 69 (86.3%) | 147 (97.4%) |
| 45 to 54 Years | 109 (100.0%) | 113 (91.9%) |
| 55 to 64 Years | 99 (85.3%) | 81 (96.4%) |
| 65 to 74 Years | 32 (100.0%) | 68 (95.8%) |
| 75 Years and over | 42 (93.3%) | 95 (90.5%) |
| Total | 656 (95.5%) | 849 (93.7%) |
Income Below Poverty Among Married-Couple Families in Mount Pulaski
The poverty statistics for married-couple families in Mount Pulaski show that 1.0% or 3 of the total 305 families live below the poverty line. Families with no children have the highest poverty rate of 1.5%, comprising of 3 families. On the other hand, families with 1 or 2 children have the lowest poverty rate of 0.0%, which includes 0 families.
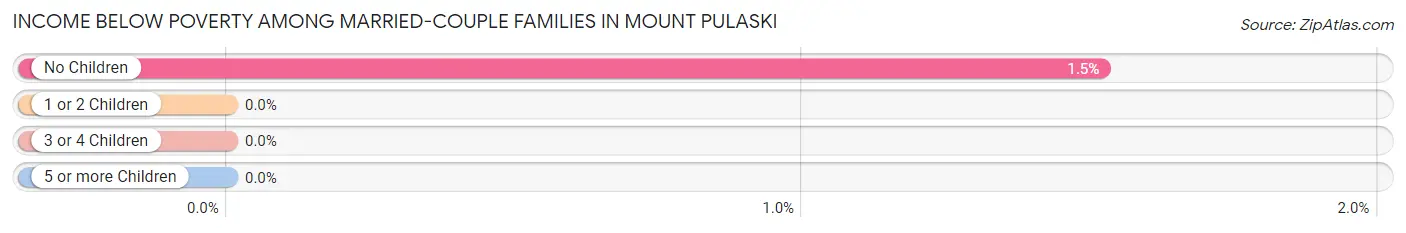
| Children | Above Poverty | Below Poverty |
| No Children | 195 (98.5%) | 3 (1.5%) |
| 1 or 2 Children | 78 (100.0%) | 0 (0.0%) |
| 3 or 4 Children | 26 (100.0%) | 0 (0.0%) |
| 5 or more Children | 3 (100.0%) | 0 (0.0%) |
| Total | 302 (99.0%) | 3 (1.0%) |
Income Below Poverty Among Single-Parent Households in Mount Pulaski
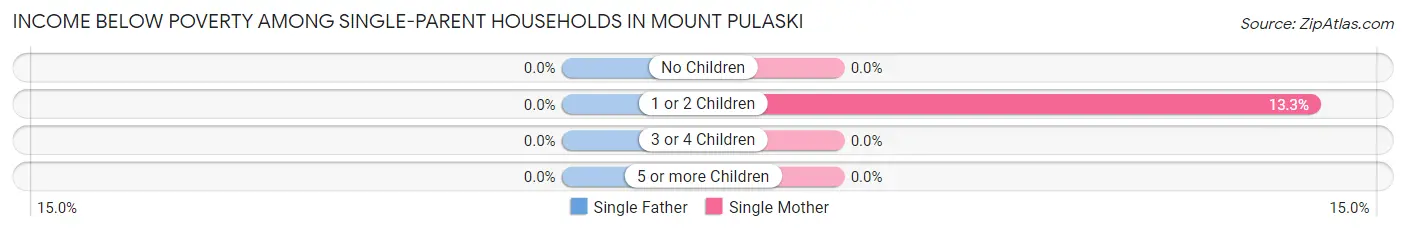
| Children | Single Father | Single Mother |
| No Children | 0 (0.0%) | 0 (0.0%) |
| 1 or 2 Children | 0 (0.0%) | 2 (13.3%) |
| 3 or 4 Children | 0 (0.0%) | 0 (0.0%) |
| 5 or more Children | 0 (0.0%) | 0 (0.0%) |
| Total | 0 (0.0%) | 2 (1.8%) |
Income Below Poverty Among Married-Couple vs Single-Parent Households in Mount Pulaski
The poverty data for Mount Pulaski shows that 3 of the married-couple family households (1.0%) and 2 of the single-parent households (1.6%) are living below the poverty level. Within the married-couple family households, those with no children have the highest poverty rate, with 3 households (1.5%) falling below the poverty line. Among the single-parent households, those with 1 or 2 children have the highest poverty rate, with 2 household (8.0%) living below poverty.
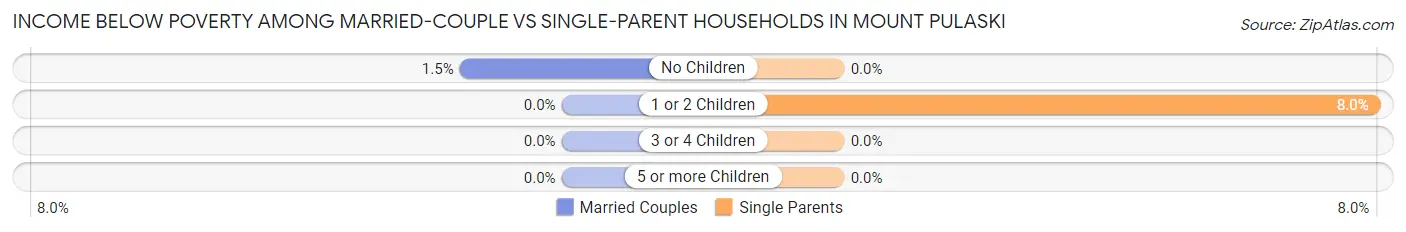
| Children | Married-Couple Families | Single-Parent Households |
| No Children | 3 (1.5%) | 0 (0.0%) |
| 1 or 2 Children | 0 (0.0%) | 2 (8.0%) |
| 3 or 4 Children | 0 (0.0%) | 0 (0.0%) |
| 5 or more Children | 0 (0.0%) | 0 (0.0%) |
| Total | 3 (1.0%) | 2 (1.6%) |
Race in Mount Pulaski
The most populous races in Mount Pulaski are White / Caucasian (1,583 | 96.8%), Hispanic or Latino (48 | 2.9%), and Two or more Races (28 | 1.7%).
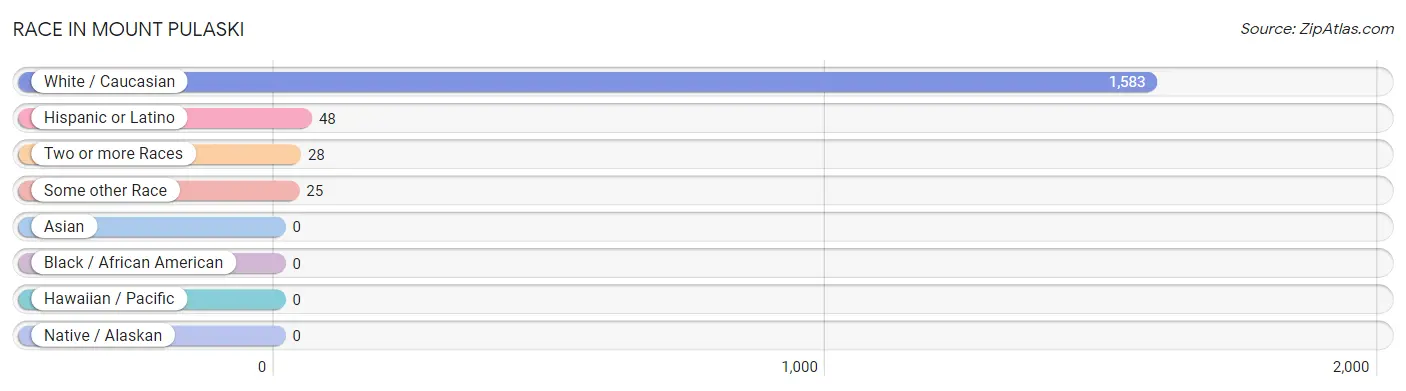
| Race | # Population | % Population |
| Asian | 0 | 0.0% |
| Black / African American | 0 | 0.0% |
| Hawaiian / Pacific | 0 | 0.0% |
| Hispanic or Latino | 48 | 2.9% |
| Native / Alaskan | 0 | 0.0% |
| White / Caucasian | 1,583 | 96.8% |
| Two or more Races | 28 | 1.7% |
| Some other Race | 25 | 1.5% |
| Total | 1,636 | 100.0% |
Ancestry in Mount Pulaski
The most populous ancestries reported in Mount Pulaski are German (715 | 43.7%), Polish (245 | 15.0%), Irish (235 | 14.4%), English (160 | 9.8%), and American (115 | 7.0%), together accounting for 89.8% of all Mount Pulaski residents.
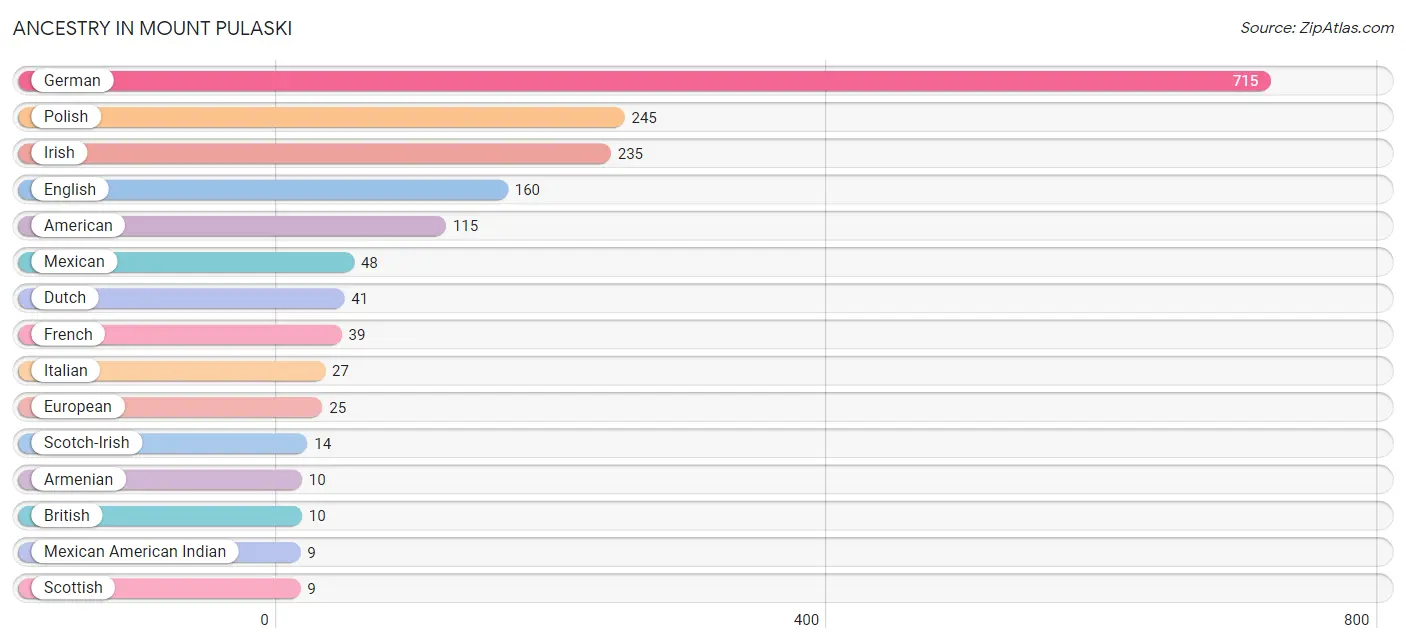
| Ancestry | # Population | % Population |
| American | 115 | 7.0% |
| Armenian | 10 | 0.6% |
| British | 10 | 0.6% |
| Canadian | 3 | 0.2% |
| Czechoslovakian | 3 | 0.2% |
| Dutch | 41 | 2.5% |
| English | 160 | 9.8% |
| European | 25 | 1.5% |
| French | 39 | 2.4% |
| French Canadian | 6 | 0.4% |
| German | 715 | 43.7% |
| Irish | 235 | 14.4% |
| Italian | 27 | 1.7% |
| Lithuanian | 2 | 0.1% |
| Mexican | 48 | 2.9% |
| Mexican American Indian | 9 | 0.5% |
| Northern European | 4 | 0.2% |
| Polish | 245 | 15.0% |
| Portuguese | 3 | 0.2% |
| Scotch-Irish | 14 | 0.9% |
| Scottish | 9 | 0.5% |
| Swedish | 5 | 0.3% |
| Swiss | 4 | 0.2% |
| Welsh | 9 | 0.5% | View All 24 Rows |
Immigrants in Mount Pulaski
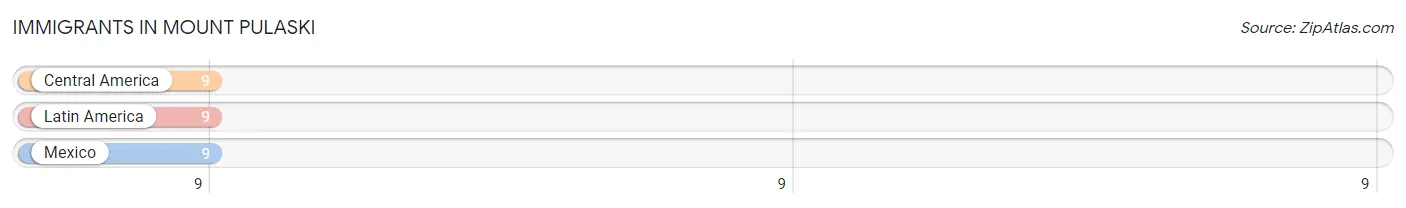
The most numerous immigrant groups reported in Mount Pulaski came from Central America (9 | 0.5%), Latin America (9 | 0.5%), and Mexico (9 | 0.5%), together accounting for 1.7% of all Mount Pulaski residents.
| Immigration Origin | # Population | % Population |
| Central America | 9 | 0.5% |
| Latin America | 9 | 0.5% |
| Mexico | 9 | 0.5% | View All 3 Rows |
Sex and Age in Mount Pulaski
Sex and Age in Mount Pulaski
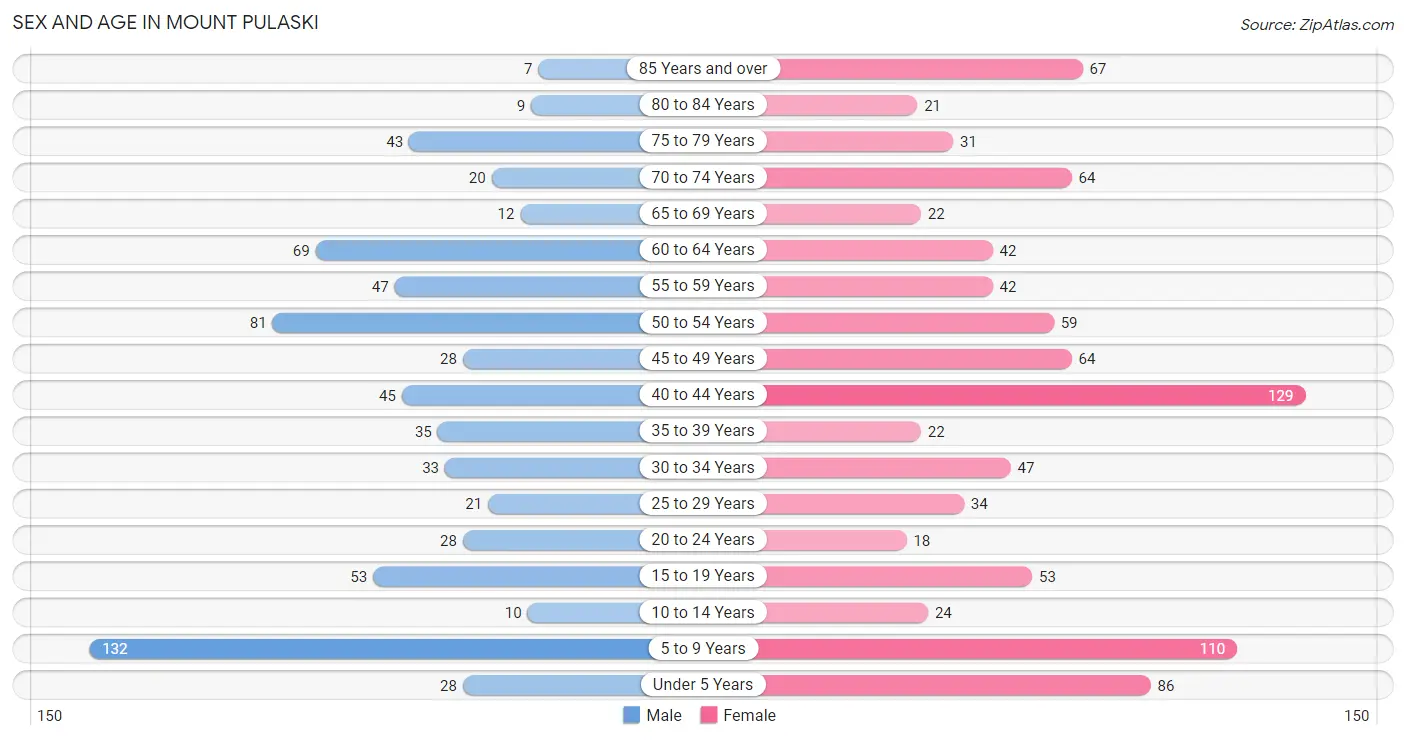
The most populous age groups in Mount Pulaski are 5 to 9 Years (132 | 18.8%) for men and 40 to 44 Years (129 | 13.8%) for women.
| Age Bracket | Male | Female |
| Under 5 Years | 28 (4.0%) | 86 (9.2%) |
| 5 to 9 Years | 132 (18.8%) | 110 (11.8%) |
| 10 to 14 Years | 10 (1.4%) | 24 (2.6%) |
| 15 to 19 Years | 53 (7.6%) | 53 (5.7%) |
| 20 to 24 Years | 28 (4.0%) | 18 (1.9%) |
| 25 to 29 Years | 21 (3.0%) | 34 (3.6%) |
| 30 to 34 Years | 33 (4.7%) | 47 (5.0%) |
| 35 to 39 Years | 35 (5.0%) | 22 (2.4%) |
| 40 to 44 Years | 45 (6.4%) | 129 (13.8%) |
| 45 to 49 Years | 28 (4.0%) | 64 (6.8%) |
| 50 to 54 Years | 81 (11.6%) | 59 (6.3%) |
| 55 to 59 Years | 47 (6.7%) | 42 (4.5%) |
| 60 to 64 Years | 69 (9.8%) | 42 (4.5%) |
| 65 to 69 Years | 12 (1.7%) | 22 (2.4%) |
| 70 to 74 Years | 20 (2.9%) | 64 (6.8%) |
| 75 to 79 Years | 43 (6.1%) | 31 (3.3%) |
| 80 to 84 Years | 9 (1.3%) | 21 (2.2%) |
| 85 Years and over | 7 (1.0%) | 67 (7.2%) |
| Total | 701 (100.0%) | 935 (100.0%) |
Families and Households in Mount Pulaski
Median Family Size in Mount Pulaski
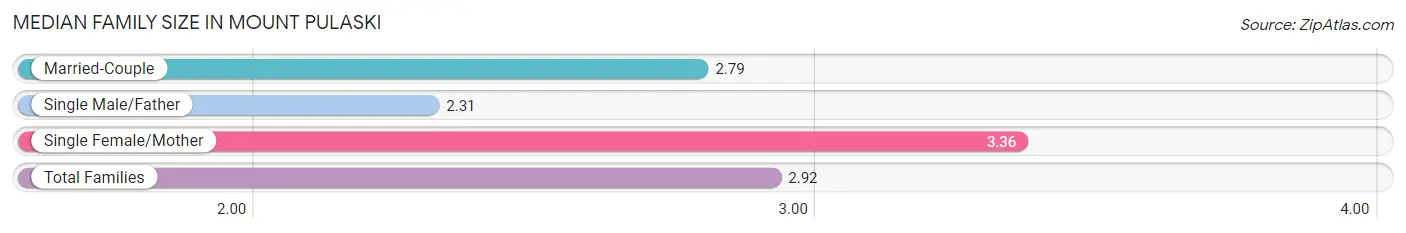
The median family size in Mount Pulaski is 2.92 persons per family, with single female/mother families (110 | 25.7%) accounting for the largest median family size of 3.36 persons per family. On the other hand, single male/father families (13 | 3.0%) represent the smallest median family size with 2.31 persons per family.
| Family Type | # Families | Family Size |
| Married-Couple | 305 (71.3%) | 2.79 |
| Single Male/Father | 13 (3.0%) | 2.31 |
| Single Female/Mother | 110 (25.7%) | 3.36 |
| Total Families | 428 (100.0%) | 2.92 |
Median Household Size in Mount Pulaski
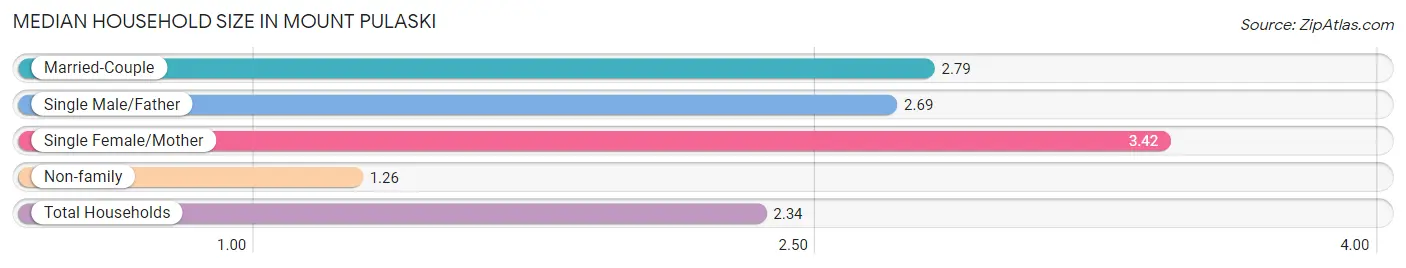
The median household size in Mount Pulaski is 2.34 persons per household, with single female/mother households (110 | 16.4%) accounting for the largest median household size of 3.42 persons per household. non-family households (243 | 36.2%) represent the smallest median household size with 1.26 persons per household.
| Household Type | # Households | Household Size |
| Married-Couple | 305 (45.5%) | 2.79 |
| Single Male/Father | 13 (1.9%) | 2.69 |
| Single Female/Mother | 110 (16.4%) | 3.42 |
| Non-family | 243 (36.2%) | 1.26 |
| Total Households | 671 (100.0%) | 2.34 |
Household Size by Marriage Status in Mount Pulaski
Out of a total of 671 households in Mount Pulaski, 428 (63.8%) are family households, while 243 (36.2%) are nonfamily households. The most numerous type of family households are 2-person households, comprising 194, and the most common type of nonfamily households are 1-person households, comprising 208.
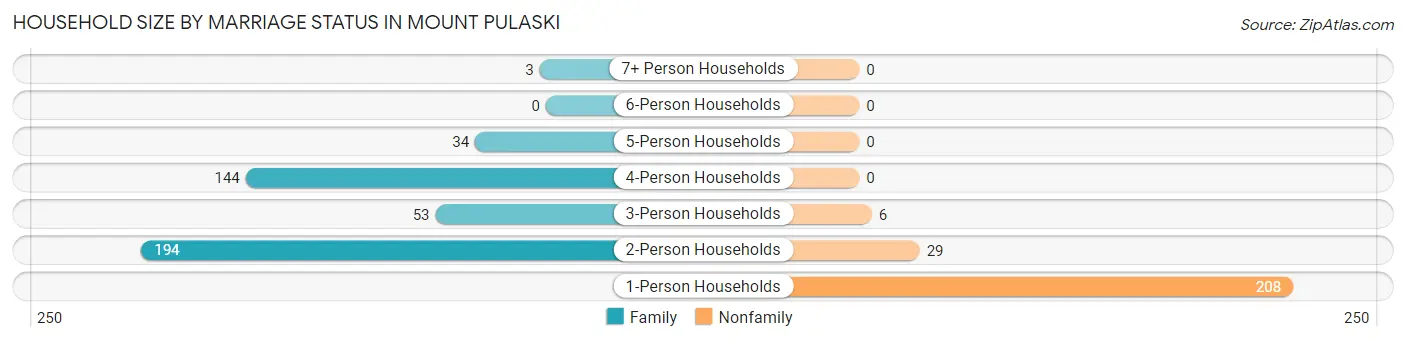
| Household Size | Family Households | Nonfamily Households |
| 1-Person Households | - | 208 (31.0%) |
| 2-Person Households | 194 (28.9%) | 29 (4.3%) |
| 3-Person Households | 53 (7.9%) | 6 (0.9%) |
| 4-Person Households | 144 (21.5%) | 0 (0.0%) |
| 5-Person Households | 34 (5.1%) | 0 (0.0%) |
| 6-Person Households | 0 (0.0%) | 0 (0.0%) |
| 7+ Person Households | 3 (0.4%) | 0 (0.0%) |
| Total | 428 (63.8%) | 243 (36.2%) |
Female Fertility in Mount Pulaski
Fertility by Age in Mount Pulaski
Average fertility rate in Mount Pulaski is 40.0 births per 1,000 women. Women in the age bracket of 20 to 34 years have the highest fertility rate with 152.0 births per 1,000 women. Women in the age bracket of 20 to 34 years acount for 100.0% of all women with births.
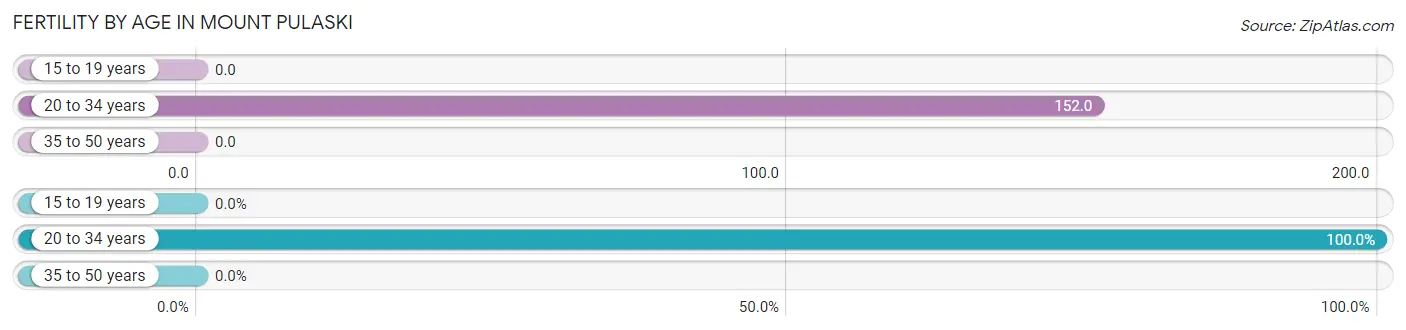
| Age Bracket | Women with Births | Births / 1,000 Women |
| 15 to 19 years | 0 (0.0%) | 0.0 |
| 20 to 34 years | 15 (100.0%) | 152.0 |
| 35 to 50 years | 0 (0.0%) | 0.0 |
| Total | 15 (100.0%) | 40.0 |
Fertility by Age by Marriage Status in Mount Pulaski
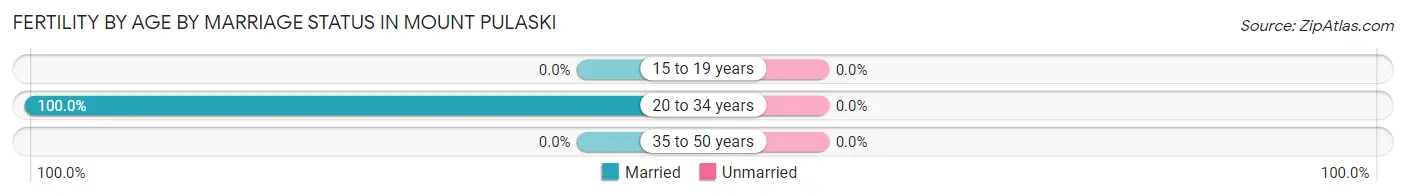
| Age Bracket | Married | Unmarried |
| 15 to 19 years | 0 (0.0%) | 0 (0.0%) |
| 20 to 34 years | 15 (100.0%) | 0 (0.0%) |
| 35 to 50 years | 0 (0.0%) | 0 (0.0%) |
| Total | 15 (100.0%) | 0 (0.0%) |
Fertility by Education in Mount Pulaski
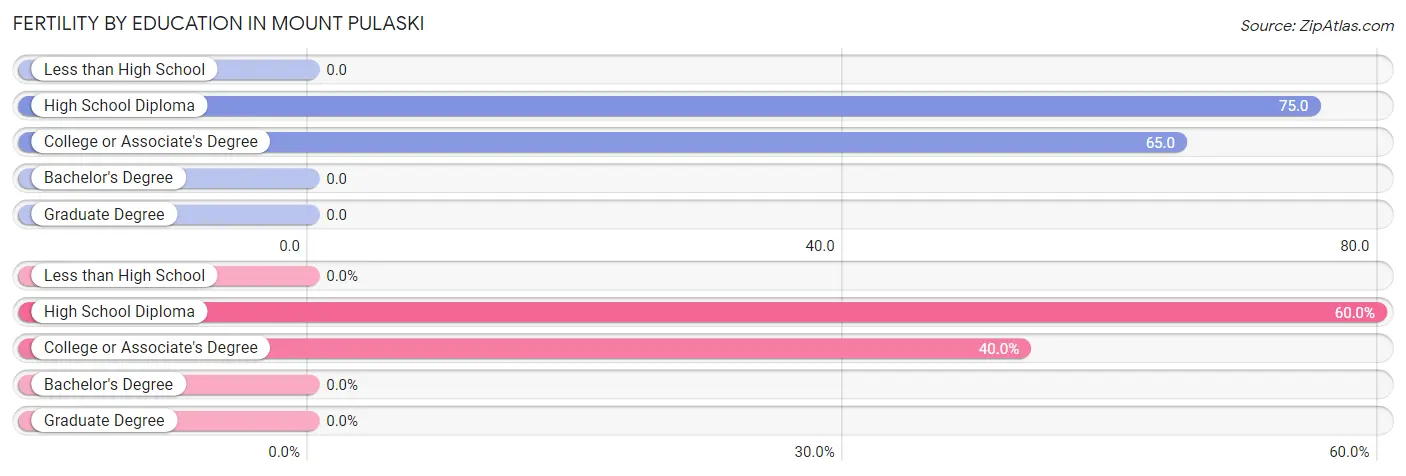
| Educational Attainment | Women with Births | Births / 1,000 Women |
| Less than High School | 0 (0.0%) | 0.0 |
| High School Diploma | 9 (60.0%) | 75.0 |
| College or Associate's Degree | 6 (40.0%) | 65.0 |
| Bachelor's Degree | 0 (0.0%) | 0.0 |
| Graduate Degree | 0 (0.0%) | 0.0 |
| Total | 15 (100.0%) | 40.0 |
Fertility by Education by Marriage Status in Mount Pulaski
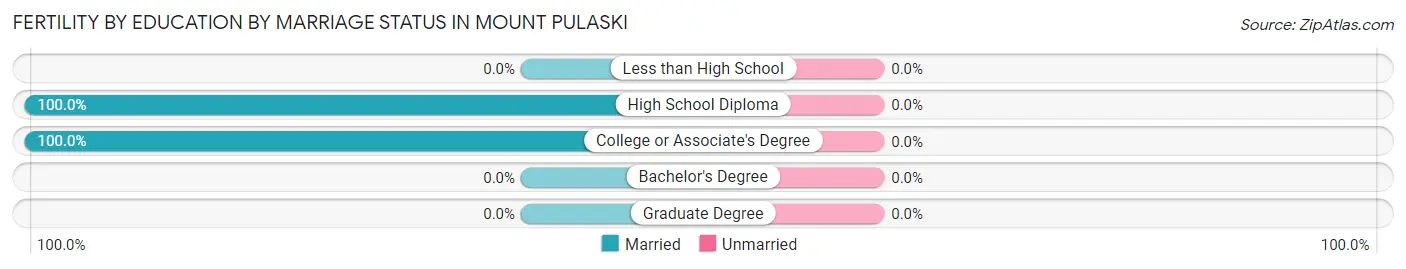
| Educational Attainment | Married | Unmarried |
| Less than High School | 0 (0.0%) | 0 (0.0%) |
| High School Diploma | 9 (100.0%) | 0 (0.0%) |
| College or Associate's Degree | 6 (100.0%) | 0 (0.0%) |
| Bachelor's Degree | 0 (0.0%) | 0 (0.0%) |
| Graduate Degree | 0 (0.0%) | 0 (0.0%) |
| Total | 15 (100.0%) | 0 (0.0%) |
Employment Characteristics in Mount Pulaski
Employment by Class of Employer in Mount Pulaski
Among the 688 employed individuals in Mount Pulaski, private company employees (429 | 62.4%), local government employees (129 | 18.8%), and not-for-profit organizations (46 | 6.7%) make up the most common classes of employment.
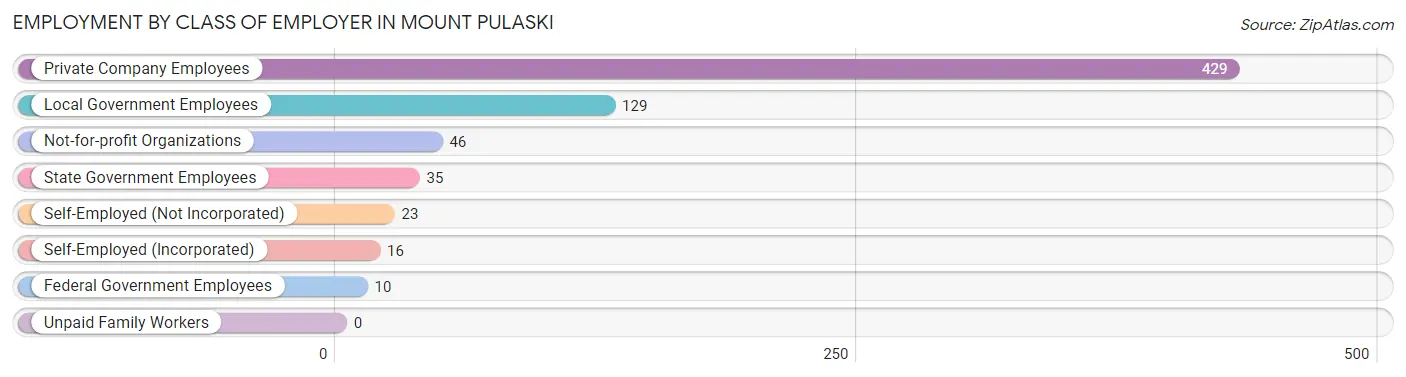
| Employer Class | # Employees | % Employees |
| Private Company Employees | 429 | 62.4% |
| Self-Employed (Incorporated) | 16 | 2.3% |
| Self-Employed (Not Incorporated) | 23 | 3.3% |
| Not-for-profit Organizations | 46 | 6.7% |
| Local Government Employees | 129 | 18.8% |
| State Government Employees | 35 | 5.1% |
| Federal Government Employees | 10 | 1.5% |
| Unpaid Family Workers | 0 | 0.0% |
| Total | 688 | 100.0% |
Employment Status by Age in Mount Pulaski
According to the labor force statistics for Mount Pulaski, out of the total population over 16 years of age (1,206), 61.0% or 736 individuals are in the labor force, with 6.5% or 48 of them unemployed. The age group with the highest labor force participation rate is 20 to 24 years, with 100.0% or 46 individuals in the labor force. Within the labor force, the 20 to 24 years age range has the highest percentage of unemployed individuals, with 21.7% or 10 of them being unemployed.
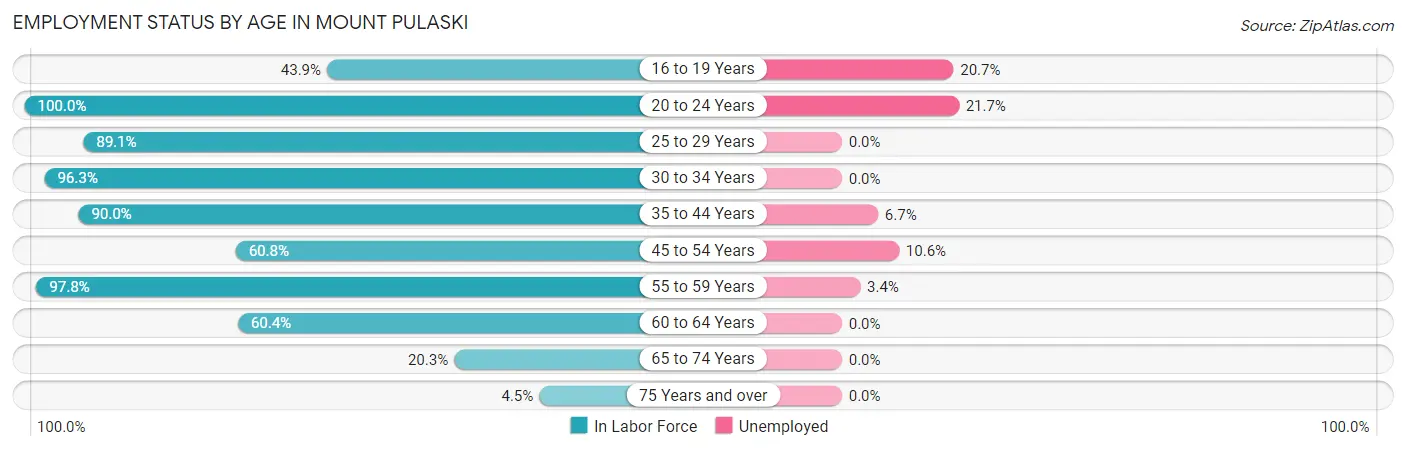
| Age Bracket | In Labor Force | Unemployed |
| 16 to 19 Years | 29 (43.9%) | 6 (20.7%) |
| 20 to 24 Years | 46 (100.0%) | 10 (21.7%) |
| 25 to 29 Years | 49 (89.1%) | 0 (0.0%) |
| 30 to 34 Years | 77 (96.3%) | 0 (0.0%) |
| 35 to 44 Years | 208 (90.0%) | 14 (6.7%) |
| 45 to 54 Years | 141 (60.8%) | 15 (10.6%) |
| 55 to 59 Years | 87 (97.8%) | 3 (3.4%) |
| 60 to 64 Years | 67 (60.4%) | 0 (0.0%) |
| 65 to 74 Years | 24 (20.3%) | 0 (0.0%) |
| 75 Years and over | 8 (4.5%) | 0 (0.0%) |
| Total | 736 (61.0%) | 48 (6.5%) |
Employment Status by Educational Attainment in Mount Pulaski
According to labor force statistics for Mount Pulaski, 78.8% of individuals (629) out of the total population between 25 and 64 years of age (798) are in the labor force, with 5.1% or 32 of them being unemployed. The group with the highest labor force participation rate are those with the educational attainment of bachelor's degree or higher, with 96.4% or 215 individuals in the labor force. Within the labor force, individuals with less than high school education have the highest percentage of unemployment, with 37.5% or 3 of them being unemployed.
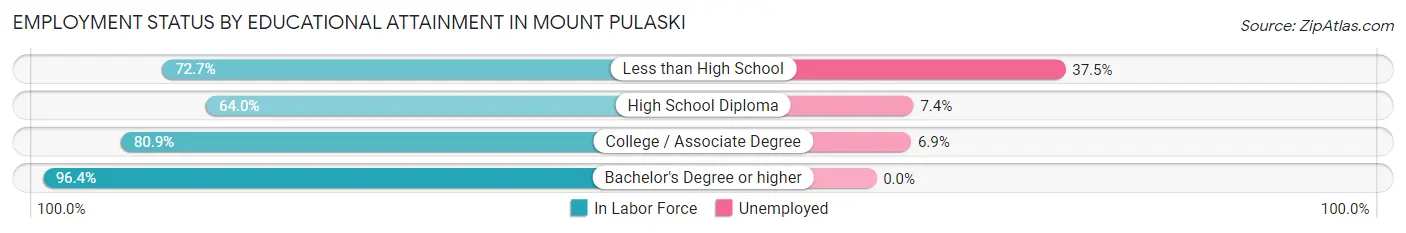
| Educational Attainment | In Labor Force | Unemployed |
| Less than High School | 8 (72.7%) | 4 (37.5%) |
| High School Diploma | 190 (64.0%) | 22 (7.4%) |
| College / Associate Degree | 216 (80.9%) | 18 (6.9%) |
| Bachelor's Degree or higher | 215 (96.4%) | 0 (0.0%) |
| Total | 629 (78.8%) | 41 (5.1%) |
Employment Occupations by Sex in Mount Pulaski
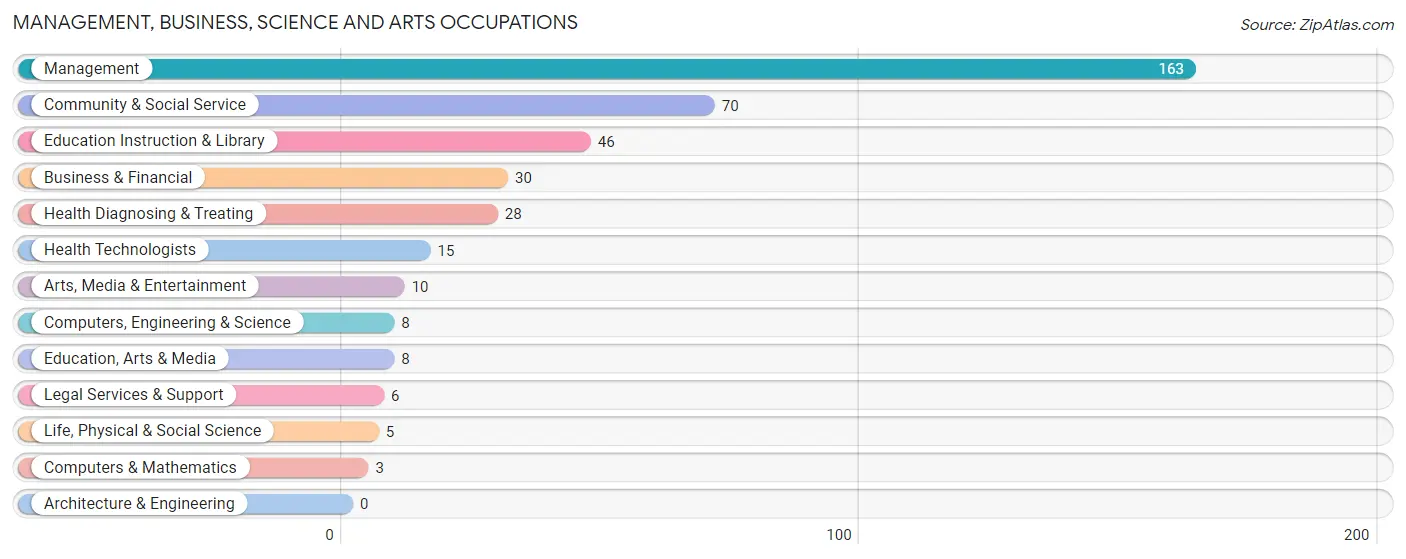
Management, Business, Science and Arts Occupations
The most common Management, Business, Science and Arts occupations in Mount Pulaski are Management (163 | 23.7%), Community & Social Service (70 | 10.2%), Education Instruction & Library (46 | 6.7%), Business & Financial (30 | 4.4%), and Health Diagnosing & Treating (28 | 4.1%).
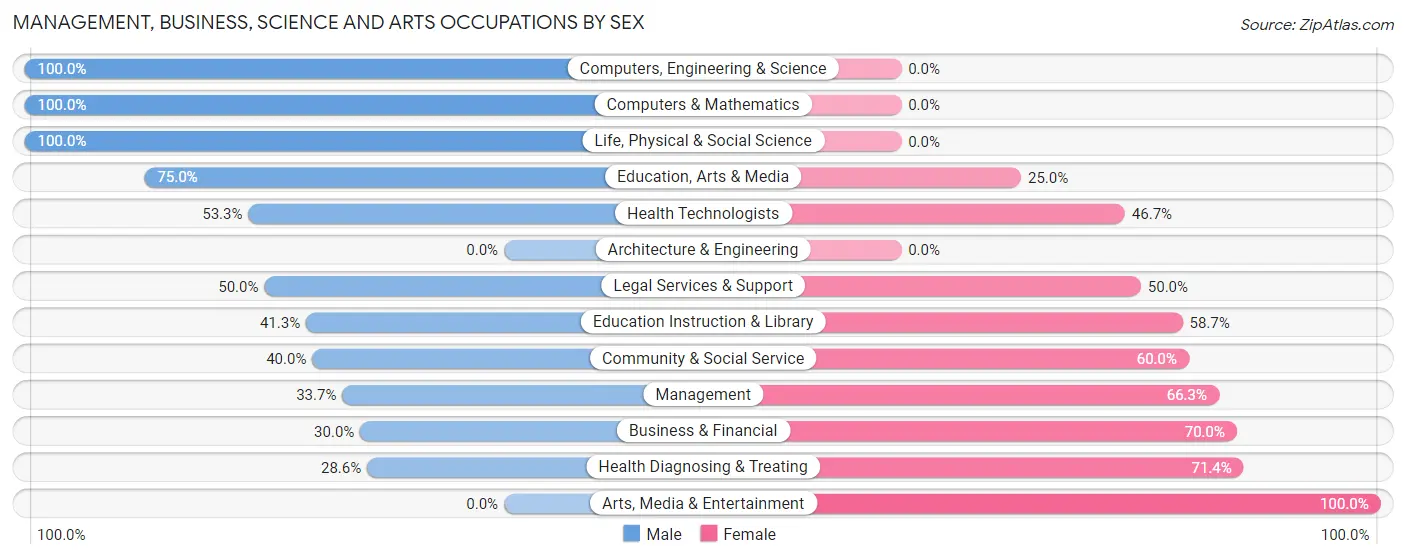
Management, Business, Science and Arts Occupations by Sex
Within the Management, Business, Science and Arts occupations in Mount Pulaski, the most male-oriented occupations are Computers, Engineering & Science (100.0%), Computers & Mathematics (100.0%), and Life, Physical & Social Science (100.0%), while the most female-oriented occupations are Arts, Media & Entertainment (100.0%), Health Diagnosing & Treating (71.4%), and Business & Financial (70.0%).
| Occupation | Male | Female |
| Management | 55 (33.7%) | 108 (66.3%) |
| Business & Financial | 9 (30.0%) | 21 (70.0%) |
| Computers, Engineering & Science | 8 (100.0%) | 0 (0.0%) |
| Computers & Mathematics | 3 (100.0%) | 0 (0.0%) |
| Architecture & Engineering | 0 (0.0%) | 0 (0.0%) |
| Life, Physical & Social Science | 5 (100.0%) | 0 (0.0%) |
| Community & Social Service | 28 (40.0%) | 42 (60.0%) |
| Education, Arts & Media | 6 (75.0%) | 2 (25.0%) |
| Legal Services & Support | 3 (50.0%) | 3 (50.0%) |
| Education Instruction & Library | 19 (41.3%) | 27 (58.7%) |
| Arts, Media & Entertainment | 0 (0.0%) | 10 (100.0%) |
| Health Diagnosing & Treating | 8 (28.6%) | 20 (71.4%) |
| Health Technologists | 8 (53.3%) | 7 (46.7%) |
| Total (Category) | 108 (36.1%) | 191 (63.9%) |
| Total (Overall) | 314 (45.6%) | 374 (54.4%) |
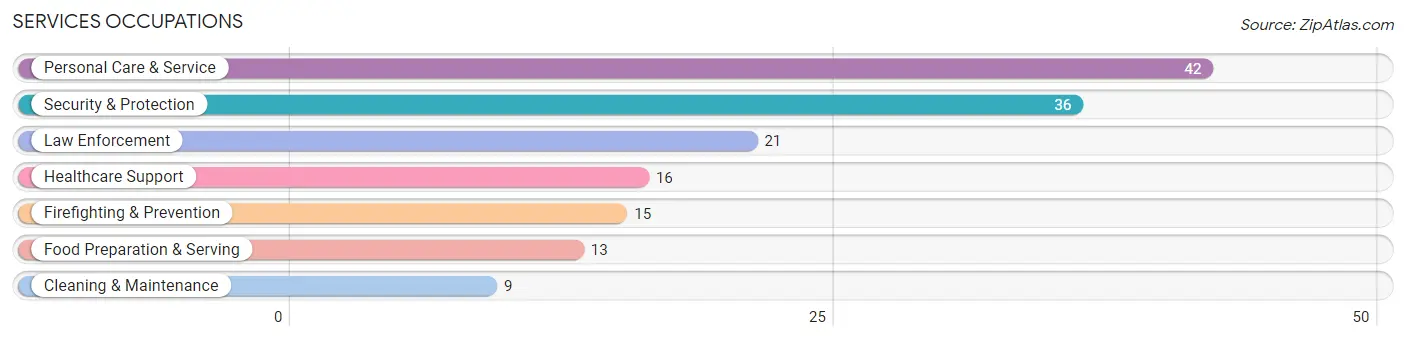
Services Occupations
The most common Services occupations in Mount Pulaski are Personal Care & Service (42 | 6.1%), Security & Protection (36 | 5.2%), Law Enforcement (21 | 3.0%), Healthcare Support (16 | 2.3%), and Firefighting & Prevention (15 | 2.2%).
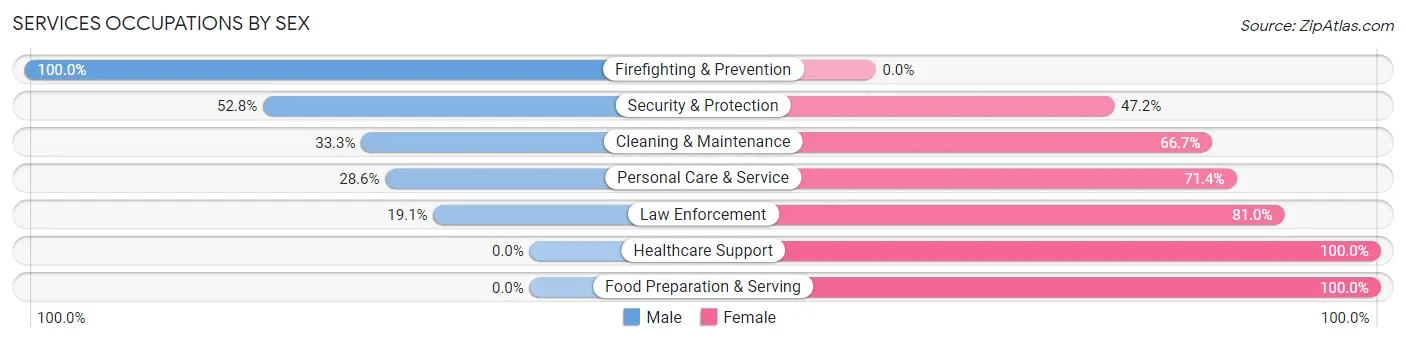
Services Occupations by Sex
Within the Services occupations in Mount Pulaski, the most male-oriented occupations are Firefighting & Prevention (100.0%), Security & Protection (52.8%), and Cleaning & Maintenance (33.3%), while the most female-oriented occupations are Healthcare Support (100.0%), Food Preparation & Serving (100.0%), and Law Enforcement (80.9%).
| Occupation | Male | Female |
| Healthcare Support | 0 (0.0%) | 16 (100.0%) |
| Security & Protection | 19 (52.8%) | 17 (47.2%) |
| Firefighting & Prevention | 15 (100.0%) | 0 (0.0%) |
| Law Enforcement | 4 (19.1%) | 17 (80.9%) |
| Food Preparation & Serving | 0 (0.0%) | 13 (100.0%) |
| Cleaning & Maintenance | 3 (33.3%) | 6 (66.7%) |
| Personal Care & Service | 12 (28.6%) | 30 (71.4%) |
| Total (Category) | 34 (29.3%) | 82 (70.7%) |
| Total (Overall) | 314 (45.6%) | 374 (54.4%) |
Sales and Office Occupations
The most common Sales and Office occupations in Mount Pulaski are Office & Administration (78 | 11.3%), and Sales & Related (16 | 2.3%).
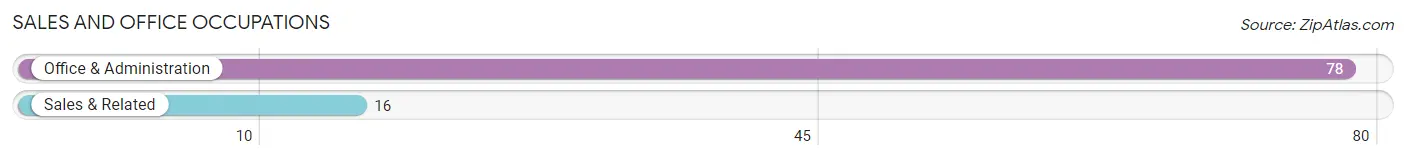
Sales and Office Occupations by Sex
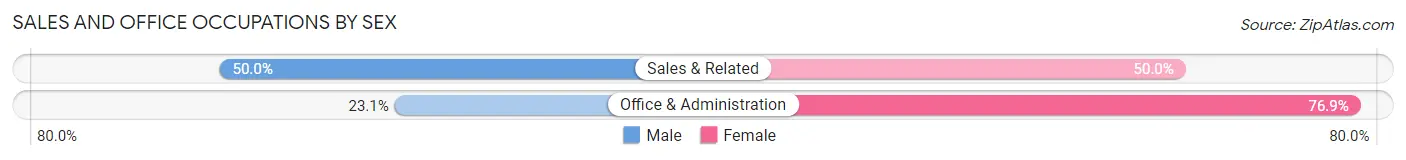
| Occupation | Male | Female |
| Sales & Related | 8 (50.0%) | 8 (50.0%) |
| Office & Administration | 18 (23.1%) | 60 (76.9%) |
| Total (Category) | 26 (27.7%) | 68 (72.3%) |
| Total (Overall) | 314 (45.6%) | 374 (54.4%) |
Natural Resources, Construction and Maintenance Occupations
The most common Natural Resources, Construction and Maintenance occupations in Mount Pulaski are Installation, Maintenance & Repair (21 | 3.0%), Construction & Extraction (13 | 1.9%), and Farming, Fishing & Forestry (8 | 1.2%).
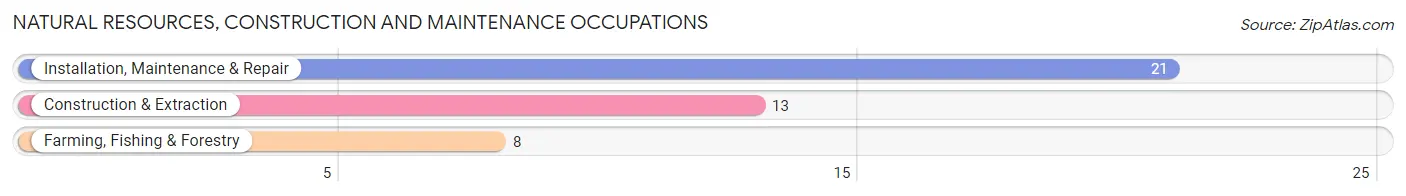
Natural Resources, Construction and Maintenance Occupations by Sex
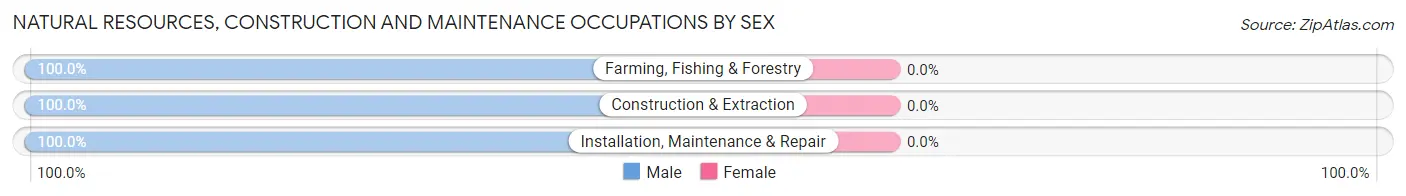
| Occupation | Male | Female |
| Farming, Fishing & Forestry | 8 (100.0%) | 0 (0.0%) |
| Construction & Extraction | 13 (100.0%) | 0 (0.0%) |
| Installation, Maintenance & Repair | 21 (100.0%) | 0 (0.0%) |
| Total (Category) | 42 (100.0%) | 0 (0.0%) |
| Total (Overall) | 314 (45.6%) | 374 (54.4%) |
Production, Transportation and Moving Occupations
The most common Production, Transportation and Moving occupations in Mount Pulaski are Production (79 | 11.5%), Transportation (39 | 5.7%), and Material Moving (19 | 2.8%).
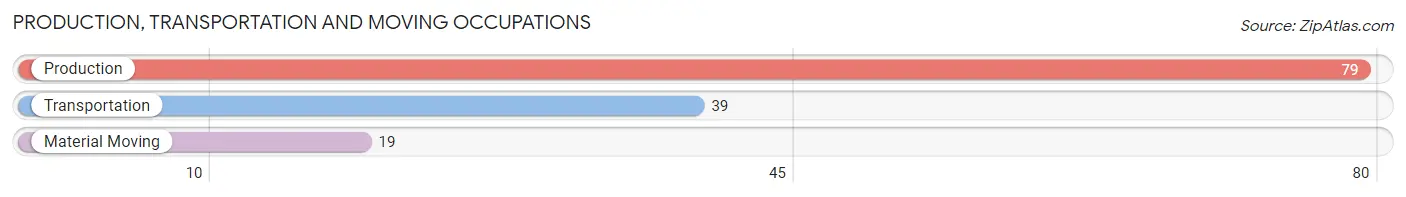
Production, Transportation and Moving Occupations by Sex
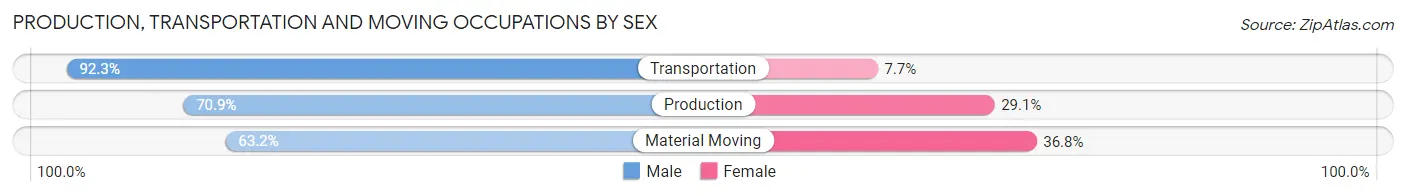
| Occupation | Male | Female |
| Production | 56 (70.9%) | 23 (29.1%) |
| Transportation | 36 (92.3%) | 3 (7.7%) |
| Material Moving | 12 (63.2%) | 7 (36.8%) |
| Total (Category) | 104 (75.9%) | 33 (24.1%) |
| Total (Overall) | 314 (45.6%) | 374 (54.4%) |
Employment Industries by Sex in Mount Pulaski
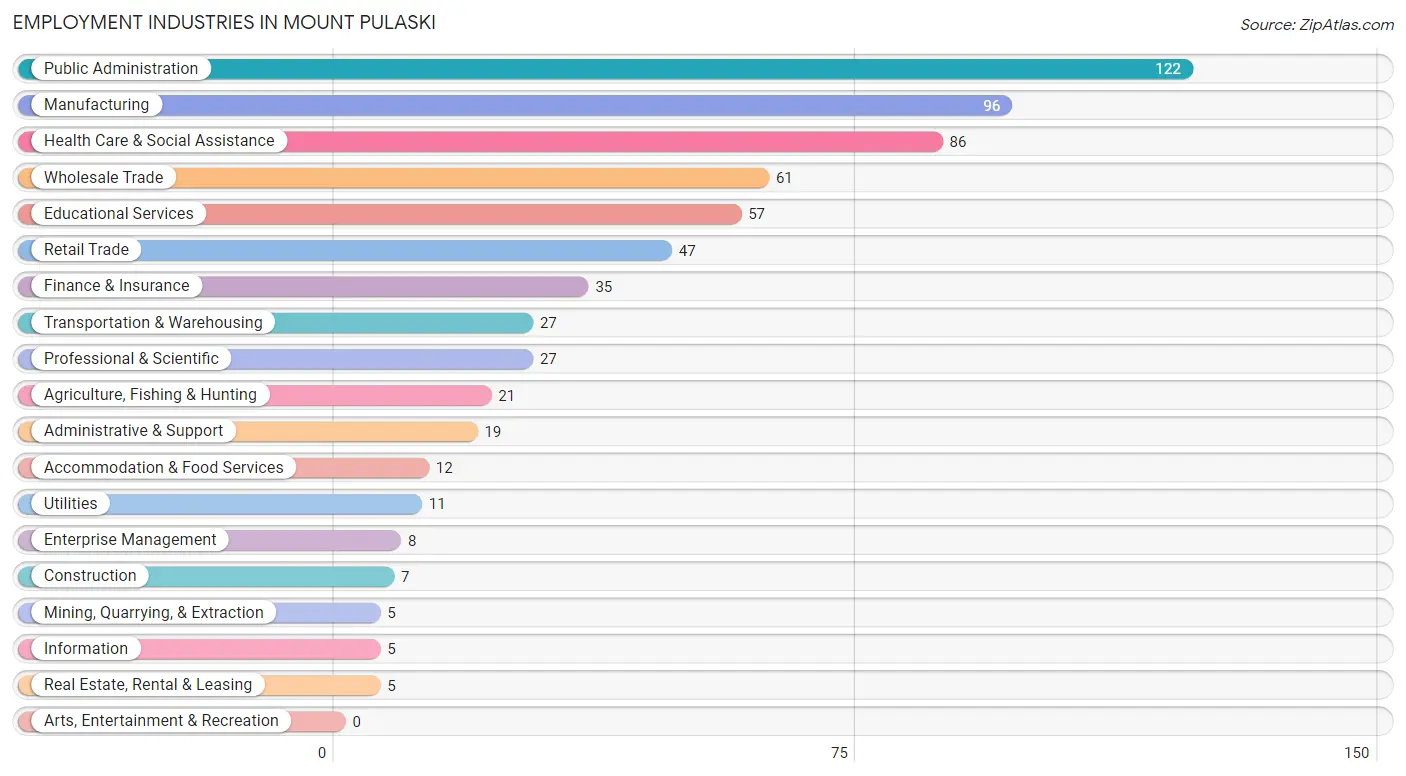
Employment Industries in Mount Pulaski
The major employment industries in Mount Pulaski include Public Administration (122 | 17.7%), Manufacturing (96 | 14.0%), Health Care & Social Assistance (86 | 12.5%), Wholesale Trade (61 | 8.9%), and Educational Services (57 | 8.3%).
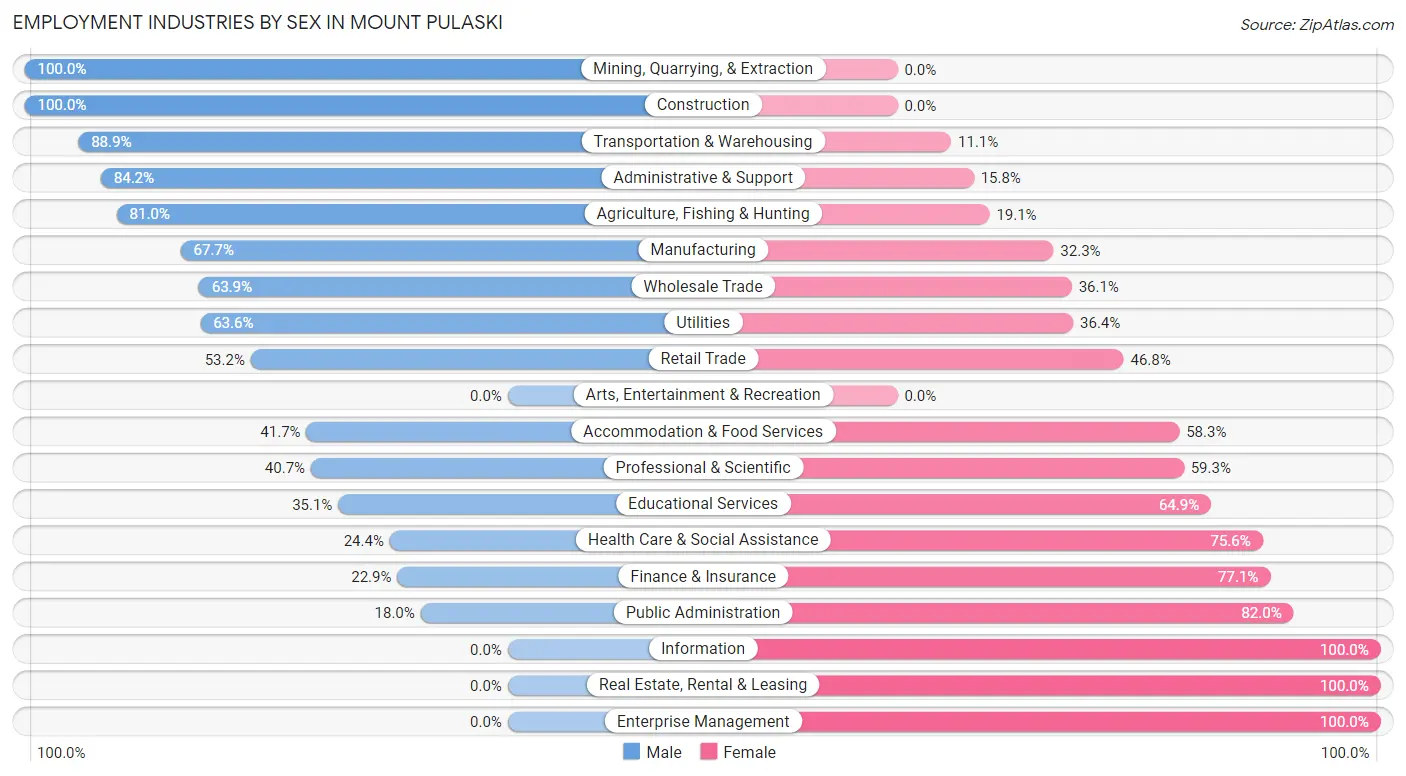
Employment Industries by Sex in Mount Pulaski
The Mount Pulaski industries that see more men than women are Mining, Quarrying, & Extraction (100.0%), Construction (100.0%), and Transportation & Warehousing (88.9%), whereas the industries that tend to have a higher number of women are Information (100.0%), Real Estate, Rental & Leasing (100.0%), and Enterprise Management (100.0%).
| Industry | Male | Female |
| Agriculture, Fishing & Hunting | 17 (80.9%) | 4 (19.1%) |
| Mining, Quarrying, & Extraction | 5 (100.0%) | 0 (0.0%) |
| Construction | 7 (100.0%) | 0 (0.0%) |
| Manufacturing | 65 (67.7%) | 31 (32.3%) |
| Wholesale Trade | 39 (63.9%) | 22 (36.1%) |
| Retail Trade | 25 (53.2%) | 22 (46.8%) |
| Transportation & Warehousing | 24 (88.9%) | 3 (11.1%) |
| Utilities | 7 (63.6%) | 4 (36.4%) |
| Information | 0 (0.0%) | 5 (100.0%) |
| Finance & Insurance | 8 (22.9%) | 27 (77.1%) |
| Real Estate, Rental & Leasing | 0 (0.0%) | 5 (100.0%) |
| Professional & Scientific | 11 (40.7%) | 16 (59.3%) |
| Enterprise Management | 0 (0.0%) | 8 (100.0%) |
| Administrative & Support | 16 (84.2%) | 3 (15.8%) |
| Educational Services | 20 (35.1%) | 37 (64.9%) |
| Health Care & Social Assistance | 21 (24.4%) | 65 (75.6%) |
| Arts, Entertainment & Recreation | 0 (0.0%) | 0 (0.0%) |
| Accommodation & Food Services | 5 (41.7%) | 7 (58.3%) |
| Public Administration | 22 (18.0%) | 100 (82.0%) |
| Total | 314 (45.6%) | 374 (54.4%) |
Education in Mount Pulaski
School Enrollment in Mount Pulaski
The most common levels of schooling among the 399 students in Mount Pulaski are elementary school (198 | 49.6%), high school (77 | 19.3%), and middle school (41 | 10.3%).
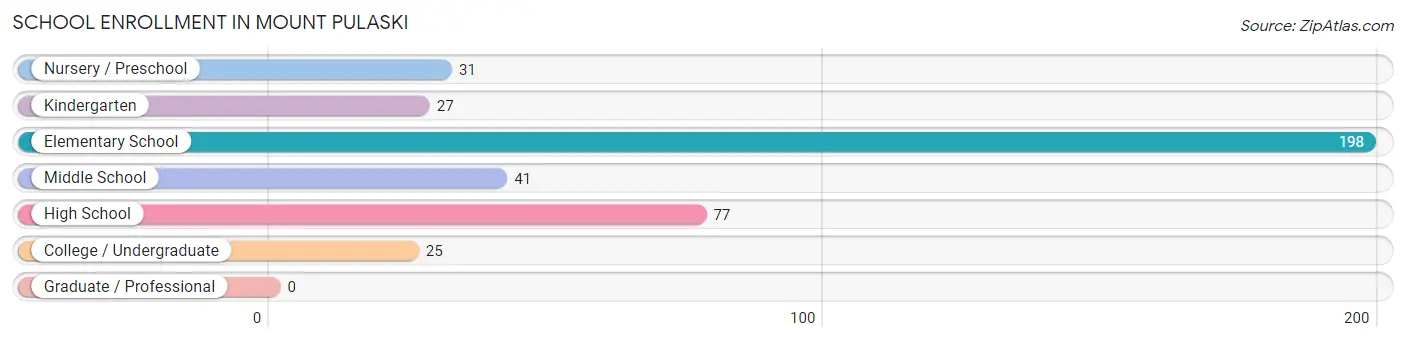
| School Level | # Students | % Students |
| Nursery / Preschool | 31 | 7.8% |
| Kindergarten | 27 | 6.8% |
| Elementary School | 198 | 49.6% |
| Middle School | 41 | 10.3% |
| High School | 77 | 19.3% |
| College / Undergraduate | 25 | 6.3% |
| Graduate / Professional | 0 | 0.0% |
| Total | 399 | 100.0% |
School Enrollment by Age by Funding Source in Mount Pulaski
Out of a total of 399 students who are enrolled in schools in Mount Pulaski, 48 (12.0%) attend a private institution, while the remaining 351 (88.0%) are enrolled in public schools. The age group of 3 to 4 year olds has the highest likelihood of being enrolled in private schools, with 14 (66.7% in the age bracket) enrolled. Conversely, the age group of 15 to 17 year olds has the lowest likelihood of being enrolled in a private school, with 59 (100.0% in the age bracket) attending a public institution.
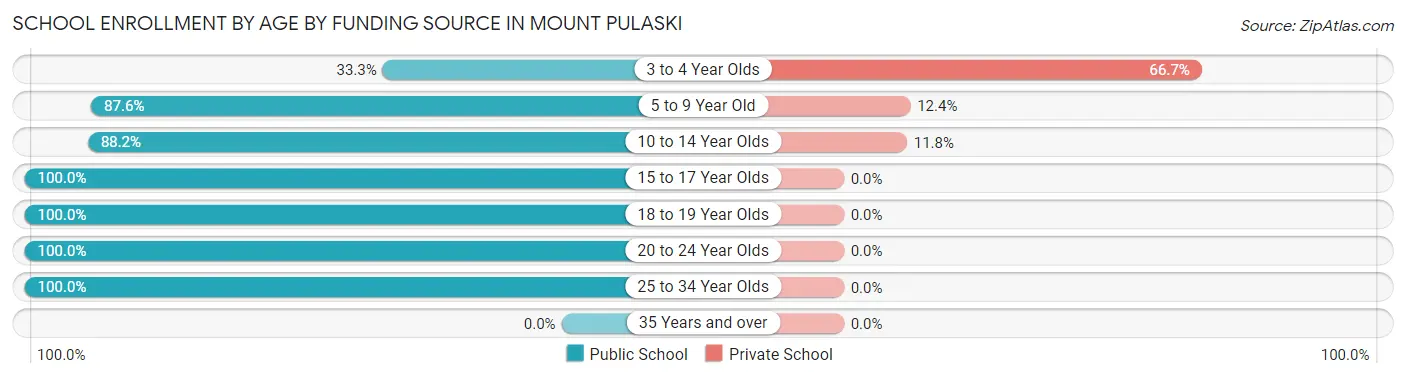
| Age Bracket | Public School | Private School |
| 3 to 4 Year Olds | 7 (33.3%) | 14 (66.7%) |
| 5 to 9 Year Old | 212 (87.6%) | 30 (12.4%) |
| 10 to 14 Year Olds | 30 (88.2%) | 4 (11.8%) |
| 15 to 17 Year Olds | 59 (100.0%) | 0 (0.0%) |
| 18 to 19 Year Olds | 34 (100.0%) | 0 (0.0%) |
| 20 to 24 Year Olds | 6 (100.0%) | 0 (0.0%) |
| 25 to 34 Year Olds | 3 (100.0%) | 0 (0.0%) |
| 35 Years and over | 0 (0.0%) | 0 (0.0%) |
| Total | 351 (88.0%) | 48 (12.0%) |
Educational Attainment by Field of Study in Mount Pulaski
Science & technology (89 | 29.9%), education (54 | 18.1%), business (45 | 15.1%), literature & languages (22 | 7.4%), and liberal arts & history (22 | 7.4%) are the most common fields of study among 298 individuals in Mount Pulaski who have obtained a bachelor's degree or higher.
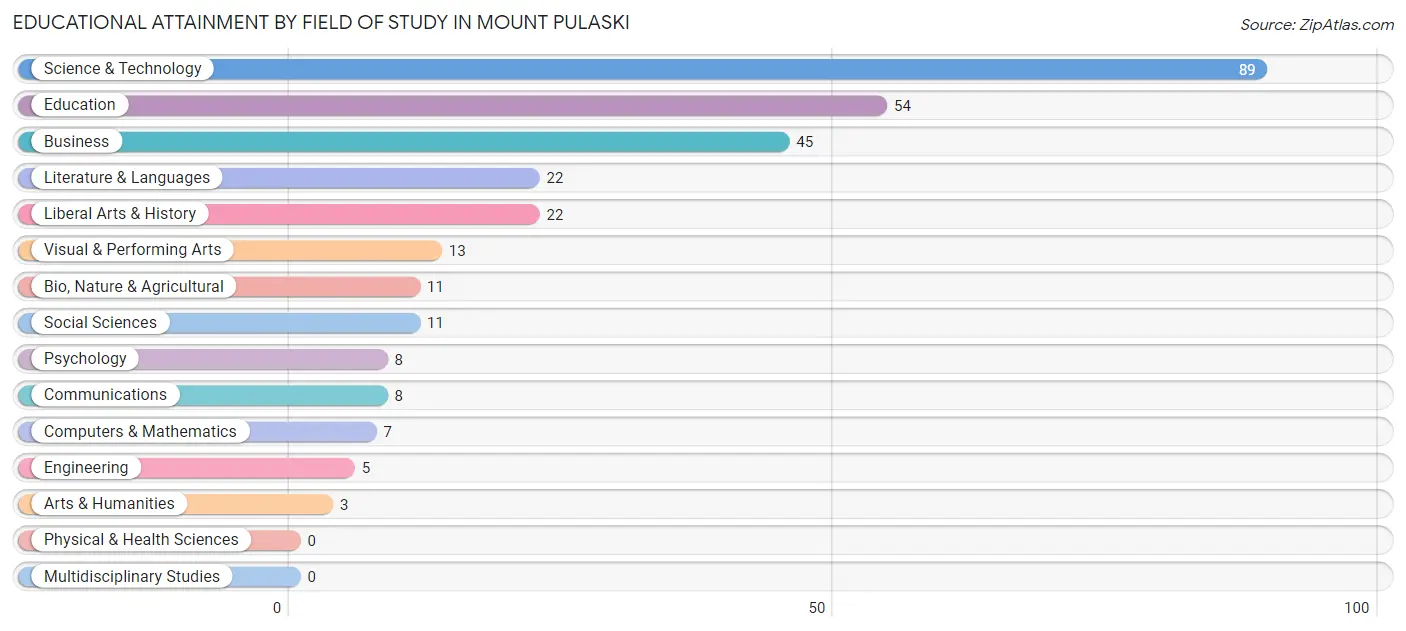
| Field of Study | # Graduates | % Graduates |
| Computers & Mathematics | 7 | 2.4% |
| Bio, Nature & Agricultural | 11 | 3.7% |
| Physical & Health Sciences | 0 | 0.0% |
| Psychology | 8 | 2.7% |
| Social Sciences | 11 | 3.7% |
| Engineering | 5 | 1.7% |
| Multidisciplinary Studies | 0 | 0.0% |
| Science & Technology | 89 | 29.9% |
| Business | 45 | 15.1% |
| Education | 54 | 18.1% |
| Literature & Languages | 22 | 7.4% |
| Liberal Arts & History | 22 | 7.4% |
| Visual & Performing Arts | 13 | 4.4% |
| Communications | 8 | 2.7% |
| Arts & Humanities | 3 | 1.0% |
| Total | 298 | 100.0% |
Transportation & Commute in Mount Pulaski
Vehicle Availability by Sex in Mount Pulaski
The most prevalent vehicle ownership categories in Mount Pulaski are males with 2 vehicles (127, accounting for 40.5%) and females with 2 vehicles (140, making up 34.0%).
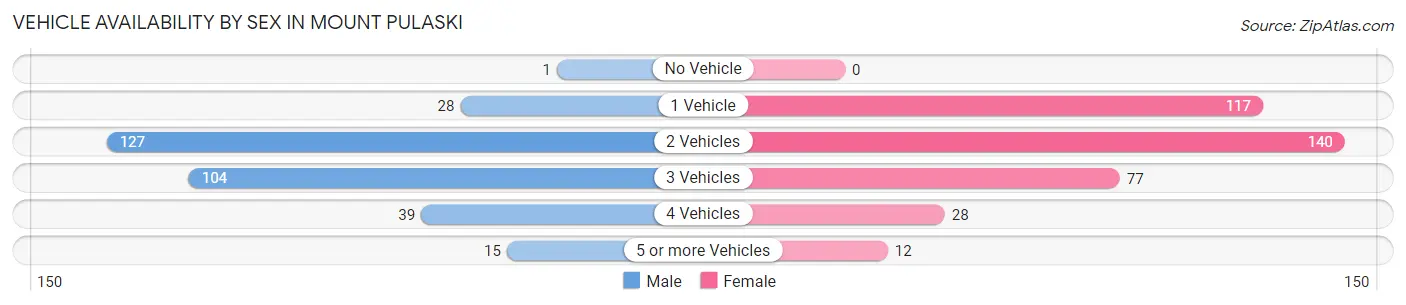
| Vehicles Available | Male | Female |
| No Vehicle | 1 (0.3%) | 0 (0.0%) |
| 1 Vehicle | 28 (8.9%) | 117 (31.3%) |
| 2 Vehicles | 127 (40.5%) | 140 (37.4%) |
| 3 Vehicles | 104 (33.1%) | 77 (20.6%) |
| 4 Vehicles | 39 (12.4%) | 28 (7.5%) |
| 5 or more Vehicles | 15 (4.8%) | 12 (3.2%) |
| Total | 314 (100.0%) | 374 (100.0%) |
Commute Time in Mount Pulaski
The most frequently occuring commute durations in Mount Pulaski are 15 to 19 minutes (125 commuters, 19.7%), 20 to 24 minutes (69 commuters, 10.9%), and less than 5 minutes (68 commuters, 10.7%).
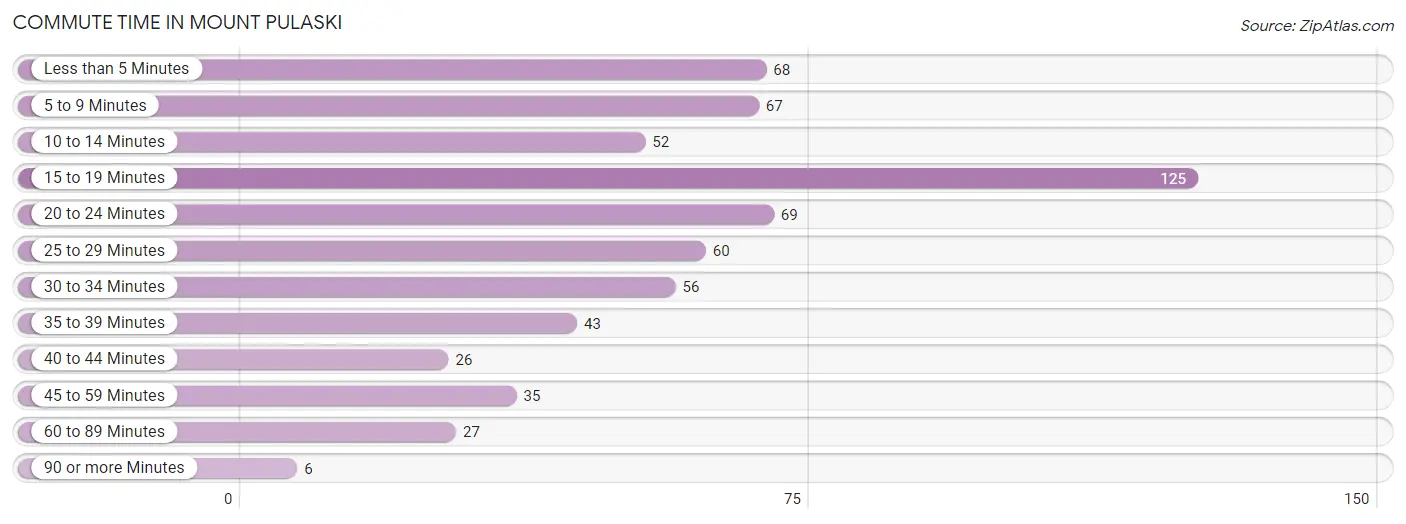
| Commute Time | # Commuters | % Commuters |
| Less than 5 Minutes | 68 | 10.7% |
| 5 to 9 Minutes | 67 | 10.6% |
| 10 to 14 Minutes | 52 | 8.2% |
| 15 to 19 Minutes | 125 | 19.7% |
| 20 to 24 Minutes | 69 | 10.9% |
| 25 to 29 Minutes | 60 | 9.5% |
| 30 to 34 Minutes | 56 | 8.8% |
| 35 to 39 Minutes | 43 | 6.8% |
| 40 to 44 Minutes | 26 | 4.1% |
| 45 to 59 Minutes | 35 | 5.5% |
| 60 to 89 Minutes | 27 | 4.3% |
| 90 or more Minutes | 6 | 0.9% |
Commute Time by Sex in Mount Pulaski
The most common commute times in Mount Pulaski are less than 5 minutes (41 commuters, 13.7%) for males and 15 to 19 minutes (95 commuters, 28.4%) for females.
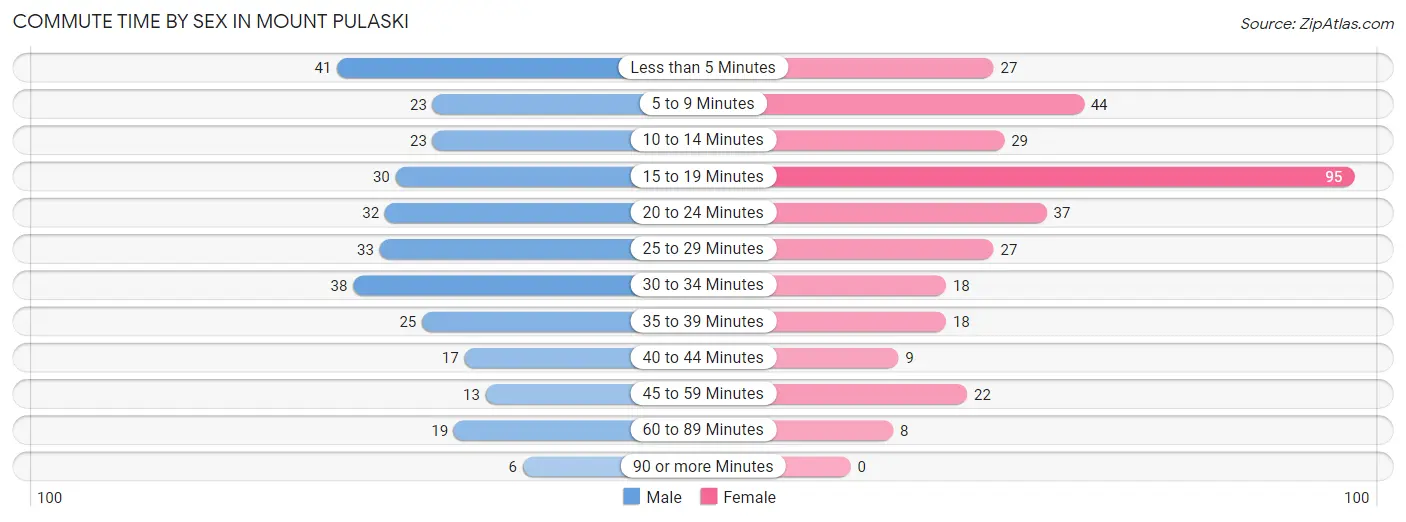
| Commute Time | Male | Female |
| Less than 5 Minutes | 41 (13.7%) | 27 (8.1%) |
| 5 to 9 Minutes | 23 (7.7%) | 44 (13.2%) |
| 10 to 14 Minutes | 23 (7.7%) | 29 (8.7%) |
| 15 to 19 Minutes | 30 (10.0%) | 95 (28.4%) |
| 20 to 24 Minutes | 32 (10.7%) | 37 (11.1%) |
| 25 to 29 Minutes | 33 (11.0%) | 27 (8.1%) |
| 30 to 34 Minutes | 38 (12.7%) | 18 (5.4%) |
| 35 to 39 Minutes | 25 (8.3%) | 18 (5.4%) |
| 40 to 44 Minutes | 17 (5.7%) | 9 (2.7%) |
| 45 to 59 Minutes | 13 (4.3%) | 22 (6.6%) |
| 60 to 89 Minutes | 19 (6.3%) | 8 (2.4%) |
| 90 or more Minutes | 6 (2.0%) | 0 (0.0%) |
Time of Departure to Work by Sex in Mount Pulaski
The most frequent times of departure to work in Mount Pulaski are 6:00 AM to 6:29 AM (58, 19.3%) for males and 7:30 AM to 7:59 AM (166, 49.7%) for females.
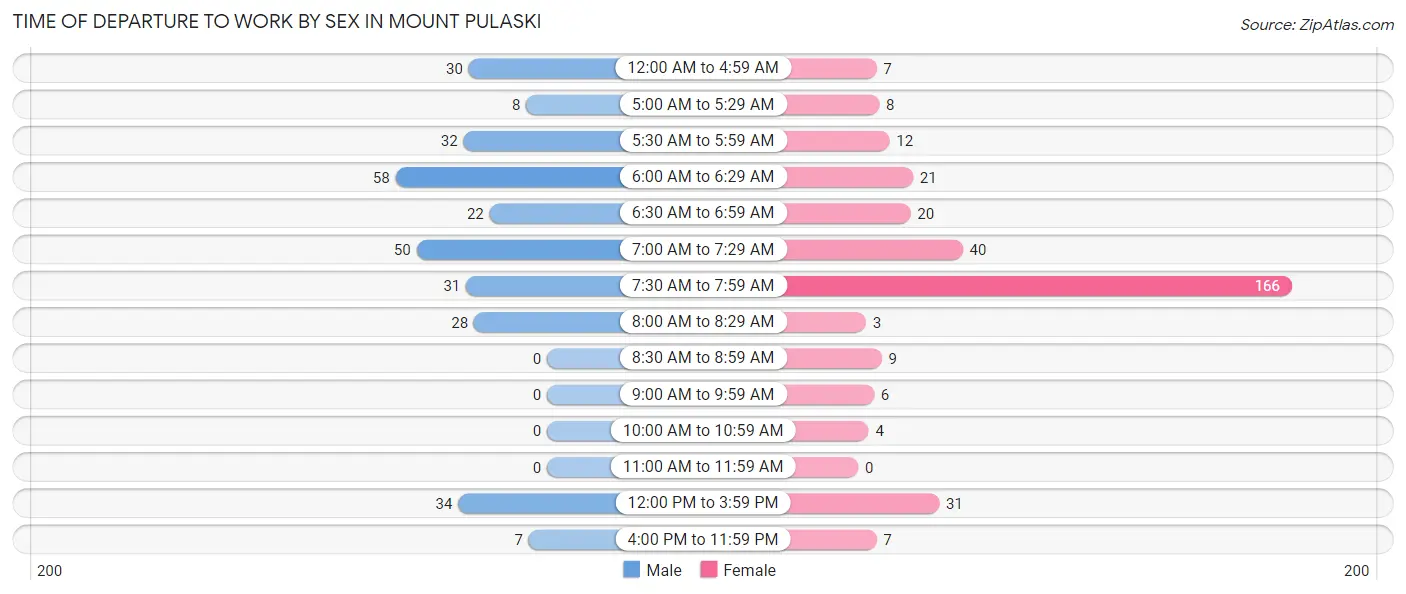
| Time of Departure | Male | Female |
| 12:00 AM to 4:59 AM | 30 (10.0%) | 7 (2.1%) |
| 5:00 AM to 5:29 AM | 8 (2.7%) | 8 (2.4%) |
| 5:30 AM to 5:59 AM | 32 (10.7%) | 12 (3.6%) |
| 6:00 AM to 6:29 AM | 58 (19.3%) | 21 (6.3%) |
| 6:30 AM to 6:59 AM | 22 (7.3%) | 20 (6.0%) |
| 7:00 AM to 7:29 AM | 50 (16.7%) | 40 (12.0%) |
| 7:30 AM to 7:59 AM | 31 (10.3%) | 166 (49.7%) |
| 8:00 AM to 8:29 AM | 28 (9.3%) | 3 (0.9%) |
| 8:30 AM to 8:59 AM | 0 (0.0%) | 9 (2.7%) |
| 9:00 AM to 9:59 AM | 0 (0.0%) | 6 (1.8%) |
| 10:00 AM to 10:59 AM | 0 (0.0%) | 4 (1.2%) |
| 11:00 AM to 11:59 AM | 0 (0.0%) | 0 (0.0%) |
| 12:00 PM to 3:59 PM | 34 (11.3%) | 31 (9.3%) |
| 4:00 PM to 11:59 PM | 7 (2.3%) | 7 (2.1%) |
| Total | 300 (100.0%) | 334 (100.0%) |
Housing Occupancy in Mount Pulaski
Occupancy by Ownership in Mount Pulaski
Of the total 671 dwellings in Mount Pulaski, owner-occupied units account for 568 (84.7%), while renter-occupied units make up 103 (15.3%).
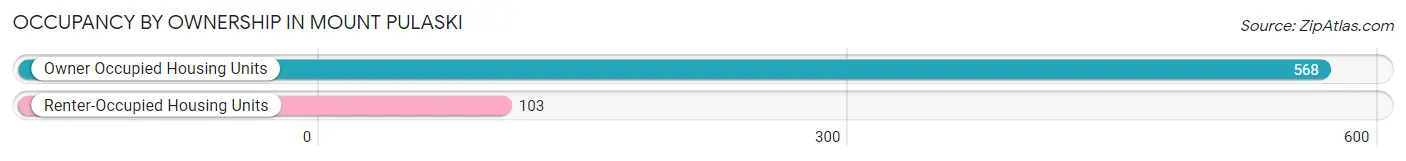
| Occupancy | # Housing Units | % Housing Units |
| Owner Occupied Housing Units | 568 | 84.7% |
| Renter-Occupied Housing Units | 103 | 15.3% |
| Total Occupied Housing Units | 671 | 100.0% |
Occupancy by Household Size in Mount Pulaski
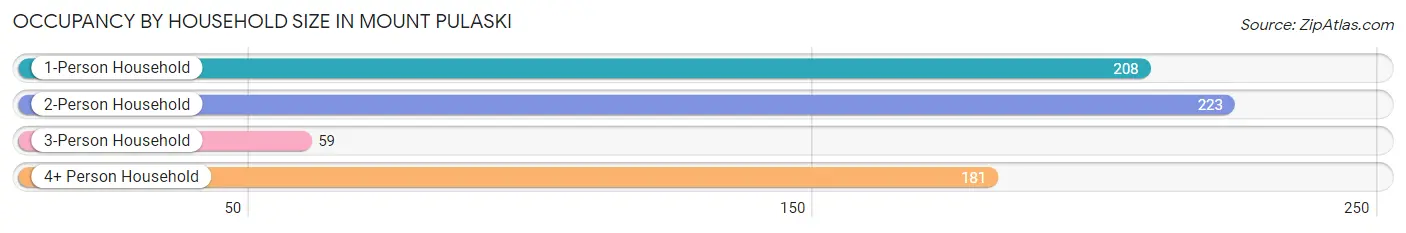
| Household Size | # Housing Units | % Housing Units |
| 1-Person Household | 208 | 31.0% |
| 2-Person Household | 223 | 33.2% |
| 3-Person Household | 59 | 8.8% |
| 4+ Person Household | 181 | 27.0% |
| Total Housing Units | 671 | 100.0% |
Occupancy by Ownership by Household Size in Mount Pulaski
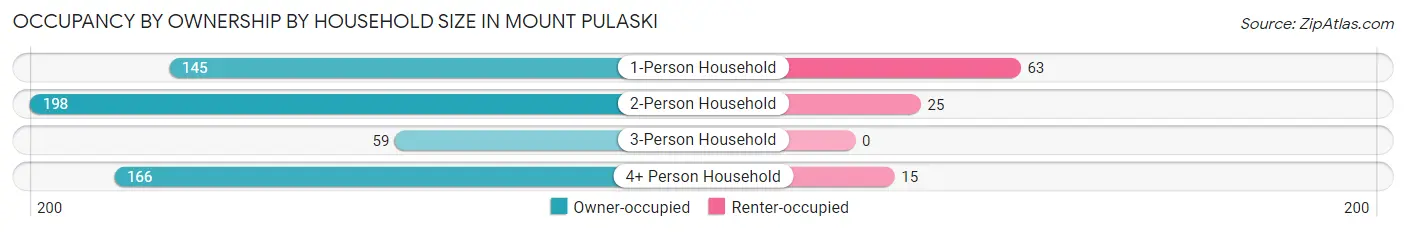
| Household Size | Owner-occupied | Renter-occupied |
| 1-Person Household | 145 (69.7%) | 63 (30.3%) |
| 2-Person Household | 198 (88.8%) | 25 (11.2%) |
| 3-Person Household | 59 (100.0%) | 0 (0.0%) |
| 4+ Person Household | 166 (91.7%) | 15 (8.3%) |
| Total Housing Units | 568 (84.7%) | 103 (15.3%) |
Occupancy by Educational Attainment in Mount Pulaski
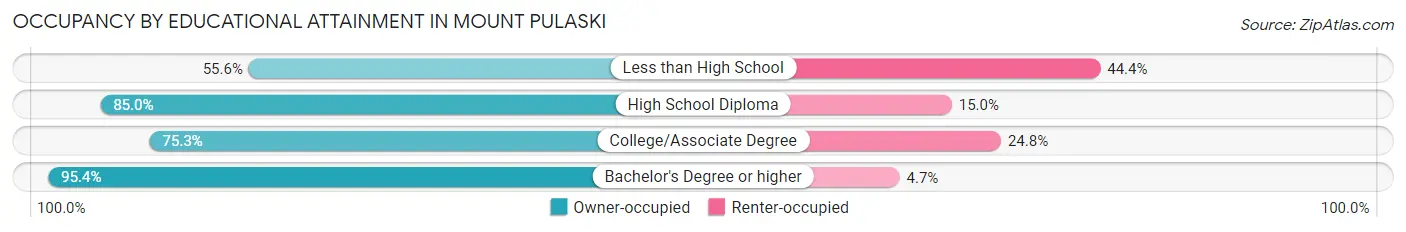
| Household Size | Owner-occupied | Renter-occupied |
| Less than High School | 10 (55.6%) | 8 (44.4%) |
| High School Diploma | 204 (85.0%) | 36 (15.0%) |
| College/Associate Degree | 149 (75.2%) | 49 (24.7%) |
| Bachelor's Degree or higher | 205 (95.4%) | 10 (4.6%) |
Occupancy by Age of Householder in Mount Pulaski
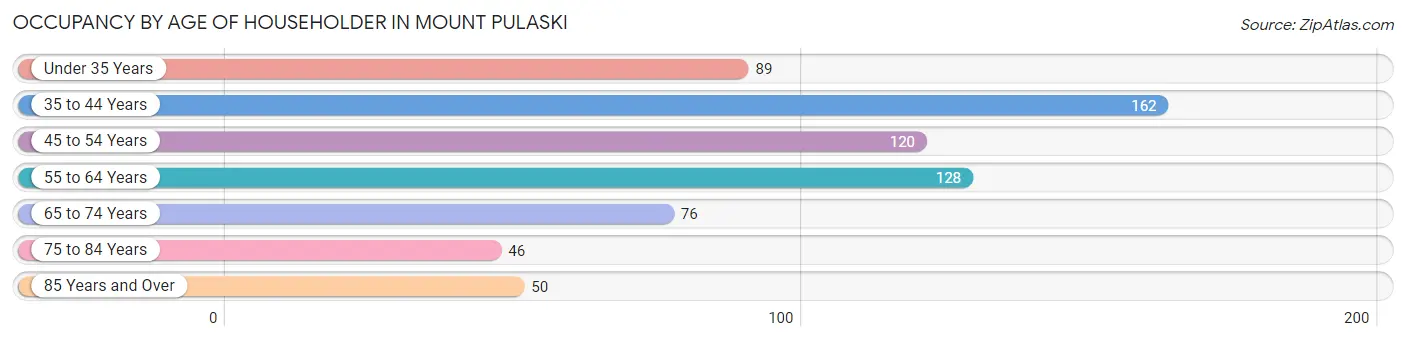
| Age Bracket | # Households | % Households |
| Under 35 Years | 89 | 13.3% |
| 35 to 44 Years | 162 | 24.1% |
| 45 to 54 Years | 120 | 17.9% |
| 55 to 64 Years | 128 | 19.1% |
| 65 to 74 Years | 76 | 11.3% |
| 75 to 84 Years | 46 | 6.9% |
| 85 Years and Over | 50 | 7.4% |
| Total | 671 | 100.0% |
Housing Finances in Mount Pulaski
Median Income by Occupancy in Mount Pulaski
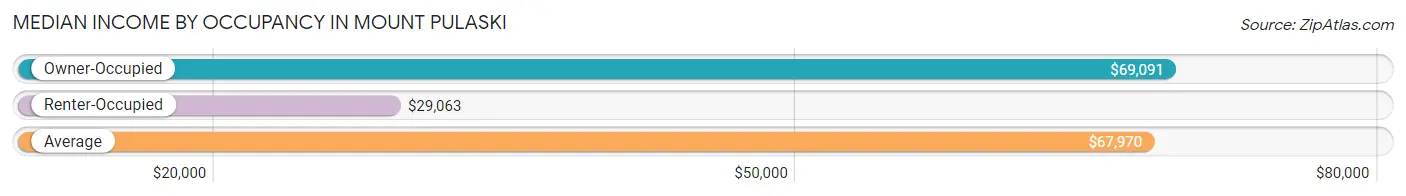
| Occupancy Type | # Households | Median Income |
| Owner-Occupied | 568 (84.7%) | $69,091 |
| Renter-Occupied | 103 (15.3%) | $29,063 |
| Average | 671 (100.0%) | $67,970 |
Occupancy by Householder Income Bracket in Mount Pulaski
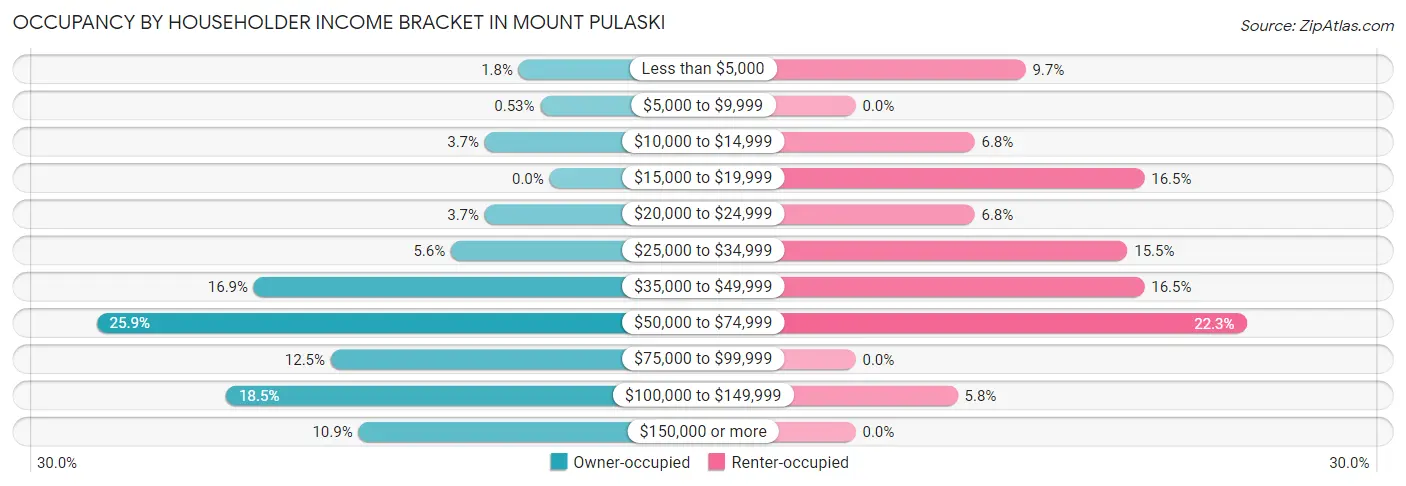
| Income Bracket | Owner-occupied | Renter-occupied |
| Less than $5,000 | 10 (1.8%) | 10 (9.7%) |
| $5,000 to $9,999 | 3 (0.5%) | 0 (0.0%) |
| $10,000 to $14,999 | 21 (3.7%) | 7 (6.8%) |
| $15,000 to $19,999 | 0 (0.0%) | 17 (16.5%) |
| $20,000 to $24,999 | 21 (3.7%) | 7 (6.8%) |
| $25,000 to $34,999 | 32 (5.6%) | 16 (15.5%) |
| $35,000 to $49,999 | 96 (16.9%) | 17 (16.5%) |
| $50,000 to $74,999 | 147 (25.9%) | 23 (22.3%) |
| $75,000 to $99,999 | 71 (12.5%) | 0 (0.0%) |
| $100,000 to $149,999 | 105 (18.5%) | 6 (5.8%) |
| $150,000 or more | 62 (10.9%) | 0 (0.0%) |
| Total | 568 (100.0%) | 103 (100.0%) |
Monthly Housing Cost Tiers in Mount Pulaski
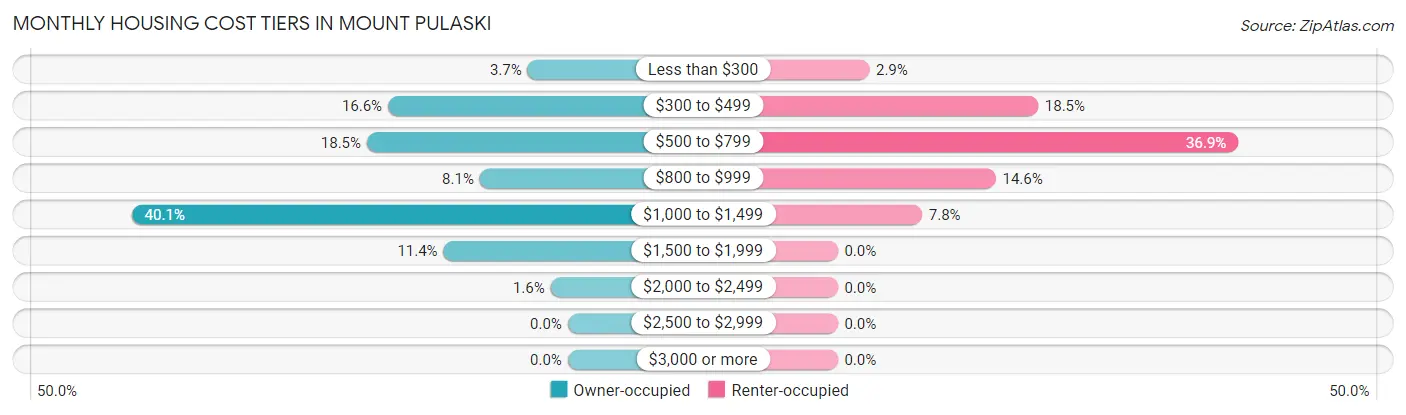
| Monthly Cost | Owner-occupied | Renter-occupied |
| Less than $300 | 21 (3.7%) | 3 (2.9%) |
| $300 to $499 | 94 (16.6%) | 19 (18.4%) |
| $500 to $799 | 105 (18.5%) | 38 (36.9%) |
| $800 to $999 | 46 (8.1%) | 15 (14.6%) |
| $1,000 to $1,499 | 228 (40.1%) | 8 (7.8%) |
| $1,500 to $1,999 | 65 (11.4%) | 0 (0.0%) |
| $2,000 to $2,499 | 9 (1.6%) | 0 (0.0%) |
| $2,500 to $2,999 | 0 (0.0%) | 0 (0.0%) |
| $3,000 or more | 0 (0.0%) | 0 (0.0%) |
| Total | 568 (100.0%) | 103 (100.0%) |
Physical Housing Characteristics in Mount Pulaski
Housing Structures in Mount Pulaski
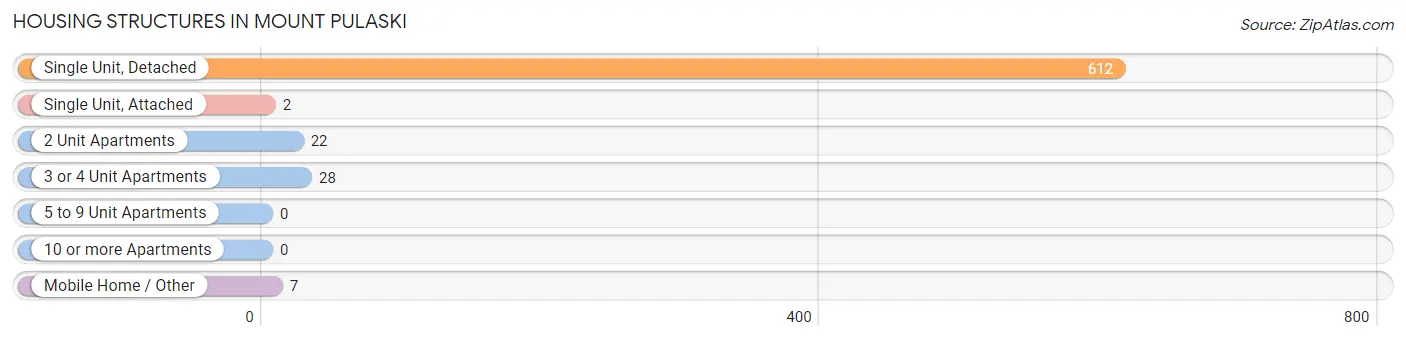
| Structure Type | # Housing Units | % Housing Units |
| Single Unit, Detached | 612 | 91.2% |
| Single Unit, Attached | 2 | 0.3% |
| 2 Unit Apartments | 22 | 3.3% |
| 3 or 4 Unit Apartments | 28 | 4.2% |
| 5 to 9 Unit Apartments | 0 | 0.0% |
| 10 or more Apartments | 0 | 0.0% |
| Mobile Home / Other | 7 | 1.0% |
| Total | 671 | 100.0% |
Housing Structures by Occupancy in Mount Pulaski
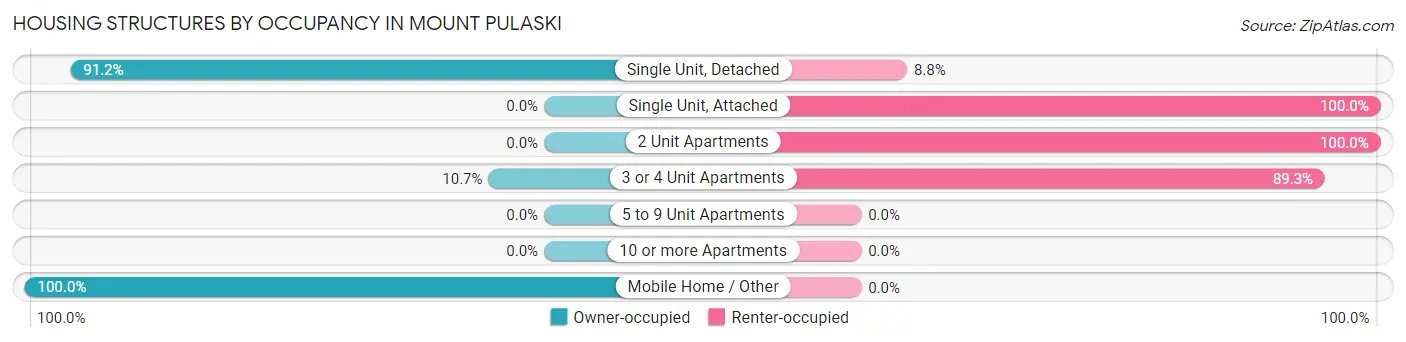
| Structure Type | Owner-occupied | Renter-occupied |
| Single Unit, Detached | 558 (91.2%) | 54 (8.8%) |
| Single Unit, Attached | 0 (0.0%) | 2 (100.0%) |
| 2 Unit Apartments | 0 (0.0%) | 22 (100.0%) |
| 3 or 4 Unit Apartments | 3 (10.7%) | 25 (89.3%) |
| 5 to 9 Unit Apartments | 0 (0.0%) | 0 (0.0%) |
| 10 or more Apartments | 0 (0.0%) | 0 (0.0%) |
| Mobile Home / Other | 7 (100.0%) | 0 (0.0%) |
| Total | 568 (84.7%) | 103 (15.3%) |
Housing Structures by Number of Rooms in Mount Pulaski
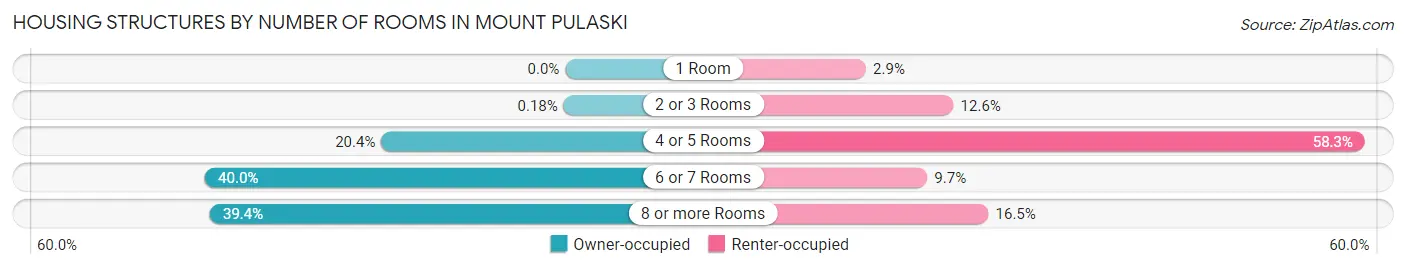
| Number of Rooms | Owner-occupied | Renter-occupied |
| 1 Room | 0 (0.0%) | 3 (2.9%) |
| 2 or 3 Rooms | 1 (0.2%) | 13 (12.6%) |
| 4 or 5 Rooms | 116 (20.4%) | 60 (58.3%) |
| 6 or 7 Rooms | 227 (40.0%) | 10 (9.7%) |
| 8 or more Rooms | 224 (39.4%) | 17 (16.5%) |
| Total | 568 (100.0%) | 103 (100.0%) |
Housing Structure by Heating Type in Mount Pulaski
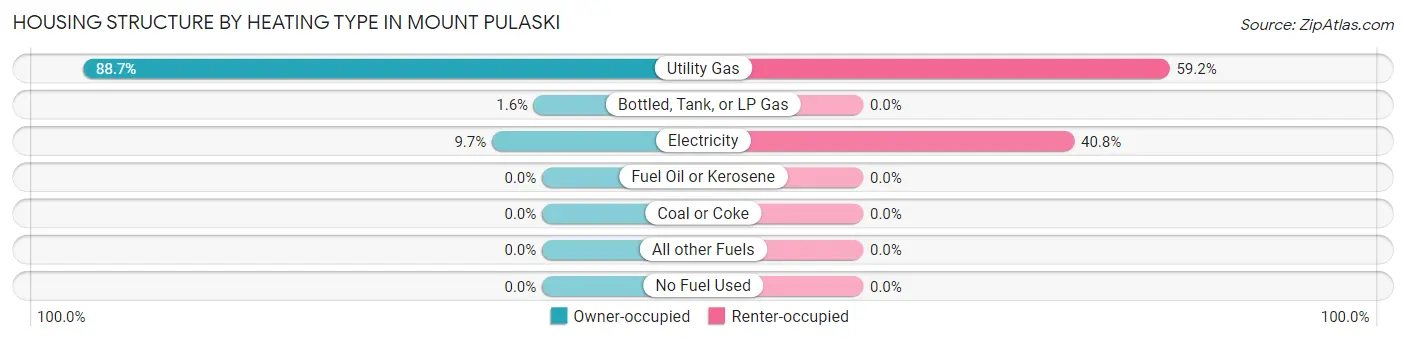
| Heating Type | Owner-occupied | Renter-occupied |
| Utility Gas | 504 (88.7%) | 61 (59.2%) |
| Bottled, Tank, or LP Gas | 9 (1.6%) | 0 (0.0%) |
| Electricity | 55 (9.7%) | 42 (40.8%) |
| Fuel Oil or Kerosene | 0 (0.0%) | 0 (0.0%) |
| Coal or Coke | 0 (0.0%) | 0 (0.0%) |
| All other Fuels | 0 (0.0%) | 0 (0.0%) |
| No Fuel Used | 0 (0.0%) | 0 (0.0%) |
| Total | 568 (100.0%) | 103 (100.0%) |
Household Vehicle Usage in Mount Pulaski
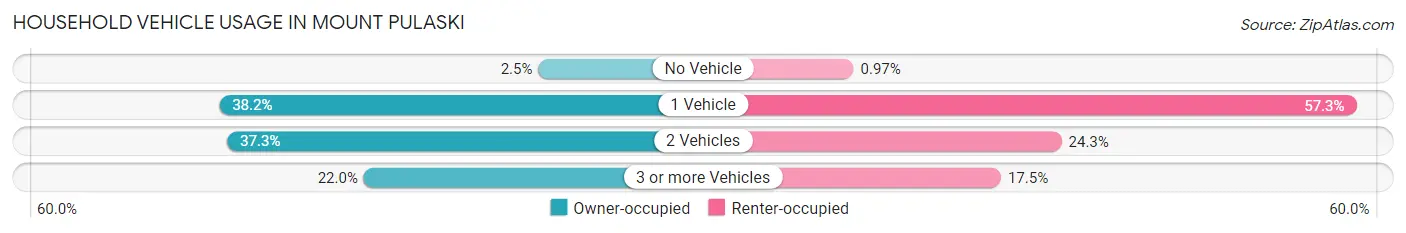
| Vehicles per Household | Owner-occupied | Renter-occupied |
| No Vehicle | 14 (2.5%) | 1 (1.0%) |
| 1 Vehicle | 217 (38.2%) | 59 (57.3%) |
| 2 Vehicles | 212 (37.3%) | 25 (24.3%) |
| 3 or more Vehicles | 125 (22.0%) | 18 (17.5%) |
| Total | 568 (100.0%) | 103 (100.0%) |
Real Estate & Mortgages in Mount Pulaski
Real Estate and Mortgage Overview in Mount Pulaski
| Characteristic | Without Mortgage | With Mortgage |
| Housing Units | 199 | 369 |
| Median Property Value | $109,900 | $112,800 |
| Median Household Income | $49,792 | $53 |
| Monthly Housing Costs | $480 | $0 |
| Real Estate Taxes | $1,993 | $2 |
Property Value by Mortgage Status in Mount Pulaski
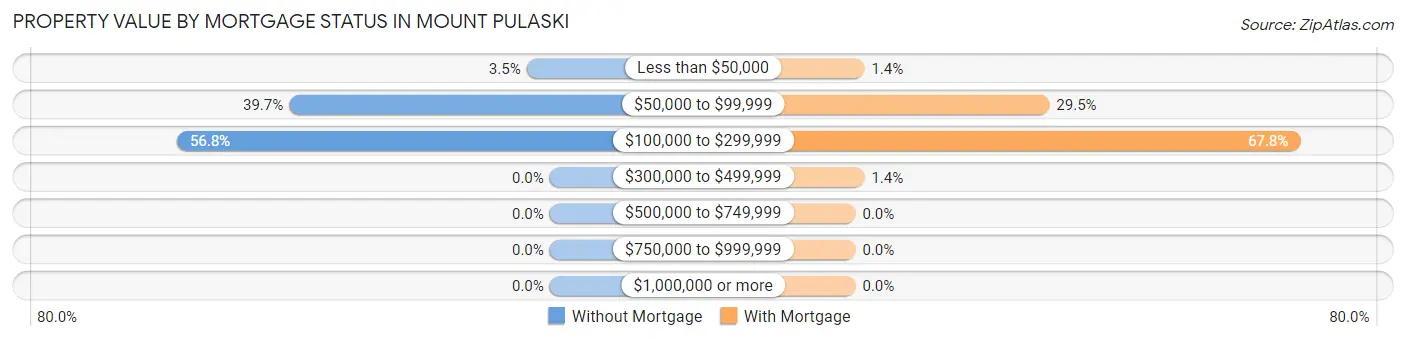
| Property Value | Without Mortgage | With Mortgage |
| Less than $50,000 | 7 (3.5%) | 5 (1.4%) |
| $50,000 to $99,999 | 79 (39.7%) | 109 (29.5%) |
| $100,000 to $299,999 | 113 (56.8%) | 250 (67.7%) |
| $300,000 to $499,999 | 0 (0.0%) | 5 (1.4%) |
| $500,000 to $749,999 | 0 (0.0%) | 0 (0.0%) |
| $750,000 to $999,999 | 0 (0.0%) | 0 (0.0%) |
| $1,000,000 or more | 0 (0.0%) | 0 (0.0%) |
| Total | 199 (100.0%) | 369 (100.0%) |
Household Income by Mortgage Status in Mount Pulaski
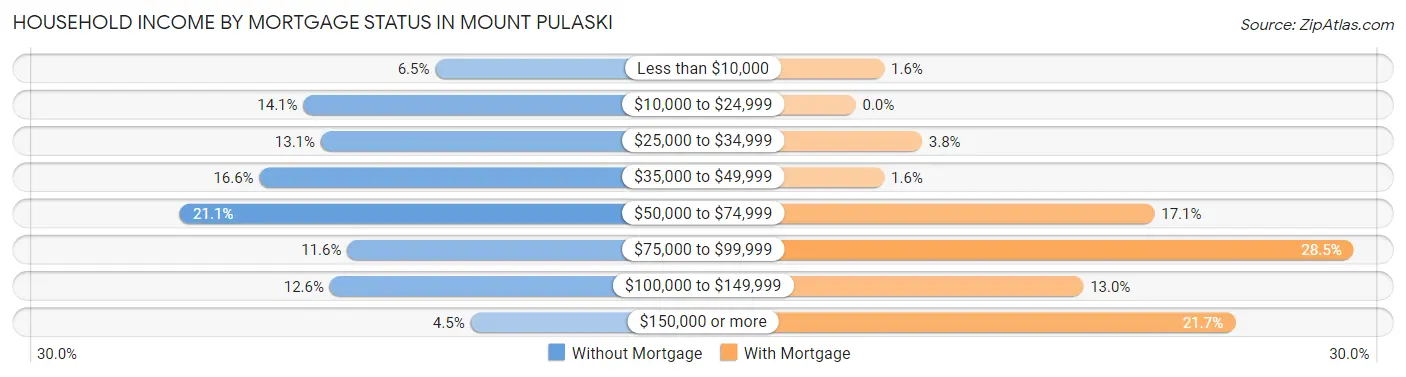
| Household Income | Without Mortgage | With Mortgage |
| Less than $10,000 | 13 (6.5%) | 6 (1.6%) |
| $10,000 to $24,999 | 28 (14.1%) | 0 (0.0%) |
| $25,000 to $34,999 | 26 (13.1%) | 14 (3.8%) |
| $35,000 to $49,999 | 33 (16.6%) | 6 (1.6%) |
| $50,000 to $74,999 | 42 (21.1%) | 63 (17.1%) |
| $75,000 to $99,999 | 23 (11.6%) | 105 (28.5%) |
| $100,000 to $149,999 | 25 (12.6%) | 48 (13.0%) |
| $150,000 or more | 9 (4.5%) | 80 (21.7%) |
| Total | 199 (100.0%) | 369 (100.0%) |
Property Value to Household Income Ratio in Mount Pulaski
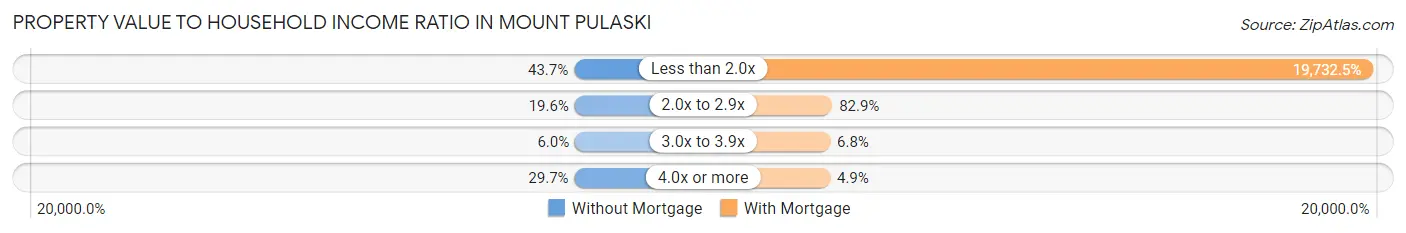
| Value-to-Income Ratio | Without Mortgage | With Mortgage |
| Less than 2.0x | 87 (43.7%) | 72,813 (19,732.5%) |
| 2.0x to 2.9x | 39 (19.6%) | 306 (82.9%) |
| 3.0x to 3.9x | 12 (6.0%) | 25 (6.8%) |
| 4.0x or more | 59 (29.6%) | 18 (4.9%) |
| Total | 199 (100.0%) | 369 (100.0%) |
Real Estate Taxes by Mortgage Status in Mount Pulaski
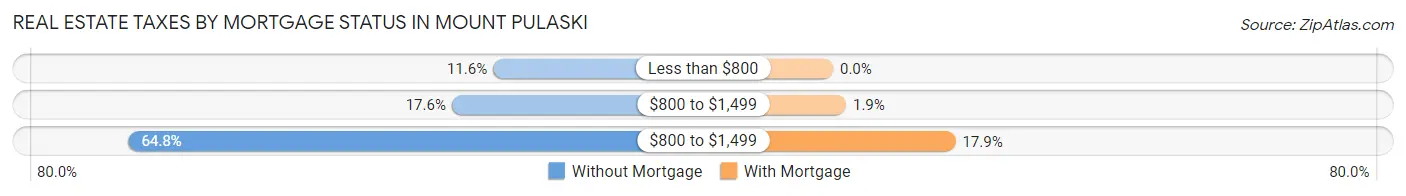
| Property Taxes | Without Mortgage | With Mortgage |
| Less than $800 | 23 (11.6%) | 0 (0.0%) |
| $800 to $1,499 | 35 (17.6%) | 7 (1.9%) |
| $800 to $1,499 | 129 (64.8%) | 66 (17.9%) |
| Total | 199 (100.0%) | 369 (100.0%) |
Health & Disability in Mount Pulaski
Health Insurance Coverage by Age in Mount Pulaski
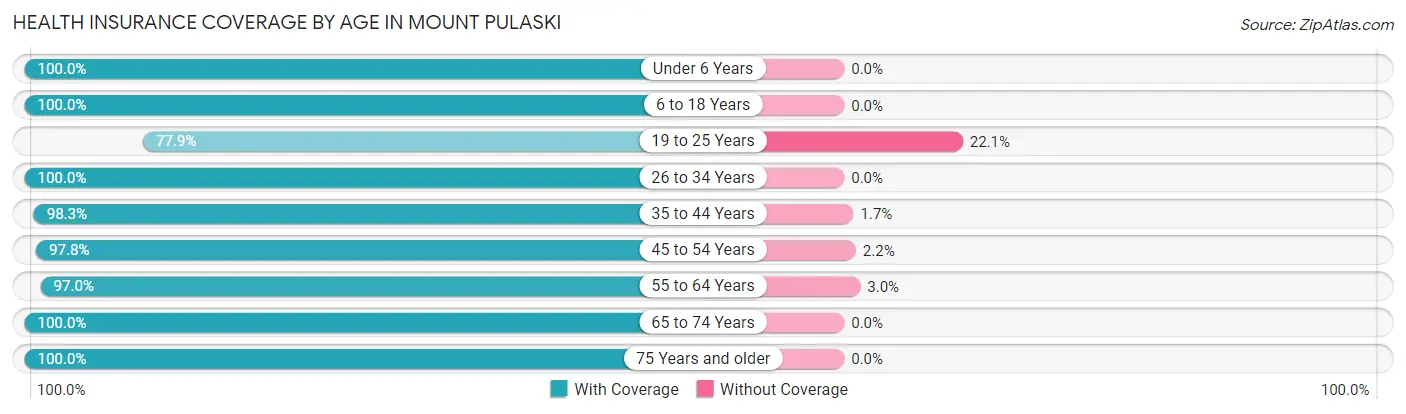
| Age Bracket | With Coverage | Without Coverage |
| Under 6 Years | 138 (100.0%) | 0 (0.0%) |
| 6 to 18 Years | 329 (100.0%) | 0 (0.0%) |
| 19 to 25 Years | 67 (77.9%) | 19 (22.1%) |
| 26 to 34 Years | 124 (100.0%) | 0 (0.0%) |
| 35 to 44 Years | 227 (98.3%) | 4 (1.7%) |
| 45 to 54 Years | 227 (97.8%) | 5 (2.2%) |
| 55 to 64 Years | 194 (97.0%) | 6 (3.0%) |
| 65 to 74 Years | 103 (100.0%) | 0 (0.0%) |
| 75 Years and older | 150 (100.0%) | 0 (0.0%) |
| Total | 1,559 (97.9%) | 34 (2.1%) |
Health Insurance Coverage by Citizenship Status in Mount Pulaski
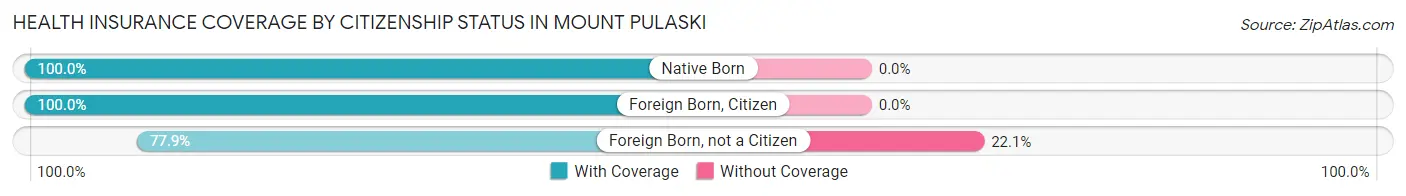
| Citizenship Status | With Coverage | Without Coverage |
| Native Born | 138 (100.0%) | 0 (0.0%) |
| Foreign Born, Citizen | 329 (100.0%) | 0 (0.0%) |
| Foreign Born, not a Citizen | 67 (77.9%) | 19 (22.1%) |
Health Insurance Coverage by Household Income in Mount Pulaski
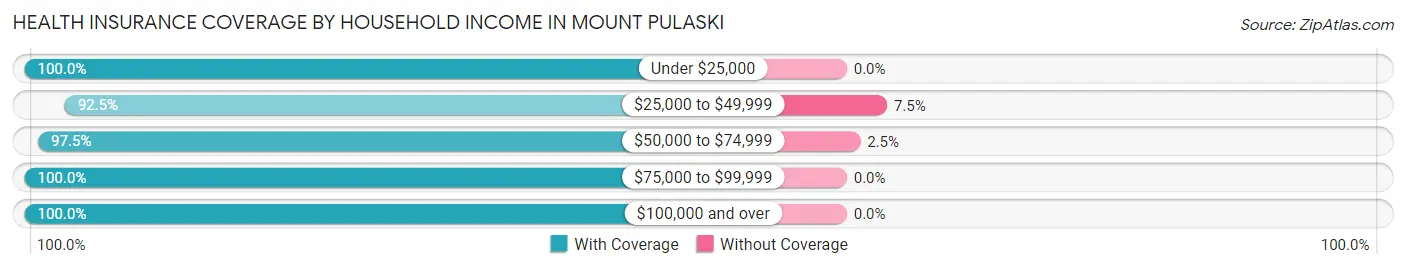
| Household Income | With Coverage | Without Coverage |
| Under $25,000 | 119 (100.0%) | 0 (0.0%) |
| $25,000 to $49,999 | 283 (92.5%) | 23 (7.5%) |
| $50,000 to $74,999 | 424 (97.5%) | 11 (2.5%) |
| $75,000 to $99,999 | 204 (100.0%) | 0 (0.0%) |
| $100,000 and over | 503 (100.0%) | 0 (0.0%) |
Public vs Private Health Insurance Coverage by Age in Mount Pulaski
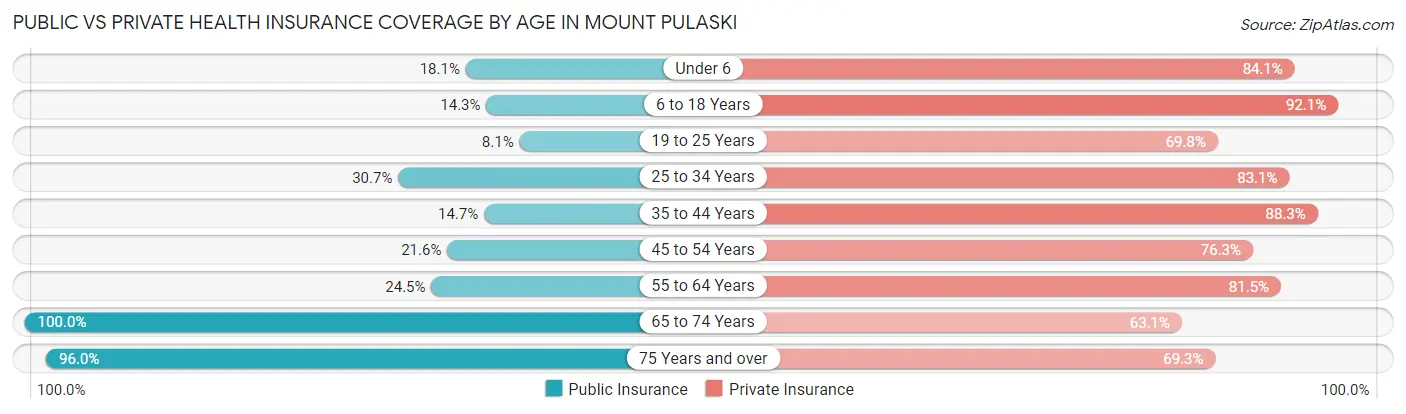
| Age Bracket | Public Insurance | Private Insurance |
| Under 6 | 25 (18.1%) | 116 (84.1%) |
| 6 to 18 Years | 47 (14.3%) | 303 (92.1%) |
| 19 to 25 Years | 7 (8.1%) | 60 (69.8%) |
| 25 to 34 Years | 38 (30.6%) | 103 (83.1%) |
| 35 to 44 Years | 34 (14.7%) | 204 (88.3%) |
| 45 to 54 Years | 50 (21.5%) | 177 (76.3%) |
| 55 to 64 Years | 49 (24.5%) | 163 (81.5%) |
| 65 to 74 Years | 103 (100.0%) | 65 (63.1%) |
| 75 Years and over | 144 (96.0%) | 104 (69.3%) |
| Total | 497 (31.2%) | 1,295 (81.3%) |
Disability Status by Sex by Age in Mount Pulaski
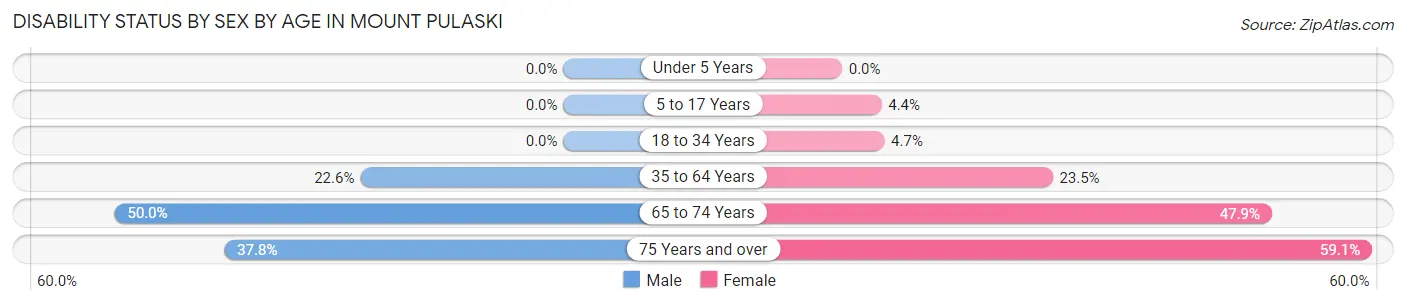
| Age Bracket | Male | Female |
| Under 5 Years | 0 (0.0%) | 0 (0.0%) |
| 5 to 17 Years | 0 (0.0%) | 7 (4.4%) |
| 18 to 34 Years | 0 (0.0%) | 6 (4.7%) |
| 35 to 64 Years | 69 (22.6%) | 84 (23.5%) |
| 65 to 74 Years | 16 (50.0%) | 34 (47.9%) |
| 75 Years and over | 17 (37.8%) | 62 (59.1%) |
Disability Class by Sex by Age in Mount Pulaski
Disability Class: Hearing Difficulty
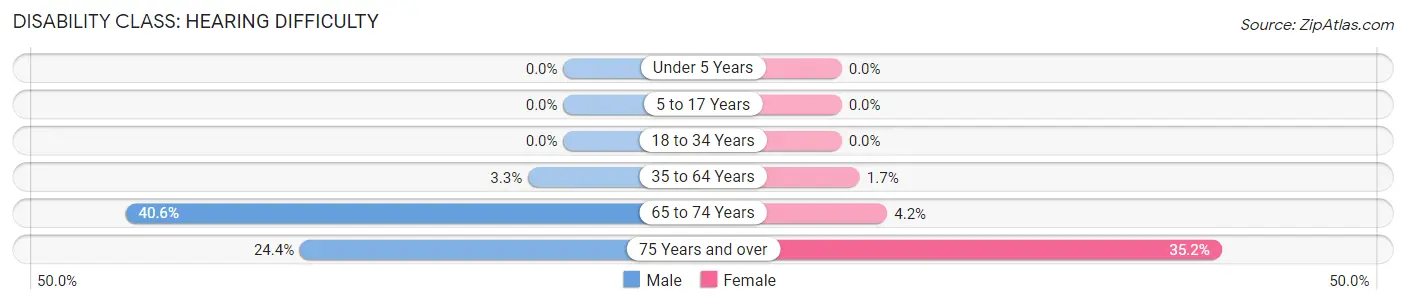
| Age Bracket | Male | Female |
| Under 5 Years | 0 (0.0%) | 0 (0.0%) |
| 5 to 17 Years | 0 (0.0%) | 0 (0.0%) |
| 18 to 34 Years | 0 (0.0%) | 0 (0.0%) |
| 35 to 64 Years | 10 (3.3%) | 6 (1.7%) |
| 65 to 74 Years | 13 (40.6%) | 3 (4.2%) |
| 75 Years and over | 11 (24.4%) | 37 (35.2%) |
Disability Class: Vision Difficulty
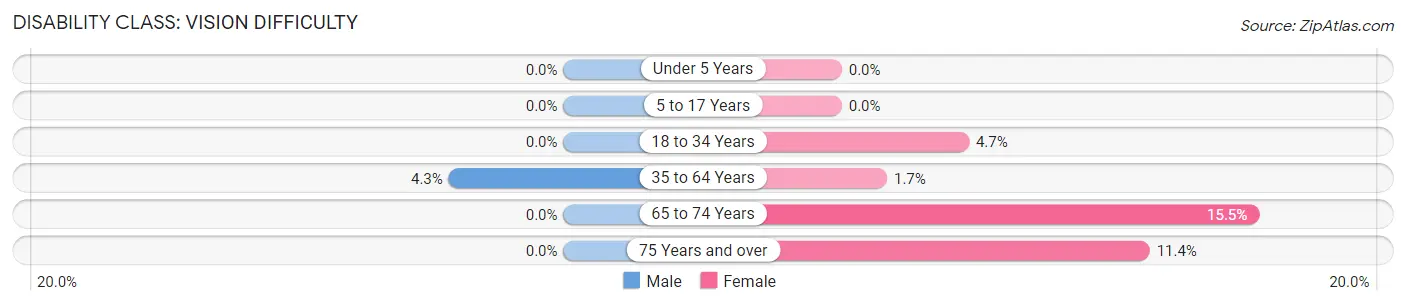
| Age Bracket | Male | Female |
| Under 5 Years | 0 (0.0%) | 0 (0.0%) |
| 5 to 17 Years | 0 (0.0%) | 0 (0.0%) |
| 18 to 34 Years | 0 (0.0%) | 6 (4.7%) |
| 35 to 64 Years | 13 (4.3%) | 6 (1.7%) |
| 65 to 74 Years | 0 (0.0%) | 11 (15.5%) |
| 75 Years and over | 0 (0.0%) | 12 (11.4%) |
Disability Class: Cognitive Difficulty
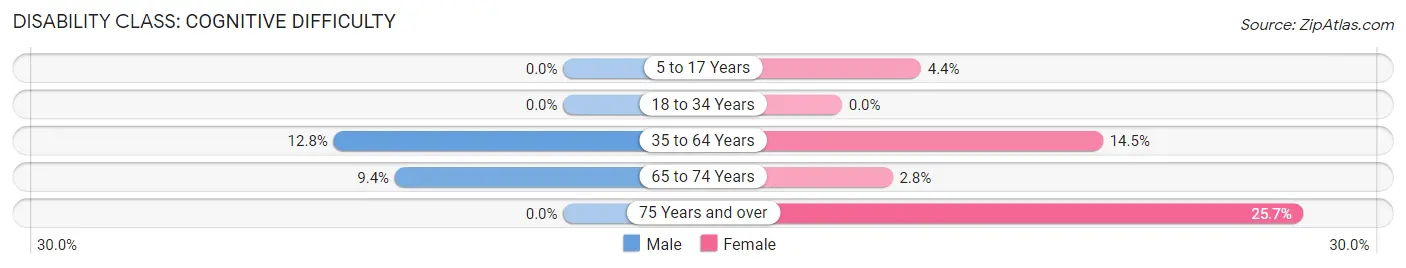
| Age Bracket | Male | Female |
| 5 to 17 Years | 0 (0.0%) | 7 (4.4%) |
| 18 to 34 Years | 0 (0.0%) | 0 (0.0%) |
| 35 to 64 Years | 39 (12.8%) | 52 (14.5%) |
| 65 to 74 Years | 3 (9.4%) | 2 (2.8%) |
| 75 Years and over | 0 (0.0%) | 27 (25.7%) |
Disability Class: Ambulatory Difficulty
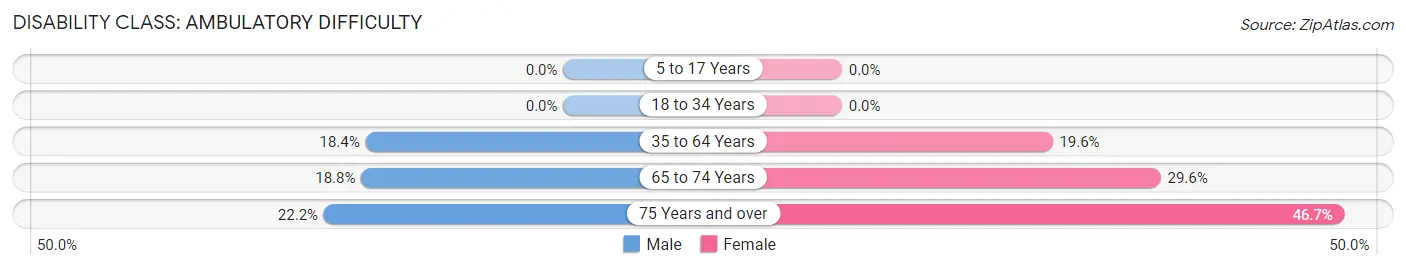
| Age Bracket | Male | Female |
| 5 to 17 Years | 0 (0.0%) | 0 (0.0%) |
| 18 to 34 Years | 0 (0.0%) | 0 (0.0%) |
| 35 to 64 Years | 56 (18.4%) | 70 (19.6%) |
| 65 to 74 Years | 6 (18.8%) | 21 (29.6%) |
| 75 Years and over | 10 (22.2%) | 49 (46.7%) |
Disability Class: Self-Care Difficulty
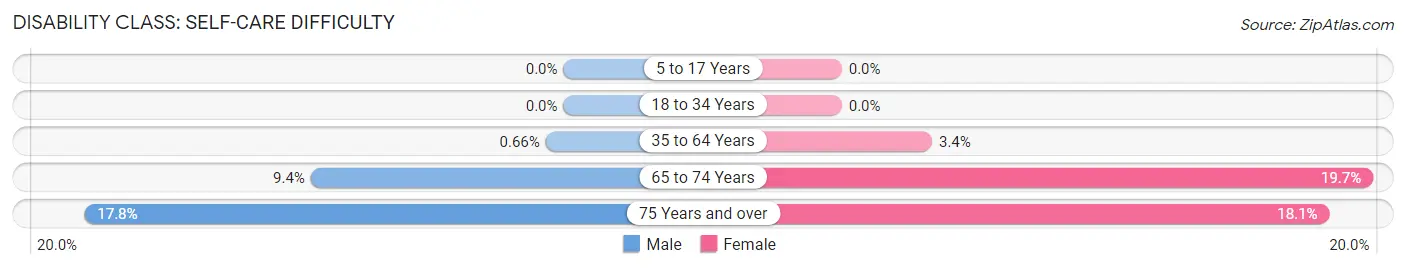
| Age Bracket | Male | Female |
| 5 to 17 Years | 0 (0.0%) | 0 (0.0%) |
| 18 to 34 Years | 0 (0.0%) | 0 (0.0%) |
| 35 to 64 Years | 2 (0.7%) | 12 (3.4%) |
| 65 to 74 Years | 3 (9.4%) | 14 (19.7%) |
| 75 Years and over | 8 (17.8%) | 19 (18.1%) |
Technology Access in Mount Pulaski
Computing Device Access in Mount Pulaski
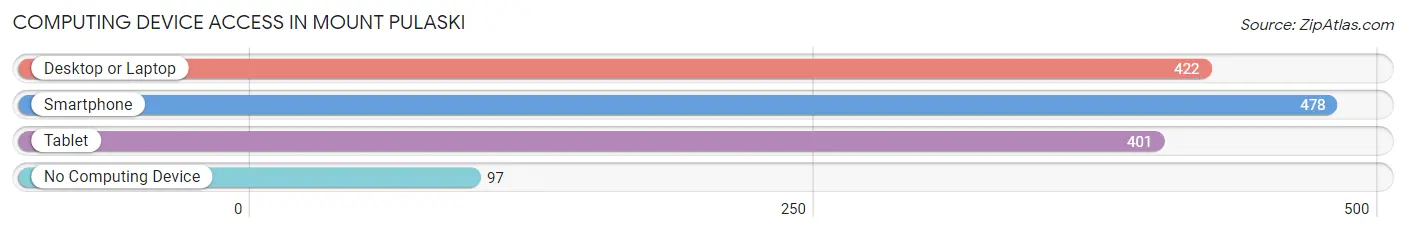
| Device Type | # Households | % Households |
| Desktop or Laptop | 422 | 62.9% |
| Smartphone | 478 | 71.2% |
| Tablet | 401 | 59.8% |
| No Computing Device | 97 | 14.5% |
| Total | 671 | 100.0% |
Internet Access in Mount Pulaski
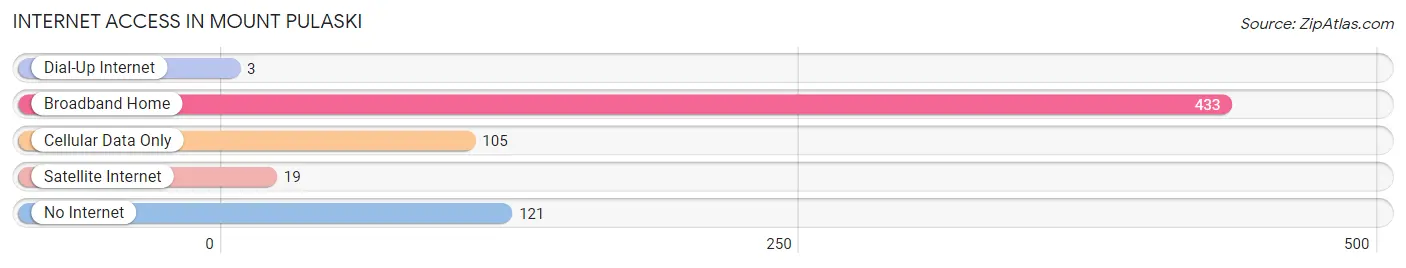
| Internet Type | # Households | % Households |
| Dial-Up Internet | 3 | 0.4% |
| Broadband Home | 433 | 64.5% |
| Cellular Data Only | 105 | 15.7% |
| Satellite Internet | 19 | 2.8% |
| No Internet | 121 | 18.0% |
| Total | 671 | 100.0% |
Mount Pulaski Summary
History
The city of Mount Pulaski, Illinois is located in Logan County, about 25 miles northwest of Springfield. It was founded in 1836 by a group of settlers from Pulaski County, Kentucky, who named the town after the Revolutionary War hero, General Casimir Pulaski. The town was officially incorporated in 1848.
Mount Pulaski was an important stop on the Underground Railroad, with many of the town’s residents helping to hide and transport escaped slaves. The town was also the site of the first Lincoln-Douglas debate in 1858.
Geography
Mount Pulaski is located in the central part of Logan County, about 25 miles northwest of Springfield. The city is situated on a hilltop, with the Sangamon River flowing to the south and east. The city is surrounded by rolling hills and farmland, with the nearest major city being Decatur, about 30 miles to the east.
The climate in Mount Pulaski is typical of the Midwest, with hot summers and cold winters. The average temperature in July is around 80 degrees Fahrenheit, while the average temperature in January is around 20 degrees Fahrenheit.
Economy
The economy of Mount Pulaski is largely based on agriculture and manufacturing. The city is home to several large farms, as well as several small businesses. The city is also home to several manufacturing companies, including a plastics factory and a metal fabrication plant.
The city is also home to several small retail stores, including a grocery store, a hardware store, and a few restaurants. The city also has a small airport, which is used for private and corporate flights.
Demographics
As of the 2010 census, the population of Mount Pulaski was 2,039. The racial makeup of the city was 97.3% White, 0.7% African American, 0.2% Native American, 0.3% Asian, 0.1% Pacific Islander, 0.4% from other races, and 1.0% from two or more races. Hispanic or Latino of any race were 1.3% of the population.
The median household income in Mount Pulaski was $45,938, and the median family income was $54,375. The per capita income for the city was $21,945. About 8.3% of families and 10.2% of the population were below the poverty line, including 14.2% of those under age 18 and 6.2% of those age 65 or over.
Mount Pulaski is served by the Mount Pulaski Community Unit School District 23, which includes two elementary schools, one middle school, and one high school. The city is also home to a branch of Lincoln Land Community College.
Common Questions
What is Per Capita Income in Mount Pulaski?
Per Capita income in Mount Pulaski is $31,399.
What is the Median Family Income in Mount Pulaski?
Median Family Income in Mount Pulaski is $77,708.
What is the Median Household income in Mount Pulaski?
Median Household Income in Mount Pulaski is $67,970.
What is Income or Wage Gap in Mount Pulaski?
Income or Wage Gap in Mount Pulaski is 27.3%.
Women in Mount Pulaski earn 72.7 cents for every dollar earned by a man.
What is Inequality or Gini Index in Mount Pulaski?
Inequality or Gini Index in Mount Pulaski is 0.37.
What is the Total Population of Mount Pulaski?
Total Population of Mount Pulaski is 1,636.
What is the Total Male Population of Mount Pulaski?
Total Male Population of Mount Pulaski is 701.
What is the Total Female Population of Mount Pulaski?
Total Female Population of Mount Pulaski is 935.
What is the Ratio of Males per 100 Females in Mount Pulaski?
There are 74.97 Males per 100 Females in Mount Pulaski.
What is the Ratio of Females per 100 Males in Mount Pulaski?
There are 133.38 Females per 100 Males in Mount Pulaski.
What is the Median Population Age in Mount Pulaski?
Median Population Age in Mount Pulaski is 41.7 Years.
What is the Average Family Size in Mount Pulaski
Average Family Size in Mount Pulaski is 2.9 People.
What is the Average Household Size in Mount Pulaski
Average Household Size in Mount Pulaski is 2.3 People.
How Large is the Labor Force in Mount Pulaski?
There are 736 People in the Labor Forcein in Mount Pulaski.
What is the Percentage of People in the Labor Force in Mount Pulaski?
61.0% of People are in the Labor Force in Mount Pulaski.
What is the Unemployment Rate in Mount Pulaski?
Unemployment Rate in Mount Pulaski is 6.5%.