Lone Tree, CO Map & Demographics
Lone Tree Map
Lone Tree Overview
$81,775
PER CAPITA INCOME
$168,349
AVG FAMILY INCOME
$121,066
AVG HOUSEHOLD INCOME
52.3%
WAGE / INCOME GAP [ % ]
47.7¢/ $1
WAGE / INCOME GAP [ $ ]
0.47
INEQUALITY / GINI INDEX
13,993
TOTAL POPULATION
6,989
MALE POPULATION
7,004
FEMALE POPULATION
99.79
MALES / 100 FEMALES
100.21
FEMALES / 100 MALES
41.1
MEDIAN AGE
3.0
AVG FAMILY SIZE
2.2
AVG HOUSEHOLD SIZE
8,607
LABOR FORCE [ PEOPLE ]
73.1%
PERCENT IN LABOR FORCE
4.1%
UNEMPLOYMENT RATE
Lone Tree Zip Codes
Income in Lone Tree
Income Overview in Lone Tree
Per Capita Income in Lone Tree is $81,775, while median incomes of families and households are $168,349 and $121,066 respectively.
| Characteristic | Number | Measure |
| Per Capita Income | 13,993 | $81,775 |
| Median Family Income | 3,508 | $168,349 |
| Mean Family Income | 3,508 | $232,563 |
| Median Household Income | 6,292 | $121,066 |
| Mean Household Income | 6,292 | $179,297 |
| Income Deficit | 3,508 | $0 |
| Wage / Income Gap (%) | 13,993 | 52.25% |
| Wage / Income Gap ($) | 13,993 | 47.75¢ per $1 |
| Gini / Inequality Index | 13,993 | 0.47 |
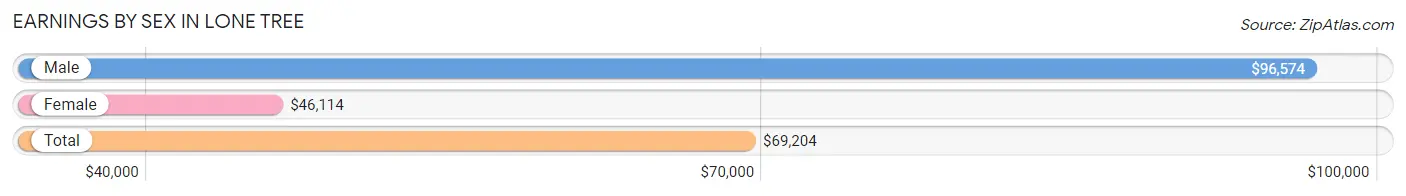
Earnings by Sex in Lone Tree
Average Earnings in Lone Tree are $69,204, $96,574 for men and $46,114 for women, a difference of 52.2%.
| Sex | Number | Average Earnings |
| Male | 4,806 (53.0%) | $96,574 |
| Female | 4,268 (47.0%) | $46,114 |
| Total | 9,074 (100.0%) | $69,204 |
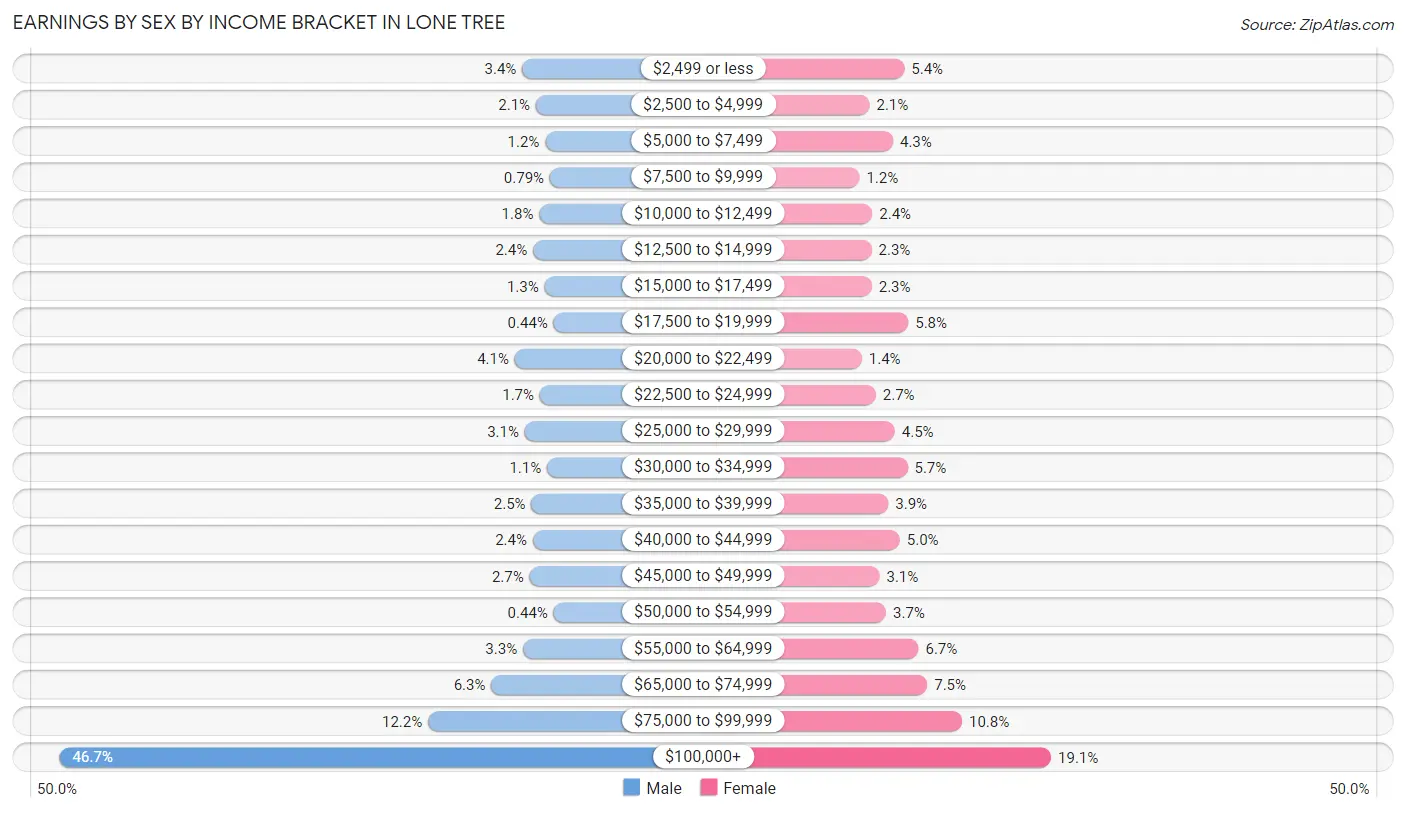
Earnings by Sex by Income Bracket in Lone Tree
The most common earnings brackets in Lone Tree are $100,000+ for men (2,246 | 46.7%) and $100,000+ for women (817 | 19.1%).
| Income | Male | Female |
| $2,499 or less | 163 (3.4%) | 230 (5.4%) |
| $2,500 to $4,999 | 101 (2.1%) | 91 (2.1%) |
| $5,000 to $7,499 | 59 (1.2%) | 185 (4.3%) |
| $7,500 to $9,999 | 38 (0.8%) | 51 (1.2%) |
| $10,000 to $12,499 | 86 (1.8%) | 102 (2.4%) |
| $12,500 to $14,999 | 114 (2.4%) | 99 (2.3%) |
| $15,000 to $17,499 | 62 (1.3%) | 100 (2.3%) |
| $17,500 to $19,999 | 21 (0.4%) | 246 (5.8%) |
| $20,000 to $22,499 | 196 (4.1%) | 60 (1.4%) |
| $22,500 to $24,999 | 83 (1.7%) | 116 (2.7%) |
| $25,000 to $29,999 | 151 (3.1%) | 192 (4.5%) |
| $30,000 to $34,999 | 51 (1.1%) | 243 (5.7%) |
| $35,000 to $39,999 | 121 (2.5%) | 166 (3.9%) |
| $40,000 to $44,999 | 115 (2.4%) | 212 (5.0%) |
| $45,000 to $49,999 | 130 (2.7%) | 131 (3.1%) |
| $50,000 to $54,999 | 21 (0.4%) | 157 (3.7%) |
| $55,000 to $64,999 | 159 (3.3%) | 287 (6.7%) |
| $65,000 to $74,999 | 302 (6.3%) | 322 (7.5%) |
| $75,000 to $99,999 | 587 (12.2%) | 461 (10.8%) |
| $100,000+ | 2,246 (46.7%) | 817 (19.1%) |
| Total | 4,806 (100.0%) | 4,268 (100.0%) |
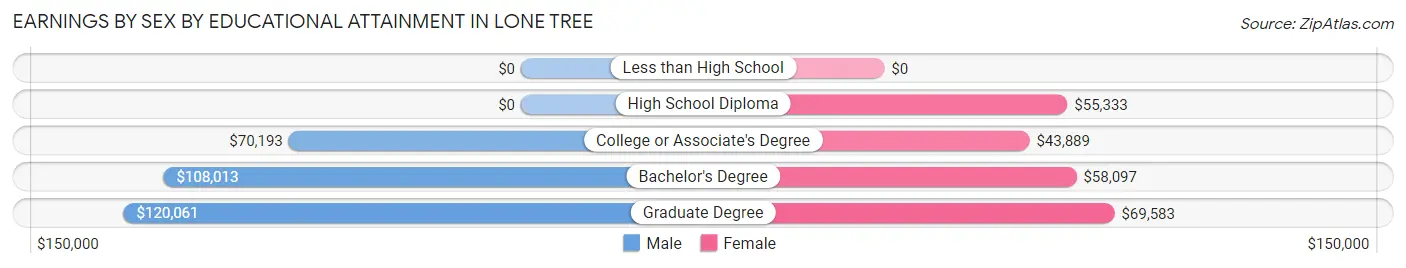
Earnings by Sex by Educational Attainment in Lone Tree
Average earnings in Lone Tree are $100,417 for men and $57,438 for women, a difference of 42.8%. Men with an educational attainment of graduate degree enjoy the highest average annual earnings of $120,061, while those with college or associate's degree education earn the least with $70,193. Women with an educational attainment of graduate degree earn the most with the average annual earnings of $69,583, while those with college or associate's degree education have the smallest earnings of $43,889.
| Educational Attainment | Male Income | Female Income |
| Less than High School | - | - |
| High School Diploma | - | - |
| College or Associate's Degree | $70,193 | $43,889 |
| Bachelor's Degree | $108,013 | $58,097 |
| Graduate Degree | $120,061 | $69,583 |
| Total | $100,417 | $57,438 |
Family Income in Lone Tree
Family Income Brackets in Lone Tree
According to the Lone Tree family income data, there are 1,459 families falling into the $200,000+ income range, which is the most common income bracket and makes up 41.6% of all families. Conversely, the $10,000 to $14,999 income bracket is the least frequent group with only 7 families (0.2%) belonging to this category.
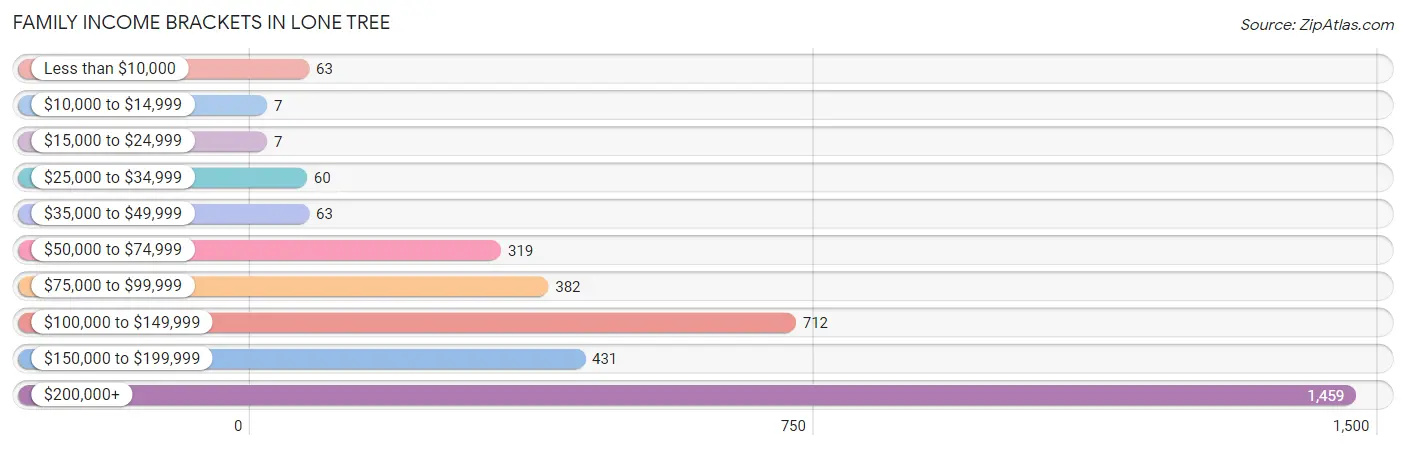
| Income Bracket | # Families | % Families |
| Less than $10,000 | 63 | 1.8% |
| $10,000 to $14,999 | 7 | 0.2% |
| $15,000 to $24,999 | 7 | 0.2% |
| $25,000 to $34,999 | 60 | 1.7% |
| $35,000 to $49,999 | 63 | 1.8% |
| $50,000 to $74,999 | 319 | 9.1% |
| $75,000 to $99,999 | 382 | 10.9% |
| $100,000 to $149,999 | 712 | 20.3% |
| $150,000 to $199,999 | 431 | 12.3% |
| $200,000+ | 1,459 | 41.6% |
Family Income by Famaliy Size in Lone Tree
5-person families (245 | 7.0%) account for the highest median family income in Lone Tree with $250,001 per family, while 2-person families (1,785 | 50.9%) have the highest median income of $65,792 per family member.
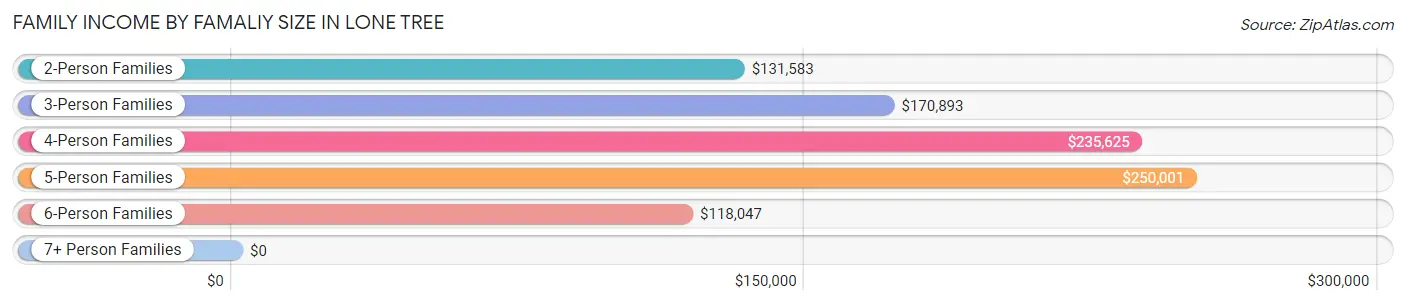
| Income Bracket | # Families | Median Income |
| 2-Person Families | 1,785 (50.9%) | $131,583 |
| 3-Person Families | 647 (18.4%) | $170,893 |
| 4-Person Families | 773 (22.0%) | $235,625 |
| 5-Person Families | 245 (7.0%) | $250,001 |
| 6-Person Families | 41 (1.2%) | $118,047 |
| 7+ Person Families | 17 (0.5%) | $0 |
| Total | 3,508 (100.0%) | $168,349 |
Family Income by Number of Earners in Lone Tree
The median family income in Lone Tree is $168,349, with families comprising 3+ earners (387) having the highest median family income of $250,001, while families with no earners (332) have the lowest median family income of $94,063, accounting for 11.0% and 9.5% of families, respectively.
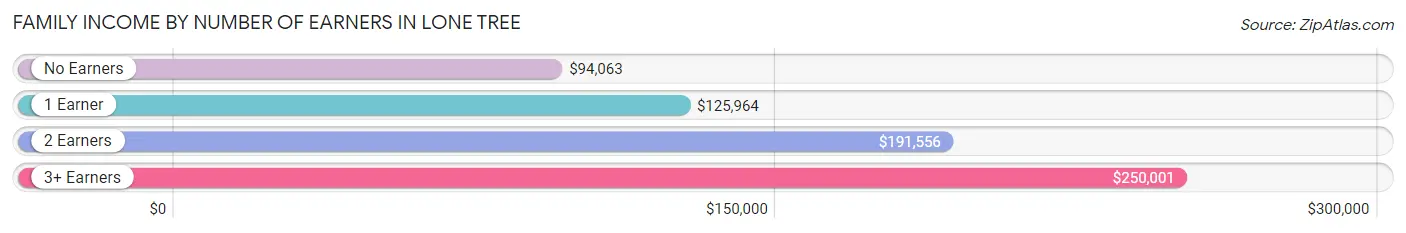
| Number of Earners | # Families | Median Income |
| No Earners | 332 (9.5%) | $94,063 |
| 1 Earner | 993 (28.3%) | $125,964 |
| 2 Earners | 1,796 (51.2%) | $191,556 |
| 3+ Earners | 387 (11.0%) | $250,001 |
| Total | 3,508 (100.0%) | $168,349 |
Household Income in Lone Tree
Household Income Brackets in Lone Tree
With 1,787 households falling in the category, the $200,000+ income range is the most frequent in Lone Tree, accounting for 28.4% of all households. In contrast, only 19 households (0.3%) fall into the $10,000 to $14,999 income bracket, making it the least populous group.
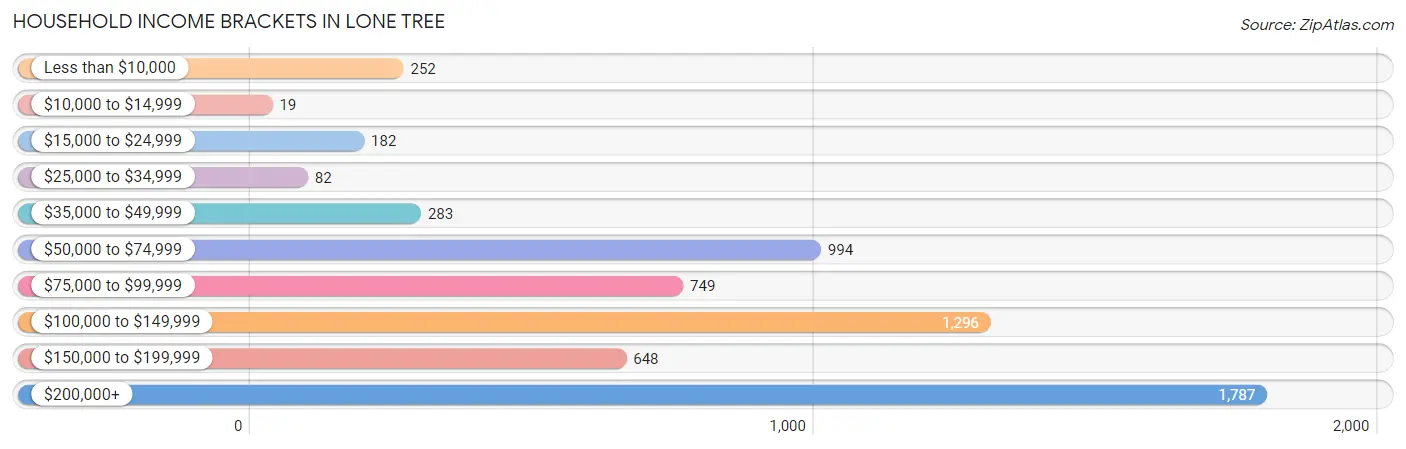
| Income Bracket | # Households | % Households |
| Less than $10,000 | 252 | 4.0% |
| $10,000 to $14,999 | 19 | 0.3% |
| $15,000 to $24,999 | 182 | 2.9% |
| $25,000 to $34,999 | 82 | 1.3% |
| $35,000 to $49,999 | 283 | 4.5% |
| $50,000 to $74,999 | 994 | 15.8% |
| $75,000 to $99,999 | 749 | 11.9% |
| $100,000 to $149,999 | 1,296 | 20.6% |
| $150,000 to $199,999 | 648 | 10.3% |
| $200,000+ | 1,787 | 28.4% |
Household Income by Householder Age in Lone Tree
The median household income in Lone Tree is $121,066, with the highest median household income of $180,444 found in the 45 to 64 years age bracket for the primary householder. A total of 2,275 households (36.2%) fall into this category. Meanwhile, the 15 to 24 years age bracket for the primary householder has the lowest median household income of $81,413, with 342 households (5.4%) in this group.
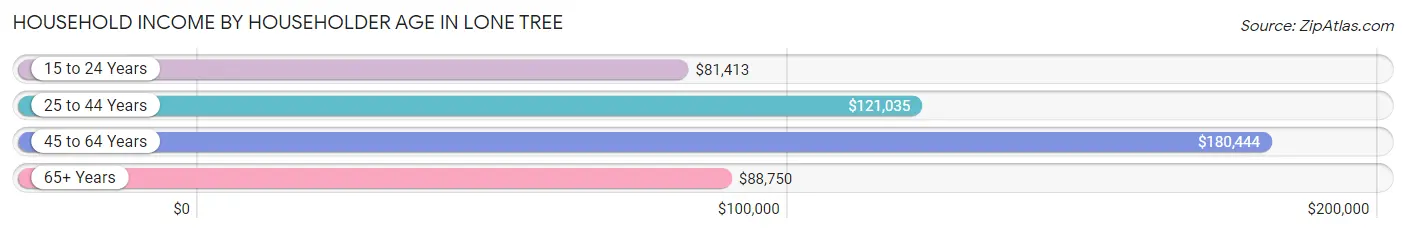
| Income Bracket | # Households | Median Income |
| 15 to 24 Years | 342 (5.4%) | $81,413 |
| 25 to 44 Years | 2,258 (35.9%) | $121,035 |
| 45 to 64 Years | 2,275 (36.2%) | $180,444 |
| 65+ Years | 1,417 (22.5%) | $88,750 |
| Total | 6,292 (100.0%) | $121,066 |
Poverty in Lone Tree
Income Below Poverty by Sex and Age in Lone Tree
With 3.4% poverty level for males and 5.2% for females among the residents of Lone Tree, 16 and 17 year old males and 75 year old and over females are the most vulnerable to poverty, with 27 males (17.1%) and 132 females (25.7%) in their respective age groups living below the poverty level.
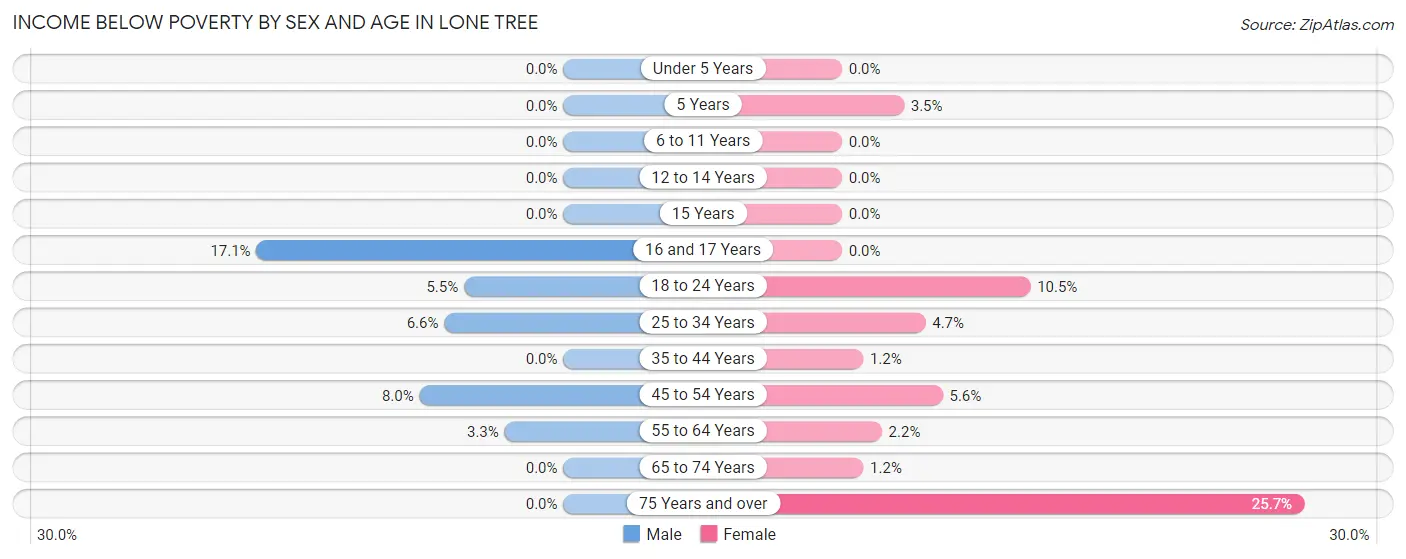
| Age Bracket | Male | Female |
| Under 5 Years | 0 (0.0%) | 0 (0.0%) |
| 5 Years | 0 (0.0%) | 2 (3.5%) |
| 6 to 11 Years | 0 (0.0%) | 0 (0.0%) |
| 12 to 14 Years | 0 (0.0%) | 0 (0.0%) |
| 15 Years | 0 (0.0%) | 0 (0.0%) |
| 16 and 17 Years | 27 (17.1%) | 0 (0.0%) |
| 18 to 24 Years | 22 (5.5%) | 83 (10.5%) |
| 25 to 34 Years | 77 (6.6%) | 48 (4.6%) |
| 35 to 44 Years | 0 (0.0%) | 10 (1.2%) |
| 45 to 54 Years | 80 (8.0%) | 62 (5.6%) |
| 55 to 64 Years | 33 (3.3%) | 17 (2.2%) |
| 65 to 74 Years | 0 (0.0%) | 9 (1.2%) |
| 75 Years and over | 0 (0.0%) | 132 (25.7%) |
| Total | 239 (3.4%) | 363 (5.2%) |
Income Above Poverty by Sex and Age in Lone Tree
According to the poverty statistics in Lone Tree, males aged under 5 years and females aged under 5 years are the age groups that are most secure financially, with 100.0% of males and 100.0% of females in these age groups living above the poverty line.
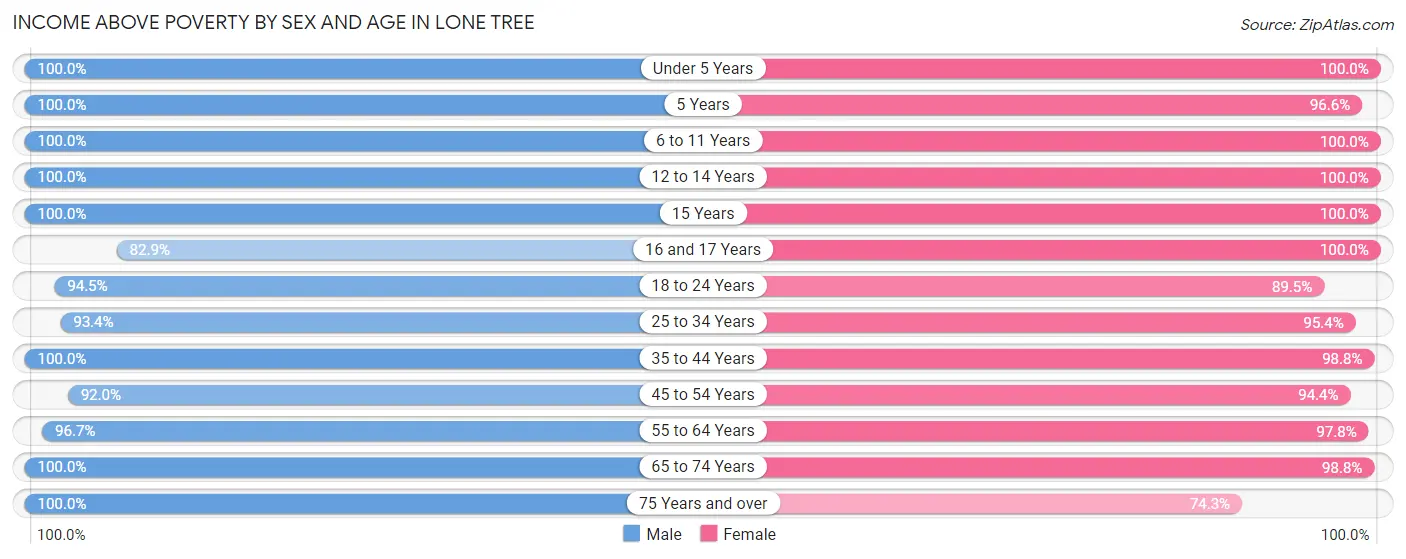
| Age Bracket | Male | Female |
| Under 5 Years | 320 (100.0%) | 180 (100.0%) |
| 5 Years | 70 (100.0%) | 56 (96.6%) |
| 6 to 11 Years | 400 (100.0%) | 532 (100.0%) |
| 12 to 14 Years | 324 (100.0%) | 155 (100.0%) |
| 15 Years | 108 (100.0%) | 61 (100.0%) |
| 16 and 17 Years | 131 (82.9%) | 167 (100.0%) |
| 18 to 24 Years | 376 (94.5%) | 708 (89.5%) |
| 25 to 34 Years | 1,085 (93.4%) | 985 (95.4%) |
| 35 to 44 Years | 944 (100.0%) | 836 (98.8%) |
| 45 to 54 Years | 919 (92.0%) | 1,044 (94.4%) |
| 55 to 64 Years | 975 (96.7%) | 748 (97.8%) |
| 65 to 74 Years | 735 (100.0%) | 747 (98.8%) |
| 75 Years and over | 363 (100.0%) | 381 (74.3%) |
| Total | 6,750 (96.6%) | 6,600 (94.8%) |
Income Below Poverty Among Married-Couple Families in Lone Tree
The poverty statistics for married-couple families in Lone Tree show that 2.1% or 62 of the total 2,995 families live below the poverty line. Families with 1 or 2 children have the highest poverty rate of 5.5%, comprising of 55 families. On the other hand, families with 3 or 4 children have the lowest poverty rate of 0.0%, which includes 0 families.
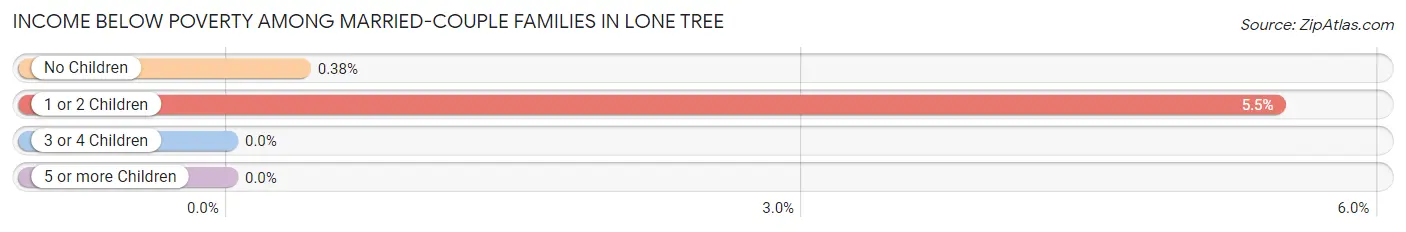
| Children | Above Poverty | Below Poverty |
| No Children | 1,822 (99.6%) | 7 (0.4%) |
| 1 or 2 Children | 951 (94.5%) | 55 (5.5%) |
| 3 or 4 Children | 160 (100.0%) | 0 (0.0%) |
| 5 or more Children | 0 (0.0%) | 0 (0.0%) |
| Total | 2,933 (97.9%) | 62 (2.1%) |
Income Below Poverty Among Single-Parent Households in Lone Tree
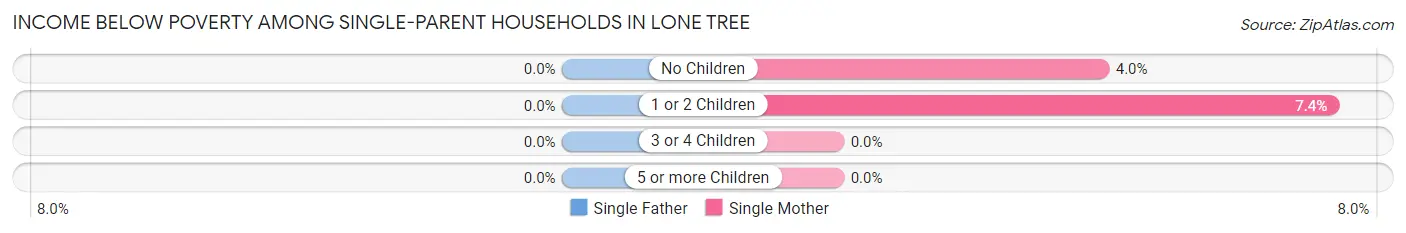
| Children | Single Father | Single Mother |
| No Children | 0 (0.0%) | 7 (4.0%) |
| 1 or 2 Children | 0 (0.0%) | 9 (7.4%) |
| 3 or 4 Children | 0 (0.0%) | 0 (0.0%) |
| 5 or more Children | 0 (0.0%) | 0 (0.0%) |
| Total | 0 (0.0%) | 16 (4.7%) |
Income Below Poverty Among Married-Couple vs Single-Parent Households in Lone Tree
The poverty data for Lone Tree shows that 62 of the married-couple family households (2.1%) and 16 of the single-parent households (3.1%) are living below the poverty level. Within the married-couple family households, those with 1 or 2 children have the highest poverty rate, with 55 households (5.5%) falling below the poverty line. Among the single-parent households, those with no children have the highest poverty rate, with 7 household (3.4%) living below poverty.
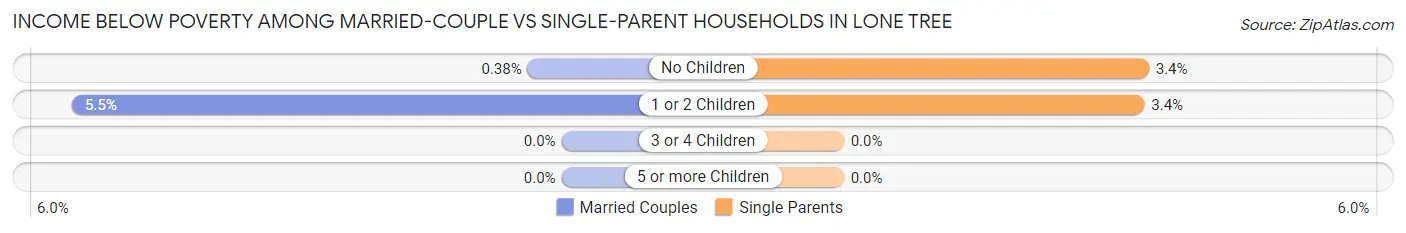
| Children | Married-Couple Families | Single-Parent Households |
| No Children | 7 (0.4%) | 7 (3.4%) |
| 1 or 2 Children | 55 (5.5%) | 9 (3.4%) |
| 3 or 4 Children | 0 (0.0%) | 0 (0.0%) |
| 5 or more Children | 0 (0.0%) | 0 (0.0%) |
| Total | 62 (2.1%) | 16 (3.1%) |
Race in Lone Tree
The most populous races in Lone Tree are White / Caucasian (11,094 | 79.3%), Asian (1,403 | 10.0%), and Hispanic or Latino (824 | 5.9%).
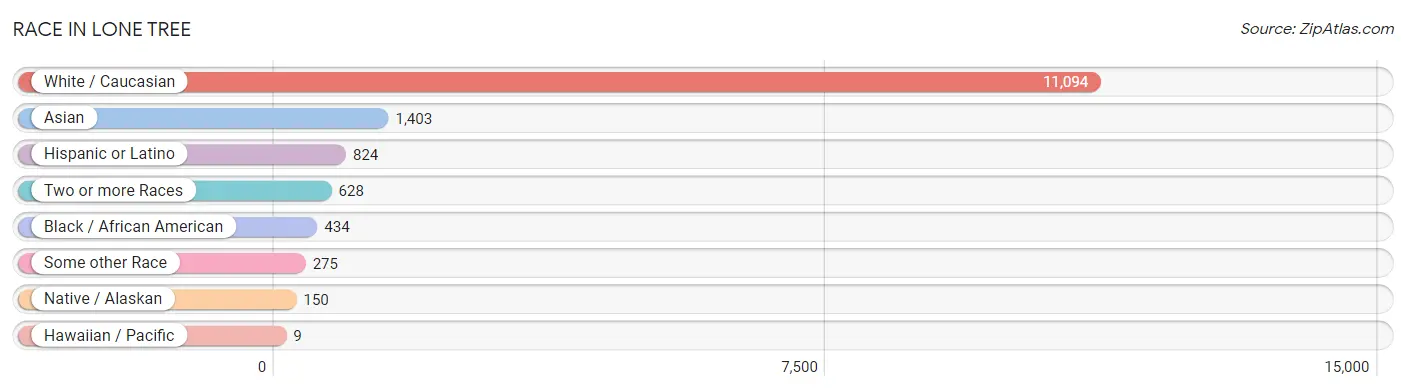
| Race | # Population | % Population |
| Asian | 1,403 | 10.0% |
| Black / African American | 434 | 3.1% |
| Hawaiian / Pacific | 9 | 0.1% |
| Hispanic or Latino | 824 | 5.9% |
| Native / Alaskan | 150 | 1.1% |
| White / Caucasian | 11,094 | 79.3% |
| Two or more Races | 628 | 4.5% |
| Some other Race | 275 | 2.0% |
| Total | 13,993 | 100.0% |
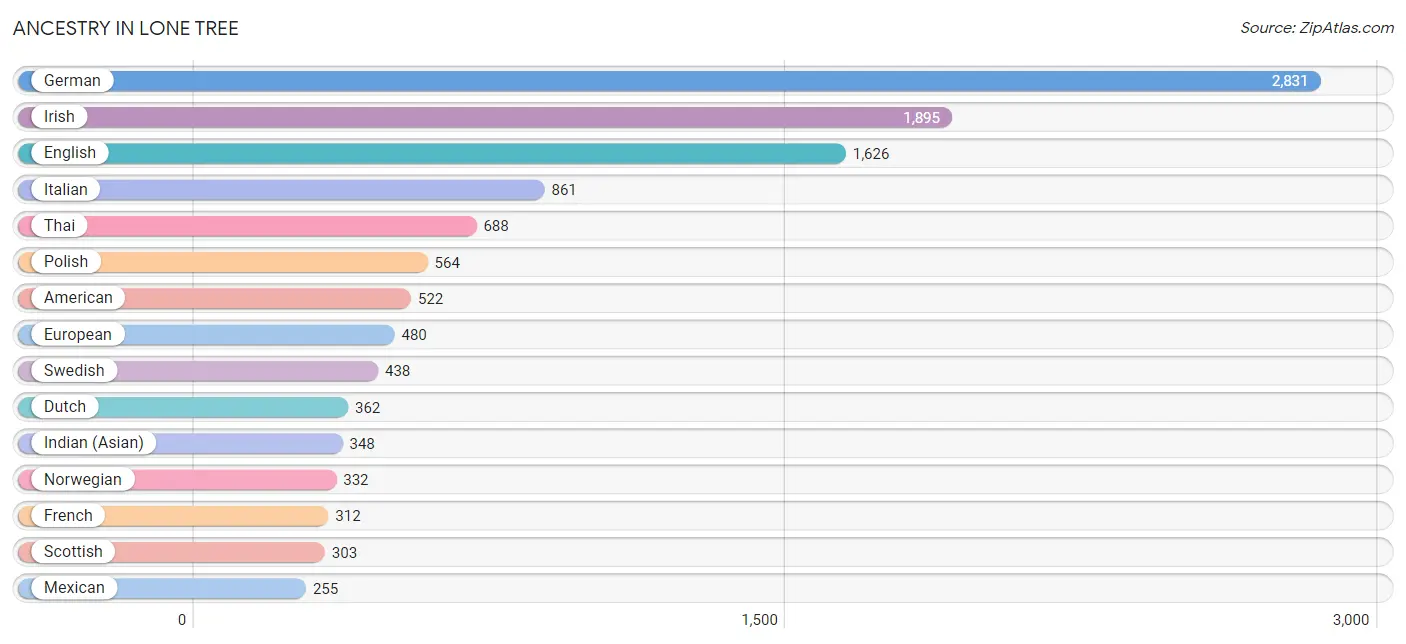
Ancestry in Lone Tree
The most populous ancestries reported in Lone Tree are German (2,831 | 20.2%), Irish (1,895 | 13.5%), English (1,626 | 11.6%), Italian (861 | 6.1%), and Thai (688 | 4.9%), together accounting for 56.5% of all Lone Tree residents.
| Ancestry | # Population | % Population |
| African | 9 | 0.1% |
| American | 522 | 3.7% |
| Arab | 40 | 0.3% |
| Argentinean | 38 | 0.3% |
| Armenian | 10 | 0.1% |
| Austrian | 70 | 0.5% |
| Bhutanese | 65 | 0.5% |
| Bolivian | 24 | 0.2% |
| Brazilian | 18 | 0.1% |
| British | 205 | 1.5% |
| Burmese | 99 | 0.7% |
| Canadian | 8 | 0.1% |
| Central American | 91 | 0.6% |
| Central American Indian | 78 | 0.6% |
| Cherokee | 20 | 0.1% |
| Chickasaw | 9 | 0.1% |
| Choctaw | 30 | 0.2% |
| Colombian | 58 | 0.4% |
| Cuban | 108 | 0.8% |
| Czech | 240 | 1.7% |
| Czechoslovakian | 27 | 0.2% |
| Danish | 59 | 0.4% |
| Dutch | 362 | 2.6% |
| Eastern European | 134 | 1.0% |
| English | 1,626 | 11.6% |
| European | 480 | 3.4% |
| Finnish | 208 | 1.5% |
| French | 312 | 2.2% |
| French Canadian | 20 | 0.1% |
| German | 2,831 | 20.2% |
| Greek | 113 | 0.8% |
| Guatemalan | 91 | 0.6% |
| Hungarian | 44 | 0.3% |
| Icelander | 9 | 0.1% |
| Indian (Asian) | 348 | 2.5% |
| Iranian | 52 | 0.4% |
| Irish | 1,895 | 13.5% |
| Italian | 861 | 6.1% |
| Jamaican | 43 | 0.3% |
| Japanese | 20 | 0.1% |
| Korean | 26 | 0.2% |
| Laotian | 7 | 0.1% |
| Latvian | 35 | 0.3% |
| Lebanese | 15 | 0.1% |
| Lithuanian | 14 | 0.1% |
| Mexican | 255 | 1.8% |
| Moroccan | 14 | 0.1% |
| Native Hawaiian | 9 | 0.1% |
| Navajo | 8 | 0.1% |
| Nigerian | 14 | 0.1% |
| Northern European | 39 | 0.3% |
| Norwegian | 332 | 2.4% |
| Pakistani | 7 | 0.1% |
| Peruvian | 10 | 0.1% |
| Polish | 564 | 4.0% |
| Portuguese | 9 | 0.1% |
| Potawatomi | 16 | 0.1% |
| Puerto Rican | 134 | 1.0% |
| Russian | 255 | 1.8% |
| Scandinavian | 47 | 0.3% |
| Scotch-Irish | 125 | 0.9% |
| Scottish | 303 | 2.2% |
| Serbian | 16 | 0.1% |
| Slovak | 37 | 0.3% |
| Slovene | 11 | 0.1% |
| South American | 138 | 1.0% |
| Spanish | 68 | 0.5% |
| Spanish American | 30 | 0.2% |
| Sri Lankan | 160 | 1.1% |
| Subsaharan African | 23 | 0.2% |
| Swedish | 438 | 3.1% |
| Swiss | 81 | 0.6% |
| Thai | 688 | 4.9% |
| Trinidadian and Tobagonian | 16 | 0.1% |
| Turkish | 10 | 0.1% |
| Ukrainian | 72 | 0.5% |
| Welsh | 140 | 1.0% | View All 77 Rows |
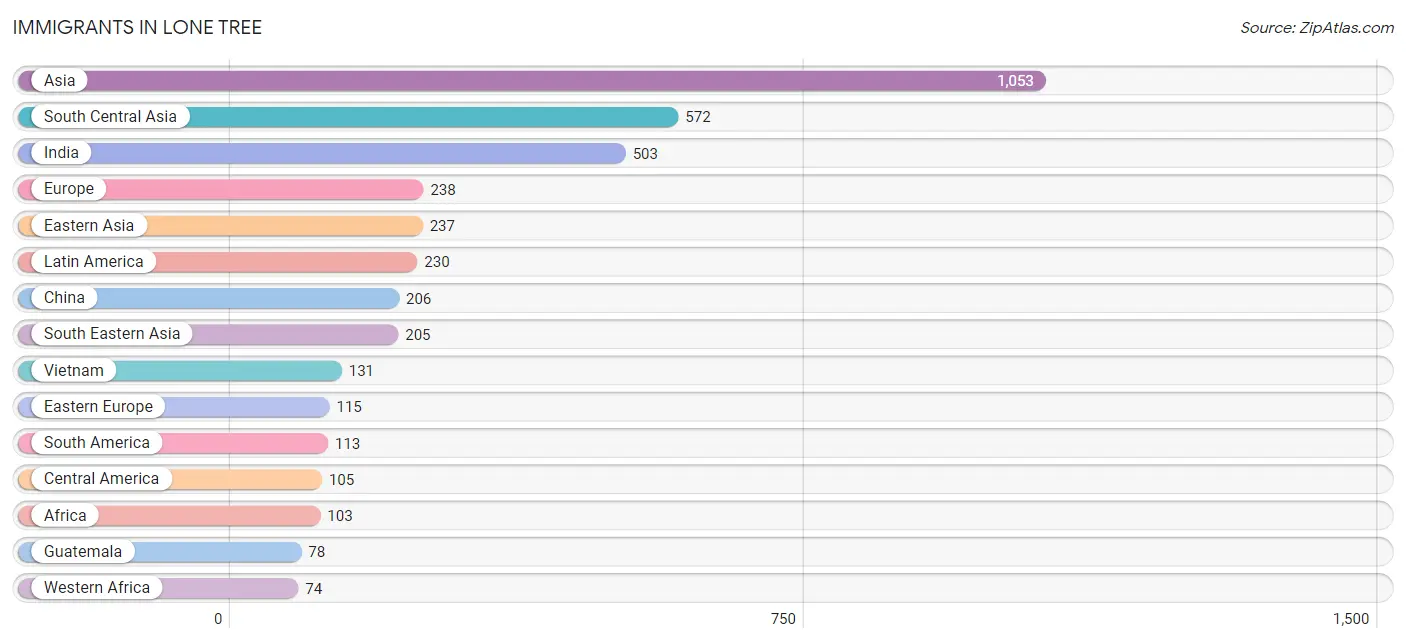
Immigrants in Lone Tree
The most numerous immigrant groups reported in Lone Tree came from Asia (1,053 | 7.5%), South Central Asia (572 | 4.1%), India (503 | 3.6%), Europe (238 | 1.7%), and Eastern Asia (237 | 1.7%), together accounting for 18.6% of all Lone Tree residents.
| Immigration Origin | # Population | % Population |
| Africa | 103 | 0.7% |
| Argentina | 38 | 0.3% |
| Asia | 1,053 | 7.5% |
| Belarus | 11 | 0.1% |
| Bolivia | 24 | 0.2% |
| Bosnia and Herzegovina | 8 | 0.1% |
| Brazil | 9 | 0.1% |
| Cambodia | 6 | 0.0% |
| Canada | 18 | 0.1% |
| Caribbean | 12 | 0.1% |
| Central America | 105 | 0.7% |
| China | 206 | 1.5% |
| Colombia | 34 | 0.2% |
| Cuba | 12 | 0.1% |
| Czechoslovakia | 9 | 0.1% |
| Eastern Asia | 237 | 1.7% |
| Eastern Europe | 115 | 0.8% |
| England | 19 | 0.1% |
| Europe | 238 | 1.7% |
| France | 53 | 0.4% |
| Germany | 17 | 0.1% |
| Guatemala | 78 | 0.6% |
| India | 503 | 3.6% |
| Indonesia | 46 | 0.3% |
| Iran | 31 | 0.2% |
| Italy | 10 | 0.1% |
| Japan | 21 | 0.2% |
| Korea | 10 | 0.1% |
| Latin America | 230 | 1.6% |
| Mexico | 27 | 0.2% |
| Morocco | 9 | 0.1% |
| Nigeria | 14 | 0.1% |
| Northern Africa | 9 | 0.1% |
| Northern Europe | 43 | 0.3% |
| Philippines | 15 | 0.1% |
| Poland | 20 | 0.1% |
| Russia | 67 | 0.5% |
| Saudi Arabia | 28 | 0.2% |
| Senegal | 60 | 0.4% |
| South Africa | 20 | 0.1% |
| South America | 113 | 0.8% |
| South Central Asia | 572 | 4.1% |
| South Eastern Asia | 205 | 1.5% |
| Southern Europe | 10 | 0.1% |
| Sri Lanka | 15 | 0.1% |
| Thailand | 7 | 0.1% |
| Vietnam | 131 | 0.9% |
| Western Africa | 74 | 0.5% |
| Western Asia | 28 | 0.2% |
| Western Europe | 70 | 0.5% | View All 50 Rows |
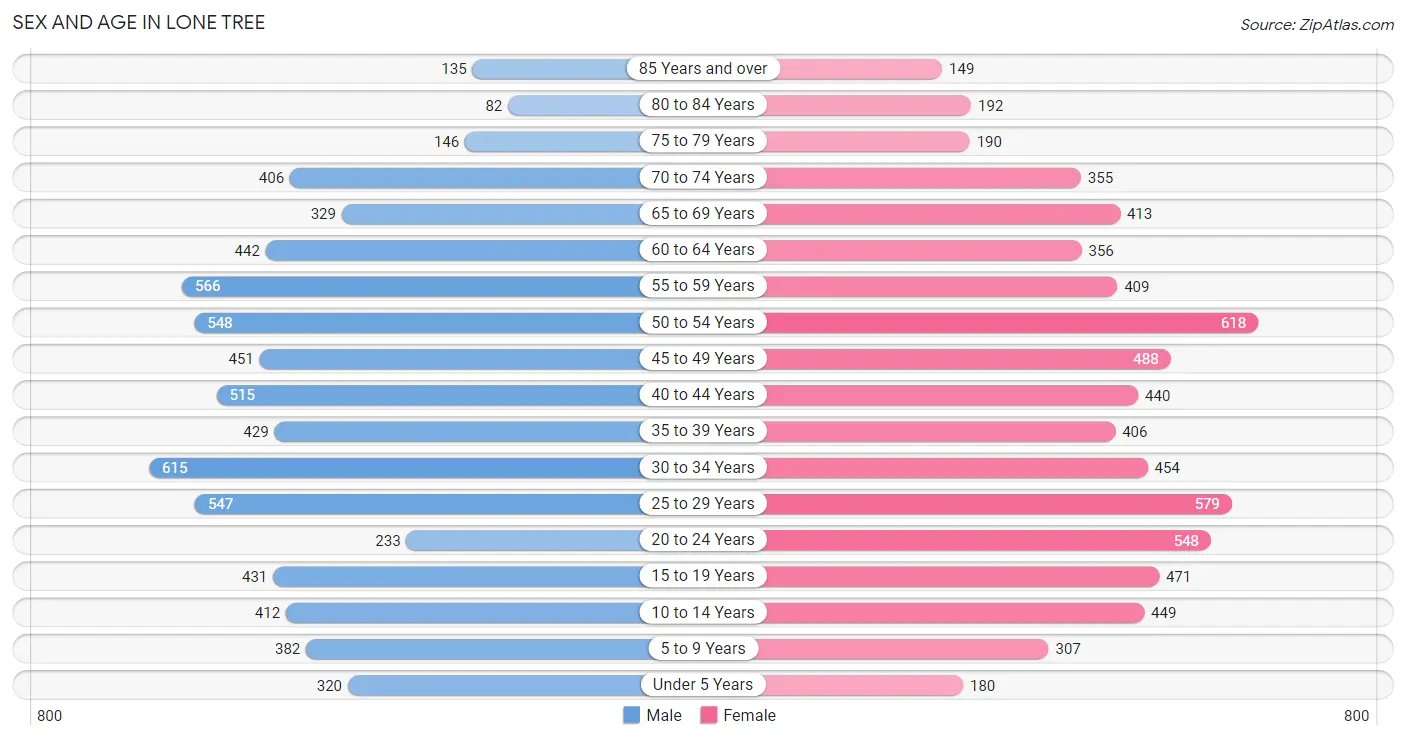
Sex and Age in Lone Tree
Sex and Age in Lone Tree
The most populous age groups in Lone Tree are 30 to 34 Years (615 | 8.8%) for men and 50 to 54 Years (618 | 8.8%) for women.
| Age Bracket | Male | Female |
| Under 5 Years | 320 (4.6%) | 180 (2.6%) |
| 5 to 9 Years | 382 (5.5%) | 307 (4.4%) |
| 10 to 14 Years | 412 (5.9%) | 449 (6.4%) |
| 15 to 19 Years | 431 (6.2%) | 471 (6.7%) |
| 20 to 24 Years | 233 (3.3%) | 548 (7.8%) |
| 25 to 29 Years | 547 (7.8%) | 579 (8.3%) |
| 30 to 34 Years | 615 (8.8%) | 454 (6.5%) |
| 35 to 39 Years | 429 (6.1%) | 406 (5.8%) |
| 40 to 44 Years | 515 (7.4%) | 440 (6.3%) |
| 45 to 49 Years | 451 (6.5%) | 488 (7.0%) |
| 50 to 54 Years | 548 (7.8%) | 618 (8.8%) |
| 55 to 59 Years | 566 (8.1%) | 409 (5.8%) |
| 60 to 64 Years | 442 (6.3%) | 356 (5.1%) |
| 65 to 69 Years | 329 (4.7%) | 413 (5.9%) |
| 70 to 74 Years | 406 (5.8%) | 355 (5.1%) |
| 75 to 79 Years | 146 (2.1%) | 190 (2.7%) |
| 80 to 84 Years | 82 (1.2%) | 192 (2.7%) |
| 85 Years and over | 135 (1.9%) | 149 (2.1%) |
| Total | 6,989 (100.0%) | 7,004 (100.0%) |
Families and Households in Lone Tree
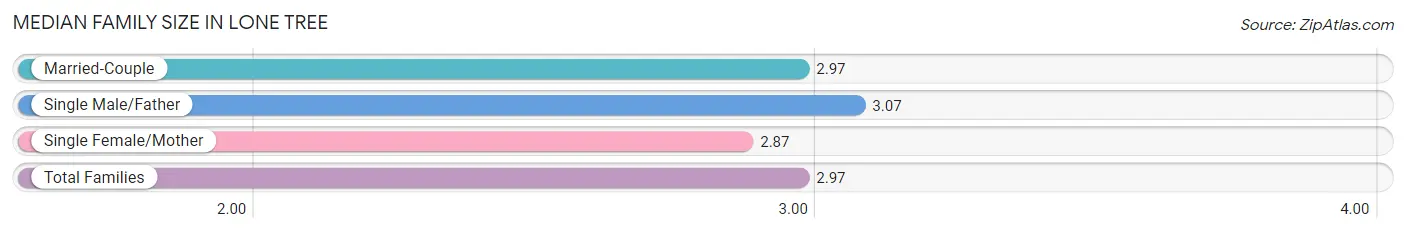
Median Family Size in Lone Tree
The median family size in Lone Tree is 2.97 persons per family, with single male/father families (174 | 5.0%) accounting for the largest median family size of 3.07 persons per family. On the other hand, single female/mother families (339 | 9.7%) represent the smallest median family size with 2.87 persons per family.
| Family Type | # Families | Family Size |
| Married-Couple | 2,995 (85.4%) | 2.97 |
| Single Male/Father | 174 (5.0%) | 3.07 |
| Single Female/Mother | 339 (9.7%) | 2.87 |
| Total Families | 3,508 (100.0%) | 2.97 |
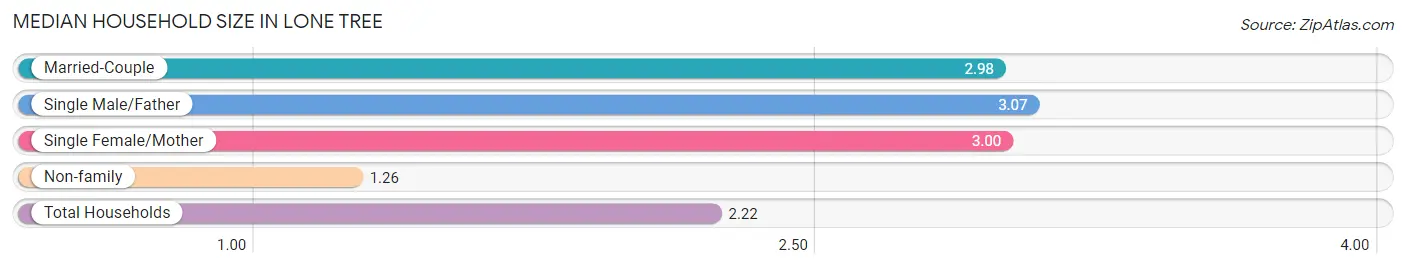
Median Household Size in Lone Tree
The median household size in Lone Tree is 2.22 persons per household, with single male/father households (174 | 2.8%) accounting for the largest median household size of 3.07 persons per household. non-family households (2,784 | 44.3%) represent the smallest median household size with 1.26 persons per household.
| Household Type | # Households | Household Size |
| Married-Couple | 2,995 (47.6%) | 2.98 |
| Single Male/Father | 174 (2.8%) | 3.07 |
| Single Female/Mother | 339 (5.4%) | 3.00 |
| Non-family | 2,784 (44.3%) | 1.26 |
| Total Households | 6,292 (100.0%) | 2.22 |
Household Size by Marriage Status in Lone Tree
Out of a total of 6,292 households in Lone Tree, 3,508 (55.7%) are family households, while 2,784 (44.3%) are nonfamily households. The most numerous type of family households are 2-person households, comprising 1,761, and the most common type of nonfamily households are 1-person households, comprising 2,146.
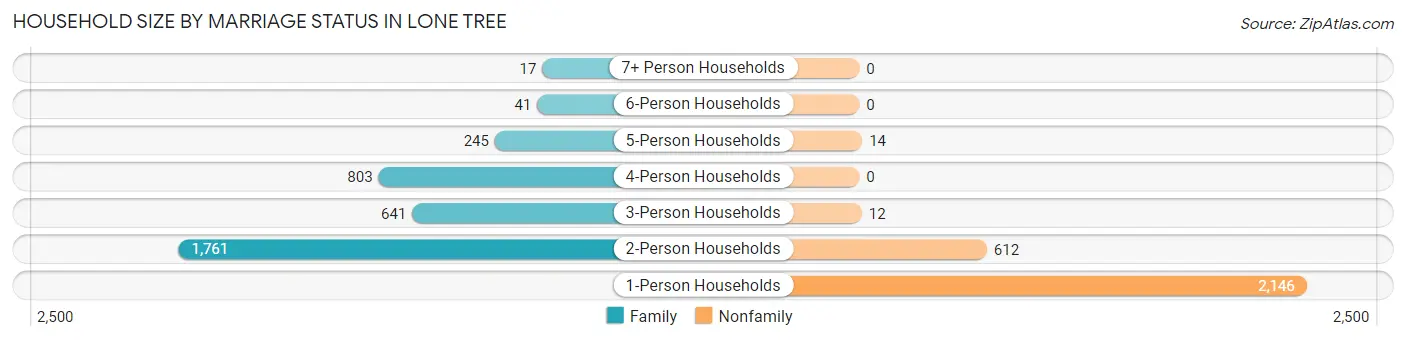
| Household Size | Family Households | Nonfamily Households |
| 1-Person Households | - | 2,146 (34.1%) |
| 2-Person Households | 1,761 (28.0%) | 612 (9.7%) |
| 3-Person Households | 641 (10.2%) | 12 (0.2%) |
| 4-Person Households | 803 (12.8%) | 0 (0.0%) |
| 5-Person Households | 245 (3.9%) | 14 (0.2%) |
| 6-Person Households | 41 (0.6%) | 0 (0.0%) |
| 7+ Person Households | 17 (0.3%) | 0 (0.0%) |
| Total | 3,508 (55.7%) | 2,784 (44.3%) |
Female Fertility in Lone Tree
Fertility by Age in Lone Tree
Average fertility rate in Lone Tree is 34.0 births per 1,000 women. Women in the age bracket of 35 to 50 years have the highest fertility rate with 59.0 births per 1,000 women. Women in the age bracket of 35 to 50 years acount for 71.4% of all women with births.
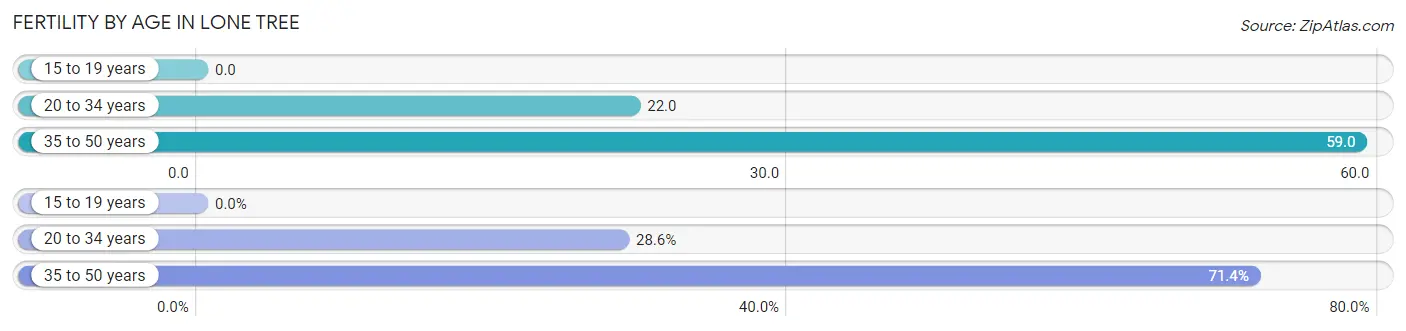
| Age Bracket | Women with Births | Births / 1,000 Women |
| 15 to 19 years | 0 (0.0%) | 0.0 |
| 20 to 34 years | 34 (28.6%) | 22.0 |
| 35 to 50 years | 85 (71.4%) | 59.0 |
| Total | 119 (100.0%) | 34.0 |
Fertility by Age by Marriage Status in Lone Tree
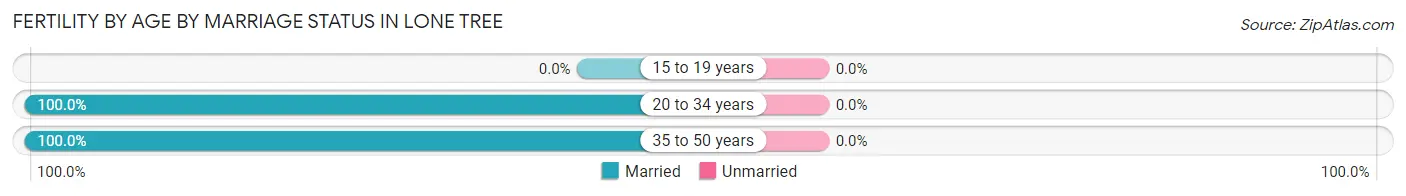
| Age Bracket | Married | Unmarried |
| 15 to 19 years | 0 (0.0%) | 0 (0.0%) |
| 20 to 34 years | 34 (100.0%) | 0 (0.0%) |
| 35 to 50 years | 85 (100.0%) | 0 (0.0%) |
| Total | 119 (100.0%) | 0 (0.0%) |
Fertility by Education in Lone Tree
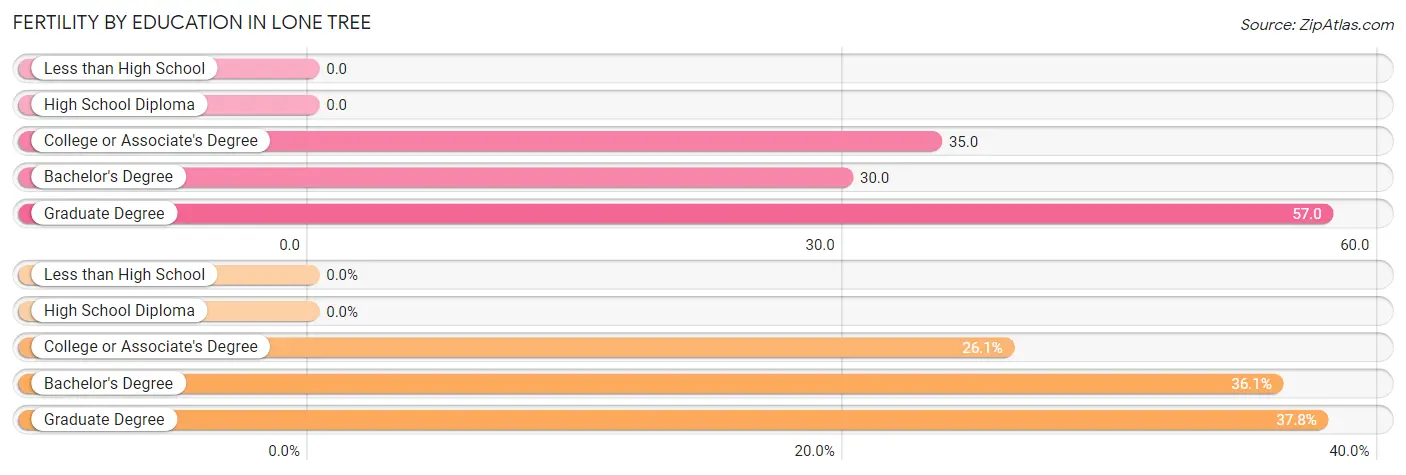
| Educational Attainment | Women with Births | Births / 1,000 Women |
| Less than High School | 0 (0.0%) | 0.0 |
| High School Diploma | 0 (0.0%) | 0.0 |
| College or Associate's Degree | 31 (26.1%) | 35.0 |
| Bachelor's Degree | 43 (36.1%) | 30.0 |
| Graduate Degree | 45 (37.8%) | 57.0 |
| Total | 119 (100.0%) | 34.0 |
Fertility by Education by Marriage Status in Lone Tree
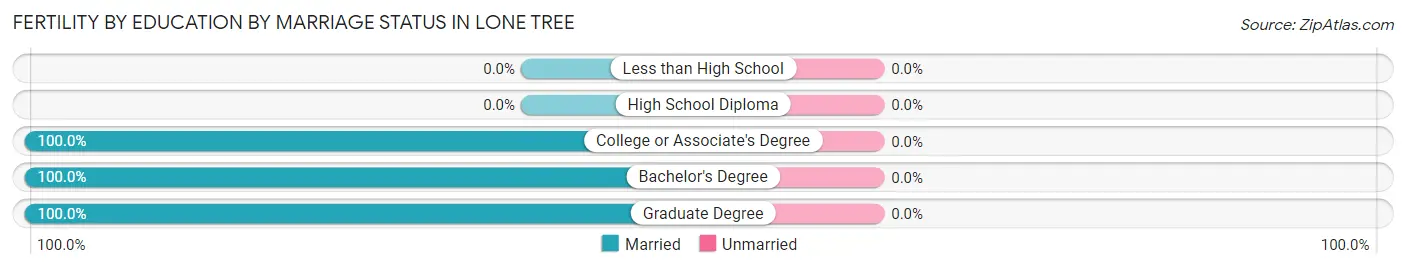
| Educational Attainment | Married | Unmarried |
| Less than High School | 0 (0.0%) | 0 (0.0%) |
| High School Diploma | 0 (0.0%) | 0 (0.0%) |
| College or Associate's Degree | 31 (100.0%) | 0 (0.0%) |
| Bachelor's Degree | 43 (100.0%) | 0 (0.0%) |
| Graduate Degree | 45 (100.0%) | 0 (0.0%) |
| Total | 119 (100.0%) | 0 (0.0%) |
Employment Characteristics in Lone Tree
Employment by Class of Employer in Lone Tree
Among the 8,046 employed individuals in Lone Tree, private company employees (5,966 | 74.2%), self-employed (not incorporated) (561 | 7.0%), and self-employed (incorporated) (551 | 6.9%) make up the most common classes of employment.
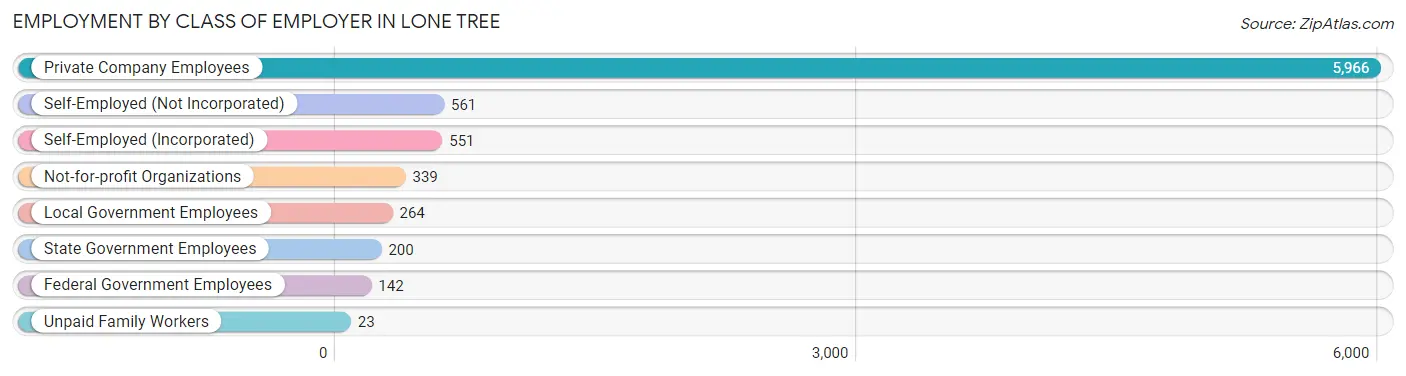
| Employer Class | # Employees | % Employees |
| Private Company Employees | 5,966 | 74.2% |
| Self-Employed (Incorporated) | 551 | 6.9% |
| Self-Employed (Not Incorporated) | 561 | 7.0% |
| Not-for-profit Organizations | 339 | 4.2% |
| Local Government Employees | 264 | 3.3% |
| State Government Employees | 200 | 2.5% |
| Federal Government Employees | 142 | 1.8% |
| Unpaid Family Workers | 23 | 0.3% |
| Total | 8,046 | 100.0% |
Employment Status by Age in Lone Tree
According to the labor force statistics for Lone Tree, out of the total population over 16 years of age (11,774), 73.1% or 8,607 individuals are in the labor force, with 4.1% or 353 of them unemployed. The age group with the highest labor force participation rate is 30 to 34 years, with 96.8% or 1,035 individuals in the labor force. Within the labor force, the 16 to 19 years age range has the highest percentage of unemployed individuals, with 21.7% or 89 of them being unemployed.
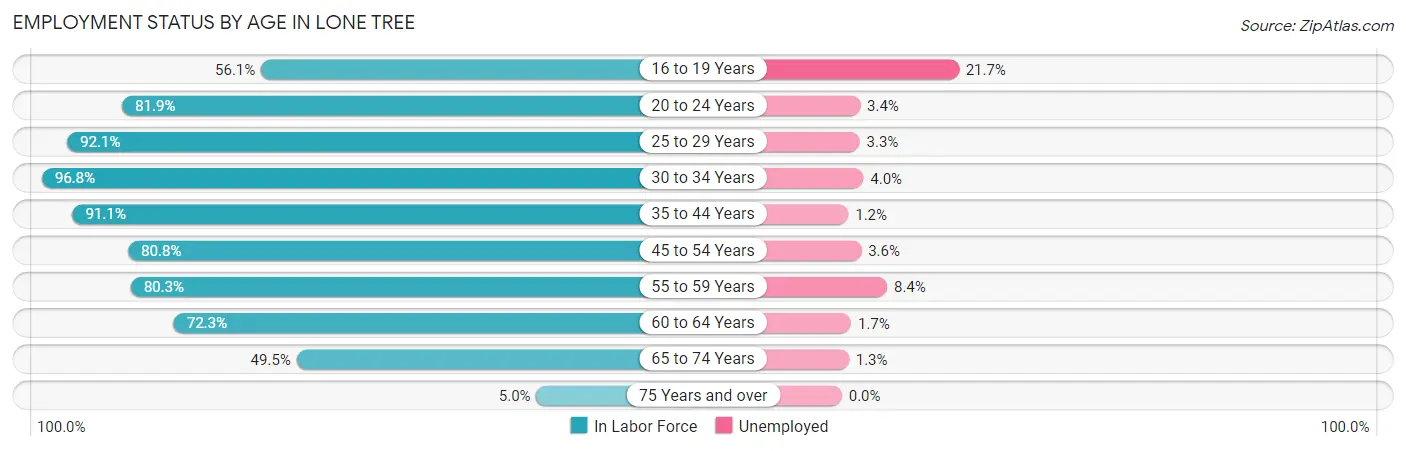
| Age Bracket | In Labor Force | Unemployed |
| 16 to 19 Years | 411 (56.1%) | 89 (21.7%) |
| 20 to 24 Years | 640 (81.9%) | 22 (3.4%) |
| 25 to 29 Years | 1,037 (92.1%) | 34 (3.3%) |
| 30 to 34 Years | 1,035 (96.8%) | 41 (4.0%) |
| 35 to 44 Years | 1,631 (91.1%) | 20 (1.2%) |
| 45 to 54 Years | 1,701 (80.8%) | 61 (3.6%) |
| 55 to 59 Years | 783 (80.3%) | 66 (8.4%) |
| 60 to 64 Years | 577 (72.3%) | 10 (1.7%) |
| 65 to 74 Years | 744 (49.5%) | 10 (1.3%) |
| 75 Years and over | 45 (5.0%) | 0 (0.0%) |
| Total | 8,607 (73.1%) | 353 (4.1%) |
Employment Status by Educational Attainment in Lone Tree
According to labor force statistics for Lone Tree, 86.0% of individuals (6,762) out of the total population between 25 and 64 years of age (7,863) are in the labor force, with 3.4% or 230 of them being unemployed. The group with the highest labor force participation rate are those with the educational attainment of less than high school, with 100.0% or 131 individuals in the labor force. Within the labor force, individuals with high school diploma education have the highest percentage of unemployment, with 12.8% or 28 of them being unemployed.
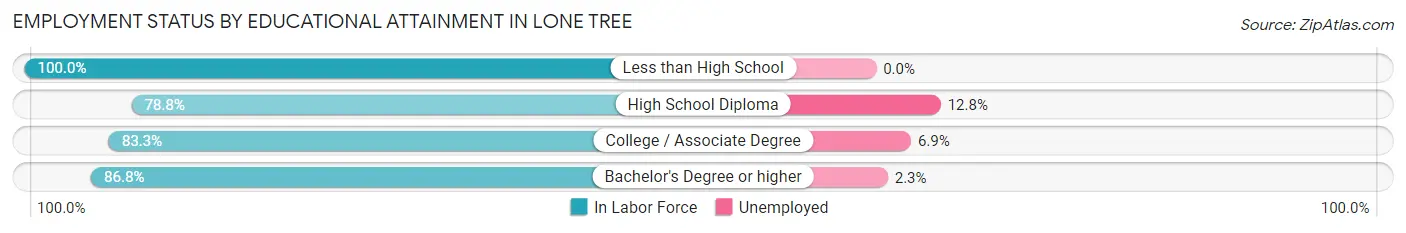
| Educational Attainment | In Labor Force | Unemployed |
| Less than High School | 131 (100.0%) | 0 (0.0%) |
| High School Diploma | 219 (78.8%) | 36 (12.8%) |
| College / Associate Degree | 1,289 (83.3%) | 107 (6.9%) |
| Bachelor's Degree or higher | 5,126 (86.8%) | 136 (2.3%) |
| Total | 6,762 (86.0%) | 267 (3.4%) |
Employment Occupations by Sex in Lone Tree
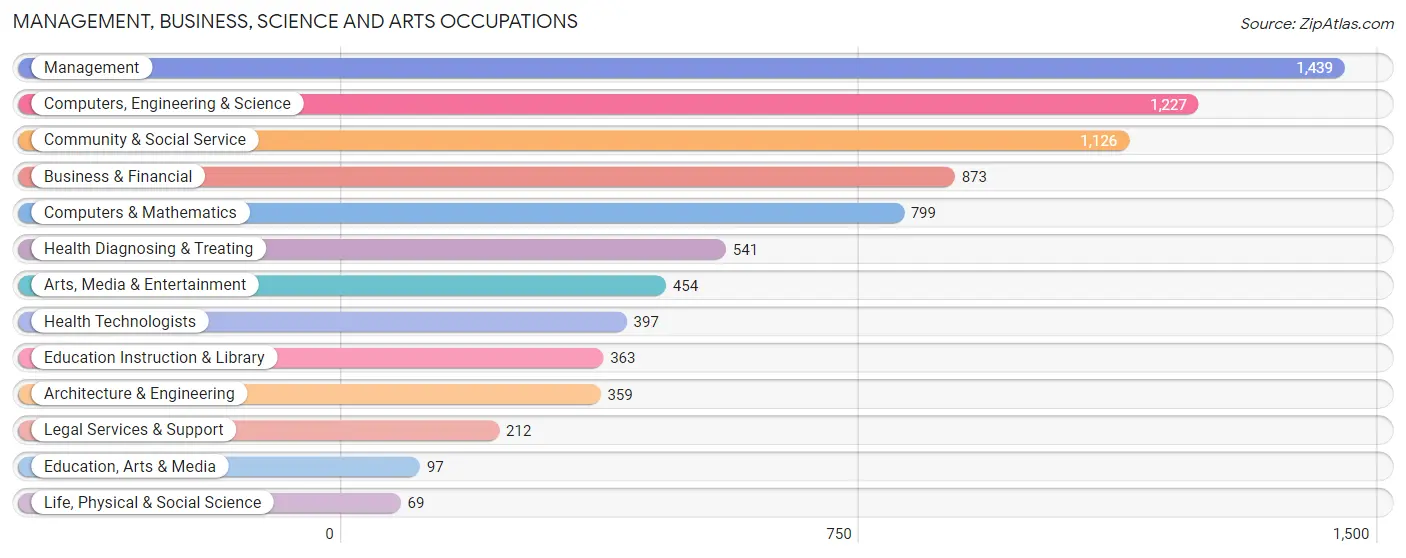
Management, Business, Science and Arts Occupations
The most common Management, Business, Science and Arts occupations in Lone Tree are Management (1,439 | 17.5%), Computers, Engineering & Science (1,227 | 14.9%), Community & Social Service (1,126 | 13.7%), Business & Financial (873 | 10.6%), and Computers & Mathematics (799 | 9.7%).
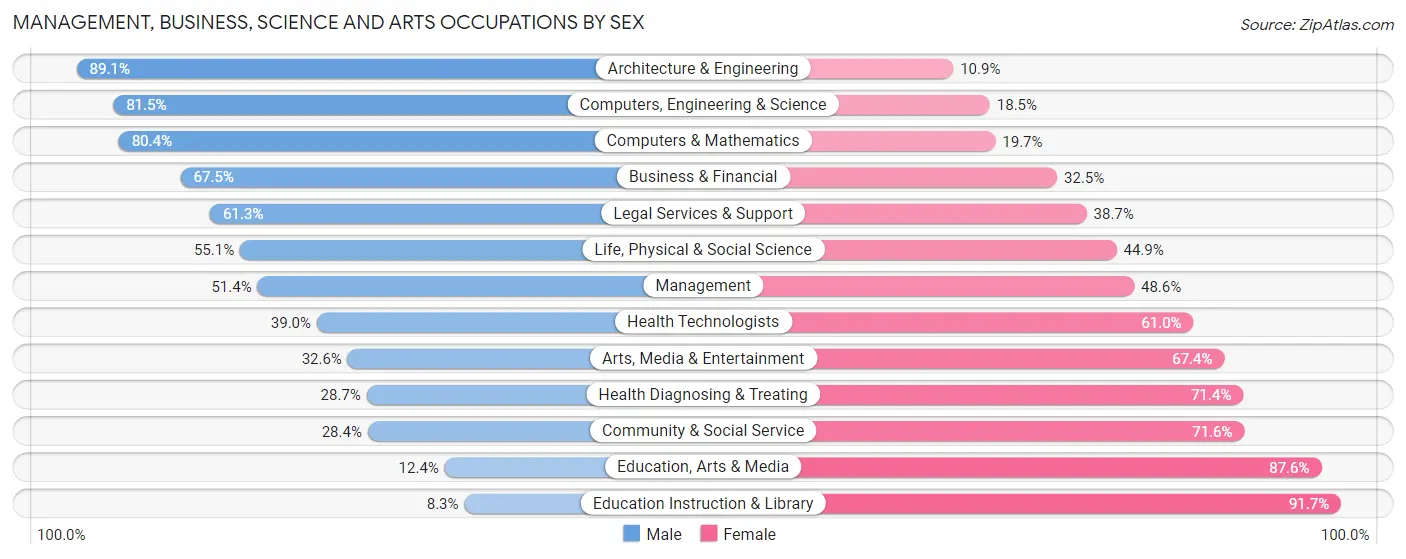
Management, Business, Science and Arts Occupations by Sex
Within the Management, Business, Science and Arts occupations in Lone Tree, the most male-oriented occupations are Architecture & Engineering (89.1%), Computers, Engineering & Science (81.5%), and Computers & Mathematics (80.3%), while the most female-oriented occupations are Education Instruction & Library (91.7%), Education, Arts & Media (87.6%), and Community & Social Service (71.6%).
| Occupation | Male | Female |
| Management | 740 (51.4%) | 699 (48.6%) |
| Business & Financial | 589 (67.5%) | 284 (32.5%) |
| Computers, Engineering & Science | 1,000 (81.5%) | 227 (18.5%) |
| Computers & Mathematics | 642 (80.3%) | 157 (19.7%) |
| Architecture & Engineering | 320 (89.1%) | 39 (10.9%) |
| Life, Physical & Social Science | 38 (55.1%) | 31 (44.9%) |
| Community & Social Service | 320 (28.4%) | 806 (71.6%) |
| Education, Arts & Media | 12 (12.4%) | 85 (87.6%) |
| Legal Services & Support | 130 (61.3%) | 82 (38.7%) |
| Education Instruction & Library | 30 (8.3%) | 333 (91.7%) |
| Arts, Media & Entertainment | 148 (32.6%) | 306 (67.4%) |
| Health Diagnosing & Treating | 155 (28.6%) | 386 (71.4%) |
| Health Technologists | 155 (39.0%) | 242 (61.0%) |
| Total (Category) | 2,804 (53.9%) | 2,402 (46.1%) |
| Total (Overall) | 4,390 (53.3%) | 3,838 (46.7%) |
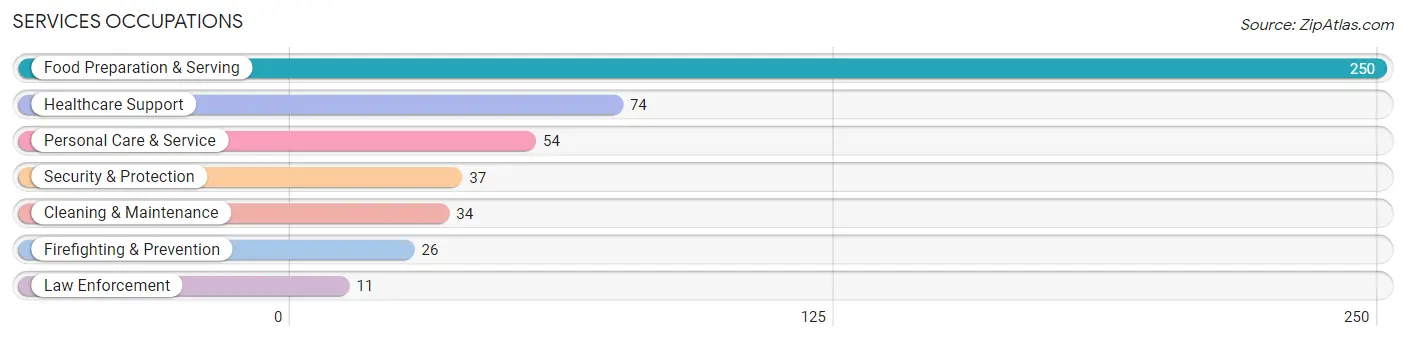
Services Occupations
The most common Services occupations in Lone Tree are Food Preparation & Serving (250 | 3.0%), Healthcare Support (74 | 0.9%), Personal Care & Service (54 | 0.7%), Security & Protection (37 | 0.4%), and Cleaning & Maintenance (34 | 0.4%).
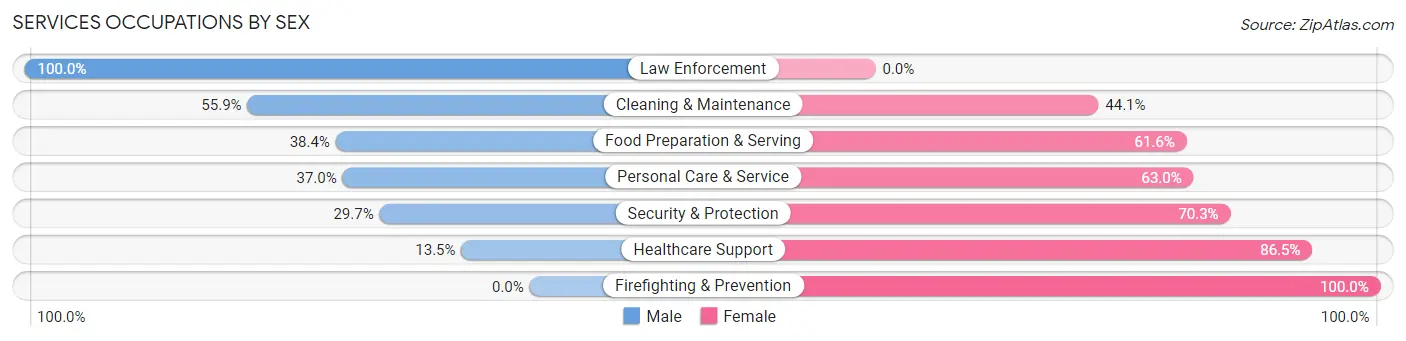
Services Occupations by Sex
Within the Services occupations in Lone Tree, the most male-oriented occupations are Law Enforcement (100.0%), Cleaning & Maintenance (55.9%), and Food Preparation & Serving (38.4%), while the most female-oriented occupations are Firefighting & Prevention (100.0%), Healthcare Support (86.5%), and Security & Protection (70.3%).
| Occupation | Male | Female |
| Healthcare Support | 10 (13.5%) | 64 (86.5%) |
| Security & Protection | 11 (29.7%) | 26 (70.3%) |
| Firefighting & Prevention | 0 (0.0%) | 26 (100.0%) |
| Law Enforcement | 11 (100.0%) | 0 (0.0%) |
| Food Preparation & Serving | 96 (38.4%) | 154 (61.6%) |
| Cleaning & Maintenance | 19 (55.9%) | 15 (44.1%) |
| Personal Care & Service | 20 (37.0%) | 34 (63.0%) |
| Total (Category) | 156 (34.7%) | 293 (65.3%) |
| Total (Overall) | 4,390 (53.3%) | 3,838 (46.7%) |
Sales and Office Occupations
The most common Sales and Office occupations in Lone Tree are Sales & Related (1,378 | 16.8%), and Office & Administration (567 | 6.9%).
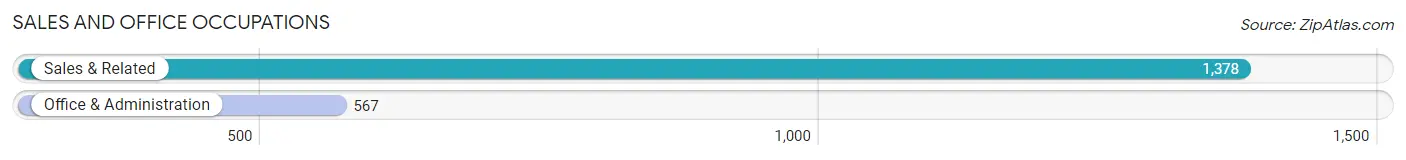
Sales and Office Occupations by Sex
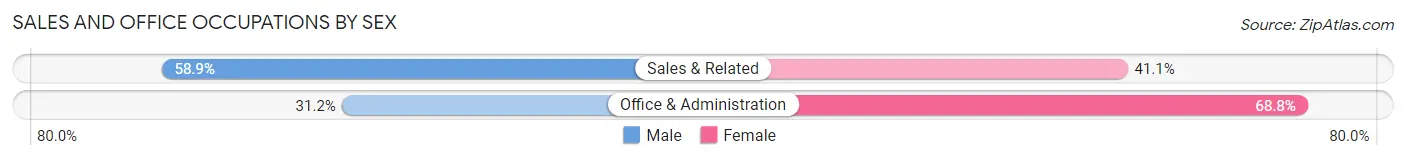
| Occupation | Male | Female |
| Sales & Related | 812 (58.9%) | 566 (41.1%) |
| Office & Administration | 177 (31.2%) | 390 (68.8%) |
| Total (Category) | 989 (50.8%) | 956 (49.1%) |
| Total (Overall) | 4,390 (53.3%) | 3,838 (46.7%) |
Natural Resources, Construction and Maintenance Occupations
The most common Natural Resources, Construction and Maintenance occupations in Lone Tree are Installation, Maintenance & Repair (192 | 2.3%), and Construction & Extraction (155 | 1.9%).
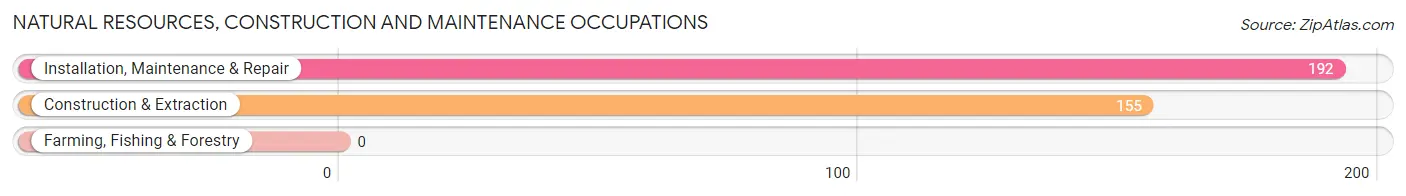
Natural Resources, Construction and Maintenance Occupations by Sex
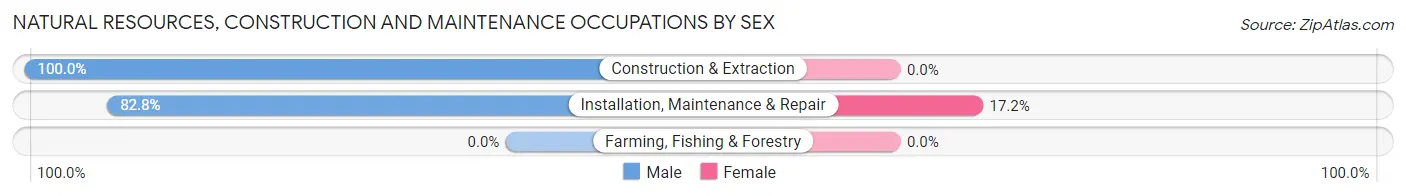
| Occupation | Male | Female |
| Farming, Fishing & Forestry | 0 (0.0%) | 0 (0.0%) |
| Construction & Extraction | 155 (100.0%) | 0 (0.0%) |
| Installation, Maintenance & Repair | 159 (82.8%) | 33 (17.2%) |
| Total (Category) | 314 (90.5%) | 33 (9.5%) |
| Total (Overall) | 4,390 (53.3%) | 3,838 (46.7%) |
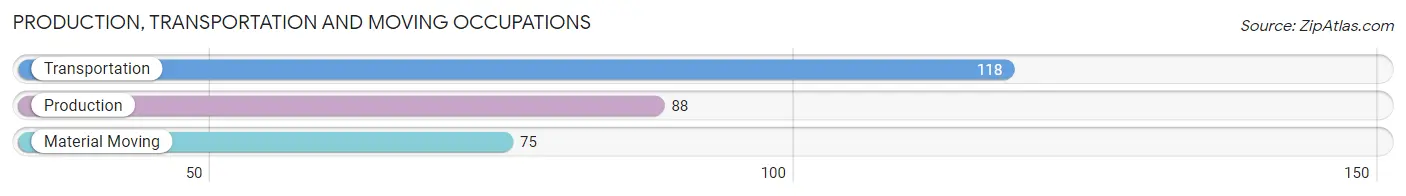
Production, Transportation and Moving Occupations
The most common Production, Transportation and Moving occupations in Lone Tree are Transportation (118 | 1.4%), Production (88 | 1.1%), and Material Moving (75 | 0.9%).
Production, Transportation and Moving Occupations by Sex
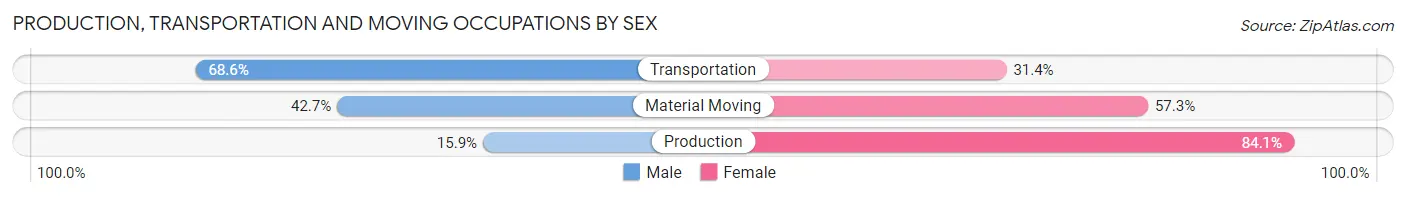
| Occupation | Male | Female |
| Production | 14 (15.9%) | 74 (84.1%) |
| Transportation | 81 (68.6%) | 37 (31.4%) |
| Material Moving | 32 (42.7%) | 43 (57.3%) |
| Total (Category) | 127 (45.2%) | 154 (54.8%) |
| Total (Overall) | 4,390 (53.3%) | 3,838 (46.7%) |
Employment Industries by Sex in Lone Tree
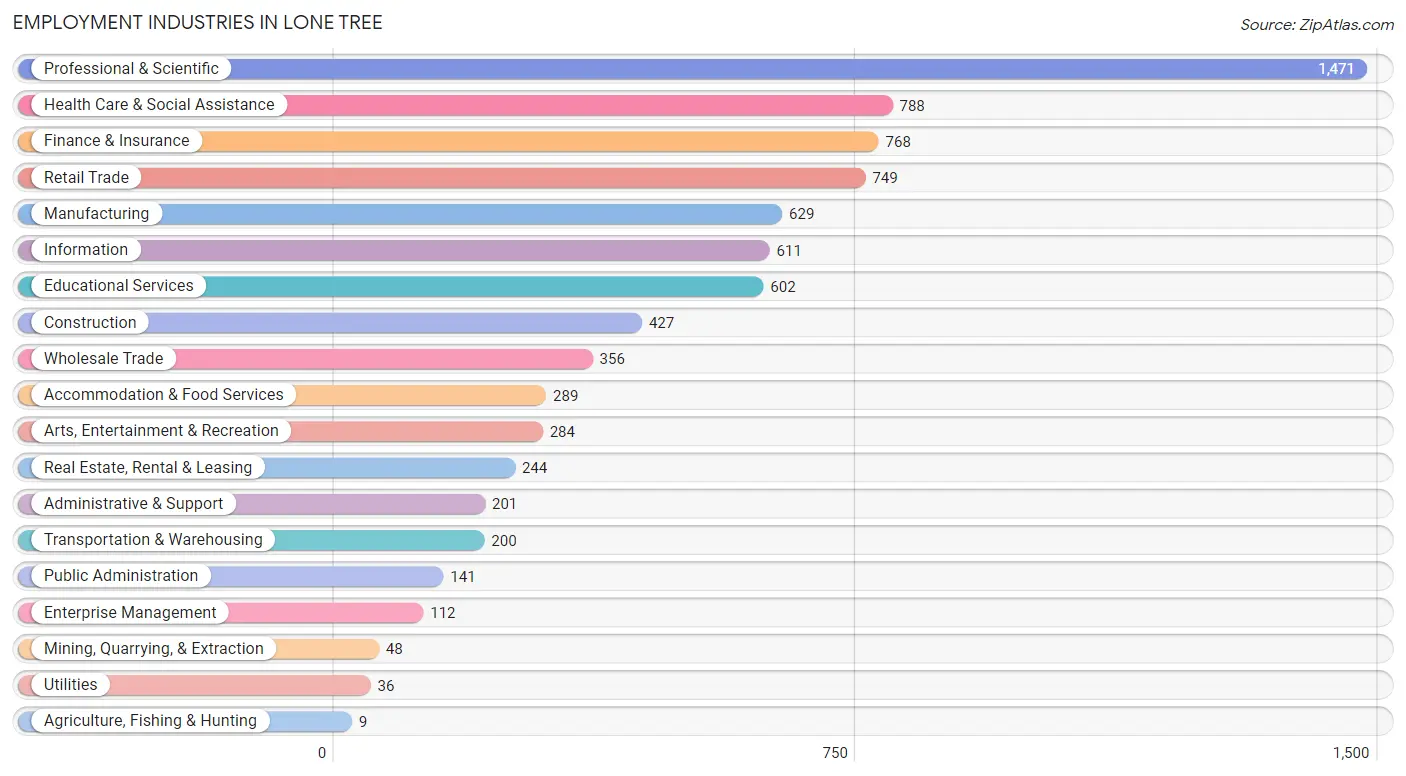
Employment Industries in Lone Tree
The major employment industries in Lone Tree include Professional & Scientific (1,471 | 17.9%), Health Care & Social Assistance (788 | 9.6%), Finance & Insurance (768 | 9.3%), Retail Trade (749 | 9.1%), and Manufacturing (629 | 7.6%).
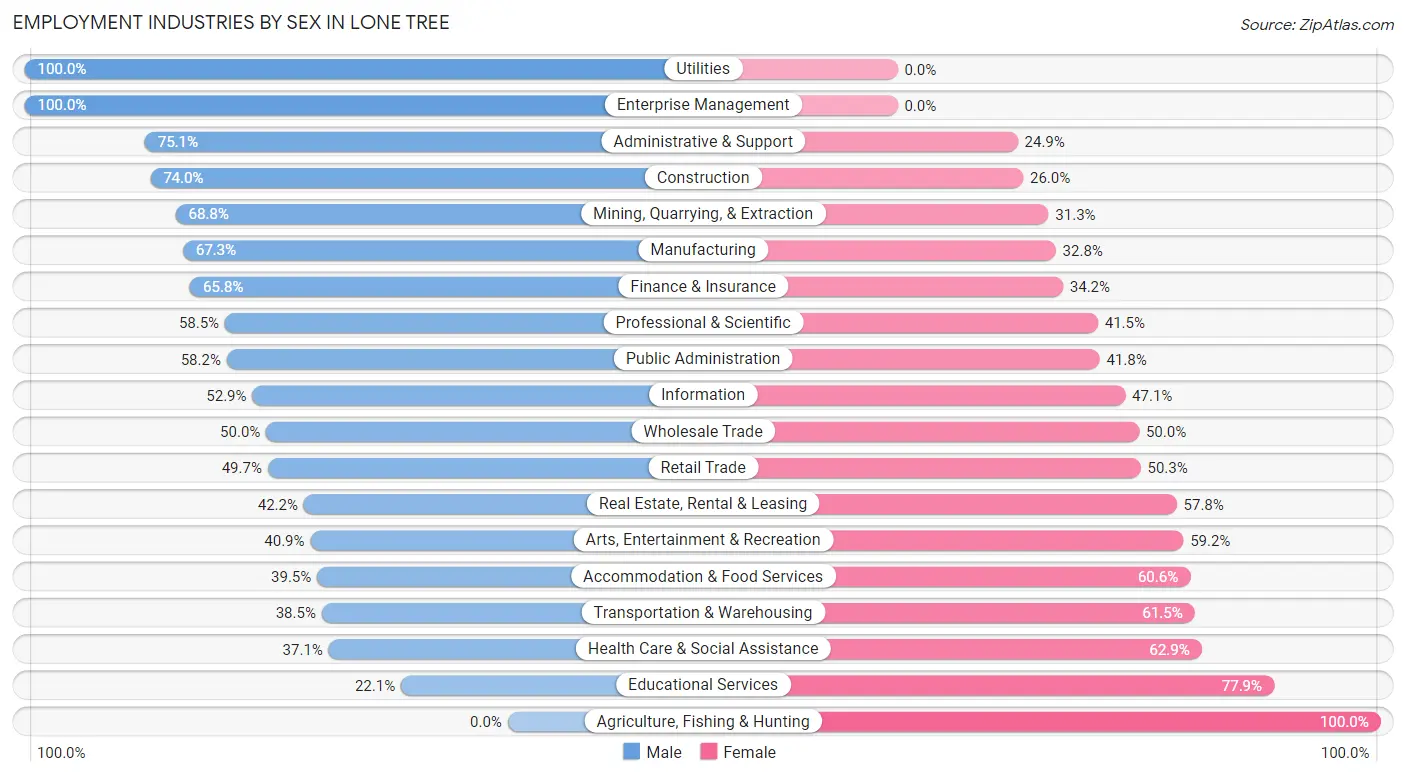
Employment Industries by Sex in Lone Tree
The Lone Tree industries that see more men than women are Utilities (100.0%), Enterprise Management (100.0%), and Administrative & Support (75.1%), whereas the industries that tend to have a higher number of women are Agriculture, Fishing & Hunting (100.0%), Educational Services (77.9%), and Health Care & Social Assistance (62.9%).
| Industry | Male | Female |
| Agriculture, Fishing & Hunting | 0 (0.0%) | 9 (100.0%) |
| Mining, Quarrying, & Extraction | 33 (68.8%) | 15 (31.2%) |
| Construction | 316 (74.0%) | 111 (26.0%) |
| Manufacturing | 423 (67.2%) | 206 (32.8%) |
| Wholesale Trade | 178 (50.0%) | 178 (50.0%) |
| Retail Trade | 372 (49.7%) | 377 (50.3%) |
| Transportation & Warehousing | 77 (38.5%) | 123 (61.5%) |
| Utilities | 36 (100.0%) | 0 (0.0%) |
| Information | 323 (52.9%) | 288 (47.1%) |
| Finance & Insurance | 505 (65.8%) | 263 (34.2%) |
| Real Estate, Rental & Leasing | 103 (42.2%) | 141 (57.8%) |
| Professional & Scientific | 861 (58.5%) | 610 (41.5%) |
| Enterprise Management | 112 (100.0%) | 0 (0.0%) |
| Administrative & Support | 151 (75.1%) | 50 (24.9%) |
| Educational Services | 133 (22.1%) | 469 (77.9%) |
| Health Care & Social Assistance | 292 (37.1%) | 496 (62.9%) |
| Arts, Entertainment & Recreation | 116 (40.8%) | 168 (59.2%) |
| Accommodation & Food Services | 114 (39.5%) | 175 (60.6%) |
| Public Administration | 82 (58.2%) | 59 (41.8%) |
| Total | 4,390 (53.3%) | 3,838 (46.7%) |
Education in Lone Tree
School Enrollment in Lone Tree
The most common levels of schooling among the 2,973 students in Lone Tree are high school (708 | 23.8%), middle school (701 | 23.6%), and elementary school (563 | 18.9%).
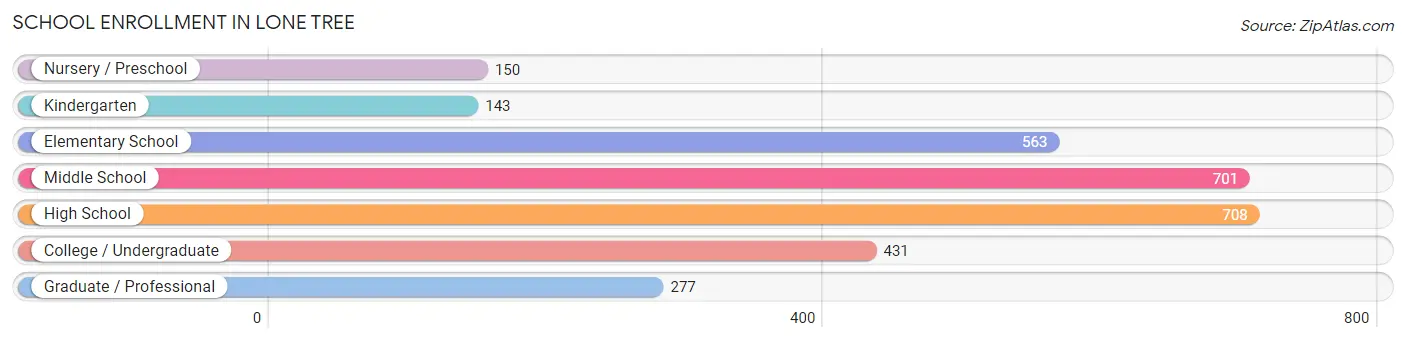
| School Level | # Students | % Students |
| Nursery / Preschool | 150 | 5.1% |
| Kindergarten | 143 | 4.8% |
| Elementary School | 563 | 18.9% |
| Middle School | 701 | 23.6% |
| High School | 708 | 23.8% |
| College / Undergraduate | 431 | 14.5% |
| Graduate / Professional | 277 | 9.3% |
| Total | 2,973 | 100.0% |
School Enrollment by Age by Funding Source in Lone Tree
Out of a total of 2,973 students who are enrolled in schools in Lone Tree, 740 (24.9%) attend a private institution, while the remaining 2,233 (75.1%) are enrolled in public schools. The age group of 3 to 4 year olds has the highest likelihood of being enrolled in private schools, with 108 (84.4% in the age bracket) enrolled. Conversely, the age group of 15 to 17 year olds has the lowest likelihood of being enrolled in a private school, with 382 (84.5% in the age bracket) attending a public institution.
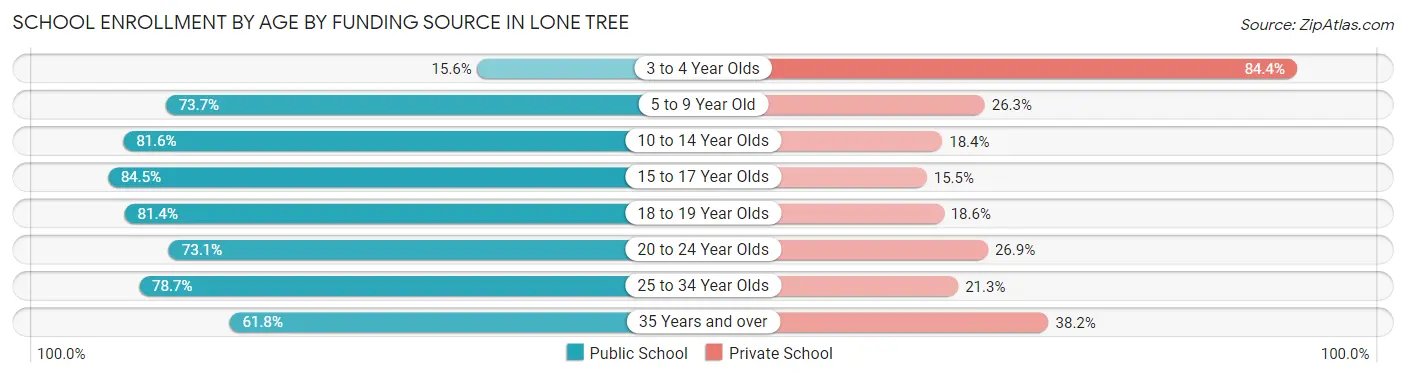
| Age Bracket | Public School | Private School |
| 3 to 4 Year Olds | 20 (15.6%) | 108 (84.4%) |
| 5 to 9 Year Old | 485 (73.7%) | 173 (26.3%) |
| 10 to 14 Year Olds | 693 (81.6%) | 156 (18.4%) |
| 15 to 17 Year Olds | 382 (84.5%) | 70 (15.5%) |
| 18 to 19 Year Olds | 179 (81.4%) | 41 (18.6%) |
| 20 to 24 Year Olds | 136 (73.1%) | 50 (26.9%) |
| 25 to 34 Year Olds | 188 (78.7%) | 51 (21.3%) |
| 35 Years and over | 149 (61.8%) | 92 (38.2%) |
| Total | 2,233 (75.1%) | 740 (24.9%) |
Educational Attainment by Field of Study in Lone Tree
Business (1,951 | 24.9%), engineering (1,030 | 13.2%), social sciences (741 | 9.5%), science & technology (544 | 7.0%), and computers & mathematics (521 | 6.7%) are the most common fields of study among 7,820 individuals in Lone Tree who have obtained a bachelor's degree or higher.
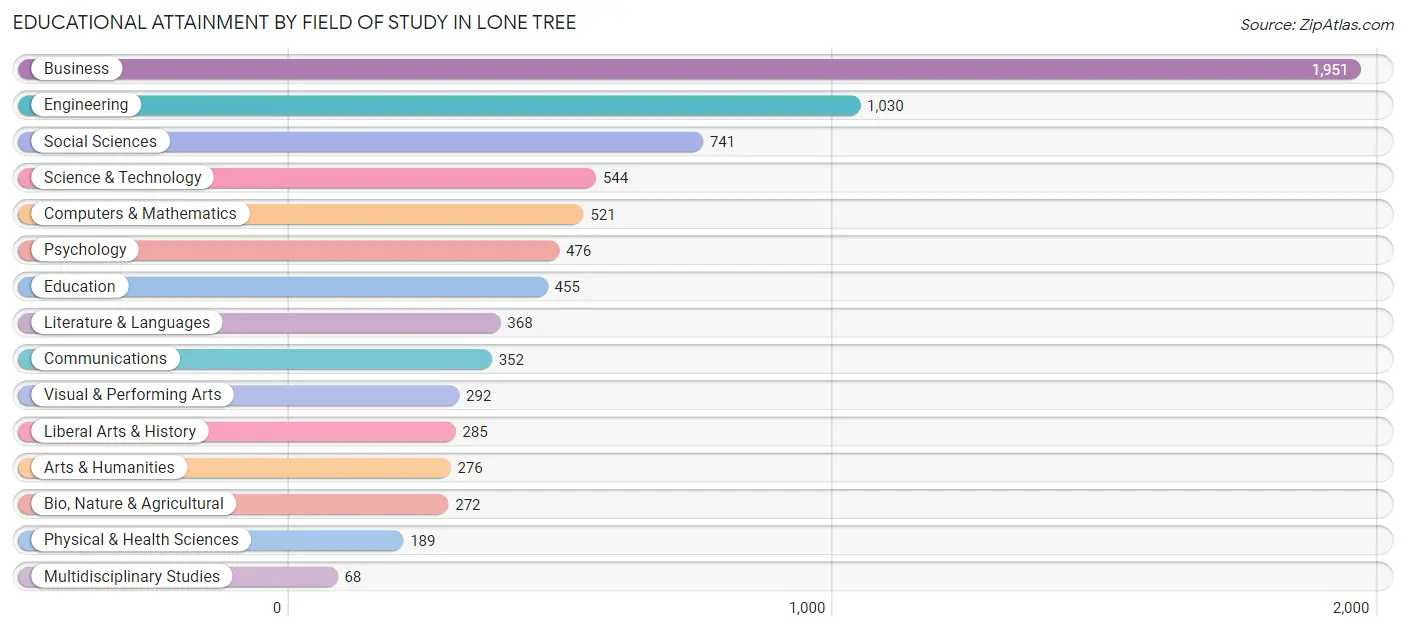
| Field of Study | # Graduates | % Graduates |
| Computers & Mathematics | 521 | 6.7% |
| Bio, Nature & Agricultural | 272 | 3.5% |
| Physical & Health Sciences | 189 | 2.4% |
| Psychology | 476 | 6.1% |
| Social Sciences | 741 | 9.5% |
| Engineering | 1,030 | 13.2% |
| Multidisciplinary Studies | 68 | 0.9% |
| Science & Technology | 544 | 7.0% |
| Business | 1,951 | 24.9% |
| Education | 455 | 5.8% |
| Literature & Languages | 368 | 4.7% |
| Liberal Arts & History | 285 | 3.6% |
| Visual & Performing Arts | 292 | 3.7% |
| Communications | 352 | 4.5% |
| Arts & Humanities | 276 | 3.5% |
| Total | 7,820 | 100.0% |
Transportation & Commute in Lone Tree
Vehicle Availability by Sex in Lone Tree
The most prevalent vehicle ownership categories in Lone Tree are males with 2 vehicles (1,929, accounting for 45.1%) and females with 2 vehicles (1,789, making up 51.2%).
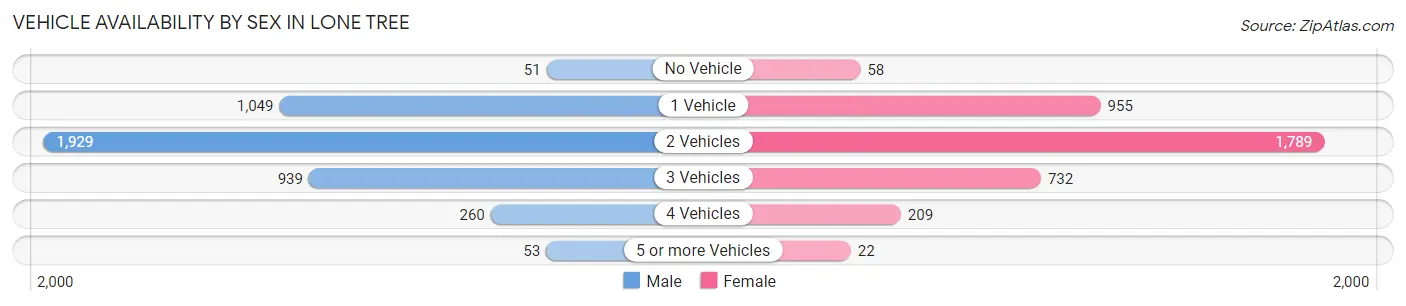
| Vehicles Available | Male | Female |
| No Vehicle | 51 (1.2%) | 58 (1.5%) |
| 1 Vehicle | 1,049 (24.5%) | 955 (25.4%) |
| 2 Vehicles | 1,929 (45.1%) | 1,789 (47.5%) |
| 3 Vehicles | 939 (21.9%) | 732 (19.4%) |
| 4 Vehicles | 260 (6.1%) | 209 (5.6%) |
| 5 or more Vehicles | 53 (1.2%) | 22 (0.6%) |
| Total | 4,281 (100.0%) | 3,765 (100.0%) |
Commute Time in Lone Tree
The most frequently occuring commute durations in Lone Tree are 15 to 19 minutes (1,291 commuters, 21.0%), 10 to 14 minutes (957 commuters, 15.5%), and 30 to 34 minutes (694 commuters, 11.3%).
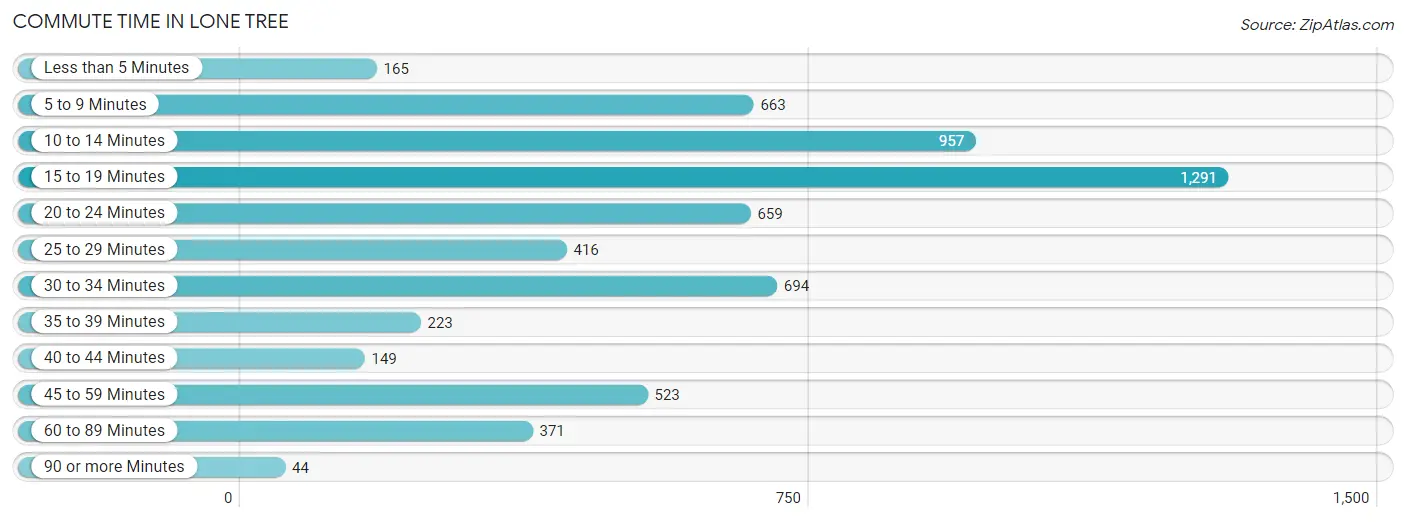
| Commute Time | # Commuters | % Commuters |
| Less than 5 Minutes | 165 | 2.7% |
| 5 to 9 Minutes | 663 | 10.8% |
| 10 to 14 Minutes | 957 | 15.5% |
| 15 to 19 Minutes | 1,291 | 21.0% |
| 20 to 24 Minutes | 659 | 10.7% |
| 25 to 29 Minutes | 416 | 6.8% |
| 30 to 34 Minutes | 694 | 11.3% |
| 35 to 39 Minutes | 223 | 3.6% |
| 40 to 44 Minutes | 149 | 2.4% |
| 45 to 59 Minutes | 523 | 8.5% |
| 60 to 89 Minutes | 371 | 6.0% |
| 90 or more Minutes | 44 | 0.7% |
Commute Time by Sex in Lone Tree
The most common commute times in Lone Tree are 15 to 19 minutes (728 commuters, 22.3%) for males and 15 to 19 minutes (563 commuters, 19.5%) for females.
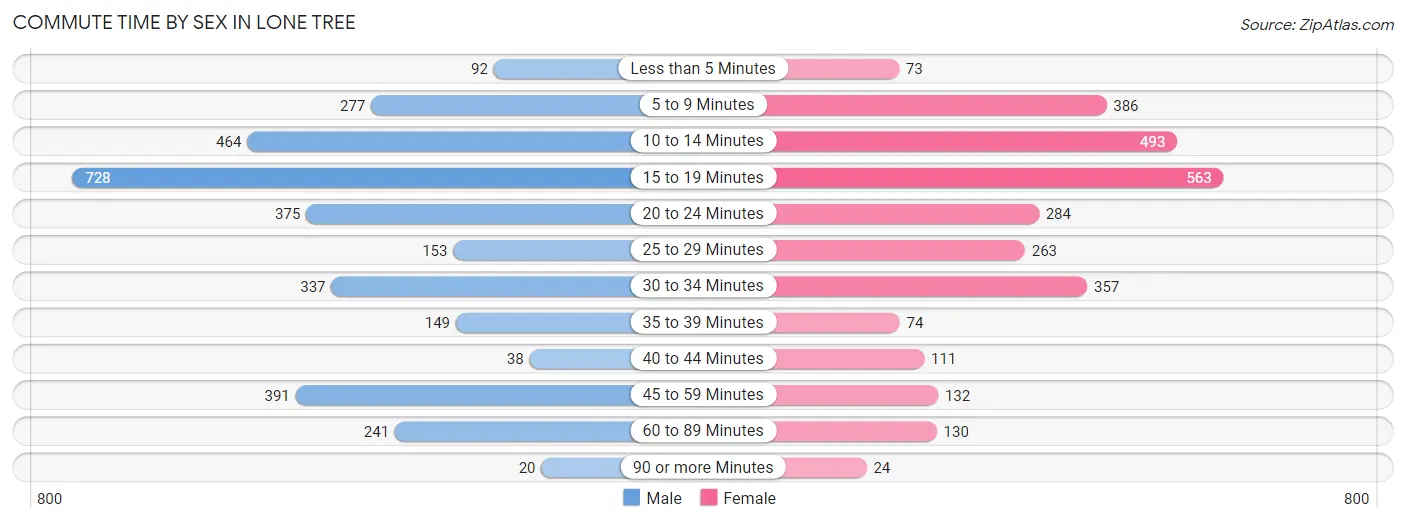
| Commute Time | Male | Female |
| Less than 5 Minutes | 92 (2.8%) | 73 (2.5%) |
| 5 to 9 Minutes | 277 (8.5%) | 386 (13.4%) |
| 10 to 14 Minutes | 464 (14.2%) | 493 (17.1%) |
| 15 to 19 Minutes | 728 (22.3%) | 563 (19.5%) |
| 20 to 24 Minutes | 375 (11.5%) | 284 (9.8%) |
| 25 to 29 Minutes | 153 (4.7%) | 263 (9.1%) |
| 30 to 34 Minutes | 337 (10.3%) | 357 (12.3%) |
| 35 to 39 Minutes | 149 (4.6%) | 74 (2.6%) |
| 40 to 44 Minutes | 38 (1.2%) | 111 (3.8%) |
| 45 to 59 Minutes | 391 (12.0%) | 132 (4.6%) |
| 60 to 89 Minutes | 241 (7.4%) | 130 (4.5%) |
| 90 or more Minutes | 20 (0.6%) | 24 (0.8%) |
Time of Departure to Work by Sex in Lone Tree
The most frequent times of departure to work in Lone Tree are 7:30 AM to 7:59 AM (529, 16.2%) for males and 7:00 AM to 7:29 AM (611, 21.1%) for females.
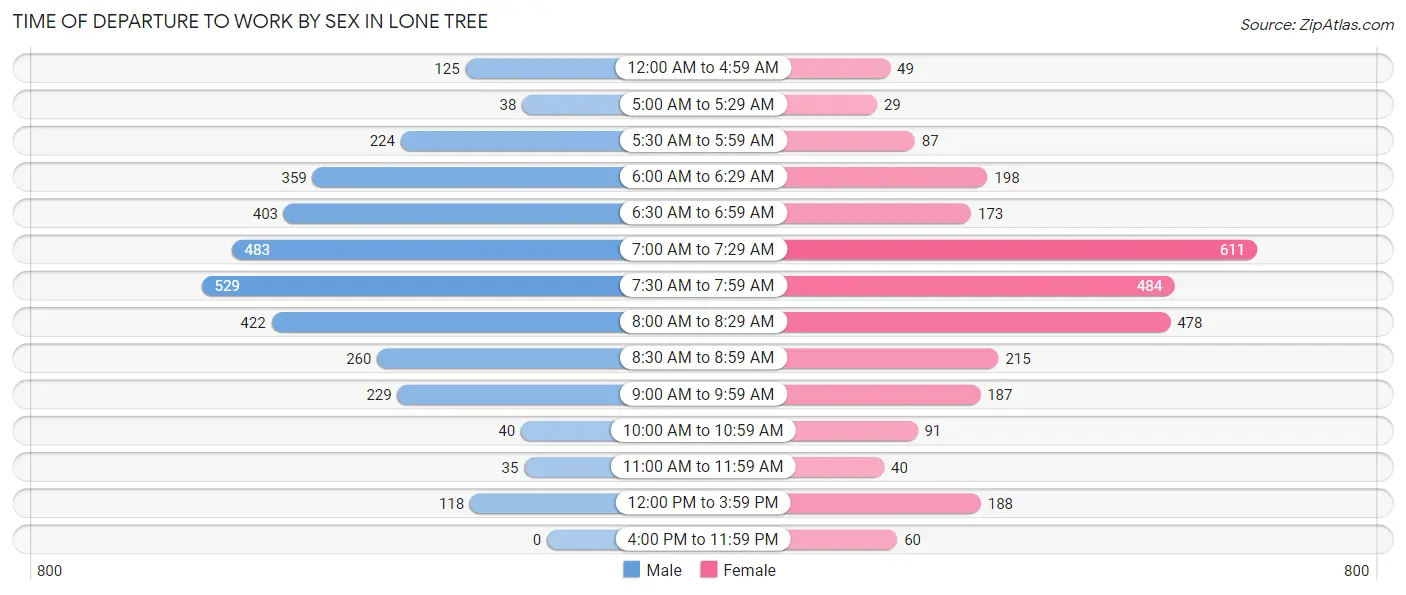
| Time of Departure | Male | Female |
| 12:00 AM to 4:59 AM | 125 (3.8%) | 49 (1.7%) |
| 5:00 AM to 5:29 AM | 38 (1.2%) | 29 (1.0%) |
| 5:30 AM to 5:59 AM | 224 (6.9%) | 87 (3.0%) |
| 6:00 AM to 6:29 AM | 359 (11.0%) | 198 (6.9%) |
| 6:30 AM to 6:59 AM | 403 (12.3%) | 173 (6.0%) |
| 7:00 AM to 7:29 AM | 483 (14.8%) | 611 (21.1%) |
| 7:30 AM to 7:59 AM | 529 (16.2%) | 484 (16.8%) |
| 8:00 AM to 8:29 AM | 422 (12.9%) | 478 (16.5%) |
| 8:30 AM to 8:59 AM | 260 (8.0%) | 215 (7.4%) |
| 9:00 AM to 9:59 AM | 229 (7.0%) | 187 (6.5%) |
| 10:00 AM to 10:59 AM | 40 (1.2%) | 91 (3.2%) |
| 11:00 AM to 11:59 AM | 35 (1.1%) | 40 (1.4%) |
| 12:00 PM to 3:59 PM | 118 (3.6%) | 188 (6.5%) |
| 4:00 PM to 11:59 PM | 0 (0.0%) | 60 (2.1%) |
| Total | 3,265 (100.0%) | 2,890 (100.0%) |
Housing Occupancy in Lone Tree
Occupancy by Ownership in Lone Tree
Of the total 6,292 dwellings in Lone Tree, owner-occupied units account for 3,680 (58.5%), while renter-occupied units make up 2,612 (41.5%).
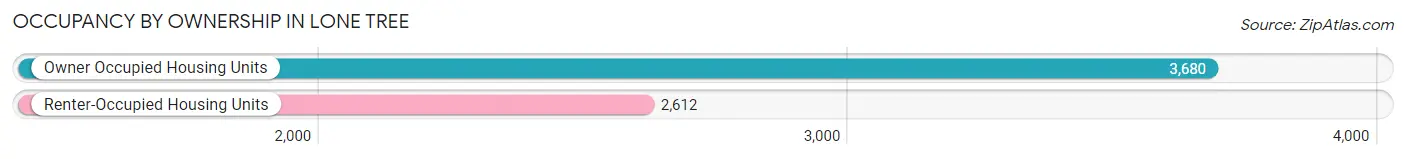
| Occupancy | # Housing Units | % Housing Units |
| Owner Occupied Housing Units | 3,680 | 58.5% |
| Renter-Occupied Housing Units | 2,612 | 41.5% |
| Total Occupied Housing Units | 6,292 | 100.0% |
Occupancy by Household Size in Lone Tree
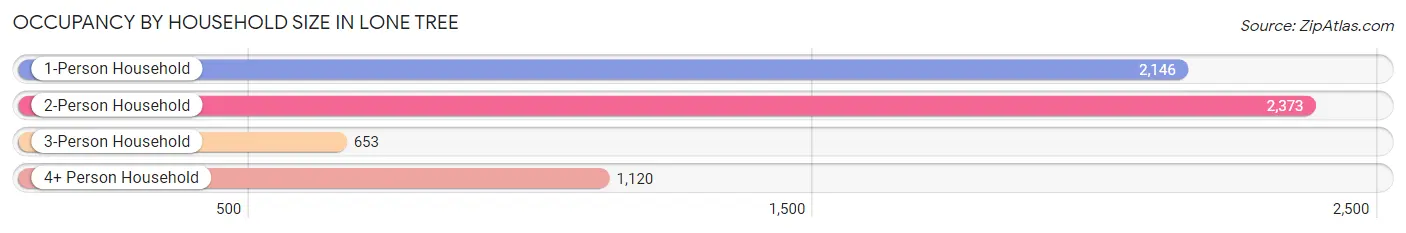
| Household Size | # Housing Units | % Housing Units |
| 1-Person Household | 2,146 | 34.1% |
| 2-Person Household | 2,373 | 37.7% |
| 3-Person Household | 653 | 10.4% |
| 4+ Person Household | 1,120 | 17.8% |
| Total Housing Units | 6,292 | 100.0% |
Occupancy by Ownership by Household Size in Lone Tree
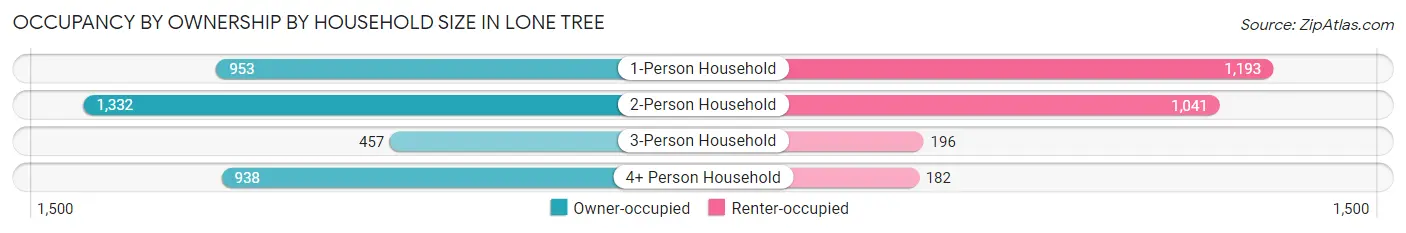
| Household Size | Owner-occupied | Renter-occupied |
| 1-Person Household | 953 (44.4%) | 1,193 (55.6%) |
| 2-Person Household | 1,332 (56.1%) | 1,041 (43.9%) |
| 3-Person Household | 457 (70.0%) | 196 (30.0%) |
| 4+ Person Household | 938 (83.8%) | 182 (16.3%) |
| Total Housing Units | 3,680 (58.5%) | 2,612 (41.5%) |
Occupancy by Educational Attainment in Lone Tree
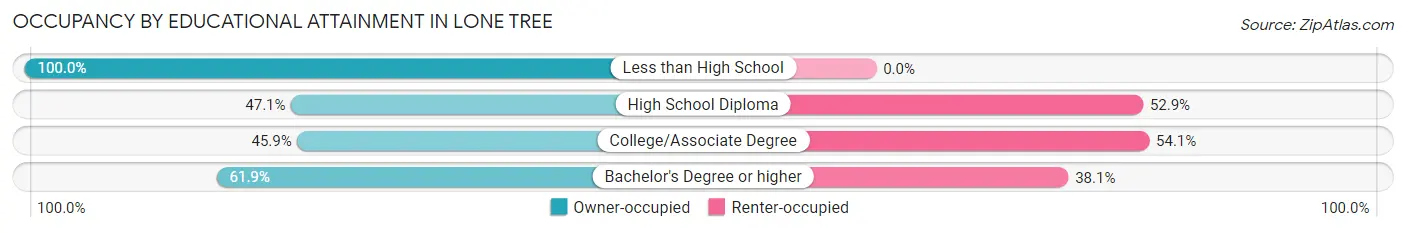
| Household Size | Owner-occupied | Renter-occupied |
| Less than High School | 59 (100.0%) | 0 (0.0%) |
| High School Diploma | 171 (47.1%) | 192 (52.9%) |
| College/Associate Degree | 529 (45.9%) | 624 (54.1%) |
| Bachelor's Degree or higher | 2,921 (61.9%) | 1,796 (38.1%) |
Occupancy by Age of Householder in Lone Tree
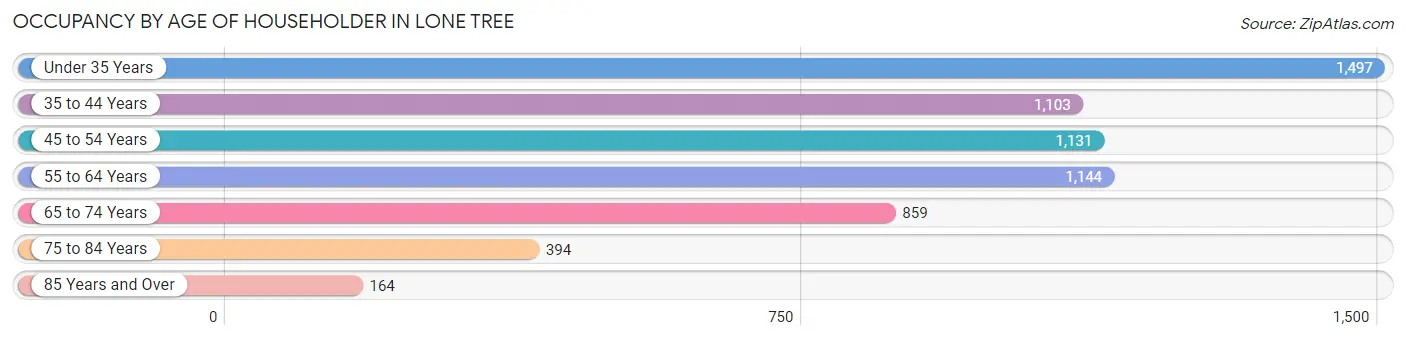
| Age Bracket | # Households | % Households |
| Under 35 Years | 1,497 | 23.8% |
| 35 to 44 Years | 1,103 | 17.5% |
| 45 to 54 Years | 1,131 | 18.0% |
| 55 to 64 Years | 1,144 | 18.2% |
| 65 to 74 Years | 859 | 13.7% |
| 75 to 84 Years | 394 | 6.3% |
| 85 Years and Over | 164 | 2.6% |
| Total | 6,292 | 100.0% |
Housing Finances in Lone Tree
Median Income by Occupancy in Lone Tree
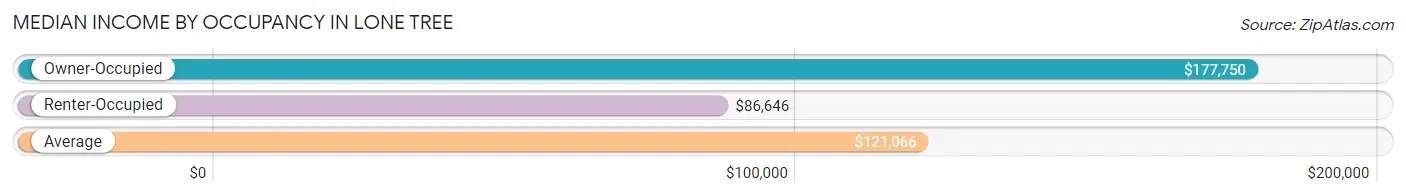
| Occupancy Type | # Households | Median Income |
| Owner-Occupied | 3,680 (58.5%) | $177,750 |
| Renter-Occupied | 2,612 (41.5%) | $86,646 |
| Average | 6,292 (100.0%) | $121,066 |
Occupancy by Householder Income Bracket in Lone Tree
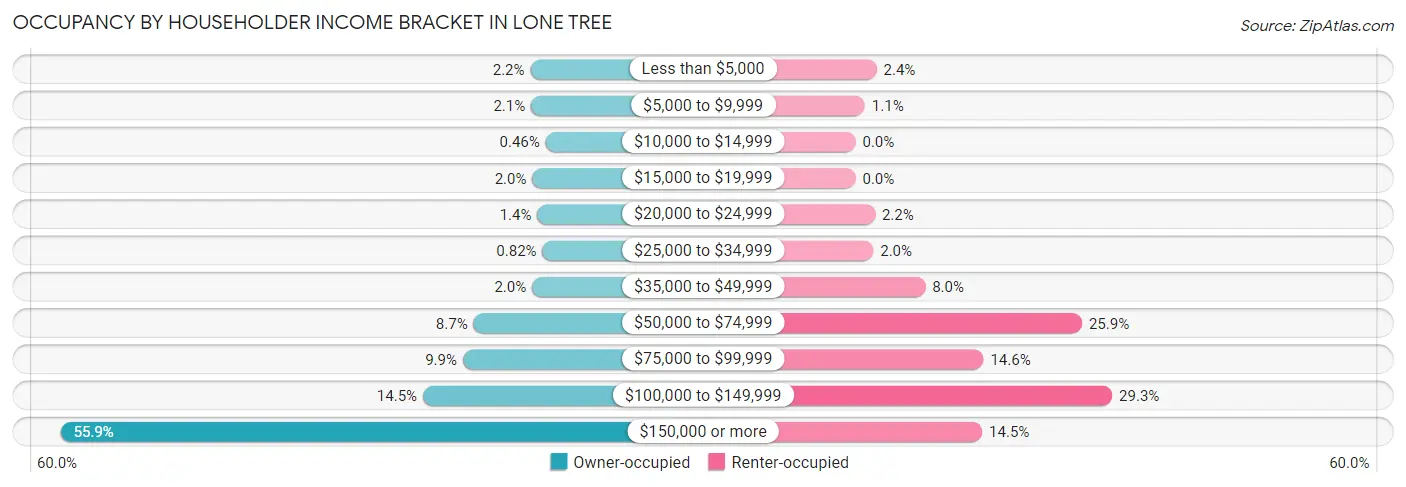
| Income Bracket | Owner-occupied | Renter-occupied |
| Less than $5,000 | 81 (2.2%) | 63 (2.4%) |
| $5,000 to $9,999 | 78 (2.1%) | 28 (1.1%) |
| $10,000 to $14,999 | 17 (0.5%) | 0 (0.0%) |
| $15,000 to $19,999 | 73 (2.0%) | 0 (0.0%) |
| $20,000 to $24,999 | 52 (1.4%) | 58 (2.2%) |
| $25,000 to $34,999 | 30 (0.8%) | 53 (2.0%) |
| $35,000 to $49,999 | 74 (2.0%) | 208 (8.0%) |
| $50,000 to $74,999 | 320 (8.7%) | 676 (25.9%) |
| $75,000 to $99,999 | 365 (9.9%) | 382 (14.6%) |
| $100,000 to $149,999 | 533 (14.5%) | 766 (29.3%) |
| $150,000 or more | 2,057 (55.9%) | 378 (14.5%) |
| Total | 3,680 (100.0%) | 2,612 (100.0%) |
Monthly Housing Cost Tiers in Lone Tree
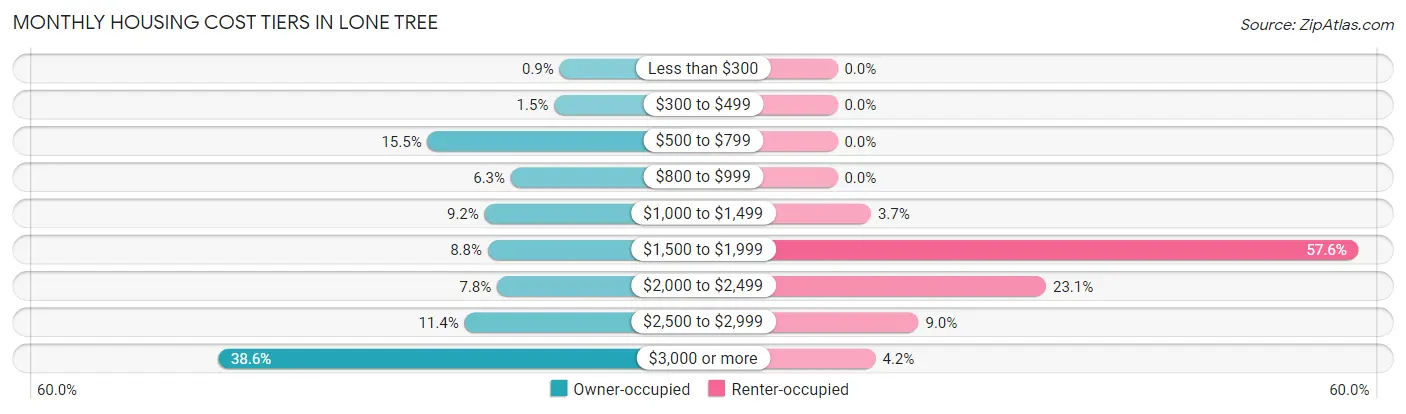
| Monthly Cost | Owner-occupied | Renter-occupied |
| Less than $300 | 33 (0.9%) | 0 (0.0%) |
| $300 to $499 | 55 (1.5%) | 0 (0.0%) |
| $500 to $799 | 570 (15.5%) | 0 (0.0%) |
| $800 to $999 | 231 (6.3%) | 0 (0.0%) |
| $1,000 to $1,499 | 338 (9.2%) | 97 (3.7%) |
| $1,500 to $1,999 | 325 (8.8%) | 1,504 (57.6%) |
| $2,000 to $2,499 | 287 (7.8%) | 602 (23.1%) |
| $2,500 to $2,999 | 419 (11.4%) | 234 (9.0%) |
| $3,000 or more | 1,422 (38.6%) | 110 (4.2%) |
| Total | 3,680 (100.0%) | 2,612 (100.0%) |
Physical Housing Characteristics in Lone Tree
Housing Structures in Lone Tree
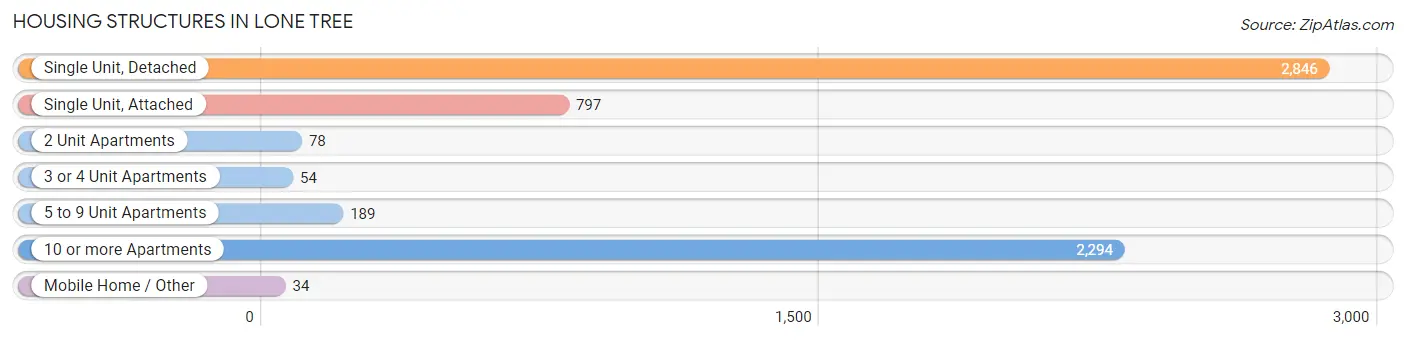
| Structure Type | # Housing Units | % Housing Units |
| Single Unit, Detached | 2,846 | 45.2% |
| Single Unit, Attached | 797 | 12.7% |
| 2 Unit Apartments | 78 | 1.2% |
| 3 or 4 Unit Apartments | 54 | 0.9% |
| 5 to 9 Unit Apartments | 189 | 3.0% |
| 10 or more Apartments | 2,294 | 36.5% |
| Mobile Home / Other | 34 | 0.5% |
| Total | 6,292 | 100.0% |
Housing Structures by Occupancy in Lone Tree
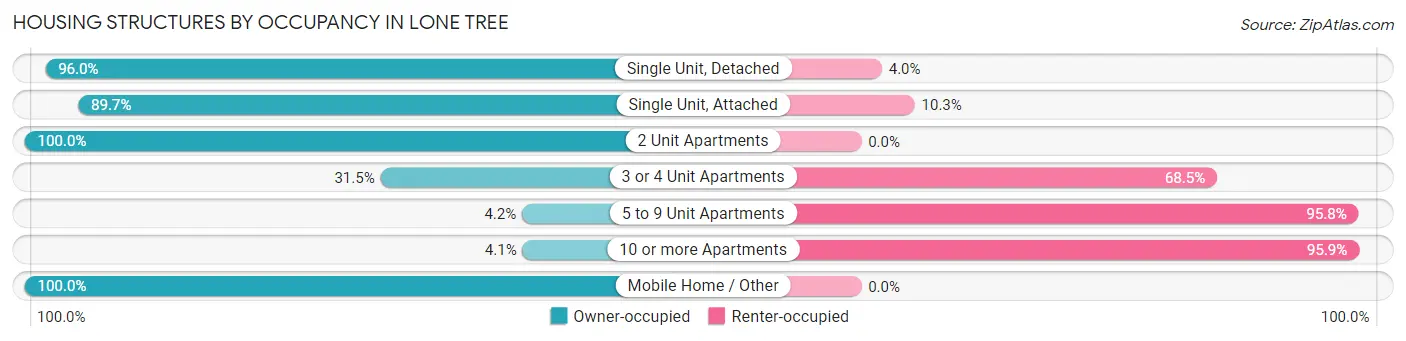
| Structure Type | Owner-occupied | Renter-occupied |
| Single Unit, Detached | 2,733 (96.0%) | 113 (4.0%) |
| Single Unit, Attached | 715 (89.7%) | 82 (10.3%) |
| 2 Unit Apartments | 78 (100.0%) | 0 (0.0%) |
| 3 or 4 Unit Apartments | 17 (31.5%) | 37 (68.5%) |
| 5 to 9 Unit Apartments | 8 (4.2%) | 181 (95.8%) |
| 10 or more Apartments | 95 (4.1%) | 2,199 (95.9%) |
| Mobile Home / Other | 34 (100.0%) | 0 (0.0%) |
| Total | 3,680 (58.5%) | 2,612 (41.5%) |
Housing Structures by Number of Rooms in Lone Tree
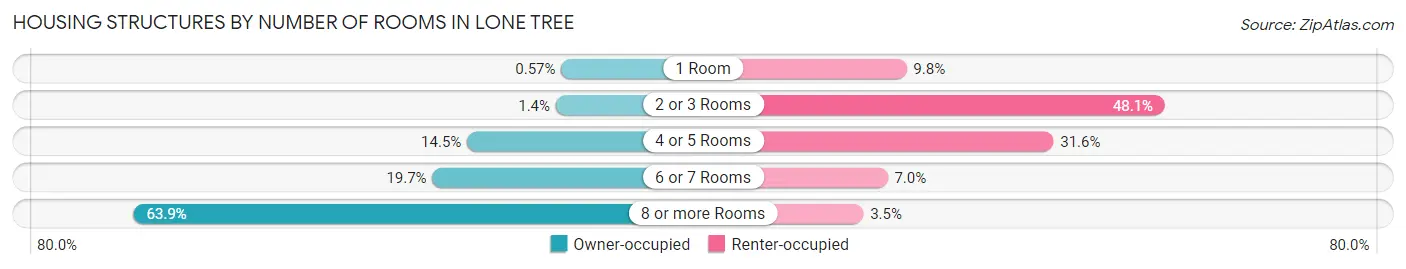
| Number of Rooms | Owner-occupied | Renter-occupied |
| 1 Room | 21 (0.6%) | 257 (9.8%) |
| 2 or 3 Rooms | 51 (1.4%) | 1,256 (48.1%) |
| 4 or 5 Rooms | 534 (14.5%) | 825 (31.6%) |
| 6 or 7 Rooms | 723 (19.7%) | 184 (7.0%) |
| 8 or more Rooms | 2,351 (63.9%) | 90 (3.5%) |
| Total | 3,680 (100.0%) | 2,612 (100.0%) |
Housing Structure by Heating Type in Lone Tree
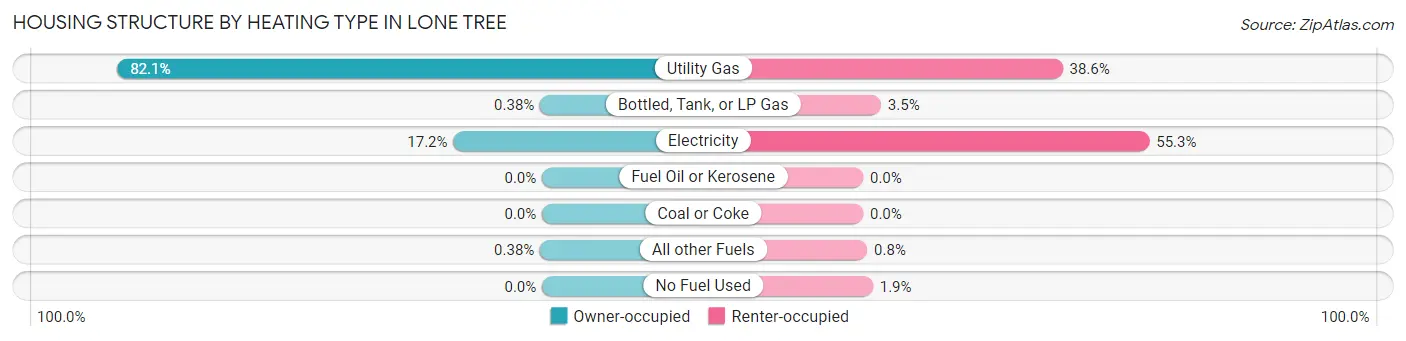
| Heating Type | Owner-occupied | Renter-occupied |
| Utility Gas | 3,021 (82.1%) | 1,007 (38.6%) |
| Bottled, Tank, or LP Gas | 14 (0.4%) | 90 (3.5%) |
| Electricity | 631 (17.2%) | 1,445 (55.3%) |
| Fuel Oil or Kerosene | 0 (0.0%) | 0 (0.0%) |
| Coal or Coke | 0 (0.0%) | 0 (0.0%) |
| All other Fuels | 14 (0.4%) | 21 (0.8%) |
| No Fuel Used | 0 (0.0%) | 49 (1.9%) |
| Total | 3,680 (100.0%) | 2,612 (100.0%) |
Household Vehicle Usage in Lone Tree
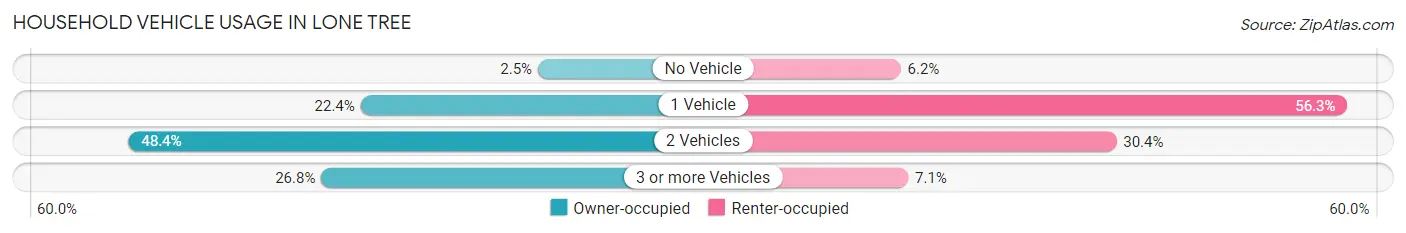
| Vehicles per Household | Owner-occupied | Renter-occupied |
| No Vehicle | 92 (2.5%) | 163 (6.2%) |
| 1 Vehicle | 823 (22.4%) | 1,470 (56.3%) |
| 2 Vehicles | 1,780 (48.4%) | 794 (30.4%) |
| 3 or more Vehicles | 985 (26.8%) | 185 (7.1%) |
| Total | 3,680 (100.0%) | 2,612 (100.0%) |
Real Estate & Mortgages in Lone Tree
Real Estate and Mortgage Overview in Lone Tree
| Characteristic | Without Mortgage | With Mortgage |
| Housing Units | 1,236 | 2,444 |
| Median Property Value | $722,200 | $800,200 |
| Median Household Income | $99,545 | $1,664 |
| Monthly Housing Costs | $794 | $1,422 |
| Real Estate Taxes | $3,622 | $26 |
Property Value by Mortgage Status in Lone Tree
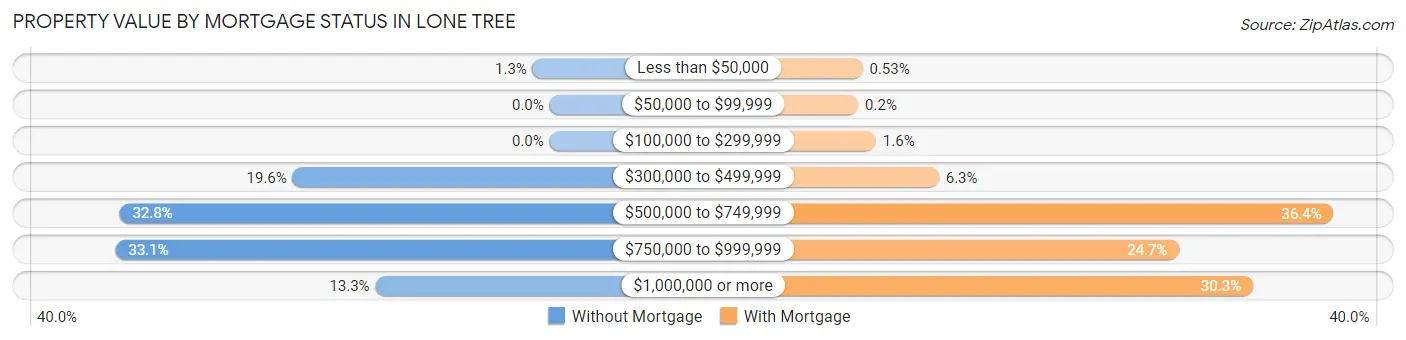
| Property Value | Without Mortgage | With Mortgage |
| Less than $50,000 | 16 (1.3%) | 13 (0.5%) |
| $50,000 to $99,999 | 0 (0.0%) | 5 (0.2%) |
| $100,000 to $299,999 | 0 (0.0%) | 38 (1.5%) |
| $300,000 to $499,999 | 242 (19.6%) | 155 (6.3%) |
| $500,000 to $749,999 | 405 (32.8%) | 890 (36.4%) |
| $750,000 to $999,999 | 409 (33.1%) | 603 (24.7%) |
| $1,000,000 or more | 164 (13.3%) | 740 (30.3%) |
| Total | 1,236 (100.0%) | 2,444 (100.0%) |
Household Income by Mortgage Status in Lone Tree
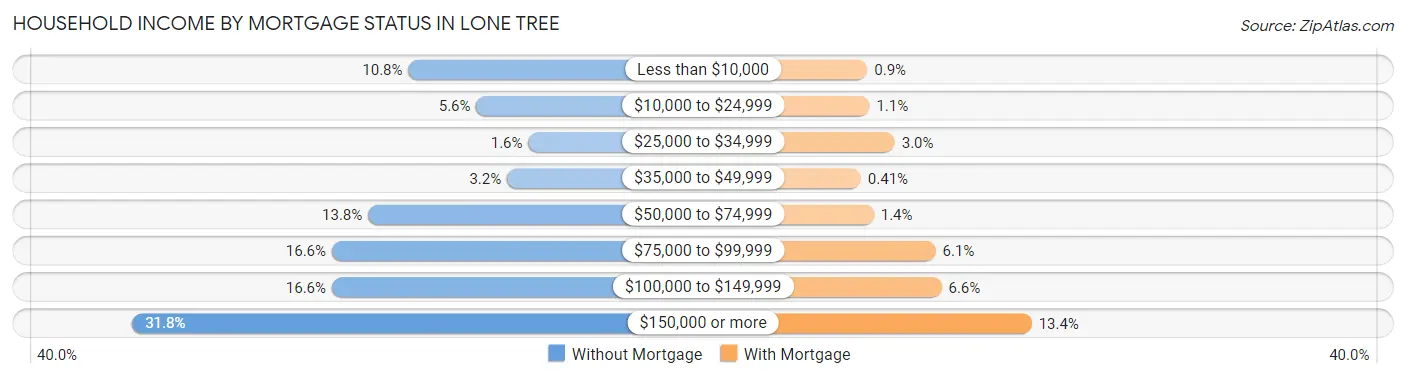
| Household Income | Without Mortgage | With Mortgage |
| Less than $10,000 | 133 (10.8%) | 22 (0.9%) |
| $10,000 to $24,999 | 69 (5.6%) | 26 (1.1%) |
| $25,000 to $34,999 | 20 (1.6%) | 73 (3.0%) |
| $35,000 to $49,999 | 40 (3.2%) | 10 (0.4%) |
| $50,000 to $74,999 | 171 (13.8%) | 34 (1.4%) |
| $75,000 to $99,999 | 205 (16.6%) | 149 (6.1%) |
| $100,000 to $149,999 | 205 (16.6%) | 160 (6.6%) |
| $150,000 or more | 393 (31.8%) | 328 (13.4%) |
| Total | 1,236 (100.0%) | 2,444 (100.0%) |
Property Value to Household Income Ratio in Lone Tree
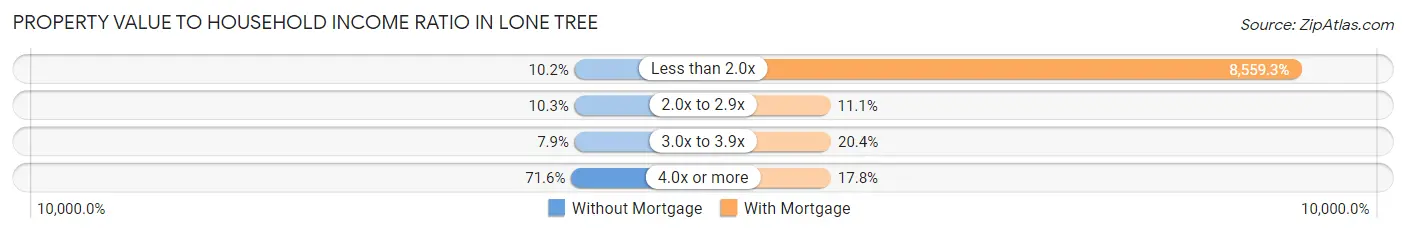
| Value-to-Income Ratio | Without Mortgage | With Mortgage |
| Less than 2.0x | 126 (10.2%) | 209,190 (8,559.3%) |
| 2.0x to 2.9x | 127 (10.3%) | 272 (11.1%) |
| 3.0x to 3.9x | 98 (7.9%) | 499 (20.4%) |
| 4.0x or more | 885 (71.6%) | 434 (17.8%) |
| Total | 1,236 (100.0%) | 2,444 (100.0%) |
Real Estate Taxes by Mortgage Status in Lone Tree
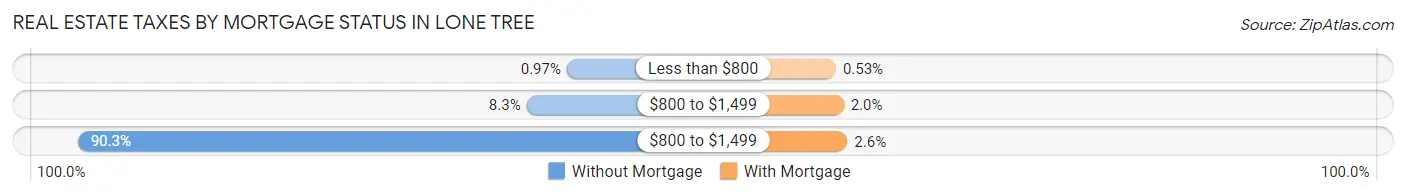
| Property Taxes | Without Mortgage | With Mortgage |
| Less than $800 | 12 (1.0%) | 13 (0.5%) |
| $800 to $1,499 | 103 (8.3%) | 48 (2.0%) |
| $800 to $1,499 | 1,116 (90.3%) | 64 (2.6%) |
| Total | 1,236 (100.0%) | 2,444 (100.0%) |
Health & Disability in Lone Tree
Health Insurance Coverage by Age in Lone Tree
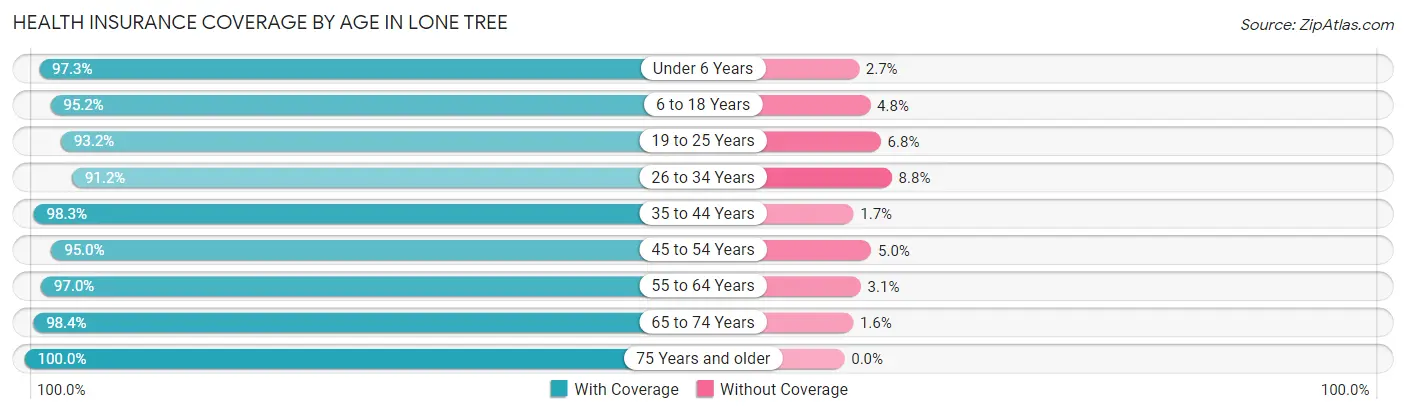
| Age Bracket | With Coverage | Without Coverage |
| Under 6 Years | 611 (97.3%) | 17 (2.7%) |
| 6 to 18 Years | 1,993 (95.2%) | 101 (4.8%) |
| 19 to 25 Years | 1,142 (93.2%) | 83 (6.8%) |
| 26 to 34 Years | 1,797 (91.2%) | 174 (8.8%) |
| 35 to 44 Years | 1,747 (98.3%) | 30 (1.7%) |
| 45 to 54 Years | 2,000 (95.0%) | 105 (5.0%) |
| 55 to 64 Years | 1,719 (97.0%) | 54 (3.0%) |
| 65 to 74 Years | 1,467 (98.4%) | 24 (1.6%) |
| 75 Years and older | 876 (100.0%) | 0 (0.0%) |
| Total | 13,352 (95.8%) | 588 (4.2%) |
Health Insurance Coverage by Citizenship Status in Lone Tree
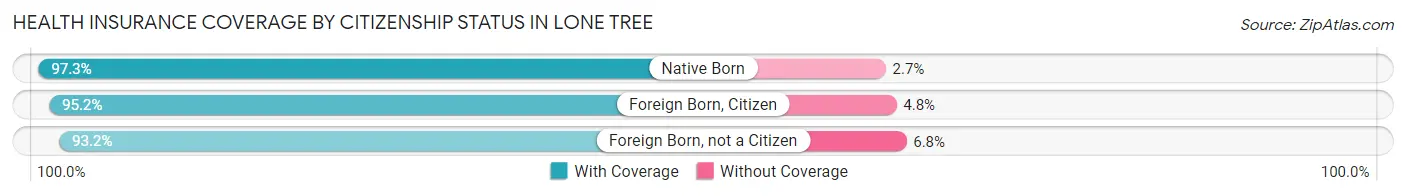
| Citizenship Status | With Coverage | Without Coverage |
| Native Born | 611 (97.3%) | 17 (2.7%) |
| Foreign Born, Citizen | 1,993 (95.2%) | 101 (4.8%) |
| Foreign Born, not a Citizen | 1,142 (93.2%) | 83 (6.8%) |
Health Insurance Coverage by Household Income in Lone Tree
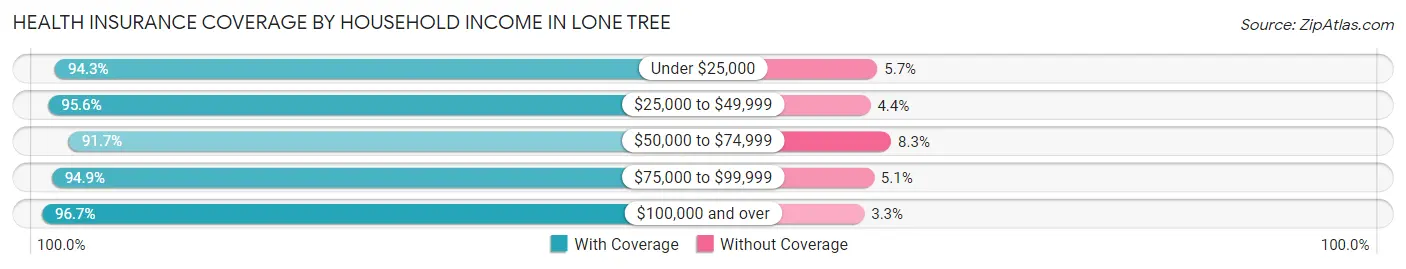
| Household Income | With Coverage | Without Coverage |
| Under $25,000 | 625 (94.3%) | 38 (5.7%) |
| $25,000 to $49,999 | 560 (95.6%) | 26 (4.4%) |
| $50,000 to $74,999 | 1,511 (91.7%) | 137 (8.3%) |
| $75,000 to $99,999 | 1,328 (94.9%) | 71 (5.1%) |
| $100,000 and over | 9,328 (96.7%) | 316 (3.3%) |
Public vs Private Health Insurance Coverage by Age in Lone Tree
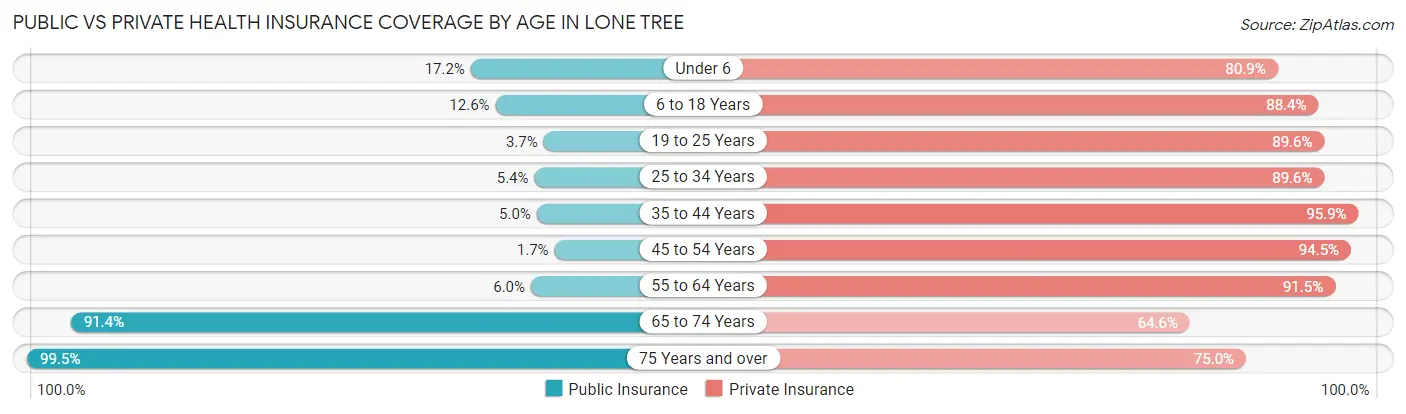
| Age Bracket | Public Insurance | Private Insurance |
| Under 6 | 108 (17.2%) | 508 (80.9%) |
| 6 to 18 Years | 264 (12.6%) | 1,852 (88.4%) |
| 19 to 25 Years | 45 (3.7%) | 1,097 (89.5%) |
| 25 to 34 Years | 106 (5.4%) | 1,765 (89.5%) |
| 35 to 44 Years | 88 (5.0%) | 1,704 (95.9%) |
| 45 to 54 Years | 35 (1.7%) | 1,989 (94.5%) |
| 55 to 64 Years | 107 (6.0%) | 1,623 (91.5%) |
| 65 to 74 Years | 1,363 (91.4%) | 963 (64.6%) |
| 75 Years and over | 872 (99.5%) | 657 (75.0%) |
| Total | 2,988 (21.4%) | 12,158 (87.2%) |
Disability Status by Sex by Age in Lone Tree
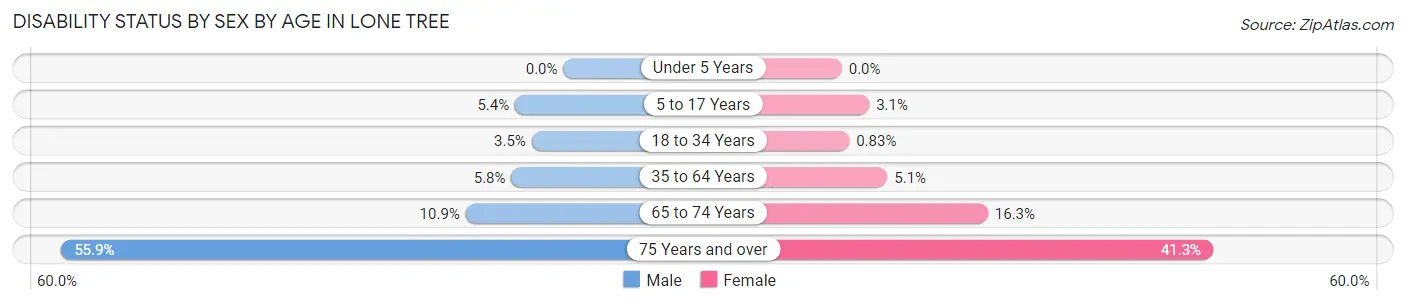
| Age Bracket | Male | Female |
| Under 5 Years | 0 (0.0%) | 0 (0.0%) |
| 5 to 17 Years | 57 (5.4%) | 30 (3.0%) |
| 18 to 34 Years | 55 (3.5%) | 15 (0.8%) |
| 35 to 64 Years | 171 (5.8%) | 137 (5.1%) |
| 65 to 74 Years | 80 (10.9%) | 123 (16.3%) |
| 75 Years and over | 203 (55.9%) | 212 (41.3%) |
Disability Class by Sex by Age in Lone Tree
Disability Class: Hearing Difficulty
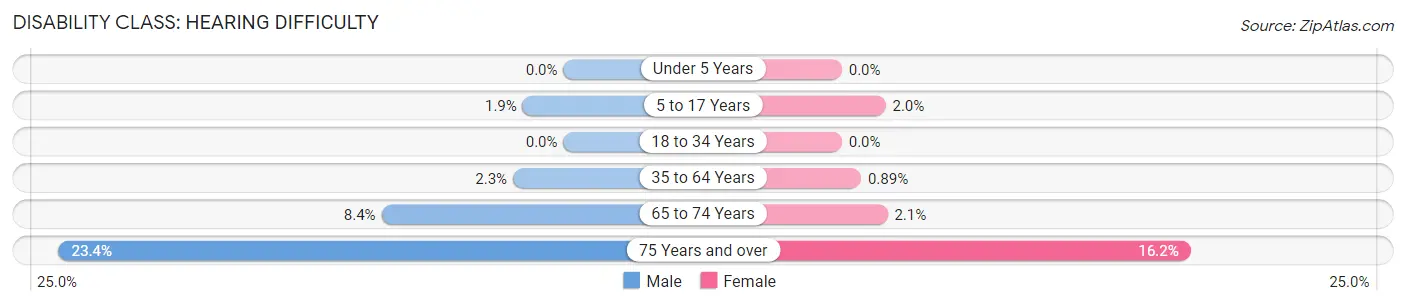
| Age Bracket | Male | Female |
| Under 5 Years | 0 (0.0%) | 0 (0.0%) |
| 5 to 17 Years | 20 (1.9%) | 20 (2.0%) |
| 18 to 34 Years | 0 (0.0%) | 0 (0.0%) |
| 35 to 64 Years | 69 (2.3%) | 24 (0.9%) |
| 65 to 74 Years | 62 (8.4%) | 16 (2.1%) |
| 75 Years and over | 85 (23.4%) | 83 (16.2%) |
Disability Class: Vision Difficulty
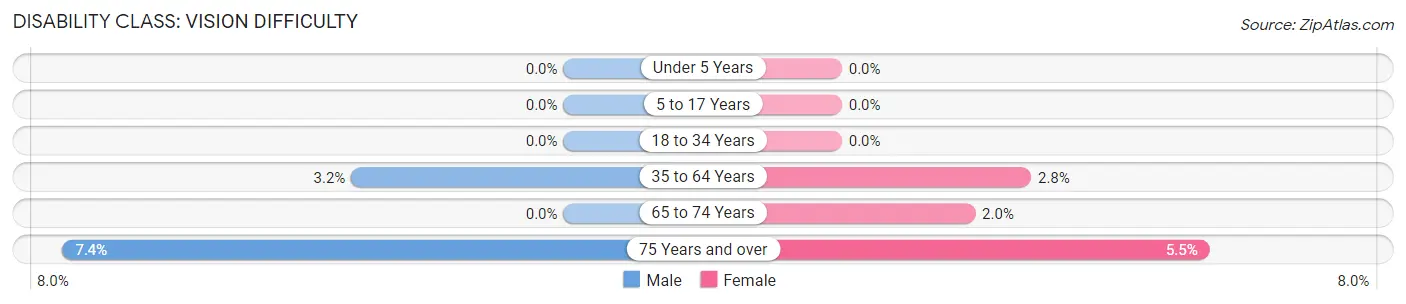
| Age Bracket | Male | Female |
| Under 5 Years | 0 (0.0%) | 0 (0.0%) |
| 5 to 17 Years | 0 (0.0%) | 0 (0.0%) |
| 18 to 34 Years | 0 (0.0%) | 0 (0.0%) |
| 35 to 64 Years | 93 (3.2%) | 76 (2.8%) |
| 65 to 74 Years | 0 (0.0%) | 15 (2.0%) |
| 75 Years and over | 27 (7.4%) | 28 (5.5%) |
Disability Class: Cognitive Difficulty
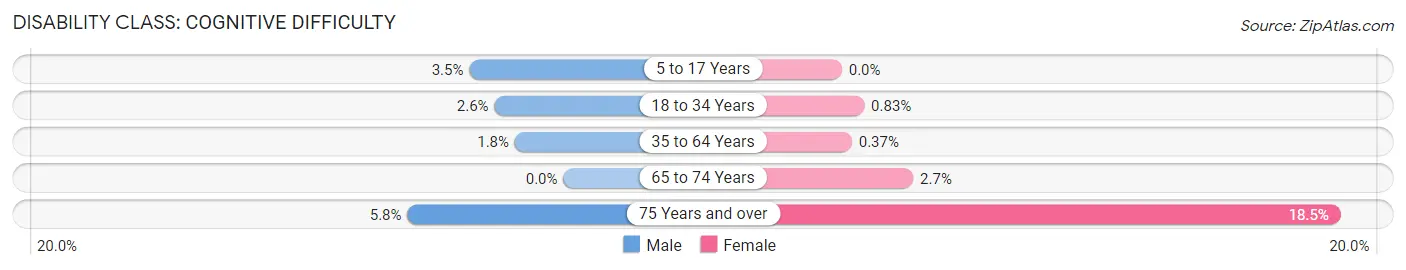
| Age Bracket | Male | Female |
| 5 to 17 Years | 37 (3.5%) | 0 (0.0%) |
| 18 to 34 Years | 40 (2.6%) | 15 (0.8%) |
| 35 to 64 Years | 53 (1.8%) | 10 (0.4%) |
| 65 to 74 Years | 0 (0.0%) | 20 (2.6%) |
| 75 Years and over | 21 (5.8%) | 95 (18.5%) |
Disability Class: Ambulatory Difficulty
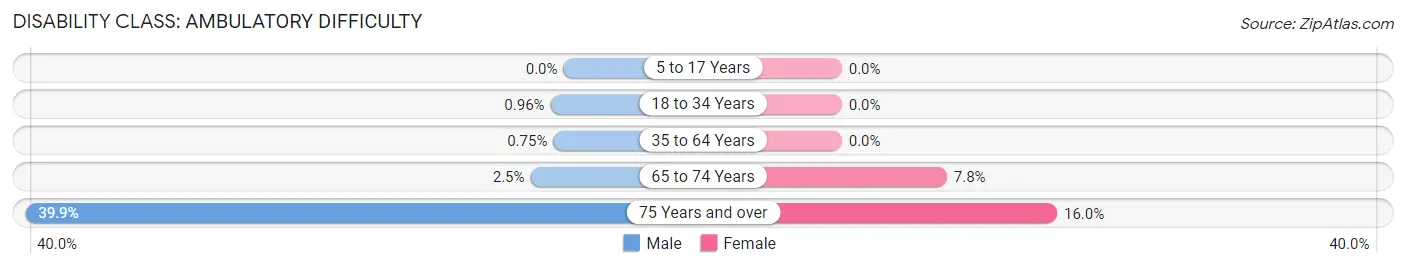
| Age Bracket | Male | Female |
| 5 to 17 Years | 0 (0.0%) | 0 (0.0%) |
| 18 to 34 Years | 15 (1.0%) | 0 (0.0%) |
| 35 to 64 Years | 22 (0.7%) | 0 (0.0%) |
| 65 to 74 Years | 18 (2.5%) | 59 (7.8%) |
| 75 Years and over | 145 (39.9%) | 82 (16.0%) |
Disability Class: Self-Care Difficulty
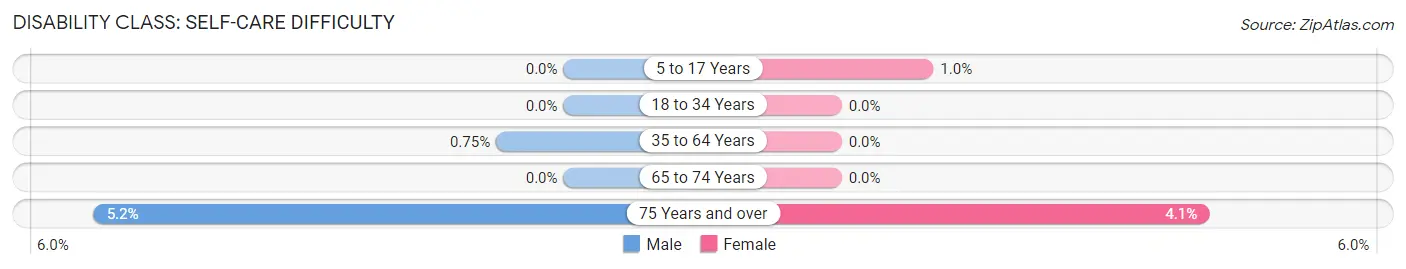
| Age Bracket | Male | Female |
| 5 to 17 Years | 0 (0.0%) | 10 (1.0%) |
| 18 to 34 Years | 0 (0.0%) | 0 (0.0%) |
| 35 to 64 Years | 22 (0.7%) | 0 (0.0%) |
| 65 to 74 Years | 0 (0.0%) | 0 (0.0%) |
| 75 Years and over | 19 (5.2%) | 21 (4.1%) |
Technology Access in Lone Tree
Computing Device Access in Lone Tree
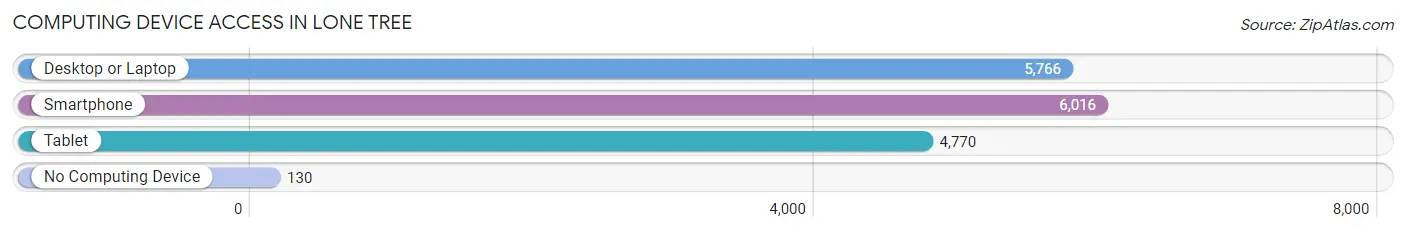
| Device Type | # Households | % Households |
| Desktop or Laptop | 5,766 | 91.6% |
| Smartphone | 6,016 | 95.6% |
| Tablet | 4,770 | 75.8% |
| No Computing Device | 130 | 2.1% |
| Total | 6,292 | 100.0% |
Internet Access in Lone Tree
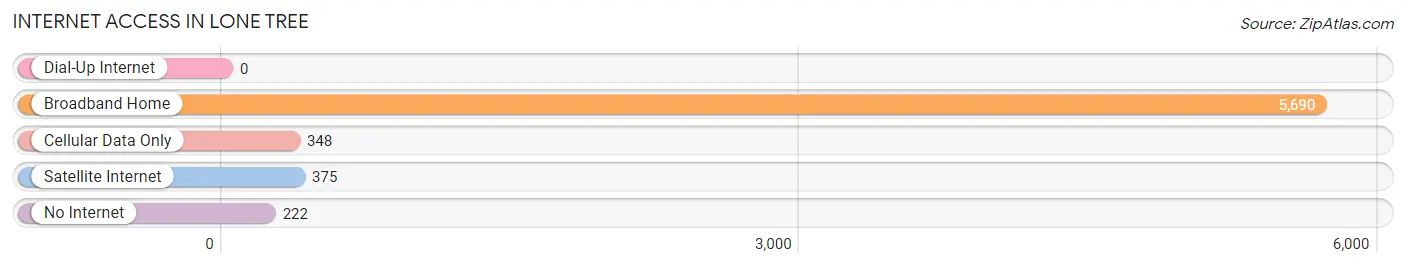
| Internet Type | # Households | % Households |
| Dial-Up Internet | 0 | 0.0% |
| Broadband Home | 5,690 | 90.4% |
| Cellular Data Only | 348 | 5.5% |
| Satellite Internet | 375 | 6.0% |
| No Internet | 222 | 3.5% |
| Total | 6,292 | 100.0% |
Lone Tree Summary
Lone Tree, Colorado is a small city located in Douglas County, Colorado, United States. It is a suburb of Denver and is located approximately 20 miles south of the city. The city was incorporated in 1995 and has a population of approximately 13,000 people.
Geography
Lone Tree is located in the foothills of the Rocky Mountains, at an elevation of 5,845 feet. The city is situated on the south side of the Denver metropolitan area, and is bordered by the cities of Centennial, Highlands Ranch, and Parker. The city is located in the South Platte River Valley, and is surrounded by rolling hills and open space. The city is home to several parks, including the Lone Tree Golf Course, Lone Tree Recreation Center, and the Lone Tree Arts Center.
History
Lone Tree was originally inhabited by the Arapaho and Cheyenne Native American tribes. The area was first settled by European settlers in the late 1800s, and the city was officially incorporated in 1995. The city was named after a lone tree that was located in the area.
Economy
Lone Tree is home to several major employers, including Charles Schwab, Sky Ridge Medical Center, and the Park Meadows Mall. The city is also home to several corporate headquarters, including the headquarters of the Charles Schwab Corporation, the Sky Ridge Medical Center, and the Park Meadows Mall.
Demographics
As of the 2010 census, the population of Lone Tree was 13,069. The racial makeup of the city was 79.2% White, 8.2% African American, 0.3% Native American, 6.2% Asian, 0.1% Pacific Islander, 3.2% from other races, and 2.9% from two or more races. The median household income was $90,845, and the median family income was $103,845.
Conclusion
Lone Tree, Colorado is a small city located in Douglas County, Colorado, United States. It is a suburb of Denver and is located approximately 20 miles south of the city. The city was incorporated in 1995 and has a population of approximately 13,000 people. The city is located in the foothills of the Rocky Mountains, and is home to several major employers, including Charles Schwab, Sky Ridge Medical Center, and the Park Meadows Mall. The population of Lone Tree is predominantly White, with a median household income of $90,845 and a median family income of $103,845.
Common Questions
What is Per Capita Income in Lone Tree?
Per Capita income in Lone Tree is $81,775.
What is the Median Family Income in Lone Tree?
Median Family Income in Lone Tree is $168,349.
What is the Median Household income in Lone Tree?
Median Household Income in Lone Tree is $121,066.
What is Income or Wage Gap in Lone Tree?
Income or Wage Gap in Lone Tree is 52.3%.
Women in Lone Tree earn 47.7 cents for every dollar earned by a man.
What is Inequality or Gini Index in Lone Tree?
Inequality or Gini Index in Lone Tree is 0.47.
What is the Total Population of Lone Tree?
Total Population of Lone Tree is 13,993.
What is the Total Male Population of Lone Tree?
Total Male Population of Lone Tree is 6,989.
What is the Total Female Population of Lone Tree?
Total Female Population of Lone Tree is 7,004.
What is the Ratio of Males per 100 Females in Lone Tree?
There are 99.79 Males per 100 Females in Lone Tree.
What is the Ratio of Females per 100 Males in Lone Tree?
There are 100.21 Females per 100 Males in Lone Tree.
What is the Median Population Age in Lone Tree?
Median Population Age in Lone Tree is 41.1 Years.
What is the Average Family Size in Lone Tree
Average Family Size in Lone Tree is 3.0 People.
What is the Average Household Size in Lone Tree
Average Household Size in Lone Tree is 2.2 People.
How Large is the Labor Force in Lone Tree?
There are 8,607 People in the Labor Forcein in Lone Tree.
What is the Percentage of People in the Labor Force in Lone Tree?
73.1% of People are in the Labor Force in Lone Tree.
What is the Unemployment Rate in Lone Tree?
Unemployment Rate in Lone Tree is 4.1%.