Bladensburg, MD Map & Demographics
Bladensburg Map
Bladensburg Overview
$26,009
PER CAPITA INCOME
$71,500
AVG FAMILY INCOME
$58,619
AVG HOUSEHOLD INCOME
7.8%
WAGE / INCOME GAP [ % ]
92.2¢/ $1
WAGE / INCOME GAP [ $ ]
0.39
INEQUALITY / GINI INDEX
9,574
TOTAL POPULATION
4,646
MALE POPULATION
4,928
FEMALE POPULATION
94.28
MALES / 100 FEMALES
106.07
FEMALES / 100 MALES
33.3
MEDIAN AGE
3.9
AVG FAMILY SIZE
2.7
AVG HOUSEHOLD SIZE
4,841
LABOR FORCE [ PEOPLE ]
71.5%
PERCENT IN LABOR FORCE
14.9%
UNEMPLOYMENT RATE
Bladensburg Zip Codes
Income in Bladensburg
Income Overview in Bladensburg
Per Capita Income in Bladensburg is $26,009, while median incomes of families and households are $71,500 and $58,619 respectively.
| Characteristic | Number | Measure |
| Per Capita Income | 9,574 | $26,009 |
| Median Family Income | 1,890 | $71,500 |
| Mean Family Income | 1,890 | $85,644 |
| Median Household Income | 3,540 | $58,619 |
| Mean Household Income | 3,540 | $68,254 |
| Income Deficit | 1,890 | $0 |
| Wage / Income Gap (%) | 9,574 | 7.80% |
| Wage / Income Gap ($) | 9,574 | 92.20¢ per $1 |
| Gini / Inequality Index | 9,574 | 0.39 |
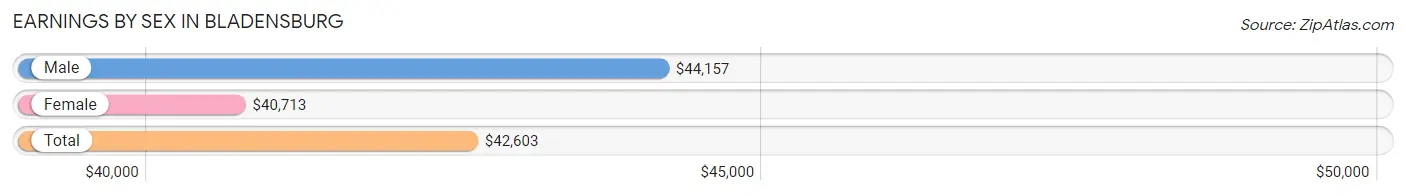
Earnings by Sex in Bladensburg
Average Earnings in Bladensburg are $42,603, $44,157 for men and $40,713 for women, a difference of 7.8%.
| Sex | Number | Average Earnings |
| Male | 2,325 (48.6%) | $44,157 |
| Female | 2,455 (51.4%) | $40,713 |
| Total | 4,780 (100.0%) | $42,603 |
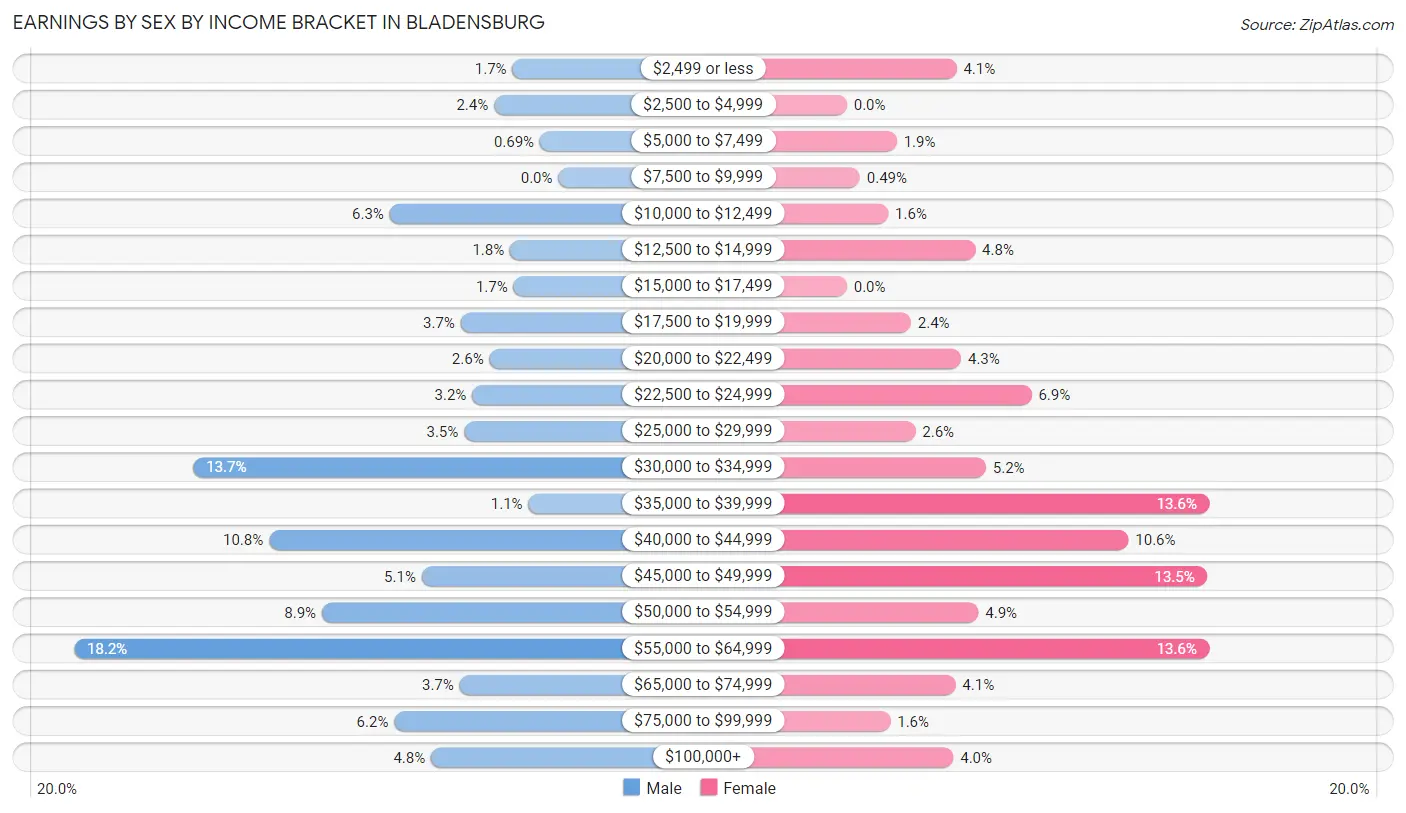
Earnings by Sex by Income Bracket in Bladensburg
The most common earnings brackets in Bladensburg are $55,000 to $64,999 for men (422 | 18.1%) and $35,000 to $39,999 for women (333 | 13.6%).
| Income | Male | Female |
| $2,499 or less | 40 (1.7%) | 101 (4.1%) |
| $2,500 to $4,999 | 56 (2.4%) | 0 (0.0%) |
| $5,000 to $7,499 | 16 (0.7%) | 46 (1.9%) |
| $7,500 to $9,999 | 0 (0.0%) | 12 (0.5%) |
| $10,000 to $12,499 | 147 (6.3%) | 38 (1.5%) |
| $12,500 to $14,999 | 42 (1.8%) | 118 (4.8%) |
| $15,000 to $17,499 | 39 (1.7%) | 0 (0.0%) |
| $17,500 to $19,999 | 85 (3.7%) | 59 (2.4%) |
| $20,000 to $22,499 | 60 (2.6%) | 105 (4.3%) |
| $22,500 to $24,999 | 75 (3.2%) | 170 (6.9%) |
| $25,000 to $29,999 | 82 (3.5%) | 63 (2.6%) |
| $30,000 to $34,999 | 318 (13.7%) | 128 (5.2%) |
| $35,000 to $39,999 | 26 (1.1%) | 333 (13.6%) |
| $40,000 to $44,999 | 252 (10.8%) | 259 (10.5%) |
| $45,000 to $49,999 | 119 (5.1%) | 331 (13.5%) |
| $50,000 to $54,999 | 206 (8.9%) | 121 (4.9%) |
| $55,000 to $64,999 | 422 (18.1%) | 333 (13.6%) |
| $65,000 to $74,999 | 86 (3.7%) | 100 (4.1%) |
| $75,000 to $99,999 | 143 (6.1%) | 40 (1.6%) |
| $100,000+ | 111 (4.8%) | 98 (4.0%) |
| Total | 2,325 (100.0%) | 2,455 (100.0%) |
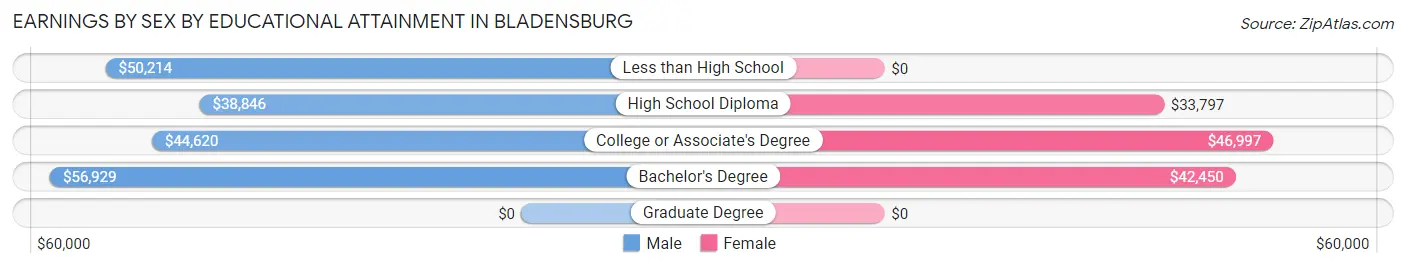
Earnings by Sex by Educational Attainment in Bladensburg
Average earnings in Bladensburg are $44,704 for men and $43,364 for women, a difference of 3.0%. Men with an educational attainment of bachelor's degree enjoy the highest average annual earnings of $56,929, while those with high school diploma education earn the least with $38,846. Women with an educational attainment of college or associate's degree earn the most with the average annual earnings of $46,997, while those with high school diploma education have the smallest earnings of $33,797.
| Educational Attainment | Male Income | Female Income |
| Less than High School | $50,214 | $0 |
| High School Diploma | $38,846 | $33,797 |
| College or Associate's Degree | $44,620 | $46,997 |
| Bachelor's Degree | $56,929 | $42,450 |
| Graduate Degree | - | - |
| Total | $44,704 | $43,364 |
Family Income in Bladensburg
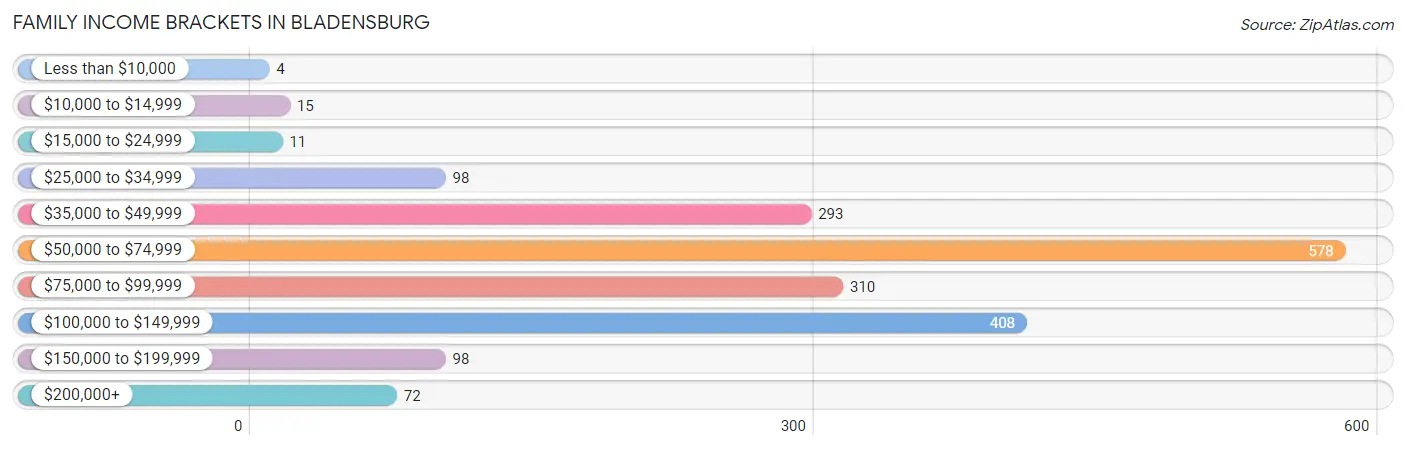
Family Income Brackets in Bladensburg
According to the Bladensburg family income data, there are 578 families falling into the $50,000 to $74,999 income range, which is the most common income bracket and makes up 30.6% of all families. Conversely, the less than $10,000 income bracket is the least frequent group with only 4 families (0.2%) belonging to this category.
| Income Bracket | # Families | % Families |
| Less than $10,000 | 4 | 0.2% |
| $10,000 to $14,999 | 15 | 0.8% |
| $15,000 to $24,999 | 11 | 0.6% |
| $25,000 to $34,999 | 98 | 5.2% |
| $35,000 to $49,999 | 293 | 15.5% |
| $50,000 to $74,999 | 578 | 30.6% |
| $75,000 to $99,999 | 310 | 16.4% |
| $100,000 to $149,999 | 408 | 21.6% |
| $150,000 to $199,999 | 98 | 5.2% |
| $200,000+ | 72 | 3.8% |
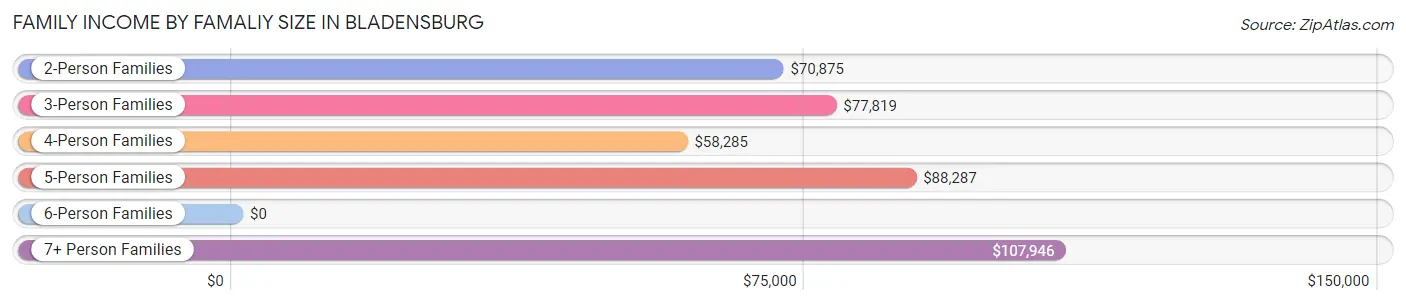
Family Income by Famaliy Size in Bladensburg
7+ person families (115 | 6.1%) account for the highest median family income in Bladensburg with $107,946 per family, while 2-person families (397 | 21.0%) have the highest median income of $35,438 per family member.
| Income Bracket | # Families | Median Income |
| 2-Person Families | 397 (21.0%) | $70,875 |
| 3-Person Families | 494 (26.1%) | $77,819 |
| 4-Person Families | 551 (29.1%) | $58,285 |
| 5-Person Families | 232 (12.3%) | $88,287 |
| 6-Person Families | 101 (5.3%) | $0 |
| 7+ Person Families | 115 (6.1%) | $107,946 |
| Total | 1,890 (100.0%) | $71,500 |
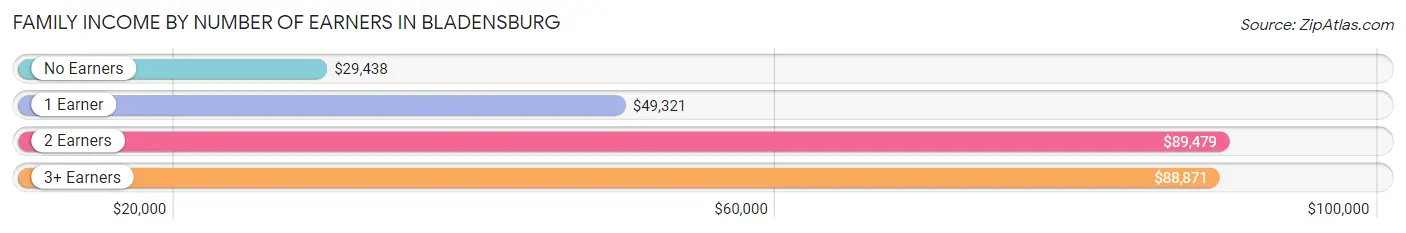
Family Income by Number of Earners in Bladensburg
The median family income in Bladensburg is $71,500, with families comprising 2 earners (962) having the highest median family income of $89,479, while families with no earners (53) have the lowest median family income of $29,438, accounting for 50.9% and 2.8% of families, respectively.
| Number of Earners | # Families | Median Income |
| No Earners | 53 (2.8%) | $29,438 |
| 1 Earner | 737 (39.0%) | $49,321 |
| 2 Earners | 962 (50.9%) | $89,479 |
| 3+ Earners | 138 (7.3%) | $88,871 |
| Total | 1,890 (100.0%) | $71,500 |
Household Income in Bladensburg
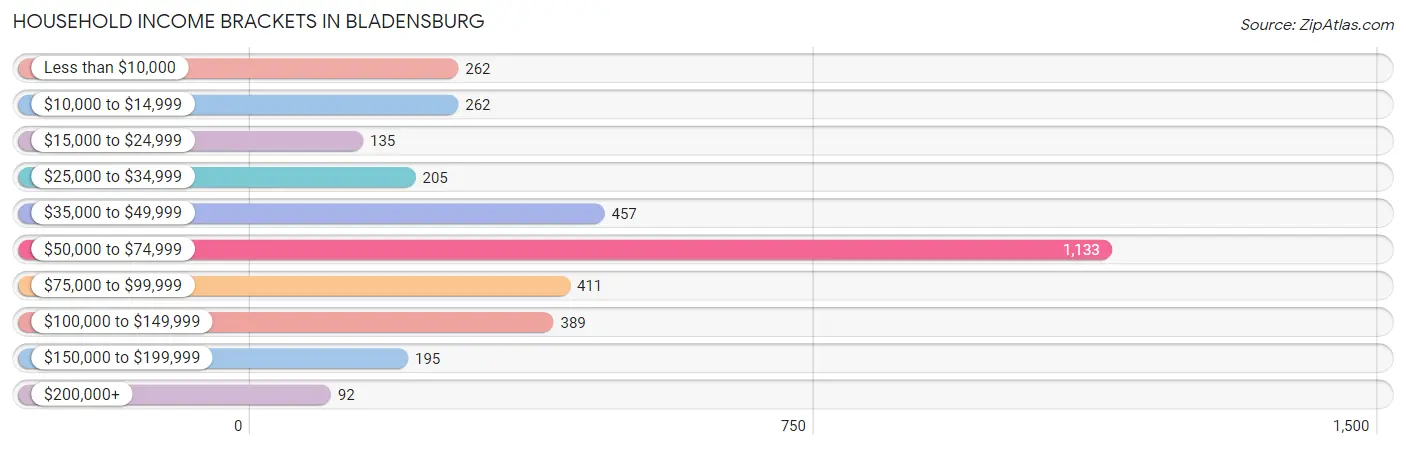
Household Income Brackets in Bladensburg
With 1,133 households falling in the category, the $50,000 to $74,999 income range is the most frequent in Bladensburg, accounting for 32.0% of all households. In contrast, only 92 households (2.6%) fall into the $200,000+ income bracket, making it the least populous group.
| Income Bracket | # Households | % Households |
| Less than $10,000 | 262 | 7.4% |
| $10,000 to $14,999 | 262 | 7.4% |
| $15,000 to $24,999 | 135 | 3.8% |
| $25,000 to $34,999 | 205 | 5.8% |
| $35,000 to $49,999 | 457 | 12.9% |
| $50,000 to $74,999 | 1,133 | 32.0% |
| $75,000 to $99,999 | 411 | 11.6% |
| $100,000 to $149,999 | 389 | 11.0% |
| $150,000 to $199,999 | 195 | 5.5% |
| $200,000+ | 92 | 2.6% |
Household Income by Householder Age in Bladensburg
The median household income in Bladensburg is $58,619, with the highest median household income of $68,498 found in the 15 to 24 years age bracket for the primary householder. A total of 244 households (6.9%) fall into this category. Meanwhile, the 65+ years age bracket for the primary householder has the lowest median household income of $32,647, with 758 households (21.4%) in this group.
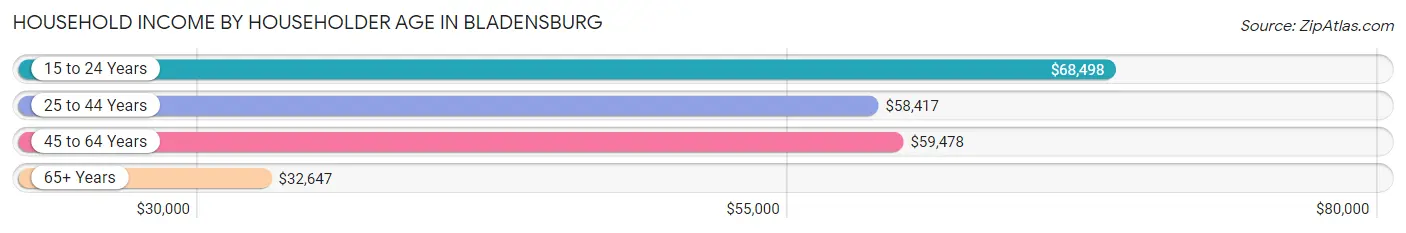
| Income Bracket | # Households | Median Income |
| 15 to 24 Years | 244 (6.9%) | $68,498 |
| 25 to 44 Years | 1,526 (43.1%) | $58,417 |
| 45 to 64 Years | 1,012 (28.6%) | $59,478 |
| 65+ Years | 758 (21.4%) | $32,647 |
| Total | 3,540 (100.0%) | $58,619 |
Poverty in Bladensburg
Income Below Poverty by Sex and Age in Bladensburg
With 5.3% poverty level for males and 9.7% for females among the residents of Bladensburg, 75 year old and over males and 75 year old and over females are the most vulnerable to poverty, with 28 males (52.8%) and 117 females (42.1%) in their respective age groups living below the poverty level.
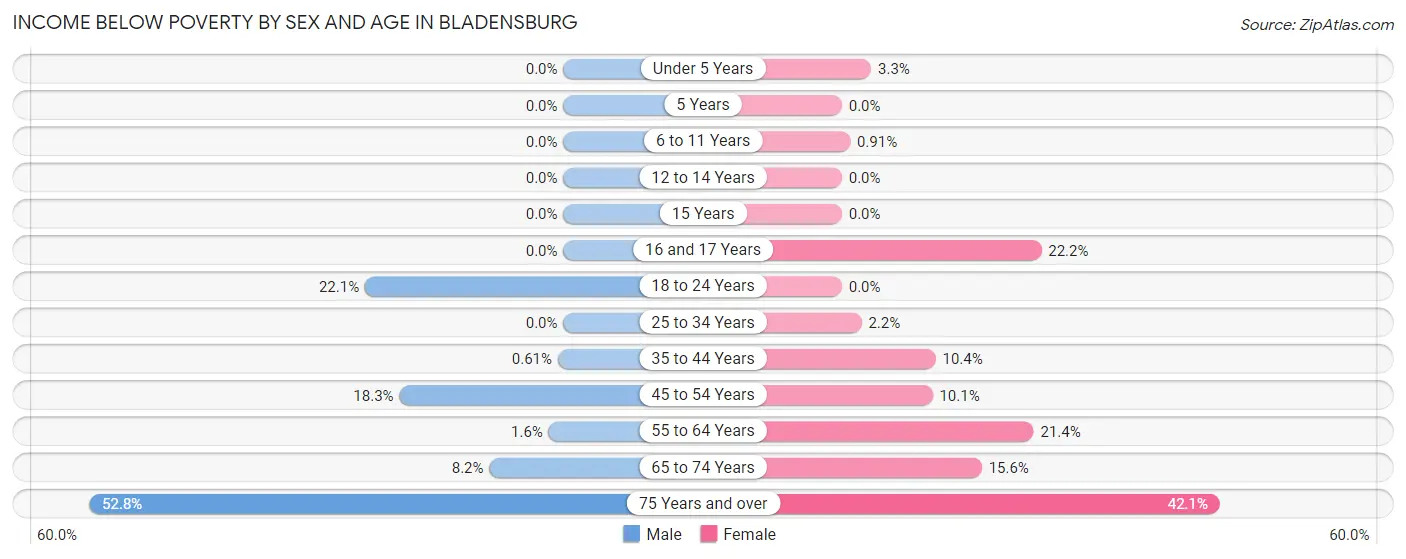
| Age Bracket | Male | Female |
| Under 5 Years | 0 (0.0%) | 11 (3.3%) |
| 5 Years | 0 (0.0%) | 0 (0.0%) |
| 6 to 11 Years | 0 (0.0%) | 5 (0.9%) |
| 12 to 14 Years | 0 (0.0%) | 0 (0.0%) |
| 15 Years | 0 (0.0%) | 0 (0.0%) |
| 16 and 17 Years | 0 (0.0%) | 42 (22.2%) |
| 18 to 24 Years | 36 (22.1%) | 0 (0.0%) |
| 25 to 34 Years | 0 (0.0%) | 16 (2.2%) |
| 35 to 44 Years | 4 (0.6%) | 85 (10.4%) |
| 45 to 54 Years | 134 (18.3%) | 40 (10.1%) |
| 55 to 64 Years | 5 (1.6%) | 88 (21.4%) |
| 65 to 74 Years | 36 (8.2%) | 74 (15.6%) |
| 75 Years and over | 28 (52.8%) | 117 (42.1%) |
| Total | 243 (5.3%) | 478 (9.7%) |
Income Above Poverty by Sex and Age in Bladensburg
According to the poverty statistics in Bladensburg, males aged under 5 years and females aged 12 to 14 years are the age groups that are most secure financially, with 100.0% of males and 100.0% of females in these age groups living above the poverty line.
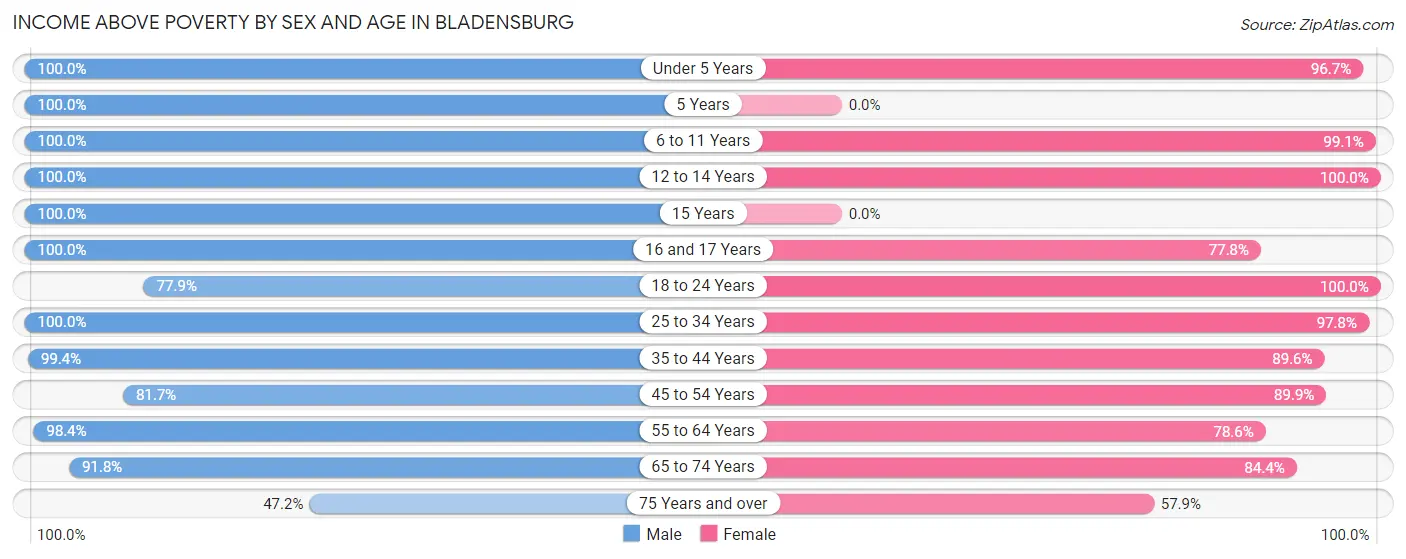
| Age Bracket | Male | Female |
| Under 5 Years | 419 (100.0%) | 326 (96.7%) |
| 5 Years | 127 (100.0%) | 0 (0.0%) |
| 6 to 11 Years | 920 (100.0%) | 547 (99.1%) |
| 12 to 14 Years | 146 (100.0%) | 233 (100.0%) |
| 15 Years | 13 (100.0%) | 0 (0.0%) |
| 16 and 17 Years | 121 (100.0%) | 147 (77.8%) |
| 18 to 24 Years | 127 (77.9%) | 495 (100.0%) |
| 25 to 34 Years | 512 (100.0%) | 713 (97.8%) |
| 35 to 44 Years | 653 (99.4%) | 729 (89.6%) |
| 45 to 54 Years | 600 (81.7%) | 356 (89.9%) |
| 55 to 64 Years | 301 (98.4%) | 324 (78.6%) |
| 65 to 74 Years | 401 (91.8%) | 401 (84.4%) |
| 75 Years and over | 25 (47.2%) | 161 (57.9%) |
| Total | 4,365 (94.7%) | 4,432 (90.3%) |
Income Below Poverty Among Married-Couple Families in Bladensburg
The poverty statistics for married-couple families in Bladensburg show that 0.7% or 8 of the total 1,212 families live below the poverty line. Families with 3 or 4 children have the highest poverty rate of 3.3%, comprising of 4 families. On the other hand, families with 1 or 2 children have the lowest poverty rate of 0.0%, which includes 0 families.
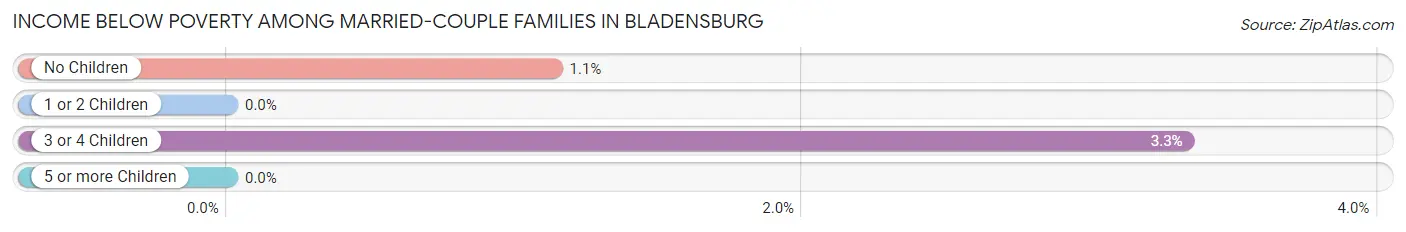
| Children | Above Poverty | Below Poverty |
| No Children | 349 (98.9%) | 4 (1.1%) |
| 1 or 2 Children | 694 (100.0%) | 0 (0.0%) |
| 3 or 4 Children | 116 (96.7%) | 4 (3.3%) |
| 5 or more Children | 45 (100.0%) | 0 (0.0%) |
| Total | 1,204 (99.3%) | 8 (0.7%) |
Income Below Poverty Among Single-Parent Households in Bladensburg
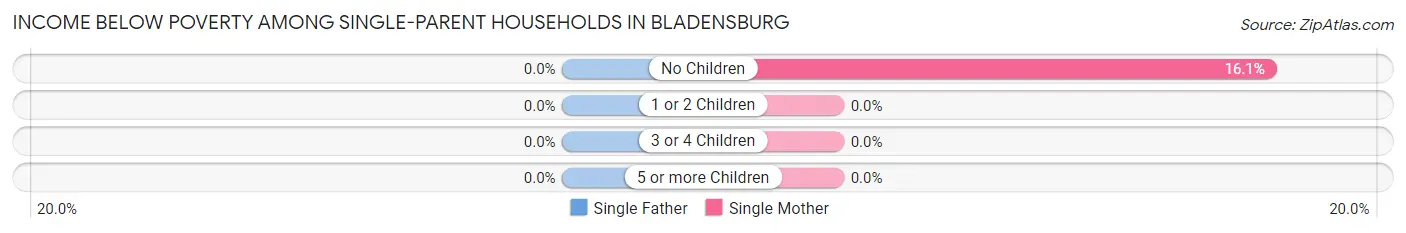
| Children | Single Father | Single Mother |
| No Children | 0 (0.0%) | 15 (16.1%) |
| 1 or 2 Children | 0 (0.0%) | 0 (0.0%) |
| 3 or 4 Children | 0 (0.0%) | 0 (0.0%) |
| 5 or more Children | 0 (0.0%) | 0 (0.0%) |
| Total | 0 (0.0%) | 15 (2.5%) |
Income Below Poverty Among Married-Couple vs Single-Parent Households in Bladensburg
The poverty data for Bladensburg shows that 8 of the married-couple family households (0.7%) and 15 of the single-parent households (2.2%) are living below the poverty level. Within the married-couple family households, those with 3 or 4 children have the highest poverty rate, with 4 households (3.3%) falling below the poverty line. Among the single-parent households, those with no children have the highest poverty rate, with 15 household (10.3%) living below poverty.
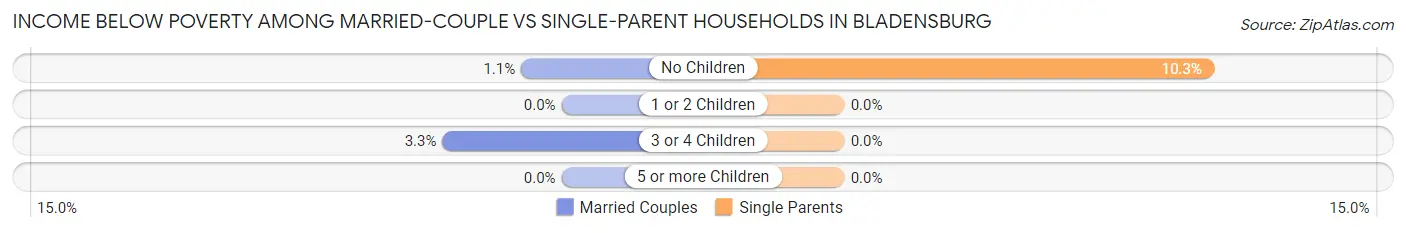
| Children | Married-Couple Families | Single-Parent Households |
| No Children | 4 (1.1%) | 15 (10.3%) |
| 1 or 2 Children | 0 (0.0%) | 0 (0.0%) |
| 3 or 4 Children | 4 (3.3%) | 0 (0.0%) |
| 5 or more Children | 0 (0.0%) | 0 (0.0%) |
| Total | 8 (0.7%) | 15 (2.2%) |
Race in Bladensburg
The most populous races in Bladensburg are Black / African American (6,268 | 65.5%), Hispanic or Latino (3,048 | 31.8%), and Some other Race (2,408 | 25.2%).
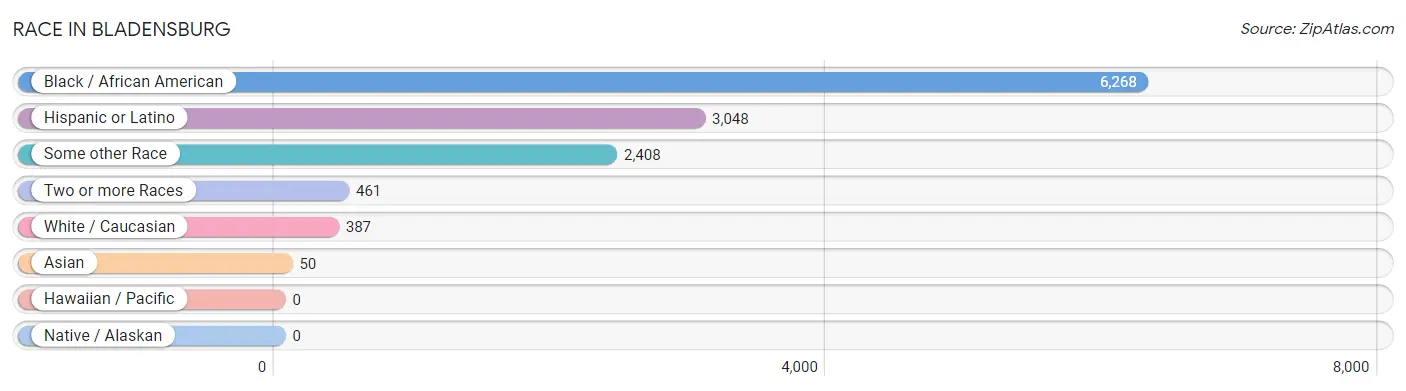
| Race | # Population | % Population |
| Asian | 50 | 0.5% |
| Black / African American | 6,268 | 65.5% |
| Hawaiian / Pacific | 0 | 0.0% |
| Hispanic or Latino | 3,048 | 31.8% |
| Native / Alaskan | 0 | 0.0% |
| White / Caucasian | 387 | 4.0% |
| Two or more Races | 461 | 4.8% |
| Some other Race | 2,408 | 25.2% |
| Total | 9,574 | 100.0% |
Ancestry in Bladensburg
The most populous ancestries reported in Bladensburg are Subsaharan African (2,072 | 21.6%), Mexican (1,701 | 17.8%), Central American (1,041 | 10.9%), African (1,024 | 10.7%), and Salvadoran (736 | 7.7%), together accounting for 68.7% of all Bladensburg residents.
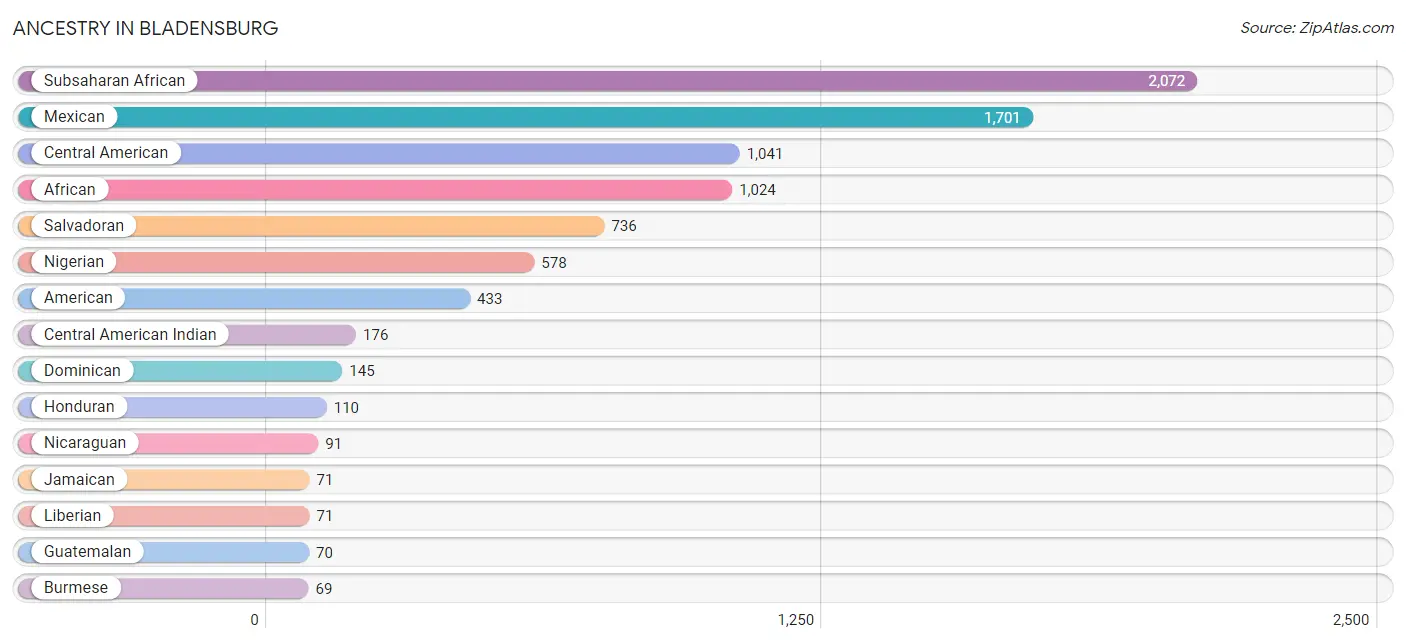
| Ancestry | # Population | % Population |
| African | 1,024 | 10.7% |
| American | 433 | 4.5% |
| Burmese | 69 | 0.7% |
| Central American | 1,041 | 10.9% |
| Central American Indian | 176 | 1.8% |
| Chippewa | 25 | 0.3% |
| Costa Rican | 34 | 0.4% |
| Dominican | 145 | 1.5% |
| English | 33 | 0.3% |
| European | 35 | 0.4% |
| German | 26 | 0.3% |
| Guatemalan | 70 | 0.7% |
| Honduran | 110 | 1.1% |
| Irish | 52 | 0.5% |
| Jamaican | 71 | 0.7% |
| Liberian | 71 | 0.7% |
| Mexican | 1,701 | 17.8% |
| Nicaraguan | 91 | 0.9% |
| Nigerian | 578 | 6.0% |
| Norwegian | 20 | 0.2% |
| Puerto Rican | 50 | 0.5% |
| Salvadoran | 736 | 7.7% |
| Scottish | 24 | 0.3% |
| Subsaharan African | 2,072 | 21.6% |
| Trinidadian and Tobagonian | 58 | 0.6% |
| Welsh | 1 | 0.0% | View All 26 Rows |
Immigrants in Bladensburg
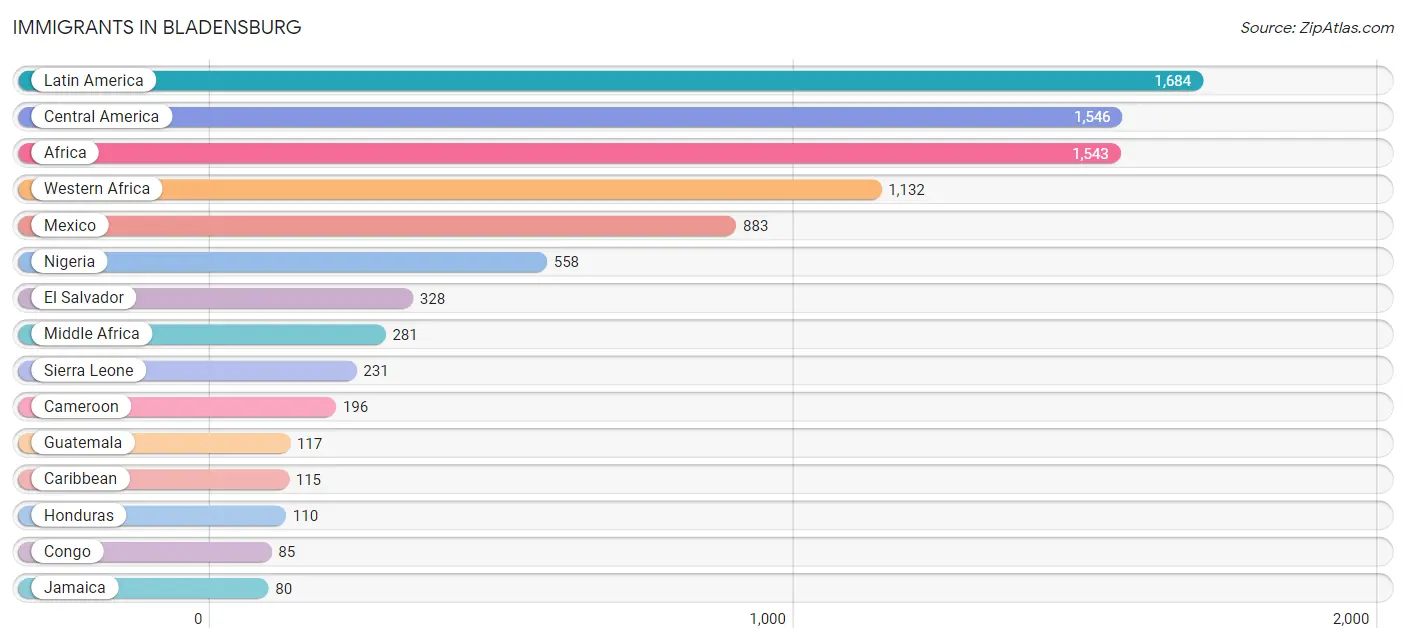
The most numerous immigrant groups reported in Bladensburg came from Latin America (1,684 | 17.6%), Central America (1,546 | 16.2%), Africa (1,543 | 16.1%), Western Africa (1,132 | 11.8%), and Mexico (883 | 9.2%), together accounting for 70.9% of all Bladensburg residents.
| Immigration Origin | # Population | % Population |
| Africa | 1,543 | 16.1% |
| Asia | 50 | 0.5% |
| Cameroon | 196 | 2.1% |
| Caribbean | 115 | 1.2% |
| Central America | 1,546 | 16.2% |
| Congo | 85 | 0.9% |
| Costa Rica | 34 | 0.4% |
| Eastern Africa | 35 | 0.4% |
| Eastern Asia | 50 | 0.5% |
| El Salvador | 328 | 3.4% |
| Ethiopia | 35 | 0.4% |
| Europe | 6 | 0.1% |
| Germany | 6 | 0.1% |
| Ghana | 78 | 0.8% |
| Guatemala | 117 | 1.2% |
| Guyana | 23 | 0.2% |
| Honduras | 110 | 1.1% |
| Jamaica | 80 | 0.8% |
| Korea | 50 | 0.5% |
| Latin America | 1,684 | 17.6% |
| Liberia | 30 | 0.3% |
| Mexico | 883 | 9.2% |
| Middle Africa | 281 | 2.9% |
| Nicaragua | 74 | 0.8% |
| Nigeria | 558 | 5.8% |
| Sierra Leone | 231 | 2.4% |
| South America | 23 | 0.2% |
| Trinidad and Tobago | 35 | 0.4% |
| Western Africa | 1,132 | 11.8% |
| Western Europe | 6 | 0.1% | View All 30 Rows |
Sex and Age in Bladensburg
Sex and Age in Bladensburg
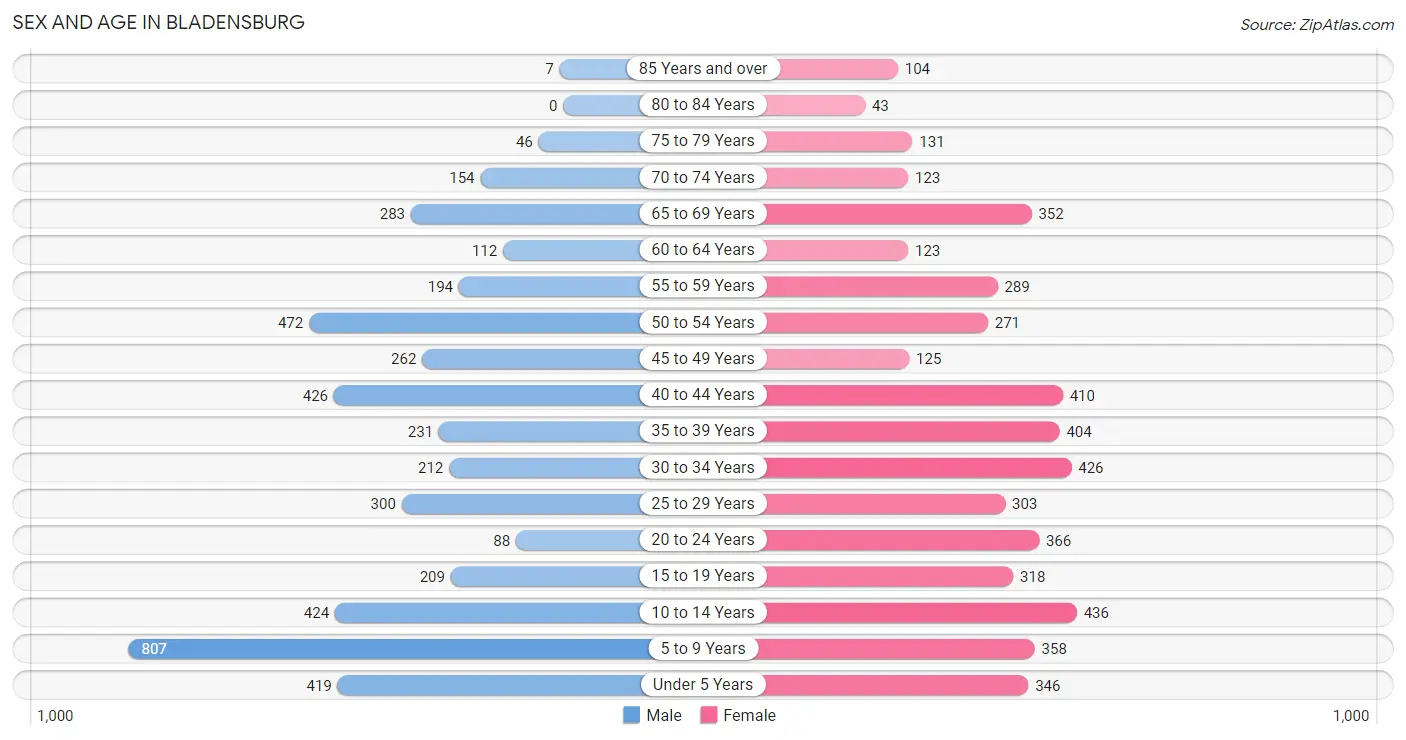
The most populous age groups in Bladensburg are 5 to 9 Years (807 | 17.4%) for men and 10 to 14 Years (436 | 8.8%) for women.
| Age Bracket | Male | Female |
| Under 5 Years | 419 (9.0%) | 346 (7.0%) |
| 5 to 9 Years | 807 (17.4%) | 358 (7.3%) |
| 10 to 14 Years | 424 (9.1%) | 436 (8.8%) |
| 15 to 19 Years | 209 (4.5%) | 318 (6.5%) |
| 20 to 24 Years | 88 (1.9%) | 366 (7.4%) |
| 25 to 29 Years | 300 (6.5%) | 303 (6.1%) |
| 30 to 34 Years | 212 (4.6%) | 426 (8.6%) |
| 35 to 39 Years | 231 (5.0%) | 404 (8.2%) |
| 40 to 44 Years | 426 (9.2%) | 410 (8.3%) |
| 45 to 49 Years | 262 (5.6%) | 125 (2.5%) |
| 50 to 54 Years | 472 (10.2%) | 271 (5.5%) |
| 55 to 59 Years | 194 (4.2%) | 289 (5.9%) |
| 60 to 64 Years | 112 (2.4%) | 123 (2.5%) |
| 65 to 69 Years | 283 (6.1%) | 352 (7.1%) |
| 70 to 74 Years | 154 (3.3%) | 123 (2.5%) |
| 75 to 79 Years | 46 (1.0%) | 131 (2.7%) |
| 80 to 84 Years | 0 (0.0%) | 43 (0.9%) |
| 85 Years and over | 7 (0.2%) | 104 (2.1%) |
| Total | 4,646 (100.0%) | 4,928 (100.0%) |
Families and Households in Bladensburg
Median Family Size in Bladensburg
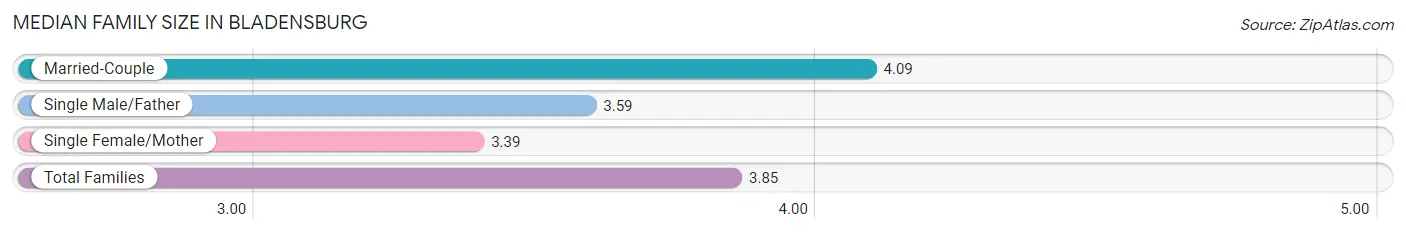
The median family size in Bladensburg is 3.85 persons per family, with married-couple families (1,212 | 64.1%) accounting for the largest median family size of 4.09 persons per family. On the other hand, single female/mother families (602 | 31.9%) represent the smallest median family size with 3.39 persons per family.
| Family Type | # Families | Family Size |
| Married-Couple | 1,212 (64.1%) | 4.09 |
| Single Male/Father | 76 (4.0%) | 3.59 |
| Single Female/Mother | 602 (31.9%) | 3.39 |
| Total Families | 1,890 (100.0%) | 3.85 |
Median Household Size in Bladensburg
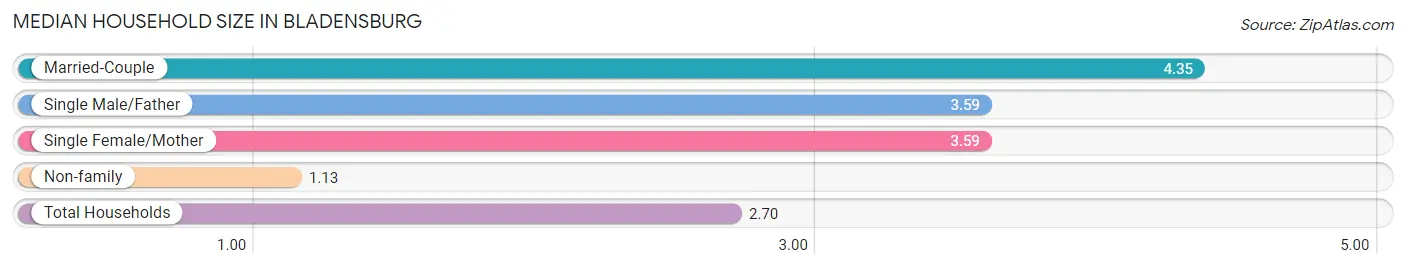
The median household size in Bladensburg is 2.70 persons per household, with married-couple households (1,212 | 34.2%) accounting for the largest median household size of 4.35 persons per household. non-family households (1,650 | 46.6%) represent the smallest median household size with 1.13 persons per household.
| Household Type | # Households | Household Size |
| Married-Couple | 1,212 (34.2%) | 4.35 |
| Single Male/Father | 76 (2.1%) | 3.59 |
| Single Female/Mother | 602 (17.0%) | 3.59 |
| Non-family | 1,650 (46.6%) | 1.13 |
| Total Households | 3,540 (100.0%) | 2.70 |
Household Size by Marriage Status in Bladensburg
Out of a total of 3,540 households in Bladensburg, 1,890 (53.4%) are family households, while 1,650 (46.6%) are nonfamily households. The most numerous type of family households are 4-person households, comprising 508, and the most common type of nonfamily households are 1-person households, comprising 1,403.
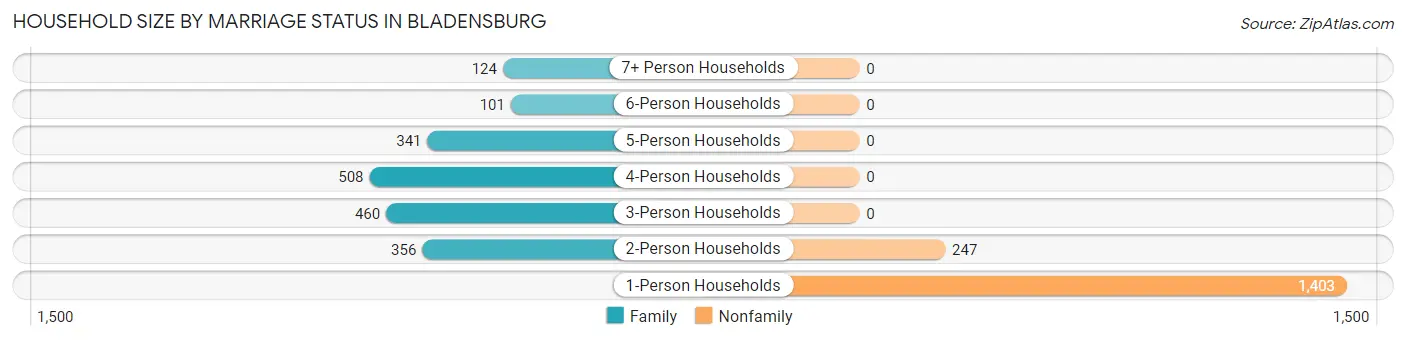
| Household Size | Family Households | Nonfamily Households |
| 1-Person Households | - | 1,403 (39.6%) |
| 2-Person Households | 356 (10.1%) | 247 (7.0%) |
| 3-Person Households | 460 (13.0%) | 0 (0.0%) |
| 4-Person Households | 508 (14.3%) | 0 (0.0%) |
| 5-Person Households | 341 (9.6%) | 0 (0.0%) |
| 6-Person Households | 101 (2.9%) | 0 (0.0%) |
| 7+ Person Households | 124 (3.5%) | 0 (0.0%) |
| Total | 1,890 (53.4%) | 1,650 (46.6%) |
Female Fertility in Bladensburg
Fertility by Age in Bladensburg
Average fertility rate in Bladensburg is 128.0 births per 1,000 women. Women in the age bracket of 20 to 34 years have the highest fertility rate with 211.0 births per 1,000 women. Women in the age bracket of 20 to 34 years acount for 72.6% of all women with births.
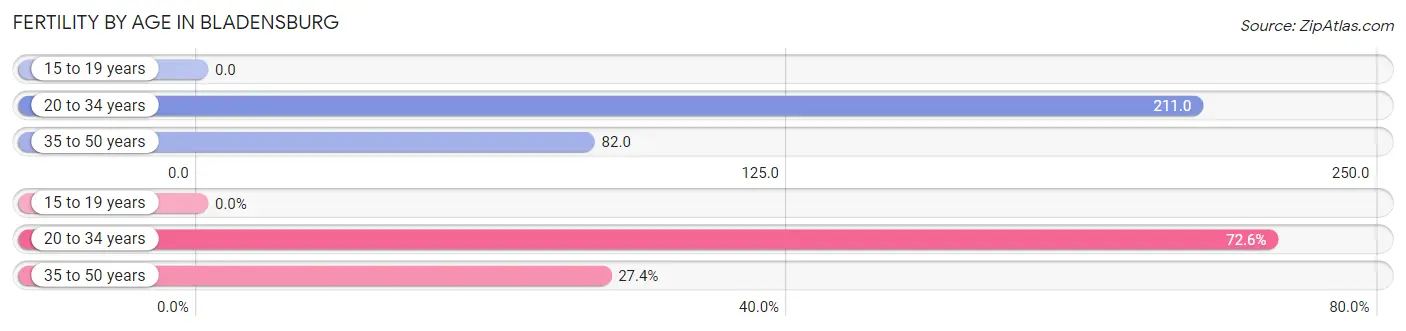
| Age Bracket | Women with Births | Births / 1,000 Women |
| 15 to 19 years | 0 (0.0%) | 0.0 |
| 20 to 34 years | 231 (72.6%) | 211.0 |
| 35 to 50 years | 87 (27.4%) | 82.0 |
| Total | 318 (100.0%) | 128.0 |
Fertility by Age by Marriage Status in Bladensburg
52.2% of women with births (318) in Bladensburg are married. The highest percentage of unmarried women with births falls into 20 to 34 years age bracket with 49.8% of them unmarried at the time of birth, while the lowest percentage of unmarried women with births belong to 35 to 50 years age bracket with 42.5% of them unmarried.
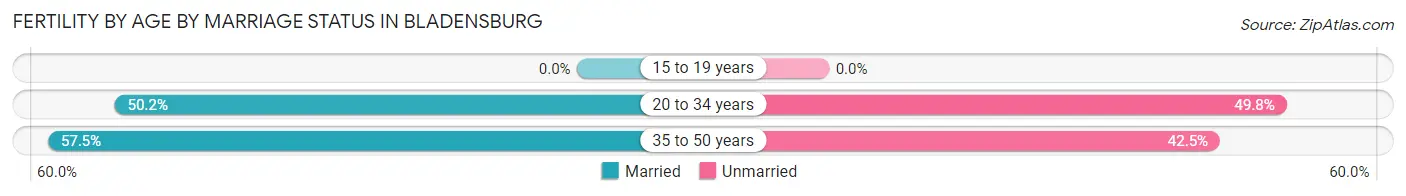
| Age Bracket | Married | Unmarried |
| 15 to 19 years | 0 (0.0%) | 0 (0.0%) |
| 20 to 34 years | 116 (50.2%) | 115 (49.8%) |
| 35 to 50 years | 50 (57.5%) | 37 (42.5%) |
| Total | 166 (52.2%) | 152 (47.8%) |
Fertility by Education in Bladensburg
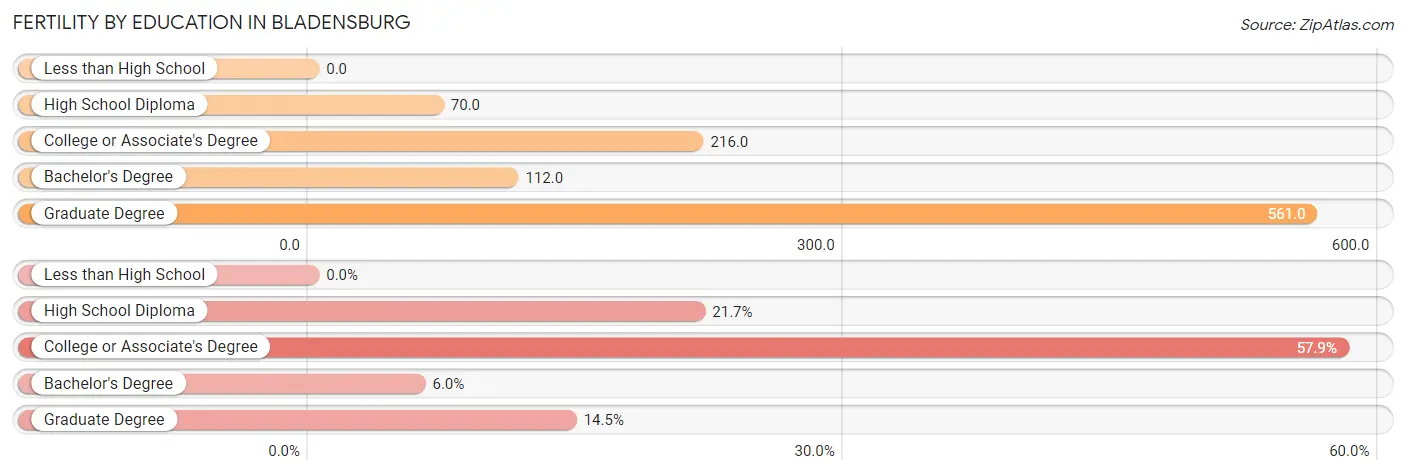
| Educational Attainment | Women with Births | Births / 1,000 Women |
| Less than High School | 0 (0.0%) | 0.0 |
| High School Diploma | 69 (21.7%) | 70.0 |
| College or Associate's Degree | 184 (57.9%) | 216.0 |
| Bachelor's Degree | 19 (6.0%) | 112.0 |
| Graduate Degree | 46 (14.5%) | 561.0 |
| Total | 318 (100.0%) | 128.0 |
Fertility by Education by Marriage Status in Bladensburg
47.8% of women with births in Bladensburg are unmarried. Women with the educational attainment of bachelor's degree are most likely to be married with 100.0% of them married at childbirth, while women with the educational attainment of college or associate's degree are least likely to be married with 69.0% of them unmarried at childbirth.
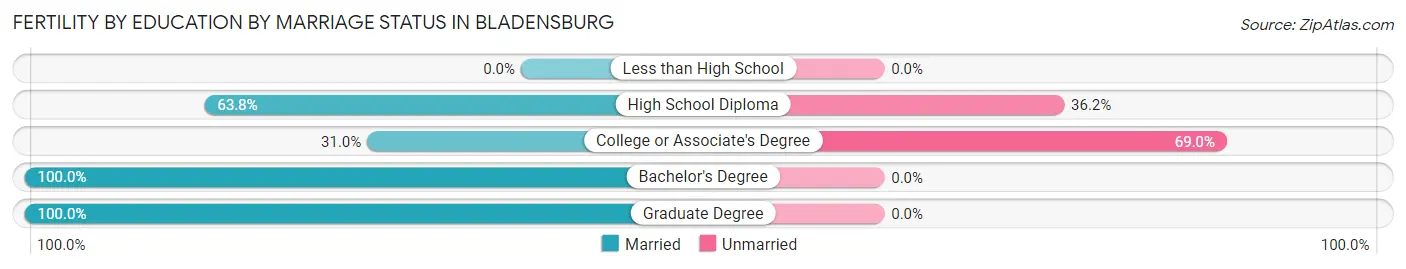
| Educational Attainment | Married | Unmarried |
| Less than High School | 0 (0.0%) | 0 (0.0%) |
| High School Diploma | 44 (63.8%) | 25 (36.2%) |
| College or Associate's Degree | 57 (31.0%) | 127 (69.0%) |
| Bachelor's Degree | 19 (100.0%) | 0 (0.0%) |
| Graduate Degree | 46 (100.0%) | 0 (0.0%) |
| Total | 166 (52.2%) | 152 (47.8%) |
Employment Characteristics in Bladensburg
Employment by Class of Employer in Bladensburg
Among the 3,934 employed individuals in Bladensburg, private company employees (2,606 | 66.2%), federal government employees (377 | 9.6%), and not-for-profit organizations (293 | 7.4%) make up the most common classes of employment.
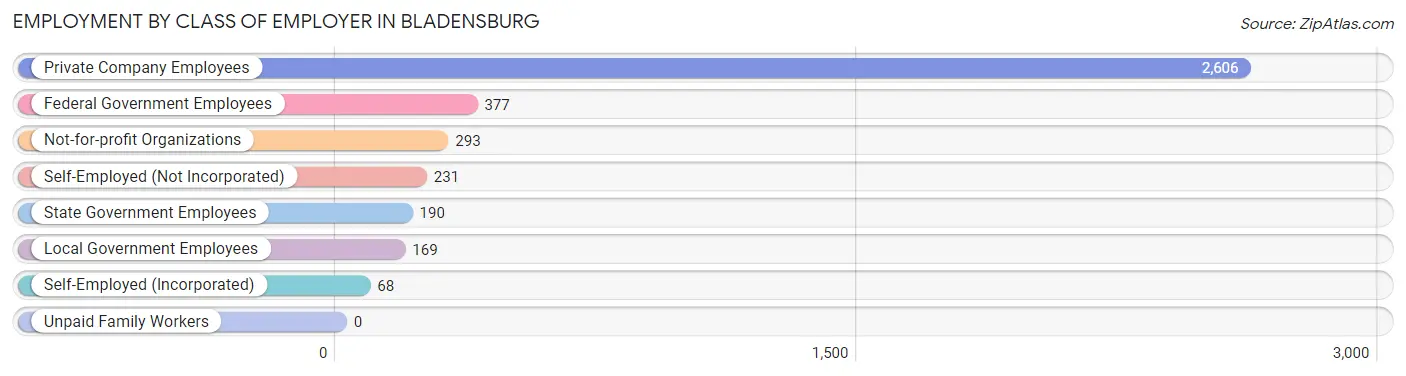
| Employer Class | # Employees | % Employees |
| Private Company Employees | 2,606 | 66.2% |
| Self-Employed (Incorporated) | 68 | 1.7% |
| Self-Employed (Not Incorporated) | 231 | 5.9% |
| Not-for-profit Organizations | 293 | 7.4% |
| Local Government Employees | 169 | 4.3% |
| State Government Employees | 190 | 4.8% |
| Federal Government Employees | 377 | 9.6% |
| Unpaid Family Workers | 0 | 0.0% |
| Total | 3,934 | 100.0% |
Employment Status by Age in Bladensburg
According to the labor force statistics for Bladensburg, out of the total population over 16 years of age (6,771), 71.5% or 4,841 individuals are in the labor force, with 14.9% or 721 of them unemployed. The age group with the highest labor force participation rate is 35 to 44 years, with 91.0% or 1,339 individuals in the labor force. Within the labor force, the 16 to 19 years age range has the highest percentage of unemployed individuals, with 69.3% or 79 of them being unemployed.
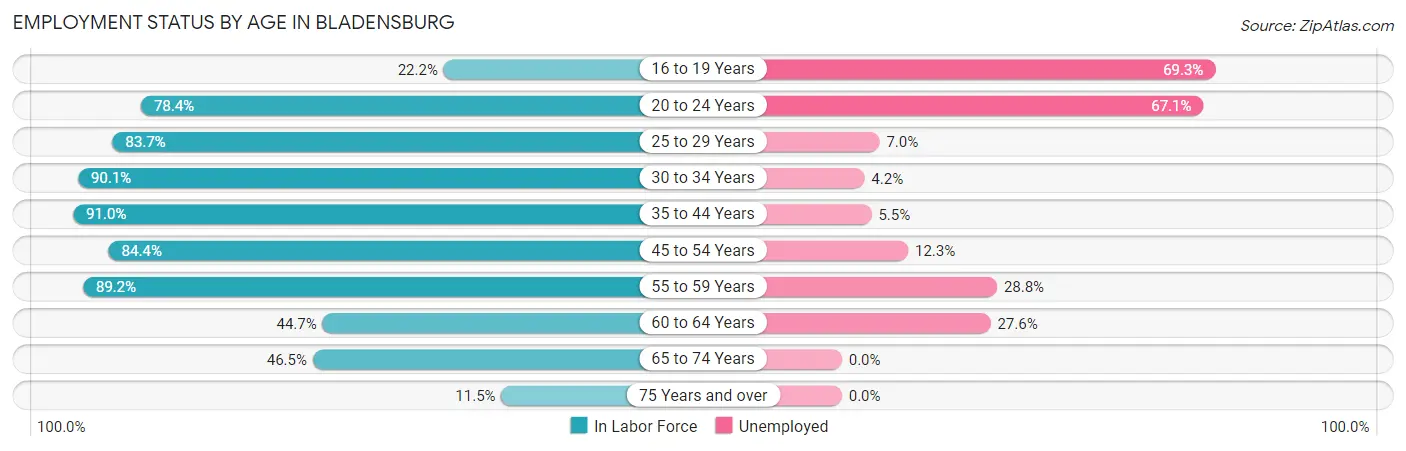
| Age Bracket | In Labor Force | Unemployed |
| 16 to 19 Years | 114 (22.2%) | 79 (69.3%) |
| 20 to 24 Years | 356 (78.4%) | 239 (67.1%) |
| 25 to 29 Years | 505 (83.7%) | 35 (7.0%) |
| 30 to 34 Years | 575 (90.1%) | 24 (4.2%) |
| 35 to 44 Years | 1,339 (91.0%) | 74 (5.5%) |
| 45 to 54 Years | 954 (84.4%) | 117 (12.3%) |
| 55 to 59 Years | 431 (89.2%) | 124 (28.8%) |
| 60 to 64 Years | 105 (44.7%) | 29 (27.6%) |
| 65 to 74 Years | 424 (46.5%) | 0 (0.0%) |
| 75 Years and over | 38 (11.5%) | 0 (0.0%) |
| Total | 4,841 (71.5%) | 721 (14.9%) |
Employment Status by Educational Attainment in Bladensburg
According to labor force statistics for Bladensburg, 85.7% of individuals (3,908) out of the total population between 25 and 64 years of age (4,560) are in the labor force, with 10.3% or 403 of them being unemployed. The group with the highest labor force participation rate are those with the educational attainment of less than high school, with 93.9% or 446 individuals in the labor force. Within the labor force, individuals with high school diploma education have the highest percentage of unemployment, with 18.5% or 258 of them being unemployed.
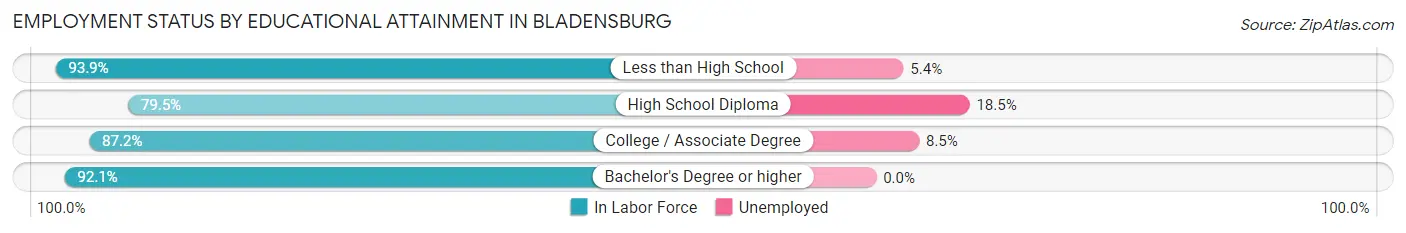
| Educational Attainment | In Labor Force | Unemployed |
| Less than High School | 446 (93.9%) | 26 (5.4%) |
| High School Diploma | 1,394 (79.5%) | 324 (18.5%) |
| College / Associate Degree | 1,426 (87.2%) | 139 (8.5%) |
| Bachelor's Degree or higher | 641 (92.1%) | 0 (0.0%) |
| Total | 3,908 (85.7%) | 470 (10.3%) |
Employment Occupations by Sex in Bladensburg
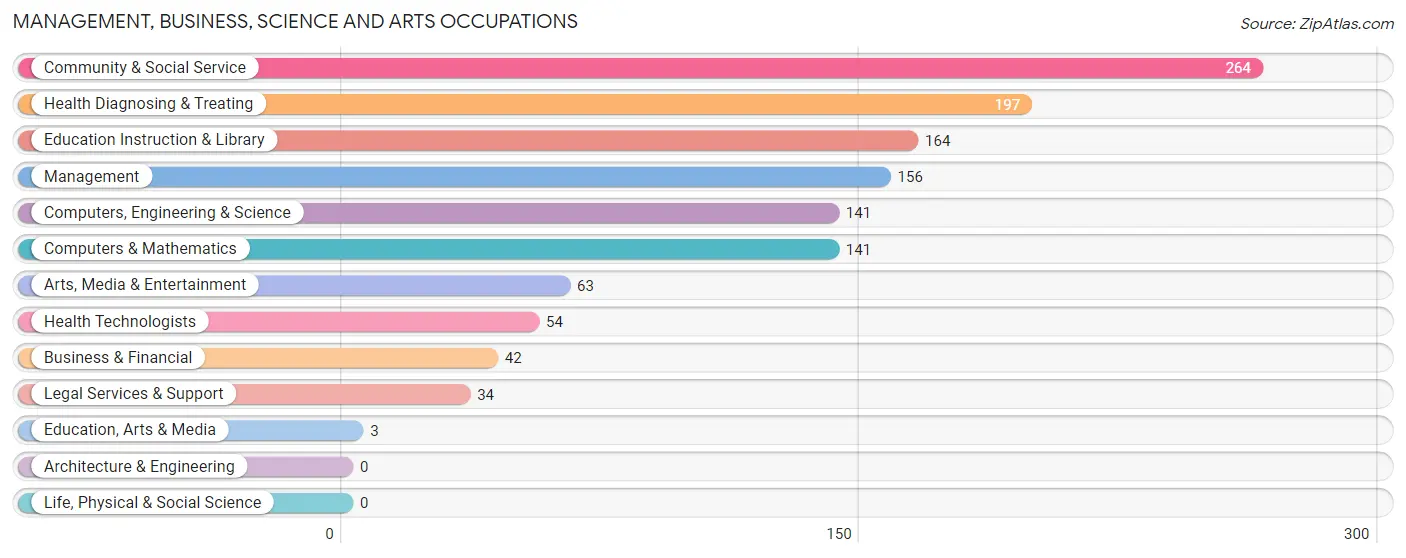
Management, Business, Science and Arts Occupations
The most common Management, Business, Science and Arts occupations in Bladensburg are Community & Social Service (264 | 6.4%), Health Diagnosing & Treating (197 | 4.8%), Education Instruction & Library (164 | 4.0%), Management (156 | 3.8%), and Computers, Engineering & Science (141 | 3.4%).
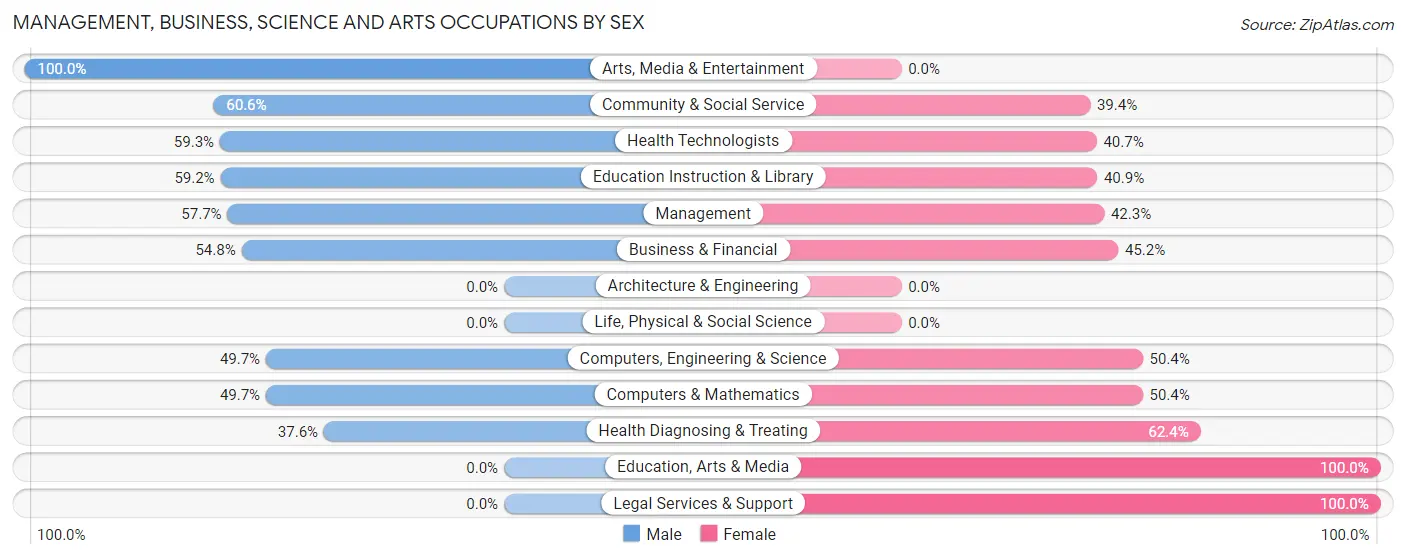
Management, Business, Science and Arts Occupations by Sex
Within the Management, Business, Science and Arts occupations in Bladensburg, the most male-oriented occupations are Arts, Media & Entertainment (100.0%), Community & Social Service (60.6%), and Health Technologists (59.3%), while the most female-oriented occupations are Education, Arts & Media (100.0%), Legal Services & Support (100.0%), and Health Diagnosing & Treating (62.4%).
| Occupation | Male | Female |
| Management | 90 (57.7%) | 66 (42.3%) |
| Business & Financial | 23 (54.8%) | 19 (45.2%) |
| Computers, Engineering & Science | 70 (49.6%) | 71 (50.3%) |
| Computers & Mathematics | 70 (49.6%) | 71 (50.3%) |
| Architecture & Engineering | 0 (0.0%) | 0 (0.0%) |
| Life, Physical & Social Science | 0 (0.0%) | 0 (0.0%) |
| Community & Social Service | 160 (60.6%) | 104 (39.4%) |
| Education, Arts & Media | 0 (0.0%) | 3 (100.0%) |
| Legal Services & Support | 0 (0.0%) | 34 (100.0%) |
| Education Instruction & Library | 97 (59.2%) | 67 (40.8%) |
| Arts, Media & Entertainment | 63 (100.0%) | 0 (0.0%) |
| Health Diagnosing & Treating | 74 (37.6%) | 123 (62.4%) |
| Health Technologists | 32 (59.3%) | 22 (40.7%) |
| Total (Category) | 417 (52.1%) | 383 (47.9%) |
| Total (Overall) | 1,939 (47.3%) | 2,161 (52.7%) |
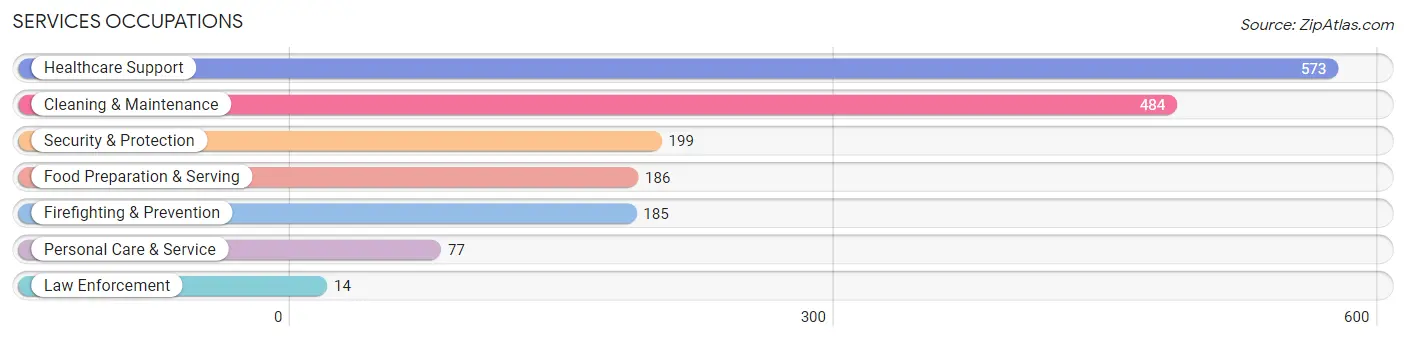
Services Occupations
The most common Services occupations in Bladensburg are Healthcare Support (573 | 14.0%), Cleaning & Maintenance (484 | 11.8%), Security & Protection (199 | 4.9%), Food Preparation & Serving (186 | 4.5%), and Firefighting & Prevention (185 | 4.5%).
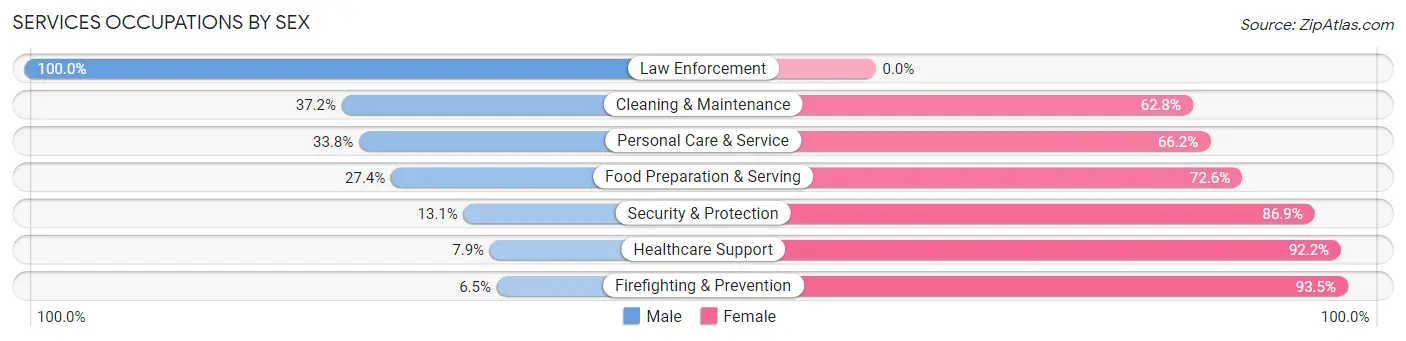
Services Occupations by Sex
Within the Services occupations in Bladensburg, the most male-oriented occupations are Law Enforcement (100.0%), Cleaning & Maintenance (37.2%), and Personal Care & Service (33.8%), while the most female-oriented occupations are Firefighting & Prevention (93.5%), Healthcare Support (92.1%), and Security & Protection (86.9%).
| Occupation | Male | Female |
| Healthcare Support | 45 (7.9%) | 528 (92.1%) |
| Security & Protection | 26 (13.1%) | 173 (86.9%) |
| Firefighting & Prevention | 12 (6.5%) | 173 (93.5%) |
| Law Enforcement | 14 (100.0%) | 0 (0.0%) |
| Food Preparation & Serving | 51 (27.4%) | 135 (72.6%) |
| Cleaning & Maintenance | 180 (37.2%) | 304 (62.8%) |
| Personal Care & Service | 26 (33.8%) | 51 (66.2%) |
| Total (Category) | 328 (21.6%) | 1,191 (78.4%) |
| Total (Overall) | 1,939 (47.3%) | 2,161 (52.7%) |
Sales and Office Occupations
The most common Sales and Office occupations in Bladensburg are Office & Administration (377 | 9.2%), and Sales & Related (328 | 8.0%).
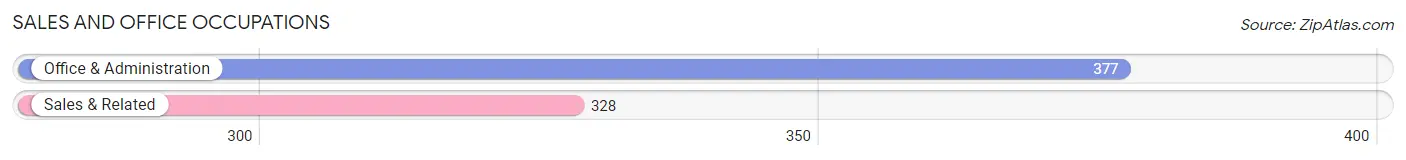
Sales and Office Occupations by Sex
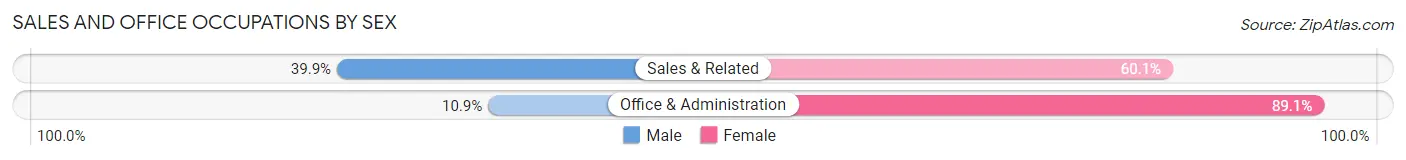
| Occupation | Male | Female |
| Sales & Related | 131 (39.9%) | 197 (60.1%) |
| Office & Administration | 41 (10.9%) | 336 (89.1%) |
| Total (Category) | 172 (24.4%) | 533 (75.6%) |
| Total (Overall) | 1,939 (47.3%) | 2,161 (52.7%) |
Natural Resources, Construction and Maintenance Occupations
The most common Natural Resources, Construction and Maintenance occupations in Bladensburg are Construction & Extraction (552 | 13.5%), and Installation, Maintenance & Repair (105 | 2.6%).
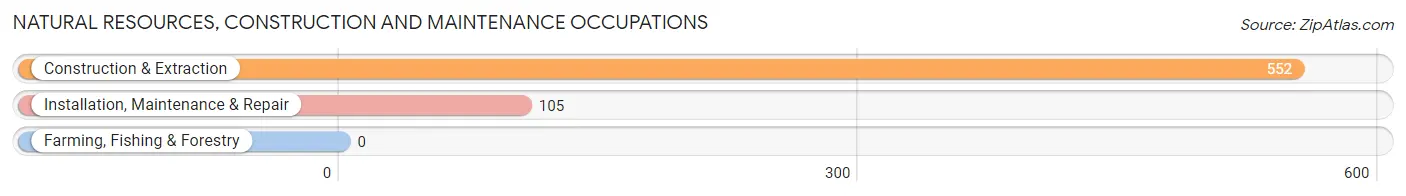
Natural Resources, Construction and Maintenance Occupations by Sex
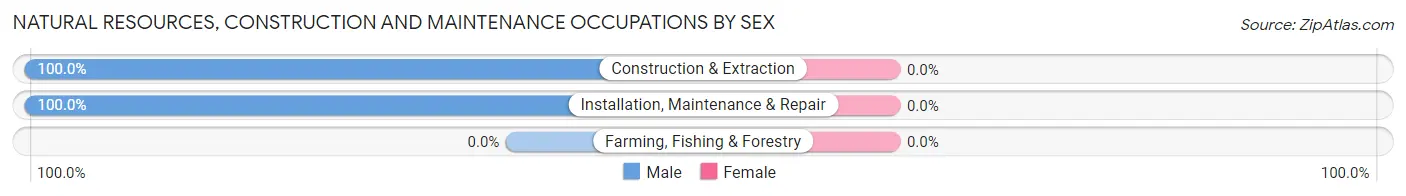
| Occupation | Male | Female |
| Farming, Fishing & Forestry | 0 (0.0%) | 0 (0.0%) |
| Construction & Extraction | 552 (100.0%) | 0 (0.0%) |
| Installation, Maintenance & Repair | 105 (100.0%) | 0 (0.0%) |
| Total (Category) | 657 (100.0%) | 0 (0.0%) |
| Total (Overall) | 1,939 (47.3%) | 2,161 (52.7%) |
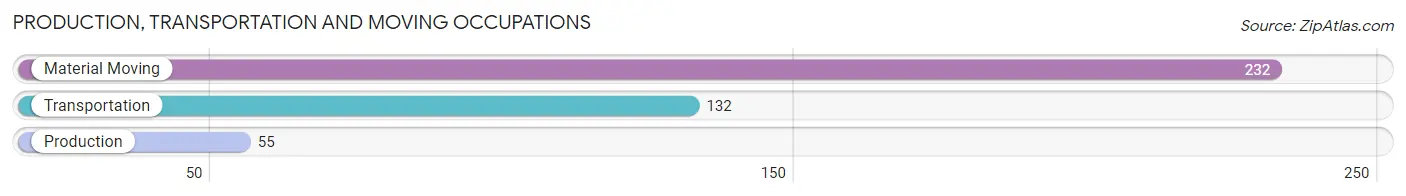
Production, Transportation and Moving Occupations
The most common Production, Transportation and Moving occupations in Bladensburg are Material Moving (232 | 5.7%), Transportation (132 | 3.2%), and Production (55 | 1.3%).
Production, Transportation and Moving Occupations by Sex
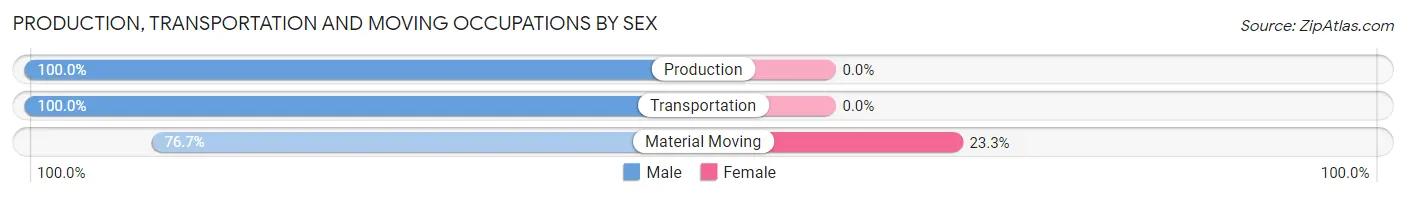
| Occupation | Male | Female |
| Production | 55 (100.0%) | 0 (0.0%) |
| Transportation | 132 (100.0%) | 0 (0.0%) |
| Material Moving | 178 (76.7%) | 54 (23.3%) |
| Total (Category) | 365 (87.1%) | 54 (12.9%) |
| Total (Overall) | 1,939 (47.3%) | 2,161 (52.7%) |
Employment Industries by Sex in Bladensburg
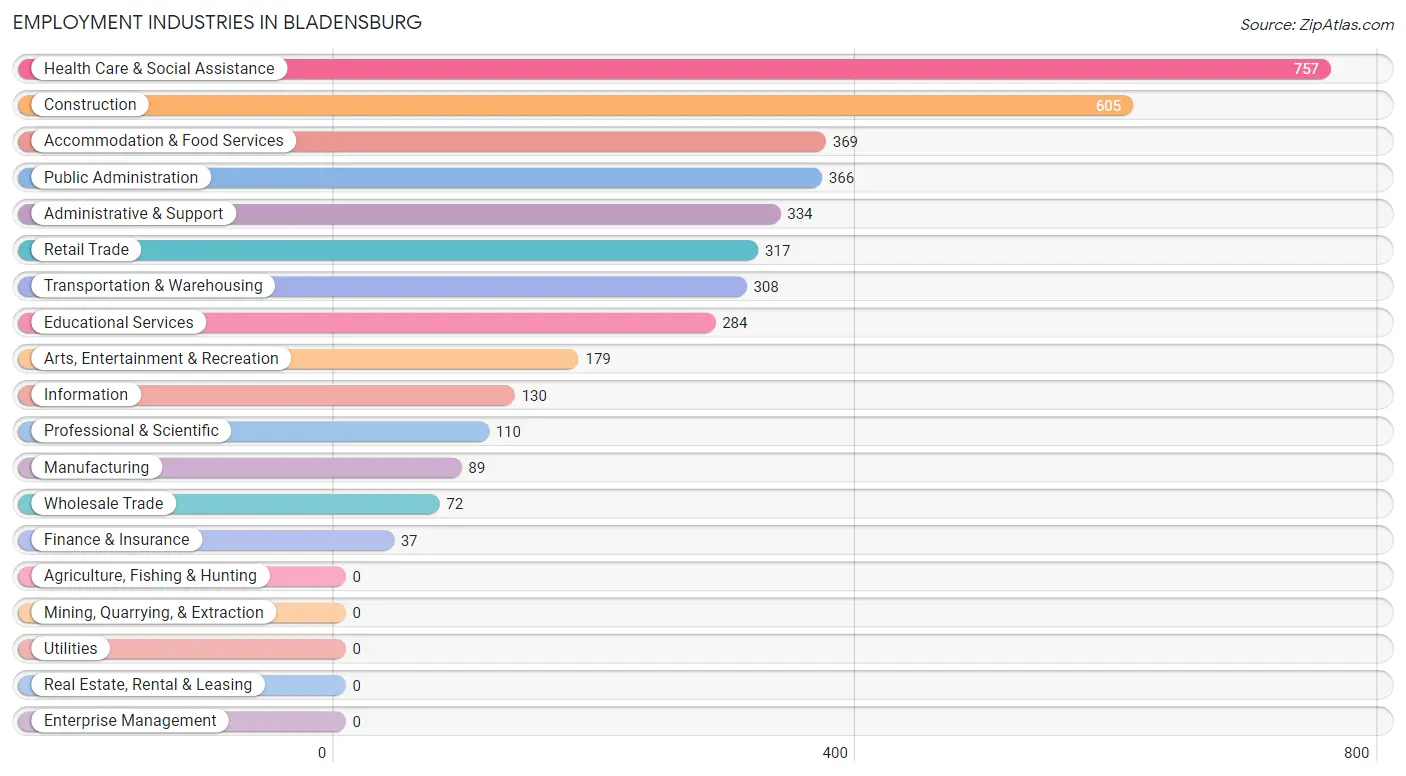
Employment Industries in Bladensburg
The major employment industries in Bladensburg include Health Care & Social Assistance (757 | 18.5%), Construction (605 | 14.8%), Accommodation & Food Services (369 | 9.0%), Public Administration (366 | 8.9%), and Administrative & Support (334 | 8.2%).
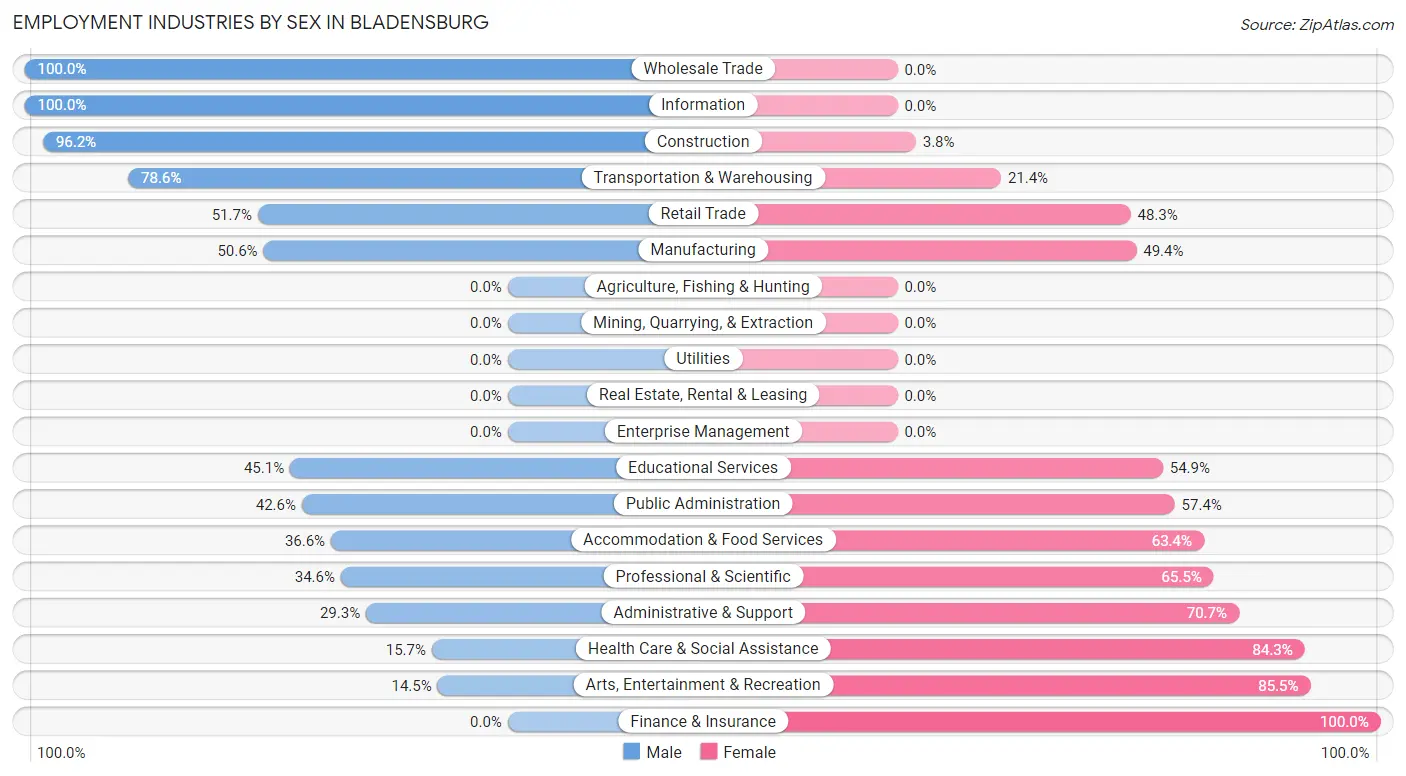
Employment Industries by Sex in Bladensburg
The Bladensburg industries that see more men than women are Wholesale Trade (100.0%), Information (100.0%), and Construction (96.2%), whereas the industries that tend to have a higher number of women are Finance & Insurance (100.0%), Arts, Entertainment & Recreation (85.5%), and Health Care & Social Assistance (84.3%).
| Industry | Male | Female |
| Agriculture, Fishing & Hunting | 0 (0.0%) | 0 (0.0%) |
| Mining, Quarrying, & Extraction | 0 (0.0%) | 0 (0.0%) |
| Construction | 582 (96.2%) | 23 (3.8%) |
| Manufacturing | 45 (50.6%) | 44 (49.4%) |
| Wholesale Trade | 72 (100.0%) | 0 (0.0%) |
| Retail Trade | 164 (51.7%) | 153 (48.3%) |
| Transportation & Warehousing | 242 (78.6%) | 66 (21.4%) |
| Utilities | 0 (0.0%) | 0 (0.0%) |
| Information | 130 (100.0%) | 0 (0.0%) |
| Finance & Insurance | 0 (0.0%) | 37 (100.0%) |
| Real Estate, Rental & Leasing | 0 (0.0%) | 0 (0.0%) |
| Professional & Scientific | 38 (34.5%) | 72 (65.4%) |
| Enterprise Management | 0 (0.0%) | 0 (0.0%) |
| Administrative & Support | 98 (29.3%) | 236 (70.7%) |
| Educational Services | 128 (45.1%) | 156 (54.9%) |
| Health Care & Social Assistance | 119 (15.7%) | 638 (84.3%) |
| Arts, Entertainment & Recreation | 26 (14.5%) | 153 (85.5%) |
| Accommodation & Food Services | 135 (36.6%) | 234 (63.4%) |
| Public Administration | 156 (42.6%) | 210 (57.4%) |
| Total | 1,939 (47.3%) | 2,161 (52.7%) |
Education in Bladensburg
School Enrollment in Bladensburg
The most common levels of schooling among the 2,963 students in Bladensburg are elementary school (986 | 33.3%), middle school (713 | 24.1%), and high school (461 | 15.6%).
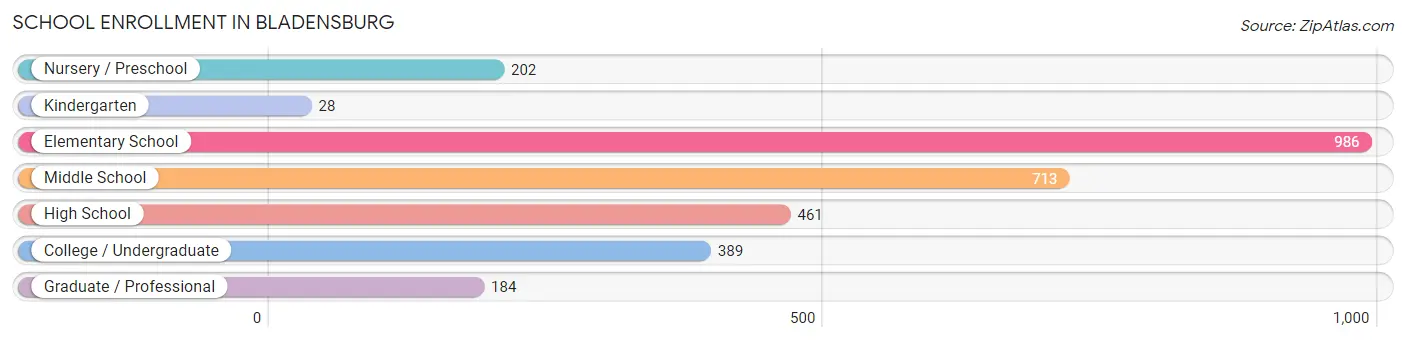
| School Level | # Students | % Students |
| Nursery / Preschool | 202 | 6.8% |
| Kindergarten | 28 | 0.9% |
| Elementary School | 986 | 33.3% |
| Middle School | 713 | 24.1% |
| High School | 461 | 15.6% |
| College / Undergraduate | 389 | 13.1% |
| Graduate / Professional | 184 | 6.2% |
| Total | 2,963 | 100.0% |
School Enrollment by Age by Funding Source in Bladensburg
Out of a total of 2,963 students who are enrolled in schools in Bladensburg, 222 (7.5%) attend a private institution, while the remaining 2,741 (92.5%) are enrolled in public schools. The age group of 25 to 34 year olds has the highest likelihood of being enrolled in private schools, with 118 (37.0% in the age bracket) enrolled. Conversely, the age group of 3 to 4 year olds has the lowest likelihood of being enrolled in a private school, with 57 (100.0% in the age bracket) attending a public institution.
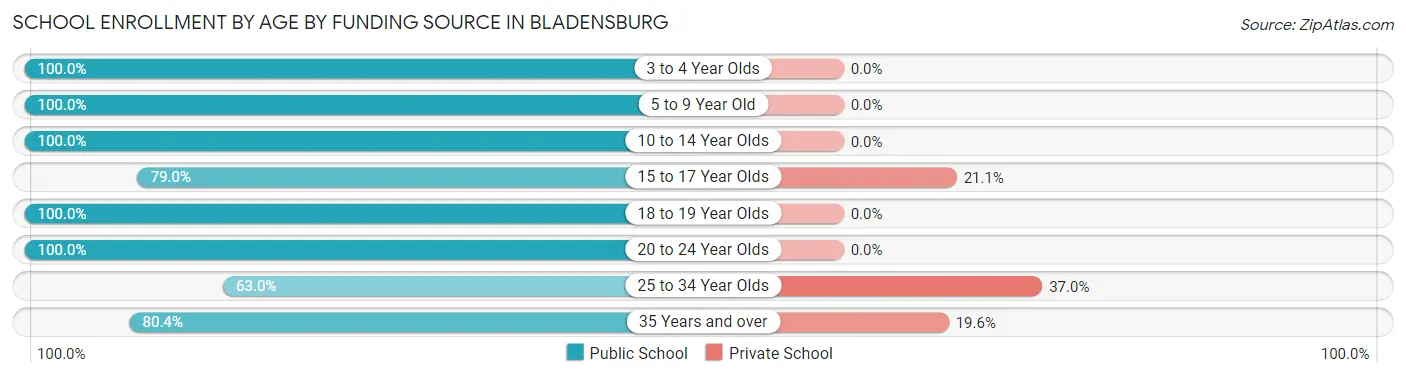
| Age Bracket | Public School | Private School |
| 3 to 4 Year Olds | 57 (100.0%) | 0 (0.0%) |
| 5 to 9 Year Old | 1,136 (100.0%) | 0 (0.0%) |
| 10 to 14 Year Olds | 802 (100.0%) | 0 (0.0%) |
| 15 to 17 Year Olds | 255 (78.9%) | 68 (21.0%) |
| 18 to 19 Year Olds | 19 (100.0%) | 0 (0.0%) |
| 20 to 24 Year Olds | 123 (100.0%) | 0 (0.0%) |
| 25 to 34 Year Olds | 201 (63.0%) | 118 (37.0%) |
| 35 Years and over | 148 (80.4%) | 36 (19.6%) |
| Total | 2,741 (92.5%) | 222 (7.5%) |
Educational Attainment by Field of Study in Bladensburg
Science & technology (201 | 20.8%), business (137 | 14.2%), education (114 | 11.8%), social sciences (102 | 10.5%), and visual & performing arts (78 | 8.1%) are the most common fields of study among 967 individuals in Bladensburg who have obtained a bachelor's degree or higher.
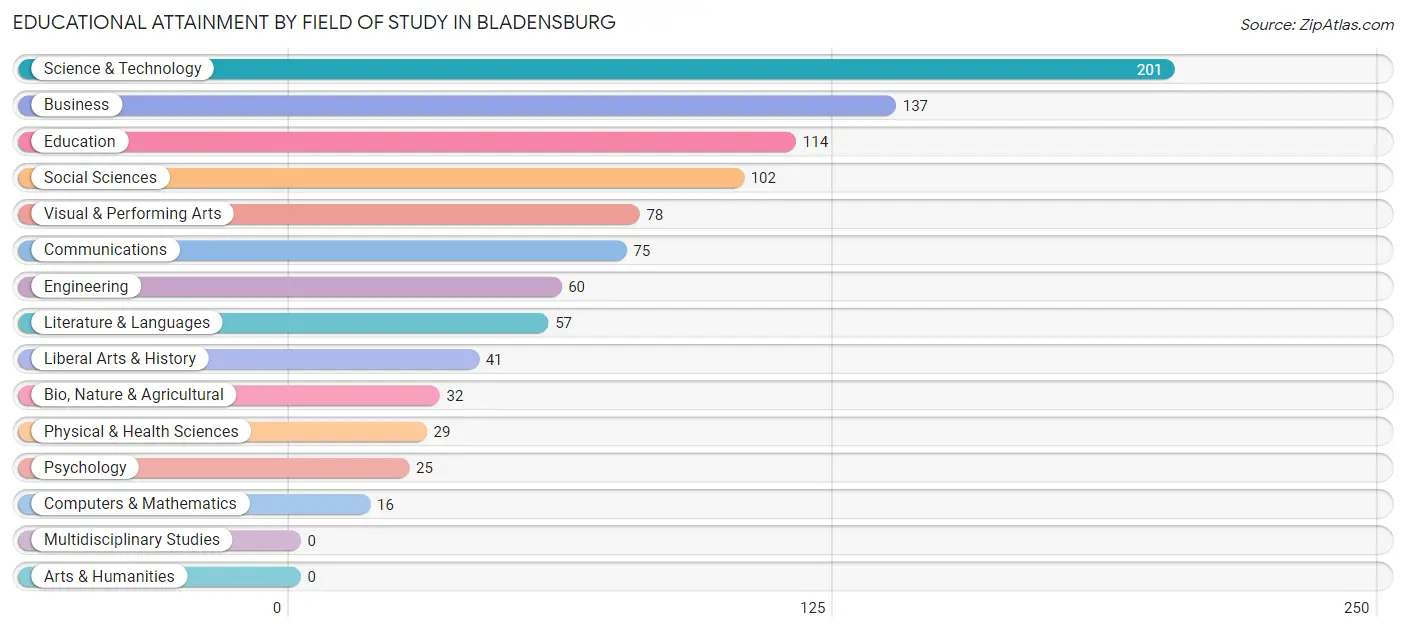
| Field of Study | # Graduates | % Graduates |
| Computers & Mathematics | 16 | 1.7% |
| Bio, Nature & Agricultural | 32 | 3.3% |
| Physical & Health Sciences | 29 | 3.0% |
| Psychology | 25 | 2.6% |
| Social Sciences | 102 | 10.5% |
| Engineering | 60 | 6.2% |
| Multidisciplinary Studies | 0 | 0.0% |
| Science & Technology | 201 | 20.8% |
| Business | 137 | 14.2% |
| Education | 114 | 11.8% |
| Literature & Languages | 57 | 5.9% |
| Liberal Arts & History | 41 | 4.2% |
| Visual & Performing Arts | 78 | 8.1% |
| Communications | 75 | 7.8% |
| Arts & Humanities | 0 | 0.0% |
| Total | 967 | 100.0% |
Transportation & Commute in Bladensburg
Vehicle Availability by Sex in Bladensburg
The most prevalent vehicle ownership categories in Bladensburg are males with 1 vehicle (913, accounting for 50.8%) and females with 1 vehicle (969, making up 42.9%).
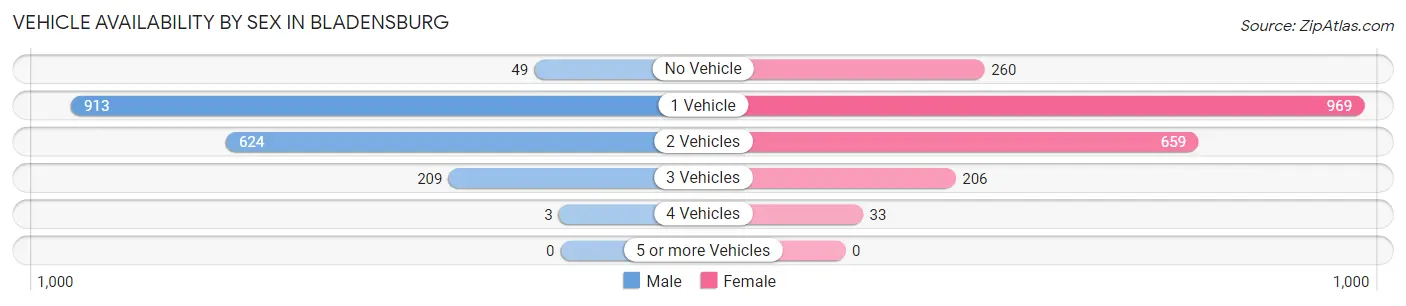
| Vehicles Available | Male | Female |
| No Vehicle | 49 (2.7%) | 260 (12.2%) |
| 1 Vehicle | 913 (50.8%) | 969 (45.6%) |
| 2 Vehicles | 624 (34.7%) | 659 (31.0%) |
| 3 Vehicles | 209 (11.6%) | 206 (9.7%) |
| 4 Vehicles | 3 (0.2%) | 33 (1.5%) |
| 5 or more Vehicles | 0 (0.0%) | 0 (0.0%) |
| Total | 1,798 (100.0%) | 2,127 (100.0%) |
Commute Time in Bladensburg
The most frequently occuring commute durations in Bladensburg are 30 to 34 minutes (819 commuters, 21.9%), 20 to 24 minutes (598 commuters, 16.0%), and 15 to 19 minutes (423 commuters, 11.3%).
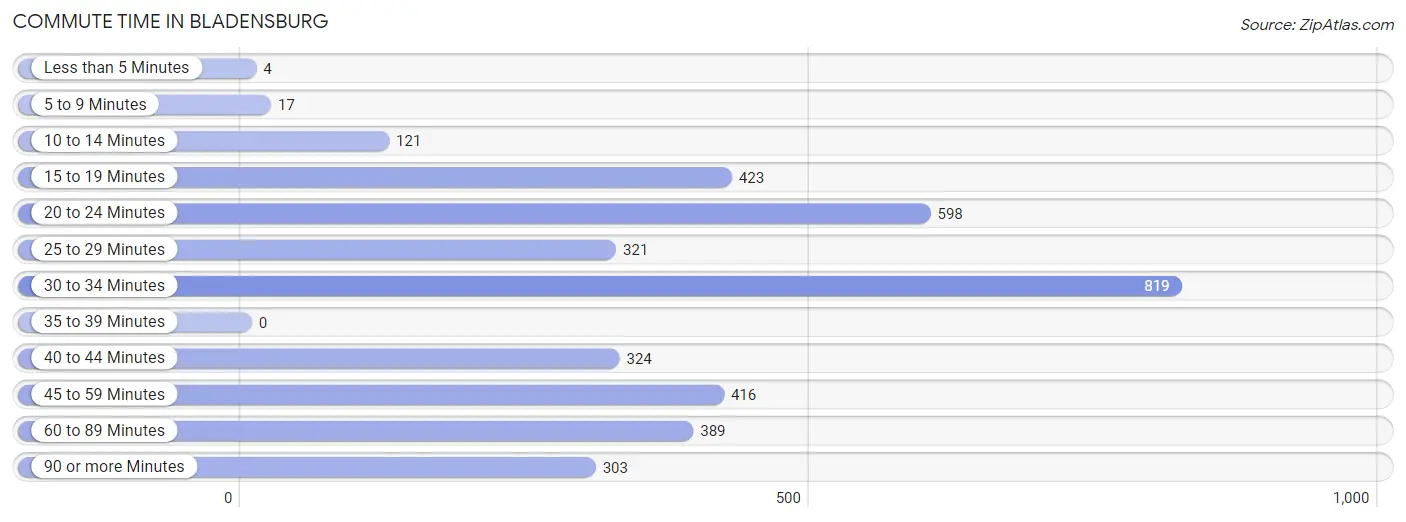
| Commute Time | # Commuters | % Commuters |
| Less than 5 Minutes | 4 | 0.1% |
| 5 to 9 Minutes | 17 | 0.5% |
| 10 to 14 Minutes | 121 | 3.2% |
| 15 to 19 Minutes | 423 | 11.3% |
| 20 to 24 Minutes | 598 | 16.0% |
| 25 to 29 Minutes | 321 | 8.6% |
| 30 to 34 Minutes | 819 | 21.9% |
| 35 to 39 Minutes | 0 | 0.0% |
| 40 to 44 Minutes | 324 | 8.7% |
| 45 to 59 Minutes | 416 | 11.1% |
| 60 to 89 Minutes | 389 | 10.4% |
| 90 or more Minutes | 303 | 8.1% |
Commute Time by Sex in Bladensburg
The most common commute times in Bladensburg are 20 to 24 minutes (376 commuters, 21.0%) for males and 30 to 34 minutes (456 commuters, 23.5%) for females.
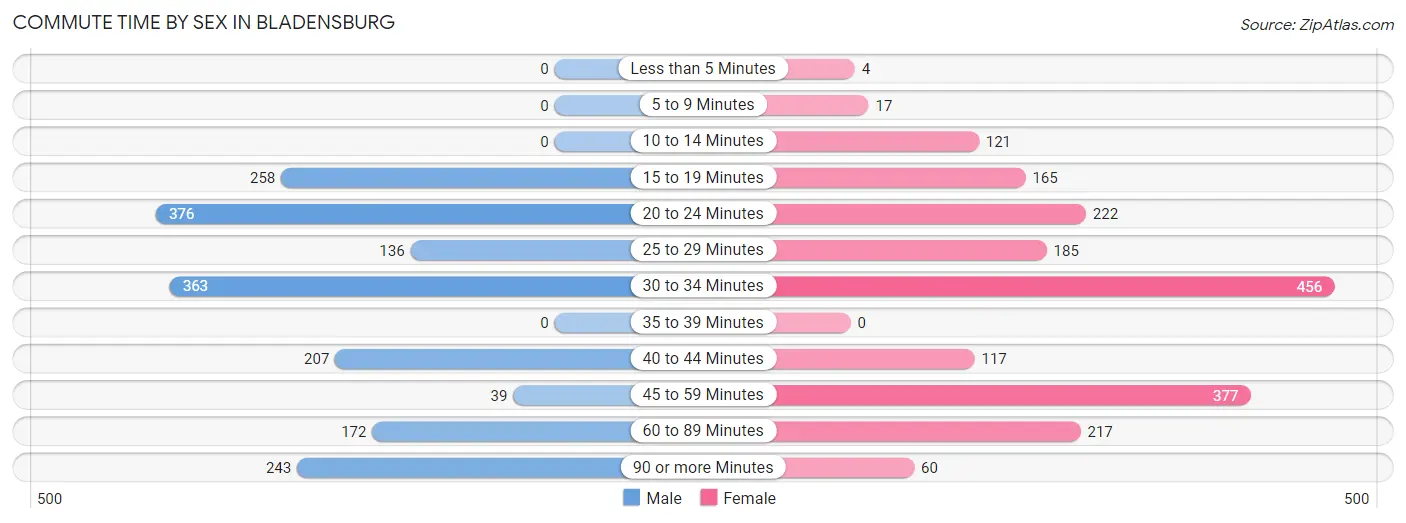
| Commute Time | Male | Female |
| Less than 5 Minutes | 0 (0.0%) | 4 (0.2%) |
| 5 to 9 Minutes | 0 (0.0%) | 17 (0.9%) |
| 10 to 14 Minutes | 0 (0.0%) | 121 (6.2%) |
| 15 to 19 Minutes | 258 (14.4%) | 165 (8.5%) |
| 20 to 24 Minutes | 376 (21.0%) | 222 (11.4%) |
| 25 to 29 Minutes | 136 (7.6%) | 185 (9.5%) |
| 30 to 34 Minutes | 363 (20.2%) | 456 (23.5%) |
| 35 to 39 Minutes | 0 (0.0%) | 0 (0.0%) |
| 40 to 44 Minutes | 207 (11.5%) | 117 (6.0%) |
| 45 to 59 Minutes | 39 (2.2%) | 377 (19.4%) |
| 60 to 89 Minutes | 172 (9.6%) | 217 (11.2%) |
| 90 or more Minutes | 243 (13.6%) | 60 (3.1%) |
Time of Departure to Work by Sex in Bladensburg
The most frequent times of departure to work in Bladensburg are 12:00 AM to 4:59 AM (499, 27.8%) for males and 8:00 AM to 8:29 AM (284, 14.6%) for females.
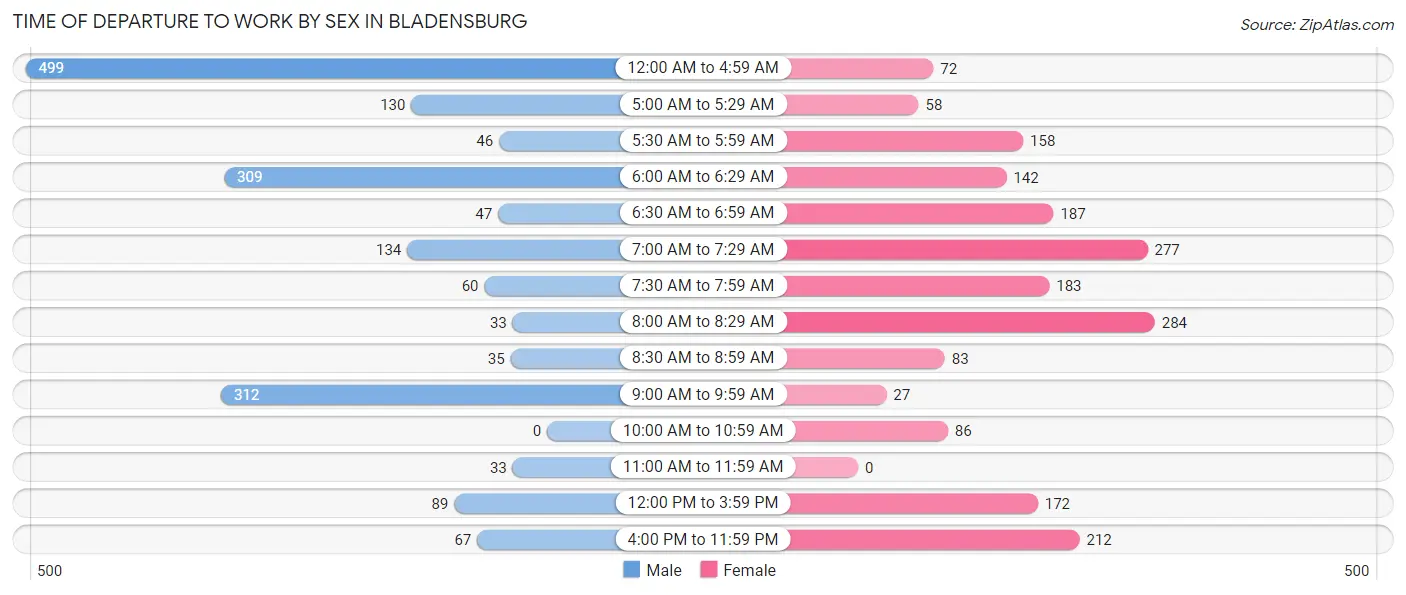
| Time of Departure | Male | Female |
| 12:00 AM to 4:59 AM | 499 (27.8%) | 72 (3.7%) |
| 5:00 AM to 5:29 AM | 130 (7.2%) | 58 (3.0%) |
| 5:30 AM to 5:59 AM | 46 (2.6%) | 158 (8.1%) |
| 6:00 AM to 6:29 AM | 309 (17.2%) | 142 (7.3%) |
| 6:30 AM to 6:59 AM | 47 (2.6%) | 187 (9.6%) |
| 7:00 AM to 7:29 AM | 134 (7.5%) | 277 (14.3%) |
| 7:30 AM to 7:59 AM | 60 (3.3%) | 183 (9.4%) |
| 8:00 AM to 8:29 AM | 33 (1.8%) | 284 (14.6%) |
| 8:30 AM to 8:59 AM | 35 (1.9%) | 83 (4.3%) |
| 9:00 AM to 9:59 AM | 312 (17.4%) | 27 (1.4%) |
| 10:00 AM to 10:59 AM | 0 (0.0%) | 86 (4.4%) |
| 11:00 AM to 11:59 AM | 33 (1.8%) | 0 (0.0%) |
| 12:00 PM to 3:59 PM | 89 (5.0%) | 172 (8.9%) |
| 4:00 PM to 11:59 PM | 67 (3.7%) | 212 (10.9%) |
| Total | 1,794 (100.0%) | 1,941 (100.0%) |
Housing Occupancy in Bladensburg
Occupancy by Ownership in Bladensburg
Of the total 3,540 dwellings in Bladensburg, owner-occupied units account for 671 (19.0%), while renter-occupied units make up 2,869 (81.0%).
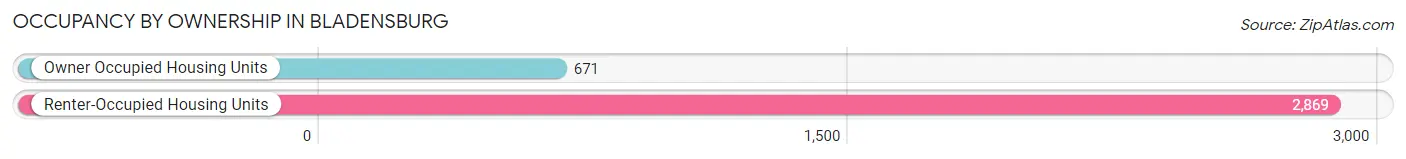
| Occupancy | # Housing Units | % Housing Units |
| Owner Occupied Housing Units | 671 | 19.0% |
| Renter-Occupied Housing Units | 2,869 | 81.0% |
| Total Occupied Housing Units | 3,540 | 100.0% |
Occupancy by Household Size in Bladensburg
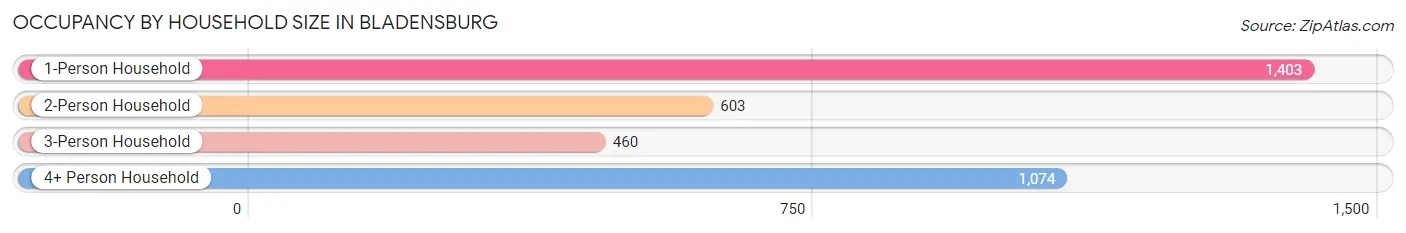
| Household Size | # Housing Units | % Housing Units |
| 1-Person Household | 1,403 | 39.6% |
| 2-Person Household | 603 | 17.0% |
| 3-Person Household | 460 | 13.0% |
| 4+ Person Household | 1,074 | 30.3% |
| Total Housing Units | 3,540 | 100.0% |
Occupancy by Ownership by Household Size in Bladensburg
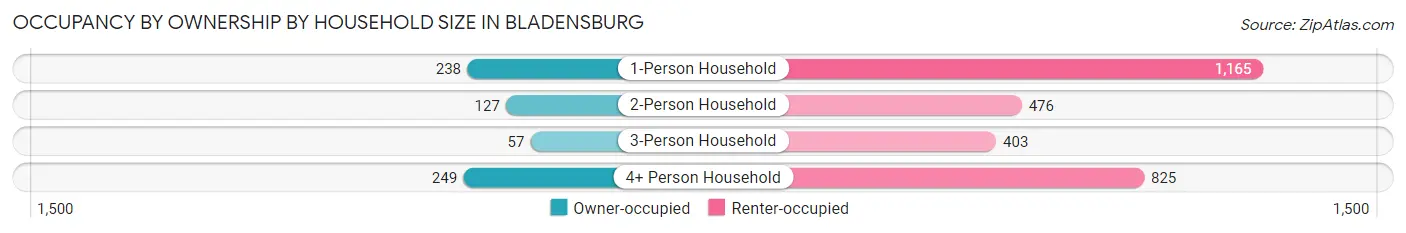
| Household Size | Owner-occupied | Renter-occupied |
| 1-Person Household | 238 (17.0%) | 1,165 (83.0%) |
| 2-Person Household | 127 (21.1%) | 476 (78.9%) |
| 3-Person Household | 57 (12.4%) | 403 (87.6%) |
| 4+ Person Household | 249 (23.2%) | 825 (76.8%) |
| Total Housing Units | 671 (19.0%) | 2,869 (81.0%) |
Occupancy by Educational Attainment in Bladensburg
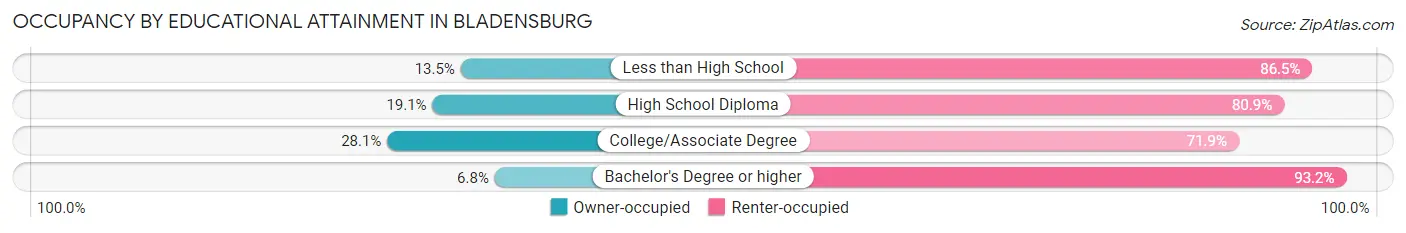
| Household Size | Owner-occupied | Renter-occupied |
| Less than High School | 67 (13.5%) | 428 (86.5%) |
| High School Diploma | 223 (19.1%) | 942 (80.9%) |
| College/Associate Degree | 334 (28.1%) | 854 (71.9%) |
| Bachelor's Degree or higher | 47 (6.8%) | 645 (93.2%) |
Occupancy by Age of Householder in Bladensburg
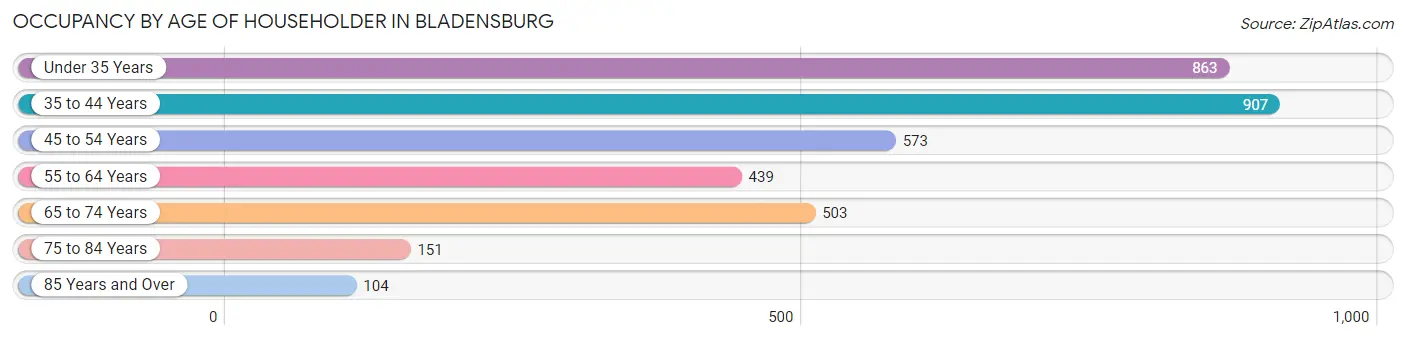
| Age Bracket | # Households | % Households |
| Under 35 Years | 863 | 24.4% |
| 35 to 44 Years | 907 | 25.6% |
| 45 to 54 Years | 573 | 16.2% |
| 55 to 64 Years | 439 | 12.4% |
| 65 to 74 Years | 503 | 14.2% |
| 75 to 84 Years | 151 | 4.3% |
| 85 Years and Over | 104 | 2.9% |
| Total | 3,540 | 100.0% |
Housing Finances in Bladensburg
Median Income by Occupancy in Bladensburg
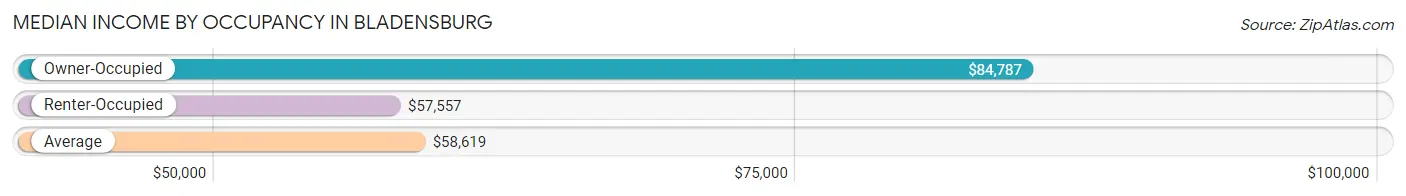
| Occupancy Type | # Households | Median Income |
| Owner-Occupied | 671 (19.0%) | $84,787 |
| Renter-Occupied | 2,869 (81.0%) | $57,557 |
| Average | 3,540 (100.0%) | $58,619 |
Occupancy by Householder Income Bracket in Bladensburg
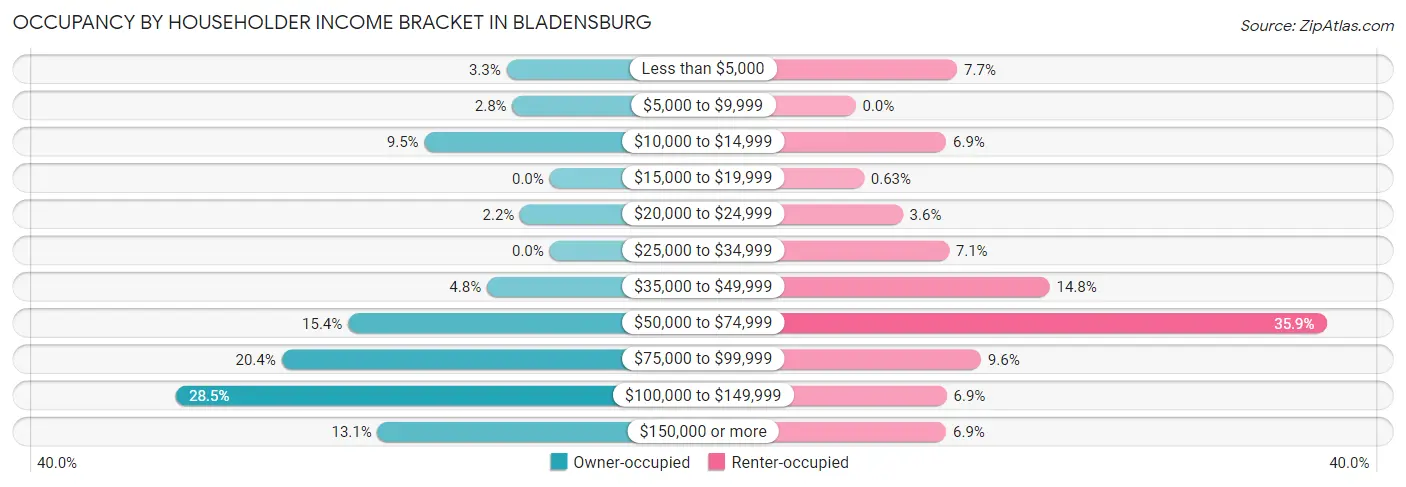
| Income Bracket | Owner-occupied | Renter-occupied |
| Less than $5,000 | 22 (3.3%) | 222 (7.7%) |
| $5,000 to $9,999 | 19 (2.8%) | 0 (0.0%) |
| $10,000 to $14,999 | 64 (9.5%) | 198 (6.9%) |
| $15,000 to $19,999 | 0 (0.0%) | 18 (0.6%) |
| $20,000 to $24,999 | 15 (2.2%) | 103 (3.6%) |
| $25,000 to $34,999 | 0 (0.0%) | 204 (7.1%) |
| $35,000 to $49,999 | 32 (4.8%) | 424 (14.8%) |
| $50,000 to $74,999 | 103 (15.3%) | 1,029 (35.9%) |
| $75,000 to $99,999 | 137 (20.4%) | 274 (9.6%) |
| $100,000 to $149,999 | 191 (28.5%) | 199 (6.9%) |
| $150,000 or more | 88 (13.1%) | 198 (6.9%) |
| Total | 671 (100.0%) | 2,869 (100.0%) |
Monthly Housing Cost Tiers in Bladensburg
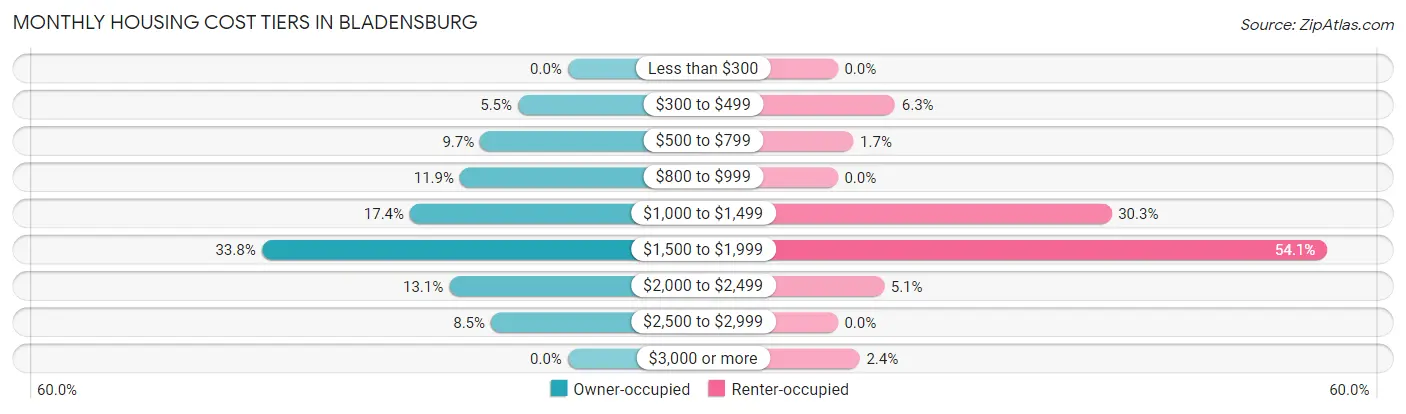
| Monthly Cost | Owner-occupied | Renter-occupied |
| Less than $300 | 0 (0.0%) | 0 (0.0%) |
| $300 to $499 | 37 (5.5%) | 182 (6.3%) |
| $500 to $799 | 65 (9.7%) | 50 (1.7%) |
| $800 to $999 | 80 (11.9%) | 0 (0.0%) |
| $1,000 to $1,499 | 117 (17.4%) | 868 (30.2%) |
| $1,500 to $1,999 | 227 (33.8%) | 1,552 (54.1%) |
| $2,000 to $2,499 | 88 (13.1%) | 147 (5.1%) |
| $2,500 to $2,999 | 57 (8.5%) | 0 (0.0%) |
| $3,000 or more | 0 (0.0%) | 70 (2.4%) |
| Total | 671 (100.0%) | 2,869 (100.0%) |
Physical Housing Characteristics in Bladensburg
Housing Structures in Bladensburg
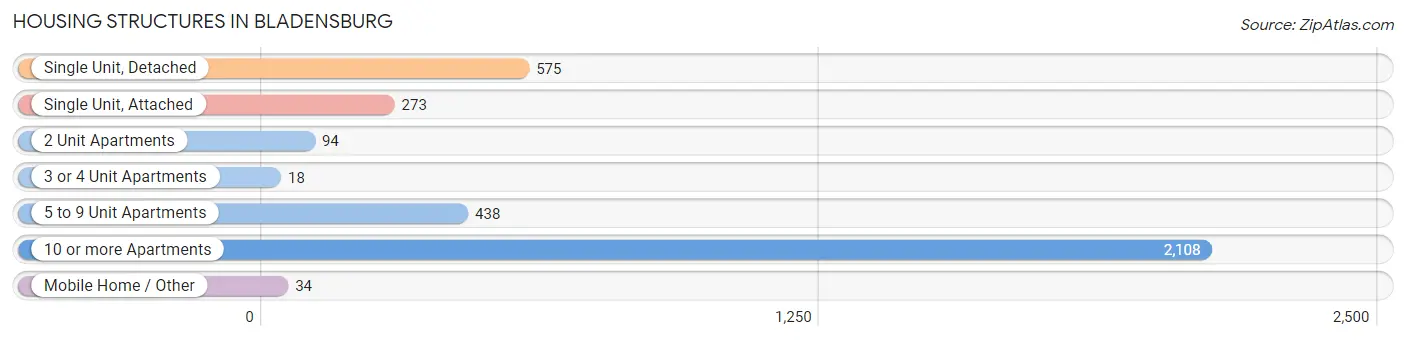
| Structure Type | # Housing Units | % Housing Units |
| Single Unit, Detached | 575 | 16.2% |
| Single Unit, Attached | 273 | 7.7% |
| 2 Unit Apartments | 94 | 2.7% |
| 3 or 4 Unit Apartments | 18 | 0.5% |
| 5 to 9 Unit Apartments | 438 | 12.4% |
| 10 or more Apartments | 2,108 | 59.6% |
| Mobile Home / Other | 34 | 1.0% |
| Total | 3,540 | 100.0% |
Housing Structures by Occupancy in Bladensburg
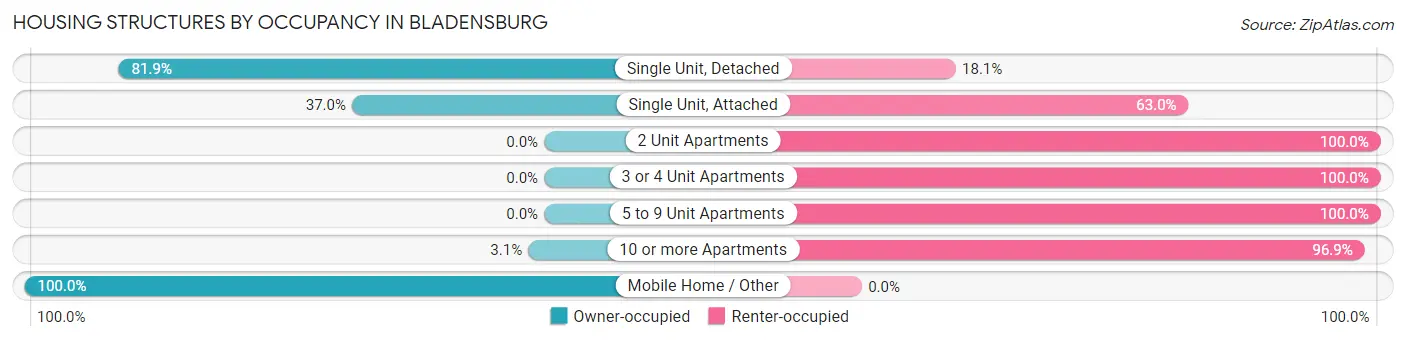
| Structure Type | Owner-occupied | Renter-occupied |
| Single Unit, Detached | 471 (81.9%) | 104 (18.1%) |
| Single Unit, Attached | 101 (37.0%) | 172 (63.0%) |
| 2 Unit Apartments | 0 (0.0%) | 94 (100.0%) |
| 3 or 4 Unit Apartments | 0 (0.0%) | 18 (100.0%) |
| 5 to 9 Unit Apartments | 0 (0.0%) | 438 (100.0%) |
| 10 or more Apartments | 65 (3.1%) | 2,043 (96.9%) |
| Mobile Home / Other | 34 (100.0%) | 0 (0.0%) |
| Total | 671 (19.0%) | 2,869 (81.0%) |
Housing Structures by Number of Rooms in Bladensburg
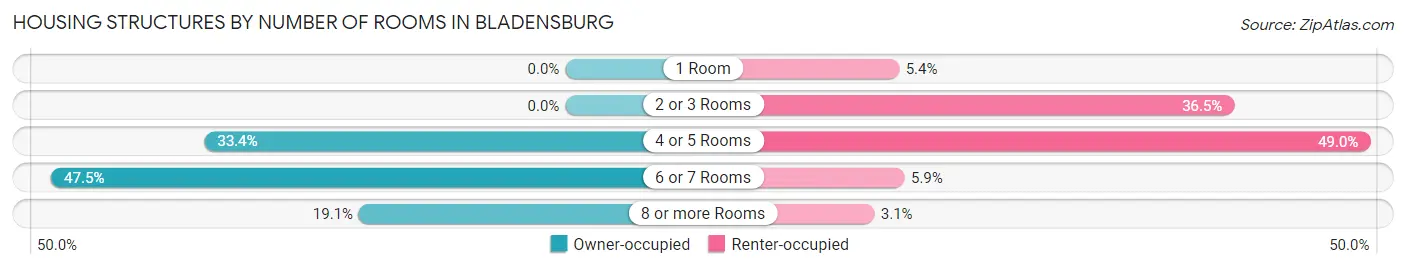
| Number of Rooms | Owner-occupied | Renter-occupied |
| 1 Room | 0 (0.0%) | 156 (5.4%) |
| 2 or 3 Rooms | 0 (0.0%) | 1,046 (36.5%) |
| 4 or 5 Rooms | 224 (33.4%) | 1,407 (49.0%) |
| 6 or 7 Rooms | 319 (47.5%) | 170 (5.9%) |
| 8 or more Rooms | 128 (19.1%) | 90 (3.1%) |
| Total | 671 (100.0%) | 2,869 (100.0%) |
Housing Structure by Heating Type in Bladensburg
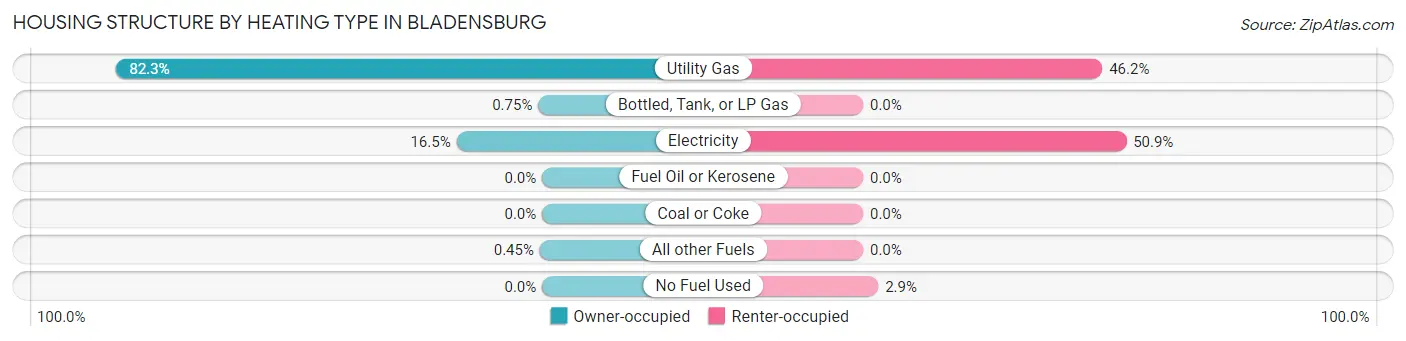
| Heating Type | Owner-occupied | Renter-occupied |
| Utility Gas | 552 (82.3%) | 1,326 (46.2%) |
| Bottled, Tank, or LP Gas | 5 (0.7%) | 0 (0.0%) |
| Electricity | 111 (16.5%) | 1,459 (50.8%) |
| Fuel Oil or Kerosene | 0 (0.0%) | 0 (0.0%) |
| Coal or Coke | 0 (0.0%) | 0 (0.0%) |
| All other Fuels | 3 (0.4%) | 0 (0.0%) |
| No Fuel Used | 0 (0.0%) | 84 (2.9%) |
| Total | 671 (100.0%) | 2,869 (100.0%) |
Household Vehicle Usage in Bladensburg
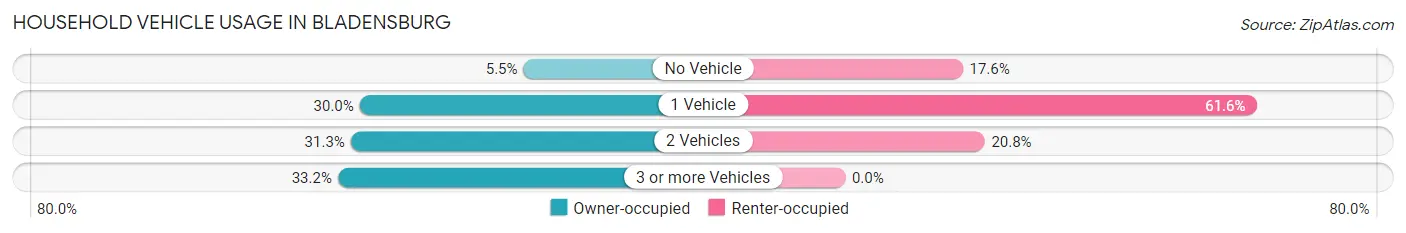
| Vehicles per Household | Owner-occupied | Renter-occupied |
| No Vehicle | 37 (5.5%) | 504 (17.6%) |
| 1 Vehicle | 201 (30.0%) | 1,767 (61.6%) |
| 2 Vehicles | 210 (31.3%) | 598 (20.8%) |
| 3 or more Vehicles | 223 (33.2%) | 0 (0.0%) |
| Total | 671 (100.0%) | 2,869 (100.0%) |
Real Estate & Mortgages in Bladensburg
Real Estate and Mortgage Overview in Bladensburg
| Characteristic | Without Mortgage | With Mortgage |
| Housing Units | 239 | 432 |
| Median Property Value | $345,400 | $319,200 |
| Median Household Income | $84,726 | $31 |
| Monthly Housing Costs | $843 | $0 |
| Real Estate Taxes | $3,489 | $0 |
Property Value by Mortgage Status in Bladensburg
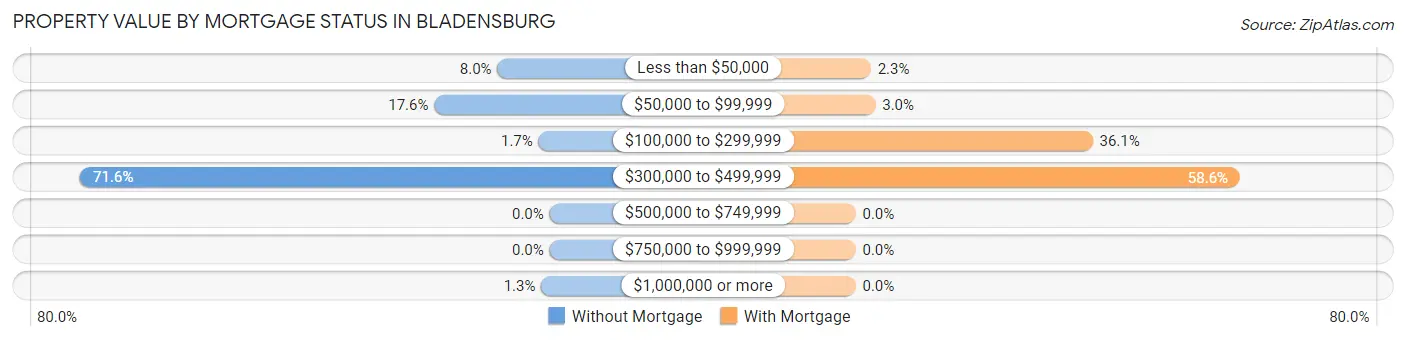
| Property Value | Without Mortgage | With Mortgage |
| Less than $50,000 | 19 (8.0%) | 10 (2.3%) |
| $50,000 to $99,999 | 42 (17.6%) | 13 (3.0%) |
| $100,000 to $299,999 | 4 (1.7%) | 156 (36.1%) |
| $300,000 to $499,999 | 171 (71.6%) | 253 (58.6%) |
| $500,000 to $749,999 | 0 (0.0%) | 0 (0.0%) |
| $750,000 to $999,999 | 0 (0.0%) | 0 (0.0%) |
| $1,000,000 or more | 3 (1.3%) | 0 (0.0%) |
| Total | 239 (100.0%) | 432 (100.0%) |
Household Income by Mortgage Status in Bladensburg
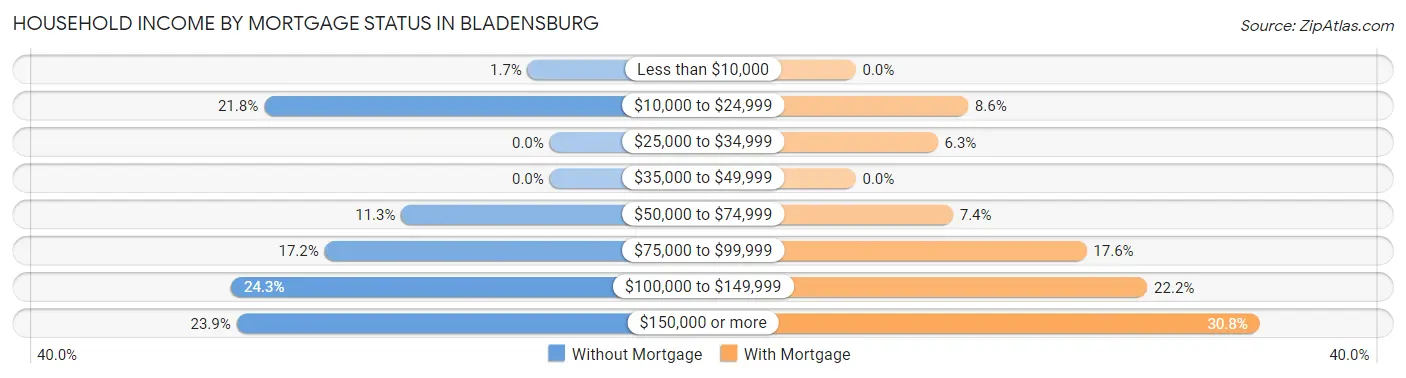
| Household Income | Without Mortgage | With Mortgage |
| Less than $10,000 | 4 (1.7%) | 0 (0.0%) |
| $10,000 to $24,999 | 52 (21.8%) | 37 (8.6%) |
| $25,000 to $34,999 | 0 (0.0%) | 27 (6.2%) |
| $35,000 to $49,999 | 0 (0.0%) | 0 (0.0%) |
| $50,000 to $74,999 | 27 (11.3%) | 32 (7.4%) |
| $75,000 to $99,999 | 41 (17.2%) | 76 (17.6%) |
| $100,000 to $149,999 | 58 (24.3%) | 96 (22.2%) |
| $150,000 or more | 57 (23.8%) | 133 (30.8%) |
| Total | 239 (100.0%) | 432 (100.0%) |
Property Value to Household Income Ratio in Bladensburg
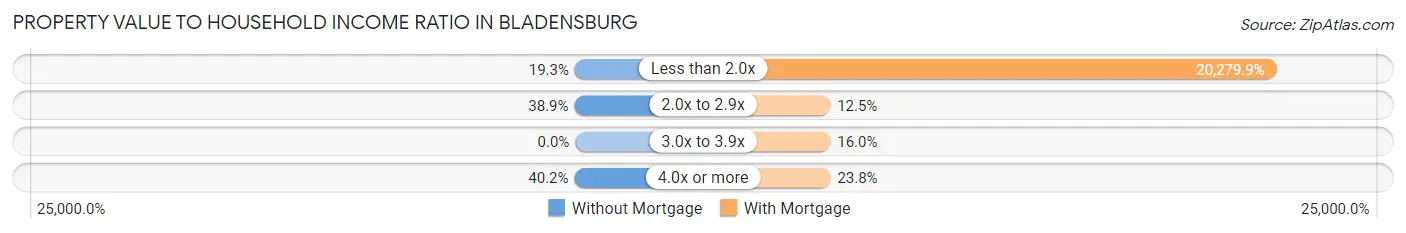
| Value-to-Income Ratio | Without Mortgage | With Mortgage |
| Less than 2.0x | 46 (19.3%) | 87,609 (20,279.9%) |
| 2.0x to 2.9x | 93 (38.9%) | 54 (12.5%) |
| 3.0x to 3.9x | 0 (0.0%) | 69 (16.0%) |
| 4.0x or more | 96 (40.2%) | 103 (23.8%) |
| Total | 239 (100.0%) | 432 (100.0%) |
Real Estate Taxes by Mortgage Status in Bladensburg
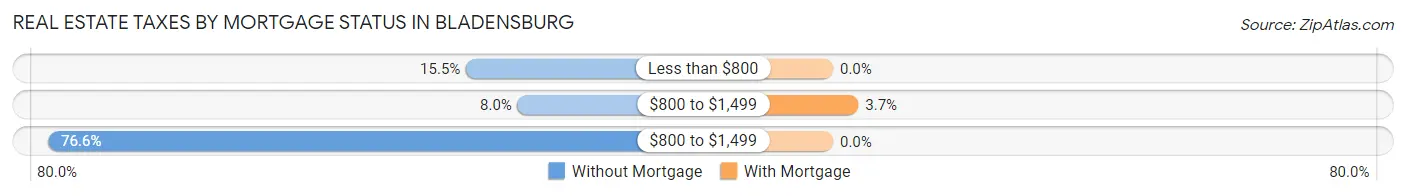
| Property Taxes | Without Mortgage | With Mortgage |
| Less than $800 | 37 (15.5%) | 0 (0.0%) |
| $800 to $1,499 | 19 (8.0%) | 16 (3.7%) |
| $800 to $1,499 | 183 (76.6%) | 0 (0.0%) |
| Total | 239 (100.0%) | 432 (100.0%) |
Health & Disability in Bladensburg
Health Insurance Coverage by Age in Bladensburg
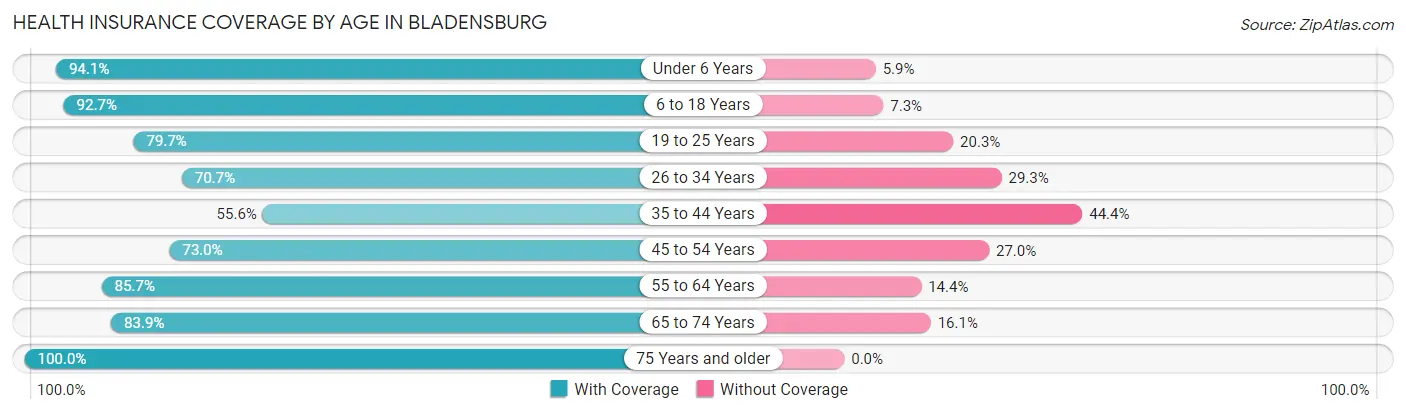
| Age Bracket | With Coverage | Without Coverage |
| Under 6 Years | 884 (94.1%) | 55 (5.9%) |
| 6 to 18 Years | 2,052 (92.7%) | 161 (7.3%) |
| 19 to 25 Years | 632 (79.7%) | 161 (20.3%) |
| 26 to 34 Years | 740 (70.7%) | 307 (29.3%) |
| 35 to 44 Years | 818 (55.6%) | 653 (44.4%) |
| 45 to 54 Years | 825 (73.0%) | 305 (27.0%) |
| 55 to 64 Years | 615 (85.7%) | 103 (14.3%) |
| 65 to 74 Years | 765 (83.9%) | 147 (16.1%) |
| 75 Years and older | 331 (100.0%) | 0 (0.0%) |
| Total | 7,662 (80.2%) | 1,892 (19.8%) |
Health Insurance Coverage by Citizenship Status in Bladensburg
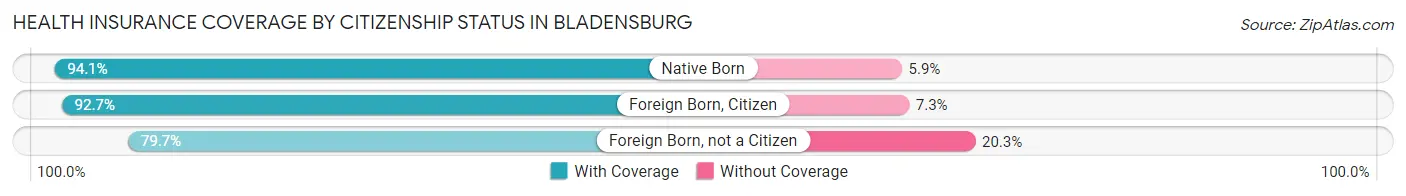
| Citizenship Status | With Coverage | Without Coverage |
| Native Born | 884 (94.1%) | 55 (5.9%) |
| Foreign Born, Citizen | 2,052 (92.7%) | 161 (7.3%) |
| Foreign Born, not a Citizen | 632 (79.7%) | 161 (20.3%) |
Health Insurance Coverage by Household Income in Bladensburg
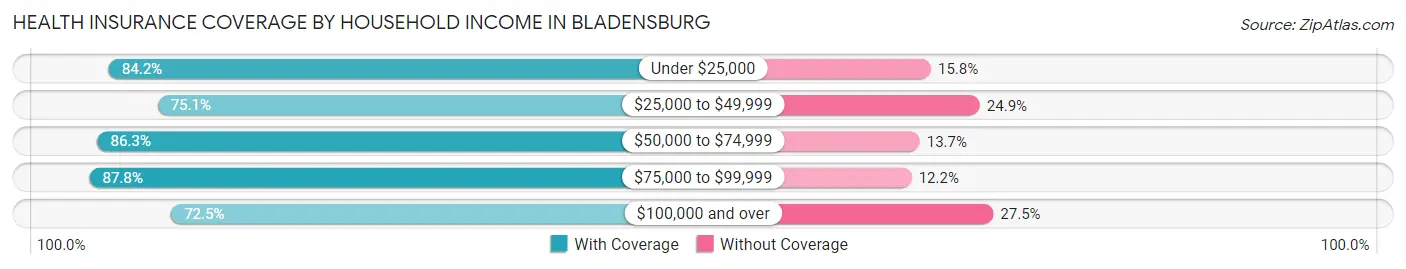
| Household Income | With Coverage | Without Coverage |
| Under $25,000 | 597 (84.2%) | 112 (15.8%) |
| $25,000 to $49,999 | 1,231 (75.1%) | 409 (24.9%) |
| $50,000 to $74,999 | 2,543 (86.3%) | 403 (13.7%) |
| $75,000 to $99,999 | 1,140 (87.8%) | 158 (12.2%) |
| $100,000 and over | 2,139 (72.5%) | 810 (27.5%) |
Public vs Private Health Insurance Coverage by Age in Bladensburg
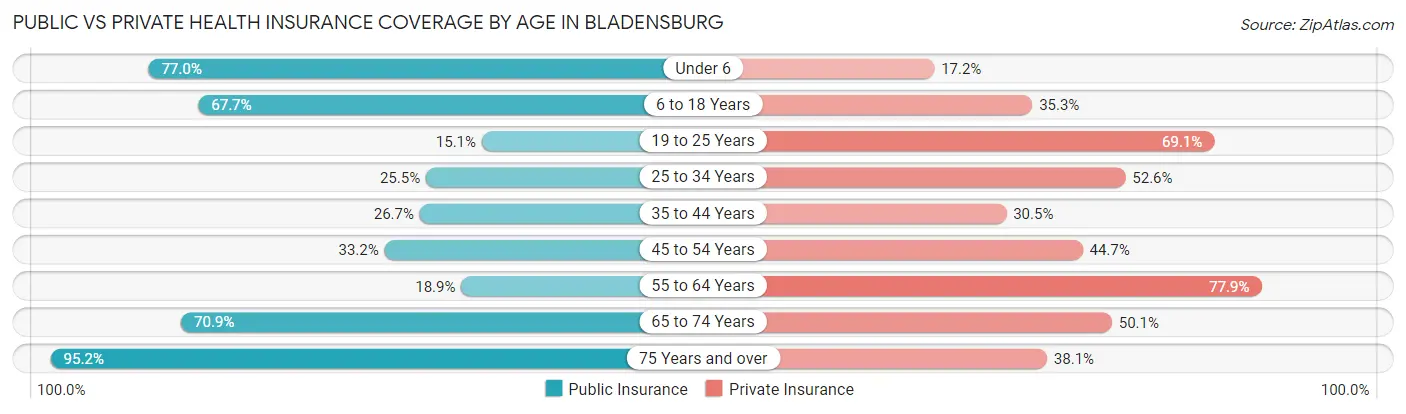
| Age Bracket | Public Insurance | Private Insurance |
| Under 6 | 723 (77.0%) | 161 (17.2%) |
| 6 to 18 Years | 1,499 (67.7%) | 782 (35.3%) |
| 19 to 25 Years | 120 (15.1%) | 548 (69.1%) |
| 25 to 34 Years | 267 (25.5%) | 551 (52.6%) |
| 35 to 44 Years | 392 (26.7%) | 449 (30.5%) |
| 45 to 54 Years | 375 (33.2%) | 505 (44.7%) |
| 55 to 64 Years | 136 (18.9%) | 559 (77.9%) |
| 65 to 74 Years | 647 (70.9%) | 457 (50.1%) |
| 75 Years and over | 315 (95.2%) | 126 (38.1%) |
| Total | 4,474 (46.8%) | 4,138 (43.3%) |
Disability Status by Sex by Age in Bladensburg
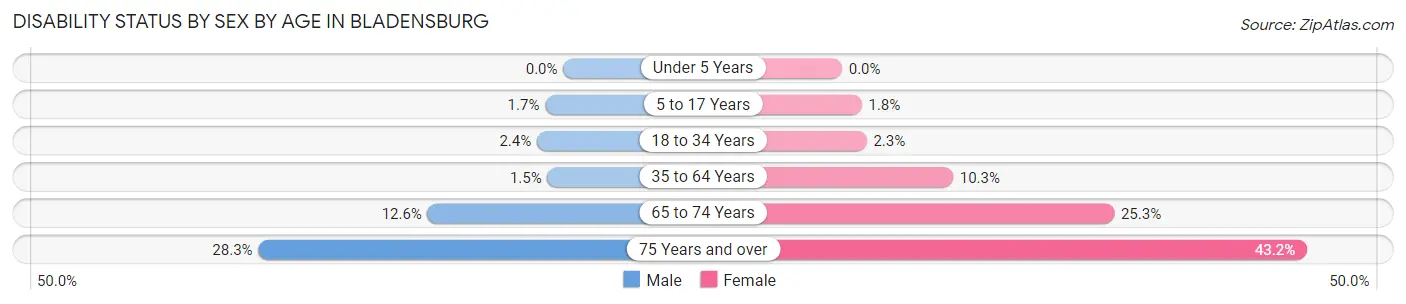
| Age Bracket | Male | Female |
| Under 5 Years | 0 (0.0%) | 0 (0.0%) |
| 5 to 17 Years | 23 (1.7%) | 18 (1.8%) |
| 18 to 34 Years | 16 (2.4%) | 28 (2.3%) |
| 35 to 64 Years | 25 (1.5%) | 167 (10.3%) |
| 65 to 74 Years | 55 (12.6%) | 120 (25.3%) |
| 75 Years and over | 15 (28.3%) | 120 (43.2%) |
Disability Class by Sex by Age in Bladensburg
Disability Class: Hearing Difficulty
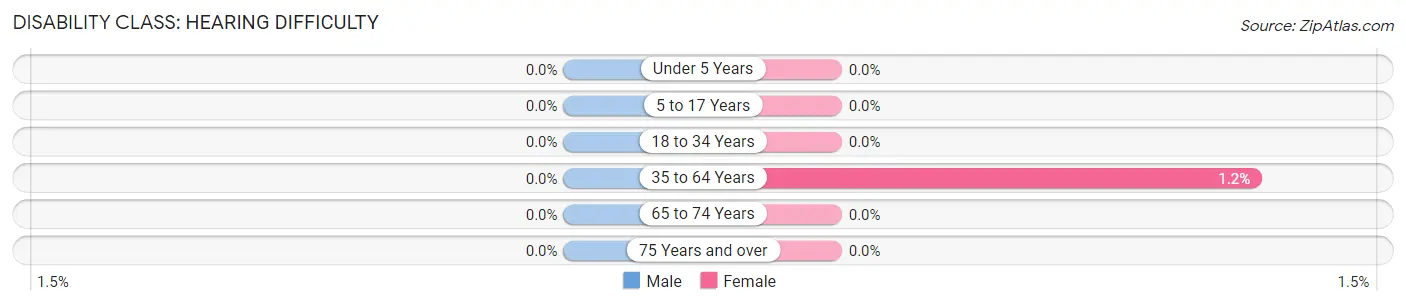
| Age Bracket | Male | Female |
| Under 5 Years | 0 (0.0%) | 0 (0.0%) |
| 5 to 17 Years | 0 (0.0%) | 0 (0.0%) |
| 18 to 34 Years | 0 (0.0%) | 0 (0.0%) |
| 35 to 64 Years | 0 (0.0%) | 19 (1.2%) |
| 65 to 74 Years | 0 (0.0%) | 0 (0.0%) |
| 75 Years and over | 0 (0.0%) | 0 (0.0%) |
Disability Class: Vision Difficulty
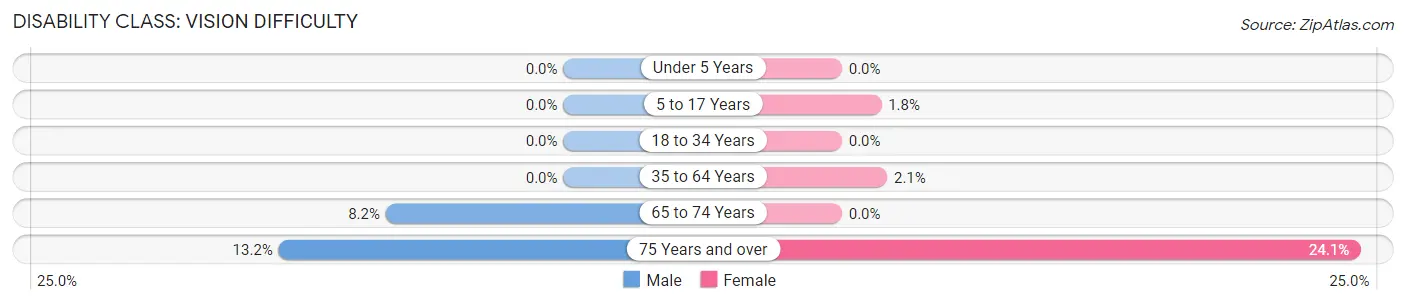
| Age Bracket | Male | Female |
| Under 5 Years | 0 (0.0%) | 0 (0.0%) |
| 5 to 17 Years | 0 (0.0%) | 18 (1.8%) |
| 18 to 34 Years | 0 (0.0%) | 0 (0.0%) |
| 35 to 64 Years | 0 (0.0%) | 34 (2.1%) |
| 65 to 74 Years | 36 (8.2%) | 0 (0.0%) |
| 75 Years and over | 7 (13.2%) | 67 (24.1%) |
Disability Class: Cognitive Difficulty
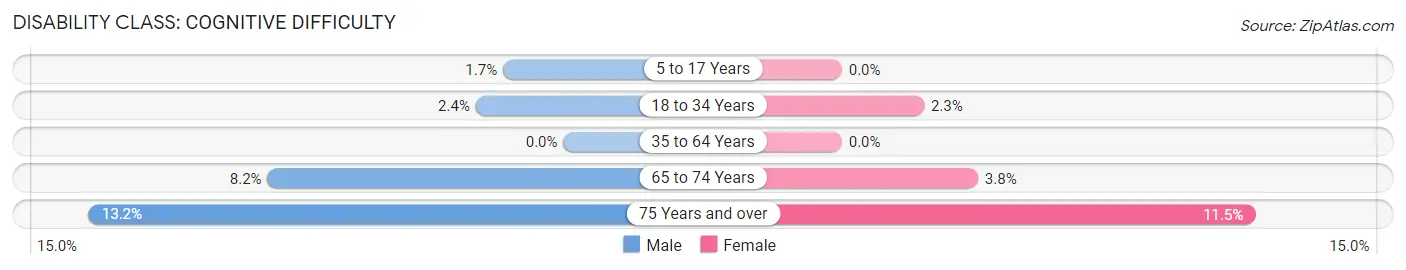
| Age Bracket | Male | Female |
| 5 to 17 Years | 23 (1.7%) | 0 (0.0%) |
| 18 to 34 Years | 16 (2.4%) | 28 (2.3%) |
| 35 to 64 Years | 0 (0.0%) | 0 (0.0%) |
| 65 to 74 Years | 36 (8.2%) | 18 (3.8%) |
| 75 Years and over | 7 (13.2%) | 32 (11.5%) |
Disability Class: Ambulatory Difficulty
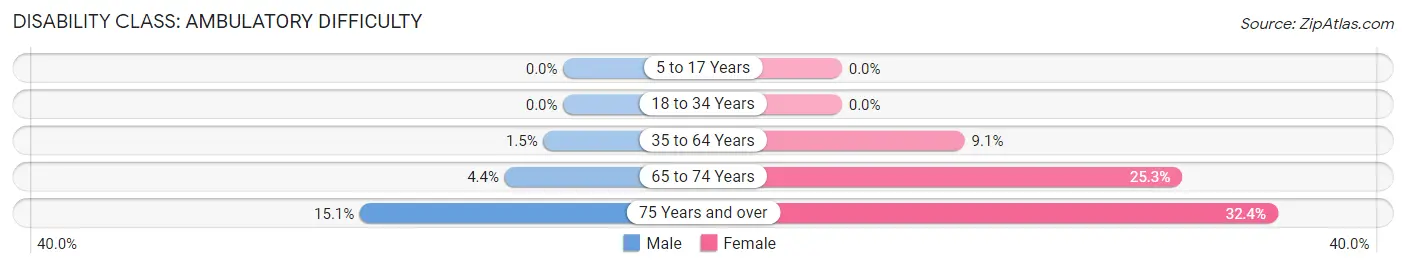
| Age Bracket | Male | Female |
| 5 to 17 Years | 0 (0.0%) | 0 (0.0%) |
| 18 to 34 Years | 0 (0.0%) | 0 (0.0%) |
| 35 to 64 Years | 25 (1.5%) | 148 (9.1%) |
| 65 to 74 Years | 19 (4.3%) | 120 (25.3%) |
| 75 Years and over | 8 (15.1%) | 90 (32.4%) |
Disability Class: Self-Care Difficulty
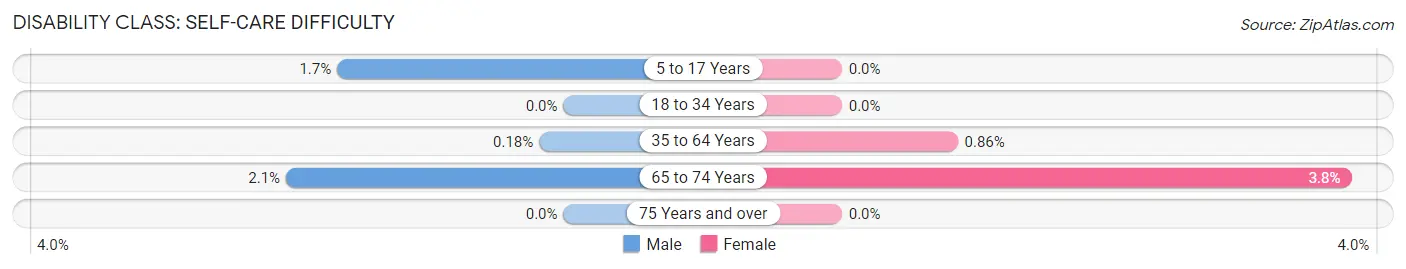
| Age Bracket | Male | Female |
| 5 to 17 Years | 23 (1.7%) | 0 (0.0%) |
| 18 to 34 Years | 0 (0.0%) | 0 (0.0%) |
| 35 to 64 Years | 3 (0.2%) | 14 (0.9%) |
| 65 to 74 Years | 9 (2.1%) | 18 (3.8%) |
| 75 Years and over | 0 (0.0%) | 0 (0.0%) |
Technology Access in Bladensburg
Computing Device Access in Bladensburg
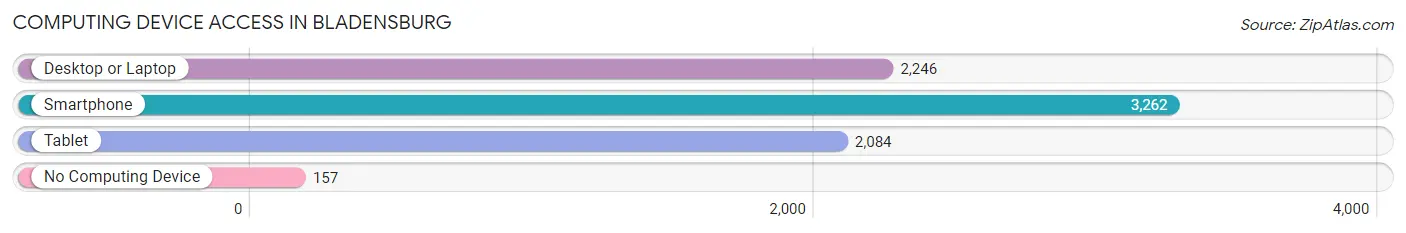
| Device Type | # Households | % Households |
| Desktop or Laptop | 2,246 | 63.4% |
| Smartphone | 3,262 | 92.1% |
| Tablet | 2,084 | 58.9% |
| No Computing Device | 157 | 4.4% |
| Total | 3,540 | 100.0% |
Internet Access in Bladensburg
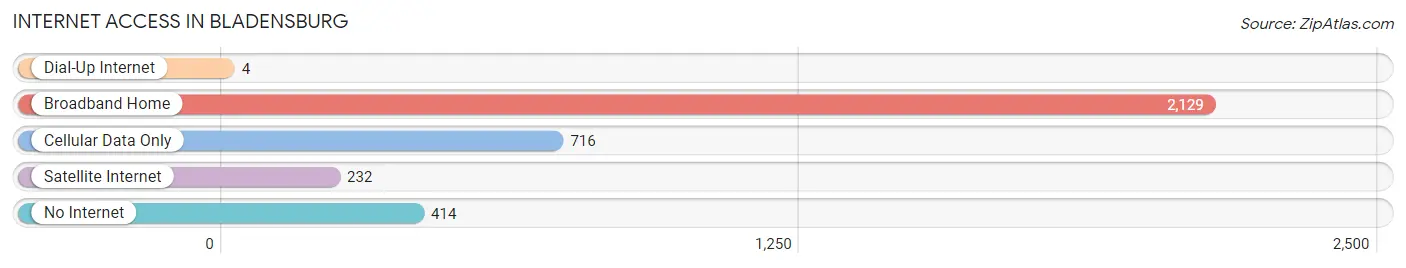
| Internet Type | # Households | % Households |
| Dial-Up Internet | 4 | 0.1% |
| Broadband Home | 2,129 | 60.1% |
| Cellular Data Only | 716 | 20.2% |
| Satellite Internet | 232 | 6.6% |
| No Internet | 414 | 11.7% |
| Total | 3,540 | 100.0% |
Bladensburg Summary
Bladensburg is a town located in Prince George’s County, Maryland, United States. It is situated along the Anacostia River, just east of Washington, D.C. The town is part of the Washington metropolitan area and is located about 8 miles northeast of the downtown area. As of the 2010 census, the population of Bladensburg was 9,148.
History
Bladensburg was founded in 1742 by an act of the Maryland General Assembly. The town was named after Thomas Bladen, the Governor of Maryland from 1742 to 1747. The town was originally a port town, and it was the site of the Battle of Bladensburg during the War of 1812. The town was also the site of the first railroad station in the United States, which opened in 1835.
Geography
Bladensburg is located at 38°56'45"N 76°55'45"W (38.94583, -76.92917). The town has a total area of 2.2 square miles, all of which is land. The town is situated along the Anacostia River, and it is bordered by the towns of Colmar Manor, Cottage City, and Edmonston.
Economy
The economy of Bladensburg is largely based on government and service-related industries. The town is home to several government agencies, including the National Oceanic and Atmospheric Administration (NOAA), the National Institute of Standards and Technology (NIST), and the U.S. Department of Agriculture (USDA). The town is also home to several service-related businesses, including restaurants, retail stores, and medical offices.
Demographics
As of the 2010 census, there were 9,148 people, 3,541 households, and 2,092 families residing in the town. The population density was 4,093.3 people per square mile. The racial makeup of the town was 44.3% White, 37.2% African American, 0.4% Native American, 8.2% Asian, 0.1% Pacific Islander, 5.7% from other races, and 4.1% from two or more races. Hispanic or Latino of any race were 13.2% of the population.
The median income for a household in the town was $50,945, and the median income for a family was $60,945. The per capita income for the town was $25,945. About 11.2% of families and 14.2% of the population were below the poverty line, including 19.2% of those under age 18 and 8.2% of those age 65 or over.
Bladensburg is a diverse and vibrant community with a rich history and a bright future. The town is home to a variety of businesses, government agencies, and service-related industries, and it is a great place to live, work, and play.
Common Questions
What is Per Capita Income in Bladensburg?
Per Capita income in Bladensburg is $26,009.
What is the Median Family Income in Bladensburg?
Median Family Income in Bladensburg is $71,500.
What is the Median Household income in Bladensburg?
Median Household Income in Bladensburg is $58,619.
What is Income or Wage Gap in Bladensburg?
Income or Wage Gap in Bladensburg is 7.8%.
Women in Bladensburg earn 92.2 cents for every dollar earned by a man.
What is Inequality or Gini Index in Bladensburg?
Inequality or Gini Index in Bladensburg is 0.39.
What is the Total Population of Bladensburg?
Total Population of Bladensburg is 9,574.
What is the Total Male Population of Bladensburg?
Total Male Population of Bladensburg is 4,646.
What is the Total Female Population of Bladensburg?
Total Female Population of Bladensburg is 4,928.
What is the Ratio of Males per 100 Females in Bladensburg?
There are 94.28 Males per 100 Females in Bladensburg.
What is the Ratio of Females per 100 Males in Bladensburg?
There are 106.07 Females per 100 Males in Bladensburg.
What is the Median Population Age in Bladensburg?
Median Population Age in Bladensburg is 33.3 Years.
What is the Average Family Size in Bladensburg
Average Family Size in Bladensburg is 3.9 People.
What is the Average Household Size in Bladensburg
Average Household Size in Bladensburg is 2.7 People.
How Large is the Labor Force in Bladensburg?
There are 4,841 People in the Labor Forcein in Bladensburg.
What is the Percentage of People in the Labor Force in Bladensburg?
71.5% of People are in the Labor Force in Bladensburg.
What is the Unemployment Rate in Bladensburg?
Unemployment Rate in Bladensburg is 14.9%.