Northwood, IA Map & Demographics
Northwood Map
Northwood Overview
$30,975
PER CAPITA INCOME
$85,288
AVG FAMILY INCOME
$62,381
AVG HOUSEHOLD INCOME
34.8%
WAGE / INCOME GAP [ % ]
65.2¢/ $1
WAGE / INCOME GAP [ $ ]
0.37
INEQUALITY / GINI INDEX
2,142
TOTAL POPULATION
1,056
MALE POPULATION
1,086
FEMALE POPULATION
97.24
MALES / 100 FEMALES
102.84
FEMALES / 100 MALES
44.4
MEDIAN AGE
2.9
AVG FAMILY SIZE
2.4
AVG HOUSEHOLD SIZE
1,153
LABOR FORCE [ PEOPLE ]
66.9%
PERCENT IN LABOR FORCE
5.6%
UNEMPLOYMENT RATE
Northwood Zip Codes
Northwood Area Codes
Income in Northwood
Income Overview in Northwood
Per Capita Income in Northwood is $30,975, while median incomes of families and households are $85,288 and $62,381 respectively.
| Characteristic | Number | Measure |
| Per Capita Income | 2,142 | $30,975 |
| Median Family Income | 569 | $85,288 |
| Mean Family Income | 569 | $90,290 |
| Median Household Income | 872 | $62,381 |
| Mean Household Income | 872 | $75,248 |
| Income Deficit | 569 | $0 |
| Wage / Income Gap (%) | 2,142 | 34.78% |
| Wage / Income Gap ($) | 2,142 | 65.22¢ per $1 |
| Gini / Inequality Index | 2,142 | 0.37 |
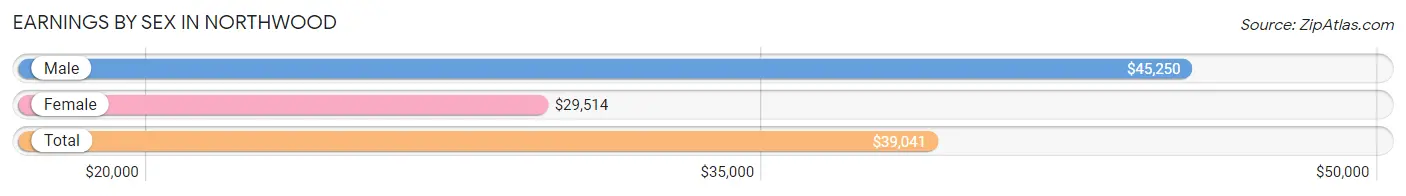
Earnings by Sex in Northwood
Average Earnings in Northwood are $39,041, $45,250 for men and $29,514 for women, a difference of 34.8%.
| Sex | Number | Average Earnings |
| Male | 605 (53.0%) | $45,250 |
| Female | 537 (47.0%) | $29,514 |
| Total | 1,142 (100.0%) | $39,041 |
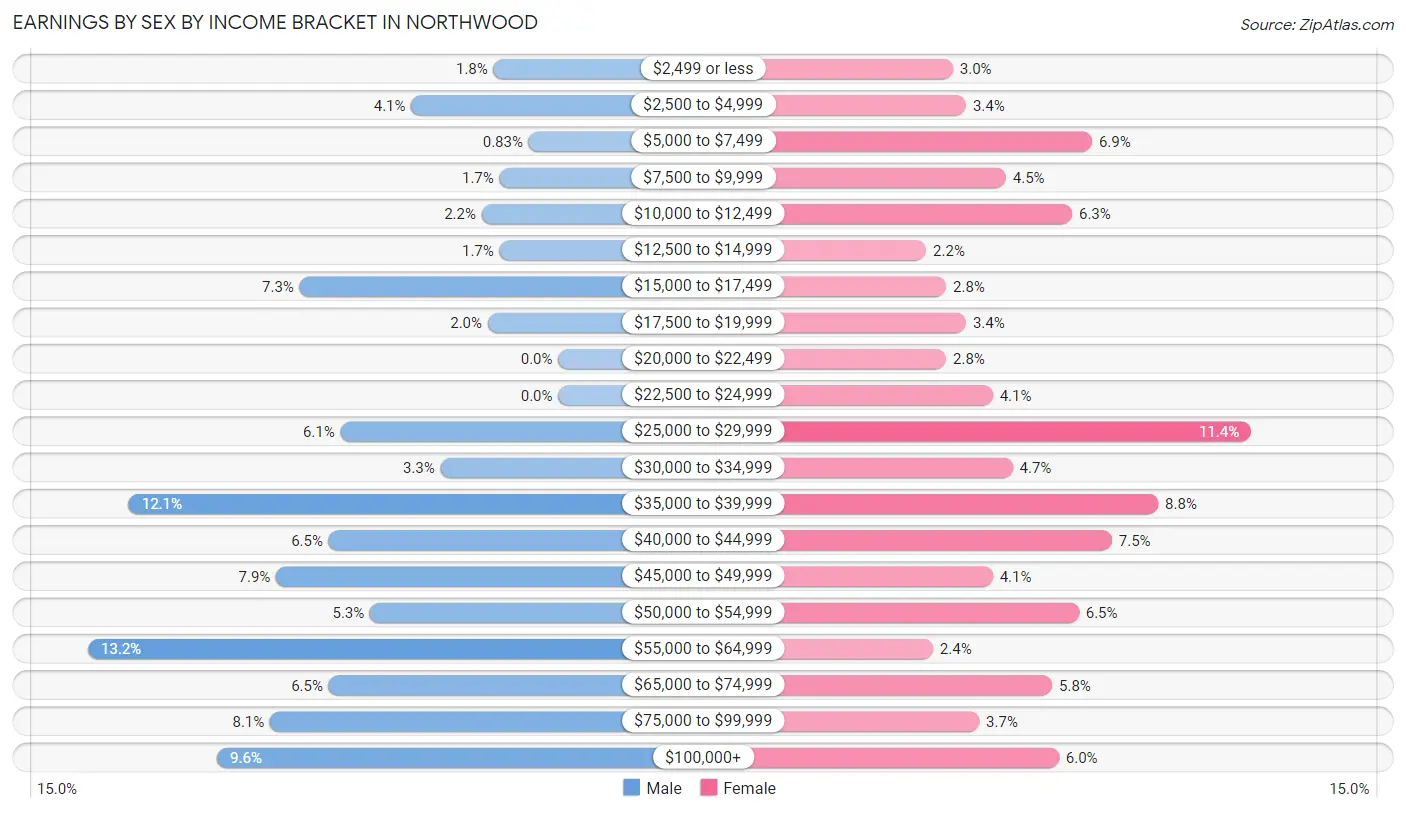
Earnings by Sex by Income Bracket in Northwood
The most common earnings brackets in Northwood are $55,000 to $64,999 for men (80 | 13.2%) and $25,000 to $29,999 for women (61 | 11.4%).
| Income | Male | Female |
| $2,499 or less | 11 (1.8%) | 16 (3.0%) |
| $2,500 to $4,999 | 25 (4.1%) | 18 (3.4%) |
| $5,000 to $7,499 | 5 (0.8%) | 37 (6.9%) |
| $7,500 to $9,999 | 10 (1.7%) | 24 (4.5%) |
| $10,000 to $12,499 | 13 (2.1%) | 34 (6.3%) |
| $12,500 to $14,999 | 10 (1.7%) | 12 (2.2%) |
| $15,000 to $17,499 | 44 (7.3%) | 15 (2.8%) |
| $17,500 to $19,999 | 12 (2.0%) | 18 (3.4%) |
| $20,000 to $22,499 | 0 (0.0%) | 15 (2.8%) |
| $22,500 to $24,999 | 0 (0.0%) | 22 (4.1%) |
| $25,000 to $29,999 | 37 (6.1%) | 61 (11.4%) |
| $30,000 to $34,999 | 20 (3.3%) | 25 (4.7%) |
| $35,000 to $39,999 | 73 (12.1%) | 47 (8.7%) |
| $40,000 to $44,999 | 39 (6.5%) | 40 (7.4%) |
| $45,000 to $49,999 | 48 (7.9%) | 22 (4.1%) |
| $50,000 to $54,999 | 32 (5.3%) | 35 (6.5%) |
| $55,000 to $64,999 | 80 (13.2%) | 13 (2.4%) |
| $65,000 to $74,999 | 39 (6.5%) | 31 (5.8%) |
| $75,000 to $99,999 | 49 (8.1%) | 20 (3.7%) |
| $100,000+ | 58 (9.6%) | 32 (6.0%) |
| Total | 605 (100.0%) | 537 (100.0%) |
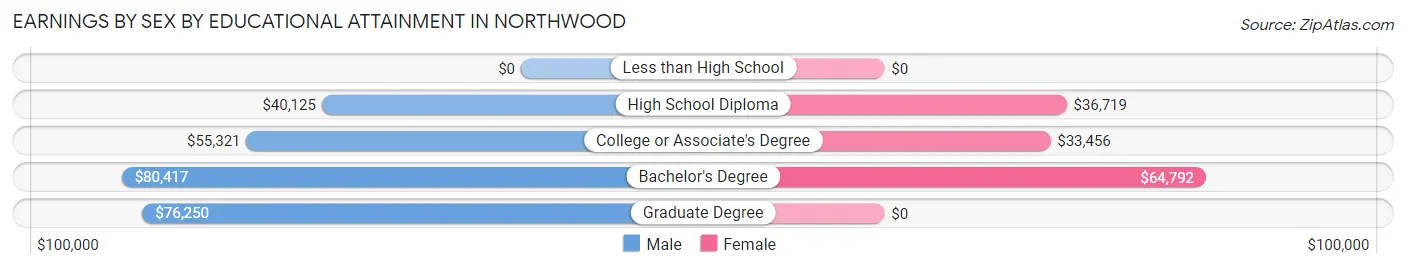
Earnings by Sex by Educational Attainment in Northwood
Average earnings in Northwood are $46,500 for men and $37,702 for women, a difference of 18.9%. Men with an educational attainment of bachelor's degree enjoy the highest average annual earnings of $80,417, while those with high school diploma education earn the least with $40,125. Women with an educational attainment of bachelor's degree earn the most with the average annual earnings of $64,792, while those with college or associate's degree education have the smallest earnings of $33,456.
| Educational Attainment | Male Income | Female Income |
| Less than High School | - | - |
| High School Diploma | $40,125 | $36,719 |
| College or Associate's Degree | $55,321 | $33,456 |
| Bachelor's Degree | $80,417 | $64,792 |
| Graduate Degree | $76,250 | $0 |
| Total | $46,500 | $37,702 |
Family Income in Northwood
Family Income Brackets in Northwood
According to the Northwood family income data, there are 141 families falling into the $100,000 to $149,999 income range, which is the most common income bracket and makes up 24.8% of all families.
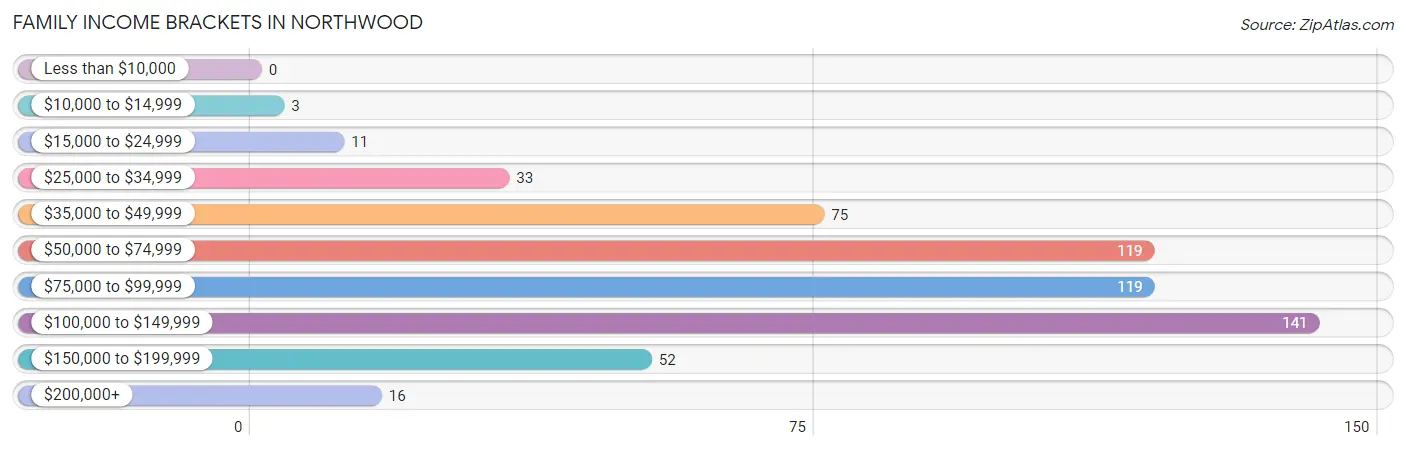
| Income Bracket | # Families | % Families |
| Less than $10,000 | 0 | 0.0% |
| $10,000 to $14,999 | 3 | 0.5% |
| $15,000 to $24,999 | 11 | 1.9% |
| $25,000 to $34,999 | 33 | 5.8% |
| $35,000 to $49,999 | 75 | 13.2% |
| $50,000 to $74,999 | 119 | 20.9% |
| $75,000 to $99,999 | 119 | 20.9% |
| $100,000 to $149,999 | 141 | 24.8% |
| $150,000 to $199,999 | 52 | 9.1% |
| $200,000+ | 16 | 2.8% |
Family Income by Famaliy Size in Northwood
4-person families (83 | 14.6%) account for the highest median family income in Northwood with $132,569 per family, while 2-person families (277 | 48.7%) have the highest median income of $37,312 per family member.
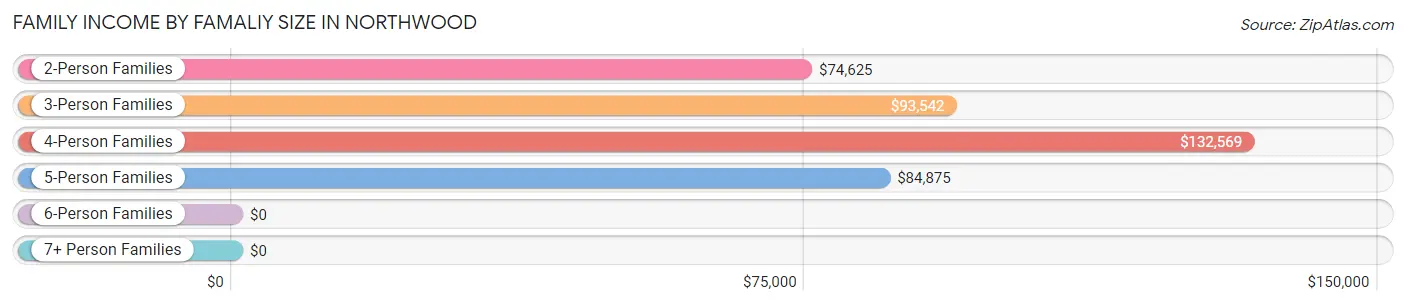
| Income Bracket | # Families | Median Income |
| 2-Person Families | 277 (48.7%) | $74,625 |
| 3-Person Families | 109 (19.2%) | $93,542 |
| 4-Person Families | 83 (14.6%) | $132,569 |
| 5-Person Families | 81 (14.2%) | $84,875 |
| 6-Person Families | 10 (1.8%) | $0 |
| 7+ Person Families | 9 (1.6%) | $0 |
| Total | 569 (100.0%) | $85,288 |
Family Income by Number of Earners in Northwood
The median family income in Northwood is $85,288, with families comprising 3+ earners (85) having the highest median family income of $108,352, while families with no earners (83) have the lowest median family income of $47,386, accounting for 14.9% and 14.6% of families, respectively.
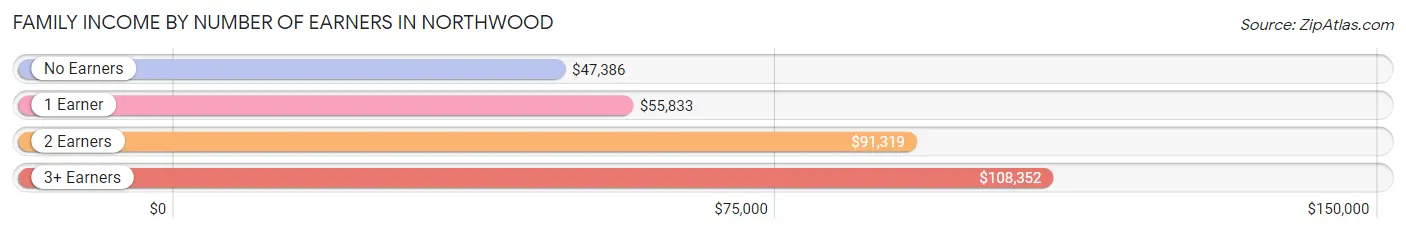
| Number of Earners | # Families | Median Income |
| No Earners | 83 (14.6%) | $47,386 |
| 1 Earner | 118 (20.7%) | $55,833 |
| 2 Earners | 283 (49.7%) | $91,319 |
| 3+ Earners | 85 (14.9%) | $108,352 |
| Total | 569 (100.0%) | $85,288 |
Household Income in Northwood
Household Income Brackets in Northwood
With 166 households falling in the category, the $50,000 to $74,999 income range is the most frequent in Northwood, accounting for 19.0% of all households. In contrast, only 26 households (3.0%) fall into the $10,000 to $14,999 income bracket, making it the least populous group.
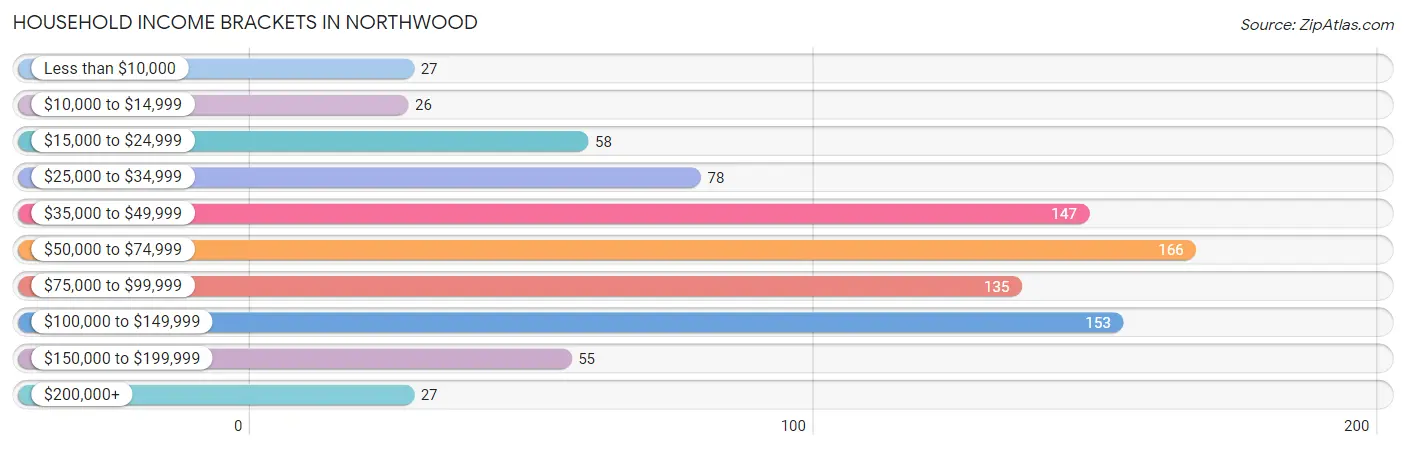
| Income Bracket | # Households | % Households |
| Less than $10,000 | 27 | 3.1% |
| $10,000 to $14,999 | 26 | 3.0% |
| $15,000 to $24,999 | 58 | 6.7% |
| $25,000 to $34,999 | 78 | 8.9% |
| $35,000 to $49,999 | 147 | 16.9% |
| $50,000 to $74,999 | 166 | 19.0% |
| $75,000 to $99,999 | 135 | 15.5% |
| $100,000 to $149,999 | 153 | 17.5% |
| $150,000 to $199,999 | 55 | 6.3% |
| $200,000+ | 27 | 3.1% |
Household Income by Householder Age in Northwood
The median household income in Northwood is $62,381, with the highest median household income of $107,750 found in the 15 to 24 years age bracket for the primary householder. A total of 18 households (2.1%) fall into this category. Meanwhile, the 65+ years age bracket for the primary householder has the lowest median household income of $43,229, with 307 households (35.2%) in this group.
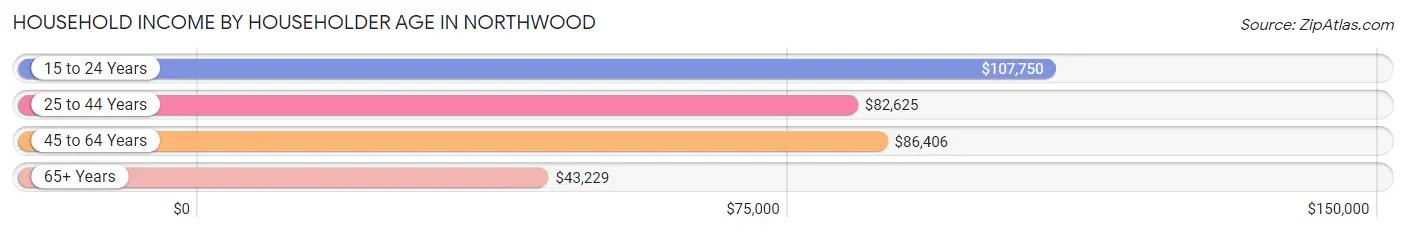
| Income Bracket | # Households | Median Income |
| 15 to 24 Years | 18 (2.1%) | $107,750 |
| 25 to 44 Years | 209 (24.0%) | $82,625 |
| 45 to 64 Years | 338 (38.8%) | $86,406 |
| 65+ Years | 307 (35.2%) | $43,229 |
| Total | 872 (100.0%) | $62,381 |
Poverty in Northwood
Income Below Poverty by Sex and Age in Northwood
With 4.0% poverty level for males and 4.9% for females among the residents of Northwood, 65 to 74 year old males and 25 to 34 year old females are the most vulnerable to poverty, with 11 males (10.7%) and 17 females (18.5%) in their respective age groups living below the poverty level.
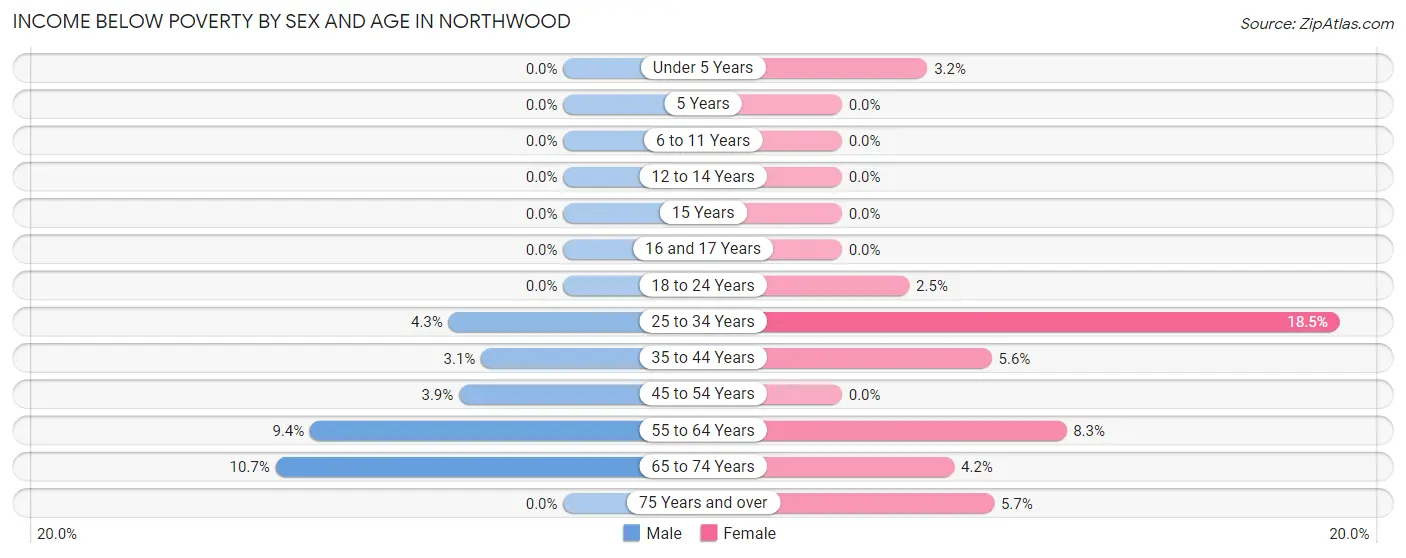
| Age Bracket | Male | Female |
| Under 5 Years | 0 (0.0%) | 2 (3.2%) |
| 5 Years | 0 (0.0%) | 0 (0.0%) |
| 6 to 11 Years | 0 (0.0%) | 0 (0.0%) |
| 12 to 14 Years | 0 (0.0%) | 0 (0.0%) |
| 15 Years | 0 (0.0%) | 0 (0.0%) |
| 16 and 17 Years | 0 (0.0%) | 0 (0.0%) |
| 18 to 24 Years | 0 (0.0%) | 3 (2.5%) |
| 25 to 34 Years | 4 (4.3%) | 17 (18.5%) |
| 35 to 44 Years | 4 (3.0%) | 7 (5.6%) |
| 45 to 54 Years | 7 (3.9%) | 0 (0.0%) |
| 55 to 64 Years | 14 (9.4%) | 10 (8.3%) |
| 65 to 74 Years | 11 (10.7%) | 6 (4.2%) |
| 75 Years and over | 0 (0.0%) | 7 (5.7%) |
| Total | 40 (4.0%) | 52 (4.9%) |
Income Above Poverty by Sex and Age in Northwood
According to the poverty statistics in Northwood, males aged under 5 years and females aged 5 years are the age groups that are most secure financially, with 100.0% of males and 100.0% of females in these age groups living above the poverty line.
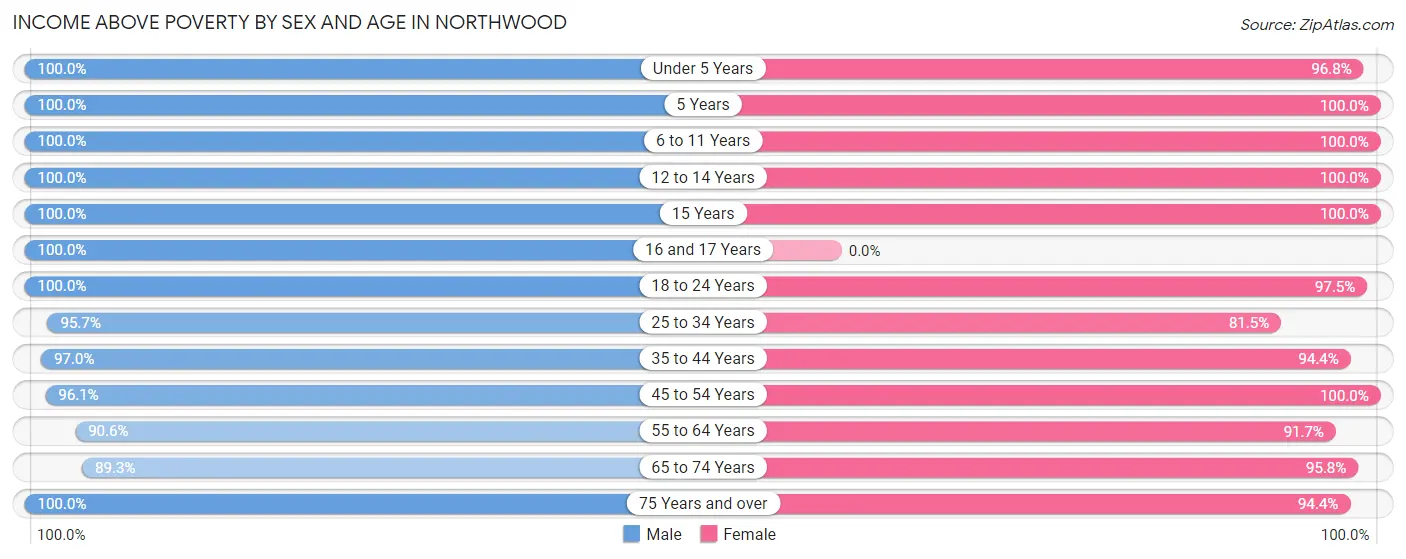
| Age Bracket | Male | Female |
| Under 5 Years | 51 (100.0%) | 61 (96.8%) |
| 5 Years | 22 (100.0%) | 5 (100.0%) |
| 6 to 11 Years | 67 (100.0%) | 43 (100.0%) |
| 12 to 14 Years | 44 (100.0%) | 45 (100.0%) |
| 15 Years | 28 (100.0%) | 28 (100.0%) |
| 16 and 17 Years | 30 (100.0%) | 0 (0.0%) |
| 18 to 24 Years | 63 (100.0%) | 117 (97.5%) |
| 25 to 34 Years | 90 (95.7%) | 75 (81.5%) |
| 35 to 44 Years | 127 (97.0%) | 119 (94.4%) |
| 45 to 54 Years | 174 (96.1%) | 154 (100.0%) |
| 55 to 64 Years | 135 (90.6%) | 110 (91.7%) |
| 65 to 74 Years | 92 (89.3%) | 138 (95.8%) |
| 75 Years and over | 47 (100.0%) | 117 (94.4%) |
| Total | 970 (96.0%) | 1,012 (95.1%) |
Income Below Poverty Among Married-Couple Families in Northwood
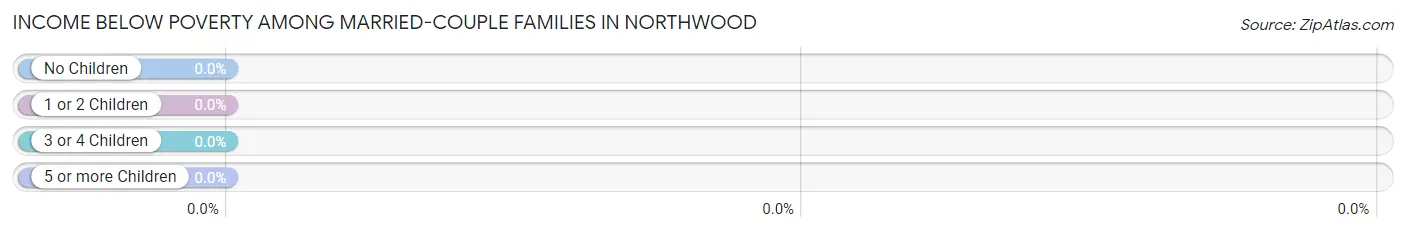
| Children | Above Poverty | Below Poverty |
| No Children | 258 (100.0%) | 0 (0.0%) |
| 1 or 2 Children | 152 (100.0%) | 0 (0.0%) |
| 3 or 4 Children | 41 (100.0%) | 0 (0.0%) |
| 5 or more Children | 9 (100.0%) | 0 (0.0%) |
| Total | 460 (100.0%) | 0 (0.0%) |
Income Below Poverty Among Single-Parent Households in Northwood
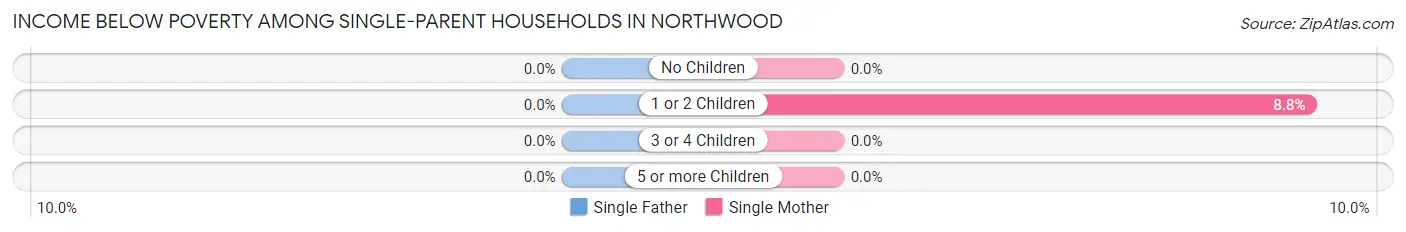
| Children | Single Father | Single Mother |
| No Children | 0 (0.0%) | 0 (0.0%) |
| 1 or 2 Children | 0 (0.0%) | 3 (8.8%) |
| 3 or 4 Children | 0 (0.0%) | 0 (0.0%) |
| 5 or more Children | 0 (0.0%) | 0 (0.0%) |
| Total | 0 (0.0%) | 3 (4.3%) |
Income Below Poverty Among Married-Couple vs Single-Parent Households in Northwood
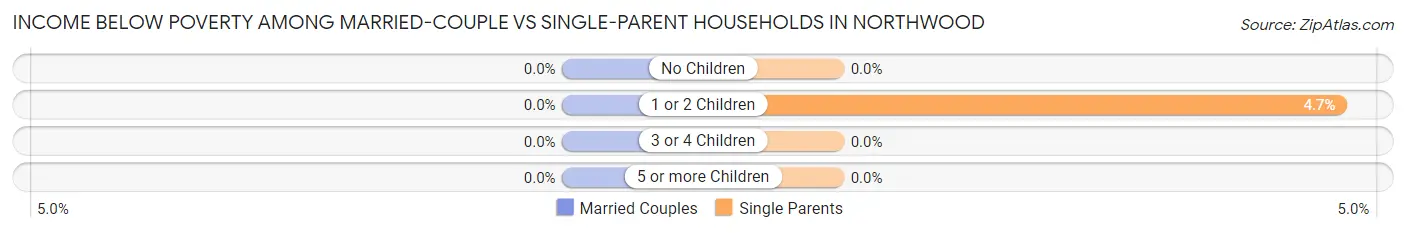
| Children | Married-Couple Families | Single-Parent Households |
| No Children | 0 (0.0%) | 0 (0.0%) |
| 1 or 2 Children | 0 (0.0%) | 3 (4.7%) |
| 3 or 4 Children | 0 (0.0%) | 0 (0.0%) |
| 5 or more Children | 0 (0.0%) | 0 (0.0%) |
| Total | 0 (0.0%) | 3 (2.8%) |
Race in Northwood
The most populous races in Northwood are White / Caucasian (2,054 | 95.9%), Hispanic or Latino (53 | 2.5%), and Two or more Races (44 | 2.1%).
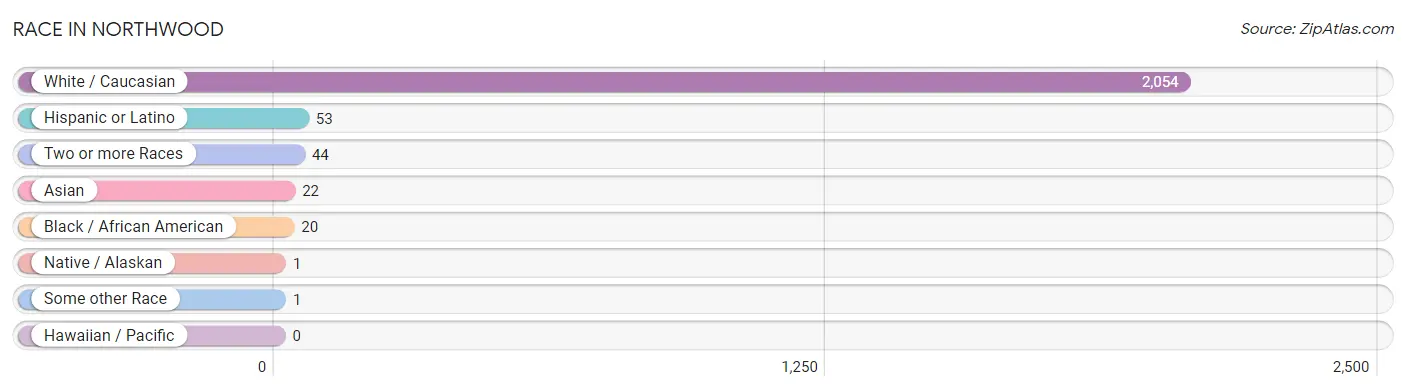
| Race | # Population | % Population |
| Asian | 22 | 1.0% |
| Black / African American | 20 | 0.9% |
| Hawaiian / Pacific | 0 | 0.0% |
| Hispanic or Latino | 53 | 2.5% |
| Native / Alaskan | 1 | 0.1% |
| White / Caucasian | 2,054 | 95.9% |
| Two or more Races | 44 | 2.1% |
| Some other Race | 1 | 0.1% |
| Total | 2,142 | 100.0% |
Ancestry in Northwood
The most populous ancestries reported in Northwood are Norwegian (604 | 28.2%), German (522 | 24.4%), Irish (167 | 7.8%), English (106 | 5.0%), and Danish (70 | 3.3%), together accounting for 68.6% of all Northwood residents.
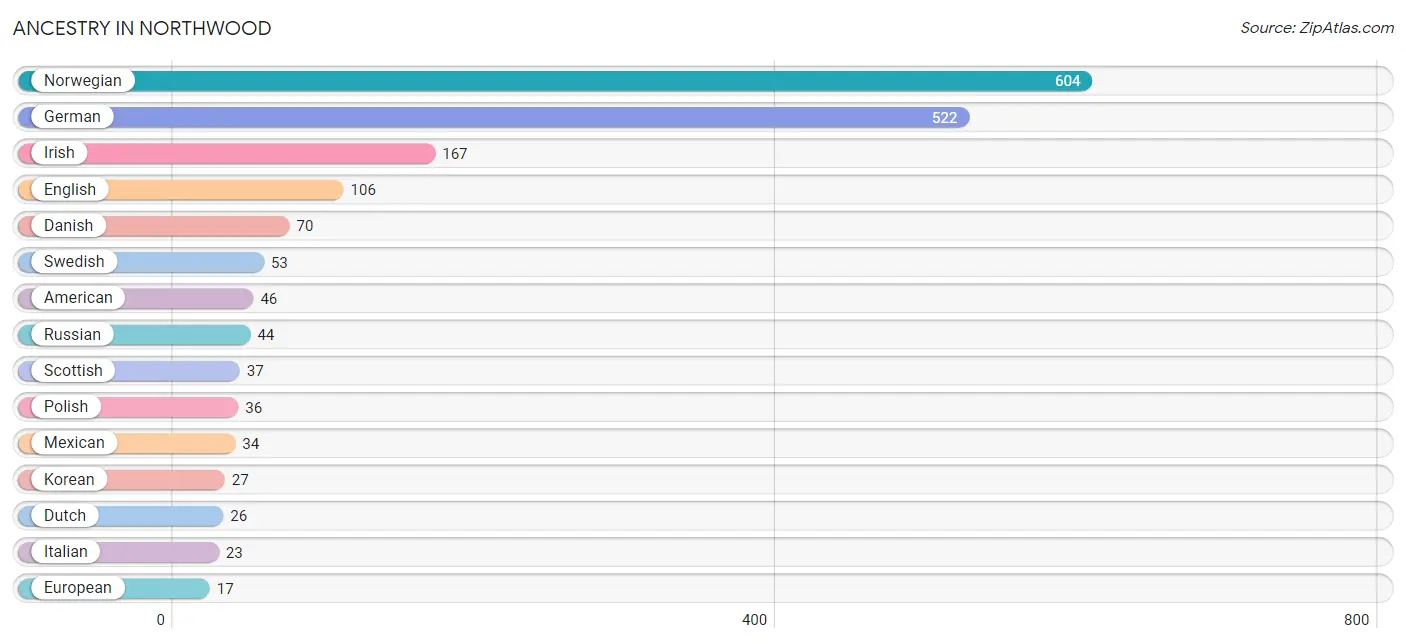
| Ancestry | # Population | % Population |
| American | 46 | 2.1% |
| Austrian | 7 | 0.3% |
| Bhutanese | 4 | 0.2% |
| British | 4 | 0.2% |
| Canadian | 3 | 0.1% |
| Chippewa | 11 | 0.5% |
| Czech | 5 | 0.2% |
| Danish | 70 | 3.3% |
| Dutch | 26 | 1.2% |
| English | 106 | 5.0% |
| European | 17 | 0.8% |
| French | 10 | 0.5% |
| German | 522 | 24.4% |
| Irish | 167 | 7.8% |
| Italian | 23 | 1.1% |
| Korean | 27 | 1.3% |
| Mexican | 34 | 1.6% |
| Northern European | 7 | 0.3% |
| Norwegian | 604 | 28.2% |
| Polish | 36 | 1.7% |
| Puerto Rican | 6 | 0.3% |
| Russian | 44 | 2.1% |
| Scandinavian | 10 | 0.5% |
| Scottish | 37 | 1.7% |
| Spaniard | 13 | 0.6% |
| Swedish | 53 | 2.5% |
| Swiss | 9 | 0.4% |
| Welsh | 7 | 0.3% | View All 28 Rows |
Immigrants in Northwood
The most numerous immigrant groups reported in Northwood came from Asia (16 | 0.7%), Philippines (16 | 0.7%), South Eastern Asia (16 | 0.7%), Africa (4 | 0.2%), and Eastern Africa (4 | 0.2%), together accounting for 2.6% of all Northwood residents.
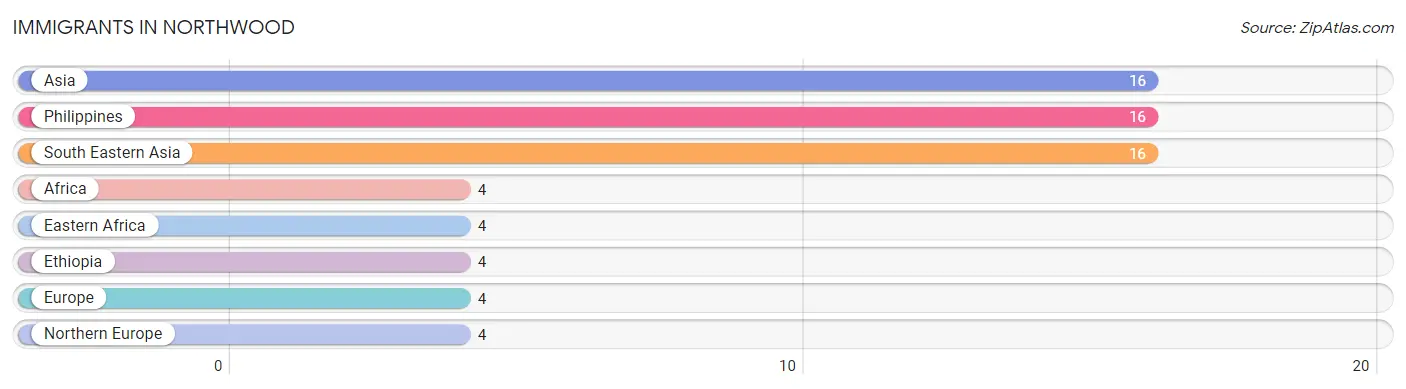
| Immigration Origin | # Population | % Population |
| Africa | 4 | 0.2% |
| Asia | 16 | 0.7% |
| Eastern Africa | 4 | 0.2% |
| Ethiopia | 4 | 0.2% |
| Europe | 4 | 0.2% |
| Northern Europe | 4 | 0.2% |
| Philippines | 16 | 0.7% |
| South Eastern Asia | 16 | 0.7% | View All 8 Rows |
Sex and Age in Northwood
Sex and Age in Northwood
The most populous age groups in Northwood are 55 to 59 Years (98 | 9.3%) for men and 50 to 54 Years (101 | 9.3%) for women.
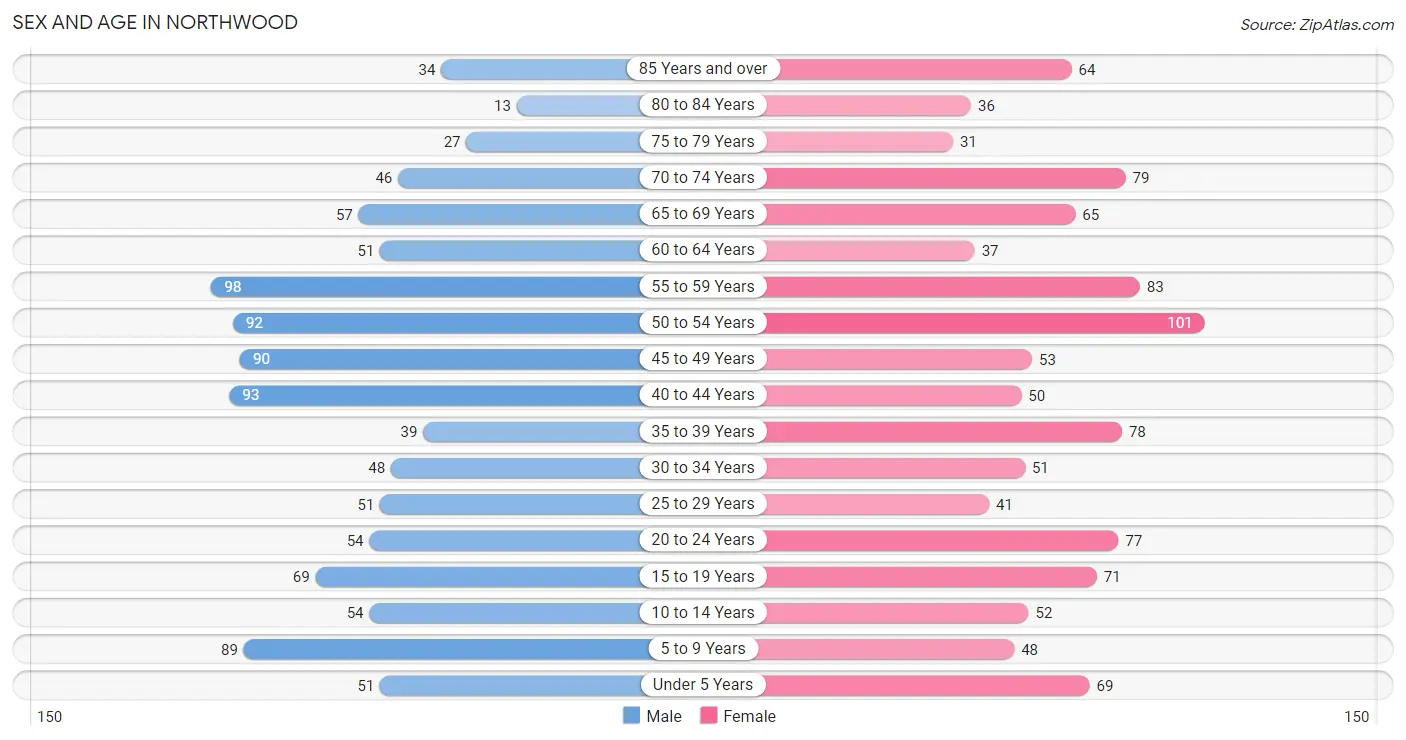
| Age Bracket | Male | Female |
| Under 5 Years | 51 (4.8%) | 69 (6.4%) |
| 5 to 9 Years | 89 (8.4%) | 48 (4.4%) |
| 10 to 14 Years | 54 (5.1%) | 52 (4.8%) |
| 15 to 19 Years | 69 (6.5%) | 71 (6.5%) |
| 20 to 24 Years | 54 (5.1%) | 77 (7.1%) |
| 25 to 29 Years | 51 (4.8%) | 41 (3.8%) |
| 30 to 34 Years | 48 (4.5%) | 51 (4.7%) |
| 35 to 39 Years | 39 (3.7%) | 78 (7.2%) |
| 40 to 44 Years | 93 (8.8%) | 50 (4.6%) |
| 45 to 49 Years | 90 (8.5%) | 53 (4.9%) |
| 50 to 54 Years | 92 (8.7%) | 101 (9.3%) |
| 55 to 59 Years | 98 (9.3%) | 83 (7.6%) |
| 60 to 64 Years | 51 (4.8%) | 37 (3.4%) |
| 65 to 69 Years | 57 (5.4%) | 65 (6.0%) |
| 70 to 74 Years | 46 (4.4%) | 79 (7.3%) |
| 75 to 79 Years | 27 (2.6%) | 31 (2.9%) |
| 80 to 84 Years | 13 (1.2%) | 36 (3.3%) |
| 85 Years and over | 34 (3.2%) | 64 (5.9%) |
| Total | 1,056 (100.0%) | 1,086 (100.0%) |
Families and Households in Northwood
Median Family Size in Northwood
The median family size in Northwood is 2.94 persons per family, with married-couple families (460 | 80.8%) accounting for the largest median family size of 2.99 persons per family. On the other hand, single male/father families (40 | 7.0%) represent the smallest median family size with 2.38 persons per family.
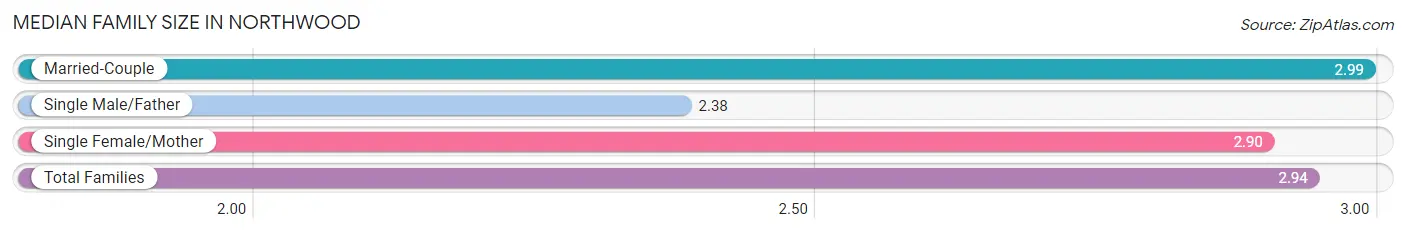
| Family Type | # Families | Family Size |
| Married-Couple | 460 (80.8%) | 2.99 |
| Single Male/Father | 40 (7.0%) | 2.38 |
| Single Female/Mother | 69 (12.1%) | 2.90 |
| Total Families | 569 (100.0%) | 2.94 |
Median Household Size in Northwood
The median household size in Northwood is 2.40 persons per household, with married-couple households (460 | 52.7%) accounting for the largest median household size of 3.01 persons per household. non-family households (303 | 34.7%) represent the smallest median household size with 1.29 persons per household.
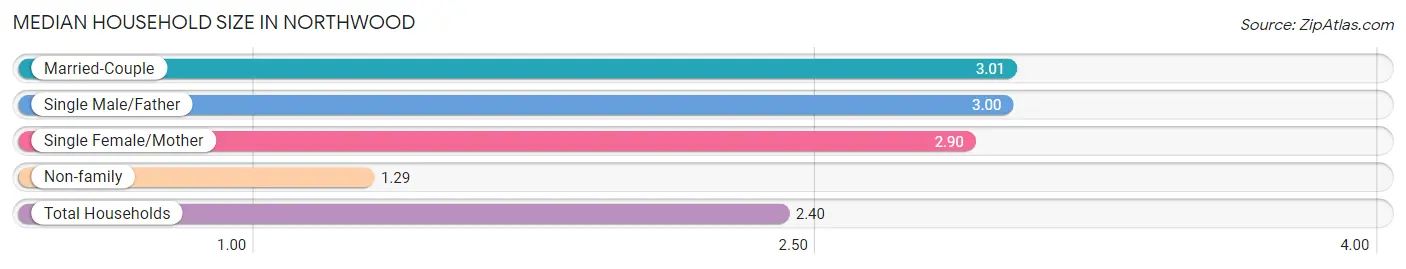
| Household Type | # Households | Household Size |
| Married-Couple | 460 (52.7%) | 3.01 |
| Single Male/Father | 40 (4.6%) | 3.00 |
| Single Female/Mother | 69 (7.9%) | 2.90 |
| Non-family | 303 (34.7%) | 1.29 |
| Total Households | 872 (100.0%) | 2.40 |
Household Size by Marriage Status in Northwood
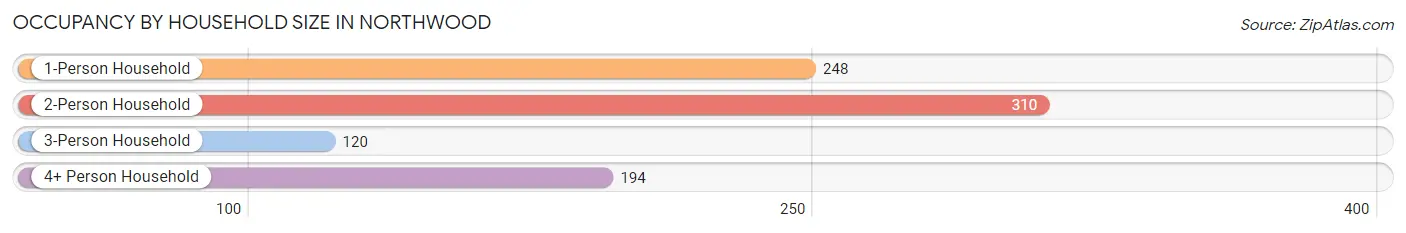
Out of a total of 872 households in Northwood, 569 (65.2%) are family households, while 303 (34.7%) are nonfamily households. The most numerous type of family households are 2-person households, comprising 273, and the most common type of nonfamily households are 1-person households, comprising 248.
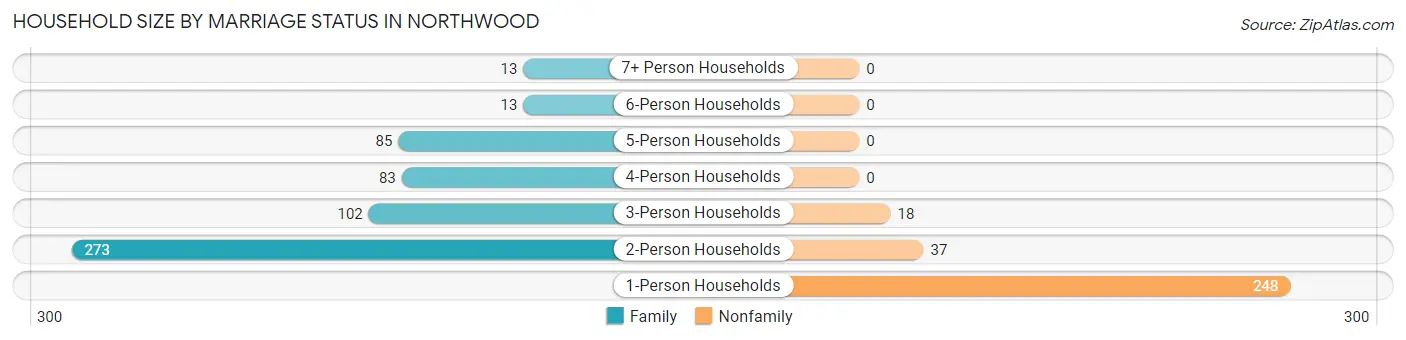
| Household Size | Family Households | Nonfamily Households |
| 1-Person Households | - | 248 (28.4%) |
| 2-Person Households | 273 (31.3%) | 37 (4.2%) |
| 3-Person Households | 102 (11.7%) | 18 (2.1%) |
| 4-Person Households | 83 (9.5%) | 0 (0.0%) |
| 5-Person Households | 85 (9.8%) | 0 (0.0%) |
| 6-Person Households | 13 (1.5%) | 0 (0.0%) |
| 7+ Person Households | 13 (1.5%) | 0 (0.0%) |
| Total | 569 (65.2%) | 303 (34.7%) |
Female Fertility in Northwood
Fertility by Age in Northwood
Average fertility rate in Northwood is 124.0 births per 1,000 women. Women in the age bracket of 20 to 34 years have the highest fertility rate with 249.0 births per 1,000 women. Women in the age bracket of 20 to 34 years acount for 75.0% of all women with births.
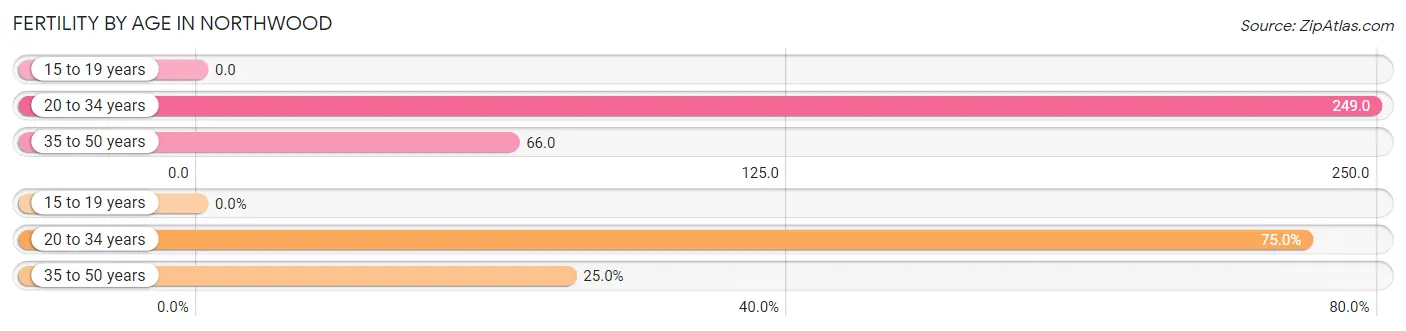
| Age Bracket | Women with Births | Births / 1,000 Women |
| 15 to 19 years | 0 (0.0%) | 0.0 |
| 20 to 34 years | 42 (75.0%) | 249.0 |
| 35 to 50 years | 14 (25.0%) | 66.0 |
| Total | 56 (100.0%) | 124.0 |
Fertility by Age by Marriage Status in Northwood
73.2% of women with births (56) in Northwood are married. The highest percentage of unmarried women with births falls into 35 to 50 years age bracket with 71.4% of them unmarried at the time of birth, while the lowest percentage of unmarried women with births belong to 20 to 34 years age bracket with 11.9% of them unmarried.
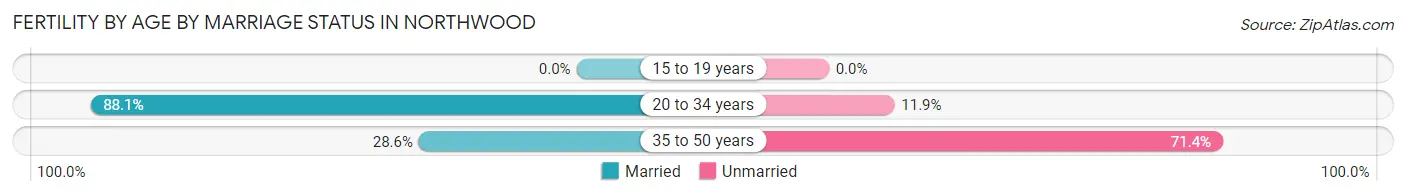
| Age Bracket | Married | Unmarried |
| 15 to 19 years | 0 (0.0%) | 0 (0.0%) |
| 20 to 34 years | 37 (88.1%) | 5 (11.9%) |
| 35 to 50 years | 4 (28.6%) | 10 (71.4%) |
| Total | 41 (73.2%) | 15 (26.8%) |
Fertility by Education in Northwood
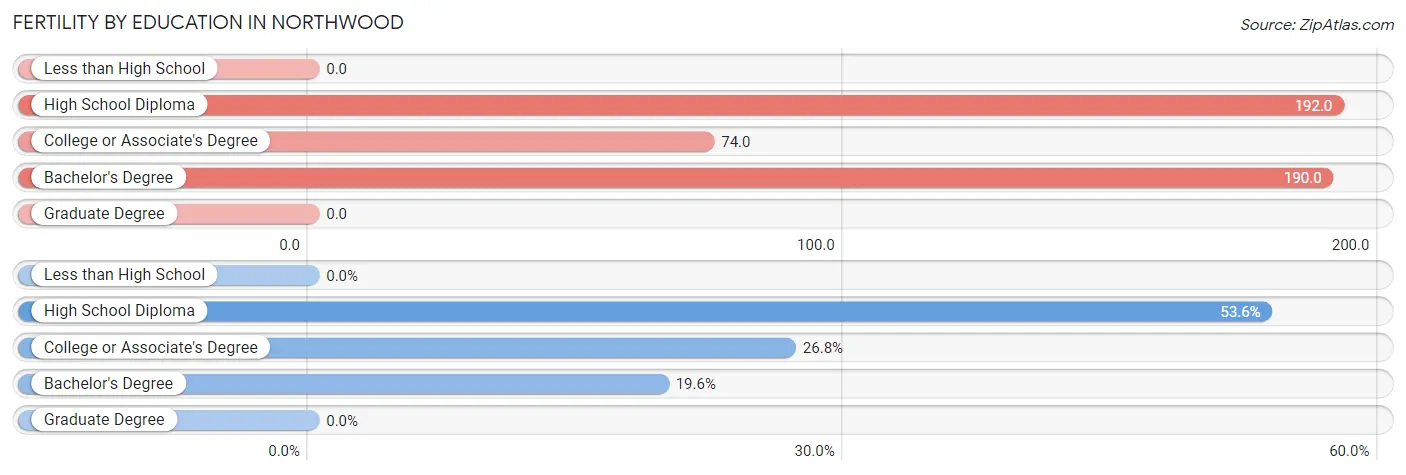
| Educational Attainment | Women with Births | Births / 1,000 Women |
| Less than High School | 0 (0.0%) | 0.0 |
| High School Diploma | 30 (53.6%) | 192.0 |
| College or Associate's Degree | 15 (26.8%) | 74.0 |
| Bachelor's Degree | 11 (19.6%) | 190.0 |
| Graduate Degree | 0 (0.0%) | 0.0 |
| Total | 56 (100.0%) | 124.0 |
Fertility by Education by Marriage Status in Northwood
26.8% of women with births in Northwood are unmarried. Women with the educational attainment of bachelor's degree are most likely to be married with 100.0% of them married at childbirth, while women with the educational attainment of high school diploma are least likely to be married with 33.3% of them unmarried at childbirth.
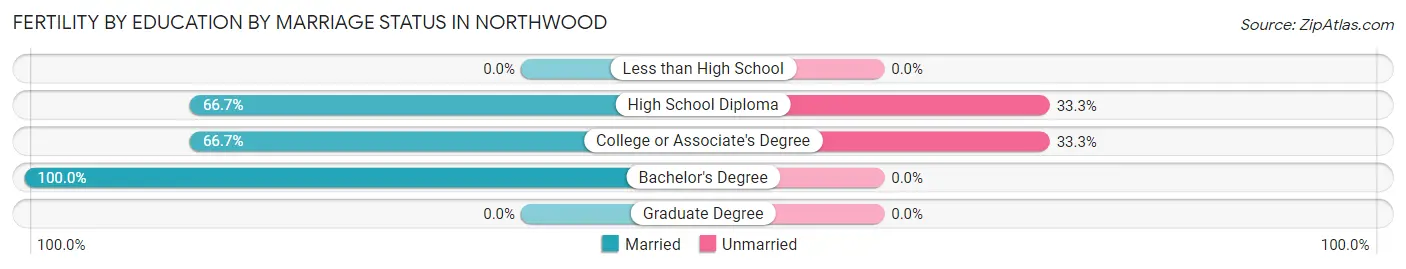
| Educational Attainment | Married | Unmarried |
| Less than High School | 0 (0.0%) | 0 (0.0%) |
| High School Diploma | 20 (66.7%) | 10 (33.3%) |
| College or Associate's Degree | 10 (66.7%) | 5 (33.3%) |
| Bachelor's Degree | 11 (100.0%) | 0 (0.0%) |
| Graduate Degree | 0 (0.0%) | 0 (0.0%) |
| Total | 41 (73.2%) | 15 (26.8%) |
Employment Characteristics in Northwood
Employment by Class of Employer in Northwood
Among the 1,061 employed individuals in Northwood, private company employees (683 | 64.4%), not-for-profit organizations (126 | 11.9%), and local government employees (87 | 8.2%) make up the most common classes of employment.
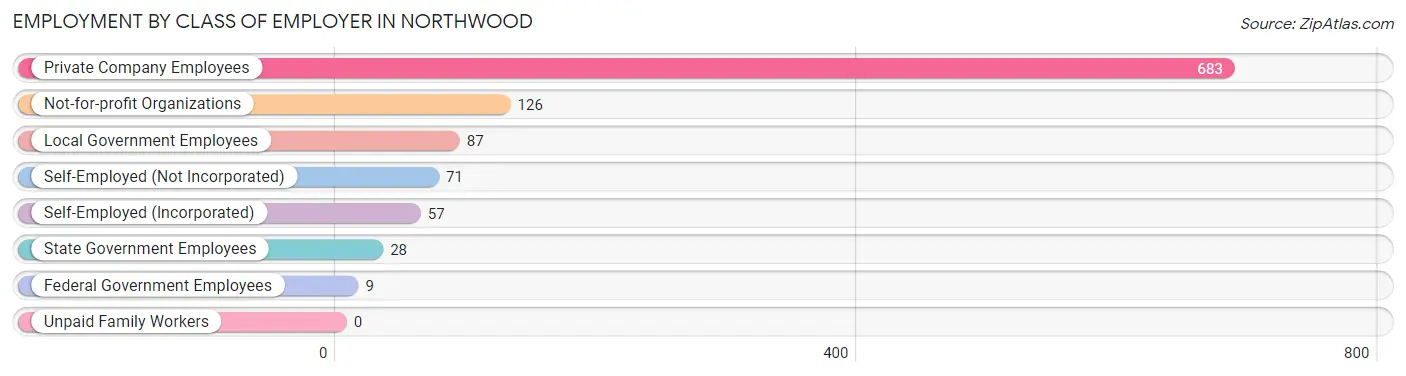
| Employer Class | # Employees | % Employees |
| Private Company Employees | 683 | 64.4% |
| Self-Employed (Incorporated) | 57 | 5.4% |
| Self-Employed (Not Incorporated) | 71 | 6.7% |
| Not-for-profit Organizations | 126 | 11.9% |
| Local Government Employees | 87 | 8.2% |
| State Government Employees | 28 | 2.6% |
| Federal Government Employees | 9 | 0.9% |
| Unpaid Family Workers | 0 | 0.0% |
| Total | 1,061 | 100.0% |
Employment Status by Age in Northwood
According to the labor force statistics for Northwood, out of the total population over 16 years of age (1,723), 66.9% or 1,153 individuals are in the labor force, with 5.6% or 65 of them unemployed. The age group with the highest labor force participation rate is 20 to 24 years, with 93.1% or 122 individuals in the labor force. Within the labor force, the 30 to 34 years age range has the highest percentage of unemployed individuals, with 20.5% or 17 of them being unemployed.
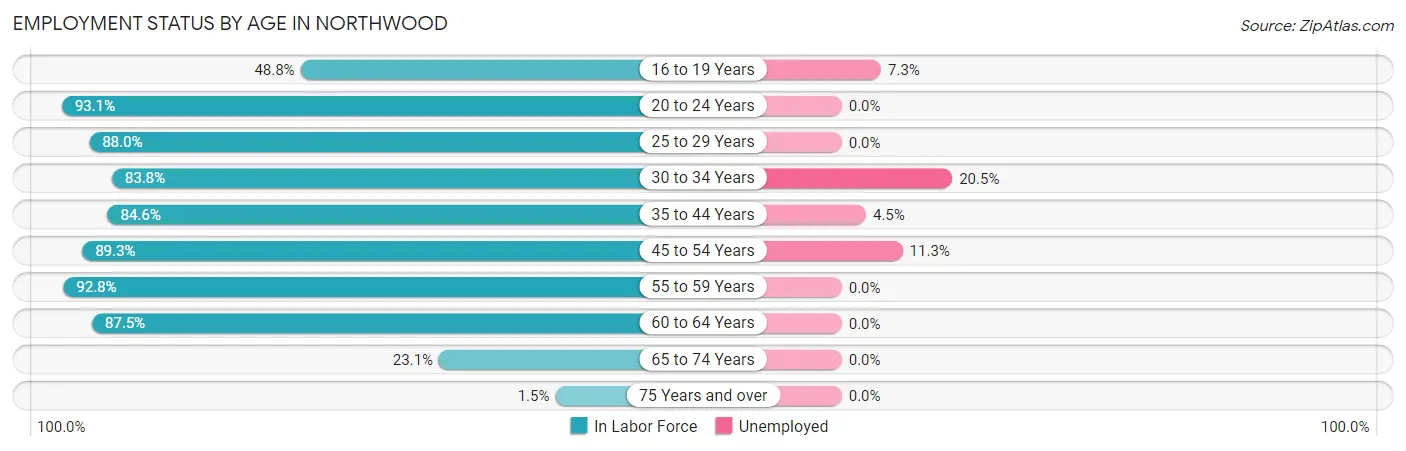
| Age Bracket | In Labor Force | Unemployed |
| 16 to 19 Years | 41 (48.8%) | 3 (7.3%) |
| 20 to 24 Years | 122 (93.1%) | 0 (0.0%) |
| 25 to 29 Years | 81 (88.0%) | 0 (0.0%) |
| 30 to 34 Years | 83 (83.8%) | 17 (20.5%) |
| 35 to 44 Years | 220 (84.6%) | 10 (4.5%) |
| 45 to 54 Years | 300 (89.3%) | 34 (11.3%) |
| 55 to 59 Years | 168 (92.8%) | 0 (0.0%) |
| 60 to 64 Years | 77 (87.5%) | 0 (0.0%) |
| 65 to 74 Years | 57 (23.1%) | 0 (0.0%) |
| 75 Years and over | 3 (1.5%) | 0 (0.0%) |
| Total | 1,153 (66.9%) | 65 (5.6%) |
Employment Status by Educational Attainment in Northwood
According to labor force statistics for Northwood, 88.0% of individuals (929) out of the total population between 25 and 64 years of age (1,056) are in the labor force, with 6.6% or 61 of them being unemployed. The group with the highest labor force participation rate are those with the educational attainment of bachelor's degree or higher, with 94.5% or 154 individuals in the labor force. Within the labor force, individuals with high school diploma education have the highest percentage of unemployment, with 9.0% or 39 of them being unemployed.
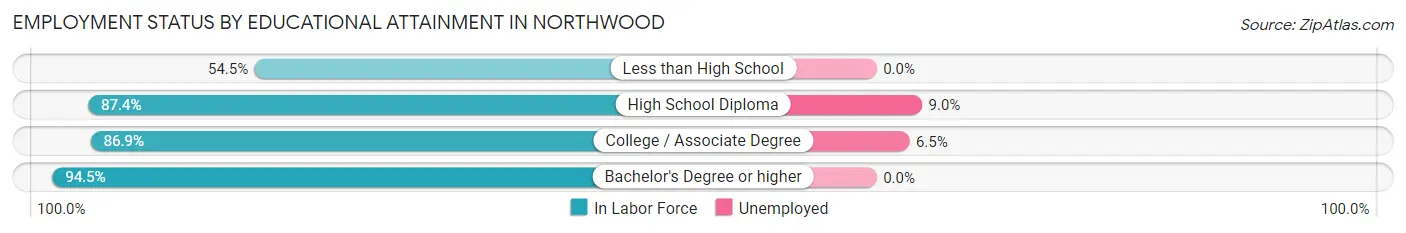
| Educational Attainment | In Labor Force | Unemployed |
| Less than High School | 6 (54.5%) | 0 (0.0%) |
| High School Diploma | 431 (87.4%) | 44 (9.0%) |
| College / Associate Degree | 338 (86.9%) | 25 (6.5%) |
| Bachelor's Degree or higher | 154 (94.5%) | 0 (0.0%) |
| Total | 929 (88.0%) | 70 (6.6%) |
Employment Occupations by Sex in Northwood
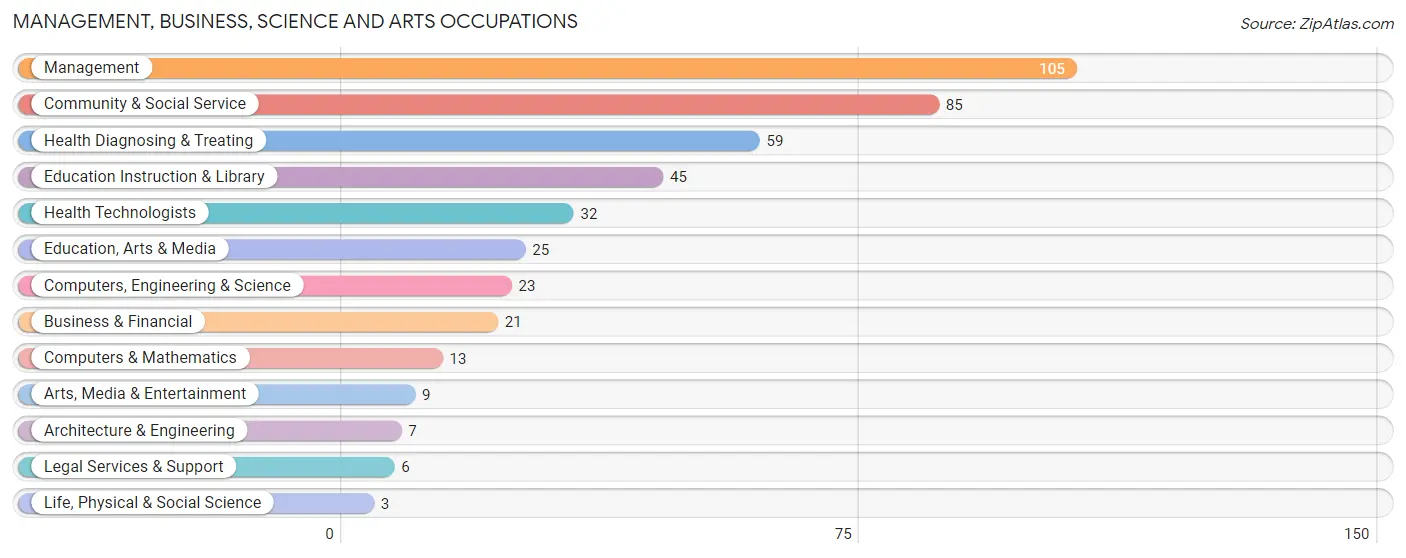
Management, Business, Science and Arts Occupations
The most common Management, Business, Science and Arts occupations in Northwood are Management (105 | 9.7%), Community & Social Service (85 | 7.8%), Health Diagnosing & Treating (59 | 5.4%), Education Instruction & Library (45 | 4.1%), and Health Technologists (32 | 2.9%).
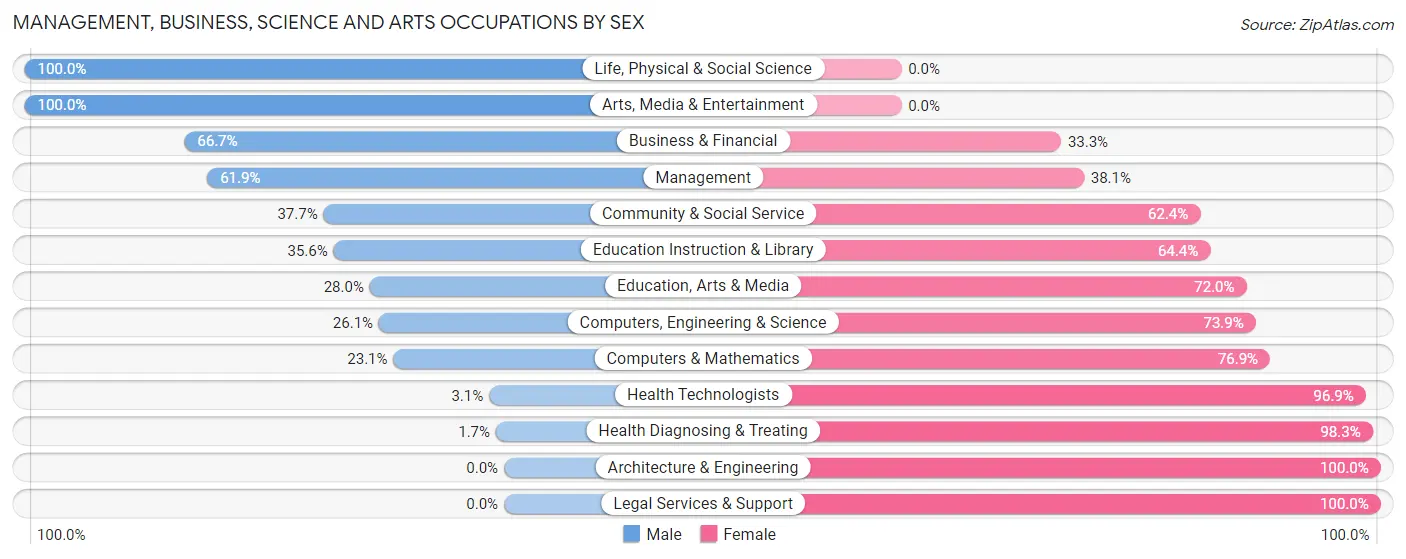
Management, Business, Science and Arts Occupations by Sex
Within the Management, Business, Science and Arts occupations in Northwood, the most male-oriented occupations are Life, Physical & Social Science (100.0%), Arts, Media & Entertainment (100.0%), and Business & Financial (66.7%), while the most female-oriented occupations are Architecture & Engineering (100.0%), Legal Services & Support (100.0%), and Health Diagnosing & Treating (98.3%).
| Occupation | Male | Female |
| Management | 65 (61.9%) | 40 (38.1%) |
| Business & Financial | 14 (66.7%) | 7 (33.3%) |
| Computers, Engineering & Science | 6 (26.1%) | 17 (73.9%) |
| Computers & Mathematics | 3 (23.1%) | 10 (76.9%) |
| Architecture & Engineering | 0 (0.0%) | 7 (100.0%) |
| Life, Physical & Social Science | 3 (100.0%) | 0 (0.0%) |
| Community & Social Service | 32 (37.7%) | 53 (62.4%) |
| Education, Arts & Media | 7 (28.0%) | 18 (72.0%) |
| Legal Services & Support | 0 (0.0%) | 6 (100.0%) |
| Education Instruction & Library | 16 (35.6%) | 29 (64.4%) |
| Arts, Media & Entertainment | 9 (100.0%) | 0 (0.0%) |
| Health Diagnosing & Treating | 1 (1.7%) | 58 (98.3%) |
| Health Technologists | 1 (3.1%) | 31 (96.9%) |
| Total (Category) | 118 (40.3%) | 175 (59.7%) |
| Total (Overall) | 581 (53.4%) | 507 (46.6%) |
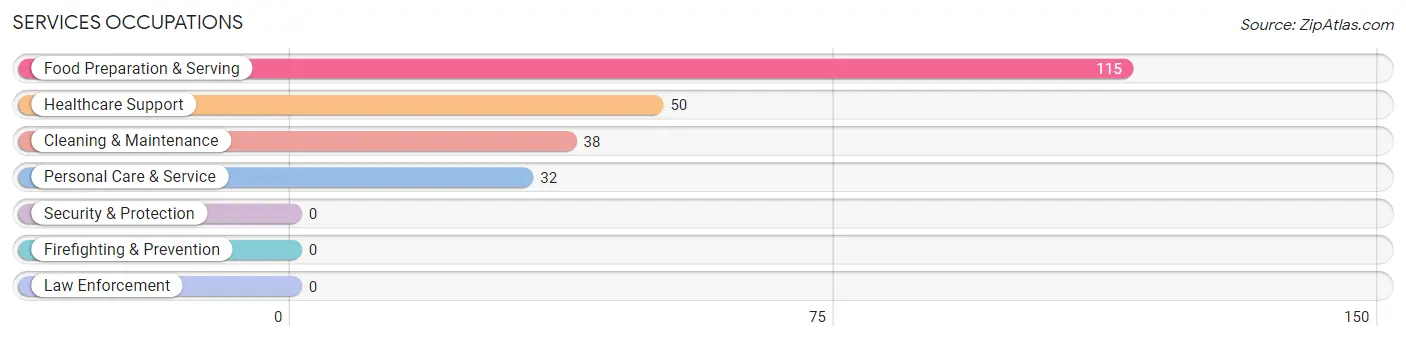
Services Occupations
The most common Services occupations in Northwood are Food Preparation & Serving (115 | 10.6%), Healthcare Support (50 | 4.6%), Cleaning & Maintenance (38 | 3.5%), and Personal Care & Service (32 | 2.9%).
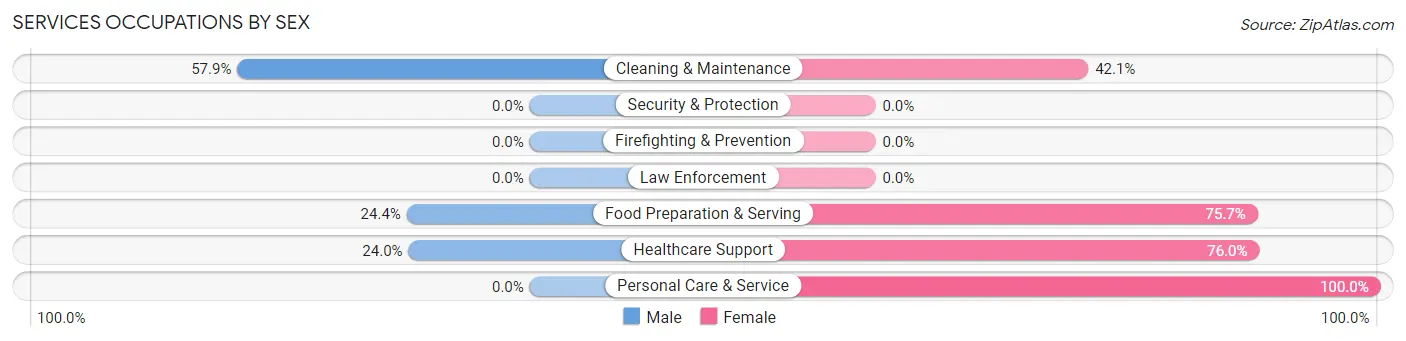
Services Occupations by Sex
Within the Services occupations in Northwood, the most male-oriented occupations are Cleaning & Maintenance (57.9%), Food Preparation & Serving (24.3%), and Healthcare Support (24.0%), while the most female-oriented occupations are Personal Care & Service (100.0%), Healthcare Support (76.0%), and Food Preparation & Serving (75.6%).
| Occupation | Male | Female |
| Healthcare Support | 12 (24.0%) | 38 (76.0%) |
| Security & Protection | 0 (0.0%) | 0 (0.0%) |
| Firefighting & Prevention | 0 (0.0%) | 0 (0.0%) |
| Law Enforcement | 0 (0.0%) | 0 (0.0%) |
| Food Preparation & Serving | 28 (24.3%) | 87 (75.6%) |
| Cleaning & Maintenance | 22 (57.9%) | 16 (42.1%) |
| Personal Care & Service | 0 (0.0%) | 32 (100.0%) |
| Total (Category) | 62 (26.4%) | 173 (73.6%) |
| Total (Overall) | 581 (53.4%) | 507 (46.6%) |
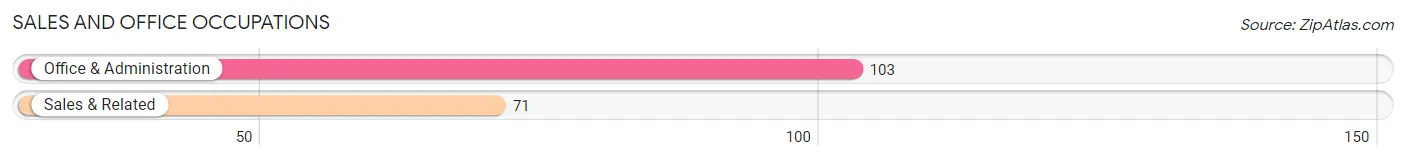
Sales and Office Occupations
The most common Sales and Office occupations in Northwood are Office & Administration (103 | 9.5%), and Sales & Related (71 | 6.5%).
Sales and Office Occupations by Sex
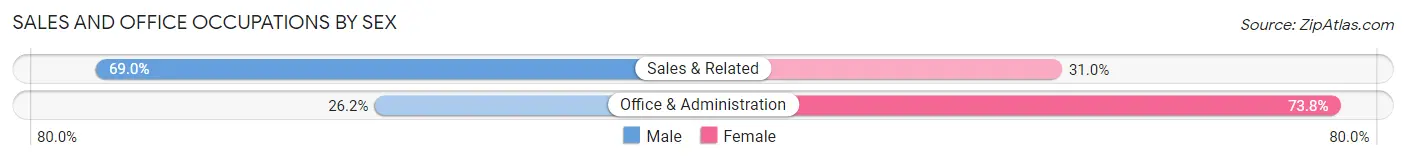
| Occupation | Male | Female |
| Sales & Related | 49 (69.0%) | 22 (31.0%) |
| Office & Administration | 27 (26.2%) | 76 (73.8%) |
| Total (Category) | 76 (43.7%) | 98 (56.3%) |
| Total (Overall) | 581 (53.4%) | 507 (46.6%) |
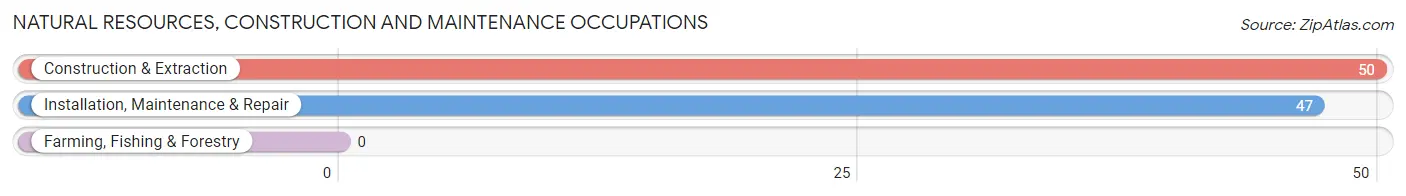
Natural Resources, Construction and Maintenance Occupations
The most common Natural Resources, Construction and Maintenance occupations in Northwood are Construction & Extraction (50 | 4.6%), and Installation, Maintenance & Repair (47 | 4.3%).
Natural Resources, Construction and Maintenance Occupations by Sex
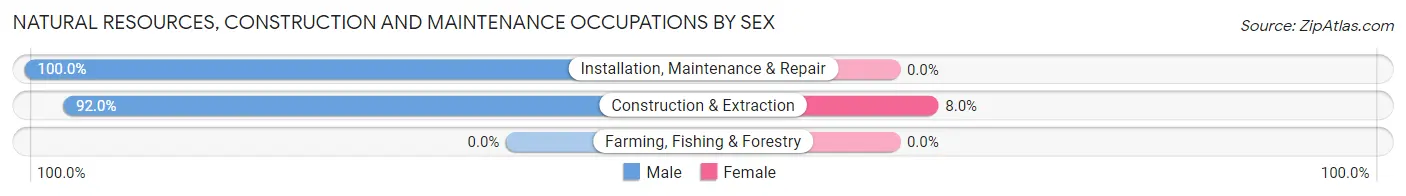
| Occupation | Male | Female |
| Farming, Fishing & Forestry | 0 (0.0%) | 0 (0.0%) |
| Construction & Extraction | 46 (92.0%) | 4 (8.0%) |
| Installation, Maintenance & Repair | 47 (100.0%) | 0 (0.0%) |
| Total (Category) | 93 (95.9%) | 4 (4.1%) |
| Total (Overall) | 581 (53.4%) | 507 (46.6%) |
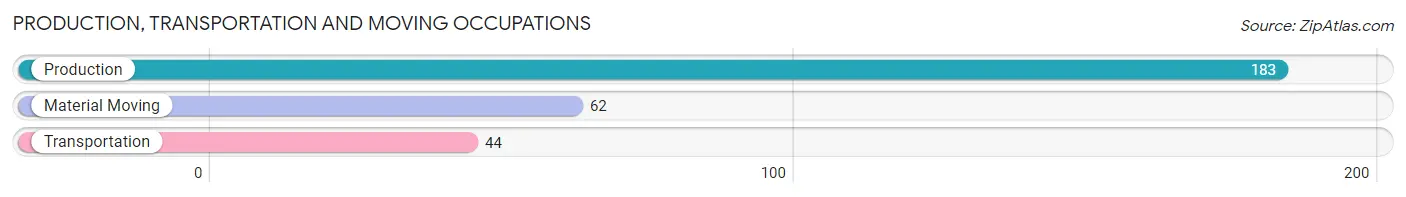
Production, Transportation and Moving Occupations
The most common Production, Transportation and Moving occupations in Northwood are Production (183 | 16.8%), Material Moving (62 | 5.7%), and Transportation (44 | 4.0%).
Production, Transportation and Moving Occupations by Sex
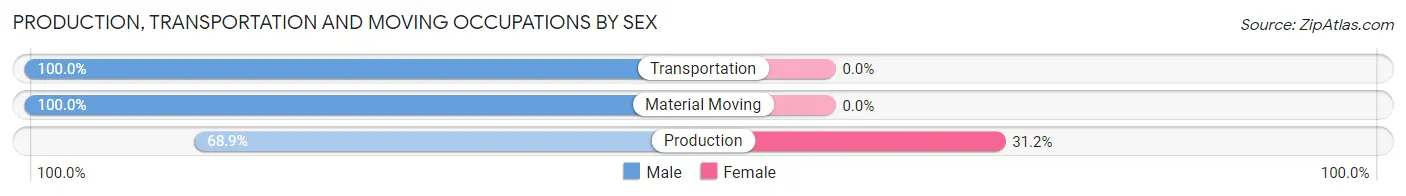
| Occupation | Male | Female |
| Production | 126 (68.9%) | 57 (31.1%) |
| Transportation | 44 (100.0%) | 0 (0.0%) |
| Material Moving | 62 (100.0%) | 0 (0.0%) |
| Total (Category) | 232 (80.3%) | 57 (19.7%) |
| Total (Overall) | 581 (53.4%) | 507 (46.6%) |
Employment Industries by Sex in Northwood
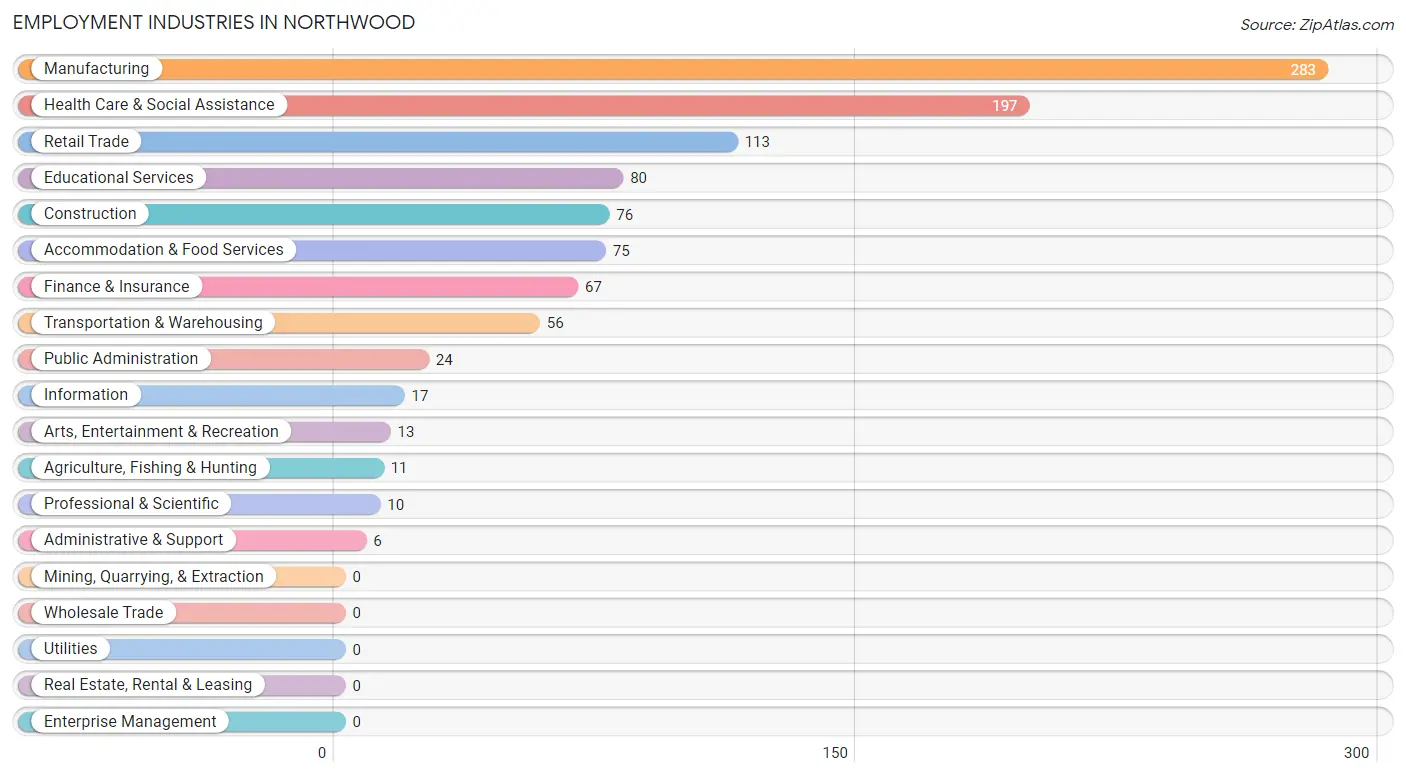
Employment Industries in Northwood
The major employment industries in Northwood include Manufacturing (283 | 26.0%), Health Care & Social Assistance (197 | 18.1%), Retail Trade (113 | 10.4%), Educational Services (80 | 7.3%), and Construction (76 | 7.0%).
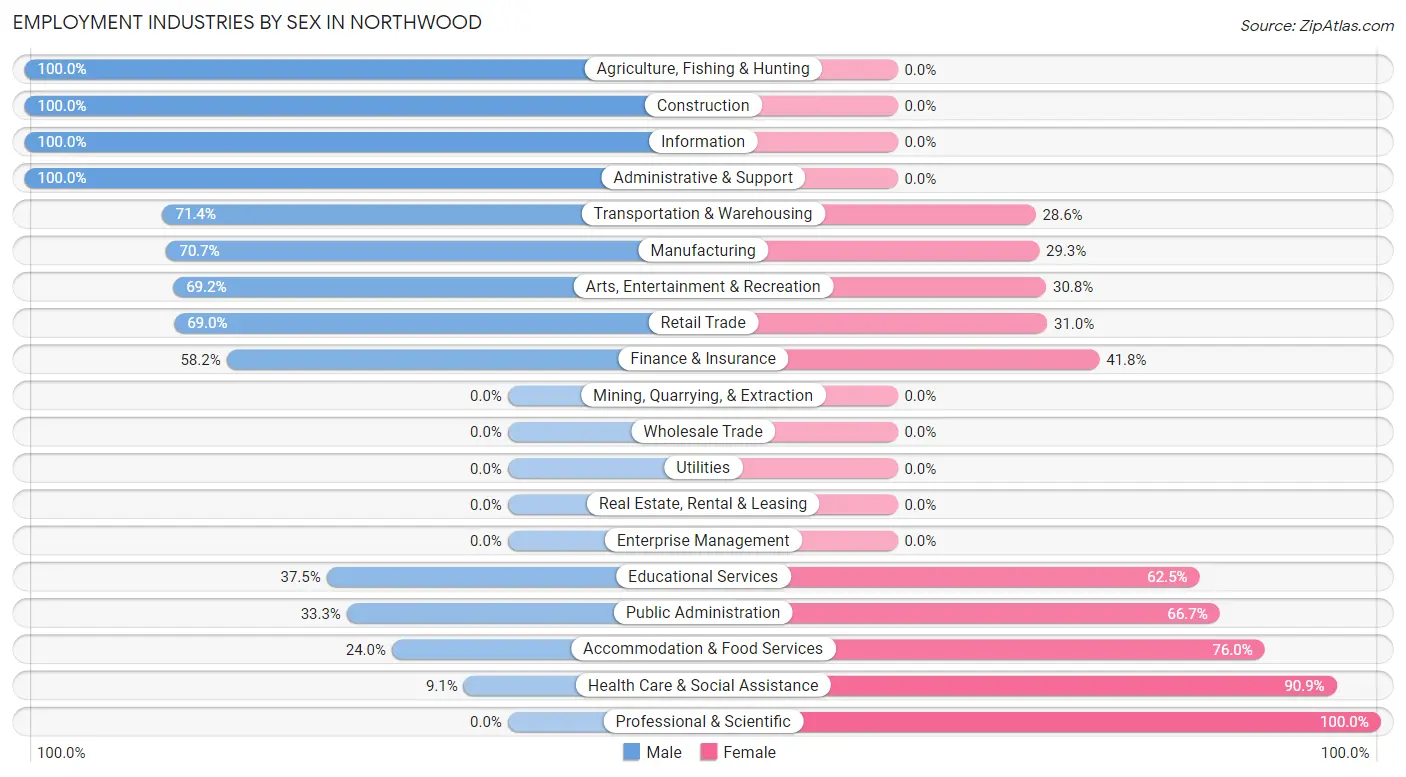
Employment Industries by Sex in Northwood
The Northwood industries that see more men than women are Agriculture, Fishing & Hunting (100.0%), Construction (100.0%), and Information (100.0%), whereas the industries that tend to have a higher number of women are Professional & Scientific (100.0%), Health Care & Social Assistance (90.9%), and Accommodation & Food Services (76.0%).
| Industry | Male | Female |
| Agriculture, Fishing & Hunting | 11 (100.0%) | 0 (0.0%) |
| Mining, Quarrying, & Extraction | 0 (0.0%) | 0 (0.0%) |
| Construction | 76 (100.0%) | 0 (0.0%) |
| Manufacturing | 200 (70.7%) | 83 (29.3%) |
| Wholesale Trade | 0 (0.0%) | 0 (0.0%) |
| Retail Trade | 78 (69.0%) | 35 (31.0%) |
| Transportation & Warehousing | 40 (71.4%) | 16 (28.6%) |
| Utilities | 0 (0.0%) | 0 (0.0%) |
| Information | 17 (100.0%) | 0 (0.0%) |
| Finance & Insurance | 39 (58.2%) | 28 (41.8%) |
| Real Estate, Rental & Leasing | 0 (0.0%) | 0 (0.0%) |
| Professional & Scientific | 0 (0.0%) | 10 (100.0%) |
| Enterprise Management | 0 (0.0%) | 0 (0.0%) |
| Administrative & Support | 6 (100.0%) | 0 (0.0%) |
| Educational Services | 30 (37.5%) | 50 (62.5%) |
| Health Care & Social Assistance | 18 (9.1%) | 179 (90.9%) |
| Arts, Entertainment & Recreation | 9 (69.2%) | 4 (30.8%) |
| Accommodation & Food Services | 18 (24.0%) | 57 (76.0%) |
| Public Administration | 8 (33.3%) | 16 (66.7%) |
| Total | 581 (53.4%) | 507 (46.6%) |
Education in Northwood
School Enrollment in Northwood
The most common levels of schooling among the 425 students in Northwood are high school (99 | 23.3%), middle school (96 | 22.6%), and elementary school (95 | 22.4%).
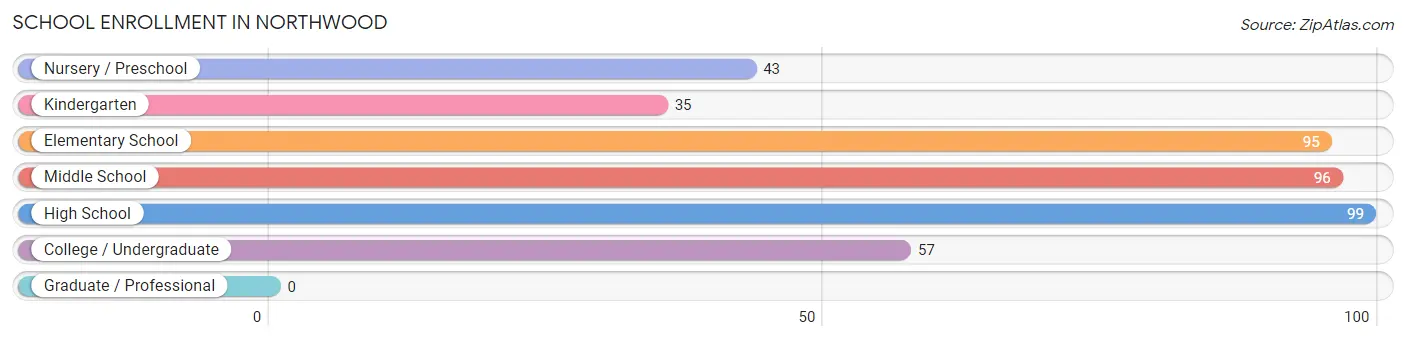
| School Level | # Students | % Students |
| Nursery / Preschool | 43 | 10.1% |
| Kindergarten | 35 | 8.2% |
| Elementary School | 95 | 22.4% |
| Middle School | 96 | 22.6% |
| High School | 99 | 23.3% |
| College / Undergraduate | 57 | 13.4% |
| Graduate / Professional | 0 | 0.0% |
| Total | 425 | 100.0% |
School Enrollment by Age by Funding Source in Northwood
Out of a total of 425 students who are enrolled in schools in Northwood, 53 (12.5%) attend a private institution, while the remaining 372 (87.5%) are enrolled in public schools. The age group of 35 years and over has the highest likelihood of being enrolled in private schools, with 9 (69.2% in the age bracket) enrolled. Conversely, the age group of 3 to 4 year olds has the lowest likelihood of being enrolled in a private school, with 26 (100.0% in the age bracket) attending a public institution.
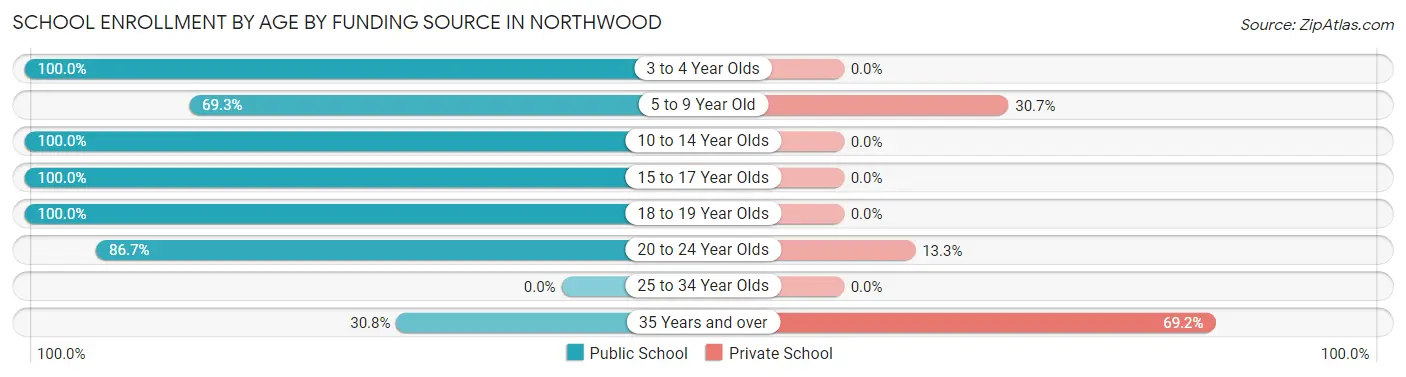
| Age Bracket | Public School | Private School |
| 3 to 4 Year Olds | 26 (100.0%) | 0 (0.0%) |
| 5 to 9 Year Old | 95 (69.3%) | 42 (30.7%) |
| 10 to 14 Year Olds | 106 (100.0%) | 0 (0.0%) |
| 15 to 17 Year Olds | 83 (100.0%) | 0 (0.0%) |
| 18 to 19 Year Olds | 45 (100.0%) | 0 (0.0%) |
| 20 to 24 Year Olds | 13 (86.7%) | 2 (13.3%) |
| 25 to 34 Year Olds | 0 (0.0%) | 0 (0.0%) |
| 35 Years and over | 4 (30.8%) | 9 (69.2%) |
| Total | 372 (87.5%) | 53 (12.5%) |
Educational Attainment by Field of Study in Northwood
Business (36 | 12.5%), bio, nature & agricultural (35 | 12.1%), science & technology (35 | 12.1%), education (34 | 11.8%), and social sciences (33 | 11.5%) are the most common fields of study among 288 individuals in Northwood who have obtained a bachelor's degree or higher.
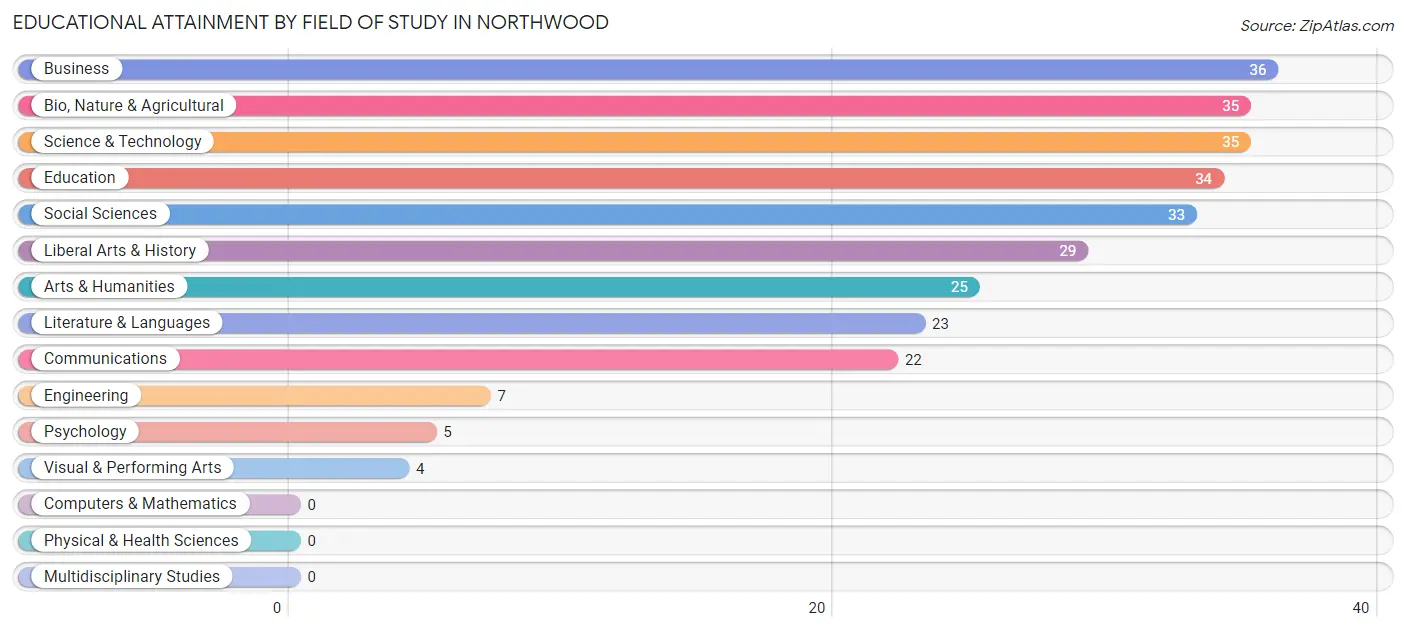
| Field of Study | # Graduates | % Graduates |
| Computers & Mathematics | 0 | 0.0% |
| Bio, Nature & Agricultural | 35 | 12.1% |
| Physical & Health Sciences | 0 | 0.0% |
| Psychology | 5 | 1.7% |
| Social Sciences | 33 | 11.5% |
| Engineering | 7 | 2.4% |
| Multidisciplinary Studies | 0 | 0.0% |
| Science & Technology | 35 | 12.1% |
| Business | 36 | 12.5% |
| Education | 34 | 11.8% |
| Literature & Languages | 23 | 8.0% |
| Liberal Arts & History | 29 | 10.1% |
| Visual & Performing Arts | 4 | 1.4% |
| Communications | 22 | 7.6% |
| Arts & Humanities | 25 | 8.7% |
| Total | 288 | 100.0% |
Transportation & Commute in Northwood
Vehicle Availability by Sex in Northwood
The most prevalent vehicle ownership categories in Northwood are males with 2 vehicles (188, accounting for 33.4%) and females with 2 vehicles (176, making up 37.8%).
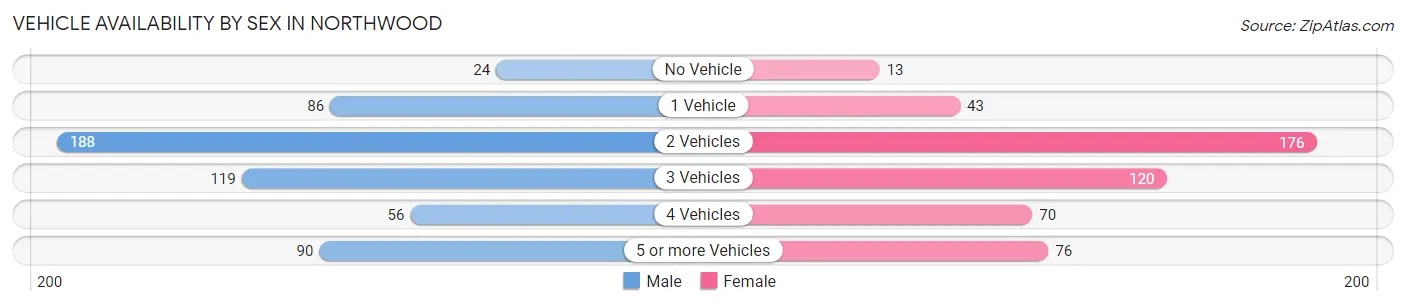
| Vehicles Available | Male | Female |
| No Vehicle | 24 (4.3%) | 13 (2.6%) |
| 1 Vehicle | 86 (15.3%) | 43 (8.6%) |
| 2 Vehicles | 188 (33.4%) | 176 (35.3%) |
| 3 Vehicles | 119 (21.1%) | 120 (24.1%) |
| 4 Vehicles | 56 (10.0%) | 70 (14.1%) |
| 5 or more Vehicles | 90 (16.0%) | 76 (15.3%) |
| Total | 563 (100.0%) | 498 (100.0%) |
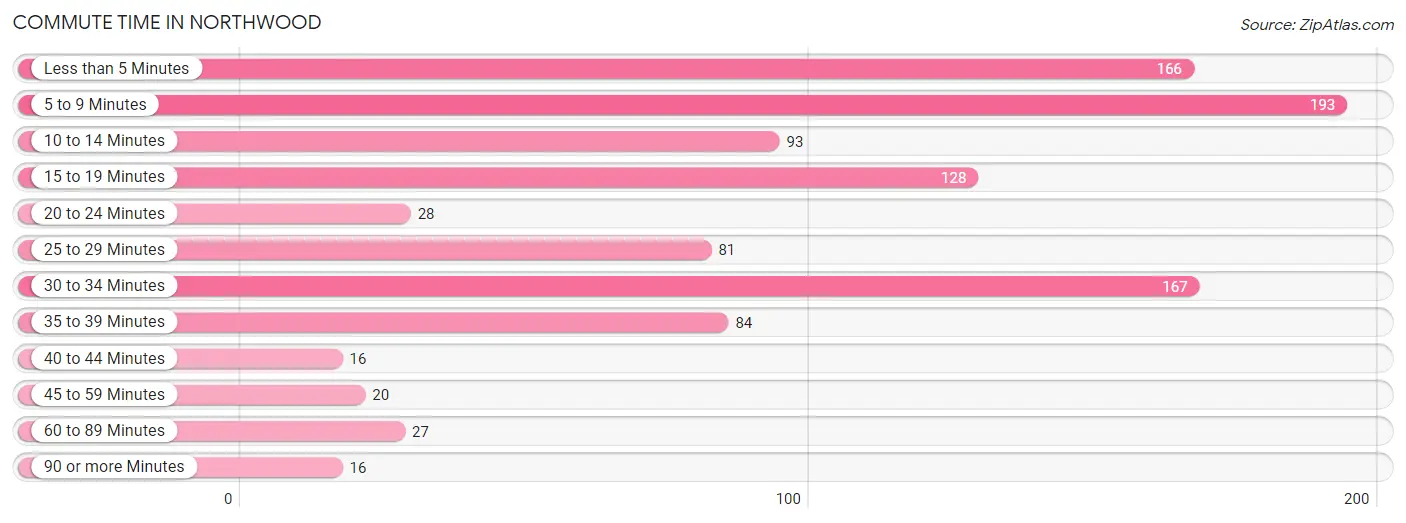
Commute Time in Northwood
The most frequently occuring commute durations in Northwood are 5 to 9 minutes (193 commuters, 18.9%), 30 to 34 minutes (167 commuters, 16.4%), and less than 5 minutes (166 commuters, 16.3%).
| Commute Time | # Commuters | % Commuters |
| Less than 5 Minutes | 166 | 16.3% |
| 5 to 9 Minutes | 193 | 18.9% |
| 10 to 14 Minutes | 93 | 9.1% |
| 15 to 19 Minutes | 128 | 12.6% |
| 20 to 24 Minutes | 28 | 2.8% |
| 25 to 29 Minutes | 81 | 8.0% |
| 30 to 34 Minutes | 167 | 16.4% |
| 35 to 39 Minutes | 84 | 8.2% |
| 40 to 44 Minutes | 16 | 1.6% |
| 45 to 59 Minutes | 20 | 2.0% |
| 60 to 89 Minutes | 27 | 2.6% |
| 90 or more Minutes | 16 | 1.6% |
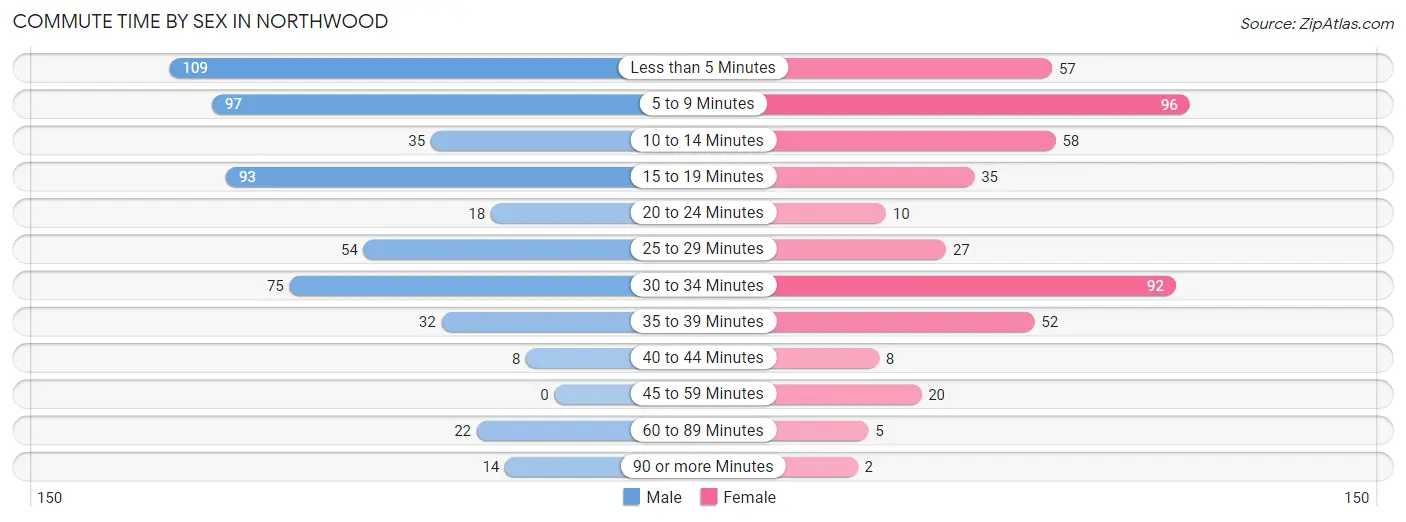
Commute Time by Sex in Northwood
The most common commute times in Northwood are less than 5 minutes (109 commuters, 19.6%) for males and 5 to 9 minutes (96 commuters, 20.8%) for females.
| Commute Time | Male | Female |
| Less than 5 Minutes | 109 (19.6%) | 57 (12.3%) |
| 5 to 9 Minutes | 97 (17.4%) | 96 (20.8%) |
| 10 to 14 Minutes | 35 (6.3%) | 58 (12.6%) |
| 15 to 19 Minutes | 93 (16.7%) | 35 (7.6%) |
| 20 to 24 Minutes | 18 (3.2%) | 10 (2.2%) |
| 25 to 29 Minutes | 54 (9.7%) | 27 (5.8%) |
| 30 to 34 Minutes | 75 (13.5%) | 92 (19.9%) |
| 35 to 39 Minutes | 32 (5.8%) | 52 (11.3%) |
| 40 to 44 Minutes | 8 (1.4%) | 8 (1.7%) |
| 45 to 59 Minutes | 0 (0.0%) | 20 (4.3%) |
| 60 to 89 Minutes | 22 (4.0%) | 5 (1.1%) |
| 90 or more Minutes | 14 (2.5%) | 2 (0.4%) |
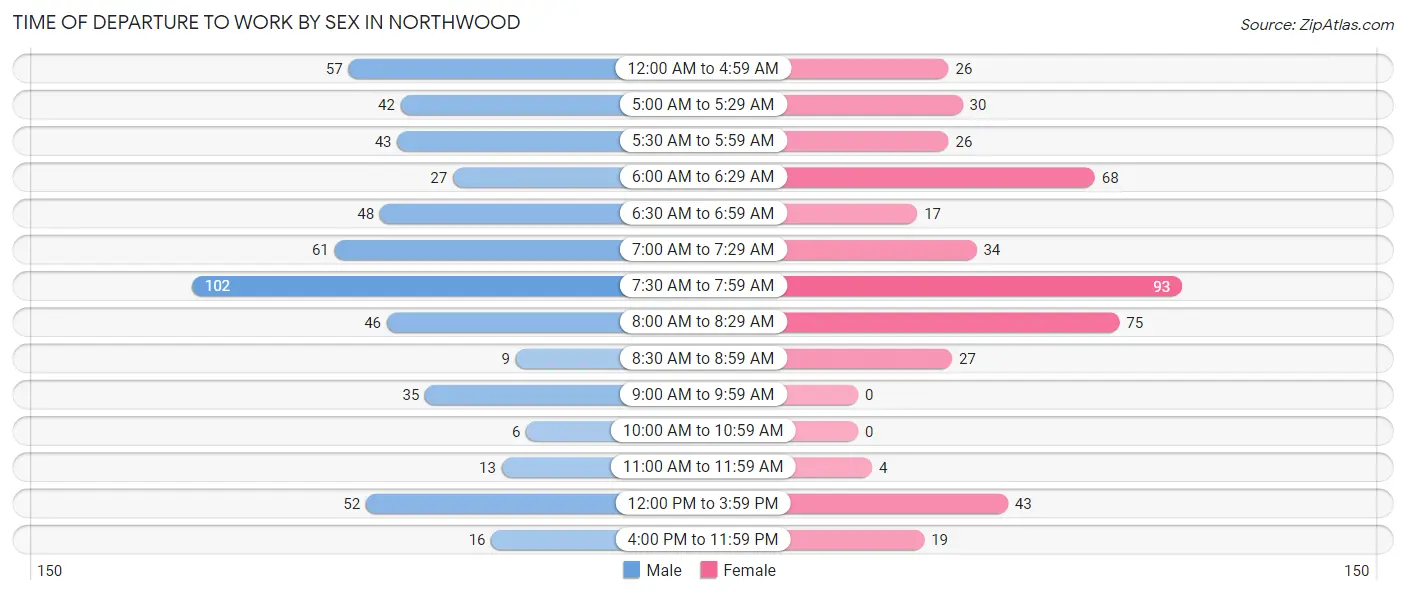
Time of Departure to Work by Sex in Northwood
The most frequent times of departure to work in Northwood are 7:30 AM to 7:59 AM (102, 18.3%) for males and 7:30 AM to 7:59 AM (93, 20.1%) for females.
| Time of Departure | Male | Female |
| 12:00 AM to 4:59 AM | 57 (10.2%) | 26 (5.6%) |
| 5:00 AM to 5:29 AM | 42 (7.5%) | 30 (6.5%) |
| 5:30 AM to 5:59 AM | 43 (7.7%) | 26 (5.6%) |
| 6:00 AM to 6:29 AM | 27 (4.9%) | 68 (14.7%) |
| 6:30 AM to 6:59 AM | 48 (8.6%) | 17 (3.7%) |
| 7:00 AM to 7:29 AM | 61 (11.0%) | 34 (7.4%) |
| 7:30 AM to 7:59 AM | 102 (18.3%) | 93 (20.1%) |
| 8:00 AM to 8:29 AM | 46 (8.3%) | 75 (16.2%) |
| 8:30 AM to 8:59 AM | 9 (1.6%) | 27 (5.8%) |
| 9:00 AM to 9:59 AM | 35 (6.3%) | 0 (0.0%) |
| 10:00 AM to 10:59 AM | 6 (1.1%) | 0 (0.0%) |
| 11:00 AM to 11:59 AM | 13 (2.3%) | 4 (0.9%) |
| 12:00 PM to 3:59 PM | 52 (9.3%) | 43 (9.3%) |
| 4:00 PM to 11:59 PM | 16 (2.9%) | 19 (4.1%) |
| Total | 557 (100.0%) | 462 (100.0%) |
Housing Occupancy in Northwood
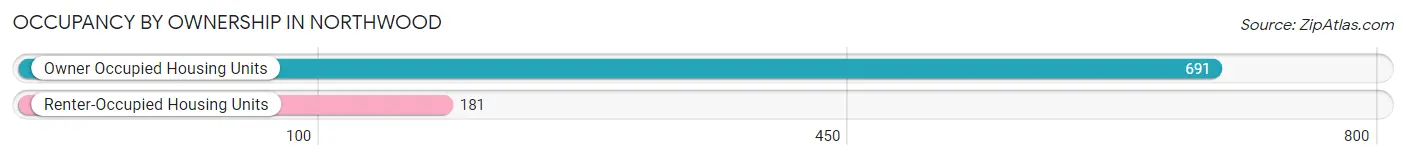
Occupancy by Ownership in Northwood
Of the total 872 dwellings in Northwood, owner-occupied units account for 691 (79.2%), while renter-occupied units make up 181 (20.8%).
| Occupancy | # Housing Units | % Housing Units |
| Owner Occupied Housing Units | 691 | 79.2% |
| Renter-Occupied Housing Units | 181 | 20.8% |
| Total Occupied Housing Units | 872 | 100.0% |
Occupancy by Household Size in Northwood
| Household Size | # Housing Units | % Housing Units |
| 1-Person Household | 248 | 28.4% |
| 2-Person Household | 310 | 35.5% |
| 3-Person Household | 120 | 13.8% |
| 4+ Person Household | 194 | 22.3% |
| Total Housing Units | 872 | 100.0% |
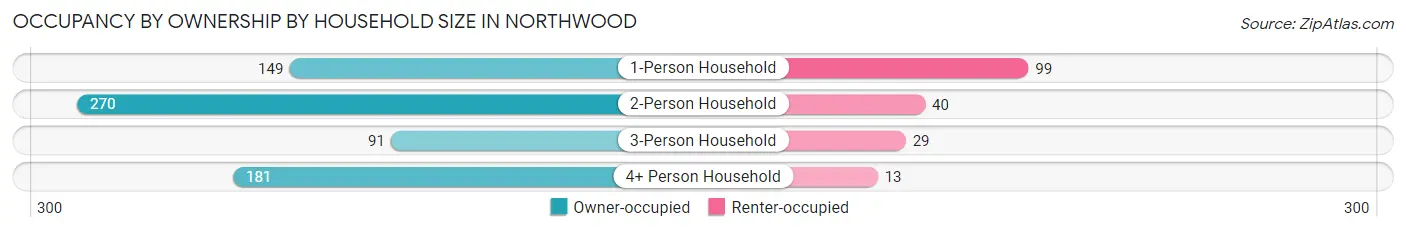
Occupancy by Ownership by Household Size in Northwood
| Household Size | Owner-occupied | Renter-occupied |
| 1-Person Household | 149 (60.1%) | 99 (39.9%) |
| 2-Person Household | 270 (87.1%) | 40 (12.9%) |
| 3-Person Household | 91 (75.8%) | 29 (24.2%) |
| 4+ Person Household | 181 (93.3%) | 13 (6.7%) |
| Total Housing Units | 691 (79.2%) | 181 (20.8%) |
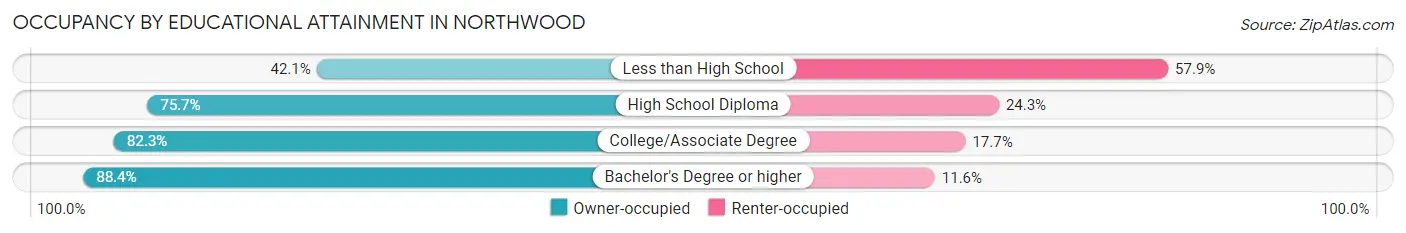
Occupancy by Educational Attainment in Northwood
| Household Size | Owner-occupied | Renter-occupied |
| Less than High School | 16 (42.1%) | 22 (57.9%) |
| High School Diploma | 230 (75.7%) | 74 (24.3%) |
| College/Associate Degree | 316 (82.3%) | 68 (17.7%) |
| Bachelor's Degree or higher | 129 (88.4%) | 17 (11.6%) |
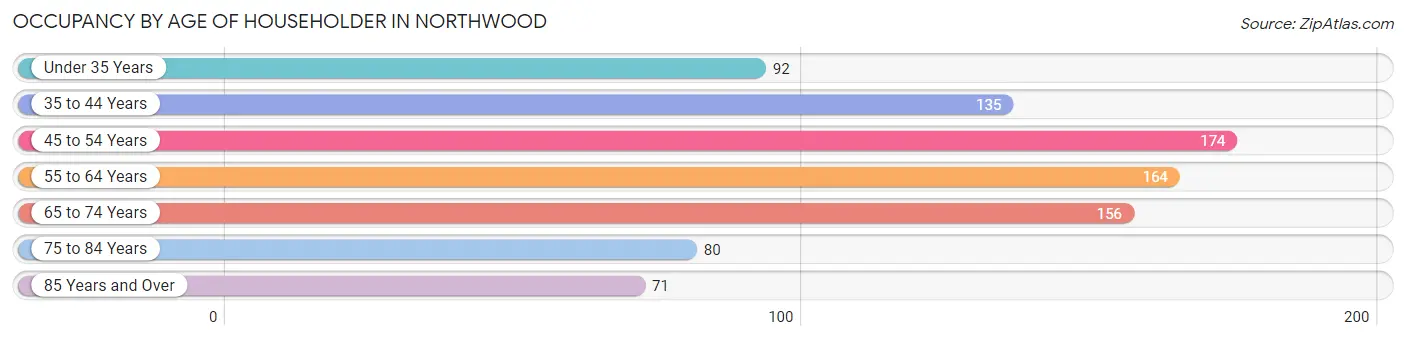
Occupancy by Age of Householder in Northwood
| Age Bracket | # Households | % Households |
| Under 35 Years | 92 | 10.5% |
| 35 to 44 Years | 135 | 15.5% |
| 45 to 54 Years | 174 | 20.0% |
| 55 to 64 Years | 164 | 18.8% |
| 65 to 74 Years | 156 | 17.9% |
| 75 to 84 Years | 80 | 9.2% |
| 85 Years and Over | 71 | 8.1% |
| Total | 872 | 100.0% |
Housing Finances in Northwood
Median Income by Occupancy in Northwood
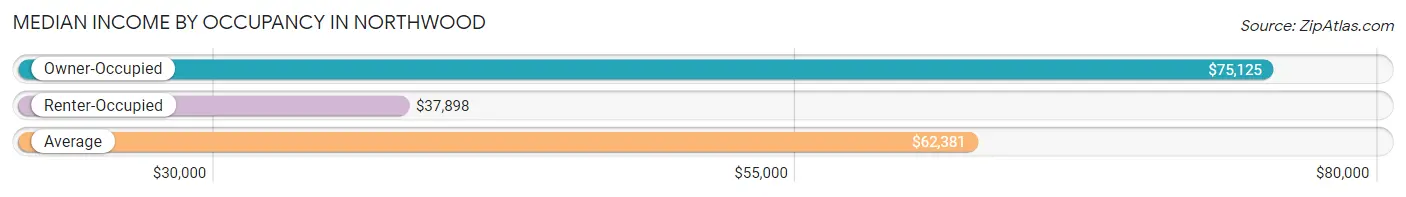
| Occupancy Type | # Households | Median Income |
| Owner-Occupied | 691 (79.2%) | $75,125 |
| Renter-Occupied | 181 (20.8%) | $37,898 |
| Average | 872 (100.0%) | $62,381 |
Occupancy by Householder Income Bracket in Northwood
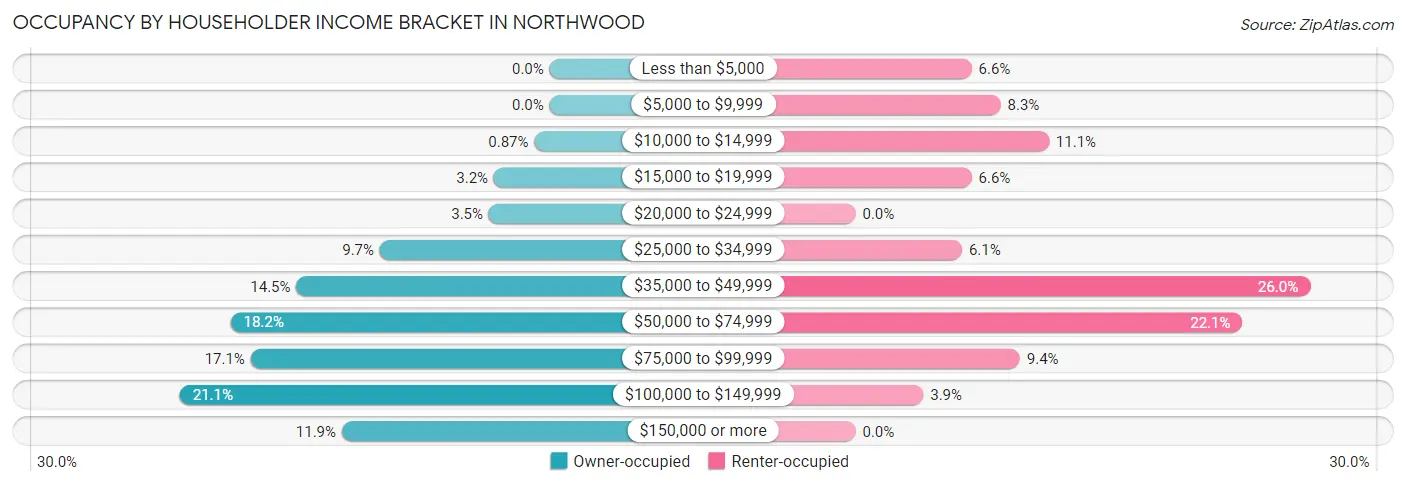
| Income Bracket | Owner-occupied | Renter-occupied |
| Less than $5,000 | 0 (0.0%) | 12 (6.6%) |
| $5,000 to $9,999 | 0 (0.0%) | 15 (8.3%) |
| $10,000 to $14,999 | 6 (0.9%) | 20 (11.1%) |
| $15,000 to $19,999 | 22 (3.2%) | 12 (6.6%) |
| $20,000 to $24,999 | 24 (3.5%) | 0 (0.0%) |
| $25,000 to $34,999 | 67 (9.7%) | 11 (6.1%) |
| $35,000 to $49,999 | 100 (14.5%) | 47 (26.0%) |
| $50,000 to $74,999 | 126 (18.2%) | 40 (22.1%) |
| $75,000 to $99,999 | 118 (17.1%) | 17 (9.4%) |
| $100,000 to $149,999 | 146 (21.1%) | 7 (3.9%) |
| $150,000 or more | 82 (11.9%) | 0 (0.0%) |
| Total | 691 (100.0%) | 181 (100.0%) |
Monthly Housing Cost Tiers in Northwood
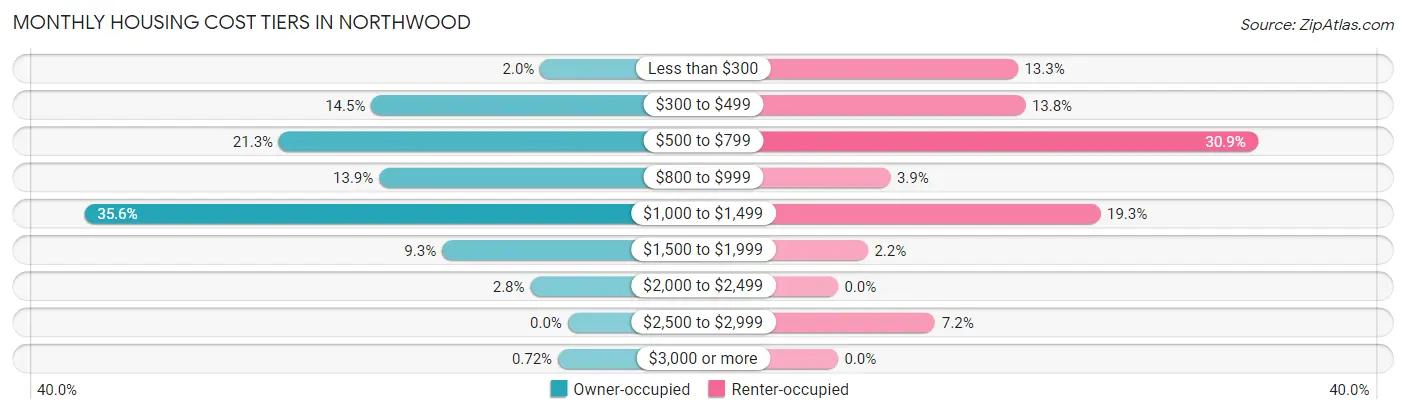
| Monthly Cost | Owner-occupied | Renter-occupied |
| Less than $300 | 14 (2.0%) | 24 (13.3%) |
| $300 to $499 | 100 (14.5%) | 25 (13.8%) |
| $500 to $799 | 147 (21.3%) | 56 (30.9%) |
| $800 to $999 | 96 (13.9%) | 7 (3.9%) |
| $1,000 to $1,499 | 246 (35.6%) | 35 (19.3%) |
| $1,500 to $1,999 | 64 (9.3%) | 4 (2.2%) |
| $2,000 to $2,499 | 19 (2.8%) | 0 (0.0%) |
| $2,500 to $2,999 | 0 (0.0%) | 13 (7.2%) |
| $3,000 or more | 5 (0.7%) | 0 (0.0%) |
| Total | 691 (100.0%) | 181 (100.0%) |
Physical Housing Characteristics in Northwood
Housing Structures in Northwood
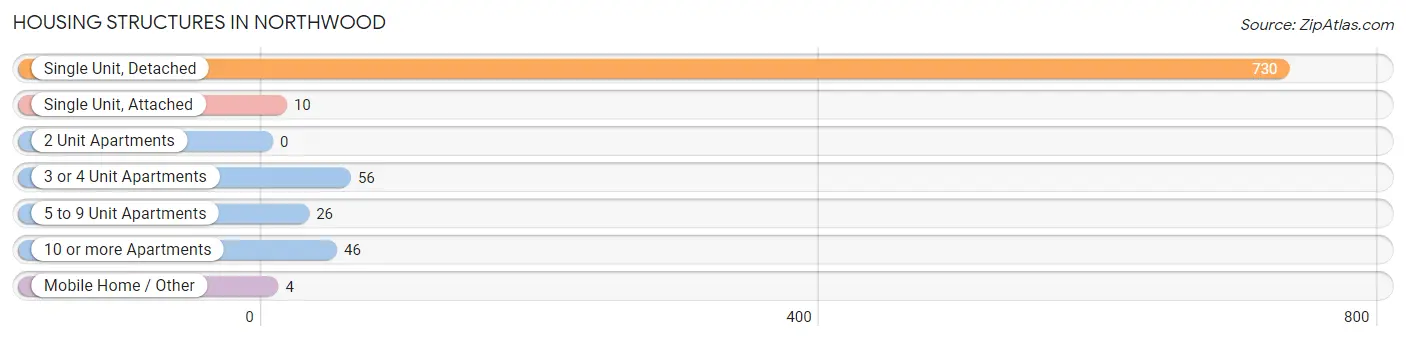
| Structure Type | # Housing Units | % Housing Units |
| Single Unit, Detached | 730 | 83.7% |
| Single Unit, Attached | 10 | 1.1% |
| 2 Unit Apartments | 0 | 0.0% |
| 3 or 4 Unit Apartments | 56 | 6.4% |
| 5 to 9 Unit Apartments | 26 | 3.0% |
| 10 or more Apartments | 46 | 5.3% |
| Mobile Home / Other | 4 | 0.5% |
| Total | 872 | 100.0% |
Housing Structures by Occupancy in Northwood
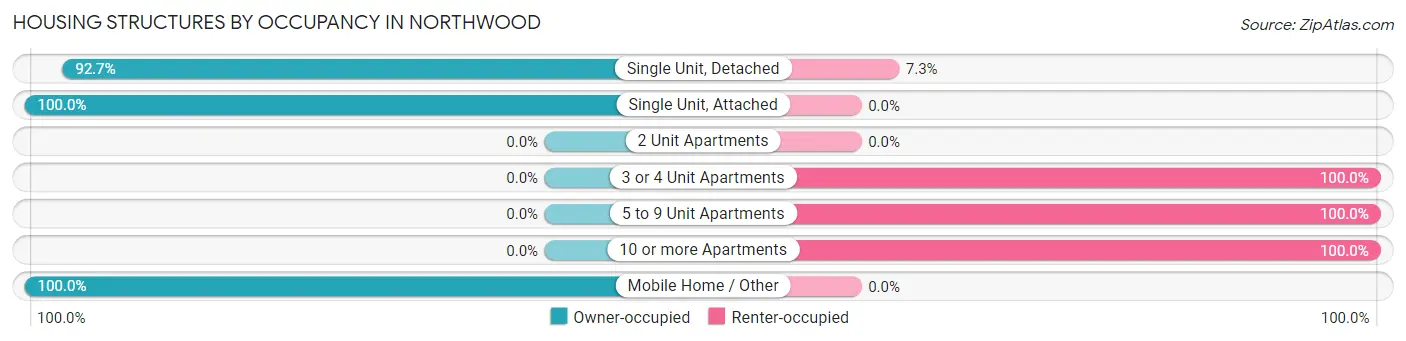
| Structure Type | Owner-occupied | Renter-occupied |
| Single Unit, Detached | 677 (92.7%) | 53 (7.3%) |
| Single Unit, Attached | 10 (100.0%) | 0 (0.0%) |
| 2 Unit Apartments | 0 (0.0%) | 0 (0.0%) |
| 3 or 4 Unit Apartments | 0 (0.0%) | 56 (100.0%) |
| 5 to 9 Unit Apartments | 0 (0.0%) | 26 (100.0%) |
| 10 or more Apartments | 0 (0.0%) | 46 (100.0%) |
| Mobile Home / Other | 4 (100.0%) | 0 (0.0%) |
| Total | 691 (79.2%) | 181 (20.8%) |
Housing Structures by Number of Rooms in Northwood
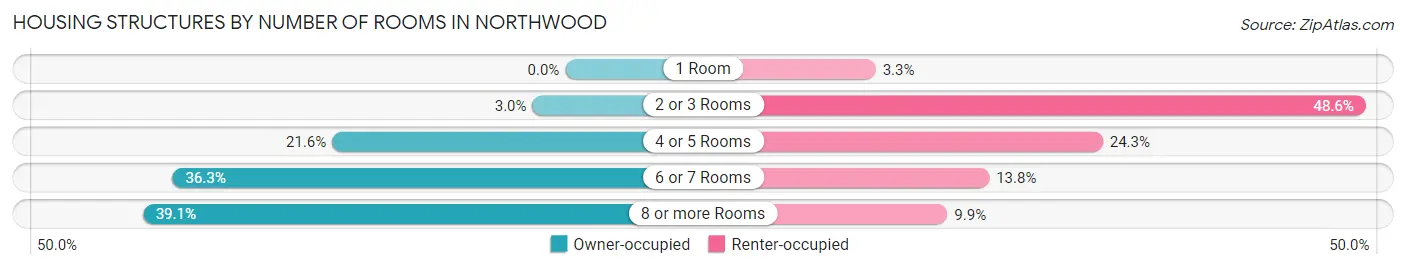
| Number of Rooms | Owner-occupied | Renter-occupied |
| 1 Room | 0 (0.0%) | 6 (3.3%) |
| 2 or 3 Rooms | 21 (3.0%) | 88 (48.6%) |
| 4 or 5 Rooms | 149 (21.6%) | 44 (24.3%) |
| 6 or 7 Rooms | 251 (36.3%) | 25 (13.8%) |
| 8 or more Rooms | 270 (39.1%) | 18 (9.9%) |
| Total | 691 (100.0%) | 181 (100.0%) |
Housing Structure by Heating Type in Northwood
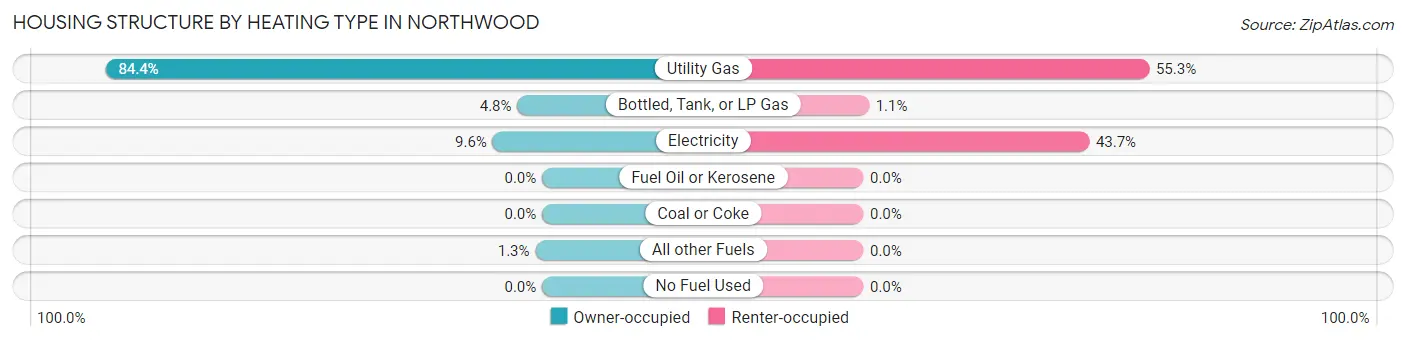
| Heating Type | Owner-occupied | Renter-occupied |
| Utility Gas | 583 (84.4%) | 100 (55.2%) |
| Bottled, Tank, or LP Gas | 33 (4.8%) | 2 (1.1%) |
| Electricity | 66 (9.6%) | 79 (43.6%) |
| Fuel Oil or Kerosene | 0 (0.0%) | 0 (0.0%) |
| Coal or Coke | 0 (0.0%) | 0 (0.0%) |
| All other Fuels | 9 (1.3%) | 0 (0.0%) |
| No Fuel Used | 0 (0.0%) | 0 (0.0%) |
| Total | 691 (100.0%) | 181 (100.0%) |
Household Vehicle Usage in Northwood
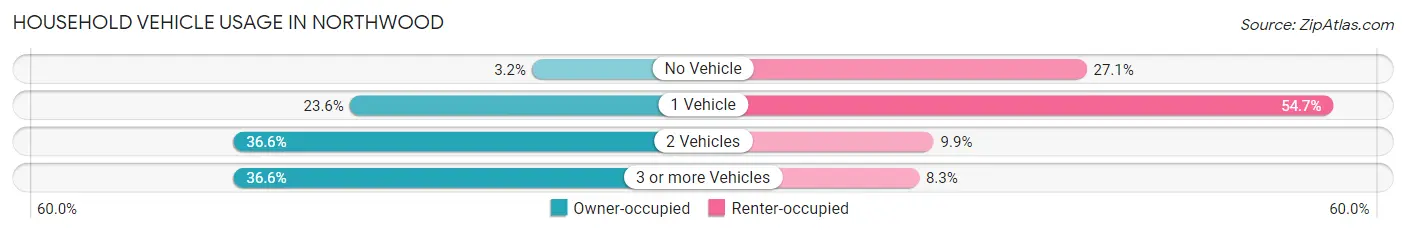
| Vehicles per Household | Owner-occupied | Renter-occupied |
| No Vehicle | 22 (3.2%) | 49 (27.1%) |
| 1 Vehicle | 163 (23.6%) | 99 (54.7%) |
| 2 Vehicles | 253 (36.6%) | 18 (9.9%) |
| 3 or more Vehicles | 253 (36.6%) | 15 (8.3%) |
| Total | 691 (100.0%) | 181 (100.0%) |
Real Estate & Mortgages in Northwood
Real Estate and Mortgage Overview in Northwood
| Characteristic | Without Mortgage | With Mortgage |
| Housing Units | 235 | 456 |
| Median Property Value | $123,900 | $119,500 |
| Median Household Income | $57,019 | $59 |
| Monthly Housing Costs | $515 | $5 |
| Real Estate Taxes | $1,879 | $0 |
Property Value by Mortgage Status in Northwood
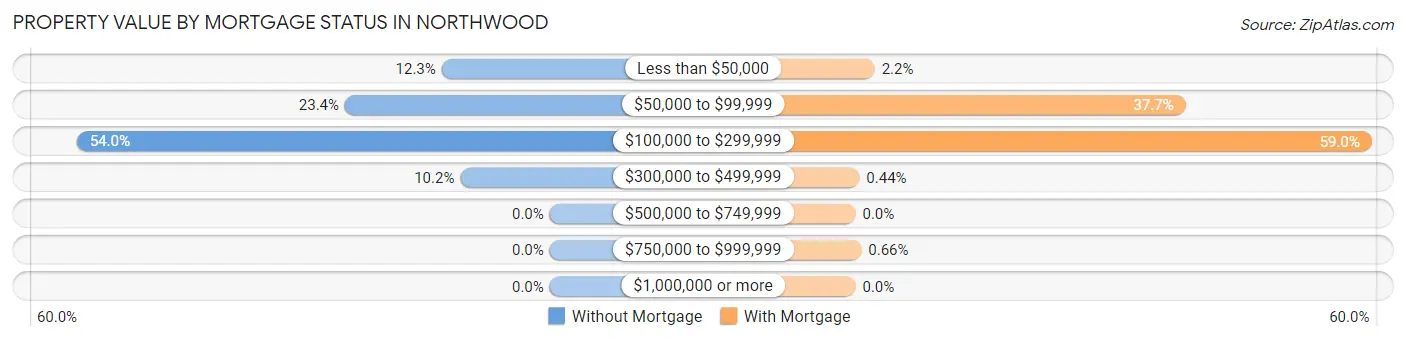
| Property Value | Without Mortgage | With Mortgage |
| Less than $50,000 | 29 (12.3%) | 10 (2.2%) |
| $50,000 to $99,999 | 55 (23.4%) | 172 (37.7%) |
| $100,000 to $299,999 | 127 (54.0%) | 269 (59.0%) |
| $300,000 to $499,999 | 24 (10.2%) | 2 (0.4%) |
| $500,000 to $749,999 | 0 (0.0%) | 0 (0.0%) |
| $750,000 to $999,999 | 0 (0.0%) | 3 (0.7%) |
| $1,000,000 or more | 0 (0.0%) | 0 (0.0%) |
| Total | 235 (100.0%) | 456 (100.0%) |
Household Income by Mortgage Status in Northwood
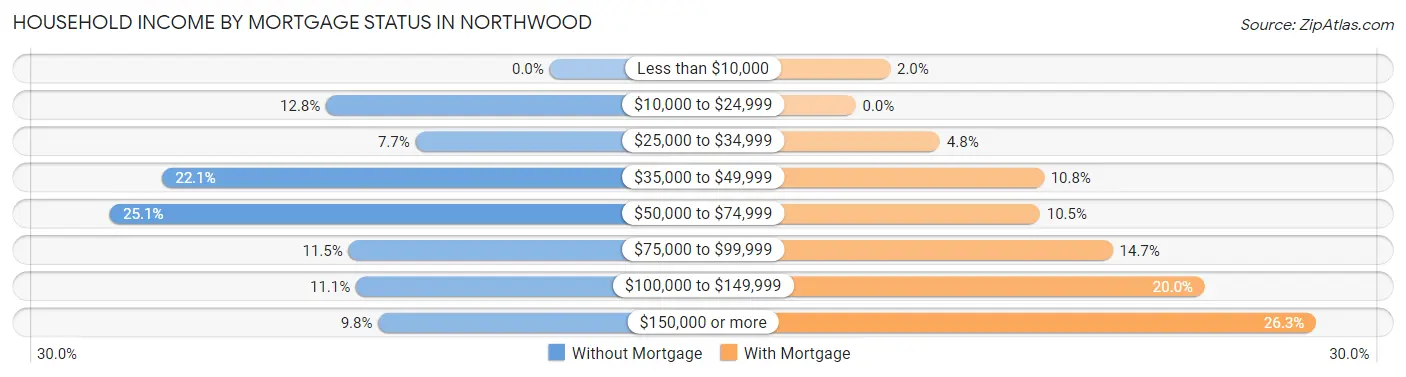
| Household Income | Without Mortgage | With Mortgage |
| Less than $10,000 | 0 (0.0%) | 9 (2.0%) |
| $10,000 to $24,999 | 30 (12.8%) | 0 (0.0%) |
| $25,000 to $34,999 | 18 (7.7%) | 22 (4.8%) |
| $35,000 to $49,999 | 52 (22.1%) | 49 (10.7%) |
| $50,000 to $74,999 | 59 (25.1%) | 48 (10.5%) |
| $75,000 to $99,999 | 27 (11.5%) | 67 (14.7%) |
| $100,000 to $149,999 | 26 (11.1%) | 91 (20.0%) |
| $150,000 or more | 23 (9.8%) | 120 (26.3%) |
| Total | 235 (100.0%) | 456 (100.0%) |
Property Value to Household Income Ratio in Northwood
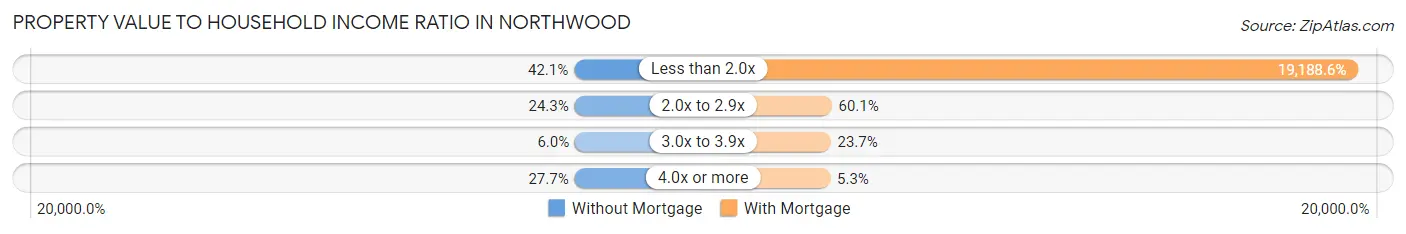
| Value-to-Income Ratio | Without Mortgage | With Mortgage |
| Less than 2.0x | 99 (42.1%) | 87,500 (19,188.6%) |
| 2.0x to 2.9x | 57 (24.3%) | 274 (60.1%) |
| 3.0x to 3.9x | 14 (6.0%) | 108 (23.7%) |
| 4.0x or more | 65 (27.7%) | 24 (5.3%) |
| Total | 235 (100.0%) | 456 (100.0%) |
Real Estate Taxes by Mortgage Status in Northwood
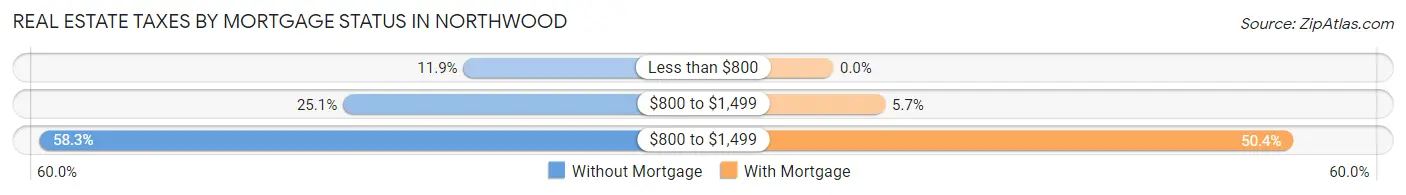
| Property Taxes | Without Mortgage | With Mortgage |
| Less than $800 | 28 (11.9%) | 0 (0.0%) |
| $800 to $1,499 | 59 (25.1%) | 26 (5.7%) |
| $800 to $1,499 | 137 (58.3%) | 230 (50.4%) |
| Total | 235 (100.0%) | 456 (100.0%) |
Health & Disability in Northwood
Health Insurance Coverage by Age in Northwood
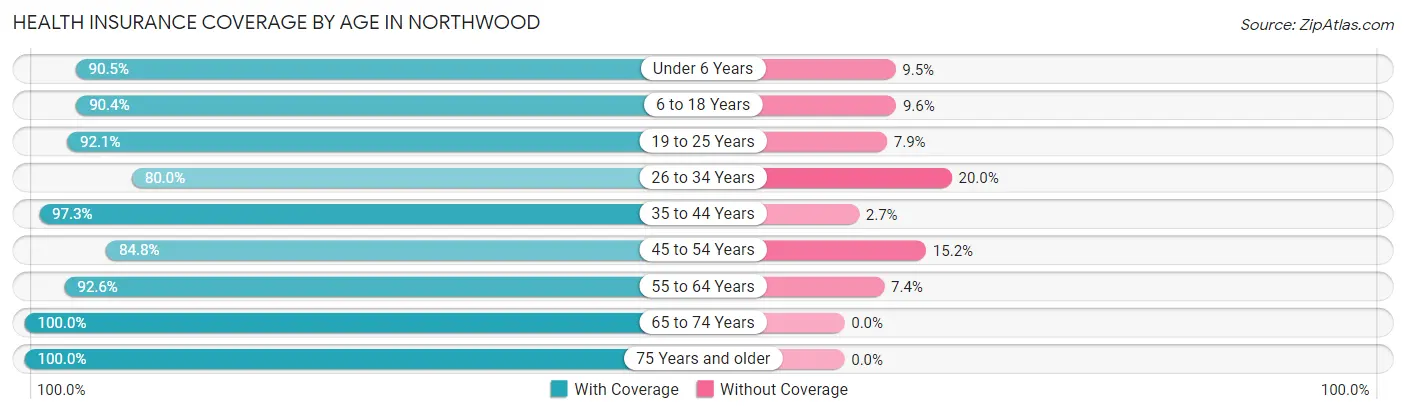
| Age Bracket | With Coverage | Without Coverage |
| Under 6 Years | 133 (90.5%) | 14 (9.5%) |
| 6 to 18 Years | 300 (90.4%) | 32 (9.6%) |
| 19 to 25 Years | 151 (92.1%) | 13 (7.9%) |
| 26 to 34 Years | 140 (80.0%) | 35 (20.0%) |
| 35 to 44 Years | 250 (97.3%) | 7 (2.7%) |
| 45 to 54 Years | 284 (84.8%) | 51 (15.2%) |
| 55 to 64 Years | 249 (92.6%) | 20 (7.4%) |
| 65 to 74 Years | 247 (100.0%) | 0 (0.0%) |
| 75 Years and older | 171 (100.0%) | 0 (0.0%) |
| Total | 1,925 (91.8%) | 172 (8.2%) |
Health Insurance Coverage by Citizenship Status in Northwood
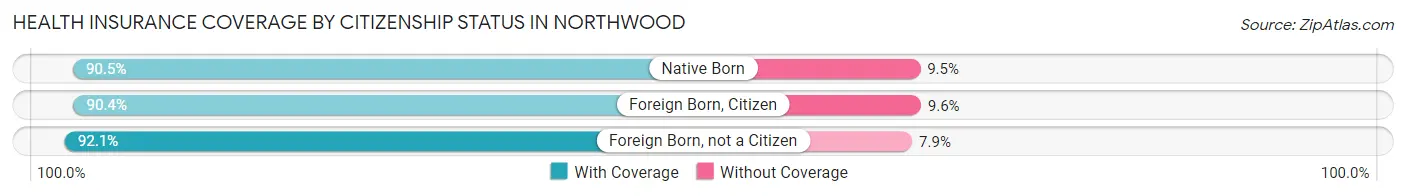
| Citizenship Status | With Coverage | Without Coverage |
| Native Born | 133 (90.5%) | 14 (9.5%) |
| Foreign Born, Citizen | 300 (90.4%) | 32 (9.6%) |
| Foreign Born, not a Citizen | 151 (92.1%) | 13 (7.9%) |
Health Insurance Coverage by Household Income in Northwood
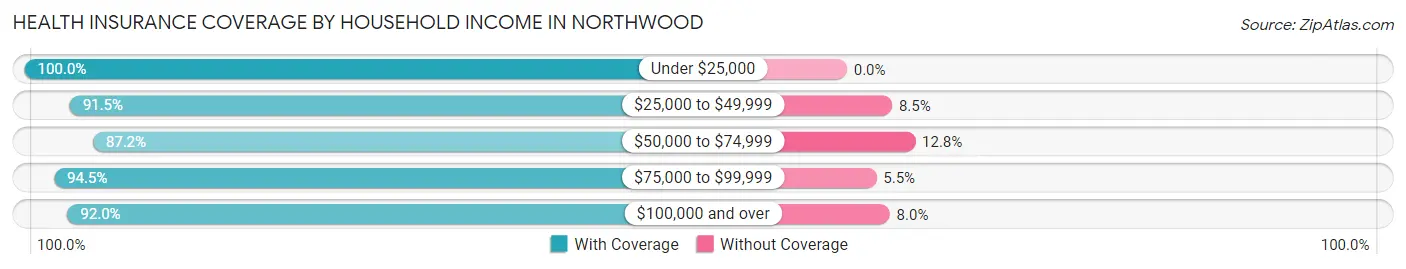
| Household Income | With Coverage | Without Coverage |
| Under $25,000 | 124 (100.0%) | 0 (0.0%) |
| $25,000 to $49,999 | 422 (91.5%) | 39 (8.5%) |
| $50,000 to $74,999 | 368 (87.2%) | 54 (12.8%) |
| $75,000 to $99,999 | 324 (94.5%) | 19 (5.5%) |
| $100,000 and over | 687 (92.0%) | 60 (8.0%) |
Public vs Private Health Insurance Coverage by Age in Northwood
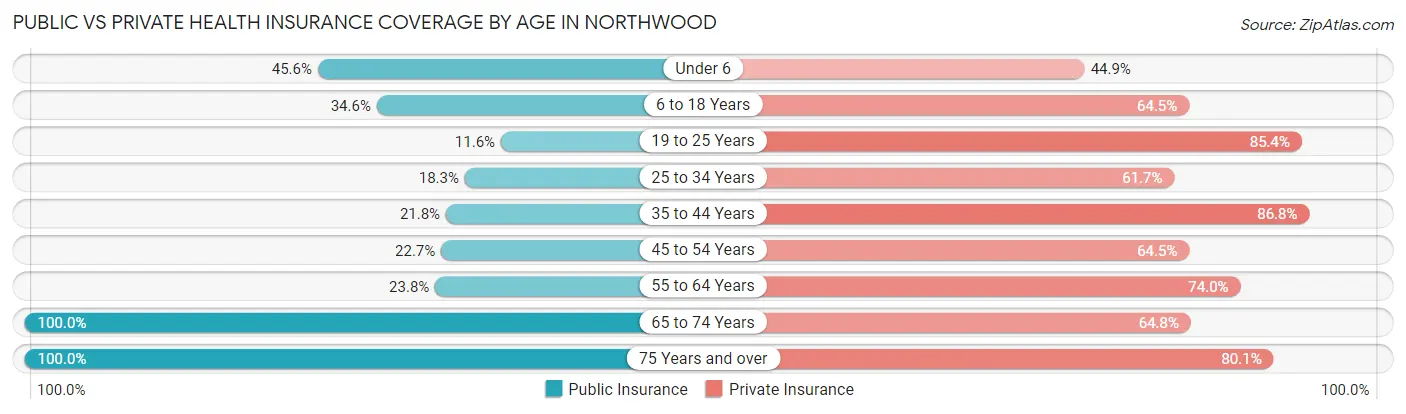
| Age Bracket | Public Insurance | Private Insurance |
| Under 6 | 67 (45.6%) | 66 (44.9%) |
| 6 to 18 Years | 115 (34.6%) | 214 (64.5%) |
| 19 to 25 Years | 19 (11.6%) | 140 (85.4%) |
| 25 to 34 Years | 32 (18.3%) | 108 (61.7%) |
| 35 to 44 Years | 56 (21.8%) | 223 (86.8%) |
| 45 to 54 Years | 76 (22.7%) | 216 (64.5%) |
| 55 to 64 Years | 64 (23.8%) | 199 (74.0%) |
| 65 to 74 Years | 247 (100.0%) | 160 (64.8%) |
| 75 Years and over | 171 (100.0%) | 137 (80.1%) |
| Total | 847 (40.4%) | 1,463 (69.8%) |
Disability Status by Sex by Age in Northwood
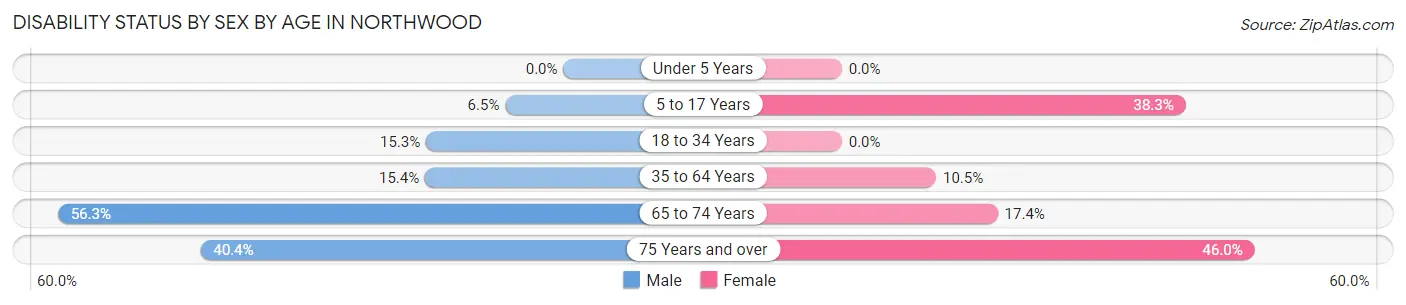
| Age Bracket | Male | Female |
| Under 5 Years | 0 (0.0%) | 0 (0.0%) |
| 5 to 17 Years | 13 (6.5%) | 49 (38.3%) |
| 18 to 34 Years | 24 (15.3%) | 0 (0.0%) |
| 35 to 64 Years | 71 (15.4%) | 42 (10.5%) |
| 65 to 74 Years | 58 (56.3%) | 25 (17.4%) |
| 75 Years and over | 19 (40.4%) | 57 (46.0%) |
Disability Class by Sex by Age in Northwood
Disability Class: Hearing Difficulty
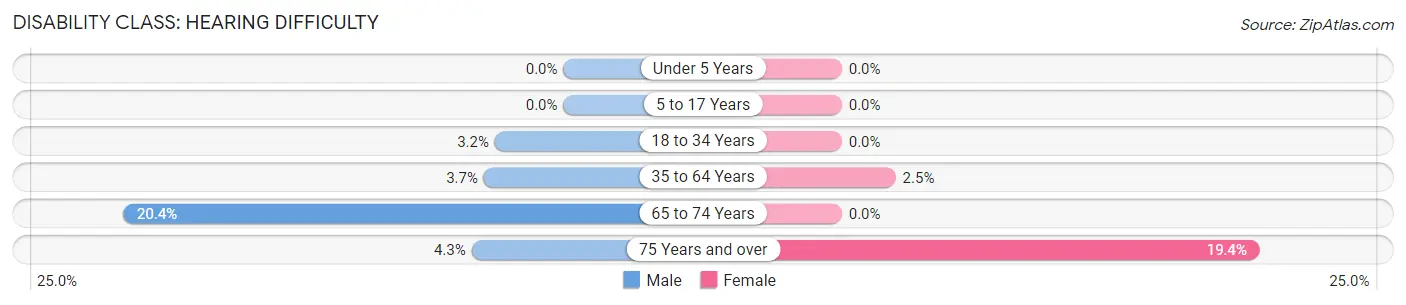
| Age Bracket | Male | Female |
| Under 5 Years | 0 (0.0%) | 0 (0.0%) |
| 5 to 17 Years | 0 (0.0%) | 0 (0.0%) |
| 18 to 34 Years | 5 (3.2%) | 0 (0.0%) |
| 35 to 64 Years | 17 (3.7%) | 10 (2.5%) |
| 65 to 74 Years | 21 (20.4%) | 0 (0.0%) |
| 75 Years and over | 2 (4.3%) | 24 (19.4%) |
Disability Class: Vision Difficulty
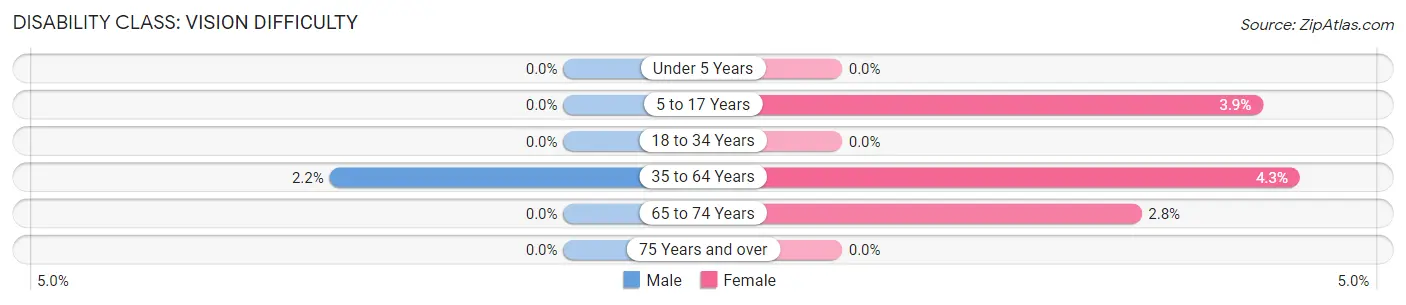
| Age Bracket | Male | Female |
| Under 5 Years | 0 (0.0%) | 0 (0.0%) |
| 5 to 17 Years | 0 (0.0%) | 5 (3.9%) |
| 18 to 34 Years | 0 (0.0%) | 0 (0.0%) |
| 35 to 64 Years | 10 (2.2%) | 17 (4.3%) |
| 65 to 74 Years | 0 (0.0%) | 4 (2.8%) |
| 75 Years and over | 0 (0.0%) | 0 (0.0%) |
Disability Class: Cognitive Difficulty
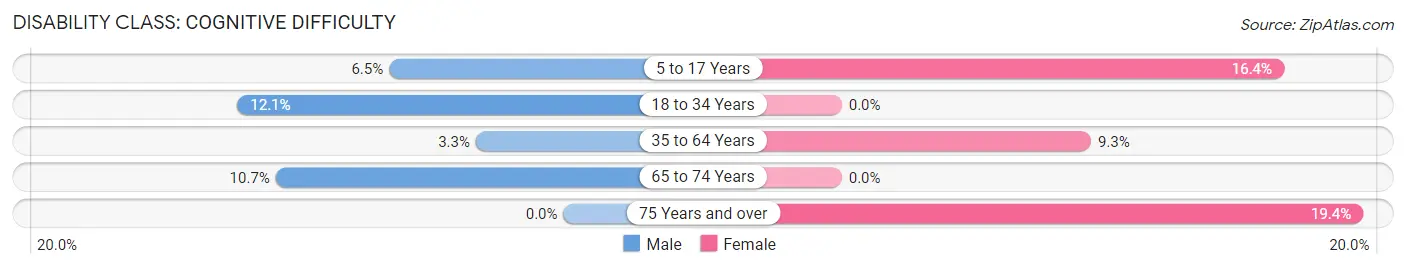
| Age Bracket | Male | Female |
| 5 to 17 Years | 13 (6.5%) | 21 (16.4%) |
| 18 to 34 Years | 19 (12.1%) | 0 (0.0%) |
| 35 to 64 Years | 15 (3.3%) | 37 (9.2%) |
| 65 to 74 Years | 11 (10.7%) | 0 (0.0%) |
| 75 Years and over | 0 (0.0%) | 24 (19.4%) |
Disability Class: Ambulatory Difficulty
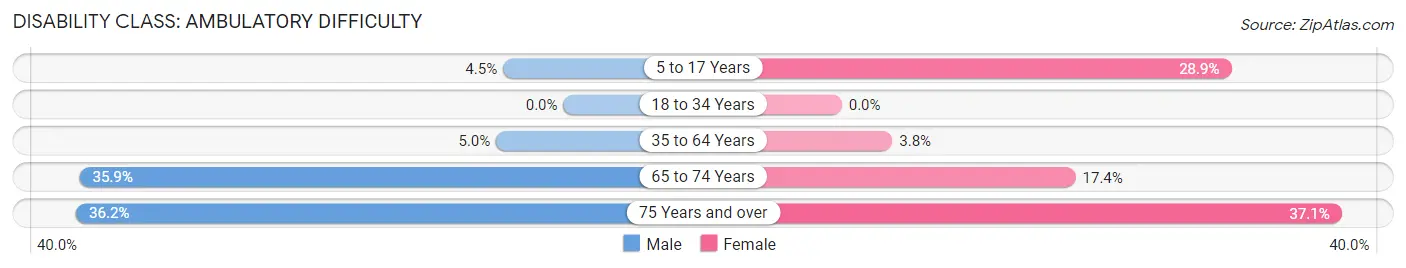
| Age Bracket | Male | Female |
| 5 to 17 Years | 9 (4.5%) | 37 (28.9%) |
| 18 to 34 Years | 0 (0.0%) | 0 (0.0%) |
| 35 to 64 Years | 23 (5.0%) | 15 (3.7%) |
| 65 to 74 Years | 37 (35.9%) | 25 (17.4%) |
| 75 Years and over | 17 (36.2%) | 46 (37.1%) |
Disability Class: Self-Care Difficulty
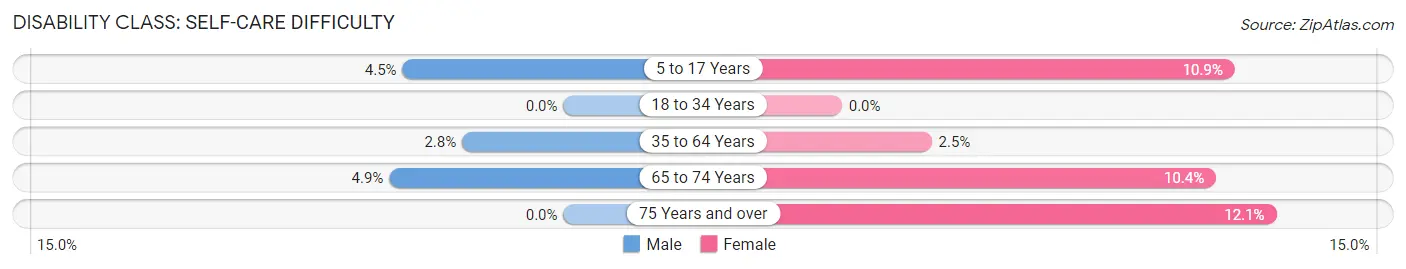
| Age Bracket | Male | Female |
| 5 to 17 Years | 9 (4.5%) | 14 (10.9%) |
| 18 to 34 Years | 0 (0.0%) | 0 (0.0%) |
| 35 to 64 Years | 13 (2.8%) | 10 (2.5%) |
| 65 to 74 Years | 5 (4.9%) | 15 (10.4%) |
| 75 Years and over | 0 (0.0%) | 15 (12.1%) |
Technology Access in Northwood
Computing Device Access in Northwood
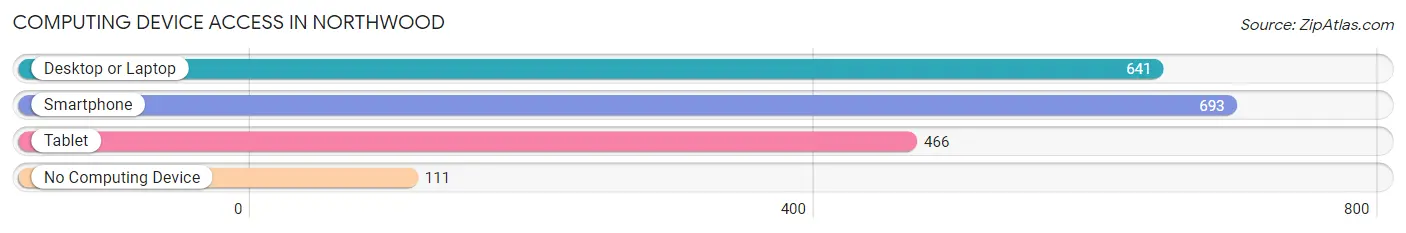
| Device Type | # Households | % Households |
| Desktop or Laptop | 641 | 73.5% |
| Smartphone | 693 | 79.5% |
| Tablet | 466 | 53.4% |
| No Computing Device | 111 | 12.7% |
| Total | 872 | 100.0% |
Internet Access in Northwood
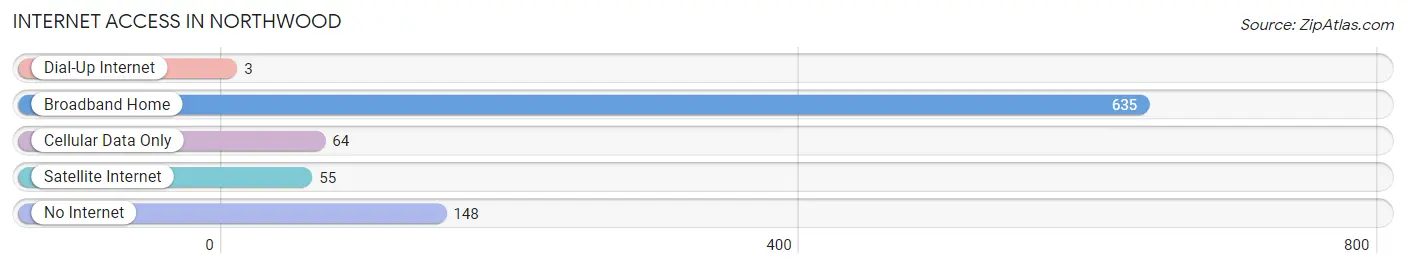
| Internet Type | # Households | % Households |
| Dial-Up Internet | 3 | 0.3% |
| Broadband Home | 635 | 72.8% |
| Cellular Data Only | 64 | 7.3% |
| Satellite Internet | 55 | 6.3% |
| No Internet | 148 | 17.0% |
| Total | 872 | 100.0% |
Northwood Summary
Northwood, Iowa is a small city located in Worth County in the northern part of the state. It is situated on the banks of the Shell Rock River, and is home to a population of just over 2,000 people. The city is known for its strong sense of community and its rural charm.
History
Northwood was founded in 1881 by a group of settlers from Norway. The city was named after the Norwegian city of Northwood, and the settlers brought with them many of the traditions and customs of their homeland. The first settlers built a sawmill and a grist mill, and the city quickly grew. By the early 1900s, Northwood had become a thriving community with a variety of businesses, including a bank, a hotel, a newspaper, and a variety of stores.
In the early 1900s, Northwood was a major center for the lumber industry. The city was home to several sawmills, and the lumber industry provided many jobs for the residents. The lumber industry declined in the mid-1900s, and the city shifted its focus to agriculture. Today, Northwood is still a major center for agriculture, and the city is home to several large farms.
Geography
Northwood is located in Worth County in the northern part of Iowa. The city is situated on the banks of the Shell Rock River, and is surrounded by rolling hills and farmland. The city is located about 30 miles north of Mason City, and about 50 miles south of the Minnesota border.
The climate in Northwood is typical of the Midwest, with hot summers and cold winters. The average temperature in the summer is around 75 degrees Fahrenheit, and the average temperature in the winter is around 25 degrees Fahrenheit. The city receives an average of about 30 inches of precipitation each year.
Economy
The economy of Northwood is largely based on agriculture. The city is home to several large farms, and the surrounding area is known for its production of corn, soybeans, and other crops. The city is also home to several manufacturing companies, including a furniture factory and a plastics factory.
In addition to agriculture and manufacturing, Northwood is home to a variety of small businesses. The city is home to several restaurants, shops, and other businesses. The city is also home to a variety of service-based businesses, including a hospital, a library, and a post office.
Demographics
As of the 2010 census, Northwood had a population of 2,068 people. The population is predominantly white, with about 95% of the population identifying as white. The median household income in Northwood is $45,000, and the median age is 43.
Northwood is a small, close-knit community. The city is known for its strong sense of community and its rural charm. The city is home to a variety of churches, and the residents take pride in their community and their heritage.
Common Questions
What is Per Capita Income in Northwood?
Per Capita income in Northwood is $30,975.
What is the Median Family Income in Northwood?
Median Family Income in Northwood is $85,288.
What is the Median Household income in Northwood?
Median Household Income in Northwood is $62,381.
What is Income or Wage Gap in Northwood?
Income or Wage Gap in Northwood is 34.8%.
Women in Northwood earn 65.2 cents for every dollar earned by a man.
What is Inequality or Gini Index in Northwood?
Inequality or Gini Index in Northwood is 0.37.
What is the Total Population of Northwood?
Total Population of Northwood is 2,142.
What is the Total Male Population of Northwood?
Total Male Population of Northwood is 1,056.
What is the Total Female Population of Northwood?
Total Female Population of Northwood is 1,086.
What is the Ratio of Males per 100 Females in Northwood?
There are 97.24 Males per 100 Females in Northwood.
What is the Ratio of Females per 100 Males in Northwood?
There are 102.84 Females per 100 Males in Northwood.
What is the Median Population Age in Northwood?
Median Population Age in Northwood is 44.4 Years.
What is the Average Family Size in Northwood
Average Family Size in Northwood is 2.9 People.
What is the Average Household Size in Northwood
Average Household Size in Northwood is 2.4 People.
How Large is the Labor Force in Northwood?
There are 1,153 People in the Labor Forcein in Northwood.
What is the Percentage of People in the Labor Force in Northwood?
66.9% of People are in the Labor Force in Northwood.
What is the Unemployment Rate in Northwood?
Unemployment Rate in Northwood is 5.6%.