Stem, NC Map & Demographics
Stem Map
Stem Overview
$32,211
PER CAPITA INCOME
$86,944
AVG FAMILY INCOME
$82,212
AVG HOUSEHOLD INCOME
20.1%
WAGE / INCOME GAP [ % ]
79.9¢/ $1
WAGE / INCOME GAP [ $ ]
0.28
INEQUALITY / GINI INDEX
1,071
TOTAL POPULATION
438
MALE POPULATION
633
FEMALE POPULATION
69.19
MALES / 100 FEMALES
144.52
FEMALES / 100 MALES
29.1
MEDIAN AGE
3.1
AVG FAMILY SIZE
2.8
AVG HOUSEHOLD SIZE
576
LABOR FORCE [ PEOPLE ]
77.7%
PERCENT IN LABOR FORCE
3.4%
UNEMPLOYMENT RATE
Stem Zip Codes
Stem Area Codes
Income in Stem
Income Overview in Stem
Per Capita Income in Stem is $32,211, while median incomes of families and households are $86,944 and $82,212 respectively.
| Characteristic | Number | Measure |
| Per Capita Income | 1,071 | $32,211 |
| Median Family Income | 304 | $86,944 |
| Mean Family Income | 304 | $91,152 |
| Median Household Income | 383 | $82,212 |
| Mean Household Income | 383 | $87,954 |
| Income Deficit | 304 | $0 |
| Wage / Income Gap (%) | 1,071 | 20.11% |
| Wage / Income Gap ($) | 1,071 | 79.89¢ per $1 |
| Gini / Inequality Index | 1,071 | 0.28 |
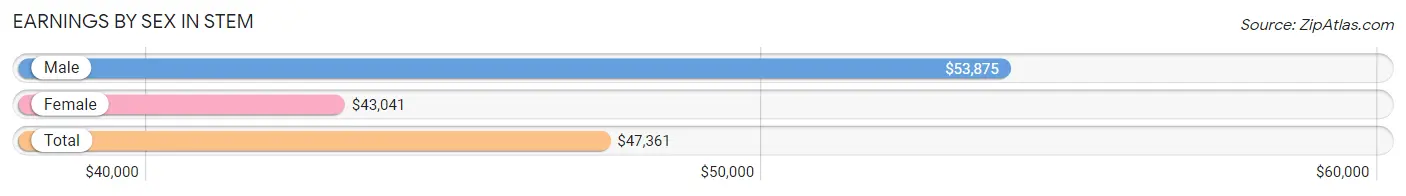
Earnings by Sex in Stem
Average Earnings in Stem are $47,361, $53,875 for men and $43,041 for women, a difference of 20.1%.
| Sex | Number | Average Earnings |
| Male | 236 (41.3%) | $53,875 |
| Female | 336 (58.7%) | $43,041 |
| Total | 572 (100.0%) | $47,361 |
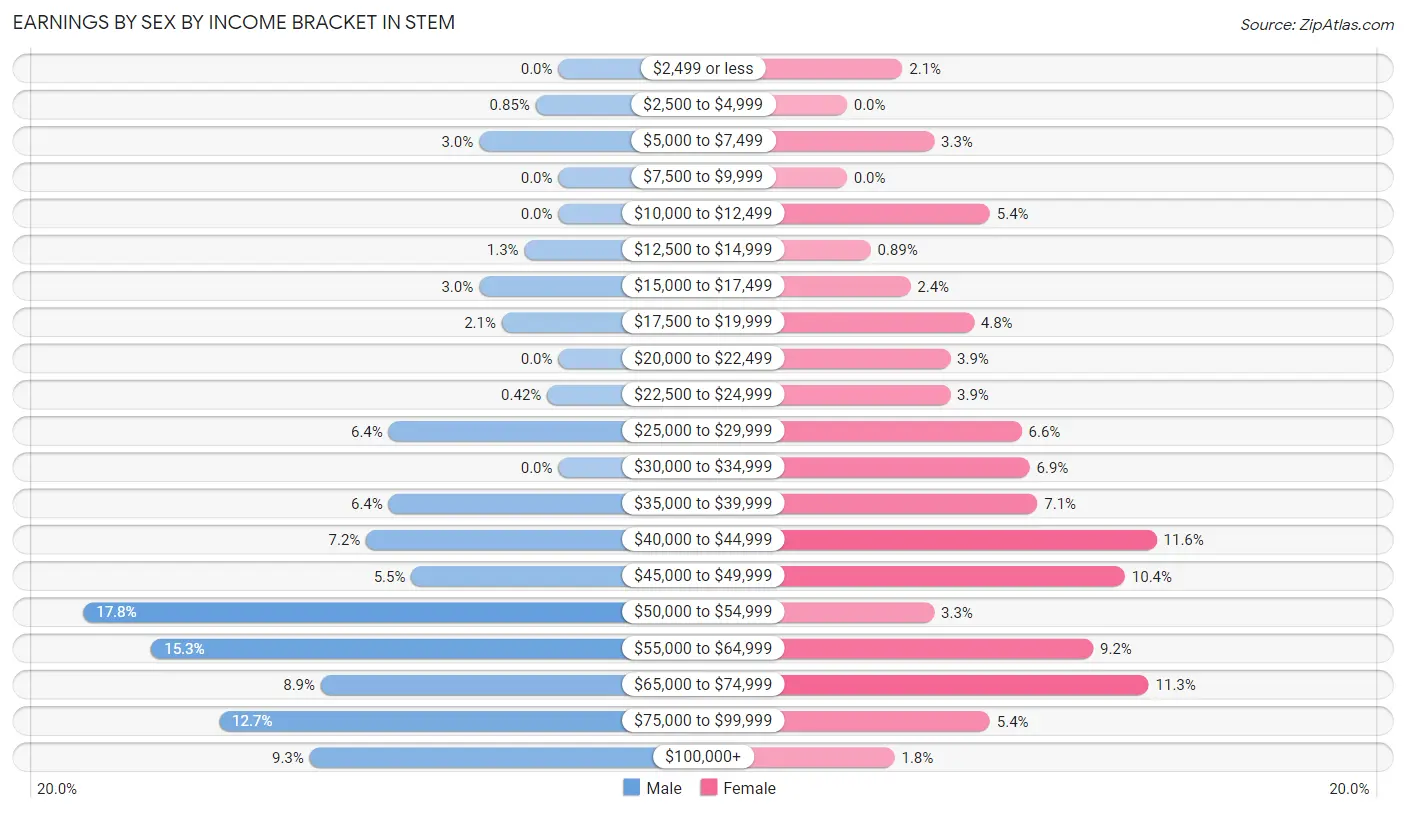
Earnings by Sex by Income Bracket in Stem
The most common earnings brackets in Stem are $50,000 to $54,999 for men (42 | 17.8%) and $40,000 to $44,999 for women (39 | 11.6%).
| Income | Male | Female |
| $2,499 or less | 0 (0.0%) | 7 (2.1%) |
| $2,500 to $4,999 | 2 (0.9%) | 0 (0.0%) |
| $5,000 to $7,499 | 7 (3.0%) | 11 (3.3%) |
| $7,500 to $9,999 | 0 (0.0%) | 0 (0.0%) |
| $10,000 to $12,499 | 0 (0.0%) | 18 (5.4%) |
| $12,500 to $14,999 | 3 (1.3%) | 3 (0.9%) |
| $15,000 to $17,499 | 7 (3.0%) | 8 (2.4%) |
| $17,500 to $19,999 | 5 (2.1%) | 16 (4.8%) |
| $20,000 to $22,499 | 0 (0.0%) | 13 (3.9%) |
| $22,500 to $24,999 | 1 (0.4%) | 13 (3.9%) |
| $25,000 to $29,999 | 15 (6.4%) | 22 (6.6%) |
| $30,000 to $34,999 | 0 (0.0%) | 23 (6.9%) |
| $35,000 to $39,999 | 15 (6.4%) | 24 (7.1%) |
| $40,000 to $44,999 | 17 (7.2%) | 39 (11.6%) |
| $45,000 to $49,999 | 13 (5.5%) | 35 (10.4%) |
| $50,000 to $54,999 | 42 (17.8%) | 11 (3.3%) |
| $55,000 to $64,999 | 36 (15.2%) | 31 (9.2%) |
| $65,000 to $74,999 | 21 (8.9%) | 38 (11.3%) |
| $75,000 to $99,999 | 30 (12.7%) | 18 (5.4%) |
| $100,000+ | 22 (9.3%) | 6 (1.8%) |
| Total | 236 (100.0%) | 336 (100.0%) |
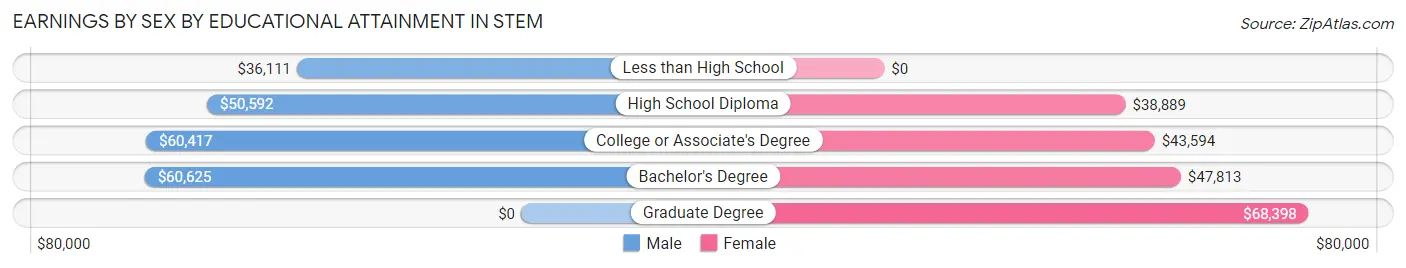
Earnings by Sex by Educational Attainment in Stem
Average earnings in Stem are $53,625 for men and $45,391 for women, a difference of 15.3%. Men with an educational attainment of bachelor's degree enjoy the highest average annual earnings of $60,625, while those with less than high school education earn the least with $36,111. Women with an educational attainment of graduate degree earn the most with the average annual earnings of $68,398, while those with high school diploma education have the smallest earnings of $38,889.
| Educational Attainment | Male Income | Female Income |
| Less than High School | $36,111 | $0 |
| High School Diploma | $50,592 | $38,889 |
| College or Associate's Degree | $60,417 | $43,594 |
| Bachelor's Degree | $60,625 | $47,813 |
| Graduate Degree | - | - |
| Total | $53,625 | $45,391 |
Family Income in Stem
Family Income Brackets in Stem
According to the Stem family income data, there are 95 families falling into the $100,000 to $149,999 income range, which is the most common income bracket and makes up 31.2% of all families.
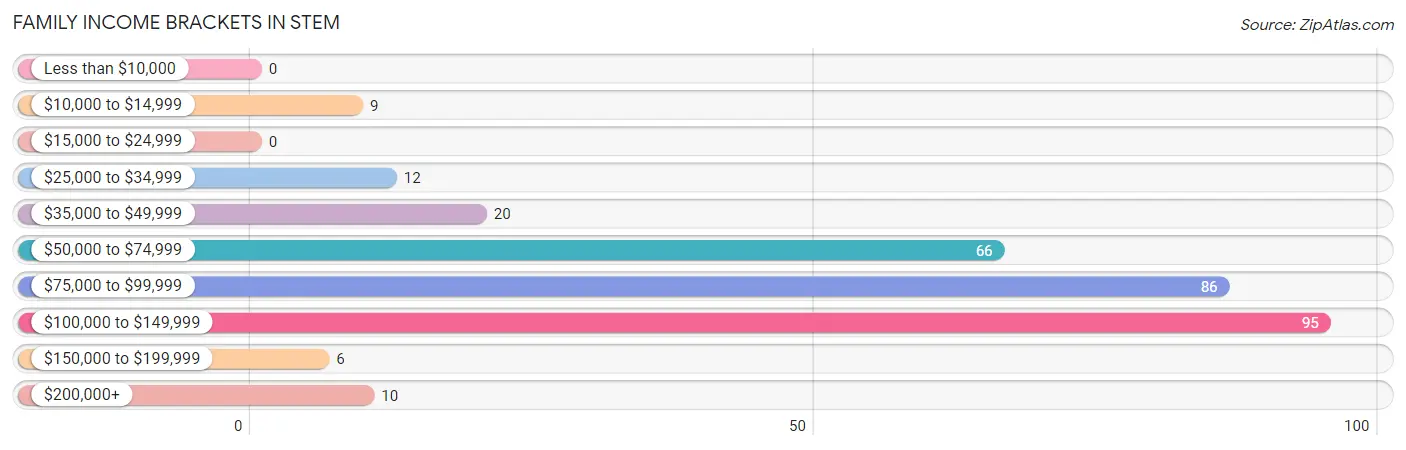
| Income Bracket | # Families | % Families |
| Less than $10,000 | 0 | 0.0% |
| $10,000 to $14,999 | 9 | 3.0% |
| $15,000 to $24,999 | 0 | 0.0% |
| $25,000 to $34,999 | 12 | 3.9% |
| $35,000 to $49,999 | 20 | 6.6% |
| $50,000 to $74,999 | 66 | 21.7% |
| $75,000 to $99,999 | 86 | 28.3% |
| $100,000 to $149,999 | 95 | 31.3% |
| $150,000 to $199,999 | 6 | 2.0% |
| $200,000+ | 10 | 3.3% |
Family Income by Famaliy Size in Stem
6-person families (10 | 3.3%) account for the highest median family income in Stem with $142,917 per family, while 2-person families (136 | 44.7%) have the highest median income of $39,792 per family member.
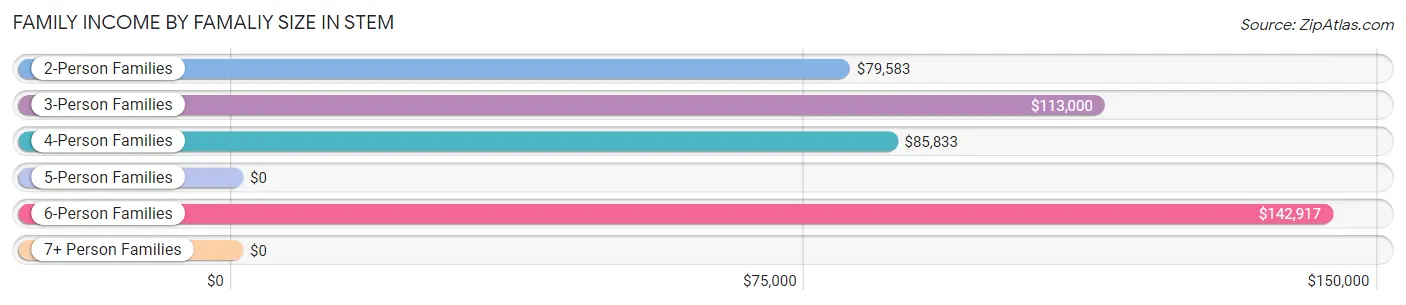
| Income Bracket | # Families | Median Income |
| 2-Person Families | 136 (44.7%) | $79,583 |
| 3-Person Families | 116 (38.2%) | $113,000 |
| 4-Person Families | 38 (12.5%) | $85,833 |
| 5-Person Families | 2 (0.7%) | $0 |
| 6-Person Families | 10 (3.3%) | $142,917 |
| 7+ Person Families | 2 (0.7%) | $0 |
| Total | 304 (100.0%) | $86,944 |
Family Income by Number of Earners in Stem
The median family income in Stem is $86,944, with families comprising 3+ earners (19) having the highest median family income of $120,625, while families with 1 earner (99) have the lowest median family income of $51,750, accounting for 6.2% and 32.6% of families, respectively.
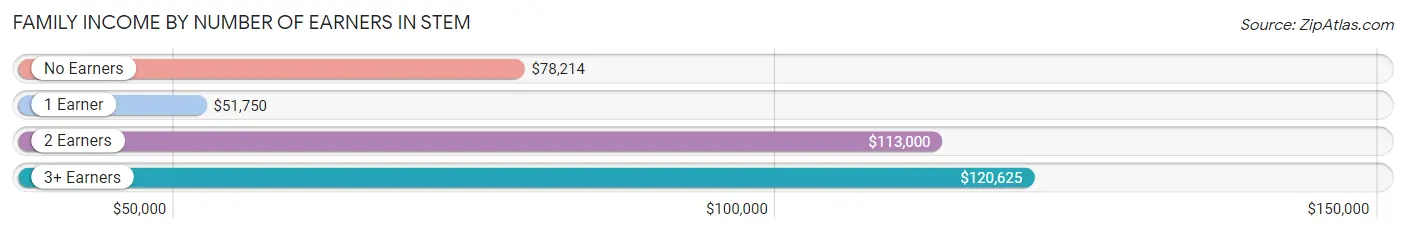
| Number of Earners | # Families | Median Income |
| No Earners | 20 (6.6%) | $78,214 |
| 1 Earner | 99 (32.6%) | $51,750 |
| 2 Earners | 166 (54.6%) | $113,000 |
| 3+ Earners | 19 (6.2%) | $120,625 |
| Total | 304 (100.0%) | $86,944 |
Household Income in Stem
Household Income Brackets in Stem
With 113 households falling in the category, the $75,000 to $99,999 income range is the most frequent in Stem, accounting for 29.5% of all households.
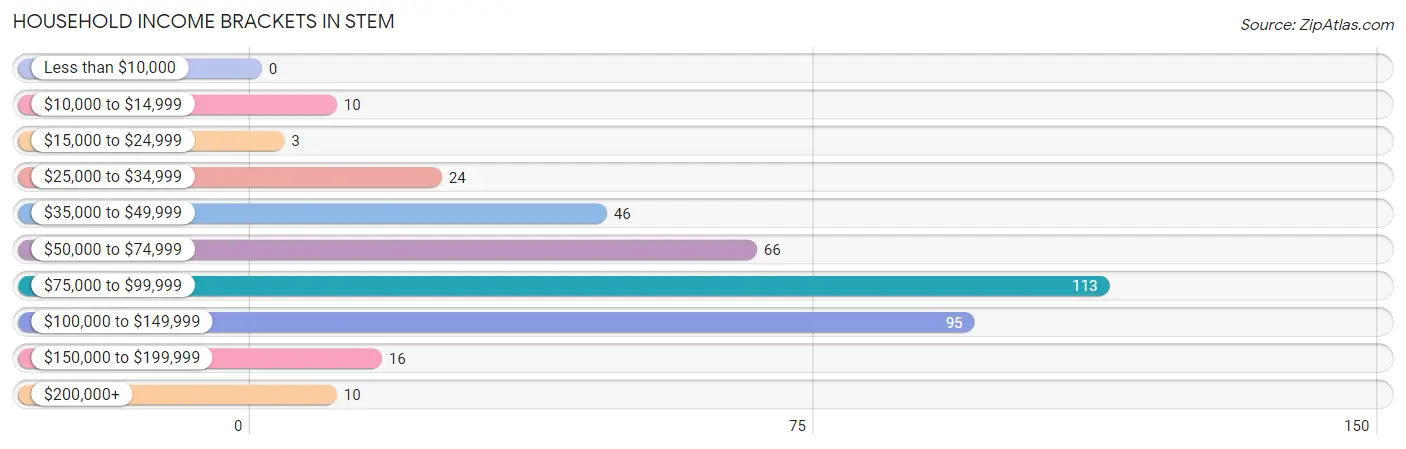
| Income Bracket | # Households | % Households |
| Less than $10,000 | 0 | 0.0% |
| $10,000 to $14,999 | 10 | 2.6% |
| $15,000 to $24,999 | 3 | 0.8% |
| $25,000 to $34,999 | 24 | 6.3% |
| $35,000 to $49,999 | 46 | 12.0% |
| $50,000 to $74,999 | 66 | 17.2% |
| $75,000 to $99,999 | 113 | 29.5% |
| $100,000 to $149,999 | 95 | 24.8% |
| $150,000 to $199,999 | 16 | 4.2% |
| $200,000+ | 10 | 2.6% |
Household Income by Householder Age in Stem
The median household income in Stem is $82,212, with the highest median household income of $185,313 found in the 15 to 24 years age bracket for the primary householder. A total of 14 households (3.7%) fall into this category. Meanwhile, the 65+ years age bracket for the primary householder has the lowest median household income of $66,667, with 64 households (16.7%) in this group.
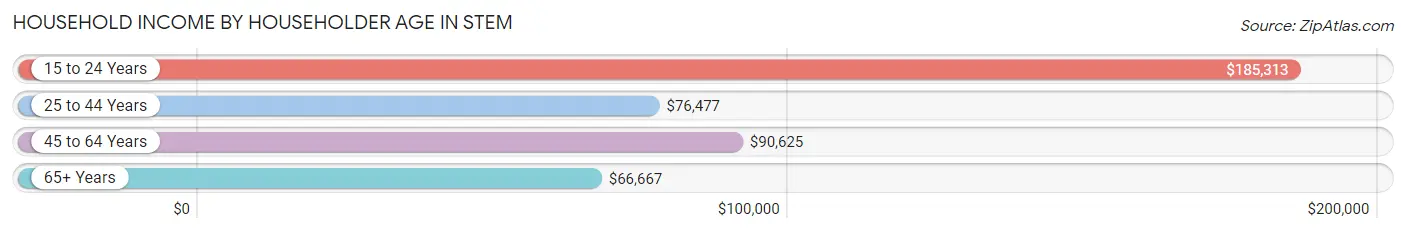
| Income Bracket | # Households | Median Income |
| 15 to 24 Years | 14 (3.7%) | $185,313 |
| 25 to 44 Years | 173 (45.2%) | $76,477 |
| 45 to 64 Years | 132 (34.5%) | $90,625 |
| 65+ Years | 64 (16.7%) | $66,667 |
| Total | 383 (100.0%) | $82,212 |
Poverty in Stem
Income Below Poverty by Sex and Age in Stem
With 2.1% poverty level for males and 2.4% for females among the residents of Stem, 16 and 17 year old males and 45 to 54 year old females are the most vulnerable to poverty, with 6 males (100.0%) and 8 females (11.9%) in their respective age groups living below the poverty level.
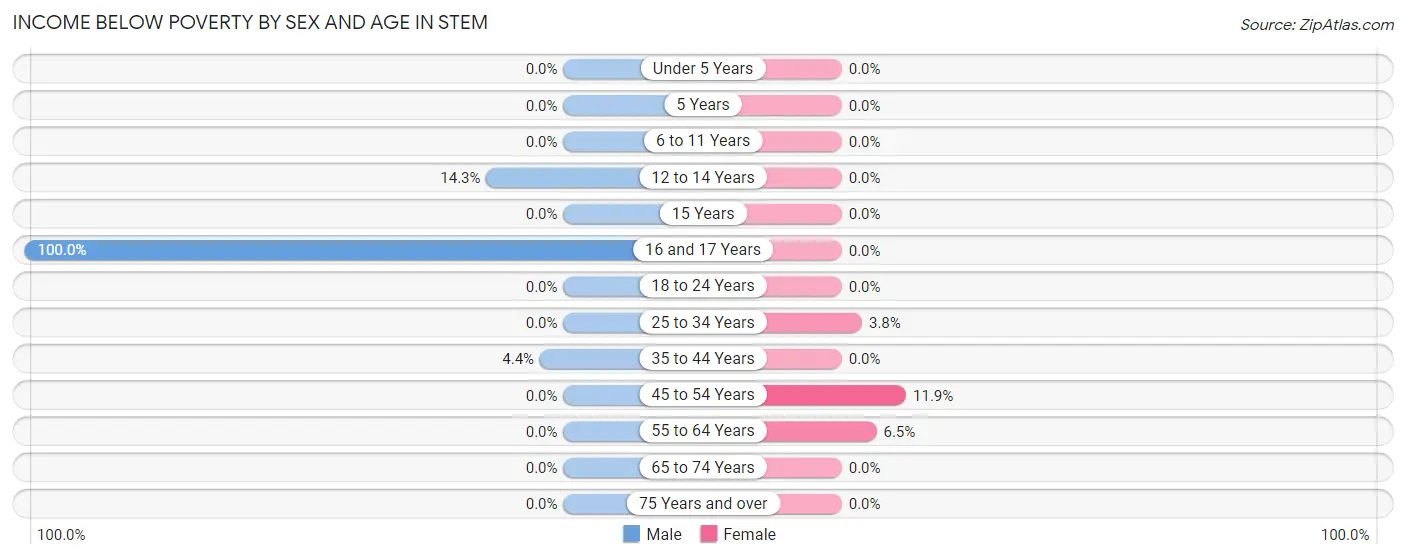
| Age Bracket | Male | Female |
| Under 5 Years | 0 (0.0%) | 0 (0.0%) |
| 5 Years | 0 (0.0%) | 0 (0.0%) |
| 6 to 11 Years | 0 (0.0%) | 0 (0.0%) |
| 12 to 14 Years | 1 (14.3%) | 0 (0.0%) |
| 15 Years | 0 (0.0%) | 0 (0.0%) |
| 16 and 17 Years | 6 (100.0%) | 0 (0.0%) |
| 18 to 24 Years | 0 (0.0%) | 0 (0.0%) |
| 25 to 34 Years | 0 (0.0%) | 5 (3.8%) |
| 35 to 44 Years | 2 (4.3%) | 0 (0.0%) |
| 45 to 54 Years | 0 (0.0%) | 8 (11.9%) |
| 55 to 64 Years | 0 (0.0%) | 2 (6.5%) |
| 65 to 74 Years | 0 (0.0%) | 0 (0.0%) |
| 75 Years and over | 0 (0.0%) | 0 (0.0%) |
| Total | 9 (2.1%) | 15 (2.4%) |
Income Above Poverty by Sex and Age in Stem
According to the poverty statistics in Stem, males aged under 5 years and females aged under 5 years are the age groups that are most secure financially, with 100.0% of males and 100.0% of females in these age groups living above the poverty line.
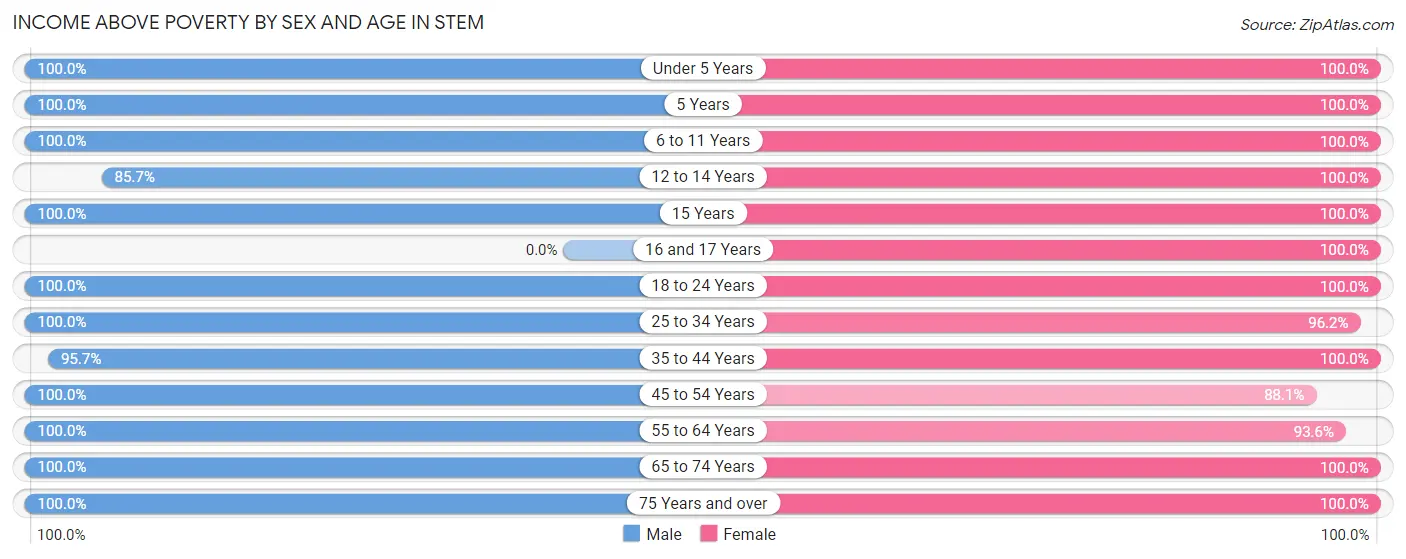
| Age Bracket | Male | Female |
| Under 5 Years | 67 (100.0%) | 46 (100.0%) |
| 5 Years | 5 (100.0%) | 2 (100.0%) |
| 6 to 11 Years | 68 (100.0%) | 97 (100.0%) |
| 12 to 14 Years | 6 (85.7%) | 19 (100.0%) |
| 15 Years | 14 (100.0%) | 2 (100.0%) |
| 16 and 17 Years | 0 (0.0%) | 13 (100.0%) |
| 18 to 24 Years | 18 (100.0%) | 84 (100.0%) |
| 25 to 34 Years | 57 (100.0%) | 128 (96.2%) |
| 35 to 44 Years | 44 (95.7%) | 71 (100.0%) |
| 45 to 54 Years | 85 (100.0%) | 59 (88.1%) |
| 55 to 64 Years | 30 (100.0%) | 29 (93.5%) |
| 65 to 74 Years | 25 (100.0%) | 29 (100.0%) |
| 75 Years and over | 10 (100.0%) | 36 (100.0%) |
| Total | 429 (98.0%) | 615 (97.6%) |
Income Below Poverty Among Married-Couple Families in Stem
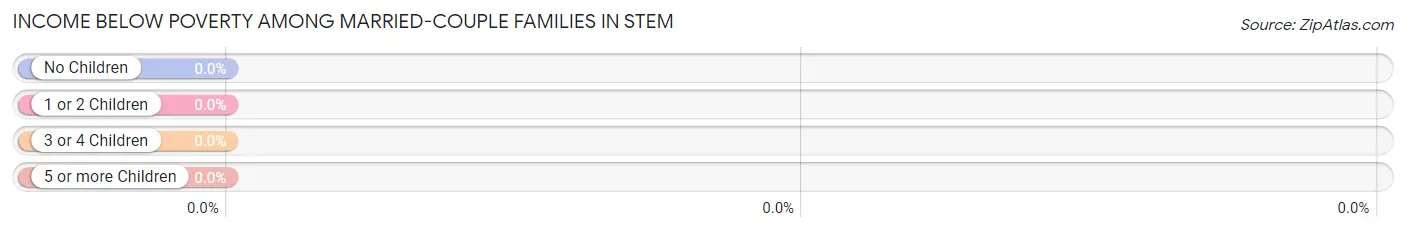
| Children | Above Poverty | Below Poverty |
| No Children | 109 (100.0%) | 0 (0.0%) |
| 1 or 2 Children | 84 (100.0%) | 0 (0.0%) |
| 3 or 4 Children | 6 (100.0%) | 0 (0.0%) |
| 5 or more Children | 2 (100.0%) | 0 (0.0%) |
| Total | 201 (100.0%) | 0 (0.0%) |
Income Below Poverty Among Single-Parent Households in Stem
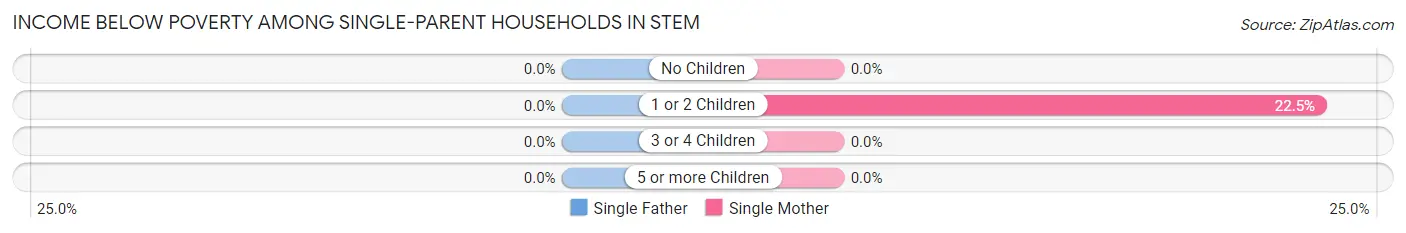
| Children | Single Father | Single Mother |
| No Children | 0 (0.0%) | 0 (0.0%) |
| 1 or 2 Children | 0 (0.0%) | 9 (22.5%) |
| 3 or 4 Children | 0 (0.0%) | 0 (0.0%) |
| 5 or more Children | 0 (0.0%) | 0 (0.0%) |
| Total | 0 (0.0%) | 9 (11.7%) |
Income Below Poverty Among Married-Couple vs Single-Parent Households in Stem
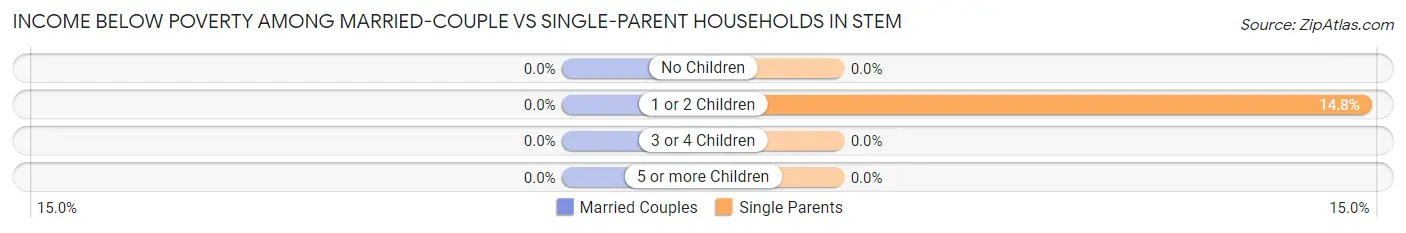
| Children | Married-Couple Families | Single-Parent Households |
| No Children | 0 (0.0%) | 0 (0.0%) |
| 1 or 2 Children | 0 (0.0%) | 9 (14.7%) |
| 3 or 4 Children | 0 (0.0%) | 0 (0.0%) |
| 5 or more Children | 0 (0.0%) | 0 (0.0%) |
| Total | 0 (0.0%) | 9 (8.7%) |
Race in Stem
The most populous races in Stem are White / Caucasian (566 | 52.8%), Black / African American (349 | 32.6%), and Hispanic or Latino (109 | 10.2%).
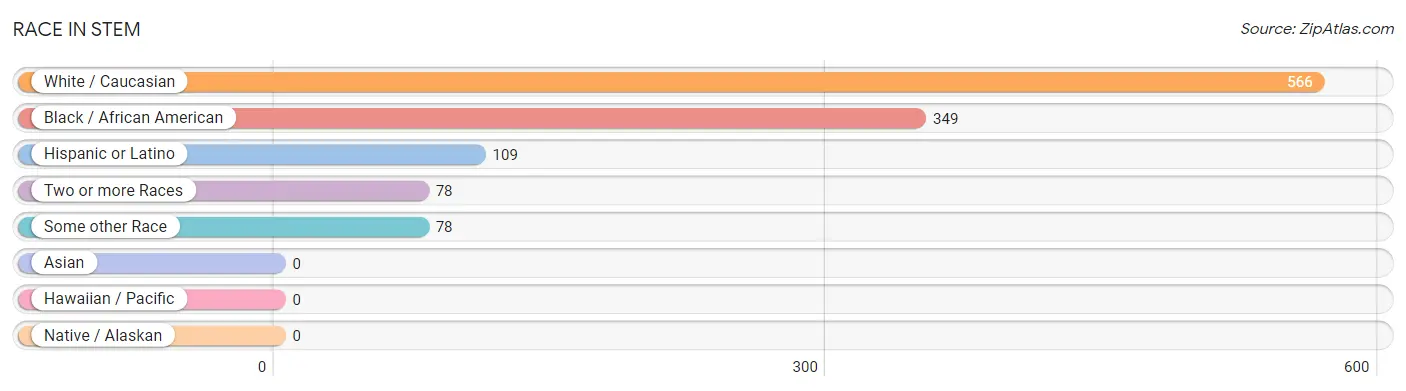
| Race | # Population | % Population |
| Asian | 0 | 0.0% |
| Black / African American | 349 | 32.6% |
| Hawaiian / Pacific | 0 | 0.0% |
| Hispanic or Latino | 109 | 10.2% |
| Native / Alaskan | 0 | 0.0% |
| White / Caucasian | 566 | 52.8% |
| Two or more Races | 78 | 7.3% |
| Some other Race | 78 | 7.3% |
| Total | 1,071 | 100.0% |
Ancestry in Stem
The most populous ancestries reported in Stem are English (110 | 10.3%), Mexican (102 | 9.5%), German (85 | 7.9%), Irish (64 | 6.0%), and American (39 | 3.6%), together accounting for 37.3% of all Stem residents.
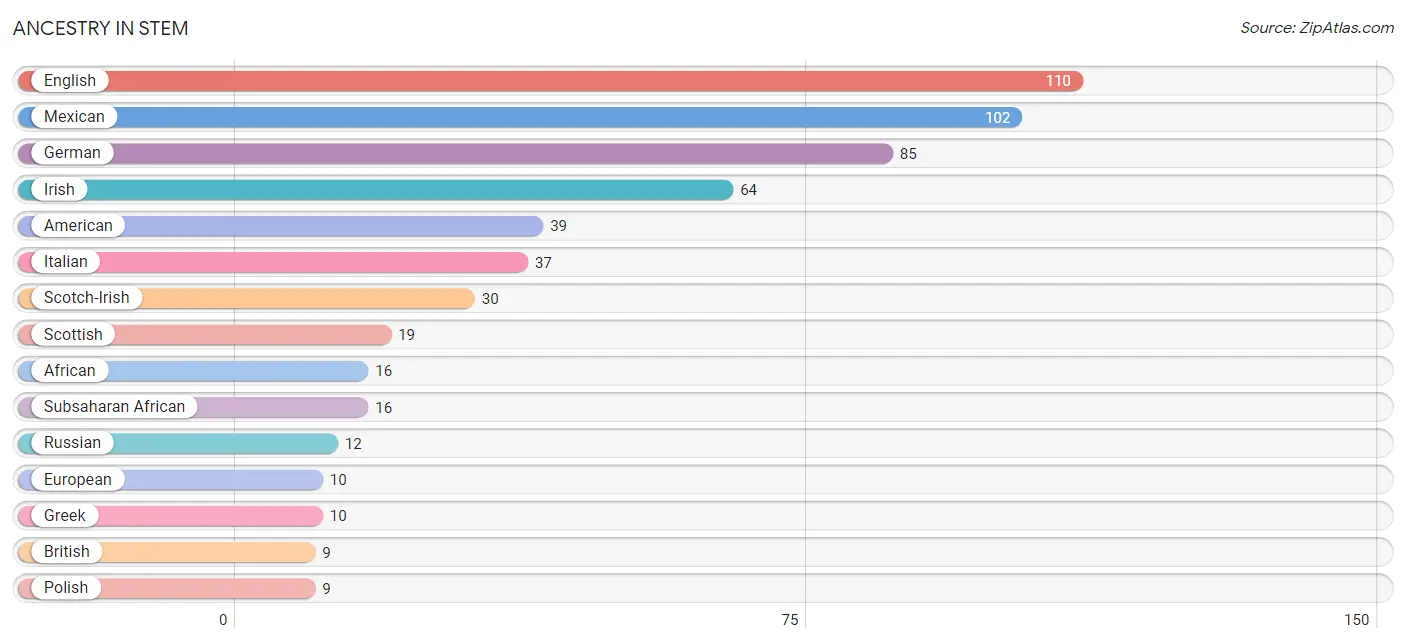
| Ancestry | # Population | % Population |
| African | 16 | 1.5% |
| American | 39 | 3.6% |
| Austrian | 2 | 0.2% |
| Belgian | 5 | 0.5% |
| Blackfeet | 2 | 0.2% |
| British | 9 | 0.8% |
| Burmese | 1 | 0.1% |
| Czech | 8 | 0.7% |
| Czechoslovakian | 5 | 0.5% |
| Dominican | 2 | 0.2% |
| Dutch | 5 | 0.5% |
| English | 110 | 10.3% |
| European | 10 | 0.9% |
| French | 2 | 0.2% |
| German | 85 | 7.9% |
| Greek | 10 | 0.9% |
| Irish | 64 | 6.0% |
| Italian | 37 | 3.5% |
| Mexican | 102 | 9.5% |
| Northern European | 2 | 0.2% |
| Norwegian | 3 | 0.3% |
| Polish | 9 | 0.8% |
| Puerto Rican | 2 | 0.2% |
| Russian | 12 | 1.1% |
| Scotch-Irish | 30 | 2.8% |
| Scottish | 19 | 1.8% |
| Spanish | 3 | 0.3% |
| Subsaharan African | 16 | 1.5% |
| Ukrainian | 2 | 0.2% |
| Welsh | 1 | 0.1% | View All 30 Rows |
Immigrants in Stem
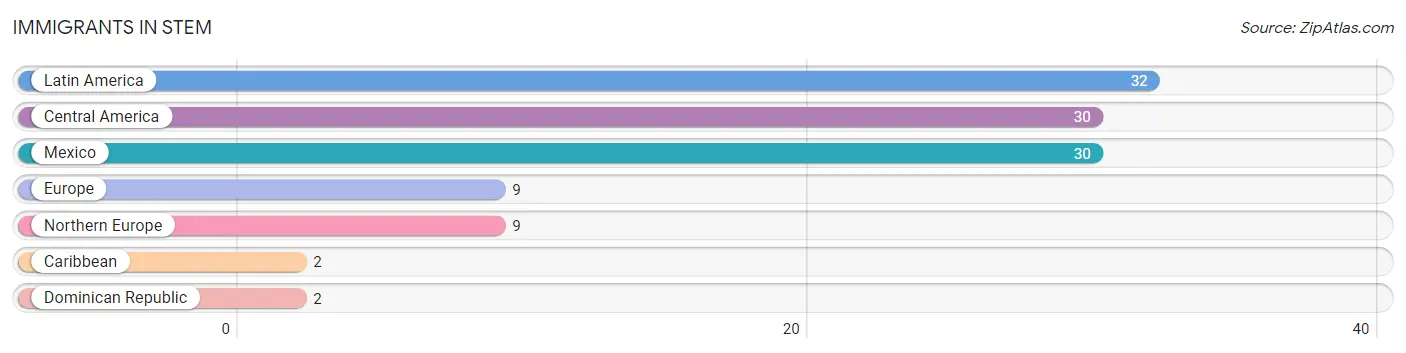
The most numerous immigrant groups reported in Stem came from Latin America (32 | 3.0%), Central America (30 | 2.8%), Mexico (30 | 2.8%), Europe (9 | 0.8%), and Northern Europe (9 | 0.8%), together accounting for 10.3% of all Stem residents.
| Immigration Origin | # Population | % Population |
| Caribbean | 2 | 0.2% |
| Central America | 30 | 2.8% |
| Dominican Republic | 2 | 0.2% |
| Europe | 9 | 0.8% |
| Latin America | 32 | 3.0% |
| Mexico | 30 | 2.8% |
| Northern Europe | 9 | 0.8% | View All 7 Rows |
Sex and Age in Stem
Sex and Age in Stem
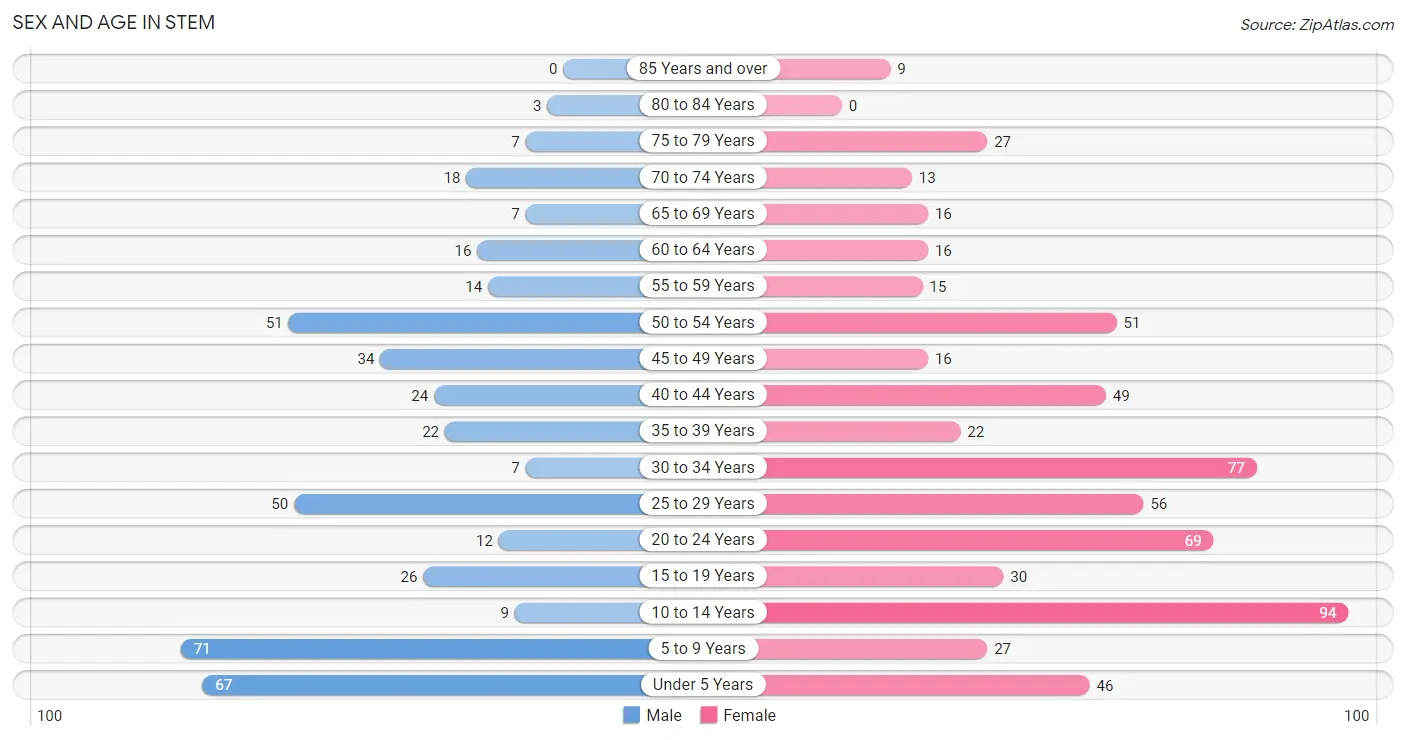
The most populous age groups in Stem are 5 to 9 Years (71 | 16.2%) for men and 10 to 14 Years (94 | 14.8%) for women.
| Age Bracket | Male | Female |
| Under 5 Years | 67 (15.3%) | 46 (7.3%) |
| 5 to 9 Years | 71 (16.2%) | 27 (4.3%) |
| 10 to 14 Years | 9 (2.1%) | 94 (14.8%) |
| 15 to 19 Years | 26 (5.9%) | 30 (4.7%) |
| 20 to 24 Years | 12 (2.7%) | 69 (10.9%) |
| 25 to 29 Years | 50 (11.4%) | 56 (8.8%) |
| 30 to 34 Years | 7 (1.6%) | 77 (12.2%) |
| 35 to 39 Years | 22 (5.0%) | 22 (3.5%) |
| 40 to 44 Years | 24 (5.5%) | 49 (7.7%) |
| 45 to 49 Years | 34 (7.8%) | 16 (2.5%) |
| 50 to 54 Years | 51 (11.6%) | 51 (8.1%) |
| 55 to 59 Years | 14 (3.2%) | 15 (2.4%) |
| 60 to 64 Years | 16 (3.6%) | 16 (2.5%) |
| 65 to 69 Years | 7 (1.6%) | 16 (2.5%) |
| 70 to 74 Years | 18 (4.1%) | 13 (2.1%) |
| 75 to 79 Years | 7 (1.6%) | 27 (4.3%) |
| 80 to 84 Years | 3 (0.7%) | 0 (0.0%) |
| 85 Years and over | 0 (0.0%) | 9 (1.4%) |
| Total | 438 (100.0%) | 633 (100.0%) |
Families and Households in Stem
Median Family Size in Stem
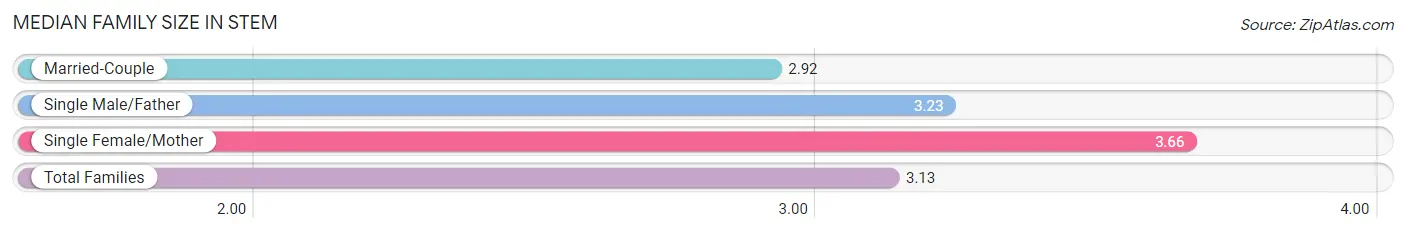
The median family size in Stem is 3.13 persons per family, with single female/mother families (77 | 25.3%) accounting for the largest median family size of 3.66 persons per family. On the other hand, married-couple families (201 | 66.1%) represent the smallest median family size with 2.92 persons per family.
| Family Type | # Families | Family Size |
| Married-Couple | 201 (66.1%) | 2.92 |
| Single Male/Father | 26 (8.6%) | 3.23 |
| Single Female/Mother | 77 (25.3%) | 3.66 |
| Total Families | 304 (100.0%) | 3.13 |
Median Household Size in Stem
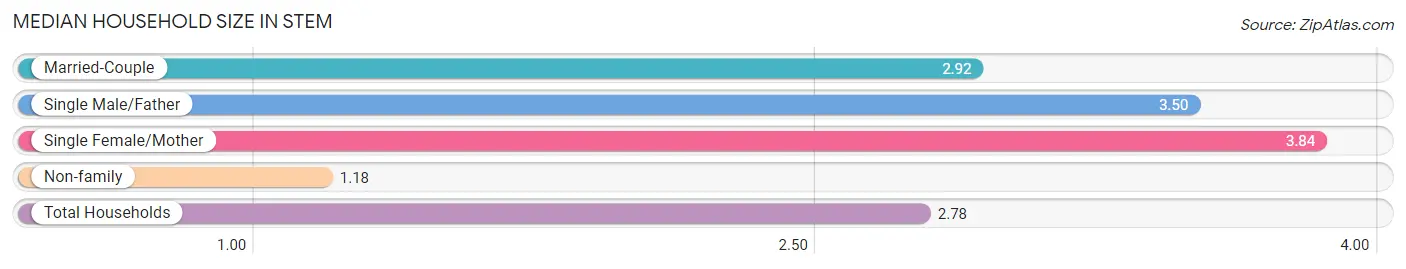
The median household size in Stem is 2.78 persons per household, with single female/mother households (77 | 20.1%) accounting for the largest median household size of 3.84 persons per household. non-family households (79 | 20.6%) represent the smallest median household size with 1.18 persons per household.
| Household Type | # Households | Household Size |
| Married-Couple | 201 (52.5%) | 2.92 |
| Single Male/Father | 26 (6.8%) | 3.50 |
| Single Female/Mother | 77 (20.1%) | 3.84 |
| Non-family | 79 (20.6%) | 1.18 |
| Total Households | 383 (100.0%) | 2.78 |
Household Size by Marriage Status in Stem
Out of a total of 383 households in Stem, 304 (79.4%) are family households, while 79 (20.6%) are nonfamily households. The most numerous type of family households are 2-person households, comprising 126, and the most common type of nonfamily households are 1-person households, comprising 68.
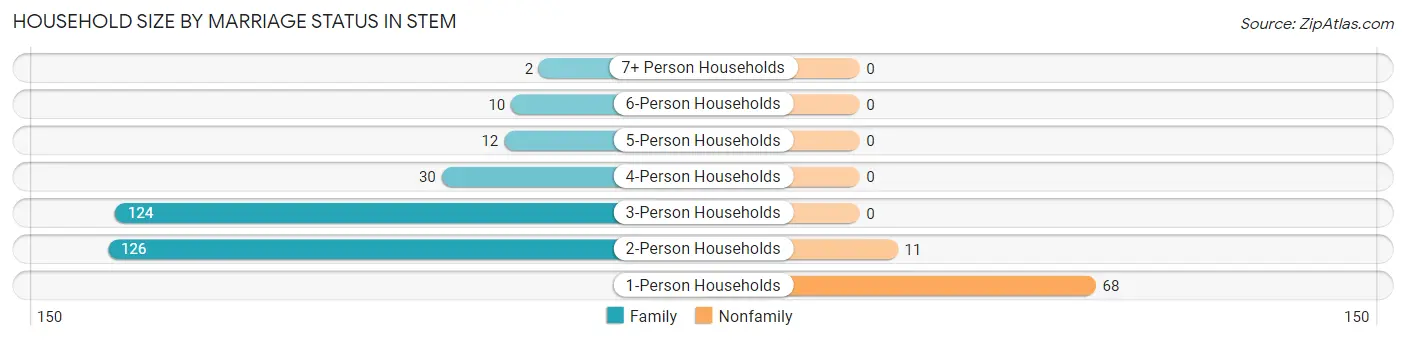
| Household Size | Family Households | Nonfamily Households |
| 1-Person Households | - | 68 (17.7%) |
| 2-Person Households | 126 (32.9%) | 11 (2.9%) |
| 3-Person Households | 124 (32.4%) | 0 (0.0%) |
| 4-Person Households | 30 (7.8%) | 0 (0.0%) |
| 5-Person Households | 12 (3.1%) | 0 (0.0%) |
| 6-Person Households | 10 (2.6%) | 0 (0.0%) |
| 7+ Person Households | 2 (0.5%) | 0 (0.0%) |
| Total | 304 (79.4%) | 79 (20.6%) |
Female Fertility in Stem
Fertility by Age in Stem
Average fertility rate in Stem is 130.0 births per 1,000 women. Women in the age bracket of 20 to 34 years have the highest fertility rate with 208.0 births per 1,000 women. Women in the age bracket of 20 to 34 years acount for 100.0% of all women with births.
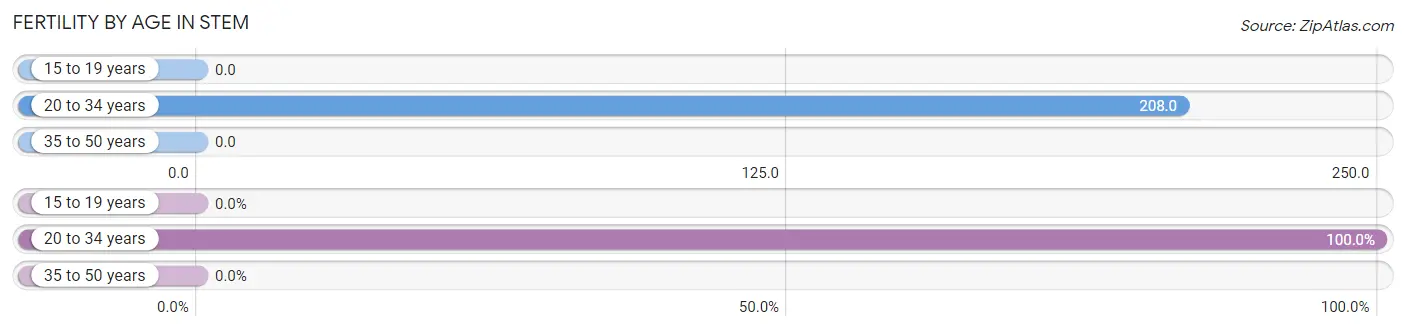
| Age Bracket | Women with Births | Births / 1,000 Women |
| 15 to 19 years | 0 (0.0%) | 0.0 |
| 20 to 34 years | 42 (100.0%) | 208.0 |
| 35 to 50 years | 0 (0.0%) | 0.0 |
| Total | 42 (100.0%) | 130.0 |
Fertility by Age by Marriage Status in Stem
57.1% of women with births (42) in Stem are married. The highest percentage of unmarried women with births falls into 20 to 34 years age bracket with 42.9% of them unmarried at the time of birth, while the lowest percentage of unmarried women with births belong to 20 to 34 years age bracket with 42.9% of them unmarried.
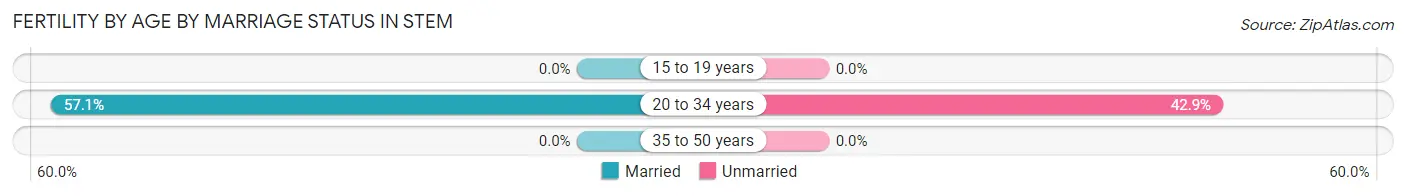
| Age Bracket | Married | Unmarried |
| 15 to 19 years | 0 (0.0%) | 0 (0.0%) |
| 20 to 34 years | 24 (57.1%) | 18 (42.9%) |
| 35 to 50 years | 0 (0.0%) | 0 (0.0%) |
| Total | 24 (57.1%) | 18 (42.9%) |
Fertility by Education in Stem
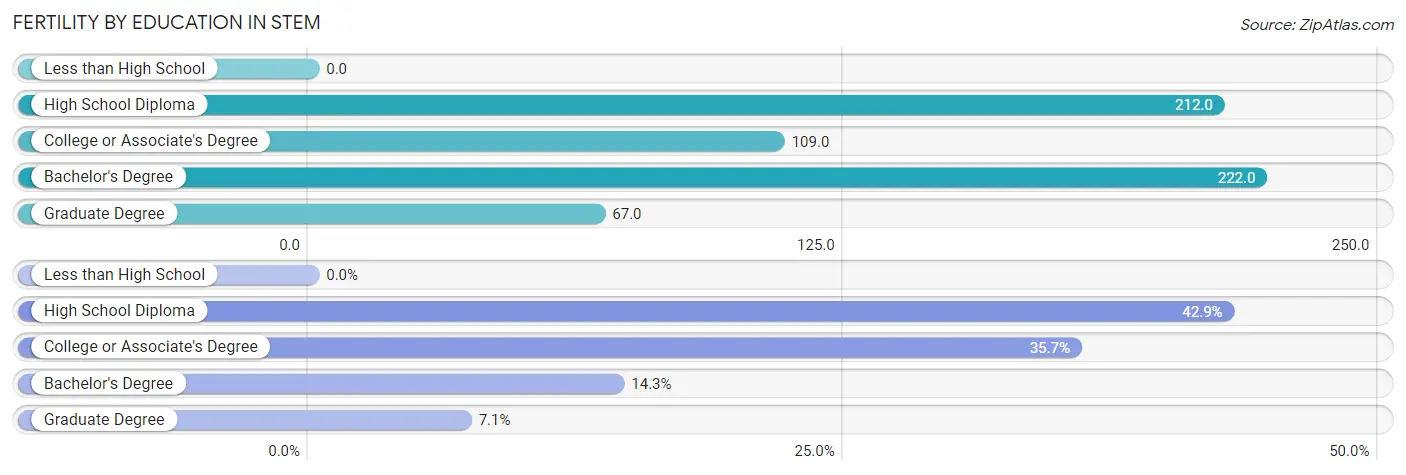
| Educational Attainment | Women with Births | Births / 1,000 Women |
| Less than High School | 0 (0.0%) | 0.0 |
| High School Diploma | 18 (42.9%) | 212.0 |
| College or Associate's Degree | 15 (35.7%) | 109.0 |
| Bachelor's Degree | 6 (14.3%) | 222.0 |
| Graduate Degree | 3 (7.1%) | 67.0 |
| Total | 42 (100.0%) | 130.0 |
Fertility by Education by Marriage Status in Stem
42.9% of women with births in Stem are unmarried. Women with the educational attainment of college or associate's degree are most likely to be married with 100.0% of them married at childbirth, while women with the educational attainment of high school diploma are least likely to be married with 100.0% of them unmarried at childbirth.
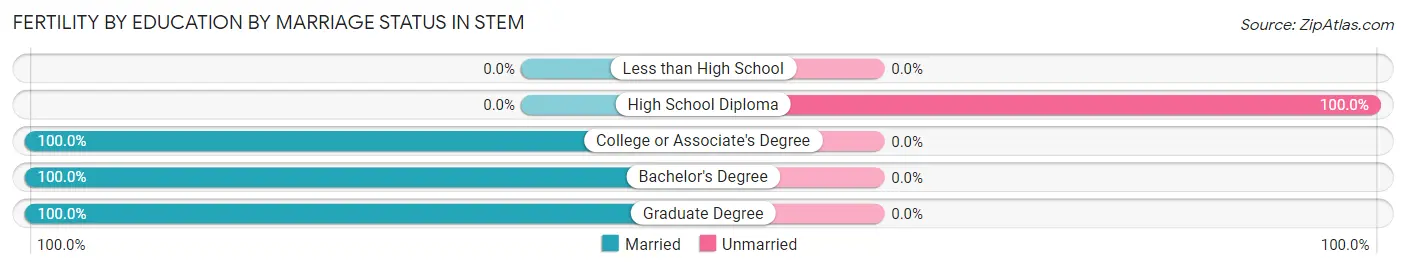
| Educational Attainment | Married | Unmarried |
| Less than High School | 0 (0.0%) | 0 (0.0%) |
| High School Diploma | 0 (0.0%) | 18 (100.0%) |
| College or Associate's Degree | 15 (100.0%) | 0 (0.0%) |
| Bachelor's Degree | 6 (100.0%) | 0 (0.0%) |
| Graduate Degree | 3 (100.0%) | 0 (0.0%) |
| Total | 24 (57.1%) | 18 (42.9%) |
Employment Characteristics in Stem
Employment by Class of Employer in Stem
Among the 549 employed individuals in Stem, private company employees (271 | 49.4%), state government employees (118 | 21.5%), and local government employees (59 | 10.7%) make up the most common classes of employment.
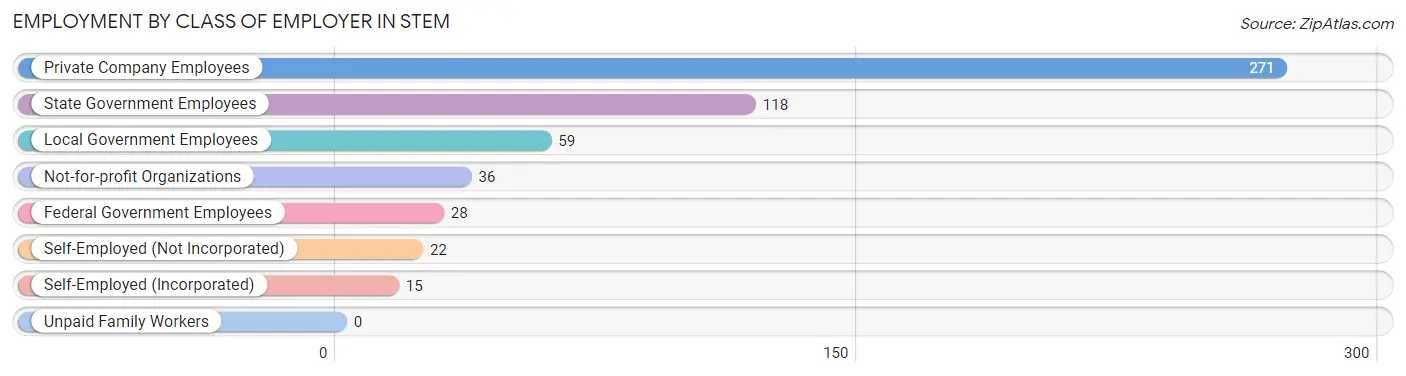
| Employer Class | # Employees | % Employees |
| Private Company Employees | 271 | 49.4% |
| Self-Employed (Incorporated) | 15 | 2.7% |
| Self-Employed (Not Incorporated) | 22 | 4.0% |
| Not-for-profit Organizations | 36 | 6.6% |
| Local Government Employees | 59 | 10.7% |
| State Government Employees | 118 | 21.5% |
| Federal Government Employees | 28 | 5.1% |
| Unpaid Family Workers | 0 | 0.0% |
| Total | 549 | 100.0% |
Employment Status by Age in Stem
According to the labor force statistics for Stem, out of the total population over 16 years of age (741), 77.7% or 576 individuals are in the labor force, with 3.4% or 20 of them unemployed. The age group with the highest labor force participation rate is 45 to 54 years, with 100.0% or 152 individuals in the labor force. Within the labor force, the 65 to 74 years age range has the highest percentage of unemployed individuals, with 38.1% or 8 of them being unemployed.
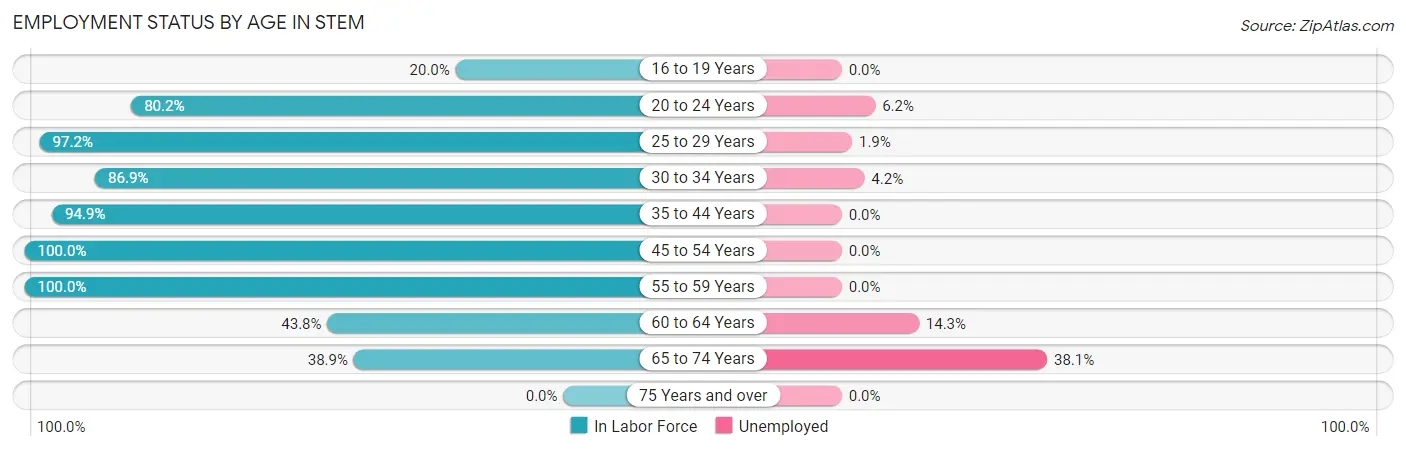
| Age Bracket | In Labor Force | Unemployed |
| 16 to 19 Years | 8 (20.0%) | 0 (0.0%) |
| 20 to 24 Years | 65 (80.2%) | 4 (6.2%) |
| 25 to 29 Years | 103 (97.2%) | 2 (1.9%) |
| 30 to 34 Years | 73 (86.9%) | 3 (4.2%) |
| 35 to 44 Years | 111 (94.9%) | 0 (0.0%) |
| 45 to 54 Years | 152 (100.0%) | 0 (0.0%) |
| 55 to 59 Years | 29 (100.0%) | 0 (0.0%) |
| 60 to 64 Years | 14 (43.8%) | 2 (14.3%) |
| 65 to 74 Years | 21 (38.9%) | 8 (38.1%) |
| 75 Years and over | 0 (0.0%) | 0 (0.0%) |
| Total | 576 (77.7%) | 20 (3.4%) |
Employment Status by Educational Attainment in Stem
According to labor force statistics for Stem, 92.7% of individuals (482) out of the total population between 25 and 64 years of age (520) are in the labor force, with 1.5% or 7 of them being unemployed. The group with the highest labor force participation rate are those with the educational attainment of bachelor's degree or higher, with 99.2% or 129 individuals in the labor force. Within the labor force, individuals with college / associate degree education have the highest percentage of unemployment, with 2.6% or 5 of them being unemployed.
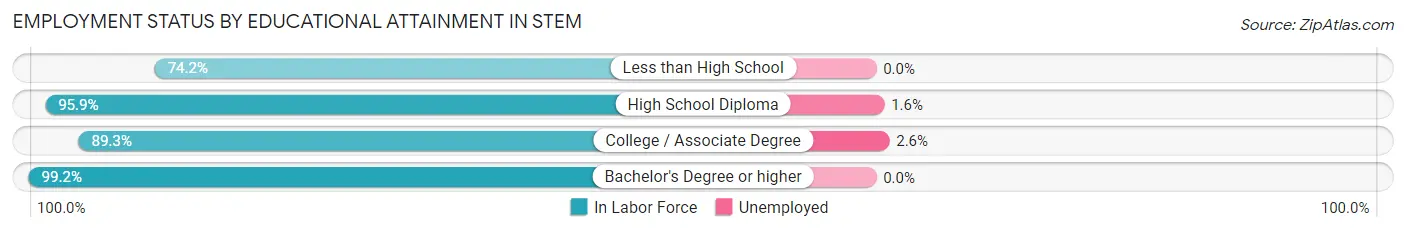
| Educational Attainment | In Labor Force | Unemployed |
| Less than High School | 23 (74.2%) | 0 (0.0%) |
| High School Diploma | 139 (95.9%) | 2 (1.6%) |
| College / Associate Degree | 191 (89.3%) | 6 (2.6%) |
| Bachelor's Degree or higher | 129 (99.2%) | 0 (0.0%) |
| Total | 482 (92.7%) | 8 (1.5%) |
Employment Occupations by Sex in Stem
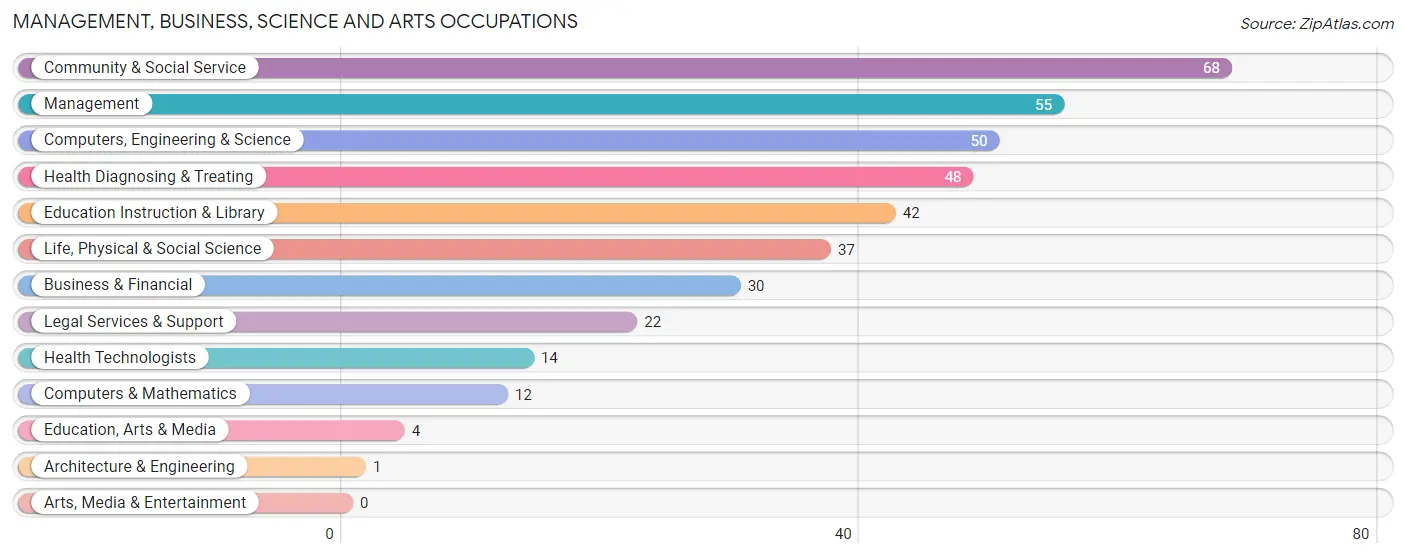
Management, Business, Science and Arts Occupations
The most common Management, Business, Science and Arts occupations in Stem are Community & Social Service (68 | 12.5%), Management (55 | 10.1%), Computers, Engineering & Science (50 | 9.2%), Health Diagnosing & Treating (48 | 8.8%), and Education Instruction & Library (42 | 7.7%).
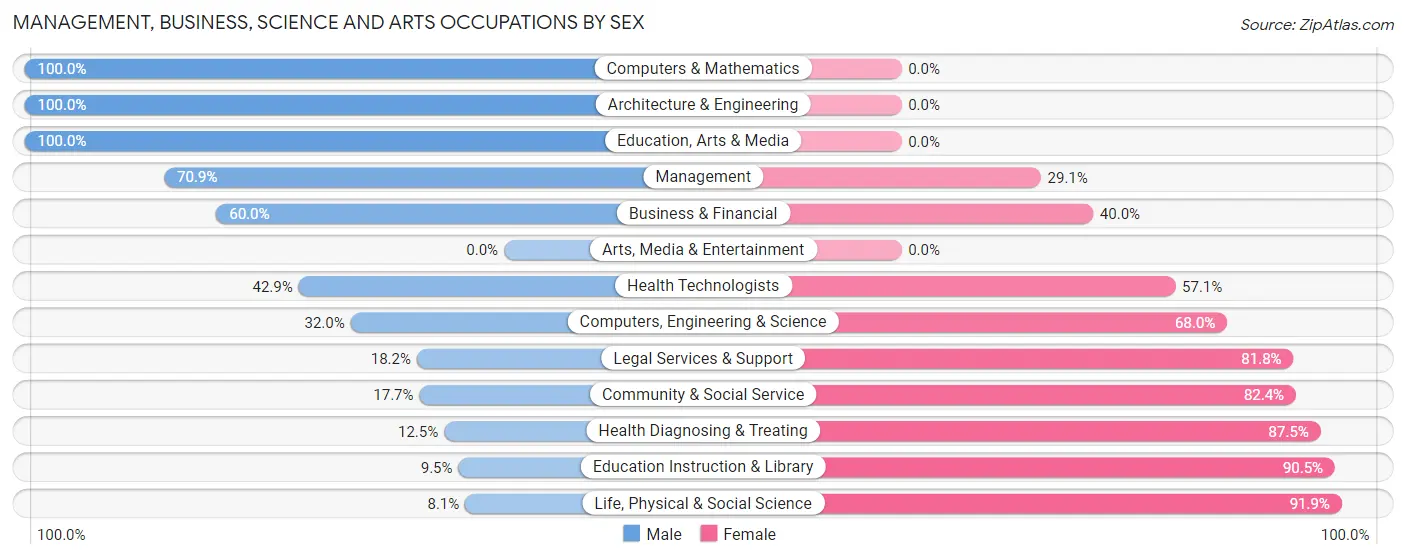
Management, Business, Science and Arts Occupations by Sex
Within the Management, Business, Science and Arts occupations in Stem, the most male-oriented occupations are Computers & Mathematics (100.0%), Architecture & Engineering (100.0%), and Education, Arts & Media (100.0%), while the most female-oriented occupations are Life, Physical & Social Science (91.9%), Education Instruction & Library (90.5%), and Health Diagnosing & Treating (87.5%).
| Occupation | Male | Female |
| Management | 39 (70.9%) | 16 (29.1%) |
| Business & Financial | 18 (60.0%) | 12 (40.0%) |
| Computers, Engineering & Science | 16 (32.0%) | 34 (68.0%) |
| Computers & Mathematics | 12 (100.0%) | 0 (0.0%) |
| Architecture & Engineering | 1 (100.0%) | 0 (0.0%) |
| Life, Physical & Social Science | 3 (8.1%) | 34 (91.9%) |
| Community & Social Service | 12 (17.6%) | 56 (82.4%) |
| Education, Arts & Media | 4 (100.0%) | 0 (0.0%) |
| Legal Services & Support | 4 (18.2%) | 18 (81.8%) |
| Education Instruction & Library | 4 (9.5%) | 38 (90.5%) |
| Arts, Media & Entertainment | 0 (0.0%) | 0 (0.0%) |
| Health Diagnosing & Treating | 6 (12.5%) | 42 (87.5%) |
| Health Technologists | 6 (42.9%) | 8 (57.1%) |
| Total (Category) | 91 (36.2%) | 160 (63.7%) |
| Total (Overall) | 223 (40.9%) | 322 (59.1%) |
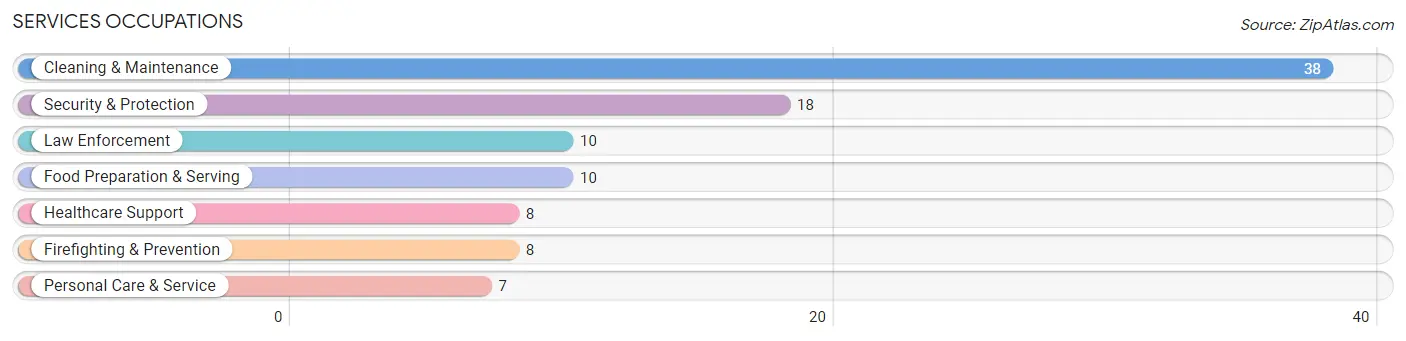
Services Occupations
The most common Services occupations in Stem are Cleaning & Maintenance (38 | 7.0%), Security & Protection (18 | 3.3%), Law Enforcement (10 | 1.8%), Food Preparation & Serving (10 | 1.8%), and Healthcare Support (8 | 1.5%).
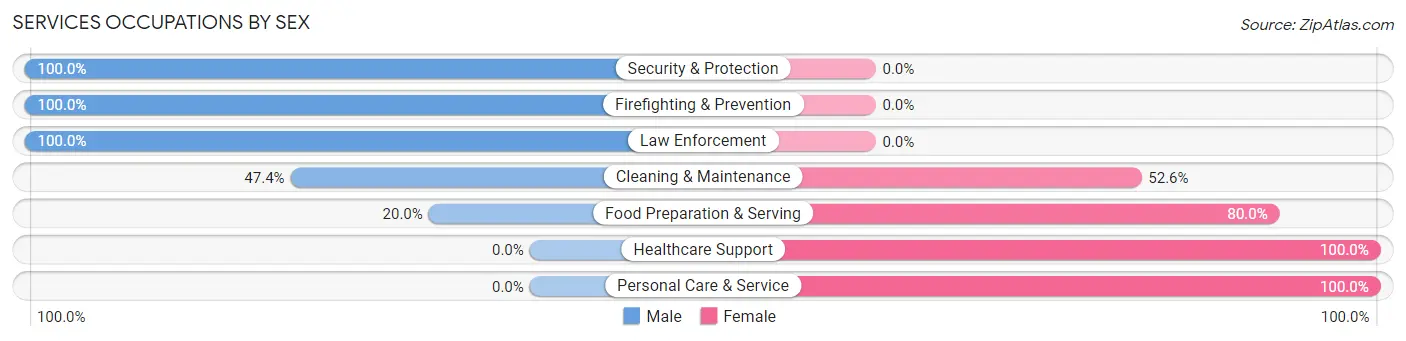
Services Occupations by Sex
Within the Services occupations in Stem, the most male-oriented occupations are Security & Protection (100.0%), Firefighting & Prevention (100.0%), and Law Enforcement (100.0%), while the most female-oriented occupations are Healthcare Support (100.0%), Personal Care & Service (100.0%), and Food Preparation & Serving (80.0%).
| Occupation | Male | Female |
| Healthcare Support | 0 (0.0%) | 8 (100.0%) |
| Security & Protection | 18 (100.0%) | 0 (0.0%) |
| Firefighting & Prevention | 8 (100.0%) | 0 (0.0%) |
| Law Enforcement | 10 (100.0%) | 0 (0.0%) |
| Food Preparation & Serving | 2 (20.0%) | 8 (80.0%) |
| Cleaning & Maintenance | 18 (47.4%) | 20 (52.6%) |
| Personal Care & Service | 0 (0.0%) | 7 (100.0%) |
| Total (Category) | 38 (46.9%) | 43 (53.1%) |
| Total (Overall) | 223 (40.9%) | 322 (59.1%) |
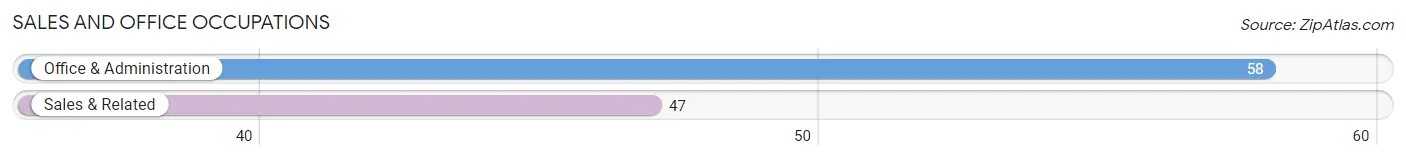
Sales and Office Occupations
The most common Sales and Office occupations in Stem are Office & Administration (58 | 10.6%), and Sales & Related (47 | 8.6%).
Sales and Office Occupations by Sex
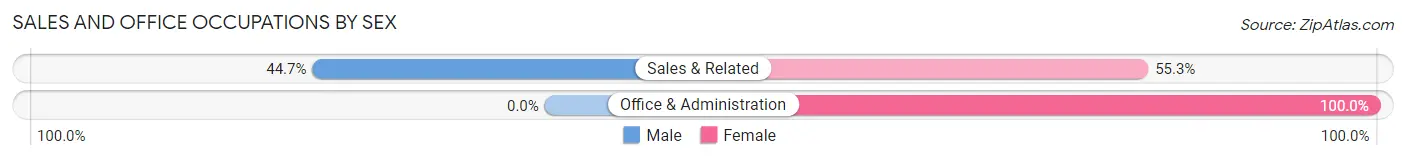
| Occupation | Male | Female |
| Sales & Related | 21 (44.7%) | 26 (55.3%) |
| Office & Administration | 0 (0.0%) | 58 (100.0%) |
| Total (Category) | 21 (20.0%) | 84 (80.0%) |
| Total (Overall) | 223 (40.9%) | 322 (59.1%) |
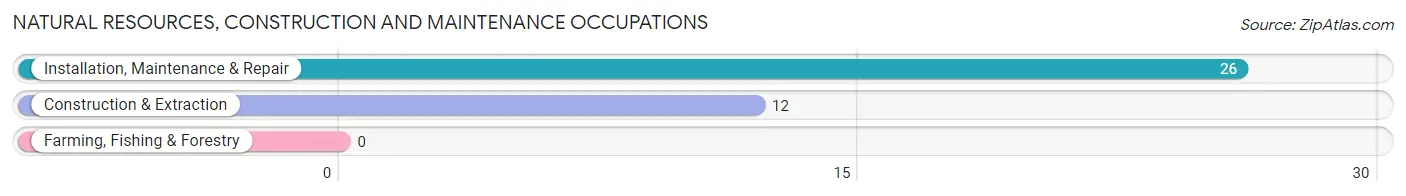
Natural Resources, Construction and Maintenance Occupations
The most common Natural Resources, Construction and Maintenance occupations in Stem are Installation, Maintenance & Repair (26 | 4.8%), and Construction & Extraction (12 | 2.2%).
Natural Resources, Construction and Maintenance Occupations by Sex
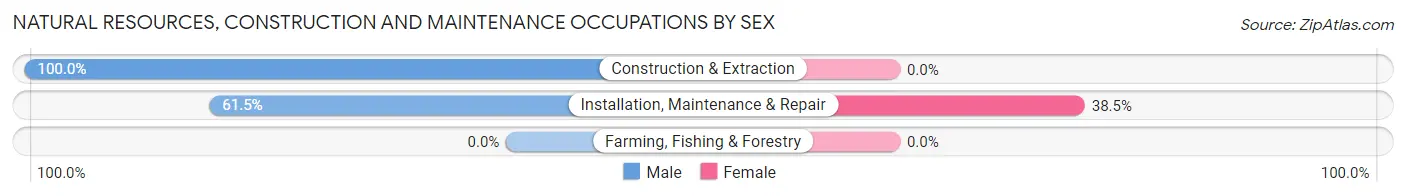
| Occupation | Male | Female |
| Farming, Fishing & Forestry | 0 (0.0%) | 0 (0.0%) |
| Construction & Extraction | 12 (100.0%) | 0 (0.0%) |
| Installation, Maintenance & Repair | 16 (61.5%) | 10 (38.5%) |
| Total (Category) | 28 (73.7%) | 10 (26.3%) |
| Total (Overall) | 223 (40.9%) | 322 (59.1%) |
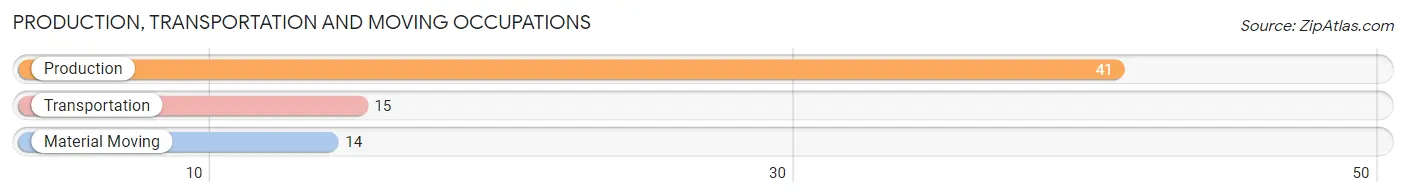
Production, Transportation and Moving Occupations
The most common Production, Transportation and Moving occupations in Stem are Production (41 | 7.5%), Transportation (15 | 2.8%), and Material Moving (14 | 2.6%).
Production, Transportation and Moving Occupations by Sex
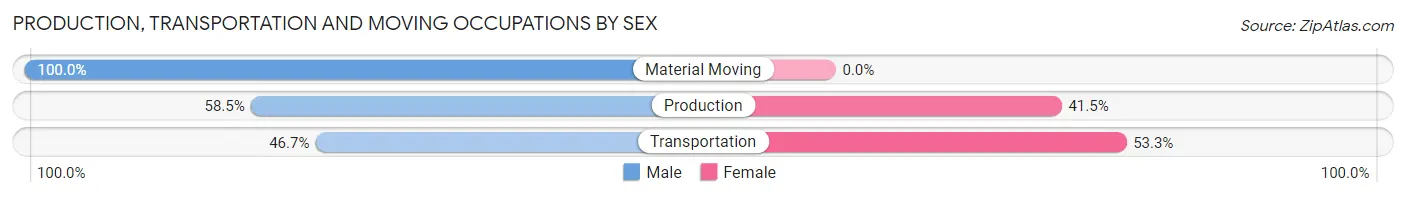
| Occupation | Male | Female |
| Production | 24 (58.5%) | 17 (41.5%) |
| Transportation | 7 (46.7%) | 8 (53.3%) |
| Material Moving | 14 (100.0%) | 0 (0.0%) |
| Total (Category) | 45 (64.3%) | 25 (35.7%) |
| Total (Overall) | 223 (40.9%) | 322 (59.1%) |
Employment Industries by Sex in Stem
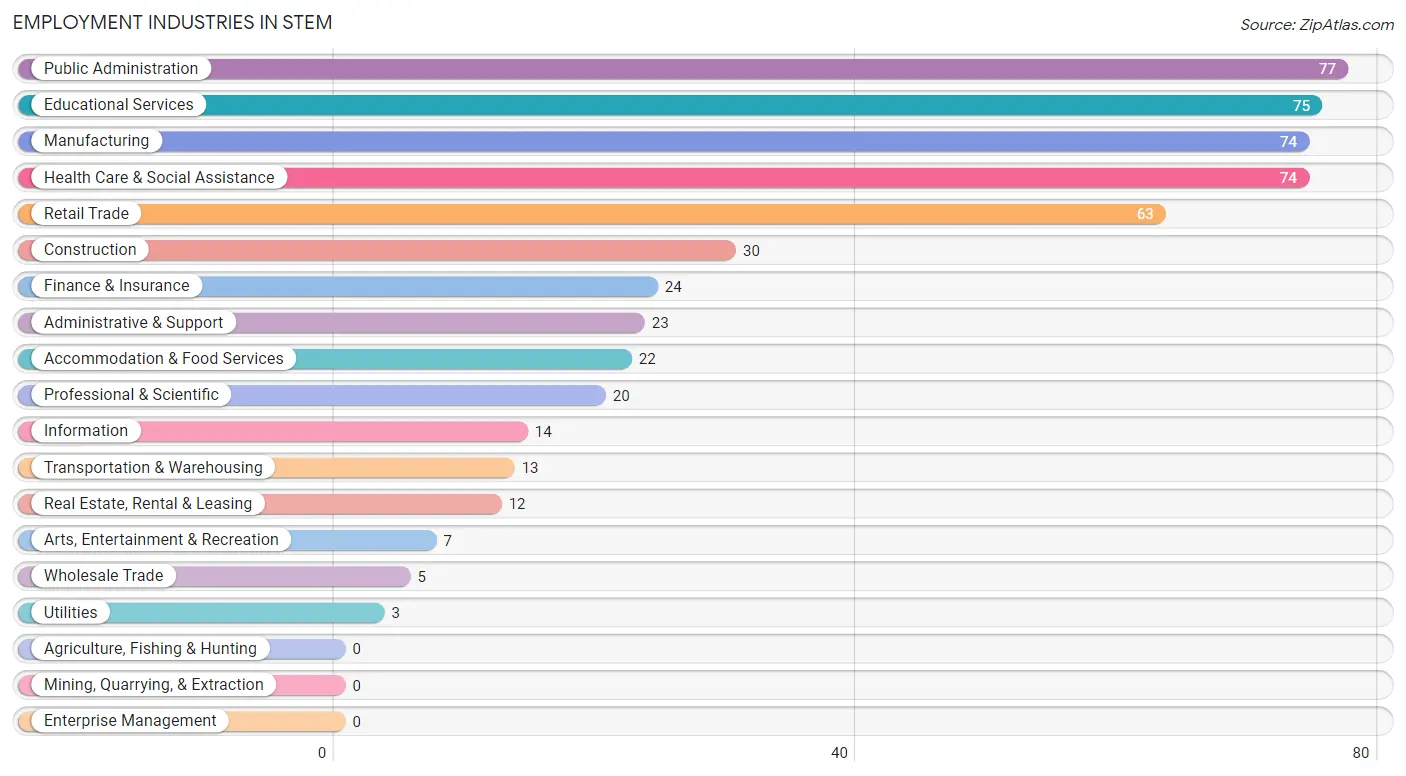
Employment Industries in Stem
The major employment industries in Stem include Public Administration (77 | 14.1%), Educational Services (75 | 13.8%), Manufacturing (74 | 13.6%), Health Care & Social Assistance (74 | 13.6%), and Retail Trade (63 | 11.6%).
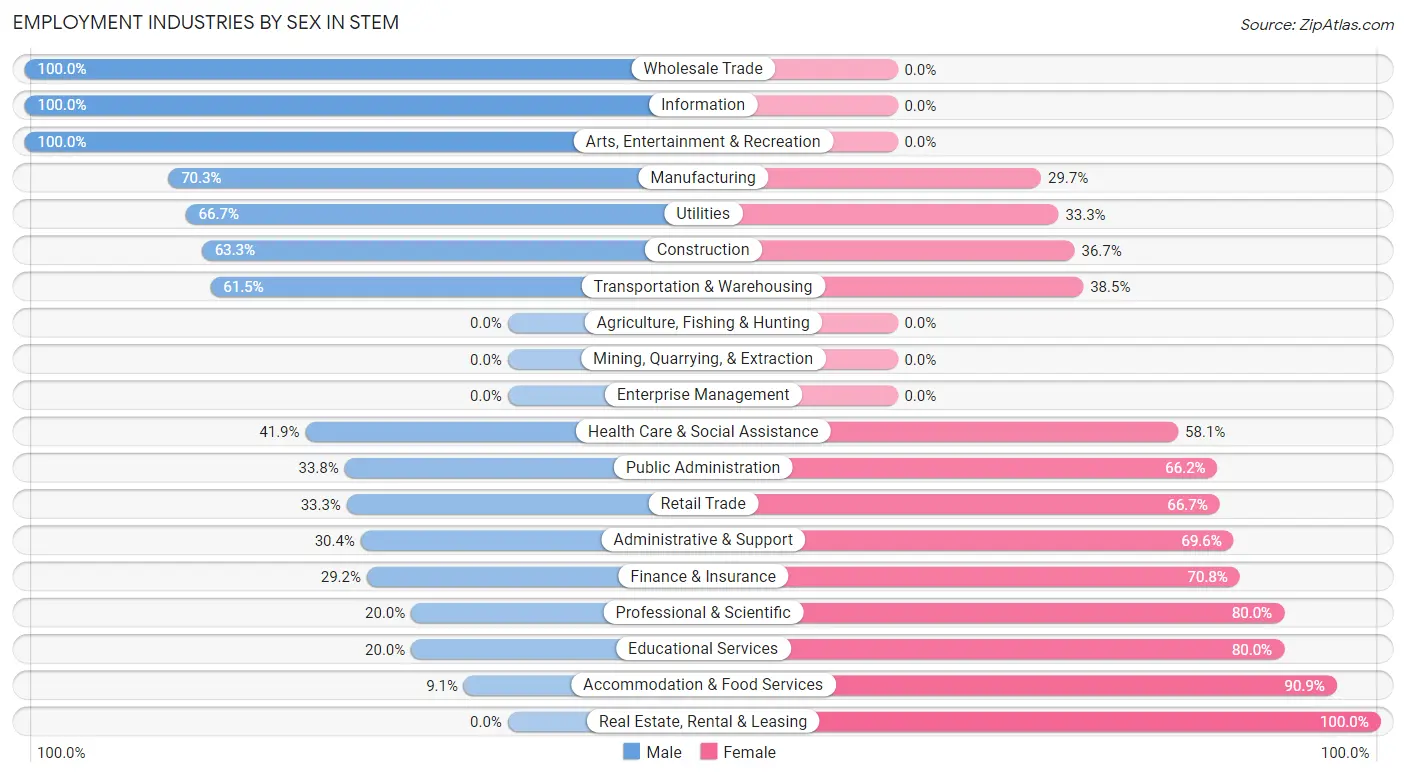
Employment Industries by Sex in Stem
The Stem industries that see more men than women are Wholesale Trade (100.0%), Information (100.0%), and Arts, Entertainment & Recreation (100.0%), whereas the industries that tend to have a higher number of women are Real Estate, Rental & Leasing (100.0%), Accommodation & Food Services (90.9%), and Professional & Scientific (80.0%).
| Industry | Male | Female |
| Agriculture, Fishing & Hunting | 0 (0.0%) | 0 (0.0%) |
| Mining, Quarrying, & Extraction | 0 (0.0%) | 0 (0.0%) |
| Construction | 19 (63.3%) | 11 (36.7%) |
| Manufacturing | 52 (70.3%) | 22 (29.7%) |
| Wholesale Trade | 5 (100.0%) | 0 (0.0%) |
| Retail Trade | 21 (33.3%) | 42 (66.7%) |
| Transportation & Warehousing | 8 (61.5%) | 5 (38.5%) |
| Utilities | 2 (66.7%) | 1 (33.3%) |
| Information | 14 (100.0%) | 0 (0.0%) |
| Finance & Insurance | 7 (29.2%) | 17 (70.8%) |
| Real Estate, Rental & Leasing | 0 (0.0%) | 12 (100.0%) |
| Professional & Scientific | 4 (20.0%) | 16 (80.0%) |
| Enterprise Management | 0 (0.0%) | 0 (0.0%) |
| Administrative & Support | 7 (30.4%) | 16 (69.6%) |
| Educational Services | 15 (20.0%) | 60 (80.0%) |
| Health Care & Social Assistance | 31 (41.9%) | 43 (58.1%) |
| Arts, Entertainment & Recreation | 7 (100.0%) | 0 (0.0%) |
| Accommodation & Food Services | 2 (9.1%) | 20 (90.9%) |
| Public Administration | 26 (33.8%) | 51 (66.2%) |
| Total | 223 (40.9%) | 322 (59.1%) |
Education in Stem
School Enrollment in Stem
The most common levels of schooling among the 308 students in Stem are middle school (96 | 31.2%), elementary school (83 | 27.0%), and high school (44 | 14.3%).
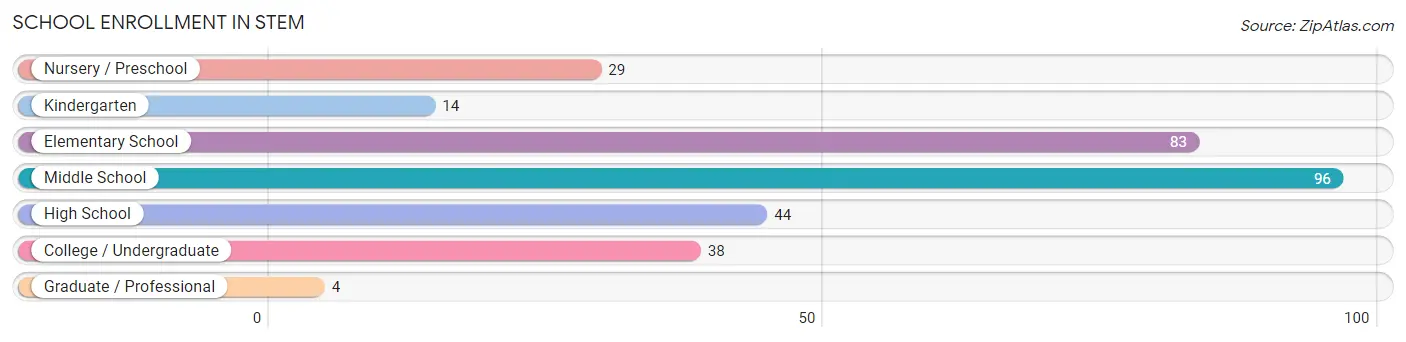
| School Level | # Students | % Students |
| Nursery / Preschool | 29 | 9.4% |
| Kindergarten | 14 | 4.5% |
| Elementary School | 83 | 27.0% |
| Middle School | 96 | 31.2% |
| High School | 44 | 14.3% |
| College / Undergraduate | 38 | 12.3% |
| Graduate / Professional | 4 | 1.3% |
| Total | 308 | 100.0% |
School Enrollment by Age by Funding Source in Stem
Out of a total of 308 students who are enrolled in schools in Stem, 29 (9.4%) attend a private institution, while the remaining 279 (90.6%) are enrolled in public schools. The age group of 3 to 4 year olds has the highest likelihood of being enrolled in private schools, with 23 (79.3% in the age bracket) enrolled. Conversely, the age group of 10 to 14 year olds has the lowest likelihood of being enrolled in a private school, with 103 (100.0% in the age bracket) attending a public institution.
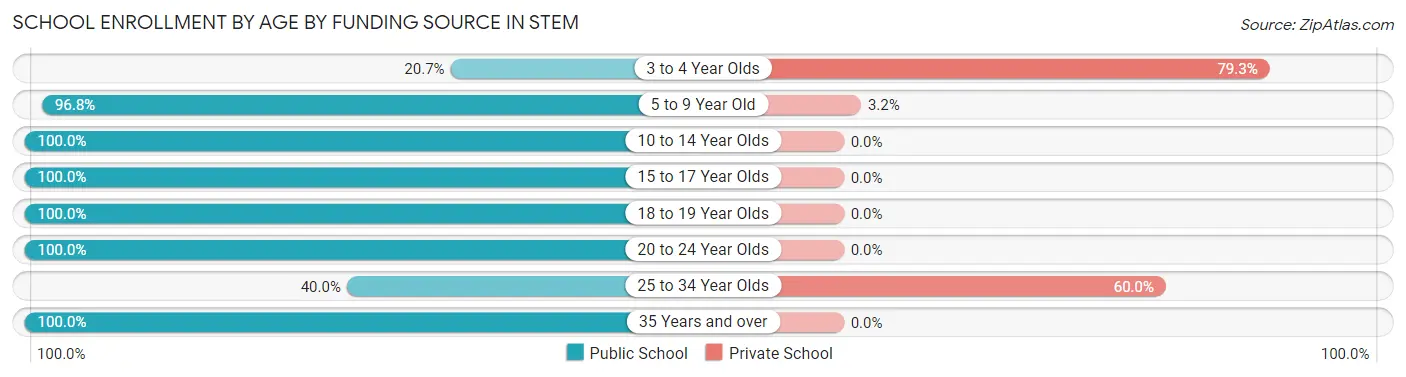
| Age Bracket | Public School | Private School |
| 3 to 4 Year Olds | 6 (20.7%) | 23 (79.3%) |
| 5 to 9 Year Old | 90 (96.8%) | 3 (3.2%) |
| 10 to 14 Year Olds | 103 (100.0%) | 0 (0.0%) |
| 15 to 17 Year Olds | 35 (100.0%) | 0 (0.0%) |
| 18 to 19 Year Olds | 13 (100.0%) | 0 (0.0%) |
| 20 to 24 Year Olds | 20 (100.0%) | 0 (0.0%) |
| 25 to 34 Year Olds | 2 (40.0%) | 3 (60.0%) |
| 35 Years and over | 10 (100.0%) | 0 (0.0%) |
| Total | 279 (90.6%) | 29 (9.4%) |
Educational Attainment by Field of Study in Stem
Psychology (38 | 21.8%), business (35 | 20.1%), science & technology (17 | 9.8%), arts & humanities (17 | 9.8%), and social sciences (15 | 8.6%) are the most common fields of study among 174 individuals in Stem who have obtained a bachelor's degree or higher.
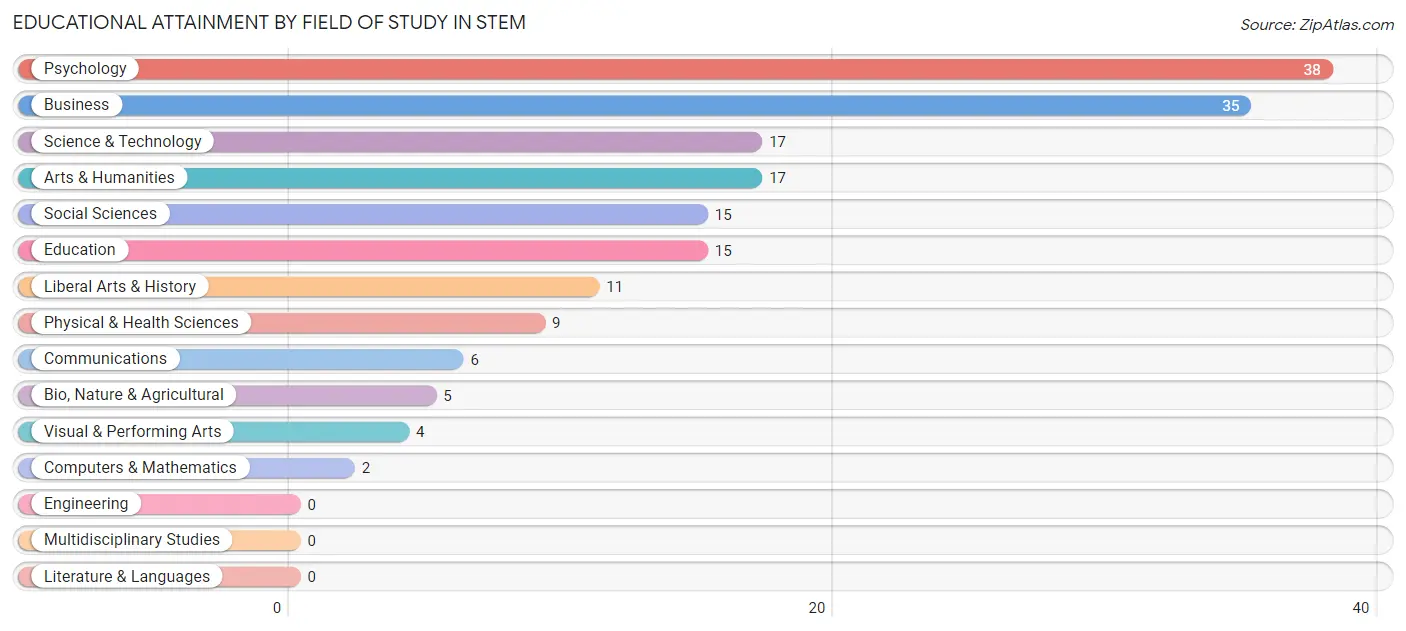
| Field of Study | # Graduates | % Graduates |
| Computers & Mathematics | 2 | 1.1% |
| Bio, Nature & Agricultural | 5 | 2.9% |
| Physical & Health Sciences | 9 | 5.2% |
| Psychology | 38 | 21.8% |
| Social Sciences | 15 | 8.6% |
| Engineering | 0 | 0.0% |
| Multidisciplinary Studies | 0 | 0.0% |
| Science & Technology | 17 | 9.8% |
| Business | 35 | 20.1% |
| Education | 15 | 8.6% |
| Literature & Languages | 0 | 0.0% |
| Liberal Arts & History | 11 | 6.3% |
| Visual & Performing Arts | 4 | 2.3% |
| Communications | 6 | 3.5% |
| Arts & Humanities | 17 | 9.8% |
| Total | 174 | 100.0% |
Transportation & Commute in Stem
Vehicle Availability by Sex in Stem
The most prevalent vehicle ownership categories in Stem are males with 2 vehicles (106, accounting for 47.3%) and females with 2 vehicles (99, making up 32.7%).
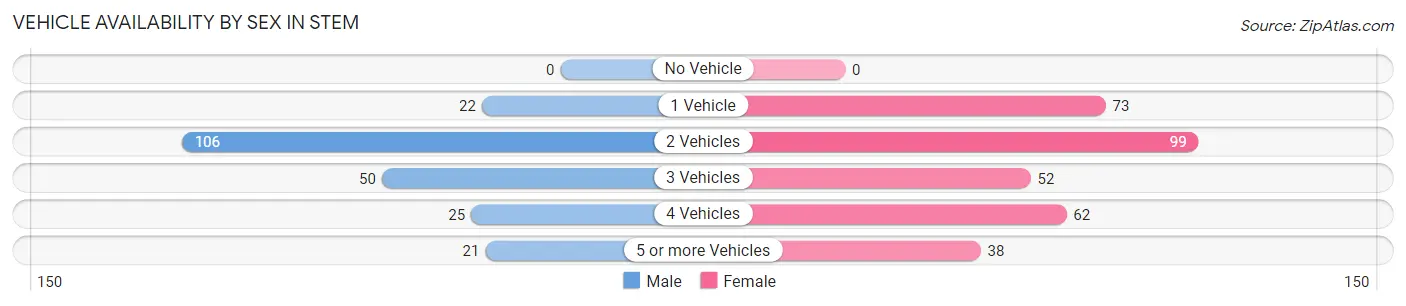
| Vehicles Available | Male | Female |
| No Vehicle | 0 (0.0%) | 0 (0.0%) |
| 1 Vehicle | 22 (9.8%) | 73 (22.5%) |
| 2 Vehicles | 106 (47.3%) | 99 (30.6%) |
| 3 Vehicles | 50 (22.3%) | 52 (16.1%) |
| 4 Vehicles | 25 (11.2%) | 62 (19.1%) |
| 5 or more Vehicles | 21 (9.4%) | 38 (11.7%) |
| Total | 224 (100.0%) | 324 (100.0%) |
Commute Time in Stem
The most frequently occuring commute durations in Stem are 45 to 59 minutes (111 commuters, 22.5%), 15 to 19 minutes (71 commuters, 14.4%), and 35 to 39 minutes (61 commuters, 12.3%).
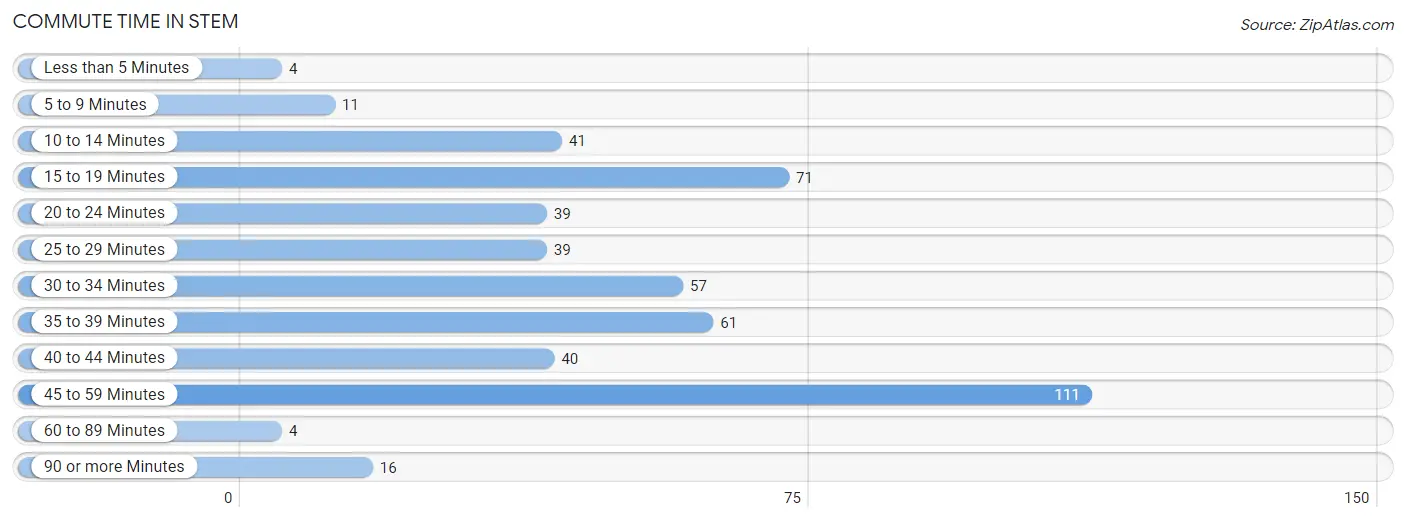
| Commute Time | # Commuters | % Commuters |
| Less than 5 Minutes | 4 | 0.8% |
| 5 to 9 Minutes | 11 | 2.2% |
| 10 to 14 Minutes | 41 | 8.3% |
| 15 to 19 Minutes | 71 | 14.4% |
| 20 to 24 Minutes | 39 | 7.9% |
| 25 to 29 Minutes | 39 | 7.9% |
| 30 to 34 Minutes | 57 | 11.5% |
| 35 to 39 Minutes | 61 | 12.3% |
| 40 to 44 Minutes | 40 | 8.1% |
| 45 to 59 Minutes | 111 | 22.5% |
| 60 to 89 Minutes | 4 | 0.8% |
| 90 or more Minutes | 16 | 3.2% |
Commute Time by Sex in Stem
The most common commute times in Stem are 45 to 59 minutes (45 commuters, 20.7%) for males and 45 to 59 minutes (66 commuters, 23.8%) for females.
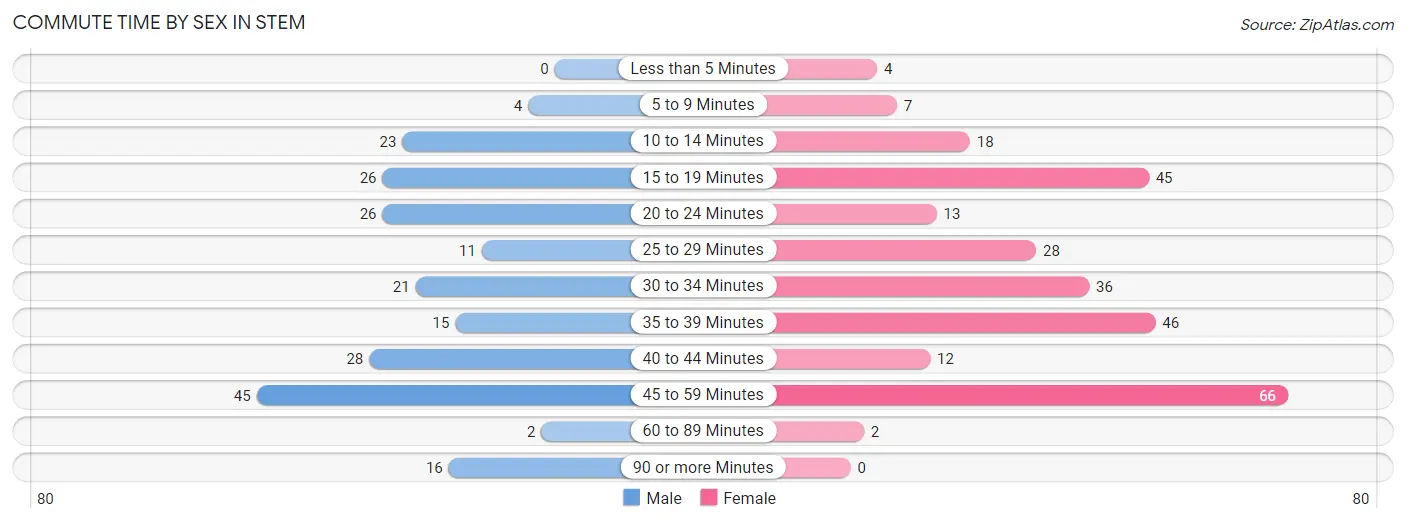
| Commute Time | Male | Female |
| Less than 5 Minutes | 0 (0.0%) | 4 (1.4%) |
| 5 to 9 Minutes | 4 (1.8%) | 7 (2.5%) |
| 10 to 14 Minutes | 23 (10.6%) | 18 (6.5%) |
| 15 to 19 Minutes | 26 (12.0%) | 45 (16.3%) |
| 20 to 24 Minutes | 26 (12.0%) | 13 (4.7%) |
| 25 to 29 Minutes | 11 (5.1%) | 28 (10.1%) |
| 30 to 34 Minutes | 21 (9.7%) | 36 (13.0%) |
| 35 to 39 Minutes | 15 (6.9%) | 46 (16.6%) |
| 40 to 44 Minutes | 28 (12.9%) | 12 (4.3%) |
| 45 to 59 Minutes | 45 (20.7%) | 66 (23.8%) |
| 60 to 89 Minutes | 2 (0.9%) | 2 (0.7%) |
| 90 or more Minutes | 16 (7.4%) | 0 (0.0%) |
Time of Departure to Work by Sex in Stem
The most frequent times of departure to work in Stem are 12:00 AM to 4:59 AM (34, 15.7%) for males and 7:00 AM to 7:29 AM (86, 31.0%) for females.
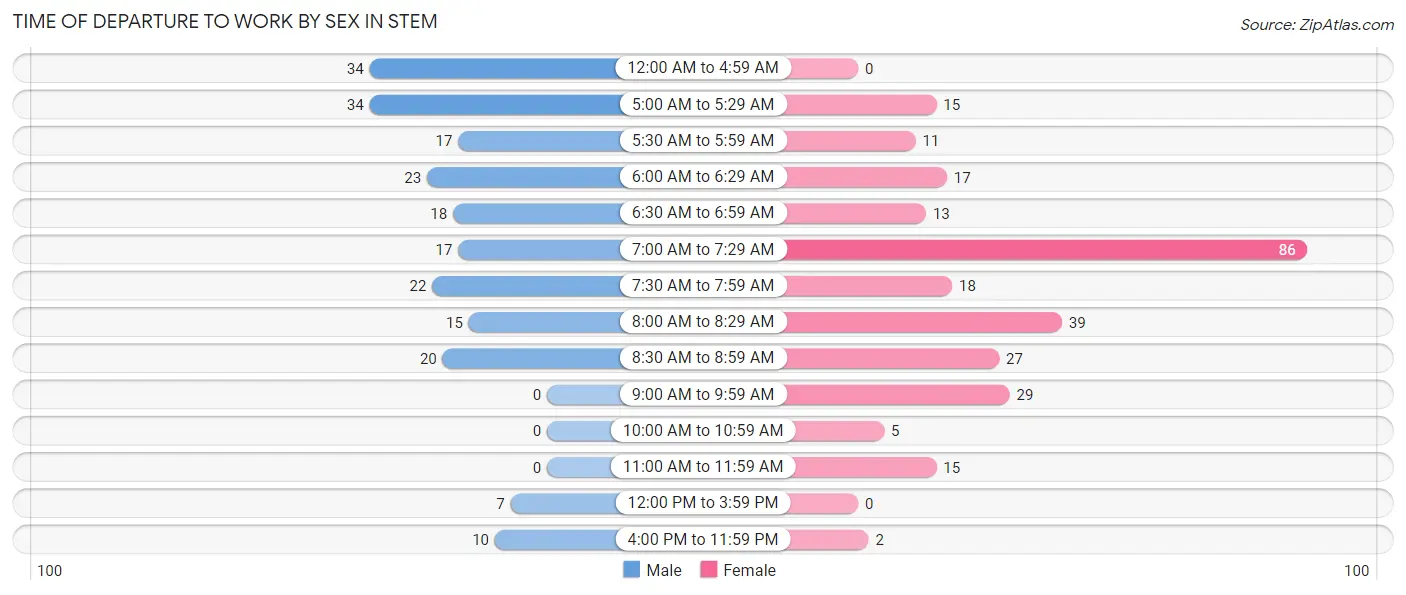
| Time of Departure | Male | Female |
| 12:00 AM to 4:59 AM | 34 (15.7%) | 0 (0.0%) |
| 5:00 AM to 5:29 AM | 34 (15.7%) | 15 (5.4%) |
| 5:30 AM to 5:59 AM | 17 (7.8%) | 11 (4.0%) |
| 6:00 AM to 6:29 AM | 23 (10.6%) | 17 (6.1%) |
| 6:30 AM to 6:59 AM | 18 (8.3%) | 13 (4.7%) |
| 7:00 AM to 7:29 AM | 17 (7.8%) | 86 (31.0%) |
| 7:30 AM to 7:59 AM | 22 (10.1%) | 18 (6.5%) |
| 8:00 AM to 8:29 AM | 15 (6.9%) | 39 (14.1%) |
| 8:30 AM to 8:59 AM | 20 (9.2%) | 27 (9.8%) |
| 9:00 AM to 9:59 AM | 0 (0.0%) | 29 (10.5%) |
| 10:00 AM to 10:59 AM | 0 (0.0%) | 5 (1.8%) |
| 11:00 AM to 11:59 AM | 0 (0.0%) | 15 (5.4%) |
| 12:00 PM to 3:59 PM | 7 (3.2%) | 0 (0.0%) |
| 4:00 PM to 11:59 PM | 10 (4.6%) | 2 (0.7%) |
| Total | 217 (100.0%) | 277 (100.0%) |
Housing Occupancy in Stem
Occupancy by Ownership in Stem
Of the total 383 dwellings in Stem, owner-occupied units account for 370 (96.6%), while renter-occupied units make up 13 (3.4%).
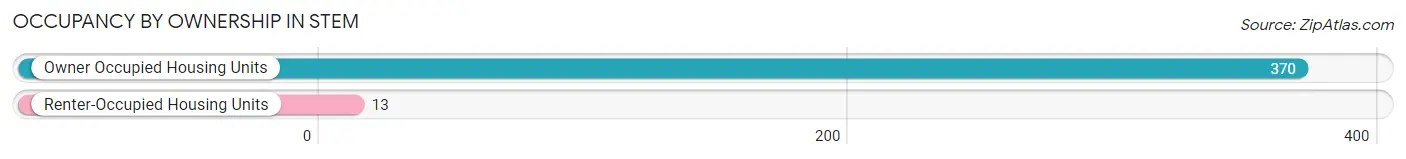
| Occupancy | # Housing Units | % Housing Units |
| Owner Occupied Housing Units | 370 | 96.6% |
| Renter-Occupied Housing Units | 13 | 3.4% |
| Total Occupied Housing Units | 383 | 100.0% |
Occupancy by Household Size in Stem
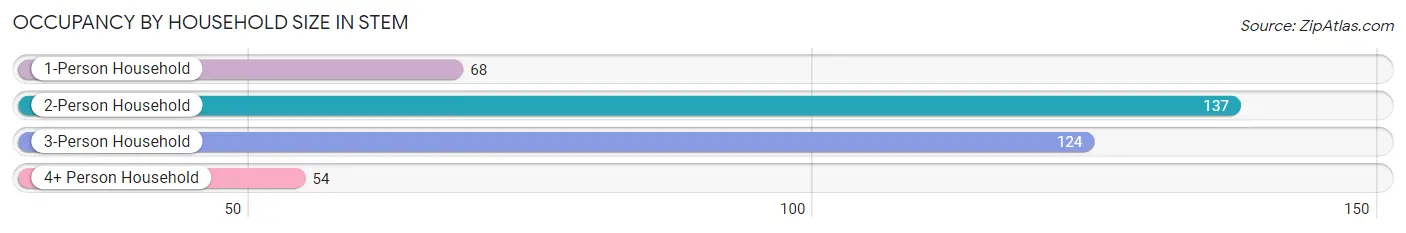
| Household Size | # Housing Units | % Housing Units |
| 1-Person Household | 68 | 17.7% |
| 2-Person Household | 137 | 35.8% |
| 3-Person Household | 124 | 32.4% |
| 4+ Person Household | 54 | 14.1% |
| Total Housing Units | 383 | 100.0% |
Occupancy by Ownership by Household Size in Stem
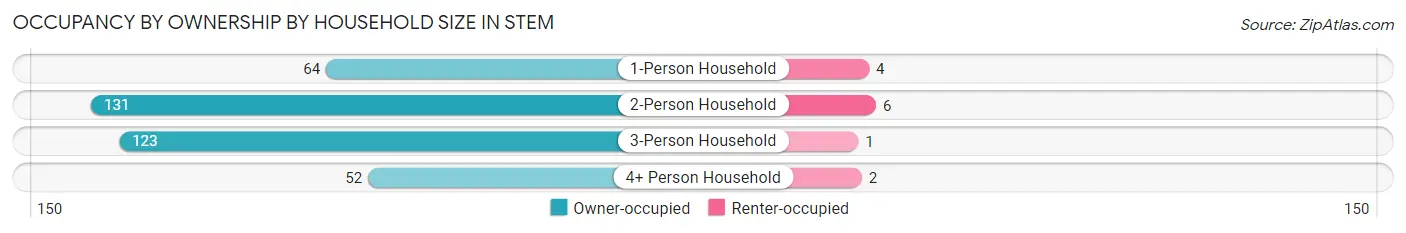
| Household Size | Owner-occupied | Renter-occupied |
| 1-Person Household | 64 (94.1%) | 4 (5.9%) |
| 2-Person Household | 131 (95.6%) | 6 (4.4%) |
| 3-Person Household | 123 (99.2%) | 1 (0.8%) |
| 4+ Person Household | 52 (96.3%) | 2 (3.7%) |
| Total Housing Units | 370 (96.6%) | 13 (3.4%) |
Occupancy by Educational Attainment in Stem
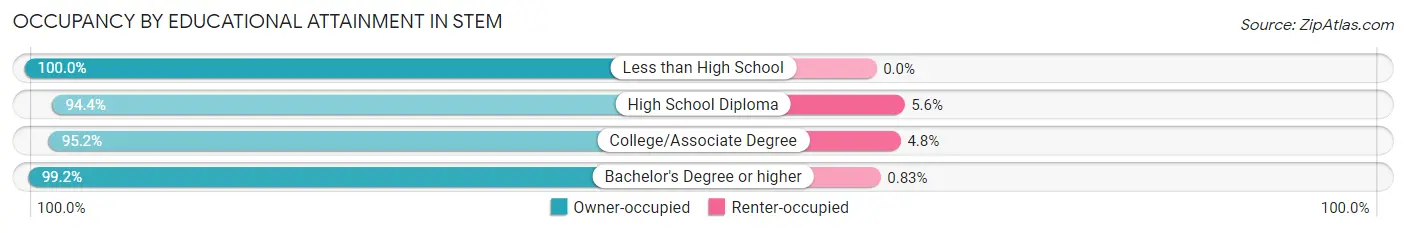
| Household Size | Owner-occupied | Renter-occupied |
| Less than High School | 25 (100.0%) | 0 (0.0%) |
| High School Diploma | 68 (94.4%) | 4 (5.6%) |
| College/Associate Degree | 158 (95.2%) | 8 (4.8%) |
| Bachelor's Degree or higher | 119 (99.2%) | 1 (0.8%) |
Occupancy by Age of Householder in Stem
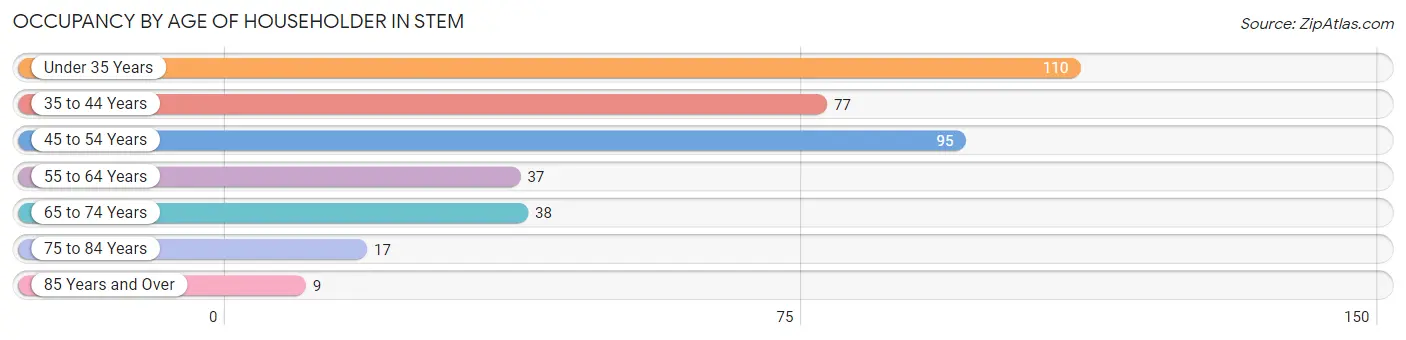
| Age Bracket | # Households | % Households |
| Under 35 Years | 110 | 28.7% |
| 35 to 44 Years | 77 | 20.1% |
| 45 to 54 Years | 95 | 24.8% |
| 55 to 64 Years | 37 | 9.7% |
| 65 to 74 Years | 38 | 9.9% |
| 75 to 84 Years | 17 | 4.4% |
| 85 Years and Over | 9 | 2.4% |
| Total | 383 | 100.0% |
Housing Finances in Stem
Median Income by Occupancy in Stem
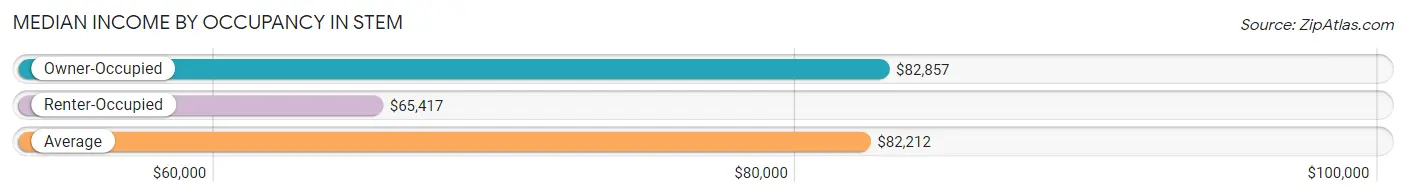
| Occupancy Type | # Households | Median Income |
| Owner-Occupied | 370 (96.6%) | $82,857 |
| Renter-Occupied | 13 (3.4%) | $65,417 |
| Average | 383 (100.0%) | $82,212 |
Occupancy by Householder Income Bracket in Stem
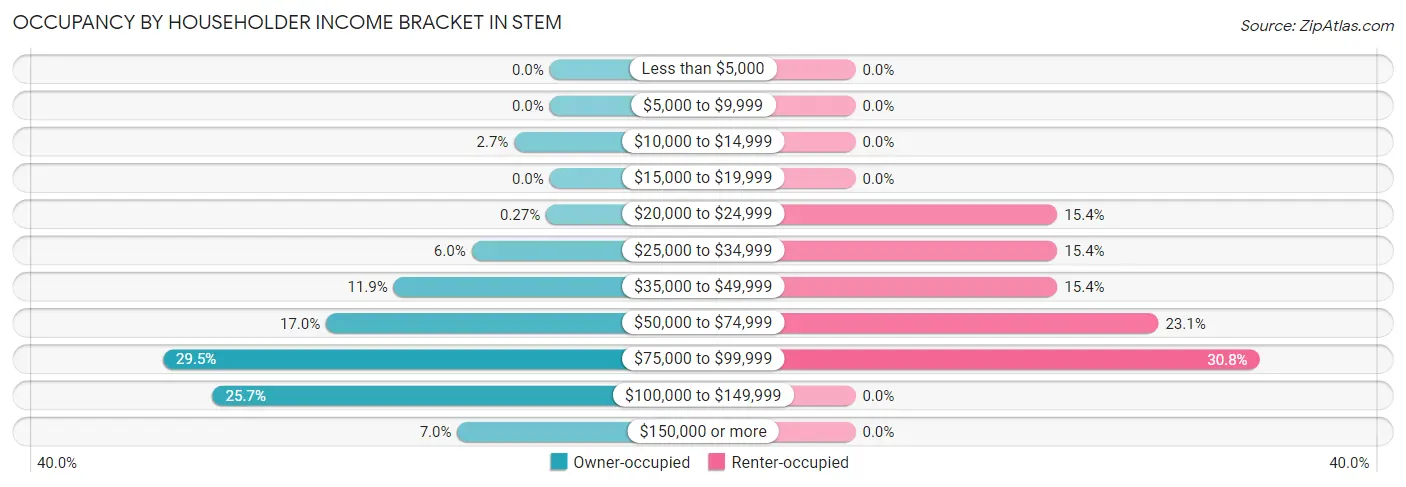
| Income Bracket | Owner-occupied | Renter-occupied |
| Less than $5,000 | 0 (0.0%) | 0 (0.0%) |
| $5,000 to $9,999 | 0 (0.0%) | 0 (0.0%) |
| $10,000 to $14,999 | 10 (2.7%) | 0 (0.0%) |
| $15,000 to $19,999 | 0 (0.0%) | 0 (0.0%) |
| $20,000 to $24,999 | 1 (0.3%) | 2 (15.4%) |
| $25,000 to $34,999 | 22 (5.9%) | 2 (15.4%) |
| $35,000 to $49,999 | 44 (11.9%) | 2 (15.4%) |
| $50,000 to $74,999 | 63 (17.0%) | 3 (23.1%) |
| $75,000 to $99,999 | 109 (29.5%) | 4 (30.8%) |
| $100,000 to $149,999 | 95 (25.7%) | 0 (0.0%) |
| $150,000 or more | 26 (7.0%) | 0 (0.0%) |
| Total | 370 (100.0%) | 13 (100.0%) |
Monthly Housing Cost Tiers in Stem
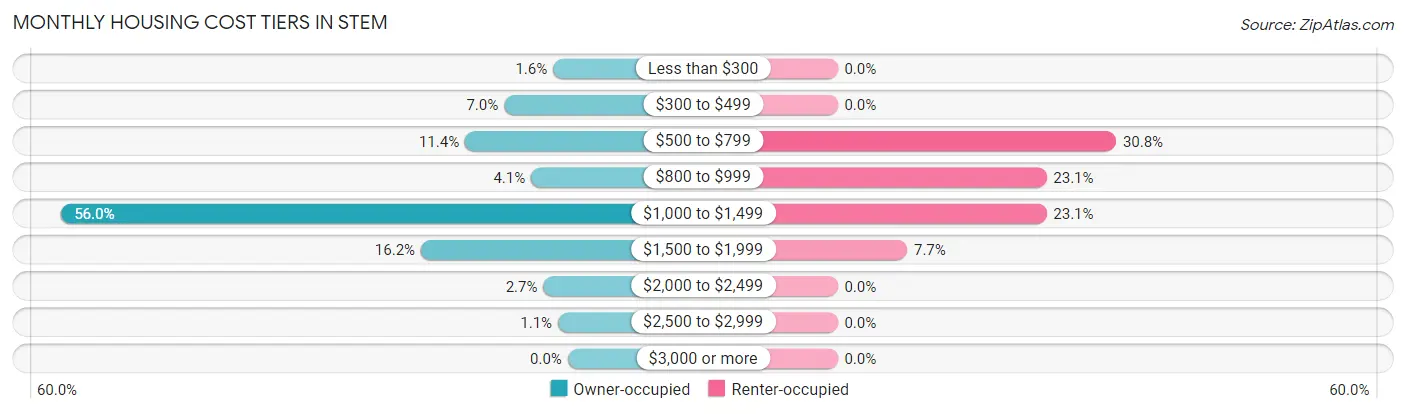
| Monthly Cost | Owner-occupied | Renter-occupied |
| Less than $300 | 6 (1.6%) | 0 (0.0%) |
| $300 to $499 | 26 (7.0%) | 0 (0.0%) |
| $500 to $799 | 42 (11.4%) | 4 (30.8%) |
| $800 to $999 | 15 (4.1%) | 3 (23.1%) |
| $1,000 to $1,499 | 207 (55.9%) | 3 (23.1%) |
| $1,500 to $1,999 | 60 (16.2%) | 1 (7.7%) |
| $2,000 to $2,499 | 10 (2.7%) | 0 (0.0%) |
| $2,500 to $2,999 | 4 (1.1%) | 0 (0.0%) |
| $3,000 or more | 0 (0.0%) | 0 (0.0%) |
| Total | 370 (100.0%) | 13 (100.0%) |
Physical Housing Characteristics in Stem
Housing Structures in Stem
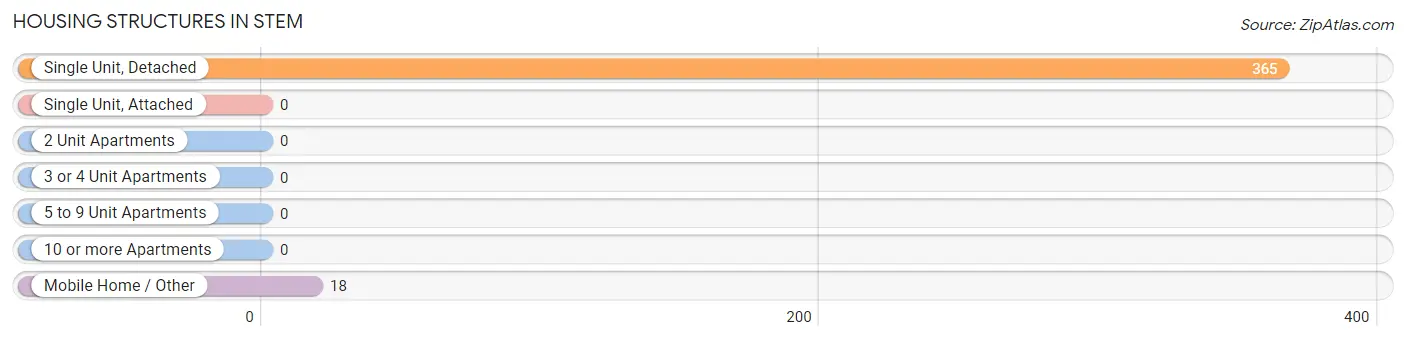
| Structure Type | # Housing Units | % Housing Units |
| Single Unit, Detached | 365 | 95.3% |
| Single Unit, Attached | 0 | 0.0% |
| 2 Unit Apartments | 0 | 0.0% |
| 3 or 4 Unit Apartments | 0 | 0.0% |
| 5 to 9 Unit Apartments | 0 | 0.0% |
| 10 or more Apartments | 0 | 0.0% |
| Mobile Home / Other | 18 | 4.7% |
| Total | 383 | 100.0% |
Housing Structures by Occupancy in Stem
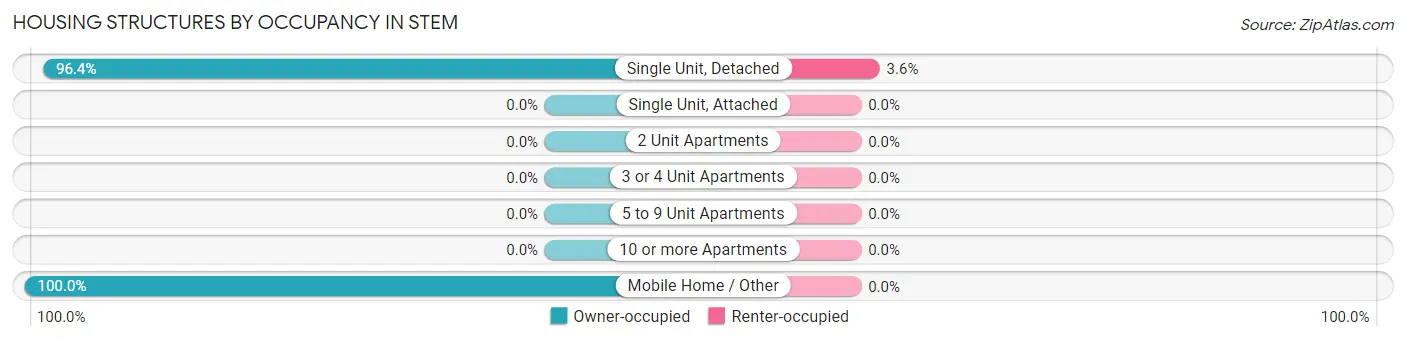
| Structure Type | Owner-occupied | Renter-occupied |
| Single Unit, Detached | 352 (96.4%) | 13 (3.6%) |
| Single Unit, Attached | 0 (0.0%) | 0 (0.0%) |
| 2 Unit Apartments | 0 (0.0%) | 0 (0.0%) |
| 3 or 4 Unit Apartments | 0 (0.0%) | 0 (0.0%) |
| 5 to 9 Unit Apartments | 0 (0.0%) | 0 (0.0%) |
| 10 or more Apartments | 0 (0.0%) | 0 (0.0%) |
| Mobile Home / Other | 18 (100.0%) | 0 (0.0%) |
| Total | 370 (96.6%) | 13 (3.4%) |
Housing Structures by Number of Rooms in Stem
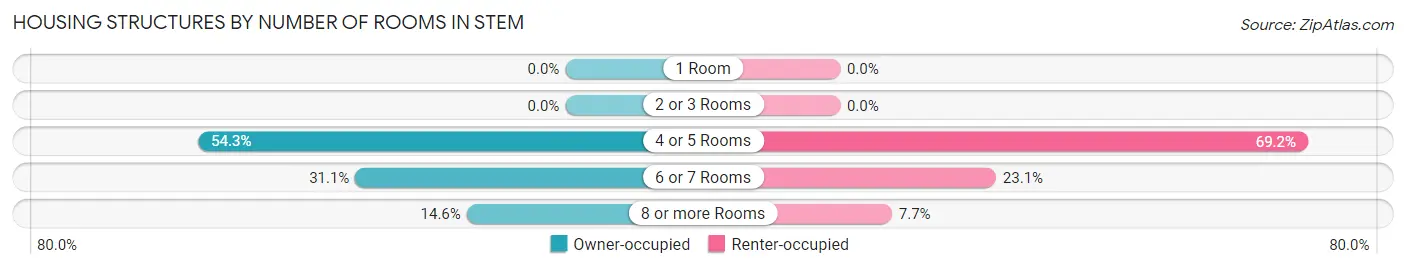
| Number of Rooms | Owner-occupied | Renter-occupied |
| 1 Room | 0 (0.0%) | 0 (0.0%) |
| 2 or 3 Rooms | 0 (0.0%) | 0 (0.0%) |
| 4 or 5 Rooms | 201 (54.3%) | 9 (69.2%) |
| 6 or 7 Rooms | 115 (31.1%) | 3 (23.1%) |
| 8 or more Rooms | 54 (14.6%) | 1 (7.7%) |
| Total | 370 (100.0%) | 13 (100.0%) |
Housing Structure by Heating Type in Stem
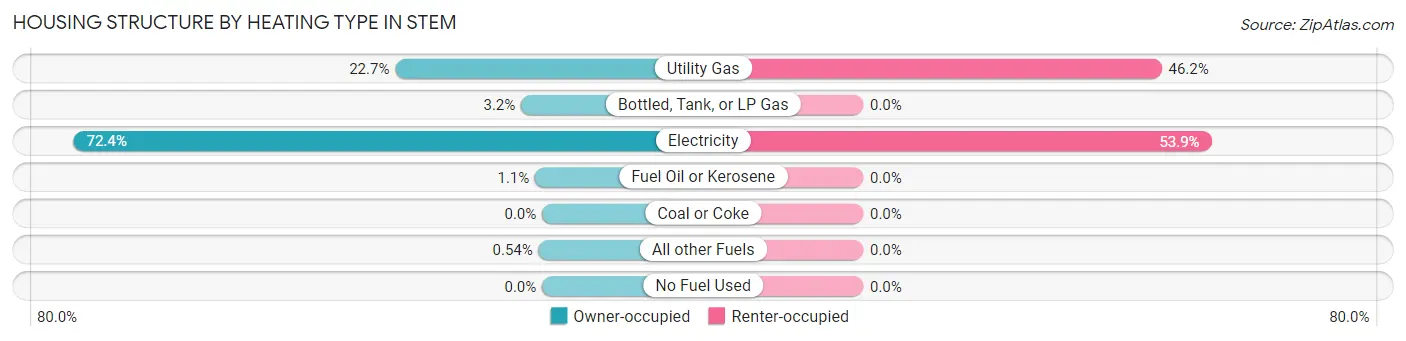
| Heating Type | Owner-occupied | Renter-occupied |
| Utility Gas | 84 (22.7%) | 6 (46.2%) |
| Bottled, Tank, or LP Gas | 12 (3.2%) | 0 (0.0%) |
| Electricity | 268 (72.4%) | 7 (53.8%) |
| Fuel Oil or Kerosene | 4 (1.1%) | 0 (0.0%) |
| Coal or Coke | 0 (0.0%) | 0 (0.0%) |
| All other Fuels | 2 (0.5%) | 0 (0.0%) |
| No Fuel Used | 0 (0.0%) | 0 (0.0%) |
| Total | 370 (100.0%) | 13 (100.0%) |
Household Vehicle Usage in Stem
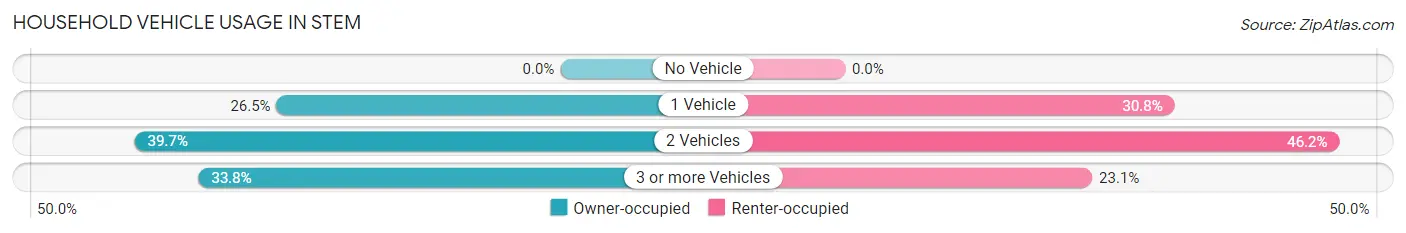
| Vehicles per Household | Owner-occupied | Renter-occupied |
| No Vehicle | 0 (0.0%) | 0 (0.0%) |
| 1 Vehicle | 98 (26.5%) | 4 (30.8%) |
| 2 Vehicles | 147 (39.7%) | 6 (46.2%) |
| 3 or more Vehicles | 125 (33.8%) | 3 (23.1%) |
| Total | 370 (100.0%) | 13 (100.0%) |
Real Estate & Mortgages in Stem
Real Estate and Mortgage Overview in Stem
| Characteristic | Without Mortgage | With Mortgage |
| Housing Units | 74 | 296 |
| Median Property Value | $184,000 | $197,400 |
| Median Household Income | $49,853 | $23 |
| Monthly Housing Costs | $528 | $0 |
| Real Estate Taxes | $2,118 | $2 |
Property Value by Mortgage Status in Stem
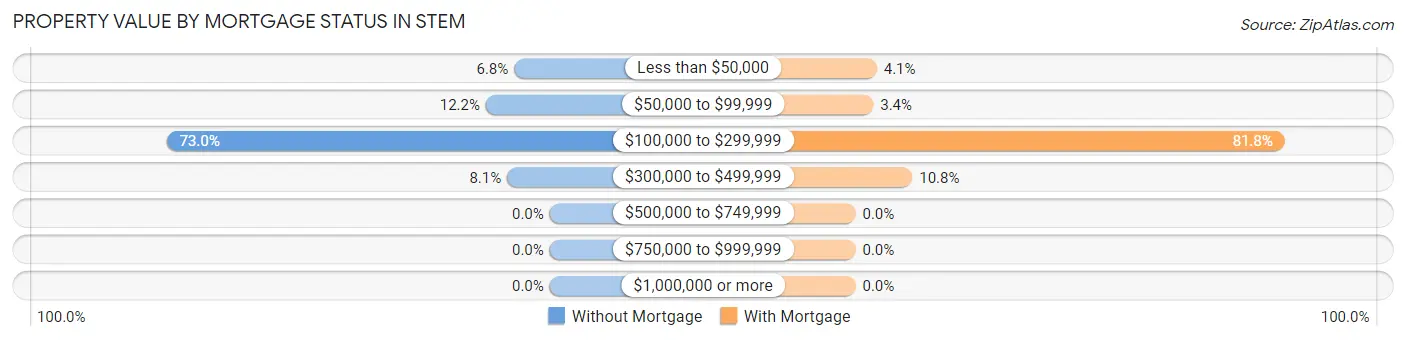
| Property Value | Without Mortgage | With Mortgage |
| Less than $50,000 | 5 (6.8%) | 12 (4.1%) |
| $50,000 to $99,999 | 9 (12.2%) | 10 (3.4%) |
| $100,000 to $299,999 | 54 (73.0%) | 242 (81.8%) |
| $300,000 to $499,999 | 6 (8.1%) | 32 (10.8%) |
| $500,000 to $749,999 | 0 (0.0%) | 0 (0.0%) |
| $750,000 to $999,999 | 0 (0.0%) | 0 (0.0%) |
| $1,000,000 or more | 0 (0.0%) | 0 (0.0%) |
| Total | 74 (100.0%) | 296 (100.0%) |
Household Income by Mortgage Status in Stem
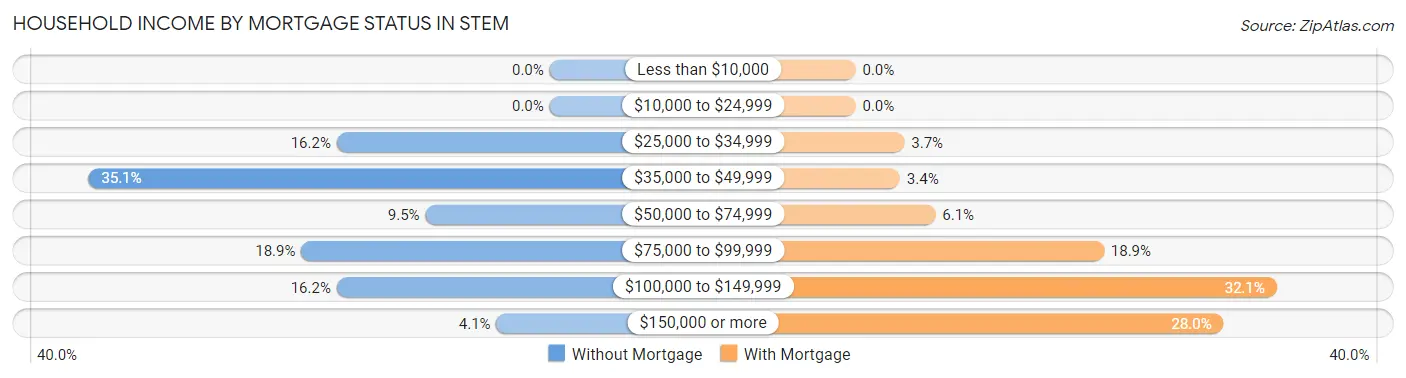
| Household Income | Without Mortgage | With Mortgage |
| Less than $10,000 | 0 (0.0%) | 0 (0.0%) |
| $10,000 to $24,999 | 0 (0.0%) | 0 (0.0%) |
| $25,000 to $34,999 | 12 (16.2%) | 11 (3.7%) |
| $35,000 to $49,999 | 26 (35.1%) | 10 (3.4%) |
| $50,000 to $74,999 | 7 (9.5%) | 18 (6.1%) |
| $75,000 to $99,999 | 14 (18.9%) | 56 (18.9%) |
| $100,000 to $149,999 | 12 (16.2%) | 95 (32.1%) |
| $150,000 or more | 3 (4.1%) | 83 (28.0%) |
| Total | 74 (100.0%) | 296 (100.0%) |
Property Value to Household Income Ratio in Stem
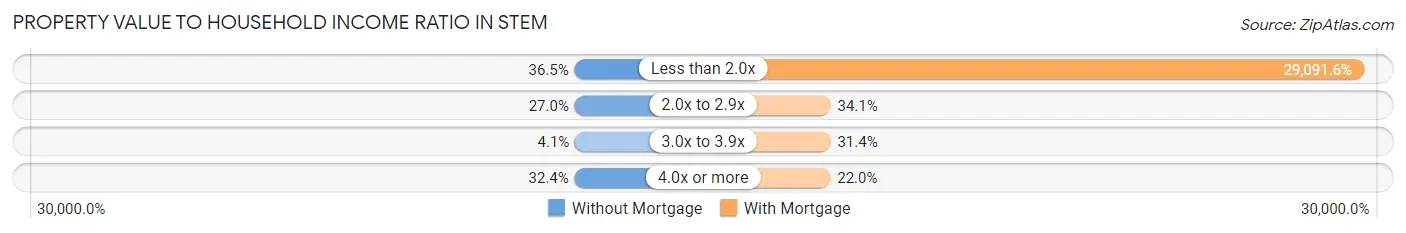
| Value-to-Income Ratio | Without Mortgage | With Mortgage |
| Less than 2.0x | 27 (36.5%) | 86,111 (29,091.6%) |
| 2.0x to 2.9x | 20 (27.0%) | 101 (34.1%) |
| 3.0x to 3.9x | 3 (4.1%) | 93 (31.4%) |
| 4.0x or more | 24 (32.4%) | 65 (22.0%) |
| Total | 74 (100.0%) | 296 (100.0%) |
Real Estate Taxes by Mortgage Status in Stem
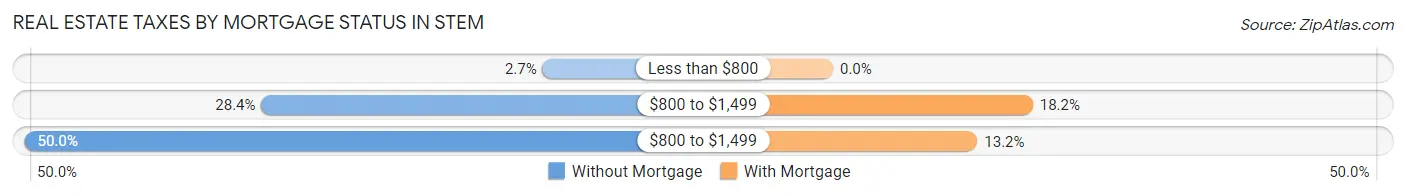
| Property Taxes | Without Mortgage | With Mortgage |
| Less than $800 | 2 (2.7%) | 0 (0.0%) |
| $800 to $1,499 | 21 (28.4%) | 54 (18.2%) |
| $800 to $1,499 | 37 (50.0%) | 39 (13.2%) |
| Total | 74 (100.0%) | 296 (100.0%) |
Health & Disability in Stem
Health Insurance Coverage by Age in Stem
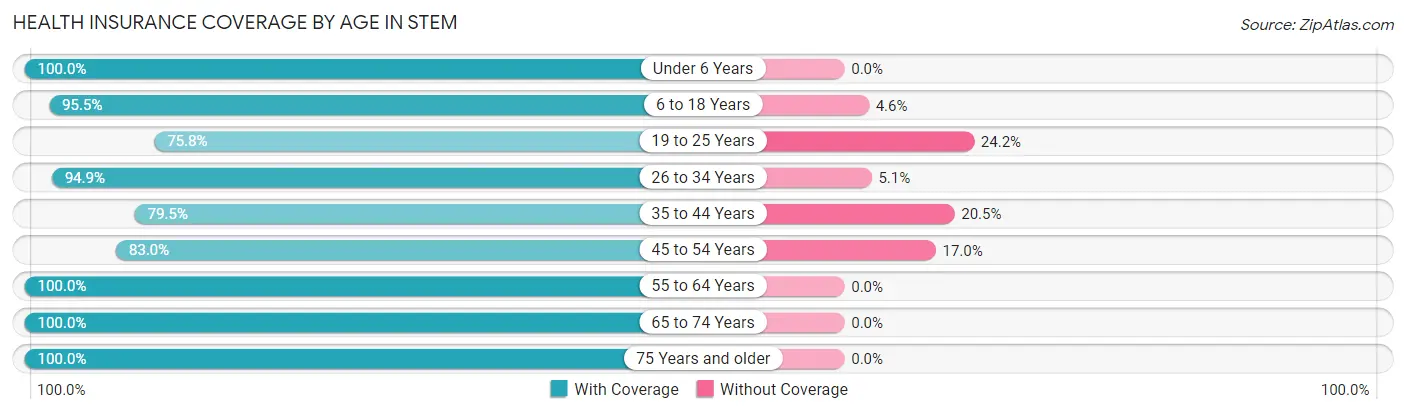
| Age Bracket | With Coverage | Without Coverage |
| Under 6 Years | 120 (100.0%) | 0 (0.0%) |
| 6 to 18 Years | 231 (95.5%) | 11 (4.5%) |
| 19 to 25 Years | 91 (75.8%) | 29 (24.2%) |
| 26 to 34 Years | 150 (94.9%) | 8 (5.1%) |
| 35 to 44 Years | 93 (79.5%) | 24 (20.5%) |
| 45 to 54 Years | 117 (83.0%) | 24 (17.0%) |
| 55 to 64 Years | 61 (100.0%) | 0 (0.0%) |
| 65 to 74 Years | 54 (100.0%) | 0 (0.0%) |
| 75 Years and older | 46 (100.0%) | 0 (0.0%) |
| Total | 963 (90.9%) | 96 (9.1%) |
Health Insurance Coverage by Citizenship Status in Stem
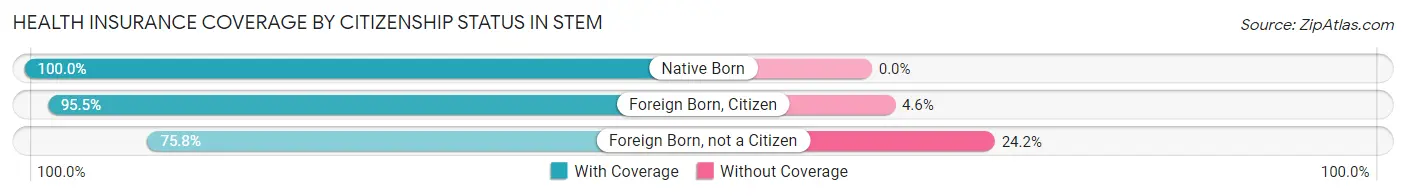
| Citizenship Status | With Coverage | Without Coverage |
| Native Born | 120 (100.0%) | 0 (0.0%) |
| Foreign Born, Citizen | 231 (95.5%) | 11 (4.5%) |
| Foreign Born, not a Citizen | 91 (75.8%) | 29 (24.2%) |
Health Insurance Coverage by Household Income in Stem
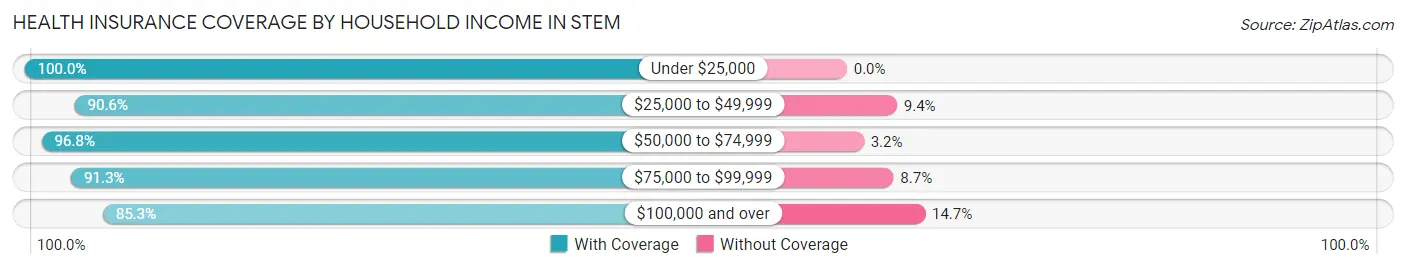
| Household Income | With Coverage | Without Coverage |
| Under $25,000 | 19 (100.0%) | 0 (0.0%) |
| $25,000 to $49,999 | 116 (90.6%) | 12 (9.4%) |
| $50,000 to $74,999 | 275 (96.8%) | 9 (3.2%) |
| $75,000 to $99,999 | 251 (91.3%) | 24 (8.7%) |
| $100,000 and over | 297 (85.3%) | 51 (14.7%) |
Public vs Private Health Insurance Coverage by Age in Stem
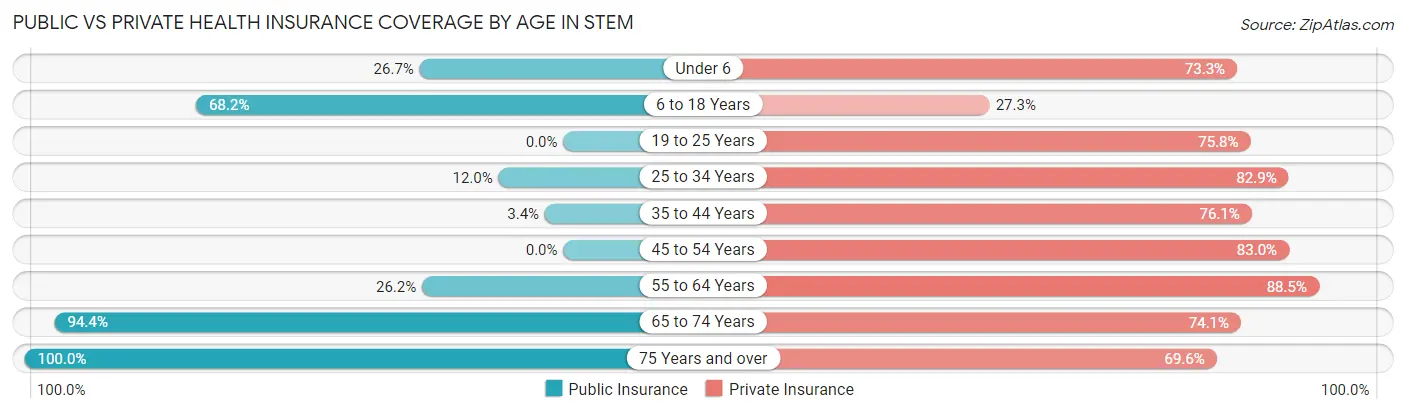
| Age Bracket | Public Insurance | Private Insurance |
| Under 6 | 32 (26.7%) | 88 (73.3%) |
| 6 to 18 Years | 165 (68.2%) | 66 (27.3%) |
| 19 to 25 Years | 0 (0.0%) | 91 (75.8%) |
| 25 to 34 Years | 19 (12.0%) | 131 (82.9%) |
| 35 to 44 Years | 4 (3.4%) | 89 (76.1%) |
| 45 to 54 Years | 0 (0.0%) | 117 (83.0%) |
| 55 to 64 Years | 16 (26.2%) | 54 (88.5%) |
| 65 to 74 Years | 51 (94.4%) | 40 (74.1%) |
| 75 Years and over | 46 (100.0%) | 32 (69.6%) |
| Total | 333 (31.4%) | 708 (66.9%) |
Disability Status by Sex by Age in Stem
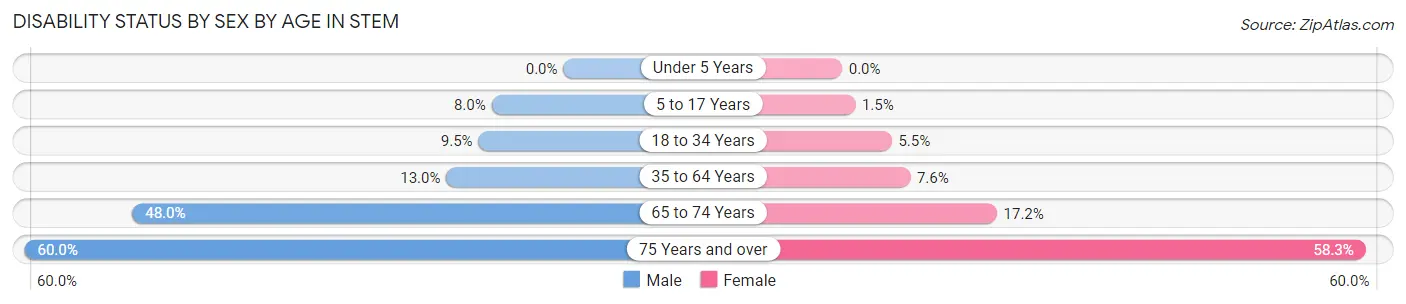
| Age Bracket | Male | Female |
| Under 5 Years | 0 (0.0%) | 0 (0.0%) |
| 5 to 17 Years | 8 (8.0%) | 2 (1.5%) |
| 18 to 34 Years | 7 (9.5%) | 12 (5.5%) |
| 35 to 64 Years | 21 (13.0%) | 12 (7.6%) |
| 65 to 74 Years | 12 (48.0%) | 5 (17.2%) |
| 75 Years and over | 6 (60.0%) | 21 (58.3%) |
Disability Class by Sex by Age in Stem
Disability Class: Hearing Difficulty
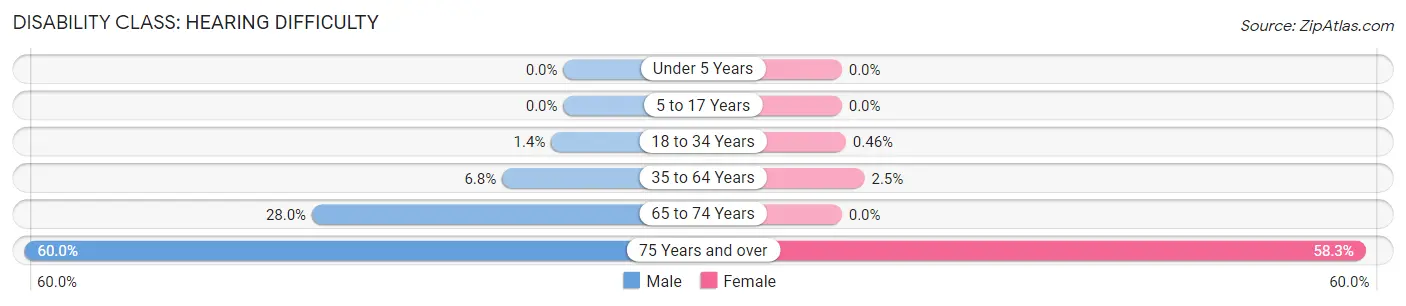
| Age Bracket | Male | Female |
| Under 5 Years | 0 (0.0%) | 0 (0.0%) |
| 5 to 17 Years | 0 (0.0%) | 0 (0.0%) |
| 18 to 34 Years | 1 (1.3%) | 1 (0.5%) |
| 35 to 64 Years | 11 (6.8%) | 4 (2.5%) |
| 65 to 74 Years | 7 (28.0%) | 0 (0.0%) |
| 75 Years and over | 6 (60.0%) | 21 (58.3%) |
Disability Class: Vision Difficulty
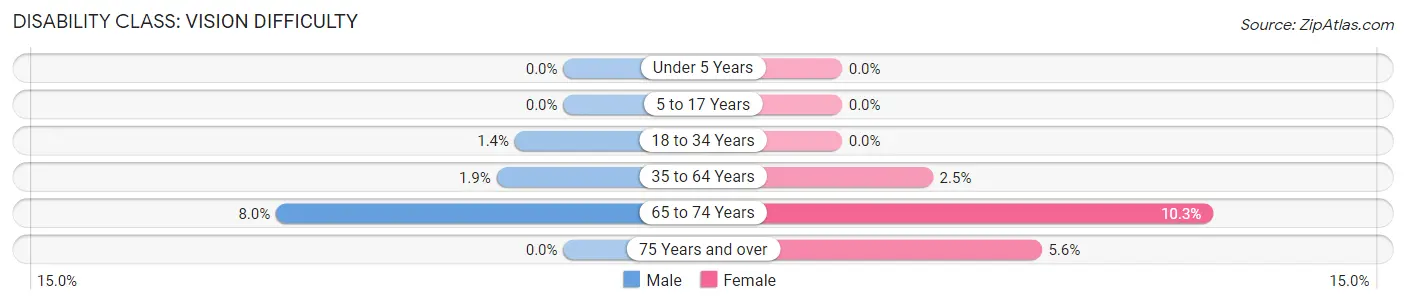
| Age Bracket | Male | Female |
| Under 5 Years | 0 (0.0%) | 0 (0.0%) |
| 5 to 17 Years | 0 (0.0%) | 0 (0.0%) |
| 18 to 34 Years | 1 (1.3%) | 0 (0.0%) |
| 35 to 64 Years | 3 (1.9%) | 4 (2.5%) |
| 65 to 74 Years | 2 (8.0%) | 3 (10.3%) |
| 75 Years and over | 0 (0.0%) | 2 (5.6%) |
Disability Class: Cognitive Difficulty
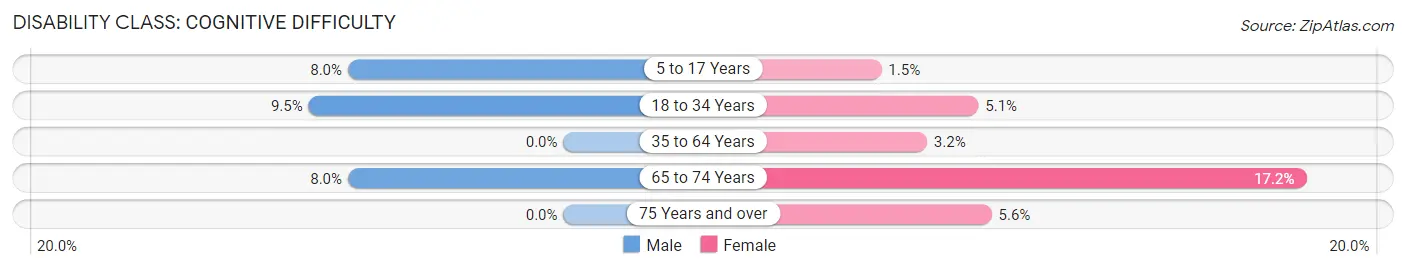
| Age Bracket | Male | Female |
| 5 to 17 Years | 8 (8.0%) | 2 (1.5%) |
| 18 to 34 Years | 7 (9.5%) | 11 (5.1%) |
| 35 to 64 Years | 0 (0.0%) | 5 (3.2%) |
| 65 to 74 Years | 2 (8.0%) | 5 (17.2%) |
| 75 Years and over | 0 (0.0%) | 2 (5.6%) |
Disability Class: Ambulatory Difficulty
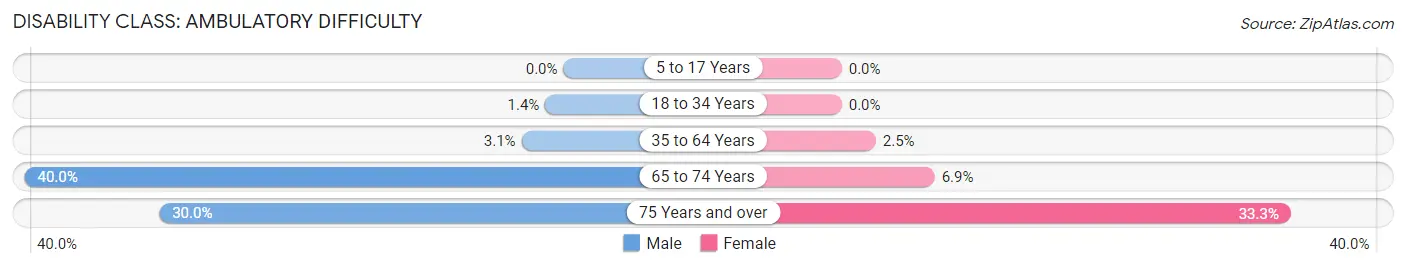
| Age Bracket | Male | Female |
| 5 to 17 Years | 0 (0.0%) | 0 (0.0%) |
| 18 to 34 Years | 1 (1.3%) | 0 (0.0%) |
| 35 to 64 Years | 5 (3.1%) | 4 (2.5%) |
| 65 to 74 Years | 10 (40.0%) | 2 (6.9%) |
| 75 Years and over | 3 (30.0%) | 12 (33.3%) |
Disability Class: Self-Care Difficulty
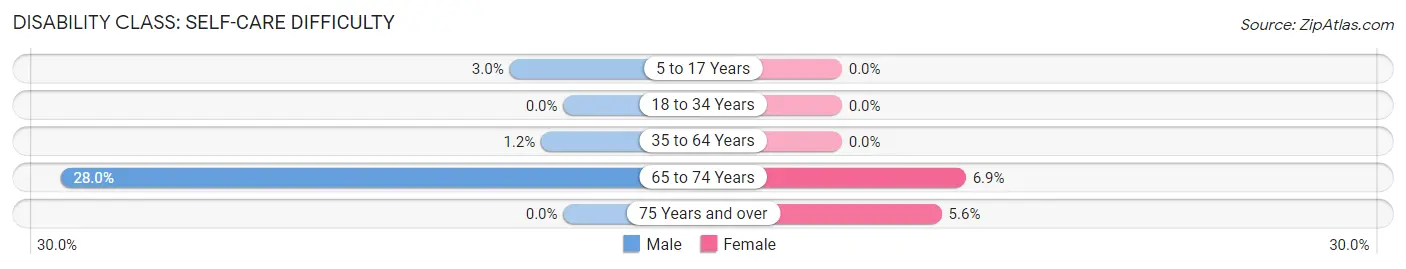
| Age Bracket | Male | Female |
| 5 to 17 Years | 3 (3.0%) | 0 (0.0%) |
| 18 to 34 Years | 0 (0.0%) | 0 (0.0%) |
| 35 to 64 Years | 2 (1.2%) | 0 (0.0%) |
| 65 to 74 Years | 7 (28.0%) | 2 (6.9%) |
| 75 Years and over | 0 (0.0%) | 2 (5.6%) |
Technology Access in Stem
Computing Device Access in Stem
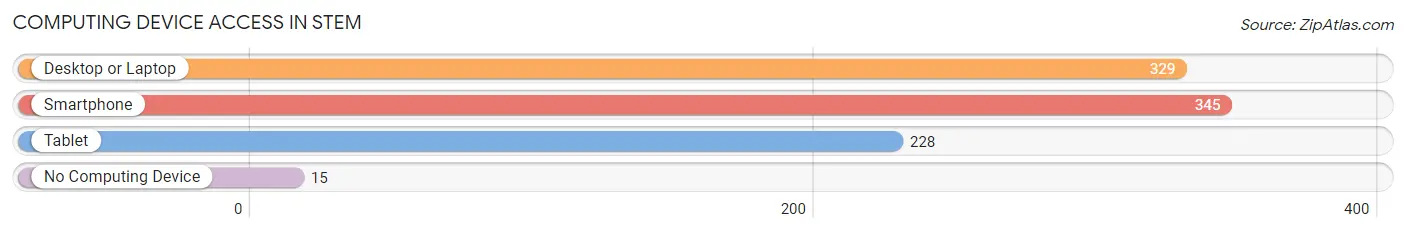
| Device Type | # Households | % Households |
| Desktop or Laptop | 329 | 85.9% |
| Smartphone | 345 | 90.1% |
| Tablet | 228 | 59.5% |
| No Computing Device | 15 | 3.9% |
| Total | 383 | 100.0% |
Internet Access in Stem
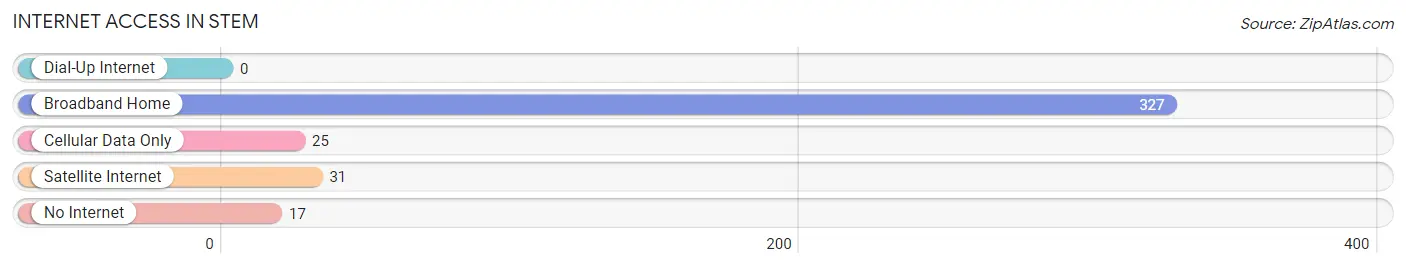
| Internet Type | # Households | % Households |
| Dial-Up Internet | 0 | 0.0% |
| Broadband Home | 327 | 85.4% |
| Cellular Data Only | 25 | 6.5% |
| Satellite Internet | 31 | 8.1% |
| No Internet | 17 | 4.4% |
| Total | 383 | 100.0% |
Stem Summary
North Carolina is a state located in the southeastern United States. It is bordered by South Carolina to the south, Georgia to the southwest, Tennessee to the west, Virginia to the north, and the Atlantic Ocean to the east. North Carolina is the 28th most populous state in the United States, with an estimated population of 10.4 million in 2019.
History
The history of North Carolina dates back to the 16th century, when the first European settlers arrived in the area. The first permanent settlement was established in 1585 by Sir Walter Raleigh, who named the area Virginia in honor of Queen Elizabeth I. The area was later renamed North Carolina in 1663.
North Carolina was one of the original 13 colonies that declared independence from Great Britain in 1776. During the American Revolution, North Carolina was the site of several major battles, including the Battle of Moore's Creek Bridge and the Battle of Guilford Courthouse.
After the war, North Carolina became the 12th state to ratify the United States Constitution in 1789. During the 19th century, North Carolina was a major producer of tobacco, cotton, and naval stores. The state also played a major role in the Civil War, with several major battles taking place in the state.
Geography
North Carolina is located in the southeastern United States, bordered by South Carolina to the south, Georgia to the southwest, Tennessee to the west, Virginia to the north, and the Atlantic Ocean to the east. The state has three major geographic regions: the Coastal Plain, the Piedmont, and the Appalachian Mountains.
The Coastal Plain is a flat, low-lying region that stretches along the Atlantic coast. The Piedmont is a hilly region located in the central part of the state. The Appalachian Mountains are located in the western part of the state and are the highest mountains in the eastern United States.
Economy
North Carolina has a diverse economy that is driven by agriculture, manufacturing, technology, and tourism. Agriculture is the state’s largest industry, with tobacco, cotton, and soybeans being the major crops. Manufacturing is also a major industry, with textiles, furniture, and electronics being the major products.
Technology is a growing industry in North Carolina, with the Research Triangle Park in Raleigh-Durham being a major hub for technology companies. Tourism is also a major industry, with the state’s beaches, mountains, and cities being popular destinations.
Demographics
As of 2019, North Carolina had an estimated population of 10.4 million. The state is racially diverse, with the largest racial groups being White (68.5%), Black or African American (21.5%), and Hispanic or Latino (8.9%). The state is also home to a large Native American population, with the Lumbee tribe being the largest.
The state’s largest cities are Charlotte (872,498), Raleigh (464,758), Greensboro (285,342), Durham (267,587), and Winston-Salem (244,605). The state’s capital is Raleigh. The state’s official language is English, although Spanish is also widely spoken.
Conclusion
North Carolina is a state located in the southeastern United States. It has a rich history, diverse geography, and a diverse economy. The state is home to a diverse population, with the largest racial groups being White, Black or African American, and Hispanic or Latino. North Carolina is a major producer of agriculture, manufacturing, and technology, and is also a popular tourist destination.
Common Questions
What is Per Capita Income in Stem?
Per Capita income in Stem is $32,211.
What is the Median Family Income in Stem?
Median Family Income in Stem is $86,944.
What is the Median Household income in Stem?
Median Household Income in Stem is $82,212.
What is Income or Wage Gap in Stem?
Income or Wage Gap in Stem is 20.1%.
Women in Stem earn 79.9 cents for every dollar earned by a man.
What is Inequality or Gini Index in Stem?
Inequality or Gini Index in Stem is 0.28.
What is the Total Population of Stem?
Total Population of Stem is 1,071.
What is the Total Male Population of Stem?
Total Male Population of Stem is 438.
What is the Total Female Population of Stem?
Total Female Population of Stem is 633.
What is the Ratio of Males per 100 Females in Stem?
There are 69.19 Males per 100 Females in Stem.
What is the Ratio of Females per 100 Males in Stem?
There are 144.52 Females per 100 Males in Stem.
What is the Median Population Age in Stem?
Median Population Age in Stem is 29.1 Years.
What is the Average Family Size in Stem
Average Family Size in Stem is 3.1 People.
What is the Average Household Size in Stem
Average Household Size in Stem is 2.8 People.
How Large is the Labor Force in Stem?
There are 576 People in the Labor Forcein in Stem.
What is the Percentage of People in the Labor Force in Stem?
77.7% of People are in the Labor Force in Stem.
What is the Unemployment Rate in Stem?
Unemployment Rate in Stem is 3.4%.