Corona de Tucson, AZ Map & Demographics
Corona de Tucson Map
Corona de Tucson Overview
$42,866
PER CAPITA INCOME
$112,574
AVG FAMILY INCOME
$106,049
AVG HOUSEHOLD INCOME
50.4%
WAGE / INCOME GAP [ % ]
49.6¢/ $1
WAGE / INCOME GAP [ $ ]
0.36
INEQUALITY / GINI INDEX
8,742
TOTAL POPULATION
4,427
MALE POPULATION
4,315
FEMALE POPULATION
102.60
MALES / 100 FEMALES
97.47
FEMALES / 100 MALES
37.4
MEDIAN AGE
3.3
AVG FAMILY SIZE
2.9
AVG HOUSEHOLD SIZE
4,126
LABOR FORCE [ PEOPLE ]
65.9%
PERCENT IN LABOR FORCE
3.6%
UNEMPLOYMENT RATE
Corona de Tucson Area Codes
Income in Corona de Tucson
Income Overview in Corona de Tucson
Per Capita Income in Corona de Tucson is $42,866, while median incomes of families and households are $112,574 and $106,049 respectively.
| Characteristic | Number | Measure |
| Per Capita Income | 8,742 | $42,866 |
| Median Family Income | 2,359 | $112,574 |
| Mean Family Income | 2,359 | $134,737 |
| Median Household Income | 2,972 | $106,049 |
| Mean Household Income | 2,972 | $124,400 |
| Income Deficit | 2,359 | $0 |
| Wage / Income Gap (%) | 8,742 | 50.40% |
| Wage / Income Gap ($) | 8,742 | 49.60¢ per $1 |
| Gini / Inequality Index | 8,742 | 0.36 |
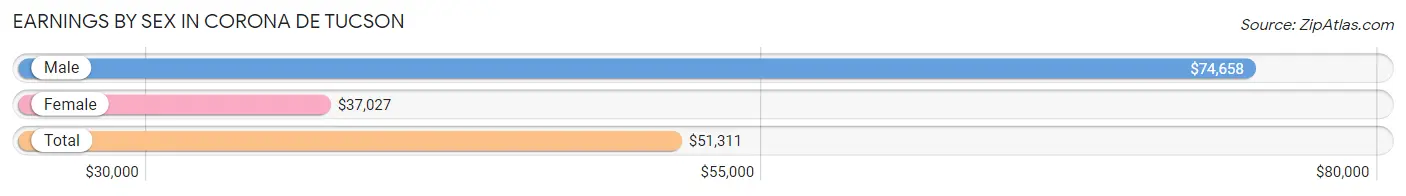
Earnings by Sex in Corona de Tucson
Average Earnings in Corona de Tucson are $51,311, $74,658 for men and $37,027 for women, a difference of 50.4%.
| Sex | Number | Average Earnings |
| Male | 2,259 (52.9%) | $74,658 |
| Female | 2,012 (47.1%) | $37,027 |
| Total | 4,271 (100.0%) | $51,311 |
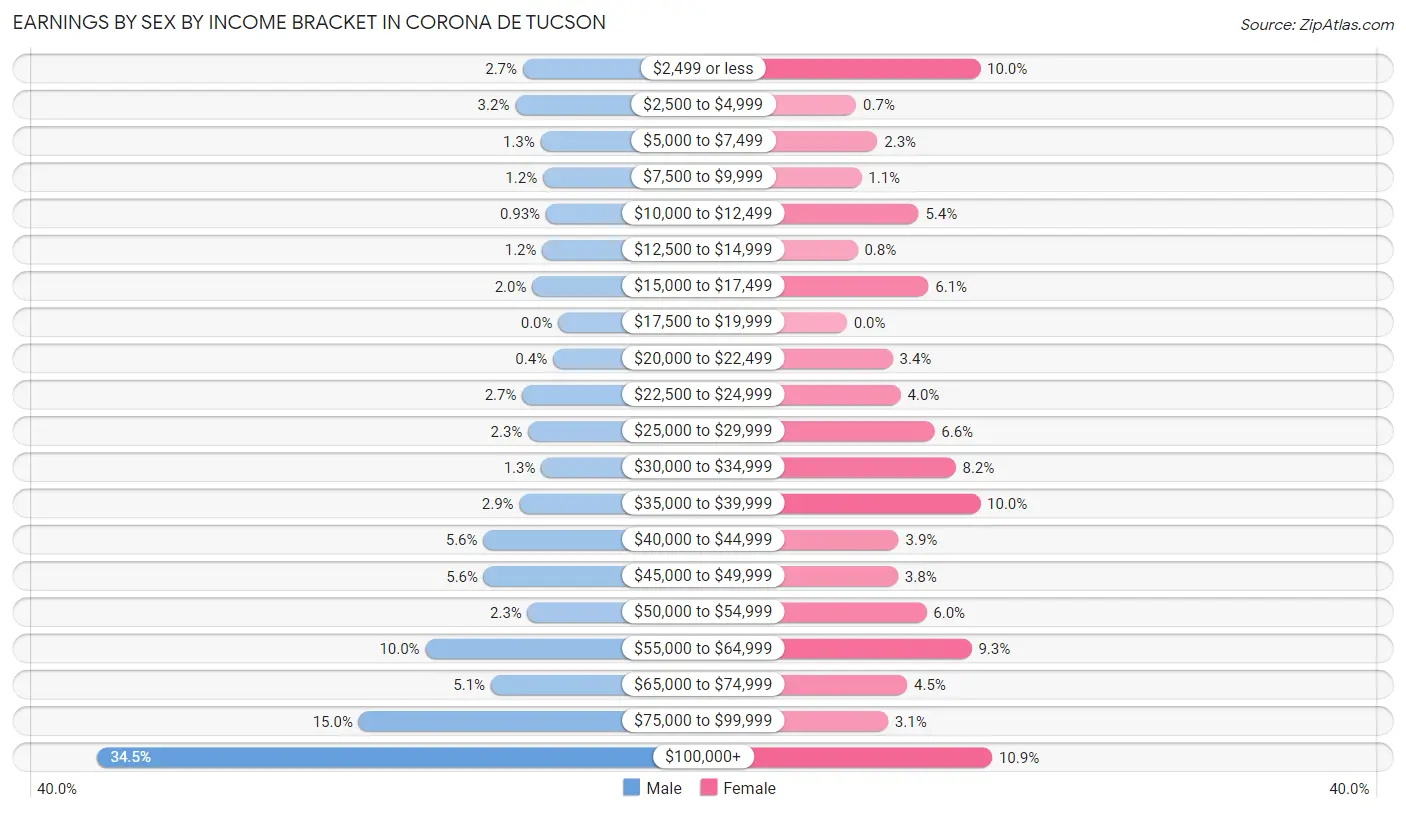
Earnings by Sex by Income Bracket in Corona de Tucson
The most common earnings brackets in Corona de Tucson are $100,000+ for men (780 | 34.5%) and $100,000+ for women (219 | 10.9%).
| Income | Male | Female |
| $2,499 or less | 60 (2.7%) | 201 (10.0%) |
| $2,500 to $4,999 | 73 (3.2%) | 14 (0.7%) |
| $5,000 to $7,499 | 30 (1.3%) | 46 (2.3%) |
| $7,500 to $9,999 | 26 (1.1%) | 22 (1.1%) |
| $10,000 to $12,499 | 21 (0.9%) | 108 (5.4%) |
| $12,500 to $14,999 | 27 (1.2%) | 16 (0.8%) |
| $15,000 to $17,499 | 44 (1.9%) | 123 (6.1%) |
| $17,500 to $19,999 | 0 (0.0%) | 0 (0.0%) |
| $20,000 to $22,499 | 9 (0.4%) | 69 (3.4%) |
| $22,500 to $24,999 | 61 (2.7%) | 81 (4.0%) |
| $25,000 to $29,999 | 51 (2.3%) | 132 (6.6%) |
| $30,000 to $34,999 | 29 (1.3%) | 164 (8.2%) |
| $35,000 to $39,999 | 66 (2.9%) | 201 (10.0%) |
| $40,000 to $44,999 | 127 (5.6%) | 78 (3.9%) |
| $45,000 to $49,999 | 126 (5.6%) | 77 (3.8%) |
| $50,000 to $54,999 | 52 (2.3%) | 120 (6.0%) |
| $55,000 to $64,999 | 225 (10.0%) | 188 (9.3%) |
| $65,000 to $74,999 | 114 (5.1%) | 91 (4.5%) |
| $75,000 to $99,999 | 338 (15.0%) | 62 (3.1%) |
| $100,000+ | 780 (34.5%) | 219 (10.9%) |
| Total | 2,259 (100.0%) | 2,012 (100.0%) |
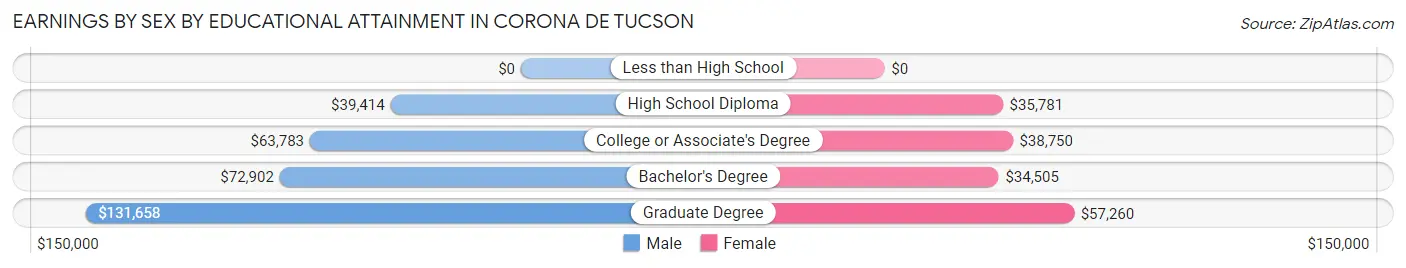
Earnings by Sex by Educational Attainment in Corona de Tucson
Average earnings in Corona de Tucson are $82,470 for men and $38,864 for women, a difference of 52.9%. Men with an educational attainment of graduate degree enjoy the highest average annual earnings of $131,658, while those with high school diploma education earn the least with $39,414. Women with an educational attainment of graduate degree earn the most with the average annual earnings of $57,260, while those with bachelor's degree education have the smallest earnings of $34,505.
| Educational Attainment | Male Income | Female Income |
| Less than High School | - | - |
| High School Diploma | $39,414 | $35,781 |
| College or Associate's Degree | $63,783 | $38,750 |
| Bachelor's Degree | $72,902 | $34,505 |
| Graduate Degree | $131,658 | $57,260 |
| Total | $82,470 | $38,864 |
Family Income in Corona de Tucson
Family Income Brackets in Corona de Tucson
According to the Corona de Tucson family income data, there are 776 families falling into the $100,000 to $149,999 income range, which is the most common income bracket and makes up 32.9% of all families.
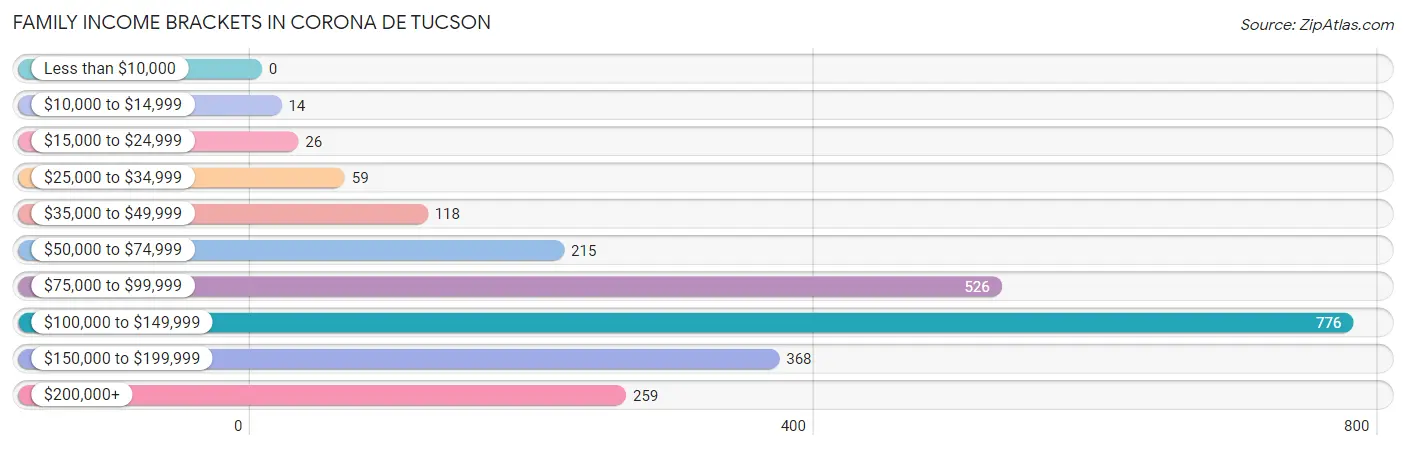
| Income Bracket | # Families | % Families |
| Less than $10,000 | 0 | 0.0% |
| $10,000 to $14,999 | 14 | 0.6% |
| $15,000 to $24,999 | 26 | 1.1% |
| $25,000 to $34,999 | 59 | 2.5% |
| $35,000 to $49,999 | 118 | 5.0% |
| $50,000 to $74,999 | 215 | 9.1% |
| $75,000 to $99,999 | 526 | 22.3% |
| $100,000 to $149,999 | 776 | 32.9% |
| $150,000 to $199,999 | 368 | 15.6% |
| $200,000+ | 259 | 11.0% |
Family Income by Famaliy Size in Corona de Tucson
5-person families (167 | 7.1%) account for the highest median family income in Corona de Tucson with $150,313 per family, while 2-person families (845 | 35.8%) have the highest median income of $54,330 per family member.
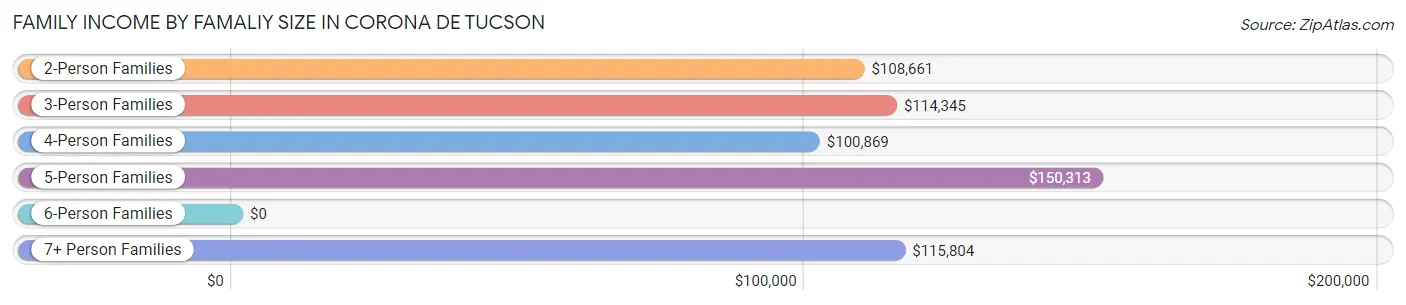
| Income Bracket | # Families | Median Income |
| 2-Person Families | 845 (35.8%) | $108,661 |
| 3-Person Families | 406 (17.2%) | $114,345 |
| 4-Person Families | 857 (36.3%) | $100,869 |
| 5-Person Families | 167 (7.1%) | $150,313 |
| 6-Person Families | 53 (2.2%) | $0 |
| 7+ Person Families | 31 (1.3%) | $115,804 |
| Total | 2,359 (100.0%) | $112,574 |
Family Income by Number of Earners in Corona de Tucson
The median family income in Corona de Tucson is $112,574, with families comprising 1 earner (605) having the highest median family income of $133,634, while families with no earners (322) have the lowest median family income of $75,787, accounting for 25.7% and 13.7% of families, respectively.
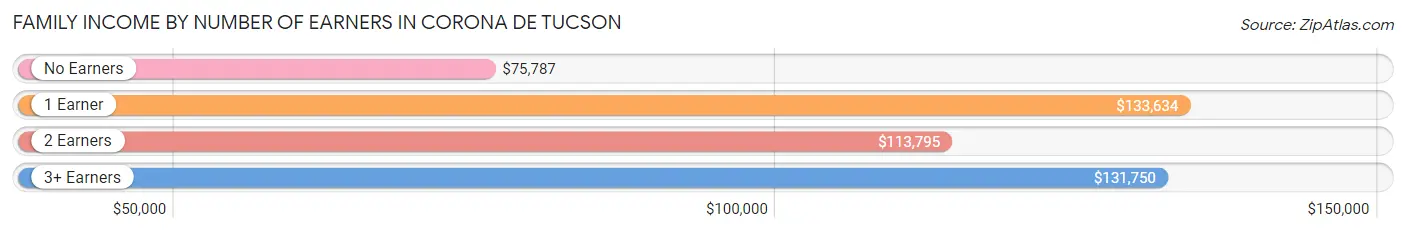
| Number of Earners | # Families | Median Income |
| No Earners | 322 (13.7%) | $75,787 |
| 1 Earner | 605 (25.7%) | $133,634 |
| 2 Earners | 1,271 (53.9%) | $113,795 |
| 3+ Earners | 161 (6.8%) | $131,750 |
| Total | 2,359 (100.0%) | $112,574 |
Household Income in Corona de Tucson
Household Income Brackets in Corona de Tucson
With 1,005 households falling in the category, the $100,000 to $149,999 income range is the most frequent in Corona de Tucson, accounting for 33.8% of all households. In contrast, only 15 households (0.5%) fall into the $10,000 to $14,999 income bracket, making it the least populous group.
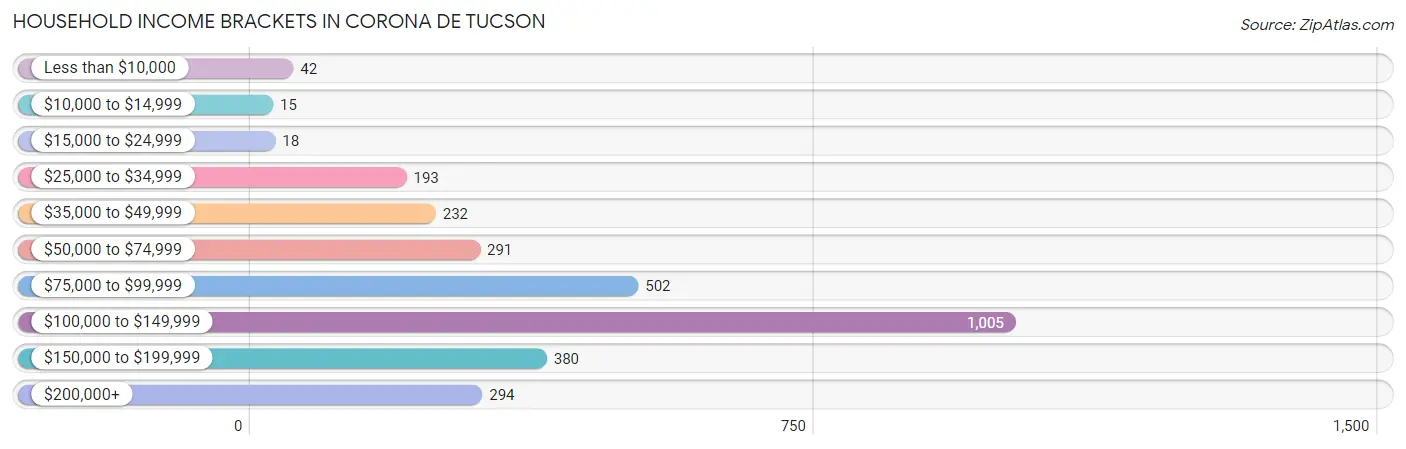
| Income Bracket | # Households | % Households |
| Less than $10,000 | 42 | 1.4% |
| $10,000 to $14,999 | 15 | 0.5% |
| $15,000 to $24,999 | 18 | 0.6% |
| $25,000 to $34,999 | 193 | 6.5% |
| $35,000 to $49,999 | 232 | 7.8% |
| $50,000 to $74,999 | 291 | 9.8% |
| $75,000 to $99,999 | 502 | 16.9% |
| $100,000 to $149,999 | 1,005 | 33.8% |
| $150,000 to $199,999 | 380 | 12.8% |
| $200,000+ | 294 | 9.9% |
Household Income by Householder Age in Corona de Tucson
The median household income in Corona de Tucson is $106,049, with the highest median household income of $125,323 found in the 45 to 64 years age bracket for the primary householder. A total of 1,036 households (34.9%) fall into this category. Meanwhile, the 15 to 24 years age bracket for the primary householder has the lowest median household income of $0, with 38 households (1.3%) in this group.
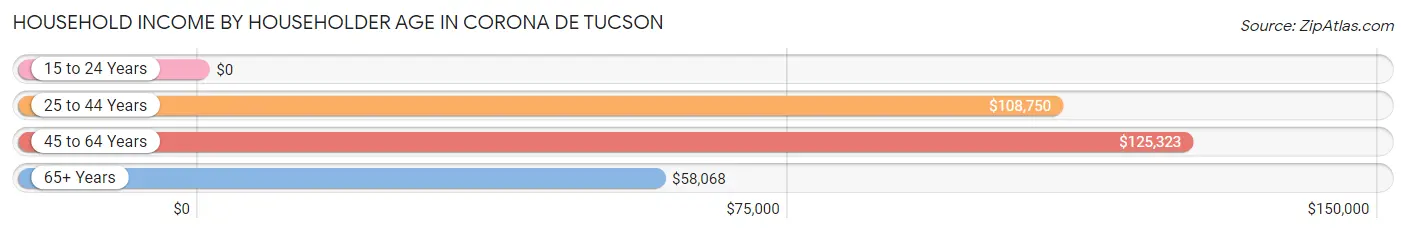
| Income Bracket | # Households | Median Income |
| 15 to 24 Years | 38 (1.3%) | $0 |
| 25 to 44 Years | 1,189 (40.0%) | $108,750 |
| 45 to 64 Years | 1,036 (34.9%) | $125,323 |
| 65+ Years | 709 (23.9%) | $58,068 |
| Total | 2,972 (100.0%) | $106,049 |
Poverty in Corona de Tucson
Income Below Poverty by Sex and Age in Corona de Tucson
With 2.7% poverty level for males and 2.5% for females among the residents of Corona de Tucson, 18 to 24 year old males and 25 to 34 year old females are the most vulnerable to poverty, with 26 males (13.4%) and 67 females (13.3%) in their respective age groups living below the poverty level.
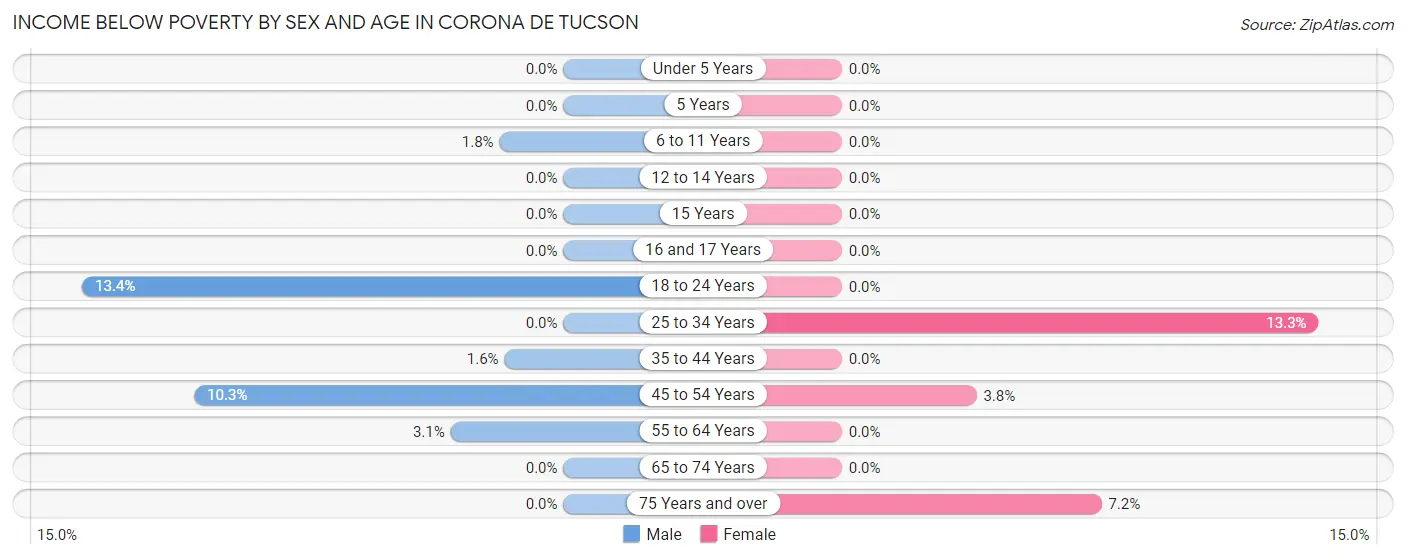
| Age Bracket | Male | Female |
| Under 5 Years | 0 (0.0%) | 0 (0.0%) |
| 5 Years | 0 (0.0%) | 0 (0.0%) |
| 6 to 11 Years | 13 (1.8%) | 0 (0.0%) |
| 12 to 14 Years | 0 (0.0%) | 0 (0.0%) |
| 15 Years | 0 (0.0%) | 0 (0.0%) |
| 16 and 17 Years | 0 (0.0%) | 0 (0.0%) |
| 18 to 24 Years | 26 (13.4%) | 0 (0.0%) |
| 25 to 34 Years | 0 (0.0%) | 67 (13.3%) |
| 35 to 44 Years | 13 (1.6%) | 0 (0.0%) |
| 45 to 54 Years | 55 (10.3%) | 25 (3.7%) |
| 55 to 64 Years | 13 (3.1%) | 0 (0.0%) |
| 65 to 74 Years | 0 (0.0%) | 0 (0.0%) |
| 75 Years and over | 0 (0.0%) | 18 (7.2%) |
| Total | 120 (2.7%) | 110 (2.5%) |
Income Above Poverty by Sex and Age in Corona de Tucson
According to the poverty statistics in Corona de Tucson, males aged under 5 years and females aged under 5 years are the age groups that are most secure financially, with 100.0% of males and 100.0% of females in these age groups living above the poverty line.
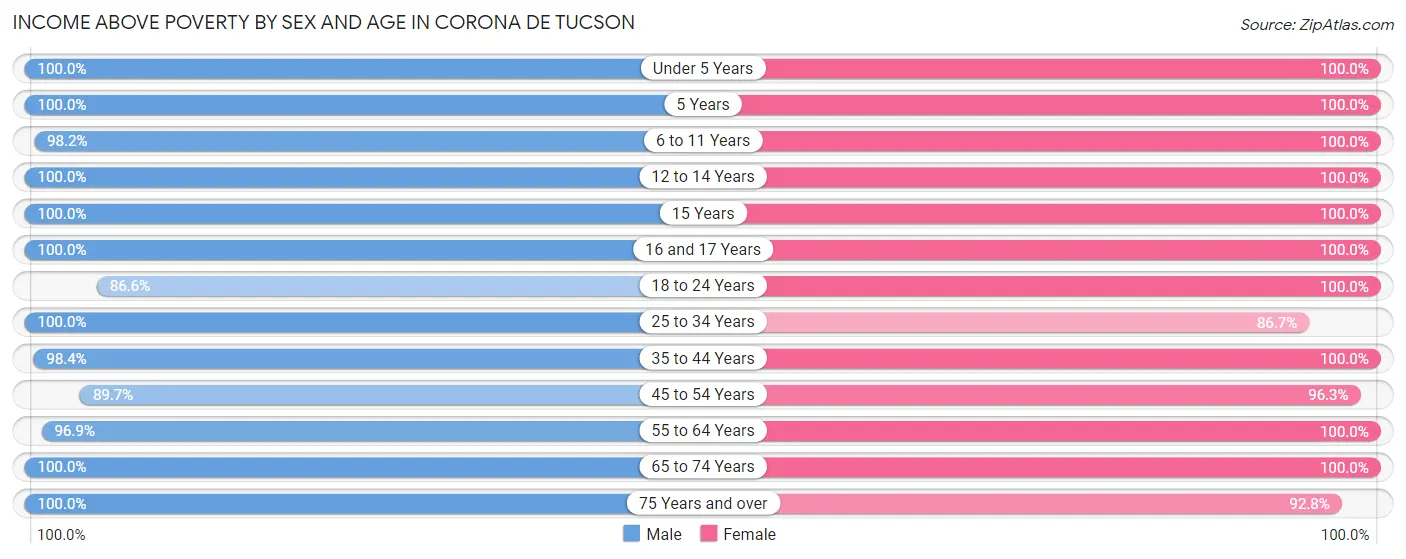
| Age Bracket | Male | Female |
| Under 5 Years | 255 (100.0%) | 357 (100.0%) |
| 5 Years | 55 (100.0%) | 70 (100.0%) |
| 6 to 11 Years | 719 (98.2%) | 419 (100.0%) |
| 12 to 14 Years | 254 (100.0%) | 274 (100.0%) |
| 15 Years | 44 (100.0%) | 21 (100.0%) |
| 16 and 17 Years | 71 (100.0%) | 121 (100.0%) |
| 18 to 24 Years | 168 (86.6%) | 215 (100.0%) |
| 25 to 34 Years | 527 (100.0%) | 438 (86.7%) |
| 35 to 44 Years | 778 (98.4%) | 747 (100.0%) |
| 45 to 54 Years | 480 (89.7%) | 641 (96.3%) |
| 55 to 64 Years | 401 (96.9%) | 336 (100.0%) |
| 65 to 74 Years | 366 (100.0%) | 335 (100.0%) |
| 75 Years and over | 189 (100.0%) | 231 (92.8%) |
| Total | 4,307 (97.3%) | 4,205 (97.5%) |
Income Below Poverty Among Married-Couple Families in Corona de Tucson
The poverty statistics for married-couple families in Corona de Tucson show that 1.1% or 25 of the total 2,198 families live below the poverty line. Families with 1 or 2 children have the highest poverty rate of 1.4%, comprising of 14 families. On the other hand, families with 3 or 4 children have the lowest poverty rate of 0.0%, which includes 0 families.
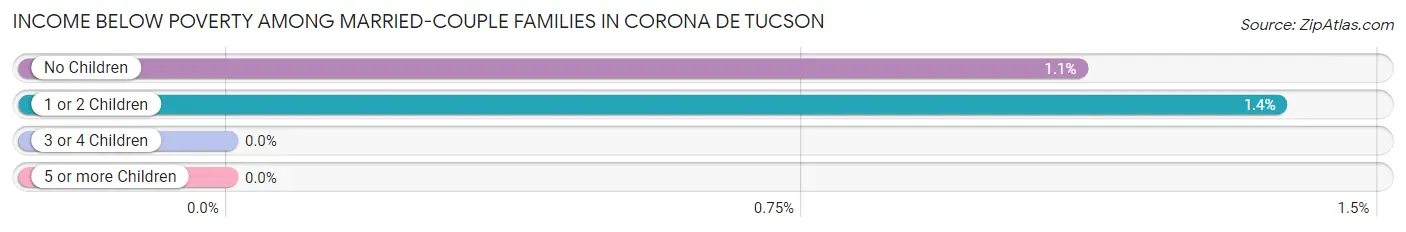
| Children | Above Poverty | Below Poverty |
| No Children | 979 (98.9%) | 11 (1.1%) |
| 1 or 2 Children | 1,005 (98.6%) | 14 (1.4%) |
| 3 or 4 Children | 169 (100.0%) | 0 (0.0%) |
| 5 or more Children | 20 (100.0%) | 0 (0.0%) |
| Total | 2,173 (98.9%) | 25 (1.1%) |
Income Below Poverty Among Single-Parent Households in Corona de Tucson
| Children | Single Father | Single Mother |
| No Children | 0 (0.0%) | 0 (0.0%) |
| 1 or 2 Children | 0 (0.0%) | 0 (0.0%) |
| 3 or 4 Children | 0 (0.0%) | 0 (0.0%) |
| 5 or more Children | 0 (0.0%) | 0 (0.0%) |
| Total | 0 (0.0%) | 0 (0.0%) |
Income Below Poverty Among Married-Couple vs Single-Parent Households in Corona de Tucson
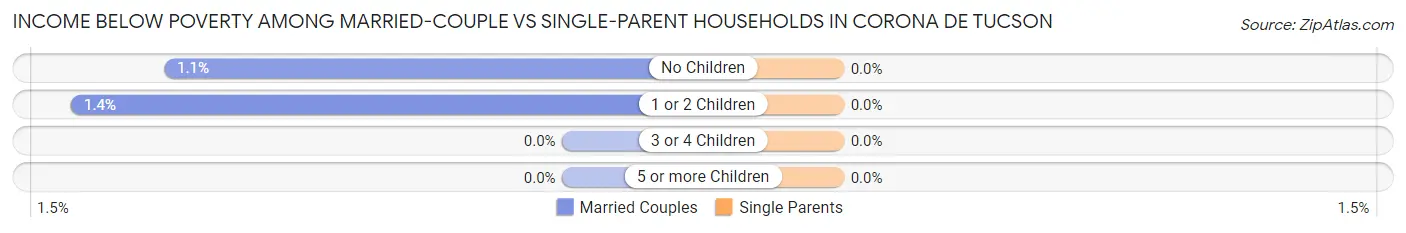
| Children | Married-Couple Families | Single-Parent Households |
| No Children | 11 (1.1%) | 0 (0.0%) |
| 1 or 2 Children | 14 (1.4%) | 0 (0.0%) |
| 3 or 4 Children | 0 (0.0%) | 0 (0.0%) |
| 5 or more Children | 0 (0.0%) | 0 (0.0%) |
| Total | 25 (1.1%) | 0 (0.0%) |
Race in Corona de Tucson
The most populous races in Corona de Tucson are White / Caucasian (7,126 | 81.5%), Hispanic or Latino (1,943 | 22.2%), and Two or more Races (712 | 8.1%).
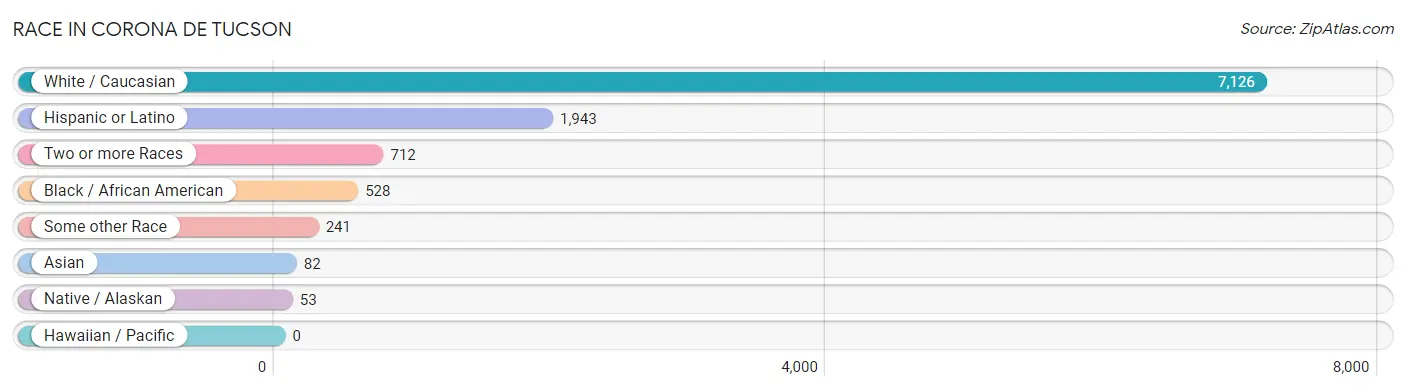
| Race | # Population | % Population |
| Asian | 82 | 0.9% |
| Black / African American | 528 | 6.0% |
| Hawaiian / Pacific | 0 | 0.0% |
| Hispanic or Latino | 1,943 | 22.2% |
| Native / Alaskan | 53 | 0.6% |
| White / Caucasian | 7,126 | 81.5% |
| Two or more Races | 712 | 8.1% |
| Some other Race | 241 | 2.8% |
| Total | 8,742 | 100.0% |
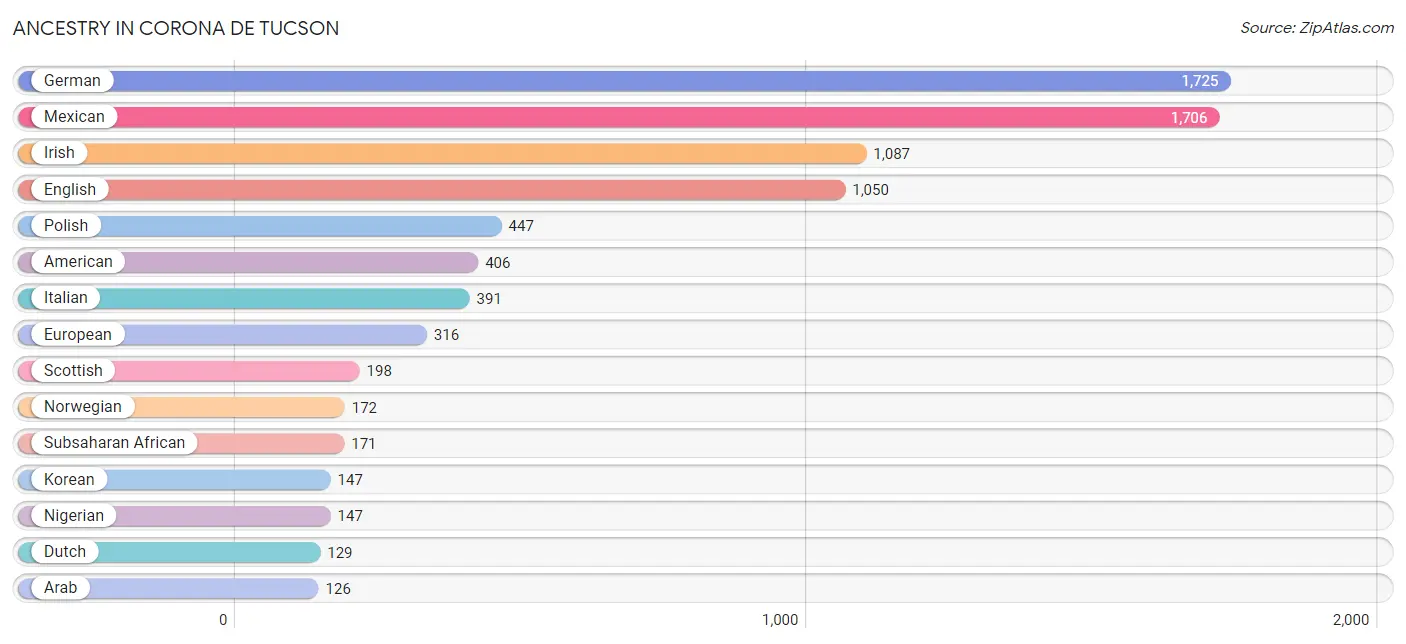
Ancestry in Corona de Tucson
The most populous ancestries reported in Corona de Tucson are German (1,725 | 19.7%), Mexican (1,706 | 19.5%), Irish (1,087 | 12.4%), English (1,050 | 12.0%), and Polish (447 | 5.1%), together accounting for 68.8% of all Corona de Tucson residents.
| Ancestry | # Population | % Population |
| African | 9 | 0.1% |
| American | 406 | 4.6% |
| Arab | 126 | 1.4% |
| Bhutanese | 92 | 1.1% |
| British | 32 | 0.4% |
| British West Indian | 8 | 0.1% |
| Burmese | 42 | 0.5% |
| Canadian | 27 | 0.3% |
| Central American | 25 | 0.3% |
| Central American Indian | 24 | 0.3% |
| Croatian | 8 | 0.1% |
| Cuban | 33 | 0.4% |
| Czech | 8 | 0.1% |
| Danish | 18 | 0.2% |
| Dutch | 129 | 1.5% |
| Eastern European | 72 | 0.8% |
| English | 1,050 | 12.0% |
| European | 316 | 3.6% |
| Finnish | 17 | 0.2% |
| French | 96 | 1.1% |
| French Canadian | 109 | 1.3% |
| German | 1,725 | 19.7% |
| Greek | 43 | 0.5% |
| Guatemalan | 24 | 0.3% |
| Hungarian | 13 | 0.2% |
| Irish | 1,087 | 12.4% |
| Italian | 391 | 4.5% |
| Kenyan | 15 | 0.2% |
| Korean | 147 | 1.7% |
| Lebanese | 126 | 1.4% |
| Mexican | 1,706 | 19.5% |
| Nigerian | 147 | 1.7% |
| Northern European | 101 | 1.2% |
| Norwegian | 172 | 2.0% |
| Peruvian | 23 | 0.3% |
| Polish | 447 | 5.1% |
| Puerto Rican | 48 | 0.5% |
| Russian | 63 | 0.7% |
| Salvadoran | 1 | 0.0% |
| Scandinavian | 61 | 0.7% |
| Scotch-Irish | 61 | 0.7% |
| Scottish | 198 | 2.3% |
| South American | 23 | 0.3% |
| Spaniard | 108 | 1.2% |
| Subsaharan African | 171 | 2.0% |
| Swedish | 87 | 1.0% |
| Swiss | 61 | 0.7% |
| Tohono O'Odham | 33 | 0.4% |
| U.S. Virgin Islander | 8 | 0.1% |
| Welsh | 82 | 0.9% |
| West Indian | 63 | 0.7% | View All 51 Rows |
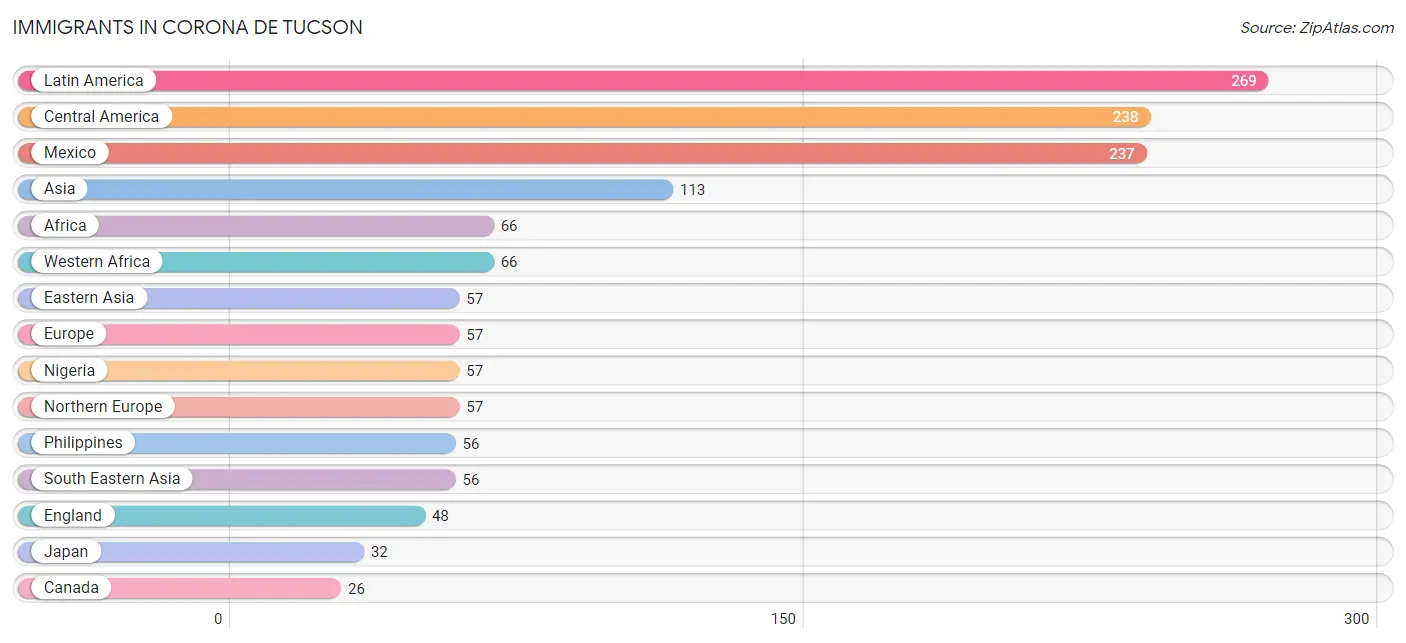
Immigrants in Corona de Tucson
The most numerous immigrant groups reported in Corona de Tucson came from Latin America (269 | 3.1%), Central America (238 | 2.7%), Mexico (237 | 2.7%), Asia (113 | 1.3%), and Africa (66 | 0.7%), together accounting for 10.5% of all Corona de Tucson residents.
| Immigration Origin | # Population | % Population |
| Africa | 66 | 0.7% |
| Asia | 113 | 1.3% |
| Barbados | 8 | 0.1% |
| Canada | 26 | 0.3% |
| Caribbean | 8 | 0.1% |
| Central America | 238 | 2.7% |
| China | 12 | 0.1% |
| Eastern Asia | 57 | 0.6% |
| El Salvador | 1 | 0.0% |
| England | 48 | 0.5% |
| Europe | 57 | 0.6% |
| Japan | 32 | 0.4% |
| Korea | 13 | 0.2% |
| Latin America | 269 | 3.1% |
| Mexico | 237 | 2.7% |
| Nigeria | 57 | 0.6% |
| Northern Europe | 57 | 0.6% |
| Peru | 23 | 0.3% |
| Philippines | 56 | 0.6% |
| South America | 23 | 0.3% |
| South Eastern Asia | 56 | 0.6% |
| Taiwan | 12 | 0.1% |
| Western Africa | 66 | 0.7% | View All 23 Rows |
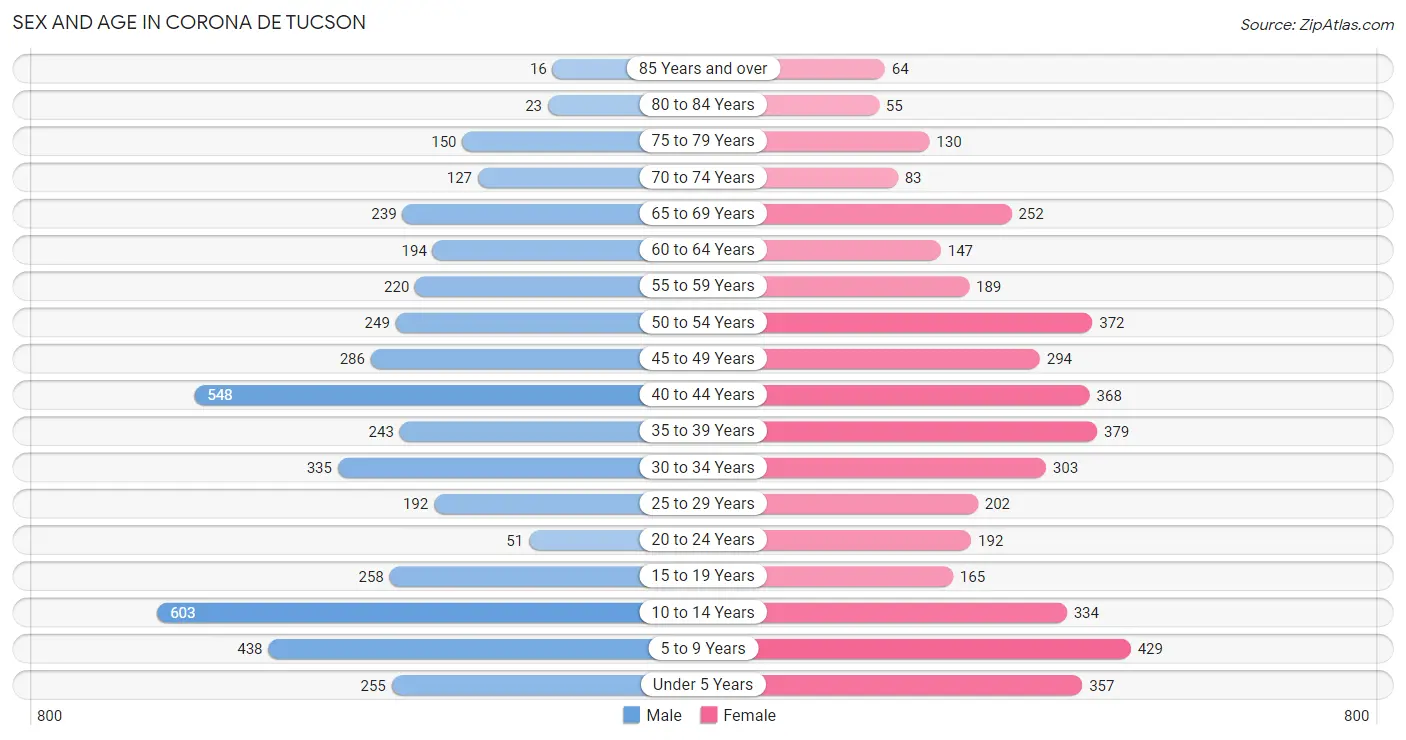
Sex and Age in Corona de Tucson
Sex and Age in Corona de Tucson
The most populous age groups in Corona de Tucson are 10 to 14 Years (603 | 13.6%) for men and 5 to 9 Years (429 | 9.9%) for women.
| Age Bracket | Male | Female |
| Under 5 Years | 255 (5.8%) | 357 (8.3%) |
| 5 to 9 Years | 438 (9.9%) | 429 (9.9%) |
| 10 to 14 Years | 603 (13.6%) | 334 (7.7%) |
| 15 to 19 Years | 258 (5.8%) | 165 (3.8%) |
| 20 to 24 Years | 51 (1.1%) | 192 (4.4%) |
| 25 to 29 Years | 192 (4.3%) | 202 (4.7%) |
| 30 to 34 Years | 335 (7.6%) | 303 (7.0%) |
| 35 to 39 Years | 243 (5.5%) | 379 (8.8%) |
| 40 to 44 Years | 548 (12.4%) | 368 (8.5%) |
| 45 to 49 Years | 286 (6.5%) | 294 (6.8%) |
| 50 to 54 Years | 249 (5.6%) | 372 (8.6%) |
| 55 to 59 Years | 220 (5.0%) | 189 (4.4%) |
| 60 to 64 Years | 194 (4.4%) | 147 (3.4%) |
| 65 to 69 Years | 239 (5.4%) | 252 (5.8%) |
| 70 to 74 Years | 127 (2.9%) | 83 (1.9%) |
| 75 to 79 Years | 150 (3.4%) | 130 (3.0%) |
| 80 to 84 Years | 23 (0.5%) | 55 (1.3%) |
| 85 Years and over | 16 (0.4%) | 64 (1.5%) |
| Total | 4,427 (100.0%) | 4,315 (100.0%) |
Families and Households in Corona de Tucson
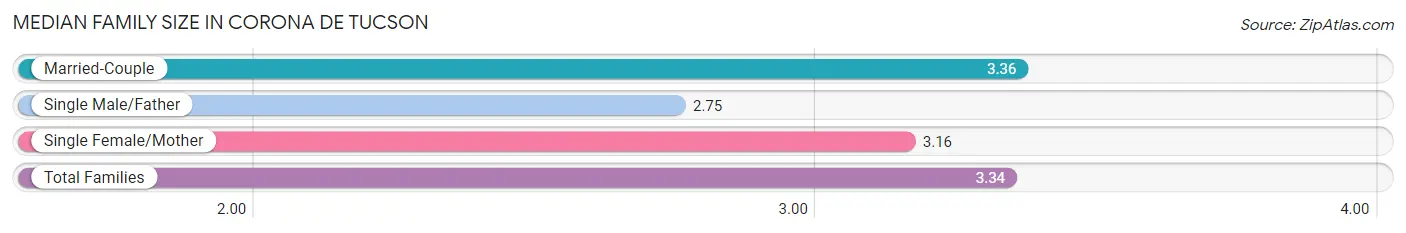
Median Family Size in Corona de Tucson
The median family size in Corona de Tucson is 3.34 persons per family, with married-couple families (2,198 | 93.2%) accounting for the largest median family size of 3.36 persons per family. On the other hand, single male/father families (24 | 1.0%) represent the smallest median family size with 2.75 persons per family.
| Family Type | # Families | Family Size |
| Married-Couple | 2,198 (93.2%) | 3.36 |
| Single Male/Father | 24 (1.0%) | 2.75 |
| Single Female/Mother | 137 (5.8%) | 3.16 |
| Total Families | 2,359 (100.0%) | 3.34 |
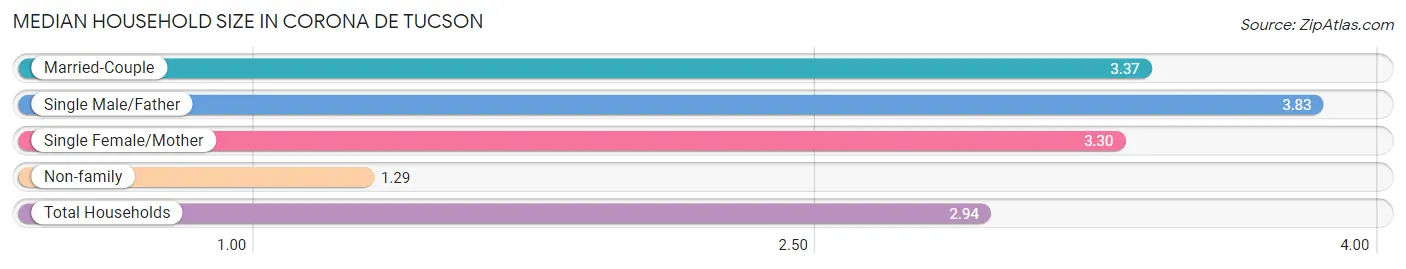
Median Household Size in Corona de Tucson
The median household size in Corona de Tucson is 2.94 persons per household, with single male/father households (24 | 0.8%) accounting for the largest median household size of 3.83 persons per household. non-family households (613 | 20.6%) represent the smallest median household size with 1.29 persons per household.
| Household Type | # Households | Household Size |
| Married-Couple | 2,198 (74.0%) | 3.37 |
| Single Male/Father | 24 (0.8%) | 3.83 |
| Single Female/Mother | 137 (4.6%) | 3.30 |
| Non-family | 613 (20.6%) | 1.29 |
| Total Households | 2,972 (100.0%) | 2.94 |
Household Size by Marriage Status in Corona de Tucson
Out of a total of 2,972 households in Corona de Tucson, 2,359 (79.4%) are family households, while 613 (20.6%) are nonfamily households. The most numerous type of family households are 4-person households, comprising 891, and the most common type of nonfamily households are 1-person households, comprising 472.
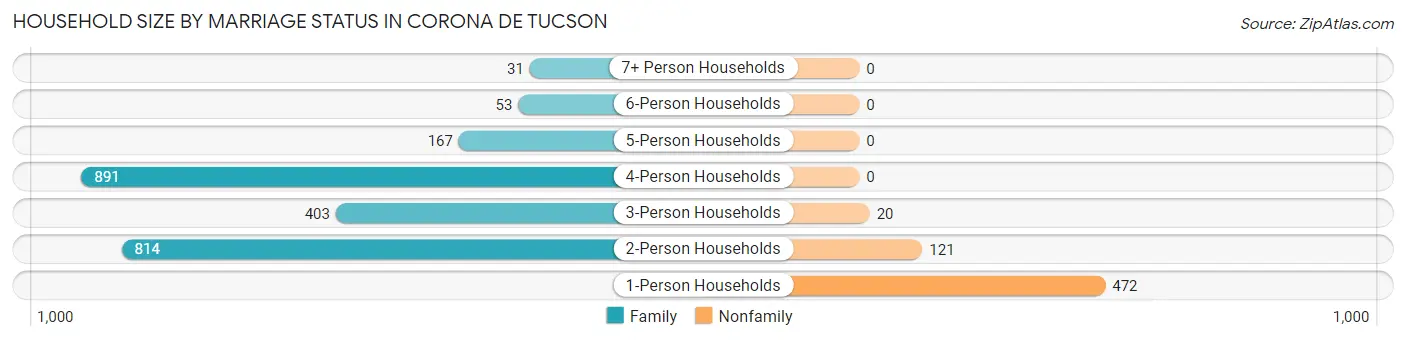
| Household Size | Family Households | Nonfamily Households |
| 1-Person Households | - | 472 (15.9%) |
| 2-Person Households | 814 (27.4%) | 121 (4.1%) |
| 3-Person Households | 403 (13.6%) | 20 (0.7%) |
| 4-Person Households | 891 (30.0%) | 0 (0.0%) |
| 5-Person Households | 167 (5.6%) | 0 (0.0%) |
| 6-Person Households | 53 (1.8%) | 0 (0.0%) |
| 7+ Person Households | 31 (1.0%) | 0 (0.0%) |
| Total | 2,359 (79.4%) | 613 (20.6%) |
Female Fertility in Corona de Tucson
Fertility by Age in Corona de Tucson
Average fertility rate in Corona de Tucson is 69.0 births per 1,000 women. Women in the age bracket of 15 to 19 years have the highest fertility rate with 188.0 births per 1,000 women. Women in the age bracket of 20 to 34 years acount for 77.9% of all women with births.
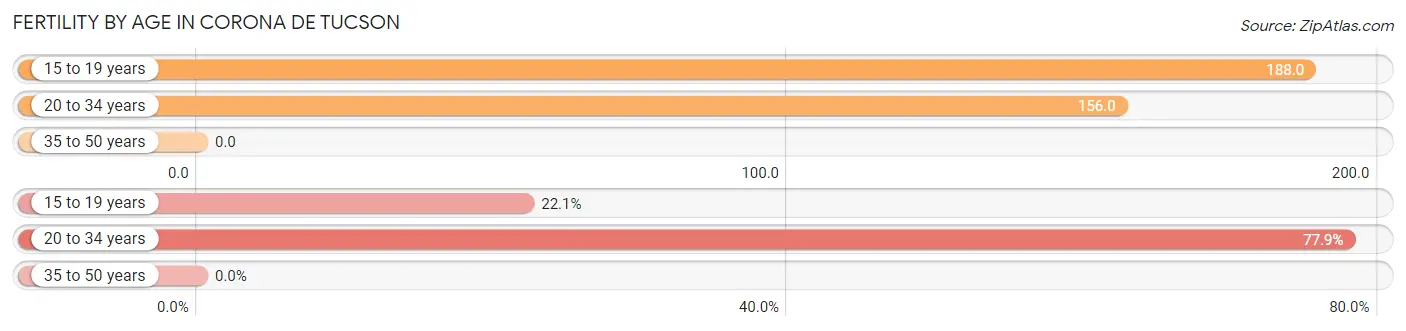
| Age Bracket | Women with Births | Births / 1,000 Women |
| 15 to 19 years | 31 (22.1%) | 188.0 |
| 20 to 34 years | 109 (77.9%) | 156.0 |
| 35 to 50 years | 0 (0.0%) | 0.0 |
| Total | 140 (100.0%) | 69.0 |
Fertility by Age by Marriage Status in Corona de Tucson
66.4% of women with births (140) in Corona de Tucson are married. The highest percentage of unmarried women with births falls into 15 to 19 years age bracket with 100.0% of them unmarried at the time of birth, while the lowest percentage of unmarried women with births belong to 20 to 34 years age bracket with 14.7% of them unmarried.
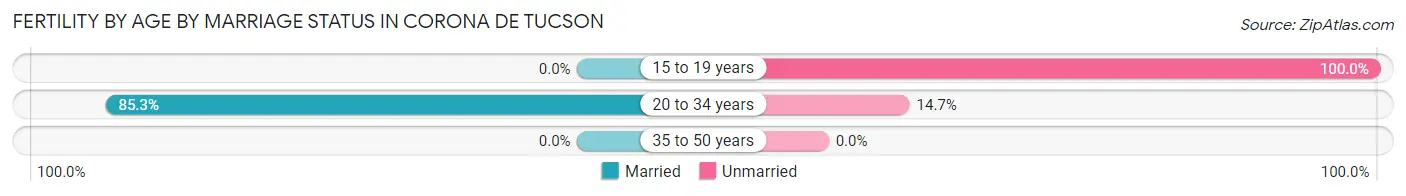
| Age Bracket | Married | Unmarried |
| 15 to 19 years | 0 (0.0%) | 31 (100.0%) |
| 20 to 34 years | 93 (85.3%) | 16 (14.7%) |
| 35 to 50 years | 0 (0.0%) | 0 (0.0%) |
| Total | 93 (66.4%) | 47 (33.6%) |
Fertility by Education in Corona de Tucson
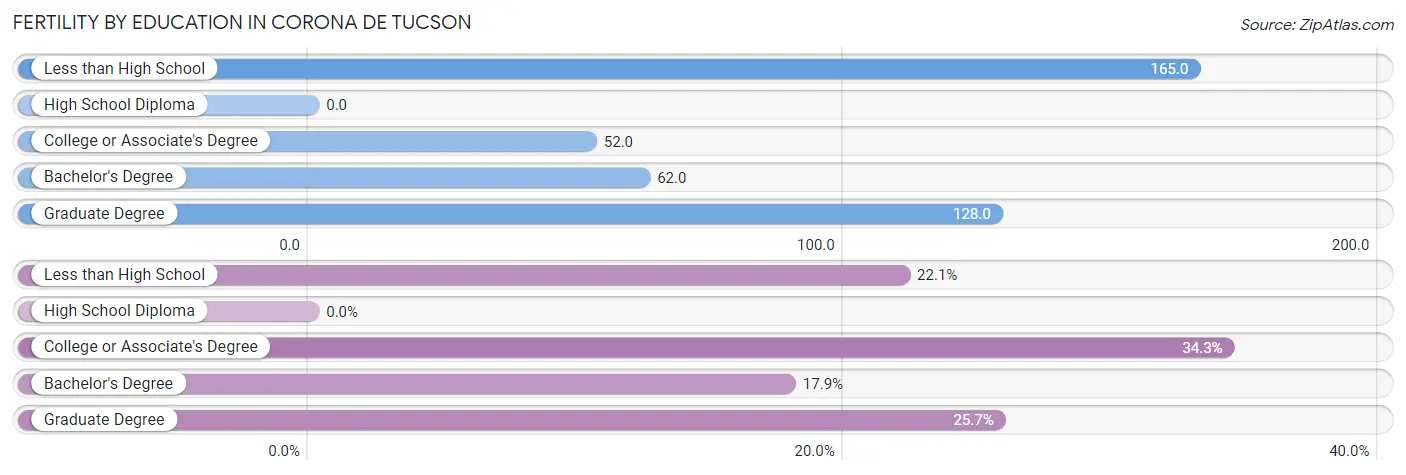
| Educational Attainment | Women with Births | Births / 1,000 Women |
| Less than High School | 31 (22.1%) | 165.0 |
| High School Diploma | 0 (0.0%) | 0.0 |
| College or Associate's Degree | 48 (34.3%) | 52.0 |
| Bachelor's Degree | 25 (17.9%) | 62.0 |
| Graduate Degree | 36 (25.7%) | 128.0 |
| Total | 140 (100.0%) | 69.0 |
Fertility by Education by Marriage Status in Corona de Tucson
33.6% of women with births in Corona de Tucson are unmarried. Women with the educational attainment of bachelor's degree are most likely to be married with 100.0% of them married at childbirth, while women with the educational attainment of less than high school are least likely to be married with 100.0% of them unmarried at childbirth.
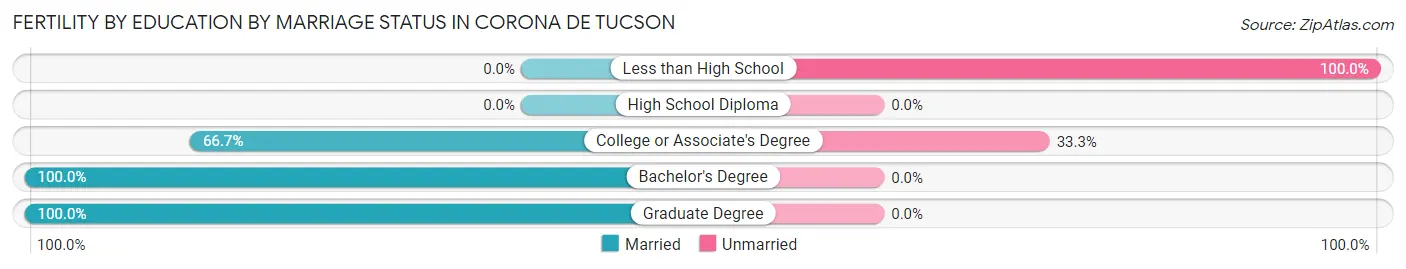
| Educational Attainment | Married | Unmarried |
| Less than High School | 0 (0.0%) | 31 (100.0%) |
| High School Diploma | 0 (0.0%) | 0 (0.0%) |
| College or Associate's Degree | 32 (66.7%) | 16 (33.3%) |
| Bachelor's Degree | 25 (100.0%) | 0 (0.0%) |
| Graduate Degree | 36 (100.0%) | 0 (0.0%) |
| Total | 93 (66.4%) | 47 (33.6%) |
Employment Characteristics in Corona de Tucson
Employment by Class of Employer in Corona de Tucson
Among the 3,959 employed individuals in Corona de Tucson, private company employees (2,247 | 56.8%), state government employees (394 | 10.0%), and federal government employees (389 | 9.8%) make up the most common classes of employment.
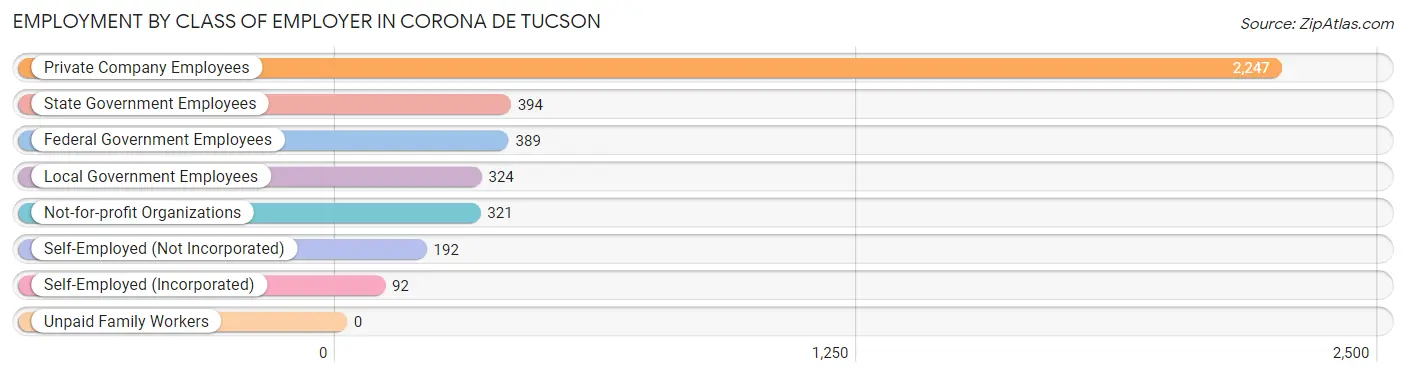
| Employer Class | # Employees | % Employees |
| Private Company Employees | 2,247 | 56.8% |
| Self-Employed (Incorporated) | 92 | 2.3% |
| Self-Employed (Not Incorporated) | 192 | 4.9% |
| Not-for-profit Organizations | 321 | 8.1% |
| Local Government Employees | 324 | 8.2% |
| State Government Employees | 394 | 10.0% |
| Federal Government Employees | 389 | 9.8% |
| Unpaid Family Workers | 0 | 0.0% |
| Total | 3,959 | 100.0% |
Employment Status by Age in Corona de Tucson
According to the labor force statistics for Corona de Tucson, out of the total population over 16 years of age (6,261), 65.9% or 4,126 individuals are in the labor force, with 3.6% or 149 of them unemployed. The age group with the highest labor force participation rate is 25 to 29 years, with 90.4% or 356 individuals in the labor force. Within the labor force, the 16 to 19 years age range has the highest percentage of unemployed individuals, with 16.1% or 19 of them being unemployed.
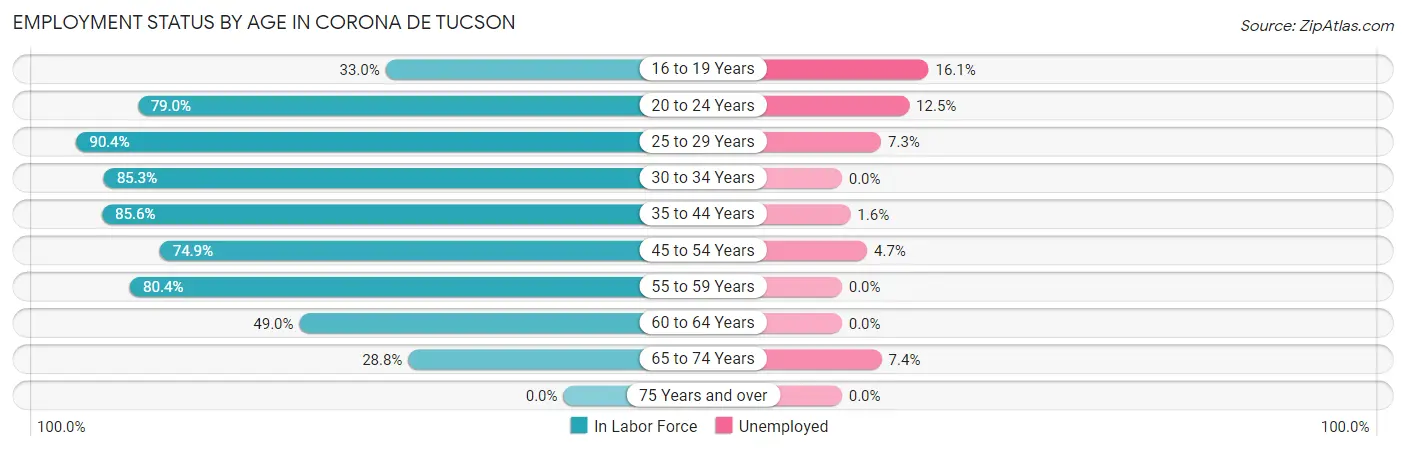
| Age Bracket | In Labor Force | Unemployed |
| 16 to 19 Years | 118 (33.0%) | 19 (16.1%) |
| 20 to 24 Years | 192 (79.0%) | 24 (12.5%) |
| 25 to 29 Years | 356 (90.4%) | 26 (7.3%) |
| 30 to 34 Years | 544 (85.3%) | 0 (0.0%) |
| 35 to 44 Years | 1,317 (85.6%) | 21 (1.6%) |
| 45 to 54 Years | 900 (74.9%) | 42 (4.7%) |
| 55 to 59 Years | 329 (80.4%) | 0 (0.0%) |
| 60 to 64 Years | 167 (49.0%) | 0 (0.0%) |
| 65 to 74 Years | 202 (28.8%) | 15 (7.4%) |
| 75 Years and over | 0 (0.0%) | 0 (0.0%) |
| Total | 4,126 (65.9%) | 149 (3.6%) |
Employment Status by Educational Attainment in Corona de Tucson
According to labor force statistics for Corona de Tucson, 79.9% of individuals (3,612) out of the total population between 25 and 64 years of age (4,521) are in the labor force, with 2.5% or 90 of them being unemployed. The group with the highest labor force participation rate are those with the educational attainment of bachelor's degree or higher, with 92.3% or 1,757 individuals in the labor force. Within the labor force, individuals with less than high school education have the highest percentage of unemployment, with 61.3% or 19 of them being unemployed.
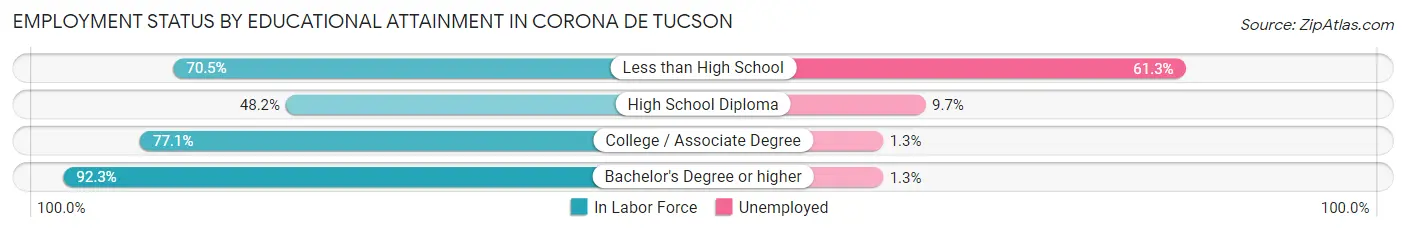
| Educational Attainment | In Labor Force | Unemployed |
| Less than High School | 31 (70.5%) | 27 (61.3%) |
| High School Diploma | 269 (48.2%) | 54 (9.7%) |
| College / Associate Degree | 1,554 (77.1%) | 26 (1.3%) |
| Bachelor's Degree or higher | 1,757 (92.3%) | 25 (1.3%) |
| Total | 3,612 (79.9%) | 113 (2.5%) |
Employment Occupations by Sex in Corona de Tucson
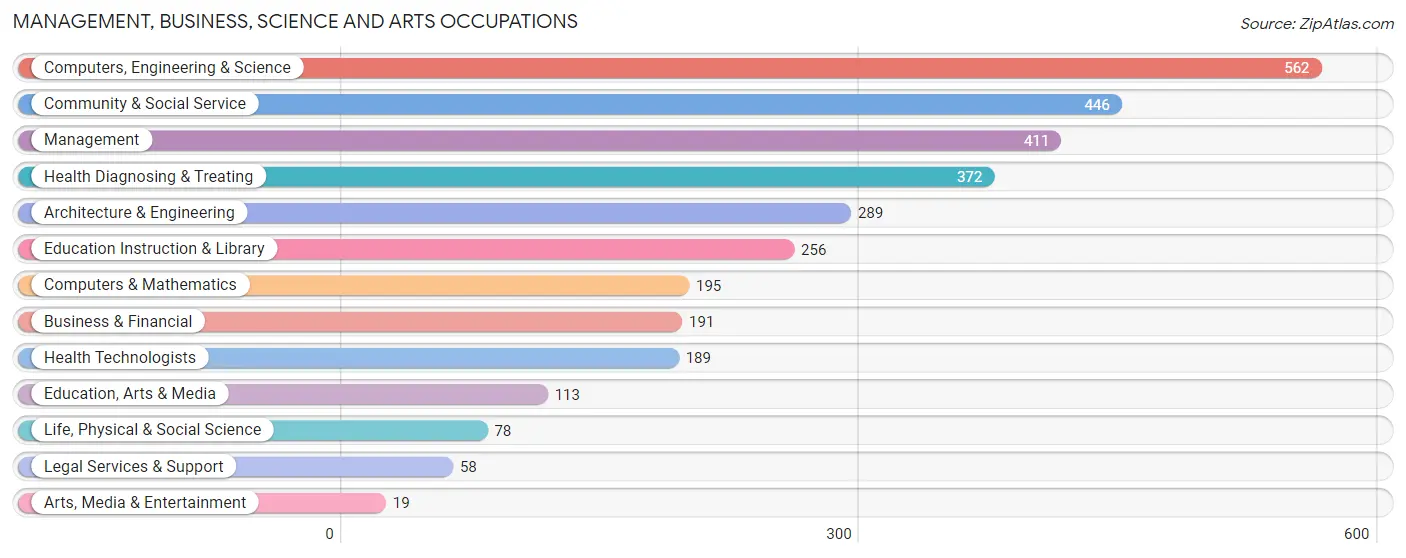
Management, Business, Science and Arts Occupations
The most common Management, Business, Science and Arts occupations in Corona de Tucson are Computers, Engineering & Science (562 | 14.4%), Community & Social Service (446 | 11.4%), Management (411 | 10.5%), Health Diagnosing & Treating (372 | 9.5%), and Architecture & Engineering (289 | 7.4%).
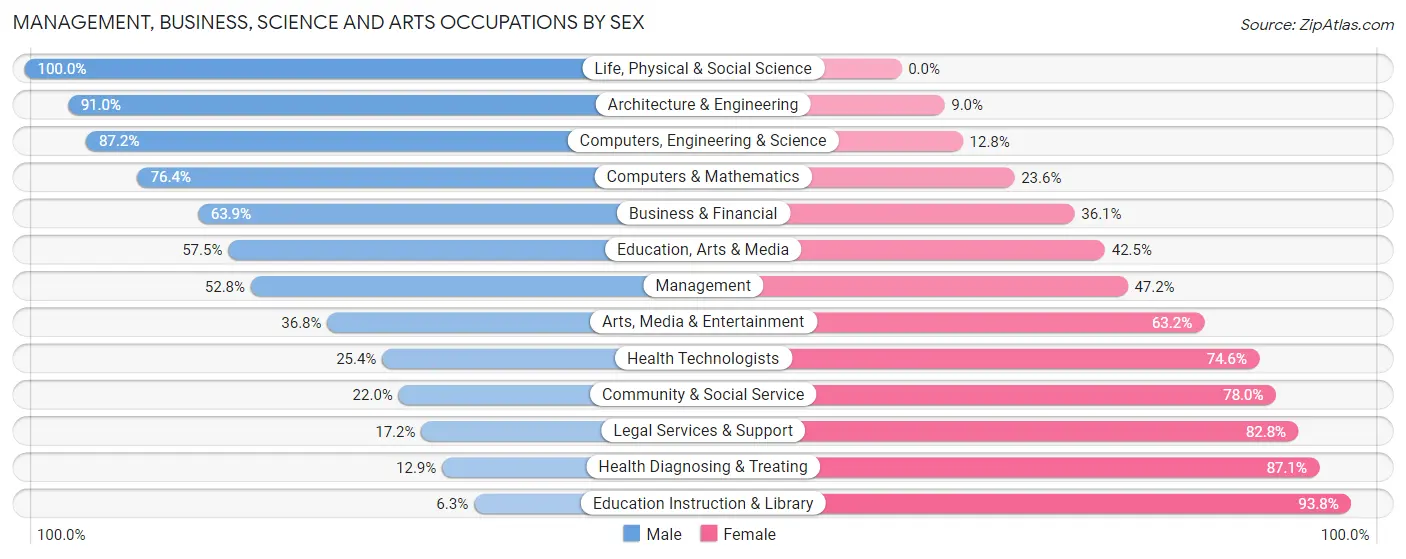
Management, Business, Science and Arts Occupations by Sex
Within the Management, Business, Science and Arts occupations in Corona de Tucson, the most male-oriented occupations are Life, Physical & Social Science (100.0%), Architecture & Engineering (91.0%), and Computers, Engineering & Science (87.2%), while the most female-oriented occupations are Education Instruction & Library (93.8%), Health Diagnosing & Treating (87.1%), and Legal Services & Support (82.8%).
| Occupation | Male | Female |
| Management | 217 (52.8%) | 194 (47.2%) |
| Business & Financial | 122 (63.9%) | 69 (36.1%) |
| Computers, Engineering & Science | 490 (87.2%) | 72 (12.8%) |
| Computers & Mathematics | 149 (76.4%) | 46 (23.6%) |
| Architecture & Engineering | 263 (91.0%) | 26 (9.0%) |
| Life, Physical & Social Science | 78 (100.0%) | 0 (0.0%) |
| Community & Social Service | 98 (22.0%) | 348 (78.0%) |
| Education, Arts & Media | 65 (57.5%) | 48 (42.5%) |
| Legal Services & Support | 10 (17.2%) | 48 (82.8%) |
| Education Instruction & Library | 16 (6.2%) | 240 (93.8%) |
| Arts, Media & Entertainment | 7 (36.8%) | 12 (63.2%) |
| Health Diagnosing & Treating | 48 (12.9%) | 324 (87.1%) |
| Health Technologists | 48 (25.4%) | 141 (74.6%) |
| Total (Category) | 975 (49.2%) | 1,007 (50.8%) |
| Total (Overall) | 2,066 (52.8%) | 1,843 (47.1%) |
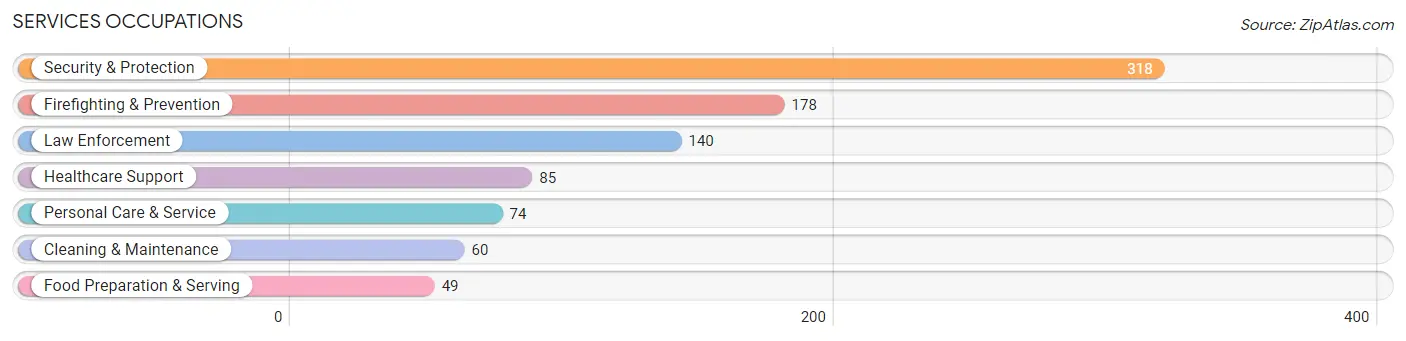
Services Occupations
The most common Services occupations in Corona de Tucson are Security & Protection (318 | 8.1%), Firefighting & Prevention (178 | 4.5%), Law Enforcement (140 | 3.6%), Healthcare Support (85 | 2.2%), and Personal Care & Service (74 | 1.9%).
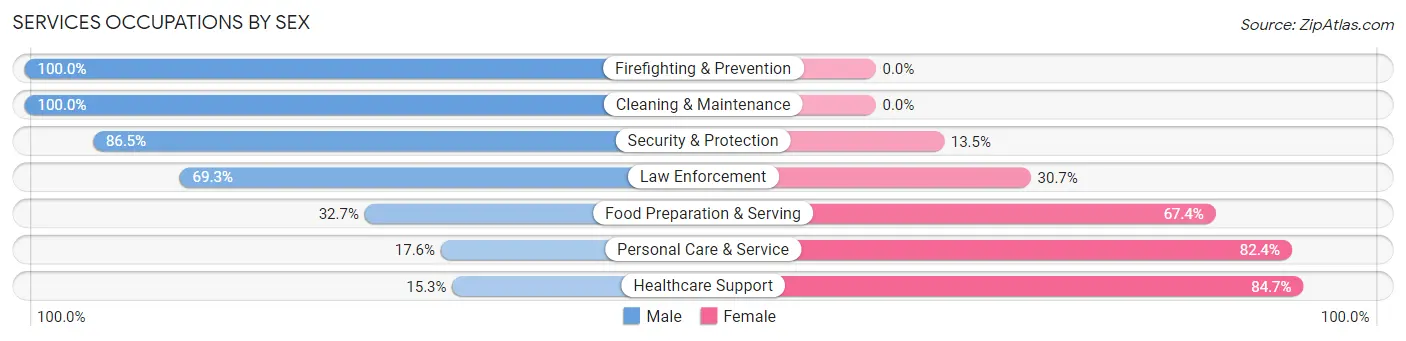
Services Occupations by Sex
Within the Services occupations in Corona de Tucson, the most male-oriented occupations are Firefighting & Prevention (100.0%), Cleaning & Maintenance (100.0%), and Security & Protection (86.5%), while the most female-oriented occupations are Healthcare Support (84.7%), Personal Care & Service (82.4%), and Food Preparation & Serving (67.3%).
| Occupation | Male | Female |
| Healthcare Support | 13 (15.3%) | 72 (84.7%) |
| Security & Protection | 275 (86.5%) | 43 (13.5%) |
| Firefighting & Prevention | 178 (100.0%) | 0 (0.0%) |
| Law Enforcement | 97 (69.3%) | 43 (30.7%) |
| Food Preparation & Serving | 16 (32.7%) | 33 (67.3%) |
| Cleaning & Maintenance | 60 (100.0%) | 0 (0.0%) |
| Personal Care & Service | 13 (17.6%) | 61 (82.4%) |
| Total (Category) | 377 (64.3%) | 209 (35.7%) |
| Total (Overall) | 2,066 (52.8%) | 1,843 (47.1%) |
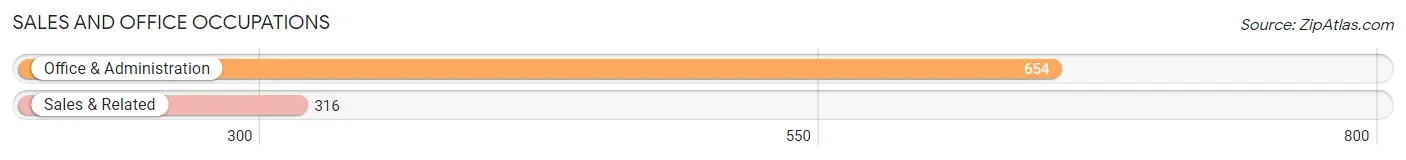
Sales and Office Occupations
The most common Sales and Office occupations in Corona de Tucson are Office & Administration (654 | 16.7%), and Sales & Related (316 | 8.1%).
Sales and Office Occupations by Sex
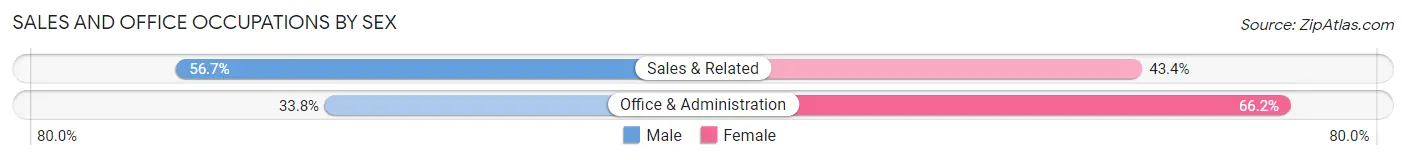
| Occupation | Male | Female |
| Sales & Related | 179 (56.7%) | 137 (43.3%) |
| Office & Administration | 221 (33.8%) | 433 (66.2%) |
| Total (Category) | 400 (41.2%) | 570 (58.8%) |
| Total (Overall) | 2,066 (52.8%) | 1,843 (47.1%) |
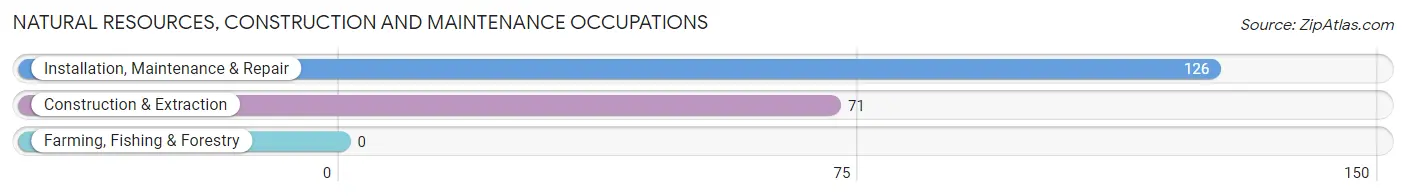
Natural Resources, Construction and Maintenance Occupations
The most common Natural Resources, Construction and Maintenance occupations in Corona de Tucson are Installation, Maintenance & Repair (126 | 3.2%), and Construction & Extraction (71 | 1.8%).
Natural Resources, Construction and Maintenance Occupations by Sex
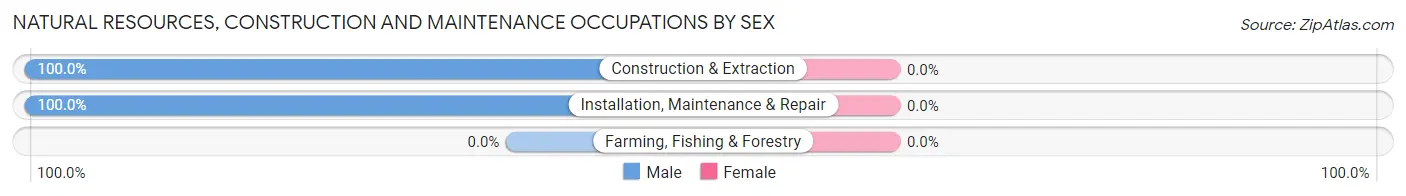
| Occupation | Male | Female |
| Farming, Fishing & Forestry | 0 (0.0%) | 0 (0.0%) |
| Construction & Extraction | 71 (100.0%) | 0 (0.0%) |
| Installation, Maintenance & Repair | 126 (100.0%) | 0 (0.0%) |
| Total (Category) | 197 (100.0%) | 0 (0.0%) |
| Total (Overall) | 2,066 (52.8%) | 1,843 (47.1%) |
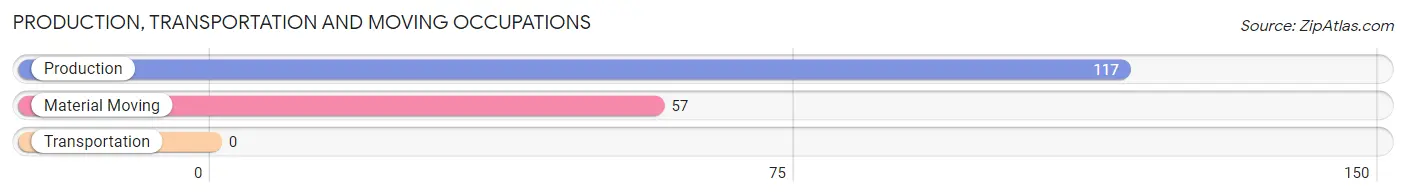
Production, Transportation and Moving Occupations
The most common Production, Transportation and Moving occupations in Corona de Tucson are Production (117 | 3.0%), and Material Moving (57 | 1.5%).
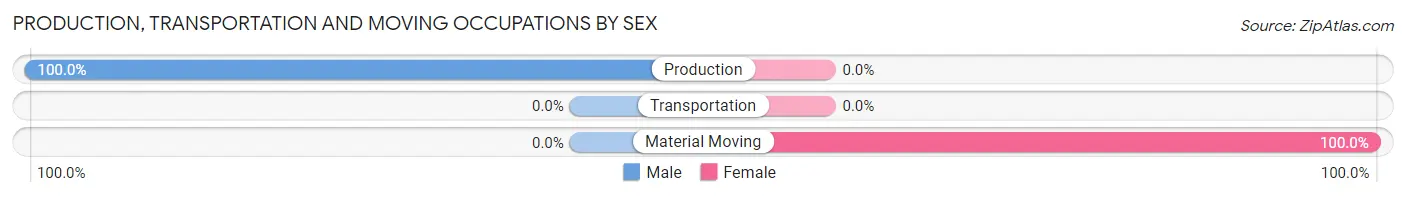
Production, Transportation and Moving Occupations by Sex
| Occupation | Male | Female |
| Production | 117 (100.0%) | 0 (0.0%) |
| Transportation | 0 (0.0%) | 0 (0.0%) |
| Material Moving | 0 (0.0%) | 57 (100.0%) |
| Total (Category) | 117 (67.2%) | 57 (32.8%) |
| Total (Overall) | 2,066 (52.8%) | 1,843 (47.1%) |
Employment Industries by Sex in Corona de Tucson
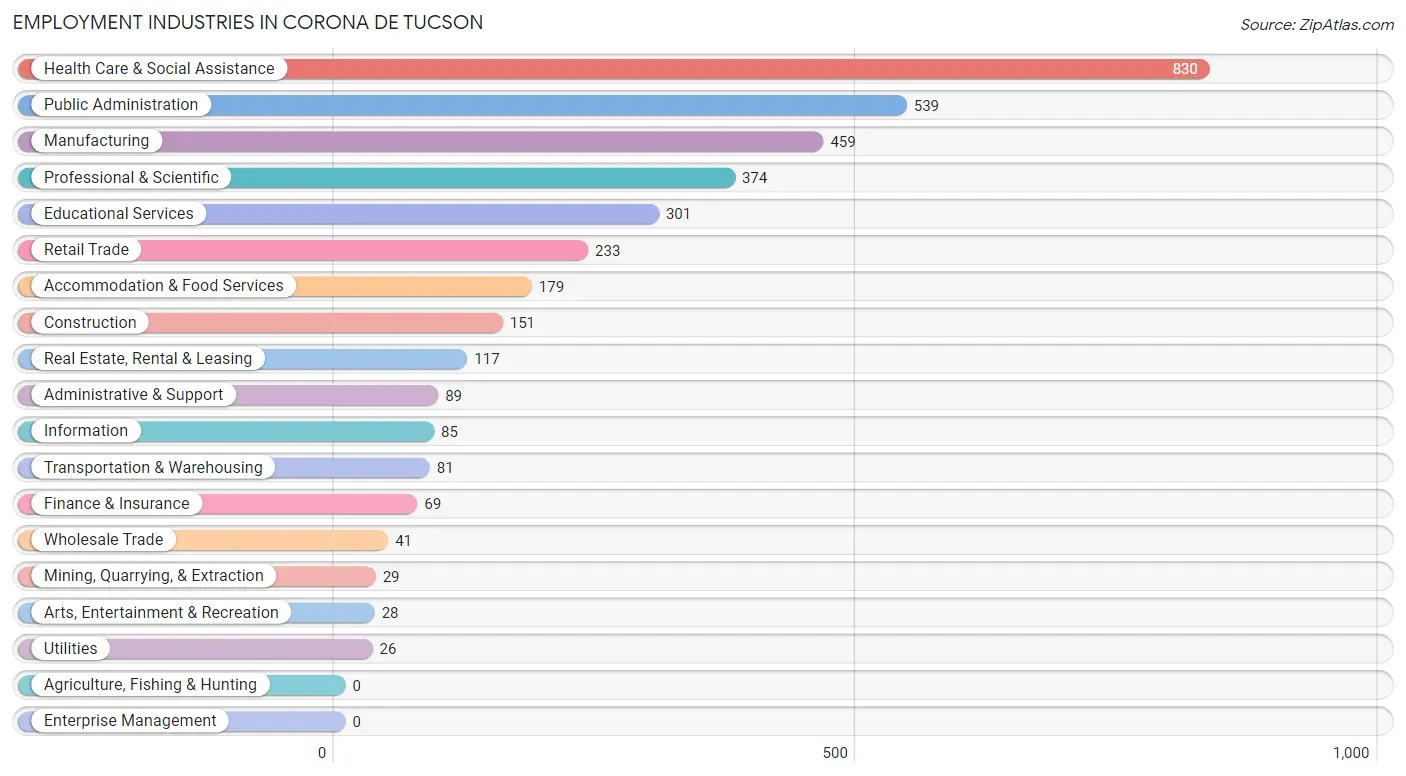
Employment Industries in Corona de Tucson
The major employment industries in Corona de Tucson include Health Care & Social Assistance (830 | 21.2%), Public Administration (539 | 13.8%), Manufacturing (459 | 11.7%), Professional & Scientific (374 | 9.6%), and Educational Services (301 | 7.7%).
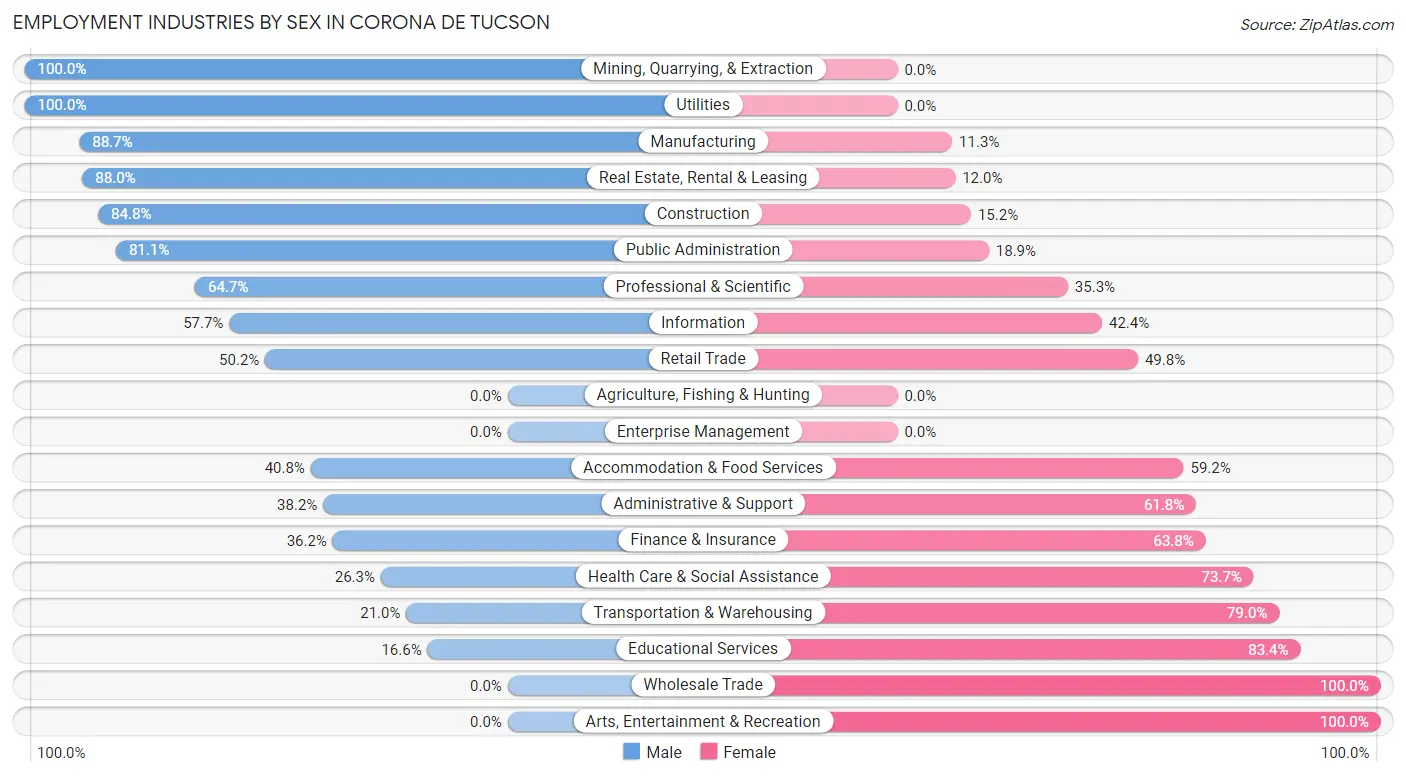
Employment Industries by Sex in Corona de Tucson
The Corona de Tucson industries that see more men than women are Mining, Quarrying, & Extraction (100.0%), Utilities (100.0%), and Manufacturing (88.7%), whereas the industries that tend to have a higher number of women are Wholesale Trade (100.0%), Arts, Entertainment & Recreation (100.0%), and Educational Services (83.4%).
| Industry | Male | Female |
| Agriculture, Fishing & Hunting | 0 (0.0%) | 0 (0.0%) |
| Mining, Quarrying, & Extraction | 29 (100.0%) | 0 (0.0%) |
| Construction | 128 (84.8%) | 23 (15.2%) |
| Manufacturing | 407 (88.7%) | 52 (11.3%) |
| Wholesale Trade | 0 (0.0%) | 41 (100.0%) |
| Retail Trade | 117 (50.2%) | 116 (49.8%) |
| Transportation & Warehousing | 17 (21.0%) | 64 (79.0%) |
| Utilities | 26 (100.0%) | 0 (0.0%) |
| Information | 49 (57.7%) | 36 (42.3%) |
| Finance & Insurance | 25 (36.2%) | 44 (63.8%) |
| Real Estate, Rental & Leasing | 103 (88.0%) | 14 (12.0%) |
| Professional & Scientific | 242 (64.7%) | 132 (35.3%) |
| Enterprise Management | 0 (0.0%) | 0 (0.0%) |
| Administrative & Support | 34 (38.2%) | 55 (61.8%) |
| Educational Services | 50 (16.6%) | 251 (83.4%) |
| Health Care & Social Assistance | 218 (26.3%) | 612 (73.7%) |
| Arts, Entertainment & Recreation | 0 (0.0%) | 28 (100.0%) |
| Accommodation & Food Services | 73 (40.8%) | 106 (59.2%) |
| Public Administration | 437 (81.1%) | 102 (18.9%) |
| Total | 2,066 (52.8%) | 1,843 (47.1%) |
Education in Corona de Tucson
School Enrollment in Corona de Tucson
The most common levels of schooling among the 2,514 students in Corona de Tucson are middle school (782 | 31.1%), elementary school (591 | 23.5%), and high school (412 | 16.4%).
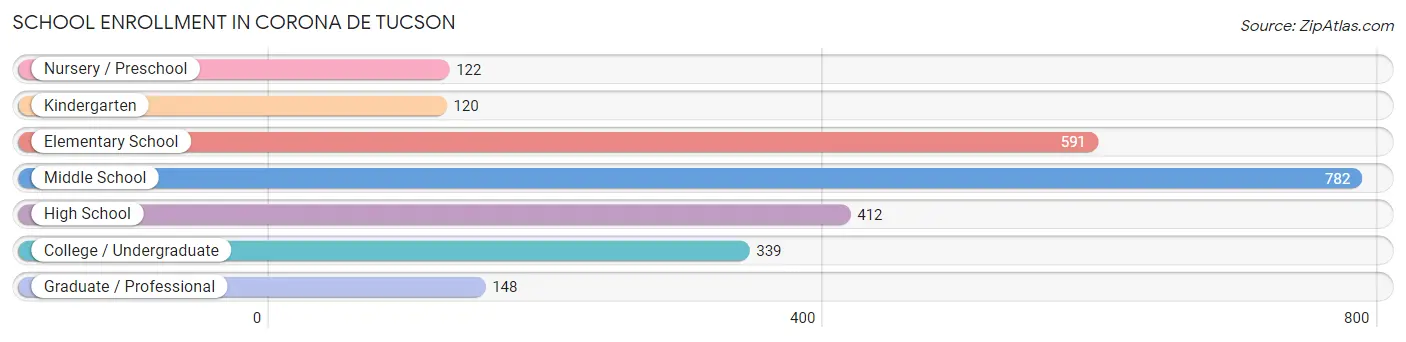
| School Level | # Students | % Students |
| Nursery / Preschool | 122 | 4.9% |
| Kindergarten | 120 | 4.8% |
| Elementary School | 591 | 23.5% |
| Middle School | 782 | 31.1% |
| High School | 412 | 16.4% |
| College / Undergraduate | 339 | 13.5% |
| Graduate / Professional | 148 | 5.9% |
| Total | 2,514 | 100.0% |
School Enrollment by Age by Funding Source in Corona de Tucson
Out of a total of 2,514 students who are enrolled in schools in Corona de Tucson, 156 (6.2%) attend a private institution, while the remaining 2,358 (93.8%) are enrolled in public schools. The age group of 3 to 4 year olds has the highest likelihood of being enrolled in private schools, with 17 (37.0% in the age bracket) enrolled. Conversely, the age group of 18 to 19 year olds has the lowest likelihood of being enrolled in a private school, with 117 (100.0% in the age bracket) attending a public institution.
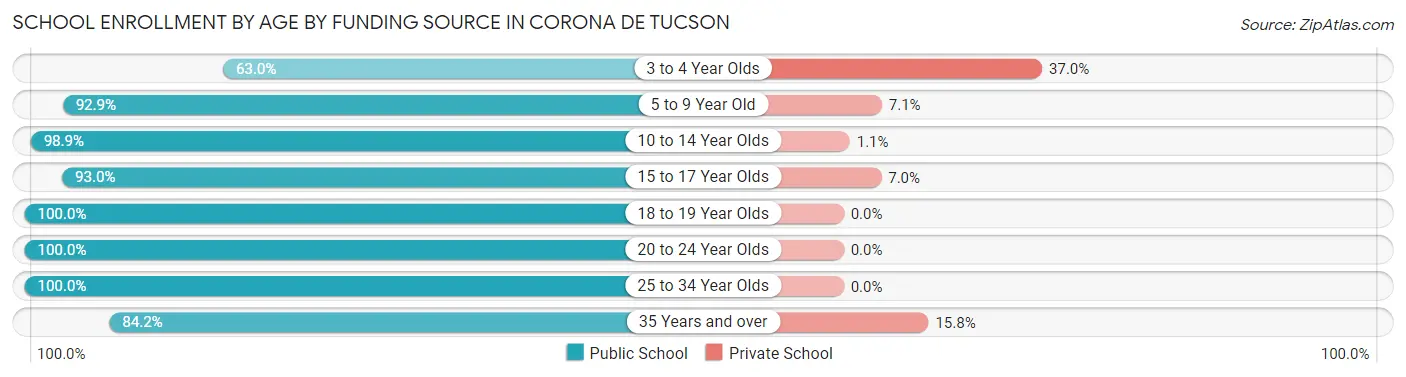
| Age Bracket | Public School | Private School |
| 3 to 4 Year Olds | 29 (63.0%) | 17 (37.0%) |
| 5 to 9 Year Old | 719 (92.9%) | 55 (7.1%) |
| 10 to 14 Year Olds | 870 (98.9%) | 10 (1.1%) |
| 15 to 17 Year Olds | 239 (93.0%) | 18 (7.0%) |
| 18 to 19 Year Olds | 117 (100.0%) | 0 (0.0%) |
| 20 to 24 Year Olds | 76 (100.0%) | 0 (0.0%) |
| 25 to 34 Year Olds | 16 (100.0%) | 0 (0.0%) |
| 35 Years and over | 293 (84.2%) | 55 (15.8%) |
| Total | 2,358 (93.8%) | 156 (6.2%) |
Educational Attainment by Field of Study in Corona de Tucson
Business (635 | 25.7%), education (348 | 14.1%), arts & humanities (316 | 12.8%), science & technology (234 | 9.5%), and physical & health sciences (182 | 7.3%) are the most common fields of study among 2,475 individuals in Corona de Tucson who have obtained a bachelor's degree or higher.
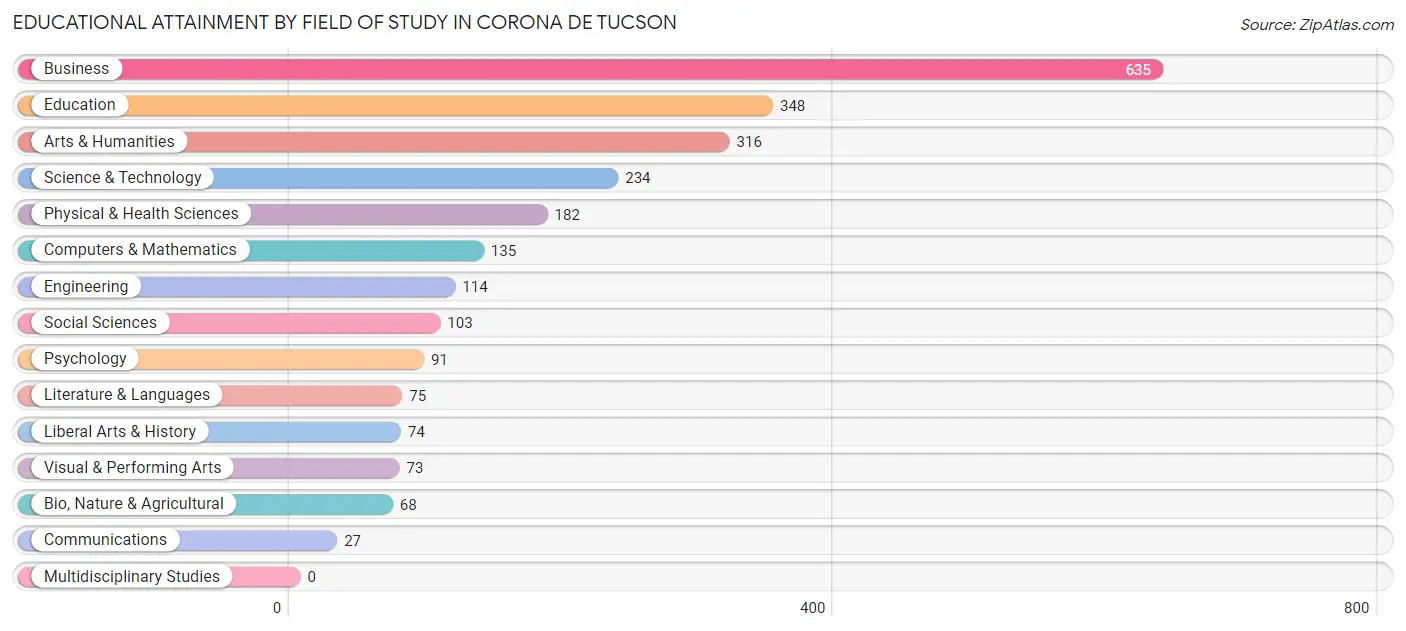
| Field of Study | # Graduates | % Graduates |
| Computers & Mathematics | 135 | 5.4% |
| Bio, Nature & Agricultural | 68 | 2.8% |
| Physical & Health Sciences | 182 | 7.3% |
| Psychology | 91 | 3.7% |
| Social Sciences | 103 | 4.2% |
| Engineering | 114 | 4.6% |
| Multidisciplinary Studies | 0 | 0.0% |
| Science & Technology | 234 | 9.5% |
| Business | 635 | 25.7% |
| Education | 348 | 14.1% |
| Literature & Languages | 75 | 3.0% |
| Liberal Arts & History | 74 | 3.0% |
| Visual & Performing Arts | 73 | 2.9% |
| Communications | 27 | 1.1% |
| Arts & Humanities | 316 | 12.8% |
| Total | 2,475 | 100.0% |
Transportation & Commute in Corona de Tucson
Vehicle Availability by Sex in Corona de Tucson
The most prevalent vehicle ownership categories in Corona de Tucson are males with 2 vehicles (1,173, accounting for 55.0%) and females with 2 vehicles (847, making up 64.3%).
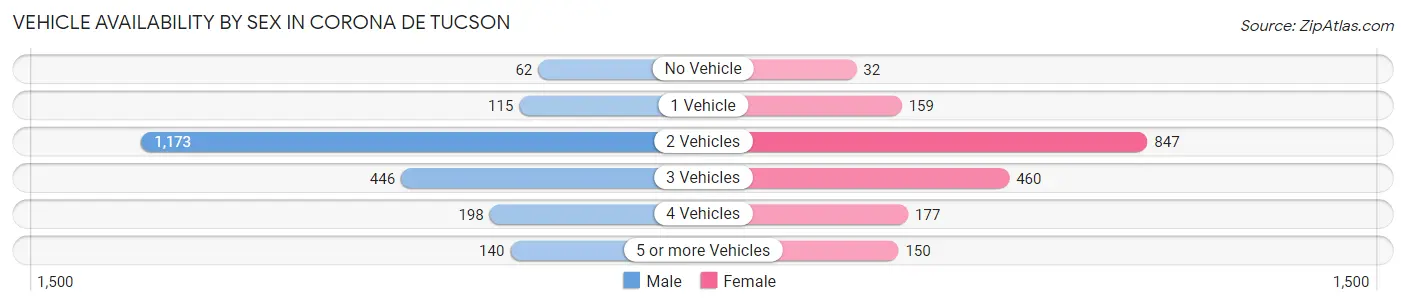
| Vehicles Available | Male | Female |
| No Vehicle | 62 (2.9%) | 32 (1.8%) |
| 1 Vehicle | 115 (5.4%) | 159 (8.7%) |
| 2 Vehicles | 1,173 (55.0%) | 847 (46.4%) |
| 3 Vehicles | 446 (20.9%) | 460 (25.2%) |
| 4 Vehicles | 198 (9.3%) | 177 (9.7%) |
| 5 or more Vehicles | 140 (6.6%) | 150 (8.2%) |
| Total | 2,134 (100.0%) | 1,825 (100.0%) |
Commute Time in Corona de Tucson
The most frequently occuring commute durations in Corona de Tucson are 30 to 34 minutes (841 commuters, 23.8%), 45 to 59 minutes (657 commuters, 18.6%), and 35 to 39 minutes (564 commuters, 15.9%).
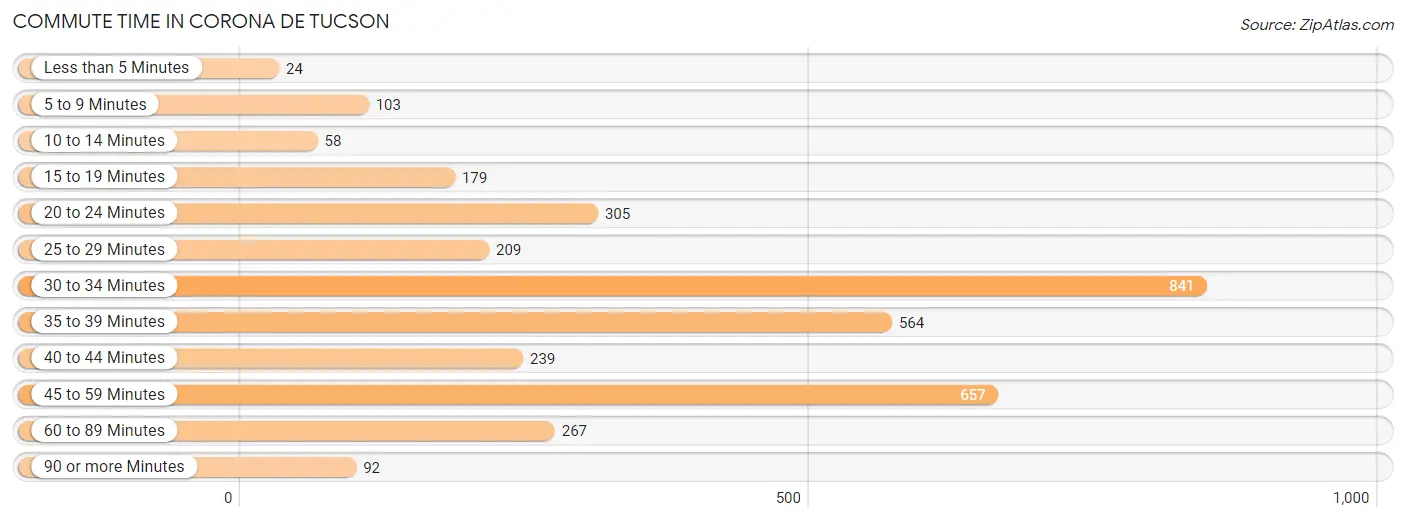
| Commute Time | # Commuters | % Commuters |
| Less than 5 Minutes | 24 | 0.7% |
| 5 to 9 Minutes | 103 | 2.9% |
| 10 to 14 Minutes | 58 | 1.6% |
| 15 to 19 Minutes | 179 | 5.1% |
| 20 to 24 Minutes | 305 | 8.6% |
| 25 to 29 Minutes | 209 | 5.9% |
| 30 to 34 Minutes | 841 | 23.8% |
| 35 to 39 Minutes | 564 | 15.9% |
| 40 to 44 Minutes | 239 | 6.8% |
| 45 to 59 Minutes | 657 | 18.6% |
| 60 to 89 Minutes | 267 | 7.5% |
| 90 or more Minutes | 92 | 2.6% |
Commute Time by Sex in Corona de Tucson
The most common commute times in Corona de Tucson are 30 to 34 minutes (425 commuters, 22.3%) for males and 30 to 34 minutes (416 commuters, 25.5%) for females.
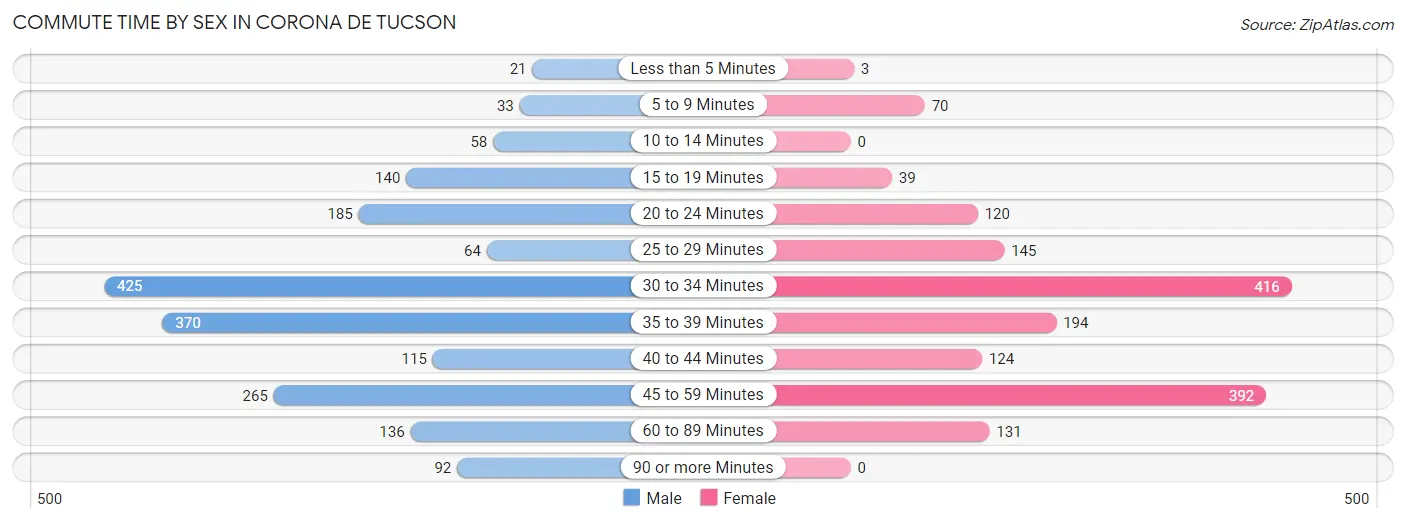
| Commute Time | Male | Female |
| Less than 5 Minutes | 21 (1.1%) | 3 (0.2%) |
| 5 to 9 Minutes | 33 (1.7%) | 70 (4.3%) |
| 10 to 14 Minutes | 58 (3.0%) | 0 (0.0%) |
| 15 to 19 Minutes | 140 (7.3%) | 39 (2.4%) |
| 20 to 24 Minutes | 185 (9.7%) | 120 (7.3%) |
| 25 to 29 Minutes | 64 (3.4%) | 145 (8.9%) |
| 30 to 34 Minutes | 425 (22.3%) | 416 (25.5%) |
| 35 to 39 Minutes | 370 (19.4%) | 194 (11.9%) |
| 40 to 44 Minutes | 115 (6.0%) | 124 (7.6%) |
| 45 to 59 Minutes | 265 (13.9%) | 392 (24.0%) |
| 60 to 89 Minutes | 136 (7.1%) | 131 (8.0%) |
| 90 or more Minutes | 92 (4.8%) | 0 (0.0%) |
Time of Departure to Work by Sex in Corona de Tucson
The most frequent times of departure to work in Corona de Tucson are 6:00 AM to 6:29 AM (466, 24.5%) for males and 7:00 AM to 7:29 AM (412, 25.2%) for females.
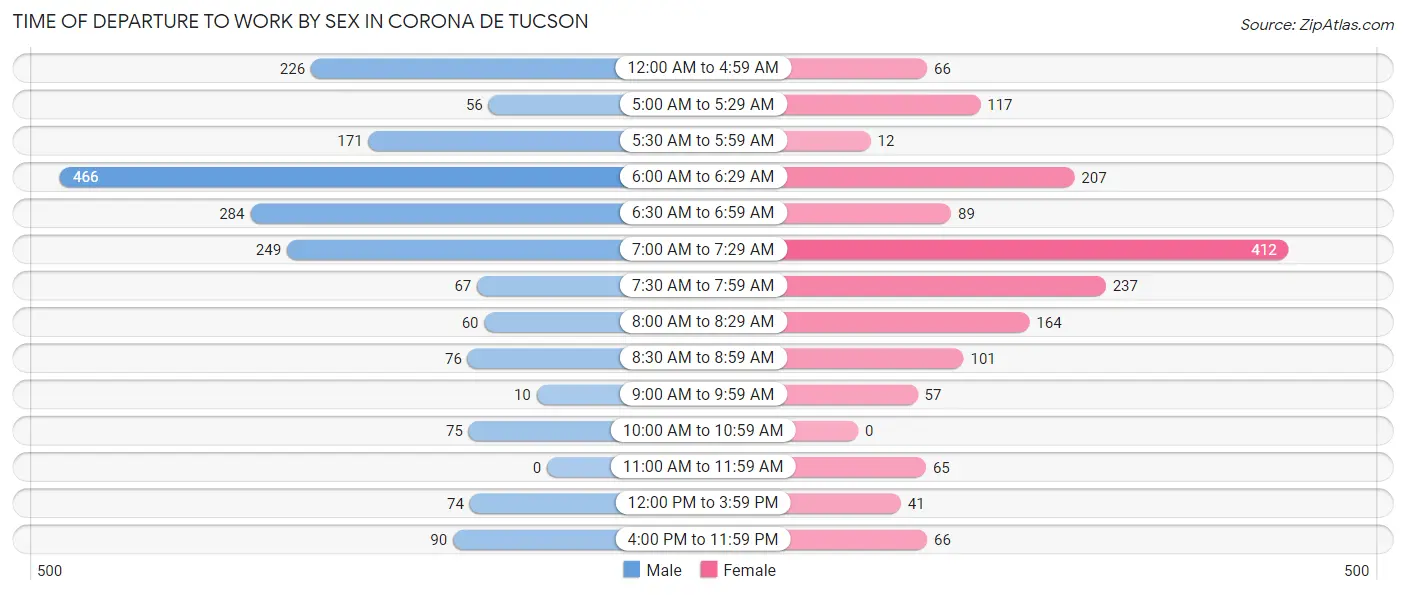
| Time of Departure | Male | Female |
| 12:00 AM to 4:59 AM | 226 (11.9%) | 66 (4.0%) |
| 5:00 AM to 5:29 AM | 56 (2.9%) | 117 (7.2%) |
| 5:30 AM to 5:59 AM | 171 (9.0%) | 12 (0.7%) |
| 6:00 AM to 6:29 AM | 466 (24.5%) | 207 (12.7%) |
| 6:30 AM to 6:59 AM | 284 (14.9%) | 89 (5.4%) |
| 7:00 AM to 7:29 AM | 249 (13.1%) | 412 (25.2%) |
| 7:30 AM to 7:59 AM | 67 (3.5%) | 237 (14.5%) |
| 8:00 AM to 8:29 AM | 60 (3.2%) | 164 (10.0%) |
| 8:30 AM to 8:59 AM | 76 (4.0%) | 101 (6.2%) |
| 9:00 AM to 9:59 AM | 10 (0.5%) | 57 (3.5%) |
| 10:00 AM to 10:59 AM | 75 (3.9%) | 0 (0.0%) |
| 11:00 AM to 11:59 AM | 0 (0.0%) | 65 (4.0%) |
| 12:00 PM to 3:59 PM | 74 (3.9%) | 41 (2.5%) |
| 4:00 PM to 11:59 PM | 90 (4.7%) | 66 (4.0%) |
| Total | 1,904 (100.0%) | 1,634 (100.0%) |
Housing Occupancy in Corona de Tucson
Occupancy by Ownership in Corona de Tucson
Of the total 2,972 dwellings in Corona de Tucson, owner-occupied units account for 2,881 (96.9%), while renter-occupied units make up 91 (3.1%).
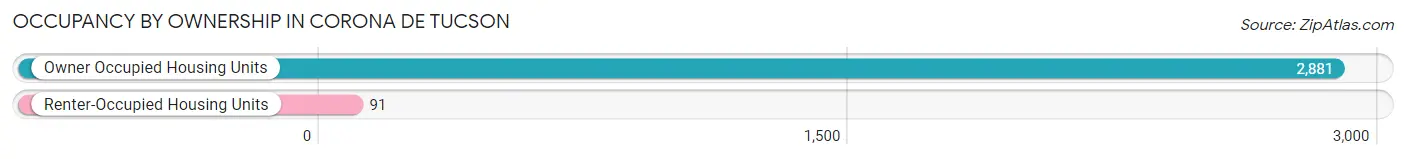
| Occupancy | # Housing Units | % Housing Units |
| Owner Occupied Housing Units | 2,881 | 96.9% |
| Renter-Occupied Housing Units | 91 | 3.1% |
| Total Occupied Housing Units | 2,972 | 100.0% |
Occupancy by Household Size in Corona de Tucson
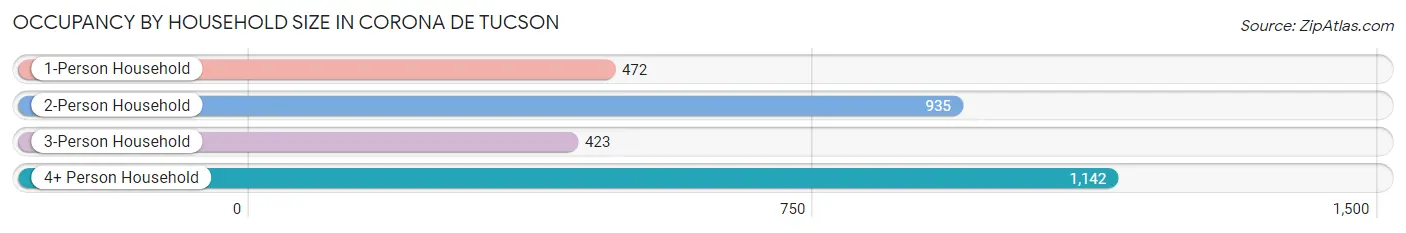
| Household Size | # Housing Units | % Housing Units |
| 1-Person Household | 472 | 15.9% |
| 2-Person Household | 935 | 31.5% |
| 3-Person Household | 423 | 14.2% |
| 4+ Person Household | 1,142 | 38.4% |
| Total Housing Units | 2,972 | 100.0% |
Occupancy by Ownership by Household Size in Corona de Tucson
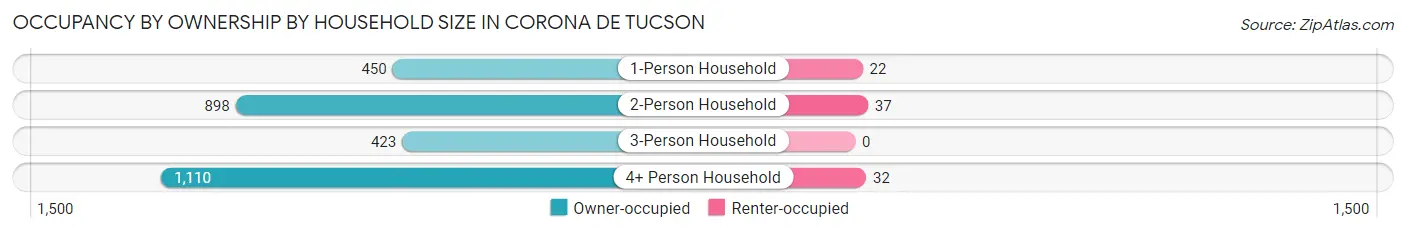
| Household Size | Owner-occupied | Renter-occupied |
| 1-Person Household | 450 (95.3%) | 22 (4.7%) |
| 2-Person Household | 898 (96.0%) | 37 (4.0%) |
| 3-Person Household | 423 (100.0%) | 0 (0.0%) |
| 4+ Person Household | 1,110 (97.2%) | 32 (2.8%) |
| Total Housing Units | 2,881 (96.9%) | 91 (3.1%) |
Occupancy by Educational Attainment in Corona de Tucson
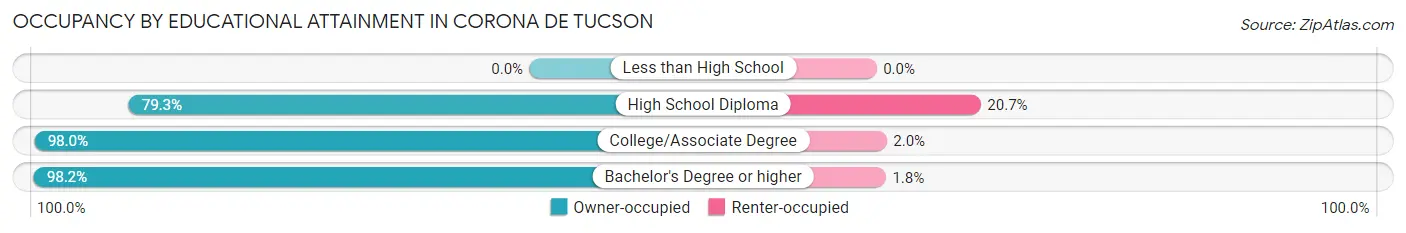
| Household Size | Owner-occupied | Renter-occupied |
| Less than High School | 0 (0.0%) | 0 (0.0%) |
| High School Diploma | 142 (79.3%) | 37 (20.7%) |
| College/Associate Degree | 1,404 (98.0%) | 29 (2.0%) |
| Bachelor's Degree or higher | 1,335 (98.2%) | 25 (1.8%) |
Occupancy by Age of Householder in Corona de Tucson
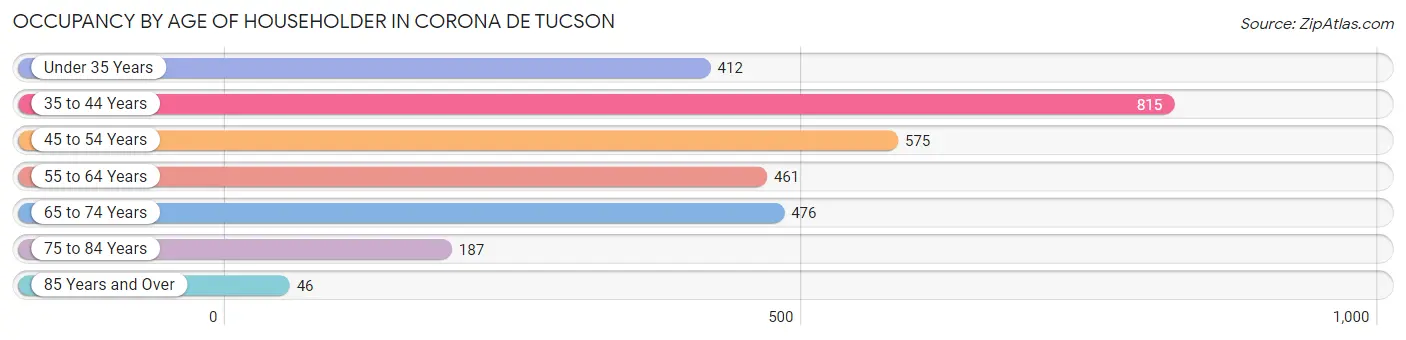
| Age Bracket | # Households | % Households |
| Under 35 Years | 412 | 13.9% |
| 35 to 44 Years | 815 | 27.4% |
| 45 to 54 Years | 575 | 19.4% |
| 55 to 64 Years | 461 | 15.5% |
| 65 to 74 Years | 476 | 16.0% |
| 75 to 84 Years | 187 | 6.3% |
| 85 Years and Over | 46 | 1.5% |
| Total | 2,972 | 100.0% |
Housing Finances in Corona de Tucson
Median Income by Occupancy in Corona de Tucson
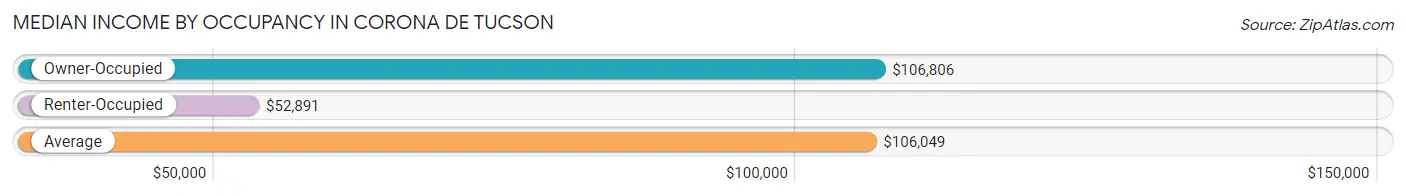
| Occupancy Type | # Households | Median Income |
| Owner-Occupied | 2,881 (96.9%) | $106,806 |
| Renter-Occupied | 91 (3.1%) | $52,891 |
| Average | 2,972 (100.0%) | $106,049 |
Occupancy by Householder Income Bracket in Corona de Tucson
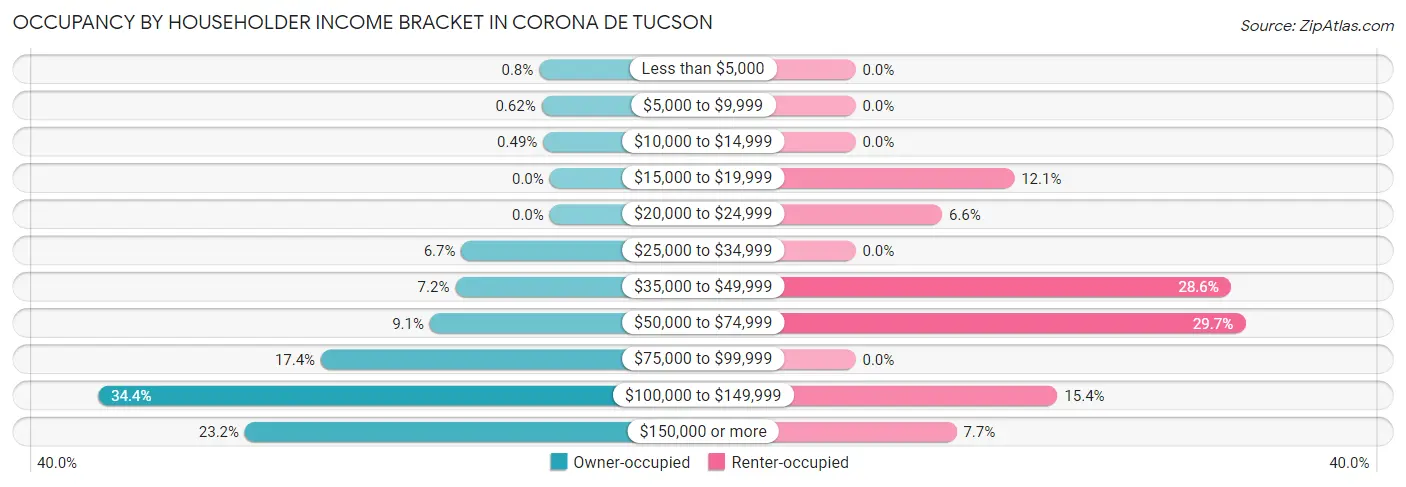
| Income Bracket | Owner-occupied | Renter-occupied |
| Less than $5,000 | 23 (0.8%) | 0 (0.0%) |
| $5,000 to $9,999 | 18 (0.6%) | 0 (0.0%) |
| $10,000 to $14,999 | 14 (0.5%) | 0 (0.0%) |
| $15,000 to $19,999 | 0 (0.0%) | 11 (12.1%) |
| $20,000 to $24,999 | 0 (0.0%) | 6 (6.6%) |
| $25,000 to $34,999 | 194 (6.7%) | 0 (0.0%) |
| $35,000 to $49,999 | 207 (7.2%) | 26 (28.6%) |
| $50,000 to $74,999 | 263 (9.1%) | 27 (29.7%) |
| $75,000 to $99,999 | 502 (17.4%) | 0 (0.0%) |
| $100,000 to $149,999 | 991 (34.4%) | 14 (15.4%) |
| $150,000 or more | 669 (23.2%) | 7 (7.7%) |
| Total | 2,881 (100.0%) | 91 (100.0%) |
Monthly Housing Cost Tiers in Corona de Tucson
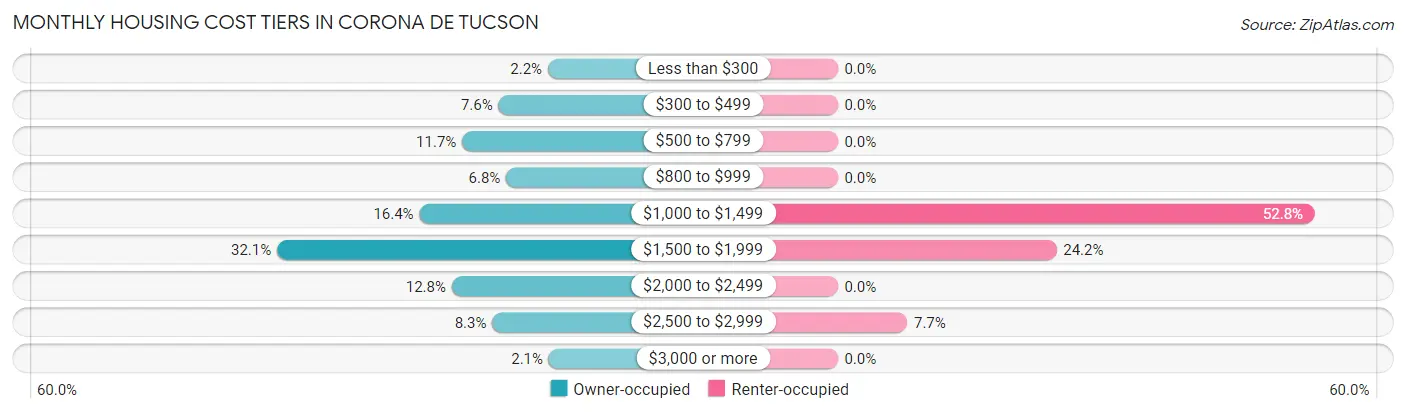
| Monthly Cost | Owner-occupied | Renter-occupied |
| Less than $300 | 63 (2.2%) | 0 (0.0%) |
| $300 to $499 | 220 (7.6%) | 0 (0.0%) |
| $500 to $799 | 336 (11.7%) | 0 (0.0%) |
| $800 to $999 | 196 (6.8%) | 0 (0.0%) |
| $1,000 to $1,499 | 472 (16.4%) | 48 (52.7%) |
| $1,500 to $1,999 | 925 (32.1%) | 22 (24.2%) |
| $2,000 to $2,499 | 369 (12.8%) | 0 (0.0%) |
| $2,500 to $2,999 | 240 (8.3%) | 7 (7.7%) |
| $3,000 or more | 60 (2.1%) | 0 (0.0%) |
| Total | 2,881 (100.0%) | 91 (100.0%) |
Physical Housing Characteristics in Corona de Tucson
Housing Structures in Corona de Tucson
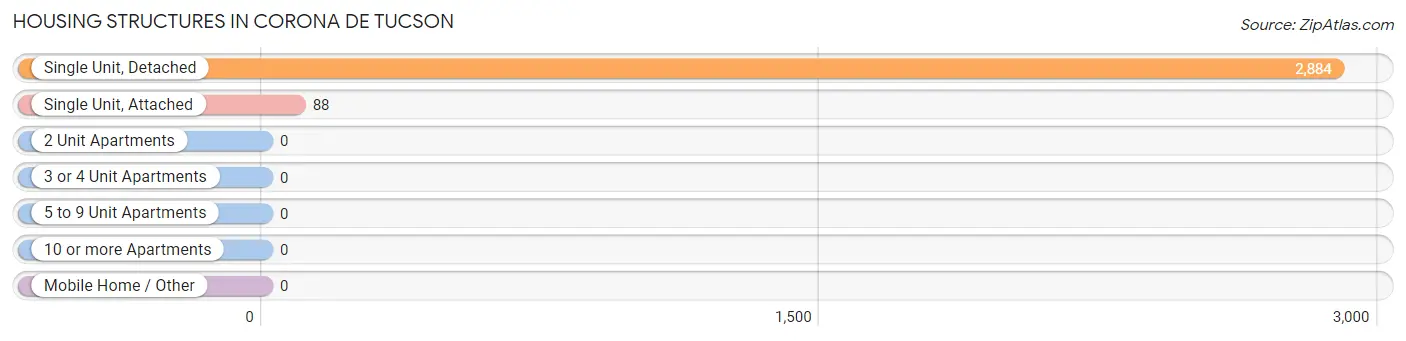
| Structure Type | # Housing Units | % Housing Units |
| Single Unit, Detached | 2,884 | 97.0% |
| Single Unit, Attached | 88 | 3.0% |
| 2 Unit Apartments | 0 | 0.0% |
| 3 or 4 Unit Apartments | 0 | 0.0% |
| 5 to 9 Unit Apartments | 0 | 0.0% |
| 10 or more Apartments | 0 | 0.0% |
| Mobile Home / Other | 0 | 0.0% |
| Total | 2,972 | 100.0% |
Housing Structures by Occupancy in Corona de Tucson
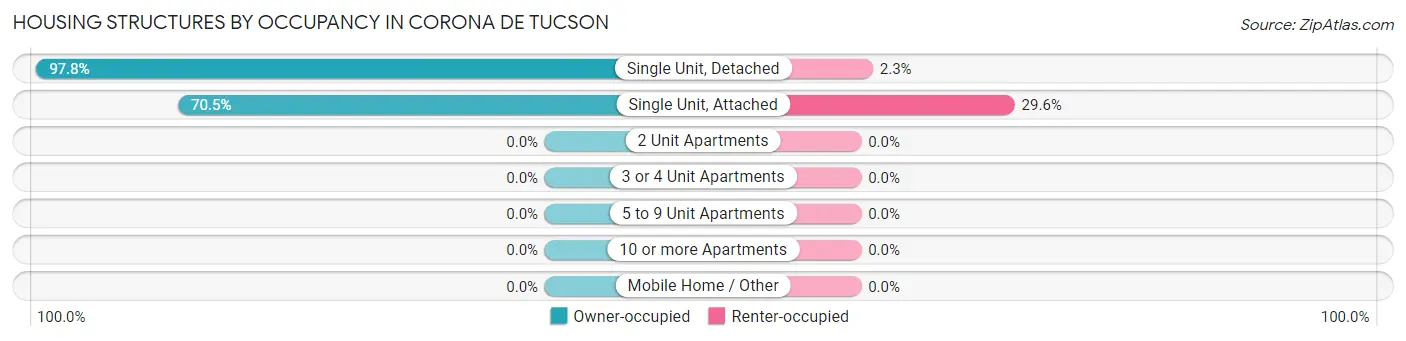
| Structure Type | Owner-occupied | Renter-occupied |
| Single Unit, Detached | 2,819 (97.8%) | 65 (2.2%) |
| Single Unit, Attached | 62 (70.5%) | 26 (29.5%) |
| 2 Unit Apartments | 0 (0.0%) | 0 (0.0%) |
| 3 or 4 Unit Apartments | 0 (0.0%) | 0 (0.0%) |
| 5 to 9 Unit Apartments | 0 (0.0%) | 0 (0.0%) |
| 10 or more Apartments | 0 (0.0%) | 0 (0.0%) |
| Mobile Home / Other | 0 (0.0%) | 0 (0.0%) |
| Total | 2,881 (96.9%) | 91 (3.1%) |
Housing Structures by Number of Rooms in Corona de Tucson
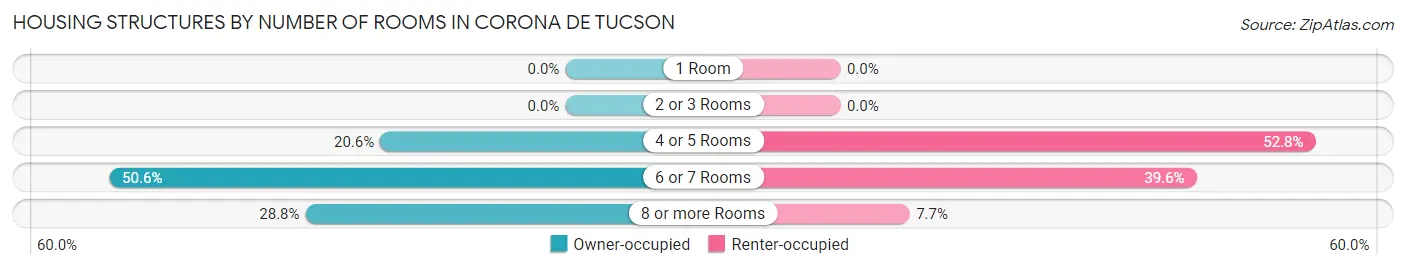
| Number of Rooms | Owner-occupied | Renter-occupied |
| 1 Room | 0 (0.0%) | 0 (0.0%) |
| 2 or 3 Rooms | 0 (0.0%) | 0 (0.0%) |
| 4 or 5 Rooms | 592 (20.5%) | 48 (52.7%) |
| 6 or 7 Rooms | 1,458 (50.6%) | 36 (39.6%) |
| 8 or more Rooms | 831 (28.8%) | 7 (7.7%) |
| Total | 2,881 (100.0%) | 91 (100.0%) |
Housing Structure by Heating Type in Corona de Tucson
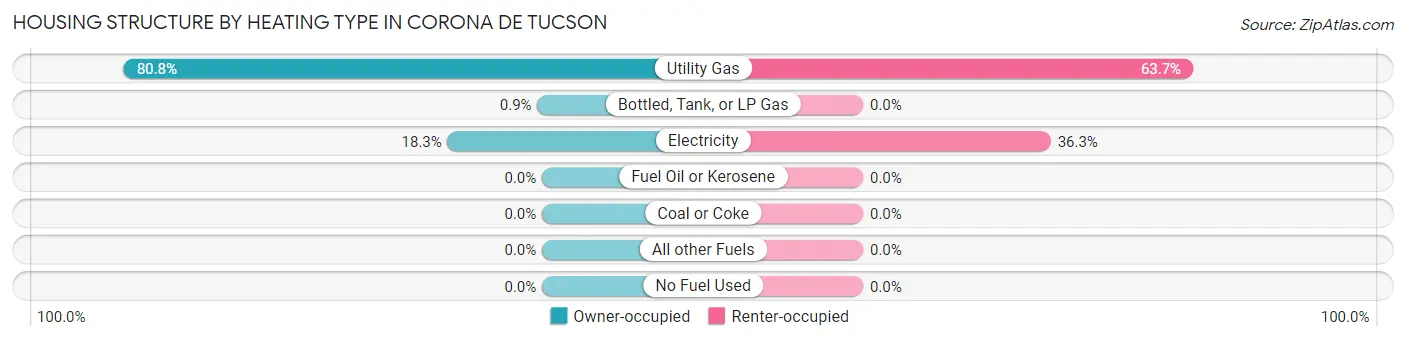
| Heating Type | Owner-occupied | Renter-occupied |
| Utility Gas | 2,329 (80.8%) | 58 (63.7%) |
| Bottled, Tank, or LP Gas | 26 (0.9%) | 0 (0.0%) |
| Electricity | 526 (18.3%) | 33 (36.3%) |
| Fuel Oil or Kerosene | 0 (0.0%) | 0 (0.0%) |
| Coal or Coke | 0 (0.0%) | 0 (0.0%) |
| All other Fuels | 0 (0.0%) | 0 (0.0%) |
| No Fuel Used | 0 (0.0%) | 0 (0.0%) |
| Total | 2,881 (100.0%) | 91 (100.0%) |
Household Vehicle Usage in Corona de Tucson
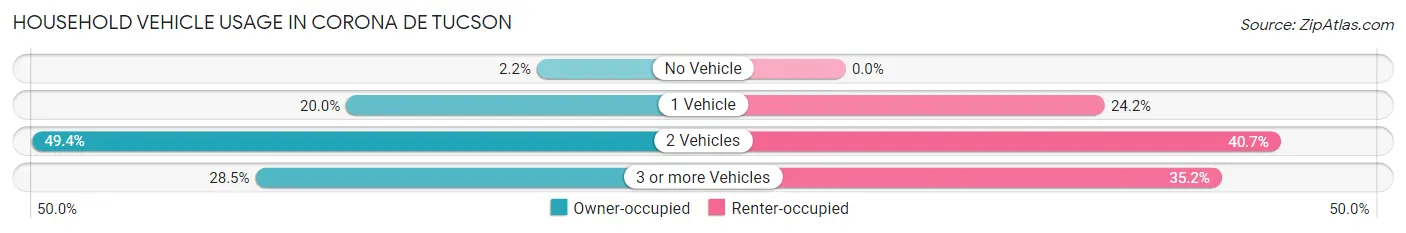
| Vehicles per Household | Owner-occupied | Renter-occupied |
| No Vehicle | 63 (2.2%) | 0 (0.0%) |
| 1 Vehicle | 576 (20.0%) | 22 (24.2%) |
| 2 Vehicles | 1,422 (49.4%) | 37 (40.7%) |
| 3 or more Vehicles | 820 (28.5%) | 32 (35.2%) |
| Total | 2,881 (100.0%) | 91 (100.0%) |
Real Estate & Mortgages in Corona de Tucson
Real Estate and Mortgage Overview in Corona de Tucson
| Characteristic | Without Mortgage | With Mortgage |
| Housing Units | 649 | 2,232 |
| Median Property Value | $342,700 | $297,400 |
| Median Household Income | $101,723 | $561 |
| Monthly Housing Costs | $557 | $60 |
| Real Estate Taxes | $2,748 | $91 |
Property Value by Mortgage Status in Corona de Tucson
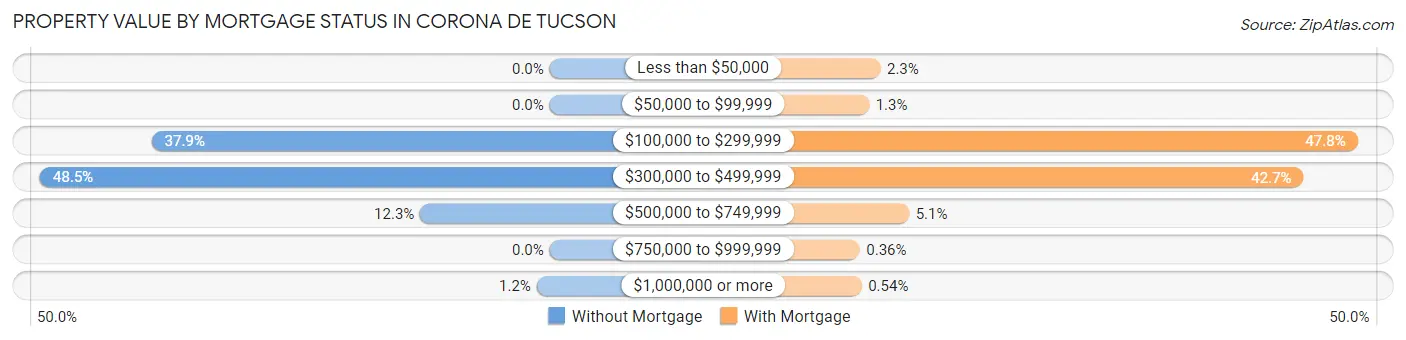
| Property Value | Without Mortgage | With Mortgage |
| Less than $50,000 | 0 (0.0%) | 52 (2.3%) |
| $50,000 to $99,999 | 0 (0.0%) | 28 (1.3%) |
| $100,000 to $299,999 | 246 (37.9%) | 1,067 (47.8%) |
| $300,000 to $499,999 | 315 (48.5%) | 952 (42.6%) |
| $500,000 to $749,999 | 80 (12.3%) | 113 (5.1%) |
| $750,000 to $999,999 | 0 (0.0%) | 8 (0.4%) |
| $1,000,000 or more | 8 (1.2%) | 12 (0.5%) |
| Total | 649 (100.0%) | 2,232 (100.0%) |
Household Income by Mortgage Status in Corona de Tucson
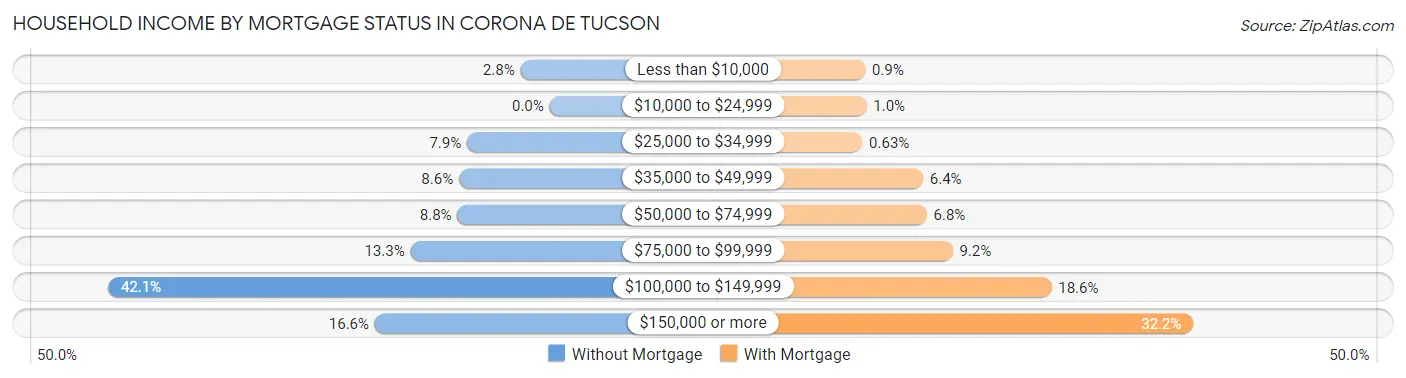
| Household Income | Without Mortgage | With Mortgage |
| Less than $10,000 | 18 (2.8%) | 20 (0.9%) |
| $10,000 to $24,999 | 0 (0.0%) | 23 (1.0%) |
| $25,000 to $34,999 | 51 (7.9%) | 14 (0.6%) |
| $35,000 to $49,999 | 56 (8.6%) | 143 (6.4%) |
| $50,000 to $74,999 | 57 (8.8%) | 151 (6.8%) |
| $75,000 to $99,999 | 86 (13.3%) | 206 (9.2%) |
| $100,000 to $149,999 | 273 (42.1%) | 416 (18.6%) |
| $150,000 or more | 108 (16.6%) | 718 (32.2%) |
| Total | 649 (100.0%) | 2,232 (100.0%) |
Property Value to Household Income Ratio in Corona de Tucson
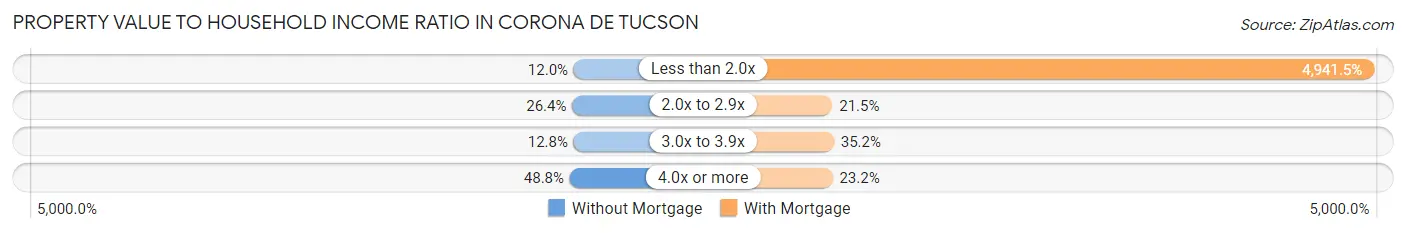
| Value-to-Income Ratio | Without Mortgage | With Mortgage |
| Less than 2.0x | 78 (12.0%) | 110,294 (4,941.5%) |
| 2.0x to 2.9x | 171 (26.4%) | 480 (21.5%) |
| 3.0x to 3.9x | 83 (12.8%) | 785 (35.2%) |
| 4.0x or more | 317 (48.8%) | 518 (23.2%) |
| Total | 649 (100.0%) | 2,232 (100.0%) |
Real Estate Taxes by Mortgage Status in Corona de Tucson
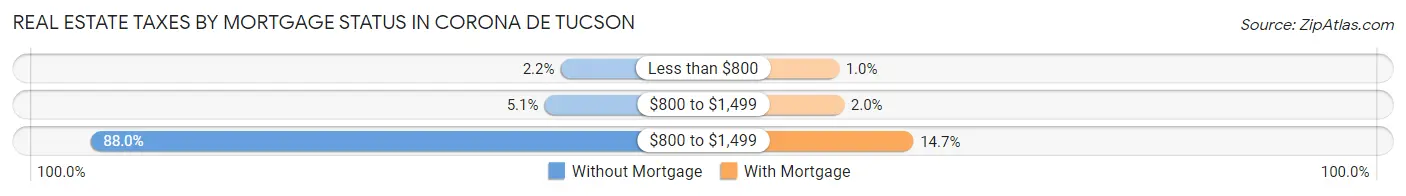
| Property Taxes | Without Mortgage | With Mortgage |
| Less than $800 | 14 (2.2%) | 23 (1.0%) |
| $800 to $1,499 | 33 (5.1%) | 44 (2.0%) |
| $800 to $1,499 | 571 (88.0%) | 327 (14.6%) |
| Total | 649 (100.0%) | 2,232 (100.0%) |
Health & Disability in Corona de Tucson
Health Insurance Coverage by Age in Corona de Tucson
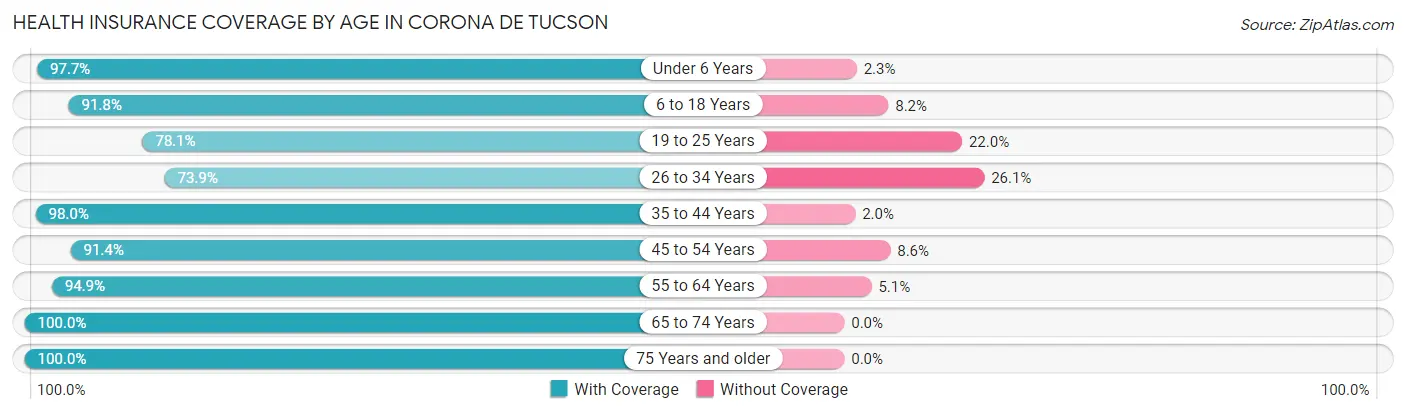
| Age Bracket | With Coverage | Without Coverage |
| Under 6 Years | 720 (97.7%) | 17 (2.3%) |
| 6 to 18 Years | 1,846 (91.8%) | 165 (8.2%) |
| 19 to 25 Years | 384 (78.0%) | 108 (22.0%) |
| 26 to 34 Years | 646 (73.9%) | 228 (26.1%) |
| 35 to 44 Years | 1,440 (98.0%) | 30 (2.0%) |
| 45 to 54 Years | 1,098 (91.4%) | 103 (8.6%) |
| 55 to 64 Years | 712 (94.9%) | 38 (5.1%) |
| 65 to 74 Years | 701 (100.0%) | 0 (0.0%) |
| 75 Years and older | 438 (100.0%) | 0 (0.0%) |
| Total | 7,985 (92.1%) | 689 (7.9%) |
Health Insurance Coverage by Citizenship Status in Corona de Tucson
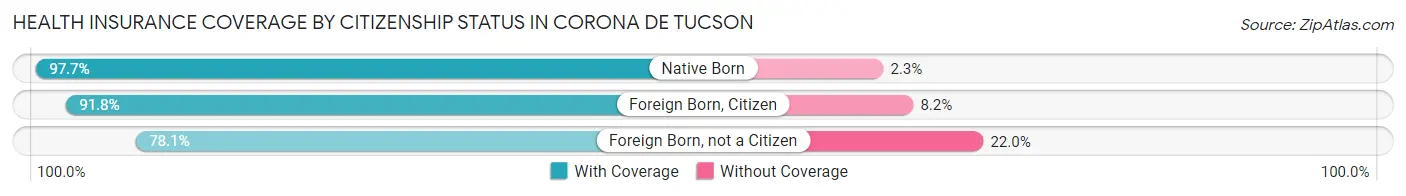
| Citizenship Status | With Coverage | Without Coverage |
| Native Born | 720 (97.7%) | 17 (2.3%) |
| Foreign Born, Citizen | 1,846 (91.8%) | 165 (8.2%) |
| Foreign Born, not a Citizen | 384 (78.0%) | 108 (22.0%) |
Health Insurance Coverage by Household Income in Corona de Tucson
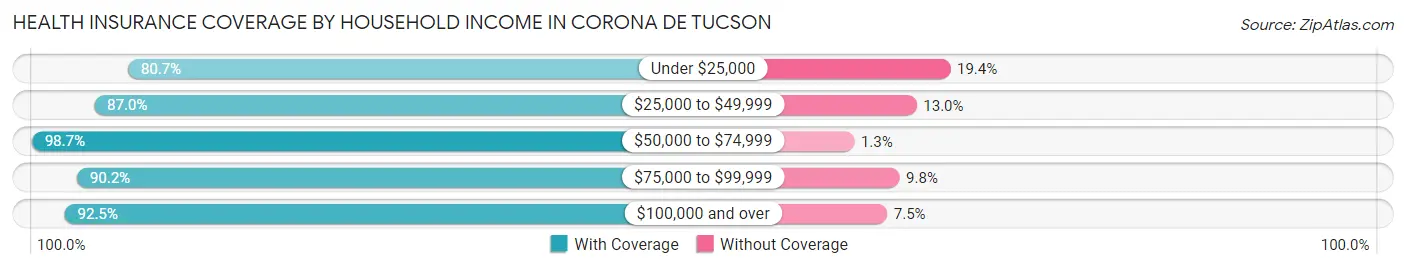
| Household Income | With Coverage | Without Coverage |
| Under $25,000 | 100 (80.6%) | 24 (19.4%) |
| $25,000 to $49,999 | 661 (87.0%) | 99 (13.0%) |
| $50,000 to $74,999 | 886 (98.7%) | 12 (1.3%) |
| $75,000 to $99,999 | 1,443 (90.2%) | 157 (9.8%) |
| $100,000 and over | 4,895 (92.5%) | 397 (7.5%) |
Public vs Private Health Insurance Coverage by Age in Corona de Tucson
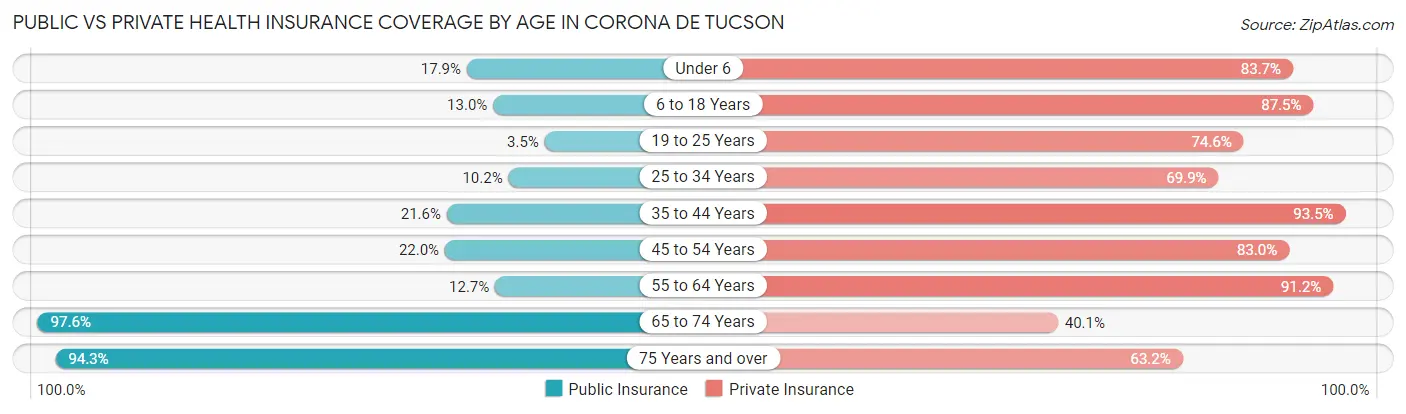
| Age Bracket | Public Insurance | Private Insurance |
| Under 6 | 132 (17.9%) | 617 (83.7%) |
| 6 to 18 Years | 262 (13.0%) | 1,760 (87.5%) |
| 19 to 25 Years | 17 (3.5%) | 367 (74.6%) |
| 25 to 34 Years | 89 (10.2%) | 611 (69.9%) |
| 35 to 44 Years | 318 (21.6%) | 1,374 (93.5%) |
| 45 to 54 Years | 264 (22.0%) | 997 (83.0%) |
| 55 to 64 Years | 95 (12.7%) | 684 (91.2%) |
| 65 to 74 Years | 684 (97.6%) | 281 (40.1%) |
| 75 Years and over | 413 (94.3%) | 277 (63.2%) |
| Total | 2,274 (26.2%) | 6,968 (80.3%) |
Disability Status by Sex by Age in Corona de Tucson
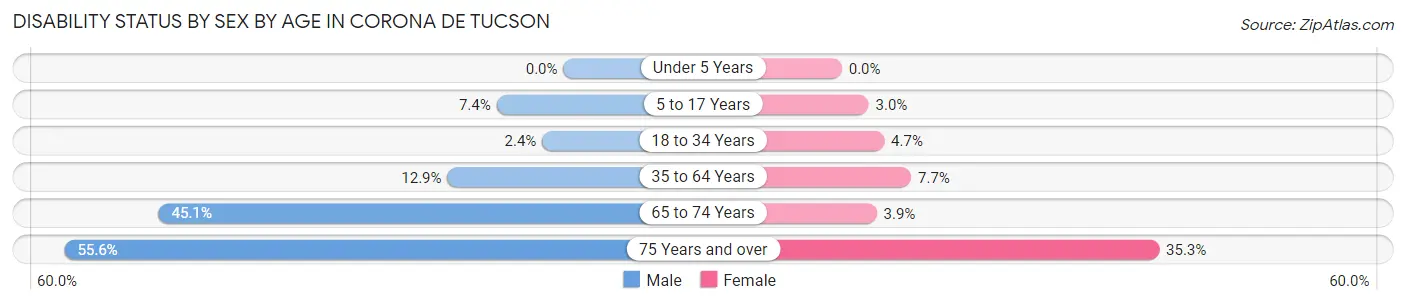
| Age Bracket | Male | Female |
| Under 5 Years | 0 (0.0%) | 0 (0.0%) |
| 5 to 17 Years | 86 (7.4%) | 27 (3.0%) |
| 18 to 34 Years | 17 (2.4%) | 34 (4.7%) |
| 35 to 64 Years | 216 (12.9%) | 135 (7.7%) |
| 65 to 74 Years | 165 (45.1%) | 13 (3.9%) |
| 75 Years and over | 105 (55.6%) | 88 (35.3%) |
Disability Class by Sex by Age in Corona de Tucson
Disability Class: Hearing Difficulty
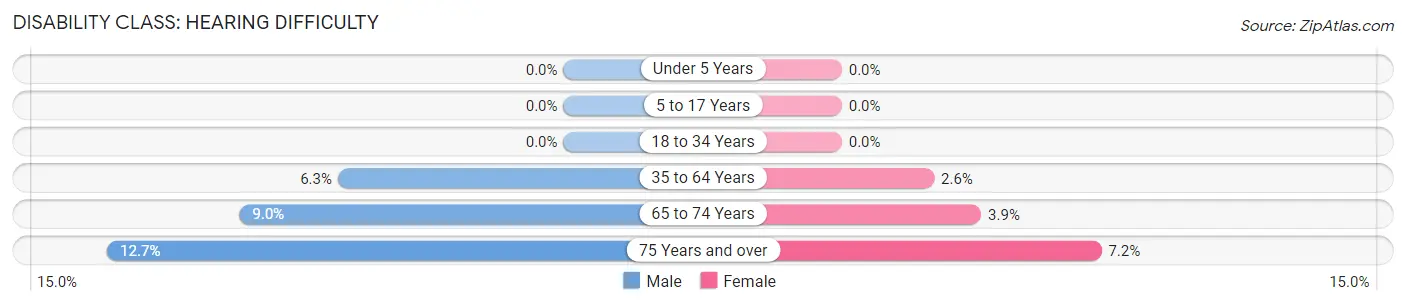
| Age Bracket | Male | Female |
| Under 5 Years | 0 (0.0%) | 0 (0.0%) |
| 5 to 17 Years | 0 (0.0%) | 0 (0.0%) |
| 18 to 34 Years | 0 (0.0%) | 0 (0.0%) |
| 35 to 64 Years | 105 (6.3%) | 45 (2.6%) |
| 65 to 74 Years | 33 (9.0%) | 13 (3.9%) |
| 75 Years and over | 24 (12.7%) | 18 (7.2%) |
Disability Class: Vision Difficulty
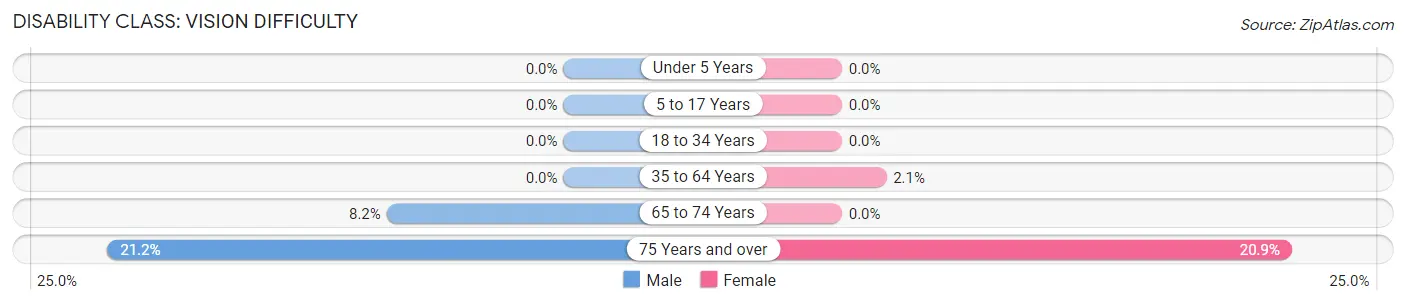
| Age Bracket | Male | Female |
| Under 5 Years | 0 (0.0%) | 0 (0.0%) |
| 5 to 17 Years | 0 (0.0%) | 0 (0.0%) |
| 18 to 34 Years | 0 (0.0%) | 0 (0.0%) |
| 35 to 64 Years | 0 (0.0%) | 36 (2.1%) |
| 65 to 74 Years | 30 (8.2%) | 0 (0.0%) |
| 75 Years and over | 40 (21.2%) | 52 (20.9%) |
Disability Class: Cognitive Difficulty
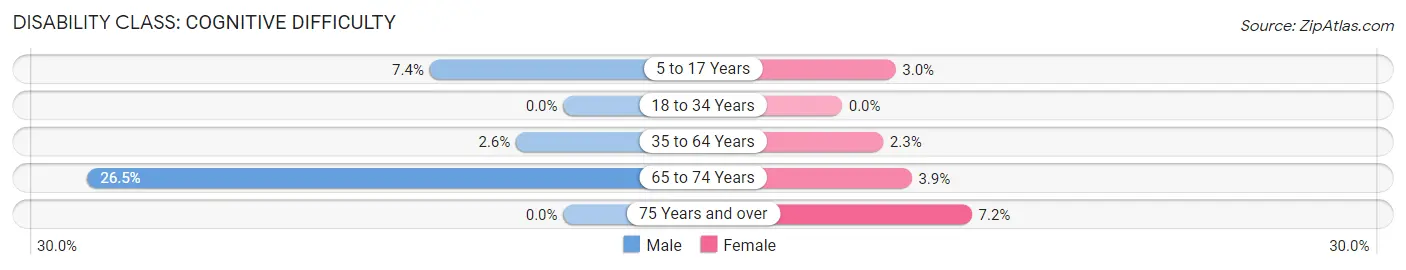
| Age Bracket | Male | Female |
| 5 to 17 Years | 86 (7.4%) | 27 (3.0%) |
| 18 to 34 Years | 0 (0.0%) | 0 (0.0%) |
| 35 to 64 Years | 44 (2.6%) | 40 (2.3%) |
| 65 to 74 Years | 97 (26.5%) | 13 (3.9%) |
| 75 Years and over | 0 (0.0%) | 18 (7.2%) |
Disability Class: Ambulatory Difficulty
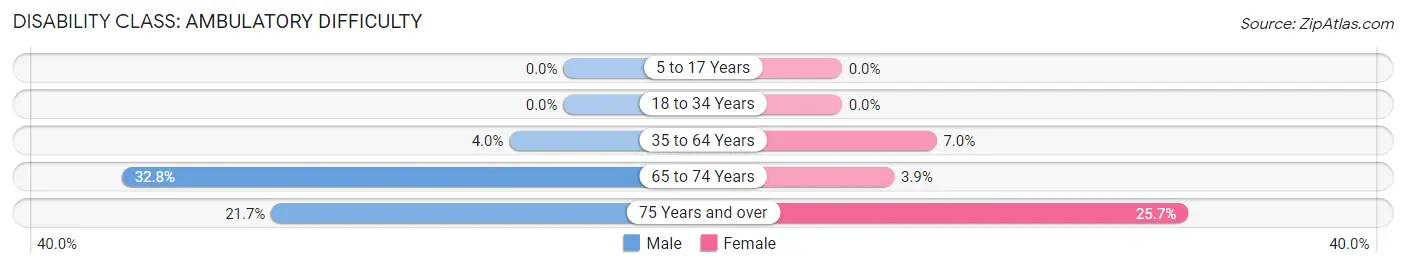
| Age Bracket | Male | Female |
| 5 to 17 Years | 0 (0.0%) | 0 (0.0%) |
| 18 to 34 Years | 0 (0.0%) | 0 (0.0%) |
| 35 to 64 Years | 67 (4.0%) | 123 (7.0%) |
| 65 to 74 Years | 120 (32.8%) | 13 (3.9%) |
| 75 Years and over | 41 (21.7%) | 64 (25.7%) |
Disability Class: Self-Care Difficulty
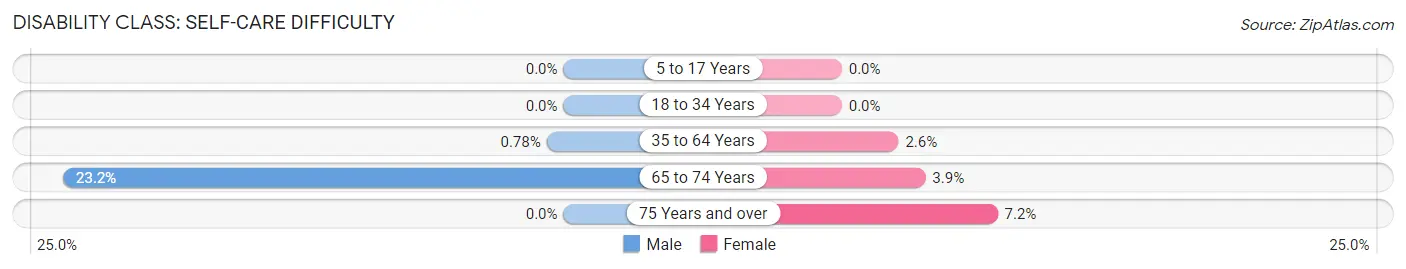
| Age Bracket | Male | Female |
| 5 to 17 Years | 0 (0.0%) | 0 (0.0%) |
| 18 to 34 Years | 0 (0.0%) | 0 (0.0%) |
| 35 to 64 Years | 13 (0.8%) | 46 (2.6%) |
| 65 to 74 Years | 85 (23.2%) | 13 (3.9%) |
| 75 Years and over | 0 (0.0%) | 18 (7.2%) |
Technology Access in Corona de Tucson
Computing Device Access in Corona de Tucson
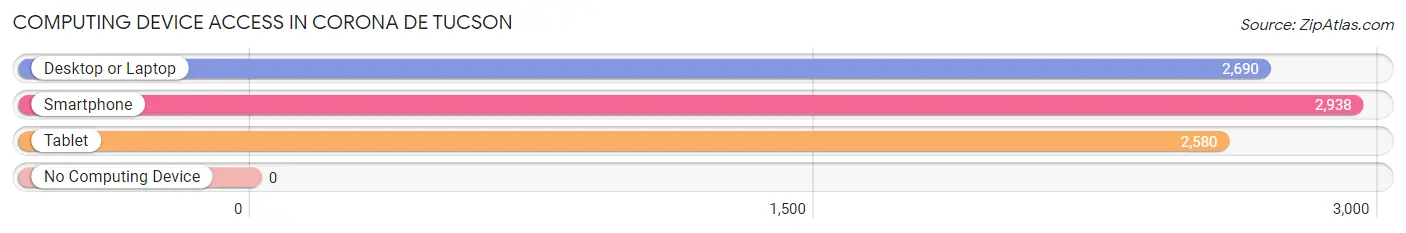
| Device Type | # Households | % Households |
| Desktop or Laptop | 2,690 | 90.5% |
| Smartphone | 2,938 | 98.9% |
| Tablet | 2,580 | 86.8% |
| No Computing Device | 0 | 0.0% |
| Total | 2,972 | 100.0% |
Internet Access in Corona de Tucson
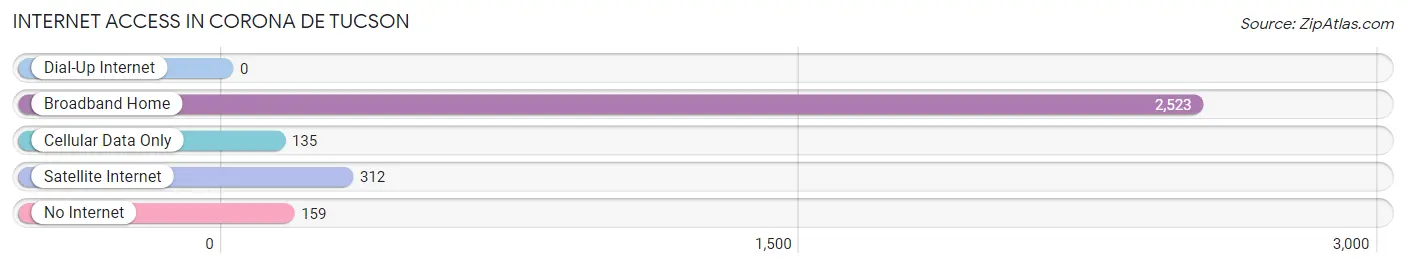
| Internet Type | # Households | % Households |
| Dial-Up Internet | 0 | 0.0% |
| Broadband Home | 2,523 | 84.9% |
| Cellular Data Only | 135 | 4.5% |
| Satellite Internet | 312 | 10.5% |
| No Internet | 159 | 5.3% |
| Total | 2,972 | 100.0% |
Corona de Tucson Summary
Corona de Tucson, Arizona is a small unincorporated community located in Pima County, Arizona. It is situated in the foothills of the Santa Catalina Mountains, approximately 20 miles north of Tucson. The population of Corona de Tucson was estimated to be 1,845 in 2019.
History
Corona de Tucson was founded in the late 1800s by a group of Mexican settlers. The settlers were attracted to the area due to its fertile soil and abundant water supply. The community was originally known as El Coronado, which translates to “the crowned one” in Spanish. The name was changed to Corona de Tucson in the early 1900s.
The area was primarily used for farming and ranching until the 1950s, when the population began to grow. The population growth was due to the development of the nearby Davis-Monthan Air Force Base. The base provided employment opportunities for many of the residents of Corona de Tucson.
Geography
Corona de Tucson is located in the foothills of the Santa Catalina Mountains. The area is characterized by rolling hills and desert vegetation. The climate is arid, with hot summers and mild winters. The average annual precipitation is approximately 11 inches.
The community is located approximately 20 miles north of Tucson. It is bordered by the towns of Marana and Oro Valley to the north, and the town of Sahuarita to the south.
Economy
The economy of Corona de Tucson is primarily based on agriculture and tourism. The area is home to several farms and ranches, which produce a variety of crops, including cotton, alfalfa, and wheat. The area is also home to several wineries and vineyards, which produce a variety of wines.
Tourism is an important part of the local economy. The area is home to several attractions, including the Arizona-Sonora Desert Museum, the Saguaro National Park, and the Tucson Mountain Park. The area is also home to several golf courses, which attract visitors from around the world.
Demographics
As of 2019, the population of Corona de Tucson was estimated to be 1,845. The population is primarily Hispanic, with a small percentage of other ethnicities. The median household income is approximately $50,000, and the median home value is approximately $200,000.
The area is served by the Marana Unified School District. The district operates several elementary, middle, and high schools in the area. The area is also home to several private schools, including the Corona de Tucson Christian Academy.
Conclusion
Corona de Tucson, Arizona is a small unincorporated community located in Pima County, Arizona. It is situated in the foothills of the Santa Catalina Mountains, approximately 20 miles north of Tucson. The population of Corona de Tucson was estimated to be 1,845 in 2019. The economy of Corona de Tucson is primarily based on agriculture and tourism. The population is primarily Hispanic, with a small percentage of other ethnicities. The area is served by the Marana Unified School District and is home to several attractions, including the Arizona-Sonora Desert Museum, the Saguaro National Park, and the Tucson Mountain Park.
Common Questions
What is Per Capita Income in Corona de Tucson?
Per Capita income in Corona de Tucson is $42,866.
What is the Median Family Income in Corona de Tucson?
Median Family Income in Corona de Tucson is $112,574.
What is the Median Household income in Corona de Tucson?
Median Household Income in Corona de Tucson is $106,049.
What is Income or Wage Gap in Corona de Tucson?
Income or Wage Gap in Corona de Tucson is 50.4%.
Women in Corona de Tucson earn 49.6 cents for every dollar earned by a man.
What is Inequality or Gini Index in Corona de Tucson?
Inequality or Gini Index in Corona de Tucson is 0.36.
What is the Total Population of Corona de Tucson?
Total Population of Corona de Tucson is 8,742.
What is the Total Male Population of Corona de Tucson?
Total Male Population of Corona de Tucson is 4,427.
What is the Total Female Population of Corona de Tucson?
Total Female Population of Corona de Tucson is 4,315.
What is the Ratio of Males per 100 Females in Corona de Tucson?
There are 102.60 Males per 100 Females in Corona de Tucson.
What is the Ratio of Females per 100 Males in Corona de Tucson?
There are 97.47 Females per 100 Males in Corona de Tucson.
What is the Median Population Age in Corona de Tucson?
Median Population Age in Corona de Tucson is 37.4 Years.
What is the Average Family Size in Corona de Tucson
Average Family Size in Corona de Tucson is 3.3 People.
What is the Average Household Size in Corona de Tucson
Average Household Size in Corona de Tucson is 2.9 People.
How Large is the Labor Force in Corona de Tucson?
There are 4,126 People in the Labor Forcein in Corona de Tucson.
What is the Percentage of People in the Labor Force in Corona de Tucson?
65.9% of People are in the Labor Force in Corona de Tucson.
What is the Unemployment Rate in Corona de Tucson?
Unemployment Rate in Corona de Tucson is 3.6%.