Grosse Pointe, MI Map & Demographics
Grosse Pointe Map
Grosse Pointe Overview
$78,799
PER CAPITA INCOME
$166,000
AVG FAMILY INCOME
$136,094
AVG HOUSEHOLD INCOME
53.8%
WAGE / INCOME GAP [ % ]
46.2¢/ $1
WAGE / INCOME GAP [ $ ]
0.50
INEQUALITY / GINI INDEX
5,621
TOTAL POPULATION
2,530
MALE POPULATION
3,091
FEMALE POPULATION
81.85
MALES / 100 FEMALES
122.17
FEMALES / 100 MALES
44.1
MEDIAN AGE
3.2
AVG FAMILY SIZE
2.5
AVG HOUSEHOLD SIZE
2,727
LABOR FORCE [ PEOPLE ]
64.1%
PERCENT IN LABOR FORCE
4.0%
UNEMPLOYMENT RATE
Grosse Pointe Area Codes
Income in Grosse Pointe
Income Overview in Grosse Pointe
Per Capita Income in Grosse Pointe is $78,799, while median incomes of families and households are $166,000 and $136,094 respectively.
| Characteristic | Number | Measure |
| Per Capita Income | 5,621 | $78,799 |
| Median Family Income | 1,504 | $166,000 |
| Mean Family Income | 1,504 | $254,116 |
| Median Household Income | 2,252 | $136,094 |
| Mean Household Income | 2,252 | $201,645 |
| Income Deficit | 1,504 | $0 |
| Wage / Income Gap (%) | 5,621 | 53.84% |
| Wage / Income Gap ($) | 5,621 | 46.16¢ per $1 |
| Gini / Inequality Index | 5,621 | 0.50 |
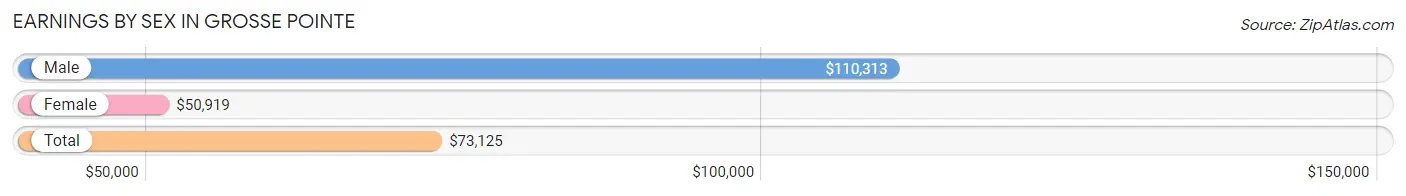
Earnings by Sex in Grosse Pointe
Average Earnings in Grosse Pointe are $73,125, $110,313 for men and $50,919 for women, a difference of 53.8%.
| Sex | Number | Average Earnings |
| Male | 1,461 (51.1%) | $110,313 |
| Female | 1,397 (48.9%) | $50,919 |
| Total | 2,858 (100.0%) | $73,125 |
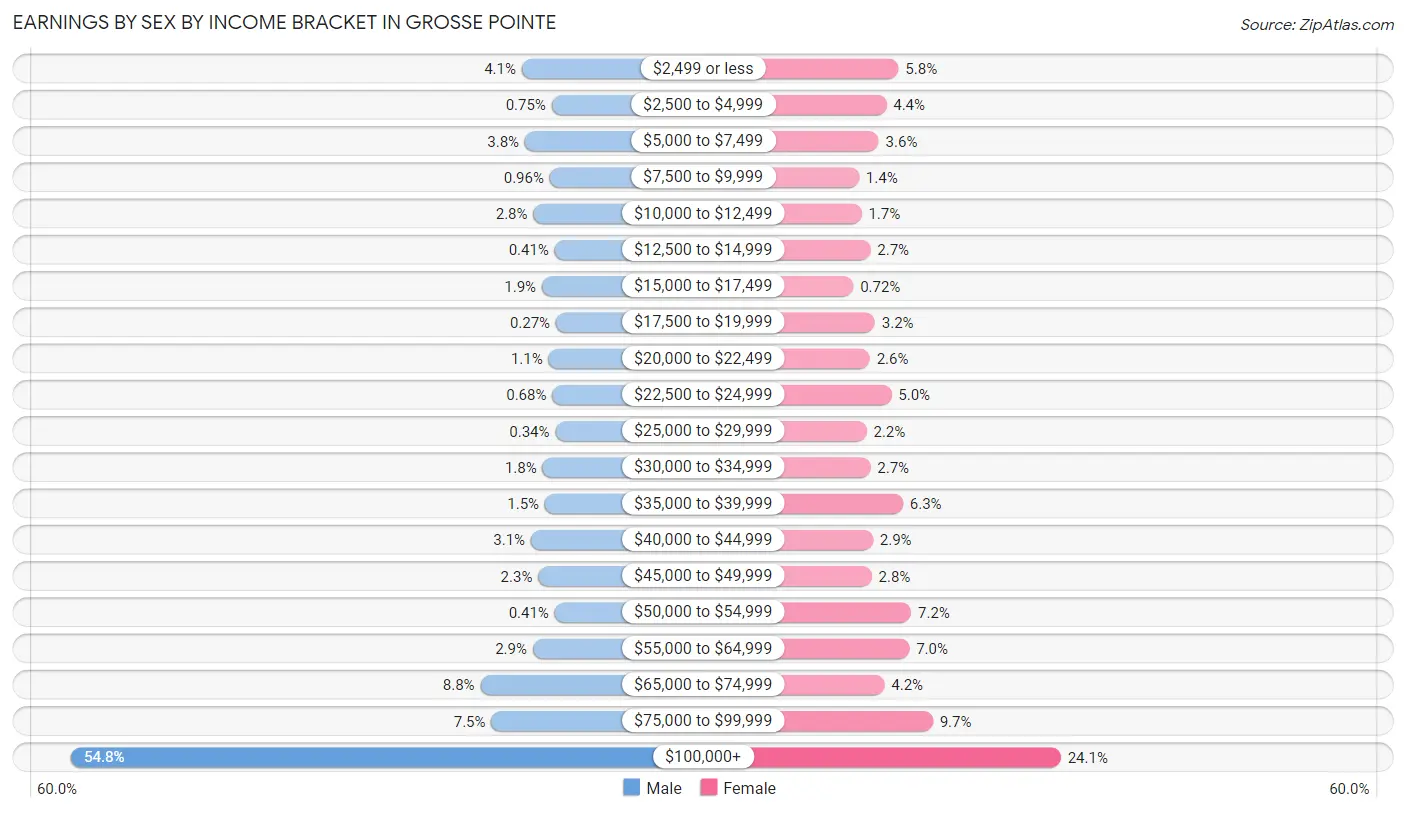
Earnings by Sex by Income Bracket in Grosse Pointe
The most common earnings brackets in Grosse Pointe are $100,000+ for men (800 | 54.8%) and $100,000+ for women (336 | 24.0%).
| Income | Male | Female |
| $2,499 or less | 60 (4.1%) | 81 (5.8%) |
| $2,500 to $4,999 | 11 (0.7%) | 62 (4.4%) |
| $5,000 to $7,499 | 55 (3.8%) | 50 (3.6%) |
| $7,500 to $9,999 | 14 (1.0%) | 19 (1.4%) |
| $10,000 to $12,499 | 41 (2.8%) | 23 (1.7%) |
| $12,500 to $14,999 | 6 (0.4%) | 37 (2.6%) |
| $15,000 to $17,499 | 27 (1.8%) | 10 (0.7%) |
| $17,500 to $19,999 | 4 (0.3%) | 44 (3.2%) |
| $20,000 to $22,499 | 16 (1.1%) | 36 (2.6%) |
| $22,500 to $24,999 | 10 (0.7%) | 70 (5.0%) |
| $25,000 to $29,999 | 5 (0.3%) | 31 (2.2%) |
| $30,000 to $34,999 | 26 (1.8%) | 37 (2.6%) |
| $35,000 to $39,999 | 22 (1.5%) | 88 (6.3%) |
| $40,000 to $44,999 | 45 (3.1%) | 41 (2.9%) |
| $45,000 to $49,999 | 33 (2.3%) | 39 (2.8%) |
| $50,000 to $54,999 | 6 (0.4%) | 101 (7.2%) |
| $55,000 to $64,999 | 42 (2.9%) | 98 (7.0%) |
| $65,000 to $74,999 | 128 (8.8%) | 59 (4.2%) |
| $75,000 to $99,999 | 110 (7.5%) | 135 (9.7%) |
| $100,000+ | 800 (54.8%) | 336 (24.0%) |
| Total | 1,461 (100.0%) | 1,397 (100.0%) |
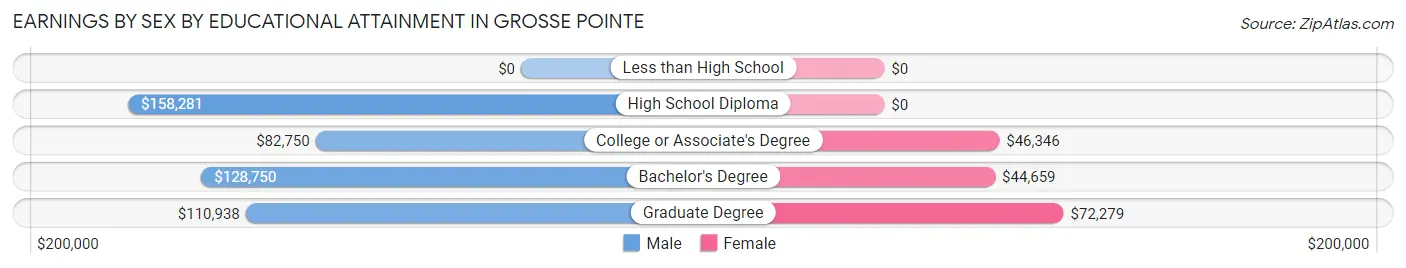
Earnings by Sex by Educational Attainment in Grosse Pointe
Average earnings in Grosse Pointe are $125,524 for men and $52,917 for women, a difference of 57.8%. Men with an educational attainment of high school diploma enjoy the highest average annual earnings of $158,281, while those with college or associate's degree education earn the least with $82,750. Women with an educational attainment of graduate degree earn the most with the average annual earnings of $72,279, while those with bachelor's degree education have the smallest earnings of $44,659.
| Educational Attainment | Male Income | Female Income |
| Less than High School | - | - |
| High School Diploma | $158,281 | $0 |
| College or Associate's Degree | $82,750 | $46,346 |
| Bachelor's Degree | $128,750 | $44,659 |
| Graduate Degree | $110,938 | $72,279 |
| Total | $125,524 | $52,917 |
Family Income in Grosse Pointe
Family Income Brackets in Grosse Pointe
According to the Grosse Pointe family income data, there are 629 families falling into the $200,000+ income range, which is the most common income bracket and makes up 41.8% of all families.
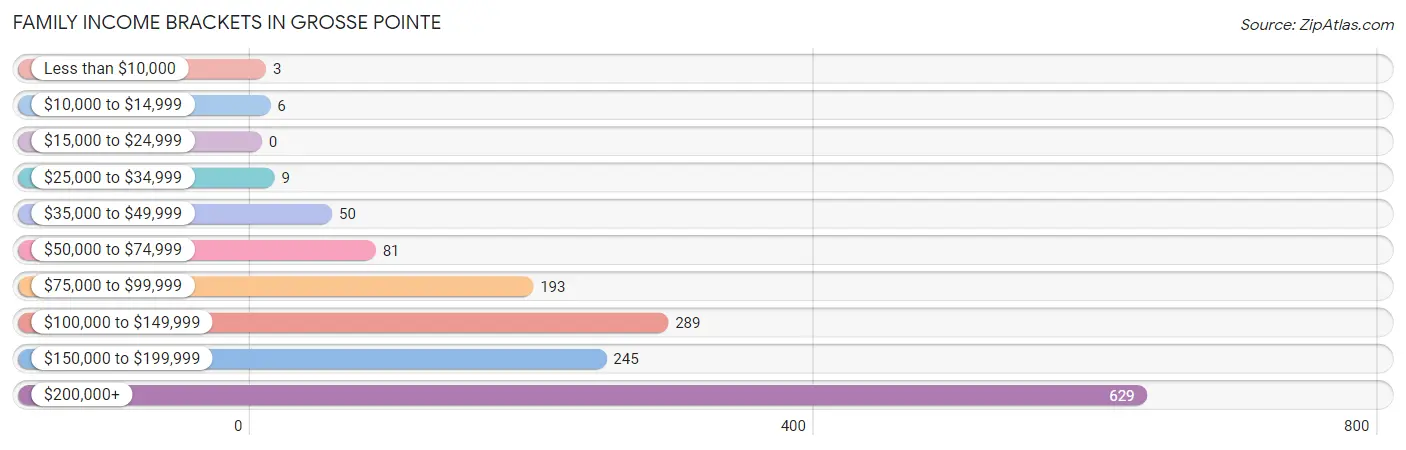
| Income Bracket | # Families | % Families |
| Less than $10,000 | 3 | 0.2% |
| $10,000 to $14,999 | 6 | 0.4% |
| $15,000 to $24,999 | 0 | 0.0% |
| $25,000 to $34,999 | 9 | 0.6% |
| $35,000 to $49,999 | 50 | 3.3% |
| $50,000 to $74,999 | 81 | 5.4% |
| $75,000 to $99,999 | 193 | 12.8% |
| $100,000 to $149,999 | 289 | 19.2% |
| $150,000 to $199,999 | 245 | 16.3% |
| $200,000+ | 629 | 41.8% |
Family Income by Famaliy Size in Grosse Pointe
4-person families (360 | 23.9%) account for the highest median family income in Grosse Pointe with $208,654 per family, while 2-person families (748 | 49.7%) have the highest median income of $77,404 per family member.
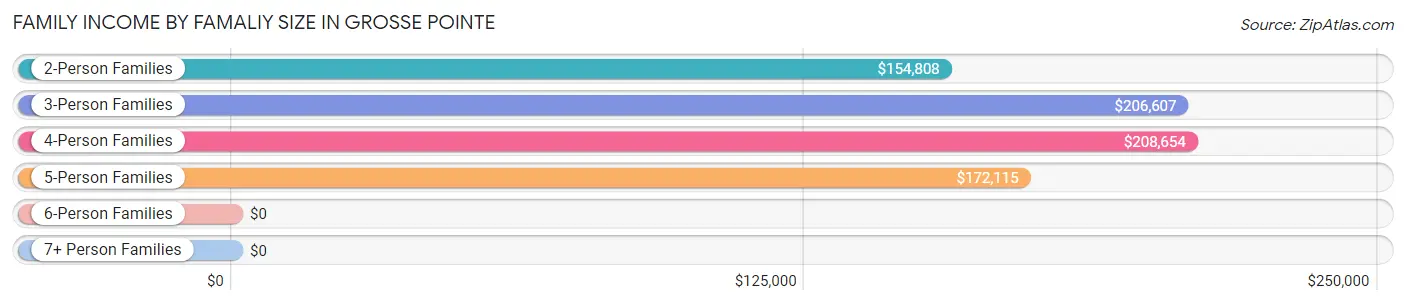
| Income Bracket | # Families | Median Income |
| 2-Person Families | 748 (49.7%) | $154,808 |
| 3-Person Families | 219 (14.6%) | $206,607 |
| 4-Person Families | 360 (23.9%) | $208,654 |
| 5-Person Families | 74 (4.9%) | $172,115 |
| 6-Person Families | 35 (2.3%) | $0 |
| 7+ Person Families | 68 (4.5%) | $0 |
| Total | 1,504 (100.0%) | $166,000 |
Family Income by Number of Earners in Grosse Pointe
The median family income in Grosse Pointe is $166,000, with families comprising 3+ earners (179) having the highest median family income of $250,001, while families with no earners (194) have the lowest median family income of $133,438, accounting for 11.9% and 12.9% of families, respectively.
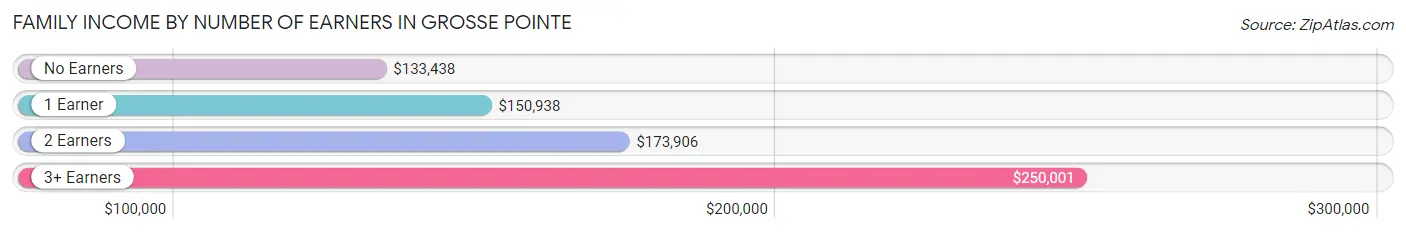
| Number of Earners | # Families | Median Income |
| No Earners | 194 (12.9%) | $133,438 |
| 1 Earner | 566 (37.6%) | $150,938 |
| 2 Earners | 565 (37.6%) | $173,906 |
| 3+ Earners | 179 (11.9%) | $250,001 |
| Total | 1,504 (100.0%) | $166,000 |
Household Income in Grosse Pointe
Household Income Brackets in Grosse Pointe
With 712 households falling in the category, the $200,000+ income range is the most frequent in Grosse Pointe, accounting for 31.6% of all households. In contrast, only 11 households (0.5%) fall into the $10,000 to $14,999 income bracket, making it the least populous group.
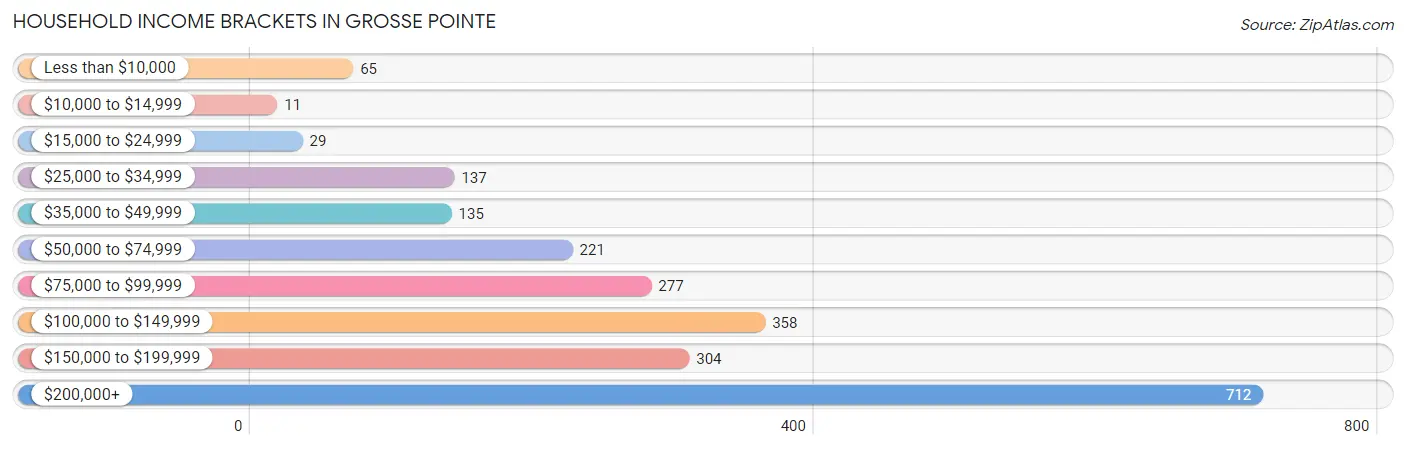
| Income Bracket | # Households | % Households |
| Less than $10,000 | 65 | 2.9% |
| $10,000 to $14,999 | 11 | 0.5% |
| $15,000 to $24,999 | 29 | 1.3% |
| $25,000 to $34,999 | 137 | 6.1% |
| $35,000 to $49,999 | 135 | 6.0% |
| $50,000 to $74,999 | 221 | 9.8% |
| $75,000 to $99,999 | 277 | 12.3% |
| $100,000 to $149,999 | 358 | 15.9% |
| $150,000 to $199,999 | 304 | 13.5% |
| $200,000+ | 712 | 31.6% |
Household Income by Householder Age in Grosse Pointe
The median household income in Grosse Pointe is $136,094, with the highest median household income of $171,731 found in the 25 to 44 years age bracket for the primary householder. A total of 540 households (24.0%) fall into this category. Meanwhile, the 15 to 24 years age bracket for the primary householder has the lowest median household income of $0, with 15 households (0.7%) in this group.
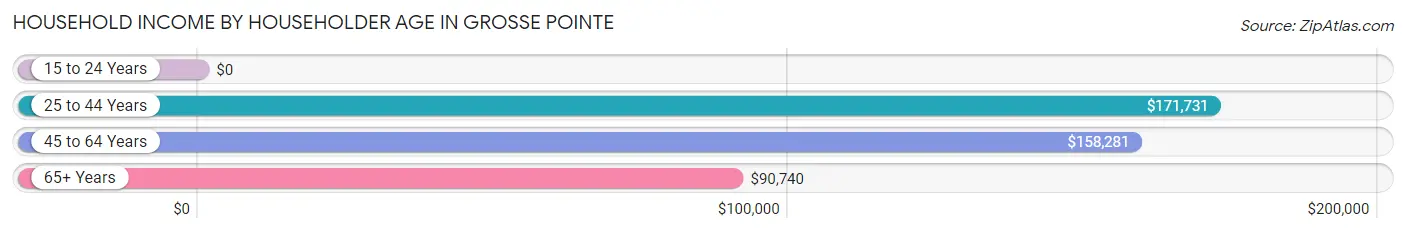
| Income Bracket | # Households | Median Income |
| 15 to 24 Years | 15 (0.7%) | $0 |
| 25 to 44 Years | 540 (24.0%) | $171,731 |
| 45 to 64 Years | 796 (35.3%) | $158,281 |
| 65+ Years | 901 (40.0%) | $90,740 |
| Total | 2,252 (100.0%) | $136,094 |
Poverty in Grosse Pointe
Income Below Poverty by Sex and Age in Grosse Pointe
With 1.6% poverty level for males and 2.1% for females among the residents of Grosse Pointe, 18 to 24 year old males and 75 year old and over females are the most vulnerable to poverty, with 17 males (9.6%) and 41 females (11.1%) in their respective age groups living below the poverty level.
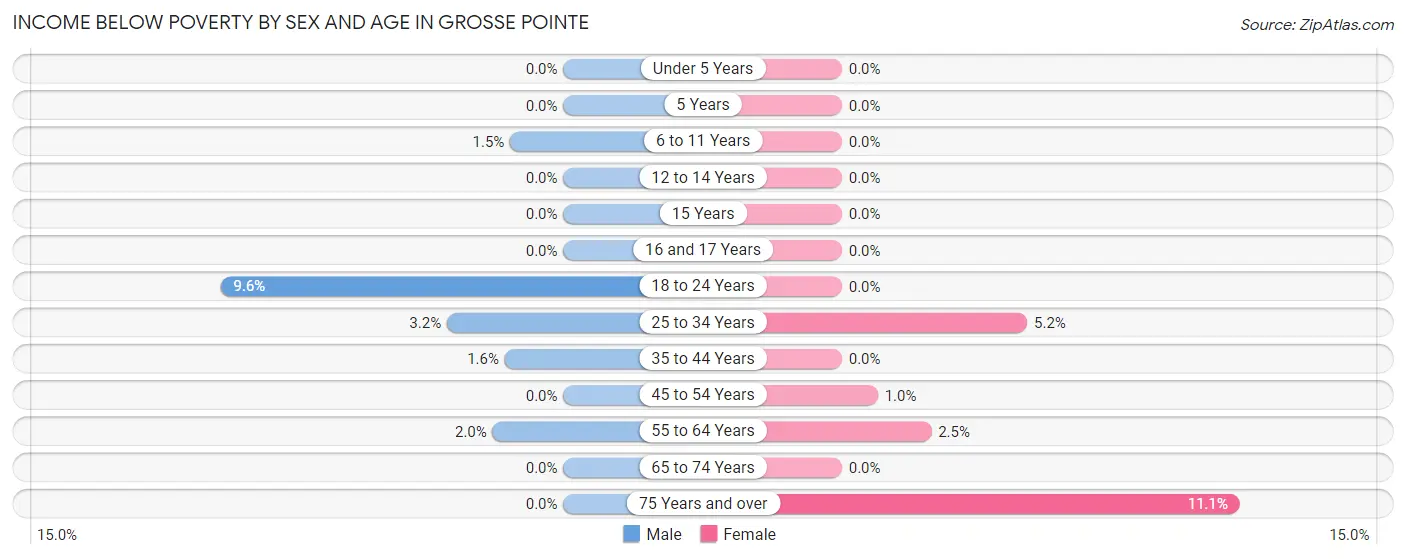
| Age Bracket | Male | Female |
| Under 5 Years | 0 (0.0%) | 0 (0.0%) |
| 5 Years | 0 (0.0%) | 0 (0.0%) |
| 6 to 11 Years | 4 (1.5%) | 0 (0.0%) |
| 12 to 14 Years | 0 (0.0%) | 0 (0.0%) |
| 15 Years | 0 (0.0%) | 0 (0.0%) |
| 16 and 17 Years | 0 (0.0%) | 0 (0.0%) |
| 18 to 24 Years | 17 (9.6%) | 0 (0.0%) |
| 25 to 34 Years | 7 (3.2%) | 8 (5.2%) |
| 35 to 44 Years | 6 (1.6%) | 0 (0.0%) |
| 45 to 54 Years | 0 (0.0%) | 3 (1.0%) |
| 55 to 64 Years | 6 (2.0%) | 13 (2.5%) |
| 65 to 74 Years | 0 (0.0%) | 0 (0.0%) |
| 75 Years and over | 0 (0.0%) | 41 (11.1%) |
| Total | 40 (1.6%) | 65 (2.1%) |
Income Above Poverty by Sex and Age in Grosse Pointe
According to the poverty statistics in Grosse Pointe, males aged under 5 years and females aged under 5 years are the age groups that are most secure financially, with 100.0% of males and 100.0% of females in these age groups living above the poverty line.
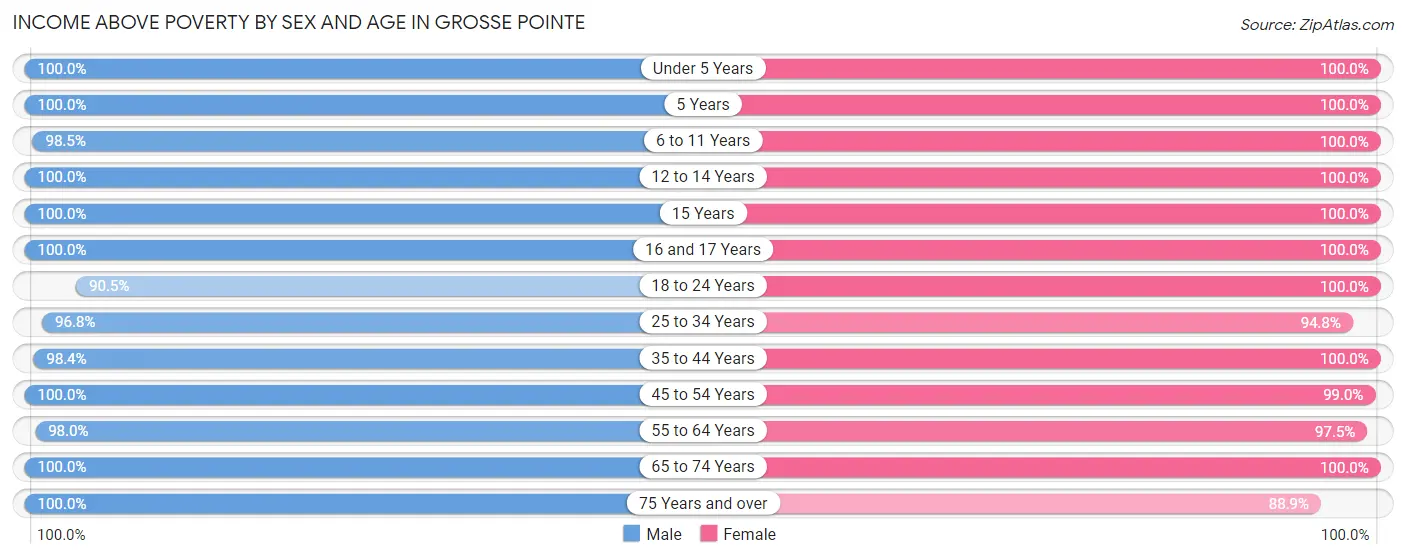
| Age Bracket | Male | Female |
| Under 5 Years | 174 (100.0%) | 262 (100.0%) |
| 5 Years | 70 (100.0%) | 25 (100.0%) |
| 6 to 11 Years | 267 (98.5%) | 270 (100.0%) |
| 12 to 14 Years | 63 (100.0%) | 106 (100.0%) |
| 15 Years | 51 (100.0%) | 74 (100.0%) |
| 16 and 17 Years | 18 (100.0%) | 57 (100.0%) |
| 18 to 24 Years | 161 (90.4%) | 168 (100.0%) |
| 25 to 34 Years | 209 (96.8%) | 147 (94.8%) |
| 35 to 44 Years | 361 (98.4%) | 340 (100.0%) |
| 45 to 54 Years | 287 (100.0%) | 298 (99.0%) |
| 55 to 64 Years | 298 (98.0%) | 509 (97.5%) |
| 65 to 74 Years | 356 (100.0%) | 441 (100.0%) |
| 75 Years and over | 175 (100.0%) | 329 (88.9%) |
| Total | 2,490 (98.4%) | 3,026 (97.9%) |
Income Below Poverty Among Married-Couple Families in Grosse Pointe
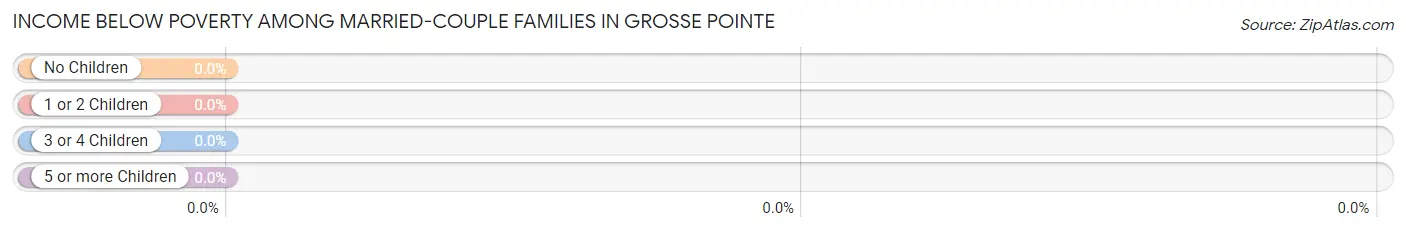
| Children | Above Poverty | Below Poverty |
| No Children | 776 (100.0%) | 0 (0.0%) |
| 1 or 2 Children | 412 (100.0%) | 0 (0.0%) |
| 3 or 4 Children | 97 (100.0%) | 0 (0.0%) |
| 5 or more Children | 41 (100.0%) | 0 (0.0%) |
| Total | 1,326 (100.0%) | 0 (0.0%) |
Income Below Poverty Among Single-Parent Households in Grosse Pointe
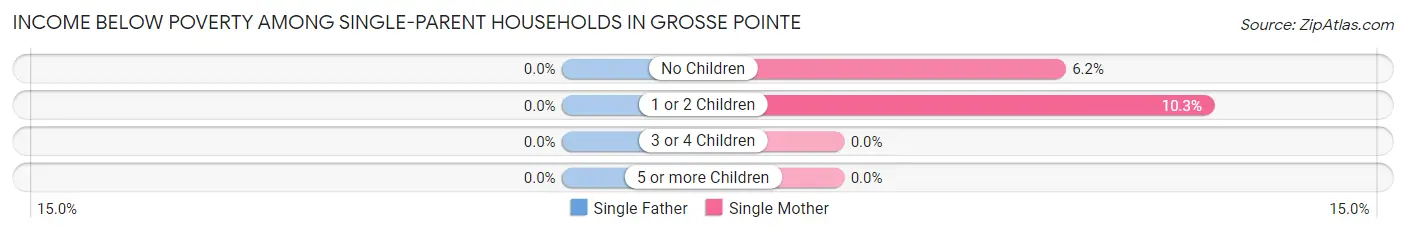
| Children | Single Father | Single Mother |
| No Children | 0 (0.0%) | 6 (6.2%) |
| 1 or 2 Children | 0 (0.0%) | 3 (10.3%) |
| 3 or 4 Children | 0 (0.0%) | 0 (0.0%) |
| 5 or more Children | 0 (0.0%) | 0 (0.0%) |
| Total | 0 (0.0%) | 9 (7.1%) |
Income Below Poverty Among Married-Couple vs Single-Parent Households in Grosse Pointe
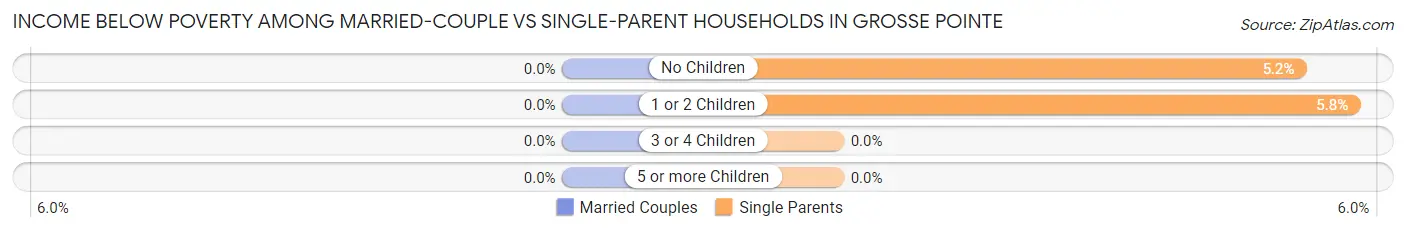
| Children | Married-Couple Families | Single-Parent Households |
| No Children | 0 (0.0%) | 6 (5.2%) |
| 1 or 2 Children | 0 (0.0%) | 3 (5.8%) |
| 3 or 4 Children | 0 (0.0%) | 0 (0.0%) |
| 5 or more Children | 0 (0.0%) | 0 (0.0%) |
| Total | 0 (0.0%) | 9 (5.1%) |
Race in Grosse Pointe
The most populous races in Grosse Pointe are White / Caucasian (5,096 | 90.7%), Two or more Races (263 | 4.7%), and Hispanic or Latino (231 | 4.1%).
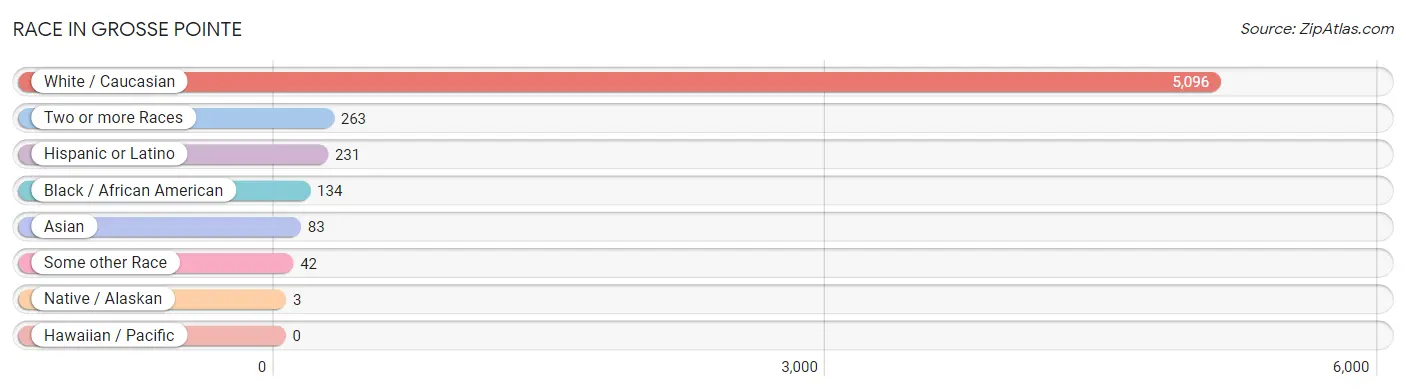
| Race | # Population | % Population |
| Asian | 83 | 1.5% |
| Black / African American | 134 | 2.4% |
| Hawaiian / Pacific | 0 | 0.0% |
| Hispanic or Latino | 231 | 4.1% |
| Native / Alaskan | 3 | 0.1% |
| White / Caucasian | 5,096 | 90.7% |
| Two or more Races | 263 | 4.7% |
| Some other Race | 42 | 0.7% |
| Total | 5,621 | 100.0% |
Ancestry in Grosse Pointe
The most populous ancestries reported in Grosse Pointe are German (1,635 | 29.1%), Irish (1,189 | 21.1%), Italian (972 | 17.3%), Polish (722 | 12.8%), and English (637 | 11.3%), together accounting for 91.7% of all Grosse Pointe residents.

| Ancestry | # Population | % Population |
| Albanian | 15 | 0.3% |
| American | 150 | 2.7% |
| Arab | 93 | 1.7% |
| Argentinean | 44 | 0.8% |
| Austrian | 79 | 1.4% |
| Belgian | 64 | 1.1% |
| Bhutanese | 49 | 0.9% |
| British | 167 | 3.0% |
| Burmese | 5 | 0.1% |
| Canadian | 3 | 0.1% |
| Carpatho Rusyn | 17 | 0.3% |
| Cherokee | 18 | 0.3% |
| Chippewa | 9 | 0.2% |
| Croatian | 21 | 0.4% |
| Cuban | 50 | 0.9% |
| Czech | 58 | 1.0% |
| Danish | 31 | 0.5% |
| Dutch | 72 | 1.3% |
| Eastern European | 17 | 0.3% |
| English | 637 | 11.3% |
| European | 166 | 2.9% |
| Finnish | 17 | 0.3% |
| French | 151 | 2.7% |
| French Canadian | 43 | 0.8% |
| German | 1,635 | 29.1% |
| Greek | 59 | 1.1% |
| Haitian | 7 | 0.1% |
| Hungarian | 61 | 1.1% |
| Iranian | 26 | 0.5% |
| Irish | 1,189 | 21.1% |
| Italian | 972 | 17.3% |
| Korean | 5 | 0.1% |
| Lebanese | 85 | 1.5% |
| Liberian | 9 | 0.2% |
| Lithuanian | 51 | 0.9% |
| Malaysian | 50 | 0.9% |
| Mexican | 119 | 2.1% |
| Northern European | 8 | 0.1% |
| Peruvian | 9 | 0.2% |
| Polish | 722 | 12.8% |
| Romanian | 13 | 0.2% |
| Russian | 98 | 1.7% |
| Scandinavian | 16 | 0.3% |
| Scotch-Irish | 110 | 2.0% |
| Scottish | 173 | 3.1% |
| Serbian | 8 | 0.1% |
| Slavic | 4 | 0.1% |
| Slovak | 42 | 0.7% |
| South American | 53 | 0.9% |
| Spaniard | 3 | 0.1% |
| Spanish | 6 | 0.1% |
| Subsaharan African | 9 | 0.2% |
| Swedish | 65 | 1.2% |
| Swiss | 8 | 0.1% |
| Syrian | 8 | 0.1% |
| Thai | 67 | 1.2% |
| Ukrainian | 28 | 0.5% |
| Welsh | 115 | 2.1% |
| Yugoslavian | 75 | 1.3% | View All 59 Rows |
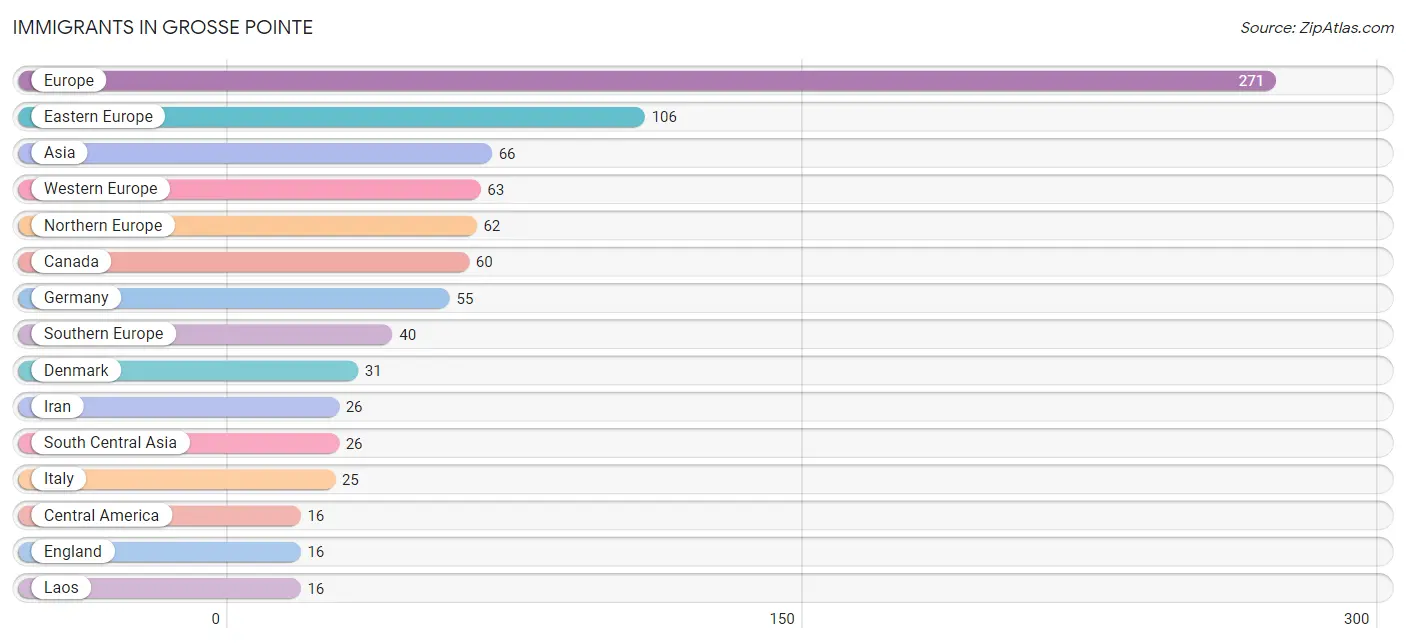
Immigrants in Grosse Pointe
The most numerous immigrant groups reported in Grosse Pointe came from Europe (271 | 4.8%), Eastern Europe (106 | 1.9%), Asia (66 | 1.2%), Western Europe (63 | 1.1%), and Northern Europe (62 | 1.1%), together accounting for 10.1% of all Grosse Pointe residents.
| Immigration Origin | # Population | % Population |
| Africa | 9 | 0.2% |
| Asia | 66 | 1.2% |
| Australia | 9 | 0.2% |
| Austria | 8 | 0.1% |
| Belarus | 3 | 0.1% |
| Canada | 60 | 1.1% |
| Central America | 16 | 0.3% |
| Denmark | 31 | 0.5% |
| Eastern Asia | 12 | 0.2% |
| Eastern Europe | 106 | 1.9% |
| England | 16 | 0.3% |
| Europe | 271 | 4.8% |
| Germany | 55 | 1.0% |
| Greece | 15 | 0.3% |
| Iran | 26 | 0.5% |
| Italy | 25 | 0.4% |
| Japan | 12 | 0.2% |
| Laos | 16 | 0.3% |
| Latin America | 16 | 0.3% |
| Lebanon | 12 | 0.2% |
| Liberia | 9 | 0.2% |
| Mexico | 16 | 0.3% |
| Moldova | 6 | 0.1% |
| Northern Europe | 62 | 1.1% |
| Oceania | 13 | 0.2% |
| Poland | 5 | 0.1% |
| Russia | 13 | 0.2% |
| Scotland | 8 | 0.1% |
| South Central Asia | 26 | 0.5% |
| South Eastern Asia | 16 | 0.3% |
| Southern Europe | 40 | 0.7% |
| Western Africa | 9 | 0.2% |
| Western Asia | 12 | 0.2% |
| Western Europe | 63 | 1.1% | View All 34 Rows |
Sex and Age in Grosse Pointe
Sex and Age in Grosse Pointe
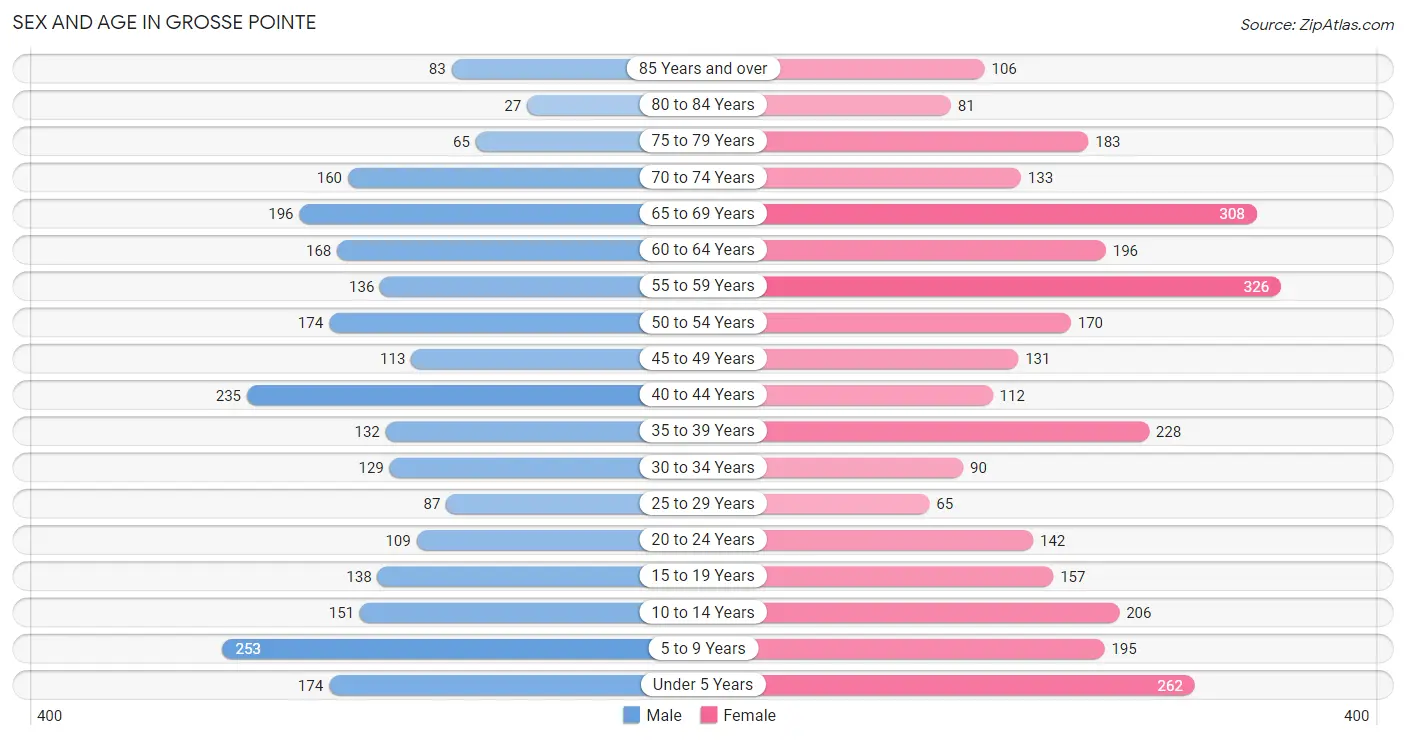
The most populous age groups in Grosse Pointe are 5 to 9 Years (253 | 10.0%) for men and 55 to 59 Years (326 | 10.5%) for women.
| Age Bracket | Male | Female |
| Under 5 Years | 174 (6.9%) | 262 (8.5%) |
| 5 to 9 Years | 253 (10.0%) | 195 (6.3%) |
| 10 to 14 Years | 151 (6.0%) | 206 (6.7%) |
| 15 to 19 Years | 138 (5.4%) | 157 (5.1%) |
| 20 to 24 Years | 109 (4.3%) | 142 (4.6%) |
| 25 to 29 Years | 87 (3.4%) | 65 (2.1%) |
| 30 to 34 Years | 129 (5.1%) | 90 (2.9%) |
| 35 to 39 Years | 132 (5.2%) | 228 (7.4%) |
| 40 to 44 Years | 235 (9.3%) | 112 (3.6%) |
| 45 to 49 Years | 113 (4.5%) | 131 (4.2%) |
| 50 to 54 Years | 174 (6.9%) | 170 (5.5%) |
| 55 to 59 Years | 136 (5.4%) | 326 (10.5%) |
| 60 to 64 Years | 168 (6.6%) | 196 (6.3%) |
| 65 to 69 Years | 196 (7.7%) | 308 (10.0%) |
| 70 to 74 Years | 160 (6.3%) | 133 (4.3%) |
| 75 to 79 Years | 65 (2.6%) | 183 (5.9%) |
| 80 to 84 Years | 27 (1.1%) | 81 (2.6%) |
| 85 Years and over | 83 (3.3%) | 106 (3.4%) |
| Total | 2,530 (100.0%) | 3,091 (100.0%) |
Families and Households in Grosse Pointe
Median Family Size in Grosse Pointe
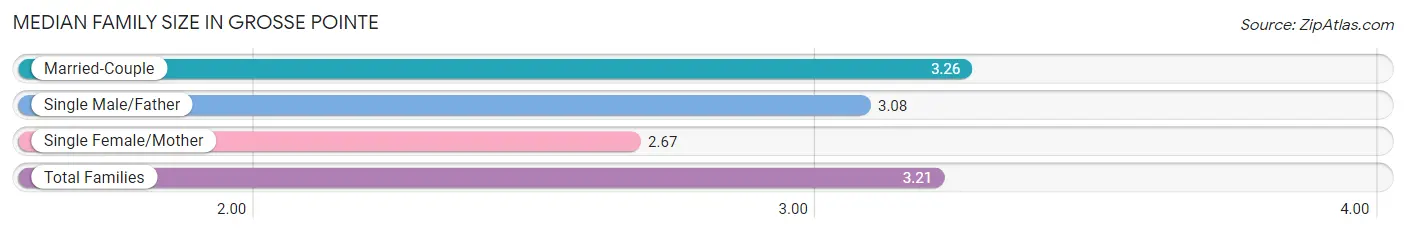
The median family size in Grosse Pointe is 3.21 persons per family, with married-couple families (1,326 | 88.2%) accounting for the largest median family size of 3.26 persons per family. On the other hand, single female/mother families (126 | 8.4%) represent the smallest median family size with 2.67 persons per family.
| Family Type | # Families | Family Size |
| Married-Couple | 1,326 (88.2%) | 3.26 |
| Single Male/Father | 52 (3.5%) | 3.08 |
| Single Female/Mother | 126 (8.4%) | 2.67 |
| Total Families | 1,504 (100.0%) | 3.21 |
Median Household Size in Grosse Pointe
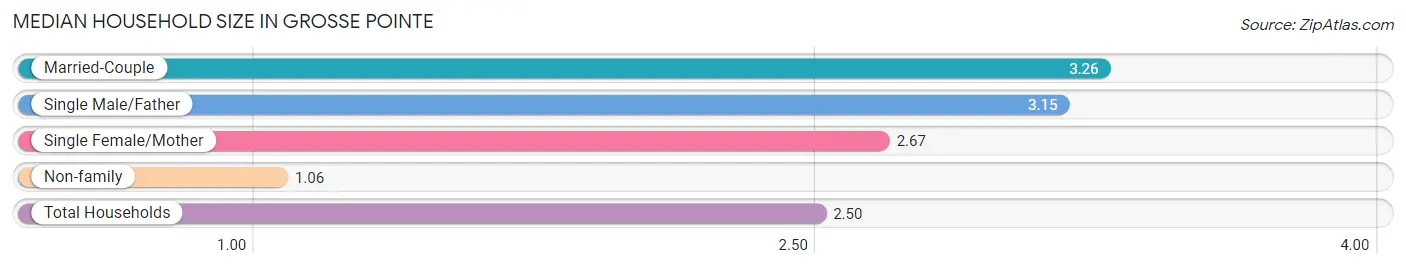
The median household size in Grosse Pointe is 2.50 persons per household, with married-couple households (1,326 | 58.9%) accounting for the largest median household size of 3.26 persons per household. non-family households (748 | 33.2%) represent the smallest median household size with 1.06 persons per household.
| Household Type | # Households | Household Size |
| Married-Couple | 1,326 (58.9%) | 3.26 |
| Single Male/Father | 52 (2.3%) | 3.15 |
| Single Female/Mother | 126 (5.6%) | 2.67 |
| Non-family | 748 (33.2%) | 1.06 |
| Total Households | 2,252 (100.0%) | 2.50 |
Household Size by Marriage Status in Grosse Pointe
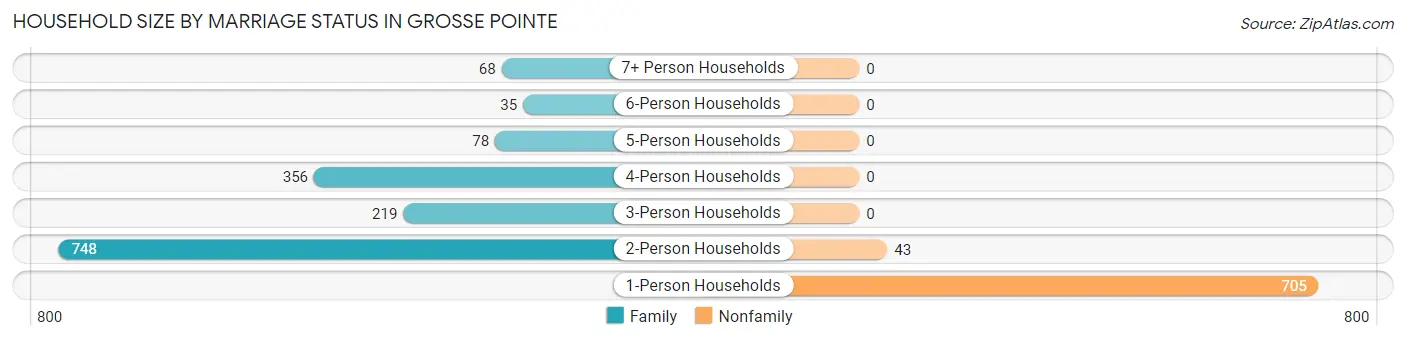
Out of a total of 2,252 households in Grosse Pointe, 1,504 (66.8%) are family households, while 748 (33.2%) are nonfamily households. The most numerous type of family households are 2-person households, comprising 748, and the most common type of nonfamily households are 1-person households, comprising 705.
| Household Size | Family Households | Nonfamily Households |
| 1-Person Households | - | 705 (31.3%) |
| 2-Person Households | 748 (33.2%) | 43 (1.9%) |
| 3-Person Households | 219 (9.7%) | 0 (0.0%) |
| 4-Person Households | 356 (15.8%) | 0 (0.0%) |
| 5-Person Households | 78 (3.5%) | 0 (0.0%) |
| 6-Person Households | 35 (1.5%) | 0 (0.0%) |
| 7+ Person Households | 68 (3.0%) | 0 (0.0%) |
| Total | 1,504 (66.8%) | 748 (33.2%) |
Female Fertility in Grosse Pointe
Fertility by Age in Grosse Pointe
Average fertility rate in Grosse Pointe is 109.0 births per 1,000 women. Women in the age bracket of 20 to 34 years have the highest fertility rate with 209.0 births per 1,000 women. Women in the age bracket of 20 to 34 years acount for 59.6% of all women with births.
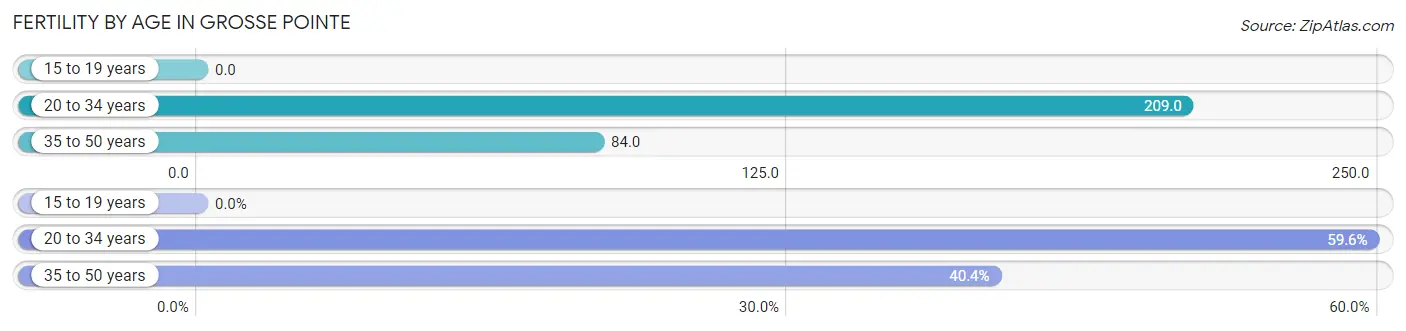
| Age Bracket | Women with Births | Births / 1,000 Women |
| 15 to 19 years | 0 (0.0%) | 0.0 |
| 20 to 34 years | 62 (59.6%) | 209.0 |
| 35 to 50 years | 42 (40.4%) | 84.0 |
| Total | 104 (100.0%) | 109.0 |
Fertility by Age by Marriage Status in Grosse Pointe
96.2% of women with births (104) in Grosse Pointe are married. The highest percentage of unmarried women with births falls into 35 to 50 years age bracket with 9.5% of them unmarried at the time of birth, while the lowest percentage of unmarried women with births belong to 20 to 34 years age bracket with 0.0% of them unmarried.
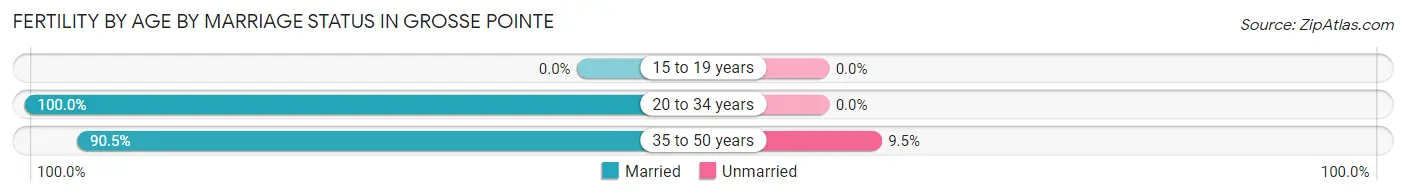
| Age Bracket | Married | Unmarried |
| 15 to 19 years | 0 (0.0%) | 0 (0.0%) |
| 20 to 34 years | 62 (100.0%) | 0 (0.0%) |
| 35 to 50 years | 38 (90.5%) | 4 (9.5%) |
| Total | 100 (96.2%) | 4 (3.8%) |
Fertility by Education in Grosse Pointe
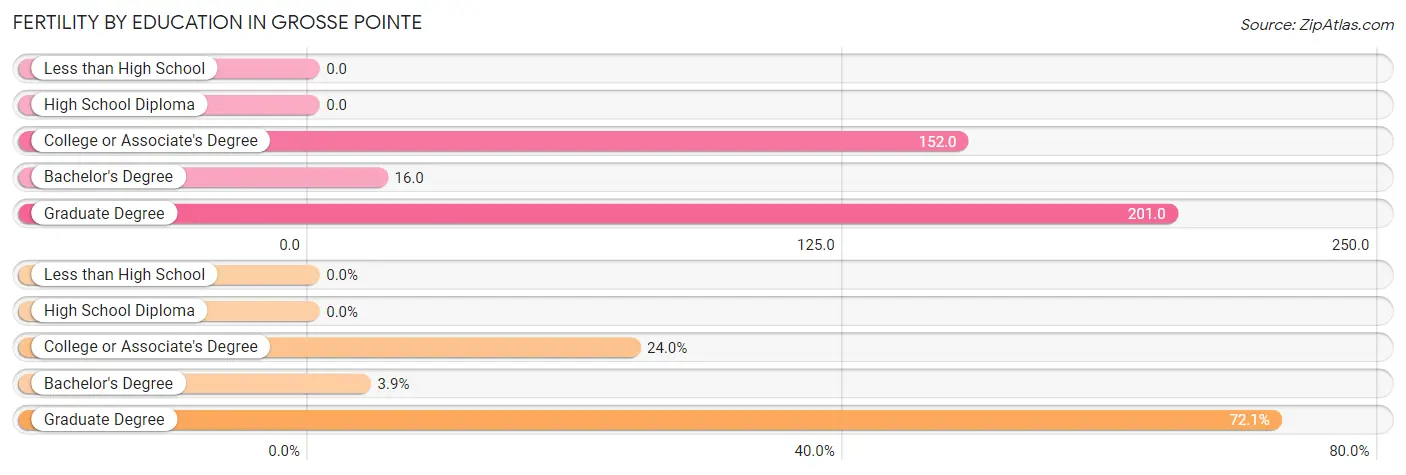
| Educational Attainment | Women with Births | Births / 1,000 Women |
| Less than High School | 0 (0.0%) | 0.0 |
| High School Diploma | 0 (0.0%) | 0.0 |
| College or Associate's Degree | 25 (24.0%) | 152.0 |
| Bachelor's Degree | 4 (3.8%) | 16.0 |
| Graduate Degree | 75 (72.1%) | 201.0 |
| Total | 104 (100.0%) | 109.0 |
Fertility by Education by Marriage Status in Grosse Pointe
3.8% of women with births in Grosse Pointe are unmarried. Women with the educational attainment of college or associate's degree are most likely to be married with 100.0% of them married at childbirth, while women with the educational attainment of graduate degree are least likely to be married with 5.3% of them unmarried at childbirth.
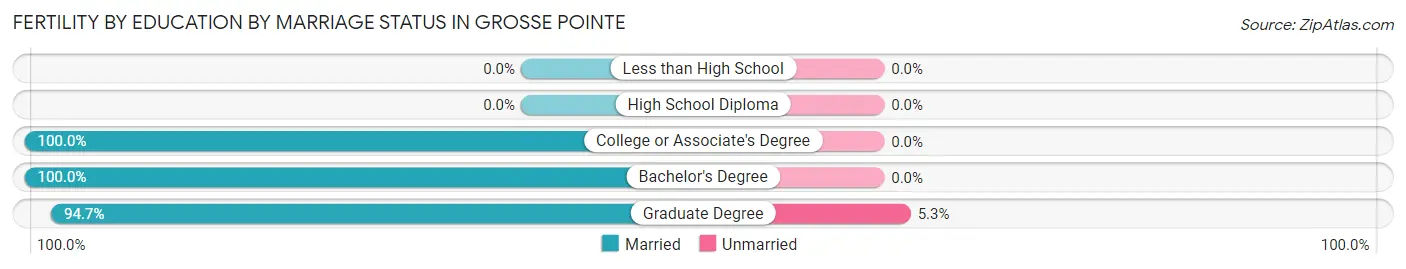
| Educational Attainment | Married | Unmarried |
| Less than High School | 0 (0.0%) | 0 (0.0%) |
| High School Diploma | 0 (0.0%) | 0 (0.0%) |
| College or Associate's Degree | 25 (100.0%) | 0 (0.0%) |
| Bachelor's Degree | 4 (100.0%) | 0 (0.0%) |
| Graduate Degree | 71 (94.7%) | 4 (5.3%) |
| Total | 100 (96.2%) | 4 (3.8%) |
Employment Characteristics in Grosse Pointe
Employment by Class of Employer in Grosse Pointe
Among the 2,535 employed individuals in Grosse Pointe, private company employees (1,525 | 60.2%), not-for-profit organizations (369 | 14.6%), and local government employees (173 | 6.8%) make up the most common classes of employment.
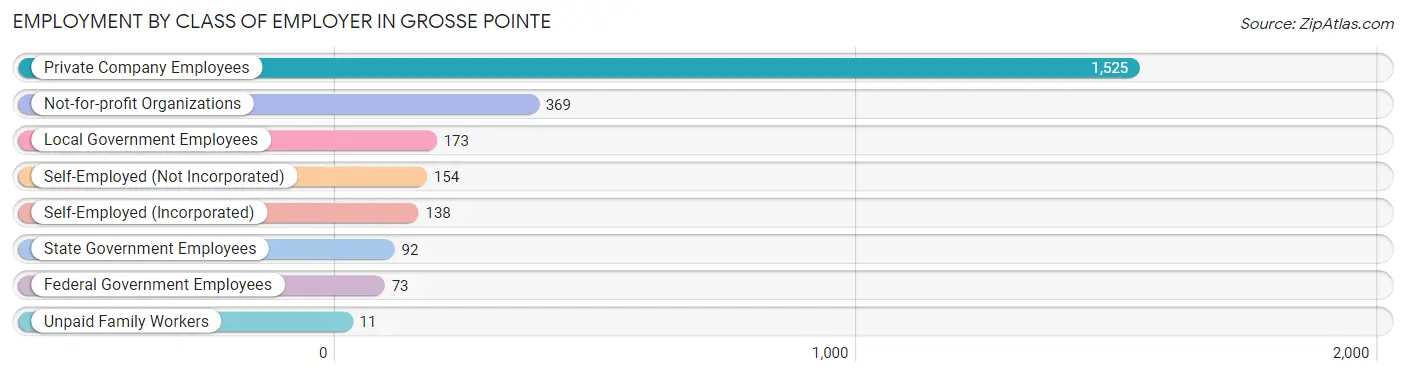
| Employer Class | # Employees | % Employees |
| Private Company Employees | 1,525 | 60.2% |
| Self-Employed (Incorporated) | 138 | 5.4% |
| Self-Employed (Not Incorporated) | 154 | 6.1% |
| Not-for-profit Organizations | 369 | 14.6% |
| Local Government Employees | 173 | 6.8% |
| State Government Employees | 92 | 3.6% |
| Federal Government Employees | 73 | 2.9% |
| Unpaid Family Workers | 11 | 0.4% |
| Total | 2,535 | 100.0% |
Employment Status by Age in Grosse Pointe
According to the labor force statistics for Grosse Pointe, out of the total population over 16 years of age (4,255), 64.1% or 2,727 individuals are in the labor force, with 4.0% or 109 of them unemployed. The age group with the highest labor force participation rate is 30 to 34 years, with 95.0% or 208 individuals in the labor force. Within the labor force, the 16 to 19 years age range has the highest percentage of unemployed individuals, with 33.9% or 20 of them being unemployed.
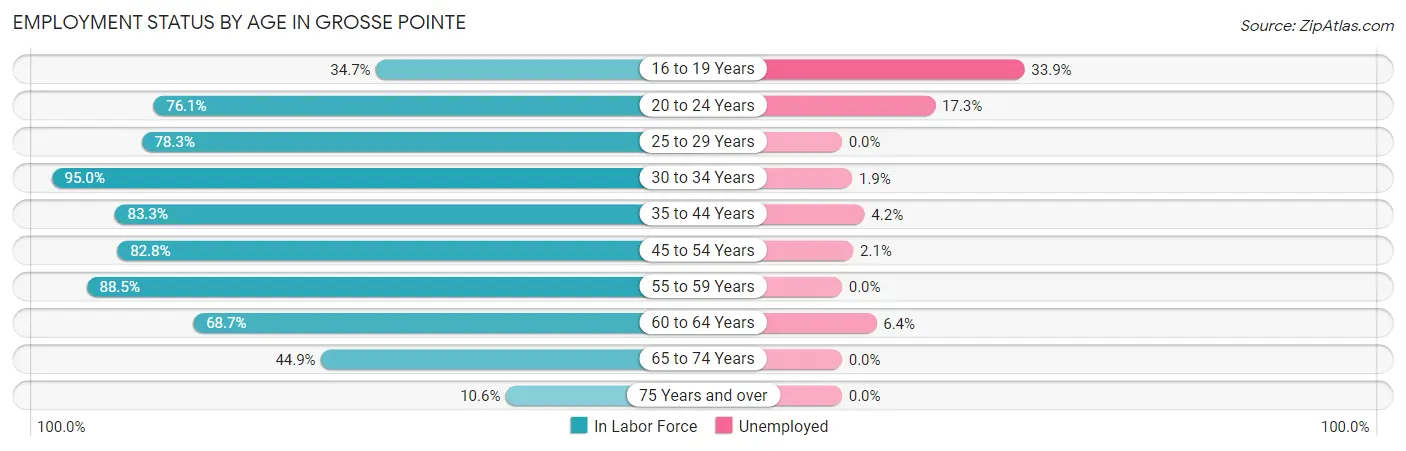
| Age Bracket | In Labor Force | Unemployed |
| 16 to 19 Years | 59 (34.7%) | 20 (33.9%) |
| 20 to 24 Years | 191 (76.1%) | 33 (17.3%) |
| 25 to 29 Years | 119 (78.3%) | 0 (0.0%) |
| 30 to 34 Years | 208 (95.0%) | 4 (1.9%) |
| 35 to 44 Years | 589 (83.3%) | 25 (4.2%) |
| 45 to 54 Years | 487 (82.8%) | 10 (2.1%) |
| 55 to 59 Years | 409 (88.5%) | 0 (0.0%) |
| 60 to 64 Years | 250 (68.7%) | 16 (6.4%) |
| 65 to 74 Years | 358 (44.9%) | 0 (0.0%) |
| 75 Years and over | 58 (10.6%) | 0 (0.0%) |
| Total | 2,727 (64.1%) | 109 (4.0%) |
Employment Status by Educational Attainment in Grosse Pointe
According to labor force statistics for Grosse Pointe, 82.7% of individuals (2,061) out of the total population between 25 and 64 years of age (2,492) are in the labor force, with 2.7% or 56 of them being unemployed. The group with the highest labor force participation rate are those with the educational attainment of bachelor's degree or higher, with 84.9% or 1,637 individuals in the labor force. Within the labor force, individuals with bachelor's degree or higher education have the highest percentage of unemployment, with 3.4% or 56 of them being unemployed.
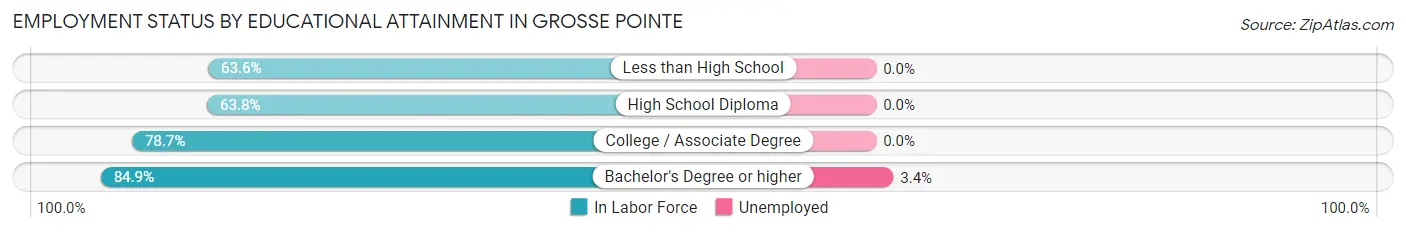
| Educational Attainment | In Labor Force | Unemployed |
| Less than High School | 7 (63.6%) | 0 (0.0%) |
| High School Diploma | 74 (63.8%) | 0 (0.0%) |
| College / Associate Degree | 344 (78.7%) | 0 (0.0%) |
| Bachelor's Degree or higher | 1,637 (84.9%) | 66 (3.4%) |
| Total | 2,061 (82.7%) | 67 (2.7%) |
Employment Occupations by Sex in Grosse Pointe
Management, Business, Science and Arts Occupations
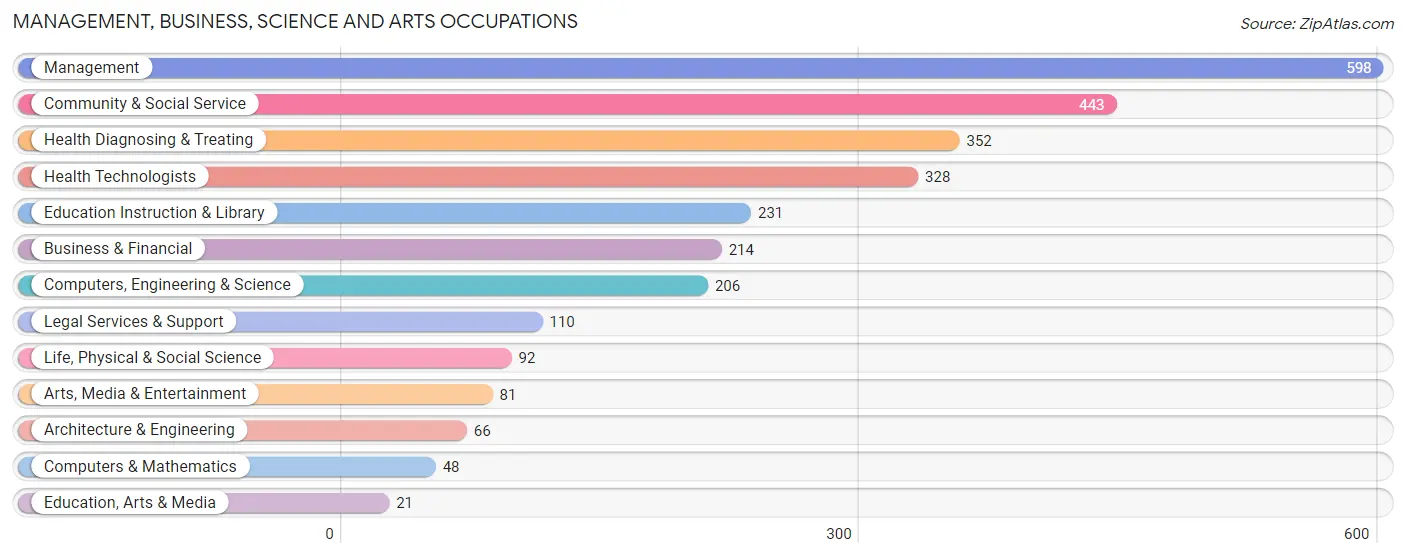
The most common Management, Business, Science and Arts occupations in Grosse Pointe are Management (598 | 22.8%), Community & Social Service (443 | 16.9%), Health Diagnosing & Treating (352 | 13.4%), Health Technologists (328 | 12.5%), and Education Instruction & Library (231 | 8.8%).
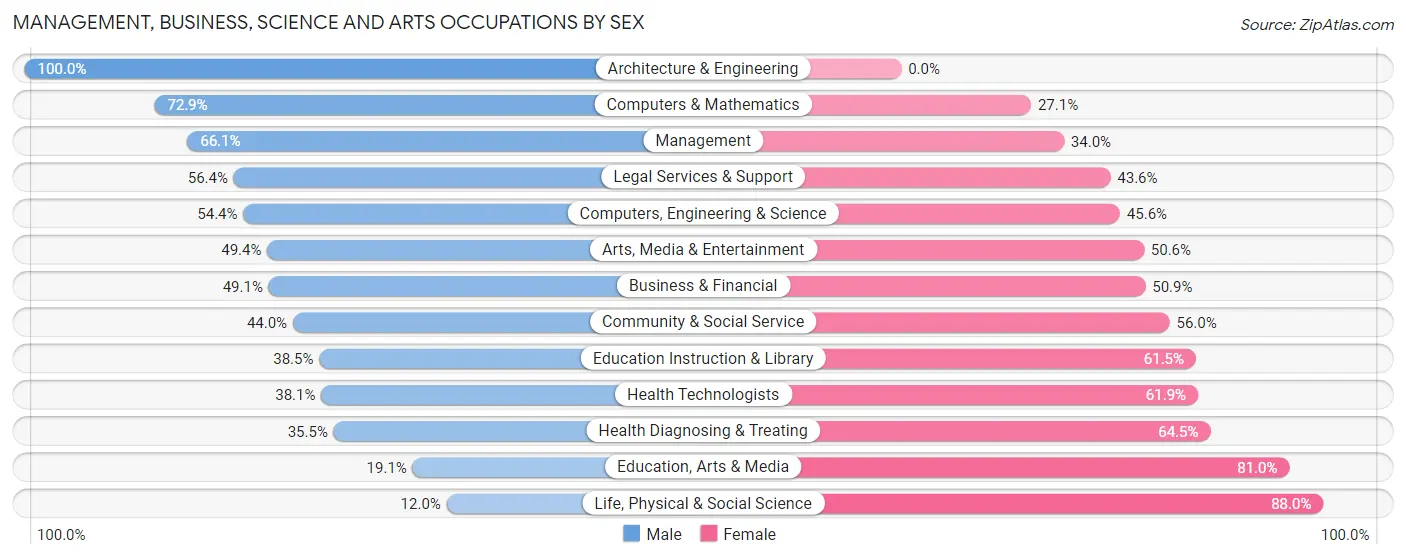
Management, Business, Science and Arts Occupations by Sex
Within the Management, Business, Science and Arts occupations in Grosse Pointe, the most male-oriented occupations are Architecture & Engineering (100.0%), Computers & Mathematics (72.9%), and Management (66.0%), while the most female-oriented occupations are Life, Physical & Social Science (88.0%), Education, Arts & Media (80.9%), and Health Diagnosing & Treating (64.5%).
| Occupation | Male | Female |
| Management | 395 (66.0%) | 203 (34.0%) |
| Business & Financial | 105 (49.1%) | 109 (50.9%) |
| Computers, Engineering & Science | 112 (54.4%) | 94 (45.6%) |
| Computers & Mathematics | 35 (72.9%) | 13 (27.1%) |
| Architecture & Engineering | 66 (100.0%) | 0 (0.0%) |
| Life, Physical & Social Science | 11 (12.0%) | 81 (88.0%) |
| Community & Social Service | 195 (44.0%) | 248 (56.0%) |
| Education, Arts & Media | 4 (19.1%) | 17 (80.9%) |
| Legal Services & Support | 62 (56.4%) | 48 (43.6%) |
| Education Instruction & Library | 89 (38.5%) | 142 (61.5%) |
| Arts, Media & Entertainment | 40 (49.4%) | 41 (50.6%) |
| Health Diagnosing & Treating | 125 (35.5%) | 227 (64.5%) |
| Health Technologists | 125 (38.1%) | 203 (61.9%) |
| Total (Category) | 932 (51.4%) | 881 (48.6%) |
| Total (Overall) | 1,340 (51.1%) | 1,280 (48.8%) |
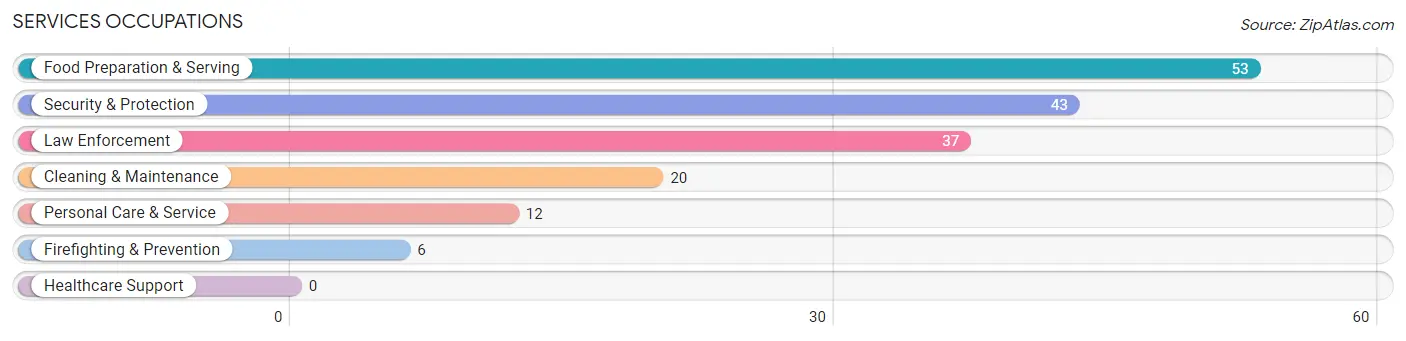
Services Occupations
The most common Services occupations in Grosse Pointe are Food Preparation & Serving (53 | 2.0%), Security & Protection (43 | 1.6%), Law Enforcement (37 | 1.4%), Cleaning & Maintenance (20 | 0.8%), and Personal Care & Service (12 | 0.5%).
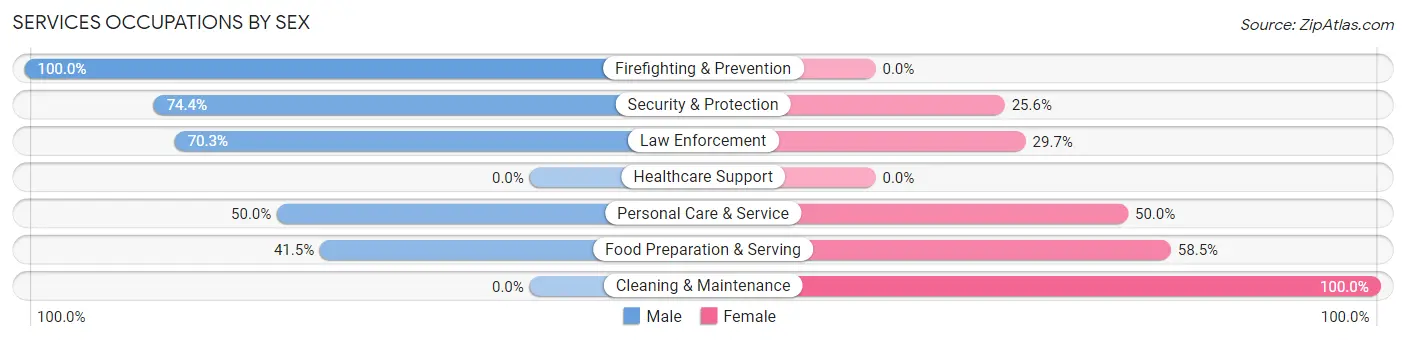
Services Occupations by Sex
Within the Services occupations in Grosse Pointe, the most male-oriented occupations are Firefighting & Prevention (100.0%), Security & Protection (74.4%), and Law Enforcement (70.3%), while the most female-oriented occupations are Cleaning & Maintenance (100.0%), Food Preparation & Serving (58.5%), and Personal Care & Service (50.0%).
| Occupation | Male | Female |
| Healthcare Support | 0 (0.0%) | 0 (0.0%) |
| Security & Protection | 32 (74.4%) | 11 (25.6%) |
| Firefighting & Prevention | 6 (100.0%) | 0 (0.0%) |
| Law Enforcement | 26 (70.3%) | 11 (29.7%) |
| Food Preparation & Serving | 22 (41.5%) | 31 (58.5%) |
| Cleaning & Maintenance | 0 (0.0%) | 20 (100.0%) |
| Personal Care & Service | 6 (50.0%) | 6 (50.0%) |
| Total (Category) | 60 (46.9%) | 68 (53.1%) |
| Total (Overall) | 1,340 (51.1%) | 1,280 (48.8%) |
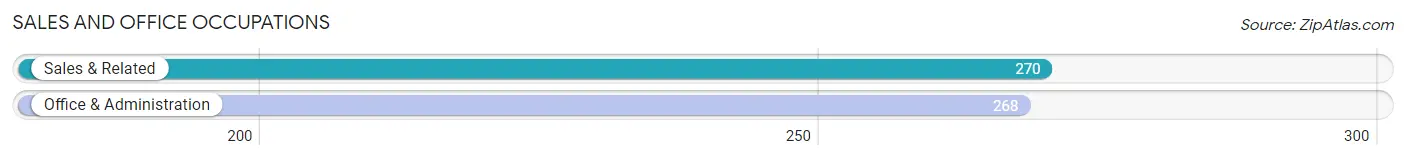
Sales and Office Occupations
The most common Sales and Office occupations in Grosse Pointe are Sales & Related (270 | 10.3%), and Office & Administration (268 | 10.2%).
Sales and Office Occupations by Sex
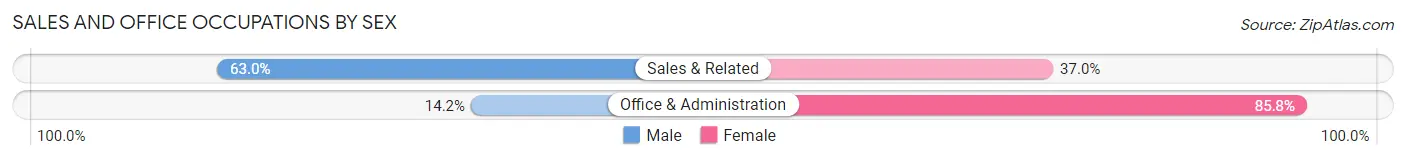
| Occupation | Male | Female |
| Sales & Related | 170 (63.0%) | 100 (37.0%) |
| Office & Administration | 38 (14.2%) | 230 (85.8%) |
| Total (Category) | 208 (38.7%) | 330 (61.3%) |
| Total (Overall) | 1,340 (51.1%) | 1,280 (48.8%) |
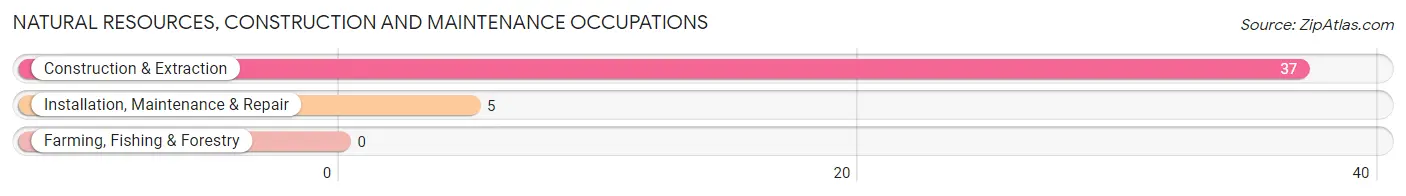
Natural Resources, Construction and Maintenance Occupations
The most common Natural Resources, Construction and Maintenance occupations in Grosse Pointe are Construction & Extraction (37 | 1.4%), and Installation, Maintenance & Repair (5 | 0.2%).
Natural Resources, Construction and Maintenance Occupations by Sex
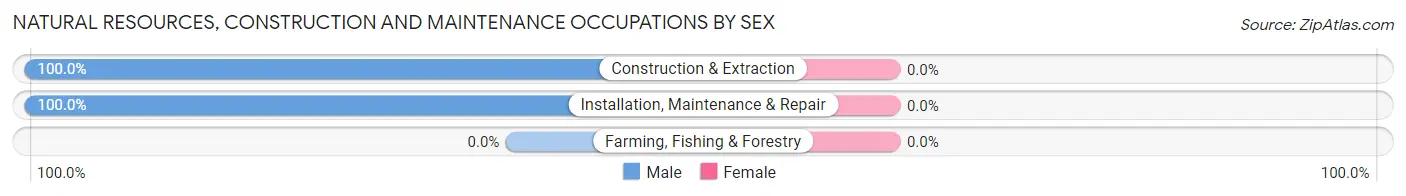
| Occupation | Male | Female |
| Farming, Fishing & Forestry | 0 (0.0%) | 0 (0.0%) |
| Construction & Extraction | 37 (100.0%) | 0 (0.0%) |
| Installation, Maintenance & Repair | 5 (100.0%) | 0 (0.0%) |
| Total (Category) | 42 (100.0%) | 0 (0.0%) |
| Total (Overall) | 1,340 (51.1%) | 1,280 (48.8%) |
Production, Transportation and Moving Occupations
The most common Production, Transportation and Moving occupations in Grosse Pointe are Production (55 | 2.1%), Transportation (25 | 0.9%), and Material Moving (19 | 0.7%).
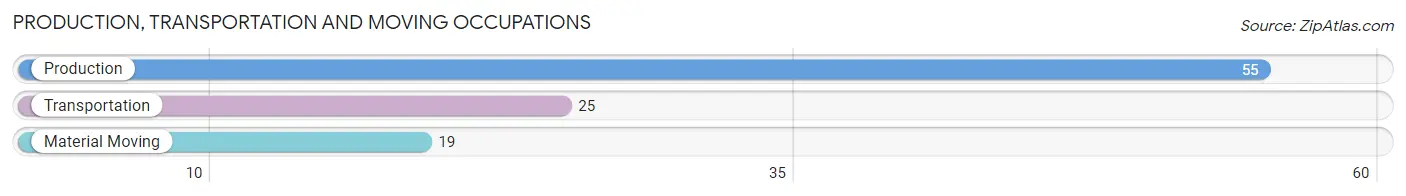
Production, Transportation and Moving Occupations by Sex
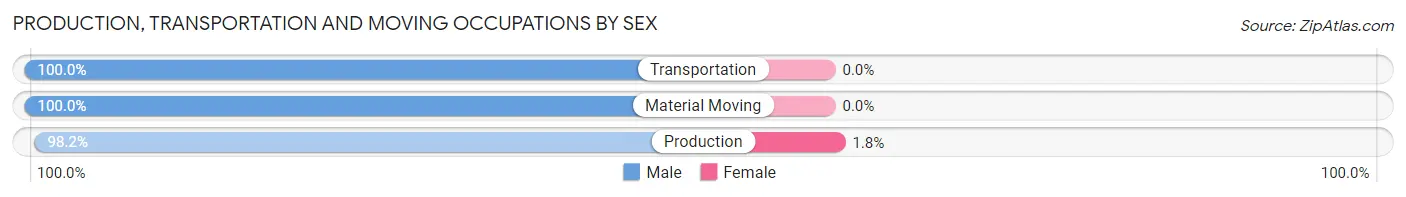
| Occupation | Male | Female |
| Production | 54 (98.2%) | 1 (1.8%) |
| Transportation | 25 (100.0%) | 0 (0.0%) |
| Material Moving | 19 (100.0%) | 0 (0.0%) |
| Total (Category) | 98 (99.0%) | 1 (1.0%) |
| Total (Overall) | 1,340 (51.1%) | 1,280 (48.8%) |
Employment Industries by Sex in Grosse Pointe
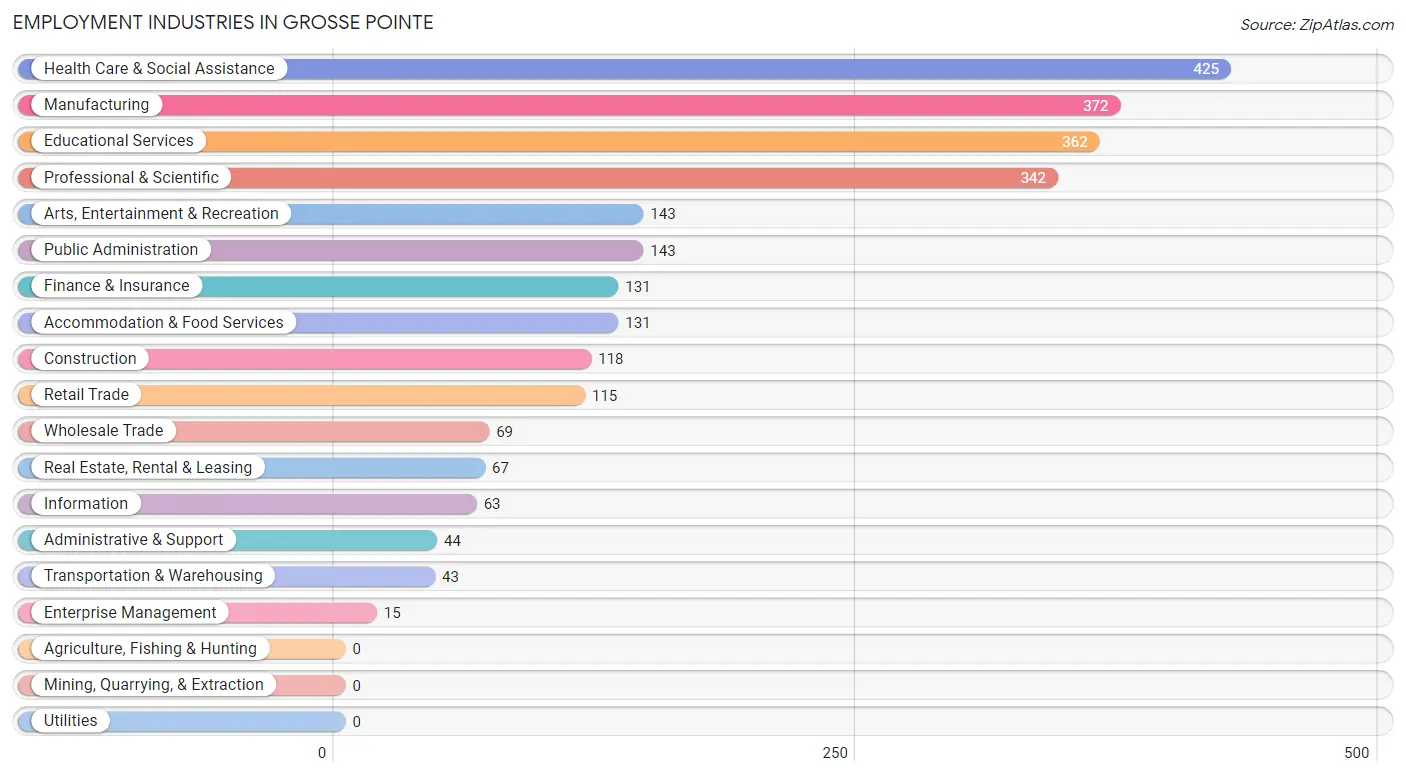
Employment Industries in Grosse Pointe
The major employment industries in Grosse Pointe include Health Care & Social Assistance (425 | 16.2%), Manufacturing (372 | 14.2%), Educational Services (362 | 13.8%), Professional & Scientific (342 | 13.1%), and Arts, Entertainment & Recreation (143 | 5.5%).
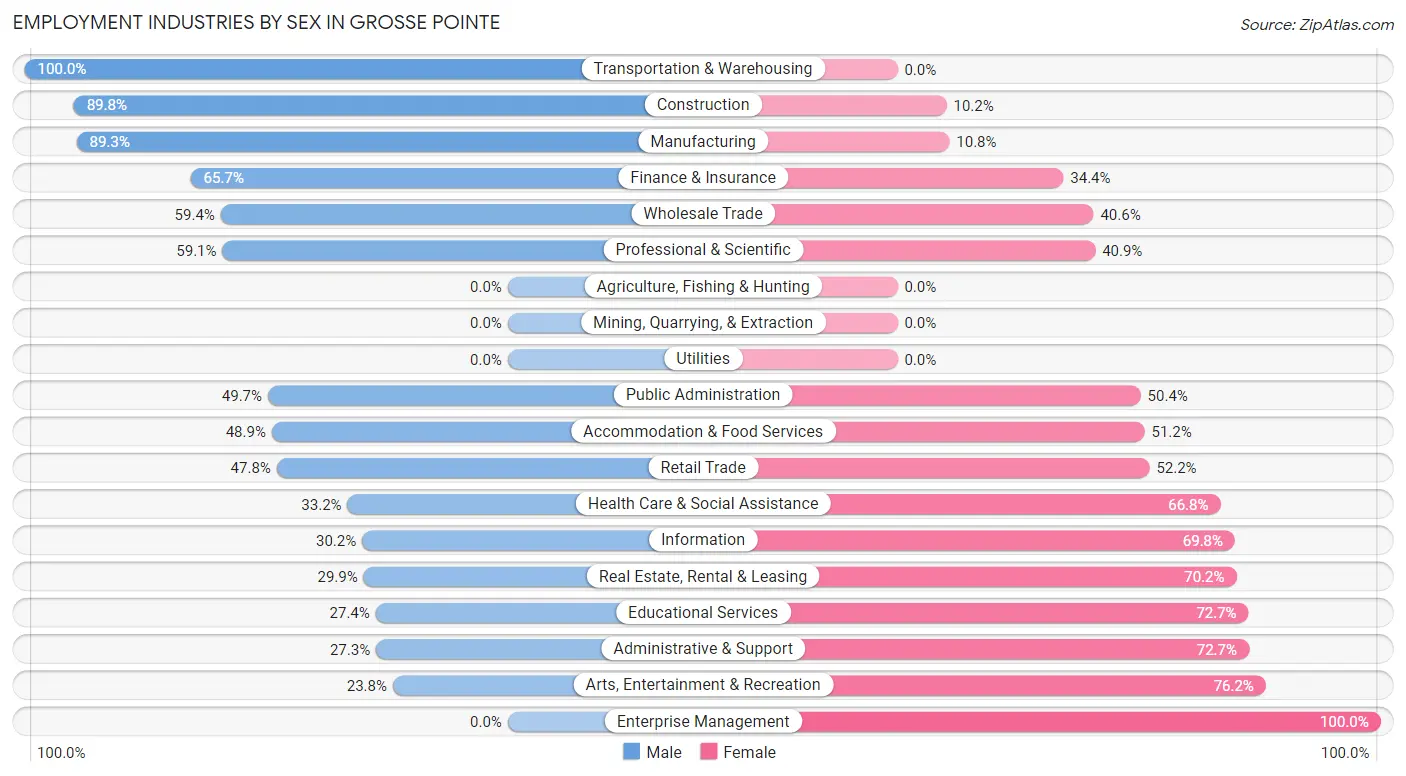
Employment Industries by Sex in Grosse Pointe
The Grosse Pointe industries that see more men than women are Transportation & Warehousing (100.0%), Construction (89.8%), and Manufacturing (89.2%), whereas the industries that tend to have a higher number of women are Enterprise Management (100.0%), Arts, Entertainment & Recreation (76.2%), and Administrative & Support (72.7%).
| Industry | Male | Female |
| Agriculture, Fishing & Hunting | 0 (0.0%) | 0 (0.0%) |
| Mining, Quarrying, & Extraction | 0 (0.0%) | 0 (0.0%) |
| Construction | 106 (89.8%) | 12 (10.2%) |
| Manufacturing | 332 (89.2%) | 40 (10.7%) |
| Wholesale Trade | 41 (59.4%) | 28 (40.6%) |
| Retail Trade | 55 (47.8%) | 60 (52.2%) |
| Transportation & Warehousing | 43 (100.0%) | 0 (0.0%) |
| Utilities | 0 (0.0%) | 0 (0.0%) |
| Information | 19 (30.2%) | 44 (69.8%) |
| Finance & Insurance | 86 (65.6%) | 45 (34.4%) |
| Real Estate, Rental & Leasing | 20 (29.8%) | 47 (70.2%) |
| Professional & Scientific | 202 (59.1%) | 140 (40.9%) |
| Enterprise Management | 0 (0.0%) | 15 (100.0%) |
| Administrative & Support | 12 (27.3%) | 32 (72.7%) |
| Educational Services | 99 (27.4%) | 263 (72.7%) |
| Health Care & Social Assistance | 141 (33.2%) | 284 (66.8%) |
| Arts, Entertainment & Recreation | 34 (23.8%) | 109 (76.2%) |
| Accommodation & Food Services | 64 (48.8%) | 67 (51.1%) |
| Public Administration | 71 (49.6%) | 72 (50.3%) |
| Total | 1,340 (51.1%) | 1,280 (48.8%) |
Education in Grosse Pointe
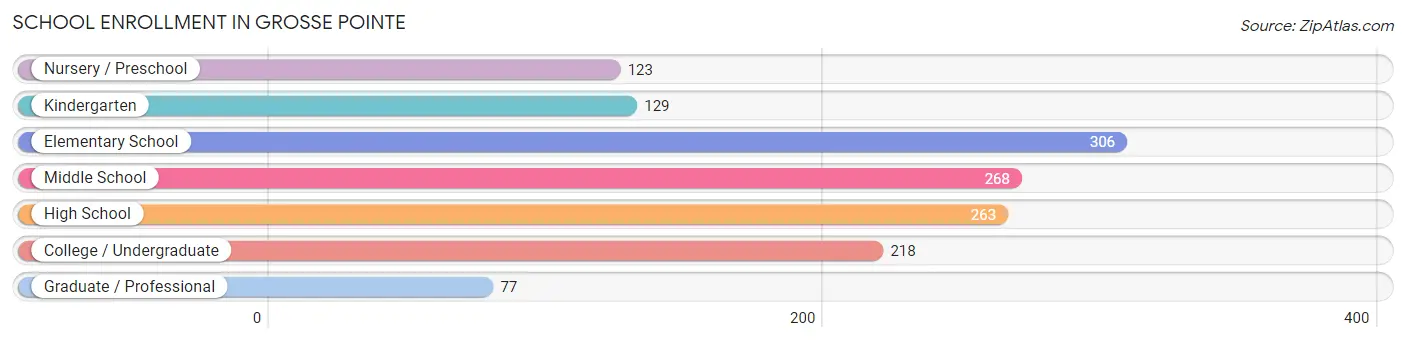
School Enrollment in Grosse Pointe
The most common levels of schooling among the 1,384 students in Grosse Pointe are elementary school (306 | 22.1%), middle school (268 | 19.4%), and high school (263 | 19.0%).
| School Level | # Students | % Students |
| Nursery / Preschool | 123 | 8.9% |
| Kindergarten | 129 | 9.3% |
| Elementary School | 306 | 22.1% |
| Middle School | 268 | 19.4% |
| High School | 263 | 19.0% |
| College / Undergraduate | 218 | 15.8% |
| Graduate / Professional | 77 | 5.6% |
| Total | 1,384 | 100.0% |
School Enrollment by Age by Funding Source in Grosse Pointe
Out of a total of 1,384 students who are enrolled in schools in Grosse Pointe, 372 (26.9%) attend a private institution, while the remaining 1,012 (73.1%) are enrolled in public schools. The age group of 3 to 4 year olds has the highest likelihood of being enrolled in private schools, with 99 (95.2% in the age bracket) enrolled. Conversely, the age group of 15 to 17 year olds has the lowest likelihood of being enrolled in a private school, with 183 (91.5% in the age bracket) attending a public institution.
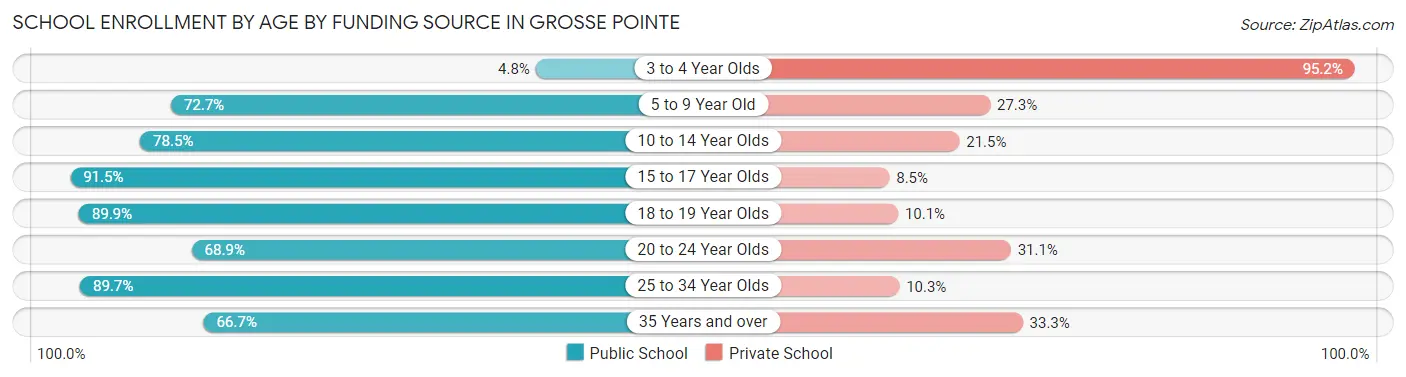
| Age Bracket | Public School | Private School |
| 3 to 4 Year Olds | 5 (4.8%) | 99 (95.2%) |
| 5 to 9 Year Old | 304 (72.7%) | 114 (27.3%) |
| 10 to 14 Year Olds | 277 (78.5%) | 76 (21.5%) |
| 15 to 17 Year Olds | 183 (91.5%) | 17 (8.5%) |
| 18 to 19 Year Olds | 80 (89.9%) | 9 (10.1%) |
| 20 to 24 Year Olds | 93 (68.9%) | 42 (31.1%) |
| 25 to 34 Year Olds | 52 (89.7%) | 6 (10.3%) |
| 35 Years and over | 18 (66.7%) | 9 (33.3%) |
| Total | 1,012 (73.1%) | 372 (26.9%) |
Educational Attainment by Field of Study in Grosse Pointe
Business (514 | 16.2%), education (373 | 11.8%), social sciences (313 | 9.9%), science & technology (305 | 9.6%), and engineering (233 | 7.3%) are the most common fields of study among 3,170 individuals in Grosse Pointe who have obtained a bachelor's degree or higher.
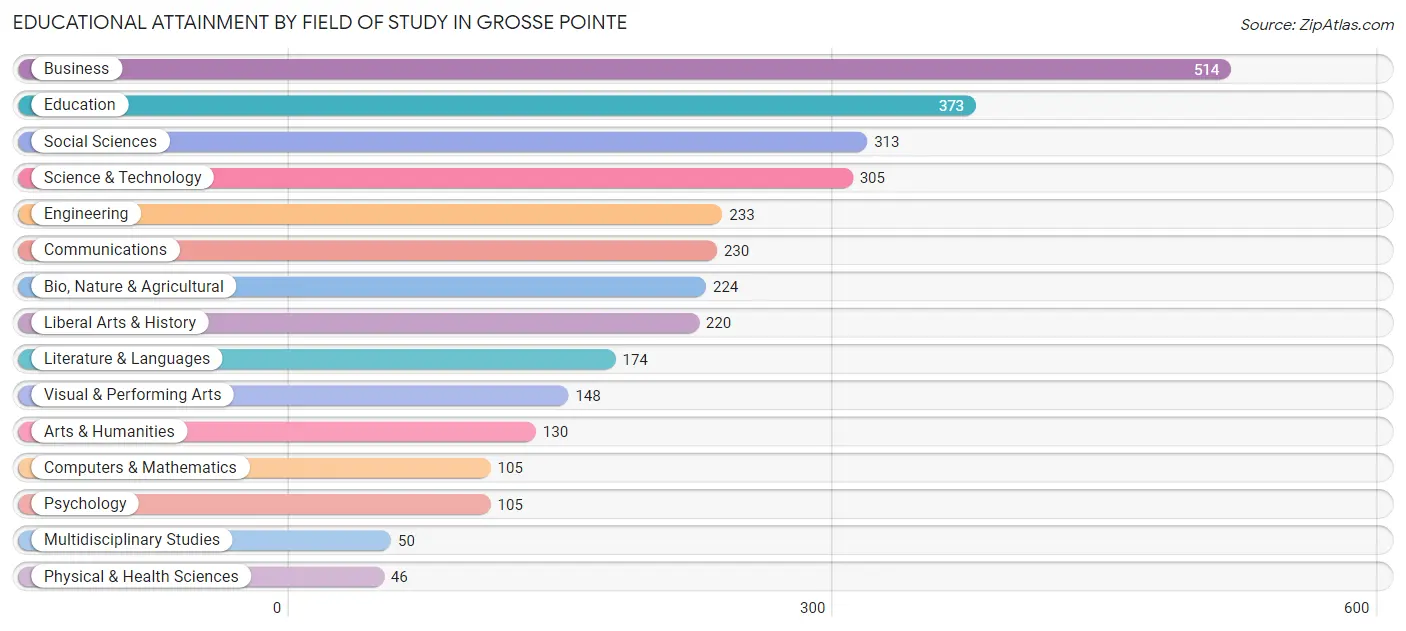
| Field of Study | # Graduates | % Graduates |
| Computers & Mathematics | 105 | 3.3% |
| Bio, Nature & Agricultural | 224 | 7.1% |
| Physical & Health Sciences | 46 | 1.5% |
| Psychology | 105 | 3.3% |
| Social Sciences | 313 | 9.9% |
| Engineering | 233 | 7.3% |
| Multidisciplinary Studies | 50 | 1.6% |
| Science & Technology | 305 | 9.6% |
| Business | 514 | 16.2% |
| Education | 373 | 11.8% |
| Literature & Languages | 174 | 5.5% |
| Liberal Arts & History | 220 | 6.9% |
| Visual & Performing Arts | 148 | 4.7% |
| Communications | 230 | 7.3% |
| Arts & Humanities | 130 | 4.1% |
| Total | 3,170 | 100.0% |
Transportation & Commute in Grosse Pointe
Vehicle Availability by Sex in Grosse Pointe
The most prevalent vehicle ownership categories in Grosse Pointe are males with 2 vehicles (768, accounting for 58.4%) and females with 2 vehicles (534, making up 63.0%).
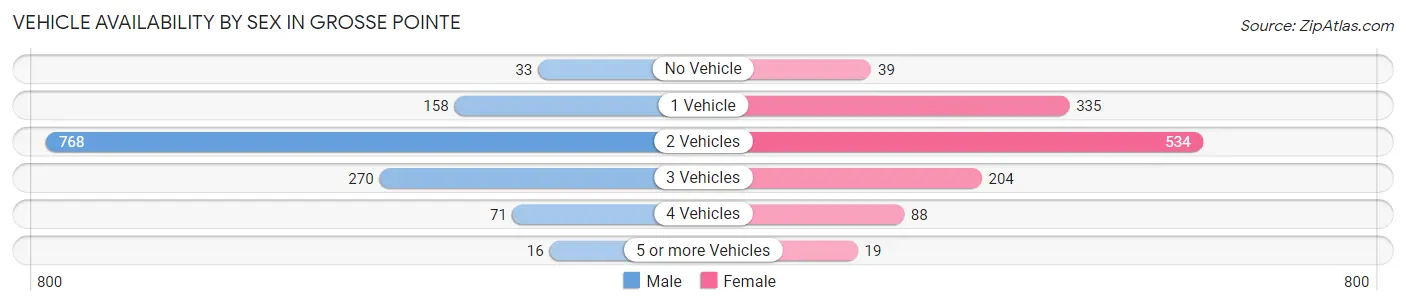
| Vehicles Available | Male | Female |
| No Vehicle | 33 (2.5%) | 39 (3.2%) |
| 1 Vehicle | 158 (12.0%) | 335 (27.5%) |
| 2 Vehicles | 768 (58.4%) | 534 (43.8%) |
| 3 Vehicles | 270 (20.5%) | 204 (16.7%) |
| 4 Vehicles | 71 (5.4%) | 88 (7.2%) |
| 5 or more Vehicles | 16 (1.2%) | 19 (1.6%) |
| Total | 1,316 (100.0%) | 1,219 (100.0%) |
Commute Time in Grosse Pointe
The most frequently occuring commute durations in Grosse Pointe are 5 to 9 minutes (348 commuters, 17.2%), 20 to 24 minutes (312 commuters, 15.4%), and 30 to 34 minutes (272 commuters, 13.4%).
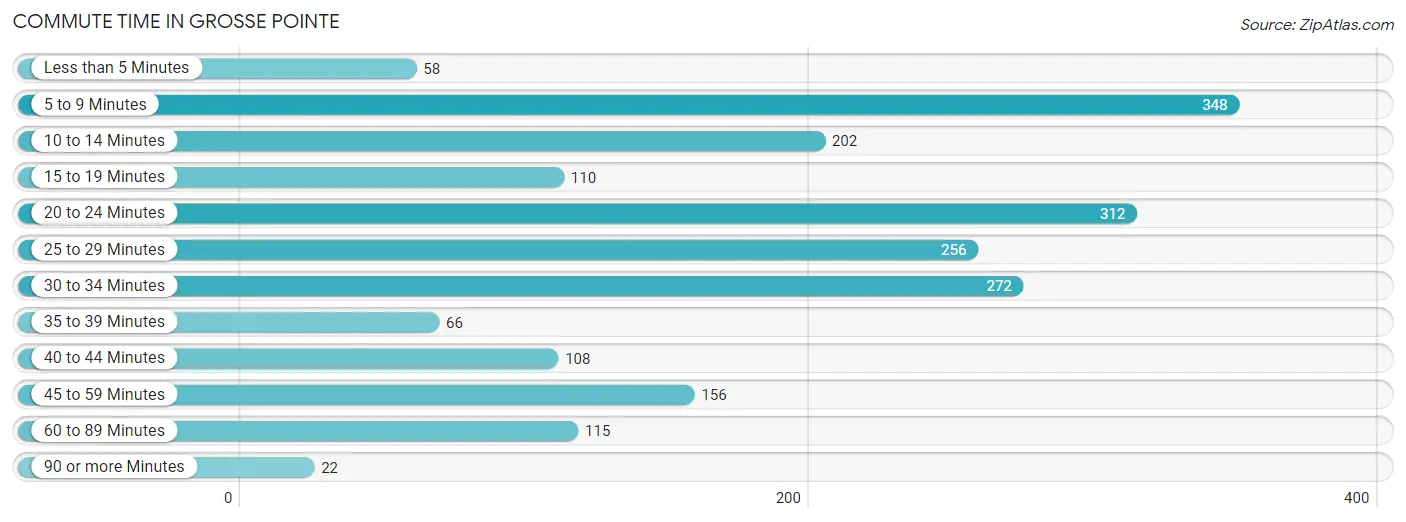
| Commute Time | # Commuters | % Commuters |
| Less than 5 Minutes | 58 | 2.9% |
| 5 to 9 Minutes | 348 | 17.2% |
| 10 to 14 Minutes | 202 | 10.0% |
| 15 to 19 Minutes | 110 | 5.4% |
| 20 to 24 Minutes | 312 | 15.4% |
| 25 to 29 Minutes | 256 | 12.6% |
| 30 to 34 Minutes | 272 | 13.4% |
| 35 to 39 Minutes | 66 | 3.3% |
| 40 to 44 Minutes | 108 | 5.3% |
| 45 to 59 Minutes | 156 | 7.7% |
| 60 to 89 Minutes | 115 | 5.7% |
| 90 or more Minutes | 22 | 1.1% |
Commute Time by Sex in Grosse Pointe
The most common commute times in Grosse Pointe are 20 to 24 minutes (183 commuters, 18.8%) for males and 5 to 9 minutes (231 commuters, 21.9%) for females.
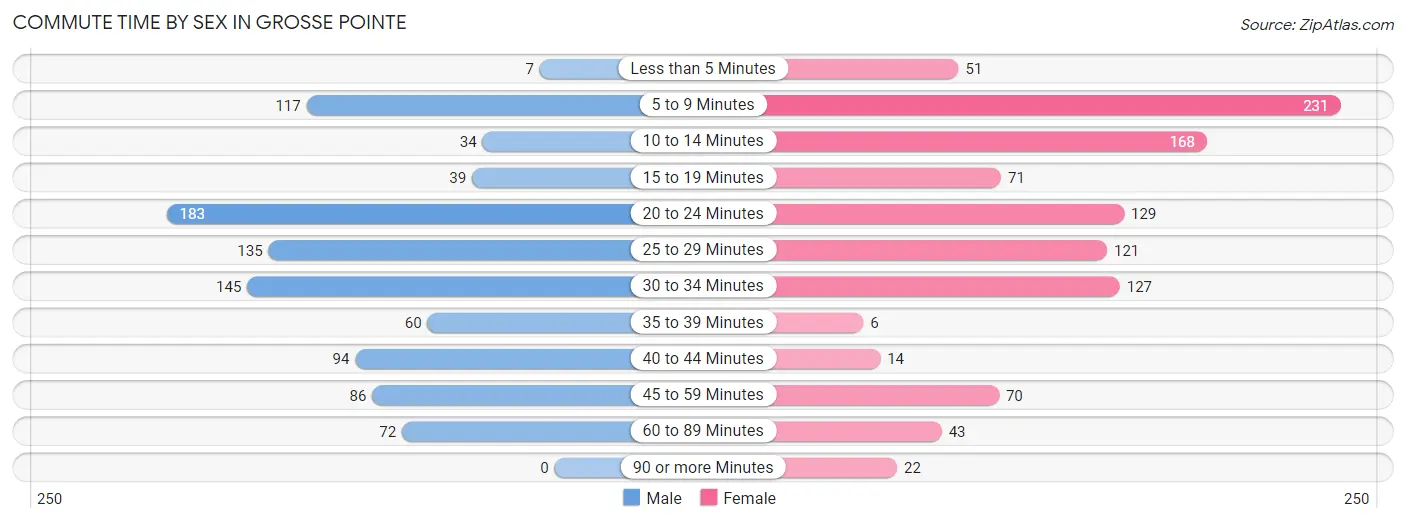
| Commute Time | Male | Female |
| Less than 5 Minutes | 7 (0.7%) | 51 (4.8%) |
| 5 to 9 Minutes | 117 (12.0%) | 231 (21.9%) |
| 10 to 14 Minutes | 34 (3.5%) | 168 (16.0%) |
| 15 to 19 Minutes | 39 (4.0%) | 71 (6.7%) |
| 20 to 24 Minutes | 183 (18.8%) | 129 (12.2%) |
| 25 to 29 Minutes | 135 (13.9%) | 121 (11.5%) |
| 30 to 34 Minutes | 145 (14.9%) | 127 (12.1%) |
| 35 to 39 Minutes | 60 (6.2%) | 6 (0.6%) |
| 40 to 44 Minutes | 94 (9.7%) | 14 (1.3%) |
| 45 to 59 Minutes | 86 (8.8%) | 70 (6.7%) |
| 60 to 89 Minutes | 72 (7.4%) | 43 (4.1%) |
| 90 or more Minutes | 0 (0.0%) | 22 (2.1%) |
Time of Departure to Work by Sex in Grosse Pointe
The most frequent times of departure to work in Grosse Pointe are 7:00 AM to 7:29 AM (160, 16.5%) for males and 7:30 AM to 7:59 AM (188, 17.8%) for females.
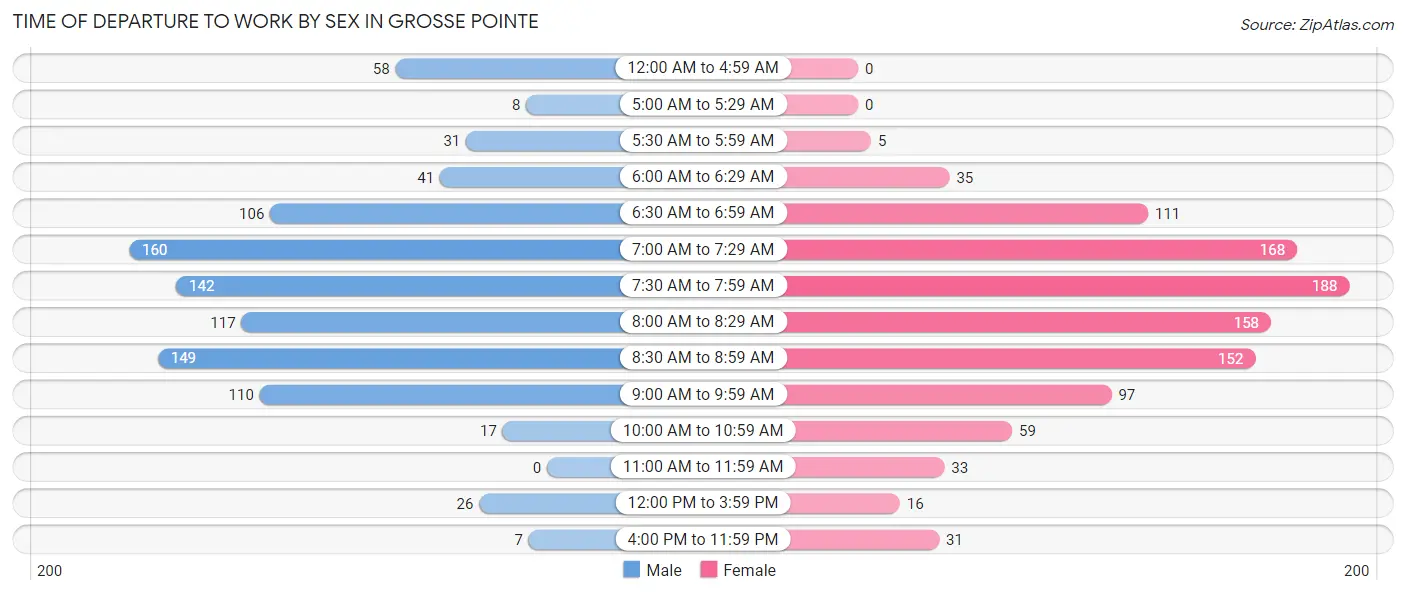
| Time of Departure | Male | Female |
| 12:00 AM to 4:59 AM | 58 (6.0%) | 0 (0.0%) |
| 5:00 AM to 5:29 AM | 8 (0.8%) | 0 (0.0%) |
| 5:30 AM to 5:59 AM | 31 (3.2%) | 5 (0.5%) |
| 6:00 AM to 6:29 AM | 41 (4.2%) | 35 (3.3%) |
| 6:30 AM to 6:59 AM | 106 (10.9%) | 111 (10.5%) |
| 7:00 AM to 7:29 AM | 160 (16.5%) | 168 (16.0%) |
| 7:30 AM to 7:59 AM | 142 (14.6%) | 188 (17.8%) |
| 8:00 AM to 8:29 AM | 117 (12.0%) | 158 (15.0%) |
| 8:30 AM to 8:59 AM | 149 (15.3%) | 152 (14.4%) |
| 9:00 AM to 9:59 AM | 110 (11.3%) | 97 (9.2%) |
| 10:00 AM to 10:59 AM | 17 (1.8%) | 59 (5.6%) |
| 11:00 AM to 11:59 AM | 0 (0.0%) | 33 (3.1%) |
| 12:00 PM to 3:59 PM | 26 (2.7%) | 16 (1.5%) |
| 4:00 PM to 11:59 PM | 7 (0.7%) | 31 (2.9%) |
| Total | 972 (100.0%) | 1,053 (100.0%) |
Housing Occupancy in Grosse Pointe
Occupancy by Ownership in Grosse Pointe
Of the total 2,252 dwellings in Grosse Pointe, owner-occupied units account for 1,939 (86.1%), while renter-occupied units make up 313 (13.9%).
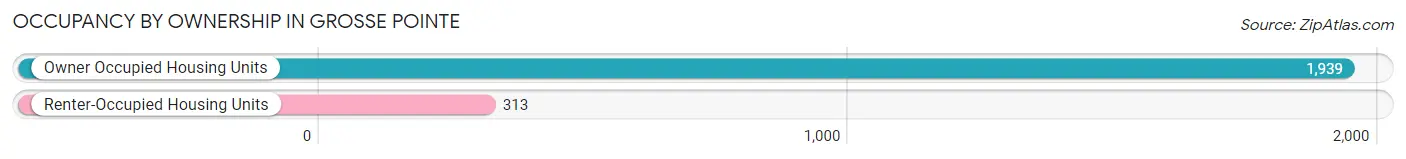
| Occupancy | # Housing Units | % Housing Units |
| Owner Occupied Housing Units | 1,939 | 86.1% |
| Renter-Occupied Housing Units | 313 | 13.9% |
| Total Occupied Housing Units | 2,252 | 100.0% |
Occupancy by Household Size in Grosse Pointe
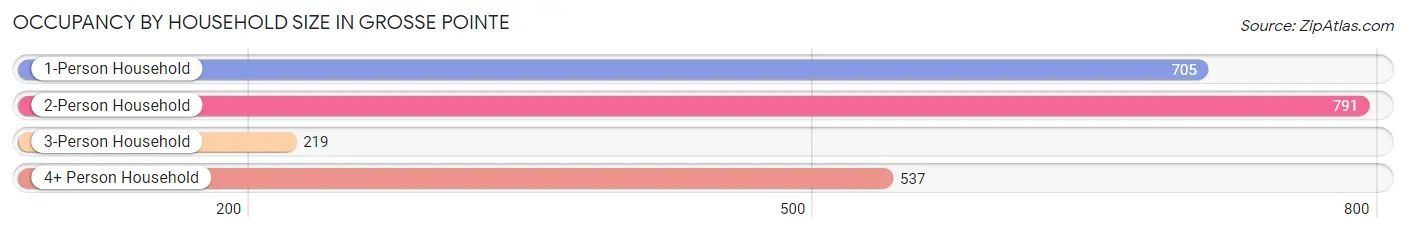
| Household Size | # Housing Units | % Housing Units |
| 1-Person Household | 705 | 31.3% |
| 2-Person Household | 791 | 35.1% |
| 3-Person Household | 219 | 9.7% |
| 4+ Person Household | 537 | 23.8% |
| Total Housing Units | 2,252 | 100.0% |
Occupancy by Ownership by Household Size in Grosse Pointe
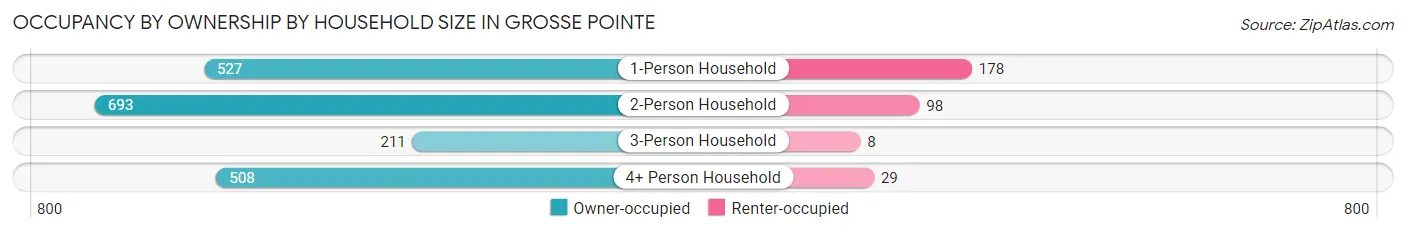
| Household Size | Owner-occupied | Renter-occupied |
| 1-Person Household | 527 (74.8%) | 178 (25.3%) |
| 2-Person Household | 693 (87.6%) | 98 (12.4%) |
| 3-Person Household | 211 (96.4%) | 8 (3.6%) |
| 4+ Person Household | 508 (94.6%) | 29 (5.4%) |
| Total Housing Units | 1,939 (86.1%) | 313 (13.9%) |
Occupancy by Educational Attainment in Grosse Pointe

| Household Size | Owner-occupied | Renter-occupied |
| Less than High School | 14 (100.0%) | 0 (0.0%) |
| High School Diploma | 69 (47.6%) | 76 (52.4%) |
| College/Associate Degree | 313 (90.5%) | 33 (9.5%) |
| Bachelor's Degree or higher | 1,543 (88.3%) | 204 (11.7%) |
Occupancy by Age of Householder in Grosse Pointe
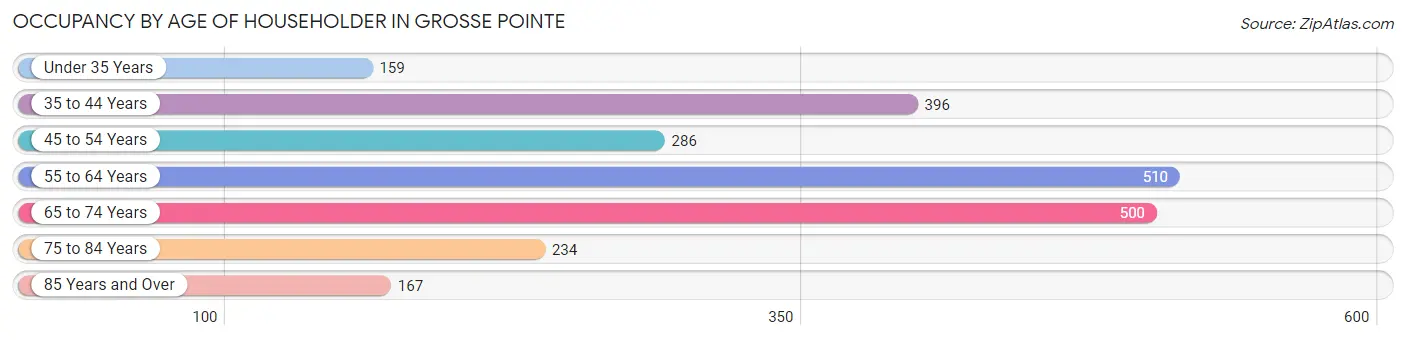
| Age Bracket | # Households | % Households |
| Under 35 Years | 159 | 7.1% |
| 35 to 44 Years | 396 | 17.6% |
| 45 to 54 Years | 286 | 12.7% |
| 55 to 64 Years | 510 | 22.7% |
| 65 to 74 Years | 500 | 22.2% |
| 75 to 84 Years | 234 | 10.4% |
| 85 Years and Over | 167 | 7.4% |
| Total | 2,252 | 100.0% |
Housing Finances in Grosse Pointe
Median Income by Occupancy in Grosse Pointe
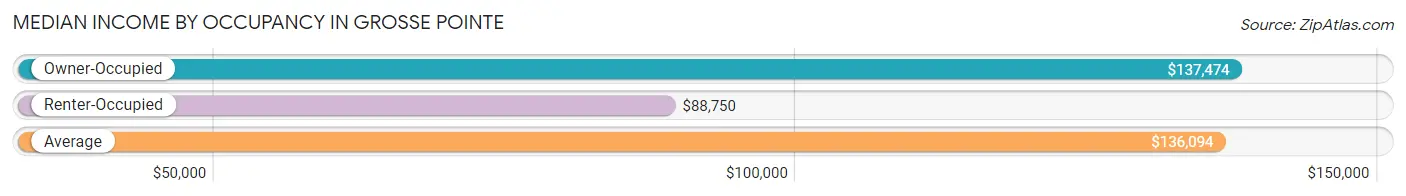
| Occupancy Type | # Households | Median Income |
| Owner-Occupied | 1,939 (86.1%) | $137,474 |
| Renter-Occupied | 313 (13.9%) | $88,750 |
| Average | 2,252 (100.0%) | $136,094 |
Occupancy by Householder Income Bracket in Grosse Pointe
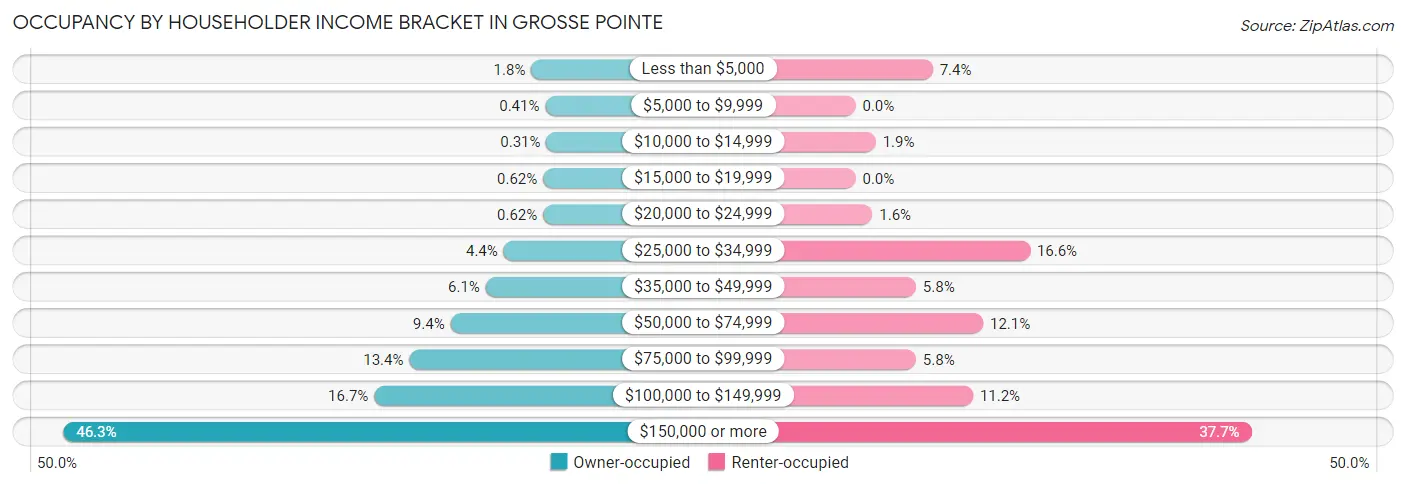
| Income Bracket | Owner-occupied | Renter-occupied |
| Less than $5,000 | 34 (1.8%) | 23 (7.3%) |
| $5,000 to $9,999 | 8 (0.4%) | 0 (0.0%) |
| $10,000 to $14,999 | 6 (0.3%) | 6 (1.9%) |
| $15,000 to $19,999 | 12 (0.6%) | 0 (0.0%) |
| $20,000 to $24,999 | 12 (0.6%) | 5 (1.6%) |
| $25,000 to $34,999 | 85 (4.4%) | 52 (16.6%) |
| $35,000 to $49,999 | 118 (6.1%) | 18 (5.8%) |
| $50,000 to $74,999 | 183 (9.4%) | 38 (12.1%) |
| $75,000 to $99,999 | 259 (13.4%) | 18 (5.8%) |
| $100,000 to $149,999 | 324 (16.7%) | 35 (11.2%) |
| $150,000 or more | 898 (46.3%) | 118 (37.7%) |
| Total | 1,939 (100.0%) | 313 (100.0%) |
Monthly Housing Cost Tiers in Grosse Pointe
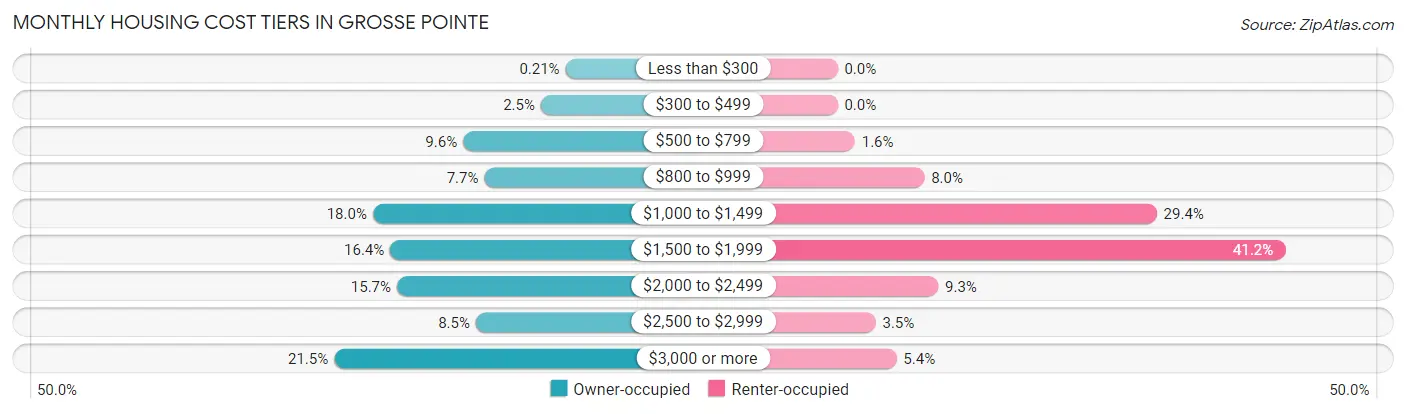
| Monthly Cost | Owner-occupied | Renter-occupied |
| Less than $300 | 4 (0.2%) | 0 (0.0%) |
| $300 to $499 | 48 (2.5%) | 0 (0.0%) |
| $500 to $799 | 187 (9.6%) | 5 (1.6%) |
| $800 to $999 | 149 (7.7%) | 25 (8.0%) |
| $1,000 to $1,499 | 348 (17.9%) | 92 (29.4%) |
| $1,500 to $1,999 | 317 (16.4%) | 129 (41.2%) |
| $2,000 to $2,499 | 305 (15.7%) | 29 (9.3%) |
| $2,500 to $2,999 | 164 (8.5%) | 11 (3.5%) |
| $3,000 or more | 417 (21.5%) | 17 (5.4%) |
| Total | 1,939 (100.0%) | 313 (100.0%) |
Physical Housing Characteristics in Grosse Pointe
Housing Structures in Grosse Pointe
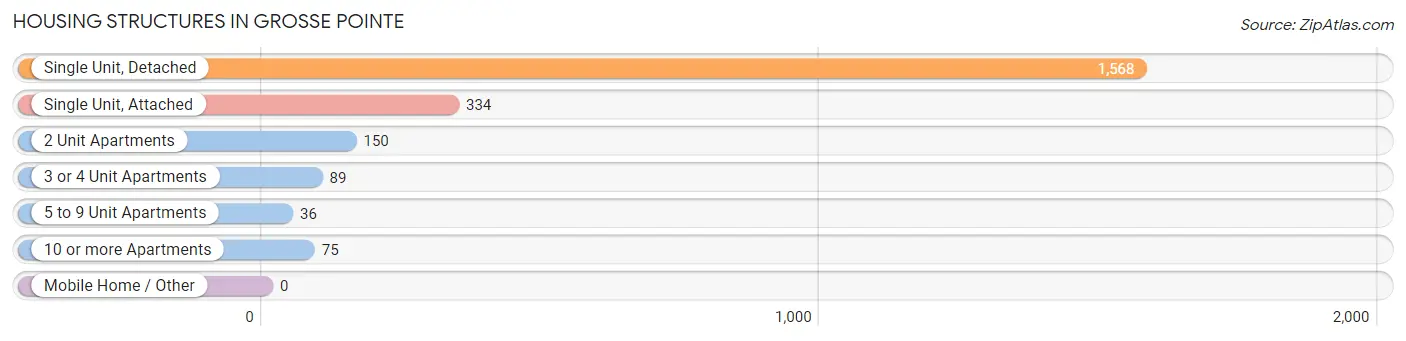
| Structure Type | # Housing Units | % Housing Units |
| Single Unit, Detached | 1,568 | 69.6% |
| Single Unit, Attached | 334 | 14.8% |
| 2 Unit Apartments | 150 | 6.7% |
| 3 or 4 Unit Apartments | 89 | 4.0% |
| 5 to 9 Unit Apartments | 36 | 1.6% |
| 10 or more Apartments | 75 | 3.3% |
| Mobile Home / Other | 0 | 0.0% |
| Total | 2,252 | 100.0% |
Housing Structures by Occupancy in Grosse Pointe
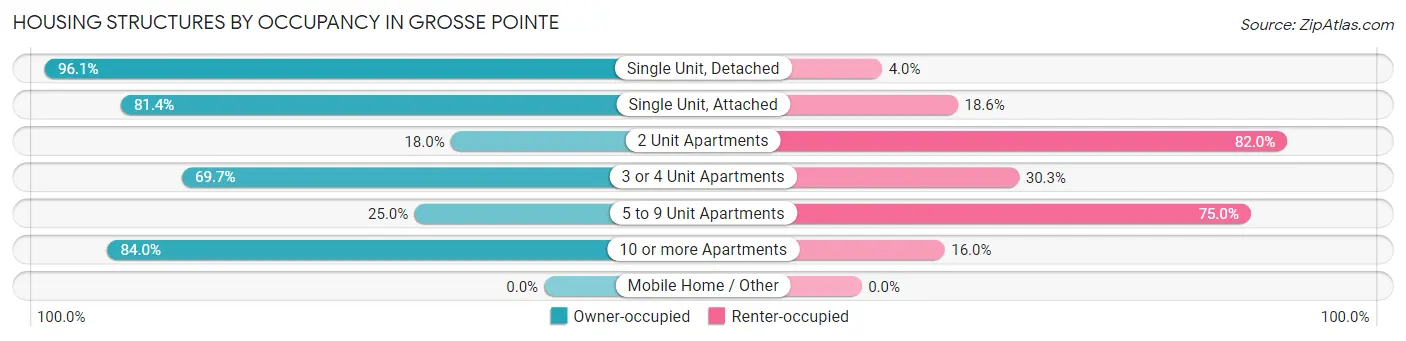
| Structure Type | Owner-occupied | Renter-occupied |
| Single Unit, Detached | 1,506 (96.1%) | 62 (4.0%) |
| Single Unit, Attached | 272 (81.4%) | 62 (18.6%) |
| 2 Unit Apartments | 27 (18.0%) | 123 (82.0%) |
| 3 or 4 Unit Apartments | 62 (69.7%) | 27 (30.3%) |
| 5 to 9 Unit Apartments | 9 (25.0%) | 27 (75.0%) |
| 10 or more Apartments | 63 (84.0%) | 12 (16.0%) |
| Mobile Home / Other | 0 (0.0%) | 0 (0.0%) |
| Total | 1,939 (86.1%) | 313 (13.9%) |
Housing Structures by Number of Rooms in Grosse Pointe
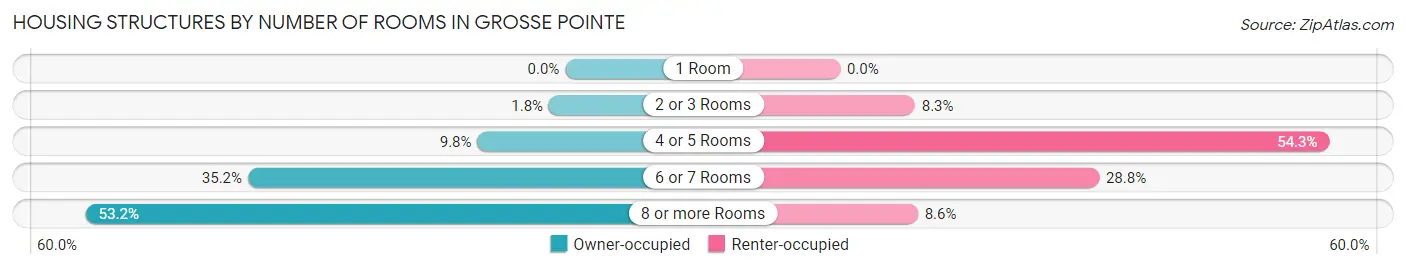
| Number of Rooms | Owner-occupied | Renter-occupied |
| 1 Room | 0 (0.0%) | 0 (0.0%) |
| 2 or 3 Rooms | 35 (1.8%) | 26 (8.3%) |
| 4 or 5 Rooms | 189 (9.8%) | 170 (54.3%) |
| 6 or 7 Rooms | 683 (35.2%) | 90 (28.7%) |
| 8 or more Rooms | 1,032 (53.2%) | 27 (8.6%) |
| Total | 1,939 (100.0%) | 313 (100.0%) |
Housing Structure by Heating Type in Grosse Pointe
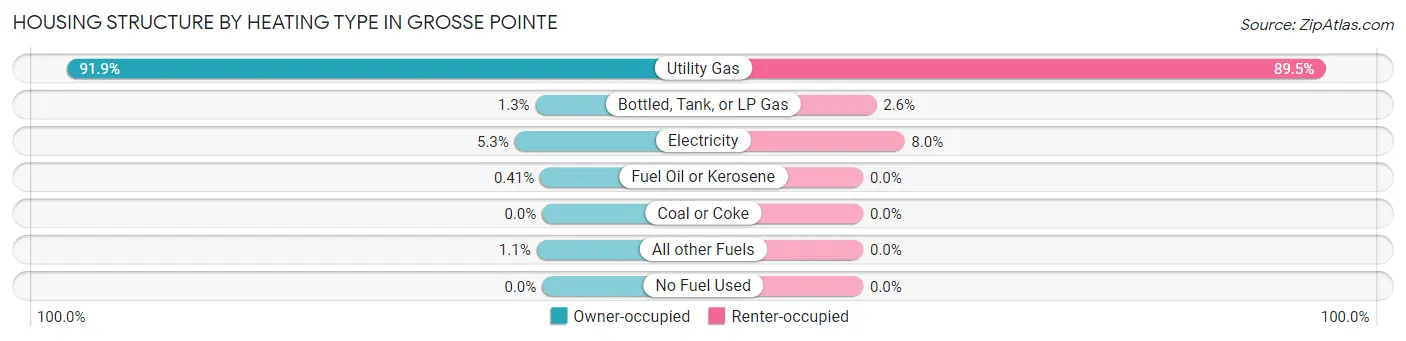
| Heating Type | Owner-occupied | Renter-occupied |
| Utility Gas | 1,782 (91.9%) | 280 (89.5%) |
| Bottled, Tank, or LP Gas | 25 (1.3%) | 8 (2.6%) |
| Electricity | 103 (5.3%) | 25 (8.0%) |
| Fuel Oil or Kerosene | 8 (0.4%) | 0 (0.0%) |
| Coal or Coke | 0 (0.0%) | 0 (0.0%) |
| All other Fuels | 21 (1.1%) | 0 (0.0%) |
| No Fuel Used | 0 (0.0%) | 0 (0.0%) |
| Total | 1,939 (100.0%) | 313 (100.0%) |
Household Vehicle Usage in Grosse Pointe
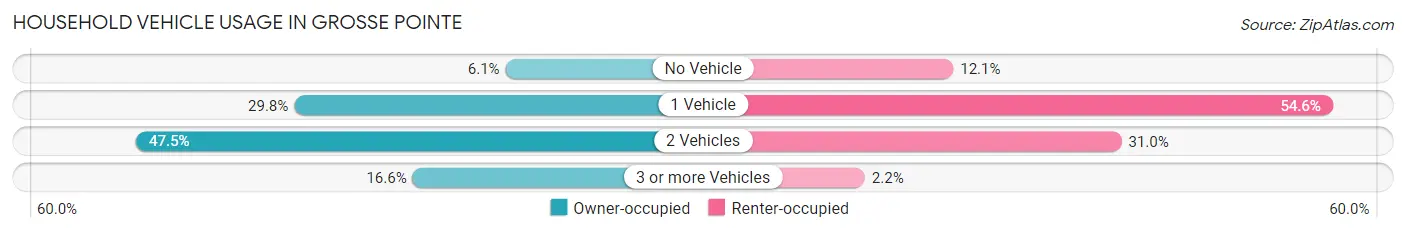
| Vehicles per Household | Owner-occupied | Renter-occupied |
| No Vehicle | 119 (6.1%) | 38 (12.1%) |
| 1 Vehicle | 578 (29.8%) | 171 (54.6%) |
| 2 Vehicles | 921 (47.5%) | 97 (31.0%) |
| 3 or more Vehicles | 321 (16.6%) | 7 (2.2%) |
| Total | 1,939 (100.0%) | 313 (100.0%) |
Real Estate & Mortgages in Grosse Pointe
Real Estate and Mortgage Overview in Grosse Pointe
| Characteristic | Without Mortgage | With Mortgage |
| Housing Units | 751 | 1,188 |
| Median Property Value | $373,500 | $383,500 |
| Median Household Income | $124,688 | $608 |
| Monthly Housing Costs | $1,061 | $417 |
| Real Estate Taxes | $6,597 | $49 |
Property Value by Mortgage Status in Grosse Pointe
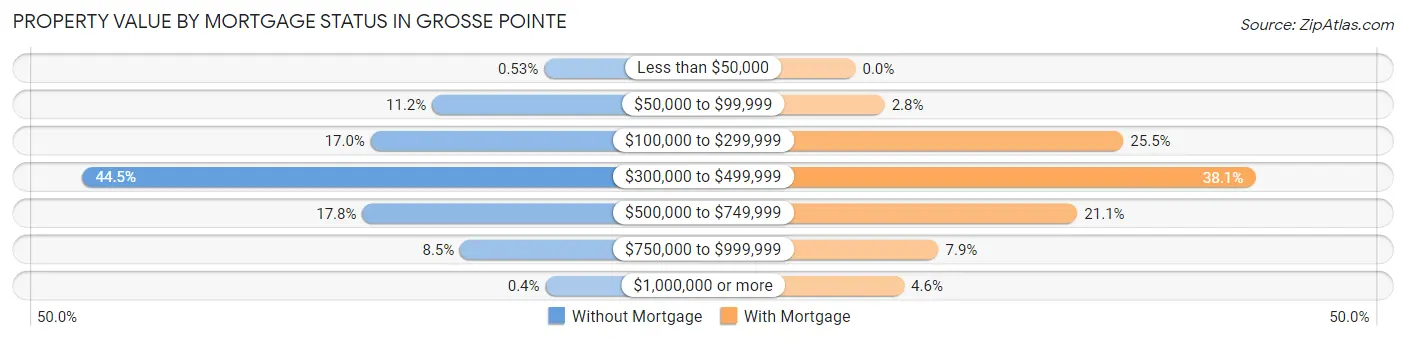
| Property Value | Without Mortgage | With Mortgage |
| Less than $50,000 | 4 (0.5%) | 0 (0.0%) |
| $50,000 to $99,999 | 84 (11.2%) | 33 (2.8%) |
| $100,000 to $299,999 | 128 (17.0%) | 303 (25.5%) |
| $300,000 to $499,999 | 334 (44.5%) | 452 (38.1%) |
| $500,000 to $749,999 | 134 (17.8%) | 251 (21.1%) |
| $750,000 to $999,999 | 64 (8.5%) | 94 (7.9%) |
| $1,000,000 or more | 3 (0.4%) | 55 (4.6%) |
| Total | 751 (100.0%) | 1,188 (100.0%) |
Household Income by Mortgage Status in Grosse Pointe
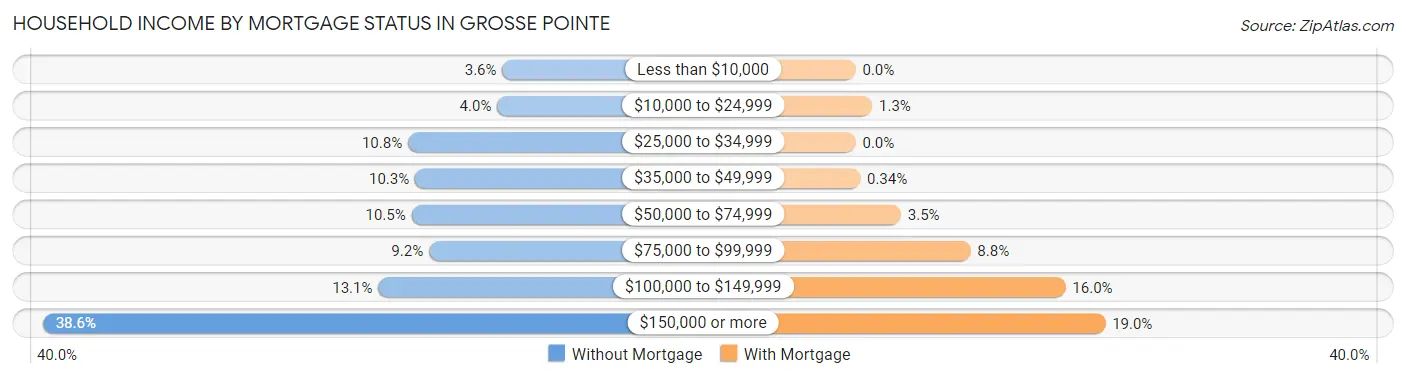
| Household Income | Without Mortgage | With Mortgage |
| Less than $10,000 | 27 (3.6%) | 0 (0.0%) |
| $10,000 to $24,999 | 30 (4.0%) | 15 (1.3%) |
| $25,000 to $34,999 | 81 (10.8%) | 0 (0.0%) |
| $35,000 to $49,999 | 77 (10.2%) | 4 (0.3%) |
| $50,000 to $74,999 | 79 (10.5%) | 41 (3.5%) |
| $75,000 to $99,999 | 69 (9.2%) | 104 (8.7%) |
| $100,000 to $149,999 | 98 (13.1%) | 190 (16.0%) |
| $150,000 or more | 290 (38.6%) | 226 (19.0%) |
| Total | 751 (100.0%) | 1,188 (100.0%) |
Property Value to Household Income Ratio in Grosse Pointe
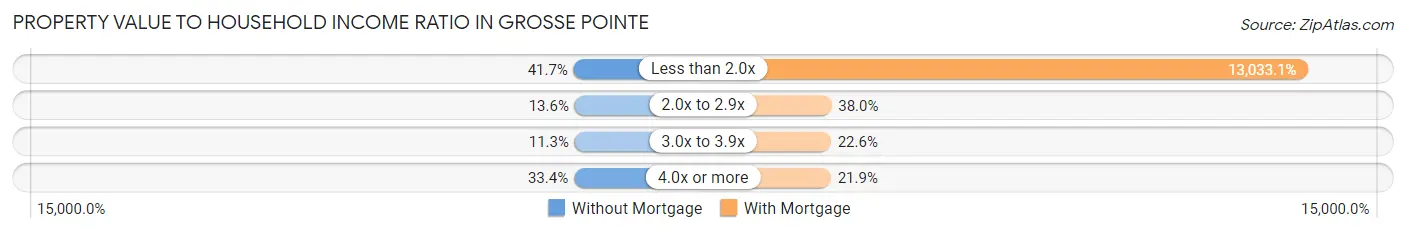
| Value-to-Income Ratio | Without Mortgage | With Mortgage |
| Less than 2.0x | 313 (41.7%) | 154,833 (13,033.1%) |
| 2.0x to 2.9x | 102 (13.6%) | 451 (38.0%) |
| 3.0x to 3.9x | 85 (11.3%) | 269 (22.6%) |
| 4.0x or more | 251 (33.4%) | 260 (21.9%) |
| Total | 751 (100.0%) | 1,188 (100.0%) |
Real Estate Taxes by Mortgage Status in Grosse Pointe
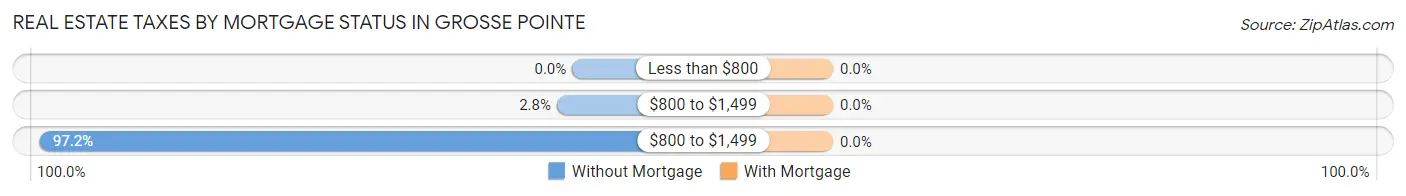
| Property Taxes | Without Mortgage | With Mortgage |
| Less than $800 | 0 (0.0%) | 0 (0.0%) |
| $800 to $1,499 | 21 (2.8%) | 0 (0.0%) |
| $800 to $1,499 | 730 (97.2%) | 0 (0.0%) |
| Total | 751 (100.0%) | 1,188 (100.0%) |
Health & Disability in Grosse Pointe
Health Insurance Coverage by Age in Grosse Pointe
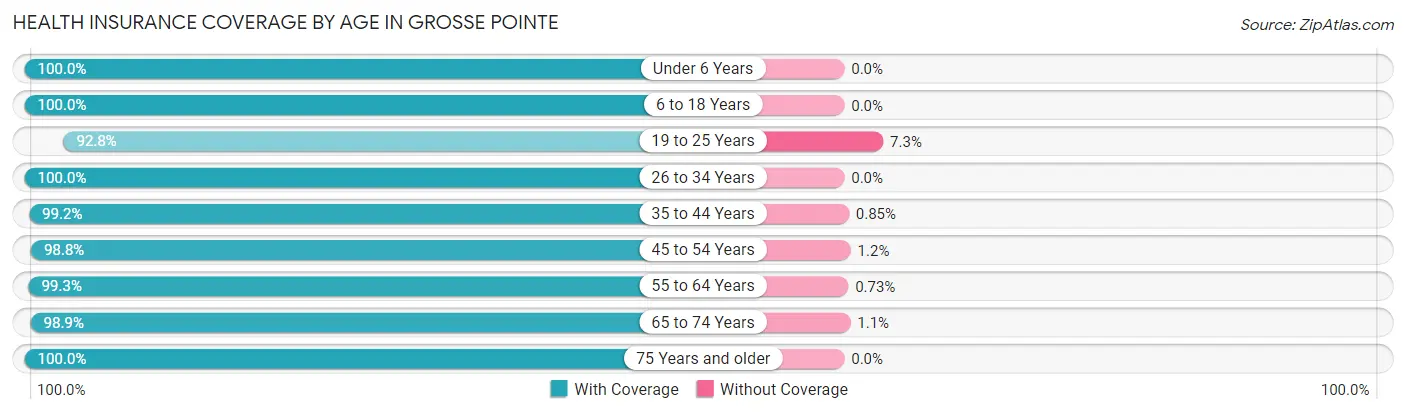
| Age Bracket | With Coverage | Without Coverage |
| Under 6 Years | 531 (100.0%) | 0 (0.0%) |
| 6 to 18 Years | 949 (100.0%) | 0 (0.0%) |
| 19 to 25 Years | 320 (92.7%) | 25 (7.2%) |
| 26 to 34 Years | 333 (100.0%) | 0 (0.0%) |
| 35 to 44 Years | 701 (99.2%) | 6 (0.9%) |
| 45 to 54 Years | 581 (98.8%) | 7 (1.2%) |
| 55 to 64 Years | 820 (99.3%) | 6 (0.7%) |
| 65 to 74 Years | 788 (98.9%) | 9 (1.1%) |
| 75 Years and older | 545 (100.0%) | 0 (0.0%) |
| Total | 5,568 (99.1%) | 53 (0.9%) |
Health Insurance Coverage by Citizenship Status in Grosse Pointe
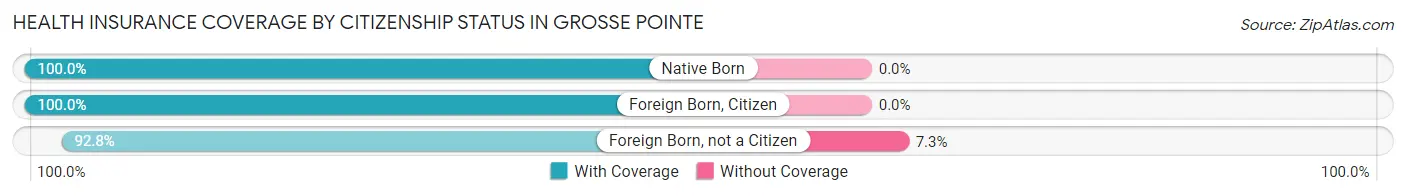
| Citizenship Status | With Coverage | Without Coverage |
| Native Born | 531 (100.0%) | 0 (0.0%) |
| Foreign Born, Citizen | 949 (100.0%) | 0 (0.0%) |
| Foreign Born, not a Citizen | 320 (92.7%) | 25 (7.2%) |
Health Insurance Coverage by Household Income in Grosse Pointe
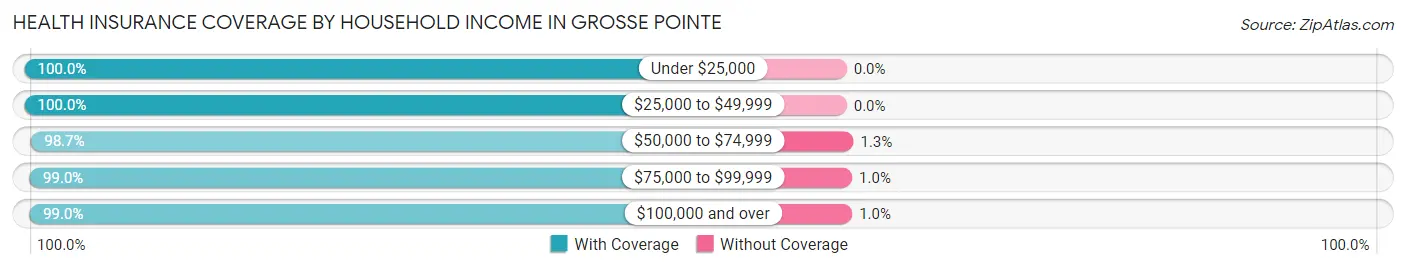
| Household Income | With Coverage | Without Coverage |
| Under $25,000 | 117 (100.0%) | 0 (0.0%) |
| $25,000 to $49,999 | 367 (100.0%) | 0 (0.0%) |
| $50,000 to $74,999 | 471 (98.7%) | 6 (1.3%) |
| $75,000 to $99,999 | 592 (99.0%) | 6 (1.0%) |
| $100,000 and over | 4,020 (99.0%) | 41 (1.0%) |
Public vs Private Health Insurance Coverage by Age in Grosse Pointe
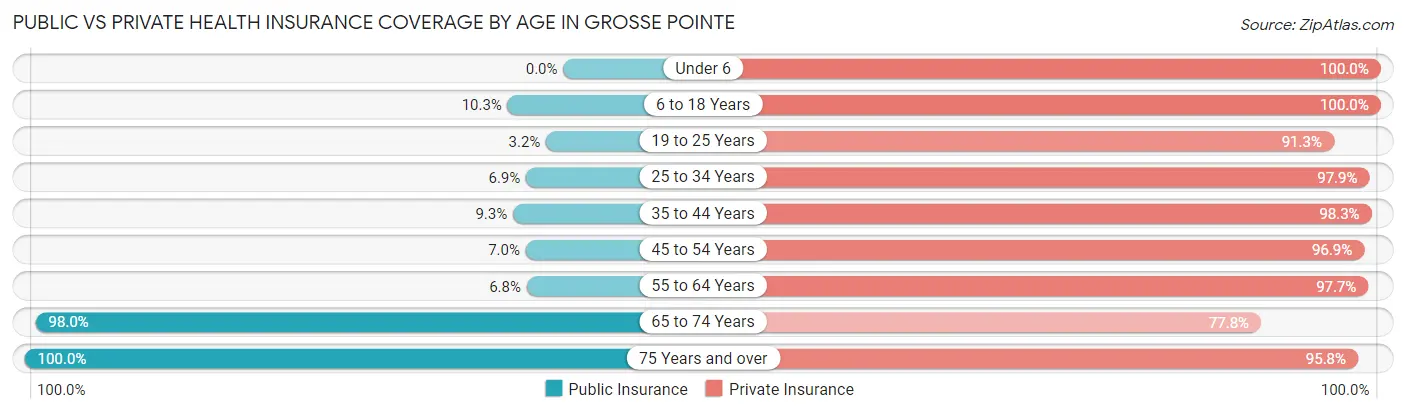
| Age Bracket | Public Insurance | Private Insurance |
| Under 6 | 0 (0.0%) | 531 (100.0%) |
| 6 to 18 Years | 98 (10.3%) | 949 (100.0%) |
| 19 to 25 Years | 11 (3.2%) | 315 (91.3%) |
| 25 to 34 Years | 23 (6.9%) | 326 (97.9%) |
| 35 to 44 Years | 66 (9.3%) | 695 (98.3%) |
| 45 to 54 Years | 41 (7.0%) | 570 (96.9%) |
| 55 to 64 Years | 56 (6.8%) | 807 (97.7%) |
| 65 to 74 Years | 781 (98.0%) | 620 (77.8%) |
| 75 Years and over | 545 (100.0%) | 522 (95.8%) |
| Total | 1,621 (28.8%) | 5,335 (94.9%) |
Disability Status by Sex by Age in Grosse Pointe
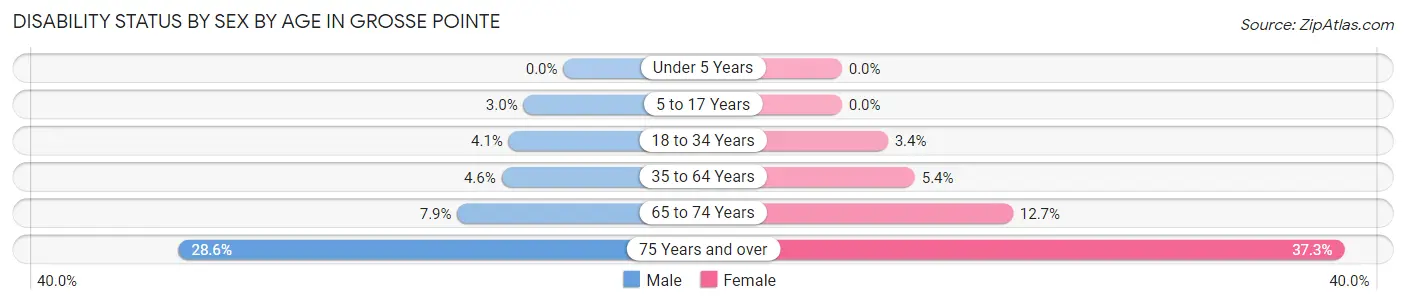
| Age Bracket | Male | Female |
| Under 5 Years | 0 (0.0%) | 0 (0.0%) |
| 5 to 17 Years | 14 (3.0%) | 0 (0.0%) |
| 18 to 34 Years | 16 (4.1%) | 11 (3.4%) |
| 35 to 64 Years | 44 (4.6%) | 63 (5.4%) |
| 65 to 74 Years | 28 (7.9%) | 56 (12.7%) |
| 75 Years and over | 50 (28.6%) | 138 (37.3%) |
Disability Class by Sex by Age in Grosse Pointe
Disability Class: Hearing Difficulty
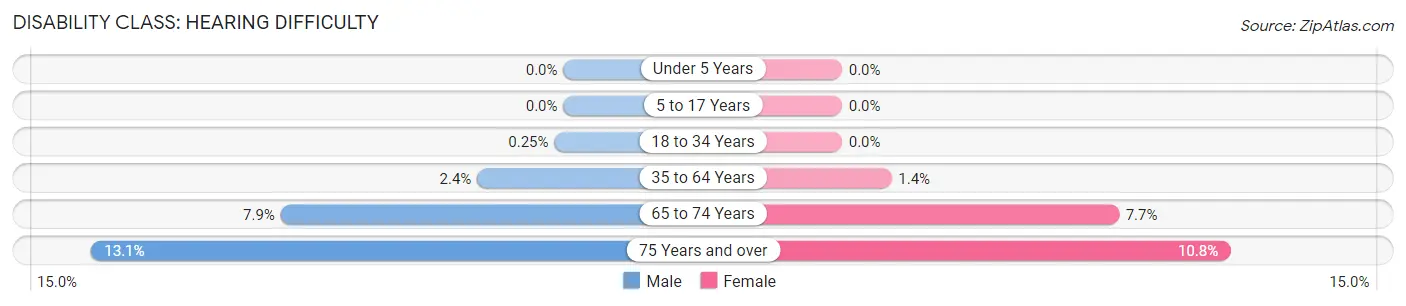
| Age Bracket | Male | Female |
| Under 5 Years | 0 (0.0%) | 0 (0.0%) |
| 5 to 17 Years | 0 (0.0%) | 0 (0.0%) |
| 18 to 34 Years | 1 (0.3%) | 0 (0.0%) |
| 35 to 64 Years | 23 (2.4%) | 16 (1.4%) |
| 65 to 74 Years | 28 (7.9%) | 34 (7.7%) |
| 75 Years and over | 23 (13.1%) | 40 (10.8%) |
Disability Class: Vision Difficulty
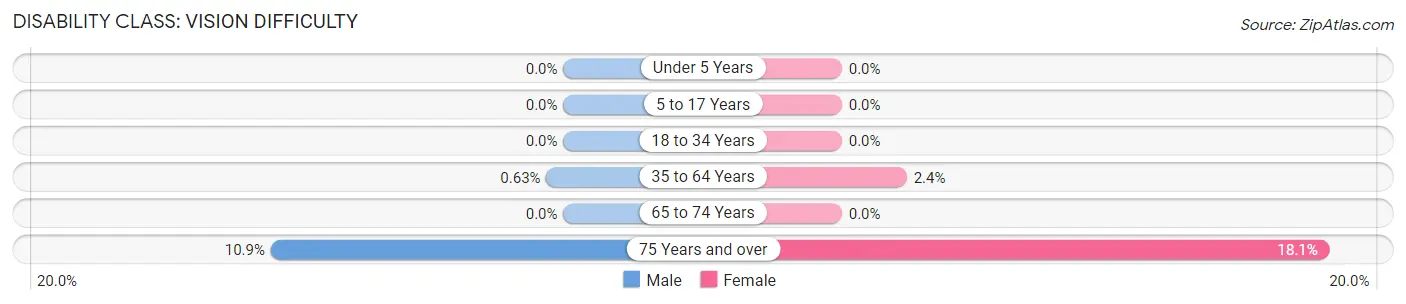
| Age Bracket | Male | Female |
| Under 5 Years | 0 (0.0%) | 0 (0.0%) |
| 5 to 17 Years | 0 (0.0%) | 0 (0.0%) |
| 18 to 34 Years | 0 (0.0%) | 0 (0.0%) |
| 35 to 64 Years | 6 (0.6%) | 28 (2.4%) |
| 65 to 74 Years | 0 (0.0%) | 0 (0.0%) |
| 75 Years and over | 19 (10.9%) | 67 (18.1%) |
Disability Class: Cognitive Difficulty
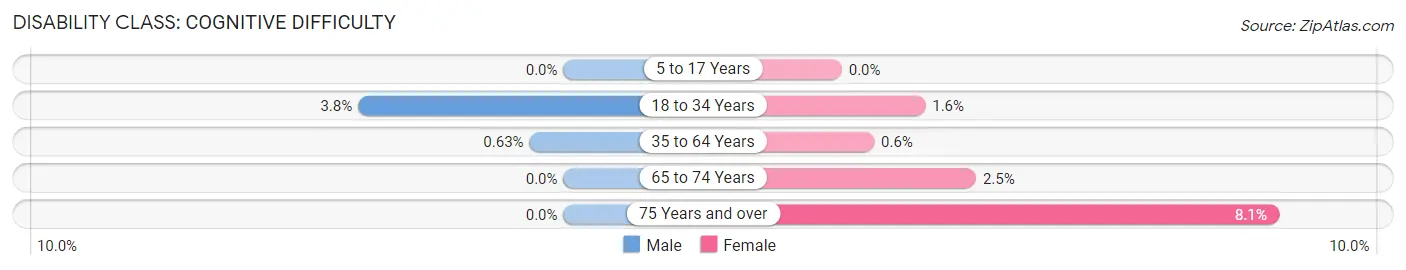
| Age Bracket | Male | Female |
| 5 to 17 Years | 0 (0.0%) | 0 (0.0%) |
| 18 to 34 Years | 15 (3.8%) | 5 (1.5%) |
| 35 to 64 Years | 6 (0.6%) | 7 (0.6%) |
| 65 to 74 Years | 0 (0.0%) | 11 (2.5%) |
| 75 Years and over | 0 (0.0%) | 30 (8.1%) |
Disability Class: Ambulatory Difficulty
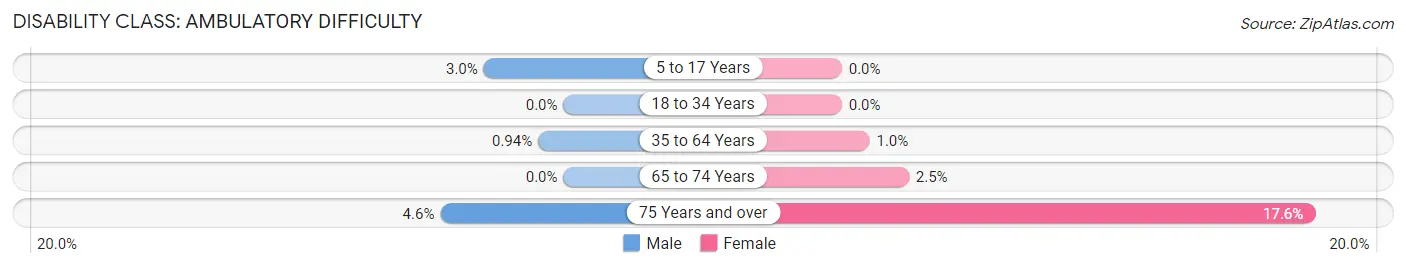
| Age Bracket | Male | Female |
| 5 to 17 Years | 14 (3.0%) | 0 (0.0%) |
| 18 to 34 Years | 0 (0.0%) | 0 (0.0%) |
| 35 to 64 Years | 9 (0.9%) | 12 (1.0%) |
| 65 to 74 Years | 0 (0.0%) | 11 (2.5%) |
| 75 Years and over | 8 (4.6%) | 65 (17.6%) |
Disability Class: Self-Care Difficulty
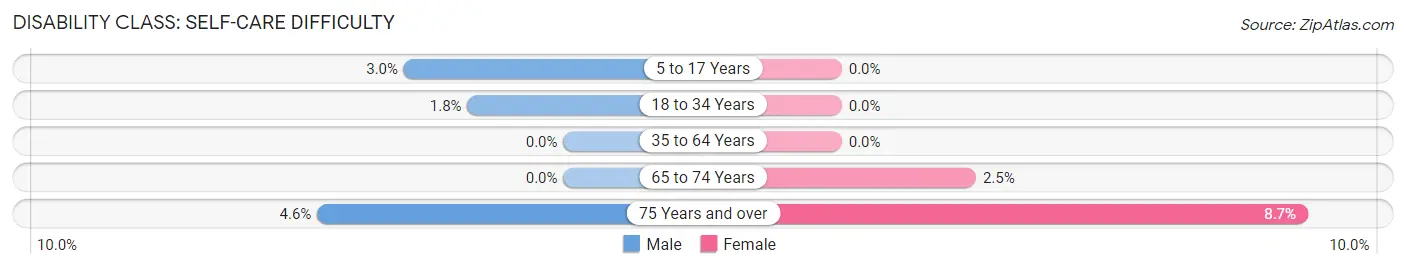
| Age Bracket | Male | Female |
| 5 to 17 Years | 14 (3.0%) | 0 (0.0%) |
| 18 to 34 Years | 7 (1.8%) | 0 (0.0%) |
| 35 to 64 Years | 0 (0.0%) | 0 (0.0%) |
| 65 to 74 Years | 0 (0.0%) | 11 (2.5%) |
| 75 Years and over | 8 (4.6%) | 32 (8.6%) |
Technology Access in Grosse Pointe
Computing Device Access in Grosse Pointe
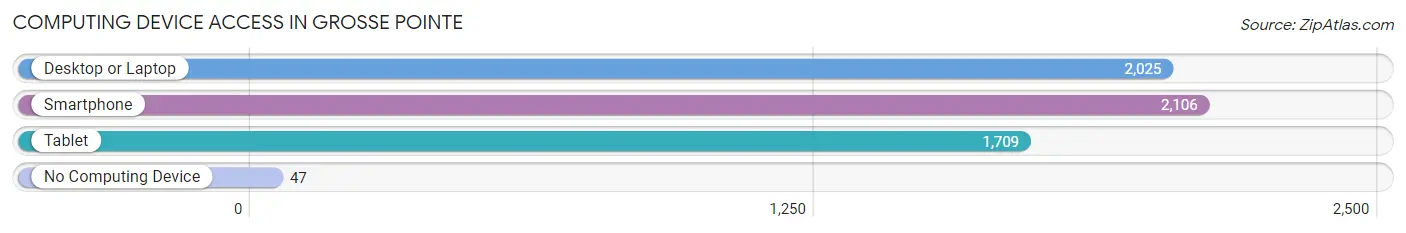
| Device Type | # Households | % Households |
| Desktop or Laptop | 2,025 | 89.9% |
| Smartphone | 2,106 | 93.5% |
| Tablet | 1,709 | 75.9% |
| No Computing Device | 47 | 2.1% |
| Total | 2,252 | 100.0% |
Internet Access in Grosse Pointe
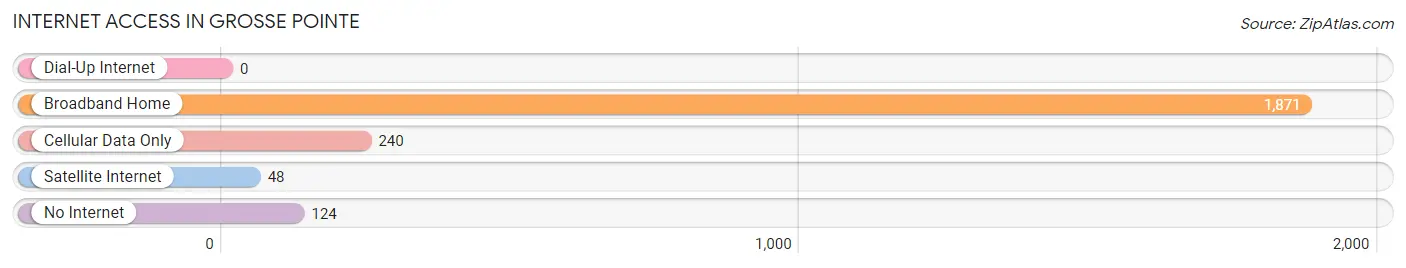
| Internet Type | # Households | % Households |
| Dial-Up Internet | 0 | 0.0% |
| Broadband Home | 1,871 | 83.1% |
| Cellular Data Only | 240 | 10.7% |
| Satellite Internet | 48 | 2.1% |
| No Internet | 124 | 5.5% |
| Total | 2,252 | 100.0% |
Grosse Pointe Summary
Grosse Pointe is a small city located in Wayne County, Michigan. It is situated on the shores of Lake St. Clair, just east of Detroit. The city is known for its affluent neighborhoods, excellent schools, and beautiful parks. Grosse Pointe has a population of 5,421 as of the 2010 census, and is part of the larger Grosse Pointe-Harper Woods Metropolitan Statistical Area.
History
Grosse Pointe was first settled in the early 19th century by French-Canadian fur traders. The area was originally known as “La Grande Pointe”, and was part of the larger Macomb County. In 1818, the area was divided into two townships, Grosse Pointe and Macomb. In 1873, Grosse Pointe was incorporated as a village, and in 1893 it was incorporated as a city.
The city experienced rapid growth in the early 20th century, as wealthy Detroiters moved to the area to escape the city’s industrial pollution. The city was also home to several prominent figures, including Henry Ford, who built a summer home in Grosse Pointe in 1915.
Geography
Grosse Pointe is located in southeastern Michigan, on the shores of Lake St. Clair. The city is bordered by Detroit to the west, Harper Woods to the north, and St. Clair Shores to the east. The city covers an area of 4.2 square miles, and has a population density of 1,279 people per square mile.
The city is divided into five distinct neighborhoods: Grosse Pointe Park, Grosse Pointe Farms, Grosse Pointe Woods, Grosse Pointe Shores, and Grosse Pointe City. Each neighborhood has its own unique character and charm.
Economy
Grosse Pointe has a strong economy, with a median household income of $90,845. The city is home to several large employers, including Beaumont Health, DTE Energy, and the Grosse Pointe Public School System. The city also has a thriving retail sector, with several upscale shopping centers and boutiques.
Demographics
As of the 2010 census, Grosse Pointe had a population of 5,421. The racial makeup of the city was 92.3% White, 4.2% African American, 0.7% Asian, 0.3% Native American, and 2.5% from other races. The median age of the population was 44.7 years.
Grosse Pointe is a highly educated city, with over 90% of the population having a high school diploma or higher. The city also has a high rate of homeownership, with over 80% of the population owning their own homes.
Conclusion
Grosse Pointe is a small city located in Wayne County, Michigan. It is situated on the shores of Lake St. Clair, just east of Detroit. The city is known for its affluent neighborhoods, excellent schools, and beautiful parks. Grosse Pointe has a strong economy, with a median household income of $90,845, and a highly educated population. The city is also home to several large employers, and has a thriving retail sector. Grosse Pointe is a great place to live, work, and raise a family.
Common Questions
What is Per Capita Income in Grosse Pointe?
Per Capita income in Grosse Pointe is $78,799.
What is the Median Family Income in Grosse Pointe?
Median Family Income in Grosse Pointe is $166,000.
What is the Median Household income in Grosse Pointe?
Median Household Income in Grosse Pointe is $136,094.
What is Income or Wage Gap in Grosse Pointe?
Income or Wage Gap in Grosse Pointe is 53.8%.
Women in Grosse Pointe earn 46.2 cents for every dollar earned by a man.
What is Inequality or Gini Index in Grosse Pointe?
Inequality or Gini Index in Grosse Pointe is 0.50.
What is the Total Population of Grosse Pointe?
Total Population of Grosse Pointe is 5,621.
What is the Total Male Population of Grosse Pointe?
Total Male Population of Grosse Pointe is 2,530.
What is the Total Female Population of Grosse Pointe?
Total Female Population of Grosse Pointe is 3,091.
What is the Ratio of Males per 100 Females in Grosse Pointe?
There are 81.85 Males per 100 Females in Grosse Pointe.
What is the Ratio of Females per 100 Males in Grosse Pointe?
There are 122.17 Females per 100 Males in Grosse Pointe.
What is the Median Population Age in Grosse Pointe?
Median Population Age in Grosse Pointe is 44.1 Years.
What is the Average Family Size in Grosse Pointe
Average Family Size in Grosse Pointe is 3.2 People.
What is the Average Household Size in Grosse Pointe
Average Household Size in Grosse Pointe is 2.5 People.
How Large is the Labor Force in Grosse Pointe?
There are 2,727 People in the Labor Forcein in Grosse Pointe.
What is the Percentage of People in the Labor Force in Grosse Pointe?
64.1% of People are in the Labor Force in Grosse Pointe.
What is the Unemployment Rate in Grosse Pointe?
Unemployment Rate in Grosse Pointe is 4.0%.