Brecksville, OH Map & Demographics
Brecksville Map
Brecksville Overview
$62,031
PER CAPITA INCOME
$137,443
AVG FAMILY INCOME
$122,546
AVG HOUSEHOLD INCOME
26.7%
WAGE / INCOME GAP [ % ]
73.3¢/ $1
WAGE / INCOME GAP [ $ ]
$7,858
FAMILY INCOME DEFICIT
0.40
INEQUALITY / GINI INDEX
13,618
TOTAL POPULATION
7,069
MALE POPULATION
6,549
FEMALE POPULATION
107.94
MALES / 100 FEMALES
92.64
FEMALES / 100 MALES
50.2
MEDIAN AGE
3.0
AVG FAMILY SIZE
2.4
AVG HOUSEHOLD SIZE
7,396
LABOR FORCE [ PEOPLE ]
65.3%
PERCENT IN LABOR FORCE
6.1%
UNEMPLOYMENT RATE
Brecksville Zip Codes
Income in Brecksville
Income Overview in Brecksville
Per Capita Income in Brecksville is $62,031, while median incomes of families and households are $137,443 and $122,546 respectively.
| Characteristic | Number | Measure |
| Per Capita Income | 13,618 | $62,031 |
| Median Family Income | 3,856 | $137,443 |
| Mean Family Income | 3,856 | $174,757 |
| Median Household Income | 5,574 | $122,546 |
| Mean Household Income | 5,574 | $150,689 |
| Income Deficit | 3,856 | $7,858 |
| Wage / Income Gap (%) | 13,618 | 26.68% |
| Wage / Income Gap ($) | 13,618 | 73.32¢ per $1 |
| Gini / Inequality Index | 13,618 | 0.40 |
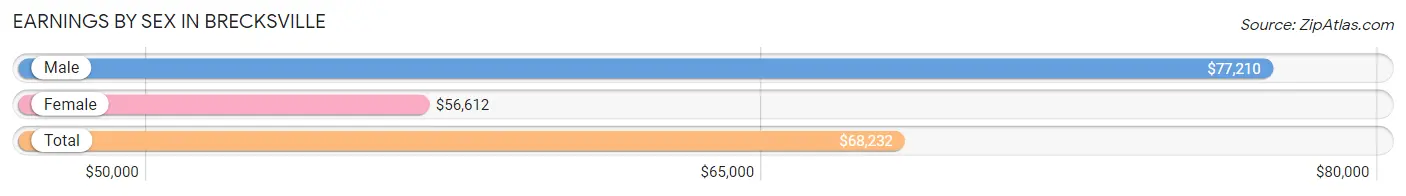
Earnings by Sex in Brecksville
Average Earnings in Brecksville are $68,232, $77,210 for men and $56,612 for women, a difference of 26.7%.
| Sex | Number | Average Earnings |
| Male | 4,243 (56.4%) | $77,210 |
| Female | 3,275 (43.6%) | $56,612 |
| Total | 7,518 (100.0%) | $68,232 |
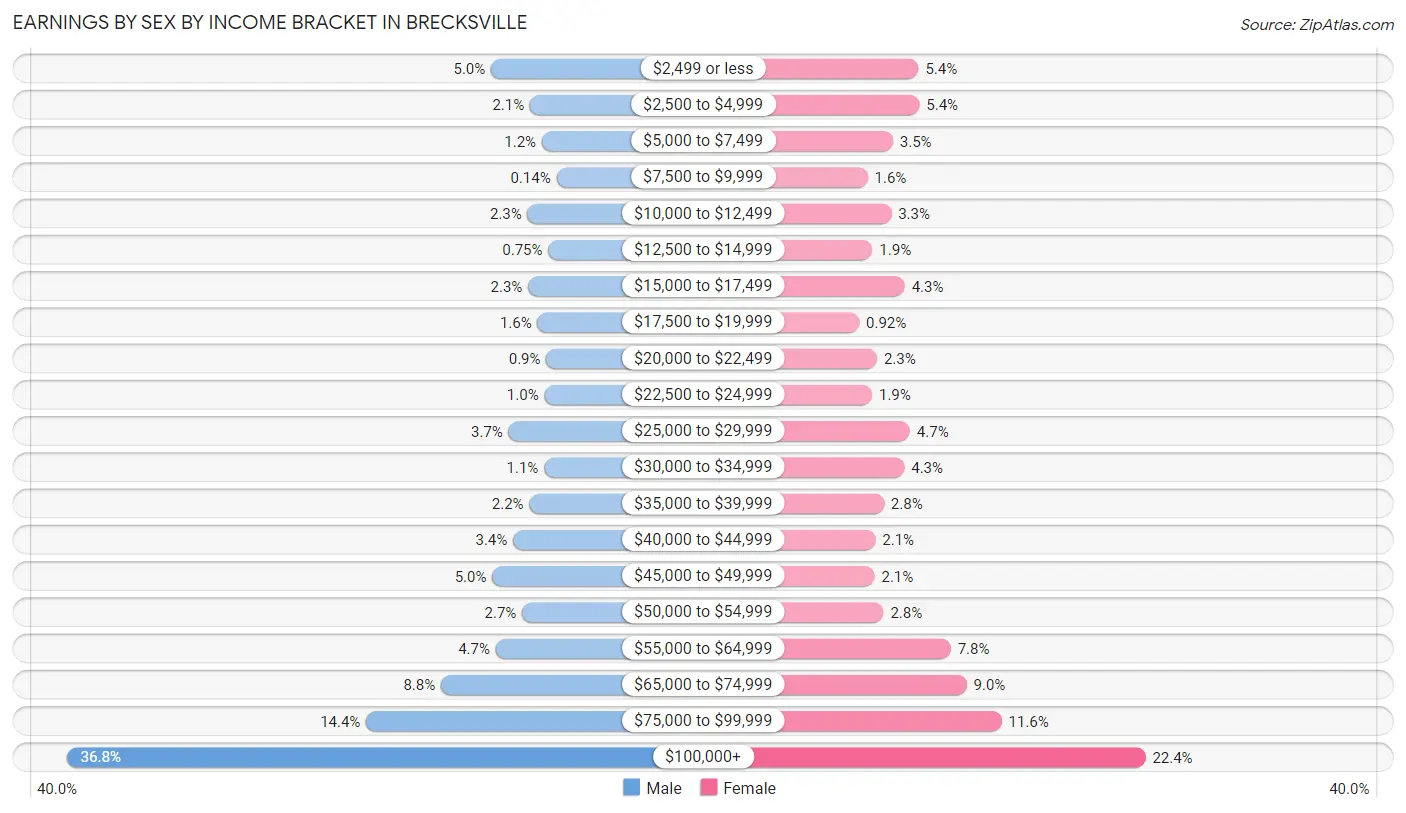
Earnings by Sex by Income Bracket in Brecksville
The most common earnings brackets in Brecksville are $100,000+ for men (1,560 | 36.8%) and $100,000+ for women (733 | 22.4%).
| Income | Male | Female |
| $2,499 or less | 214 (5.0%) | 176 (5.4%) |
| $2,500 to $4,999 | 90 (2.1%) | 178 (5.4%) |
| $5,000 to $7,499 | 52 (1.2%) | 113 (3.5%) |
| $7,500 to $9,999 | 6 (0.1%) | 51 (1.6%) |
| $10,000 to $12,499 | 98 (2.3%) | 109 (3.3%) |
| $12,500 to $14,999 | 32 (0.7%) | 63 (1.9%) |
| $15,000 to $17,499 | 96 (2.3%) | 142 (4.3%) |
| $17,500 to $19,999 | 66 (1.6%) | 30 (0.9%) |
| $20,000 to $22,499 | 38 (0.9%) | 74 (2.3%) |
| $22,500 to $24,999 | 44 (1.0%) | 62 (1.9%) |
| $25,000 to $29,999 | 158 (3.7%) | 155 (4.7%) |
| $30,000 to $34,999 | 45 (1.1%) | 141 (4.3%) |
| $35,000 to $39,999 | 92 (2.2%) | 91 (2.8%) |
| $40,000 to $44,999 | 144 (3.4%) | 70 (2.1%) |
| $45,000 to $49,999 | 210 (5.0%) | 68 (2.1%) |
| $50,000 to $54,999 | 115 (2.7%) | 90 (2.8%) |
| $55,000 to $64,999 | 199 (4.7%) | 255 (7.8%) |
| $65,000 to $74,999 | 373 (8.8%) | 294 (9.0%) |
| $75,000 to $99,999 | 611 (14.4%) | 380 (11.6%) |
| $100,000+ | 1,560 (36.8%) | 733 (22.4%) |
| Total | 4,243 (100.0%) | 3,275 (100.0%) |
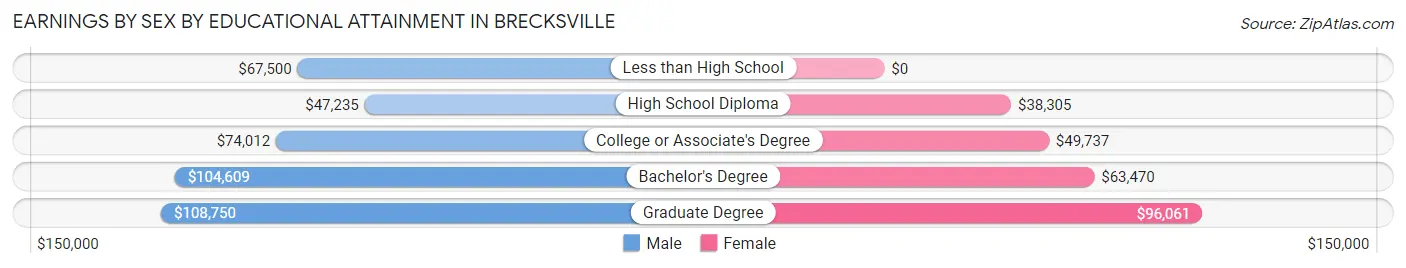
Earnings by Sex by Educational Attainment in Brecksville
Average earnings in Brecksville are $88,100 for men and $64,505 for women, a difference of 26.8%. Men with an educational attainment of graduate degree enjoy the highest average annual earnings of $108,750, while those with high school diploma education earn the least with $47,235. Women with an educational attainment of graduate degree earn the most with the average annual earnings of $96,061, while those with high school diploma education have the smallest earnings of $38,305.
| Educational Attainment | Male Income | Female Income |
| Less than High School | $67,500 | $0 |
| High School Diploma | $47,235 | $38,305 |
| College or Associate's Degree | $74,012 | $49,737 |
| Bachelor's Degree | $104,609 | $63,470 |
| Graduate Degree | $108,750 | $96,061 |
| Total | $88,100 | $64,505 |
Family Income in Brecksville
Family Income Brackets in Brecksville
According to the Brecksville family income data, there are 1,161 families falling into the $200,000+ income range, which is the most common income bracket and makes up 30.1% of all families.
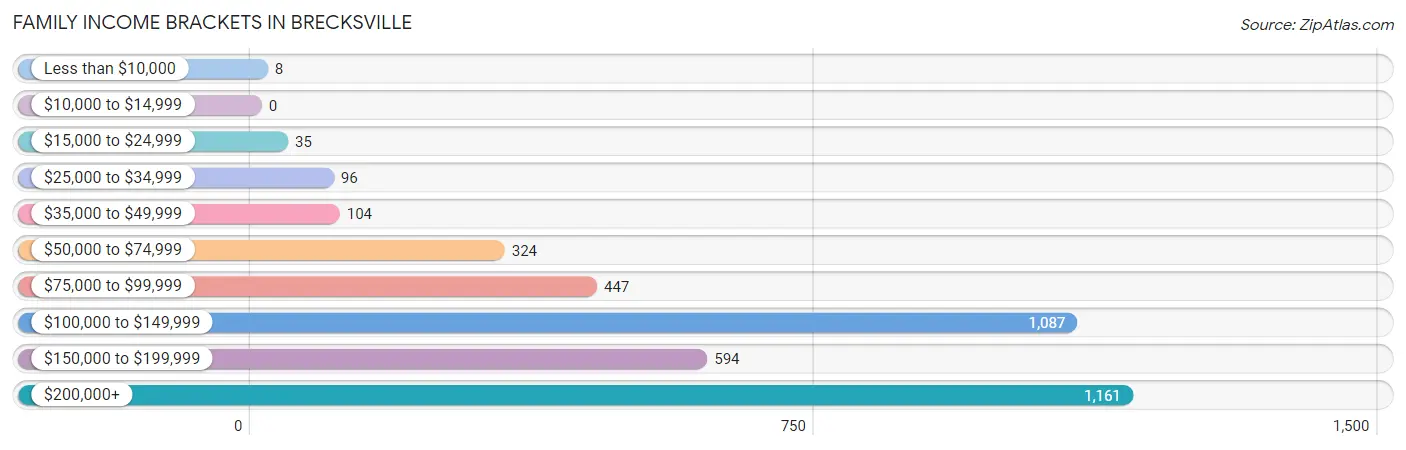
| Income Bracket | # Families | % Families |
| Less than $10,000 | 8 | 0.2% |
| $10,000 to $14,999 | 0 | 0.0% |
| $15,000 to $24,999 | 35 | 0.9% |
| $25,000 to $34,999 | 96 | 2.5% |
| $35,000 to $49,999 | 104 | 2.7% |
| $50,000 to $74,999 | 324 | 8.4% |
| $75,000 to $99,999 | 447 | 11.6% |
| $100,000 to $149,999 | 1,087 | 28.2% |
| $150,000 to $199,999 | 594 | 15.4% |
| $200,000+ | 1,161 | 30.1% |
Family Income by Famaliy Size in Brecksville
7+ person families (43 | 1.1%) account for the highest median family income in Brecksville with $250,001 per family, while 2-person families (1,997 | 51.8%) have the highest median income of $61,890 per family member.
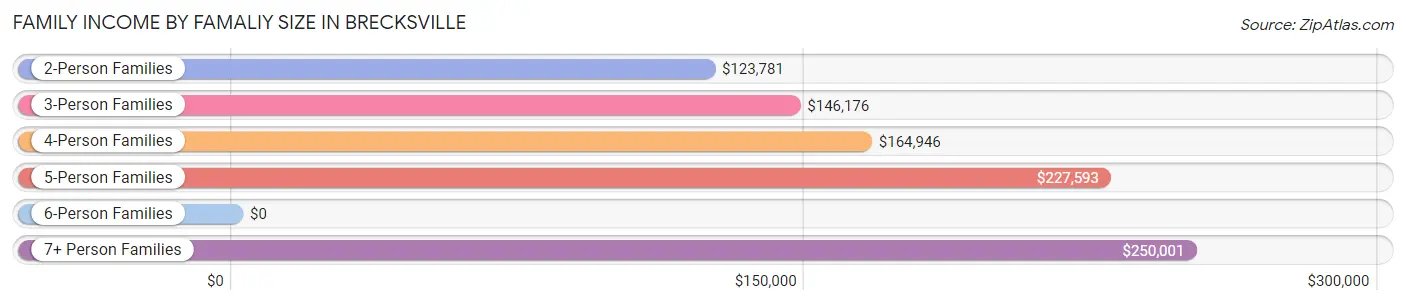
| Income Bracket | # Families | Median Income |
| 2-Person Families | 1,997 (51.8%) | $123,781 |
| 3-Person Families | 770 (20.0%) | $146,176 |
| 4-Person Families | 697 (18.1%) | $164,946 |
| 5-Person Families | 316 (8.2%) | $227,593 |
| 6-Person Families | 33 (0.9%) | $0 |
| 7+ Person Families | 43 (1.1%) | $250,001 |
| Total | 3,856 (100.0%) | $137,443 |
Family Income by Number of Earners in Brecksville
The median family income in Brecksville is $137,443, with families comprising 3+ earners (435) having the highest median family income of $184,712, while families with no earners (549) have the lowest median family income of $92,083, accounting for 11.3% and 14.2% of families, respectively.
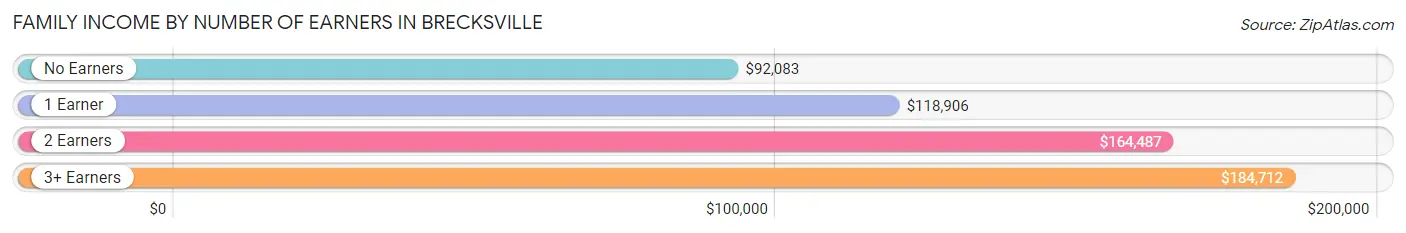
| Number of Earners | # Families | Median Income |
| No Earners | 549 (14.2%) | $92,083 |
| 1 Earner | 1,018 (26.4%) | $118,906 |
| 2 Earners | 1,854 (48.1%) | $164,487 |
| 3+ Earners | 435 (11.3%) | $184,712 |
| Total | 3,856 (100.0%) | $137,443 |
Household Income in Brecksville
Household Income Brackets in Brecksville
With 1,315 households falling in the category, the $200,000+ income range is the most frequent in Brecksville, accounting for 23.6% of all households. In contrast, only 50 households (0.9%) fall into the $10,000 to $14,999 income bracket, making it the least populous group.
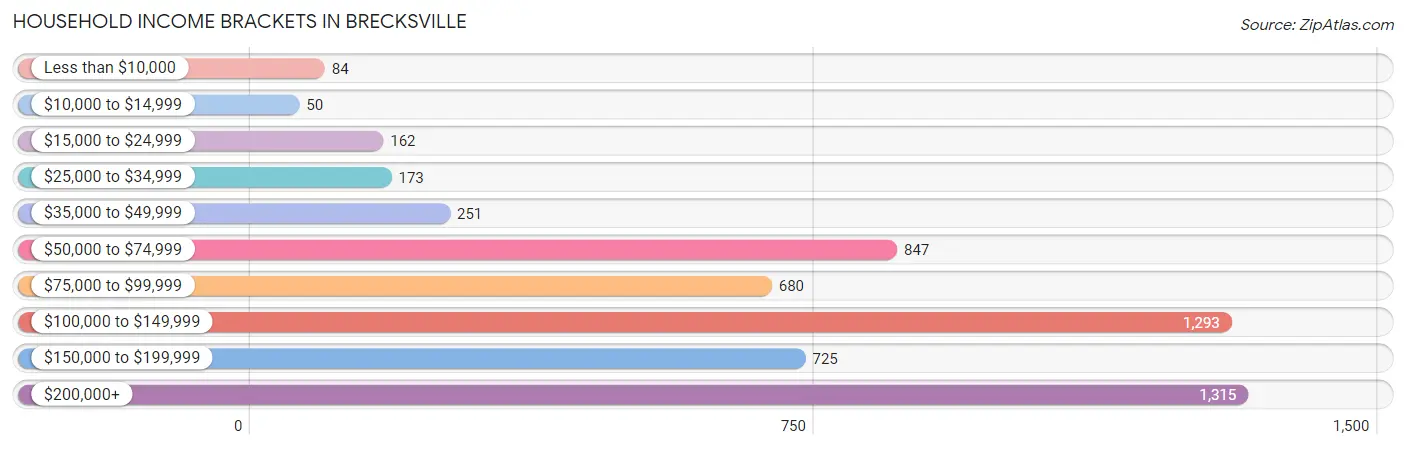
| Income Bracket | # Households | % Households |
| Less than $10,000 | 84 | 1.5% |
| $10,000 to $14,999 | 50 | 0.9% |
| $15,000 to $24,999 | 162 | 2.9% |
| $25,000 to $34,999 | 173 | 3.1% |
| $35,000 to $49,999 | 251 | 4.5% |
| $50,000 to $74,999 | 847 | 15.2% |
| $75,000 to $99,999 | 680 | 12.2% |
| $100,000 to $149,999 | 1,293 | 23.2% |
| $150,000 to $199,999 | 725 | 13.0% |
| $200,000+ | 1,315 | 23.6% |
Household Income by Householder Age in Brecksville
The median household income in Brecksville is $122,546, with the highest median household income of $145,938 found in the 25 to 44 years age bracket for the primary householder. A total of 1,178 households (21.1%) fall into this category. Meanwhile, the 15 to 24 years age bracket for the primary householder has the lowest median household income of $28,125, with 93 households (1.7%) in this group.
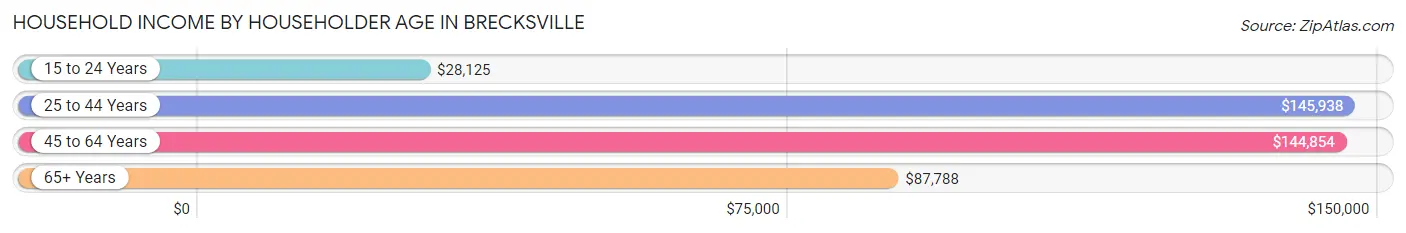
| Income Bracket | # Households | Median Income |
| 15 to 24 Years | 93 (1.7%) | $28,125 |
| 25 to 44 Years | 1,178 (21.1%) | $145,938 |
| 45 to 64 Years | 2,321 (41.6%) | $144,854 |
| 65+ Years | 1,982 (35.6%) | $87,788 |
| Total | 5,574 (100.0%) | $122,546 |
Poverty in Brecksville
Income Below Poverty by Sex and Age in Brecksville
With 1.6% poverty level for males and 4.3% for females among the residents of Brecksville, 25 to 34 year old males and 45 to 54 year old females are the most vulnerable to poverty, with 38 males (6.5%) and 140 females (14.7%) in their respective age groups living below the poverty level.
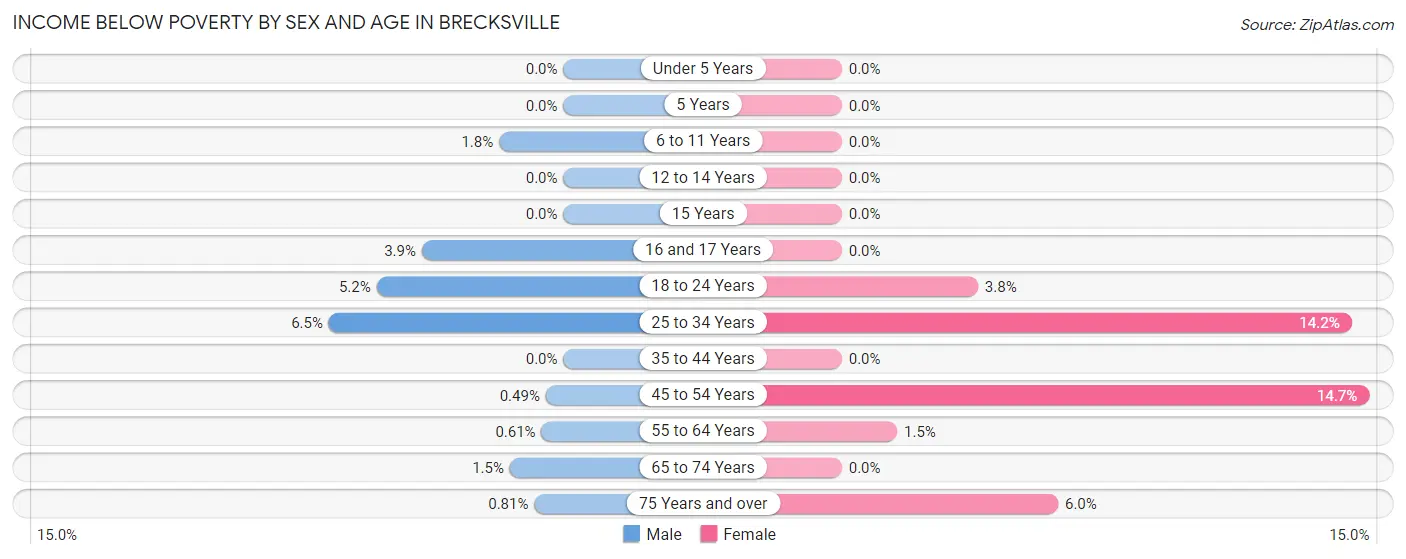
| Age Bracket | Male | Female |
| Under 5 Years | 0 (0.0%) | 0 (0.0%) |
| 5 Years | 0 (0.0%) | 0 (0.0%) |
| 6 to 11 Years | 7 (1.8%) | 0 (0.0%) |
| 12 to 14 Years | 0 (0.0%) | 0 (0.0%) |
| 15 Years | 0 (0.0%) | 0 (0.0%) |
| 16 and 17 Years | 10 (3.9%) | 0 (0.0%) |
| 18 to 24 Years | 25 (5.2%) | 16 (3.8%) |
| 25 to 34 Years | 38 (6.5%) | 61 (14.2%) |
| 35 to 44 Years | 0 (0.0%) | 0 (0.0%) |
| 45 to 54 Years | 4 (0.5%) | 140 (14.7%) |
| 55 to 64 Years | 8 (0.6%) | 17 (1.5%) |
| 65 to 74 Years | 16 (1.5%) | 0 (0.0%) |
| 75 Years and over | 4 (0.8%) | 45 (6.0%) |
| Total | 112 (1.6%) | 279 (4.3%) |
Income Above Poverty by Sex and Age in Brecksville
According to the poverty statistics in Brecksville, males aged under 5 years and females aged under 5 years are the age groups that are most secure financially, with 100.0% of males and 100.0% of females in these age groups living above the poverty line.
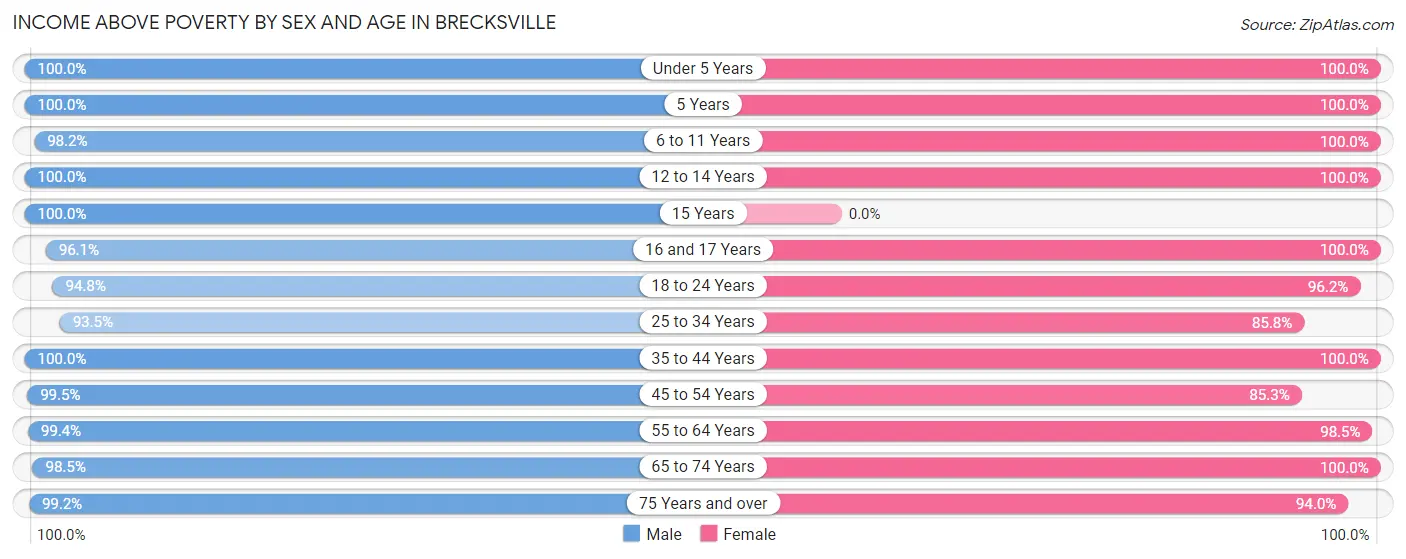
| Age Bracket | Male | Female |
| Under 5 Years | 480 (100.0%) | 414 (100.0%) |
| 5 Years | 48 (100.0%) | 138 (100.0%) |
| 6 to 11 Years | 385 (98.2%) | 385 (100.0%) |
| 12 to 14 Years | 208 (100.0%) | 171 (100.0%) |
| 15 Years | 56 (100.0%) | 0 (0.0%) |
| 16 and 17 Years | 244 (96.1%) | 71 (100.0%) |
| 18 to 24 Years | 456 (94.8%) | 406 (96.2%) |
| 25 to 34 Years | 544 (93.5%) | 369 (85.8%) |
| 35 to 44 Years | 723 (100.0%) | 762 (100.0%) |
| 45 to 54 Years | 815 (99.5%) | 814 (85.3%) |
| 55 to 64 Years | 1,309 (99.4%) | 1,089 (98.5%) |
| 65 to 74 Years | 1,059 (98.5%) | 933 (100.0%) |
| 75 Years and over | 491 (99.2%) | 702 (94.0%) |
| Total | 6,818 (98.4%) | 6,254 (95.7%) |
Income Below Poverty Among Married-Couple Families in Brecksville
The poverty statistics for married-couple families in Brecksville show that 0.7% or 24 of the total 3,411 families live below the poverty line. Families with 1 or 2 children have the highest poverty rate of 1.2%, comprising of 12 families. On the other hand, families with 3 or 4 children have the lowest poverty rate of 0.0%, which includes 0 families.
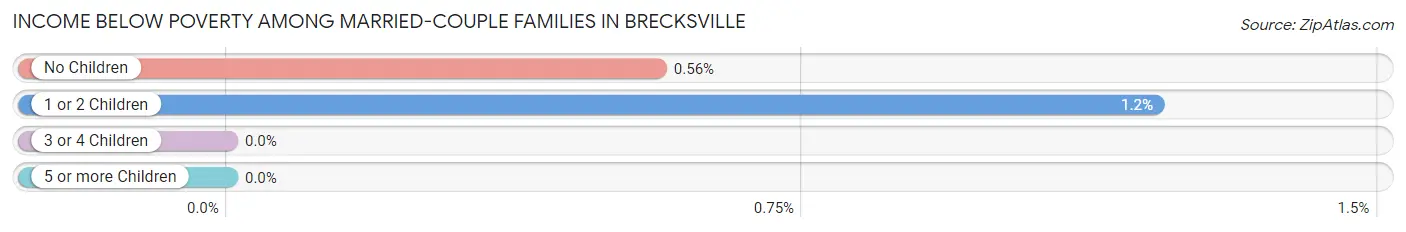
| Children | Above Poverty | Below Poverty |
| No Children | 2,139 (99.4%) | 12 (0.6%) |
| 1 or 2 Children | 979 (98.8%) | 12 (1.2%) |
| 3 or 4 Children | 248 (100.0%) | 0 (0.0%) |
| 5 or more Children | 21 (100.0%) | 0 (0.0%) |
| Total | 3,387 (99.3%) | 24 (0.7%) |
Income Below Poverty Among Single-Parent Households in Brecksville
| Children | Single Father | Single Mother |
| No Children | 0 (0.0%) | 0 (0.0%) |
| 1 or 2 Children | 0 (0.0%) | 0 (0.0%) |
| 3 or 4 Children | 0 (0.0%) | 0 (0.0%) |
| 5 or more Children | 0 (0.0%) | 0 (0.0%) |
| Total | 0 (0.0%) | 0 (0.0%) |
Income Below Poverty Among Married-Couple vs Single-Parent Households in Brecksville
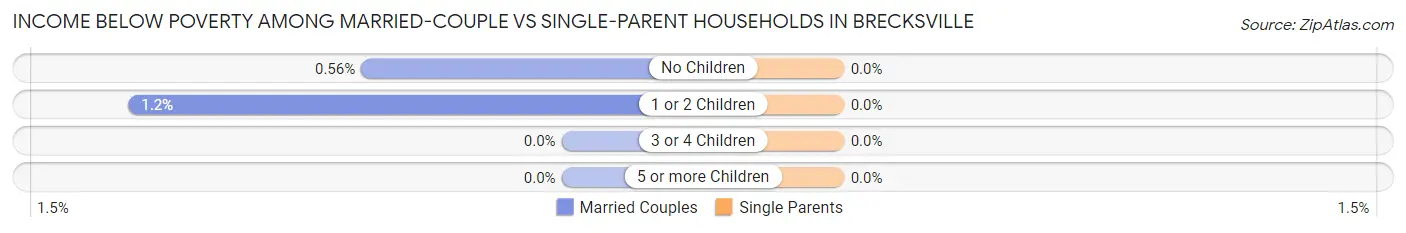
| Children | Married-Couple Families | Single-Parent Households |
| No Children | 12 (0.6%) | 0 (0.0%) |
| 1 or 2 Children | 12 (1.2%) | 0 (0.0%) |
| 3 or 4 Children | 0 (0.0%) | 0 (0.0%) |
| 5 or more Children | 0 (0.0%) | 0 (0.0%) |
| Total | 24 (0.7%) | 0 (0.0%) |
Race in Brecksville
The most populous races in Brecksville are White / Caucasian (12,327 | 90.5%), Asian (688 | 5.1%), and Two or more Races (425 | 3.1%).
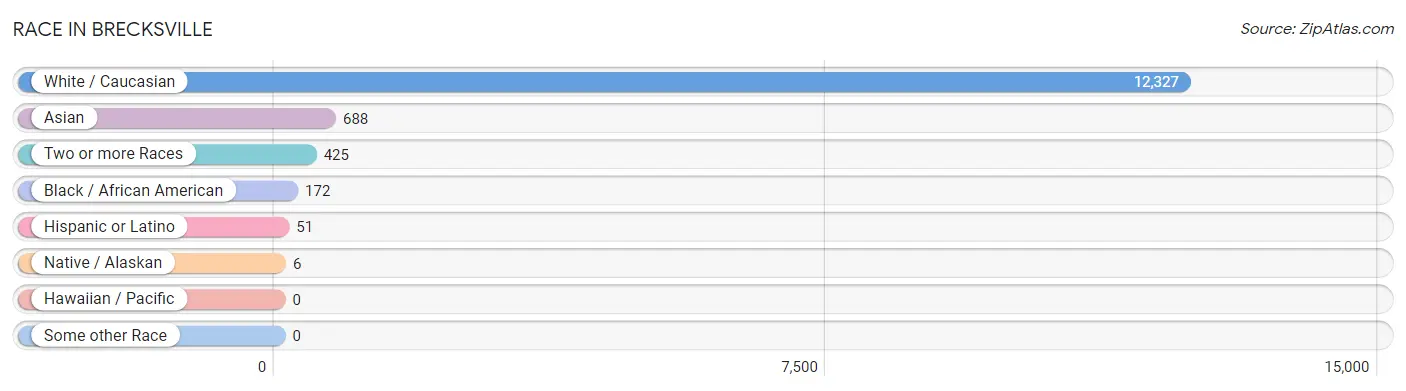
| Race | # Population | % Population |
| Asian | 688 | 5.1% |
| Black / African American | 172 | 1.3% |
| Hawaiian / Pacific | 0 | 0.0% |
| Hispanic or Latino | 51 | 0.4% |
| Native / Alaskan | 6 | 0.0% |
| White / Caucasian | 12,327 | 90.5% |
| Two or more Races | 425 | 3.1% |
| Some other Race | 0 | 0.0% |
| Total | 13,618 | 100.0% |
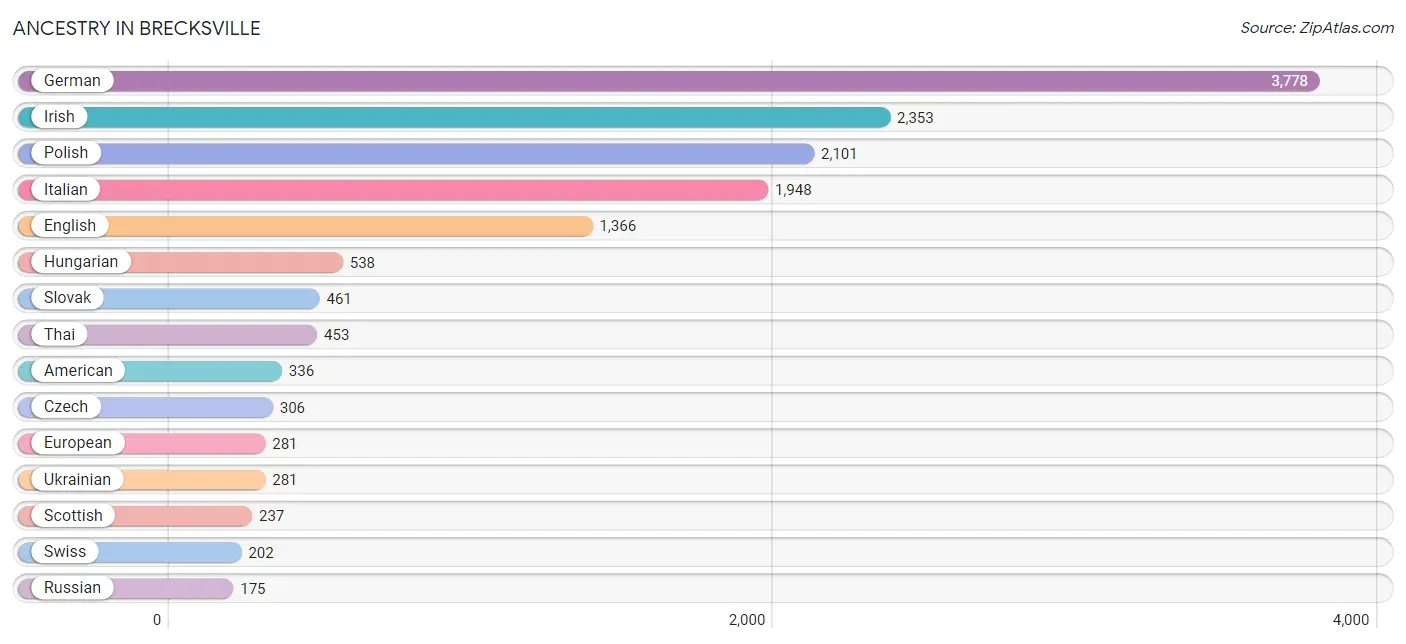
Ancestry in Brecksville
The most populous ancestries reported in Brecksville are German (3,778 | 27.7%), Irish (2,353 | 17.3%), Polish (2,101 | 15.4%), Italian (1,948 | 14.3%), and English (1,366 | 10.0%), together accounting for 84.8% of all Brecksville residents.
| Ancestry | # Population | % Population |
| African | 14 | 0.1% |
| American | 336 | 2.5% |
| Arab | 112 | 0.8% |
| Argentinean | 14 | 0.1% |
| Austrian | 67 | 0.5% |
| Bhutanese | 80 | 0.6% |
| British | 149 | 1.1% |
| Bulgarian | 15 | 0.1% |
| Burmese | 126 | 0.9% |
| Croatian | 82 | 0.6% |
| Czech | 306 | 2.2% |
| Czechoslovakian | 79 | 0.6% |
| Danish | 32 | 0.2% |
| Dutch | 142 | 1.0% |
| Eastern European | 95 | 0.7% |
| English | 1,366 | 10.0% |
| European | 281 | 2.1% |
| Filipino | 26 | 0.2% |
| Finnish | 12 | 0.1% |
| French | 129 | 0.9% |
| French Canadian | 7 | 0.1% |
| German | 3,778 | 27.7% |
| Greek | 106 | 0.8% |
| Hungarian | 538 | 4.0% |
| Indian (Asian) | 58 | 0.4% |
| Irish | 2,353 | 17.3% |
| Italian | 1,948 | 14.3% |
| Japanese | 33 | 0.2% |
| Korean | 141 | 1.0% |
| Latvian | 13 | 0.1% |
| Lebanese | 86 | 0.6% |
| Lithuanian | 43 | 0.3% |
| Macedonian | 10 | 0.1% |
| Mexican | 27 | 0.2% |
| Norwegian | 88 | 0.6% |
| Pakistani | 9 | 0.1% |
| Polish | 2,101 | 15.4% |
| Portuguese | 25 | 0.2% |
| Puerto Rican | 10 | 0.1% |
| Romanian | 19 | 0.1% |
| Russian | 175 | 1.3% |
| Scandinavian | 56 | 0.4% |
| Scotch-Irish | 136 | 1.0% |
| Scottish | 237 | 1.7% |
| Serbian | 158 | 1.2% |
| Slavic | 49 | 0.4% |
| Slovak | 461 | 3.4% |
| Slovene | 155 | 1.1% |
| South American | 14 | 0.1% |
| Subsaharan African | 14 | 0.1% |
| Swedish | 81 | 0.6% |
| Swiss | 202 | 1.5% |
| Syrian | 34 | 0.3% |
| Thai | 453 | 3.3% |
| Tlingit-Haida | 6 | 0.0% |
| Ukrainian | 281 | 2.1% |
| Welsh | 65 | 0.5% |
| Yugoslavian | 43 | 0.3% | View All 58 Rows |
Immigrants in Brecksville
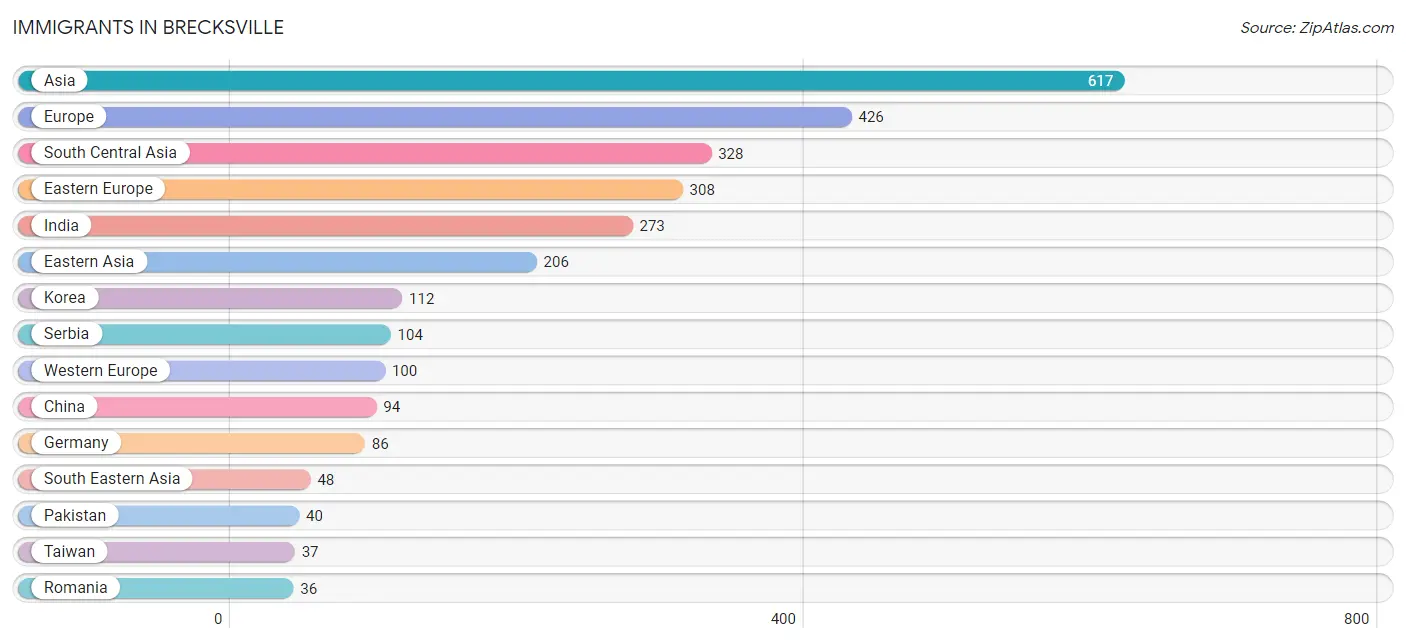
The most numerous immigrant groups reported in Brecksville came from Asia (617 | 4.5%), Europe (426 | 3.1%), South Central Asia (328 | 2.4%), Eastern Europe (308 | 2.3%), and India (273 | 2.0%), together accounting for 14.3% of all Brecksville residents.
| Immigration Origin | # Population | % Population |
| Argentina | 6 | 0.0% |
| Asia | 617 | 4.5% |
| Bosnia and Herzegovina | 16 | 0.1% |
| Bulgaria | 25 | 0.2% |
| Central America | 8 | 0.1% |
| China | 94 | 0.7% |
| Eastern Asia | 206 | 1.5% |
| Eastern Europe | 308 | 2.3% |
| England | 5 | 0.0% |
| Europe | 426 | 3.1% |
| France | 14 | 0.1% |
| Germany | 86 | 0.6% |
| Hungary | 21 | 0.2% |
| India | 273 | 2.0% |
| Indonesia | 32 | 0.2% |
| Korea | 112 | 0.8% |
| Latin America | 14 | 0.1% |
| Latvia | 13 | 0.1% |
| Lebanon | 30 | 0.2% |
| Lithuania | 11 | 0.1% |
| Mexico | 8 | 0.1% |
| Nepal | 15 | 0.1% |
| Northern Europe | 18 | 0.1% |
| Pakistan | 40 | 0.3% |
| Philippines | 16 | 0.1% |
| Poland | 28 | 0.2% |
| Romania | 36 | 0.3% |
| Saudi Arabia | 5 | 0.0% |
| Scotland | 7 | 0.1% |
| Serbia | 104 | 0.8% |
| South America | 6 | 0.0% |
| South Central Asia | 328 | 2.4% |
| South Eastern Asia | 48 | 0.4% |
| Taiwan | 37 | 0.3% |
| Ukraine | 20 | 0.2% |
| Western Asia | 35 | 0.3% |
| Western Europe | 100 | 0.7% | View All 37 Rows |
Sex and Age in Brecksville
Sex and Age in Brecksville
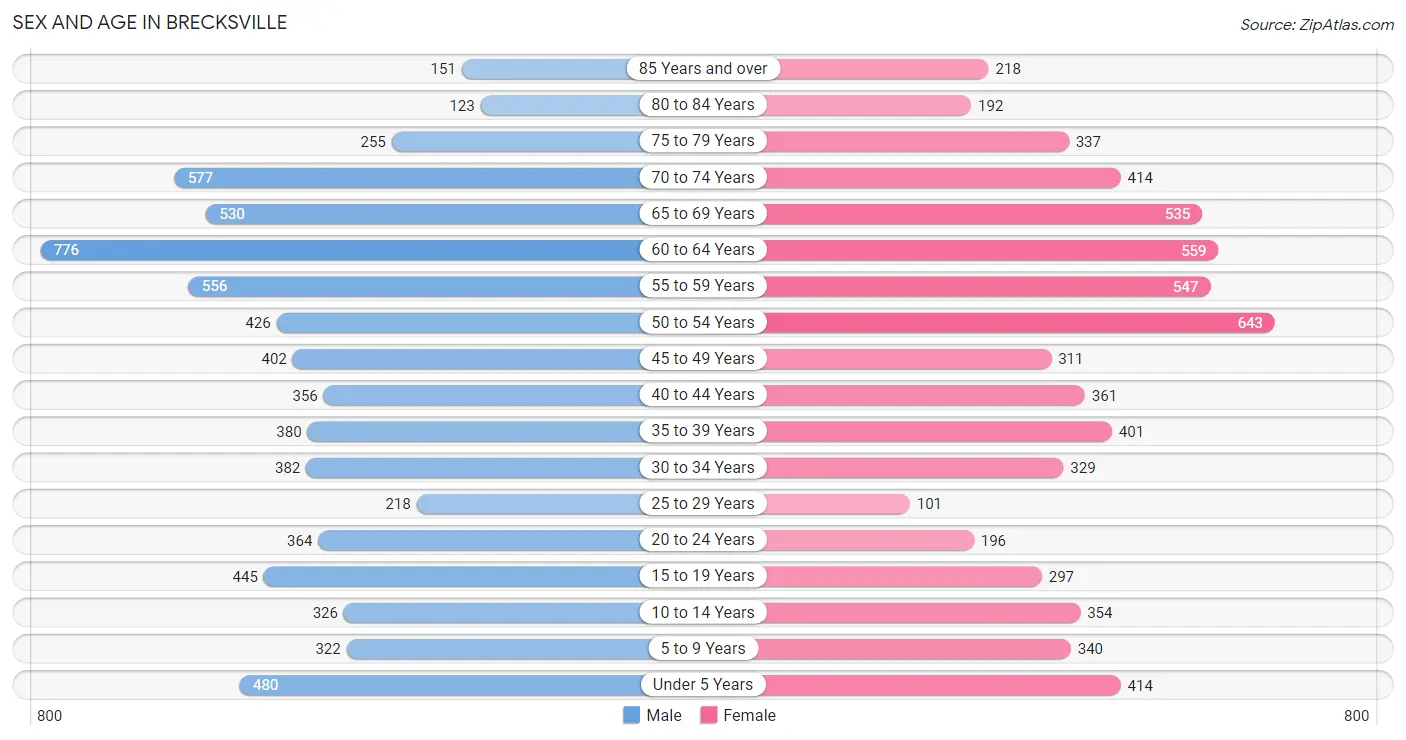
The most populous age groups in Brecksville are 60 to 64 Years (776 | 11.0%) for men and 50 to 54 Years (643 | 9.8%) for women.
| Age Bracket | Male | Female |
| Under 5 Years | 480 (6.8%) | 414 (6.3%) |
| 5 to 9 Years | 322 (4.6%) | 340 (5.2%) |
| 10 to 14 Years | 326 (4.6%) | 354 (5.4%) |
| 15 to 19 Years | 445 (6.3%) | 297 (4.5%) |
| 20 to 24 Years | 364 (5.1%) | 196 (3.0%) |
| 25 to 29 Years | 218 (3.1%) | 101 (1.5%) |
| 30 to 34 Years | 382 (5.4%) | 329 (5.0%) |
| 35 to 39 Years | 380 (5.4%) | 401 (6.1%) |
| 40 to 44 Years | 356 (5.0%) | 361 (5.5%) |
| 45 to 49 Years | 402 (5.7%) | 311 (4.8%) |
| 50 to 54 Years | 426 (6.0%) | 643 (9.8%) |
| 55 to 59 Years | 556 (7.9%) | 547 (8.4%) |
| 60 to 64 Years | 776 (11.0%) | 559 (8.5%) |
| 65 to 69 Years | 530 (7.5%) | 535 (8.2%) |
| 70 to 74 Years | 577 (8.2%) | 414 (6.3%) |
| 75 to 79 Years | 255 (3.6%) | 337 (5.1%) |
| 80 to 84 Years | 123 (1.7%) | 192 (2.9%) |
| 85 Years and over | 151 (2.1%) | 218 (3.3%) |
| Total | 7,069 (100.0%) | 6,549 (100.0%) |
Families and Households in Brecksville
Median Family Size in Brecksville
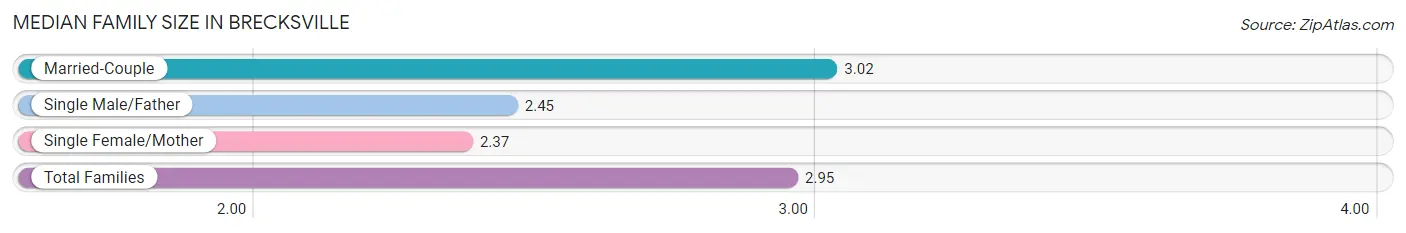
The median family size in Brecksville is 2.95 persons per family, with married-couple families (3,411 | 88.5%) accounting for the largest median family size of 3.02 persons per family. On the other hand, single female/mother families (223 | 5.8%) represent the smallest median family size with 2.37 persons per family.
| Family Type | # Families | Family Size |
| Married-Couple | 3,411 (88.5%) | 3.02 |
| Single Male/Father | 222 (5.8%) | 2.45 |
| Single Female/Mother | 223 (5.8%) | 2.37 |
| Total Families | 3,856 (100.0%) | 2.95 |
Median Household Size in Brecksville
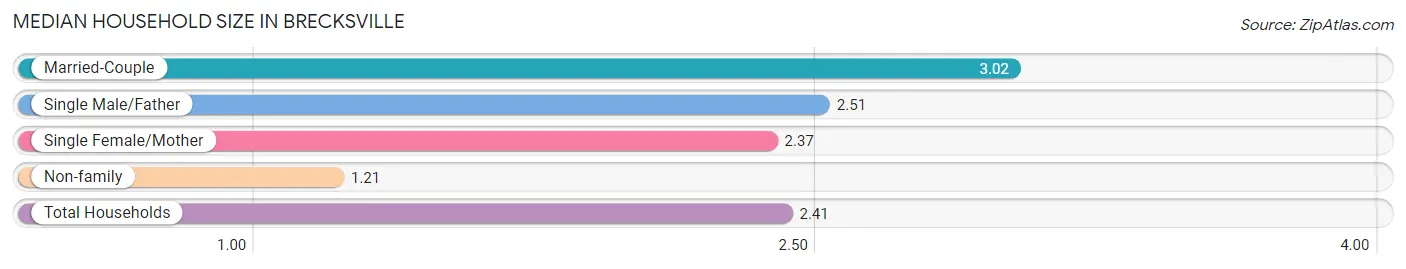
The median household size in Brecksville is 2.41 persons per household, with married-couple households (3,411 | 61.2%) accounting for the largest median household size of 3.02 persons per household. non-family households (1,718 | 30.8%) represent the smallest median household size with 1.21 persons per household.
| Household Type | # Households | Household Size |
| Married-Couple | 3,411 (61.2%) | 3.02 |
| Single Male/Father | 222 (4.0%) | 2.51 |
| Single Female/Mother | 223 (4.0%) | 2.37 |
| Non-family | 1,718 (30.8%) | 1.21 |
| Total Households | 5,574 (100.0%) | 2.41 |
Household Size by Marriage Status in Brecksville
Out of a total of 5,574 households in Brecksville, 3,856 (69.2%) are family households, while 1,718 (30.8%) are nonfamily households. The most numerous type of family households are 2-person households, comprising 1,977, and the most common type of nonfamily households are 1-person households, comprising 1,416.
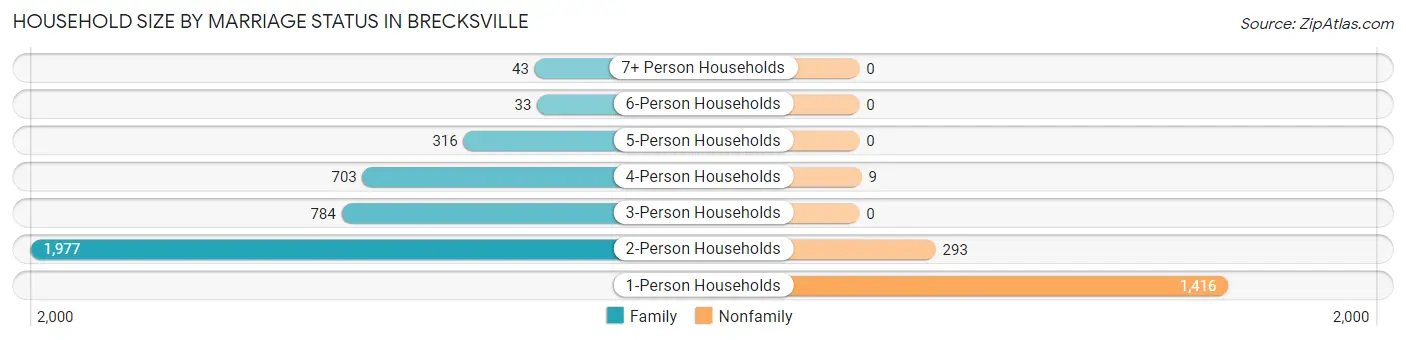
| Household Size | Family Households | Nonfamily Households |
| 1-Person Households | - | 1,416 (25.4%) |
| 2-Person Households | 1,977 (35.5%) | 293 (5.3%) |
| 3-Person Households | 784 (14.1%) | 0 (0.0%) |
| 4-Person Households | 703 (12.6%) | 9 (0.2%) |
| 5-Person Households | 316 (5.7%) | 0 (0.0%) |
| 6-Person Households | 33 (0.6%) | 0 (0.0%) |
| 7+ Person Households | 43 (0.8%) | 0 (0.0%) |
| Total | 3,856 (69.2%) | 1,718 (30.8%) |
Female Fertility in Brecksville
Fertility by Age in Brecksville
Average fertility rate in Brecksville is 67.0 births per 1,000 women. Women in the age bracket of 20 to 34 years have the highest fertility rate with 179.0 births per 1,000 women. Women in the age bracket of 20 to 34 years acount for 80.6% of all women with births.
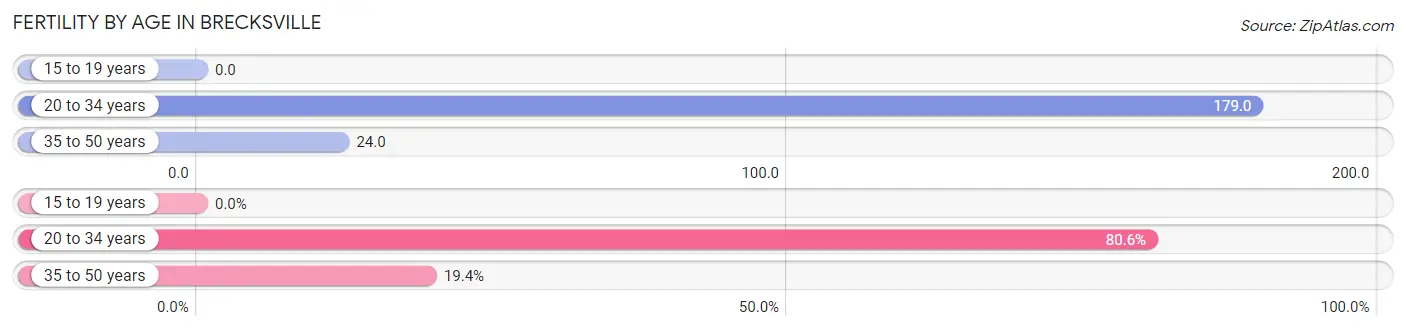
| Age Bracket | Women with Births | Births / 1,000 Women |
| 15 to 19 years | 0 (0.0%) | 0.0 |
| 20 to 34 years | 112 (80.6%) | 179.0 |
| 35 to 50 years | 27 (19.4%) | 24.0 |
| Total | 139 (100.0%) | 67.0 |
Fertility by Age by Marriage Status in Brecksville
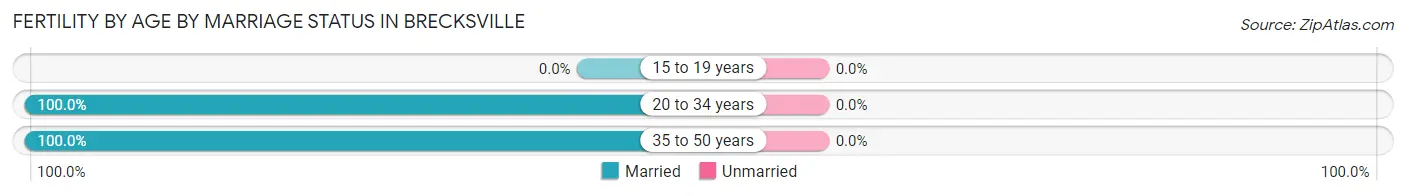
| Age Bracket | Married | Unmarried |
| 15 to 19 years | 0 (0.0%) | 0 (0.0%) |
| 20 to 34 years | 112 (100.0%) | 0 (0.0%) |
| 35 to 50 years | 27 (100.0%) | 0 (0.0%) |
| Total | 139 (100.0%) | 0 (0.0%) |
Fertility by Education in Brecksville
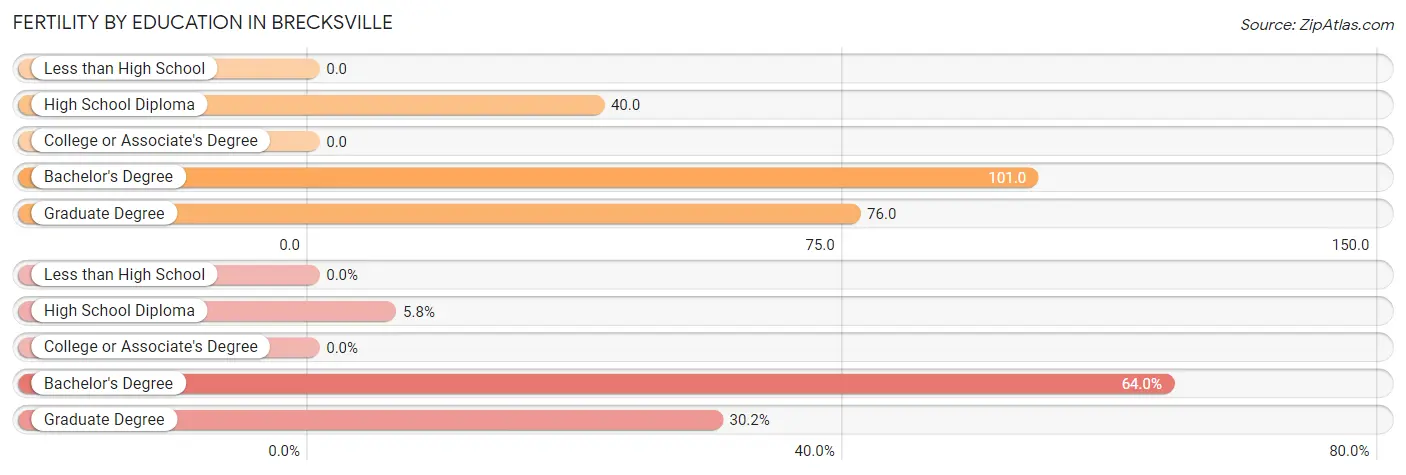
| Educational Attainment | Women with Births | Births / 1,000 Women |
| Less than High School | 0 (0.0%) | 0.0 |
| High School Diploma | 8 (5.8%) | 40.0 |
| College or Associate's Degree | 0 (0.0%) | 0.0 |
| Bachelor's Degree | 89 (64.0%) | 101.0 |
| Graduate Degree | 42 (30.2%) | 76.0 |
| Total | 139 (100.0%) | 67.0 |
Fertility by Education by Marriage Status in Brecksville
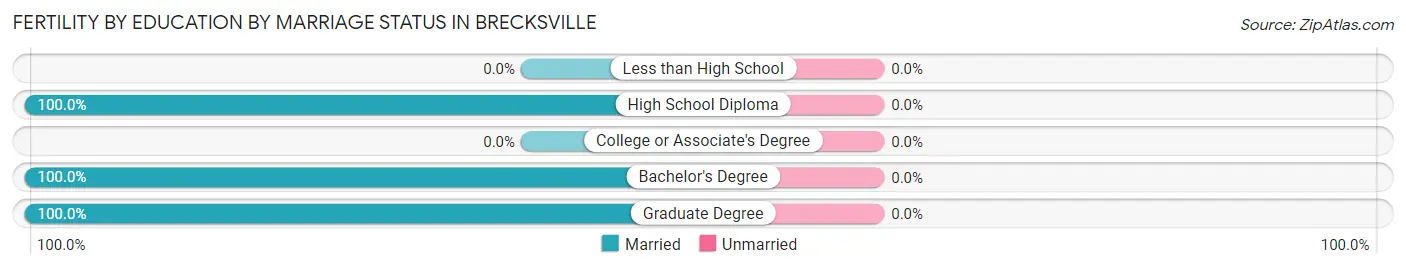
| Educational Attainment | Married | Unmarried |
| Less than High School | 0 (0.0%) | 0 (0.0%) |
| High School Diploma | 8 (100.0%) | 0 (0.0%) |
| College or Associate's Degree | 0 (0.0%) | 0 (0.0%) |
| Bachelor's Degree | 89 (100.0%) | 0 (0.0%) |
| Graduate Degree | 42 (100.0%) | 0 (0.0%) |
| Total | 139 (100.0%) | 0 (0.0%) |
Employment Characteristics in Brecksville
Employment by Class of Employer in Brecksville
Among the 6,748 employed individuals in Brecksville, private company employees (4,132 | 61.2%), not-for-profit organizations (943 | 14.0%), and local government employees (667 | 9.9%) make up the most common classes of employment.
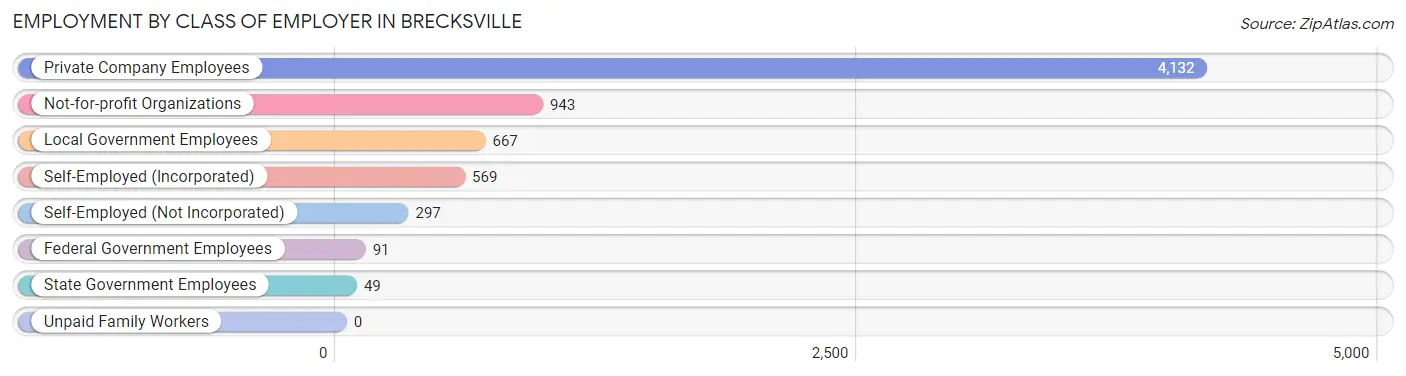
| Employer Class | # Employees | % Employees |
| Private Company Employees | 4,132 | 61.2% |
| Self-Employed (Incorporated) | 569 | 8.4% |
| Self-Employed (Not Incorporated) | 297 | 4.4% |
| Not-for-profit Organizations | 943 | 14.0% |
| Local Government Employees | 667 | 9.9% |
| State Government Employees | 49 | 0.7% |
| Federal Government Employees | 91 | 1.3% |
| Unpaid Family Workers | 0 | 0.0% |
| Total | 6,748 | 100.0% |
Employment Status by Age in Brecksville
According to the labor force statistics for Brecksville, out of the total population over 16 years of age (11,326), 65.3% or 7,396 individuals are in the labor force, with 6.1% or 451 of them unemployed. The age group with the highest labor force participation rate is 35 to 44 years, with 88.7% or 1,329 individuals in the labor force. Within the labor force, the 16 to 19 years age range has the highest percentage of unemployed individuals, with 35.7% or 119 of them being unemployed.
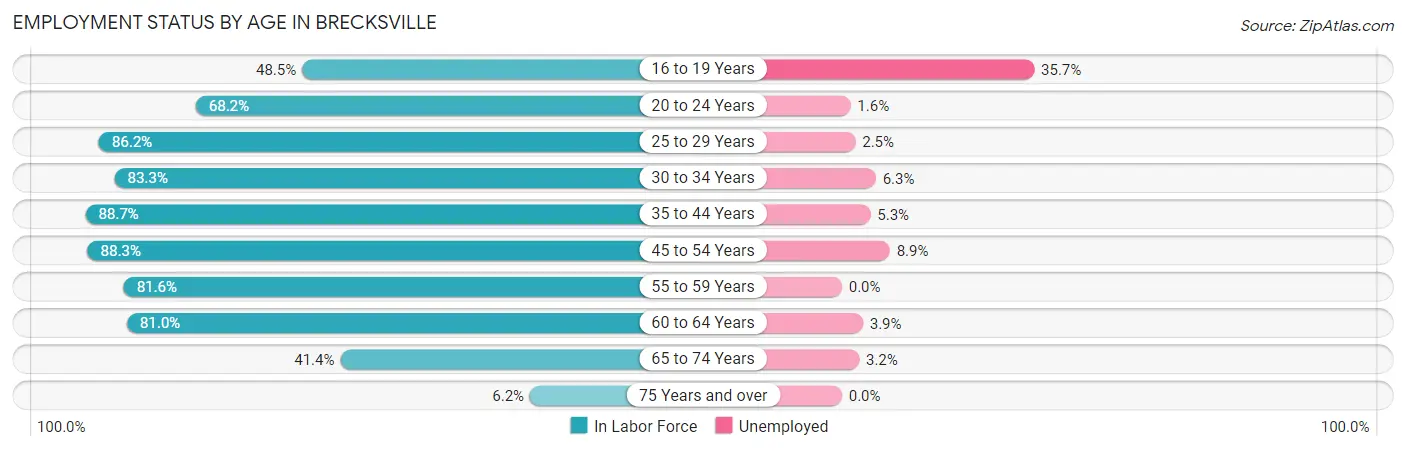
| Age Bracket | In Labor Force | Unemployed |
| 16 to 19 Years | 333 (48.5%) | 119 (35.7%) |
| 20 to 24 Years | 382 (68.2%) | 6 (1.6%) |
| 25 to 29 Years | 275 (86.2%) | 7 (2.5%) |
| 30 to 34 Years | 592 (83.3%) | 37 (6.3%) |
| 35 to 44 Years | 1,329 (88.7%) | 70 (5.3%) |
| 45 to 54 Years | 1,574 (88.3%) | 140 (8.9%) |
| 55 to 59 Years | 900 (81.6%) | 0 (0.0%) |
| 60 to 64 Years | 1,081 (81.0%) | 42 (3.9%) |
| 65 to 74 Years | 851 (41.4%) | 27 (3.2%) |
| 75 Years and over | 79 (6.2%) | 0 (0.0%) |
| Total | 7,396 (65.3%) | 451 (6.1%) |
Employment Status by Educational Attainment in Brecksville
According to labor force statistics for Brecksville, 85.2% of individuals (5,749) out of the total population between 25 and 64 years of age (6,748) are in the labor force, with 5.2% or 299 of them being unemployed. The group with the highest labor force participation rate are those with the educational attainment of bachelor's degree or higher, with 87.6% or 3,926 individuals in the labor force. Within the labor force, individuals with high school diploma education have the highest percentage of unemployment, with 21.8% or 147 of them being unemployed.
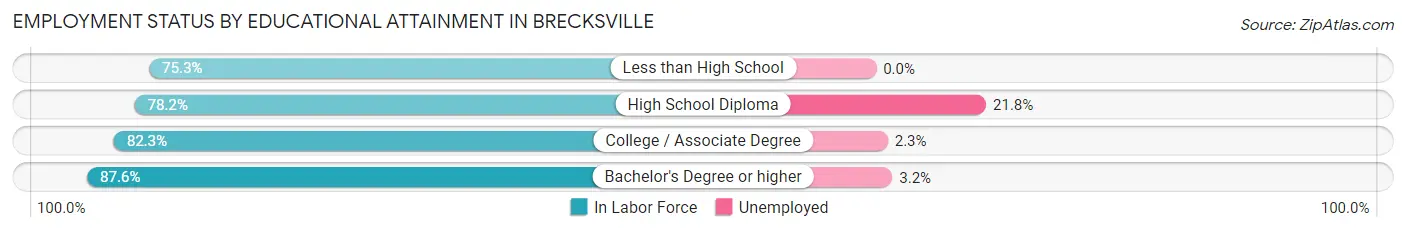
| Educational Attainment | In Labor Force | Unemployed |
| Less than High School | 55 (75.3%) | 0 (0.0%) |
| High School Diploma | 674 (78.2%) | 188 (21.8%) |
| College / Associate Degree | 1,095 (82.3%) | 31 (2.3%) |
| Bachelor's Degree or higher | 3,926 (87.6%) | 143 (3.2%) |
| Total | 5,749 (85.2%) | 351 (5.2%) |
Employment Occupations by Sex in Brecksville
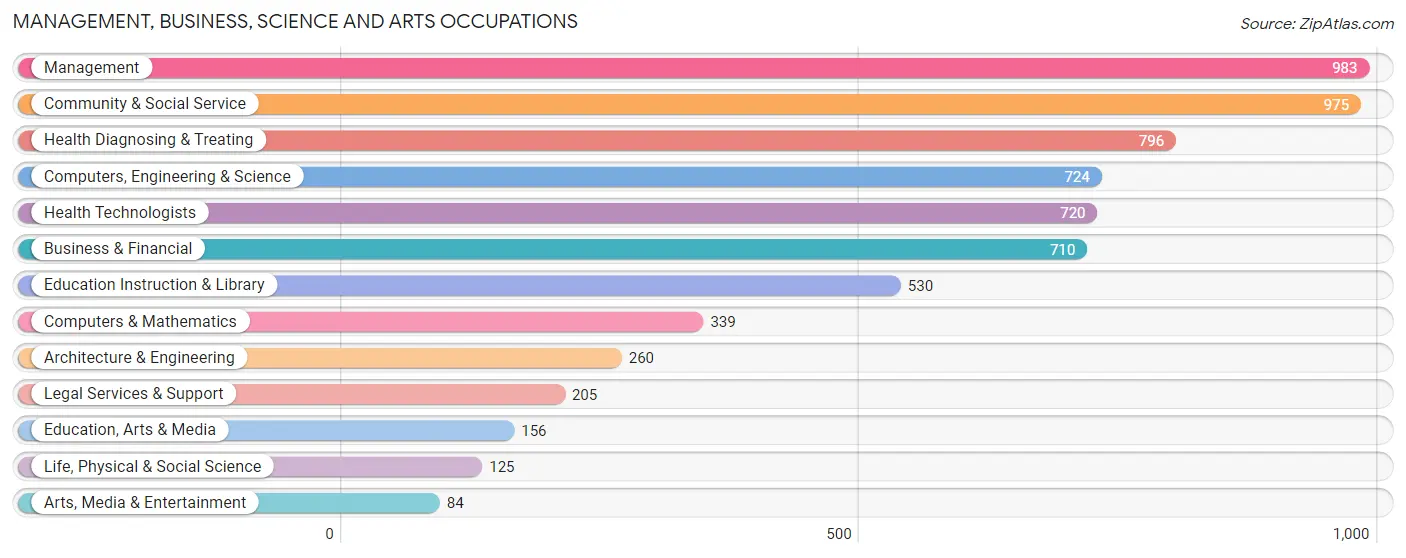
Management, Business, Science and Arts Occupations
The most common Management, Business, Science and Arts occupations in Brecksville are Management (983 | 14.1%), Community & Social Service (975 | 14.0%), Health Diagnosing & Treating (796 | 11.5%), Computers, Engineering & Science (724 | 10.4%), and Health Technologists (720 | 10.4%).
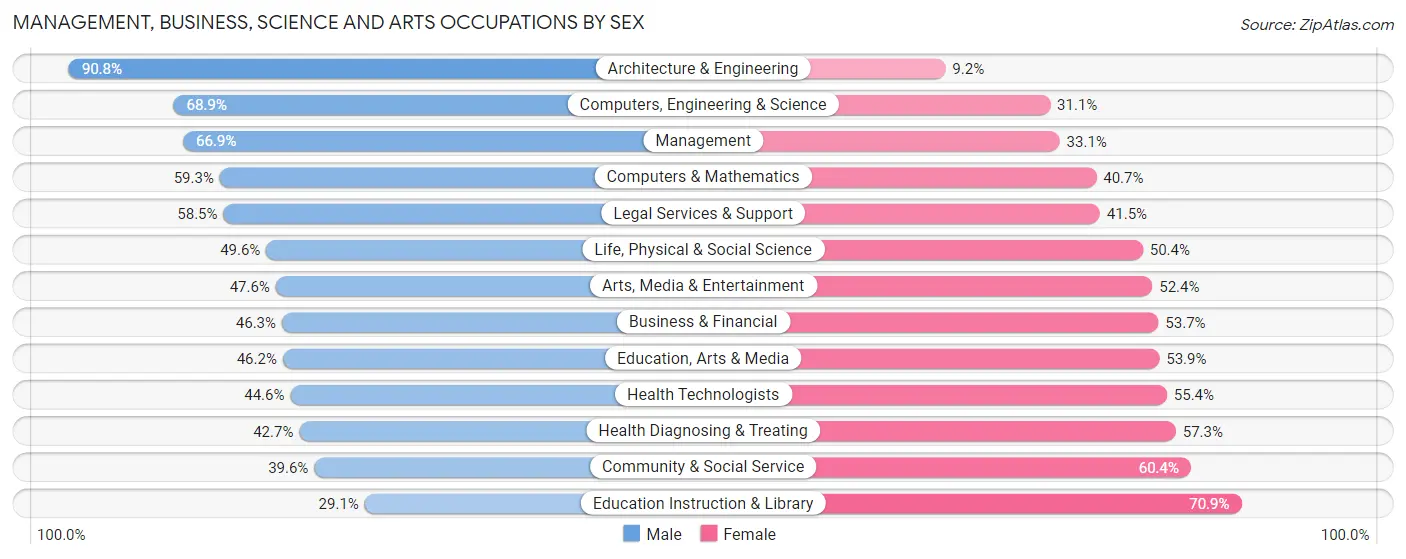
Management, Business, Science and Arts Occupations by Sex
Within the Management, Business, Science and Arts occupations in Brecksville, the most male-oriented occupations are Architecture & Engineering (90.8%), Computers, Engineering & Science (68.9%), and Management (66.9%), while the most female-oriented occupations are Education Instruction & Library (70.9%), Community & Social Service (60.4%), and Health Diagnosing & Treating (57.3%).
| Occupation | Male | Female |
| Management | 658 (66.9%) | 325 (33.1%) |
| Business & Financial | 329 (46.3%) | 381 (53.7%) |
| Computers, Engineering & Science | 499 (68.9%) | 225 (31.1%) |
| Computers & Mathematics | 201 (59.3%) | 138 (40.7%) |
| Architecture & Engineering | 236 (90.8%) | 24 (9.2%) |
| Life, Physical & Social Science | 62 (49.6%) | 63 (50.4%) |
| Community & Social Service | 386 (39.6%) | 589 (60.4%) |
| Education, Arts & Media | 72 (46.2%) | 84 (53.8%) |
| Legal Services & Support | 120 (58.5%) | 85 (41.5%) |
| Education Instruction & Library | 154 (29.1%) | 376 (70.9%) |
| Arts, Media & Entertainment | 40 (47.6%) | 44 (52.4%) |
| Health Diagnosing & Treating | 340 (42.7%) | 456 (57.3%) |
| Health Technologists | 321 (44.6%) | 399 (55.4%) |
| Total (Category) | 2,212 (52.8%) | 1,976 (47.2%) |
| Total (Overall) | 3,953 (56.9%) | 2,995 (43.1%) |
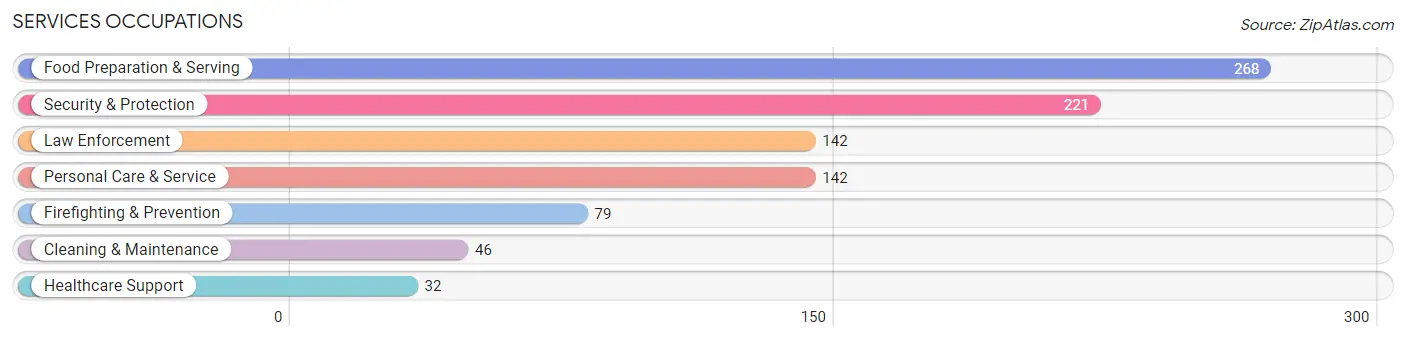
Services Occupations
The most common Services occupations in Brecksville are Food Preparation & Serving (268 | 3.9%), Security & Protection (221 | 3.2%), Law Enforcement (142 | 2.0%), Personal Care & Service (142 | 2.0%), and Firefighting & Prevention (79 | 1.1%).
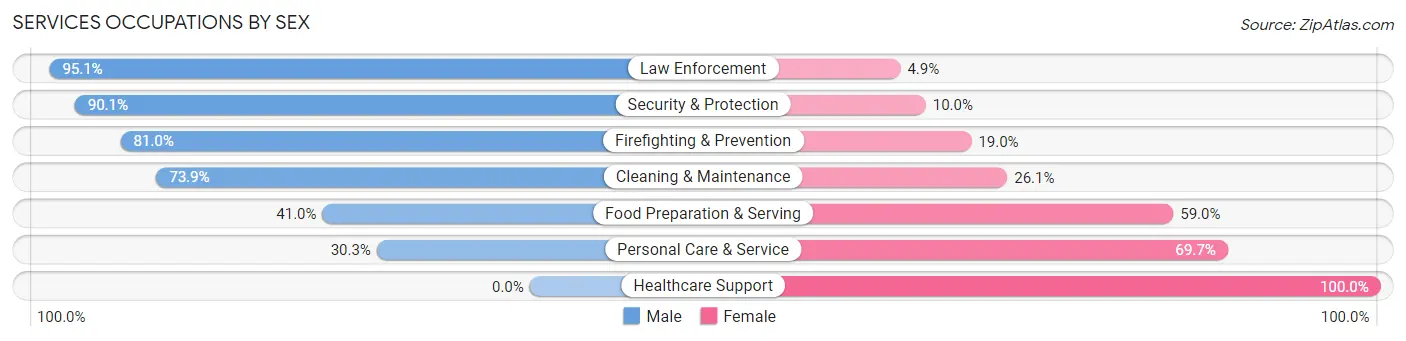
Services Occupations by Sex
Within the Services occupations in Brecksville, the most male-oriented occupations are Law Enforcement (95.1%), Security & Protection (90.0%), and Firefighting & Prevention (81.0%), while the most female-oriented occupations are Healthcare Support (100.0%), Personal Care & Service (69.7%), and Food Preparation & Serving (59.0%).
| Occupation | Male | Female |
| Healthcare Support | 0 (0.0%) | 32 (100.0%) |
| Security & Protection | 199 (90.0%) | 22 (10.0%) |
| Firefighting & Prevention | 64 (81.0%) | 15 (19.0%) |
| Law Enforcement | 135 (95.1%) | 7 (4.9%) |
| Food Preparation & Serving | 110 (41.0%) | 158 (59.0%) |
| Cleaning & Maintenance | 34 (73.9%) | 12 (26.1%) |
| Personal Care & Service | 43 (30.3%) | 99 (69.7%) |
| Total (Category) | 386 (54.4%) | 323 (45.6%) |
| Total (Overall) | 3,953 (56.9%) | 2,995 (43.1%) |
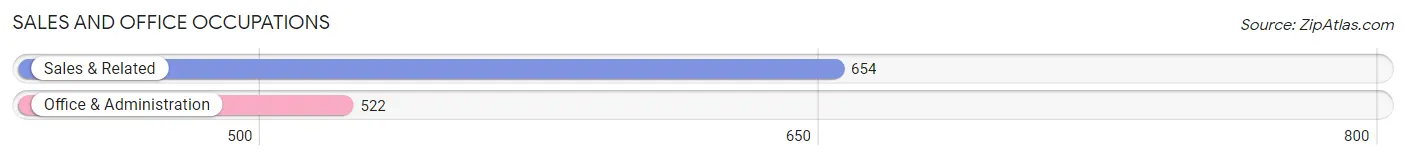
Sales and Office Occupations
The most common Sales and Office occupations in Brecksville are Sales & Related (654 | 9.4%), and Office & Administration (522 | 7.5%).
Sales and Office Occupations by Sex
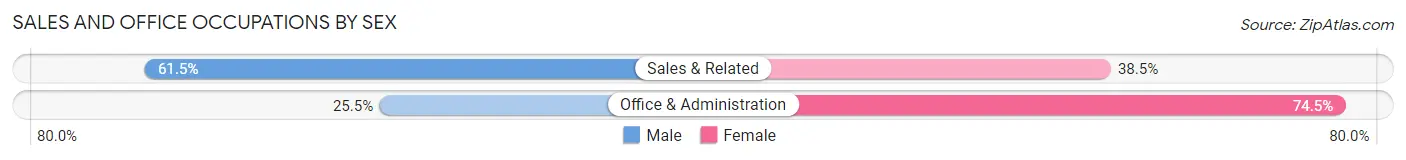
| Occupation | Male | Female |
| Sales & Related | 402 (61.5%) | 252 (38.5%) |
| Office & Administration | 133 (25.5%) | 389 (74.5%) |
| Total (Category) | 535 (45.5%) | 641 (54.5%) |
| Total (Overall) | 3,953 (56.9%) | 2,995 (43.1%) |
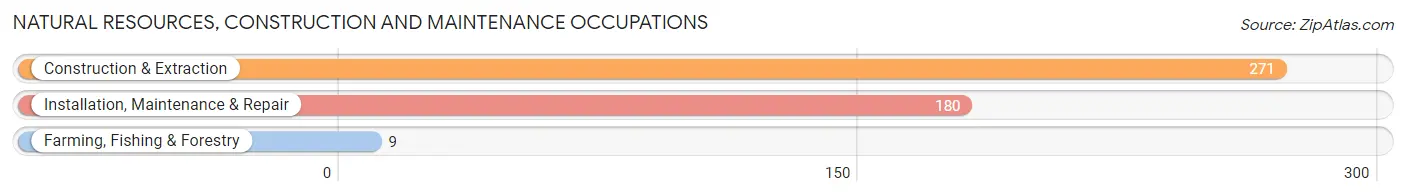
Natural Resources, Construction and Maintenance Occupations
The most common Natural Resources, Construction and Maintenance occupations in Brecksville are Construction & Extraction (271 | 3.9%), Installation, Maintenance & Repair (180 | 2.6%), and Farming, Fishing & Forestry (9 | 0.1%).
Natural Resources, Construction and Maintenance Occupations by Sex
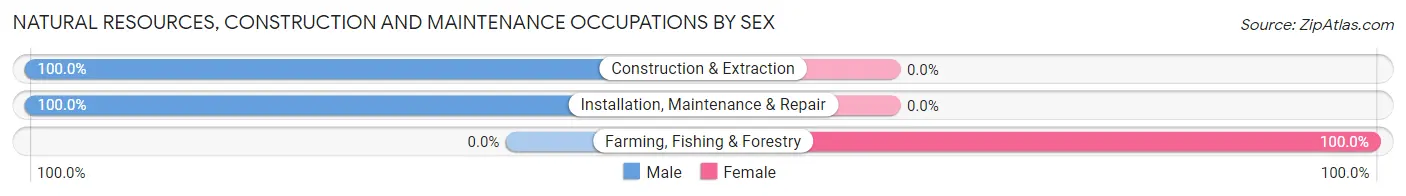
| Occupation | Male | Female |
| Farming, Fishing & Forestry | 0 (0.0%) | 9 (100.0%) |
| Construction & Extraction | 271 (100.0%) | 0 (0.0%) |
| Installation, Maintenance & Repair | 180 (100.0%) | 0 (0.0%) |
| Total (Category) | 451 (98.0%) | 9 (2.0%) |
| Total (Overall) | 3,953 (56.9%) | 2,995 (43.1%) |
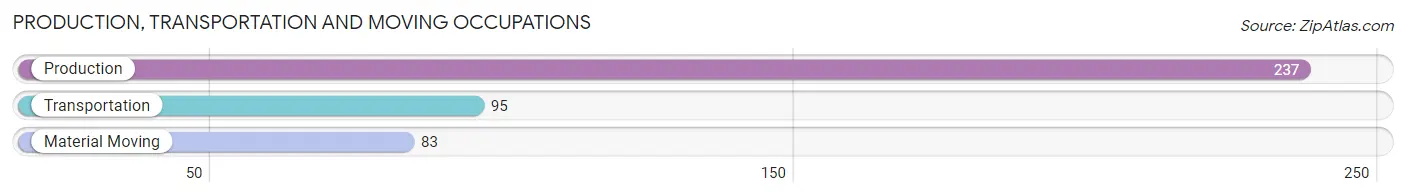
Production, Transportation and Moving Occupations
The most common Production, Transportation and Moving occupations in Brecksville are Production (237 | 3.4%), Transportation (95 | 1.4%), and Material Moving (83 | 1.2%).
Production, Transportation and Moving Occupations by Sex
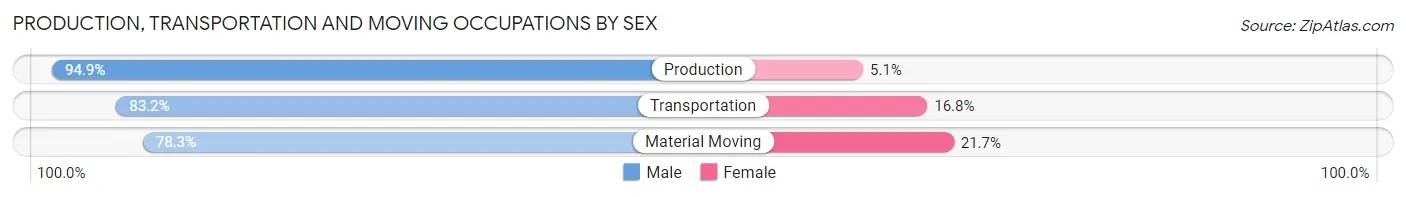
| Occupation | Male | Female |
| Production | 225 (94.9%) | 12 (5.1%) |
| Transportation | 79 (83.2%) | 16 (16.8%) |
| Material Moving | 65 (78.3%) | 18 (21.7%) |
| Total (Category) | 369 (88.9%) | 46 (11.1%) |
| Total (Overall) | 3,953 (56.9%) | 2,995 (43.1%) |
Employment Industries by Sex in Brecksville
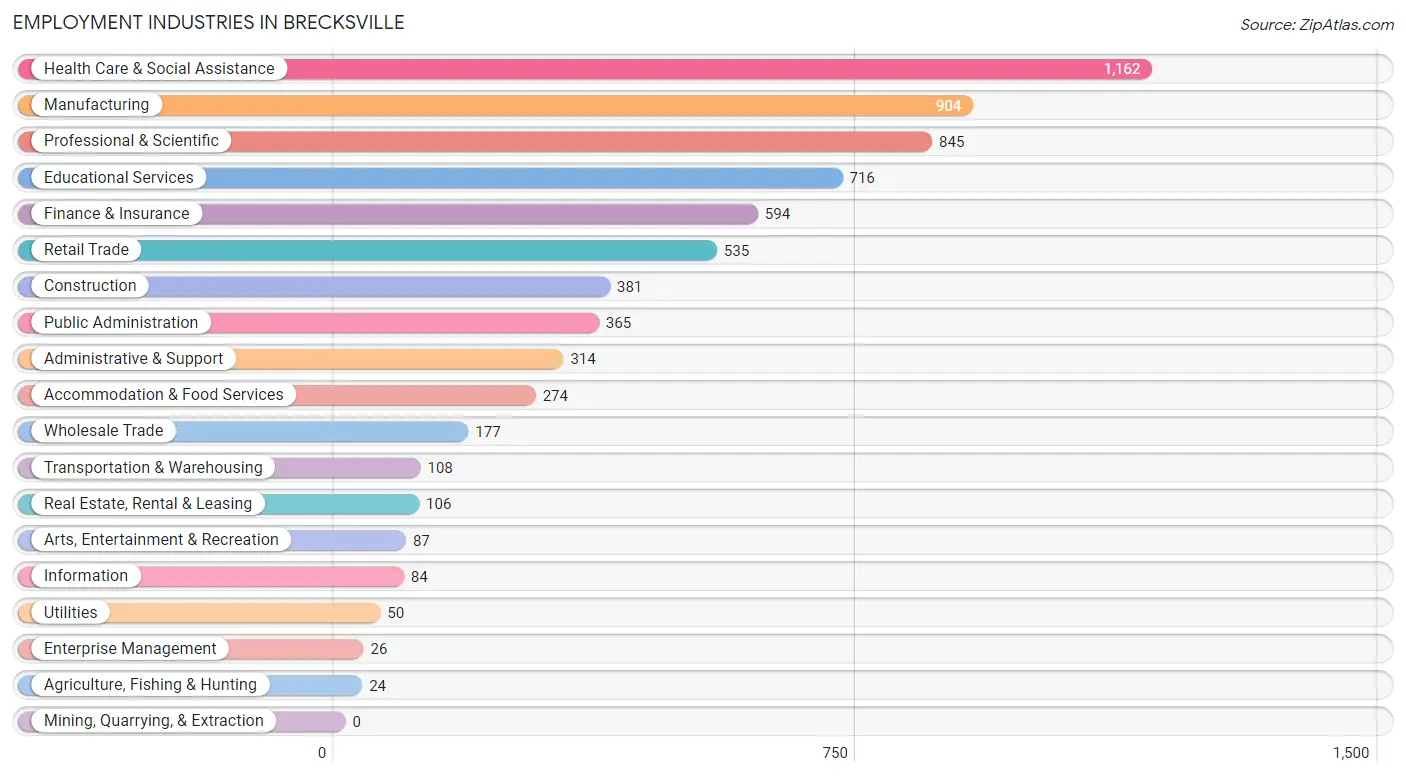
Employment Industries in Brecksville
The major employment industries in Brecksville include Health Care & Social Assistance (1,162 | 16.7%), Manufacturing (904 | 13.0%), Professional & Scientific (845 | 12.2%), Educational Services (716 | 10.3%), and Finance & Insurance (594 | 8.6%).
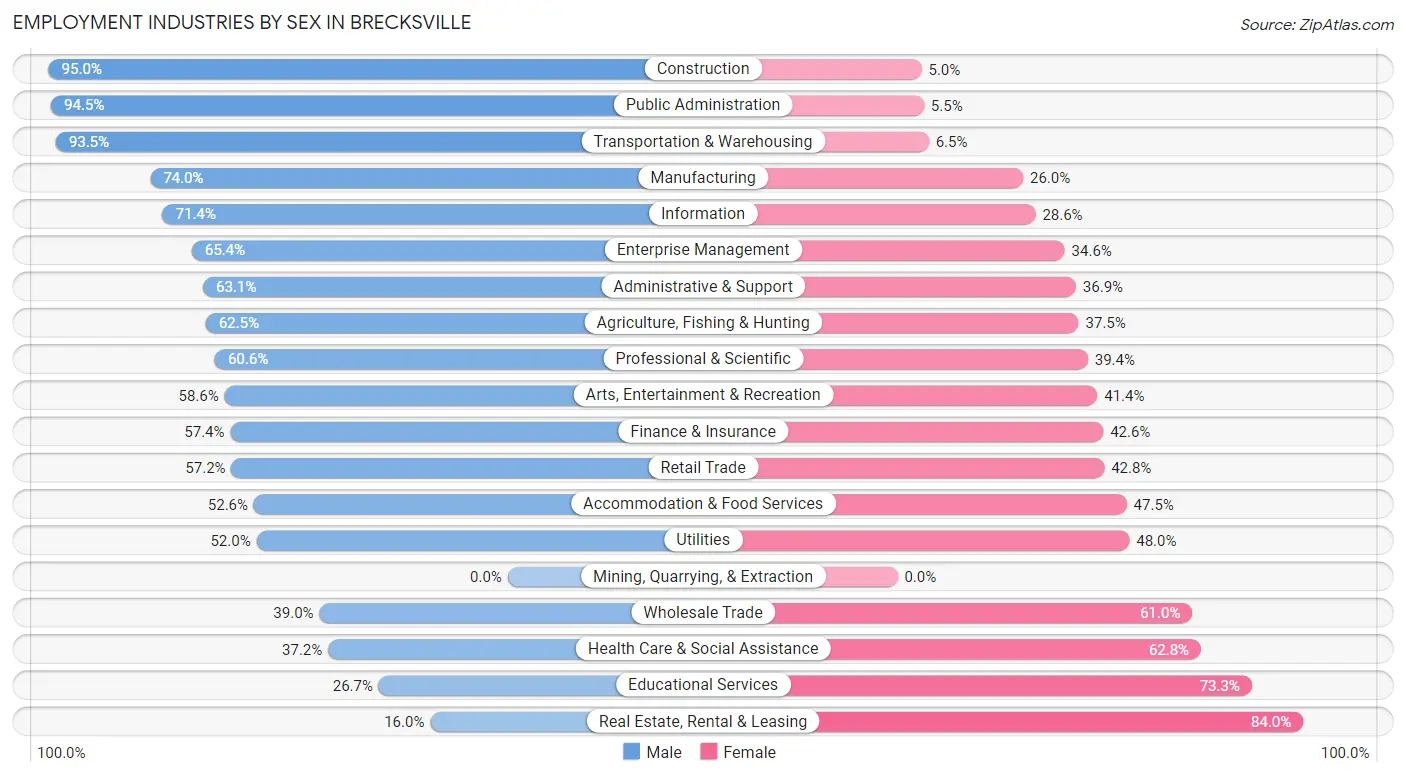
Employment Industries by Sex in Brecksville
The Brecksville industries that see more men than women are Construction (95.0%), Public Administration (94.5%), and Transportation & Warehousing (93.5%), whereas the industries that tend to have a higher number of women are Real Estate, Rental & Leasing (84.0%), Educational Services (73.3%), and Health Care & Social Assistance (62.8%).
| Industry | Male | Female |
| Agriculture, Fishing & Hunting | 15 (62.5%) | 9 (37.5%) |
| Mining, Quarrying, & Extraction | 0 (0.0%) | 0 (0.0%) |
| Construction | 362 (95.0%) | 19 (5.0%) |
| Manufacturing | 669 (74.0%) | 235 (26.0%) |
| Wholesale Trade | 69 (39.0%) | 108 (61.0%) |
| Retail Trade | 306 (57.2%) | 229 (42.8%) |
| Transportation & Warehousing | 101 (93.5%) | 7 (6.5%) |
| Utilities | 26 (52.0%) | 24 (48.0%) |
| Information | 60 (71.4%) | 24 (28.6%) |
| Finance & Insurance | 341 (57.4%) | 253 (42.6%) |
| Real Estate, Rental & Leasing | 17 (16.0%) | 89 (84.0%) |
| Professional & Scientific | 512 (60.6%) | 333 (39.4%) |
| Enterprise Management | 17 (65.4%) | 9 (34.6%) |
| Administrative & Support | 198 (63.1%) | 116 (36.9%) |
| Educational Services | 191 (26.7%) | 525 (73.3%) |
| Health Care & Social Assistance | 432 (37.2%) | 730 (62.8%) |
| Arts, Entertainment & Recreation | 51 (58.6%) | 36 (41.4%) |
| Accommodation & Food Services | 144 (52.5%) | 130 (47.4%) |
| Public Administration | 345 (94.5%) | 20 (5.5%) |
| Total | 3,953 (56.9%) | 2,995 (43.1%) |
Education in Brecksville
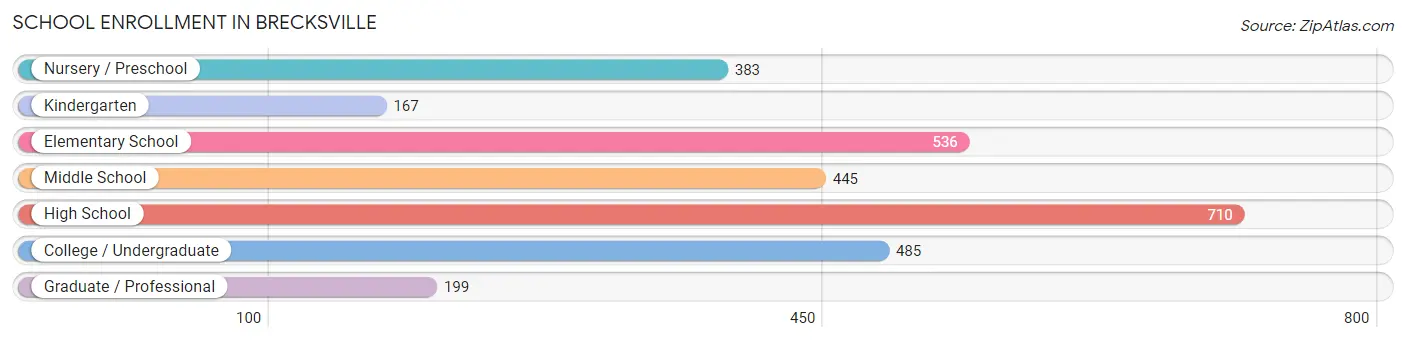
School Enrollment in Brecksville
The most common levels of schooling among the 2,925 students in Brecksville are high school (710 | 24.3%), elementary school (536 | 18.3%), and college / undergraduate (485 | 16.6%).
| School Level | # Students | % Students |
| Nursery / Preschool | 383 | 13.1% |
| Kindergarten | 167 | 5.7% |
| Elementary School | 536 | 18.3% |
| Middle School | 445 | 15.2% |
| High School | 710 | 24.3% |
| College / Undergraduate | 485 | 16.6% |
| Graduate / Professional | 199 | 6.8% |
| Total | 2,925 | 100.0% |
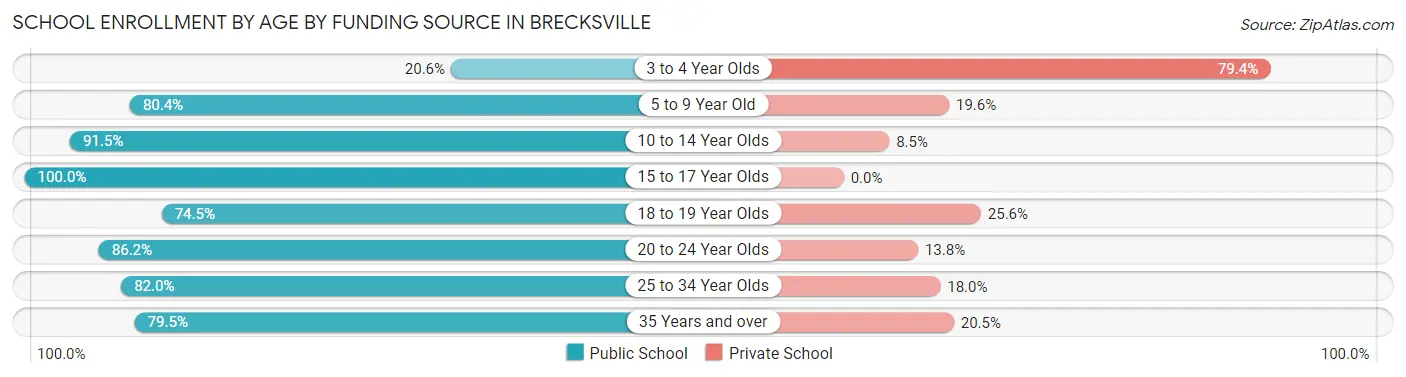
School Enrollment by Age by Funding Source in Brecksville
Out of a total of 2,925 students who are enrolled in schools in Brecksville, 605 (20.7%) attend a private institution, while the remaining 2,320 (79.3%) are enrolled in public schools. The age group of 3 to 4 year olds has the highest likelihood of being enrolled in private schools, with 239 (79.4% in the age bracket) enrolled. Conversely, the age group of 15 to 17 year olds has the lowest likelihood of being enrolled in a private school, with 376 (100.0% in the age bracket) attending a public institution.
| Age Bracket | Public School | Private School |
| 3 to 4 Year Olds | 62 (20.6%) | 239 (79.4%) |
| 5 to 9 Year Old | 516 (80.4%) | 126 (19.6%) |
| 10 to 14 Year Olds | 615 (91.5%) | 57 (8.5%) |
| 15 to 17 Year Olds | 376 (100.0%) | 0 (0.0%) |
| 18 to 19 Year Olds | 239 (74.5%) | 82 (25.6%) |
| 20 to 24 Year Olds | 274 (86.2%) | 44 (13.8%) |
| 25 to 34 Year Olds | 82 (82.0%) | 18 (18.0%) |
| 35 Years and over | 155 (79.5%) | 40 (20.5%) |
| Total | 2,320 (79.3%) | 605 (20.7%) |
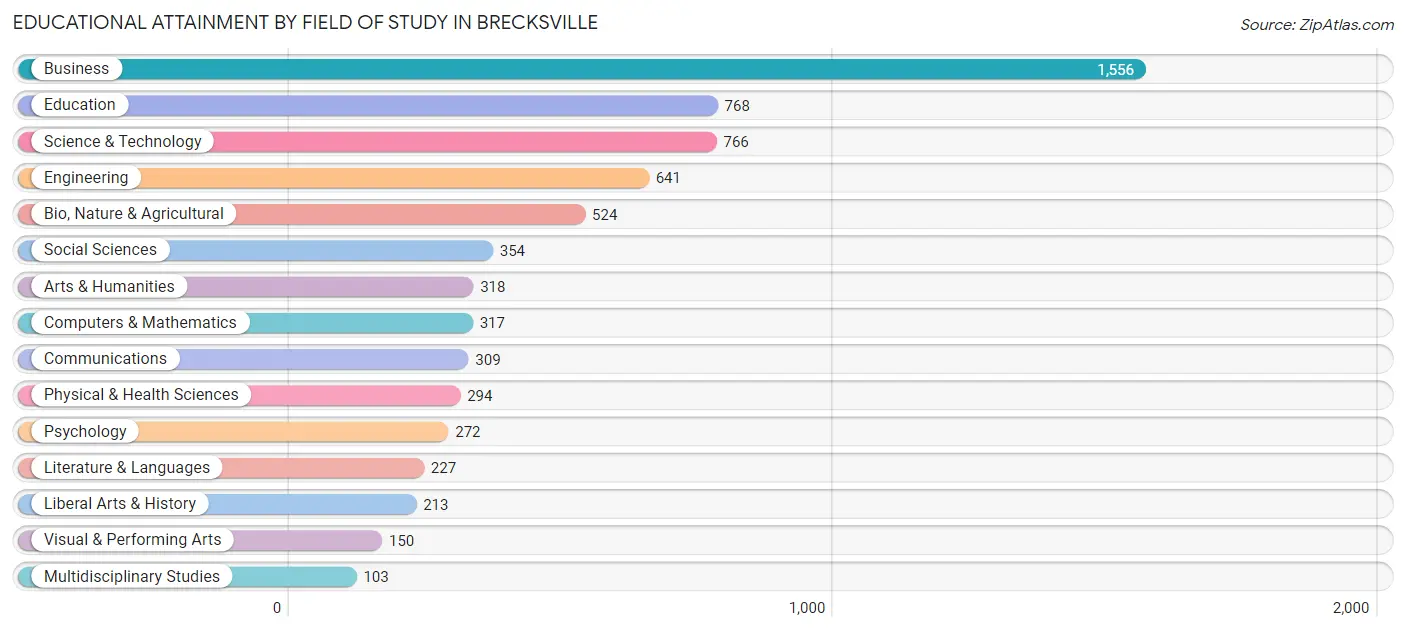
Educational Attainment by Field of Study in Brecksville
Business (1,556 | 22.8%), education (768 | 11.3%), science & technology (766 | 11.2%), engineering (641 | 9.4%), and bio, nature & agricultural (524 | 7.7%) are the most common fields of study among 6,812 individuals in Brecksville who have obtained a bachelor's degree or higher.
| Field of Study | # Graduates | % Graduates |
| Computers & Mathematics | 317 | 4.6% |
| Bio, Nature & Agricultural | 524 | 7.7% |
| Physical & Health Sciences | 294 | 4.3% |
| Psychology | 272 | 4.0% |
| Social Sciences | 354 | 5.2% |
| Engineering | 641 | 9.4% |
| Multidisciplinary Studies | 103 | 1.5% |
| Science & Technology | 766 | 11.2% |
| Business | 1,556 | 22.8% |
| Education | 768 | 11.3% |
| Literature & Languages | 227 | 3.3% |
| Liberal Arts & History | 213 | 3.1% |
| Visual & Performing Arts | 150 | 2.2% |
| Communications | 309 | 4.5% |
| Arts & Humanities | 318 | 4.7% |
| Total | 6,812 | 100.0% |
Transportation & Commute in Brecksville
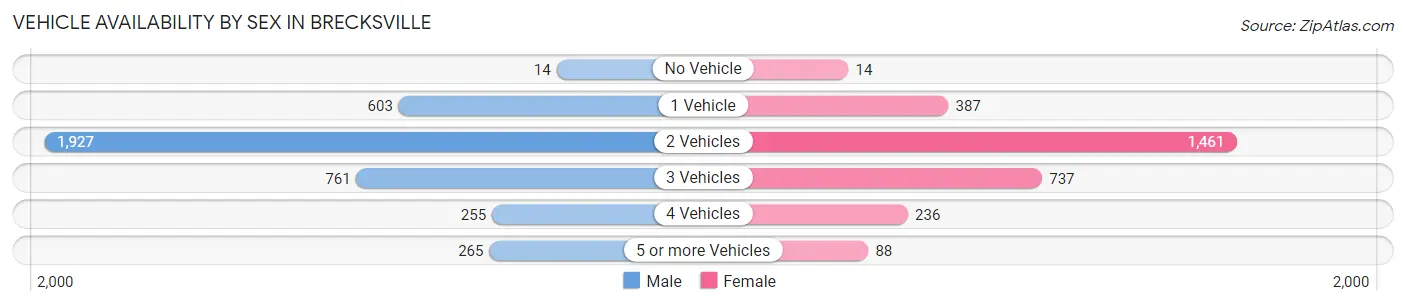
Vehicle Availability by Sex in Brecksville
The most prevalent vehicle ownership categories in Brecksville are males with 2 vehicles (1,927, accounting for 50.4%) and females with 2 vehicles (1,461, making up 65.9%).
| Vehicles Available | Male | Female |
| No Vehicle | 14 (0.4%) | 14 (0.5%) |
| 1 Vehicle | 603 (15.8%) | 387 (13.2%) |
| 2 Vehicles | 1,927 (50.4%) | 1,461 (50.0%) |
| 3 Vehicles | 761 (19.9%) | 737 (25.2%) |
| 4 Vehicles | 255 (6.7%) | 236 (8.1%) |
| 5 or more Vehicles | 265 (6.9%) | 88 (3.0%) |
| Total | 3,825 (100.0%) | 2,923 (100.0%) |
Commute Time in Brecksville
The most frequently occuring commute durations in Brecksville are 30 to 34 minutes (1,056 commuters, 18.5%), 25 to 29 minutes (814 commuters, 14.3%), and 15 to 19 minutes (734 commuters, 12.9%).
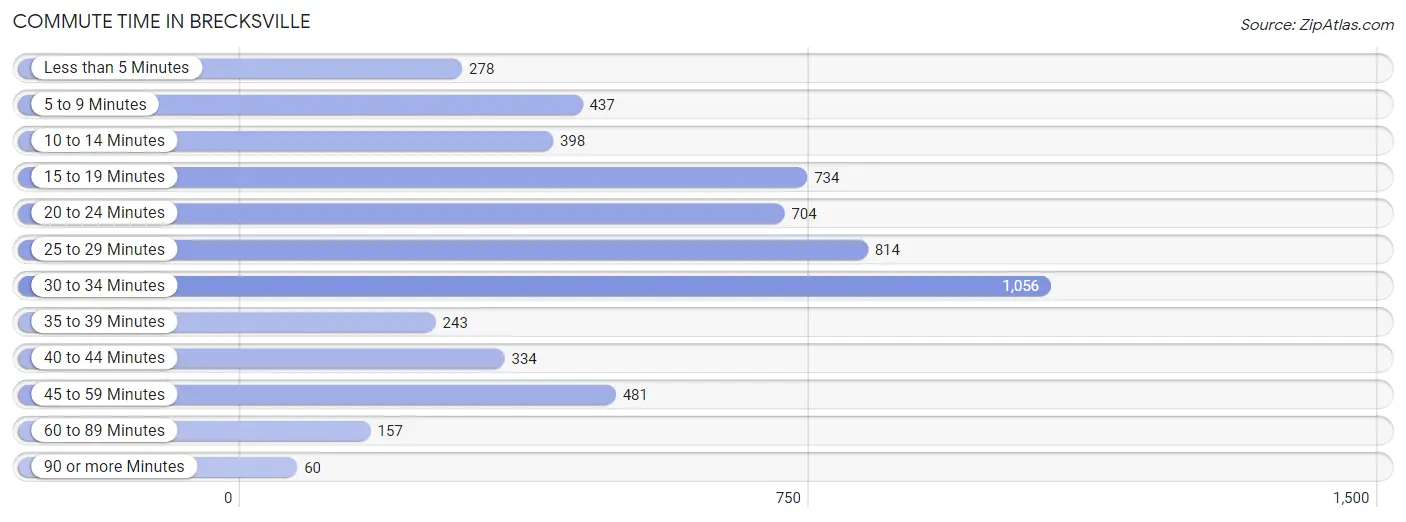
| Commute Time | # Commuters | % Commuters |
| Less than 5 Minutes | 278 | 4.9% |
| 5 to 9 Minutes | 437 | 7.7% |
| 10 to 14 Minutes | 398 | 7.0% |
| 15 to 19 Minutes | 734 | 12.9% |
| 20 to 24 Minutes | 704 | 12.4% |
| 25 to 29 Minutes | 814 | 14.3% |
| 30 to 34 Minutes | 1,056 | 18.5% |
| 35 to 39 Minutes | 243 | 4.3% |
| 40 to 44 Minutes | 334 | 5.9% |
| 45 to 59 Minutes | 481 | 8.4% |
| 60 to 89 Minutes | 157 | 2.8% |
| 90 or more Minutes | 60 | 1.1% |
Commute Time by Sex in Brecksville
The most common commute times in Brecksville are 30 to 34 minutes (677 commuters, 20.9%) for males and 25 to 29 minutes (384 commuters, 15.6%) for females.
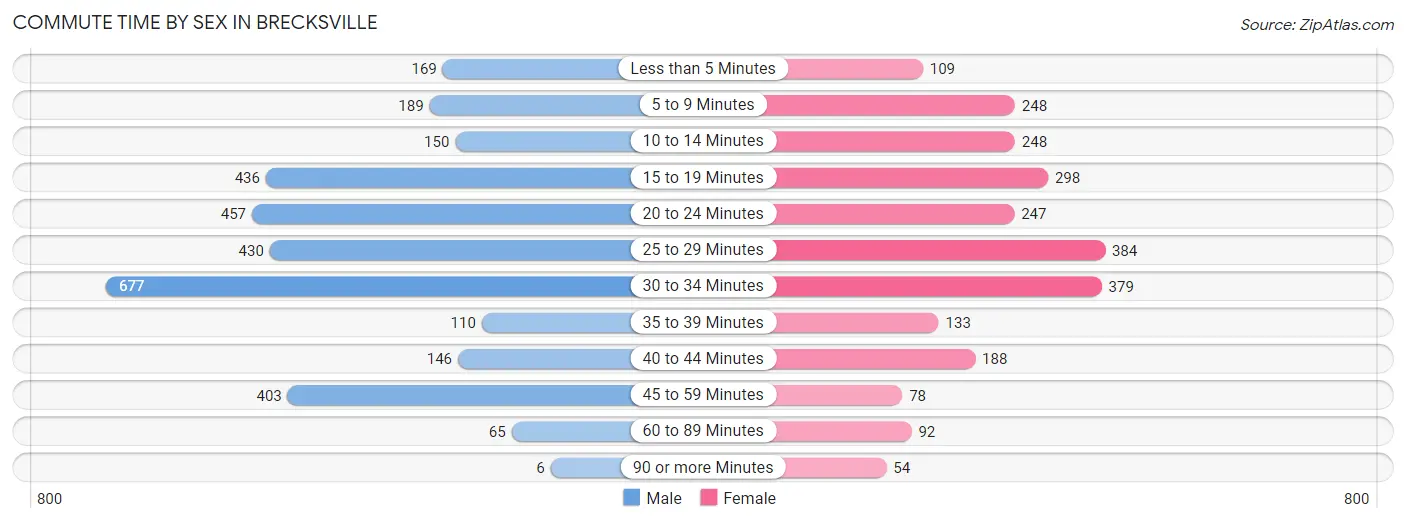
| Commute Time | Male | Female |
| Less than 5 Minutes | 169 (5.2%) | 109 (4.4%) |
| 5 to 9 Minutes | 189 (5.8%) | 248 (10.1%) |
| 10 to 14 Minutes | 150 (4.6%) | 248 (10.1%) |
| 15 to 19 Minutes | 436 (13.5%) | 298 (12.1%) |
| 20 to 24 Minutes | 457 (14.1%) | 247 (10.1%) |
| 25 to 29 Minutes | 430 (13.3%) | 384 (15.6%) |
| 30 to 34 Minutes | 677 (20.9%) | 379 (15.4%) |
| 35 to 39 Minutes | 110 (3.4%) | 133 (5.4%) |
| 40 to 44 Minutes | 146 (4.5%) | 188 (7.6%) |
| 45 to 59 Minutes | 403 (12.4%) | 78 (3.2%) |
| 60 to 89 Minutes | 65 (2.0%) | 92 (3.7%) |
| 90 or more Minutes | 6 (0.2%) | 54 (2.2%) |
Time of Departure to Work by Sex in Brecksville
The most frequent times of departure to work in Brecksville are 7:00 AM to 7:29 AM (650, 20.1%) for males and 7:00 AM to 7:29 AM (465, 18.9%) for females.
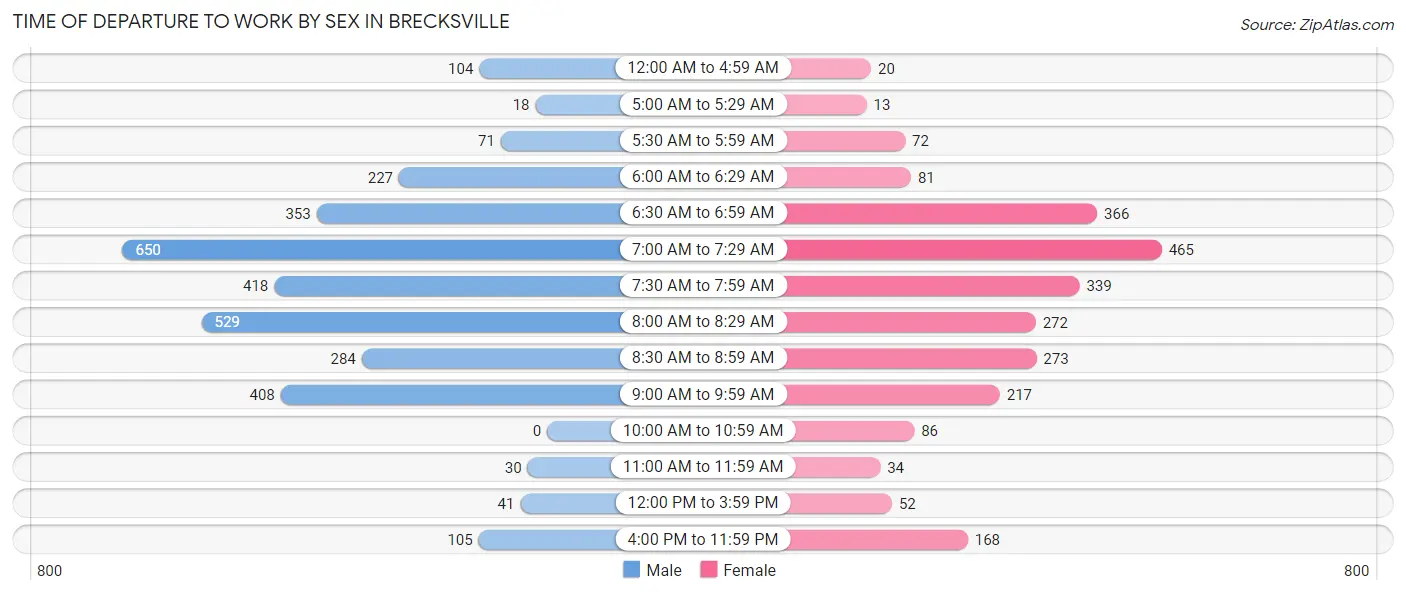
| Time of Departure | Male | Female |
| 12:00 AM to 4:59 AM | 104 (3.2%) | 20 (0.8%) |
| 5:00 AM to 5:29 AM | 18 (0.6%) | 13 (0.5%) |
| 5:30 AM to 5:59 AM | 71 (2.2%) | 72 (2.9%) |
| 6:00 AM to 6:29 AM | 227 (7.0%) | 81 (3.3%) |
| 6:30 AM to 6:59 AM | 353 (10.9%) | 366 (14.9%) |
| 7:00 AM to 7:29 AM | 650 (20.1%) | 465 (18.9%) |
| 7:30 AM to 7:59 AM | 418 (12.9%) | 339 (13.8%) |
| 8:00 AM to 8:29 AM | 529 (16.3%) | 272 (11.1%) |
| 8:30 AM to 8:59 AM | 284 (8.8%) | 273 (11.1%) |
| 9:00 AM to 9:59 AM | 408 (12.6%) | 217 (8.8%) |
| 10:00 AM to 10:59 AM | 0 (0.0%) | 86 (3.5%) |
| 11:00 AM to 11:59 AM | 30 (0.9%) | 34 (1.4%) |
| 12:00 PM to 3:59 PM | 41 (1.3%) | 52 (2.1%) |
| 4:00 PM to 11:59 PM | 105 (3.2%) | 168 (6.8%) |
| Total | 3,238 (100.0%) | 2,458 (100.0%) |
Housing Occupancy in Brecksville
Occupancy by Ownership in Brecksville
Of the total 5,574 dwellings in Brecksville, owner-occupied units account for 4,685 (84.1%), while renter-occupied units make up 889 (16.0%).
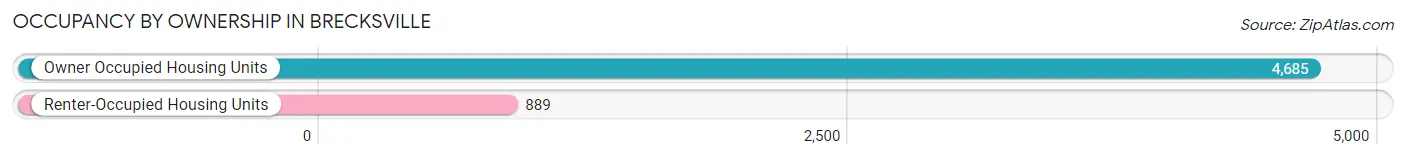
| Occupancy | # Housing Units | % Housing Units |
| Owner Occupied Housing Units | 4,685 | 84.1% |
| Renter-Occupied Housing Units | 889 | 16.0% |
| Total Occupied Housing Units | 5,574 | 100.0% |
Occupancy by Household Size in Brecksville
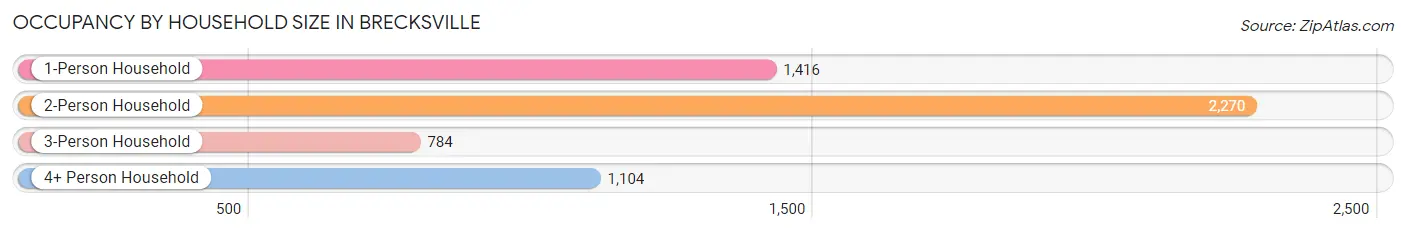
| Household Size | # Housing Units | % Housing Units |
| 1-Person Household | 1,416 | 25.4% |
| 2-Person Household | 2,270 | 40.7% |
| 3-Person Household | 784 | 14.1% |
| 4+ Person Household | 1,104 | 19.8% |
| Total Housing Units | 5,574 | 100.0% |
Occupancy by Ownership by Household Size in Brecksville
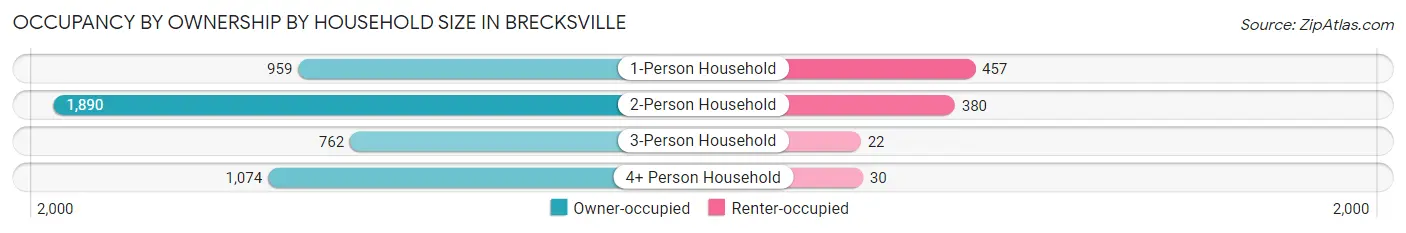
| Household Size | Owner-occupied | Renter-occupied |
| 1-Person Household | 959 (67.7%) | 457 (32.3%) |
| 2-Person Household | 1,890 (83.3%) | 380 (16.7%) |
| 3-Person Household | 762 (97.2%) | 22 (2.8%) |
| 4+ Person Household | 1,074 (97.3%) | 30 (2.7%) |
| Total Housing Units | 4,685 (84.1%) | 889 (16.0%) |
Occupancy by Educational Attainment in Brecksville
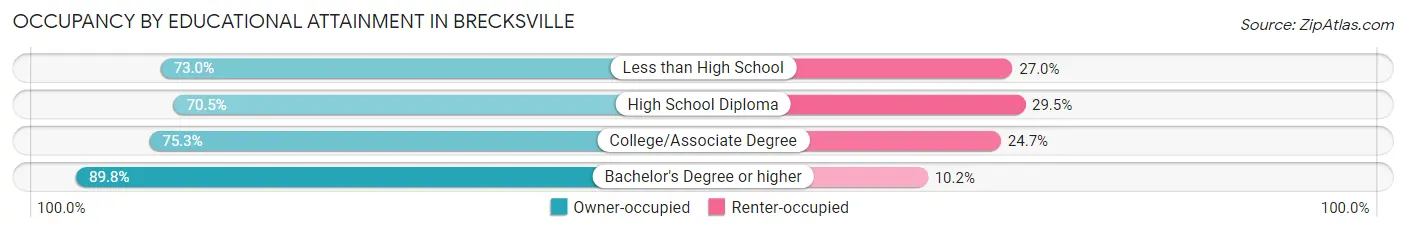
| Household Size | Owner-occupied | Renter-occupied |
| Less than High School | 73 (73.0%) | 27 (27.0%) |
| High School Diploma | 456 (70.5%) | 191 (29.5%) |
| College/Associate Degree | 922 (75.3%) | 303 (24.7%) |
| Bachelor's Degree or higher | 3,234 (89.8%) | 368 (10.2%) |
Occupancy by Age of Householder in Brecksville
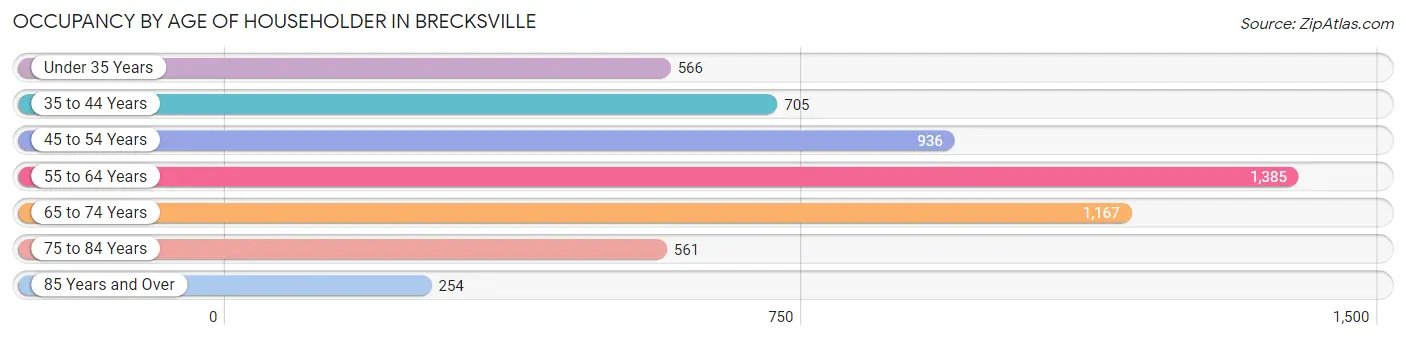
| Age Bracket | # Households | % Households |
| Under 35 Years | 566 | 10.2% |
| 35 to 44 Years | 705 | 12.7% |
| 45 to 54 Years | 936 | 16.8% |
| 55 to 64 Years | 1,385 | 24.8% |
| 65 to 74 Years | 1,167 | 20.9% |
| 75 to 84 Years | 561 | 10.1% |
| 85 Years and Over | 254 | 4.6% |
| Total | 5,574 | 100.0% |
Housing Finances in Brecksville
Median Income by Occupancy in Brecksville
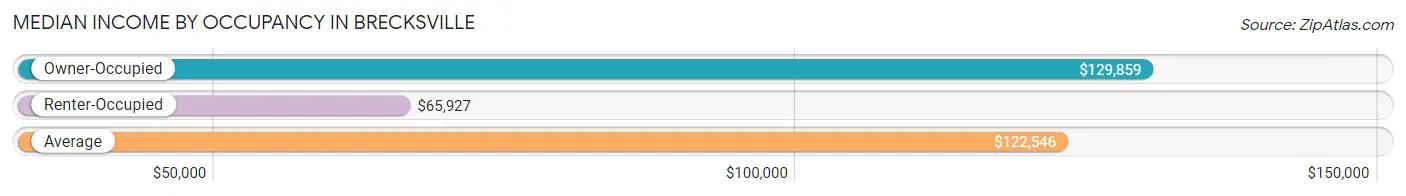
| Occupancy Type | # Households | Median Income |
| Owner-Occupied | 4,685 (84.1%) | $129,859 |
| Renter-Occupied | 889 (16.0%) | $65,927 |
| Average | 5,574 (100.0%) | $122,546 |
Occupancy by Householder Income Bracket in Brecksville
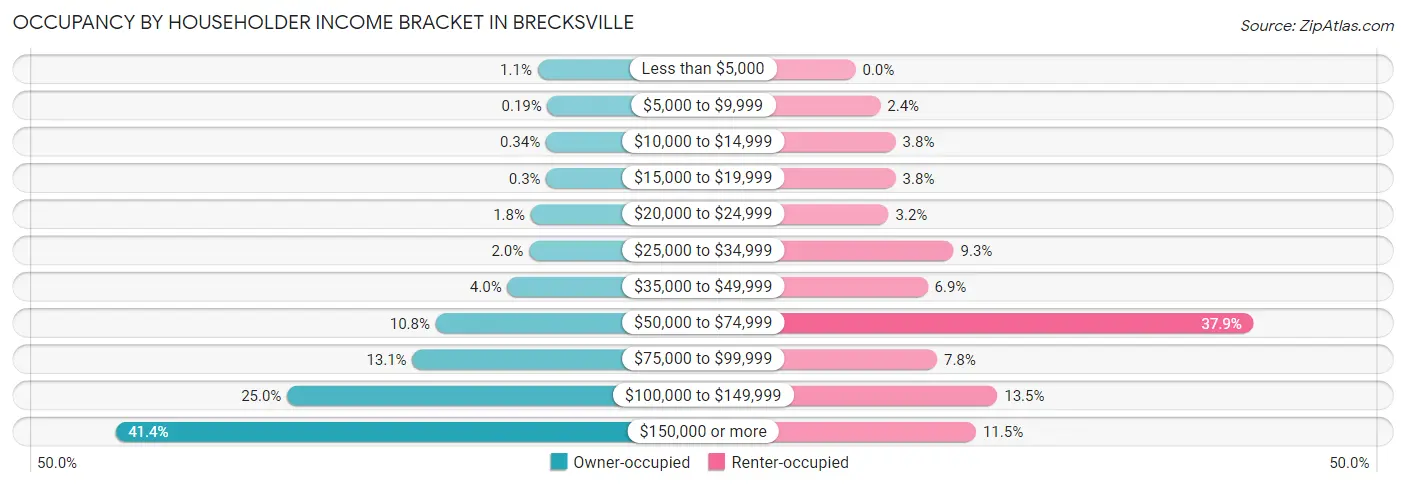
| Income Bracket | Owner-occupied | Renter-occupied |
| Less than $5,000 | 53 (1.1%) | 0 (0.0%) |
| $5,000 to $9,999 | 9 (0.2%) | 21 (2.4%) |
| $10,000 to $14,999 | 16 (0.3%) | 34 (3.8%) |
| $15,000 to $19,999 | 14 (0.3%) | 34 (3.8%) |
| $20,000 to $24,999 | 84 (1.8%) | 28 (3.2%) |
| $25,000 to $34,999 | 92 (2.0%) | 83 (9.3%) |
| $35,000 to $49,999 | 188 (4.0%) | 61 (6.9%) |
| $50,000 to $74,999 | 508 (10.8%) | 337 (37.9%) |
| $75,000 to $99,999 | 612 (13.1%) | 69 (7.8%) |
| $100,000 to $149,999 | 1,171 (25.0%) | 120 (13.5%) |
| $150,000 or more | 1,938 (41.4%) | 102 (11.5%) |
| Total | 4,685 (100.0%) | 889 (100.0%) |
Monthly Housing Cost Tiers in Brecksville
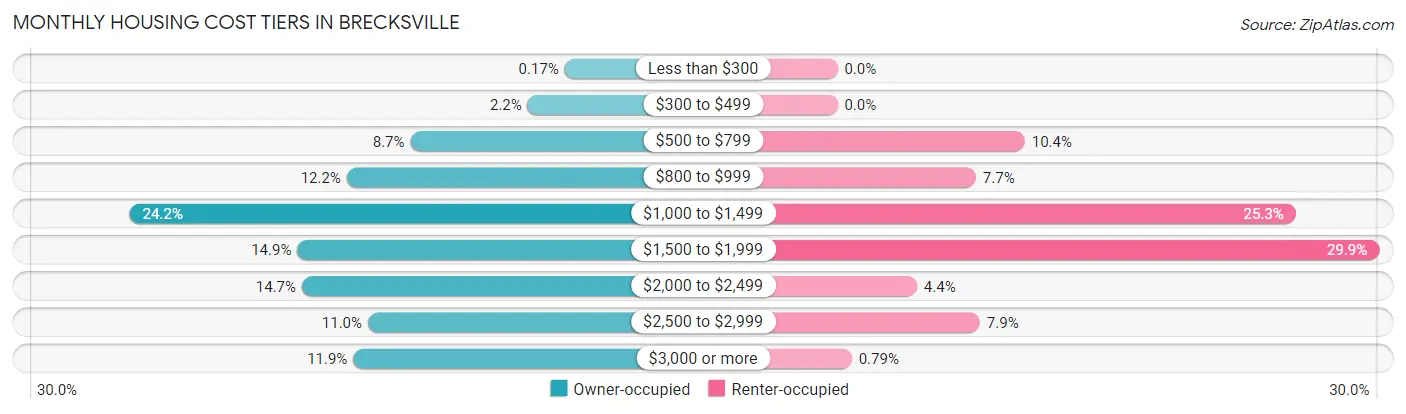
| Monthly Cost | Owner-occupied | Renter-occupied |
| Less than $300 | 8 (0.2%) | 0 (0.0%) |
| $300 to $499 | 104 (2.2%) | 0 (0.0%) |
| $500 to $799 | 407 (8.7%) | 92 (10.3%) |
| $800 to $999 | 572 (12.2%) | 68 (7.6%) |
| $1,000 to $1,499 | 1,134 (24.2%) | 225 (25.3%) |
| $1,500 to $1,999 | 700 (14.9%) | 266 (29.9%) |
| $2,000 to $2,499 | 688 (14.7%) | 39 (4.4%) |
| $2,500 to $2,999 | 517 (11.0%) | 70 (7.9%) |
| $3,000 or more | 555 (11.8%) | 7 (0.8%) |
| Total | 4,685 (100.0%) | 889 (100.0%) |
Physical Housing Characteristics in Brecksville
Housing Structures in Brecksville
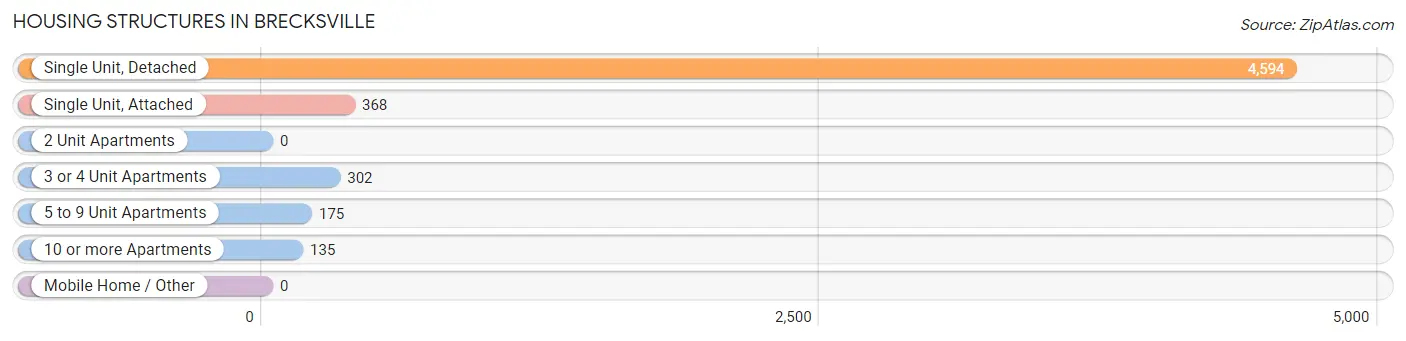
| Structure Type | # Housing Units | % Housing Units |
| Single Unit, Detached | 4,594 | 82.4% |
| Single Unit, Attached | 368 | 6.6% |
| 2 Unit Apartments | 0 | 0.0% |
| 3 or 4 Unit Apartments | 302 | 5.4% |
| 5 to 9 Unit Apartments | 175 | 3.1% |
| 10 or more Apartments | 135 | 2.4% |
| Mobile Home / Other | 0 | 0.0% |
| Total | 5,574 | 100.0% |
Housing Structures by Occupancy in Brecksville
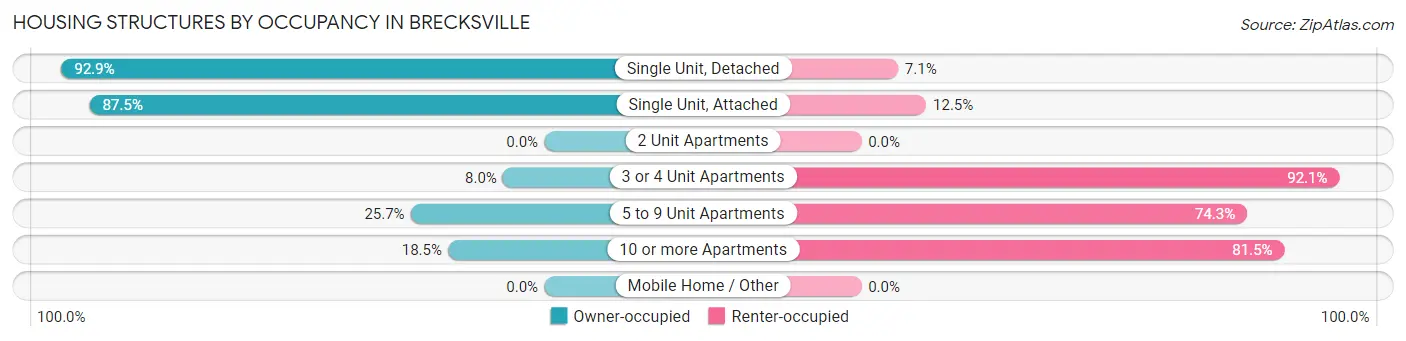
| Structure Type | Owner-occupied | Renter-occupied |
| Single Unit, Detached | 4,269 (92.9%) | 325 (7.1%) |
| Single Unit, Attached | 322 (87.5%) | 46 (12.5%) |
| 2 Unit Apartments | 0 (0.0%) | 0 (0.0%) |
| 3 or 4 Unit Apartments | 24 (8.0%) | 278 (92.0%) |
| 5 to 9 Unit Apartments | 45 (25.7%) | 130 (74.3%) |
| 10 or more Apartments | 25 (18.5%) | 110 (81.5%) |
| Mobile Home / Other | 0 (0.0%) | 0 (0.0%) |
| Total | 4,685 (84.1%) | 889 (16.0%) |
Housing Structures by Number of Rooms in Brecksville
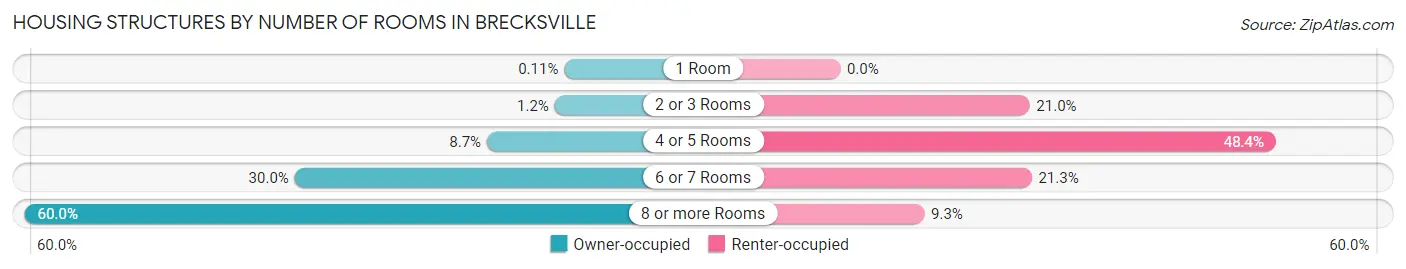
| Number of Rooms | Owner-occupied | Renter-occupied |
| 1 Room | 5 (0.1%) | 0 (0.0%) |
| 2 or 3 Rooms | 55 (1.2%) | 187 (21.0%) |
| 4 or 5 Rooms | 407 (8.7%) | 430 (48.4%) |
| 6 or 7 Rooms | 1,407 (30.0%) | 189 (21.3%) |
| 8 or more Rooms | 2,811 (60.0%) | 83 (9.3%) |
| Total | 4,685 (100.0%) | 889 (100.0%) |
Housing Structure by Heating Type in Brecksville
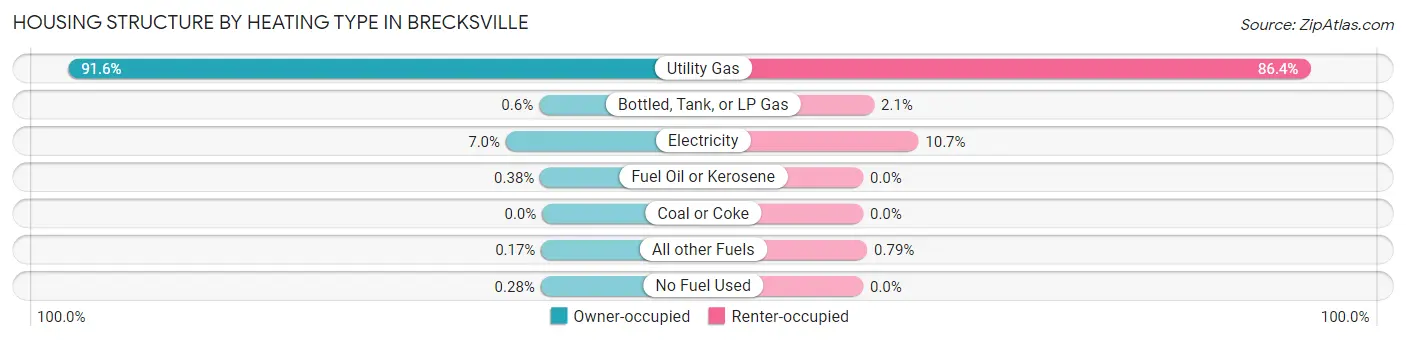
| Heating Type | Owner-occupied | Renter-occupied |
| Utility Gas | 4,290 (91.6%) | 768 (86.4%) |
| Bottled, Tank, or LP Gas | 28 (0.6%) | 19 (2.1%) |
| Electricity | 328 (7.0%) | 95 (10.7%) |
| Fuel Oil or Kerosene | 18 (0.4%) | 0 (0.0%) |
| Coal or Coke | 0 (0.0%) | 0 (0.0%) |
| All other Fuels | 8 (0.2%) | 7 (0.8%) |
| No Fuel Used | 13 (0.3%) | 0 (0.0%) |
| Total | 4,685 (100.0%) | 889 (100.0%) |
Household Vehicle Usage in Brecksville
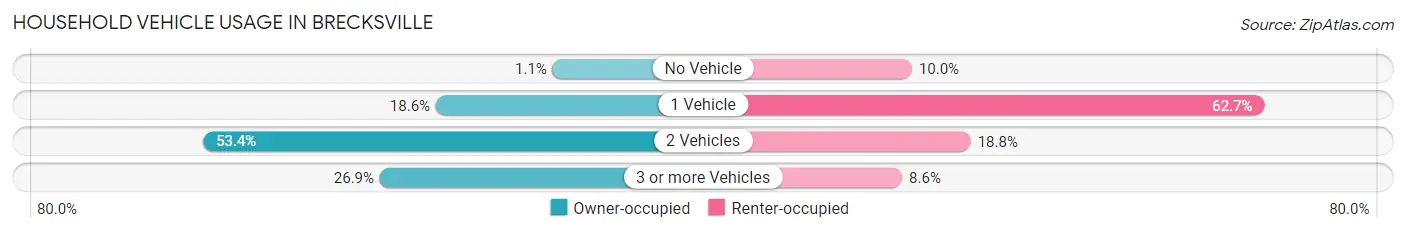
| Vehicles per Household | Owner-occupied | Renter-occupied |
| No Vehicle | 53 (1.1%) | 89 (10.0%) |
| 1 Vehicle | 870 (18.6%) | 557 (62.6%) |
| 2 Vehicles | 2,500 (53.4%) | 167 (18.8%) |
| 3 or more Vehicles | 1,262 (26.9%) | 76 (8.6%) |
| Total | 4,685 (100.0%) | 889 (100.0%) |
Real Estate & Mortgages in Brecksville
Real Estate and Mortgage Overview in Brecksville
| Characteristic | Without Mortgage | With Mortgage |
| Housing Units | 1,921 | 2,764 |
| Median Property Value | $347,900 | $357,600 |
| Median Household Income | $95,272 | $1,397 |
| Monthly Housing Costs | $969 | $555 |
| Real Estate Taxes | $7,208 | $38 |
Property Value by Mortgage Status in Brecksville
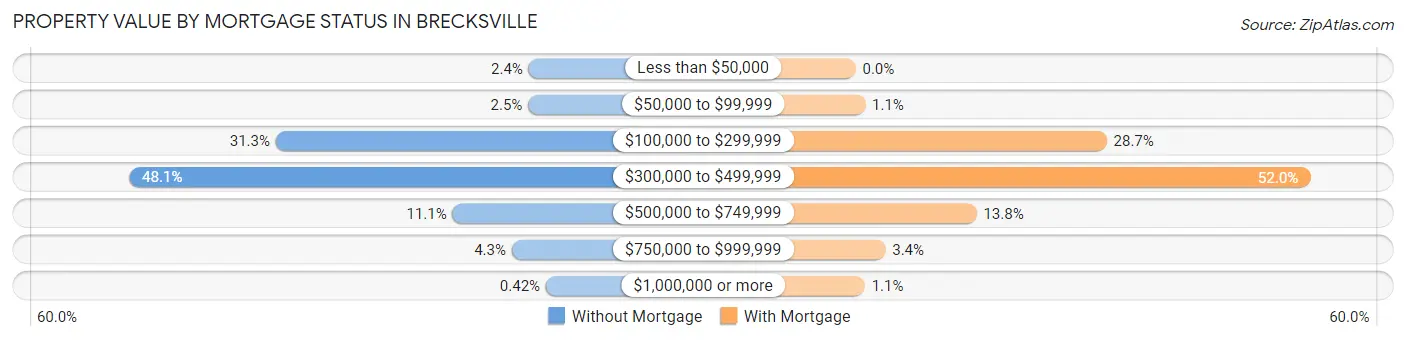
| Property Value | Without Mortgage | With Mortgage |
| Less than $50,000 | 46 (2.4%) | 0 (0.0%) |
| $50,000 to $99,999 | 47 (2.5%) | 30 (1.1%) |
| $100,000 to $299,999 | 601 (31.3%) | 793 (28.7%) |
| $300,000 to $499,999 | 923 (48.0%) | 1,436 (51.9%) |
| $500,000 to $749,999 | 213 (11.1%) | 382 (13.8%) |
| $750,000 to $999,999 | 83 (4.3%) | 94 (3.4%) |
| $1,000,000 or more | 8 (0.4%) | 29 (1.1%) |
| Total | 1,921 (100.0%) | 2,764 (100.0%) |
Household Income by Mortgage Status in Brecksville
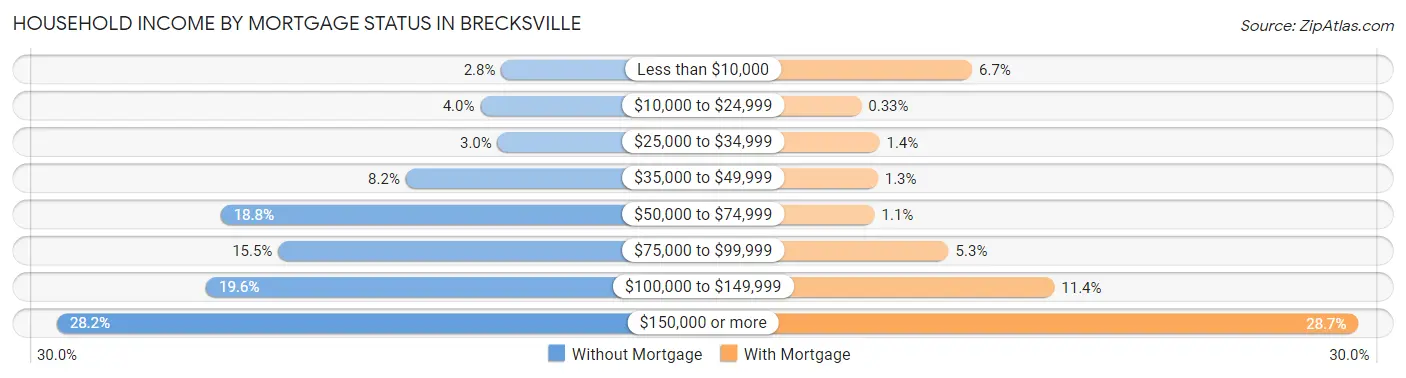
| Household Income | Without Mortgage | With Mortgage |
| Less than $10,000 | 53 (2.8%) | 184 (6.7%) |
| $10,000 to $24,999 | 76 (4.0%) | 9 (0.3%) |
| $25,000 to $34,999 | 57 (3.0%) | 38 (1.4%) |
| $35,000 to $49,999 | 158 (8.2%) | 35 (1.3%) |
| $50,000 to $74,999 | 361 (18.8%) | 30 (1.1%) |
| $75,000 to $99,999 | 298 (15.5%) | 147 (5.3%) |
| $100,000 to $149,999 | 377 (19.6%) | 314 (11.4%) |
| $150,000 or more | 541 (28.2%) | 794 (28.7%) |
| Total | 1,921 (100.0%) | 2,764 (100.0%) |
Property Value to Household Income Ratio in Brecksville
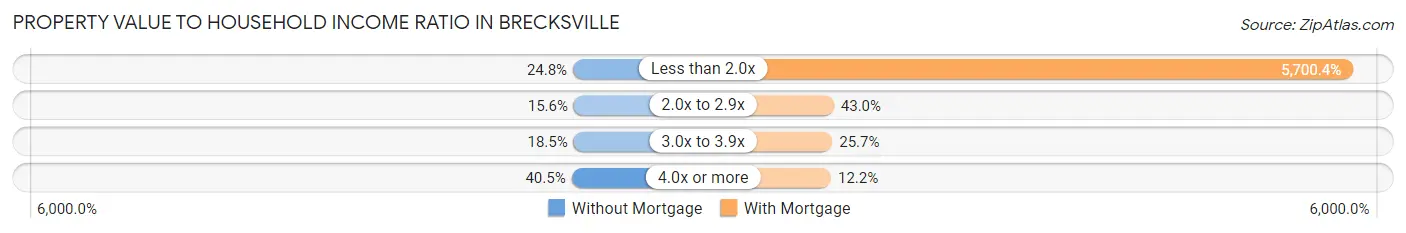
| Value-to-Income Ratio | Without Mortgage | With Mortgage |
| Less than 2.0x | 477 (24.8%) | 157,560 (5,700.4%) |
| 2.0x to 2.9x | 299 (15.6%) | 1,189 (43.0%) |
| 3.0x to 3.9x | 356 (18.5%) | 711 (25.7%) |
| 4.0x or more | 778 (40.5%) | 337 (12.2%) |
| Total | 1,921 (100.0%) | 2,764 (100.0%) |
Real Estate Taxes by Mortgage Status in Brecksville
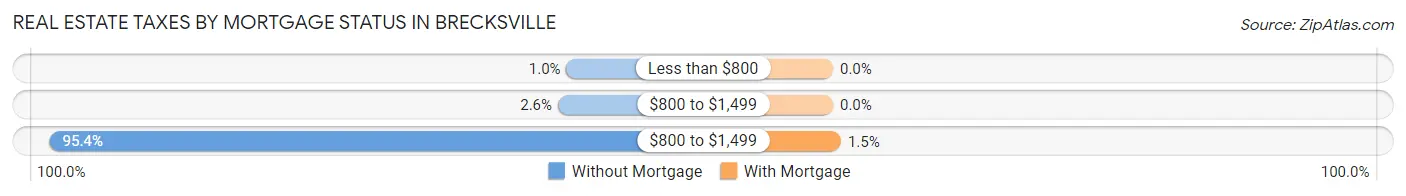
| Property Taxes | Without Mortgage | With Mortgage |
| Less than $800 | 20 (1.0%) | 0 (0.0%) |
| $800 to $1,499 | 50 (2.6%) | 0 (0.0%) |
| $800 to $1,499 | 1,833 (95.4%) | 40 (1.5%) |
| Total | 1,921 (100.0%) | 2,764 (100.0%) |
Health & Disability in Brecksville
Health Insurance Coverage by Age in Brecksville
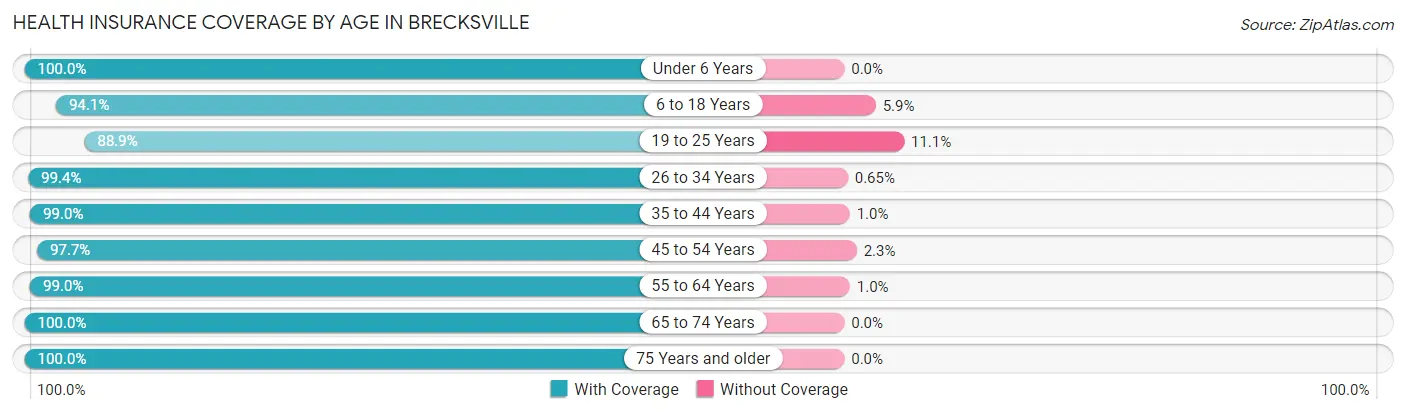
| Age Bracket | With Coverage | Without Coverage |
| Under 6 Years | 1,080 (100.0%) | 0 (0.0%) |
| 6 to 18 Years | 1,688 (94.1%) | 105 (5.9%) |
| 19 to 25 Years | 654 (88.9%) | 82 (11.1%) |
| 26 to 34 Years | 917 (99.4%) | 6 (0.6%) |
| 35 to 44 Years | 1,470 (99.0%) | 15 (1.0%) |
| 45 to 54 Years | 1,732 (97.7%) | 41 (2.3%) |
| 55 to 64 Years | 2,398 (99.0%) | 25 (1.0%) |
| 65 to 74 Years | 2,008 (100.0%) | 0 (0.0%) |
| 75 Years and older | 1,242 (100.0%) | 0 (0.0%) |
| Total | 13,189 (98.0%) | 274 (2.0%) |
Health Insurance Coverage by Citizenship Status in Brecksville
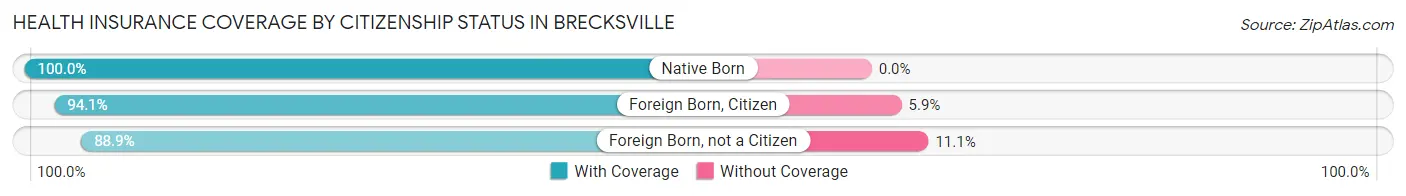
| Citizenship Status | With Coverage | Without Coverage |
| Native Born | 1,080 (100.0%) | 0 (0.0%) |
| Foreign Born, Citizen | 1,688 (94.1%) | 105 (5.9%) |
| Foreign Born, not a Citizen | 654 (88.9%) | 82 (11.1%) |
Health Insurance Coverage by Household Income in Brecksville
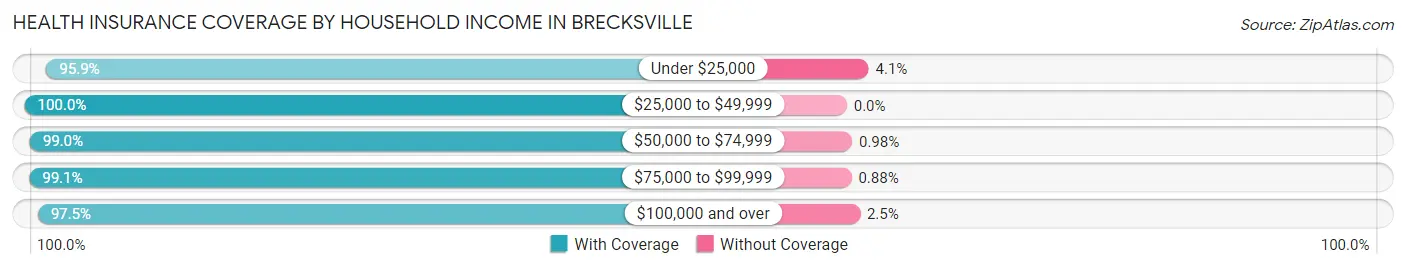
| Household Income | With Coverage | Without Coverage |
| Under $25,000 | 328 (95.9%) | 14 (4.1%) |
| $25,000 to $49,999 | 674 (100.0%) | 0 (0.0%) |
| $50,000 to $74,999 | 1,510 (99.0%) | 15 (1.0%) |
| $75,000 to $99,999 | 1,458 (99.1%) | 13 (0.9%) |
| $100,000 and over | 9,216 (97.5%) | 232 (2.5%) |
Public vs Private Health Insurance Coverage by Age in Brecksville
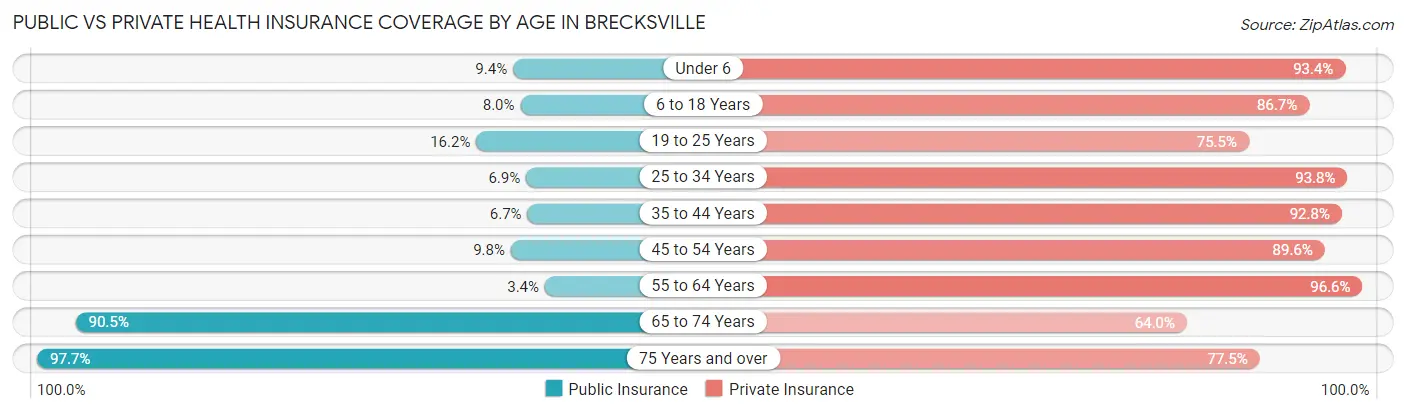
| Age Bracket | Public Insurance | Private Insurance |
| Under 6 | 101 (9.3%) | 1,009 (93.4%) |
| 6 to 18 Years | 143 (8.0%) | 1,555 (86.7%) |
| 19 to 25 Years | 119 (16.2%) | 556 (75.5%) |
| 25 to 34 Years | 64 (6.9%) | 866 (93.8%) |
| 35 to 44 Years | 99 (6.7%) | 1,378 (92.8%) |
| 45 to 54 Years | 173 (9.8%) | 1,589 (89.6%) |
| 55 to 64 Years | 83 (3.4%) | 2,341 (96.6%) |
| 65 to 74 Years | 1,818 (90.5%) | 1,286 (64.0%) |
| 75 Years and over | 1,213 (97.7%) | 963 (77.5%) |
| Total | 3,813 (28.3%) | 11,543 (85.7%) |
Disability Status by Sex by Age in Brecksville
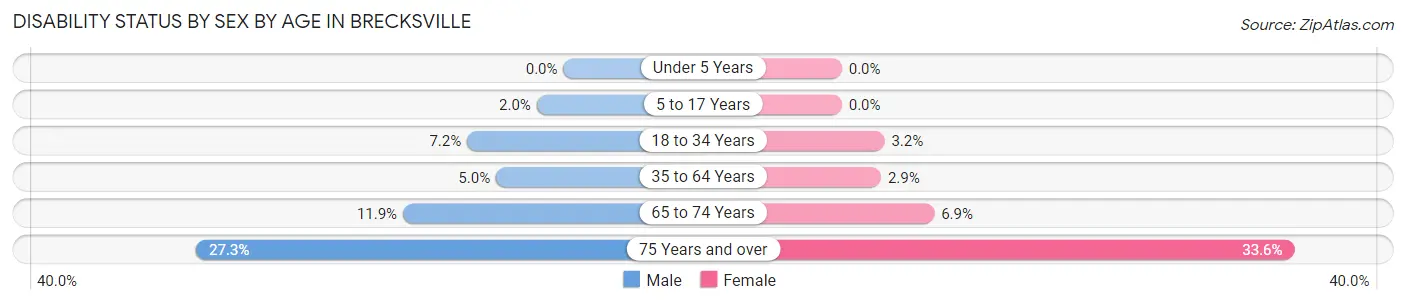
| Age Bracket | Male | Female |
| Under 5 Years | 0 (0.0%) | 0 (0.0%) |
| 5 to 17 Years | 19 (2.0%) | 0 (0.0%) |
| 18 to 34 Years | 76 (7.1%) | 27 (3.2%) |
| 35 to 64 Years | 143 (5.0%) | 82 (2.9%) |
| 65 to 74 Years | 128 (11.9%) | 64 (6.9%) |
| 75 Years and over | 135 (27.3%) | 251 (33.6%) |
Disability Class by Sex by Age in Brecksville
Disability Class: Hearing Difficulty
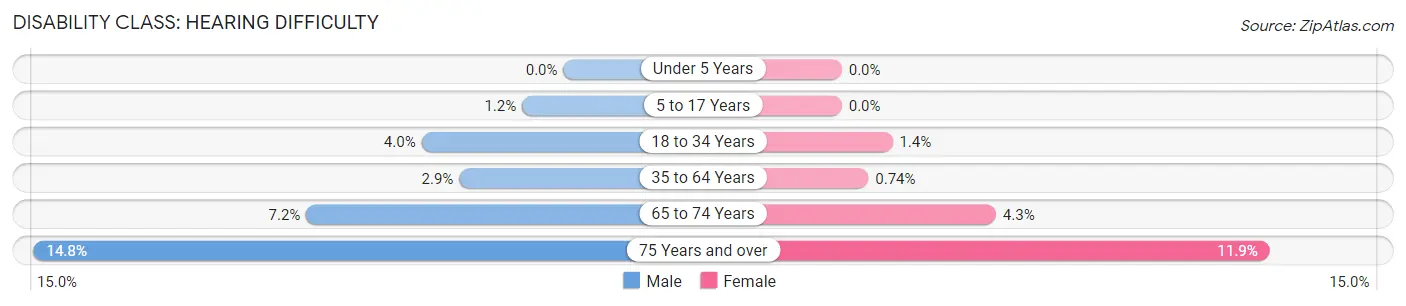
| Age Bracket | Male | Female |
| Under 5 Years | 0 (0.0%) | 0 (0.0%) |
| 5 to 17 Years | 11 (1.1%) | 0 (0.0%) |
| 18 to 34 Years | 42 (4.0%) | 12 (1.4%) |
| 35 to 64 Years | 83 (2.9%) | 21 (0.7%) |
| 65 to 74 Years | 77 (7.2%) | 40 (4.3%) |
| 75 Years and over | 73 (14.7%) | 89 (11.9%) |
Disability Class: Vision Difficulty
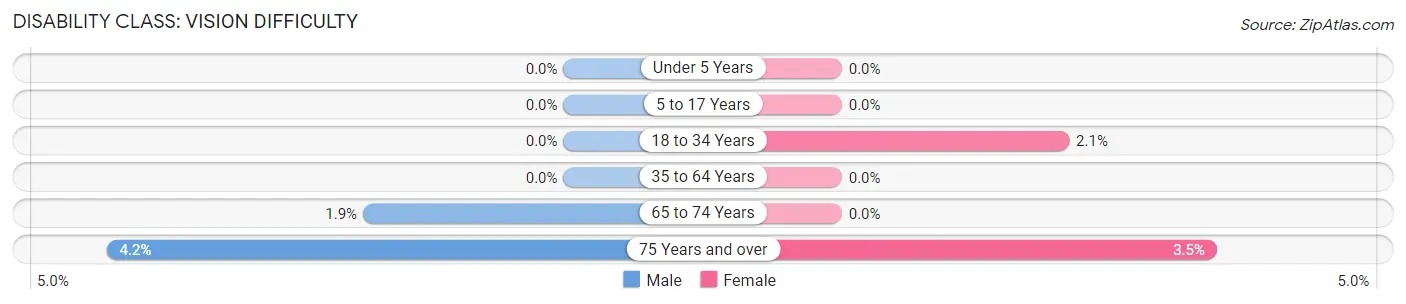
| Age Bracket | Male | Female |
| Under 5 Years | 0 (0.0%) | 0 (0.0%) |
| 5 to 17 Years | 0 (0.0%) | 0 (0.0%) |
| 18 to 34 Years | 0 (0.0%) | 18 (2.1%) |
| 35 to 64 Years | 0 (0.0%) | 0 (0.0%) |
| 65 to 74 Years | 20 (1.9%) | 0 (0.0%) |
| 75 Years and over | 21 (4.2%) | 26 (3.5%) |
Disability Class: Cognitive Difficulty
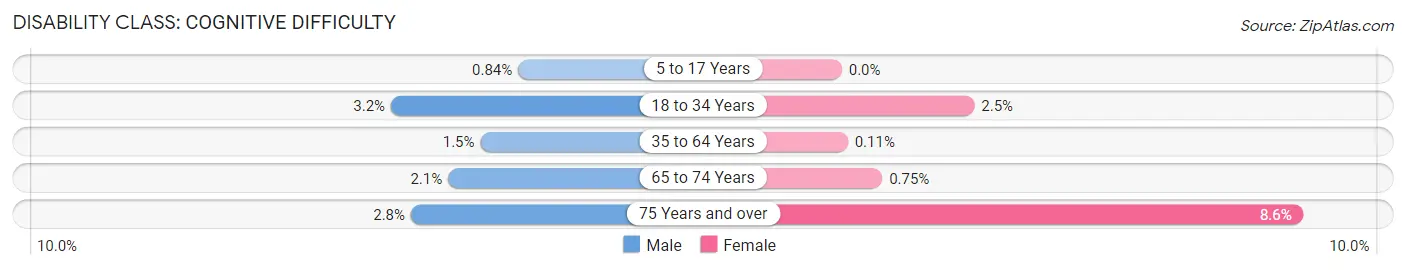
| Age Bracket | Male | Female |
| 5 to 17 Years | 8 (0.8%) | 0 (0.0%) |
| 18 to 34 Years | 34 (3.2%) | 21 (2.5%) |
| 35 to 64 Years | 44 (1.5%) | 3 (0.1%) |
| 65 to 74 Years | 23 (2.1%) | 7 (0.7%) |
| 75 Years and over | 14 (2.8%) | 64 (8.6%) |
Disability Class: Ambulatory Difficulty
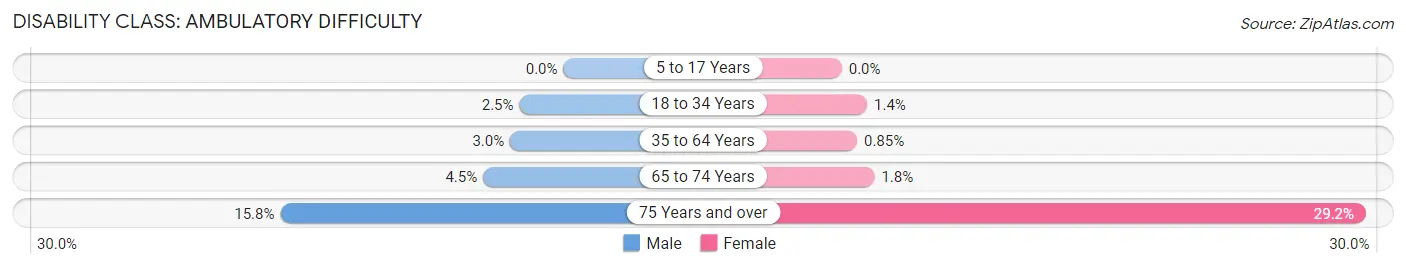
| Age Bracket | Male | Female |
| 5 to 17 Years | 0 (0.0%) | 0 (0.0%) |
| 18 to 34 Years | 26 (2.5%) | 12 (1.4%) |
| 35 to 64 Years | 85 (3.0%) | 24 (0.9%) |
| 65 to 74 Years | 48 (4.5%) | 17 (1.8%) |
| 75 Years and over | 78 (15.8%) | 218 (29.2%) |
Disability Class: Self-Care Difficulty
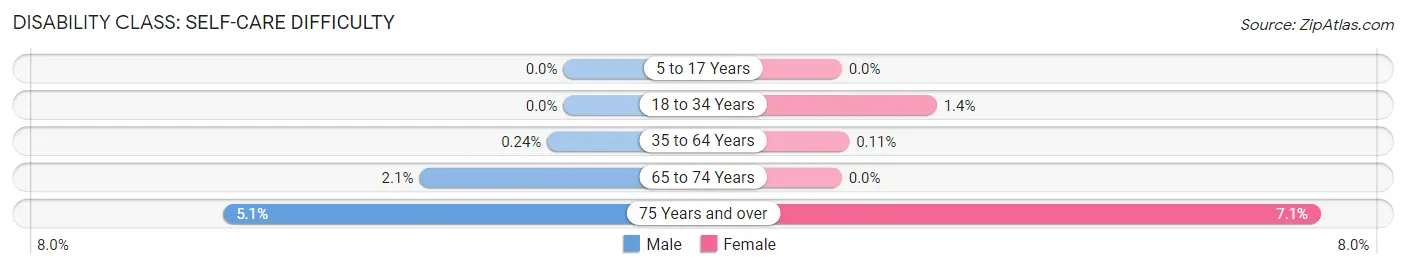
| Age Bracket | Male | Female |
| 5 to 17 Years | 0 (0.0%) | 0 (0.0%) |
| 18 to 34 Years | 0 (0.0%) | 12 (1.4%) |
| 35 to 64 Years | 7 (0.2%) | 3 (0.1%) |
| 65 to 74 Years | 23 (2.1%) | 0 (0.0%) |
| 75 Years and over | 25 (5.1%) | 53 (7.1%) |
Technology Access in Brecksville
Computing Device Access in Brecksville
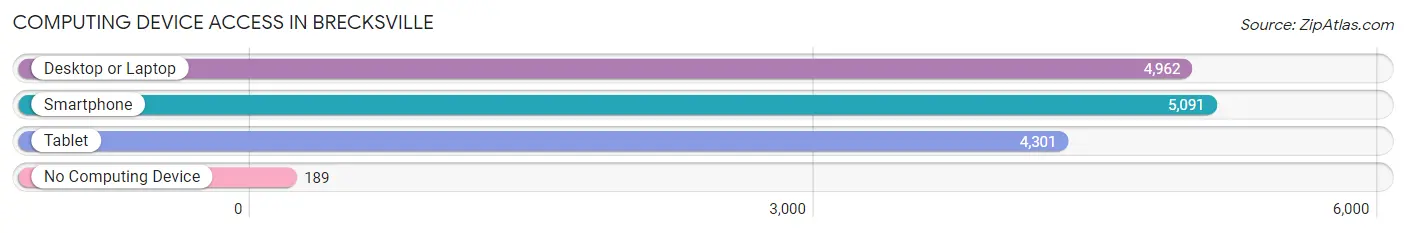
| Device Type | # Households | % Households |
| Desktop or Laptop | 4,962 | 89.0% |
| Smartphone | 5,091 | 91.3% |
| Tablet | 4,301 | 77.2% |
| No Computing Device | 189 | 3.4% |
| Total | 5,574 | 100.0% |
Internet Access in Brecksville
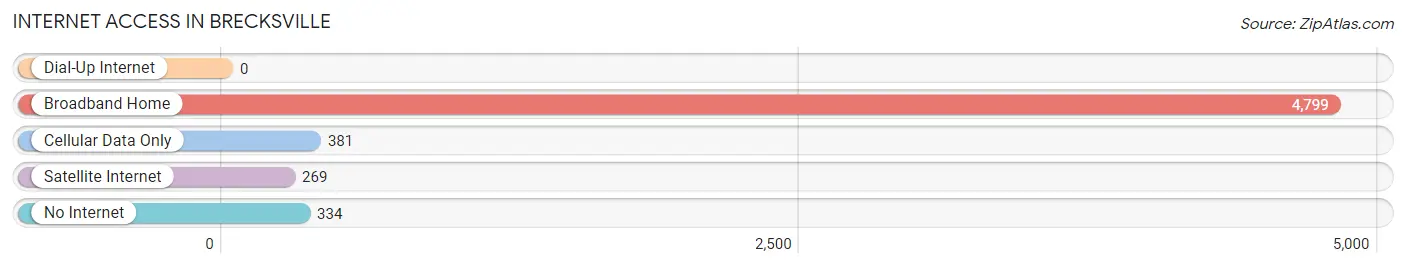
| Internet Type | # Households | % Households |
| Dial-Up Internet | 0 | 0.0% |
| Broadband Home | 4,799 | 86.1% |
| Cellular Data Only | 381 | 6.8% |
| Satellite Internet | 269 | 4.8% |
| No Internet | 334 | 6.0% |
| Total | 5,574 | 100.0% |
Brecksville Summary
History
The area now known as Brecksville, Ohio was first settled in 1811 by a group of pioneers from Connecticut. The town was originally known as “Brecksville Station” and was named after the Brecks family who had settled in the area. The town was officially incorporated in 1845 and was named after the Brecks family.
The town of Brecksville was originally a farming community, with the majority of the population being of German descent. The town was also home to a number of small businesses, including a sawmill, a gristmill, and a blacksmith shop.
In the late 19th century, the town began to grow and develop. The Cleveland and Pittsburgh Railroad was built through the town in 1881, and the town was connected to the rest of the country by the Ohio and Erie Canal in 1892. This allowed for the growth of the town’s economy and population.
In the early 20th century, Brecksville began to experience a period of rapid growth. The town was home to a number of factories, including a steel mill, a paper mill, and a brickyard. The town also became a popular tourist destination, with many people visiting the nearby Cuyahoga Valley National Park.
The town continued to grow throughout the 20th century, and by the year 2000, the population had grown to over 8,000 people.
Geography
Brecksville is located in Cuyahoga County, Ohio, approximately 20 miles south of Cleveland. The town is situated on the Cuyahoga River, and is bordered by the cities of Broadview Heights, North Royalton, and Independence.
The town covers an area of 8.3 square miles, and is mostly flat with some rolling hills. The town is home to a number of parks and recreational areas, including the Brecksville Reservation, which is part of the Cleveland Metroparks system.
Economy
The economy of Brecksville is largely based on the service industry, with many residents employed in retail, healthcare, and education. The town is also home to a number of small businesses, including restaurants, shops, and professional services.
The town is also home to a number of large employers, including the Cleveland Clinic, the Cleveland Metroparks, and the Cleveland-Cuyahoga County Port Authority.
Demographics
As of the 2010 census, the population of Brecksville was 8,381. The racial makeup of the town was 94.3% White, 2.2% African American, 0.3% Native American, 1.3% Asian, 0.1% Pacific Islander, 0.7% from other races, and 1.3% from two or more races. Hispanic or Latino of any race were 2.2% of the population.
The median household income in Brecksville was $76,945, and the median family income was $90,945. The per capita income for the town was $37,945. About 3.2% of families and 4.3% of the population were below the poverty line, including 5.2% of those under age 18 and 4.2% of those age 65 or over.
Common Questions
What is Per Capita Income in Brecksville?
Per Capita income in Brecksville is $62,031.
What is the Median Family Income in Brecksville?
Median Family Income in Brecksville is $137,443.
What is the Median Household income in Brecksville?
Median Household Income in Brecksville is $122,546.
What is Income or Wage Gap in Brecksville?
Income or Wage Gap in Brecksville is 26.7%.
Women in Brecksville earn 73.3 cents for every dollar earned by a man.
What is Family Income Deficit in Brecksville?
Family Income Deficit in Brecksville is $7,858.
Families that are below poverty line in Brecksville earn $7,858 less on average than the poverty threshold level.
What is Inequality or Gini Index in Brecksville?
Inequality or Gini Index in Brecksville is 0.40.
What is the Total Population of Brecksville?
Total Population of Brecksville is 13,618.
What is the Total Male Population of Brecksville?
Total Male Population of Brecksville is 7,069.
What is the Total Female Population of Brecksville?
Total Female Population of Brecksville is 6,549.
What is the Ratio of Males per 100 Females in Brecksville?
There are 107.94 Males per 100 Females in Brecksville.
What is the Ratio of Females per 100 Males in Brecksville?
There are 92.64 Females per 100 Males in Brecksville.
What is the Median Population Age in Brecksville?
Median Population Age in Brecksville is 50.2 Years.
What is the Average Family Size in Brecksville
Average Family Size in Brecksville is 3.0 People.
What is the Average Household Size in Brecksville
Average Household Size in Brecksville is 2.4 People.
How Large is the Labor Force in Brecksville?
There are 7,396 People in the Labor Forcein in Brecksville.
What is the Percentage of People in the Labor Force in Brecksville?
65.3% of People are in the Labor Force in Brecksville.
What is the Unemployment Rate in Brecksville?
Unemployment Rate in Brecksville is 6.1%.