Alamo, CA Map & Demographics
Alamo Map
Alamo Overview
$134,776
PER CAPITA INCOME
$250,001
AVG FAMILY INCOME
$250,001
AVG HOUSEHOLD INCOME
77.6%
WAGE / INCOME GAP [ % ]
22.4¢/ $1
WAGE / INCOME GAP [ $ ]
$8,083
FAMILY INCOME DEFICIT
0.47
INEQUALITY / GINI INDEX
14,355
TOTAL POPULATION
7,302
MALE POPULATION
7,053
FEMALE POPULATION
103.53
MALES / 100 FEMALES
96.59
FEMALES / 100 MALES
51.1
MEDIAN AGE
3.0
AVG FAMILY SIZE
2.9
AVG HOUSEHOLD SIZE
6,389
LABOR FORCE [ PEOPLE ]
54.0%
PERCENT IN LABOR FORCE
2.7%
UNEMPLOYMENT RATE
Alamo Zip Codes
Income in Alamo
Income Overview in Alamo
Per Capita Income in Alamo is $134,776, while median incomes of families and households are $250,001 and $250,001 respectively.
| Characteristic | Number | Measure |
| Per Capita Income | 14,355 | $134,776 |
| Median Family Income | 4,326 | $250,001 |
| Mean Family Income | 4,326 | $413,454 |
| Median Household Income | 4,963 | $250,001 |
| Mean Household Income | 4,963 | $385,967 |
| Income Deficit | 4,326 | $8,083 |
| Wage / Income Gap (%) | 14,355 | 77.58% |
| Wage / Income Gap ($) | 14,355 | 22.42¢ per $1 |
| Gini / Inequality Index | 14,355 | 0.47 |
Earnings by Sex in Alamo
Average Earnings in Alamo are $104,112, $200,656 for men and $44,985 for women, a difference of 77.6%.
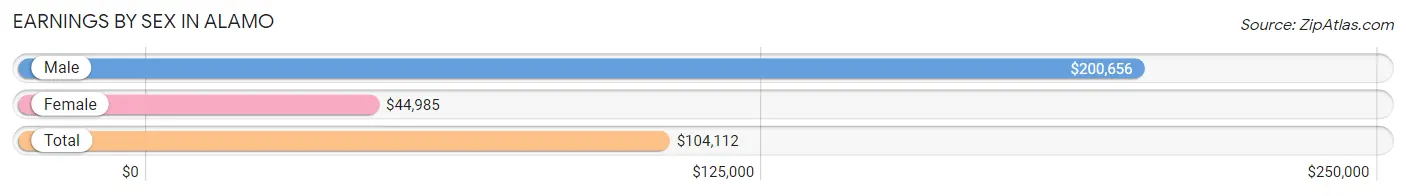
| Sex | Number | Average Earnings |
| Male | 3,724 (53.6%) | $200,656 |
| Female | 3,219 (46.4%) | $44,985 |
| Total | 6,943 (100.0%) | $104,112 |
Earnings by Sex by Income Bracket in Alamo
The most common earnings brackets in Alamo are $100,000+ for men (2,566 | 68.9%) and $100,000+ for women (980 | 30.4%).
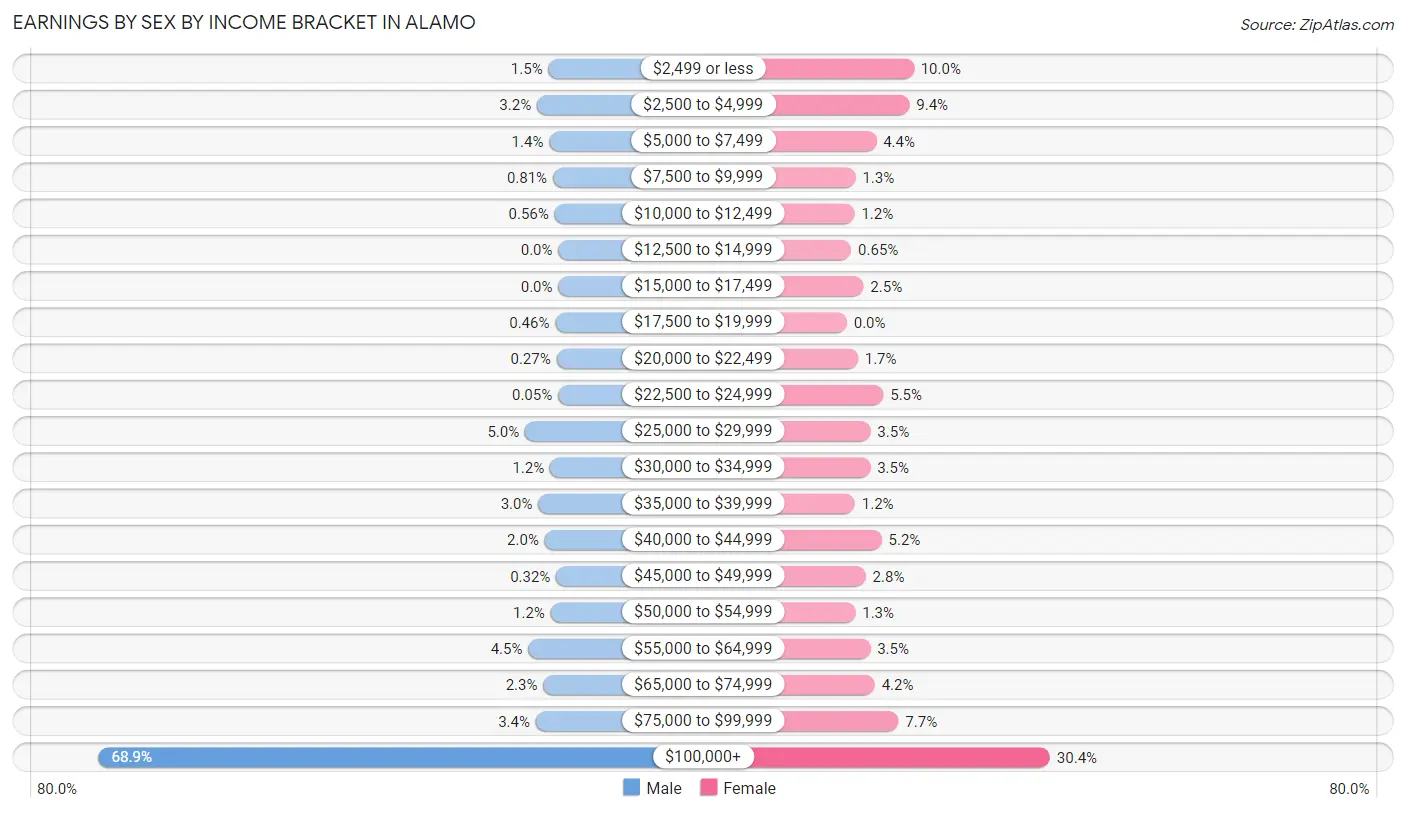
| Income | Male | Female |
| $2,499 or less | 55 (1.5%) | 323 (10.0%) |
| $2,500 to $4,999 | 119 (3.2%) | 302 (9.4%) |
| $5,000 to $7,499 | 51 (1.4%) | 142 (4.4%) |
| $7,500 to $9,999 | 30 (0.8%) | 42 (1.3%) |
| $10,000 to $12,499 | 21 (0.6%) | 37 (1.1%) |
| $12,500 to $14,999 | 0 (0.0%) | 21 (0.6%) |
| $15,000 to $17,499 | 0 (0.0%) | 80 (2.5%) |
| $17,500 to $19,999 | 17 (0.5%) | 0 (0.0%) |
| $20,000 to $22,499 | 10 (0.3%) | 53 (1.7%) |
| $22,500 to $24,999 | 2 (0.1%) | 176 (5.5%) |
| $25,000 to $29,999 | 186 (5.0%) | 114 (3.5%) |
| $30,000 to $34,999 | 46 (1.2%) | 113 (3.5%) |
| $35,000 to $39,999 | 112 (3.0%) | 39 (1.2%) |
| $40,000 to $44,999 | 76 (2.0%) | 168 (5.2%) |
| $45,000 to $49,999 | 12 (0.3%) | 91 (2.8%) |
| $50,000 to $54,999 | 43 (1.1%) | 41 (1.3%) |
| $55,000 to $64,999 | 168 (4.5%) | 113 (3.5%) |
| $65,000 to $74,999 | 84 (2.3%) | 135 (4.2%) |
| $75,000 to $99,999 | 126 (3.4%) | 249 (7.7%) |
| $100,000+ | 2,566 (68.9%) | 980 (30.4%) |
| Total | 3,724 (100.0%) | 3,219 (100.0%) |
Earnings by Sex by Educational Attainment in Alamo
Average earnings in Alamo are $218,216 for men and $69,722 for women, a difference of 68.0%. Men with an educational attainment of graduate degree enjoy the highest average annual earnings of $250,001, while those with high school diploma education earn the least with $65,972. Women with an educational attainment of graduate degree earn the most with the average annual earnings of $95,500, while those with college or associate's degree education have the smallest earnings of $25,714.
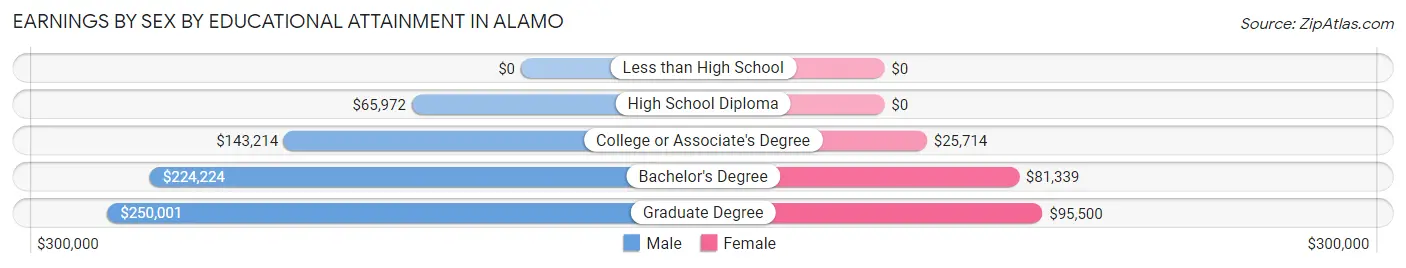
| Educational Attainment | Male Income | Female Income |
| Less than High School | - | - |
| High School Diploma | $65,972 | $0 |
| College or Associate's Degree | $143,214 | $25,714 |
| Bachelor's Degree | $224,224 | $81,339 |
| Graduate Degree | $250,001 | $95,500 |
| Total | $218,216 | $69,722 |
Family Income in Alamo
Family Income Brackets in Alamo
According to the Alamo family income data, there are 3,084 families falling into the $200,000+ income range, which is the most common income bracket and makes up 71.3% of all families.
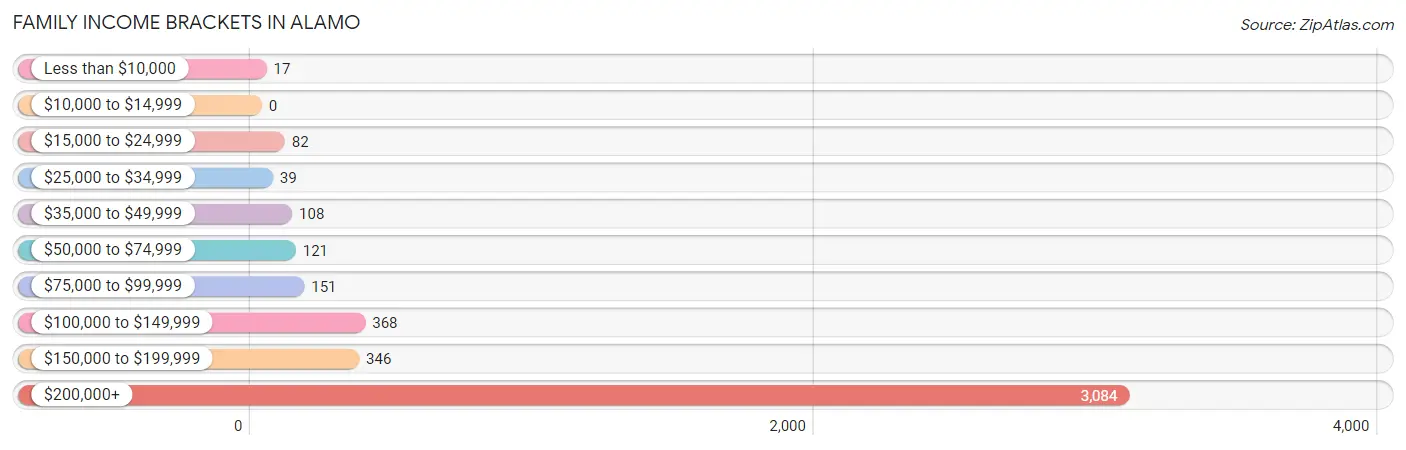
| Income Bracket | # Families | % Families |
| Less than $10,000 | 17 | 0.4% |
| $10,000 to $14,999 | 0 | 0.0% |
| $15,000 to $24,999 | 82 | 1.9% |
| $25,000 to $34,999 | 39 | 0.9% |
| $35,000 to $49,999 | 108 | 2.5% |
| $50,000 to $74,999 | 121 | 2.8% |
| $75,000 to $99,999 | 151 | 3.5% |
| $100,000 to $149,999 | 368 | 8.5% |
| $150,000 to $199,999 | 346 | 8.0% |
| $200,000+ | 3,084 | 71.3% |
Family Income by Famaliy Size in Alamo
3-person families (540 | 12.5%) account for the highest median family income in Alamo with $250,001 per family, while 2-person families (2,402 | 55.5%) have the highest median income of $123,145 per family member.
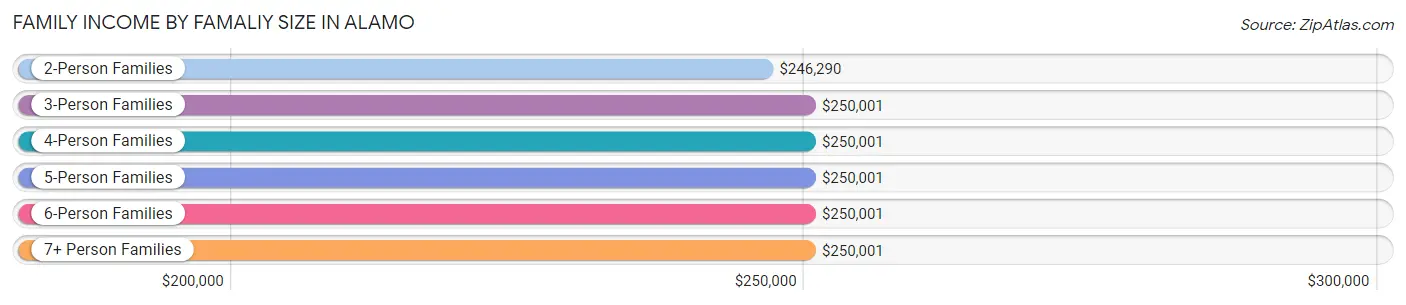
| Income Bracket | # Families | Median Income |
| 2-Person Families | 2,402 (55.5%) | $246,290 |
| 3-Person Families | 540 (12.5%) | $250,001 |
| 4-Person Families | 726 (16.8%) | $250,001 |
| 5-Person Families | 494 (11.4%) | $250,001 |
| 6-Person Families | 106 (2.5%) | $250,001 |
| 7+ Person Families | 58 (1.3%) | $250,001 |
| Total | 4,326 (100.0%) | $250,001 |
Family Income by Number of Earners in Alamo
The median family income in Alamo is $250,001, with families comprising 1 earner (1,460) having the highest median family income of $250,001, while families with no earners (779) have the lowest median family income of $127,279, accounting for 33.8% and 18.0% of families, respectively.
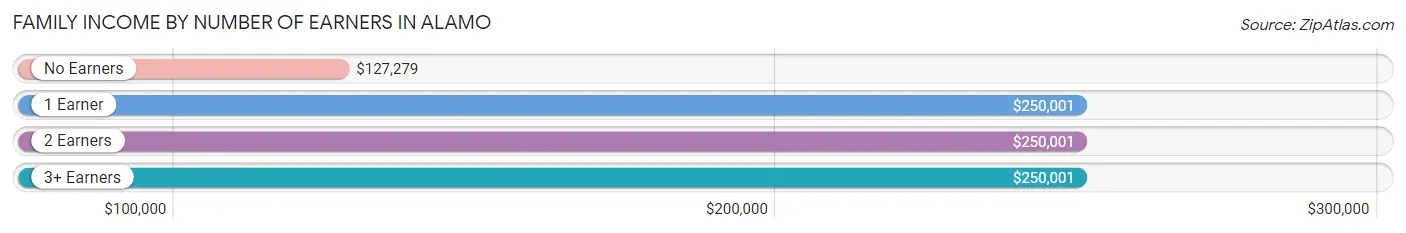
| Number of Earners | # Families | Median Income |
| No Earners | 779 (18.0%) | $127,279 |
| 1 Earner | 1,460 (33.8%) | $250,001 |
| 2 Earners | 1,583 (36.6%) | $250,001 |
| 3+ Earners | 504 (11.7%) | $250,001 |
| Total | 4,326 (100.0%) | $250,001 |
Household Income in Alamo
Household Income Brackets in Alamo
With 3,261 households falling in the category, the $200,000+ income range is the most frequent in Alamo, accounting for 65.7% of all households. In contrast, only 35 households (0.7%) fall into the $10,000 to $14,999 income bracket, making it the least populous group.
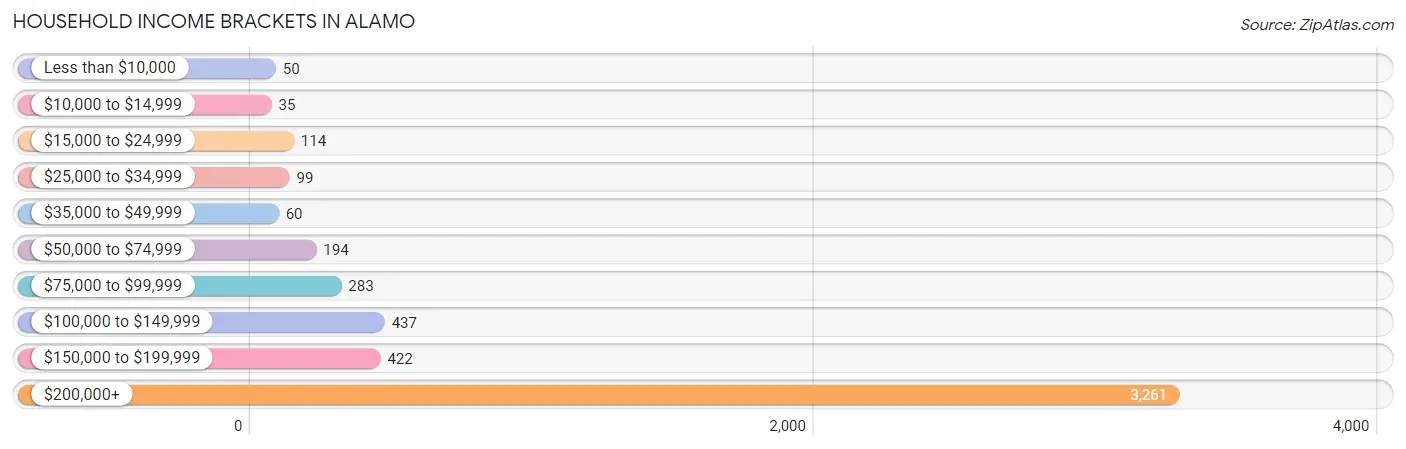
| Income Bracket | # Households | % Households |
| Less than $10,000 | 50 | 1.0% |
| $10,000 to $14,999 | 35 | 0.7% |
| $15,000 to $24,999 | 114 | 2.3% |
| $25,000 to $34,999 | 99 | 2.0% |
| $35,000 to $49,999 | 60 | 1.2% |
| $50,000 to $74,999 | 194 | 3.9% |
| $75,000 to $99,999 | 283 | 5.7% |
| $100,000 to $149,999 | 437 | 8.8% |
| $150,000 to $199,999 | 422 | 8.5% |
| $200,000+ | 3,261 | 65.7% |
Household Income by Householder Age in Alamo
The median household income in Alamo is $250,001, with the highest median household income of $250,001 found in the 25 to 44 years age bracket for the primary householder. A total of 538 households (10.8%) fall into this category. Meanwhile, the 15 to 24 years age bracket for the primary householder has the lowest median household income of $0, with 76 households (1.5%) in this group.
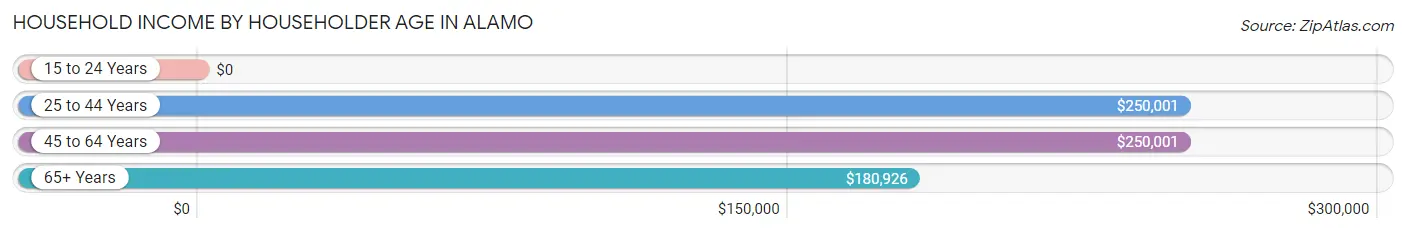
| Income Bracket | # Households | Median Income |
| 15 to 24 Years | 76 (1.5%) | $0 |
| 25 to 44 Years | 538 (10.8%) | $250,001 |
| 45 to 64 Years | 2,317 (46.7%) | $250,001 |
| 65+ Years | 2,032 (40.9%) | $180,926 |
| Total | 4,963 (100.0%) | $250,001 |
Poverty in Alamo
Income Below Poverty by Sex and Age in Alamo
With 4.4% poverty level for males and 2.8% for females among the residents of Alamo, 25 to 34 year old males and 75 year old and over females are the most vulnerable to poverty, with 82 males (22.7%) and 54 females (6.3%) in their respective age groups living below the poverty level.
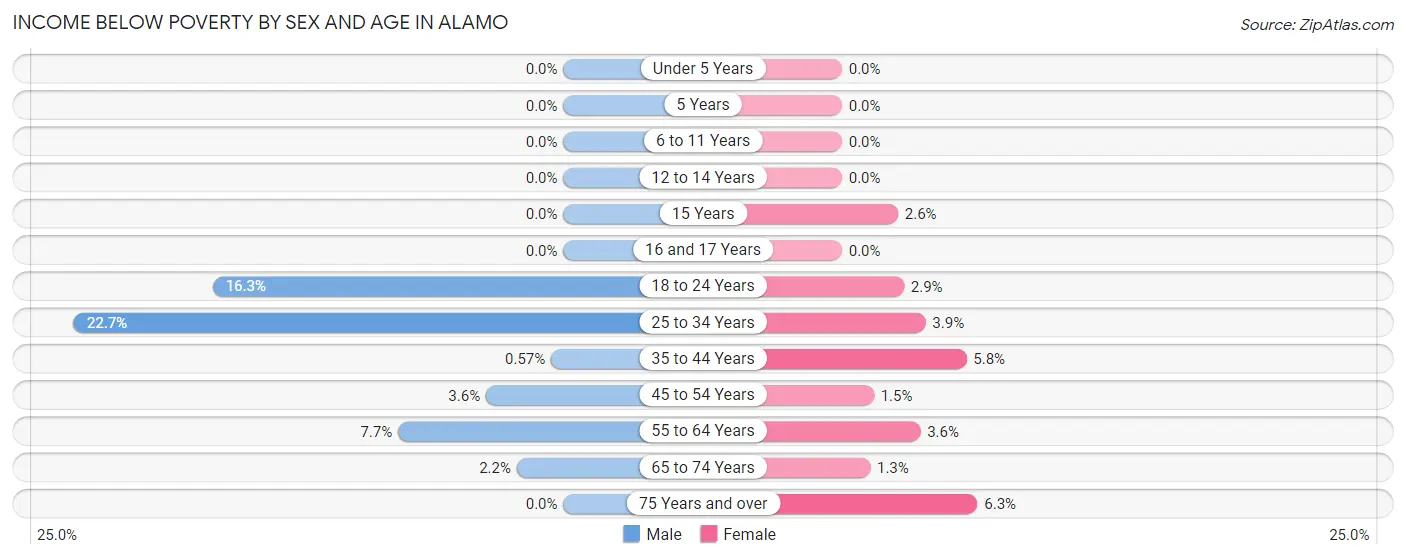
| Age Bracket | Male | Female |
| Under 5 Years | 0 (0.0%) | 0 (0.0%) |
| 5 Years | 0 (0.0%) | 0 (0.0%) |
| 6 to 11 Years | 0 (0.0%) | 0 (0.0%) |
| 12 to 14 Years | 0 (0.0%) | 0 (0.0%) |
| 15 Years | 0 (0.0%) | 4 (2.6%) |
| 16 and 17 Years | 0 (0.0%) | 0 (0.0%) |
| 18 to 24 Years | 75 (16.3%) | 15 (2.9%) |
| 25 to 34 Years | 82 (22.7%) | 10 (3.9%) |
| 35 to 44 Years | 3 (0.6%) | 36 (5.8%) |
| 45 to 54 Years | 42 (3.6%) | 15 (1.5%) |
| 55 to 64 Years | 101 (7.7%) | 52 (3.6%) |
| 65 to 74 Years | 20 (2.2%) | 12 (1.3%) |
| 75 Years and over | 0 (0.0%) | 54 (6.3%) |
| Total | 323 (4.4%) | 198 (2.8%) |
Income Above Poverty by Sex and Age in Alamo
According to the poverty statistics in Alamo, males aged under 5 years and females aged under 5 years are the age groups that are most secure financially, with 100.0% of males and 100.0% of females in these age groups living above the poverty line.
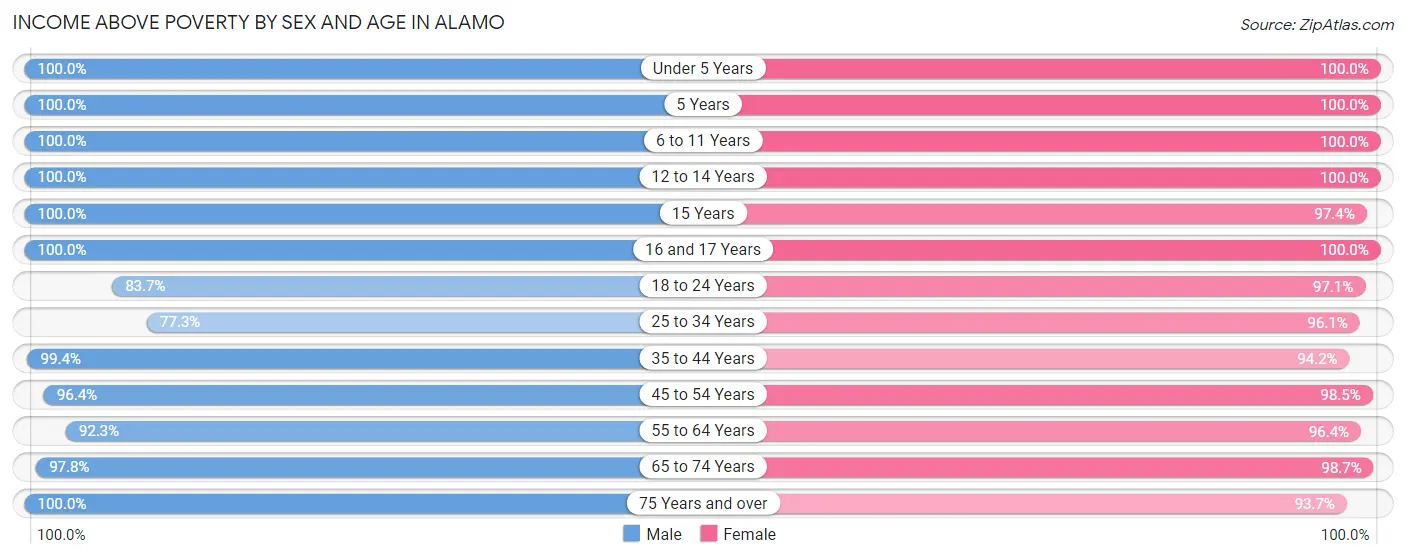
| Age Bracket | Male | Female |
| Under 5 Years | 247 (100.0%) | 179 (100.0%) |
| 5 Years | 94 (100.0%) | 12 (100.0%) |
| 6 to 11 Years | 484 (100.0%) | 459 (100.0%) |
| 12 to 14 Years | 374 (100.0%) | 314 (100.0%) |
| 15 Years | 158 (100.0%) | 150 (97.4%) |
| 16 and 17 Years | 246 (100.0%) | 280 (100.0%) |
| 18 to 24 Years | 386 (83.7%) | 506 (97.1%) |
| 25 to 34 Years | 279 (77.3%) | 248 (96.1%) |
| 35 to 44 Years | 525 (99.4%) | 587 (94.2%) |
| 45 to 54 Years | 1,129 (96.4%) | 996 (98.5%) |
| 55 to 64 Years | 1,215 (92.3%) | 1,376 (96.4%) |
| 65 to 74 Years | 904 (97.8%) | 902 (98.7%) |
| 75 Years and over | 916 (100.0%) | 805 (93.7%) |
| Total | 6,957 (95.6%) | 6,814 (97.2%) |
Income Below Poverty Among Married-Couple Families in Alamo
The poverty statistics for married-couple families in Alamo show that 1.6% or 66 of the total 4,051 families live below the poverty line. Families with no children have the highest poverty rate of 2.5%, comprising of 66 families. On the other hand, families with 1 or 2 children have the lowest poverty rate of 0.0%, which includes 0 families.
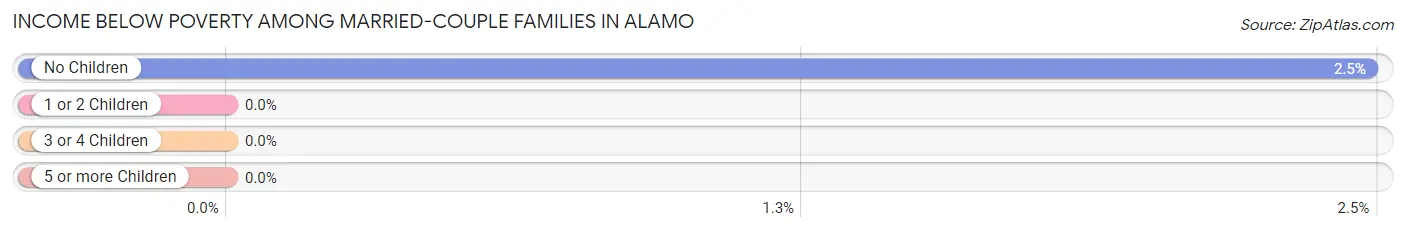
| Children | Above Poverty | Below Poverty |
| No Children | 2,600 (97.5%) | 66 (2.5%) |
| 1 or 2 Children | 985 (100.0%) | 0 (0.0%) |
| 3 or 4 Children | 395 (100.0%) | 0 (0.0%) |
| 5 or more Children | 5 (100.0%) | 0 (0.0%) |
| Total | 3,985 (98.4%) | 66 (1.6%) |
Income Below Poverty Among Single-Parent Households in Alamo
| Children | Single Father | Single Mother |
| No Children | 0 (0.0%) | 0 (0.0%) |
| 1 or 2 Children | 0 (0.0%) | 0 (0.0%) |
| 3 or 4 Children | 0 (0.0%) | 0 (0.0%) |
| 5 or more Children | 0 (0.0%) | 0 (0.0%) |
| Total | 0 (0.0%) | 0 (0.0%) |
Income Below Poverty Among Married-Couple vs Single-Parent Households in Alamo
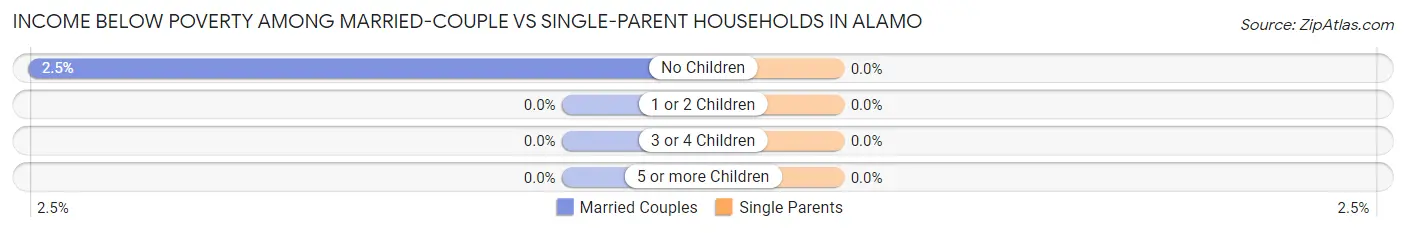
| Children | Married-Couple Families | Single-Parent Households |
| No Children | 66 (2.5%) | 0 (0.0%) |
| 1 or 2 Children | 0 (0.0%) | 0 (0.0%) |
| 3 or 4 Children | 0 (0.0%) | 0 (0.0%) |
| 5 or more Children | 0 (0.0%) | 0 (0.0%) |
| Total | 66 (1.6%) | 0 (0.0%) |
Race in Alamo
The most populous races in Alamo are White / Caucasian (11,232 | 78.2%), Asian (1,659 | 11.6%), and Hispanic or Latino (1,096 | 7.6%).
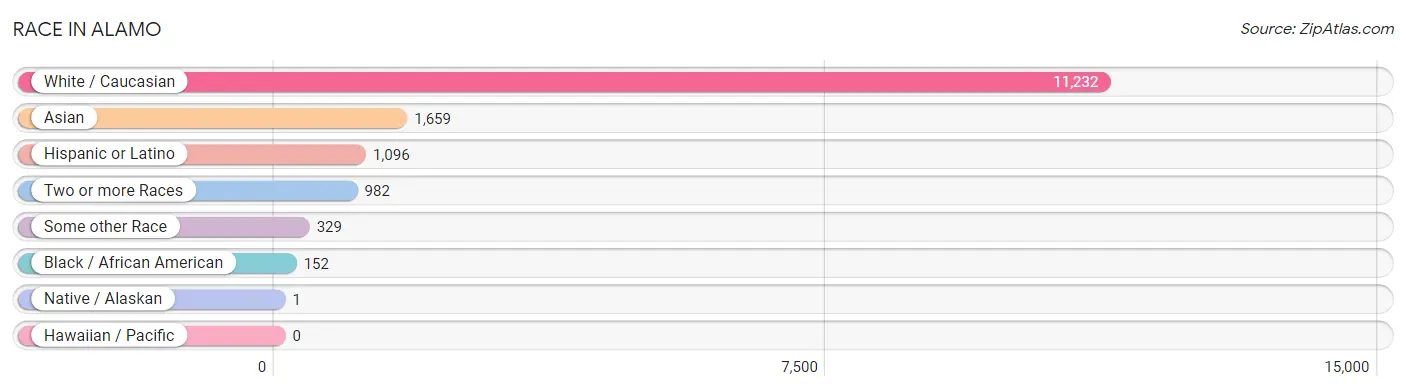
| Race | # Population | % Population |
| Asian | 1,659 | 11.6% |
| Black / African American | 152 | 1.1% |
| Hawaiian / Pacific | 0 | 0.0% |
| Hispanic or Latino | 1,096 | 7.6% |
| Native / Alaskan | 1 | 0.0% |
| White / Caucasian | 11,232 | 78.2% |
| Two or more Races | 982 | 6.8% |
| Some other Race | 329 | 2.3% |
| Total | 14,355 | 100.0% |
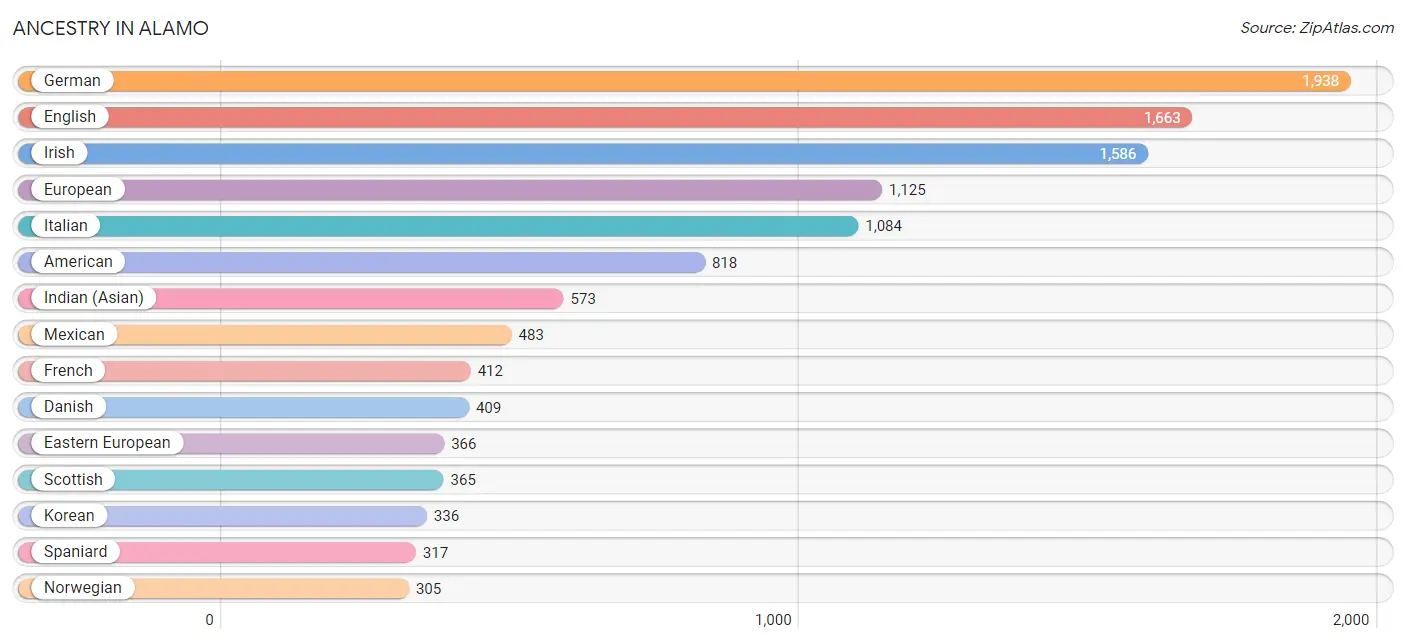
Ancestry in Alamo
The most populous ancestries reported in Alamo are German (1,938 | 13.5%), English (1,663 | 11.6%), Irish (1,586 | 11.1%), European (1,125 | 7.8%), and Italian (1,084 | 7.5%), together accounting for 51.5% of all Alamo residents.
| Ancestry | # Population | % Population |
| Afghan | 221 | 1.5% |
| African | 1 | 0.0% |
| Albanian | 16 | 0.1% |
| American | 818 | 5.7% |
| Arab | 45 | 0.3% |
| Argentinean | 16 | 0.1% |
| Armenian | 9 | 0.1% |
| Austrian | 185 | 1.3% |
| Bhutanese | 266 | 1.8% |
| British | 31 | 0.2% |
| Burmese | 219 | 1.5% |
| Canadian | 22 | 0.2% |
| Central American | 6 | 0.0% |
| Chilean | 27 | 0.2% |
| Colombian | 73 | 0.5% |
| Croatian | 40 | 0.3% |
| Cuban | 43 | 0.3% |
| Czech | 35 | 0.2% |
| Czechoslovakian | 28 | 0.2% |
| Danish | 409 | 2.9% |
| Dutch | 253 | 1.8% |
| Eastern European | 366 | 2.5% |
| Ecuadorian | 51 | 0.4% |
| Egyptian | 28 | 0.2% |
| English | 1,663 | 11.6% |
| European | 1,125 | 7.8% |
| Filipino | 228 | 1.6% |
| Finnish | 16 | 0.1% |
| French | 412 | 2.9% |
| French Canadian | 37 | 0.3% |
| German | 1,938 | 13.5% |
| Greek | 229 | 1.6% |
| Hungarian | 35 | 0.2% |
| Indian (Asian) | 573 | 4.0% |
| Iranian | 146 | 1.0% |
| Irish | 1,586 | 11.1% |
| Israeli | 13 | 0.1% |
| Italian | 1,084 | 7.5% |
| Korean | 336 | 2.3% |
| Lebanese | 36 | 0.3% |
| Lithuanian | 31 | 0.2% |
| Maltese | 30 | 0.2% |
| Mexican | 483 | 3.4% |
| New Zealander | 78 | 0.5% |
| Nicaraguan | 6 | 0.0% |
| Northern European | 164 | 1.1% |
| Norwegian | 305 | 2.1% |
| Peruvian | 46 | 0.3% |
| Polish | 172 | 1.2% |
| Portuguese | 282 | 2.0% |
| Romanian | 52 | 0.4% |
| Russian | 163 | 1.1% |
| Scandinavian | 46 | 0.3% |
| Scotch-Irish | 123 | 0.9% |
| Scottish | 365 | 2.5% |
| Serbian | 46 | 0.3% |
| Slavic | 55 | 0.4% |
| Slovak | 32 | 0.2% |
| Slovene | 12 | 0.1% |
| South African | 9 | 0.1% |
| South American | 213 | 1.5% |
| South American Indian | 14 | 0.1% |
| Spaniard | 317 | 2.2% |
| Spanish | 9 | 0.1% |
| Sri Lankan | 99 | 0.7% |
| Subsaharan African | 10 | 0.1% |
| Swedish | 213 | 1.5% |
| Swiss | 74 | 0.5% |
| Thai | 238 | 1.7% |
| Ukrainian | 149 | 1.0% |
| Welsh | 57 | 0.4% |
| Yugoslavian | 15 | 0.1% |
| Yup'ik | 1 | 0.0% | View All 73 Rows |
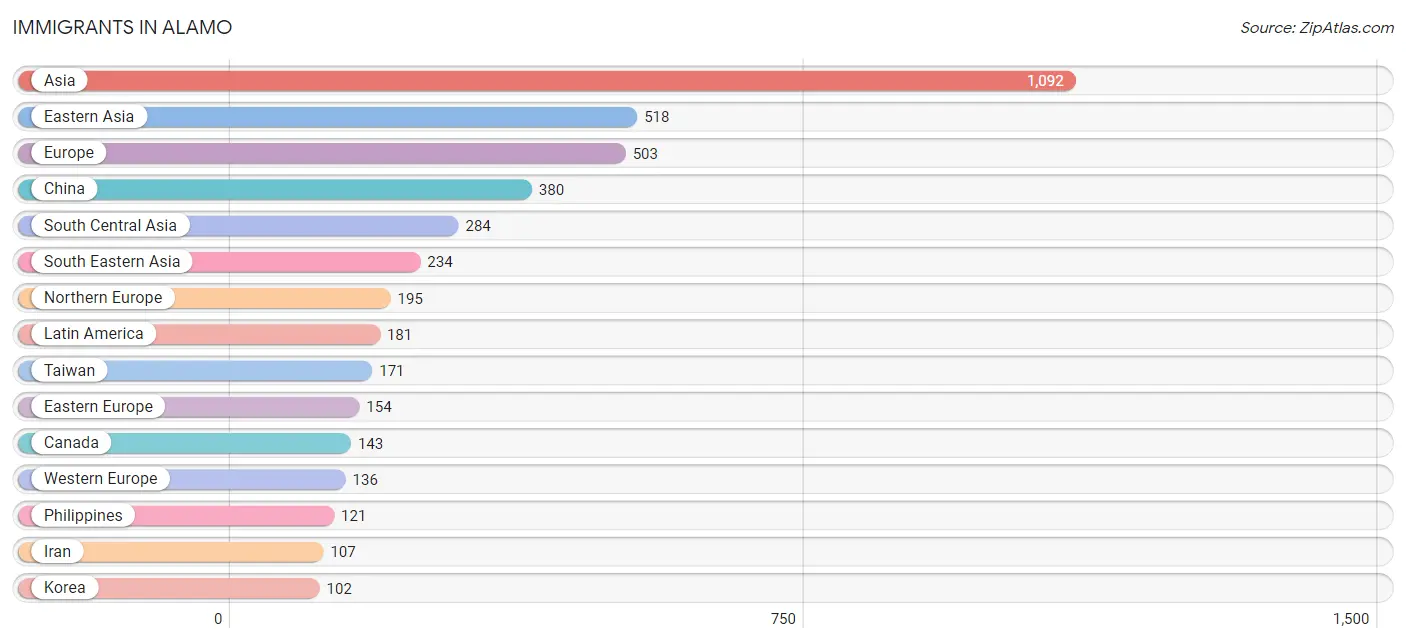
Immigrants in Alamo
The most numerous immigrant groups reported in Alamo came from Asia (1,092 | 7.6%), Eastern Asia (518 | 3.6%), Europe (503 | 3.5%), China (380 | 2.6%), and South Central Asia (284 | 2.0%), together accounting for 19.4% of all Alamo residents.
| Immigration Origin | # Population | % Population |
| Afghanistan | 77 | 0.5% |
| Africa | 39 | 0.3% |
| Asia | 1,092 | 7.6% |
| Austria | 31 | 0.2% |
| Canada | 143 | 1.0% |
| Caribbean | 21 | 0.2% |
| Central America | 61 | 0.4% |
| China | 380 | 2.6% |
| Cuba | 21 | 0.2% |
| Eastern Asia | 518 | 3.6% |
| Eastern Europe | 154 | 1.1% |
| Ecuador | 14 | 0.1% |
| England | 80 | 0.6% |
| Europe | 503 | 3.5% |
| France | 41 | 0.3% |
| Germany | 35 | 0.2% |
| India | 100 | 0.7% |
| Iran | 107 | 0.7% |
| Italy | 18 | 0.1% |
| Japan | 36 | 0.3% |
| Korea | 102 | 0.7% |
| Latin America | 181 | 1.3% |
| Latvia | 37 | 0.3% |
| Lebanon | 7 | 0.1% |
| Malaysia | 15 | 0.1% |
| Mexico | 61 | 0.4% |
| Moldova | 14 | 0.1% |
| Netherlands | 29 | 0.2% |
| Northern Europe | 195 | 1.4% |
| Oceania | 39 | 0.3% |
| Peru | 46 | 0.3% |
| Philippines | 121 | 0.8% |
| Romania | 28 | 0.2% |
| Russia | 14 | 0.1% |
| Saudi Arabia | 40 | 0.3% |
| Scotland | 34 | 0.2% |
| Singapore | 39 | 0.3% |
| South Africa | 39 | 0.3% |
| South America | 99 | 0.7% |
| South Central Asia | 284 | 2.0% |
| South Eastern Asia | 234 | 1.6% |
| Southern Europe | 18 | 0.1% |
| Sweden | 37 | 0.3% |
| Taiwan | 171 | 1.2% |
| Ukraine | 18 | 0.1% |
| Venezuela | 39 | 0.3% |
| Vietnam | 34 | 0.2% |
| Western Asia | 47 | 0.3% |
| Western Europe | 136 | 0.9% | View All 49 Rows |
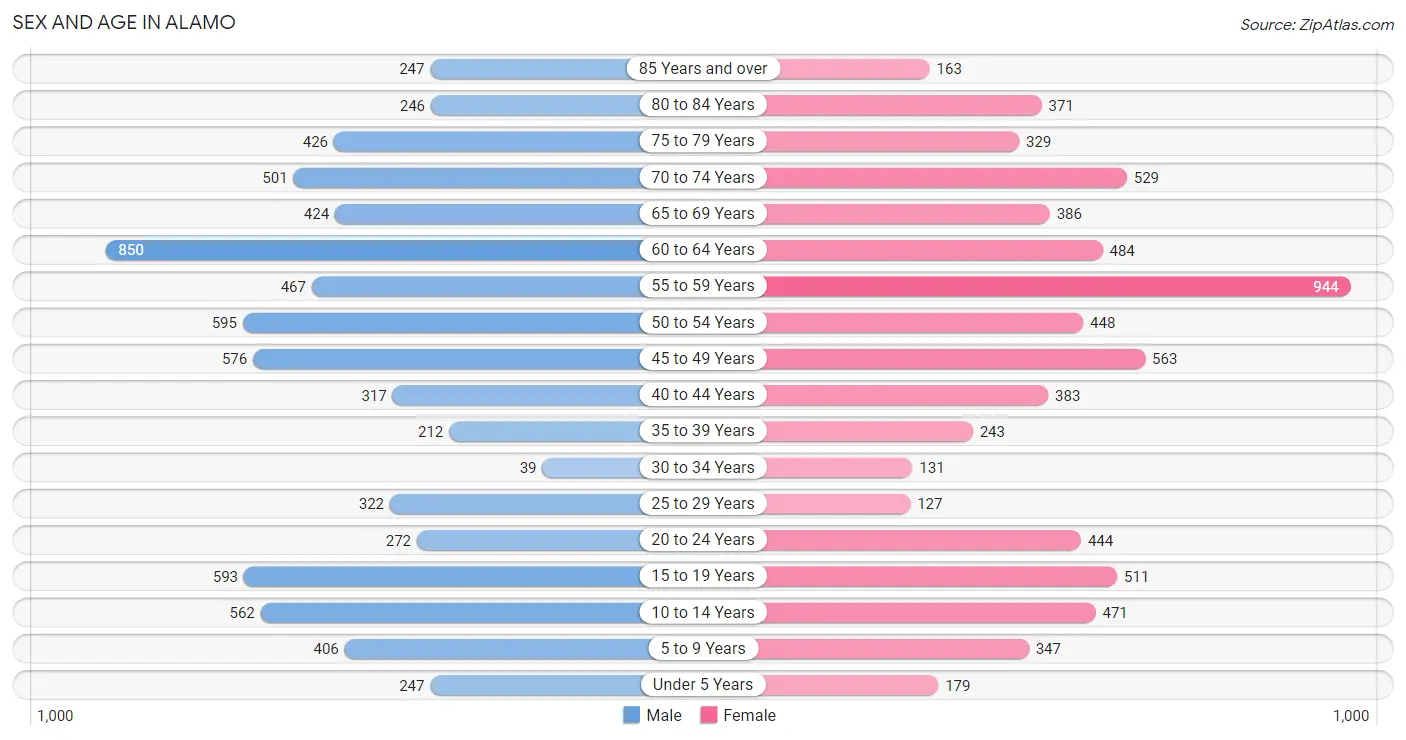
Sex and Age in Alamo
Sex and Age in Alamo
The most populous age groups in Alamo are 60 to 64 Years (850 | 11.6%) for men and 55 to 59 Years (944 | 13.4%) for women.
| Age Bracket | Male | Female |
| Under 5 Years | 247 (3.4%) | 179 (2.5%) |
| 5 to 9 Years | 406 (5.6%) | 347 (4.9%) |
| 10 to 14 Years | 562 (7.7%) | 471 (6.7%) |
| 15 to 19 Years | 593 (8.1%) | 511 (7.2%) |
| 20 to 24 Years | 272 (3.7%) | 444 (6.3%) |
| 25 to 29 Years | 322 (4.4%) | 127 (1.8%) |
| 30 to 34 Years | 39 (0.5%) | 131 (1.9%) |
| 35 to 39 Years | 212 (2.9%) | 243 (3.5%) |
| 40 to 44 Years | 317 (4.3%) | 383 (5.4%) |
| 45 to 49 Years | 576 (7.9%) | 563 (8.0%) |
| 50 to 54 Years | 595 (8.2%) | 448 (6.4%) |
| 55 to 59 Years | 467 (6.4%) | 944 (13.4%) |
| 60 to 64 Years | 850 (11.6%) | 484 (6.9%) |
| 65 to 69 Years | 424 (5.8%) | 386 (5.5%) |
| 70 to 74 Years | 501 (6.9%) | 529 (7.5%) |
| 75 to 79 Years | 426 (5.8%) | 329 (4.7%) |
| 80 to 84 Years | 246 (3.4%) | 371 (5.3%) |
| 85 Years and over | 247 (3.4%) | 163 (2.3%) |
| Total | 7,302 (100.0%) | 7,053 (100.0%) |
Families and Households in Alamo
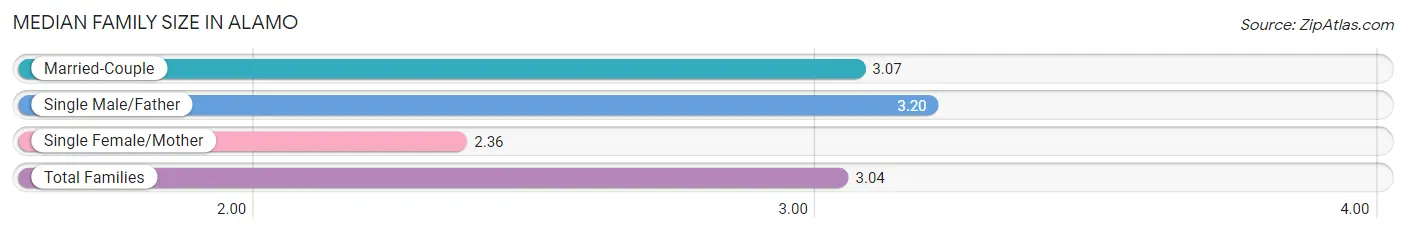
Median Family Size in Alamo
The median family size in Alamo is 3.04 persons per family, with single male/father families (98 | 2.3%) accounting for the largest median family size of 3.2 persons per family. On the other hand, single female/mother families (177 | 4.1%) represent the smallest median family size with 2.36 persons per family.
| Family Type | # Families | Family Size |
| Married-Couple | 4,051 (93.6%) | 3.07 |
| Single Male/Father | 98 (2.3%) | 3.20 |
| Single Female/Mother | 177 (4.1%) | 2.36 |
| Total Families | 4,326 (100.0%) | 3.04 |
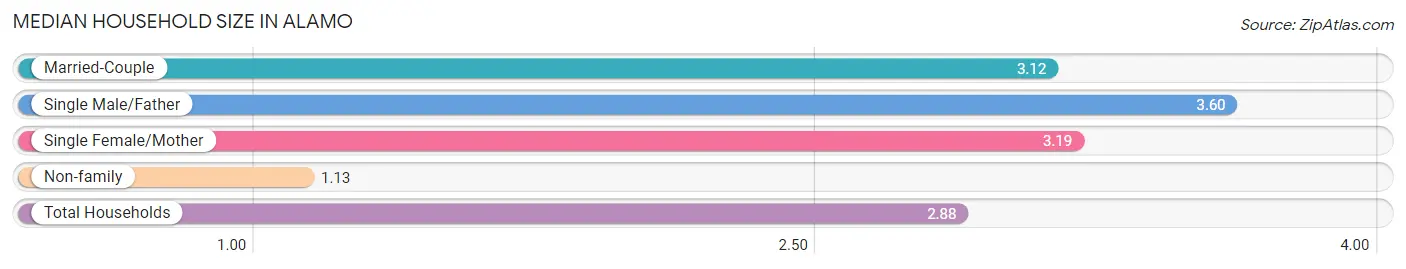
Median Household Size in Alamo
The median household size in Alamo is 2.88 persons per household, with single male/father households (98 | 2.0%) accounting for the largest median household size of 3.6 persons per household. non-family households (637 | 12.8%) represent the smallest median household size with 1.13 persons per household.
| Household Type | # Households | Household Size |
| Married-Couple | 4,051 (81.6%) | 3.12 |
| Single Male/Father | 98 (2.0%) | 3.60 |
| Single Female/Mother | 177 (3.6%) | 3.19 |
| Non-family | 637 (12.8%) | 1.13 |
| Total Households | 4,963 (100.0%) | 2.88 |
Household Size by Marriage Status in Alamo
Out of a total of 4,963 households in Alamo, 4,326 (87.2%) are family households, while 637 (12.8%) are nonfamily households. The most numerous type of family households are 2-person households, comprising 2,244, and the most common type of nonfamily households are 1-person households, comprising 556.
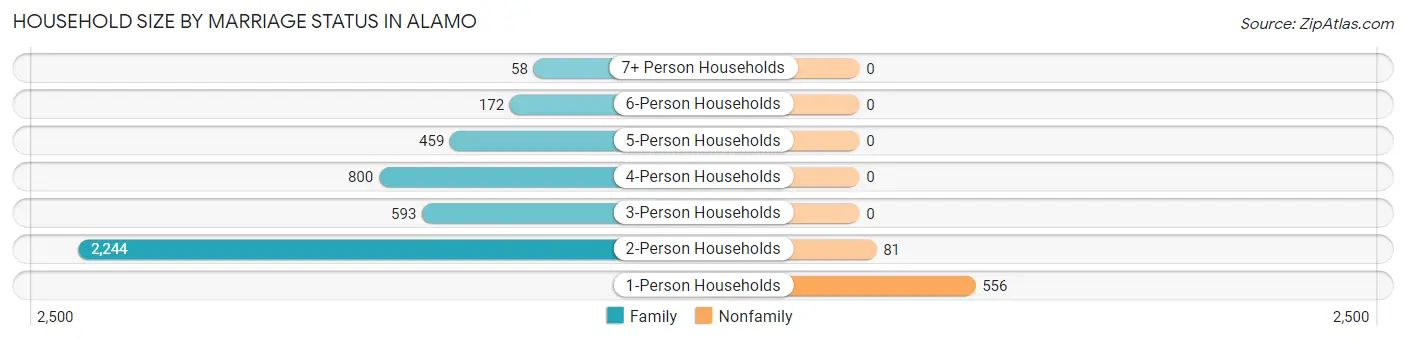
| Household Size | Family Households | Nonfamily Households |
| 1-Person Households | - | 556 (11.2%) |
| 2-Person Households | 2,244 (45.2%) | 81 (1.6%) |
| 3-Person Households | 593 (11.9%) | 0 (0.0%) |
| 4-Person Households | 800 (16.1%) | 0 (0.0%) |
| 5-Person Households | 459 (9.2%) | 0 (0.0%) |
| 6-Person Households | 172 (3.5%) | 0 (0.0%) |
| 7+ Person Households | 58 (1.2%) | 0 (0.0%) |
| Total | 4,326 (87.2%) | 637 (12.8%) |
Female Fertility in Alamo
Fertility by Age in Alamo
Average fertility rate in Alamo is 26.0 births per 1,000 women. Women in the age bracket of 35 to 50 years have the highest fertility rate with 36.0 births per 1,000 women. Women in the age bracket of 35 to 50 years acount for 72.3% of all women with births.
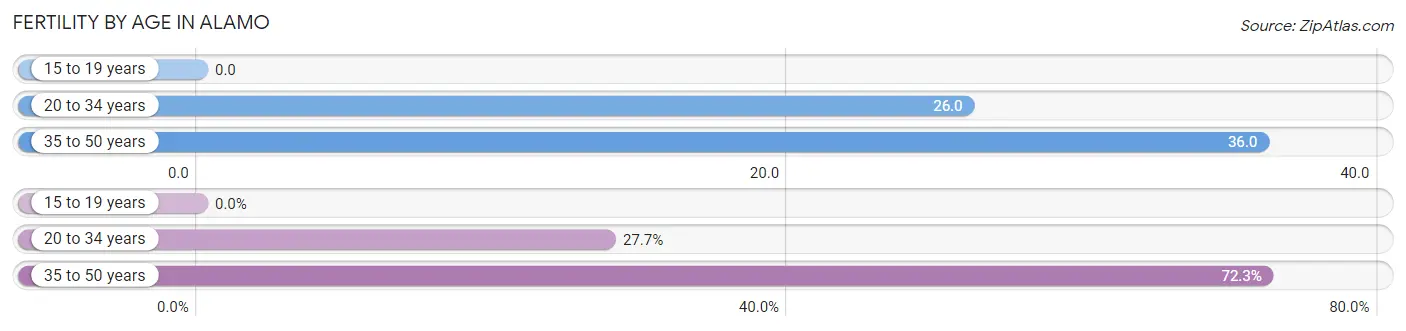
| Age Bracket | Women with Births | Births / 1,000 Women |
| 15 to 19 years | 0 (0.0%) | 0.0 |
| 20 to 34 years | 18 (27.7%) | 26.0 |
| 35 to 50 years | 47 (72.3%) | 36.0 |
| Total | 65 (100.0%) | 26.0 |
Fertility by Age by Marriage Status in Alamo
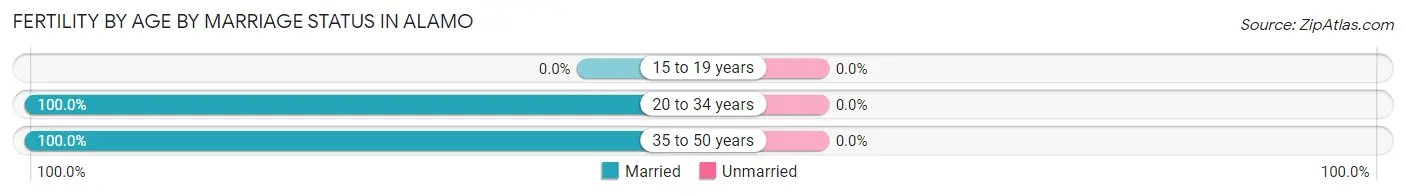
| Age Bracket | Married | Unmarried |
| 15 to 19 years | 0 (0.0%) | 0 (0.0%) |
| 20 to 34 years | 18 (100.0%) | 0 (0.0%) |
| 35 to 50 years | 47 (100.0%) | 0 (0.0%) |
| Total | 65 (100.0%) | 0 (0.0%) |
Fertility by Education in Alamo
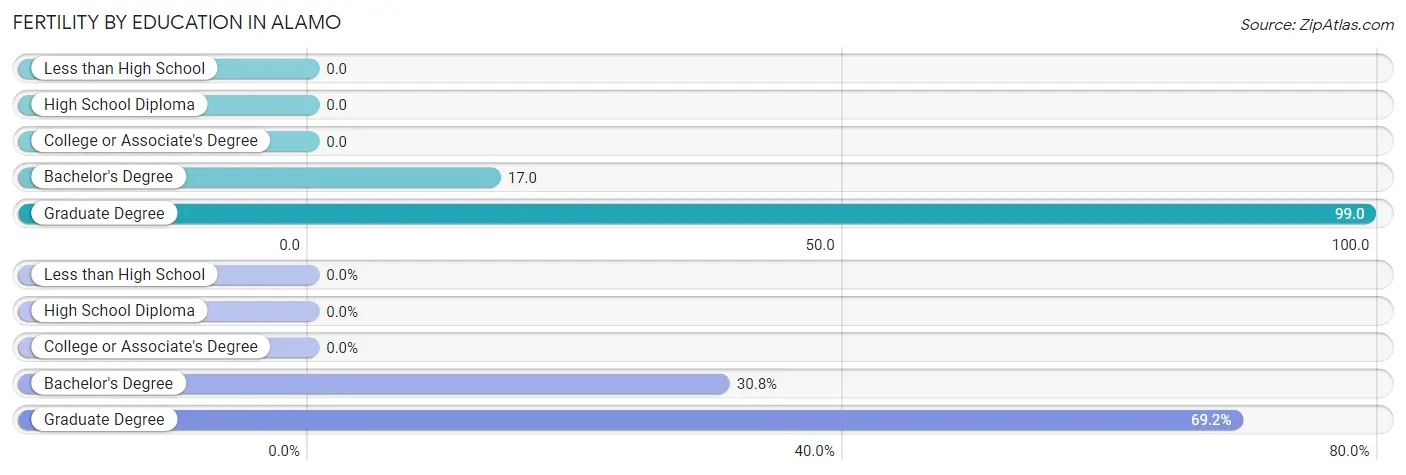
| Educational Attainment | Women with Births | Births / 1,000 Women |
| Less than High School | 0 (0.0%) | 0.0 |
| High School Diploma | 0 (0.0%) | 0.0 |
| College or Associate's Degree | 0 (0.0%) | 0.0 |
| Bachelor's Degree | 20 (30.8%) | 17.0 |
| Graduate Degree | 45 (69.2%) | 99.0 |
| Total | 65 (100.0%) | 26.0 |
Fertility by Education by Marriage Status in Alamo
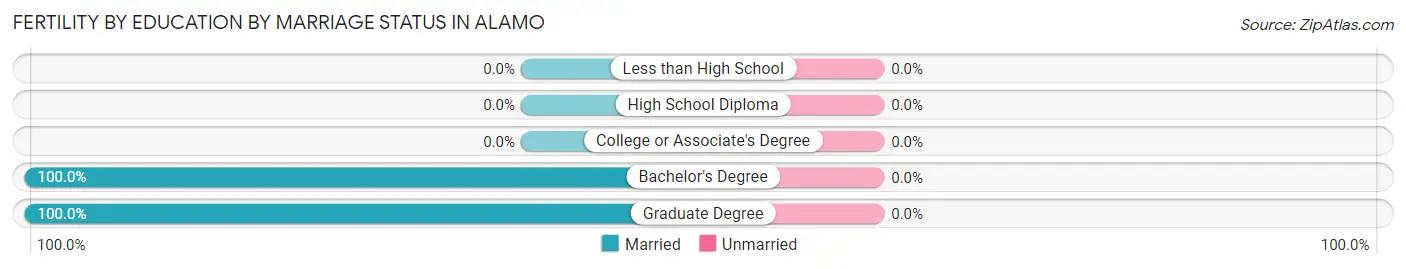
| Educational Attainment | Married | Unmarried |
| Less than High School | 0 (0.0%) | 0 (0.0%) |
| High School Diploma | 0 (0.0%) | 0 (0.0%) |
| College or Associate's Degree | 0 (0.0%) | 0 (0.0%) |
| Bachelor's Degree | 20 (100.0%) | 0 (0.0%) |
| Graduate Degree | 45 (100.0%) | 0 (0.0%) |
| Total | 65 (100.0%) | 0 (0.0%) |
Employment Characteristics in Alamo
Employment by Class of Employer in Alamo
Among the 6,086 employed individuals in Alamo, private company employees (4,062 | 66.7%), self-employed (not incorporated) (713 | 11.7%), and self-employed (incorporated) (598 | 9.8%) make up the most common classes of employment.
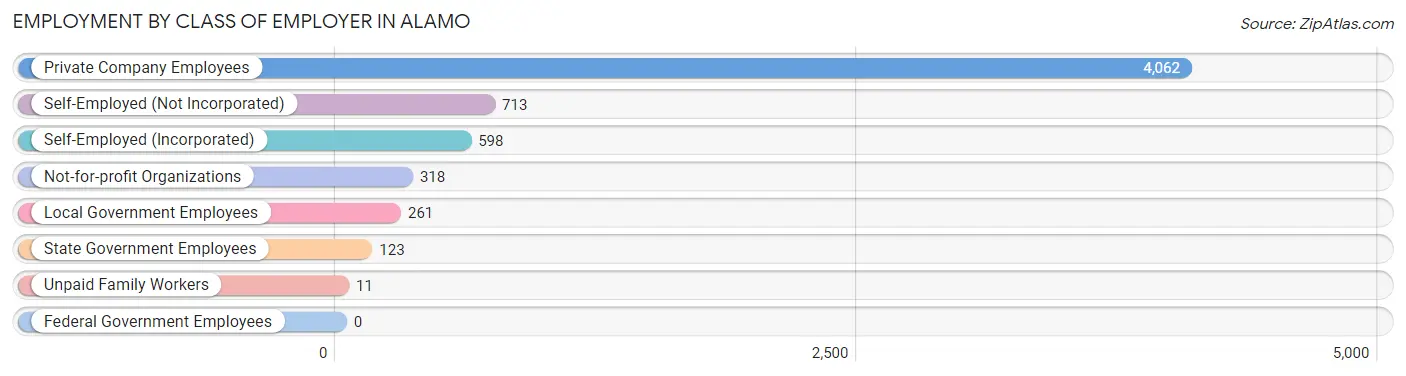
| Employer Class | # Employees | % Employees |
| Private Company Employees | 4,062 | 66.7% |
| Self-Employed (Incorporated) | 598 | 9.8% |
| Self-Employed (Not Incorporated) | 713 | 11.7% |
| Not-for-profit Organizations | 318 | 5.2% |
| Local Government Employees | 261 | 4.3% |
| State Government Employees | 123 | 2.0% |
| Federal Government Employees | 0 | 0.0% |
| Unpaid Family Workers | 11 | 0.2% |
| Total | 6,086 | 100.0% |
Employment Status by Age in Alamo
According to the labor force statistics for Alamo, out of the total population over 16 years of age (11,831), 54.0% or 6,389 individuals are in the labor force, with 2.7% or 173 of them unemployed. The age group with the highest labor force participation rate is 45 to 54 years, with 80.0% or 1,746 individuals in the labor force. Within the labor force, the 20 to 24 years age range has the highest percentage of unemployed individuals, with 17.2% or 90 of them being unemployed.
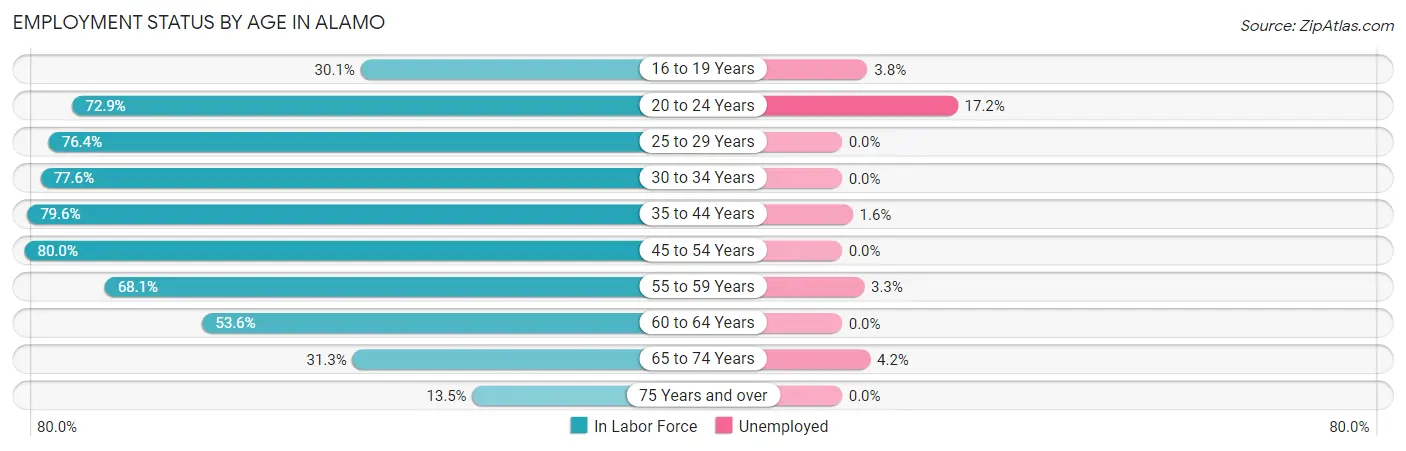
| Age Bracket | In Labor Force | Unemployed |
| 16 to 19 Years | 238 (30.1%) | 9 (3.8%) |
| 20 to 24 Years | 522 (72.9%) | 90 (17.2%) |
| 25 to 29 Years | 343 (76.4%) | 0 (0.0%) |
| 30 to 34 Years | 132 (77.6%) | 0 (0.0%) |
| 35 to 44 Years | 919 (79.6%) | 15 (1.6%) |
| 45 to 54 Years | 1,746 (80.0%) | 0 (0.0%) |
| 55 to 59 Years | 961 (68.1%) | 32 (3.3%) |
| 60 to 64 Years | 715 (53.6%) | 0 (0.0%) |
| 65 to 74 Years | 576 (31.3%) | 24 (4.2%) |
| 75 Years and over | 241 (13.5%) | 0 (0.0%) |
| Total | 6,389 (54.0%) | 173 (2.7%) |
Employment Status by Educational Attainment in Alamo
According to labor force statistics for Alamo, 71.9% of individuals (4,818) out of the total population between 25 and 64 years of age (6,701) are in the labor force, with 1.0% or 48 of them being unemployed. The group with the highest labor force participation rate are those with the educational attainment of less than high school, with 90.0% or 27 individuals in the labor force. Within the labor force, individuals with bachelor's degree or higher education have the highest percentage of unemployment, with 1.1% or 45 of them being unemployed.
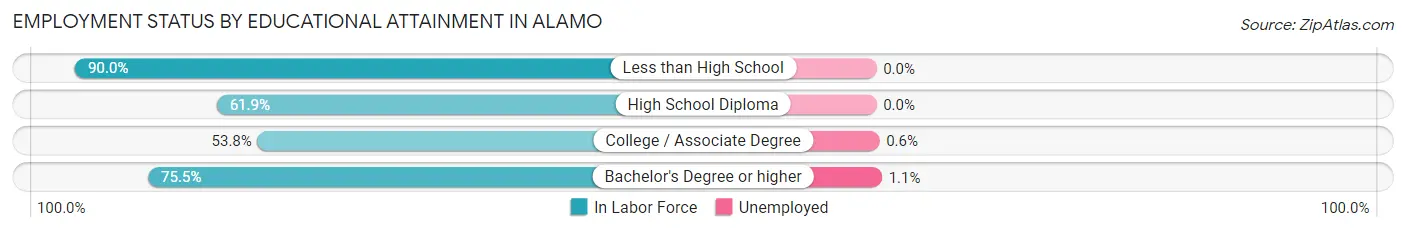
| Educational Attainment | In Labor Force | Unemployed |
| Less than High School | 27 (90.0%) | 0 (0.0%) |
| High School Diploma | 271 (61.9%) | 0 (0.0%) |
| College / Associate Degree | 470 (53.8%) | 5 (0.6%) |
| Bachelor's Degree or higher | 4,046 (75.5%) | 59 (1.1%) |
| Total | 4,818 (71.9%) | 67 (1.0%) |
Employment Occupations by Sex in Alamo
Management, Business, Science and Arts Occupations
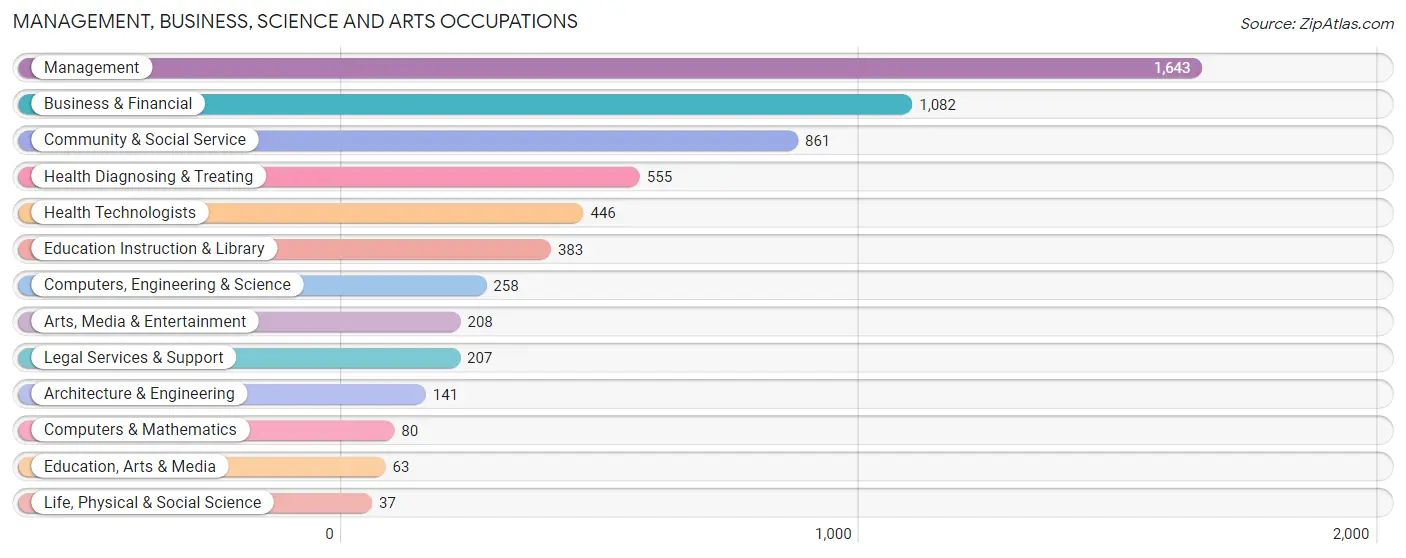
The most common Management, Business, Science and Arts occupations in Alamo are Management (1,643 | 26.4%), Business & Financial (1,082 | 17.4%), Community & Social Service (861 | 13.8%), Health Diagnosing & Treating (555 | 8.9%), and Health Technologists (446 | 7.2%).
Management, Business, Science and Arts Occupations by Sex
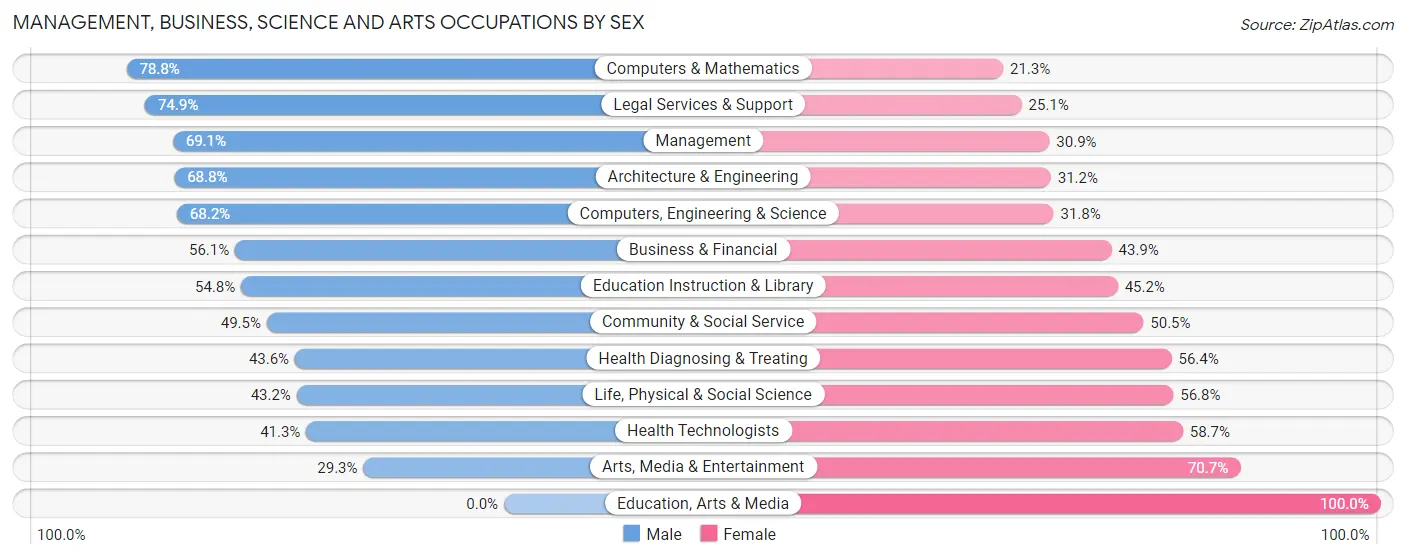
Within the Management, Business, Science and Arts occupations in Alamo, the most male-oriented occupations are Computers & Mathematics (78.7%), Legal Services & Support (74.9%), and Management (69.1%), while the most female-oriented occupations are Education, Arts & Media (100.0%), Arts, Media & Entertainment (70.7%), and Health Technologists (58.7%).
| Occupation | Male | Female |
| Management | 1,135 (69.1%) | 508 (30.9%) |
| Business & Financial | 607 (56.1%) | 475 (43.9%) |
| Computers, Engineering & Science | 176 (68.2%) | 82 (31.8%) |
| Computers & Mathematics | 63 (78.7%) | 17 (21.2%) |
| Architecture & Engineering | 97 (68.8%) | 44 (31.2%) |
| Life, Physical & Social Science | 16 (43.2%) | 21 (56.8%) |
| Community & Social Service | 426 (49.5%) | 435 (50.5%) |
| Education, Arts & Media | 0 (0.0%) | 63 (100.0%) |
| Legal Services & Support | 155 (74.9%) | 52 (25.1%) |
| Education Instruction & Library | 210 (54.8%) | 173 (45.2%) |
| Arts, Media & Entertainment | 61 (29.3%) | 147 (70.7%) |
| Health Diagnosing & Treating | 242 (43.6%) | 313 (56.4%) |
| Health Technologists | 184 (41.3%) | 262 (58.7%) |
| Total (Category) | 2,586 (58.8%) | 1,813 (41.2%) |
| Total (Overall) | 3,463 (55.7%) | 2,758 (44.3%) |
Services Occupations
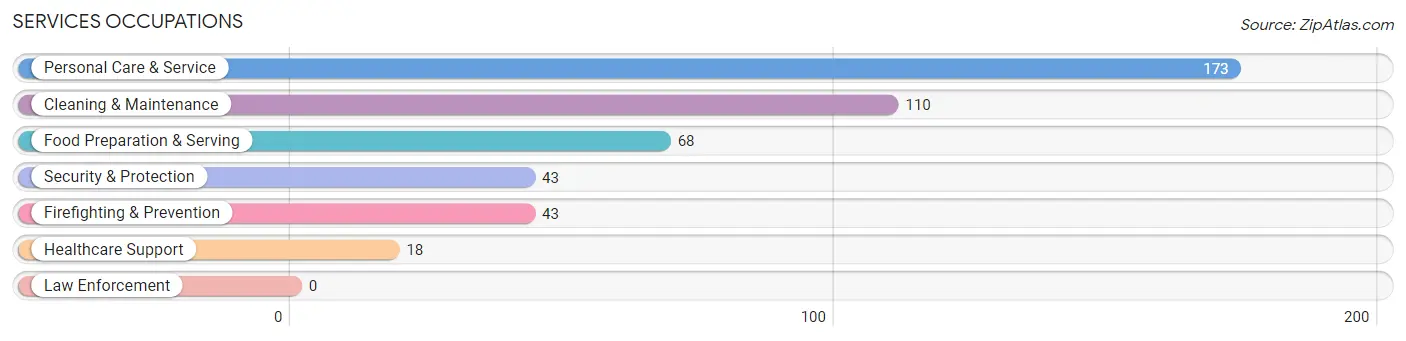
The most common Services occupations in Alamo are Personal Care & Service (173 | 2.8%), Cleaning & Maintenance (110 | 1.8%), Food Preparation & Serving (68 | 1.1%), Security & Protection (43 | 0.7%), and Firefighting & Prevention (43 | 0.7%).
Services Occupations by Sex
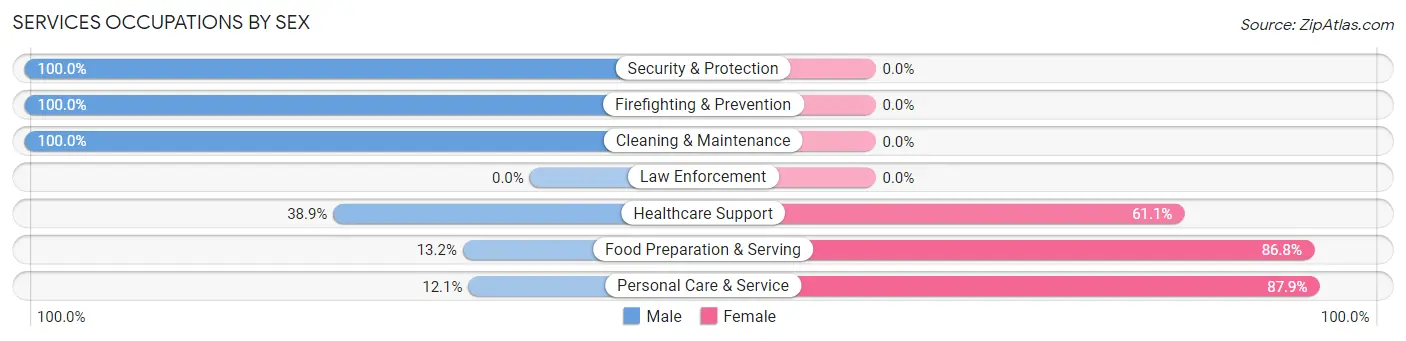
Within the Services occupations in Alamo, the most male-oriented occupations are Security & Protection (100.0%), Firefighting & Prevention (100.0%), and Cleaning & Maintenance (100.0%), while the most female-oriented occupations are Personal Care & Service (87.9%), Food Preparation & Serving (86.8%), and Healthcare Support (61.1%).
| Occupation | Male | Female |
| Healthcare Support | 7 (38.9%) | 11 (61.1%) |
| Security & Protection | 43 (100.0%) | 0 (0.0%) |
| Firefighting & Prevention | 43 (100.0%) | 0 (0.0%) |
| Law Enforcement | 0 (0.0%) | 0 (0.0%) |
| Food Preparation & Serving | 9 (13.2%) | 59 (86.8%) |
| Cleaning & Maintenance | 110 (100.0%) | 0 (0.0%) |
| Personal Care & Service | 21 (12.1%) | 152 (87.9%) |
| Total (Category) | 190 (46.1%) | 222 (53.9%) |
| Total (Overall) | 3,463 (55.7%) | 2,758 (44.3%) |
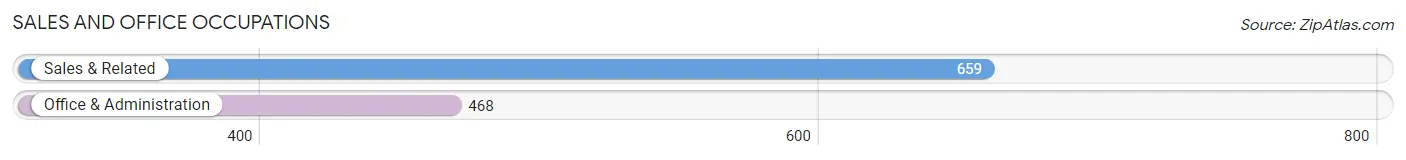
Sales and Office Occupations
The most common Sales and Office occupations in Alamo are Sales & Related (659 | 10.6%), and Office & Administration (468 | 7.5%).
Sales and Office Occupations by Sex
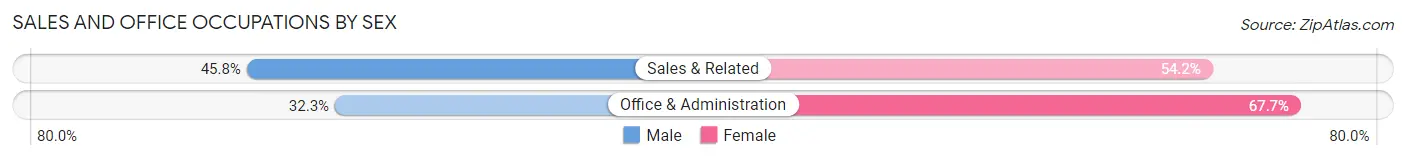
| Occupation | Male | Female |
| Sales & Related | 302 (45.8%) | 357 (54.2%) |
| Office & Administration | 151 (32.3%) | 317 (67.7%) |
| Total (Category) | 453 (40.2%) | 674 (59.8%) |
| Total (Overall) | 3,463 (55.7%) | 2,758 (44.3%) |
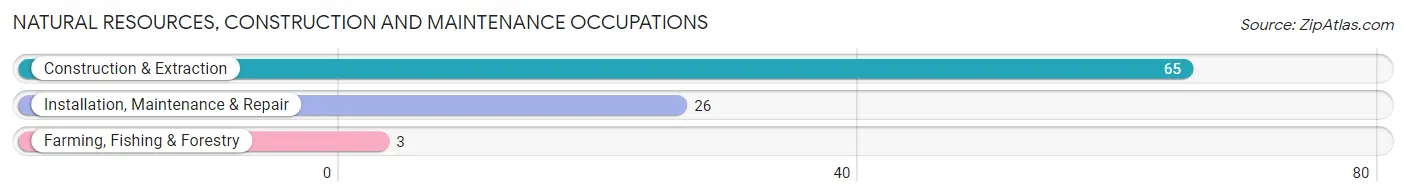
Natural Resources, Construction and Maintenance Occupations
The most common Natural Resources, Construction and Maintenance occupations in Alamo are Construction & Extraction (65 | 1.0%), Installation, Maintenance & Repair (26 | 0.4%), and Farming, Fishing & Forestry (3 | 0.1%).
Natural Resources, Construction and Maintenance Occupations by Sex
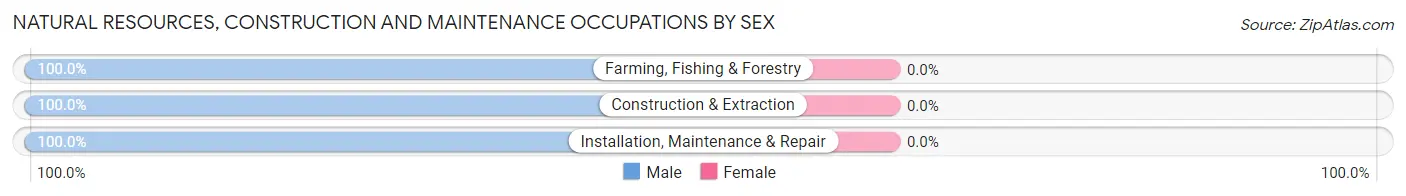
| Occupation | Male | Female |
| Farming, Fishing & Forestry | 3 (100.0%) | 0 (0.0%) |
| Construction & Extraction | 65 (100.0%) | 0 (0.0%) |
| Installation, Maintenance & Repair | 26 (100.0%) | 0 (0.0%) |
| Total (Category) | 94 (100.0%) | 0 (0.0%) |
| Total (Overall) | 3,463 (55.7%) | 2,758 (44.3%) |
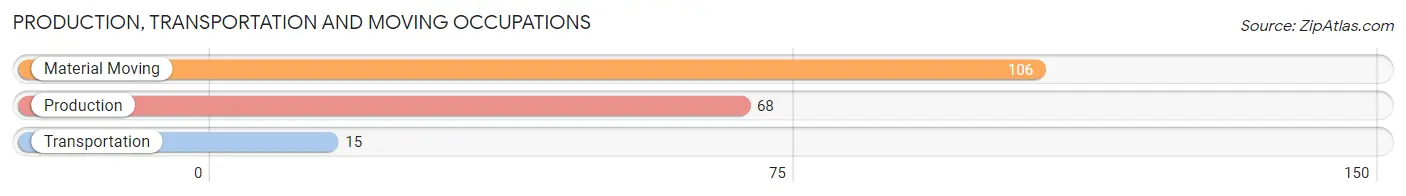
Production, Transportation and Moving Occupations
The most common Production, Transportation and Moving occupations in Alamo are Material Moving (106 | 1.7%), Production (68 | 1.1%), and Transportation (15 | 0.2%).
Production, Transportation and Moving Occupations by Sex
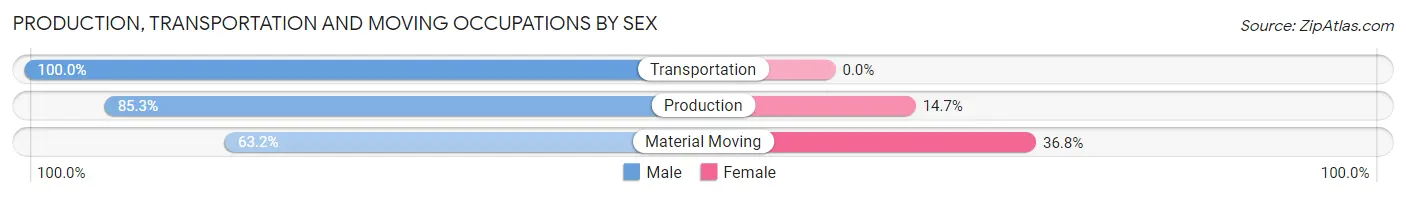
| Occupation | Male | Female |
| Production | 58 (85.3%) | 10 (14.7%) |
| Transportation | 15 (100.0%) | 0 (0.0%) |
| Material Moving | 67 (63.2%) | 39 (36.8%) |
| Total (Category) | 140 (74.1%) | 49 (25.9%) |
| Total (Overall) | 3,463 (55.7%) | 2,758 (44.3%) |
Employment Industries by Sex in Alamo
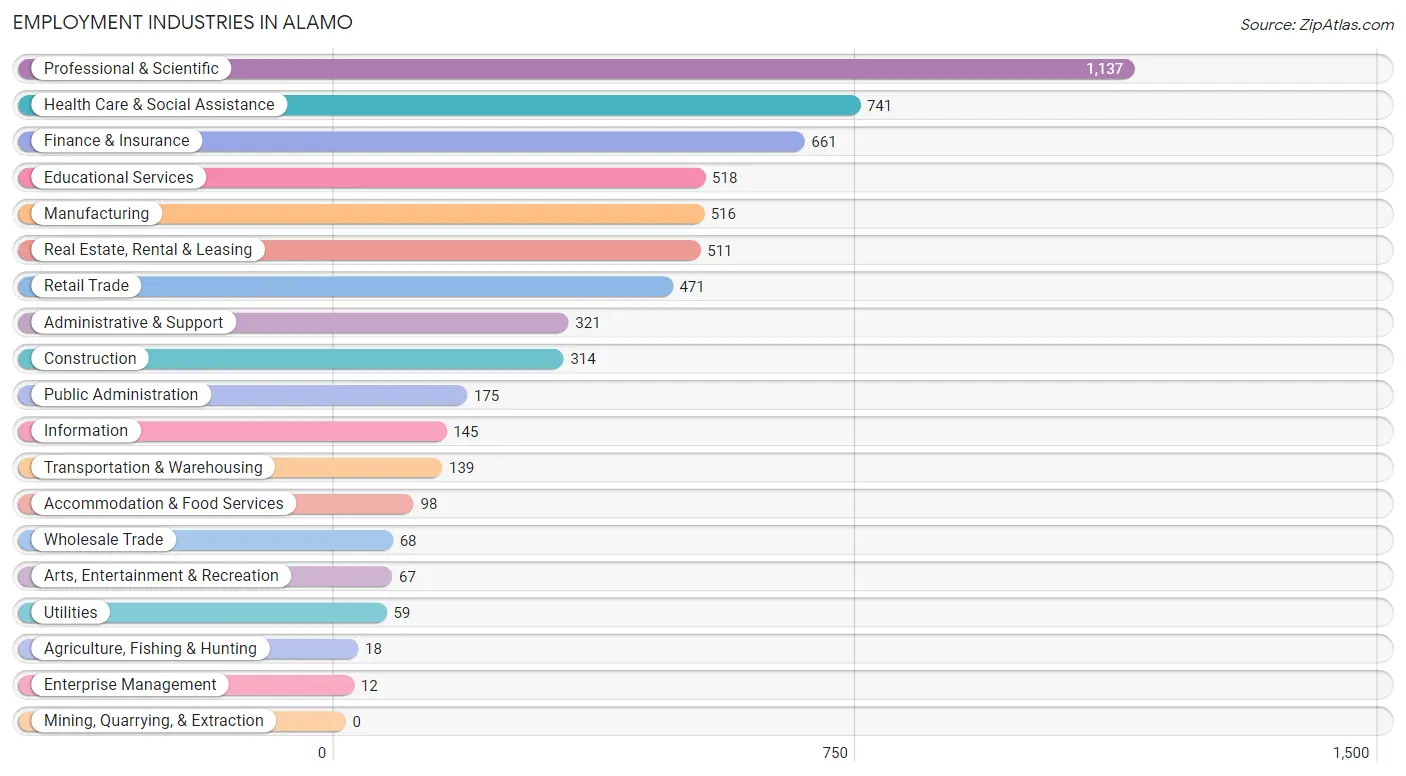
Employment Industries in Alamo
The major employment industries in Alamo include Professional & Scientific (1,137 | 18.3%), Health Care & Social Assistance (741 | 11.9%), Finance & Insurance (661 | 10.6%), Educational Services (518 | 8.3%), and Manufacturing (516 | 8.3%).
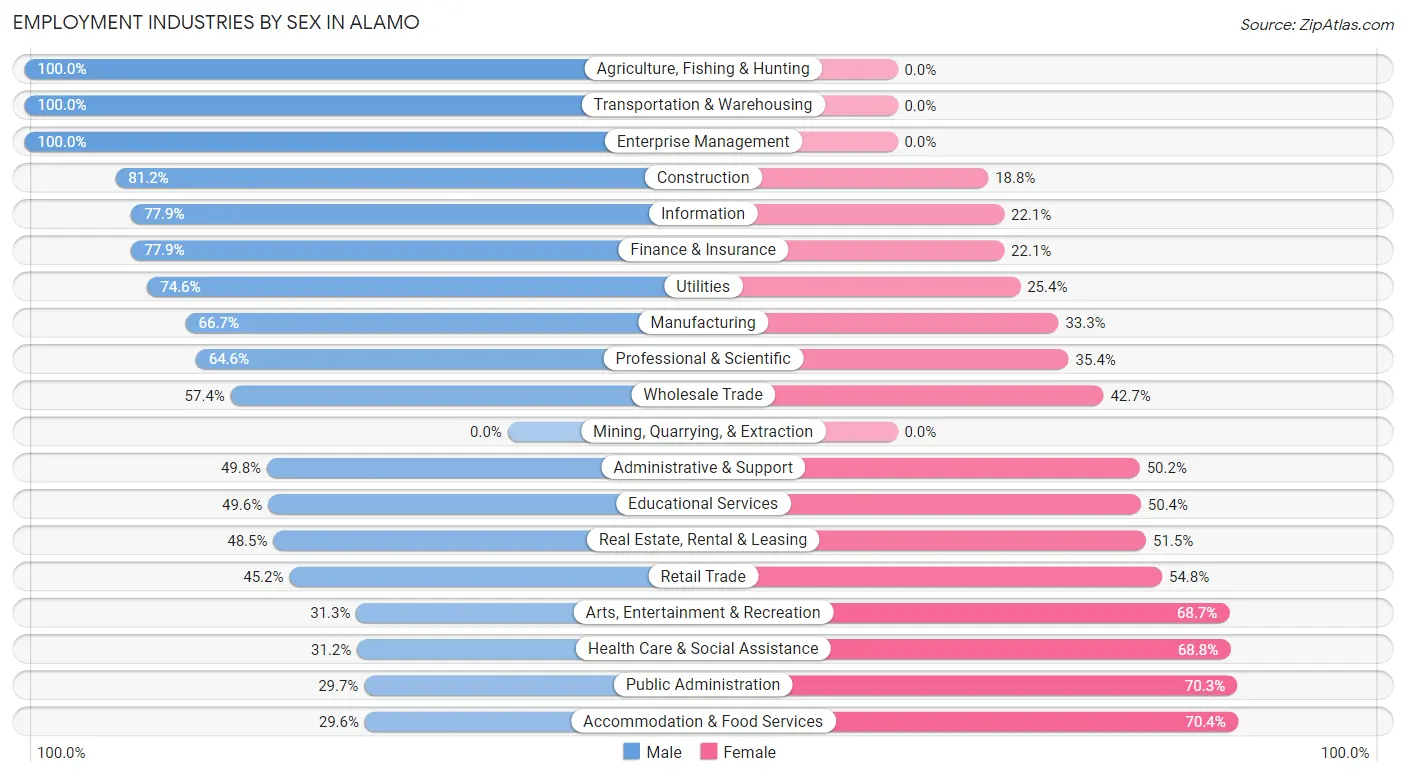
Employment Industries by Sex in Alamo
The Alamo industries that see more men than women are Agriculture, Fishing & Hunting (100.0%), Transportation & Warehousing (100.0%), and Enterprise Management (100.0%), whereas the industries that tend to have a higher number of women are Accommodation & Food Services (70.4%), Public Administration (70.3%), and Health Care & Social Assistance (68.8%).
| Industry | Male | Female |
| Agriculture, Fishing & Hunting | 18 (100.0%) | 0 (0.0%) |
| Mining, Quarrying, & Extraction | 0 (0.0%) | 0 (0.0%) |
| Construction | 255 (81.2%) | 59 (18.8%) |
| Manufacturing | 344 (66.7%) | 172 (33.3%) |
| Wholesale Trade | 39 (57.4%) | 29 (42.6%) |
| Retail Trade | 213 (45.2%) | 258 (54.8%) |
| Transportation & Warehousing | 139 (100.0%) | 0 (0.0%) |
| Utilities | 44 (74.6%) | 15 (25.4%) |
| Information | 113 (77.9%) | 32 (22.1%) |
| Finance & Insurance | 515 (77.9%) | 146 (22.1%) |
| Real Estate, Rental & Leasing | 248 (48.5%) | 263 (51.5%) |
| Professional & Scientific | 734 (64.6%) | 403 (35.4%) |
| Enterprise Management | 12 (100.0%) | 0 (0.0%) |
| Administrative & Support | 160 (49.8%) | 161 (50.2%) |
| Educational Services | 257 (49.6%) | 261 (50.4%) |
| Health Care & Social Assistance | 231 (31.2%) | 510 (68.8%) |
| Arts, Entertainment & Recreation | 21 (31.3%) | 46 (68.7%) |
| Accommodation & Food Services | 29 (29.6%) | 69 (70.4%) |
| Public Administration | 52 (29.7%) | 123 (70.3%) |
| Total | 3,463 (55.7%) | 2,758 (44.3%) |
Education in Alamo
School Enrollment in Alamo
The most common levels of schooling among the 3,466 students in Alamo are high school (1,091 | 31.5%), middle school (835 | 24.1%), and elementary school (596 | 17.2%).
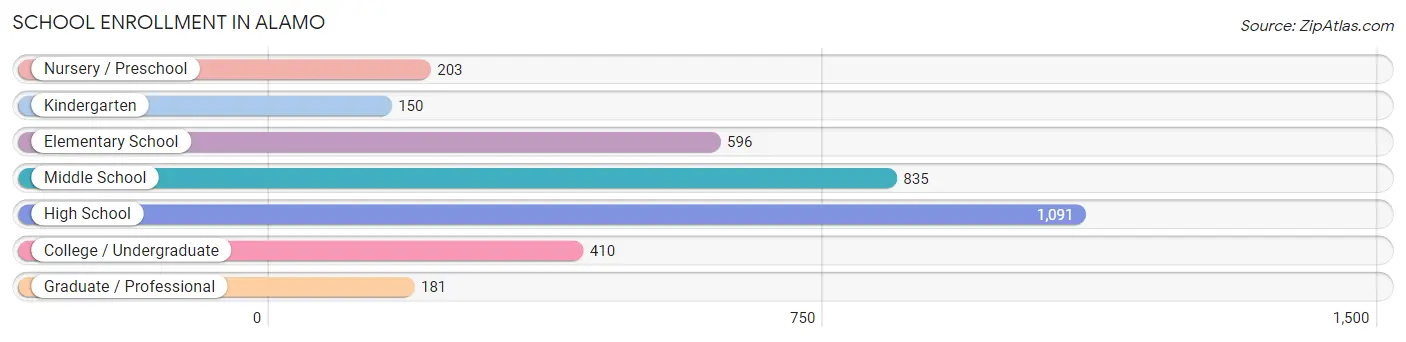
| School Level | # Students | % Students |
| Nursery / Preschool | 203 | 5.9% |
| Kindergarten | 150 | 4.3% |
| Elementary School | 596 | 17.2% |
| Middle School | 835 | 24.1% |
| High School | 1,091 | 31.5% |
| College / Undergraduate | 410 | 11.8% |
| Graduate / Professional | 181 | 5.2% |
| Total | 3,466 | 100.0% |
School Enrollment by Age by Funding Source in Alamo
Out of a total of 3,466 students who are enrolled in schools in Alamo, 960 (27.7%) attend a private institution, while the remaining 2,506 (72.3%) are enrolled in public schools. The age group of 3 to 4 year olds has the highest likelihood of being enrolled in private schools, with 120 (83.3% in the age bracket) enrolled. Conversely, the age group of 25 to 34 year olds has the lowest likelihood of being enrolled in a private school, with 77 (100.0% in the age bracket) attending a public institution.
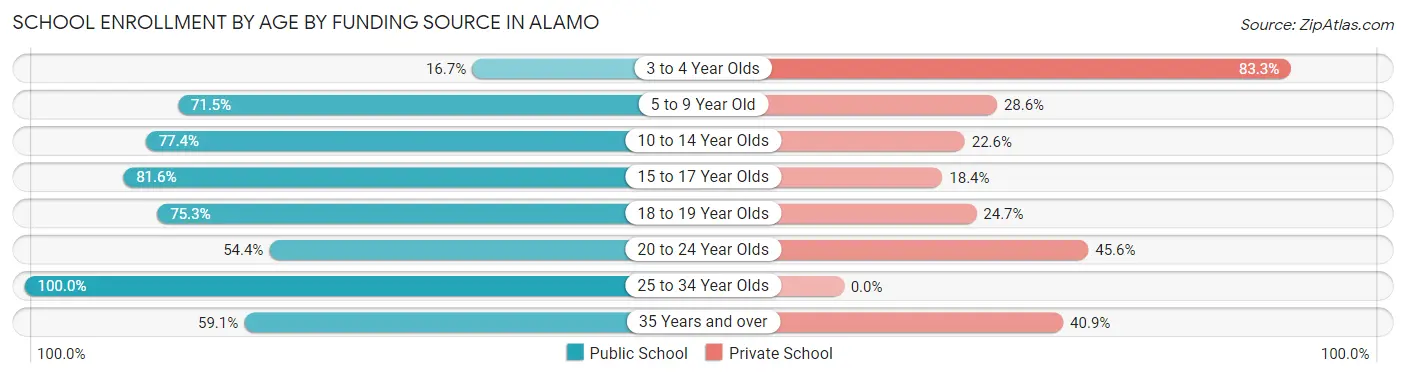
| Age Bracket | Public School | Private School |
| 3 to 4 Year Olds | 24 (16.7%) | 120 (83.3%) |
| 5 to 9 Year Old | 538 (71.5%) | 215 (28.5%) |
| 10 to 14 Year Olds | 800 (77.4%) | 233 (22.6%) |
| 15 to 17 Year Olds | 684 (81.6%) | 154 (18.4%) |
| 18 to 19 Year Olds | 128 (75.3%) | 42 (24.7%) |
| 20 to 24 Year Olds | 147 (54.4%) | 123 (45.6%) |
| 25 to 34 Year Olds | 77 (100.0%) | 0 (0.0%) |
| 35 Years and over | 107 (59.1%) | 74 (40.9%) |
| Total | 2,506 (72.3%) | 960 (27.7%) |
Educational Attainment by Field of Study in Alamo
Business (2,128 | 25.8%), social sciences (1,295 | 15.7%), engineering (814 | 9.9%), bio, nature & agricultural (556 | 6.7%), and liberal arts & history (528 | 6.4%) are the most common fields of study among 8,247 individuals in Alamo who have obtained a bachelor's degree or higher.
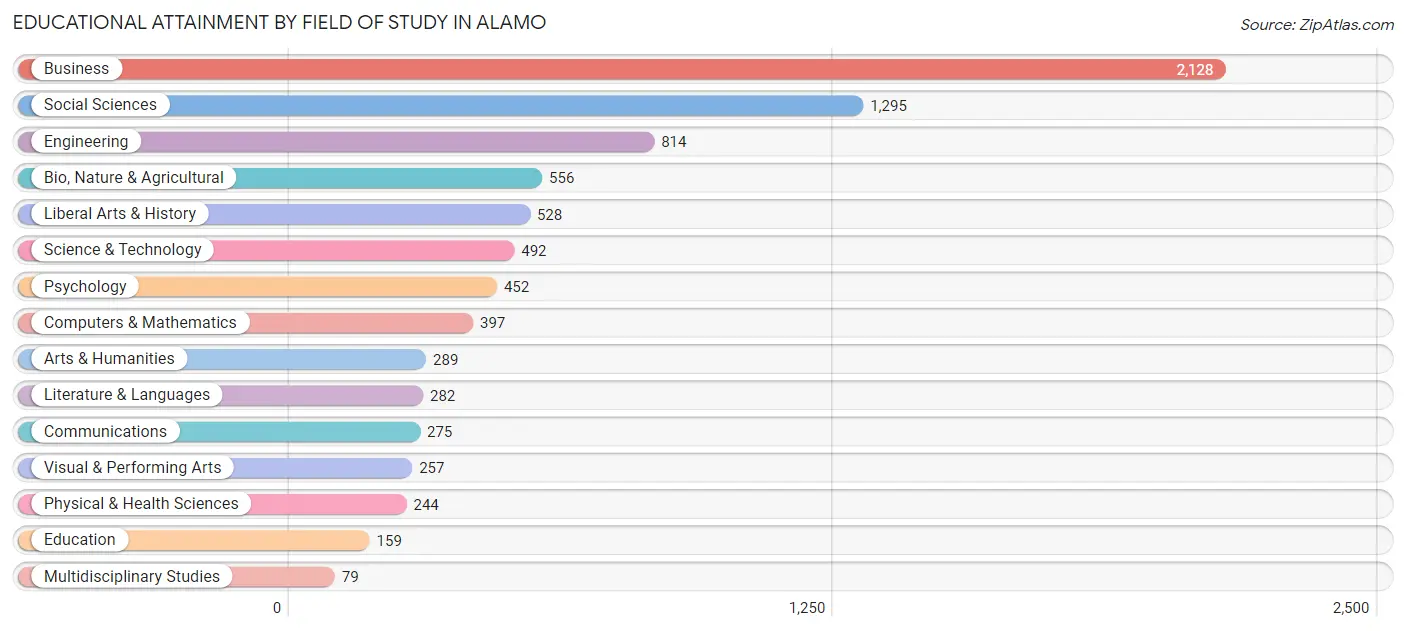
| Field of Study | # Graduates | % Graduates |
| Computers & Mathematics | 397 | 4.8% |
| Bio, Nature & Agricultural | 556 | 6.7% |
| Physical & Health Sciences | 244 | 3.0% |
| Psychology | 452 | 5.5% |
| Social Sciences | 1,295 | 15.7% |
| Engineering | 814 | 9.9% |
| Multidisciplinary Studies | 79 | 1.0% |
| Science & Technology | 492 | 6.0% |
| Business | 2,128 | 25.8% |
| Education | 159 | 1.9% |
| Literature & Languages | 282 | 3.4% |
| Liberal Arts & History | 528 | 6.4% |
| Visual & Performing Arts | 257 | 3.1% |
| Communications | 275 | 3.3% |
| Arts & Humanities | 289 | 3.5% |
| Total | 8,247 | 100.0% |
Transportation & Commute in Alamo
Vehicle Availability by Sex in Alamo
The most prevalent vehicle ownership categories in Alamo are males with 3 vehicles (1,391, accounting for 41.1%) and females with 3 vehicles (1,079, making up 52.2%).
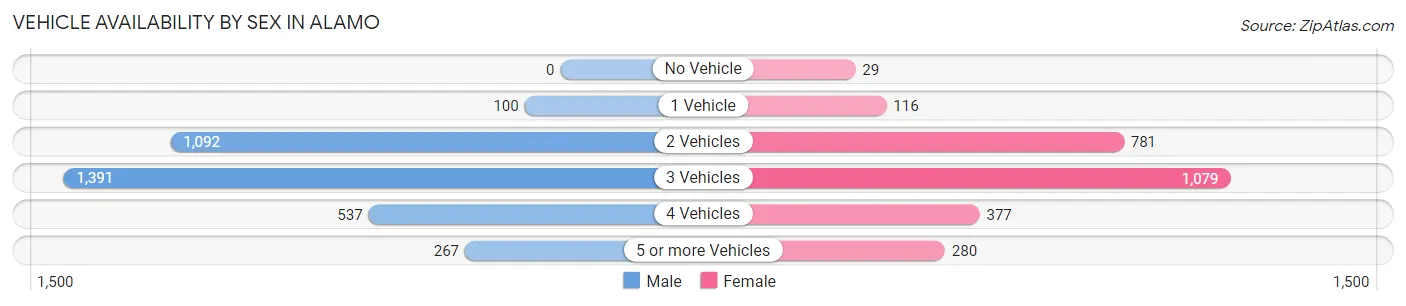
| Vehicles Available | Male | Female |
| No Vehicle | 0 (0.0%) | 29 (1.1%) |
| 1 Vehicle | 100 (2.9%) | 116 (4.4%) |
| 2 Vehicles | 1,092 (32.2%) | 781 (29.3%) |
| 3 Vehicles | 1,391 (41.1%) | 1,079 (40.5%) |
| 4 Vehicles | 537 (15.9%) | 377 (14.2%) |
| 5 or more Vehicles | 267 (7.9%) | 280 (10.5%) |
| Total | 3,387 (100.0%) | 2,662 (100.0%) |
Commute Time in Alamo
The most frequently occuring commute durations in Alamo are 15 to 19 minutes (799 commuters, 18.0%), 60 to 89 minutes (782 commuters, 17.6%), and 5 to 9 minutes (650 commuters, 14.6%).
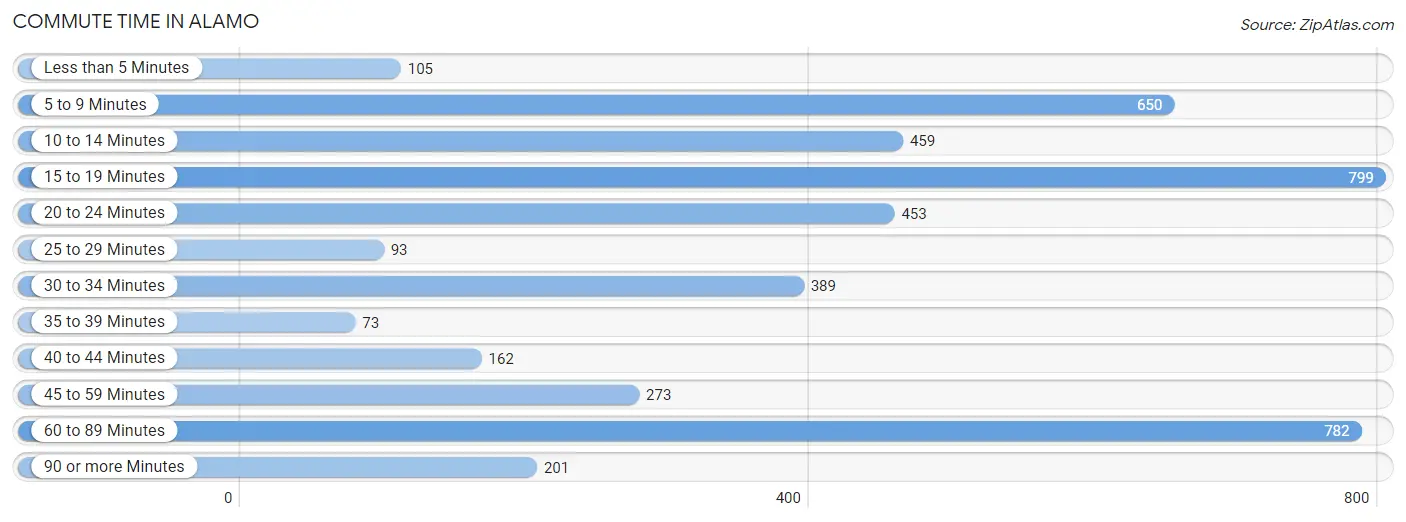
| Commute Time | # Commuters | % Commuters |
| Less than 5 Minutes | 105 | 2.4% |
| 5 to 9 Minutes | 650 | 14.6% |
| 10 to 14 Minutes | 459 | 10.3% |
| 15 to 19 Minutes | 799 | 18.0% |
| 20 to 24 Minutes | 453 | 10.2% |
| 25 to 29 Minutes | 93 | 2.1% |
| 30 to 34 Minutes | 389 | 8.8% |
| 35 to 39 Minutes | 73 | 1.6% |
| 40 to 44 Minutes | 162 | 3.6% |
| 45 to 59 Minutes | 273 | 6.1% |
| 60 to 89 Minutes | 782 | 17.6% |
| 90 or more Minutes | 201 | 4.5% |
Commute Time by Sex in Alamo
The most common commute times in Alamo are 15 to 19 minutes (461 commuters, 18.2%) for males and 5 to 9 minutes (474 commuters, 24.8%) for females.
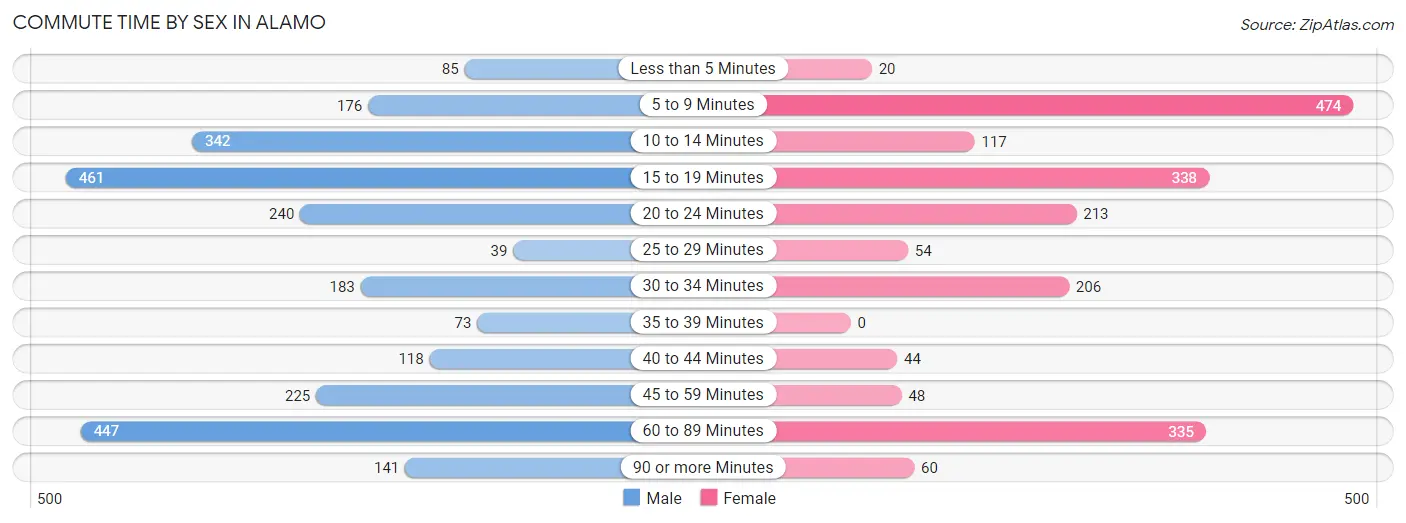
| Commute Time | Male | Female |
| Less than 5 Minutes | 85 (3.4%) | 20 (1.1%) |
| 5 to 9 Minutes | 176 (7.0%) | 474 (24.8%) |
| 10 to 14 Minutes | 342 (13.5%) | 117 (6.1%) |
| 15 to 19 Minutes | 461 (18.2%) | 338 (17.7%) |
| 20 to 24 Minutes | 240 (9.5%) | 213 (11.2%) |
| 25 to 29 Minutes | 39 (1.5%) | 54 (2.8%) |
| 30 to 34 Minutes | 183 (7.2%) | 206 (10.8%) |
| 35 to 39 Minutes | 73 (2.9%) | 0 (0.0%) |
| 40 to 44 Minutes | 118 (4.7%) | 44 (2.3%) |
| 45 to 59 Minutes | 225 (8.9%) | 48 (2.5%) |
| 60 to 89 Minutes | 447 (17.7%) | 335 (17.5%) |
| 90 or more Minutes | 141 (5.6%) | 60 (3.1%) |
Time of Departure to Work by Sex in Alamo
The most frequent times of departure to work in Alamo are 8:00 AM to 8:29 AM (407, 16.1%) for males and 7:00 AM to 7:29 AM (405, 21.2%) for females.
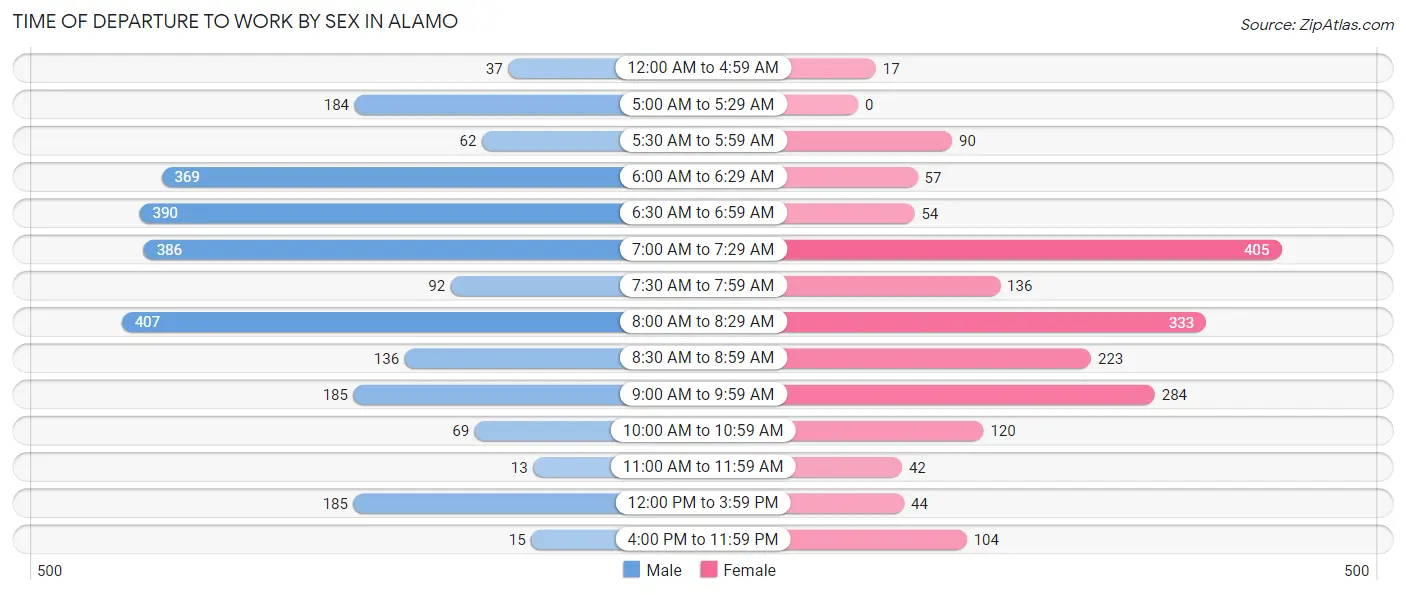
| Time of Departure | Male | Female |
| 12:00 AM to 4:59 AM | 37 (1.5%) | 17 (0.9%) |
| 5:00 AM to 5:29 AM | 184 (7.3%) | 0 (0.0%) |
| 5:30 AM to 5:59 AM | 62 (2.5%) | 90 (4.7%) |
| 6:00 AM to 6:29 AM | 369 (14.6%) | 57 (3.0%) |
| 6:30 AM to 6:59 AM | 390 (15.4%) | 54 (2.8%) |
| 7:00 AM to 7:29 AM | 386 (15.3%) | 405 (21.2%) |
| 7:30 AM to 7:59 AM | 92 (3.6%) | 136 (7.1%) |
| 8:00 AM to 8:29 AM | 407 (16.1%) | 333 (17.4%) |
| 8:30 AM to 8:59 AM | 136 (5.4%) | 223 (11.7%) |
| 9:00 AM to 9:59 AM | 185 (7.3%) | 284 (14.9%) |
| 10:00 AM to 10:59 AM | 69 (2.7%) | 120 (6.3%) |
| 11:00 AM to 11:59 AM | 13 (0.5%) | 42 (2.2%) |
| 12:00 PM to 3:59 PM | 185 (7.3%) | 44 (2.3%) |
| 4:00 PM to 11:59 PM | 15 (0.6%) | 104 (5.4%) |
| Total | 2,530 (100.0%) | 1,909 (100.0%) |
Housing Occupancy in Alamo
Occupancy by Ownership in Alamo
Of the total 4,963 dwellings in Alamo, owner-occupied units account for 4,558 (91.8%), while renter-occupied units make up 405 (8.2%).
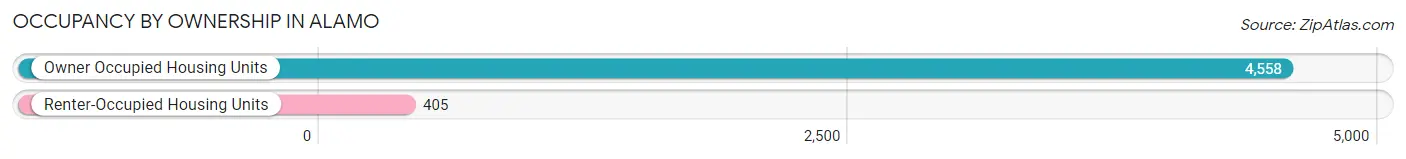
| Occupancy | # Housing Units | % Housing Units |
| Owner Occupied Housing Units | 4,558 | 91.8% |
| Renter-Occupied Housing Units | 405 | 8.2% |
| Total Occupied Housing Units | 4,963 | 100.0% |
Occupancy by Household Size in Alamo
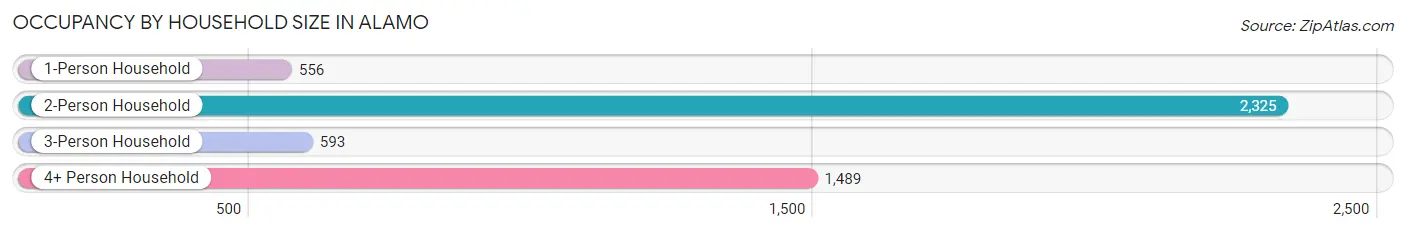
| Household Size | # Housing Units | % Housing Units |
| 1-Person Household | 556 | 11.2% |
| 2-Person Household | 2,325 | 46.9% |
| 3-Person Household | 593 | 11.9% |
| 4+ Person Household | 1,489 | 30.0% |
| Total Housing Units | 4,963 | 100.0% |
Occupancy by Ownership by Household Size in Alamo
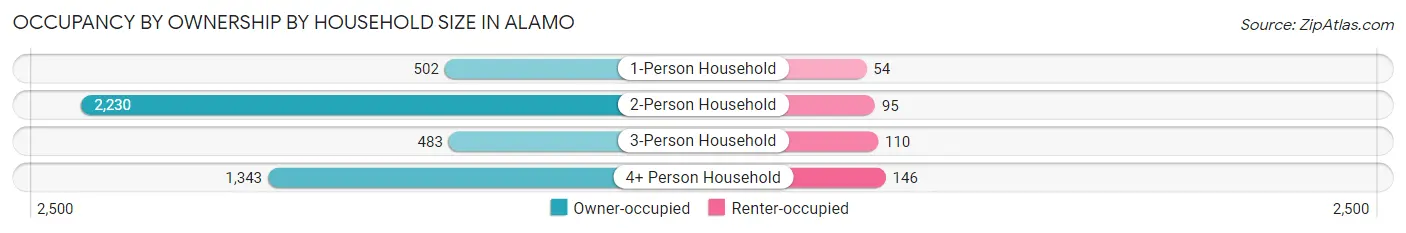
| Household Size | Owner-occupied | Renter-occupied |
| 1-Person Household | 502 (90.3%) | 54 (9.7%) |
| 2-Person Household | 2,230 (95.9%) | 95 (4.1%) |
| 3-Person Household | 483 (81.5%) | 110 (18.5%) |
| 4+ Person Household | 1,343 (90.2%) | 146 (9.8%) |
| Total Housing Units | 4,558 (91.8%) | 405 (8.2%) |
Occupancy by Educational Attainment in Alamo
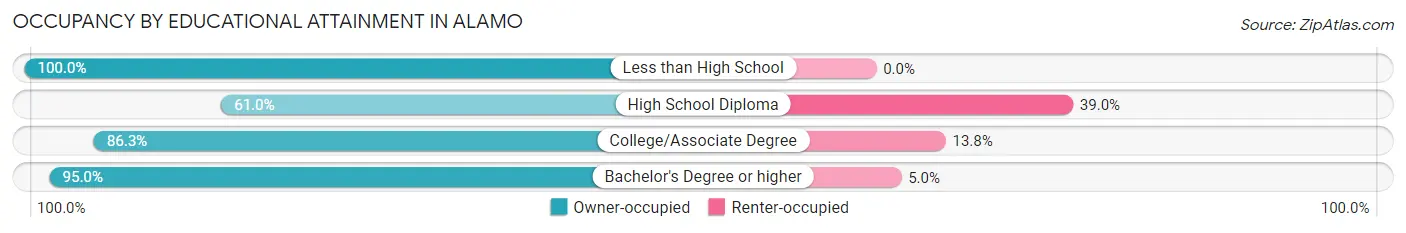
| Household Size | Owner-occupied | Renter-occupied |
| Less than High School | 21 (100.0%) | 0 (0.0%) |
| High School Diploma | 172 (61.0%) | 110 (39.0%) |
| College/Associate Degree | 621 (86.3%) | 99 (13.8%) |
| Bachelor's Degree or higher | 3,744 (95.0%) | 196 (5.0%) |
Occupancy by Age of Householder in Alamo
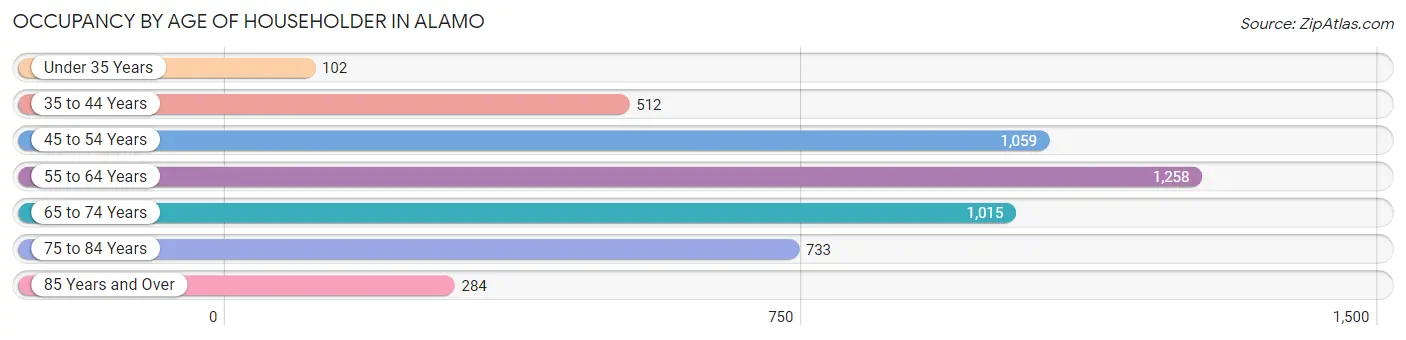
| Age Bracket | # Households | % Households |
| Under 35 Years | 102 | 2.1% |
| 35 to 44 Years | 512 | 10.3% |
| 45 to 54 Years | 1,059 | 21.3% |
| 55 to 64 Years | 1,258 | 25.4% |
| 65 to 74 Years | 1,015 | 20.4% |
| 75 to 84 Years | 733 | 14.8% |
| 85 Years and Over | 284 | 5.7% |
| Total | 4,963 | 100.0% |
Housing Finances in Alamo
Median Income by Occupancy in Alamo
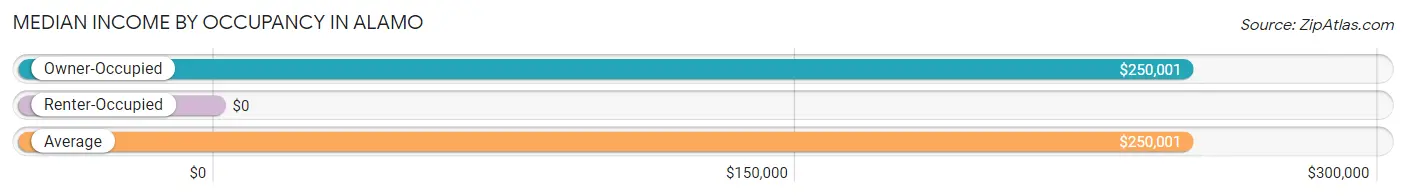
| Occupancy Type | # Households | Median Income |
| Owner-Occupied | 4,558 (91.8%) | $250,001 |
| Renter-Occupied | 405 (8.2%) | $0 |
| Average | 4,963 (100.0%) | $250,001 |
Occupancy by Householder Income Bracket in Alamo
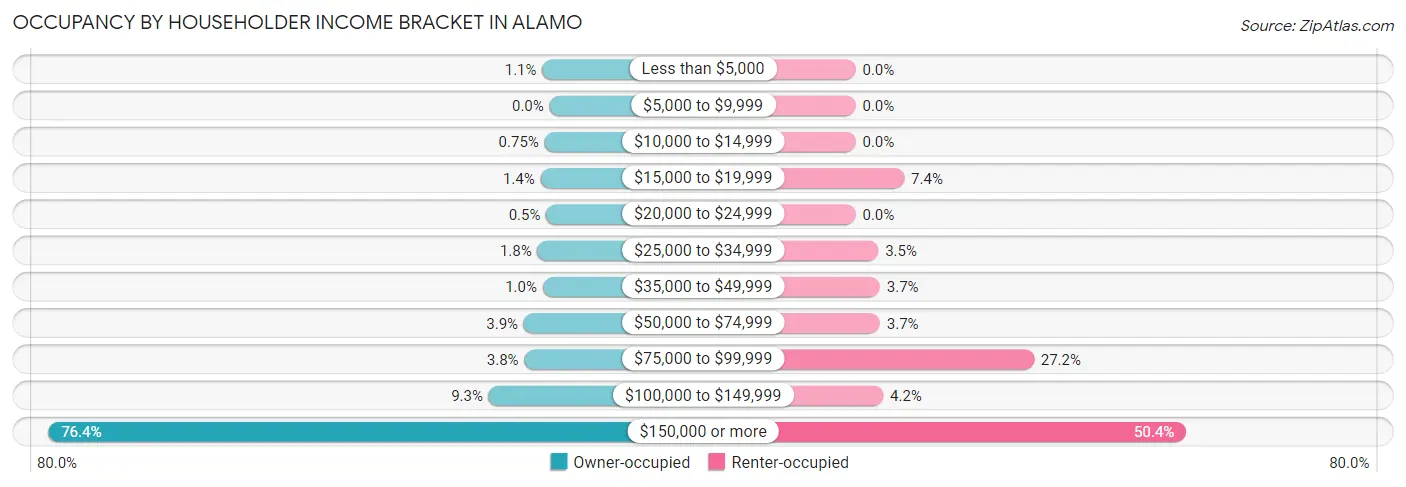
| Income Bracket | Owner-occupied | Renter-occupied |
| Less than $5,000 | 50 (1.1%) | 0 (0.0%) |
| $5,000 to $9,999 | 0 (0.0%) | 0 (0.0%) |
| $10,000 to $14,999 | 34 (0.7%) | 0 (0.0%) |
| $15,000 to $19,999 | 63 (1.4%) | 30 (7.4%) |
| $20,000 to $24,999 | 23 (0.5%) | 0 (0.0%) |
| $25,000 to $34,999 | 84 (1.8%) | 14 (3.5%) |
| $35,000 to $49,999 | 47 (1.0%) | 15 (3.7%) |
| $50,000 to $74,999 | 178 (3.9%) | 15 (3.7%) |
| $75,000 to $99,999 | 175 (3.8%) | 110 (27.2%) |
| $100,000 to $149,999 | 422 (9.3%) | 17 (4.2%) |
| $150,000 or more | 3,482 (76.4%) | 204 (50.4%) |
| Total | 4,558 (100.0%) | 405 (100.0%) |
Monthly Housing Cost Tiers in Alamo
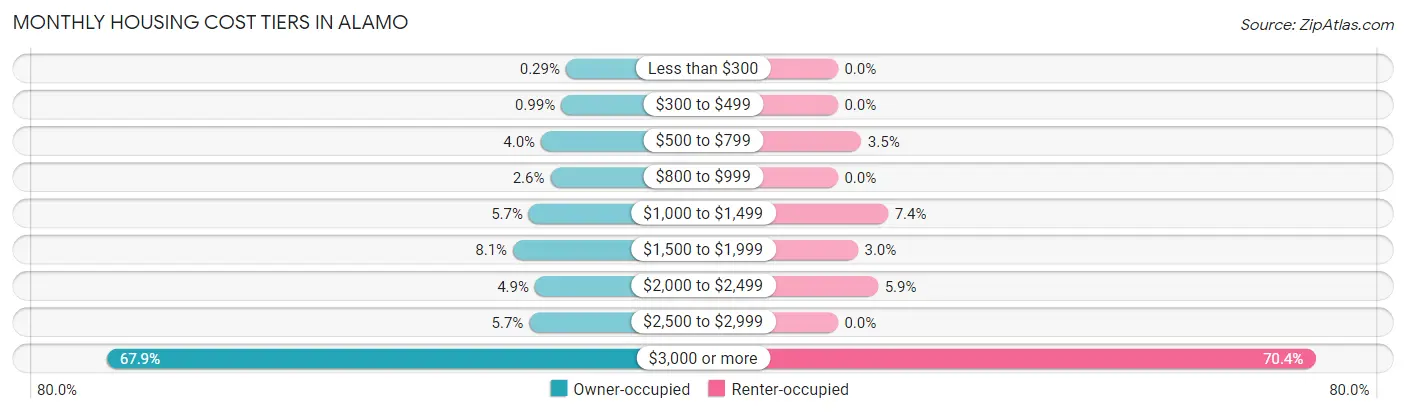
| Monthly Cost | Owner-occupied | Renter-occupied |
| Less than $300 | 13 (0.3%) | 0 (0.0%) |
| $300 to $499 | 45 (1.0%) | 0 (0.0%) |
| $500 to $799 | 180 (4.0%) | 14 (3.5%) |
| $800 to $999 | 117 (2.6%) | 0 (0.0%) |
| $1,000 to $1,499 | 261 (5.7%) | 30 (7.4%) |
| $1,500 to $1,999 | 368 (8.1%) | 12 (3.0%) |
| $2,000 to $2,499 | 221 (4.9%) | 24 (5.9%) |
| $2,500 to $2,999 | 259 (5.7%) | 0 (0.0%) |
| $3,000 or more | 3,094 (67.9%) | 285 (70.4%) |
| Total | 4,558 (100.0%) | 405 (100.0%) |
Physical Housing Characteristics in Alamo
Housing Structures in Alamo
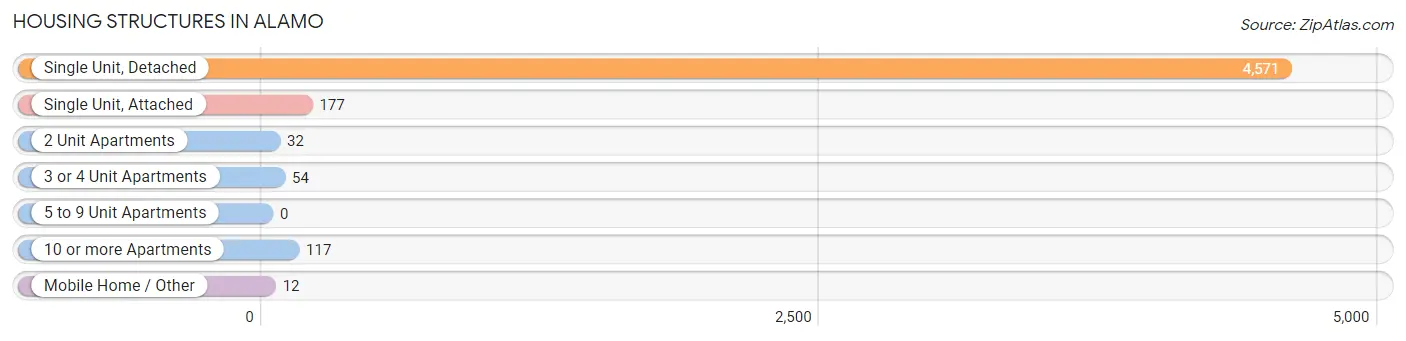
| Structure Type | # Housing Units | % Housing Units |
| Single Unit, Detached | 4,571 | 92.1% |
| Single Unit, Attached | 177 | 3.6% |
| 2 Unit Apartments | 32 | 0.6% |
| 3 or 4 Unit Apartments | 54 | 1.1% |
| 5 to 9 Unit Apartments | 0 | 0.0% |
| 10 or more Apartments | 117 | 2.4% |
| Mobile Home / Other | 12 | 0.2% |
| Total | 4,963 | 100.0% |
Housing Structures by Occupancy in Alamo
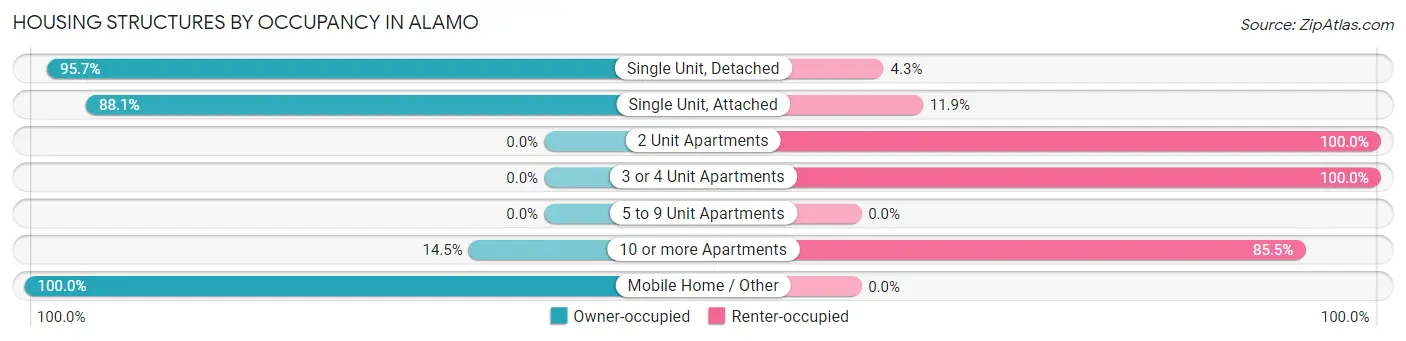
| Structure Type | Owner-occupied | Renter-occupied |
| Single Unit, Detached | 4,373 (95.7%) | 198 (4.3%) |
| Single Unit, Attached | 156 (88.1%) | 21 (11.9%) |
| 2 Unit Apartments | 0 (0.0%) | 32 (100.0%) |
| 3 or 4 Unit Apartments | 0 (0.0%) | 54 (100.0%) |
| 5 to 9 Unit Apartments | 0 (0.0%) | 0 (0.0%) |
| 10 or more Apartments | 17 (14.5%) | 100 (85.5%) |
| Mobile Home / Other | 12 (100.0%) | 0 (0.0%) |
| Total | 4,558 (91.8%) | 405 (8.2%) |
Housing Structures by Number of Rooms in Alamo
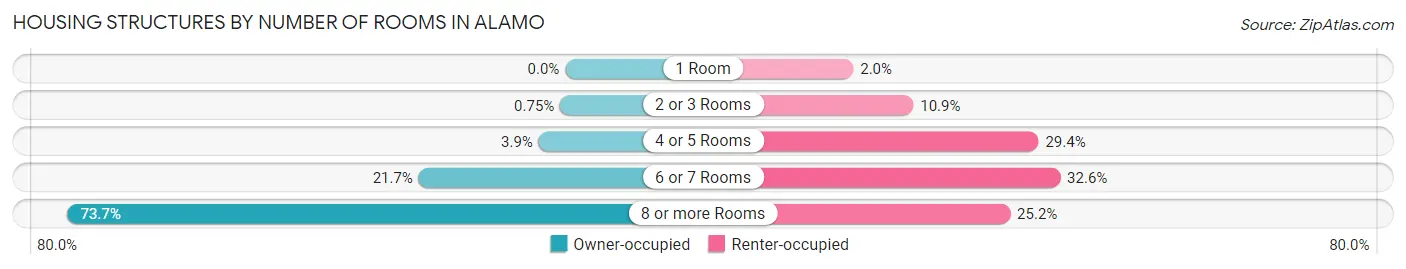
| Number of Rooms | Owner-occupied | Renter-occupied |
| 1 Room | 0 (0.0%) | 8 (2.0%) |
| 2 or 3 Rooms | 34 (0.7%) | 44 (10.9%) |
| 4 or 5 Rooms | 179 (3.9%) | 119 (29.4%) |
| 6 or 7 Rooms | 988 (21.7%) | 132 (32.6%) |
| 8 or more Rooms | 3,357 (73.7%) | 102 (25.2%) |
| Total | 4,558 (100.0%) | 405 (100.0%) |
Housing Structure by Heating Type in Alamo
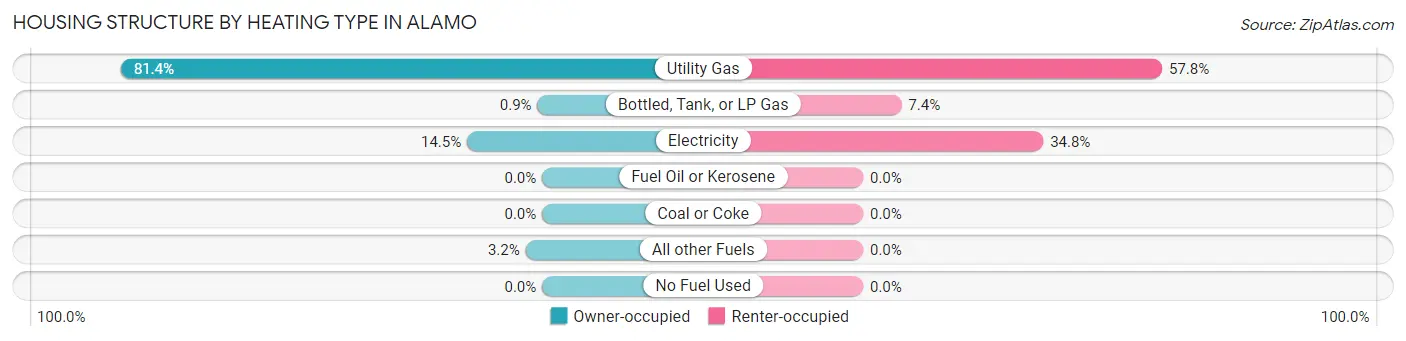
| Heating Type | Owner-occupied | Renter-occupied |
| Utility Gas | 3,710 (81.4%) | 234 (57.8%) |
| Bottled, Tank, or LP Gas | 41 (0.9%) | 30 (7.4%) |
| Electricity | 661 (14.5%) | 141 (34.8%) |
| Fuel Oil or Kerosene | 0 (0.0%) | 0 (0.0%) |
| Coal or Coke | 0 (0.0%) | 0 (0.0%) |
| All other Fuels | 146 (3.2%) | 0 (0.0%) |
| No Fuel Used | 0 (0.0%) | 0 (0.0%) |
| Total | 4,558 (100.0%) | 405 (100.0%) |
Household Vehicle Usage in Alamo
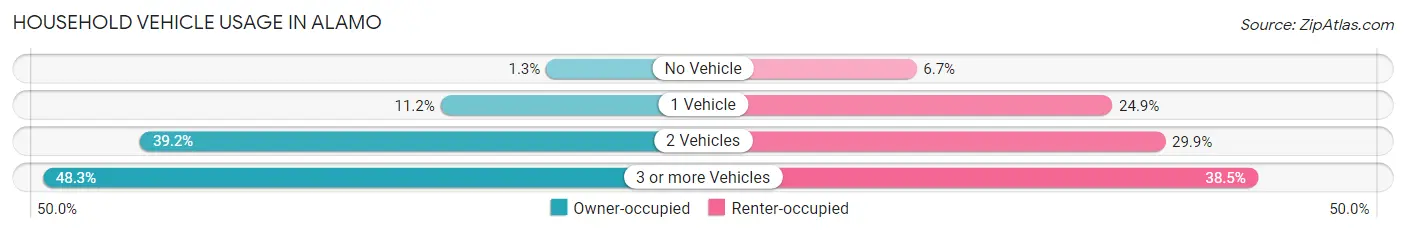
| Vehicles per Household | Owner-occupied | Renter-occupied |
| No Vehicle | 60 (1.3%) | 27 (6.7%) |
| 1 Vehicle | 509 (11.2%) | 101 (24.9%) |
| 2 Vehicles | 1,788 (39.2%) | 121 (29.9%) |
| 3 or more Vehicles | 2,201 (48.3%) | 156 (38.5%) |
| Total | 4,558 (100.0%) | 405 (100.0%) |
Real Estate & Mortgages in Alamo
Real Estate and Mortgage Overview in Alamo
| Characteristic | Without Mortgage | With Mortgage |
| Housing Units | 1,405 | 3,153 |
| Median Property Value | $1,990,700 | $2,000,001 |
| Median Household Income | $204,141 | $2,553 |
| Monthly Housing Costs | $1,501 | $2,881 |
| Real Estate Taxes | $10,001 | $8 |
Property Value by Mortgage Status in Alamo
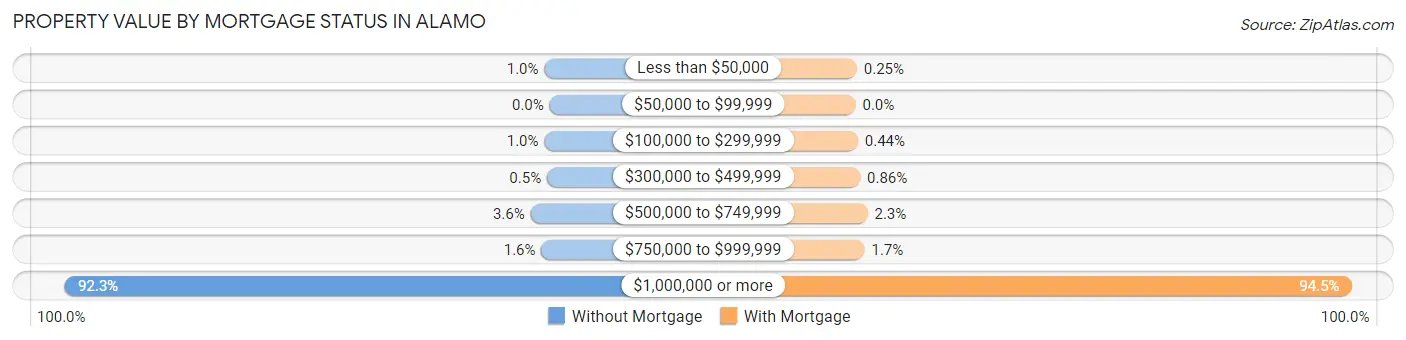
| Property Value | Without Mortgage | With Mortgage |
| Less than $50,000 | 14 (1.0%) | 8 (0.3%) |
| $50,000 to $99,999 | 0 (0.0%) | 0 (0.0%) |
| $100,000 to $299,999 | 14 (1.0%) | 14 (0.4%) |
| $300,000 to $499,999 | 7 (0.5%) | 27 (0.9%) |
| $500,000 to $749,999 | 51 (3.6%) | 72 (2.3%) |
| $750,000 to $999,999 | 22 (1.6%) | 54 (1.7%) |
| $1,000,000 or more | 1,297 (92.3%) | 2,978 (94.5%) |
| Total | 1,405 (100.0%) | 3,153 (100.0%) |
Household Income by Mortgage Status in Alamo
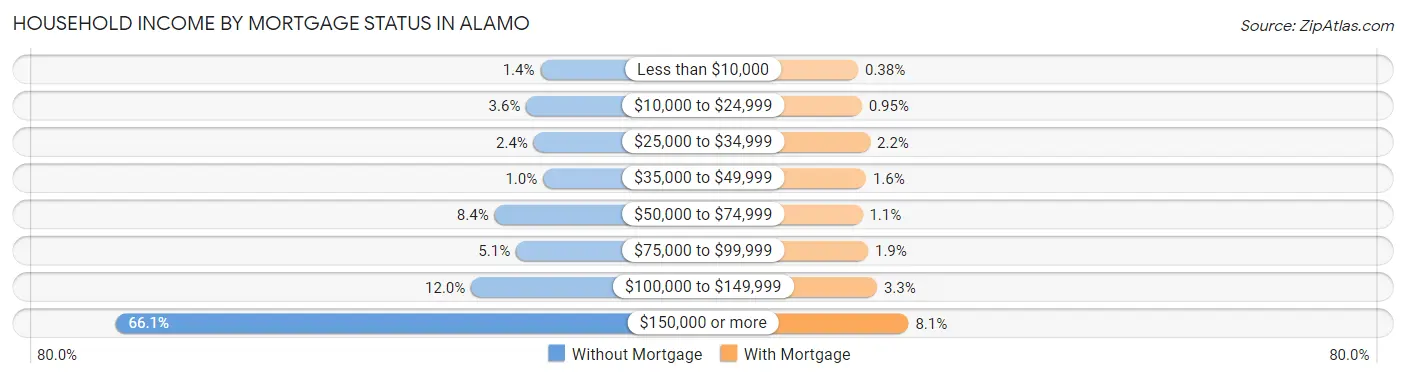
| Household Income | Without Mortgage | With Mortgage |
| Less than $10,000 | 20 (1.4%) | 12 (0.4%) |
| $10,000 to $24,999 | 50 (3.6%) | 30 (0.9%) |
| $25,000 to $34,999 | 34 (2.4%) | 70 (2.2%) |
| $35,000 to $49,999 | 14 (1.0%) | 50 (1.6%) |
| $50,000 to $74,999 | 118 (8.4%) | 33 (1.1%) |
| $75,000 to $99,999 | 72 (5.1%) | 60 (1.9%) |
| $100,000 to $149,999 | 168 (12.0%) | 103 (3.3%) |
| $150,000 or more | 929 (66.1%) | 254 (8.1%) |
| Total | 1,405 (100.0%) | 3,153 (100.0%) |
Property Value to Household Income Ratio in Alamo
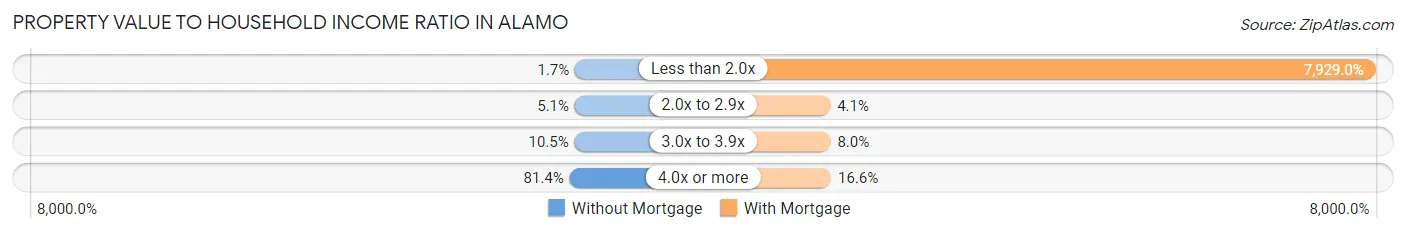
| Value-to-Income Ratio | Without Mortgage | With Mortgage |
| Less than 2.0x | 24 (1.7%) | 250,001 (7,929.0%) |
| 2.0x to 2.9x | 71 (5.1%) | 128 (4.1%) |
| 3.0x to 3.9x | 147 (10.5%) | 253 (8.0%) |
| 4.0x or more | 1,143 (81.4%) | 524 (16.6%) |
| Total | 1,405 (100.0%) | 3,153 (100.0%) |
Real Estate Taxes by Mortgage Status in Alamo
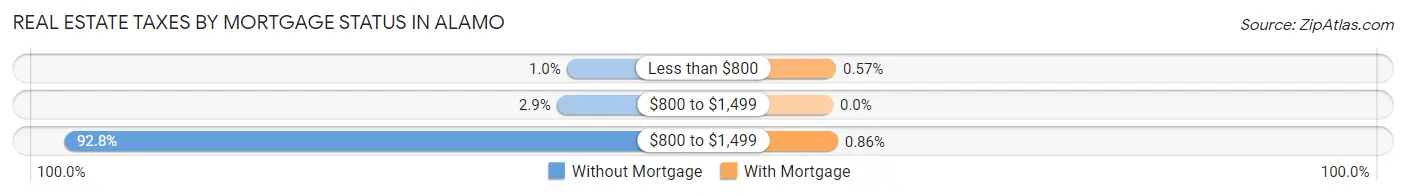
| Property Taxes | Without Mortgage | With Mortgage |
| Less than $800 | 14 (1.0%) | 18 (0.6%) |
| $800 to $1,499 | 40 (2.9%) | 0 (0.0%) |
| $800 to $1,499 | 1,304 (92.8%) | 27 (0.9%) |
| Total | 1,405 (100.0%) | 3,153 (100.0%) |
Health & Disability in Alamo
Health Insurance Coverage by Age in Alamo
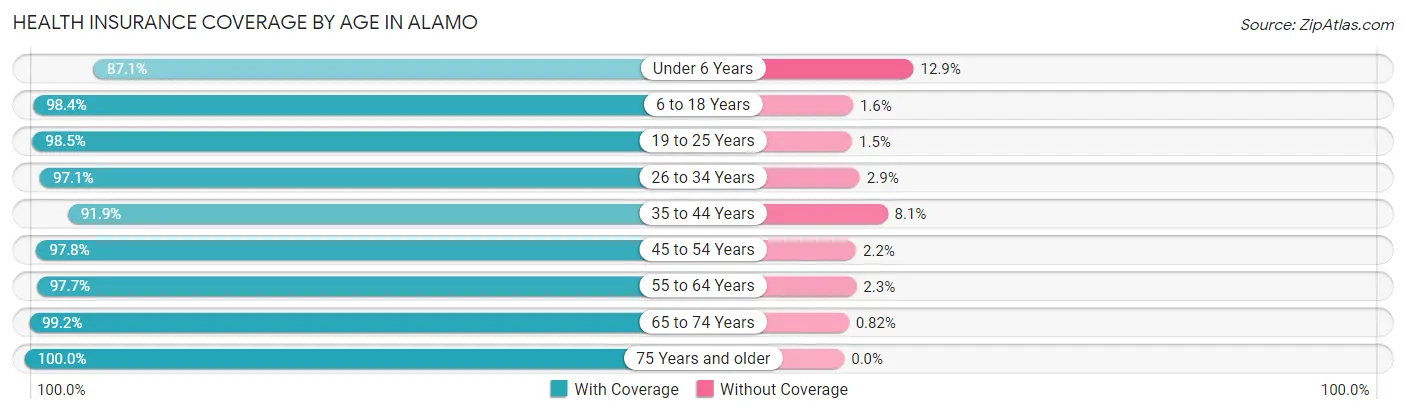
| Age Bracket | With Coverage | Without Coverage |
| Under 6 Years | 492 (87.1%) | 73 (12.9%) |
| 6 to 18 Years | 2,605 (98.4%) | 43 (1.6%) |
| 19 to 25 Years | 875 (98.5%) | 13 (1.5%) |
| 26 to 34 Years | 534 (97.1%) | 16 (2.9%) |
| 35 to 44 Years | 1,058 (91.9%) | 93 (8.1%) |
| 45 to 54 Years | 2,134 (97.8%) | 48 (2.2%) |
| 55 to 64 Years | 2,682 (97.7%) | 62 (2.3%) |
| 65 to 74 Years | 1,823 (99.2%) | 15 (0.8%) |
| 75 Years and older | 1,775 (100.0%) | 0 (0.0%) |
| Total | 13,978 (97.5%) | 363 (2.5%) |
Health Insurance Coverage by Citizenship Status in Alamo
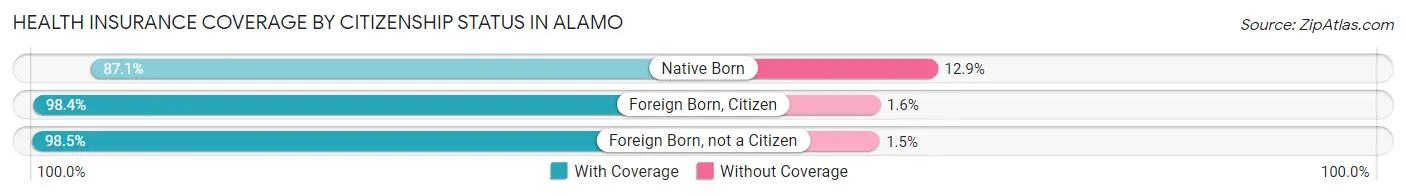
| Citizenship Status | With Coverage | Without Coverage |
| Native Born | 492 (87.1%) | 73 (12.9%) |
| Foreign Born, Citizen | 2,605 (98.4%) | 43 (1.6%) |
| Foreign Born, not a Citizen | 875 (98.5%) | 13 (1.5%) |
Health Insurance Coverage by Household Income in Alamo
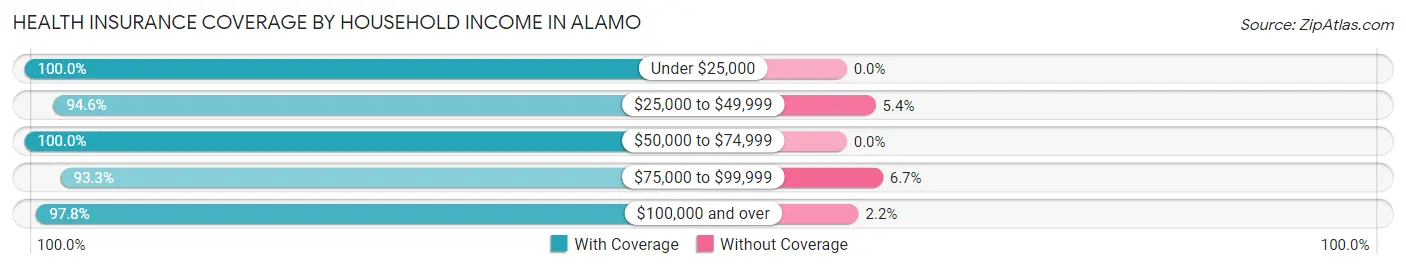
| Household Income | With Coverage | Without Coverage |
| Under $25,000 | 420 (100.0%) | 0 (0.0%) |
| $25,000 to $49,999 | 245 (94.6%) | 14 (5.4%) |
| $50,000 to $74,999 | 420 (100.0%) | 0 (0.0%) |
| $75,000 to $99,999 | 636 (93.3%) | 46 (6.7%) |
| $100,000 and over | 12,227 (97.8%) | 276 (2.2%) |
Public vs Private Health Insurance Coverage by Age in Alamo
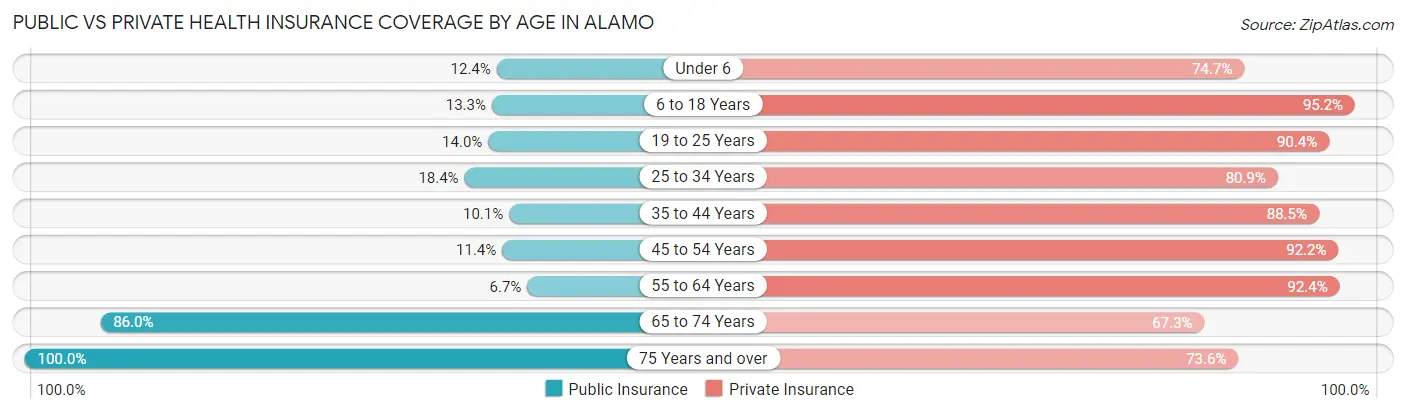
| Age Bracket | Public Insurance | Private Insurance |
| Under 6 | 70 (12.4%) | 422 (74.7%) |
| 6 to 18 Years | 352 (13.3%) | 2,522 (95.2%) |
| 19 to 25 Years | 124 (14.0%) | 803 (90.4%) |
| 25 to 34 Years | 101 (18.4%) | 445 (80.9%) |
| 35 to 44 Years | 116 (10.1%) | 1,019 (88.5%) |
| 45 to 54 Years | 248 (11.4%) | 2,011 (92.2%) |
| 55 to 64 Years | 184 (6.7%) | 2,535 (92.4%) |
| 65 to 74 Years | 1,580 (86.0%) | 1,237 (67.3%) |
| 75 Years and over | 1,775 (100.0%) | 1,306 (73.6%) |
| Total | 4,550 (31.7%) | 12,300 (85.8%) |
Disability Status by Sex by Age in Alamo
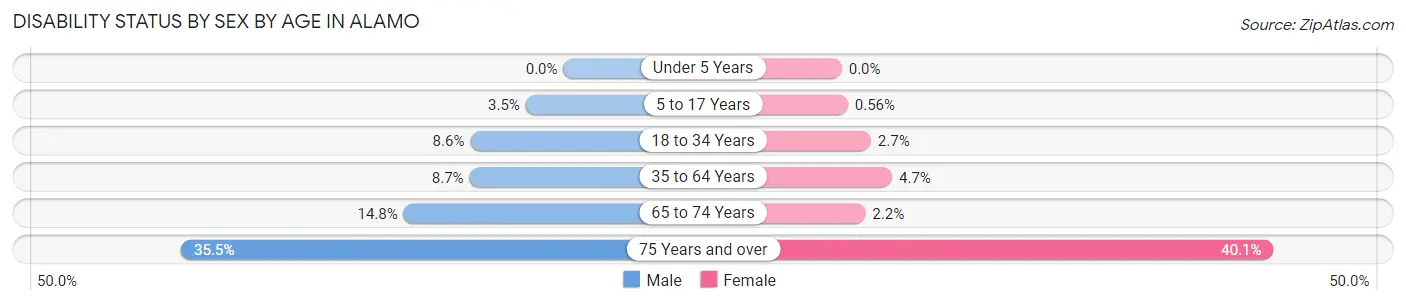
| Age Bracket | Male | Female |
| Under 5 Years | 0 (0.0%) | 0 (0.0%) |
| 5 to 17 Years | 48 (3.5%) | 7 (0.6%) |
| 18 to 34 Years | 71 (8.6%) | 21 (2.7%) |
| 35 to 64 Years | 263 (8.7%) | 143 (4.7%) |
| 65 to 74 Years | 137 (14.8%) | 20 (2.2%) |
| 75 Years and over | 325 (35.5%) | 344 (40.1%) |
Disability Class by Sex by Age in Alamo
Disability Class: Hearing Difficulty
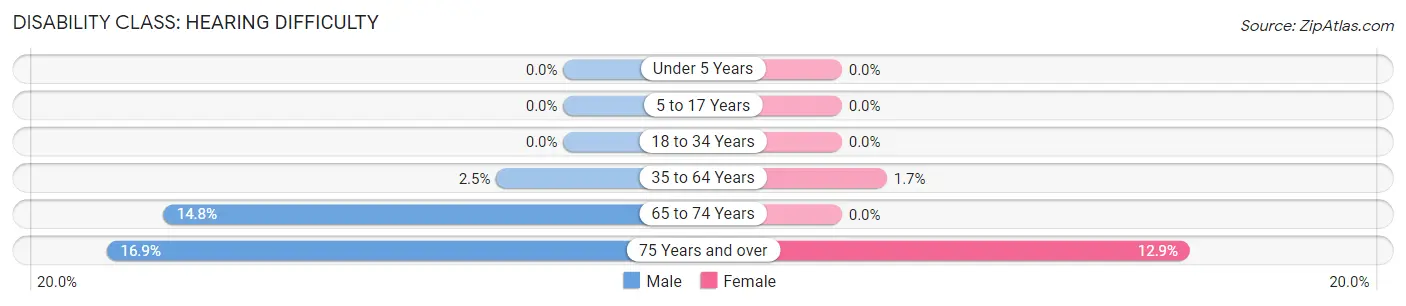
| Age Bracket | Male | Female |
| Under 5 Years | 0 (0.0%) | 0 (0.0%) |
| 5 to 17 Years | 0 (0.0%) | 0 (0.0%) |
| 18 to 34 Years | 0 (0.0%) | 0 (0.0%) |
| 35 to 64 Years | 75 (2.5%) | 51 (1.7%) |
| 65 to 74 Years | 137 (14.8%) | 0 (0.0%) |
| 75 Years and over | 155 (16.9%) | 111 (12.9%) |
Disability Class: Vision Difficulty
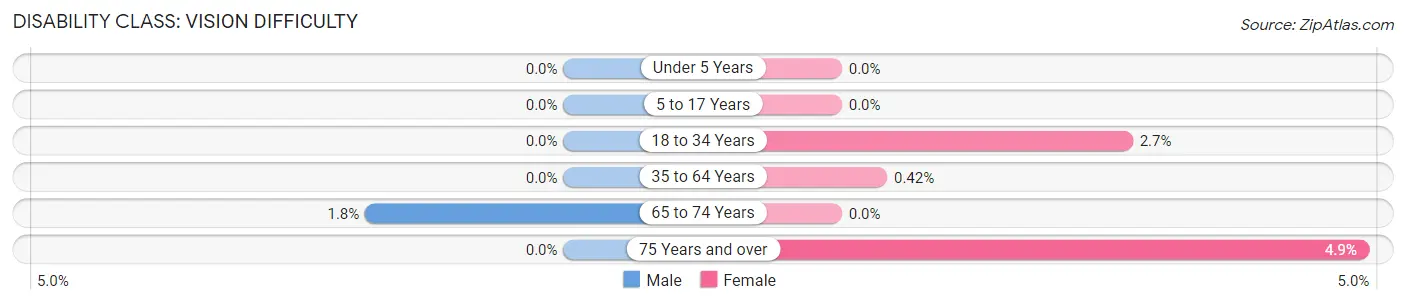
| Age Bracket | Male | Female |
| Under 5 Years | 0 (0.0%) | 0 (0.0%) |
| 5 to 17 Years | 0 (0.0%) | 0 (0.0%) |
| 18 to 34 Years | 0 (0.0%) | 21 (2.7%) |
| 35 to 64 Years | 0 (0.0%) | 13 (0.4%) |
| 65 to 74 Years | 17 (1.8%) | 0 (0.0%) |
| 75 Years and over | 0 (0.0%) | 42 (4.9%) |
Disability Class: Cognitive Difficulty
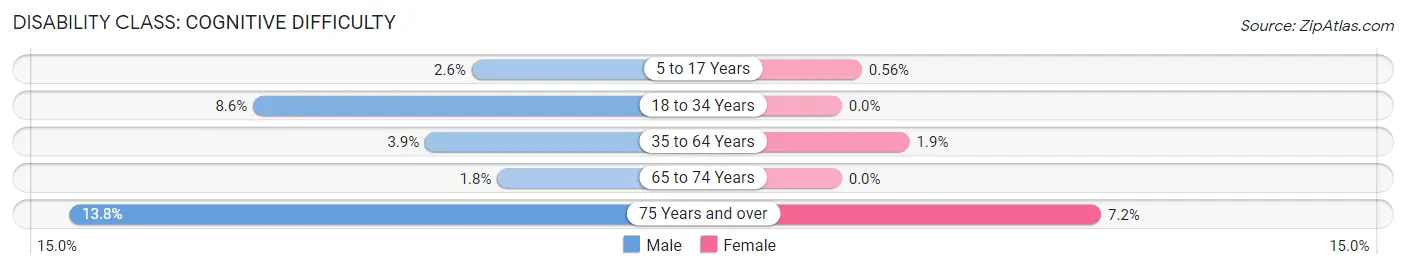
| Age Bracket | Male | Female |
| 5 to 17 Years | 35 (2.5%) | 7 (0.6%) |
| 18 to 34 Years | 71 (8.6%) | 0 (0.0%) |
| 35 to 64 Years | 116 (3.8%) | 58 (1.9%) |
| 65 to 74 Years | 17 (1.8%) | 0 (0.0%) |
| 75 Years and over | 126 (13.8%) | 62 (7.2%) |
Disability Class: Ambulatory Difficulty
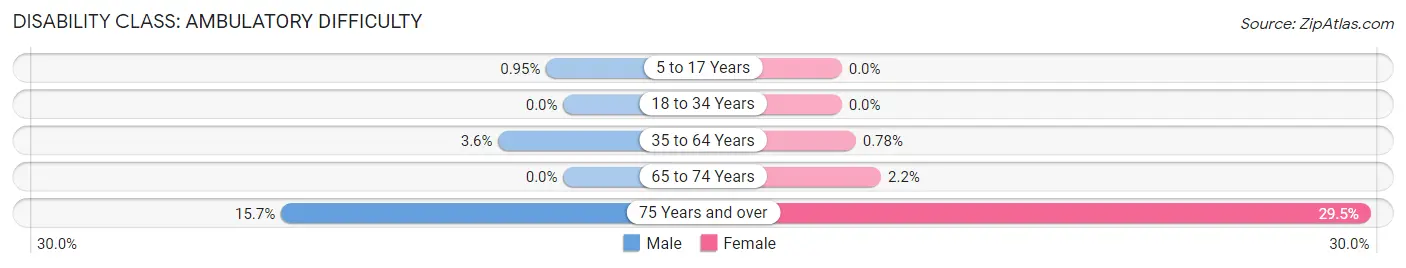
| Age Bracket | Male | Female |
| 5 to 17 Years | 13 (0.9%) | 0 (0.0%) |
| 18 to 34 Years | 0 (0.0%) | 0 (0.0%) |
| 35 to 64 Years | 109 (3.6%) | 24 (0.8%) |
| 65 to 74 Years | 0 (0.0%) | 20 (2.2%) |
| 75 Years and over | 144 (15.7%) | 253 (29.4%) |
Disability Class: Self-Care Difficulty
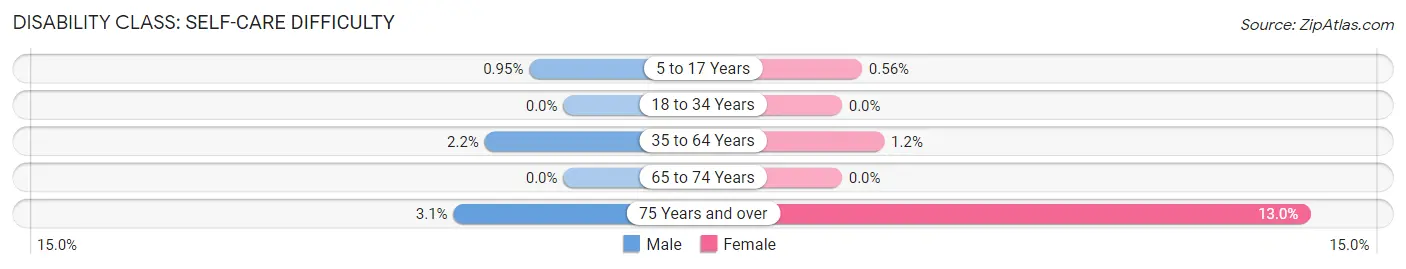
| Age Bracket | Male | Female |
| 5 to 17 Years | 13 (0.9%) | 7 (0.6%) |
| 18 to 34 Years | 0 (0.0%) | 0 (0.0%) |
| 35 to 64 Years | 66 (2.2%) | 36 (1.2%) |
| 65 to 74 Years | 0 (0.0%) | 0 (0.0%) |
| 75 Years and over | 28 (3.1%) | 112 (13.0%) |
Technology Access in Alamo
Computing Device Access in Alamo
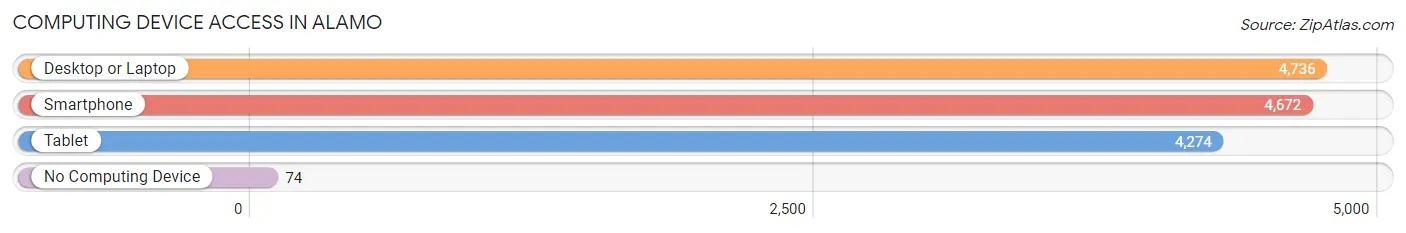
| Device Type | # Households | % Households |
| Desktop or Laptop | 4,736 | 95.4% |
| Smartphone | 4,672 | 94.1% |
| Tablet | 4,274 | 86.1% |
| No Computing Device | 74 | 1.5% |
| Total | 4,963 | 100.0% |
Internet Access in Alamo
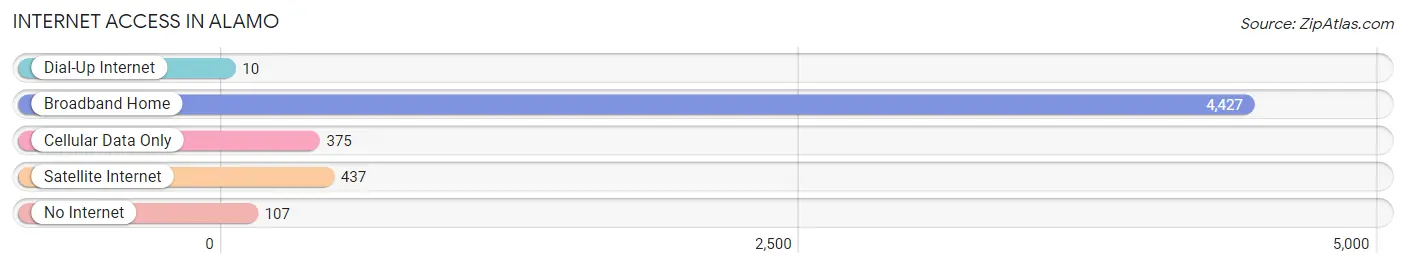
| Internet Type | # Households | % Households |
| Dial-Up Internet | 10 | 0.2% |
| Broadband Home | 4,427 | 89.2% |
| Cellular Data Only | 375 | 7.6% |
| Satellite Internet | 437 | 8.8% |
| No Internet | 107 | 2.2% |
| Total | 4,963 | 100.0% |
Alamo Summary
Alamo, California is a small unincorporated community located in Contra Costa County, California. It is situated in the San Ramon Valley, approximately 25 miles east of San Francisco. The population of Alamo was estimated to be 14,750 in 2019.
History
Alamo was originally inhabited by the Ohlone people, who lived in the area for thousands of years before the arrival of Europeans. The first Europeans to settle in the area were Spanish missionaries, who established the Mission San Jose in 1797. The mission was abandoned in 1834, and the land was divided into large ranchos. In 1848, the area became part of the United States after the Mexican-American War.
In the late 19th century, the area was developed as a rural residential community. The town was named after the Alamo, a Spanish mission in San Antonio, Texas. The town was incorporated in 1891, but it was later disincorporated in 1978.
Geography
Alamo is located in the San Ramon Valley, approximately 25 miles east of San Francisco. The town is situated at an elevation of about 500 feet above sea level. The area is characterized by rolling hills and open space. The climate is mild, with temperatures ranging from the low 40s in the winter to the mid-80s in the summer.
Economy
Alamo is primarily a residential community, but it also has a few businesses. The town is home to several restaurants, retail stores, and professional services. The town is also home to several corporate offices, including Chevron, Oracle, and AT&T.
Demographics
As of 2019, the population of Alamo was estimated to be 14,750. The racial makeup of the town was 79.3% White, 8.2% Asian, 6.2% Hispanic or Latino, and 4.3% African American. The median household income was $150,000, and the median home value was $1,000,000.
Conclusion
Alamo, California is a small unincorporated community located in Contra Costa County, California. It is situated in the San Ramon Valley, approximately 25 miles east of San Francisco. The town was originally inhabited by the Ohlone people, and it was later developed as a rural residential community in the late 19th century. The town is characterized by rolling hills and open space, and it is home to several corporate offices. As of 2019, the population of Alamo was estimated to be 14,750, and the median household income was $150,000.
Common Questions
What is Per Capita Income in Alamo?
Per Capita income in Alamo is $134,776.
What is the Median Family Income in Alamo?
Median Family Income in Alamo is $250,001.
What is the Median Household income in Alamo?
Median Household Income in Alamo is $250,001.
What is Income or Wage Gap in Alamo?
Income or Wage Gap in Alamo is 77.6%.
Women in Alamo earn 22.4 cents for every dollar earned by a man.
What is Family Income Deficit in Alamo?
Family Income Deficit in Alamo is $8,083.
Families that are below poverty line in Alamo earn $8,083 less on average than the poverty threshold level.
What is Inequality or Gini Index in Alamo?
Inequality or Gini Index in Alamo is 0.47.
What is the Total Population of Alamo?
Total Population of Alamo is 14,355.
What is the Total Male Population of Alamo?
Total Male Population of Alamo is 7,302.
What is the Total Female Population of Alamo?
Total Female Population of Alamo is 7,053.
What is the Ratio of Males per 100 Females in Alamo?
There are 103.53 Males per 100 Females in Alamo.
What is the Ratio of Females per 100 Males in Alamo?
There are 96.59 Females per 100 Males in Alamo.
What is the Median Population Age in Alamo?
Median Population Age in Alamo is 51.1 Years.
What is the Average Family Size in Alamo
Average Family Size in Alamo is 3.0 People.
What is the Average Household Size in Alamo
Average Household Size in Alamo is 2.9 People.
How Large is the Labor Force in Alamo?
There are 6,389 People in the Labor Forcein in Alamo.
What is the Percentage of People in the Labor Force in Alamo?
54.0% of People are in the Labor Force in Alamo.
What is the Unemployment Rate in Alamo?
Unemployment Rate in Alamo is 2.7%.