Stanton, NE Map & Demographics
Stanton Map
Stanton Overview
$33,616
PER CAPITA INCOME
$89,219
AVG FAMILY INCOME
$72,500
AVG HOUSEHOLD INCOME
35.4%
WAGE / INCOME GAP [ % ]
64.6¢/ $1
WAGE / INCOME GAP [ $ ]
0.44
INEQUALITY / GINI INDEX
1,673
TOTAL POPULATION
814
MALE POPULATION
859
FEMALE POPULATION
94.76
MALES / 100 FEMALES
105.53
FEMALES / 100 MALES
36.6
MEDIAN AGE
3.3
AVG FAMILY SIZE
2.6
AVG HOUSEHOLD SIZE
783
LABOR FORCE [ PEOPLE ]
60.2%
PERCENT IN LABOR FORCE
1.8%
UNEMPLOYMENT RATE
Stanton Zip Codes
Stanton Area Codes
Income in Stanton
Income Overview in Stanton
Per Capita Income in Stanton is $33,616, while median incomes of families and households are $89,219 and $72,500 respectively.
| Characteristic | Number | Measure |
| Per Capita Income | 1,673 | $33,616 |
| Median Family Income | 397 | $89,219 |
| Mean Family Income | 397 | $102,501 |
| Median Household Income | 626 | $72,500 |
| Mean Household Income | 626 | $83,745 |
| Income Deficit | 397 | $0 |
| Wage / Income Gap (%) | 1,673 | 35.43% |
| Wage / Income Gap ($) | 1,673 | 64.57¢ per $1 |
| Gini / Inequality Index | 1,673 | 0.44 |
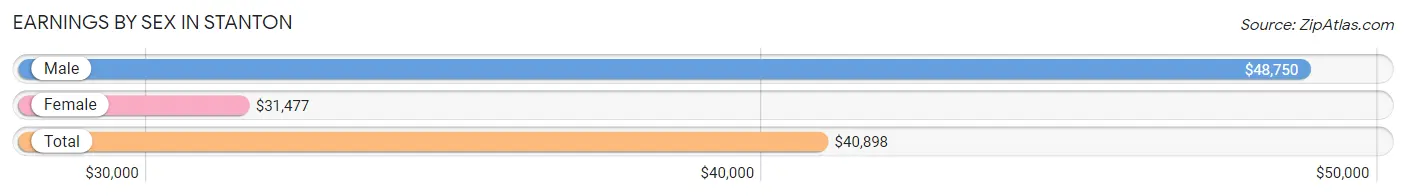
Earnings by Sex in Stanton
Average Earnings in Stanton are $40,898, $48,750 for men and $31,477 for women, a difference of 35.4%.
| Sex | Number | Average Earnings |
| Male | 441 (51.2%) | $48,750 |
| Female | 420 (48.8%) | $31,477 |
| Total | 861 (100.0%) | $40,898 |
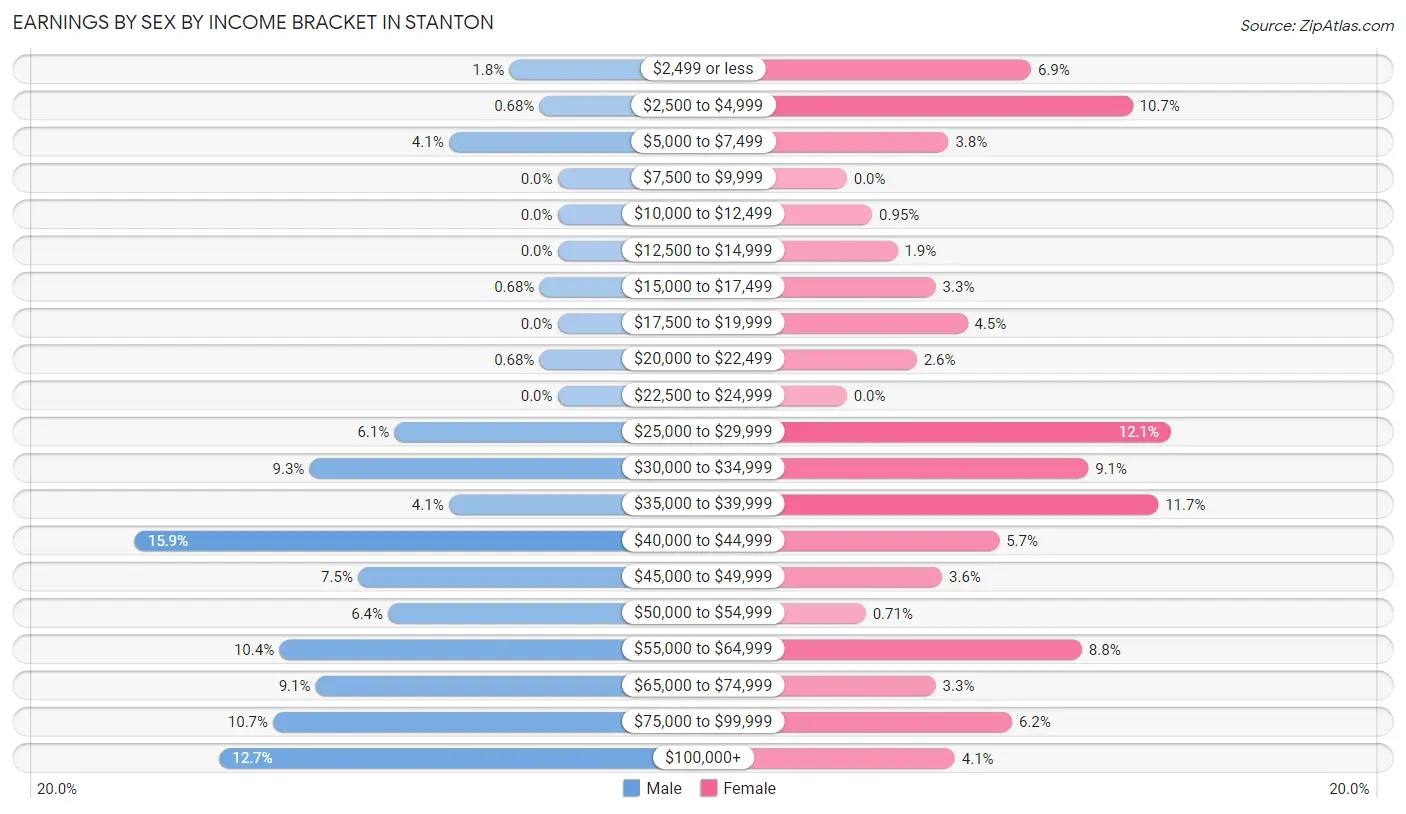
Earnings by Sex by Income Bracket in Stanton
The most common earnings brackets in Stanton are $40,000 to $44,999 for men (70 | 15.9%) and $25,000 to $29,999 for women (51 | 12.1%).
| Income | Male | Female |
| $2,499 or less | 8 (1.8%) | 29 (6.9%) |
| $2,500 to $4,999 | 3 (0.7%) | 45 (10.7%) |
| $5,000 to $7,499 | 18 (4.1%) | 16 (3.8%) |
| $7,500 to $9,999 | 0 (0.0%) | 0 (0.0%) |
| $10,000 to $12,499 | 0 (0.0%) | 4 (0.9%) |
| $12,500 to $14,999 | 0 (0.0%) | 8 (1.9%) |
| $15,000 to $17,499 | 3 (0.7%) | 14 (3.3%) |
| $17,500 to $19,999 | 0 (0.0%) | 19 (4.5%) |
| $20,000 to $22,499 | 3 (0.7%) | 11 (2.6%) |
| $22,500 to $24,999 | 0 (0.0%) | 0 (0.0%) |
| $25,000 to $29,999 | 27 (6.1%) | 51 (12.1%) |
| $30,000 to $34,999 | 41 (9.3%) | 38 (9.0%) |
| $35,000 to $39,999 | 18 (4.1%) | 49 (11.7%) |
| $40,000 to $44,999 | 70 (15.9%) | 24 (5.7%) |
| $45,000 to $49,999 | 33 (7.5%) | 15 (3.6%) |
| $50,000 to $54,999 | 28 (6.4%) | 3 (0.7%) |
| $55,000 to $64,999 | 46 (10.4%) | 37 (8.8%) |
| $65,000 to $74,999 | 40 (9.1%) | 14 (3.3%) |
| $75,000 to $99,999 | 47 (10.7%) | 26 (6.2%) |
| $100,000+ | 56 (12.7%) | 17 (4.1%) |
| Total | 441 (100.0%) | 420 (100.0%) |
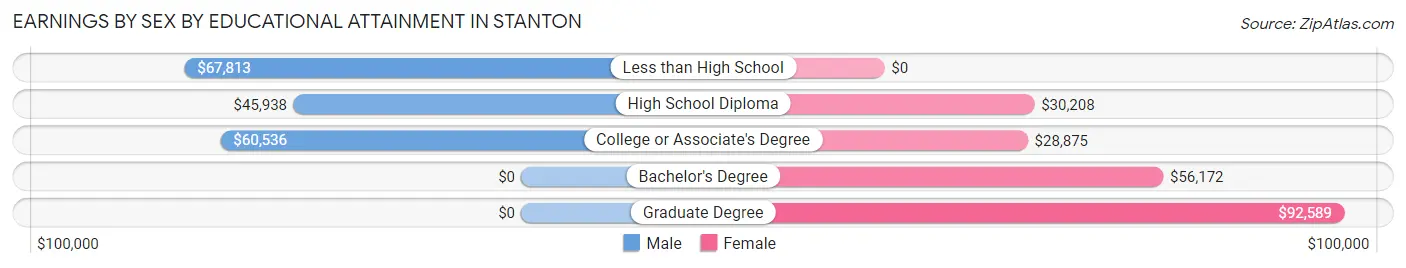
Earnings by Sex by Educational Attainment in Stanton
Average earnings in Stanton are $56,591 for men and $33,047 for women, a difference of 41.6%. Men with an educational attainment of less than high school enjoy the highest average annual earnings of $67,813, while those with high school diploma education earn the least with $45,938. Women with an educational attainment of graduate degree earn the most with the average annual earnings of $92,589, while those with college or associate's degree education have the smallest earnings of $28,875.
| Educational Attainment | Male Income | Female Income |
| Less than High School | $67,813 | $0 |
| High School Diploma | $45,938 | $30,208 |
| College or Associate's Degree | $60,536 | $28,875 |
| Bachelor's Degree | - | - |
| Graduate Degree | - | - |
| Total | $56,591 | $33,047 |
Family Income in Stanton
Family Income Brackets in Stanton
According to the Stanton family income data, there are 114 families falling into the $75,000 to $99,999 income range, which is the most common income bracket and makes up 28.7% of all families. Conversely, the $10,000 to $14,999 income bracket is the least frequent group with only 4 families (1.0%) belonging to this category.
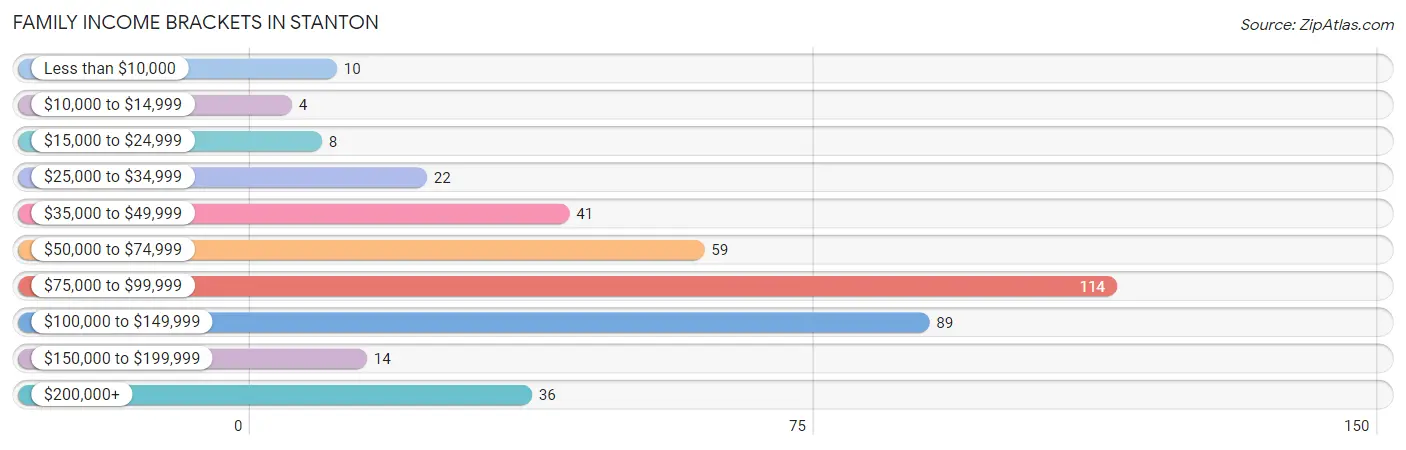
| Income Bracket | # Families | % Families |
| Less than $10,000 | 10 | 2.5% |
| $10,000 to $14,999 | 4 | 1.0% |
| $15,000 to $24,999 | 8 | 2.0% |
| $25,000 to $34,999 | 22 | 5.5% |
| $35,000 to $49,999 | 41 | 10.3% |
| $50,000 to $74,999 | 59 | 14.9% |
| $75,000 to $99,999 | 114 | 28.7% |
| $100,000 to $149,999 | 89 | 22.4% |
| $150,000 to $199,999 | 14 | 3.5% |
| $200,000+ | 36 | 9.1% |
Family Income by Famaliy Size in Stanton
5-person families (18 | 4.5%) account for the highest median family income in Stanton with $144,167 per family, while 2-person families (224 | 56.4%) have the highest median income of $36,000 per family member.
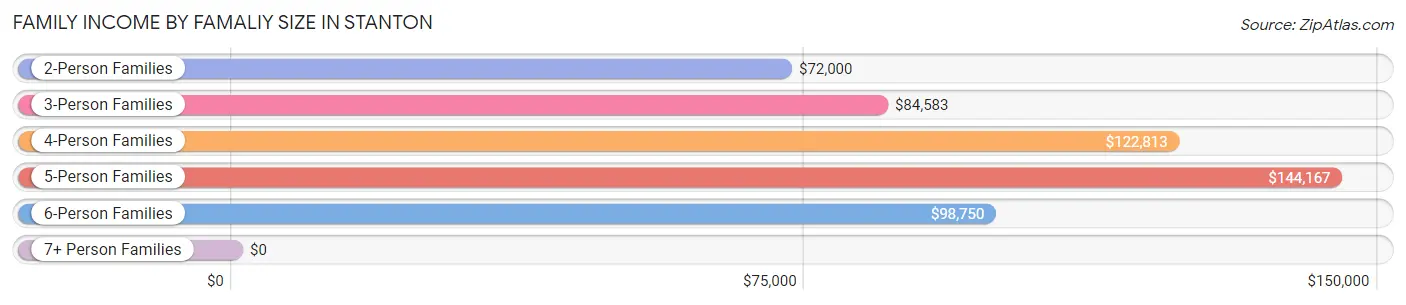
| Income Bracket | # Families | Median Income |
| 2-Person Families | 224 (56.4%) | $72,000 |
| 3-Person Families | 74 (18.6%) | $84,583 |
| 4-Person Families | 52 (13.1%) | $122,813 |
| 5-Person Families | 18 (4.5%) | $144,167 |
| 6-Person Families | 27 (6.8%) | $98,750 |
| 7+ Person Families | 2 (0.5%) | $0 |
| Total | 397 (100.0%) | $89,219 |
Family Income by Number of Earners in Stanton
The median family income in Stanton is $89,219, with families comprising 3+ earners (21) having the highest median family income of $250,001, while families with no earners (50) have the lowest median family income of $39,167, accounting for 5.3% and 12.6% of families, respectively.
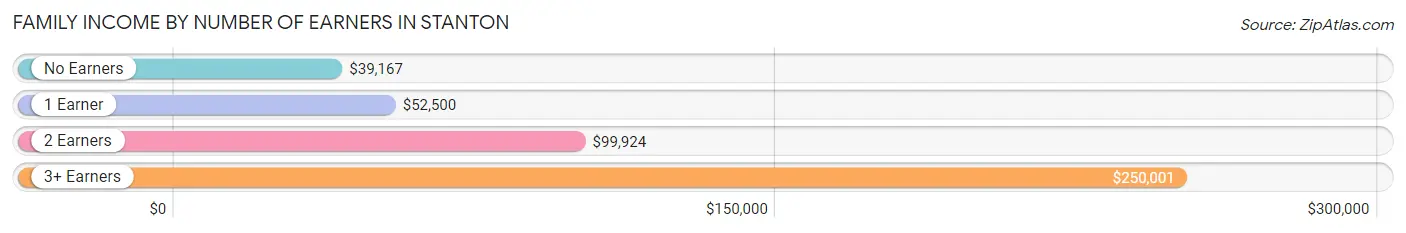
| Number of Earners | # Families | Median Income |
| No Earners | 50 (12.6%) | $39,167 |
| 1 Earner | 106 (26.7%) | $52,500 |
| 2 Earners | 220 (55.4%) | $99,924 |
| 3+ Earners | 21 (5.3%) | $250,001 |
| Total | 397 (100.0%) | $89,219 |
Household Income in Stanton
Household Income Brackets in Stanton
With 117 households falling in the category, the $100,000 to $149,999 income range is the most frequent in Stanton, accounting for 18.7% of all households. In contrast, only 7 households (1.1%) fall into the $10,000 to $14,999 income bracket, making it the least populous group.
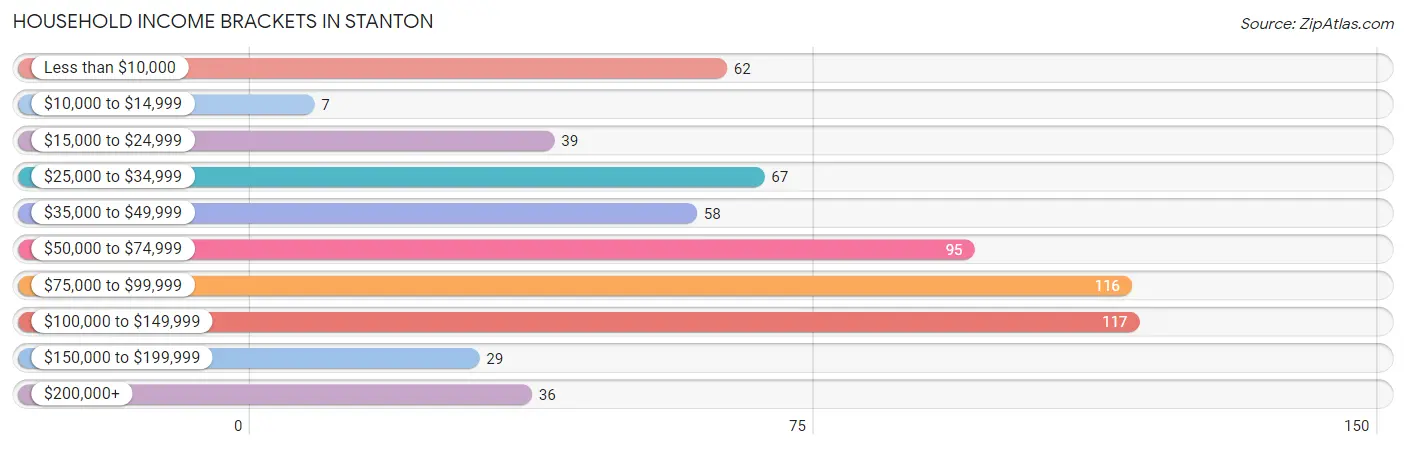
| Income Bracket | # Households | % Households |
| Less than $10,000 | 62 | 9.9% |
| $10,000 to $14,999 | 7 | 1.1% |
| $15,000 to $24,999 | 39 | 6.2% |
| $25,000 to $34,999 | 67 | 10.7% |
| $35,000 to $49,999 | 58 | 9.3% |
| $50,000 to $74,999 | 95 | 15.2% |
| $75,000 to $99,999 | 116 | 18.5% |
| $100,000 to $149,999 | 117 | 18.7% |
| $150,000 to $199,999 | 29 | 4.6% |
| $200,000+ | 36 | 5.8% |
Household Income by Householder Age in Stanton
The median household income in Stanton is $72,500, with the highest median household income of $101,786 found in the 15 to 24 years age bracket for the primary householder. A total of 22 households (3.5%) fall into this category. Meanwhile, the 65+ years age bracket for the primary householder has the lowest median household income of $34,143, with 240 households (38.3%) in this group.
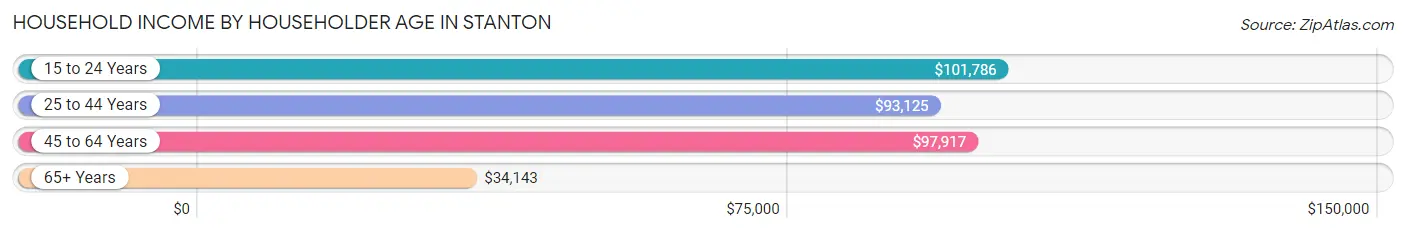
| Income Bracket | # Households | Median Income |
| 15 to 24 Years | 22 (3.5%) | $101,786 |
| 25 to 44 Years | 185 (29.5%) | $93,125 |
| 45 to 64 Years | 179 (28.6%) | $97,917 |
| 65+ Years | 240 (38.3%) | $34,143 |
| Total | 626 (100.0%) | $72,500 |
Poverty in Stanton
Income Below Poverty by Sex and Age in Stanton
With 1.8% poverty level for males and 12.3% for females among the residents of Stanton, 65 to 74 year old males and 75 year old and over females are the most vulnerable to poverty, with 10 males (13.0%) and 39 females (41.5%) in their respective age groups living below the poverty level.
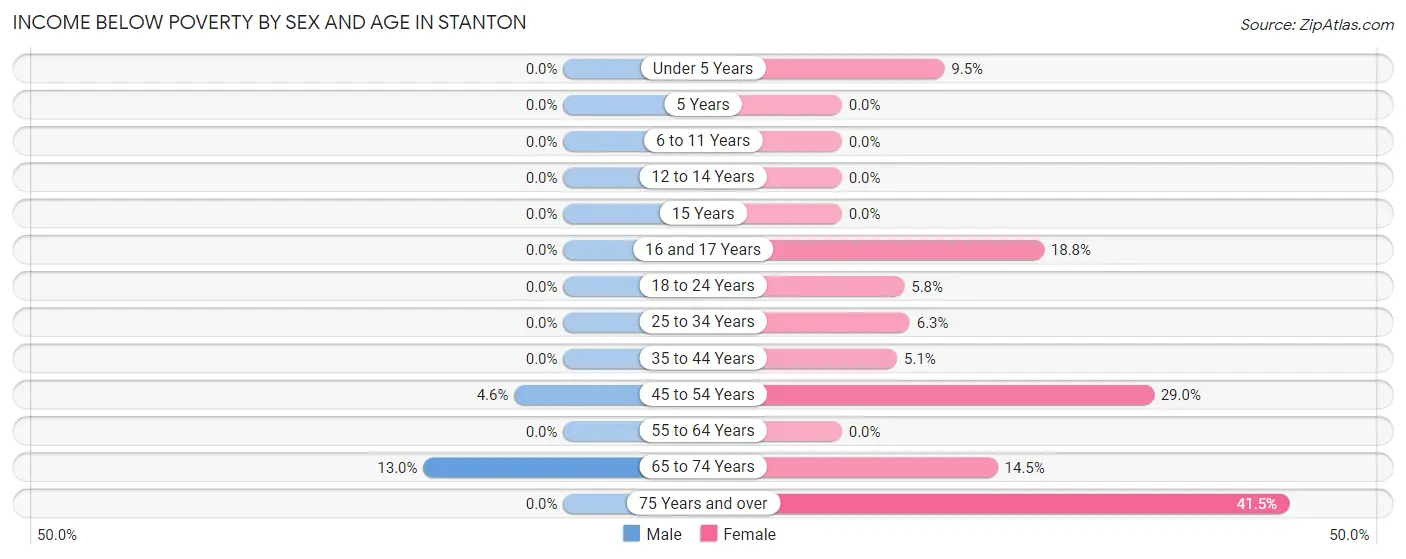
| Age Bracket | Male | Female |
| Under 5 Years | 0 (0.0%) | 2 (9.5%) |
| 5 Years | 0 (0.0%) | 0 (0.0%) |
| 6 to 11 Years | 0 (0.0%) | 0 (0.0%) |
| 12 to 14 Years | 0 (0.0%) | 0 (0.0%) |
| 15 Years | 0 (0.0%) | 0 (0.0%) |
| 16 and 17 Years | 0 (0.0%) | 9 (18.8%) |
| 18 to 24 Years | 0 (0.0%) | 4 (5.8%) |
| 25 to 34 Years | 0 (0.0%) | 7 (6.3%) |
| 35 to 44 Years | 0 (0.0%) | 4 (5.1%) |
| 45 to 54 Years | 4 (4.5%) | 22 (28.9%) |
| 55 to 64 Years | 0 (0.0%) | 0 (0.0%) |
| 65 to 74 Years | 10 (13.0%) | 12 (14.5%) |
| 75 Years and over | 0 (0.0%) | 39 (41.5%) |
| Total | 14 (1.8%) | 99 (12.3%) |
Income Above Poverty by Sex and Age in Stanton
According to the poverty statistics in Stanton, males aged under 5 years and females aged 5 years are the age groups that are most secure financially, with 100.0% of males and 100.0% of females in these age groups living above the poverty line.
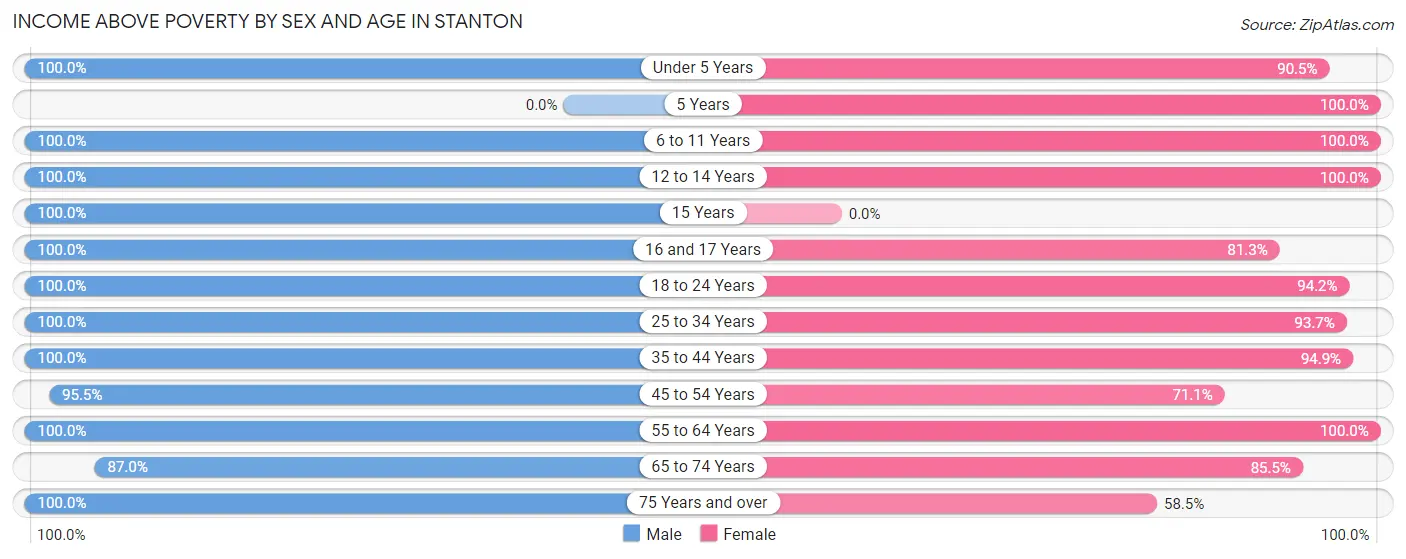
| Age Bracket | Male | Female |
| Under 5 Years | 23 (100.0%) | 19 (90.5%) |
| 5 Years | 0 (0.0%) | 22 (100.0%) |
| 6 to 11 Years | 119 (100.0%) | 97 (100.0%) |
| 12 to 14 Years | 44 (100.0%) | 14 (100.0%) |
| 15 Years | 23 (100.0%) | 0 (0.0%) |
| 16 and 17 Years | 9 (100.0%) | 39 (81.2%) |
| 18 to 24 Years | 114 (100.0%) | 65 (94.2%) |
| 25 to 34 Years | 83 (100.0%) | 104 (93.7%) |
| 35 to 44 Years | 77 (100.0%) | 74 (94.9%) |
| 45 to 54 Years | 84 (95.5%) | 54 (71.1%) |
| 55 to 64 Years | 71 (100.0%) | 92 (100.0%) |
| 65 to 74 Years | 67 (87.0%) | 71 (85.5%) |
| 75 Years and over | 70 (100.0%) | 55 (58.5%) |
| Total | 784 (98.3%) | 706 (87.7%) |
Income Below Poverty Among Married-Couple Families in Stanton
The poverty statistics for married-couple families in Stanton show that 3.9% or 12 of the total 311 families live below the poverty line. Families with no children have the highest poverty rate of 6.2%, comprising of 12 families. On the other hand, families with 1 or 2 children have the lowest poverty rate of 0.0%, which includes 0 families.
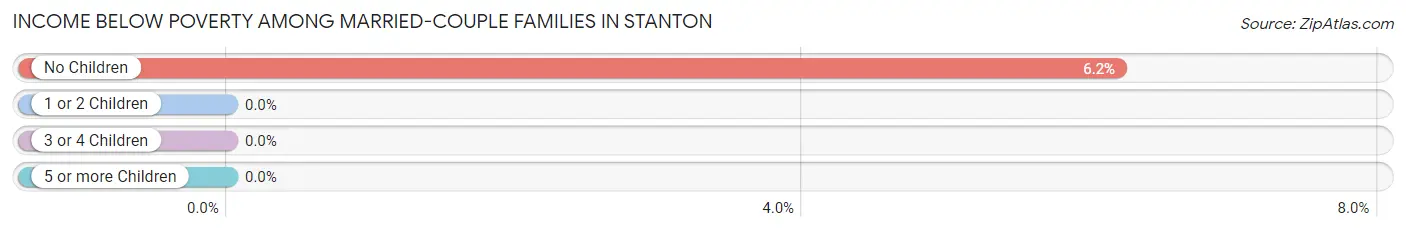
| Children | Above Poverty | Below Poverty |
| No Children | 182 (93.8%) | 12 (6.2%) |
| 1 or 2 Children | 79 (100.0%) | 0 (0.0%) |
| 3 or 4 Children | 36 (100.0%) | 0 (0.0%) |
| 5 or more Children | 2 (100.0%) | 0 (0.0%) |
| Total | 299 (96.1%) | 12 (3.9%) |
Income Below Poverty Among Single-Parent Households in Stanton
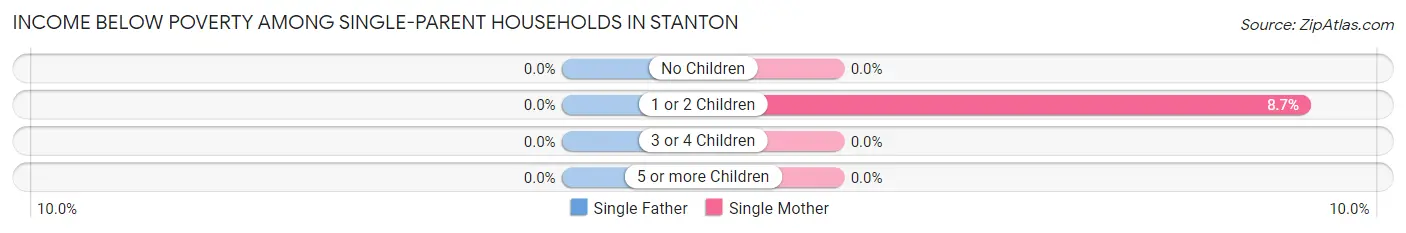
| Children | Single Father | Single Mother |
| No Children | 0 (0.0%) | 0 (0.0%) |
| 1 or 2 Children | 0 (0.0%) | 4 (8.7%) |
| 3 or 4 Children | 0 (0.0%) | 0 (0.0%) |
| 5 or more Children | 0 (0.0%) | 0 (0.0%) |
| Total | 0 (0.0%) | 4 (5.6%) |
Income Below Poverty Among Married-Couple vs Single-Parent Households in Stanton
The poverty data for Stanton shows that 12 of the married-couple family households (3.9%) and 4 of the single-parent households (4.6%) are living below the poverty level. Within the married-couple family households, those with no children have the highest poverty rate, with 12 households (6.2%) falling below the poverty line. Among the single-parent households, those with 1 or 2 children have the highest poverty rate, with 4 household (6.6%) living below poverty.
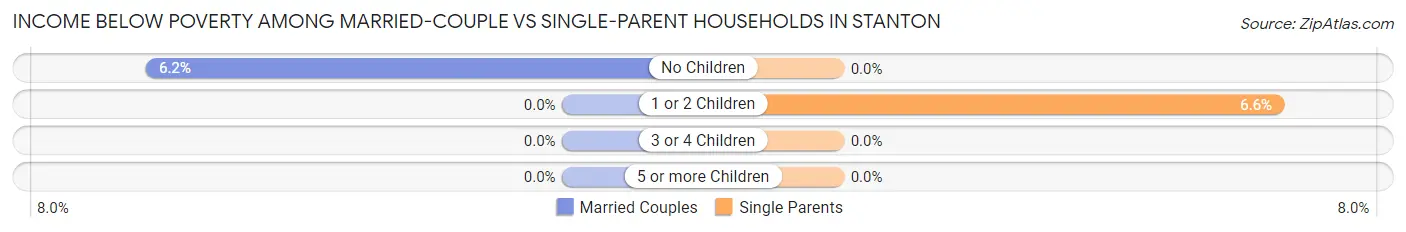
| Children | Married-Couple Families | Single-Parent Households |
| No Children | 12 (6.2%) | 0 (0.0%) |
| 1 or 2 Children | 0 (0.0%) | 4 (6.6%) |
| 3 or 4 Children | 0 (0.0%) | 0 (0.0%) |
| 5 or more Children | 0 (0.0%) | 0 (0.0%) |
| Total | 12 (3.9%) | 4 (4.6%) |
Race in Stanton
The most populous races in Stanton are White / Caucasian (1,491 | 89.1%), Hispanic or Latino (126 | 7.5%), and Some other Race (84 | 5.0%).
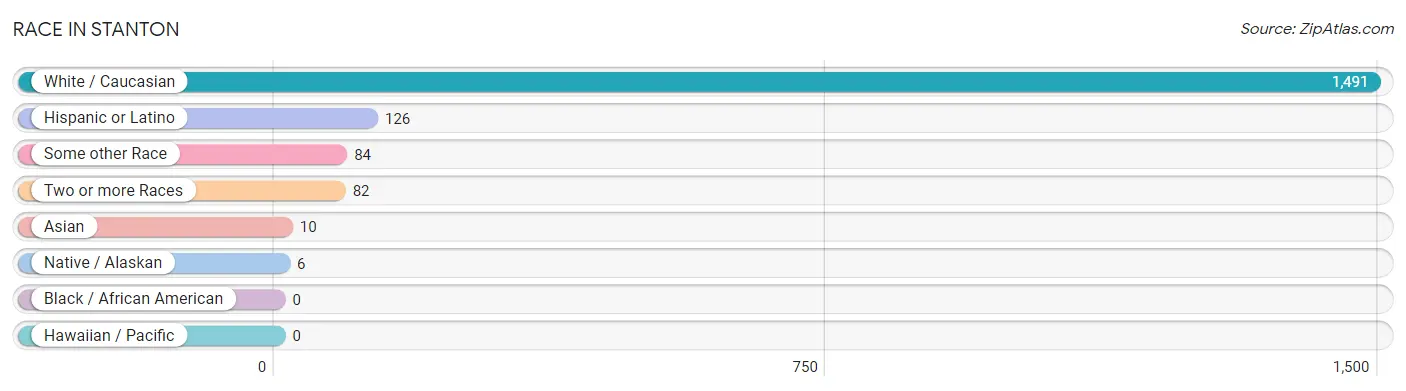
| Race | # Population | % Population |
| Asian | 10 | 0.6% |
| Black / African American | 0 | 0.0% |
| Hawaiian / Pacific | 0 | 0.0% |
| Hispanic or Latino | 126 | 7.5% |
| Native / Alaskan | 6 | 0.4% |
| White / Caucasian | 1,491 | 89.1% |
| Two or more Races | 82 | 4.9% |
| Some other Race | 84 | 5.0% |
| Total | 1,673 | 100.0% |
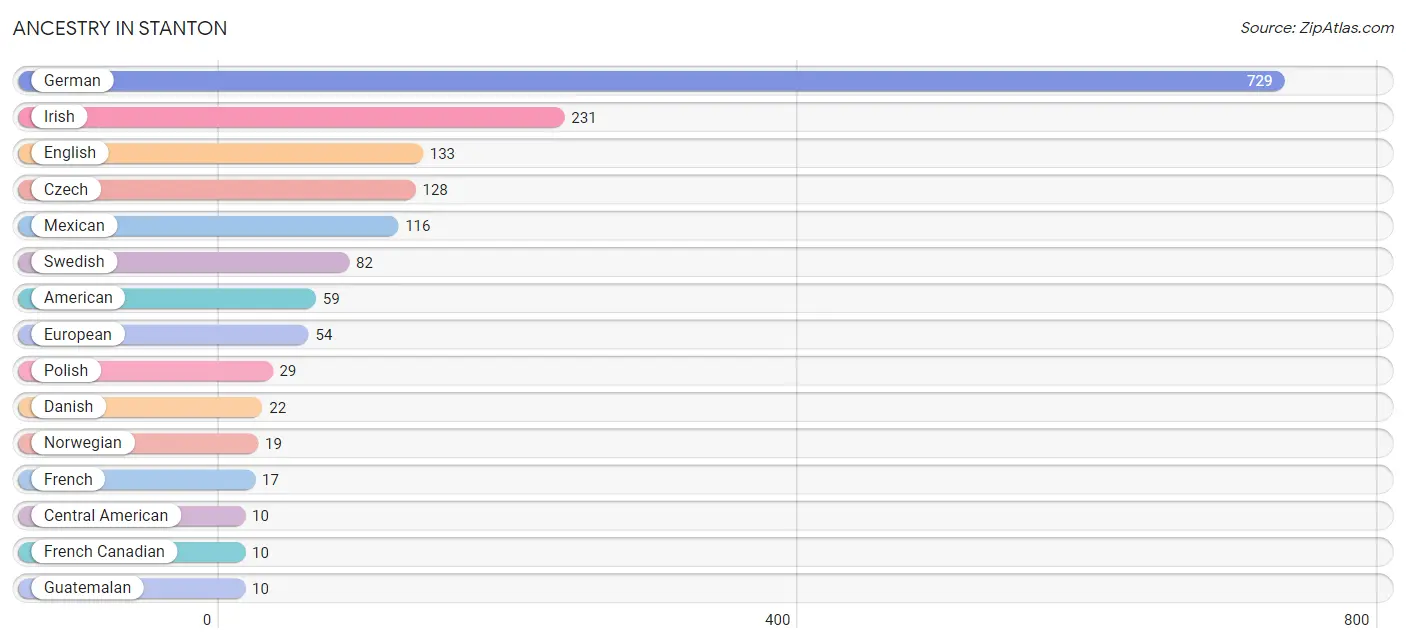
Ancestry in Stanton
The most populous ancestries reported in Stanton are German (729 | 43.6%), Irish (231 | 13.8%), English (133 | 8.0%), Czech (128 | 7.6%), and Mexican (116 | 6.9%), together accounting for 79.9% of all Stanton residents.
| Ancestry | # Population | % Population |
| American | 59 | 3.5% |
| Arab | 6 | 0.4% |
| Bhutanese | 4 | 0.2% |
| British | 3 | 0.2% |
| Central American | 10 | 0.6% |
| Czech | 128 | 7.6% |
| Danish | 22 | 1.3% |
| Dutch | 9 | 0.5% |
| English | 133 | 8.0% |
| European | 54 | 3.2% |
| Finnish | 4 | 0.2% |
| French | 17 | 1.0% |
| French Canadian | 10 | 0.6% |
| German | 729 | 43.6% |
| Greek | 3 | 0.2% |
| Guatemalan | 10 | 0.6% |
| Irish | 231 | 13.8% |
| Italian | 3 | 0.2% |
| Korean | 6 | 0.4% |
| Mexican | 116 | 6.9% |
| Norwegian | 19 | 1.1% |
| Polish | 29 | 1.7% |
| Russian | 4 | 0.2% |
| Scotch-Irish | 6 | 0.4% |
| Scottish | 4 | 0.2% |
| Sioux | 9 | 0.5% |
| Swedish | 82 | 4.9% |
| Swiss | 10 | 0.6% |
| Syrian | 6 | 0.4% | View All 29 Rows |
Immigrants in Stanton
The most numerous immigrant groups reported in Stanton came from Asia (6 | 0.4%), Philippines (6 | 0.4%), South Eastern Asia (6 | 0.4%), Central America (4 | 0.2%), and Latin America (4 | 0.2%), together accounting for 1.6% of all Stanton residents.
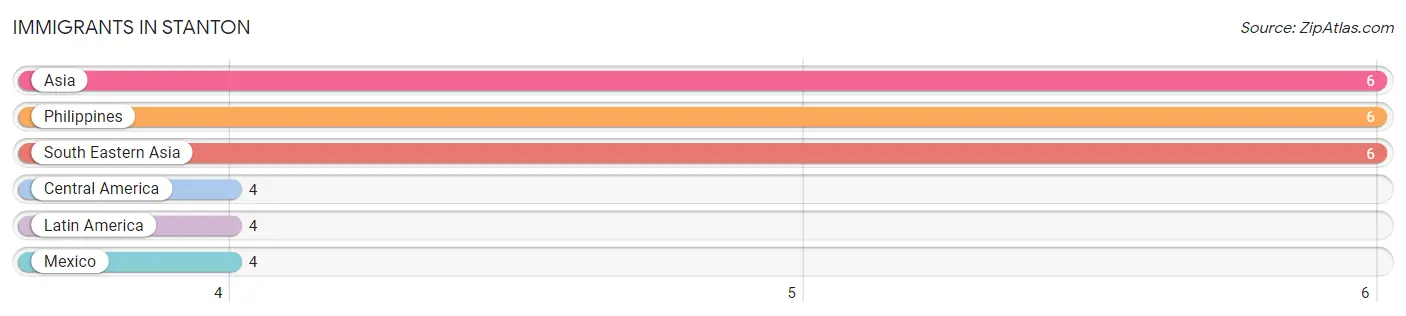
| Immigration Origin | # Population | % Population |
| Asia | 6 | 0.4% |
| Central America | 4 | 0.2% |
| Latin America | 4 | 0.2% |
| Mexico | 4 | 0.2% |
| Philippines | 6 | 0.4% |
| South Eastern Asia | 6 | 0.4% | View All 6 Rows |
Sex and Age in Stanton
Sex and Age in Stanton
The most populous age groups in Stanton are 5 to 9 Years (98 | 12.0%) for men and 10 to 14 Years (95 | 11.1%) for women.
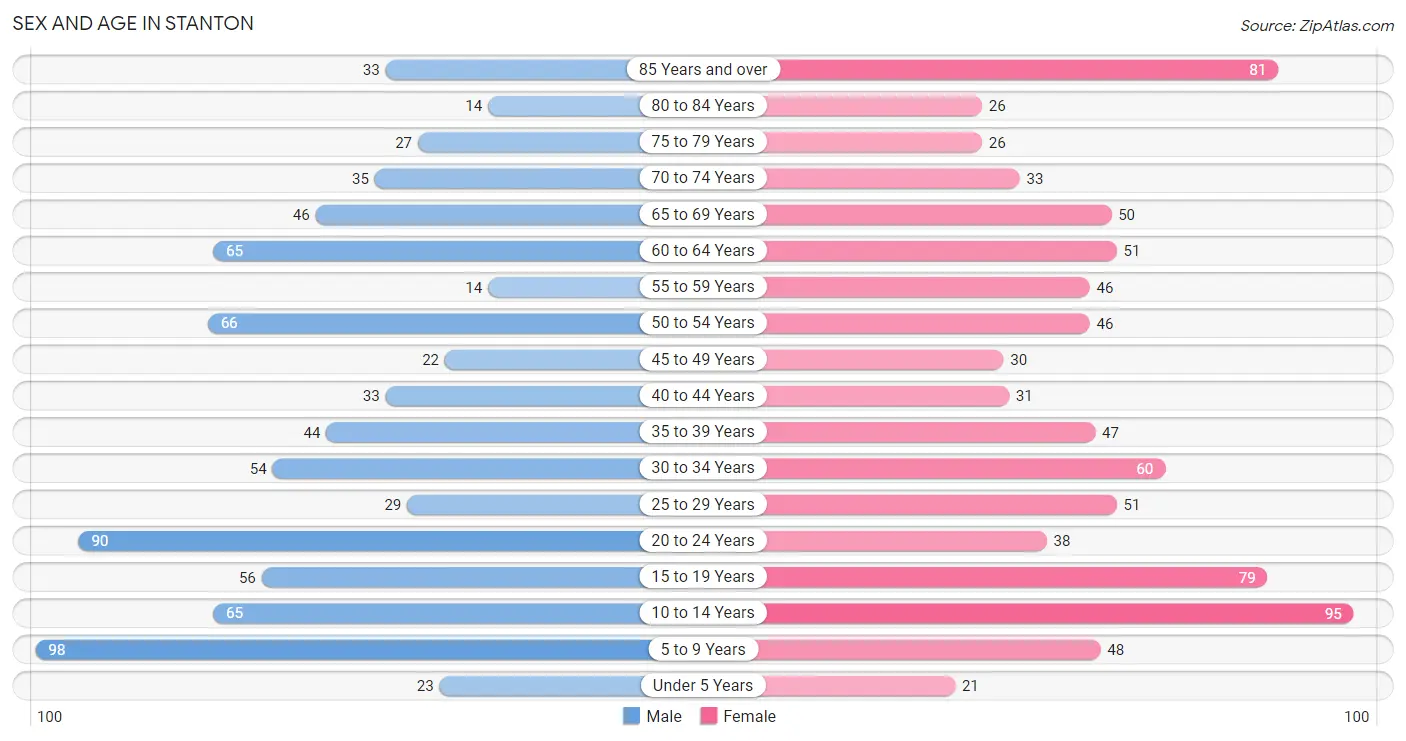
| Age Bracket | Male | Female |
| Under 5 Years | 23 (2.8%) | 21 (2.4%) |
| 5 to 9 Years | 98 (12.0%) | 48 (5.6%) |
| 10 to 14 Years | 65 (8.0%) | 95 (11.1%) |
| 15 to 19 Years | 56 (6.9%) | 79 (9.2%) |
| 20 to 24 Years | 90 (11.1%) | 38 (4.4%) |
| 25 to 29 Years | 29 (3.6%) | 51 (5.9%) |
| 30 to 34 Years | 54 (6.6%) | 60 (7.0%) |
| 35 to 39 Years | 44 (5.4%) | 47 (5.5%) |
| 40 to 44 Years | 33 (4.1%) | 31 (3.6%) |
| 45 to 49 Years | 22 (2.7%) | 30 (3.5%) |
| 50 to 54 Years | 66 (8.1%) | 46 (5.4%) |
| 55 to 59 Years | 14 (1.7%) | 46 (5.4%) |
| 60 to 64 Years | 65 (8.0%) | 51 (5.9%) |
| 65 to 69 Years | 46 (5.7%) | 50 (5.8%) |
| 70 to 74 Years | 35 (4.3%) | 33 (3.8%) |
| 75 to 79 Years | 27 (3.3%) | 26 (3.0%) |
| 80 to 84 Years | 14 (1.7%) | 26 (3.0%) |
| 85 Years and over | 33 (4.1%) | 81 (9.4%) |
| Total | 814 (100.0%) | 859 (100.0%) |
Families and Households in Stanton
Median Family Size in Stanton
The median family size in Stanton is 3.31 persons per family, with married-couple families (311 | 78.3%) accounting for the largest median family size of 3.48 persons per family. On the other hand, single male/father families (15 | 3.8%) represent the smallest median family size with 2.27 persons per family.
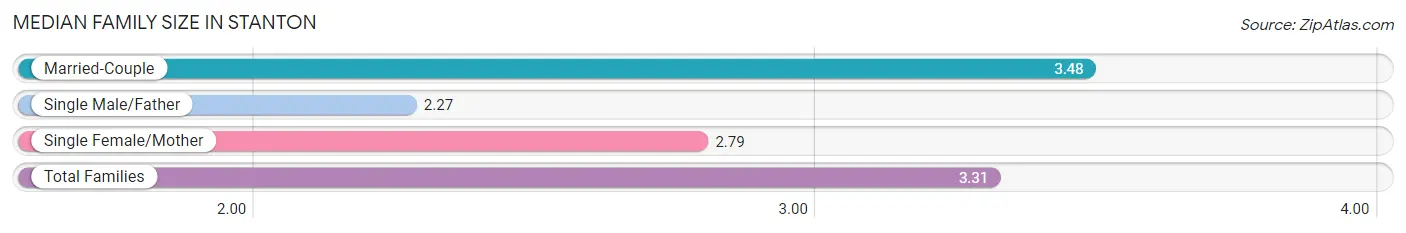
| Family Type | # Families | Family Size |
| Married-Couple | 311 (78.3%) | 3.48 |
| Single Male/Father | 15 (3.8%) | 2.27 |
| Single Female/Mother | 71 (17.9%) | 2.79 |
| Total Families | 397 (100.0%) | 3.31 |
Median Household Size in Stanton
The median household size in Stanton is 2.58 persons per household, with married-couple households (311 | 49.7%) accounting for the largest median household size of 3.53 persons per household. non-family households (229 | 36.6%) represent the smallest median household size with 1.09 persons per household.
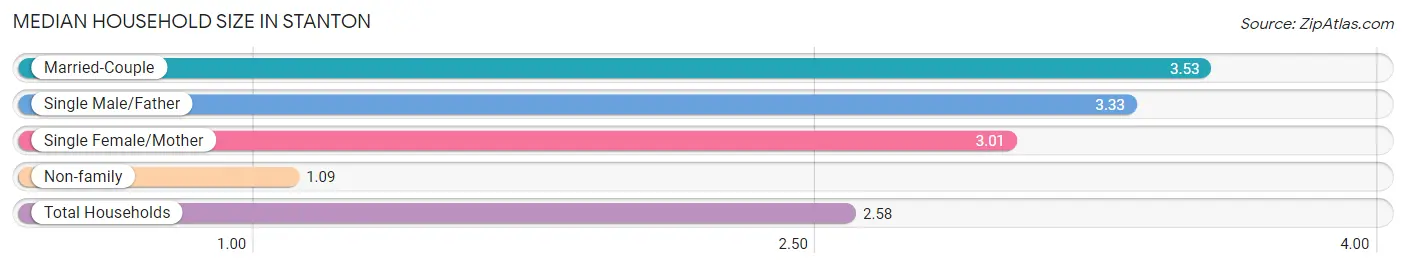
| Household Type | # Households | Household Size |
| Married-Couple | 311 (49.7%) | 3.53 |
| Single Male/Father | 15 (2.4%) | 3.33 |
| Single Female/Mother | 71 (11.3%) | 3.01 |
| Non-family | 229 (36.6%) | 1.09 |
| Total Households | 626 (100.0%) | 2.58 |
Household Size by Marriage Status in Stanton
Out of a total of 626 households in Stanton, 397 (63.4%) are family households, while 229 (36.6%) are nonfamily households. The most numerous type of family households are 2-person households, comprising 209, and the most common type of nonfamily households are 1-person households, comprising 202.
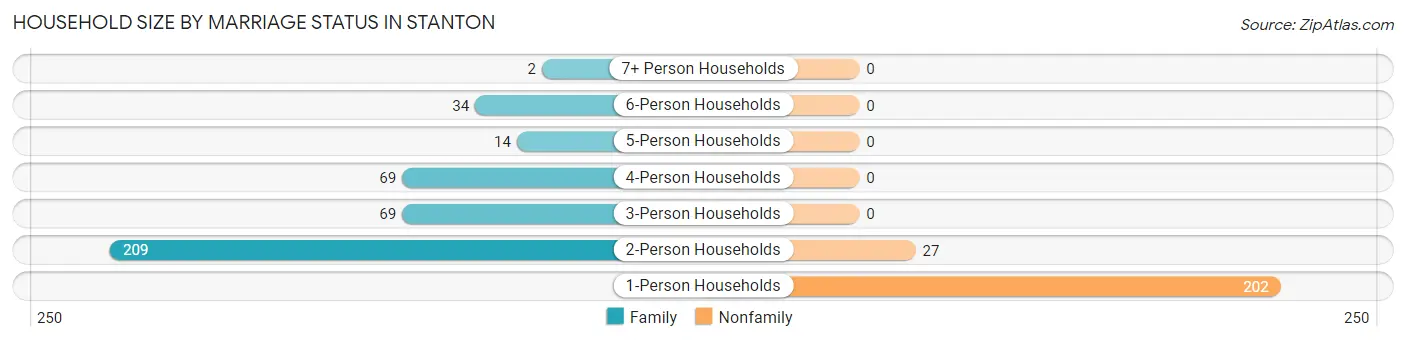
| Household Size | Family Households | Nonfamily Households |
| 1-Person Households | - | 202 (32.3%) |
| 2-Person Households | 209 (33.4%) | 27 (4.3%) |
| 3-Person Households | 69 (11.0%) | 0 (0.0%) |
| 4-Person Households | 69 (11.0%) | 0 (0.0%) |
| 5-Person Households | 14 (2.2%) | 0 (0.0%) |
| 6-Person Households | 34 (5.4%) | 0 (0.0%) |
| 7+ Person Households | 2 (0.3%) | 0 (0.0%) |
| Total | 397 (63.4%) | 229 (36.6%) |
Female Fertility in Stanton
Fertility by Age in Stanton
Average fertility rate in Stanton is 22.0 births per 1,000 women. Women in the age bracket of 20 to 34 years have the highest fertility rate with 54.0 births per 1,000 women. Women in the age bracket of 20 to 34 years acount for 100.0% of all women with births.
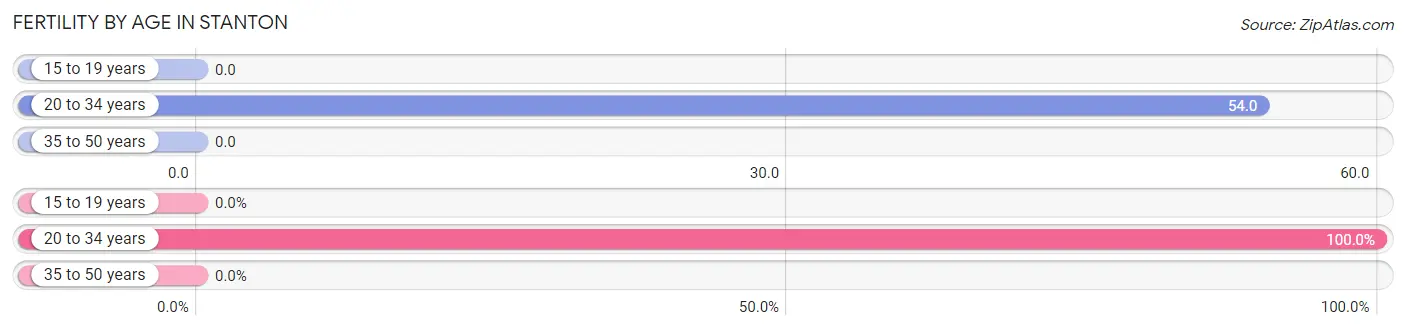
| Age Bracket | Women with Births | Births / 1,000 Women |
| 15 to 19 years | 0 (0.0%) | 0.0 |
| 20 to 34 years | 8 (100.0%) | 54.0 |
| 35 to 50 years | 0 (0.0%) | 0.0 |
| Total | 8 (100.0%) | 22.0 |
Fertility by Age by Marriage Status in Stanton
50.0% of women with births (8) in Stanton are married. The highest percentage of unmarried women with births falls into 20 to 34 years age bracket with 50.0% of them unmarried at the time of birth, while the lowest percentage of unmarried women with births belong to 20 to 34 years age bracket with 50.0% of them unmarried.
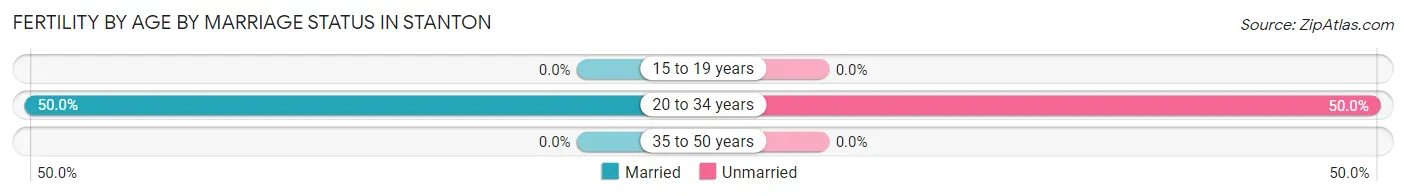
| Age Bracket | Married | Unmarried |
| 15 to 19 years | 0 (0.0%) | 0 (0.0%) |
| 20 to 34 years | 4 (50.0%) | 4 (50.0%) |
| 35 to 50 years | 0 (0.0%) | 0 (0.0%) |
| Total | 4 (50.0%) | 4 (50.0%) |
Fertility by Education in Stanton
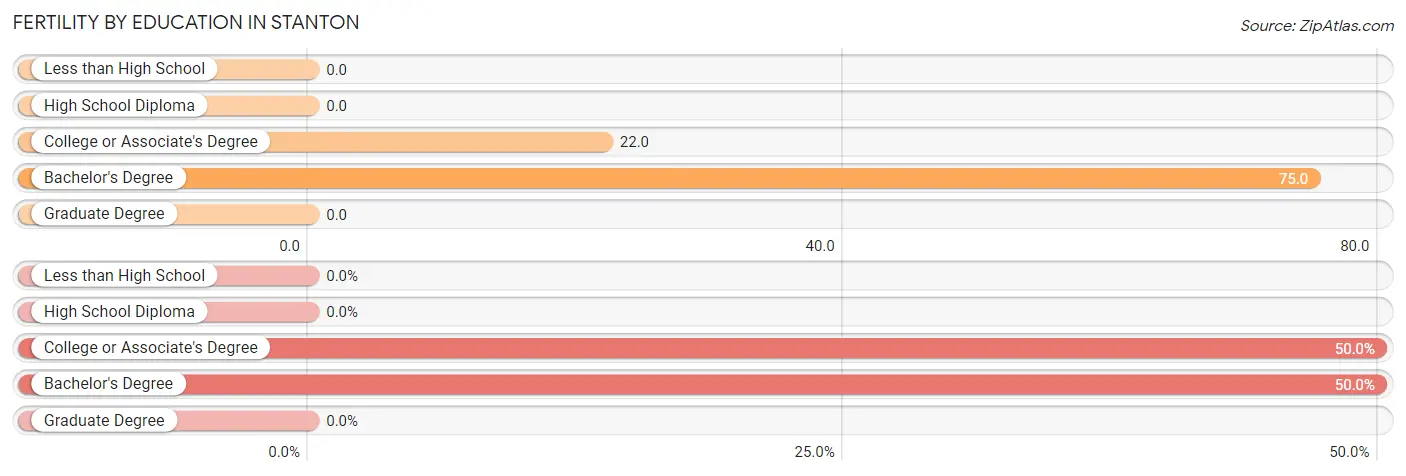
| Educational Attainment | Women with Births | Births / 1,000 Women |
| Less than High School | 0 (0.0%) | 0.0 |
| High School Diploma | 0 (0.0%) | 0.0 |
| College or Associate's Degree | 4 (50.0%) | 22.0 |
| Bachelor's Degree | 4 (50.0%) | 75.0 |
| Graduate Degree | 0 (0.0%) | 0.0 |
| Total | 8 (100.0%) | 22.0 |
Fertility by Education by Marriage Status in Stanton
50.0% of women with births in Stanton are unmarried. Women with the educational attainment of college or associate's degree are most likely to be married with 100.0% of them married at childbirth, while women with the educational attainment of bachelor's degree are least likely to be married with 100.0% of them unmarried at childbirth.
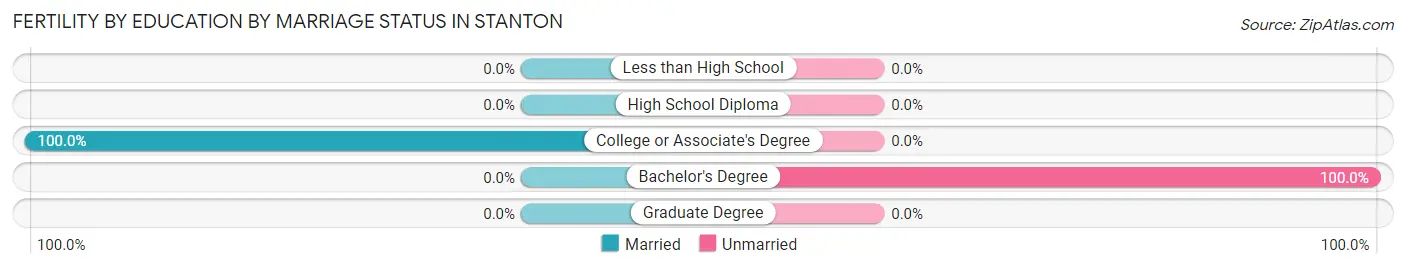
| Educational Attainment | Married | Unmarried |
| Less than High School | 0 (0.0%) | 0 (0.0%) |
| High School Diploma | 0 (0.0%) | 0 (0.0%) |
| College or Associate's Degree | 4 (100.0%) | 0 (0.0%) |
| Bachelor's Degree | 0 (0.0%) | 4 (100.0%) |
| Graduate Degree | 0 (0.0%) | 0 (0.0%) |
| Total | 4 (50.0%) | 4 (50.0%) |
Employment Characteristics in Stanton
Employment by Class of Employer in Stanton
Among the 762 employed individuals in Stanton, private company employees (522 | 68.5%), local government employees (64 | 8.4%), and not-for-profit organizations (60 | 7.9%) make up the most common classes of employment.
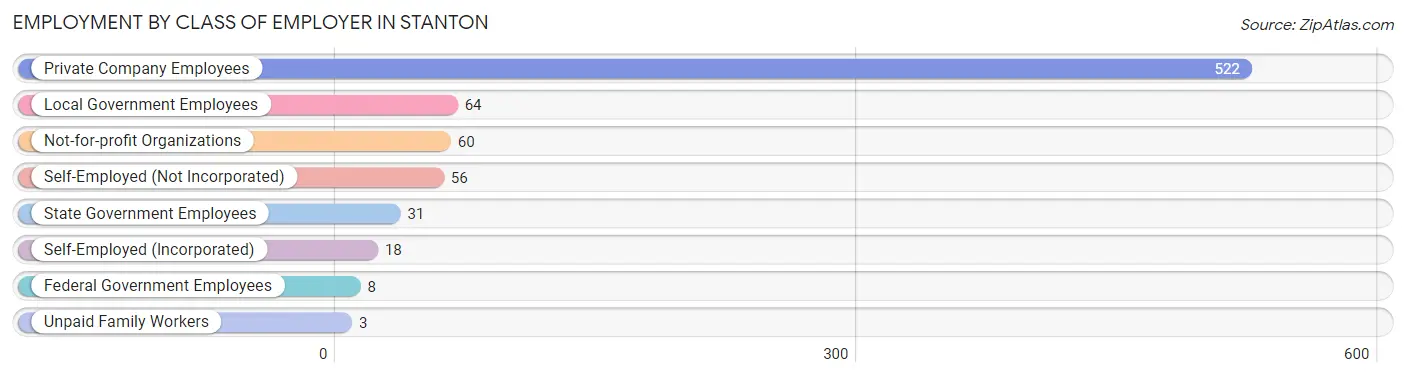
| Employer Class | # Employees | % Employees |
| Private Company Employees | 522 | 68.5% |
| Self-Employed (Incorporated) | 18 | 2.4% |
| Self-Employed (Not Incorporated) | 56 | 7.3% |
| Not-for-profit Organizations | 60 | 7.9% |
| Local Government Employees | 64 | 8.4% |
| State Government Employees | 31 | 4.1% |
| Federal Government Employees | 8 | 1.1% |
| Unpaid Family Workers | 3 | 0.4% |
| Total | 762 | 100.0% |
Employment Status by Age in Stanton
According to the labor force statistics for Stanton, out of the total population over 16 years of age (1,300), 60.2% or 783 individuals are in the labor force, with 1.8% or 14 of them unemployed. The age group with the highest labor force participation rate is 25 to 29 years, with 100.0% or 80 individuals in the labor force. Within the labor force, the 16 to 19 years age range has the highest percentage of unemployed individuals, with 51.9% or 14 of them being unemployed.
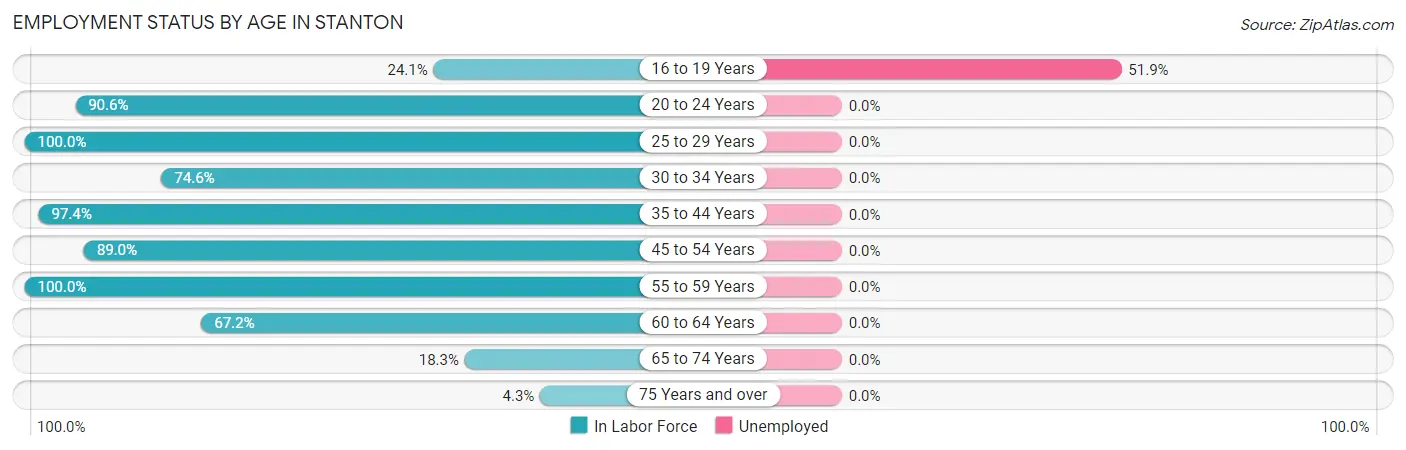
| Age Bracket | In Labor Force | Unemployed |
| 16 to 19 Years | 27 (24.1%) | 14 (51.9%) |
| 20 to 24 Years | 116 (90.6%) | 0 (0.0%) |
| 25 to 29 Years | 80 (100.0%) | 0 (0.0%) |
| 30 to 34 Years | 85 (74.6%) | 0 (0.0%) |
| 35 to 44 Years | 151 (97.4%) | 0 (0.0%) |
| 45 to 54 Years | 146 (89.0%) | 0 (0.0%) |
| 55 to 59 Years | 60 (100.0%) | 0 (0.0%) |
| 60 to 64 Years | 78 (67.2%) | 0 (0.0%) |
| 65 to 74 Years | 30 (18.3%) | 0 (0.0%) |
| 75 Years and over | 9 (4.3%) | 0 (0.0%) |
| Total | 783 (60.2%) | 14 (1.8%) |
Employment Status by Educational Attainment in Stanton
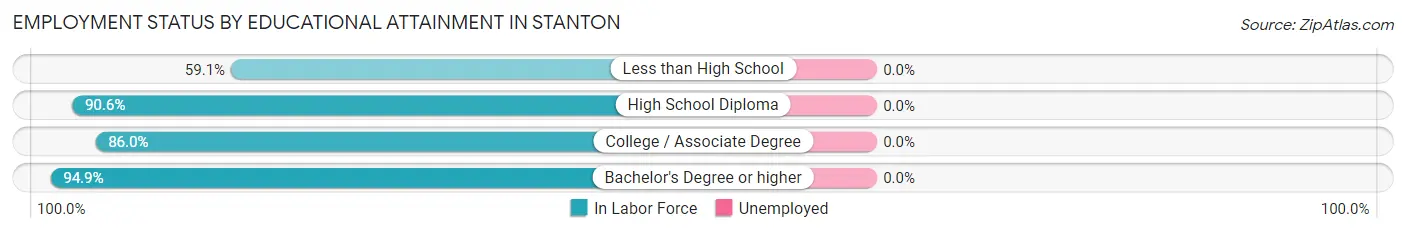
| Educational Attainment | In Labor Force | Unemployed |
| Less than High School | 26 (59.1%) | 0 (0.0%) |
| High School Diploma | 144 (90.6%) | 0 (0.0%) |
| College / Associate Degree | 300 (86.0%) | 0 (0.0%) |
| Bachelor's Degree or higher | 130 (94.9%) | 0 (0.0%) |
| Total | 600 (87.1%) | 0 (0.0%) |
Employment Occupations by Sex in Stanton
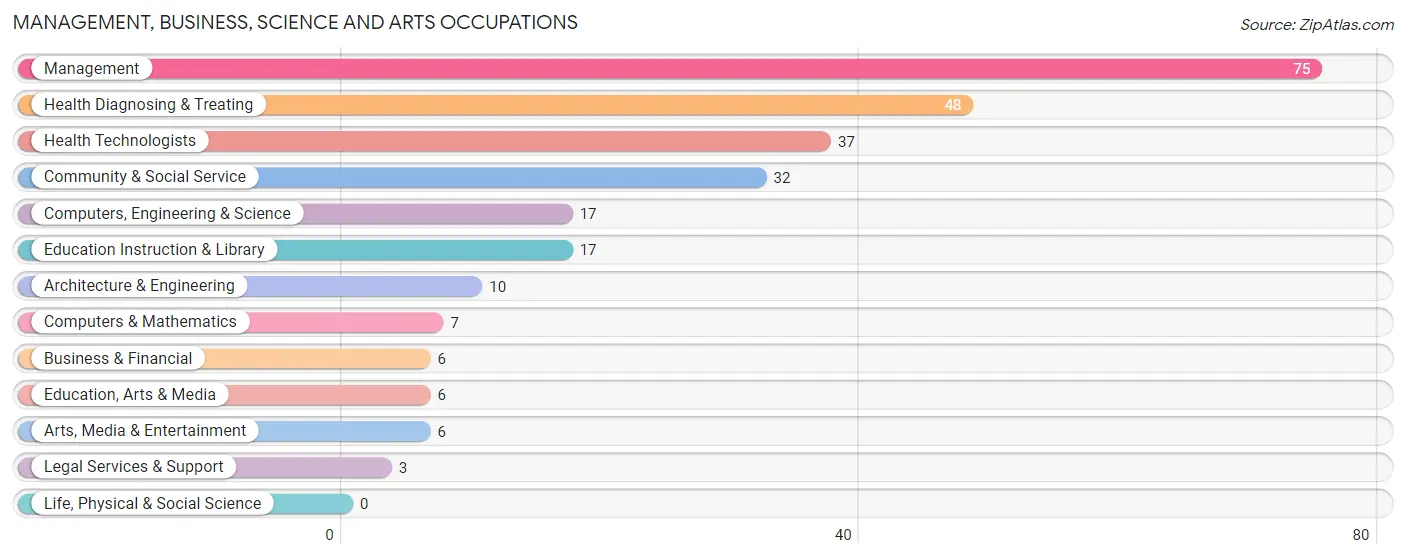
Management, Business, Science and Arts Occupations
The most common Management, Business, Science and Arts occupations in Stanton are Management (75 | 9.8%), Health Diagnosing & Treating (48 | 6.2%), Health Technologists (37 | 4.8%), Community & Social Service (32 | 4.2%), and Computers, Engineering & Science (17 | 2.2%).
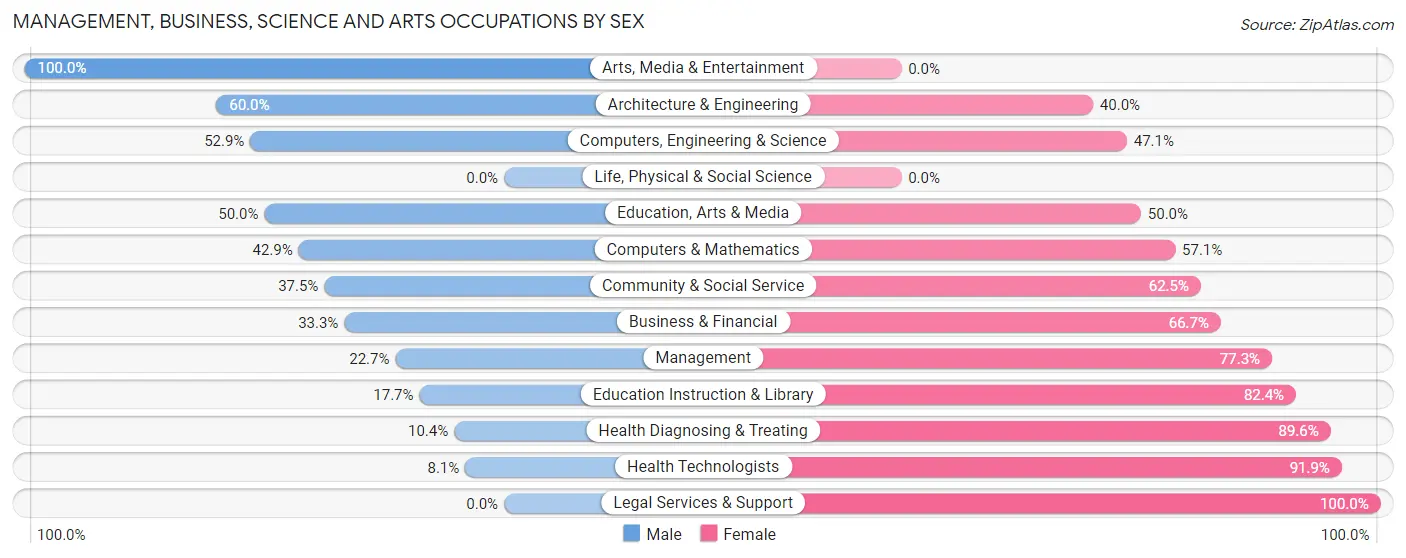
Management, Business, Science and Arts Occupations by Sex
Within the Management, Business, Science and Arts occupations in Stanton, the most male-oriented occupations are Arts, Media & Entertainment (100.0%), Architecture & Engineering (60.0%), and Computers, Engineering & Science (52.9%), while the most female-oriented occupations are Legal Services & Support (100.0%), Health Technologists (91.9%), and Health Diagnosing & Treating (89.6%).
| Occupation | Male | Female |
| Management | 17 (22.7%) | 58 (77.3%) |
| Business & Financial | 2 (33.3%) | 4 (66.7%) |
| Computers, Engineering & Science | 9 (52.9%) | 8 (47.1%) |
| Computers & Mathematics | 3 (42.9%) | 4 (57.1%) |
| Architecture & Engineering | 6 (60.0%) | 4 (40.0%) |
| Life, Physical & Social Science | 0 (0.0%) | 0 (0.0%) |
| Community & Social Service | 12 (37.5%) | 20 (62.5%) |
| Education, Arts & Media | 3 (50.0%) | 3 (50.0%) |
| Legal Services & Support | 0 (0.0%) | 3 (100.0%) |
| Education Instruction & Library | 3 (17.6%) | 14 (82.4%) |
| Arts, Media & Entertainment | 6 (100.0%) | 0 (0.0%) |
| Health Diagnosing & Treating | 5 (10.4%) | 43 (89.6%) |
| Health Technologists | 3 (8.1%) | 34 (91.9%) |
| Total (Category) | 45 (25.3%) | 133 (74.7%) |
| Total (Overall) | 406 (52.9%) | 362 (47.1%) |
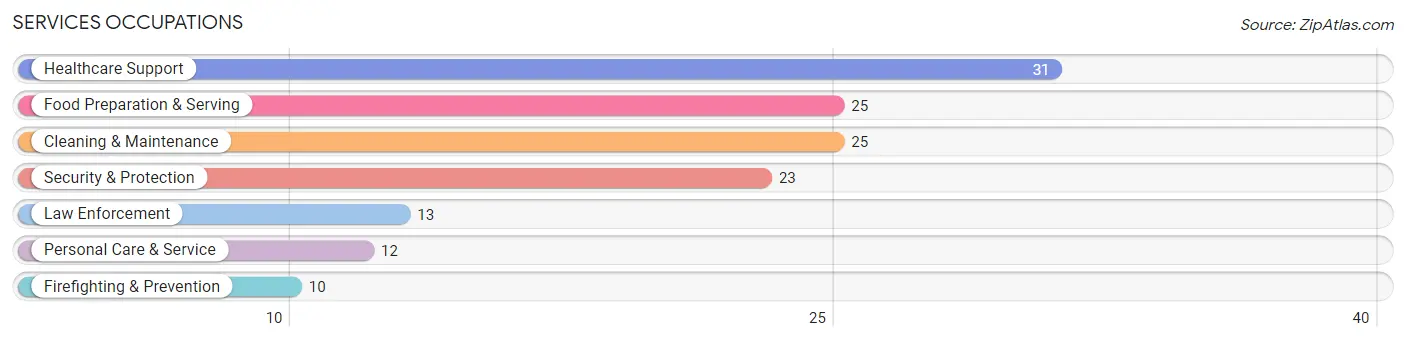
Services Occupations
The most common Services occupations in Stanton are Healthcare Support (31 | 4.0%), Food Preparation & Serving (25 | 3.3%), Cleaning & Maintenance (25 | 3.3%), Security & Protection (23 | 3.0%), and Law Enforcement (13 | 1.7%).
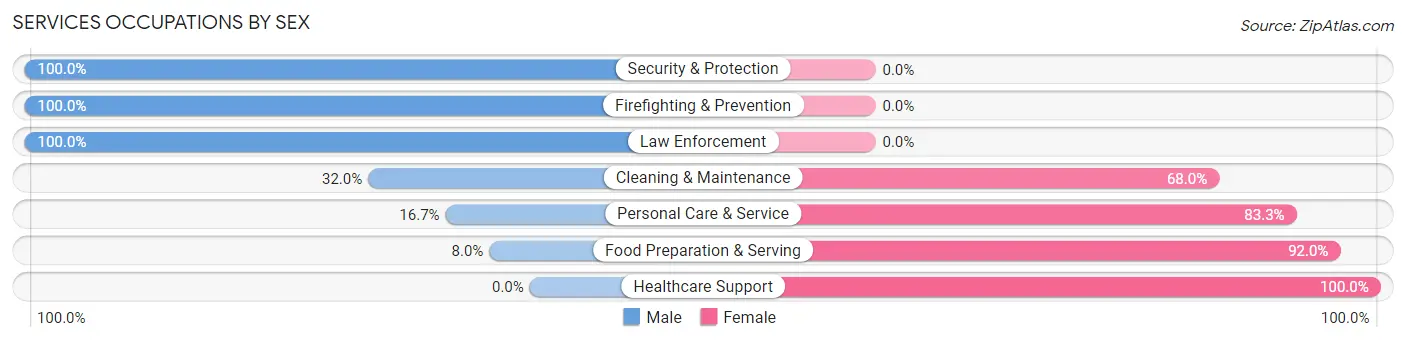
Services Occupations by Sex
Within the Services occupations in Stanton, the most male-oriented occupations are Security & Protection (100.0%), Firefighting & Prevention (100.0%), and Law Enforcement (100.0%), while the most female-oriented occupations are Healthcare Support (100.0%), Food Preparation & Serving (92.0%), and Personal Care & Service (83.3%).
| Occupation | Male | Female |
| Healthcare Support | 0 (0.0%) | 31 (100.0%) |
| Security & Protection | 23 (100.0%) | 0 (0.0%) |
| Firefighting & Prevention | 10 (100.0%) | 0 (0.0%) |
| Law Enforcement | 13 (100.0%) | 0 (0.0%) |
| Food Preparation & Serving | 2 (8.0%) | 23 (92.0%) |
| Cleaning & Maintenance | 8 (32.0%) | 17 (68.0%) |
| Personal Care & Service | 2 (16.7%) | 10 (83.3%) |
| Total (Category) | 35 (30.2%) | 81 (69.8%) |
| Total (Overall) | 406 (52.9%) | 362 (47.1%) |
Sales and Office Occupations
The most common Sales and Office occupations in Stanton are Office & Administration (93 | 12.1%), and Sales & Related (46 | 6.0%).
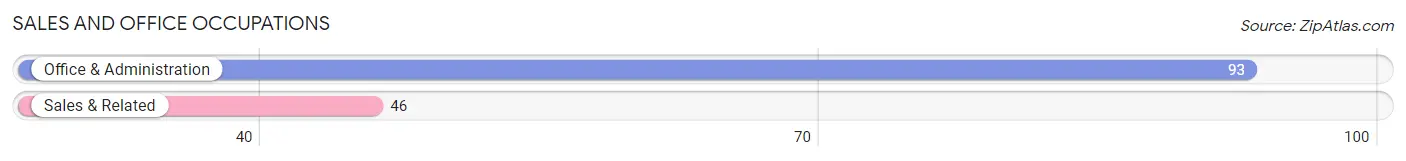
Sales and Office Occupations by Sex
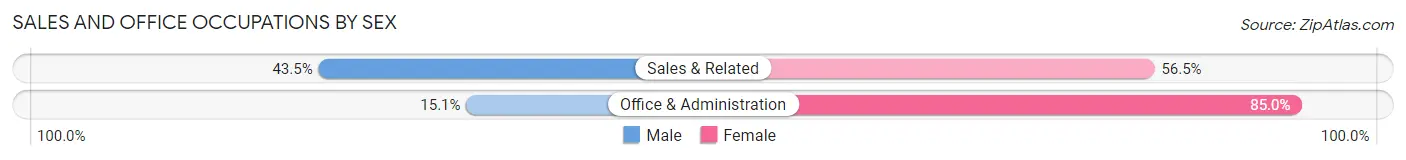
| Occupation | Male | Female |
| Sales & Related | 20 (43.5%) | 26 (56.5%) |
| Office & Administration | 14 (15.0%) | 79 (85.0%) |
| Total (Category) | 34 (24.5%) | 105 (75.5%) |
| Total (Overall) | 406 (52.9%) | 362 (47.1%) |
Natural Resources, Construction and Maintenance Occupations
The most common Natural Resources, Construction and Maintenance occupations in Stanton are Installation, Maintenance & Repair (95 | 12.4%), Construction & Extraction (41 | 5.3%), and Farming, Fishing & Forestry (6 | 0.8%).
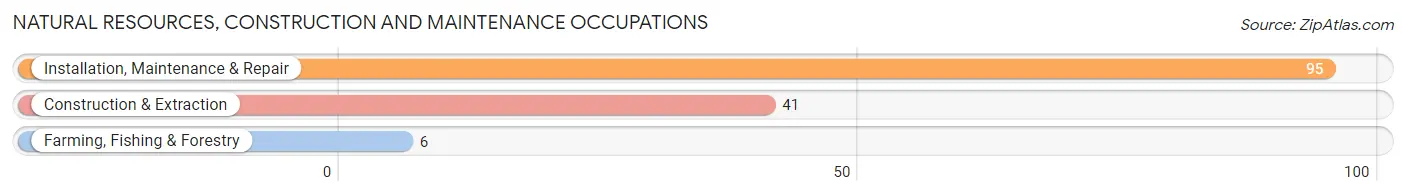
Natural Resources, Construction and Maintenance Occupations by Sex
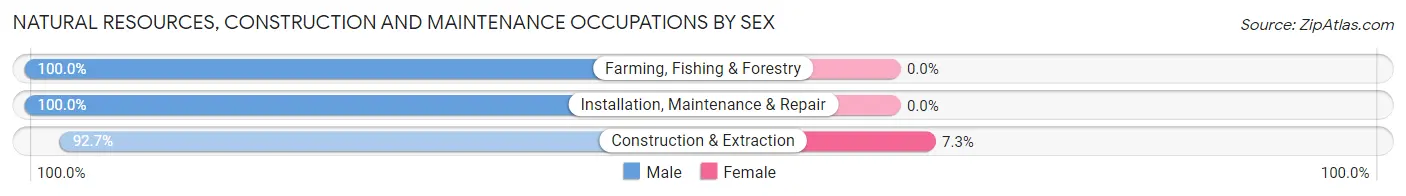
| Occupation | Male | Female |
| Farming, Fishing & Forestry | 6 (100.0%) | 0 (0.0%) |
| Construction & Extraction | 38 (92.7%) | 3 (7.3%) |
| Installation, Maintenance & Repair | 95 (100.0%) | 0 (0.0%) |
| Total (Category) | 139 (97.9%) | 3 (2.1%) |
| Total (Overall) | 406 (52.9%) | 362 (47.1%) |
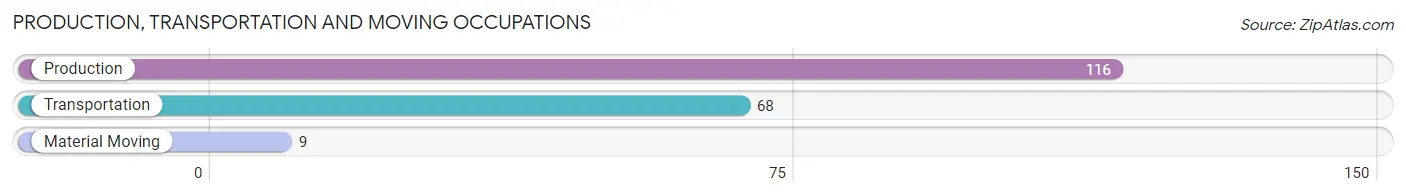
Production, Transportation and Moving Occupations
The most common Production, Transportation and Moving occupations in Stanton are Production (116 | 15.1%), Transportation (68 | 8.8%), and Material Moving (9 | 1.2%).
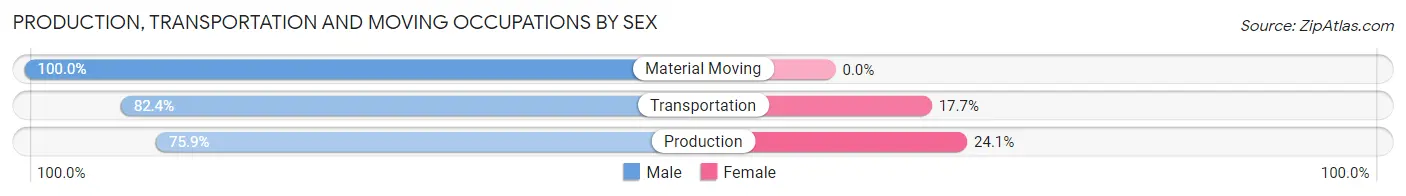
Production, Transportation and Moving Occupations by Sex
| Occupation | Male | Female |
| Production | 88 (75.9%) | 28 (24.1%) |
| Transportation | 56 (82.4%) | 12 (17.6%) |
| Material Moving | 9 (100.0%) | 0 (0.0%) |
| Total (Category) | 153 (79.3%) | 40 (20.7%) |
| Total (Overall) | 406 (52.9%) | 362 (47.1%) |
Employment Industries by Sex in Stanton
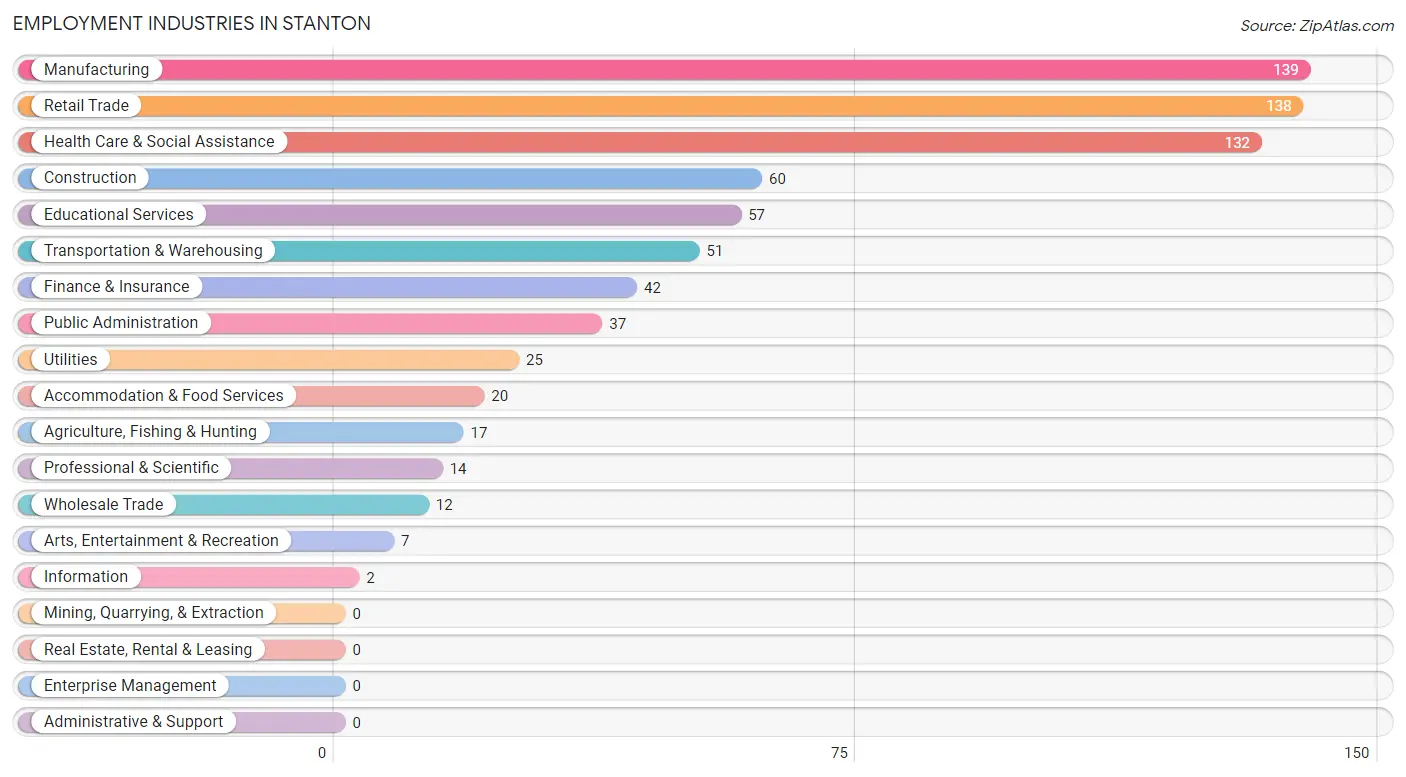
Employment Industries in Stanton
The major employment industries in Stanton include Manufacturing (139 | 18.1%), Retail Trade (138 | 18.0%), Health Care & Social Assistance (132 | 17.2%), Construction (60 | 7.8%), and Educational Services (57 | 7.4%).
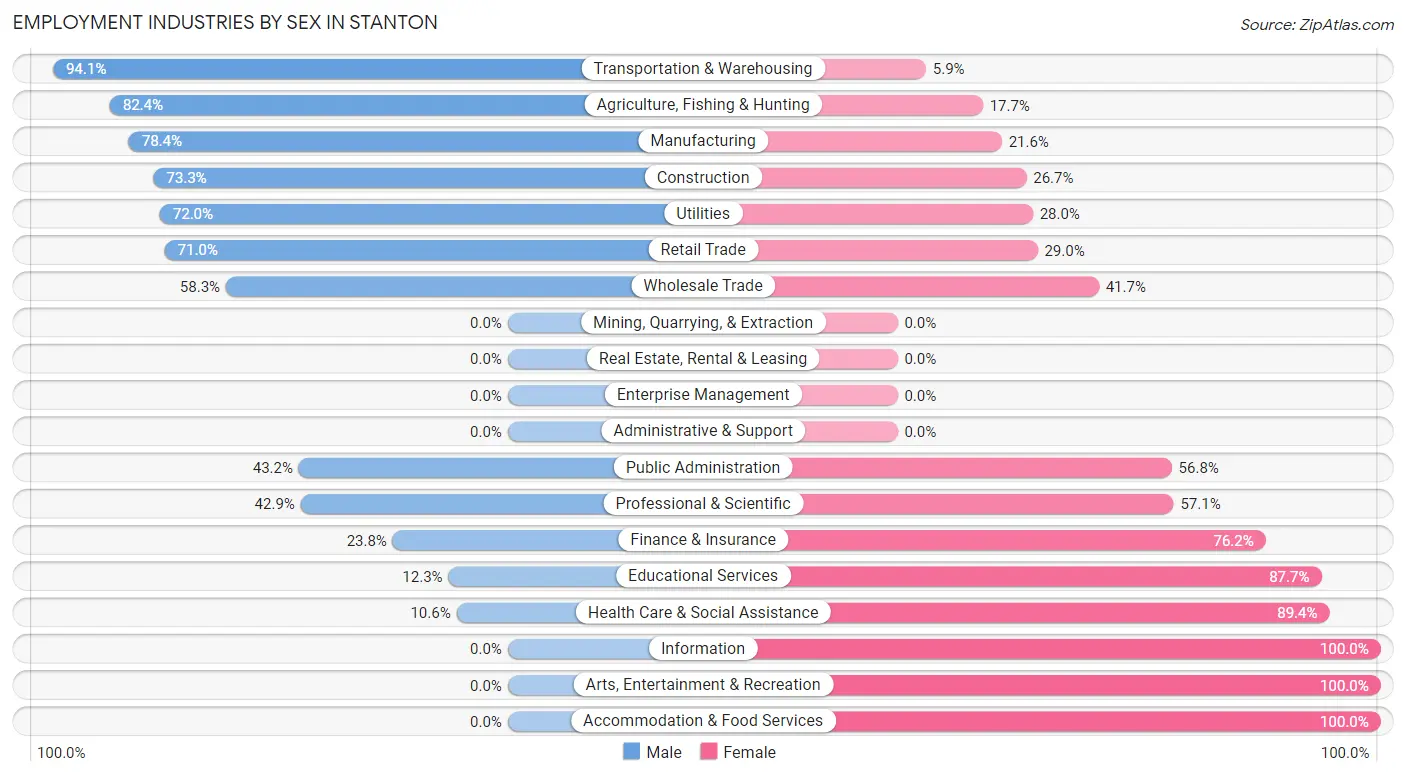
Employment Industries by Sex in Stanton
The Stanton industries that see more men than women are Transportation & Warehousing (94.1%), Agriculture, Fishing & Hunting (82.4%), and Manufacturing (78.4%), whereas the industries that tend to have a higher number of women are Information (100.0%), Arts, Entertainment & Recreation (100.0%), and Accommodation & Food Services (100.0%).
| Industry | Male | Female |
| Agriculture, Fishing & Hunting | 14 (82.4%) | 3 (17.6%) |
| Mining, Quarrying, & Extraction | 0 (0.0%) | 0 (0.0%) |
| Construction | 44 (73.3%) | 16 (26.7%) |
| Manufacturing | 109 (78.4%) | 30 (21.6%) |
| Wholesale Trade | 7 (58.3%) | 5 (41.7%) |
| Retail Trade | 98 (71.0%) | 40 (29.0%) |
| Transportation & Warehousing | 48 (94.1%) | 3 (5.9%) |
| Utilities | 18 (72.0%) | 7 (28.0%) |
| Information | 0 (0.0%) | 2 (100.0%) |
| Finance & Insurance | 10 (23.8%) | 32 (76.2%) |
| Real Estate, Rental & Leasing | 0 (0.0%) | 0 (0.0%) |
| Professional & Scientific | 6 (42.9%) | 8 (57.1%) |
| Enterprise Management | 0 (0.0%) | 0 (0.0%) |
| Administrative & Support | 0 (0.0%) | 0 (0.0%) |
| Educational Services | 7 (12.3%) | 50 (87.7%) |
| Health Care & Social Assistance | 14 (10.6%) | 118 (89.4%) |
| Arts, Entertainment & Recreation | 0 (0.0%) | 7 (100.0%) |
| Accommodation & Food Services | 0 (0.0%) | 20 (100.0%) |
| Public Administration | 16 (43.2%) | 21 (56.8%) |
| Total | 406 (52.9%) | 362 (47.1%) |
Education in Stanton
School Enrollment in Stanton
The most common levels of schooling among the 405 students in Stanton are middle school (123 | 30.4%), high school (102 | 25.2%), and elementary school (68 | 16.8%).
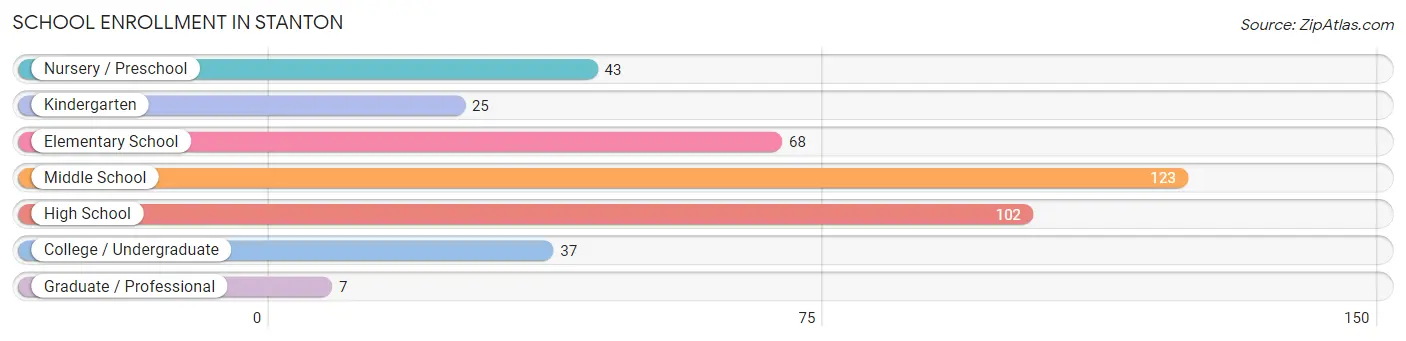
| School Level | # Students | % Students |
| Nursery / Preschool | 43 | 10.6% |
| Kindergarten | 25 | 6.2% |
| Elementary School | 68 | 16.8% |
| Middle School | 123 | 30.4% |
| High School | 102 | 25.2% |
| College / Undergraduate | 37 | 9.1% |
| Graduate / Professional | 7 | 1.7% |
| Total | 405 | 100.0% |
School Enrollment by Age by Funding Source in Stanton
Out of a total of 405 students who are enrolled in schools in Stanton, 18 (4.4%) attend a private institution, while the remaining 387 (95.6%) are enrolled in public schools. The age group of 3 to 4 year olds has the highest likelihood of being enrolled in private schools, with 3 (23.1% in the age bracket) enrolled. Conversely, the age group of 10 to 14 year olds has the lowest likelihood of being enrolled in a private school, with 160 (100.0% in the age bracket) attending a public institution.
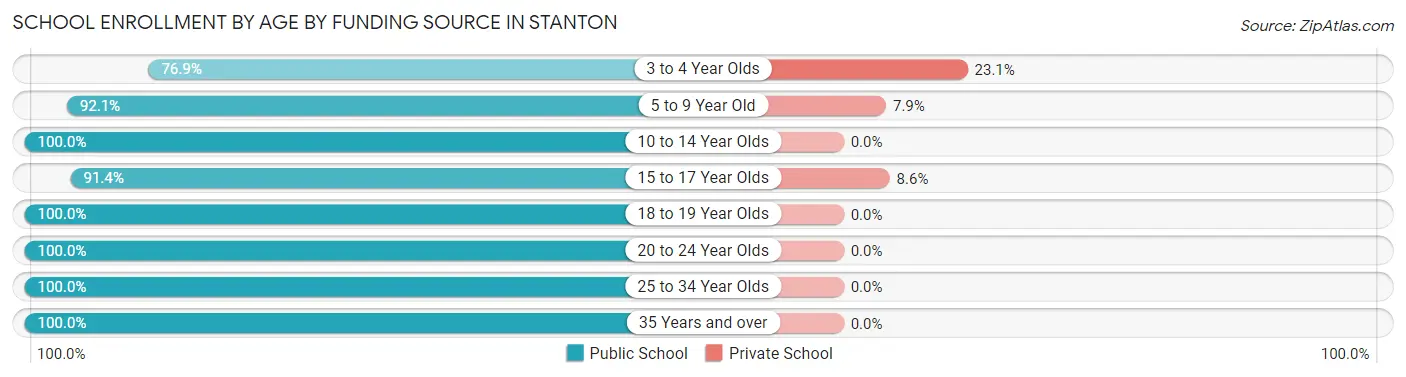
| Age Bracket | Public School | Private School |
| 3 to 4 Year Olds | 10 (76.9%) | 3 (23.1%) |
| 5 to 9 Year Old | 105 (92.1%) | 9 (7.9%) |
| 10 to 14 Year Olds | 160 (100.0%) | 0 (0.0%) |
| 15 to 17 Year Olds | 64 (91.4%) | 6 (8.6%) |
| 18 to 19 Year Olds | 29 (100.0%) | 0 (0.0%) |
| 20 to 24 Year Olds | 6 (100.0%) | 0 (0.0%) |
| 25 to 34 Year Olds | 5 (100.0%) | 0 (0.0%) |
| 35 Years and over | 8 (100.0%) | 0 (0.0%) |
| Total | 387 (95.6%) | 18 (4.4%) |
Educational Attainment by Field of Study in Stanton
Education (32 | 16.6%), social sciences (26 | 13.5%), science & technology (26 | 13.5%), business (26 | 13.5%), and liberal arts & history (20 | 10.4%) are the most common fields of study among 193 individuals in Stanton who have obtained a bachelor's degree or higher.
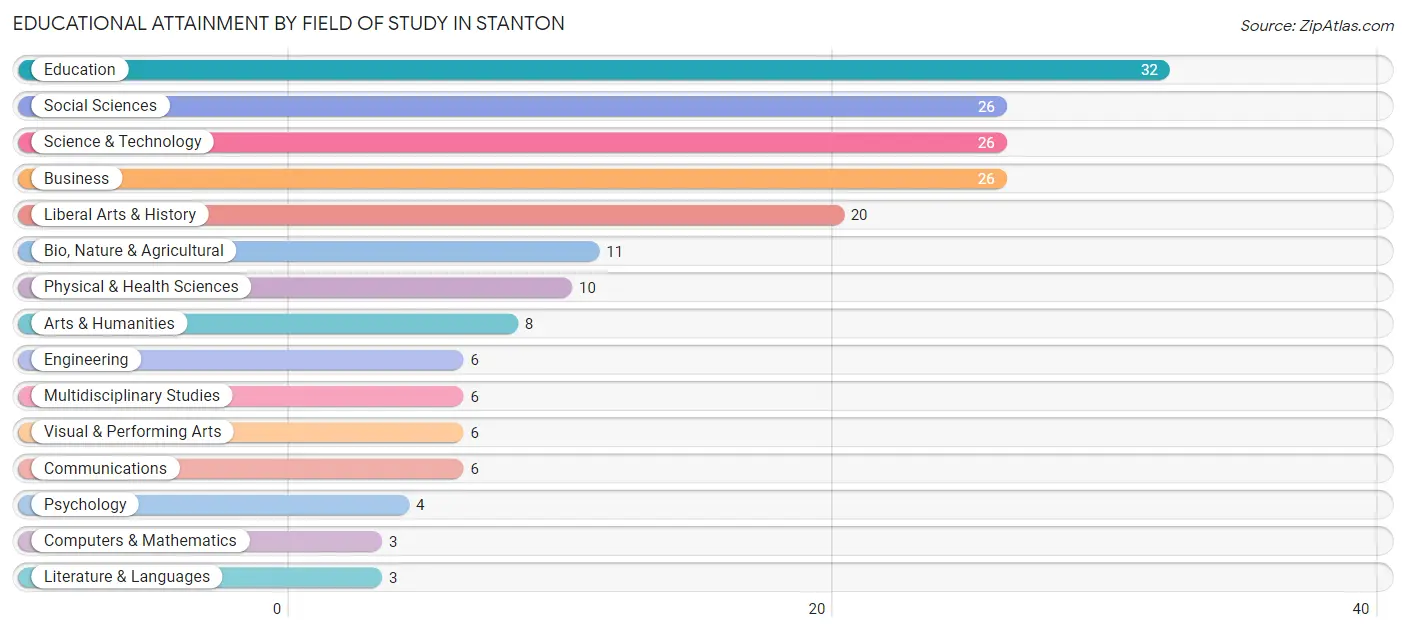
| Field of Study | # Graduates | % Graduates |
| Computers & Mathematics | 3 | 1.5% |
| Bio, Nature & Agricultural | 11 | 5.7% |
| Physical & Health Sciences | 10 | 5.2% |
| Psychology | 4 | 2.1% |
| Social Sciences | 26 | 13.5% |
| Engineering | 6 | 3.1% |
| Multidisciplinary Studies | 6 | 3.1% |
| Science & Technology | 26 | 13.5% |
| Business | 26 | 13.5% |
| Education | 32 | 16.6% |
| Literature & Languages | 3 | 1.5% |
| Liberal Arts & History | 20 | 10.4% |
| Visual & Performing Arts | 6 | 3.1% |
| Communications | 6 | 3.1% |
| Arts & Humanities | 8 | 4.2% |
| Total | 193 | 100.0% |
Transportation & Commute in Stanton
Vehicle Availability by Sex in Stanton
The most prevalent vehicle ownership categories in Stanton are males with 2 vehicles (108, accounting for 27.0%) and females with 2 vehicles (102, making up 29.8%).
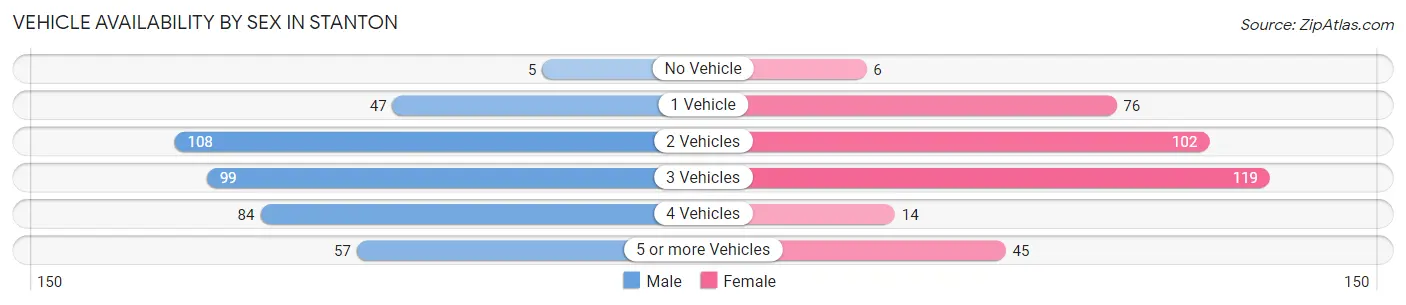
| Vehicles Available | Male | Female |
| No Vehicle | 5 (1.3%) | 6 (1.7%) |
| 1 Vehicle | 47 (11.7%) | 76 (21.0%) |
| 2 Vehicles | 108 (27.0%) | 102 (28.2%) |
| 3 Vehicles | 99 (24.7%) | 119 (32.9%) |
| 4 Vehicles | 84 (21.0%) | 14 (3.9%) |
| 5 or more Vehicles | 57 (14.2%) | 45 (12.4%) |
| Total | 400 (100.0%) | 362 (100.0%) |
Commute Time in Stanton
The most frequently occuring commute durations in Stanton are 30 to 34 minutes (142 commuters, 19.7%), 20 to 24 minutes (132 commuters, 18.3%), and 15 to 19 minutes (119 commuters, 16.5%).
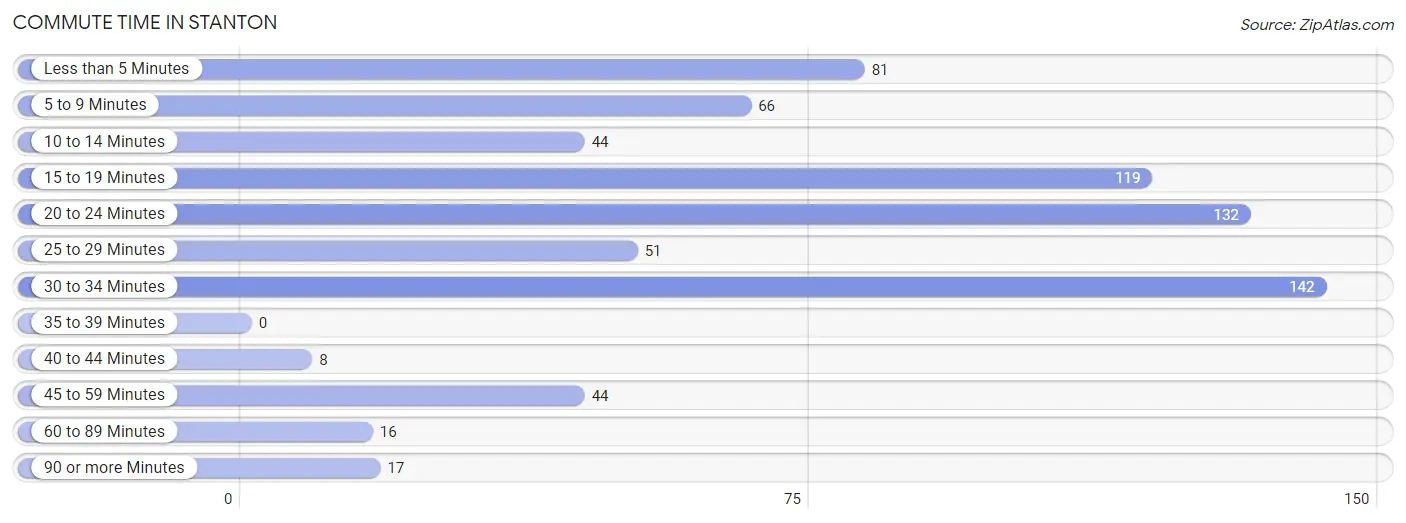
| Commute Time | # Commuters | % Commuters |
| Less than 5 Minutes | 81 | 11.3% |
| 5 to 9 Minutes | 66 | 9.2% |
| 10 to 14 Minutes | 44 | 6.1% |
| 15 to 19 Minutes | 119 | 16.5% |
| 20 to 24 Minutes | 132 | 18.3% |
| 25 to 29 Minutes | 51 | 7.1% |
| 30 to 34 Minutes | 142 | 19.7% |
| 35 to 39 Minutes | 0 | 0.0% |
| 40 to 44 Minutes | 8 | 1.1% |
| 45 to 59 Minutes | 44 | 6.1% |
| 60 to 89 Minutes | 16 | 2.2% |
| 90 or more Minutes | 17 | 2.4% |
Commute Time by Sex in Stanton
The most common commute times in Stanton are 30 to 34 minutes (126 commuters, 33.0%) for males and 20 to 24 minutes (66 commuters, 19.5%) for females.
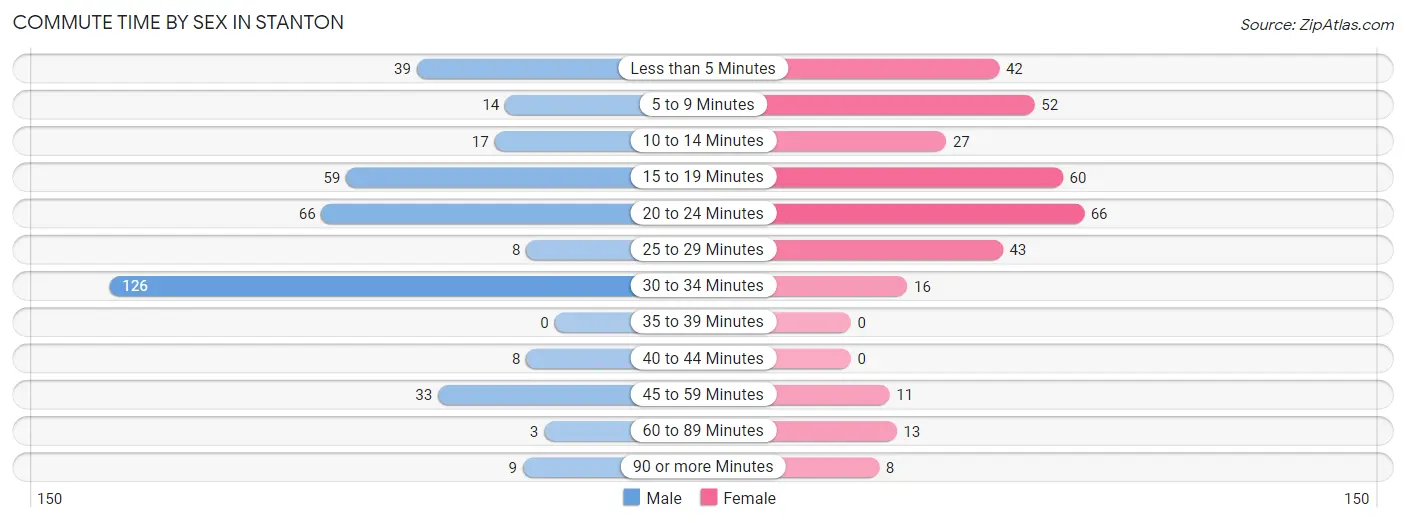
| Commute Time | Male | Female |
| Less than 5 Minutes | 39 (10.2%) | 42 (12.4%) |
| 5 to 9 Minutes | 14 (3.7%) | 52 (15.4%) |
| 10 to 14 Minutes | 17 (4.4%) | 27 (8.0%) |
| 15 to 19 Minutes | 59 (15.4%) | 60 (17.7%) |
| 20 to 24 Minutes | 66 (17.3%) | 66 (19.5%) |
| 25 to 29 Minutes | 8 (2.1%) | 43 (12.7%) |
| 30 to 34 Minutes | 126 (33.0%) | 16 (4.7%) |
| 35 to 39 Minutes | 0 (0.0%) | 0 (0.0%) |
| 40 to 44 Minutes | 8 (2.1%) | 0 (0.0%) |
| 45 to 59 Minutes | 33 (8.6%) | 11 (3.3%) |
| 60 to 89 Minutes | 3 (0.8%) | 13 (3.8%) |
| 90 or more Minutes | 9 (2.4%) | 8 (2.4%) |
Time of Departure to Work by Sex in Stanton
The most frequent times of departure to work in Stanton are 7:30 AM to 7:59 AM (87, 22.8%) for males and 7:30 AM to 7:59 AM (66, 19.5%) for females.
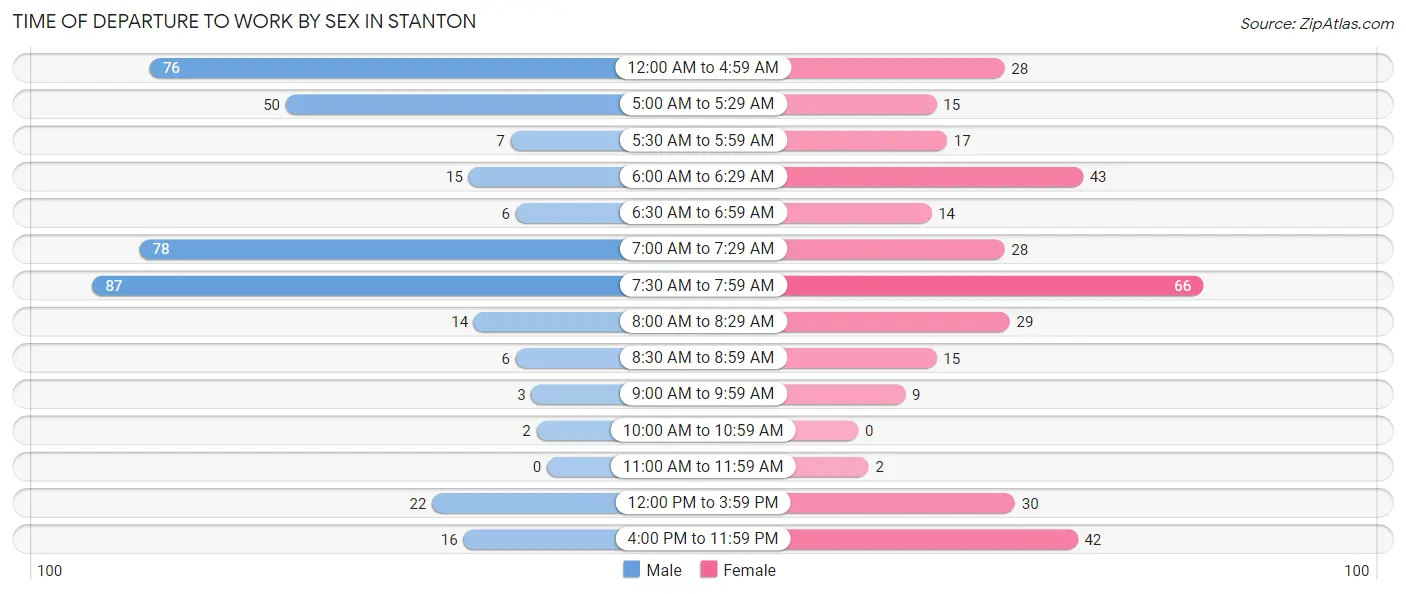
| Time of Departure | Male | Female |
| 12:00 AM to 4:59 AM | 76 (19.9%) | 28 (8.3%) |
| 5:00 AM to 5:29 AM | 50 (13.1%) | 15 (4.4%) |
| 5:30 AM to 5:59 AM | 7 (1.8%) | 17 (5.0%) |
| 6:00 AM to 6:29 AM | 15 (3.9%) | 43 (12.7%) |
| 6:30 AM to 6:59 AM | 6 (1.6%) | 14 (4.1%) |
| 7:00 AM to 7:29 AM | 78 (20.4%) | 28 (8.3%) |
| 7:30 AM to 7:59 AM | 87 (22.8%) | 66 (19.5%) |
| 8:00 AM to 8:29 AM | 14 (3.7%) | 29 (8.6%) |
| 8:30 AM to 8:59 AM | 6 (1.6%) | 15 (4.4%) |
| 9:00 AM to 9:59 AM | 3 (0.8%) | 9 (2.7%) |
| 10:00 AM to 10:59 AM | 2 (0.5%) | 0 (0.0%) |
| 11:00 AM to 11:59 AM | 0 (0.0%) | 2 (0.6%) |
| 12:00 PM to 3:59 PM | 22 (5.8%) | 30 (8.9%) |
| 4:00 PM to 11:59 PM | 16 (4.2%) | 42 (12.4%) |
| Total | 382 (100.0%) | 338 (100.0%) |
Housing Occupancy in Stanton
Occupancy by Ownership in Stanton
Of the total 626 dwellings in Stanton, owner-occupied units account for 424 (67.7%), while renter-occupied units make up 202 (32.3%).
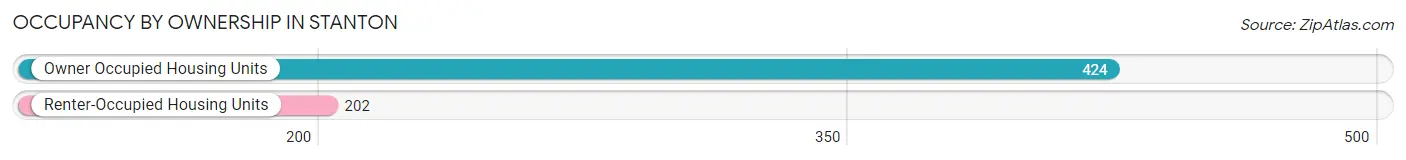
| Occupancy | # Housing Units | % Housing Units |
| Owner Occupied Housing Units | 424 | 67.7% |
| Renter-Occupied Housing Units | 202 | 32.3% |
| Total Occupied Housing Units | 626 | 100.0% |
Occupancy by Household Size in Stanton
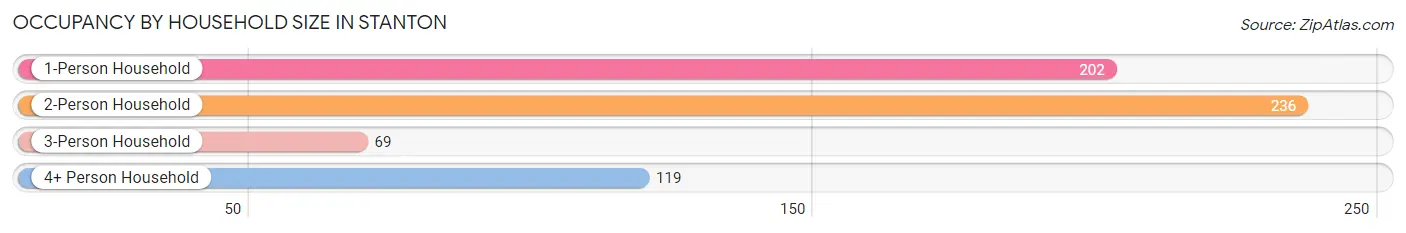
| Household Size | # Housing Units | % Housing Units |
| 1-Person Household | 202 | 32.3% |
| 2-Person Household | 236 | 37.7% |
| 3-Person Household | 69 | 11.0% |
| 4+ Person Household | 119 | 19.0% |
| Total Housing Units | 626 | 100.0% |
Occupancy by Ownership by Household Size in Stanton
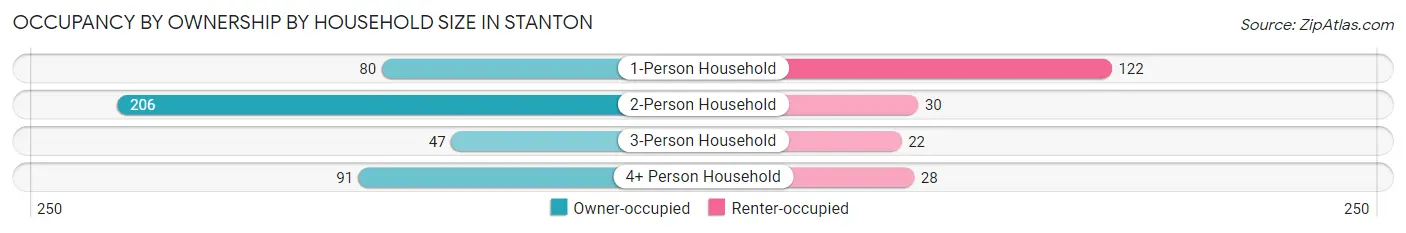
| Household Size | Owner-occupied | Renter-occupied |
| 1-Person Household | 80 (39.6%) | 122 (60.4%) |
| 2-Person Household | 206 (87.3%) | 30 (12.7%) |
| 3-Person Household | 47 (68.1%) | 22 (31.9%) |
| 4+ Person Household | 91 (76.5%) | 28 (23.5%) |
| Total Housing Units | 424 (67.7%) | 202 (32.3%) |
Occupancy by Educational Attainment in Stanton
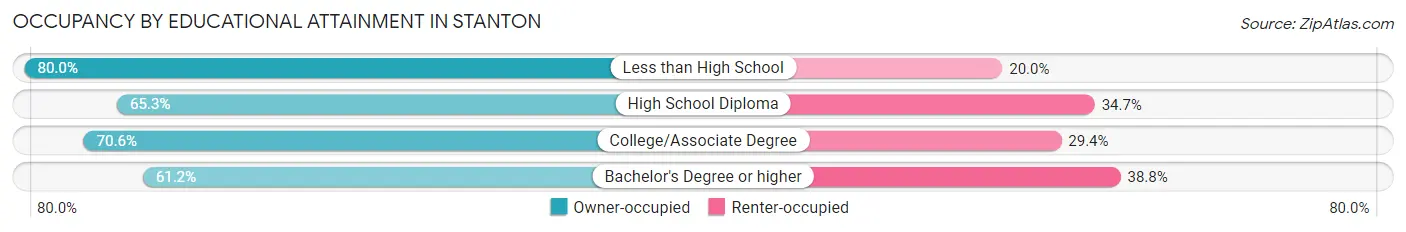
| Household Size | Owner-occupied | Renter-occupied |
| Less than High School | 28 (80.0%) | 7 (20.0%) |
| High School Diploma | 115 (65.3%) | 61 (34.7%) |
| College/Associate Degree | 202 (70.6%) | 84 (29.4%) |
| Bachelor's Degree or higher | 79 (61.2%) | 50 (38.8%) |
Occupancy by Age of Householder in Stanton
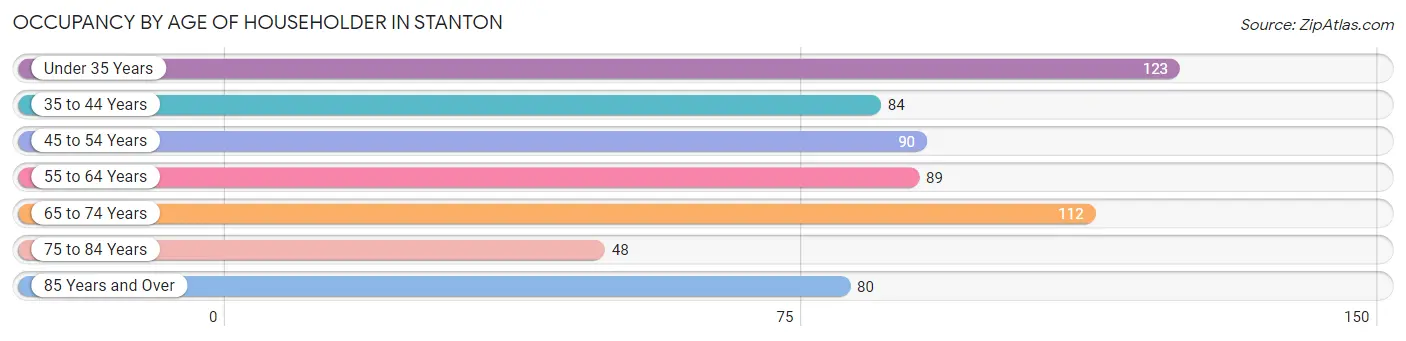
| Age Bracket | # Households | % Households |
| Under 35 Years | 123 | 19.7% |
| 35 to 44 Years | 84 | 13.4% |
| 45 to 54 Years | 90 | 14.4% |
| 55 to 64 Years | 89 | 14.2% |
| 65 to 74 Years | 112 | 17.9% |
| 75 to 84 Years | 48 | 7.7% |
| 85 Years and Over | 80 | 12.8% |
| Total | 626 | 100.0% |
Housing Finances in Stanton
Median Income by Occupancy in Stanton
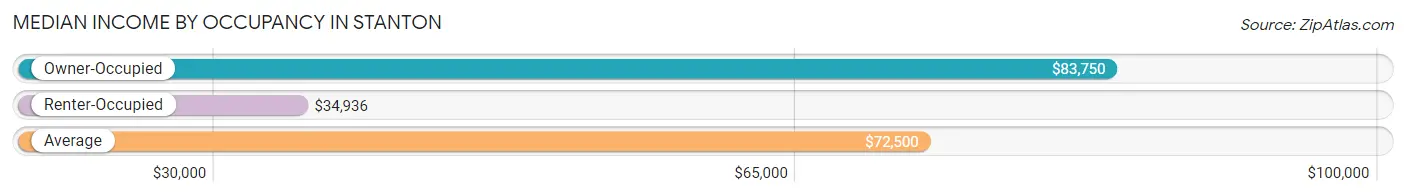
| Occupancy Type | # Households | Median Income |
| Owner-Occupied | 424 (67.7%) | $83,750 |
| Renter-Occupied | 202 (32.3%) | $34,936 |
| Average | 626 (100.0%) | $72,500 |
Occupancy by Householder Income Bracket in Stanton
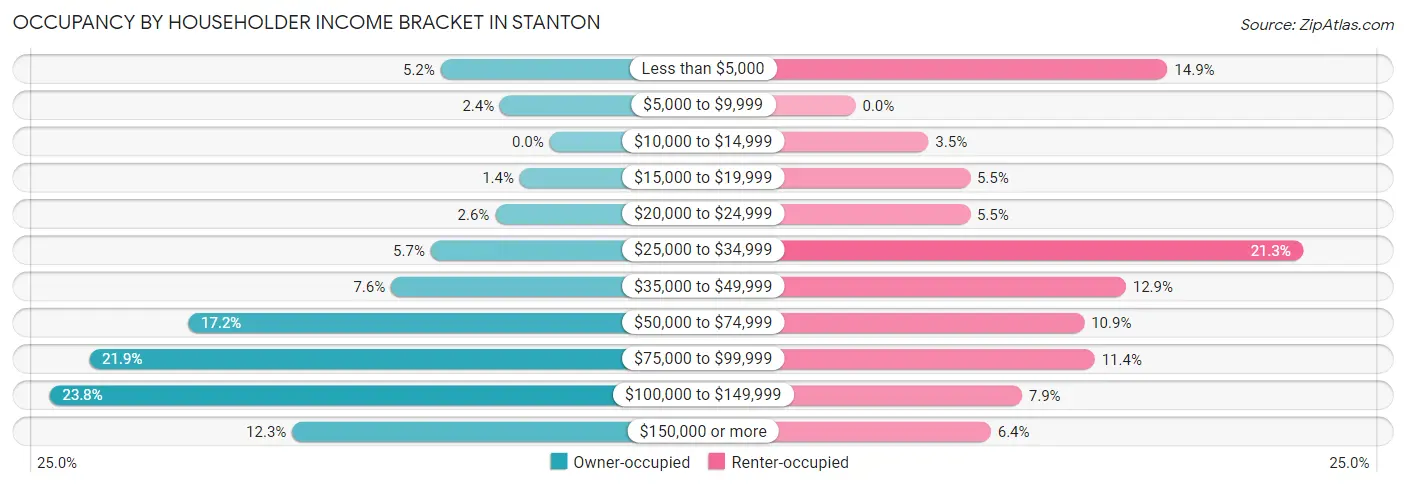
| Income Bracket | Owner-occupied | Renter-occupied |
| Less than $5,000 | 22 (5.2%) | 30 (14.8%) |
| $5,000 to $9,999 | 10 (2.4%) | 0 (0.0%) |
| $10,000 to $14,999 | 0 (0.0%) | 7 (3.5%) |
| $15,000 to $19,999 | 6 (1.4%) | 11 (5.4%) |
| $20,000 to $24,999 | 11 (2.6%) | 11 (5.4%) |
| $25,000 to $34,999 | 24 (5.7%) | 43 (21.3%) |
| $35,000 to $49,999 | 32 (7.5%) | 26 (12.9%) |
| $50,000 to $74,999 | 73 (17.2%) | 22 (10.9%) |
| $75,000 to $99,999 | 93 (21.9%) | 23 (11.4%) |
| $100,000 to $149,999 | 101 (23.8%) | 16 (7.9%) |
| $150,000 or more | 52 (12.3%) | 13 (6.4%) |
| Total | 424 (100.0%) | 202 (100.0%) |
Monthly Housing Cost Tiers in Stanton
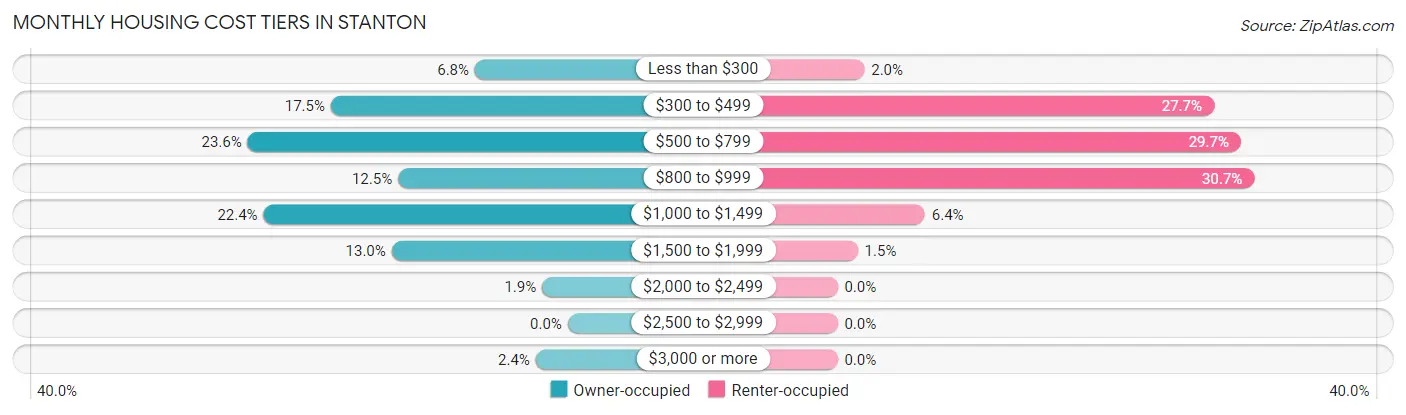
| Monthly Cost | Owner-occupied | Renter-occupied |
| Less than $300 | 29 (6.8%) | 4 (2.0%) |
| $300 to $499 | 74 (17.4%) | 56 (27.7%) |
| $500 to $799 | 100 (23.6%) | 60 (29.7%) |
| $800 to $999 | 53 (12.5%) | 62 (30.7%) |
| $1,000 to $1,499 | 95 (22.4%) | 13 (6.4%) |
| $1,500 to $1,999 | 55 (13.0%) | 3 (1.5%) |
| $2,000 to $2,499 | 8 (1.9%) | 0 (0.0%) |
| $2,500 to $2,999 | 0 (0.0%) | 0 (0.0%) |
| $3,000 or more | 10 (2.4%) | 0 (0.0%) |
| Total | 424 (100.0%) | 202 (100.0%) |
Physical Housing Characteristics in Stanton
Housing Structures in Stanton
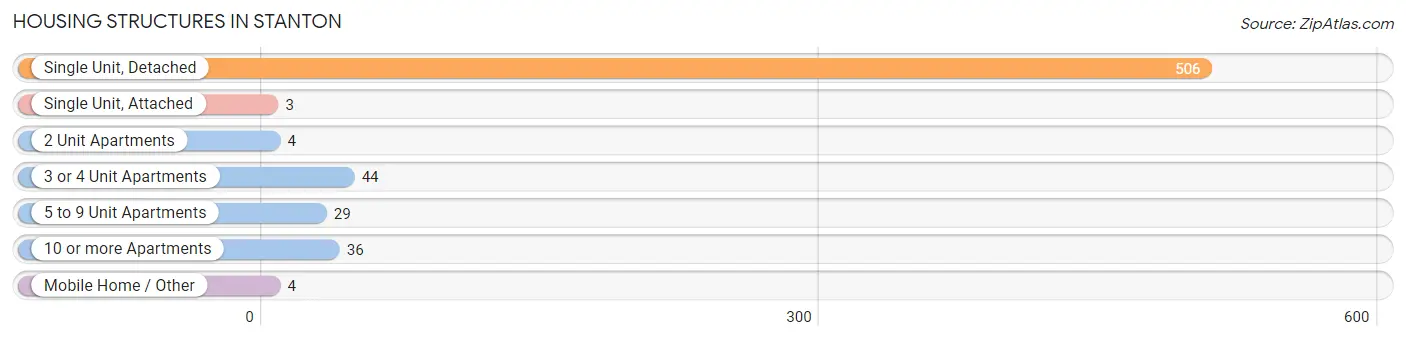
| Structure Type | # Housing Units | % Housing Units |
| Single Unit, Detached | 506 | 80.8% |
| Single Unit, Attached | 3 | 0.5% |
| 2 Unit Apartments | 4 | 0.6% |
| 3 or 4 Unit Apartments | 44 | 7.0% |
| 5 to 9 Unit Apartments | 29 | 4.6% |
| 10 or more Apartments | 36 | 5.8% |
| Mobile Home / Other | 4 | 0.6% |
| Total | 626 | 100.0% |
Housing Structures by Occupancy in Stanton
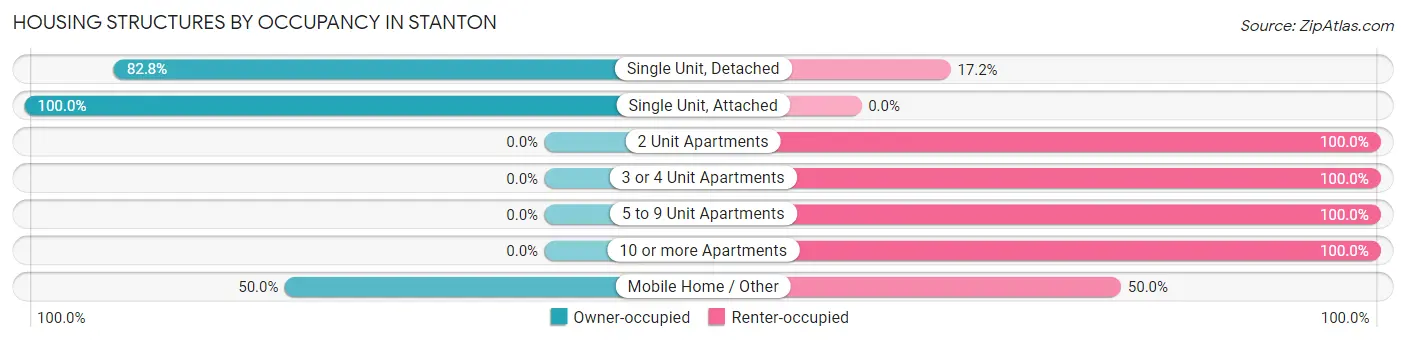
| Structure Type | Owner-occupied | Renter-occupied |
| Single Unit, Detached | 419 (82.8%) | 87 (17.2%) |
| Single Unit, Attached | 3 (100.0%) | 0 (0.0%) |
| 2 Unit Apartments | 0 (0.0%) | 4 (100.0%) |
| 3 or 4 Unit Apartments | 0 (0.0%) | 44 (100.0%) |
| 5 to 9 Unit Apartments | 0 (0.0%) | 29 (100.0%) |
| 10 or more Apartments | 0 (0.0%) | 36 (100.0%) |
| Mobile Home / Other | 2 (50.0%) | 2 (50.0%) |
| Total | 424 (67.7%) | 202 (32.3%) |
Housing Structures by Number of Rooms in Stanton
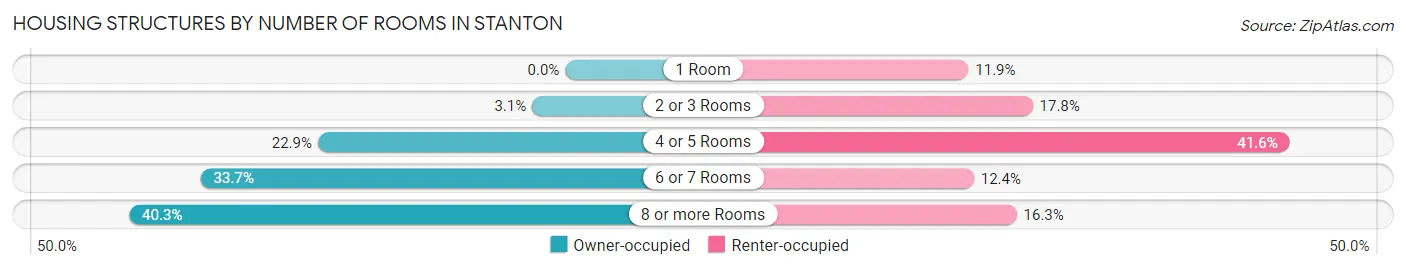
| Number of Rooms | Owner-occupied | Renter-occupied |
| 1 Room | 0 (0.0%) | 24 (11.9%) |
| 2 or 3 Rooms | 13 (3.1%) | 36 (17.8%) |
| 4 or 5 Rooms | 97 (22.9%) | 84 (41.6%) |
| 6 or 7 Rooms | 143 (33.7%) | 25 (12.4%) |
| 8 or more Rooms | 171 (40.3%) | 33 (16.3%) |
| Total | 424 (100.0%) | 202 (100.0%) |
Housing Structure by Heating Type in Stanton
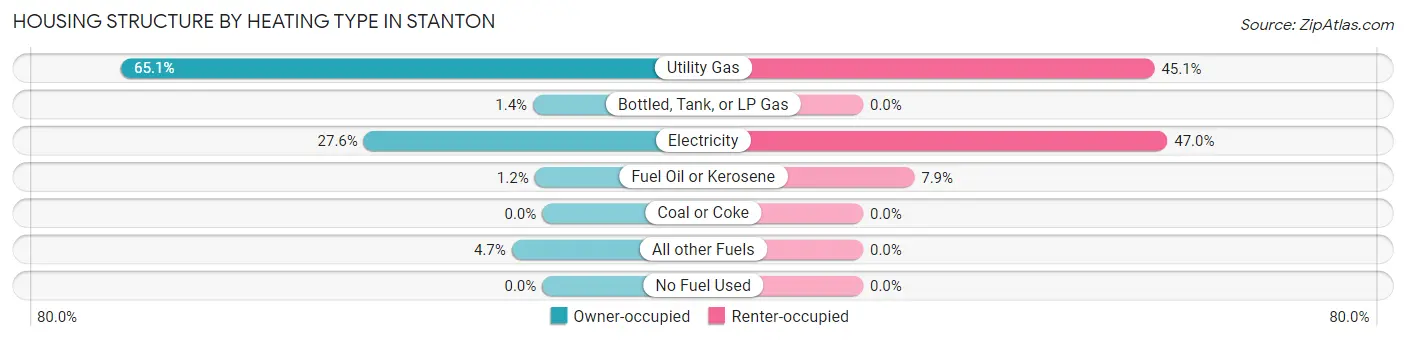
| Heating Type | Owner-occupied | Renter-occupied |
| Utility Gas | 276 (65.1%) | 91 (45.1%) |
| Bottled, Tank, or LP Gas | 6 (1.4%) | 0 (0.0%) |
| Electricity | 117 (27.6%) | 95 (47.0%) |
| Fuel Oil or Kerosene | 5 (1.2%) | 16 (7.9%) |
| Coal or Coke | 0 (0.0%) | 0 (0.0%) |
| All other Fuels | 20 (4.7%) | 0 (0.0%) |
| No Fuel Used | 0 (0.0%) | 0 (0.0%) |
| Total | 424 (100.0%) | 202 (100.0%) |
Household Vehicle Usage in Stanton
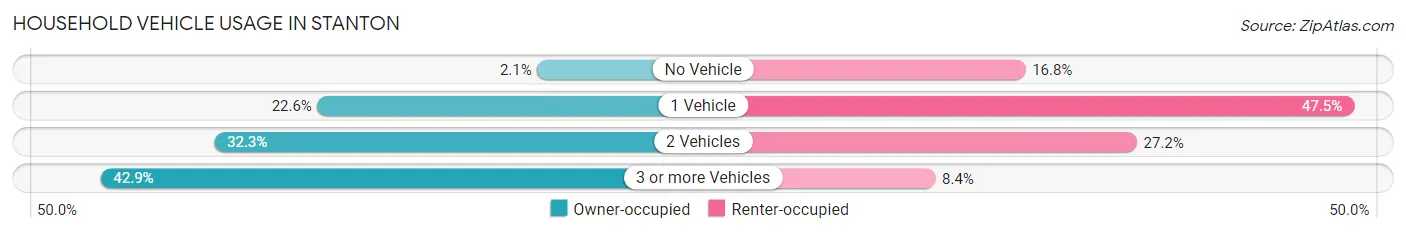
| Vehicles per Household | Owner-occupied | Renter-occupied |
| No Vehicle | 9 (2.1%) | 34 (16.8%) |
| 1 Vehicle | 96 (22.6%) | 96 (47.5%) |
| 2 Vehicles | 137 (32.3%) | 55 (27.2%) |
| 3 or more Vehicles | 182 (42.9%) | 17 (8.4%) |
| Total | 424 (100.0%) | 202 (100.0%) |
Real Estate & Mortgages in Stanton
Real Estate and Mortgage Overview in Stanton
| Characteristic | Without Mortgage | With Mortgage |
| Housing Units | 199 | 225 |
| Median Property Value | $172,800 | $148,300 |
| Median Household Income | $54,779 | $42 |
| Monthly Housing Costs | $515 | $10 |
| Real Estate Taxes | $1,472 | $0 |
Property Value by Mortgage Status in Stanton
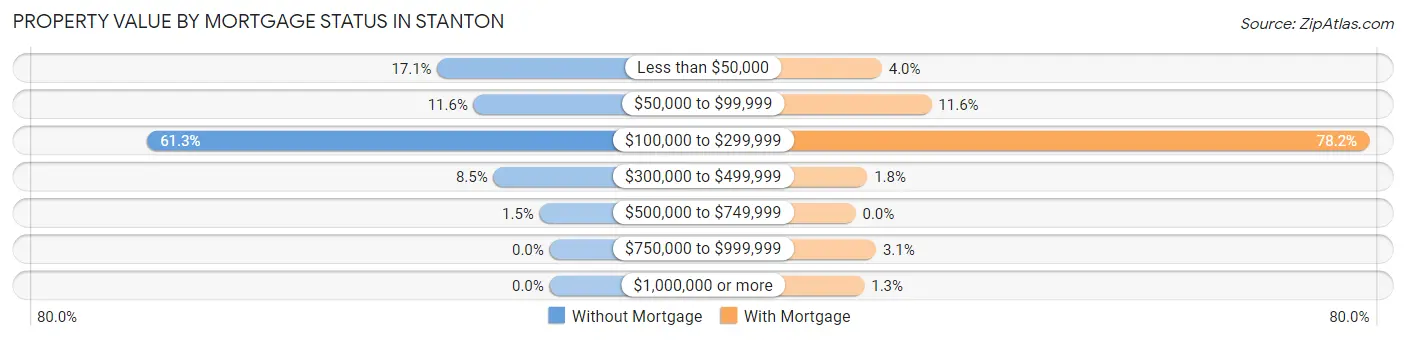
| Property Value | Without Mortgage | With Mortgage |
| Less than $50,000 | 34 (17.1%) | 9 (4.0%) |
| $50,000 to $99,999 | 23 (11.6%) | 26 (11.6%) |
| $100,000 to $299,999 | 122 (61.3%) | 176 (78.2%) |
| $300,000 to $499,999 | 17 (8.5%) | 4 (1.8%) |
| $500,000 to $749,999 | 3 (1.5%) | 0 (0.0%) |
| $750,000 to $999,999 | 0 (0.0%) | 7 (3.1%) |
| $1,000,000 or more | 0 (0.0%) | 3 (1.3%) |
| Total | 199 (100.0%) | 225 (100.0%) |
Household Income by Mortgage Status in Stanton
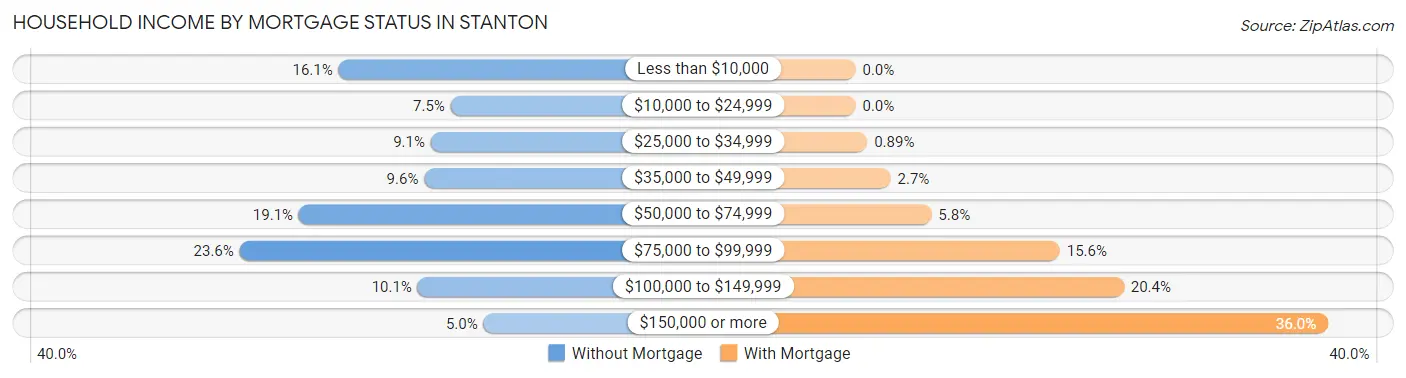
| Household Income | Without Mortgage | With Mortgage |
| Less than $10,000 | 32 (16.1%) | 0 (0.0%) |
| $10,000 to $24,999 | 15 (7.5%) | 0 (0.0%) |
| $25,000 to $34,999 | 18 (9.0%) | 2 (0.9%) |
| $35,000 to $49,999 | 19 (9.6%) | 6 (2.7%) |
| $50,000 to $74,999 | 38 (19.1%) | 13 (5.8%) |
| $75,000 to $99,999 | 47 (23.6%) | 35 (15.6%) |
| $100,000 to $149,999 | 20 (10.1%) | 46 (20.4%) |
| $150,000 or more | 10 (5.0%) | 81 (36.0%) |
| Total | 199 (100.0%) | 225 (100.0%) |
Property Value to Household Income Ratio in Stanton
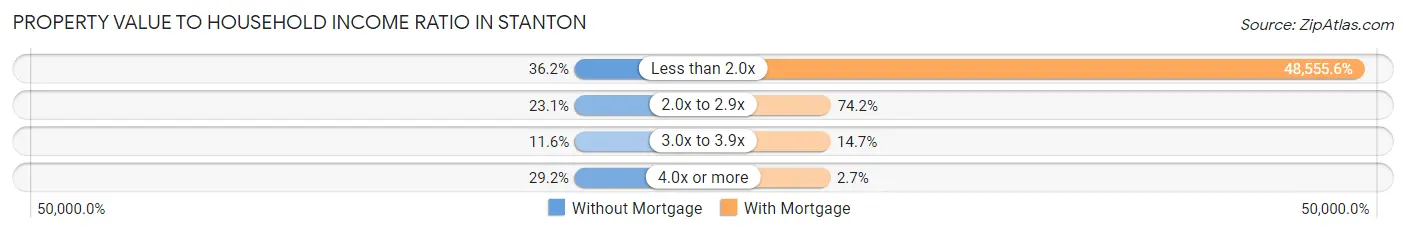
| Value-to-Income Ratio | Without Mortgage | With Mortgage |
| Less than 2.0x | 72 (36.2%) | 109,250 (48,555.6%) |
| 2.0x to 2.9x | 46 (23.1%) | 167 (74.2%) |
| 3.0x to 3.9x | 23 (11.6%) | 33 (14.7%) |
| 4.0x or more | 58 (29.1%) | 6 (2.7%) |
| Total | 199 (100.0%) | 225 (100.0%) |
Real Estate Taxes by Mortgage Status in Stanton
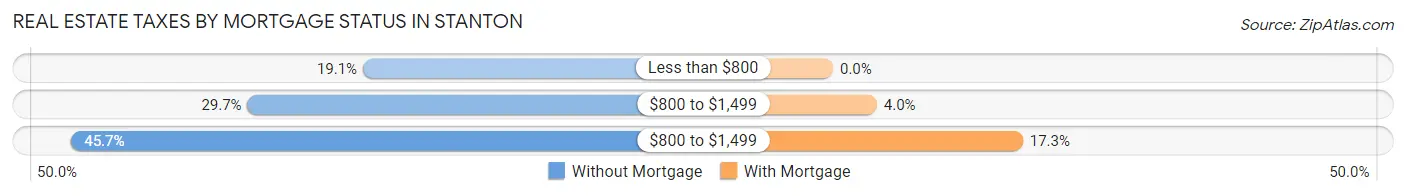
| Property Taxes | Without Mortgage | With Mortgage |
| Less than $800 | 38 (19.1%) | 0 (0.0%) |
| $800 to $1,499 | 59 (29.6%) | 9 (4.0%) |
| $800 to $1,499 | 91 (45.7%) | 39 (17.3%) |
| Total | 199 (100.0%) | 225 (100.0%) |
Health & Disability in Stanton
Health Insurance Coverage by Age in Stanton
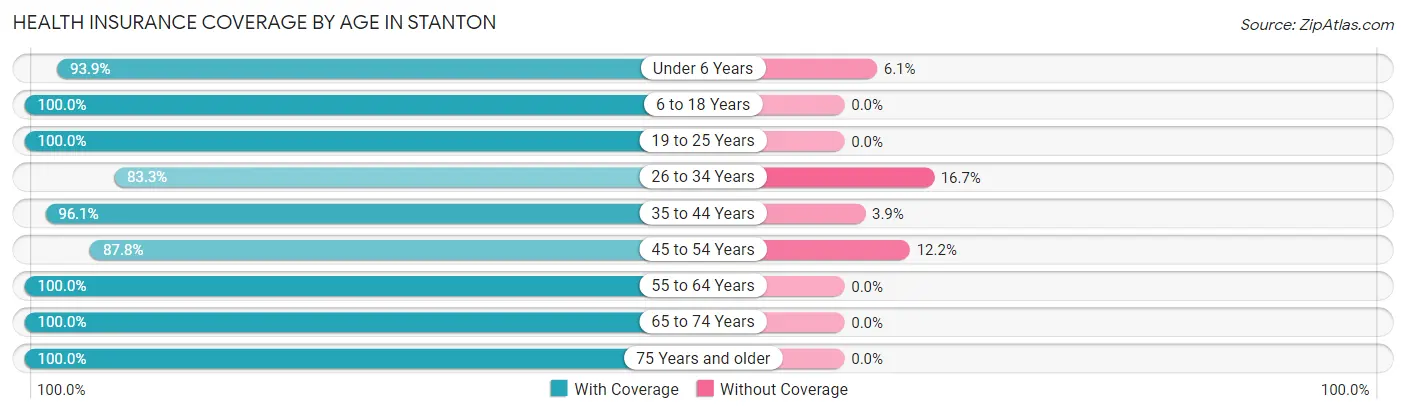
| Age Bracket | With Coverage | Without Coverage |
| Under 6 Years | 62 (93.9%) | 4 (6.1%) |
| 6 to 18 Years | 389 (100.0%) | 0 (0.0%) |
| 19 to 25 Years | 172 (100.0%) | 0 (0.0%) |
| 26 to 34 Years | 150 (83.3%) | 30 (16.7%) |
| 35 to 44 Years | 149 (96.1%) | 6 (3.9%) |
| 45 to 54 Years | 144 (87.8%) | 20 (12.2%) |
| 55 to 64 Years | 163 (100.0%) | 0 (0.0%) |
| 65 to 74 Years | 160 (100.0%) | 0 (0.0%) |
| 75 Years and older | 164 (100.0%) | 0 (0.0%) |
| Total | 1,553 (96.3%) | 60 (3.7%) |
Health Insurance Coverage by Citizenship Status in Stanton
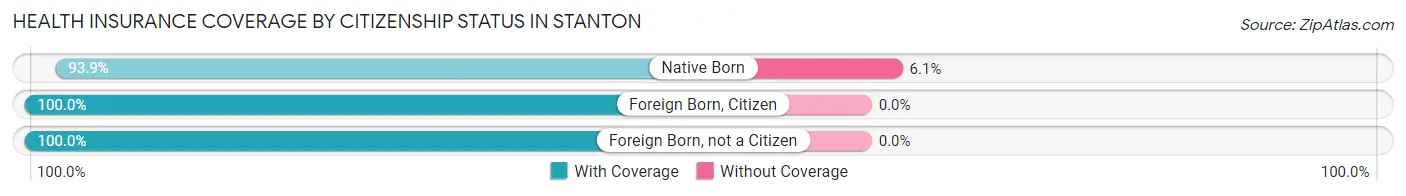
| Citizenship Status | With Coverage | Without Coverage |
| Native Born | 62 (93.9%) | 4 (6.1%) |
| Foreign Born, Citizen | 389 (100.0%) | 0 (0.0%) |
| Foreign Born, not a Citizen | 172 (100.0%) | 0 (0.0%) |
Health Insurance Coverage by Household Income in Stanton
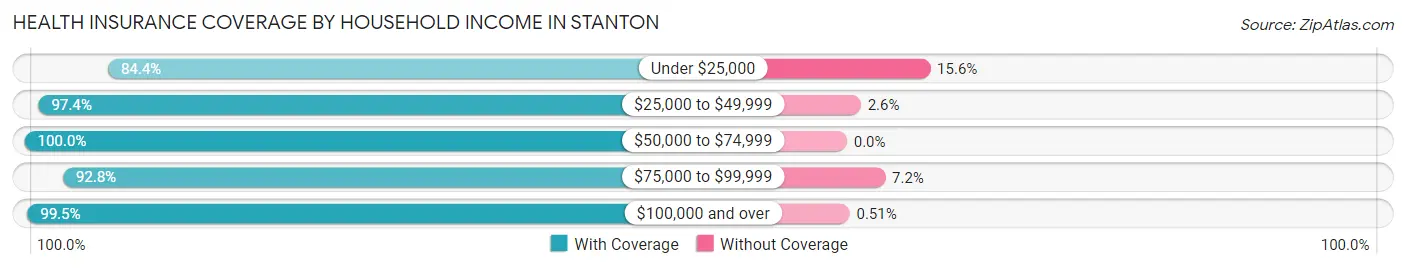
| Household Income | With Coverage | Without Coverage |
| Under $25,000 | 108 (84.4%) | 20 (15.6%) |
| $25,000 to $49,999 | 224 (97.4%) | 6 (2.6%) |
| $50,000 to $74,999 | 235 (100.0%) | 0 (0.0%) |
| $75,000 to $99,999 | 401 (92.8%) | 31 (7.2%) |
| $100,000 and over | 585 (99.5%) | 3 (0.5%) |
Public vs Private Health Insurance Coverage by Age in Stanton
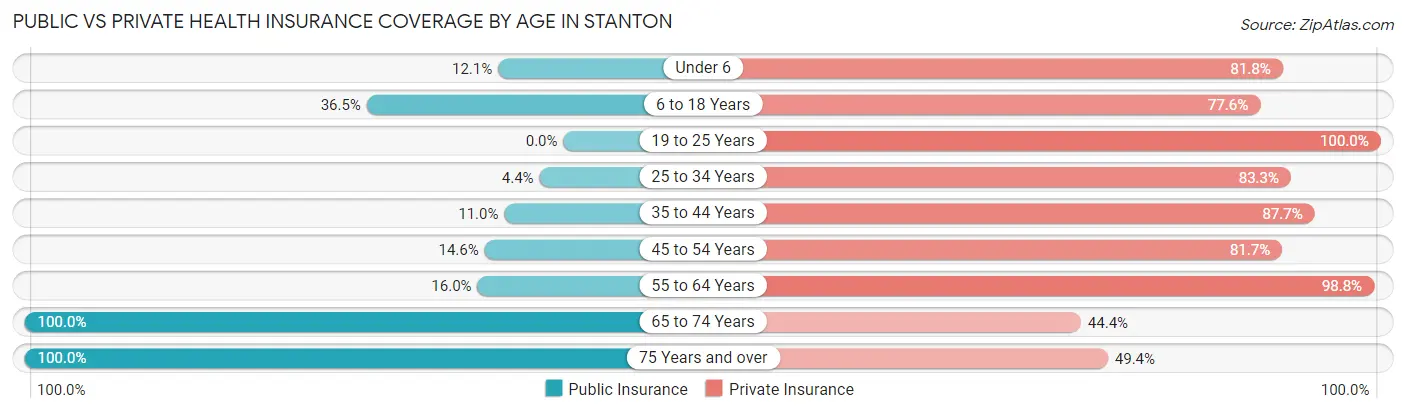
| Age Bracket | Public Insurance | Private Insurance |
| Under 6 | 8 (12.1%) | 54 (81.8%) |
| 6 to 18 Years | 142 (36.5%) | 302 (77.6%) |
| 19 to 25 Years | 0 (0.0%) | 172 (100.0%) |
| 25 to 34 Years | 8 (4.4%) | 150 (83.3%) |
| 35 to 44 Years | 17 (11.0%) | 136 (87.7%) |
| 45 to 54 Years | 24 (14.6%) | 134 (81.7%) |
| 55 to 64 Years | 26 (16.0%) | 161 (98.8%) |
| 65 to 74 Years | 160 (100.0%) | 71 (44.4%) |
| 75 Years and over | 164 (100.0%) | 81 (49.4%) |
| Total | 549 (34.0%) | 1,261 (78.2%) |
Disability Status by Sex by Age in Stanton
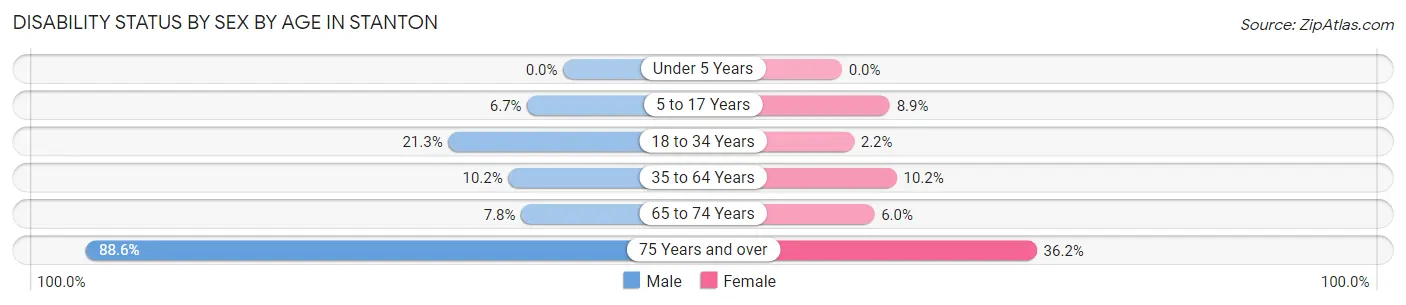
| Age Bracket | Male | Female |
| Under 5 Years | 0 (0.0%) | 0 (0.0%) |
| 5 to 17 Years | 13 (6.7%) | 17 (8.9%) |
| 18 to 34 Years | 42 (21.3%) | 4 (2.2%) |
| 35 to 64 Years | 24 (10.2%) | 25 (10.2%) |
| 65 to 74 Years | 6 (7.8%) | 5 (6.0%) |
| 75 Years and over | 62 (88.6%) | 34 (36.2%) |
Disability Class by Sex by Age in Stanton
Disability Class: Hearing Difficulty
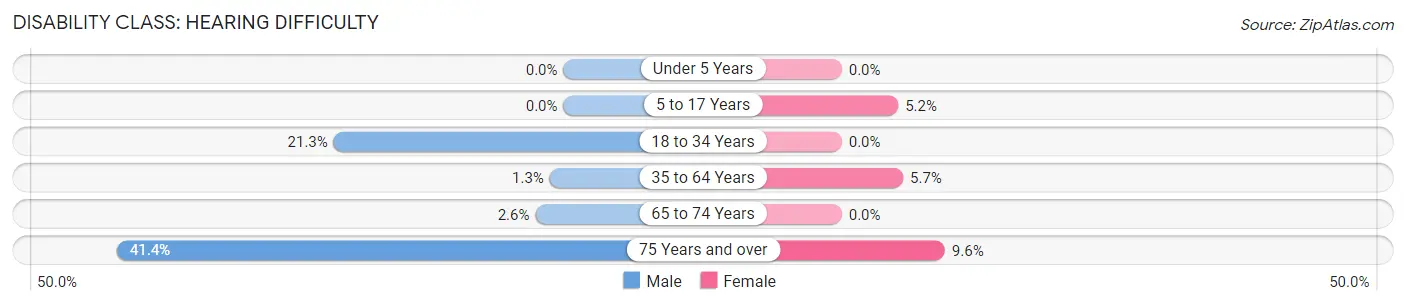
| Age Bracket | Male | Female |
| Under 5 Years | 0 (0.0%) | 0 (0.0%) |
| 5 to 17 Years | 0 (0.0%) | 10 (5.2%) |
| 18 to 34 Years | 42 (21.3%) | 0 (0.0%) |
| 35 to 64 Years | 3 (1.3%) | 14 (5.7%) |
| 65 to 74 Years | 2 (2.6%) | 0 (0.0%) |
| 75 Years and over | 29 (41.4%) | 9 (9.6%) |
Disability Class: Vision Difficulty
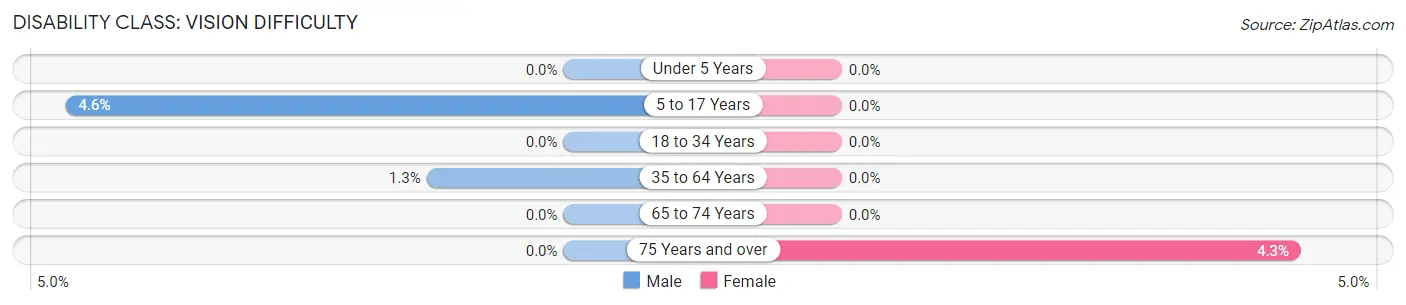
| Age Bracket | Male | Female |
| Under 5 Years | 0 (0.0%) | 0 (0.0%) |
| 5 to 17 Years | 9 (4.6%) | 0 (0.0%) |
| 18 to 34 Years | 0 (0.0%) | 0 (0.0%) |
| 35 to 64 Years | 3 (1.3%) | 0 (0.0%) |
| 65 to 74 Years | 0 (0.0%) | 0 (0.0%) |
| 75 Years and over | 0 (0.0%) | 4 (4.3%) |
Disability Class: Cognitive Difficulty
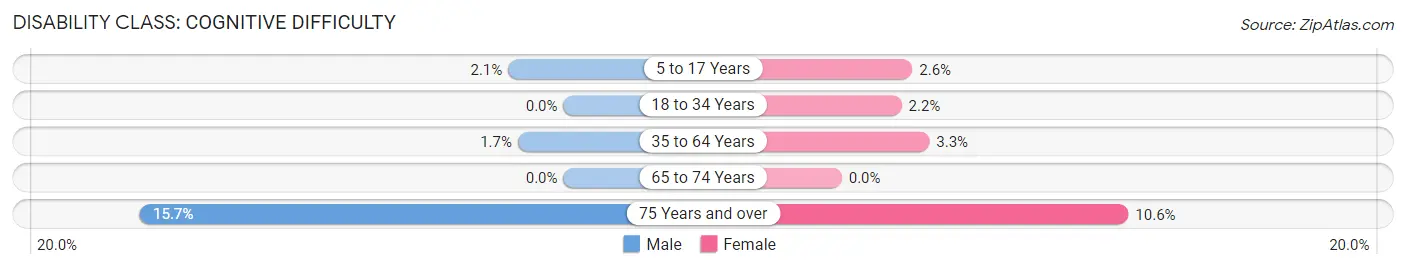
| Age Bracket | Male | Female |
| 5 to 17 Years | 4 (2.1%) | 5 (2.6%) |
| 18 to 34 Years | 0 (0.0%) | 4 (2.2%) |
| 35 to 64 Years | 4 (1.7%) | 8 (3.3%) |
| 65 to 74 Years | 0 (0.0%) | 0 (0.0%) |
| 75 Years and over | 11 (15.7%) | 10 (10.6%) |
Disability Class: Ambulatory Difficulty
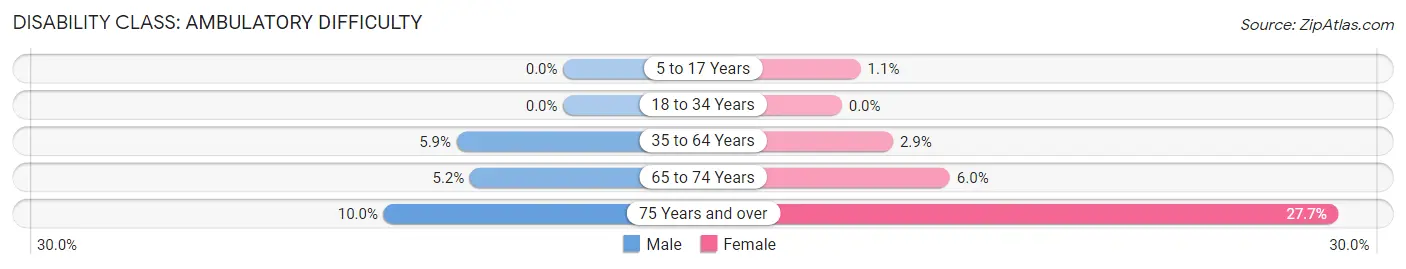
| Age Bracket | Male | Female |
| 5 to 17 Years | 0 (0.0%) | 2 (1.1%) |
| 18 to 34 Years | 0 (0.0%) | 0 (0.0%) |
| 35 to 64 Years | 14 (5.9%) | 7 (2.9%) |
| 65 to 74 Years | 4 (5.2%) | 5 (6.0%) |
| 75 Years and over | 7 (10.0%) | 26 (27.7%) |
Disability Class: Self-Care Difficulty
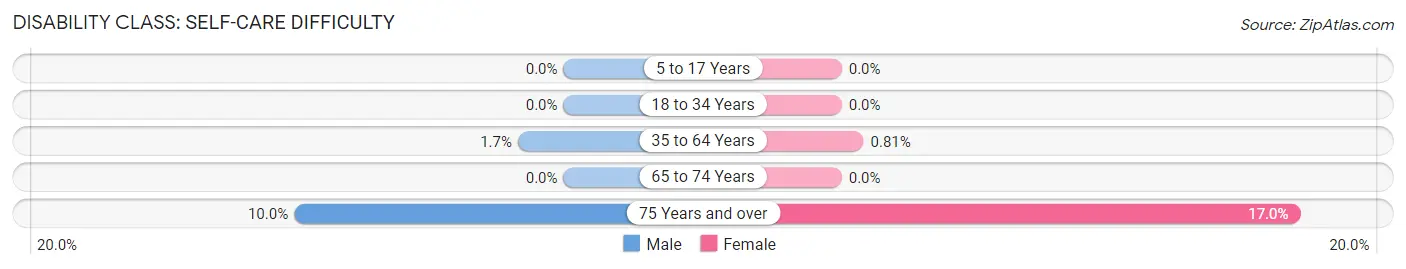
| Age Bracket | Male | Female |
| 5 to 17 Years | 0 (0.0%) | 0 (0.0%) |
| 18 to 34 Years | 0 (0.0%) | 0 (0.0%) |
| 35 to 64 Years | 4 (1.7%) | 2 (0.8%) |
| 65 to 74 Years | 0 (0.0%) | 0 (0.0%) |
| 75 Years and over | 7 (10.0%) | 16 (17.0%) |
Technology Access in Stanton
Computing Device Access in Stanton
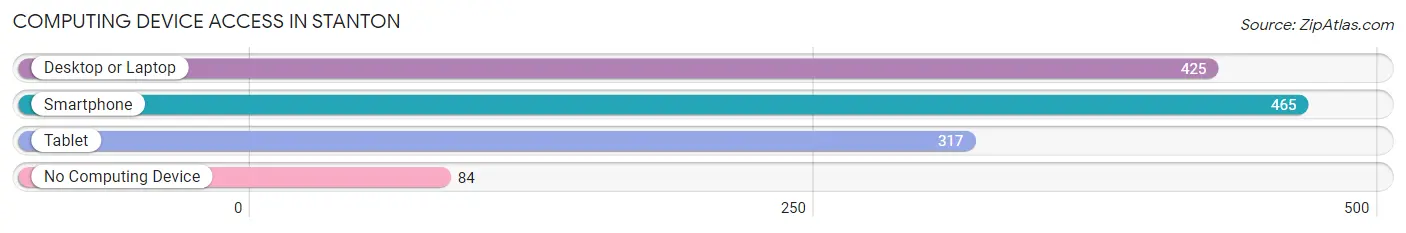
| Device Type | # Households | % Households |
| Desktop or Laptop | 425 | 67.9% |
| Smartphone | 465 | 74.3% |
| Tablet | 317 | 50.6% |
| No Computing Device | 84 | 13.4% |
| Total | 626 | 100.0% |
Internet Access in Stanton
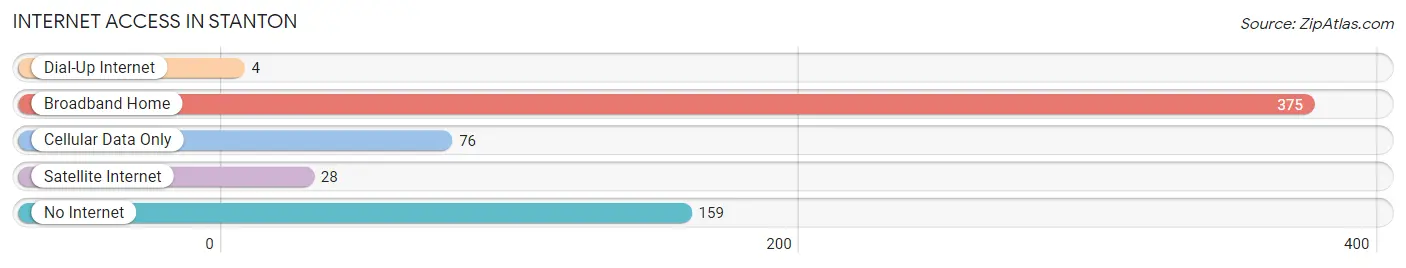
| Internet Type | # Households | % Households |
| Dial-Up Internet | 4 | 0.6% |
| Broadband Home | 375 | 59.9% |
| Cellular Data Only | 76 | 12.1% |
| Satellite Internet | 28 | 4.5% |
| No Internet | 159 | 25.4% |
| Total | 626 | 100.0% |
Stanton Summary
Stanton is a small city located in the state of Nebraska, in the United States of America. It is located in the eastern part of the state, in Stanton County, and is the county seat. The city has a population of 1,845 people, according to the 2010 census.
History
Stanton was founded in 1871 by a group of settlers from Iowa. The city was named after the first settler, William Stanton, who had come to the area in search of a new home. The city was incorporated in 1873 and was the first city in Stanton County.
The city was an important stop on the Union Pacific Railroad, which ran through the city. The railroad brought many new settlers to the area, and the city grew rapidly. By the early 1900s, Stanton had become a thriving agricultural center, with a population of over 1,000 people.
The city was also home to a number of businesses, including a flour mill, a creamery, a brickyard, and a lumberyard. The city also had a number of churches, schools, and other civic organizations.
Geography
Stanton is located in the eastern part of Nebraska, in Stanton County. The city is situated on the banks of the Elkhorn River, and is surrounded by rolling hills and farmland. The city is located about 30 miles north of Omaha, and about 50 miles south of Sioux City, Iowa.
The climate in Stanton is typical of the Midwest, with hot summers and cold winters. The average temperature in the summer is around 80 degrees Fahrenheit, and in the winter it is around 20 degrees Fahrenheit.
Economy
Stanton’s economy is largely based on agriculture. The city is home to a number of farms, which produce a variety of crops, including corn, soybeans, wheat, and hay. The city also has a number of businesses, including a lumberyard, a brickyard, and a flour mill.
The city is also home to a number of manufacturing companies, including a furniture factory, a plastics factory, and a metal fabrication plant. The city also has a number of retail stores, restaurants, and other businesses.
Demographics
According to the 2010 census, the population of Stanton was 1,845 people. The population is predominantly white, with a small percentage of African Americans, Hispanics, and other ethnicities. The median household income in the city is $41,000, and the median age is 37.
Stanton is a small city with a rich history and a vibrant economy. The city is home to a number of businesses, farms, and other organizations, and is a great place to live and work.
Common Questions
What is Per Capita Income in Stanton?
Per Capita income in Stanton is $33,616.
What is the Median Family Income in Stanton?
Median Family Income in Stanton is $89,219.
What is the Median Household income in Stanton?
Median Household Income in Stanton is $72,500.
What is Income or Wage Gap in Stanton?
Income or Wage Gap in Stanton is 35.4%.
Women in Stanton earn 64.6 cents for every dollar earned by a man.
What is Inequality or Gini Index in Stanton?
Inequality or Gini Index in Stanton is 0.44.
What is the Total Population of Stanton?
Total Population of Stanton is 1,673.
What is the Total Male Population of Stanton?
Total Male Population of Stanton is 814.
What is the Total Female Population of Stanton?
Total Female Population of Stanton is 859.
What is the Ratio of Males per 100 Females in Stanton?
There are 94.76 Males per 100 Females in Stanton.
What is the Ratio of Females per 100 Males in Stanton?
There are 105.53 Females per 100 Males in Stanton.
What is the Median Population Age in Stanton?
Median Population Age in Stanton is 36.6 Years.
What is the Average Family Size in Stanton
Average Family Size in Stanton is 3.3 People.
What is the Average Household Size in Stanton
Average Household Size in Stanton is 2.6 People.
How Large is the Labor Force in Stanton?
There are 783 People in the Labor Forcein in Stanton.
What is the Percentage of People in the Labor Force in Stanton?
60.2% of People are in the Labor Force in Stanton.
What is the Unemployment Rate in Stanton?
Unemployment Rate in Stanton is 1.8%.