Ponder, TX Map & Demographics
Ponder Map
Ponder Overview
$37,269
PER CAPITA INCOME
$102,143
AVG FAMILY INCOME
$98,227
AVG HOUSEHOLD INCOME
33.5%
WAGE / INCOME GAP [ % ]
66.5¢/ $1
WAGE / INCOME GAP [ $ ]
0.29
INEQUALITY / GINI INDEX
2,421
TOTAL POPULATION
1,184
MALE POPULATION
1,237
FEMALE POPULATION
95.72
MALES / 100 FEMALES
104.48
FEMALES / 100 MALES
31.3
MEDIAN AGE
3.5
AVG FAMILY SIZE
2.9
AVG HOUSEHOLD SIZE
1,283
LABOR FORCE [ PEOPLE ]
76.8%
PERCENT IN LABOR FORCE
4.4%
UNEMPLOYMENT RATE
Ponder Zip Codes
Ponder Area Codes
Income in Ponder
Income Overview in Ponder
Per Capita Income in Ponder is $37,269, while median incomes of families and households are $102,143 and $98,227 respectively.
| Characteristic | Number | Measure |
| Per Capita Income | 2,421 | $37,269 |
| Median Family Income | 602 | $102,143 |
| Mean Family Income | 602 | $113,399 |
| Median Household Income | 839 | $98,227 |
| Mean Household Income | 839 | $106,372 |
| Income Deficit | 602 | $0 |
| Wage / Income Gap (%) | 2,421 | 33.49% |
| Wage / Income Gap ($) | 2,421 | 66.51¢ per $1 |
| Gini / Inequality Index | 2,421 | 0.29 |
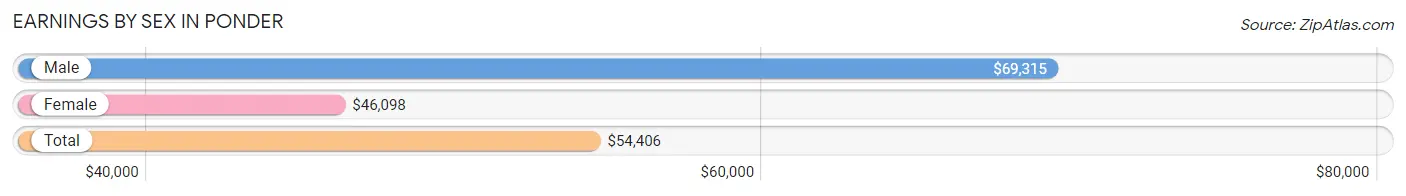
Earnings by Sex in Ponder
Average Earnings in Ponder are $54,406, $69,315 for men and $46,098 for women, a difference of 33.5%.
| Sex | Number | Average Earnings |
| Male | 625 (46.4%) | $69,315 |
| Female | 722 (53.6%) | $46,098 |
| Total | 1,347 (100.0%) | $54,406 |
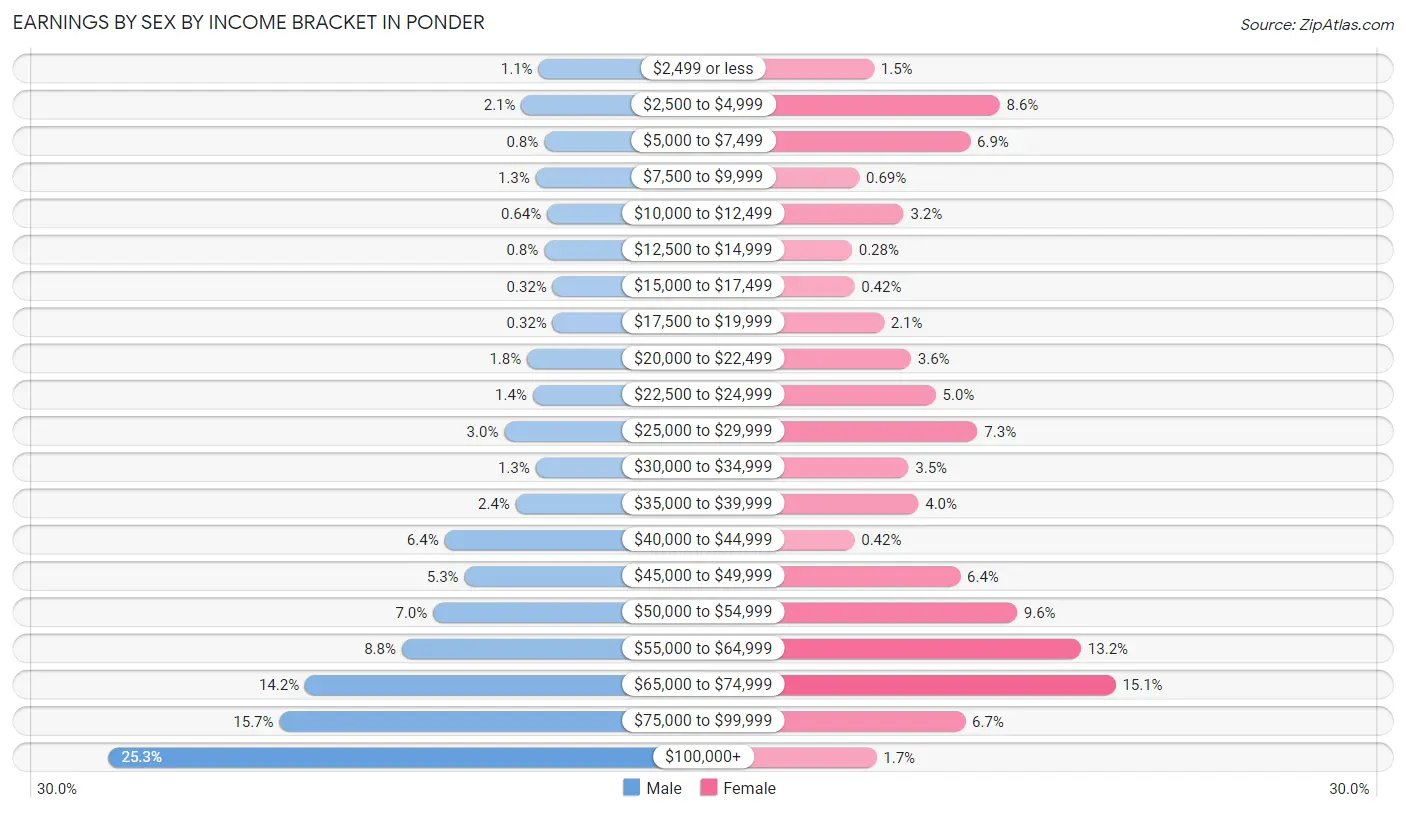
Earnings by Sex by Income Bracket in Ponder
The most common earnings brackets in Ponder are $100,000+ for men (158 | 25.3%) and $65,000 to $74,999 for women (109 | 15.1%).
| Income | Male | Female |
| $2,499 or less | 7 (1.1%) | 11 (1.5%) |
| $2,500 to $4,999 | 13 (2.1%) | 62 (8.6%) |
| $5,000 to $7,499 | 5 (0.8%) | 50 (6.9%) |
| $7,500 to $9,999 | 8 (1.3%) | 5 (0.7%) |
| $10,000 to $12,499 | 4 (0.6%) | 23 (3.2%) |
| $12,500 to $14,999 | 5 (0.8%) | 2 (0.3%) |
| $15,000 to $17,499 | 2 (0.3%) | 3 (0.4%) |
| $17,500 to $19,999 | 2 (0.3%) | 15 (2.1%) |
| $20,000 to $22,499 | 11 (1.8%) | 26 (3.6%) |
| $22,500 to $24,999 | 9 (1.4%) | 36 (5.0%) |
| $25,000 to $29,999 | 19 (3.0%) | 53 (7.3%) |
| $30,000 to $34,999 | 8 (1.3%) | 25 (3.5%) |
| $35,000 to $39,999 | 15 (2.4%) | 29 (4.0%) |
| $40,000 to $44,999 | 40 (6.4%) | 3 (0.4%) |
| $45,000 to $49,999 | 33 (5.3%) | 46 (6.4%) |
| $50,000 to $54,999 | 44 (7.0%) | 69 (9.6%) |
| $55,000 to $64,999 | 55 (8.8%) | 95 (13.2%) |
| $65,000 to $74,999 | 89 (14.2%) | 109 (15.1%) |
| $75,000 to $99,999 | 98 (15.7%) | 48 (6.7%) |
| $100,000+ | 158 (25.3%) | 12 (1.7%) |
| Total | 625 (100.0%) | 722 (100.0%) |
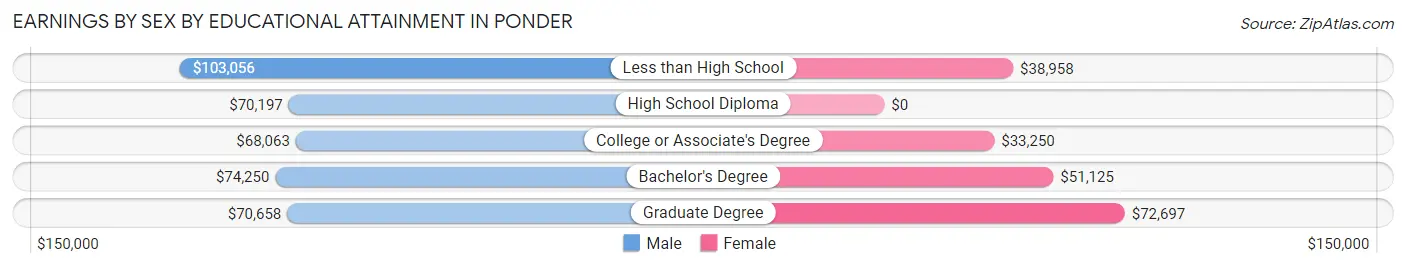
Earnings by Sex by Educational Attainment in Ponder
Average earnings in Ponder are $70,262 for men and $47,256 for women, a difference of 32.7%. Men with an educational attainment of less than high school enjoy the highest average annual earnings of $103,056, while those with college or associate's degree education earn the least with $68,063. Women with an educational attainment of graduate degree earn the most with the average annual earnings of $72,697, while those with college or associate's degree education have the smallest earnings of $33,250.
| Educational Attainment | Male Income | Female Income |
| Less than High School | $103,056 | $38,958 |
| High School Diploma | $70,197 | $0 |
| College or Associate's Degree | $68,063 | $33,250 |
| Bachelor's Degree | $74,250 | $51,125 |
| Graduate Degree | $70,658 | $72,697 |
| Total | $70,262 | $47,256 |
Family Income in Ponder
Family Income Brackets in Ponder
According to the Ponder family income data, there are 210 families falling into the $100,000 to $149,999 income range, which is the most common income bracket and makes up 34.9% of all families.
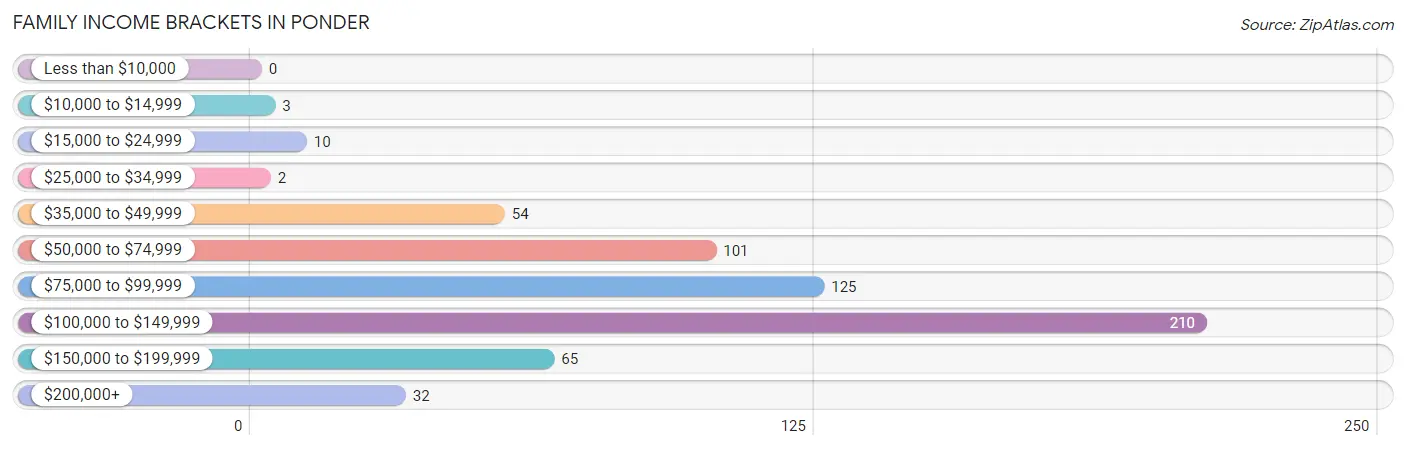
| Income Bracket | # Families | % Families |
| Less than $10,000 | 0 | 0.0% |
| $10,000 to $14,999 | 3 | 0.5% |
| $15,000 to $24,999 | 10 | 1.7% |
| $25,000 to $34,999 | 2 | 0.3% |
| $35,000 to $49,999 | 54 | 9.0% |
| $50,000 to $74,999 | 101 | 16.8% |
| $75,000 to $99,999 | 125 | 20.8% |
| $100,000 to $149,999 | 210 | 34.9% |
| $150,000 to $199,999 | 65 | 10.8% |
| $200,000+ | 32 | 5.3% |
Family Income by Famaliy Size in Ponder
3-person families (146 | 24.2%) account for the highest median family income in Ponder with $130,833 per family, while 2-person families (183 | 30.4%) have the highest median income of $46,370 per family member.
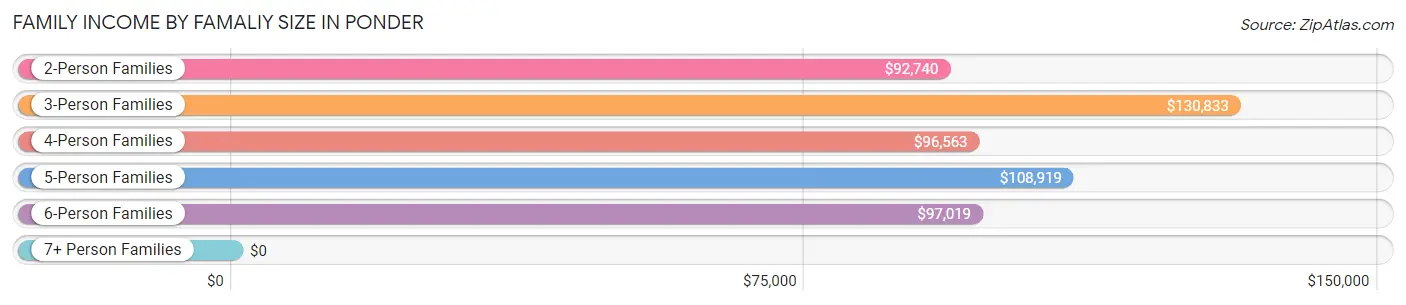
| Income Bracket | # Families | Median Income |
| 2-Person Families | 183 (30.4%) | $92,740 |
| 3-Person Families | 146 (24.2%) | $130,833 |
| 4-Person Families | 142 (23.6%) | $96,563 |
| 5-Person Families | 60 (10.0%) | $108,919 |
| 6-Person Families | 71 (11.8%) | $97,019 |
| 7+ Person Families | 0 (0.0%) | $0 |
| Total | 602 (100.0%) | $102,143 |
Family Income by Number of Earners in Ponder
The median family income in Ponder is $102,143, with families comprising 3+ earners (73) having the highest median family income of $154,375, while families with no earners (56) have the lowest median family income of $49,167, accounting for 12.1% and 9.3% of families, respectively.
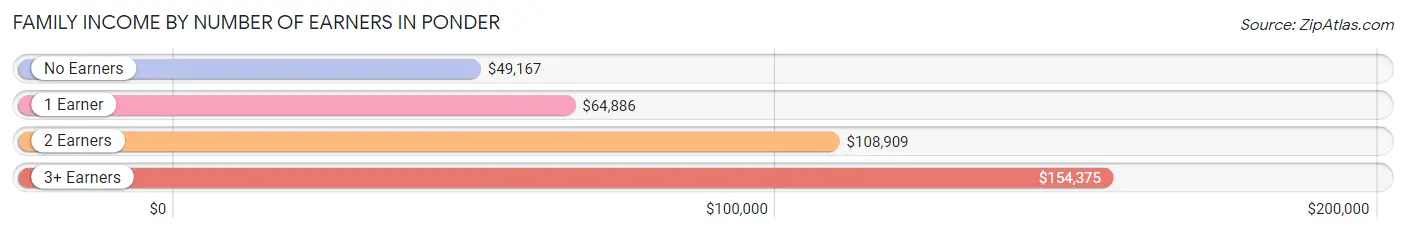
| Number of Earners | # Families | Median Income |
| No Earners | 56 (9.3%) | $49,167 |
| 1 Earner | 125 (20.8%) | $64,886 |
| 2 Earners | 348 (57.8%) | $108,909 |
| 3+ Earners | 73 (12.1%) | $154,375 |
| Total | 602 (100.0%) | $102,143 |
Household Income in Ponder
Household Income Brackets in Ponder
With 256 households falling in the category, the $75,000 to $99,999 income range is the most frequent in Ponder, accounting for 30.5% of all households. In contrast, only 3 households (0.4%) fall into the less than $10,000 income bracket, making it the least populous group.
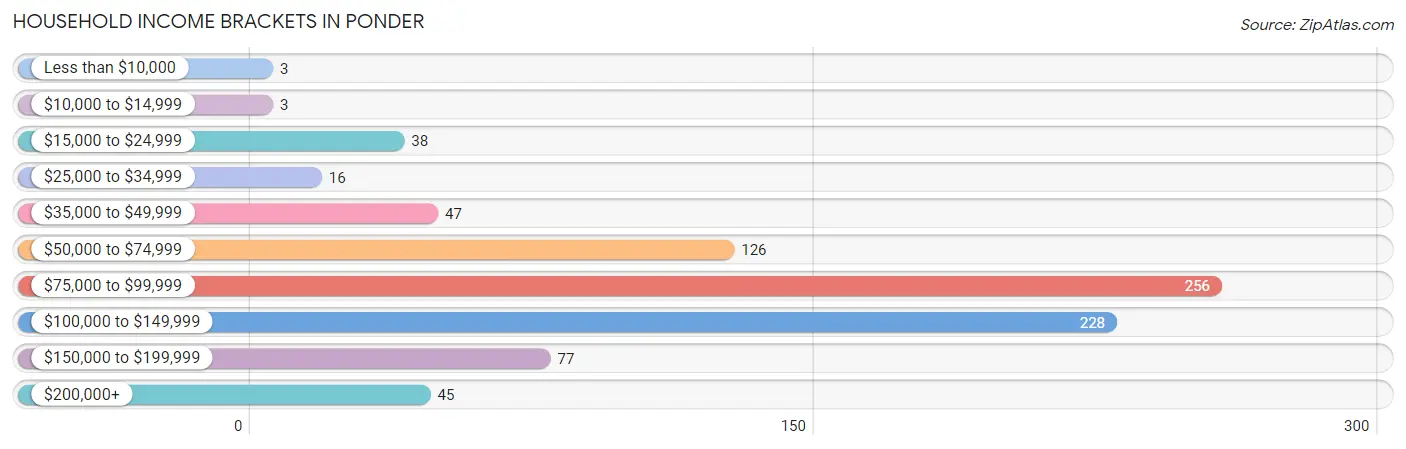
| Income Bracket | # Households | % Households |
| Less than $10,000 | 3 | 0.4% |
| $10,000 to $14,999 | 3 | 0.4% |
| $15,000 to $24,999 | 38 | 4.5% |
| $25,000 to $34,999 | 16 | 1.9% |
| $35,000 to $49,999 | 47 | 5.6% |
| $50,000 to $74,999 | 126 | 15.0% |
| $75,000 to $99,999 | 256 | 30.5% |
| $100,000 to $149,999 | 228 | 27.2% |
| $150,000 to $199,999 | 77 | 9.2% |
| $200,000+ | 45 | 5.4% |
Household Income by Householder Age in Ponder
The median household income in Ponder is $98,227, with the highest median household income of $122,946 found in the 45 to 64 years age bracket for the primary householder. A total of 209 households (24.9%) fall into this category. Meanwhile, the 15 to 24 years age bracket for the primary householder has the lowest median household income of $0, with 6 households (0.7%) in this group.
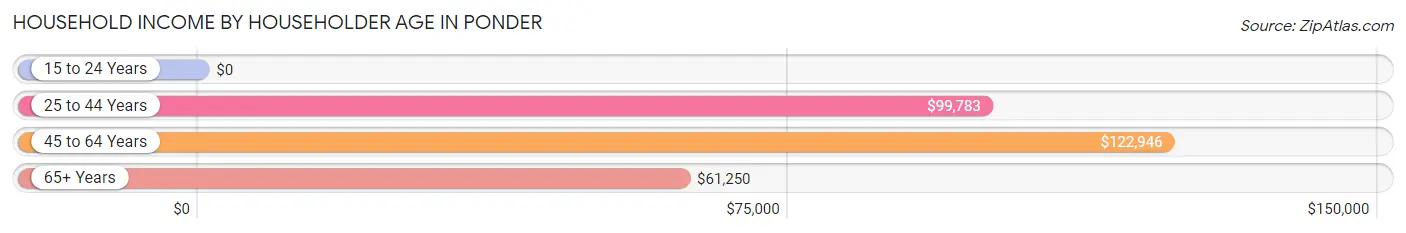
| Income Bracket | # Households | Median Income |
| 15 to 24 Years | 6 (0.7%) | $0 |
| 25 to 44 Years | 449 (53.5%) | $99,783 |
| 45 to 64 Years | 209 (24.9%) | $122,946 |
| 65+ Years | 175 (20.9%) | $61,250 |
| Total | 839 (100.0%) | $98,227 |
Poverty in Ponder
Income Below Poverty by Sex and Age in Ponder
With 0.8% poverty level for males and 3.2% for females among the residents of Ponder, 18 to 24 year old males and 25 to 34 year old females are the most vulnerable to poverty, with 4 males (21.0%) and 27 females (8.2%) in their respective age groups living below the poverty level.
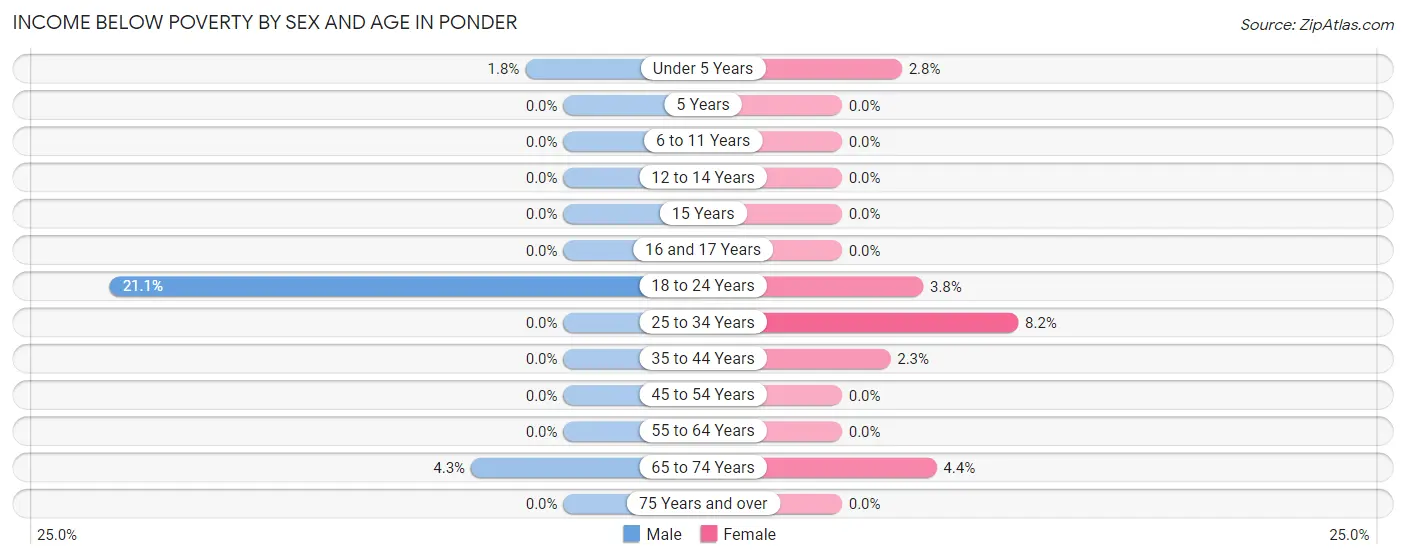
| Age Bracket | Male | Female |
| Under 5 Years | 2 (1.8%) | 2 (2.8%) |
| 5 Years | 0 (0.0%) | 0 (0.0%) |
| 6 to 11 Years | 0 (0.0%) | 0 (0.0%) |
| 12 to 14 Years | 0 (0.0%) | 0 (0.0%) |
| 15 Years | 0 (0.0%) | 0 (0.0%) |
| 16 and 17 Years | 0 (0.0%) | 0 (0.0%) |
| 18 to 24 Years | 4 (21.0%) | 2 (3.8%) |
| 25 to 34 Years | 0 (0.0%) | 27 (8.2%) |
| 35 to 44 Years | 0 (0.0%) | 4 (2.2%) |
| 45 to 54 Years | 0 (0.0%) | 0 (0.0%) |
| 55 to 64 Years | 0 (0.0%) | 0 (0.0%) |
| 65 to 74 Years | 3 (4.3%) | 5 (4.4%) |
| 75 Years and over | 0 (0.0%) | 0 (0.0%) |
| Total | 9 (0.8%) | 40 (3.2%) |
Income Above Poverty by Sex and Age in Ponder
According to the poverty statistics in Ponder, males aged 5 years and females aged 5 years are the age groups that are most secure financially, with 100.0% of males and 100.0% of females in these age groups living above the poverty line.
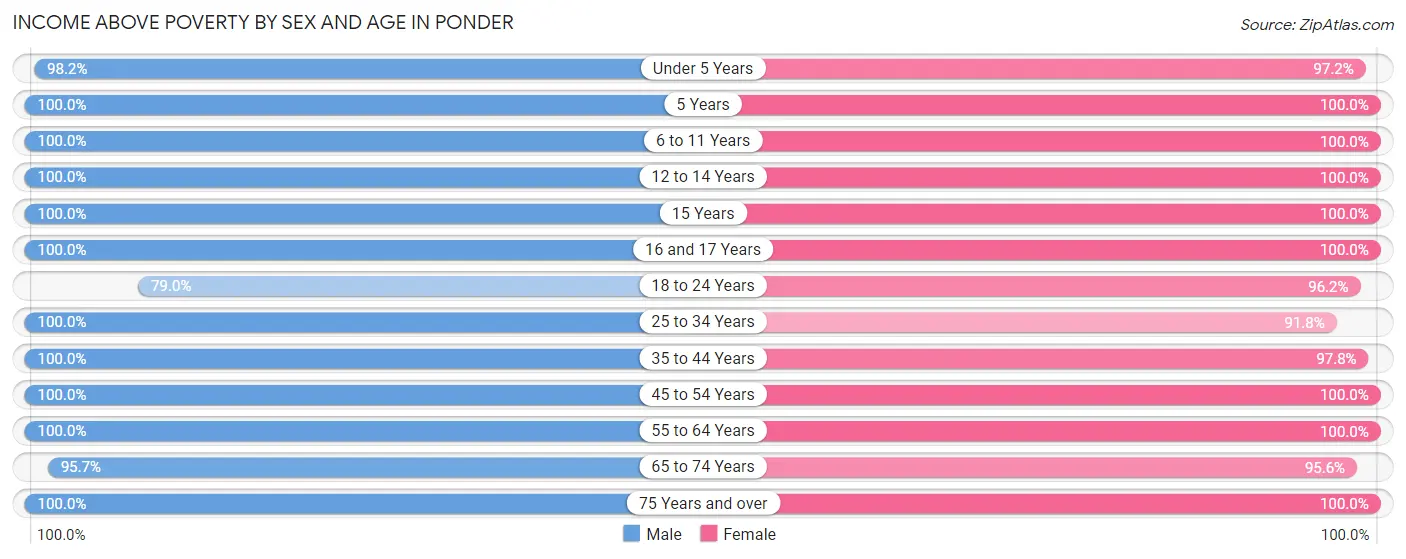
| Age Bracket | Male | Female |
| Under 5 Years | 111 (98.2%) | 70 (97.2%) |
| 5 Years | 32 (100.0%) | 12 (100.0%) |
| 6 to 11 Years | 144 (100.0%) | 131 (100.0%) |
| 12 to 14 Years | 129 (100.0%) | 57 (100.0%) |
| 15 Years | 33 (100.0%) | 21 (100.0%) |
| 16 and 17 Years | 24 (100.0%) | 20 (100.0%) |
| 18 to 24 Years | 15 (78.9%) | 51 (96.2%) |
| 25 to 34 Years | 203 (100.0%) | 303 (91.8%) |
| 35 to 44 Years | 185 (100.0%) | 174 (97.8%) |
| 45 to 54 Years | 74 (100.0%) | 77 (100.0%) |
| 55 to 64 Years | 118 (100.0%) | 124 (100.0%) |
| 65 to 74 Years | 67 (95.7%) | 109 (95.6%) |
| 75 Years and over | 36 (100.0%) | 46 (100.0%) |
| Total | 1,171 (99.2%) | 1,195 (96.8%) |
Income Below Poverty Among Married-Couple Families in Ponder
The poverty statistics for married-couple families in Ponder show that 0.6% or 3 of the total 530 families live below the poverty line. Families with no children have the highest poverty rate of 1.5%, comprising of 3 families. On the other hand, families with 1 or 2 children have the lowest poverty rate of 0.0%, which includes 0 families.
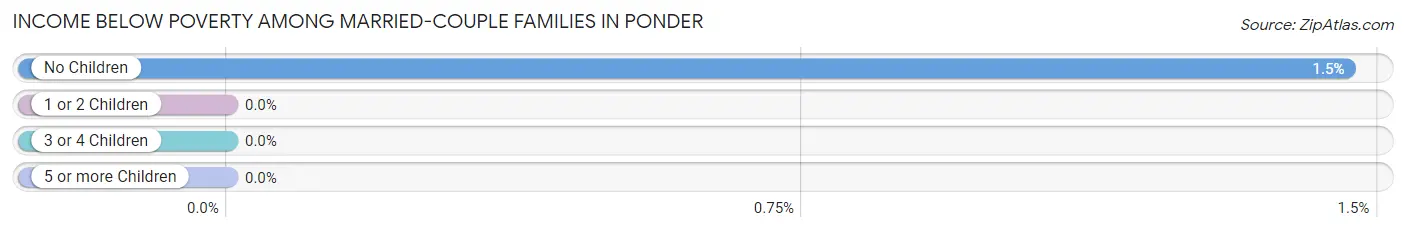
| Children | Above Poverty | Below Poverty |
| No Children | 203 (98.5%) | 3 (1.5%) |
| 1 or 2 Children | 215 (100.0%) | 0 (0.0%) |
| 3 or 4 Children | 109 (100.0%) | 0 (0.0%) |
| 5 or more Children | 0 (0.0%) | 0 (0.0%) |
| Total | 527 (99.4%) | 3 (0.6%) |
Income Below Poverty Among Single-Parent Households in Ponder
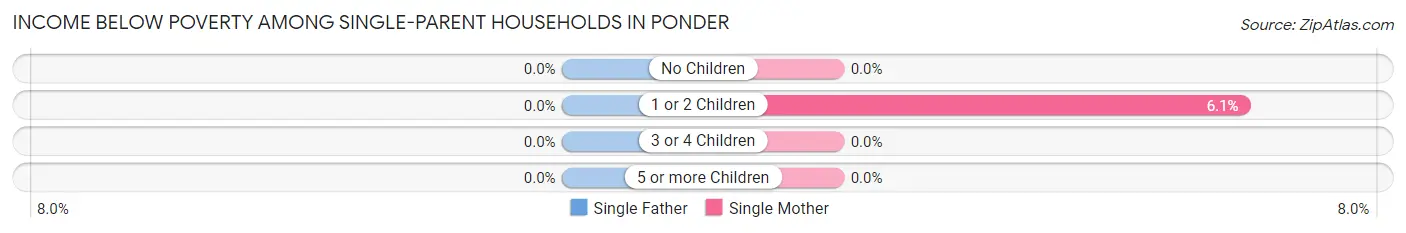
| Children | Single Father | Single Mother |
| No Children | 0 (0.0%) | 0 (0.0%) |
| 1 or 2 Children | 0 (0.0%) | 2 (6.1%) |
| 3 or 4 Children | 0 (0.0%) | 0 (0.0%) |
| 5 or more Children | 0 (0.0%) | 0 (0.0%) |
| Total | 0 (0.0%) | 2 (3.5%) |
Income Below Poverty Among Married-Couple vs Single-Parent Households in Ponder
The poverty data for Ponder shows that 3 of the married-couple family households (0.6%) and 2 of the single-parent households (2.8%) are living below the poverty level. Within the married-couple family households, those with no children have the highest poverty rate, with 3 households (1.5%) falling below the poverty line. Among the single-parent households, those with 1 or 2 children have the highest poverty rate, with 2 household (4.3%) living below poverty.
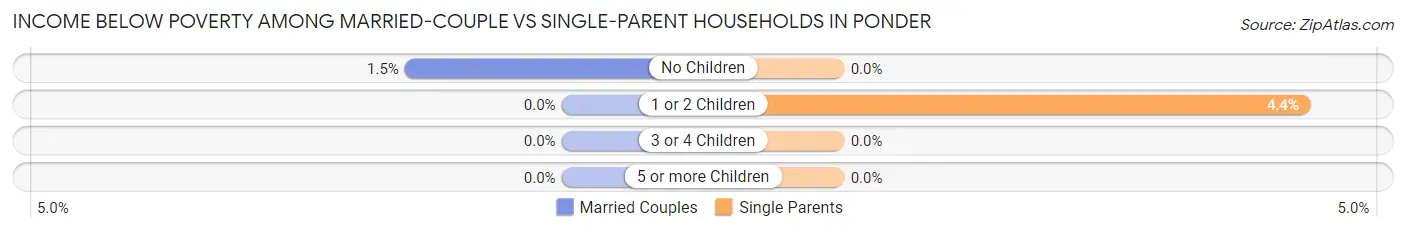
| Children | Married-Couple Families | Single-Parent Households |
| No Children | 3 (1.5%) | 0 (0.0%) |
| 1 or 2 Children | 0 (0.0%) | 2 (4.3%) |
| 3 or 4 Children | 0 (0.0%) | 0 (0.0%) |
| 5 or more Children | 0 (0.0%) | 0 (0.0%) |
| Total | 3 (0.6%) | 2 (2.8%) |
Race in Ponder
The most populous races in Ponder are White / Caucasian (1,965 | 81.2%), Hispanic or Latino (508 | 21.0%), and Two or more Races (253 | 10.4%).
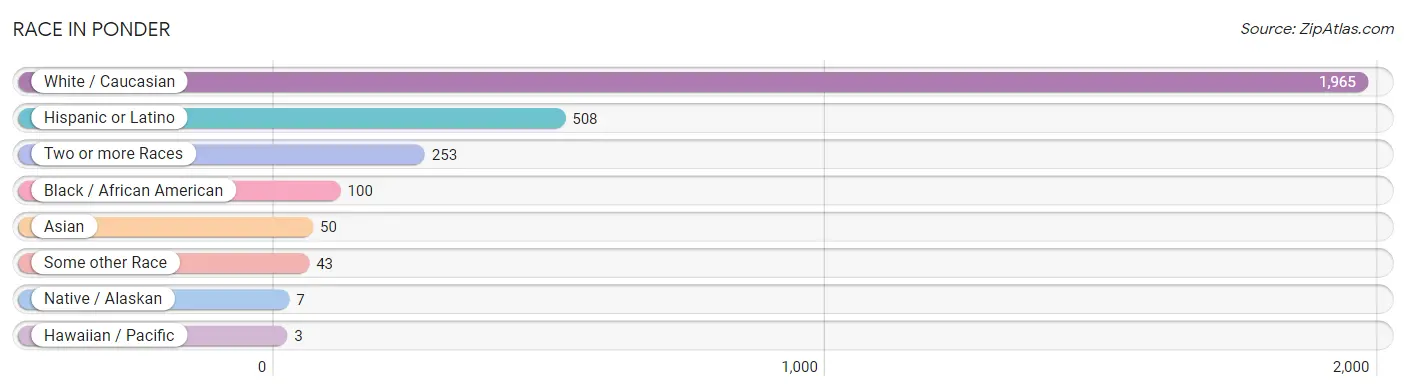
| Race | # Population | % Population |
| Asian | 50 | 2.1% |
| Black / African American | 100 | 4.1% |
| Hawaiian / Pacific | 3 | 0.1% |
| Hispanic or Latino | 508 | 21.0% |
| Native / Alaskan | 7 | 0.3% |
| White / Caucasian | 1,965 | 81.2% |
| Two or more Races | 253 | 10.4% |
| Some other Race | 43 | 1.8% |
| Total | 2,421 | 100.0% |
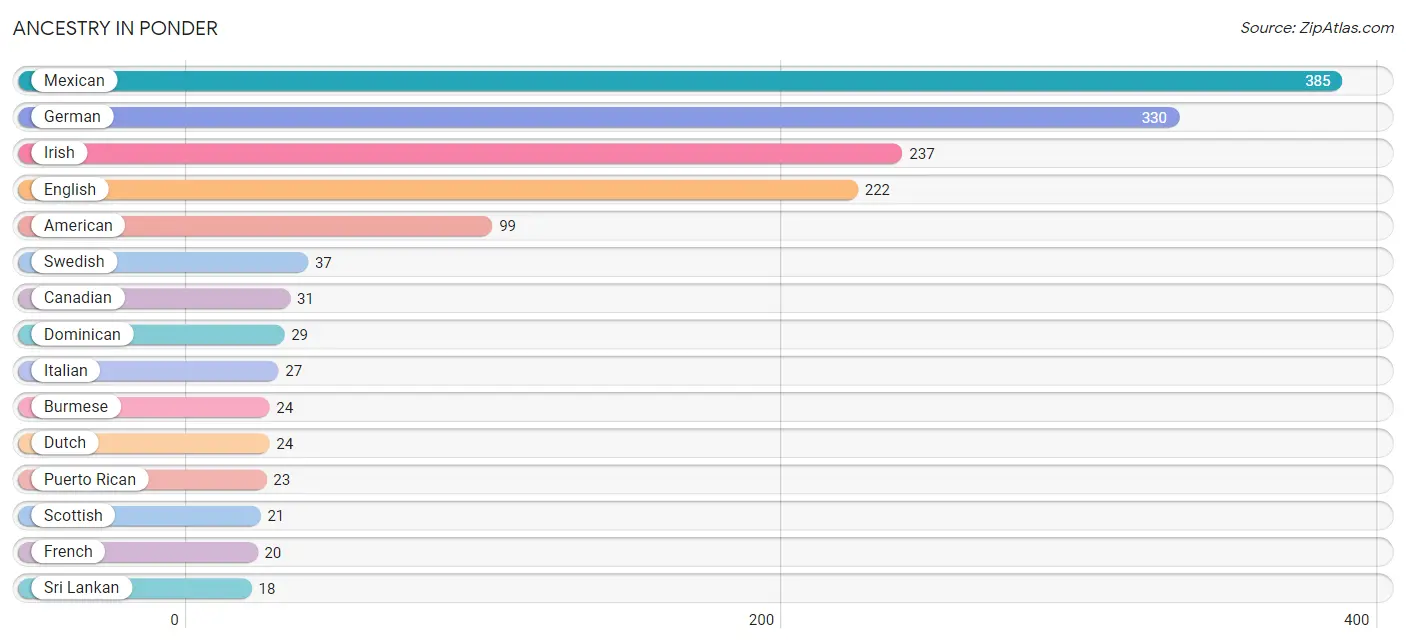
Ancestry in Ponder
The most populous ancestries reported in Ponder are Mexican (385 | 15.9%), German (330 | 13.6%), Irish (237 | 9.8%), English (222 | 9.2%), and American (99 | 4.1%), together accounting for 52.6% of all Ponder residents.
| Ancestry | # Population | % Population |
| African | 5 | 0.2% |
| American | 99 | 4.1% |
| Apache | 12 | 0.5% |
| Belgian | 3 | 0.1% |
| Bhutanese | 2 | 0.1% |
| Blackfeet | 2 | 0.1% |
| Brazilian | 12 | 0.5% |
| British | 12 | 0.5% |
| British West Indian | 3 | 0.1% |
| Burmese | 24 | 1.0% |
| Canadian | 31 | 1.3% |
| Central American | 5 | 0.2% |
| Central American Indian | 5 | 0.2% |
| Cherokee | 7 | 0.3% |
| Choctaw | 8 | 0.3% |
| Czech | 14 | 0.6% |
| Czechoslovakian | 2 | 0.1% |
| Danish | 4 | 0.2% |
| Dominican | 29 | 1.2% |
| Dutch | 24 | 1.0% |
| Ecuadorian | 3 | 0.1% |
| English | 222 | 9.2% |
| European | 7 | 0.3% |
| French | 20 | 0.8% |
| French Canadian | 3 | 0.1% |
| German | 330 | 13.6% |
| Guamanian / Chamorro | 3 | 0.1% |
| Hungarian | 3 | 0.1% |
| Indian (Asian) | 10 | 0.4% |
| Irish | 237 | 9.8% |
| Italian | 27 | 1.1% |
| Korean | 8 | 0.3% |
| Mexican | 385 | 15.9% |
| Norwegian | 4 | 0.2% |
| Osage | 7 | 0.3% |
| Polish | 7 | 0.3% |
| Puerto Rican | 23 | 0.9% |
| Salvadoran | 5 | 0.2% |
| Scotch-Irish | 9 | 0.4% |
| Scottish | 21 | 0.9% |
| Slovak | 5 | 0.2% |
| South American | 3 | 0.1% |
| Sri Lankan | 18 | 0.7% |
| Subsaharan African | 5 | 0.2% |
| Swedish | 37 | 1.5% |
| Thai | 4 | 0.2% |
| Welsh | 4 | 0.2% | View All 47 Rows |
Immigrants in Ponder
The most numerous immigrant groups reported in Ponder came from Asia (46 | 1.9%), Central America (31 | 1.3%), Eastern Asia (31 | 1.3%), Latin America (31 | 1.3%), and Mexico (27 | 1.1%), together accounting for 6.9% of all Ponder residents.
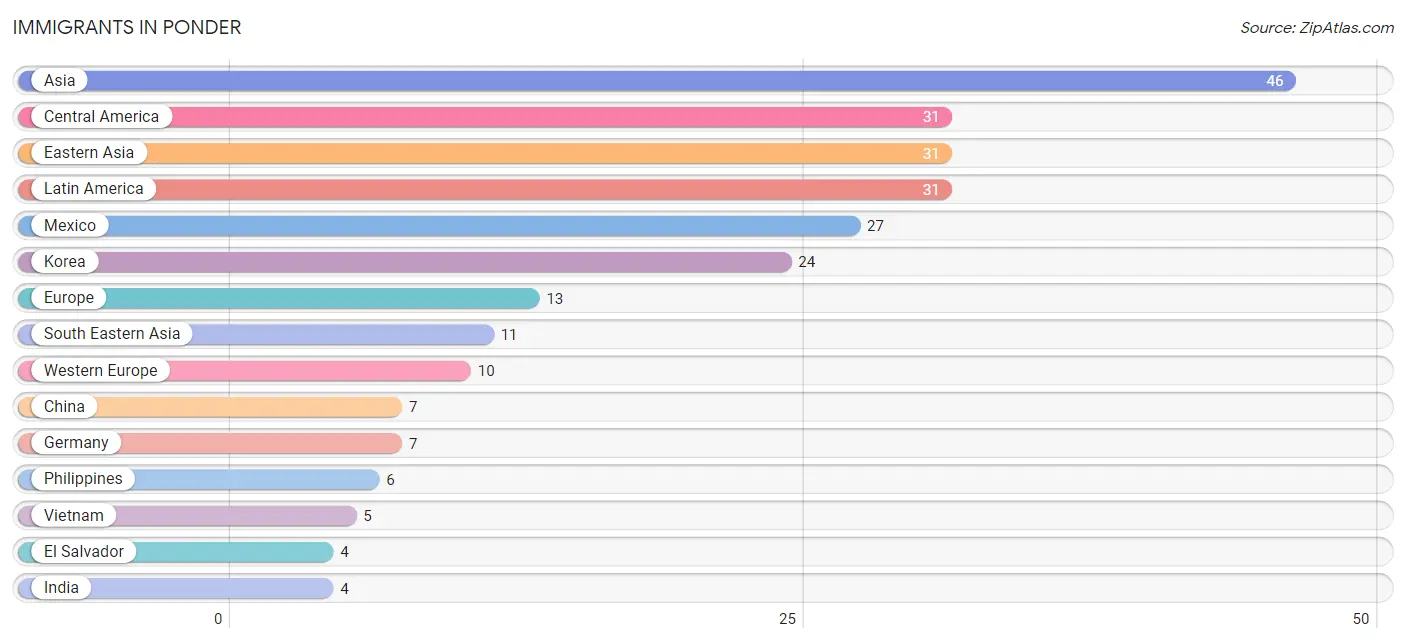
| Immigration Origin | # Population | % Population |
| Asia | 46 | 1.9% |
| Central America | 31 | 1.3% |
| China | 7 | 0.3% |
| Eastern Asia | 31 | 1.3% |
| El Salvador | 4 | 0.2% |
| Europe | 13 | 0.5% |
| France | 3 | 0.1% |
| Germany | 7 | 0.3% |
| India | 4 | 0.2% |
| Korea | 24 | 1.0% |
| Latin America | 31 | 1.3% |
| Mexico | 27 | 1.1% |
| Northern Europe | 3 | 0.1% |
| Philippines | 6 | 0.3% |
| Scotland | 3 | 0.1% |
| South Central Asia | 4 | 0.2% |
| South Eastern Asia | 11 | 0.4% |
| Vietnam | 5 | 0.2% |
| Western Europe | 10 | 0.4% | View All 19 Rows |
Sex and Age in Ponder
Sex and Age in Ponder
The most populous age groups in Ponder are 10 to 14 Years (169 | 14.3%) for men and 25 to 29 Years (215 | 17.4%) for women.
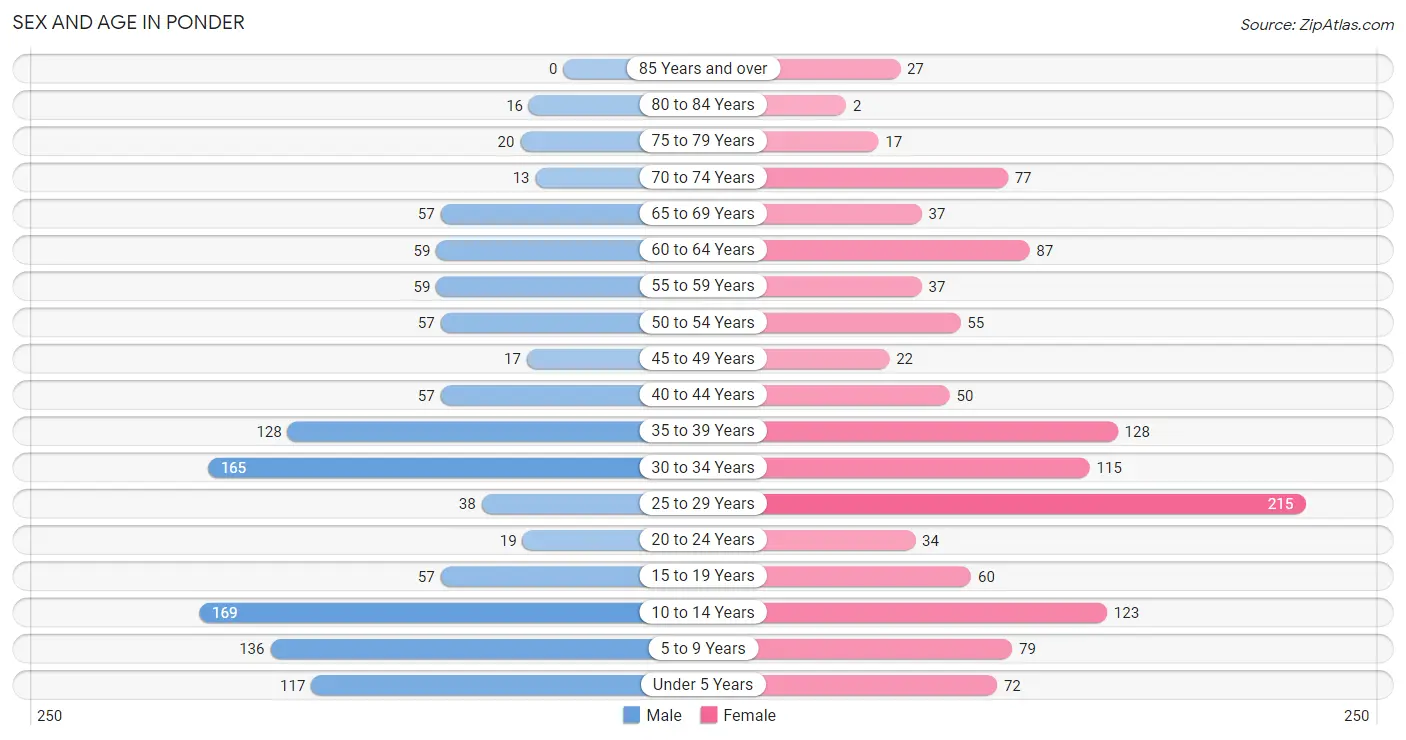
| Age Bracket | Male | Female |
| Under 5 Years | 117 (9.9%) | 72 (5.8%) |
| 5 to 9 Years | 136 (11.5%) | 79 (6.4%) |
| 10 to 14 Years | 169 (14.3%) | 123 (9.9%) |
| 15 to 19 Years | 57 (4.8%) | 60 (4.9%) |
| 20 to 24 Years | 19 (1.6%) | 34 (2.8%) |
| 25 to 29 Years | 38 (3.2%) | 215 (17.4%) |
| 30 to 34 Years | 165 (13.9%) | 115 (9.3%) |
| 35 to 39 Years | 128 (10.8%) | 128 (10.3%) |
| 40 to 44 Years | 57 (4.8%) | 50 (4.0%) |
| 45 to 49 Years | 17 (1.4%) | 22 (1.8%) |
| 50 to 54 Years | 57 (4.8%) | 55 (4.4%) |
| 55 to 59 Years | 59 (5.0%) | 37 (3.0%) |
| 60 to 64 Years | 59 (5.0%) | 87 (7.0%) |
| 65 to 69 Years | 57 (4.8%) | 37 (3.0%) |
| 70 to 74 Years | 13 (1.1%) | 77 (6.2%) |
| 75 to 79 Years | 20 (1.7%) | 17 (1.4%) |
| 80 to 84 Years | 16 (1.3%) | 2 (0.2%) |
| 85 Years and over | 0 (0.0%) | 27 (2.2%) |
| Total | 1,184 (100.0%) | 1,237 (100.0%) |
Families and Households in Ponder
Median Family Size in Ponder
The median family size in Ponder is 3.45 persons per family, with single female/mother families (57 | 9.5%) accounting for the largest median family size of 4.02 persons per family. On the other hand, single male/father families (15 | 2.5%) represent the smallest median family size with 2.80 persons per family.
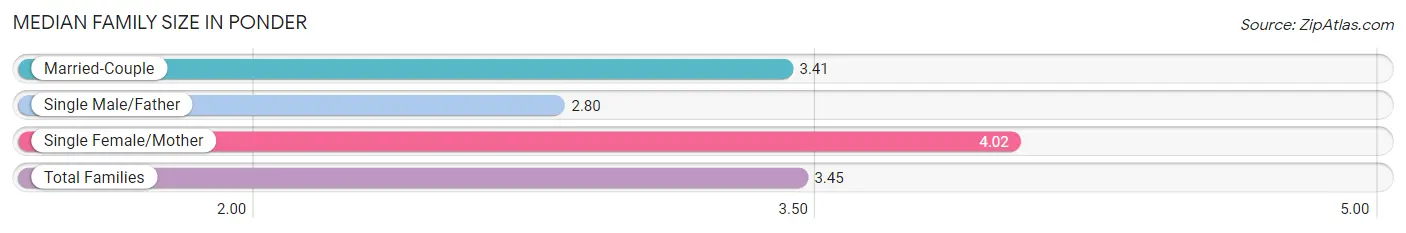
| Family Type | # Families | Family Size |
| Married-Couple | 530 (88.0%) | 3.41 |
| Single Male/Father | 15 (2.5%) | 2.80 |
| Single Female/Mother | 57 (9.5%) | 4.02 |
| Total Families | 602 (100.0%) | 3.45 |
Median Household Size in Ponder
The median household size in Ponder is 2.89 persons per household, with single female/mother households (57 | 6.8%) accounting for the largest median household size of 4.67 persons per household. non-family households (237 | 28.2%) represent the smallest median household size with 1.14 persons per household.
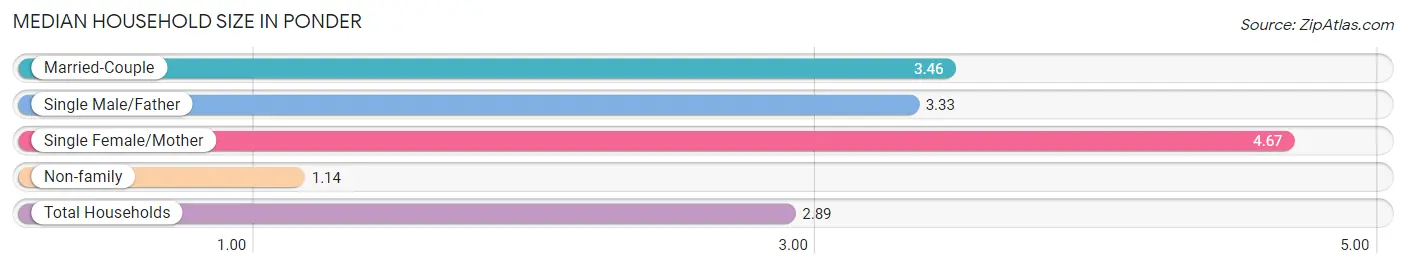
| Household Type | # Households | Household Size |
| Married-Couple | 530 (63.2%) | 3.46 |
| Single Male/Father | 15 (1.8%) | 3.33 |
| Single Female/Mother | 57 (6.8%) | 4.67 |
| Non-family | 237 (28.2%) | 1.14 |
| Total Households | 839 (100.0%) | 2.89 |
Household Size by Marriage Status in Ponder
Out of a total of 839 households in Ponder, 602 (71.8%) are family households, while 237 (28.2%) are nonfamily households. The most numerous type of family households are 2-person households, comprising 161, and the most common type of nonfamily households are 1-person households, comprising 220.
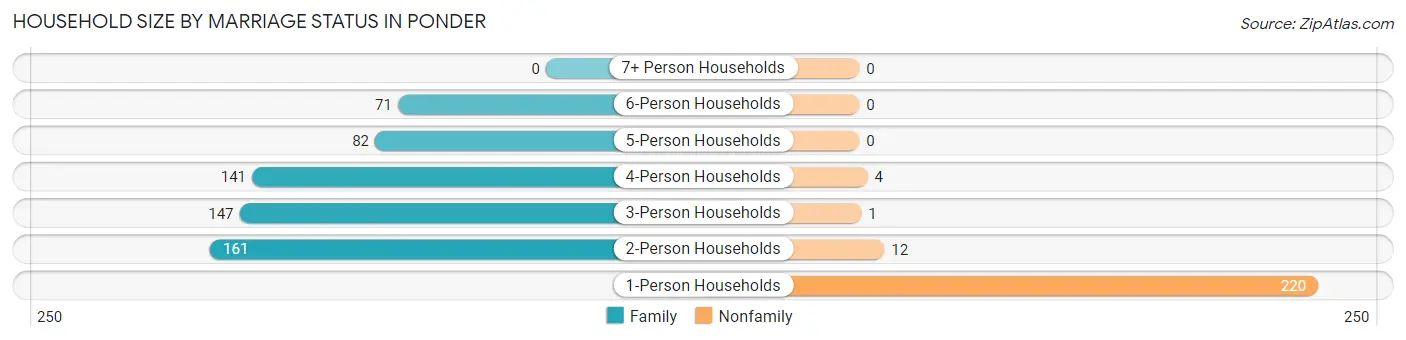
| Household Size | Family Households | Nonfamily Households |
| 1-Person Households | - | 220 (26.2%) |
| 2-Person Households | 161 (19.2%) | 12 (1.4%) |
| 3-Person Households | 147 (17.5%) | 1 (0.1%) |
| 4-Person Households | 141 (16.8%) | 4 (0.5%) |
| 5-Person Households | 82 (9.8%) | 0 (0.0%) |
| 6-Person Households | 71 (8.5%) | 0 (0.0%) |
| 7+ Person Households | 0 (0.0%) | 0 (0.0%) |
| Total | 602 (71.8%) | 237 (28.2%) |
Female Fertility in Ponder
Fertility by Age in Ponder
Average fertility rate in Ponder is 38.0 births per 1,000 women. Women in the age bracket of 35 to 50 years have the highest fertility rate with 87.0 births per 1,000 women. Women in the age bracket of 35 to 50 years acount for 75.0% of all women with births.
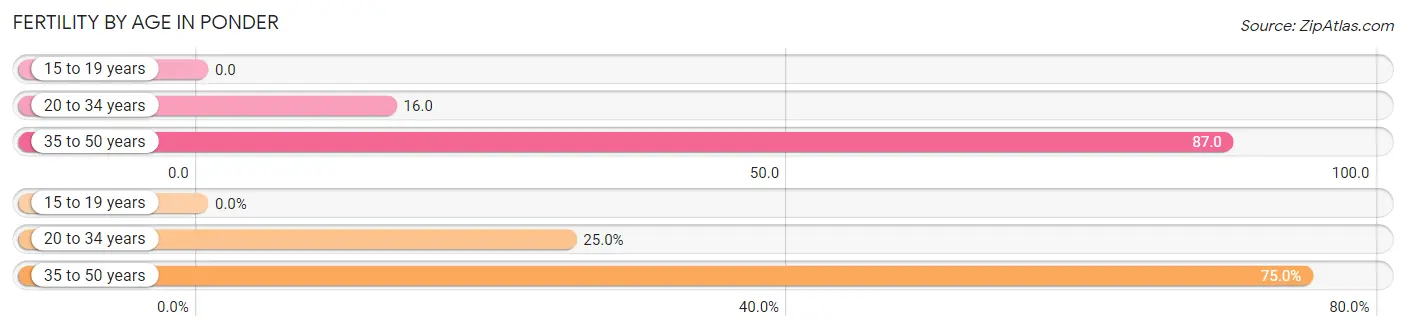
| Age Bracket | Women with Births | Births / 1,000 Women |
| 15 to 19 years | 0 (0.0%) | 0.0 |
| 20 to 34 years | 6 (25.0%) | 16.0 |
| 35 to 50 years | 18 (75.0%) | 87.0 |
| Total | 24 (100.0%) | 38.0 |
Fertility by Age by Marriage Status in Ponder
83.3% of women with births (24) in Ponder are married. The highest percentage of unmarried women with births falls into 35 to 50 years age bracket with 22.2% of them unmarried at the time of birth, while the lowest percentage of unmarried women with births belong to 20 to 34 years age bracket with 0.0% of them unmarried.
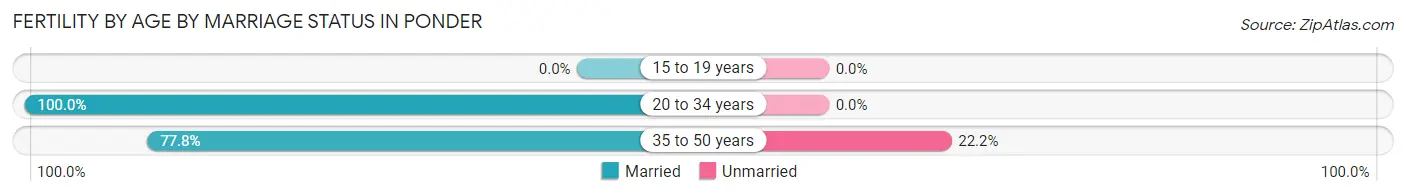
| Age Bracket | Married | Unmarried |
| 15 to 19 years | 0 (0.0%) | 0 (0.0%) |
| 20 to 34 years | 6 (100.0%) | 0 (0.0%) |
| 35 to 50 years | 14 (77.8%) | 4 (22.2%) |
| Total | 20 (83.3%) | 4 (16.7%) |
Fertility by Education in Ponder
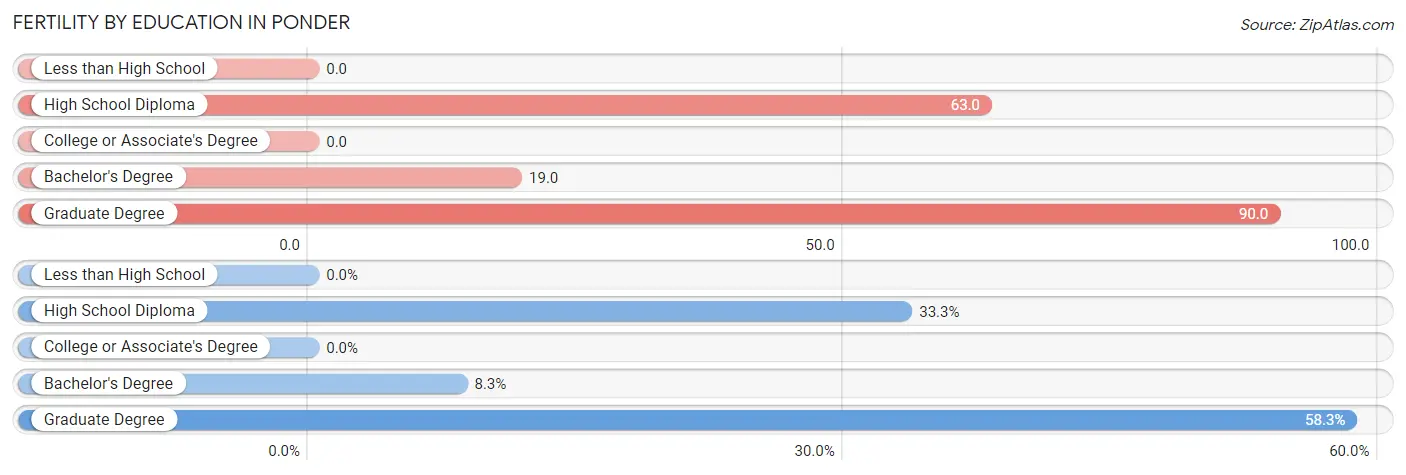
| Educational Attainment | Women with Births | Births / 1,000 Women |
| Less than High School | 0 (0.0%) | 0.0 |
| High School Diploma | 8 (33.3%) | 63.0 |
| College or Associate's Degree | 0 (0.0%) | 0.0 |
| Bachelor's Degree | 2 (8.3%) | 19.0 |
| Graduate Degree | 14 (58.3%) | 90.0 |
| Total | 24 (100.0%) | 38.0 |
Fertility by Education by Marriage Status in Ponder
16.7% of women with births in Ponder are unmarried. Women with the educational attainment of bachelor's degree are most likely to be married with 100.0% of them married at childbirth, while women with the educational attainment of high school diploma are least likely to be married with 50.0% of them unmarried at childbirth.
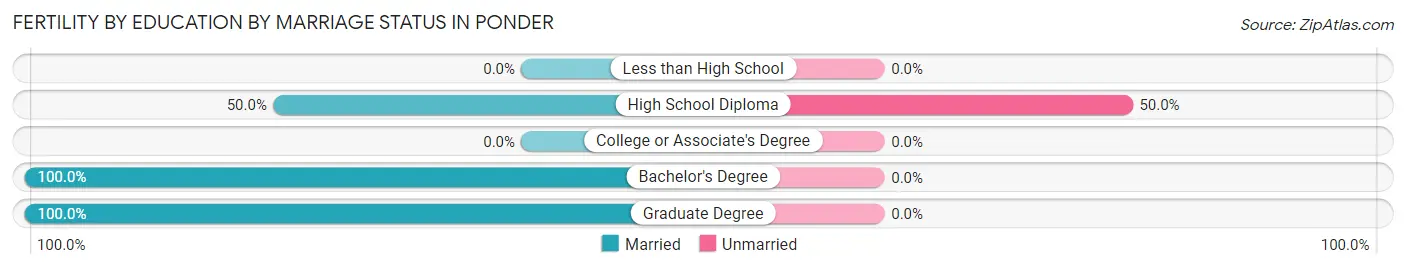
| Educational Attainment | Married | Unmarried |
| Less than High School | 0 (0.0%) | 0 (0.0%) |
| High School Diploma | 4 (50.0%) | 4 (50.0%) |
| College or Associate's Degree | 0 (0.0%) | 0 (0.0%) |
| Bachelor's Degree | 2 (100.0%) | 0 (0.0%) |
| Graduate Degree | 14 (100.0%) | 0 (0.0%) |
| Total | 20 (83.3%) | 4 (16.7%) |
Employment Characteristics in Ponder
Employment by Class of Employer in Ponder
Among the 1,205 employed individuals in Ponder, private company employees (956 | 79.3%), local government employees (88 | 7.3%), and not-for-profit organizations (75 | 6.2%) make up the most common classes of employment.
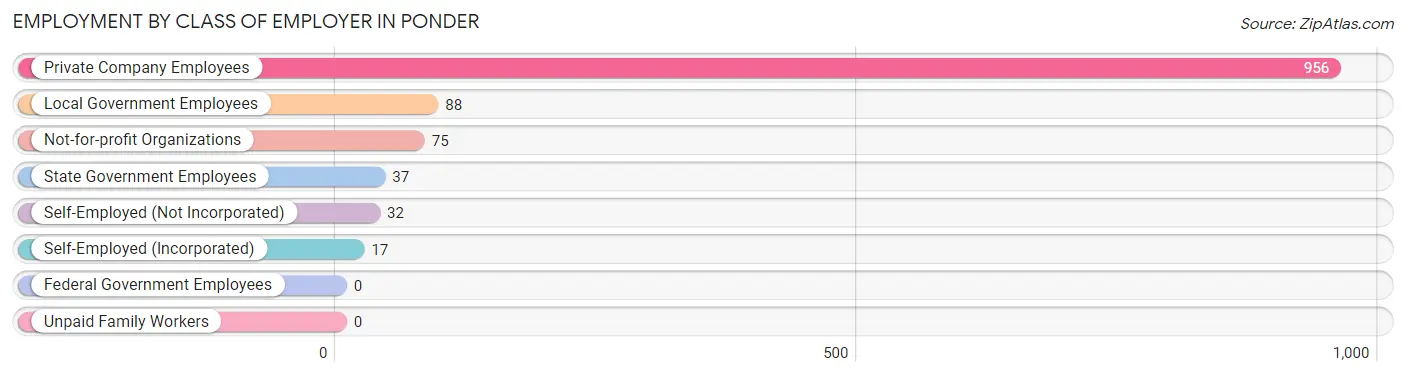
| Employer Class | # Employees | % Employees |
| Private Company Employees | 956 | 79.3% |
| Self-Employed (Incorporated) | 17 | 1.4% |
| Self-Employed (Not Incorporated) | 32 | 2.7% |
| Not-for-profit Organizations | 75 | 6.2% |
| Local Government Employees | 88 | 7.3% |
| State Government Employees | 37 | 3.1% |
| Federal Government Employees | 0 | 0.0% |
| Unpaid Family Workers | 0 | 0.0% |
| Total | 1,205 | 100.0% |
Employment Status by Age in Ponder
According to the labor force statistics for Ponder, out of the total population over 16 years of age (1,671), 76.8% or 1,283 individuals are in the labor force, with 4.4% or 56 of them unemployed. The age group with the highest labor force participation rate is 45 to 54 years, with 98.7% or 149 individuals in the labor force. Within the labor force, the 20 to 24 years age range has the highest percentage of unemployed individuals, with 26.5% or 9 of them being unemployed.
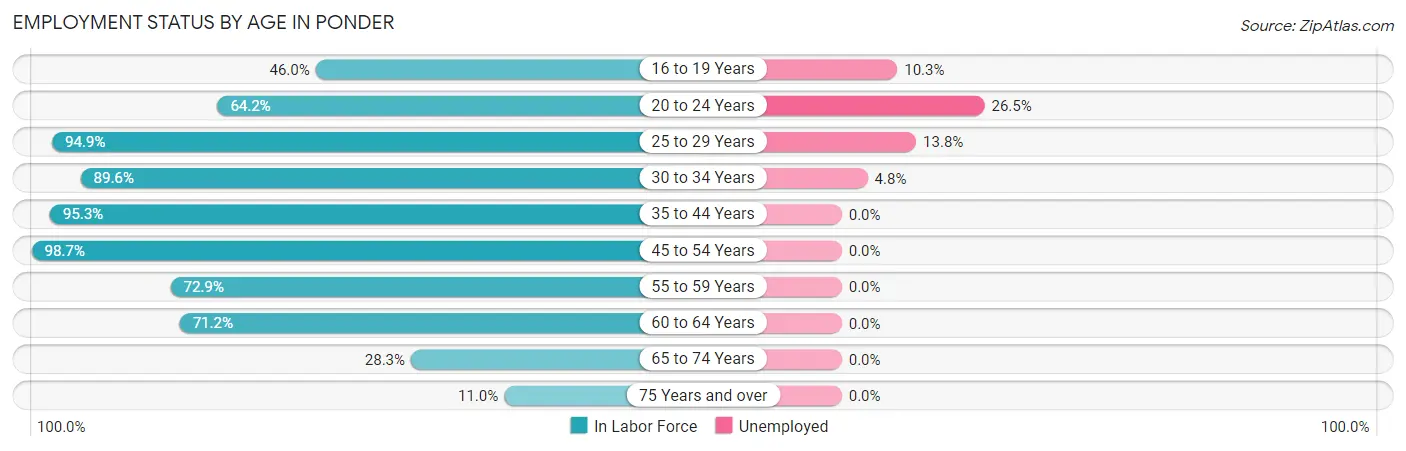
| Age Bracket | In Labor Force | Unemployed |
| 16 to 19 Years | 29 (46.0%) | 3 (10.3%) |
| 20 to 24 Years | 34 (64.2%) | 9 (26.5%) |
| 25 to 29 Years | 240 (94.9%) | 33 (13.8%) |
| 30 to 34 Years | 251 (89.6%) | 12 (4.8%) |
| 35 to 44 Years | 346 (95.3%) | 0 (0.0%) |
| 45 to 54 Years | 149 (98.7%) | 0 (0.0%) |
| 55 to 59 Years | 70 (72.9%) | 0 (0.0%) |
| 60 to 64 Years | 104 (71.2%) | 0 (0.0%) |
| 65 to 74 Years | 52 (28.3%) | 0 (0.0%) |
| 75 Years and over | 9 (11.0%) | 0 (0.0%) |
| Total | 1,283 (76.8%) | 56 (4.4%) |
Employment Status by Educational Attainment in Ponder
According to labor force statistics for Ponder, 90.0% of individuals (1,160) out of the total population between 25 and 64 years of age (1,289) are in the labor force, with 3.9% or 45 of them being unemployed. The group with the highest labor force participation rate are those with the educational attainment of bachelor's degree or higher, with 93.3% or 416 individuals in the labor force. Within the labor force, individuals with high school diploma education have the highest percentage of unemployment, with 11.0% or 30 of them being unemployed.
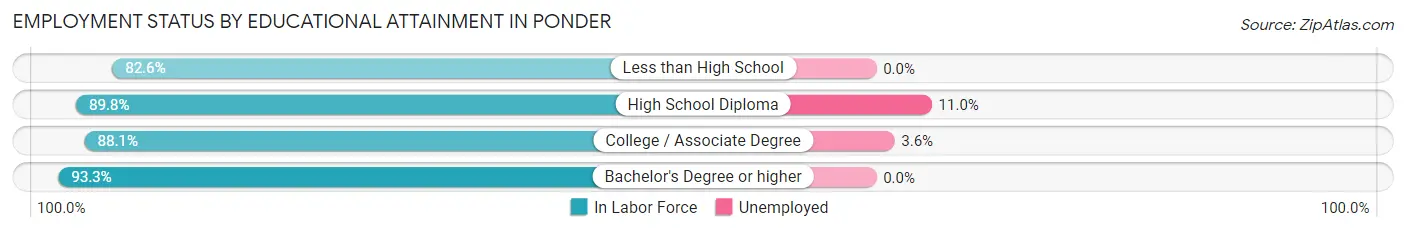
| Educational Attainment | In Labor Force | Unemployed |
| Less than High School | 57 (82.6%) | 0 (0.0%) |
| High School Diploma | 272 (89.8%) | 33 (11.0%) |
| College / Associate Degree | 415 (88.1%) | 17 (3.6%) |
| Bachelor's Degree or higher | 416 (93.3%) | 0 (0.0%) |
| Total | 1,160 (90.0%) | 50 (3.9%) |
Employment Occupations by Sex in Ponder
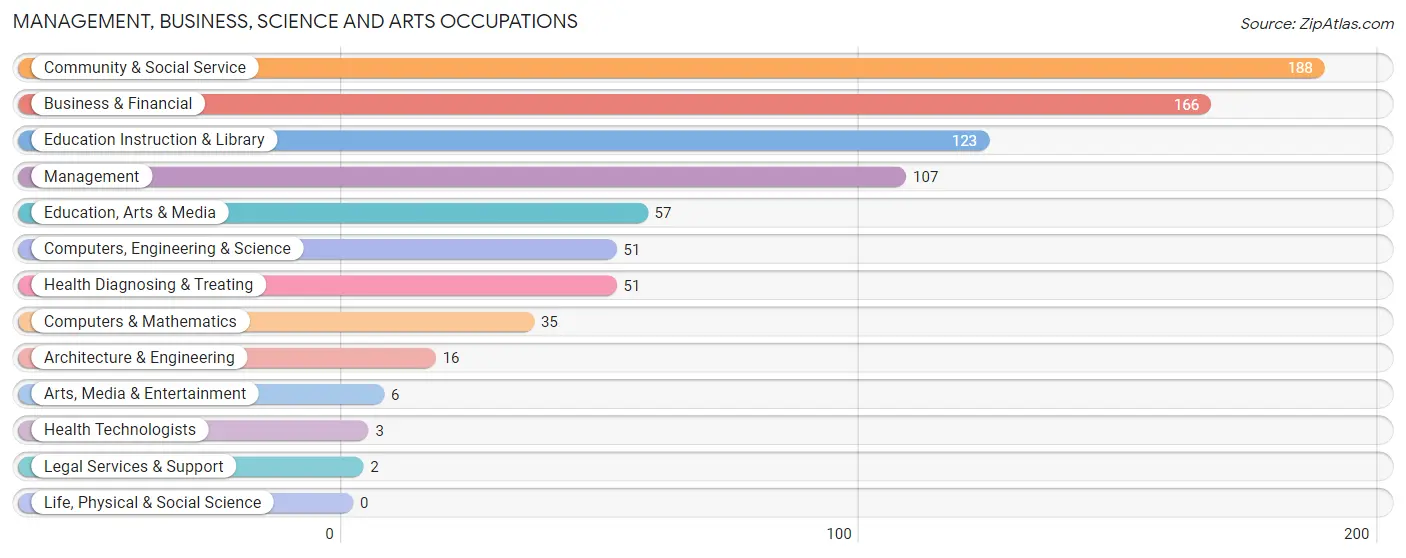
Management, Business, Science and Arts Occupations
The most common Management, Business, Science and Arts occupations in Ponder are Community & Social Service (188 | 15.3%), Business & Financial (166 | 13.5%), Education Instruction & Library (123 | 10.0%), Management (107 | 8.7%), and Education, Arts & Media (57 | 4.6%).
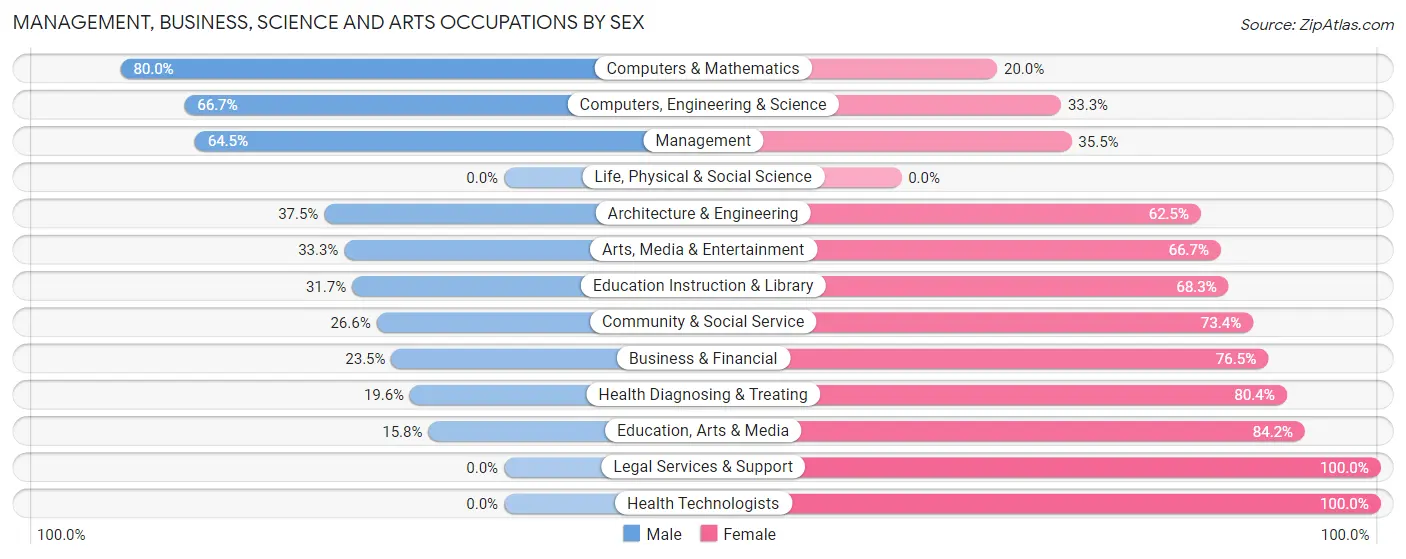
Management, Business, Science and Arts Occupations by Sex
Within the Management, Business, Science and Arts occupations in Ponder, the most male-oriented occupations are Computers & Mathematics (80.0%), Computers, Engineering & Science (66.7%), and Management (64.5%), while the most female-oriented occupations are Legal Services & Support (100.0%), Health Technologists (100.0%), and Education, Arts & Media (84.2%).
| Occupation | Male | Female |
| Management | 69 (64.5%) | 38 (35.5%) |
| Business & Financial | 39 (23.5%) | 127 (76.5%) |
| Computers, Engineering & Science | 34 (66.7%) | 17 (33.3%) |
| Computers & Mathematics | 28 (80.0%) | 7 (20.0%) |
| Architecture & Engineering | 6 (37.5%) | 10 (62.5%) |
| Life, Physical & Social Science | 0 (0.0%) | 0 (0.0%) |
| Community & Social Service | 50 (26.6%) | 138 (73.4%) |
| Education, Arts & Media | 9 (15.8%) | 48 (84.2%) |
| Legal Services & Support | 0 (0.0%) | 2 (100.0%) |
| Education Instruction & Library | 39 (31.7%) | 84 (68.3%) |
| Arts, Media & Entertainment | 2 (33.3%) | 4 (66.7%) |
| Health Diagnosing & Treating | 10 (19.6%) | 41 (80.4%) |
| Health Technologists | 0 (0.0%) | 3 (100.0%) |
| Total (Category) | 202 (35.9%) | 361 (64.1%) |
| Total (Overall) | 598 (48.7%) | 629 (51.3%) |
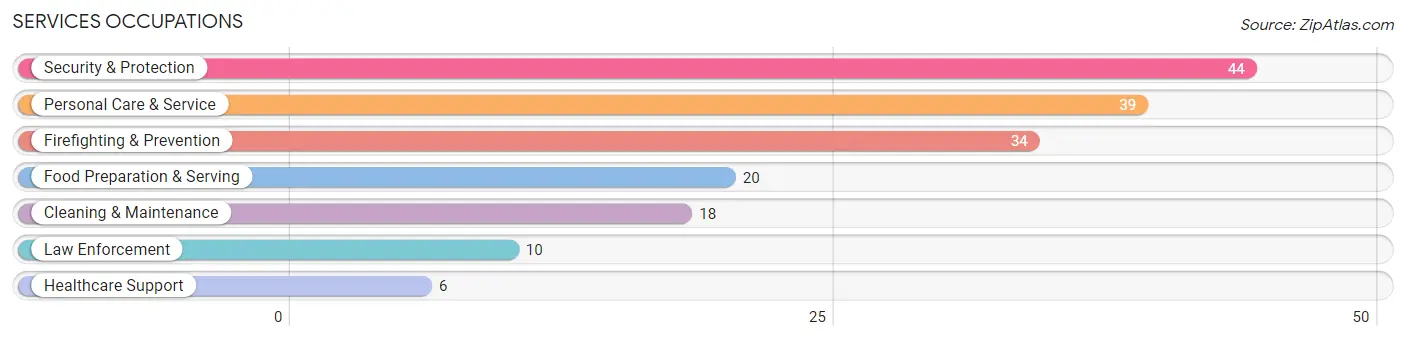
Services Occupations
The most common Services occupations in Ponder are Security & Protection (44 | 3.6%), Personal Care & Service (39 | 3.2%), Firefighting & Prevention (34 | 2.8%), Food Preparation & Serving (20 | 1.6%), and Cleaning & Maintenance (18 | 1.5%).
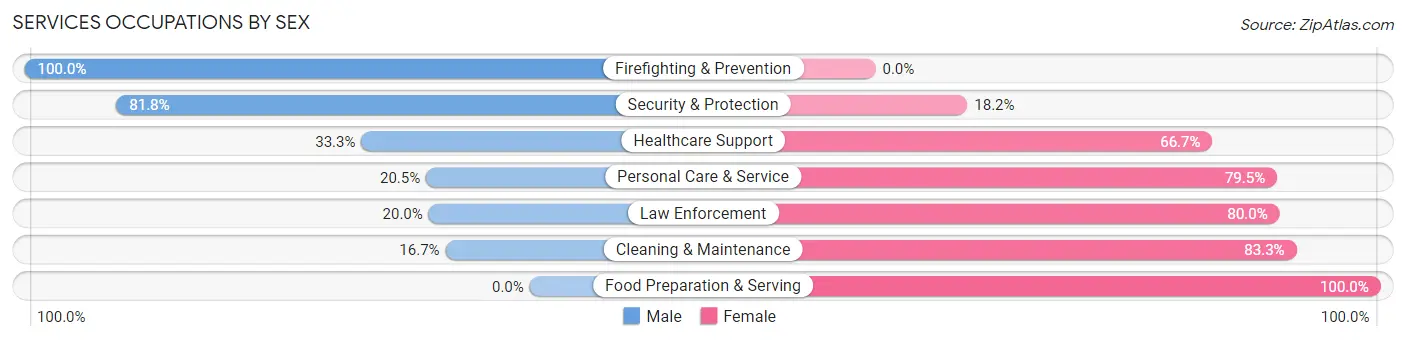
Services Occupations by Sex
Within the Services occupations in Ponder, the most male-oriented occupations are Firefighting & Prevention (100.0%), Security & Protection (81.8%), and Healthcare Support (33.3%), while the most female-oriented occupations are Food Preparation & Serving (100.0%), Cleaning & Maintenance (83.3%), and Law Enforcement (80.0%).
| Occupation | Male | Female |
| Healthcare Support | 2 (33.3%) | 4 (66.7%) |
| Security & Protection | 36 (81.8%) | 8 (18.2%) |
| Firefighting & Prevention | 34 (100.0%) | 0 (0.0%) |
| Law Enforcement | 2 (20.0%) | 8 (80.0%) |
| Food Preparation & Serving | 0 (0.0%) | 20 (100.0%) |
| Cleaning & Maintenance | 3 (16.7%) | 15 (83.3%) |
| Personal Care & Service | 8 (20.5%) | 31 (79.5%) |
| Total (Category) | 49 (38.6%) | 78 (61.4%) |
| Total (Overall) | 598 (48.7%) | 629 (51.3%) |
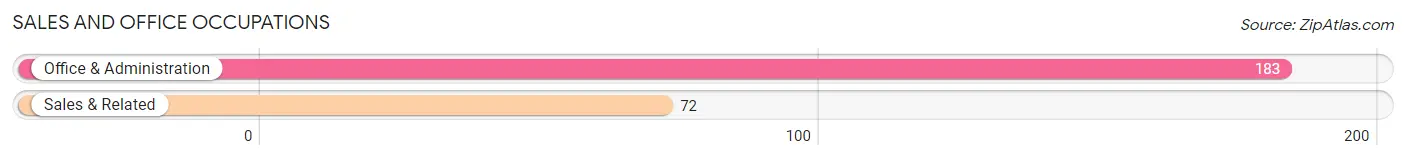
Sales and Office Occupations
The most common Sales and Office occupations in Ponder are Office & Administration (183 | 14.9%), and Sales & Related (72 | 5.9%).
Sales and Office Occupations by Sex
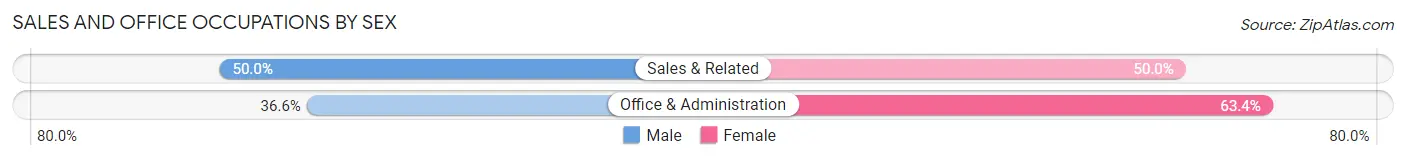
| Occupation | Male | Female |
| Sales & Related | 36 (50.0%) | 36 (50.0%) |
| Office & Administration | 67 (36.6%) | 116 (63.4%) |
| Total (Category) | 103 (40.4%) | 152 (59.6%) |
| Total (Overall) | 598 (48.7%) | 629 (51.3%) |
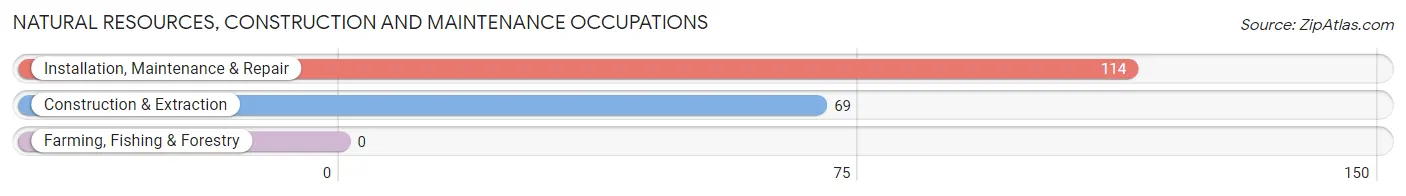
Natural Resources, Construction and Maintenance Occupations
The most common Natural Resources, Construction and Maintenance occupations in Ponder are Installation, Maintenance & Repair (114 | 9.3%), and Construction & Extraction (69 | 5.6%).
Natural Resources, Construction and Maintenance Occupations by Sex
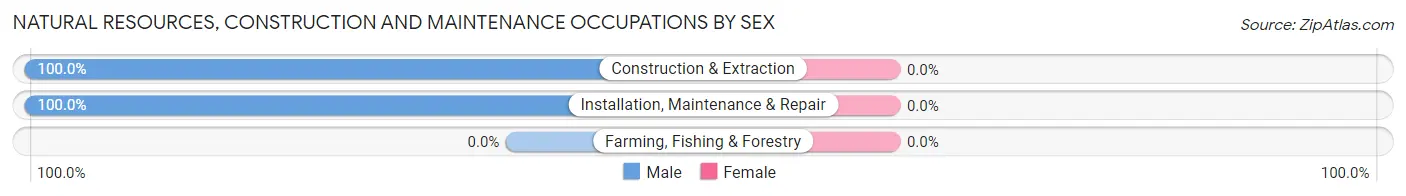
| Occupation | Male | Female |
| Farming, Fishing & Forestry | 0 (0.0%) | 0 (0.0%) |
| Construction & Extraction | 69 (100.0%) | 0 (0.0%) |
| Installation, Maintenance & Repair | 114 (100.0%) | 0 (0.0%) |
| Total (Category) | 183 (100.0%) | 0 (0.0%) |
| Total (Overall) | 598 (48.7%) | 629 (51.3%) |
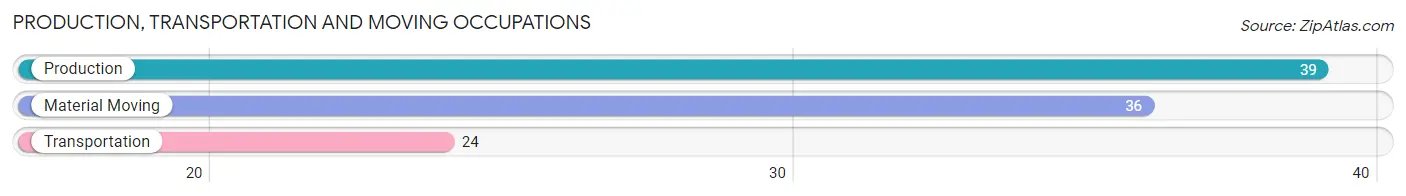
Production, Transportation and Moving Occupations
The most common Production, Transportation and Moving occupations in Ponder are Production (39 | 3.2%), Material Moving (36 | 2.9%), and Transportation (24 | 2.0%).
Production, Transportation and Moving Occupations by Sex
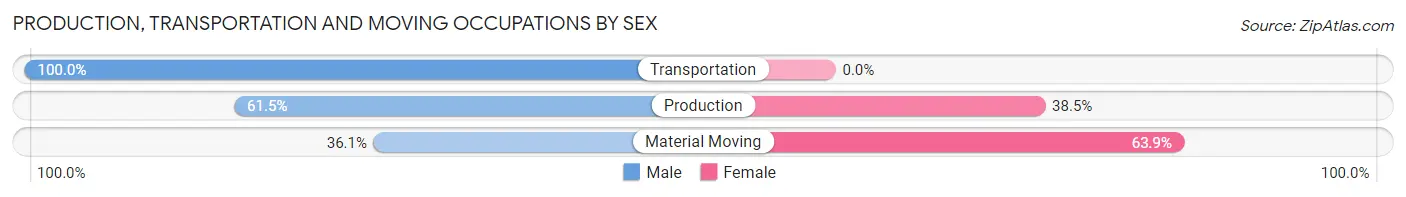
| Occupation | Male | Female |
| Production | 24 (61.5%) | 15 (38.5%) |
| Transportation | 24 (100.0%) | 0 (0.0%) |
| Material Moving | 13 (36.1%) | 23 (63.9%) |
| Total (Category) | 61 (61.6%) | 38 (38.4%) |
| Total (Overall) | 598 (48.7%) | 629 (51.3%) |
Employment Industries by Sex in Ponder
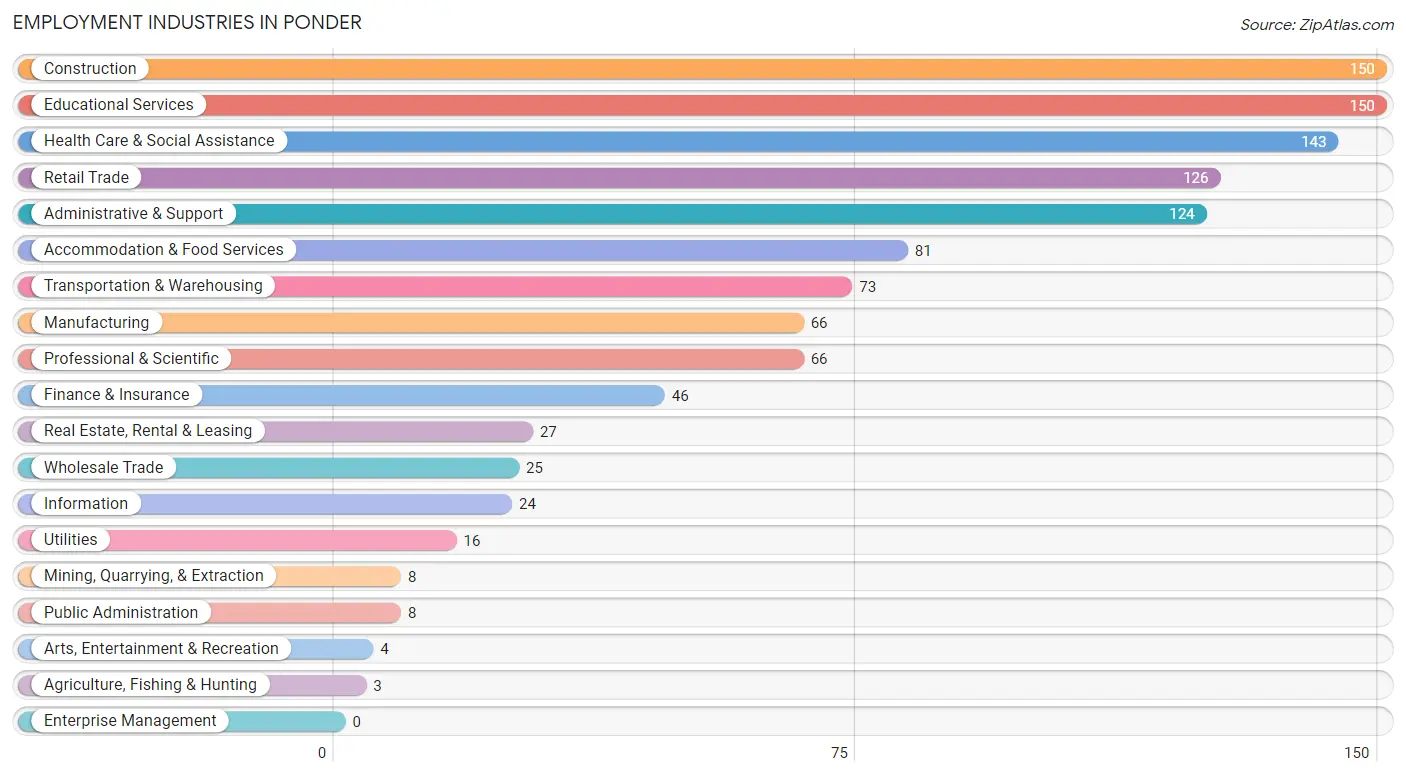
Employment Industries in Ponder
The major employment industries in Ponder include Construction (150 | 12.2%), Educational Services (150 | 12.2%), Health Care & Social Assistance (143 | 11.7%), Retail Trade (126 | 10.3%), and Administrative & Support (124 | 10.1%).
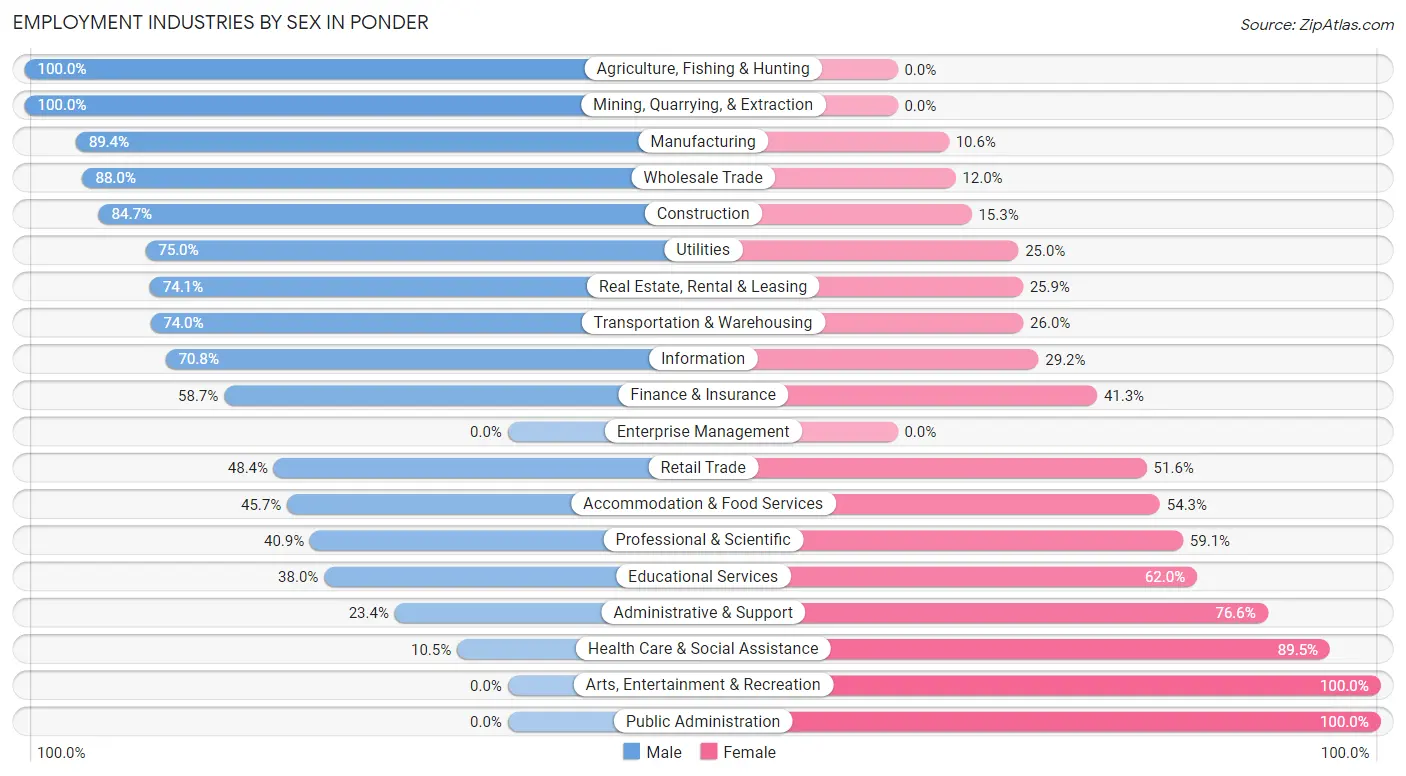
Employment Industries by Sex in Ponder
The Ponder industries that see more men than women are Agriculture, Fishing & Hunting (100.0%), Mining, Quarrying, & Extraction (100.0%), and Manufacturing (89.4%), whereas the industries that tend to have a higher number of women are Arts, Entertainment & Recreation (100.0%), Public Administration (100.0%), and Health Care & Social Assistance (89.5%).
| Industry | Male | Female |
| Agriculture, Fishing & Hunting | 3 (100.0%) | 0 (0.0%) |
| Mining, Quarrying, & Extraction | 8 (100.0%) | 0 (0.0%) |
| Construction | 127 (84.7%) | 23 (15.3%) |
| Manufacturing | 59 (89.4%) | 7 (10.6%) |
| Wholesale Trade | 22 (88.0%) | 3 (12.0%) |
| Retail Trade | 61 (48.4%) | 65 (51.6%) |
| Transportation & Warehousing | 54 (74.0%) | 19 (26.0%) |
| Utilities | 12 (75.0%) | 4 (25.0%) |
| Information | 17 (70.8%) | 7 (29.2%) |
| Finance & Insurance | 27 (58.7%) | 19 (41.3%) |
| Real Estate, Rental & Leasing | 20 (74.1%) | 7 (25.9%) |
| Professional & Scientific | 27 (40.9%) | 39 (59.1%) |
| Enterprise Management | 0 (0.0%) | 0 (0.0%) |
| Administrative & Support | 29 (23.4%) | 95 (76.6%) |
| Educational Services | 57 (38.0%) | 93 (62.0%) |
| Health Care & Social Assistance | 15 (10.5%) | 128 (89.5%) |
| Arts, Entertainment & Recreation | 0 (0.0%) | 4 (100.0%) |
| Accommodation & Food Services | 37 (45.7%) | 44 (54.3%) |
| Public Administration | 0 (0.0%) | 8 (100.0%) |
| Total | 598 (48.7%) | 629 (51.3%) |
Education in Ponder
School Enrollment in Ponder
The most common levels of schooling among the 777 students in Ponder are middle school (261 | 33.6%), elementary school (175 | 22.5%), and high school (104 | 13.4%).
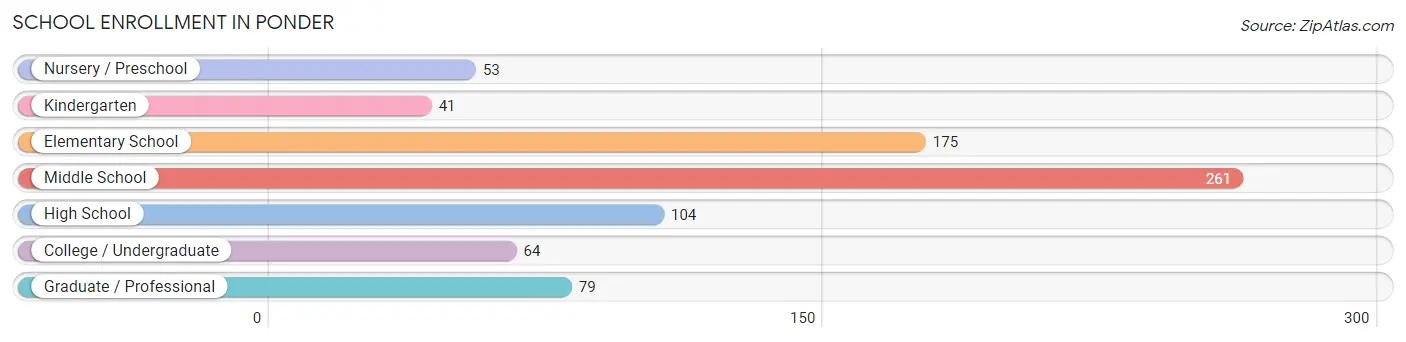
| School Level | # Students | % Students |
| Nursery / Preschool | 53 | 6.8% |
| Kindergarten | 41 | 5.3% |
| Elementary School | 175 | 22.5% |
| Middle School | 261 | 33.6% |
| High School | 104 | 13.4% |
| College / Undergraduate | 64 | 8.2% |
| Graduate / Professional | 79 | 10.2% |
| Total | 777 | 100.0% |
School Enrollment by Age by Funding Source in Ponder
Out of a total of 777 students who are enrolled in schools in Ponder, 244 (31.4%) attend a private institution, while the remaining 533 (68.6%) are enrolled in public schools. The age group of 25 to 34 year olds has the highest likelihood of being enrolled in private schools, with 100 (84.0% in the age bracket) enrolled. Conversely, the age group of 18 to 19 year olds has the lowest likelihood of being enrolled in a private school, with 5 (100.0% in the age bracket) attending a public institution.
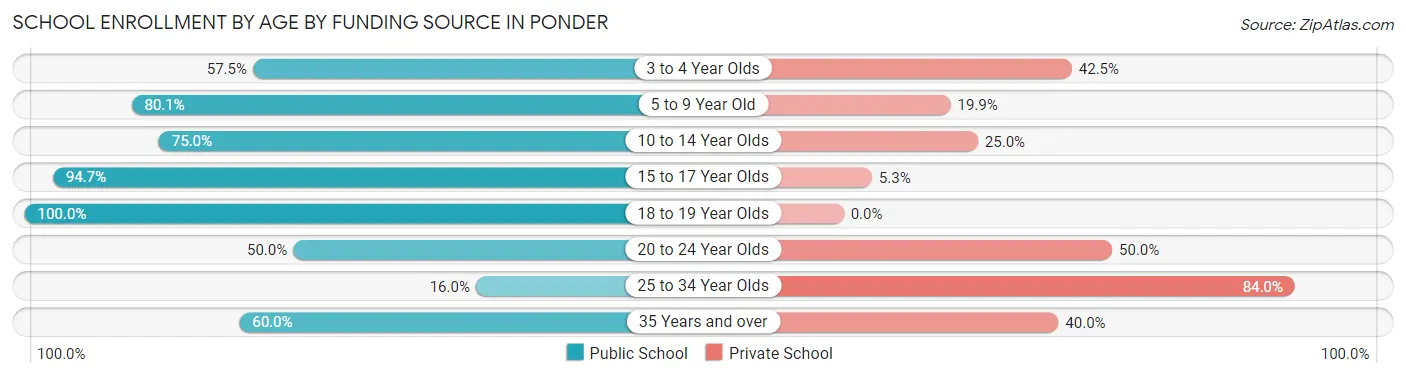
| Age Bracket | Public School | Private School |
| 3 to 4 Year Olds | 23 (57.5%) | 17 (42.5%) |
| 5 to 9 Year Old | 169 (80.1%) | 42 (19.9%) |
| 10 to 14 Year Olds | 216 (75.0%) | 72 (25.0%) |
| 15 to 17 Year Olds | 90 (94.7%) | 5 (5.3%) |
| 18 to 19 Year Olds | 5 (100.0%) | 0 (0.0%) |
| 20 to 24 Year Olds | 2 (50.0%) | 2 (50.0%) |
| 25 to 34 Year Olds | 19 (16.0%) | 100 (84.0%) |
| 35 Years and over | 9 (60.0%) | 6 (40.0%) |
| Total | 533 (68.6%) | 244 (31.4%) |
Educational Attainment by Field of Study in Ponder
Education (137 | 27.7%), business (116 | 23.5%), computers & mathematics (112 | 22.7%), arts & humanities (33 | 6.7%), and psychology (25 | 5.1%) are the most common fields of study among 494 individuals in Ponder who have obtained a bachelor's degree or higher.
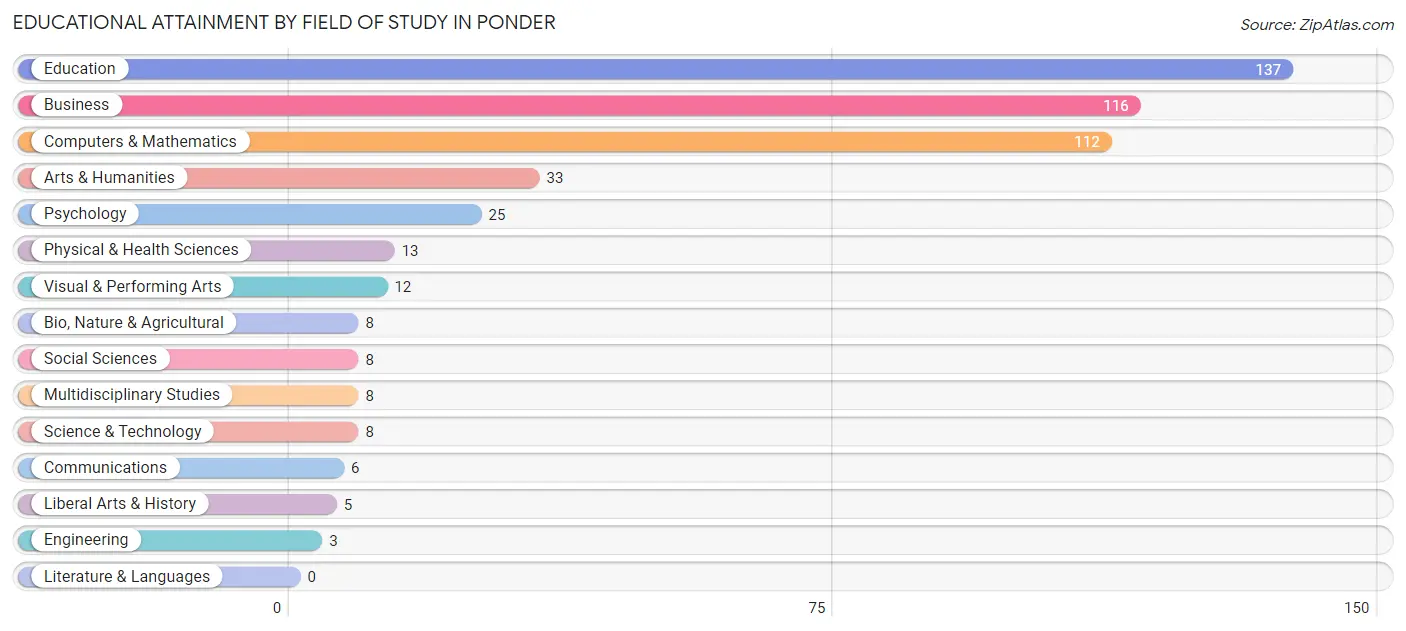
| Field of Study | # Graduates | % Graduates |
| Computers & Mathematics | 112 | 22.7% |
| Bio, Nature & Agricultural | 8 | 1.6% |
| Physical & Health Sciences | 13 | 2.6% |
| Psychology | 25 | 5.1% |
| Social Sciences | 8 | 1.6% |
| Engineering | 3 | 0.6% |
| Multidisciplinary Studies | 8 | 1.6% |
| Science & Technology | 8 | 1.6% |
| Business | 116 | 23.5% |
| Education | 137 | 27.7% |
| Literature & Languages | 0 | 0.0% |
| Liberal Arts & History | 5 | 1.0% |
| Visual & Performing Arts | 12 | 2.4% |
| Communications | 6 | 1.2% |
| Arts & Humanities | 33 | 6.7% |
| Total | 494 | 100.0% |
Transportation & Commute in Ponder
Vehicle Availability by Sex in Ponder
The most prevalent vehicle ownership categories in Ponder are males with 2 vehicles (333, accounting for 57.0%) and females with 2 vehicles (258, making up 53.6%).
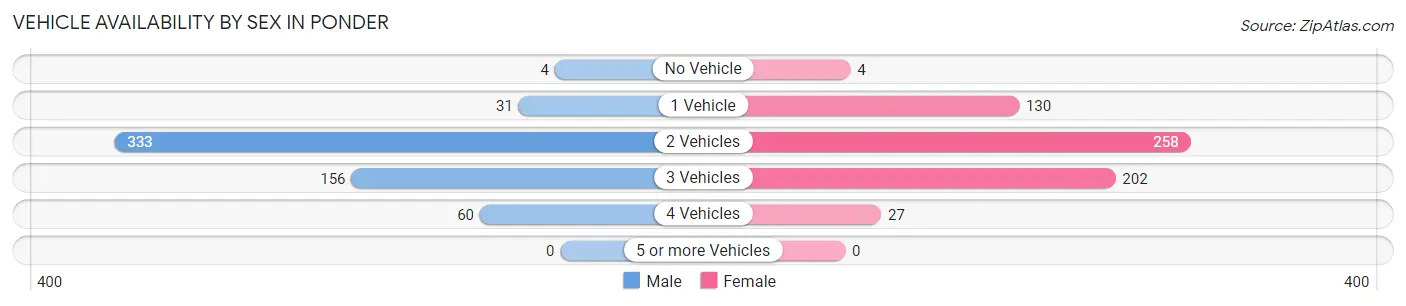
| Vehicles Available | Male | Female |
| No Vehicle | 4 (0.7%) | 4 (0.6%) |
| 1 Vehicle | 31 (5.3%) | 130 (20.9%) |
| 2 Vehicles | 333 (57.0%) | 258 (41.5%) |
| 3 Vehicles | 156 (26.7%) | 202 (32.5%) |
| 4 Vehicles | 60 (10.3%) | 27 (4.3%) |
| 5 or more Vehicles | 0 (0.0%) | 0 (0.0%) |
| Total | 584 (100.0%) | 621 (100.0%) |
Commute Time in Ponder
The most frequently occuring commute durations in Ponder are 30 to 34 minutes (254 commuters, 23.2%), 45 to 59 minutes (152 commuters, 13.9%), and 20 to 24 minutes (150 commuters, 13.7%).
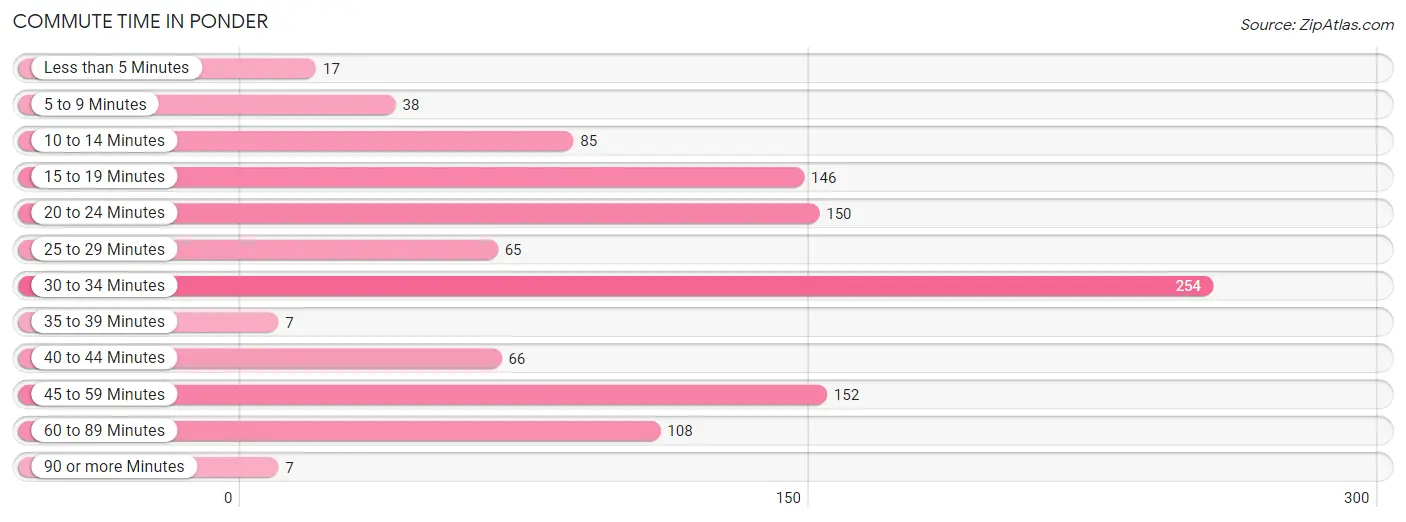
| Commute Time | # Commuters | % Commuters |
| Less than 5 Minutes | 17 | 1.5% |
| 5 to 9 Minutes | 38 | 3.5% |
| 10 to 14 Minutes | 85 | 7.8% |
| 15 to 19 Minutes | 146 | 13.3% |
| 20 to 24 Minutes | 150 | 13.7% |
| 25 to 29 Minutes | 65 | 5.9% |
| 30 to 34 Minutes | 254 | 23.2% |
| 35 to 39 Minutes | 7 | 0.6% |
| 40 to 44 Minutes | 66 | 6.0% |
| 45 to 59 Minutes | 152 | 13.9% |
| 60 to 89 Minutes | 108 | 9.9% |
| 90 or more Minutes | 7 | 0.6% |
Commute Time by Sex in Ponder
The most common commute times in Ponder are 45 to 59 minutes (136 commuters, 26.8%) for males and 30 to 34 minutes (148 commuters, 25.2%) for females.
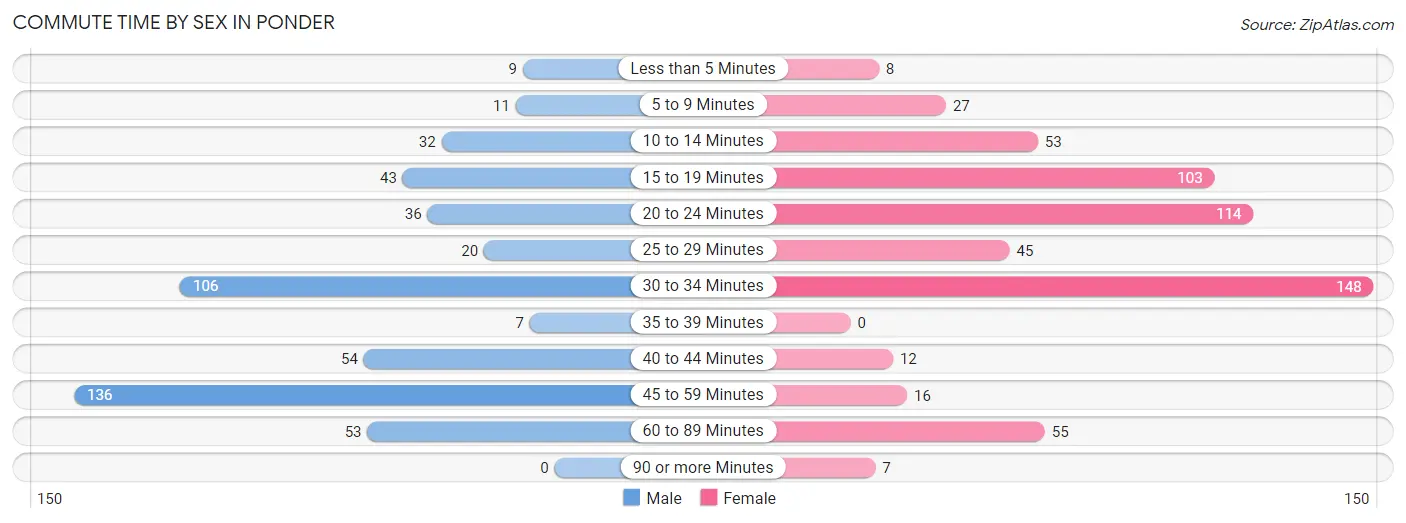
| Commute Time | Male | Female |
| Less than 5 Minutes | 9 (1.8%) | 8 (1.4%) |
| 5 to 9 Minutes | 11 (2.2%) | 27 (4.6%) |
| 10 to 14 Minutes | 32 (6.3%) | 53 (9.0%) |
| 15 to 19 Minutes | 43 (8.5%) | 103 (17.5%) |
| 20 to 24 Minutes | 36 (7.1%) | 114 (19.4%) |
| 25 to 29 Minutes | 20 (3.9%) | 45 (7.6%) |
| 30 to 34 Minutes | 106 (20.9%) | 148 (25.2%) |
| 35 to 39 Minutes | 7 (1.4%) | 0 (0.0%) |
| 40 to 44 Minutes | 54 (10.6%) | 12 (2.0%) |
| 45 to 59 Minutes | 136 (26.8%) | 16 (2.7%) |
| 60 to 89 Minutes | 53 (10.4%) | 55 (9.3%) |
| 90 or more Minutes | 0 (0.0%) | 7 (1.2%) |
Time of Departure to Work by Sex in Ponder
The most frequent times of departure to work in Ponder are 6:00 AM to 6:29 AM (96, 18.9%) for males and 8:00 AM to 8:29 AM (132, 22.5%) for females.
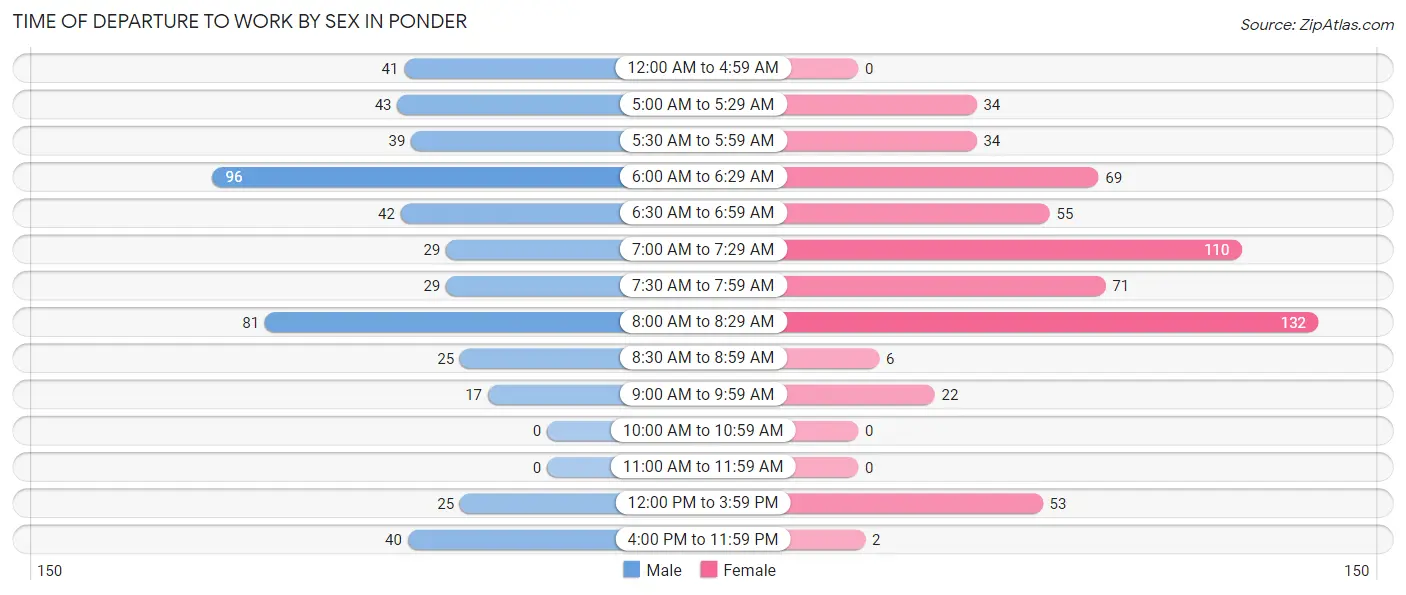
| Time of Departure | Male | Female |
| 12:00 AM to 4:59 AM | 41 (8.1%) | 0 (0.0%) |
| 5:00 AM to 5:29 AM | 43 (8.5%) | 34 (5.8%) |
| 5:30 AM to 5:59 AM | 39 (7.7%) | 34 (5.8%) |
| 6:00 AM to 6:29 AM | 96 (18.9%) | 69 (11.7%) |
| 6:30 AM to 6:59 AM | 42 (8.3%) | 55 (9.3%) |
| 7:00 AM to 7:29 AM | 29 (5.7%) | 110 (18.7%) |
| 7:30 AM to 7:59 AM | 29 (5.7%) | 71 (12.1%) |
| 8:00 AM to 8:29 AM | 81 (16.0%) | 132 (22.5%) |
| 8:30 AM to 8:59 AM | 25 (4.9%) | 6 (1.0%) |
| 9:00 AM to 9:59 AM | 17 (3.4%) | 22 (3.7%) |
| 10:00 AM to 10:59 AM | 0 (0.0%) | 0 (0.0%) |
| 11:00 AM to 11:59 AM | 0 (0.0%) | 0 (0.0%) |
| 12:00 PM to 3:59 PM | 25 (4.9%) | 53 (9.0%) |
| 4:00 PM to 11:59 PM | 40 (7.9%) | 2 (0.3%) |
| Total | 507 (100.0%) | 588 (100.0%) |
Housing Occupancy in Ponder
Occupancy by Ownership in Ponder
Of the total 839 dwellings in Ponder, owner-occupied units account for 735 (87.6%), while renter-occupied units make up 104 (12.4%).
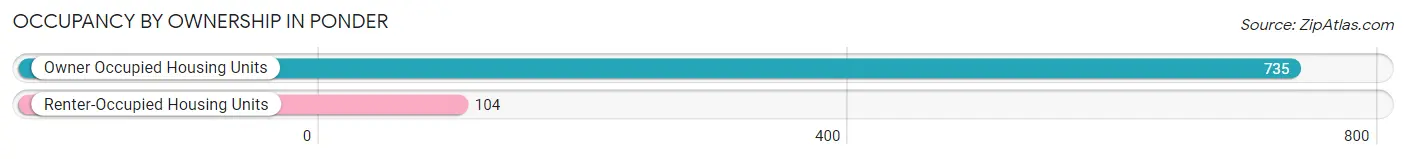
| Occupancy | # Housing Units | % Housing Units |
| Owner Occupied Housing Units | 735 | 87.6% |
| Renter-Occupied Housing Units | 104 | 12.4% |
| Total Occupied Housing Units | 839 | 100.0% |
Occupancy by Household Size in Ponder
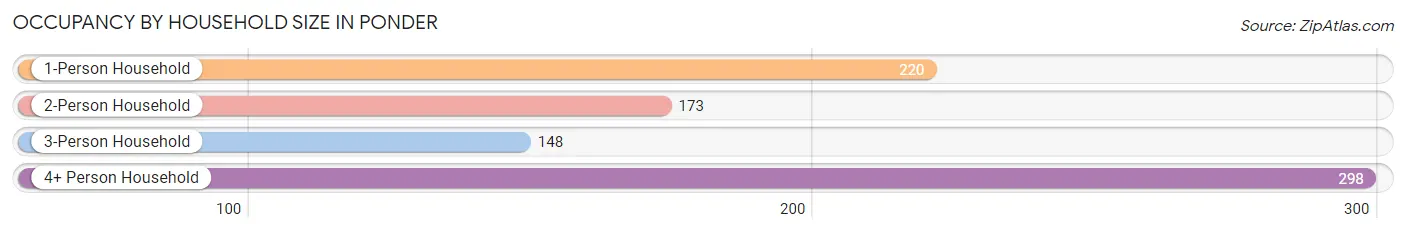
| Household Size | # Housing Units | % Housing Units |
| 1-Person Household | 220 | 26.2% |
| 2-Person Household | 173 | 20.6% |
| 3-Person Household | 148 | 17.6% |
| 4+ Person Household | 298 | 35.5% |
| Total Housing Units | 839 | 100.0% |
Occupancy by Ownership by Household Size in Ponder
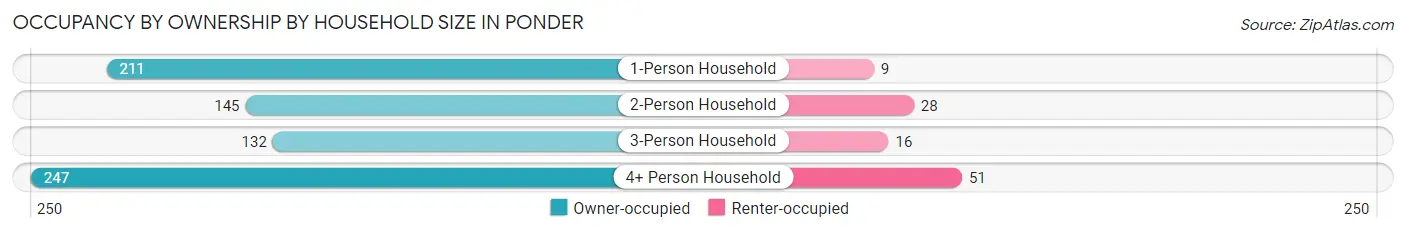
| Household Size | Owner-occupied | Renter-occupied |
| 1-Person Household | 211 (95.9%) | 9 (4.1%) |
| 2-Person Household | 145 (83.8%) | 28 (16.2%) |
| 3-Person Household | 132 (89.2%) | 16 (10.8%) |
| 4+ Person Household | 247 (82.9%) | 51 (17.1%) |
| Total Housing Units | 735 (87.6%) | 104 (12.4%) |
Occupancy by Educational Attainment in Ponder
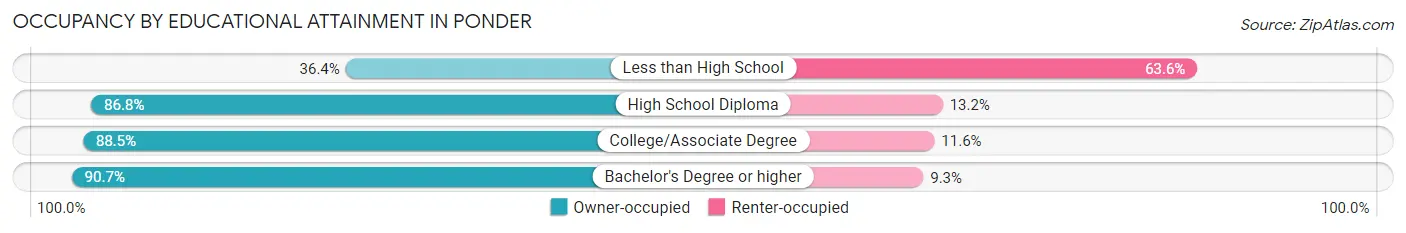
| Household Size | Owner-occupied | Renter-occupied |
| Less than High School | 8 (36.4%) | 14 (63.6%) |
| High School Diploma | 158 (86.8%) | 24 (13.2%) |
| College/Associate Degree | 268 (88.4%) | 35 (11.6%) |
| Bachelor's Degree or higher | 301 (90.7%) | 31 (9.3%) |
Occupancy by Age of Householder in Ponder
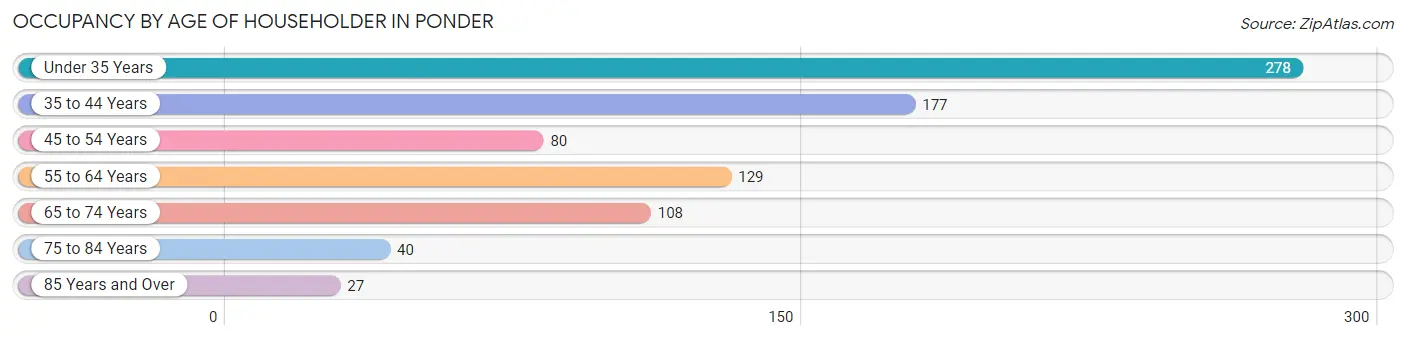
| Age Bracket | # Households | % Households |
| Under 35 Years | 278 | 33.1% |
| 35 to 44 Years | 177 | 21.1% |
| 45 to 54 Years | 80 | 9.5% |
| 55 to 64 Years | 129 | 15.4% |
| 65 to 74 Years | 108 | 12.9% |
| 75 to 84 Years | 40 | 4.8% |
| 85 Years and Over | 27 | 3.2% |
| Total | 839 | 100.0% |
Housing Finances in Ponder
Median Income by Occupancy in Ponder
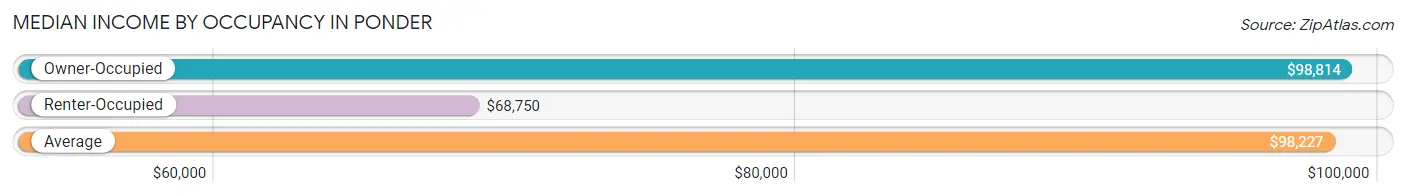
| Occupancy Type | # Households | Median Income |
| Owner-Occupied | 735 (87.6%) | $98,814 |
| Renter-Occupied | 104 (12.4%) | $68,750 |
| Average | 839 (100.0%) | $98,227 |
Occupancy by Householder Income Bracket in Ponder
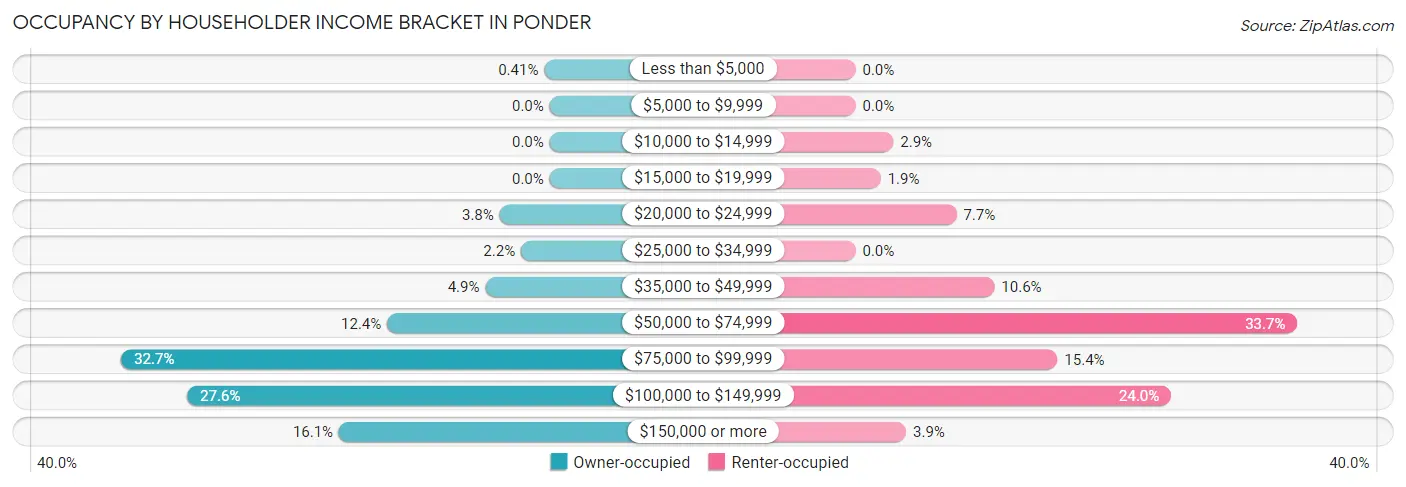
| Income Bracket | Owner-occupied | Renter-occupied |
| Less than $5,000 | 3 (0.4%) | 0 (0.0%) |
| $5,000 to $9,999 | 0 (0.0%) | 0 (0.0%) |
| $10,000 to $14,999 | 0 (0.0%) | 3 (2.9%) |
| $15,000 to $19,999 | 0 (0.0%) | 2 (1.9%) |
| $20,000 to $24,999 | 28 (3.8%) | 8 (7.7%) |
| $25,000 to $34,999 | 16 (2.2%) | 0 (0.0%) |
| $35,000 to $49,999 | 36 (4.9%) | 11 (10.6%) |
| $50,000 to $74,999 | 91 (12.4%) | 35 (33.7%) |
| $75,000 to $99,999 | 240 (32.7%) | 16 (15.4%) |
| $100,000 to $149,999 | 203 (27.6%) | 25 (24.0%) |
| $150,000 or more | 118 (16.1%) | 4 (3.8%) |
| Total | 735 (100.0%) | 104 (100.0%) |
Monthly Housing Cost Tiers in Ponder
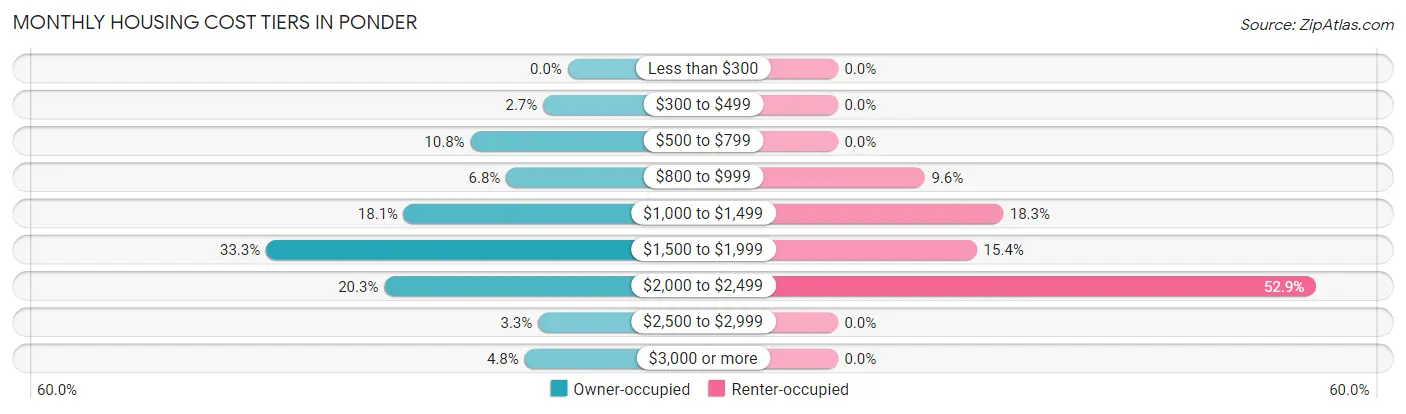
| Monthly Cost | Owner-occupied | Renter-occupied |
| Less than $300 | 0 (0.0%) | 0 (0.0%) |
| $300 to $499 | 20 (2.7%) | 0 (0.0%) |
| $500 to $799 | 79 (10.7%) | 0 (0.0%) |
| $800 to $999 | 50 (6.8%) | 10 (9.6%) |
| $1,000 to $1,499 | 133 (18.1%) | 19 (18.3%) |
| $1,500 to $1,999 | 245 (33.3%) | 16 (15.4%) |
| $2,000 to $2,499 | 149 (20.3%) | 55 (52.9%) |
| $2,500 to $2,999 | 24 (3.3%) | 0 (0.0%) |
| $3,000 or more | 35 (4.8%) | 0 (0.0%) |
| Total | 735 (100.0%) | 104 (100.0%) |
Physical Housing Characteristics in Ponder
Housing Structures in Ponder
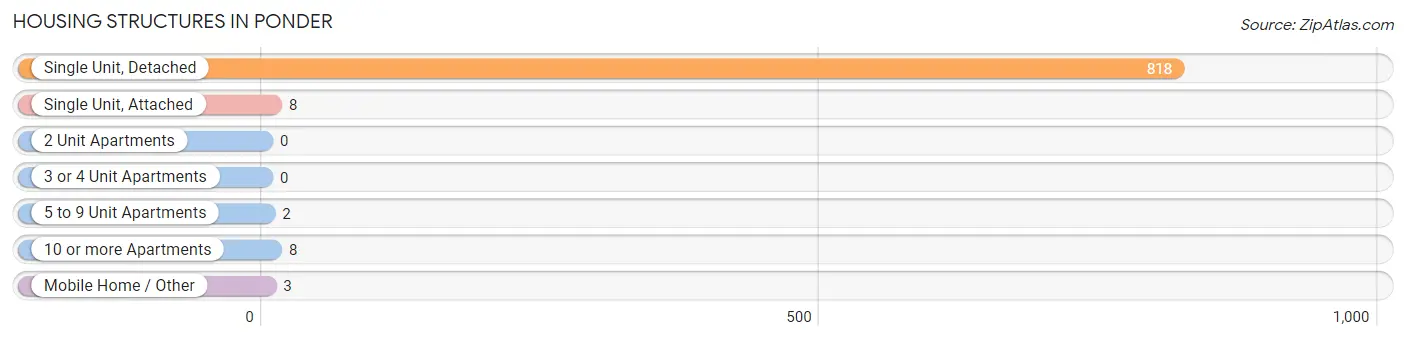
| Structure Type | # Housing Units | % Housing Units |
| Single Unit, Detached | 818 | 97.5% |
| Single Unit, Attached | 8 | 0.9% |
| 2 Unit Apartments | 0 | 0.0% |
| 3 or 4 Unit Apartments | 0 | 0.0% |
| 5 to 9 Unit Apartments | 2 | 0.2% |
| 10 or more Apartments | 8 | 0.9% |
| Mobile Home / Other | 3 | 0.4% |
| Total | 839 | 100.0% |
Housing Structures by Occupancy in Ponder
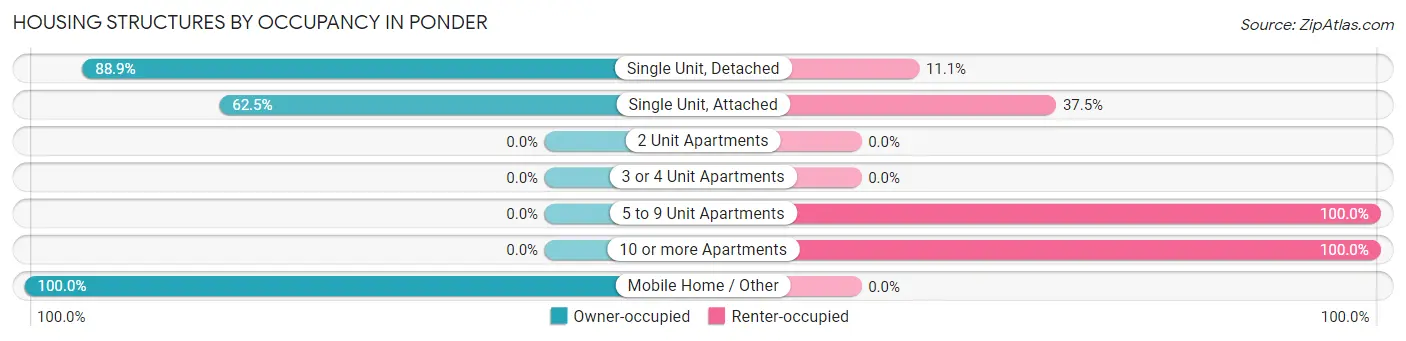
| Structure Type | Owner-occupied | Renter-occupied |
| Single Unit, Detached | 727 (88.9%) | 91 (11.1%) |
| Single Unit, Attached | 5 (62.5%) | 3 (37.5%) |
| 2 Unit Apartments | 0 (0.0%) | 0 (0.0%) |
| 3 or 4 Unit Apartments | 0 (0.0%) | 0 (0.0%) |
| 5 to 9 Unit Apartments | 0 (0.0%) | 2 (100.0%) |
| 10 or more Apartments | 0 (0.0%) | 8 (100.0%) |
| Mobile Home / Other | 3 (100.0%) | 0 (0.0%) |
| Total | 735 (87.6%) | 104 (12.4%) |
Housing Structures by Number of Rooms in Ponder
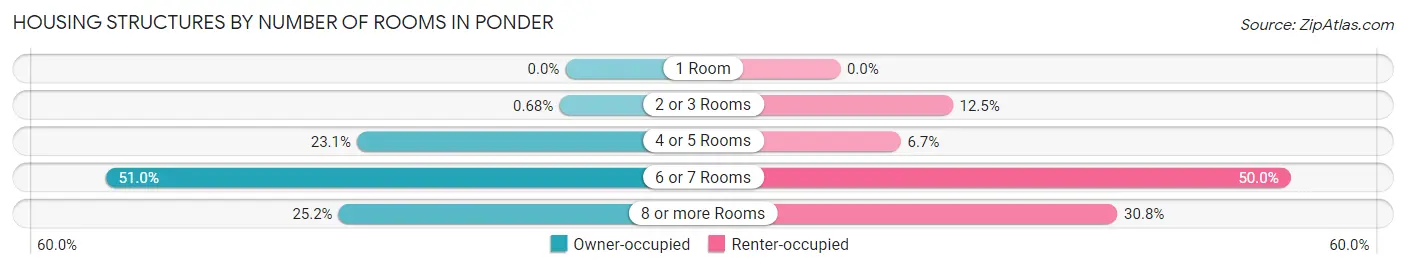
| Number of Rooms | Owner-occupied | Renter-occupied |
| 1 Room | 0 (0.0%) | 0 (0.0%) |
| 2 or 3 Rooms | 5 (0.7%) | 13 (12.5%) |
| 4 or 5 Rooms | 170 (23.1%) | 7 (6.7%) |
| 6 or 7 Rooms | 375 (51.0%) | 52 (50.0%) |
| 8 or more Rooms | 185 (25.2%) | 32 (30.8%) |
| Total | 735 (100.0%) | 104 (100.0%) |
Housing Structure by Heating Type in Ponder
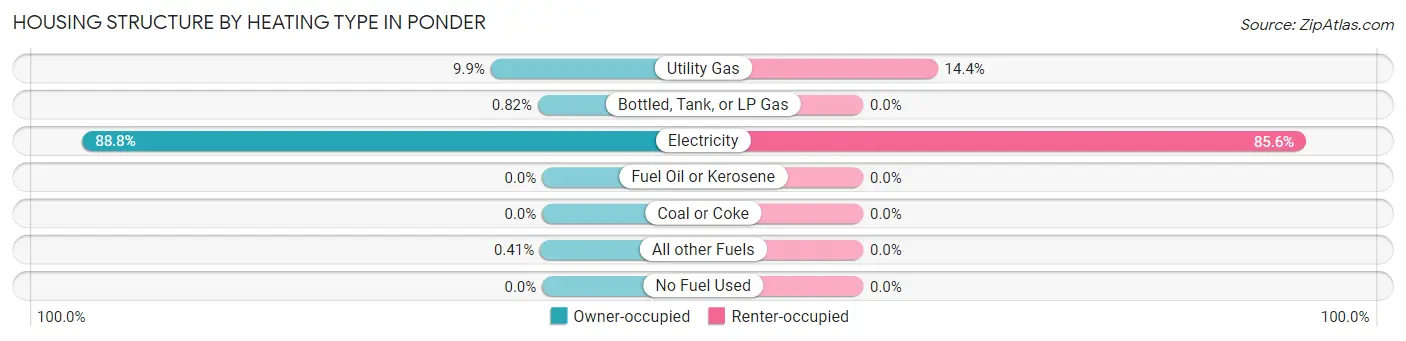
| Heating Type | Owner-occupied | Renter-occupied |
| Utility Gas | 73 (9.9%) | 15 (14.4%) |
| Bottled, Tank, or LP Gas | 6 (0.8%) | 0 (0.0%) |
| Electricity | 653 (88.8%) | 89 (85.6%) |
| Fuel Oil or Kerosene | 0 (0.0%) | 0 (0.0%) |
| Coal or Coke | 0 (0.0%) | 0 (0.0%) |
| All other Fuels | 3 (0.4%) | 0 (0.0%) |
| No Fuel Used | 0 (0.0%) | 0 (0.0%) |
| Total | 735 (100.0%) | 104 (100.0%) |
Household Vehicle Usage in Ponder
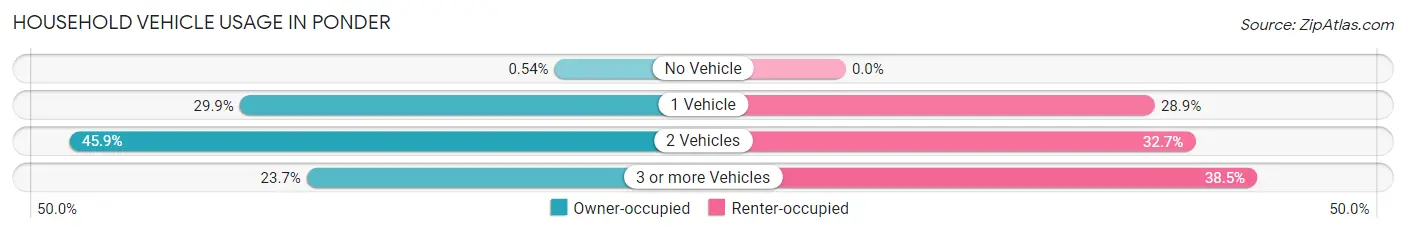
| Vehicles per Household | Owner-occupied | Renter-occupied |
| No Vehicle | 4 (0.5%) | 0 (0.0%) |
| 1 Vehicle | 220 (29.9%) | 30 (28.8%) |
| 2 Vehicles | 337 (45.9%) | 34 (32.7%) |
| 3 or more Vehicles | 174 (23.7%) | 40 (38.5%) |
| Total | 735 (100.0%) | 104 (100.0%) |
Real Estate & Mortgages in Ponder
Real Estate and Mortgage Overview in Ponder
| Characteristic | Without Mortgage | With Mortgage |
| Housing Units | 135 | 600 |
| Median Property Value | $249,300 | $254,400 |
| Median Household Income | $71,172 | $91 |
| Monthly Housing Costs | $724 | $35 |
| Real Estate Taxes | $3,900 | $8 |
Property Value by Mortgage Status in Ponder
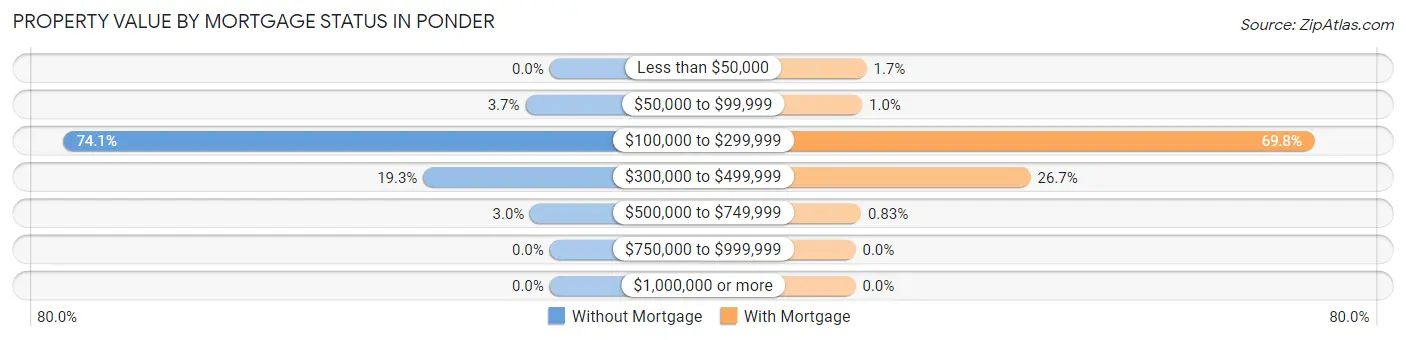
| Property Value | Without Mortgage | With Mortgage |
| Less than $50,000 | 0 (0.0%) | 10 (1.7%) |
| $50,000 to $99,999 | 5 (3.7%) | 6 (1.0%) |
| $100,000 to $299,999 | 100 (74.1%) | 419 (69.8%) |
| $300,000 to $499,999 | 26 (19.3%) | 160 (26.7%) |
| $500,000 to $749,999 | 4 (3.0%) | 5 (0.8%) |
| $750,000 to $999,999 | 0 (0.0%) | 0 (0.0%) |
| $1,000,000 or more | 0 (0.0%) | 0 (0.0%) |
| Total | 135 (100.0%) | 600 (100.0%) |
Household Income by Mortgage Status in Ponder
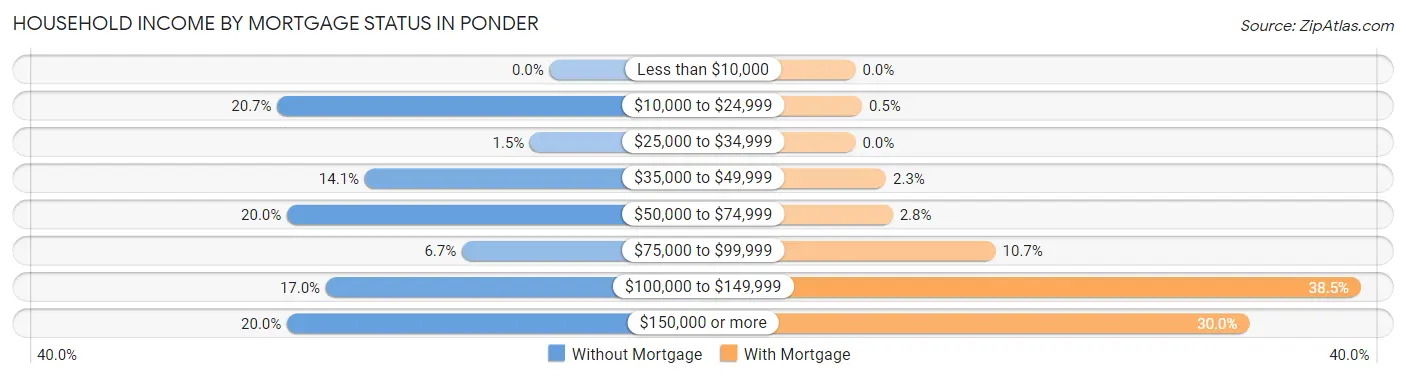
| Household Income | Without Mortgage | With Mortgage |
| Less than $10,000 | 0 (0.0%) | 0 (0.0%) |
| $10,000 to $24,999 | 28 (20.7%) | 3 (0.5%) |
| $25,000 to $34,999 | 2 (1.5%) | 0 (0.0%) |
| $35,000 to $49,999 | 19 (14.1%) | 14 (2.3%) |
| $50,000 to $74,999 | 27 (20.0%) | 17 (2.8%) |
| $75,000 to $99,999 | 9 (6.7%) | 64 (10.7%) |
| $100,000 to $149,999 | 23 (17.0%) | 231 (38.5%) |
| $150,000 or more | 27 (20.0%) | 180 (30.0%) |
| Total | 135 (100.0%) | 600 (100.0%) |
Property Value to Household Income Ratio in Ponder
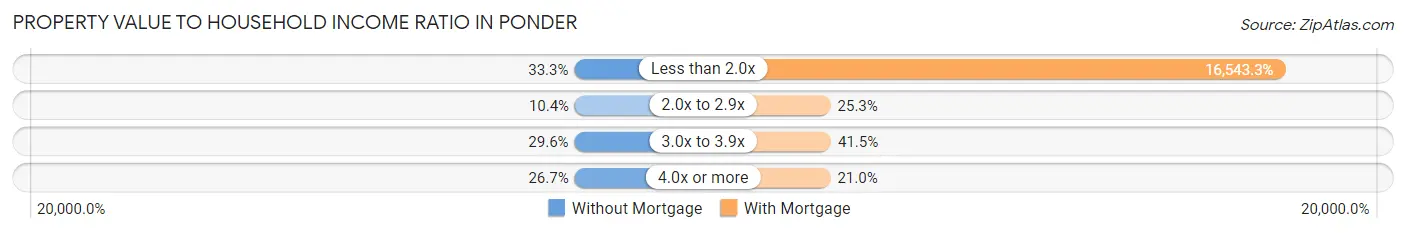
| Value-to-Income Ratio | Without Mortgage | With Mortgage |
| Less than 2.0x | 45 (33.3%) | 99,260 (16,543.3%) |
| 2.0x to 2.9x | 14 (10.4%) | 152 (25.3%) |
| 3.0x to 3.9x | 40 (29.6%) | 249 (41.5%) |
| 4.0x or more | 36 (26.7%) | 126 (21.0%) |
| Total | 135 (100.0%) | 600 (100.0%) |
Real Estate Taxes by Mortgage Status in Ponder
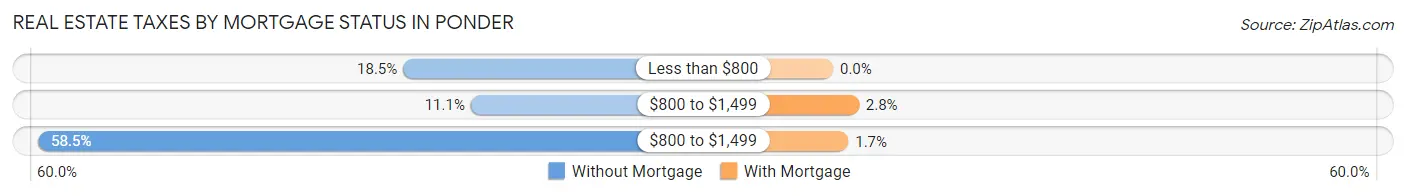
| Property Taxes | Without Mortgage | With Mortgage |
| Less than $800 | 25 (18.5%) | 0 (0.0%) |
| $800 to $1,499 | 15 (11.1%) | 17 (2.8%) |
| $800 to $1,499 | 79 (58.5%) | 10 (1.7%) |
| Total | 135 (100.0%) | 600 (100.0%) |
Health & Disability in Ponder
Health Insurance Coverage by Age in Ponder
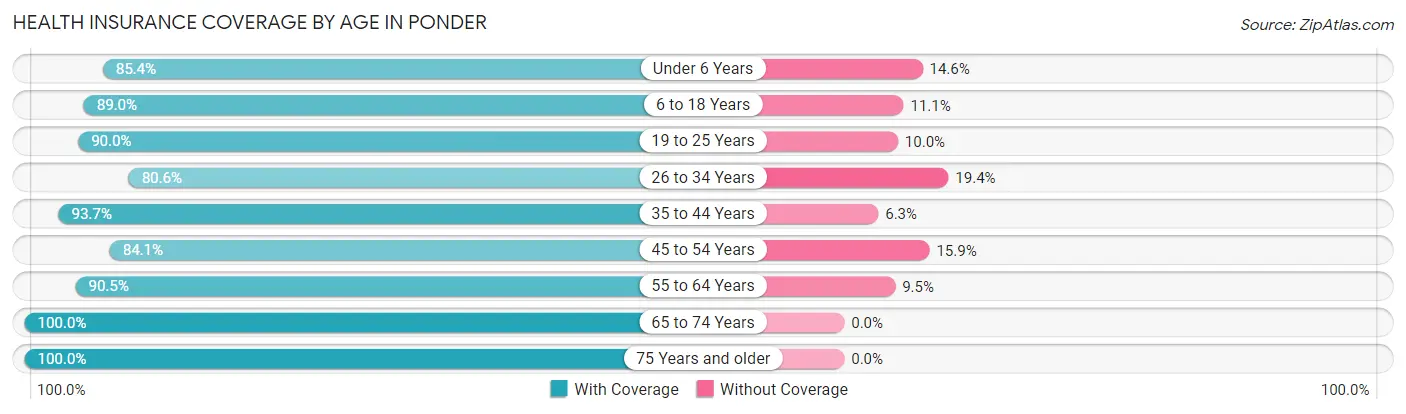
| Age Bracket | With Coverage | Without Coverage |
| Under 6 Years | 199 (85.4%) | 34 (14.6%) |
| 6 to 18 Years | 499 (88.9%) | 62 (11.1%) |
| 19 to 25 Years | 81 (90.0%) | 9 (10.0%) |
| 26 to 34 Years | 415 (80.6%) | 100 (19.4%) |
| 35 to 44 Years | 340 (93.7%) | 23 (6.3%) |
| 45 to 54 Years | 127 (84.1%) | 24 (15.9%) |
| 55 to 64 Years | 219 (90.5%) | 23 (9.5%) |
| 65 to 74 Years | 184 (100.0%) | 0 (0.0%) |
| 75 Years and older | 82 (100.0%) | 0 (0.0%) |
| Total | 2,146 (88.6%) | 275 (11.4%) |
Health Insurance Coverage by Citizenship Status in Ponder
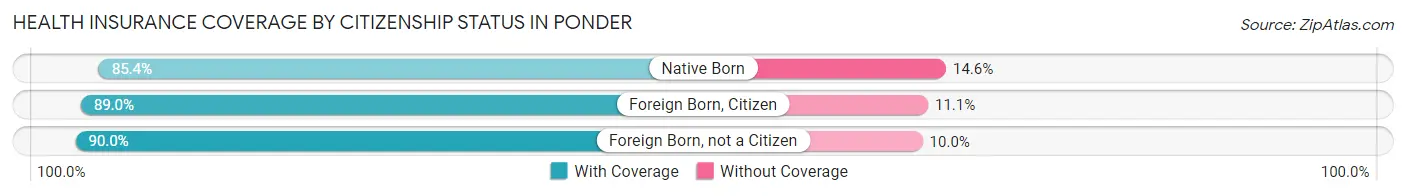
| Citizenship Status | With Coverage | Without Coverage |
| Native Born | 199 (85.4%) | 34 (14.6%) |
| Foreign Born, Citizen | 499 (88.9%) | 62 (11.1%) |
| Foreign Born, not a Citizen | 81 (90.0%) | 9 (10.0%) |
Health Insurance Coverage by Household Income in Ponder
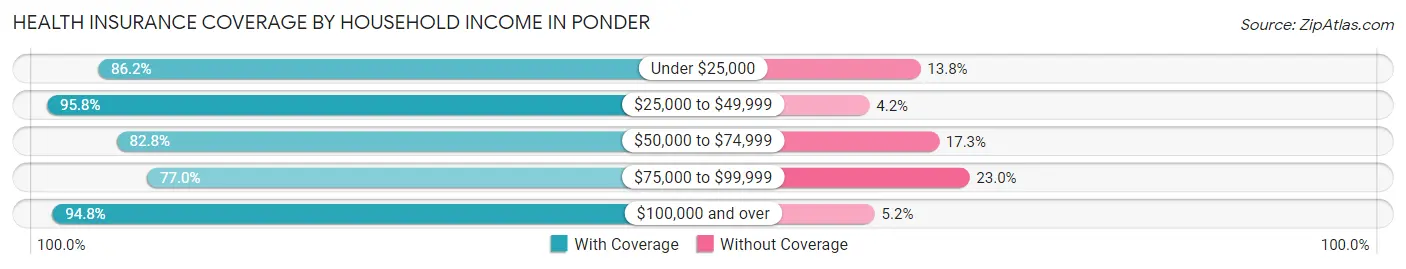
| Household Income | With Coverage | Without Coverage |
| Under $25,000 | 50 (86.2%) | 8 (13.8%) |
| $25,000 to $49,999 | 136 (95.8%) | 6 (4.2%) |
| $50,000 to $74,999 | 307 (82.8%) | 64 (17.2%) |
| $75,000 to $99,999 | 436 (77.0%) | 130 (23.0%) |
| $100,000 and over | 1,217 (94.8%) | 67 (5.2%) |
Public vs Private Health Insurance Coverage by Age in Ponder
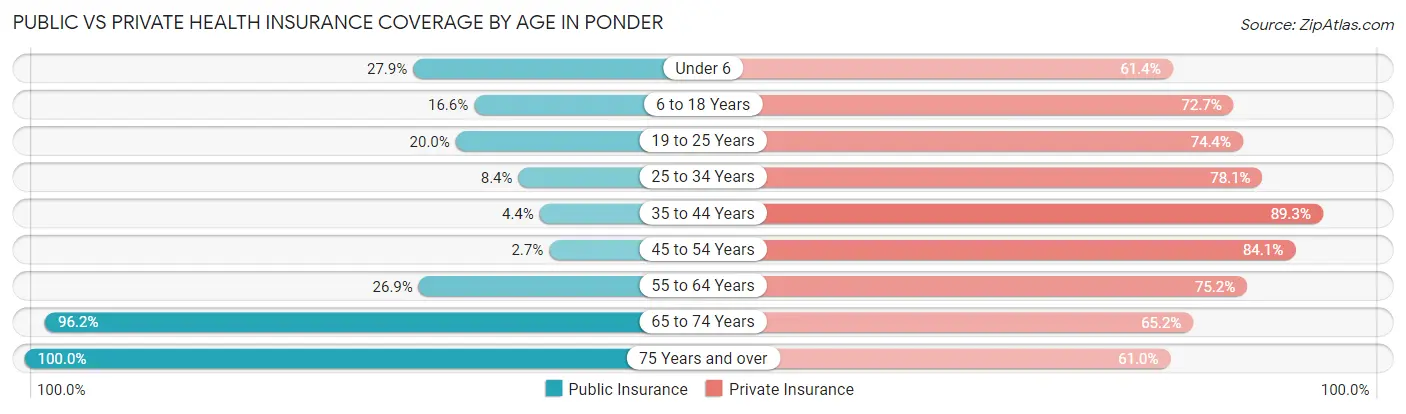
| Age Bracket | Public Insurance | Private Insurance |
| Under 6 | 65 (27.9%) | 143 (61.4%) |
| 6 to 18 Years | 93 (16.6%) | 408 (72.7%) |
| 19 to 25 Years | 18 (20.0%) | 67 (74.4%) |
| 25 to 34 Years | 43 (8.4%) | 402 (78.1%) |
| 35 to 44 Years | 16 (4.4%) | 324 (89.3%) |
| 45 to 54 Years | 4 (2.6%) | 127 (84.1%) |
| 55 to 64 Years | 65 (26.9%) | 182 (75.2%) |
| 65 to 74 Years | 177 (96.2%) | 120 (65.2%) |
| 75 Years and over | 82 (100.0%) | 50 (61.0%) |
| Total | 563 (23.3%) | 1,823 (75.3%) |
Disability Status by Sex by Age in Ponder
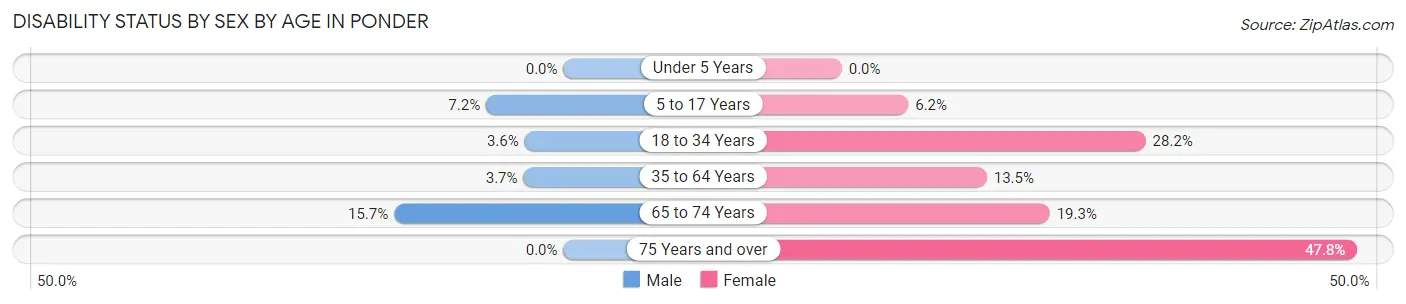
| Age Bracket | Male | Female |
| Under 5 Years | 0 (0.0%) | 0 (0.0%) |
| 5 to 17 Years | 26 (7.2%) | 15 (6.2%) |
| 18 to 34 Years | 8 (3.6%) | 108 (28.2%) |
| 35 to 64 Years | 14 (3.7%) | 51 (13.5%) |
| 65 to 74 Years | 11 (15.7%) | 22 (19.3%) |
| 75 Years and over | 0 (0.0%) | 22 (47.8%) |
Disability Class by Sex by Age in Ponder
Disability Class: Hearing Difficulty
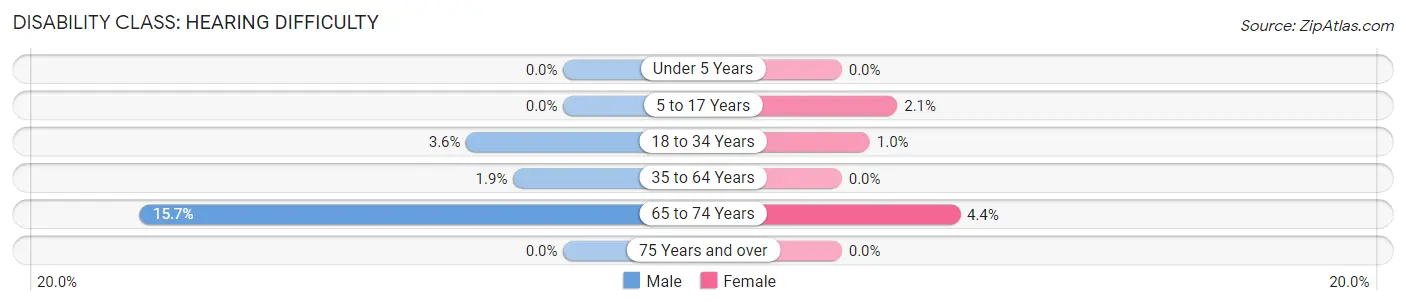
| Age Bracket | Male | Female |
| Under 5 Years | 0 (0.0%) | 0 (0.0%) |
| 5 to 17 Years | 0 (0.0%) | 5 (2.1%) |
| 18 to 34 Years | 8 (3.6%) | 4 (1.0%) |
| 35 to 64 Years | 7 (1.9%) | 0 (0.0%) |
| 65 to 74 Years | 11 (15.7%) | 5 (4.4%) |
| 75 Years and over | 0 (0.0%) | 0 (0.0%) |
Disability Class: Vision Difficulty
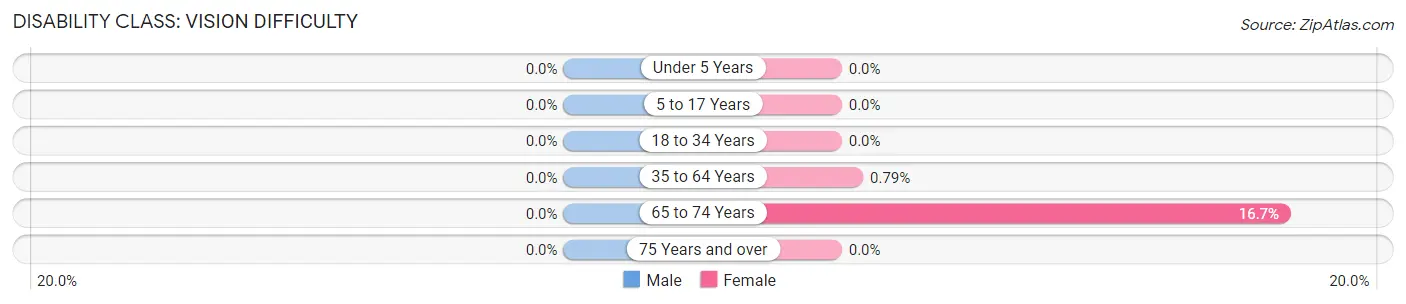
| Age Bracket | Male | Female |
| Under 5 Years | 0 (0.0%) | 0 (0.0%) |
| 5 to 17 Years | 0 (0.0%) | 0 (0.0%) |
| 18 to 34 Years | 0 (0.0%) | 0 (0.0%) |
| 35 to 64 Years | 0 (0.0%) | 3 (0.8%) |
| 65 to 74 Years | 0 (0.0%) | 19 (16.7%) |
| 75 Years and over | 0 (0.0%) | 0 (0.0%) |
Disability Class: Cognitive Difficulty
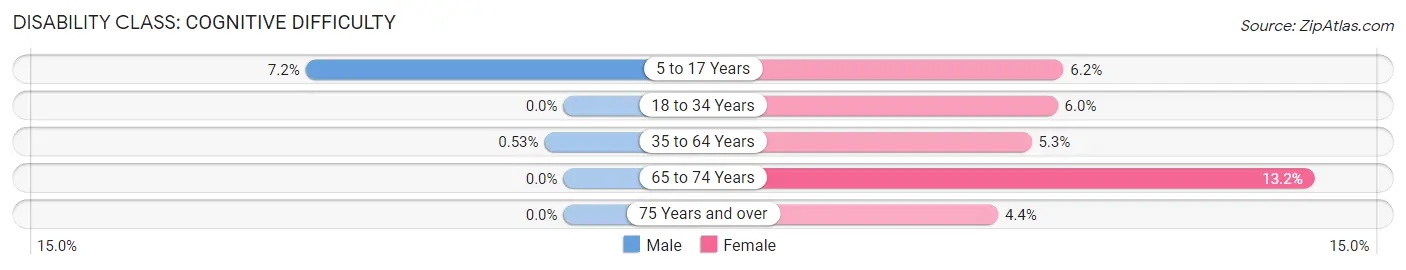
| Age Bracket | Male | Female |
| 5 to 17 Years | 26 (7.2%) | 15 (6.2%) |
| 18 to 34 Years | 0 (0.0%) | 23 (6.0%) |
| 35 to 64 Years | 2 (0.5%) | 20 (5.3%) |
| 65 to 74 Years | 0 (0.0%) | 15 (13.2%) |
| 75 Years and over | 0 (0.0%) | 2 (4.3%) |
Disability Class: Ambulatory Difficulty
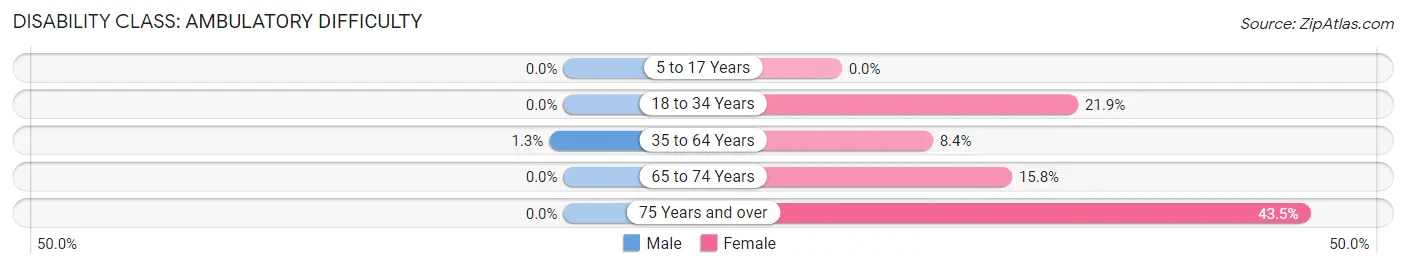
| Age Bracket | Male | Female |
| 5 to 17 Years | 0 (0.0%) | 0 (0.0%) |
| 18 to 34 Years | 0 (0.0%) | 84 (21.9%) |
| 35 to 64 Years | 5 (1.3%) | 32 (8.4%) |
| 65 to 74 Years | 0 (0.0%) | 18 (15.8%) |
| 75 Years and over | 0 (0.0%) | 20 (43.5%) |
Disability Class: Self-Care Difficulty
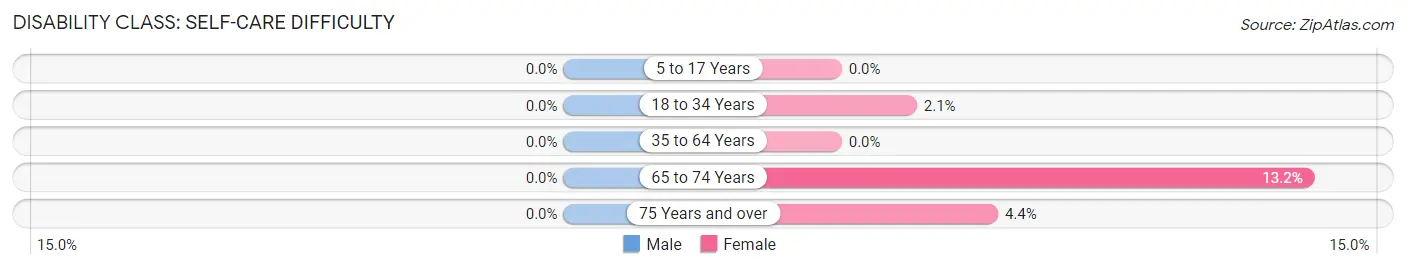
| Age Bracket | Male | Female |
| 5 to 17 Years | 0 (0.0%) | 0 (0.0%) |
| 18 to 34 Years | 0 (0.0%) | 8 (2.1%) |
| 35 to 64 Years | 0 (0.0%) | 0 (0.0%) |
| 65 to 74 Years | 0 (0.0%) | 15 (13.2%) |
| 75 Years and over | 0 (0.0%) | 2 (4.3%) |
Technology Access in Ponder
Computing Device Access in Ponder
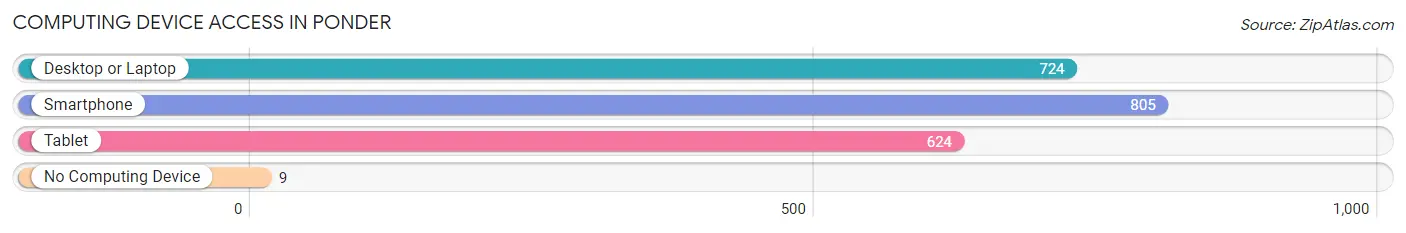
| Device Type | # Households | % Households |
| Desktop or Laptop | 724 | 86.3% |
| Smartphone | 805 | 96.0% |
| Tablet | 624 | 74.4% |
| No Computing Device | 9 | 1.1% |
| Total | 839 | 100.0% |
Internet Access in Ponder
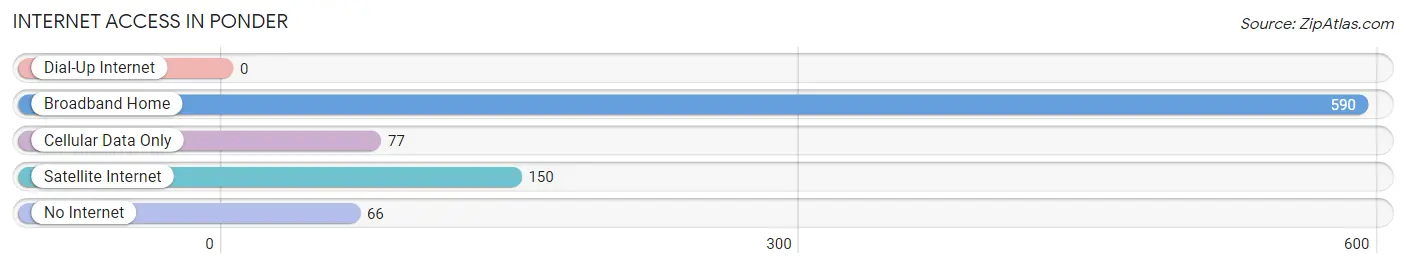
| Internet Type | # Households | % Households |
| Dial-Up Internet | 0 | 0.0% |
| Broadband Home | 590 | 70.3% |
| Cellular Data Only | 77 | 9.2% |
| Satellite Internet | 150 | 17.9% |
| No Internet | 66 | 7.9% |
| Total | 839 | 100.0% |
Ponder Summary
Ponder, Texas is a small town located in Denton County, Texas. It is situated about 25 miles northwest of Dallas and is part of the Dallas-Fort Worth-Arlington metropolitan area. The town was founded in 1873 and was named after the Ponder family, who were early settlers in the area. As of the 2010 census, the population of Ponder was 1,277.
Geography
Ponder is located at 33°14'25" North, 97°20'45" West (33.240278, -97.345833). It is situated in the northern part of Denton County, about 25 miles northwest of Dallas. The town is located on the western edge of the Blackland Prairie, a region of Texas characterized by rich, fertile soil and abundant rainfall. The town is situated on the banks of the Elm Fork of the Trinity River, which flows through the area.
The town has a total area of 1.2 square miles, all of which is land. The terrain is mostly flat, with some rolling hills in the surrounding area. The climate is humid subtropical, with hot summers and mild winters.
Economy
The economy of Ponder is largely based on agriculture. The town is home to several farms, which produce a variety of crops, including cotton, corn, wheat, and hay. The town is also home to several small businesses, including a grocery store, a hardware store, and a few restaurants.
Demographics
As of the 2010 census, the population of Ponder was 1,277. The racial makeup of the town was 94.2% White, 0.7% African American, 0.3% Native American, 0.2% Asian, 0.1% Pacific Islander, 2.7% from other races, and 1.9% from two or more races. Hispanic or Latino of any race were 6.2% of the population.
The median income for a household in Ponder was $45,000, and the median income for a family was $50,000. The per capita income for the town was $20,000. About 10.2% of families and 12.3% of the population were below the poverty line, including 16.2% of those under age 18 and 8.3% of those age 65 or over.
Education
Ponder is served by the Ponder Independent School District. The district has one elementary school, one middle school, and one high school. The town is also home to a branch of North Central Texas College.
Conclusion
Ponder, Texas is a small town located in Denton County, Texas. It is situated about 25 miles northwest of Dallas and is part of the Dallas-Fort Worth-Arlington metropolitan area. The town was founded in 1873 and was named after the Ponder family, who were early settlers in the area. The economy of Ponder is largely based on agriculture, and the town is home to several small businesses. As of the 2010 census, the population of Ponder was 1,277. The town is served by the Ponder Independent School District and is home to a branch of North Central Texas College.
Common Questions
What is Per Capita Income in Ponder?
Per Capita income in Ponder is $37,269.
What is the Median Family Income in Ponder?
Median Family Income in Ponder is $102,143.
What is the Median Household income in Ponder?
Median Household Income in Ponder is $98,227.
What is Income or Wage Gap in Ponder?
Income or Wage Gap in Ponder is 33.5%.
Women in Ponder earn 66.5 cents for every dollar earned by a man.
What is Inequality or Gini Index in Ponder?
Inequality or Gini Index in Ponder is 0.29.
What is the Total Population of Ponder?
Total Population of Ponder is 2,421.
What is the Total Male Population of Ponder?
Total Male Population of Ponder is 1,184.
What is the Total Female Population of Ponder?
Total Female Population of Ponder is 1,237.
What is the Ratio of Males per 100 Females in Ponder?
There are 95.72 Males per 100 Females in Ponder.
What is the Ratio of Females per 100 Males in Ponder?
There are 104.48 Females per 100 Males in Ponder.
What is the Median Population Age in Ponder?
Median Population Age in Ponder is 31.3 Years.
What is the Average Family Size in Ponder
Average Family Size in Ponder is 3.5 People.
What is the Average Household Size in Ponder
Average Household Size in Ponder is 2.9 People.
How Large is the Labor Force in Ponder?
There are 1,283 People in the Labor Forcein in Ponder.
What is the Percentage of People in the Labor Force in Ponder?
76.8% of People are in the Labor Force in Ponder.
What is the Unemployment Rate in Ponder?
Unemployment Rate in Ponder is 4.4%.