Trophy Club, TX Map & Demographics
Trophy Club Map
Trophy Club Overview
$79,612
PER CAPITA INCOME
$198,393
AVG FAMILY INCOME
$183,125
AVG HOUSEHOLD INCOME
48.1%
WAGE / INCOME GAP [ % ]
51.9¢/ $1
WAGE / INCOME GAP [ $ ]
$8,421
FAMILY INCOME DEFICIT
0.42
INEQUALITY / GINI INDEX
13,251
TOTAL POPULATION
6,618
MALE POPULATION
6,633
FEMALE POPULATION
99.77
MALES / 100 FEMALES
100.23
FEMALES / 100 MALES
40.3
MEDIAN AGE
3.2
AVG FAMILY SIZE
2.9
AVG HOUSEHOLD SIZE
7,301
LABOR FORCE [ PEOPLE ]
70.8%
PERCENT IN LABOR FORCE
4.0%
UNEMPLOYMENT RATE
Income in Trophy Club
Income Overview in Trophy Club
Per Capita Income in Trophy Club is $79,612, while median incomes of families and households are $198,393 and $183,125 respectively.
| Characteristic | Number | Measure |
| Per Capita Income | 13,251 | $79,612 |
| Median Family Income | 3,830 | $198,393 |
| Mean Family Income | 3,830 | $246,266 |
| Median Household Income | 4,536 | $183,125 |
| Mean Household Income | 4,536 | $226,745 |
| Income Deficit | 3,830 | $8,421 |
| Wage / Income Gap (%) | 13,251 | 48.06% |
| Wage / Income Gap ($) | 13,251 | 51.94¢ per $1 |
| Gini / Inequality Index | 13,251 | 0.42 |
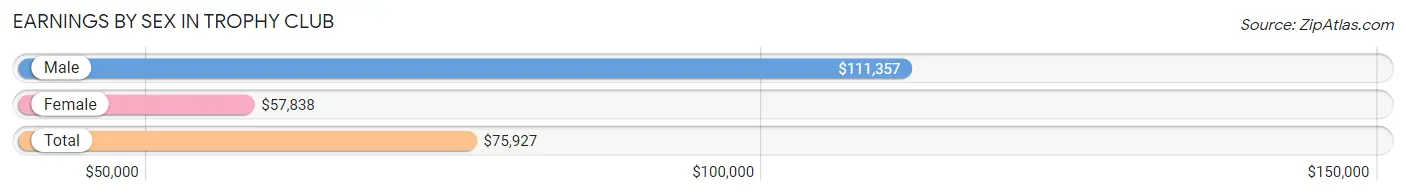
Earnings by Sex in Trophy Club
Average Earnings in Trophy Club are $75,927, $111,357 for men and $57,838 for women, a difference of 48.1%.
| Sex | Number | Average Earnings |
| Male | 4,126 (53.9%) | $111,357 |
| Female | 3,534 (46.1%) | $57,838 |
| Total | 7,660 (100.0%) | $75,927 |
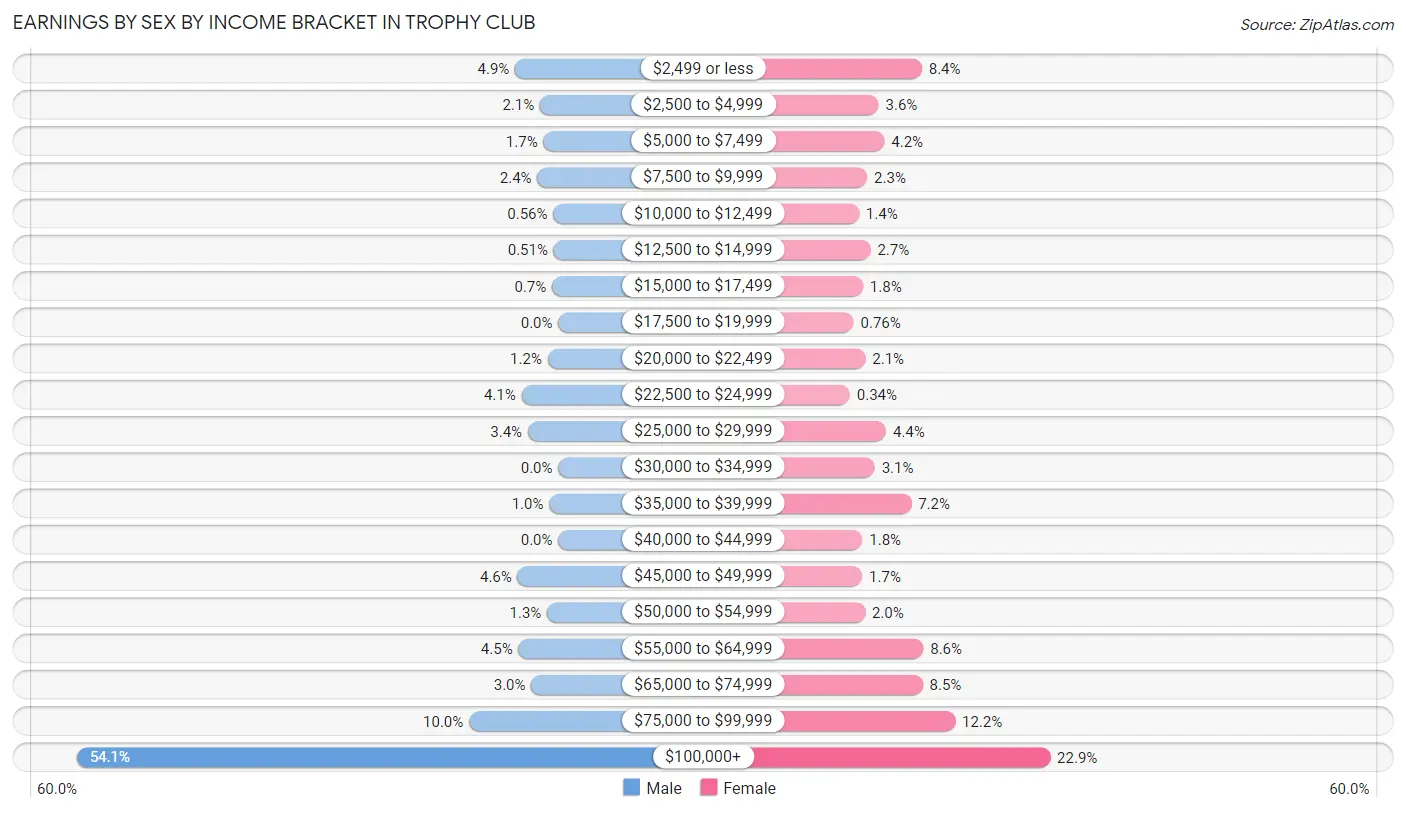
Earnings by Sex by Income Bracket in Trophy Club
The most common earnings brackets in Trophy Club are $100,000+ for men (2,234 | 54.1%) and $100,000+ for women (808 | 22.9%).
| Income | Male | Female |
| $2,499 or less | 200 (4.9%) | 298 (8.4%) |
| $2,500 to $4,999 | 85 (2.1%) | 126 (3.6%) |
| $5,000 to $7,499 | 69 (1.7%) | 149 (4.2%) |
| $7,500 to $9,999 | 97 (2.4%) | 81 (2.3%) |
| $10,000 to $12,499 | 23 (0.6%) | 48 (1.4%) |
| $12,500 to $14,999 | 21 (0.5%) | 94 (2.7%) |
| $15,000 to $17,499 | 29 (0.7%) | 64 (1.8%) |
| $17,500 to $19,999 | 0 (0.0%) | 27 (0.8%) |
| $20,000 to $22,499 | 49 (1.2%) | 74 (2.1%) |
| $22,500 to $24,999 | 171 (4.1%) | 12 (0.3%) |
| $25,000 to $29,999 | 141 (3.4%) | 156 (4.4%) |
| $30,000 to $34,999 | 0 (0.0%) | 111 (3.1%) |
| $35,000 to $39,999 | 42 (1.0%) | 256 (7.2%) |
| $40,000 to $44,999 | 0 (0.0%) | 62 (1.8%) |
| $45,000 to $49,999 | 189 (4.6%) | 61 (1.7%) |
| $50,000 to $54,999 | 52 (1.3%) | 72 (2.0%) |
| $55,000 to $64,999 | 185 (4.5%) | 304 (8.6%) |
| $65,000 to $74,999 | 125 (3.0%) | 301 (8.5%) |
| $75,000 to $99,999 | 414 (10.0%) | 430 (12.2%) |
| $100,000+ | 2,234 (54.1%) | 808 (22.9%) |
| Total | 4,126 (100.0%) | 3,534 (100.0%) |
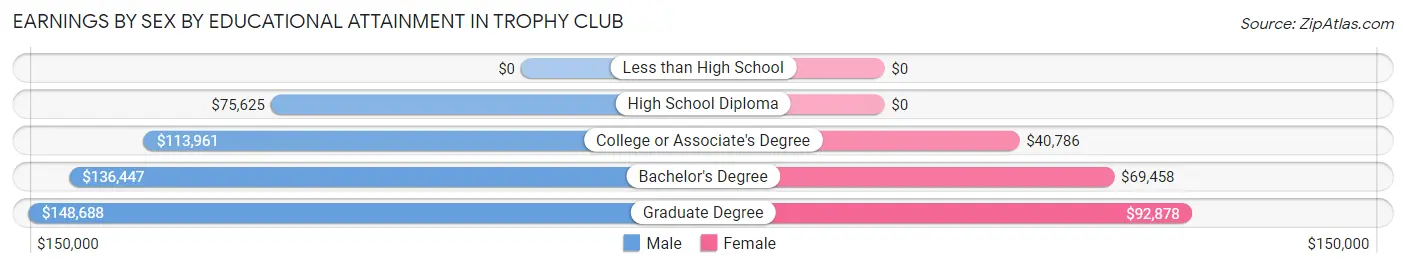
Earnings by Sex by Educational Attainment in Trophy Club
Average earnings in Trophy Club are $119,802 for men and $65,675 for women, a difference of 45.2%. Men with an educational attainment of graduate degree enjoy the highest average annual earnings of $148,688, while those with high school diploma education earn the least with $75,625. Women with an educational attainment of graduate degree earn the most with the average annual earnings of $92,878, while those with college or associate's degree education have the smallest earnings of $40,786.
| Educational Attainment | Male Income | Female Income |
| Less than High School | - | - |
| High School Diploma | $75,625 | $0 |
| College or Associate's Degree | $113,961 | $40,786 |
| Bachelor's Degree | $136,447 | $69,458 |
| Graduate Degree | $148,688 | $92,878 |
| Total | $119,802 | $65,675 |
Family Income in Trophy Club
Family Income Brackets in Trophy Club
According to the Trophy Club family income data, there are 1,896 families falling into the $200,000+ income range, which is the most common income bracket and makes up 49.5% of all families.
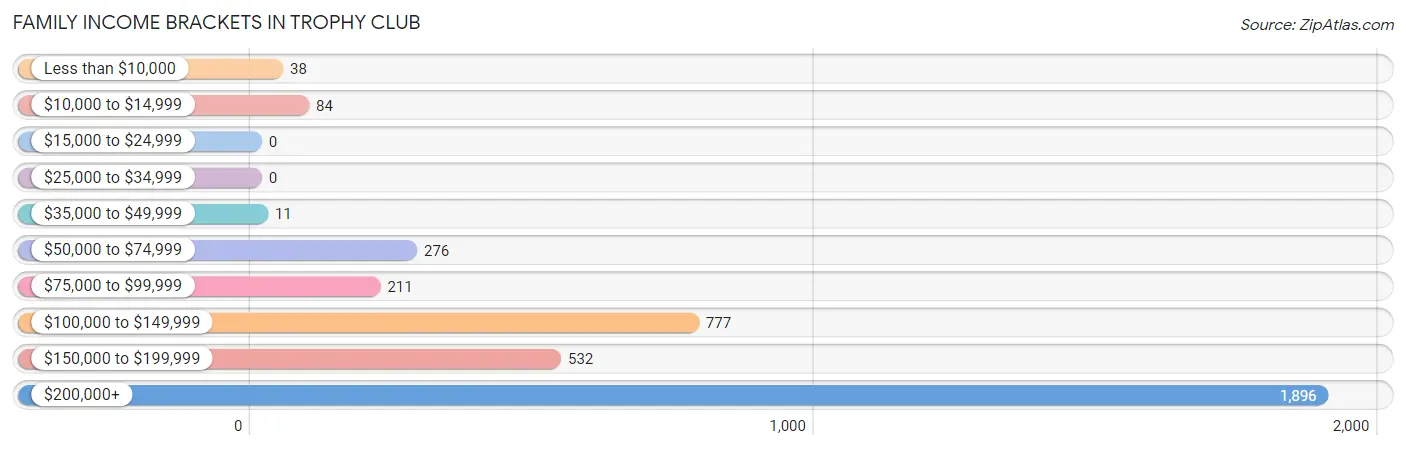
| Income Bracket | # Families | % Families |
| Less than $10,000 | 38 | 1.0% |
| $10,000 to $14,999 | 84 | 2.2% |
| $15,000 to $24,999 | 0 | 0.0% |
| $25,000 to $34,999 | 0 | 0.0% |
| $35,000 to $49,999 | 11 | 0.3% |
| $50,000 to $74,999 | 276 | 7.2% |
| $75,000 to $99,999 | 211 | 5.5% |
| $100,000 to $149,999 | 777 | 20.3% |
| $150,000 to $199,999 | 532 | 13.9% |
| $200,000+ | 1,896 | 49.5% |
Family Income by Famaliy Size in Trophy Club
4-person families (921 | 24.0%) account for the highest median family income in Trophy Club with $231,691 per family, while 3-person families (772 | 20.2%) have the highest median income of $71,000 per family member.
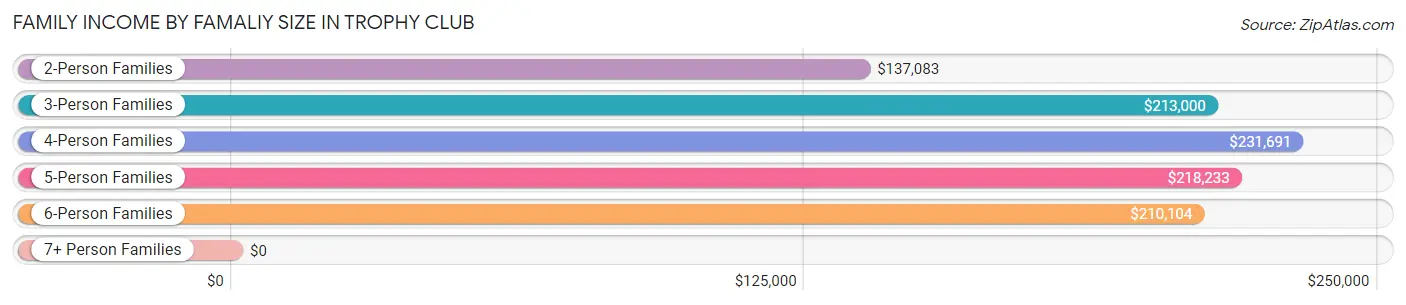
| Income Bracket | # Families | Median Income |
| 2-Person Families | 1,515 (39.6%) | $137,083 |
| 3-Person Families | 772 (20.2%) | $213,000 |
| 4-Person Families | 921 (24.0%) | $231,691 |
| 5-Person Families | 458 (12.0%) | $218,233 |
| 6-Person Families | 164 (4.3%) | $210,104 |
| 7+ Person Families | 0 (0.0%) | $0 |
| Total | 3,830 (100.0%) | $198,393 |
Family Income by Number of Earners in Trophy Club
The median family income in Trophy Club is $198,393, with families comprising 3+ earners (527) having the highest median family income of $218,240, while families with no earners (329) have the lowest median family income of $100,775, accounting for 13.8% and 8.6% of families, respectively.
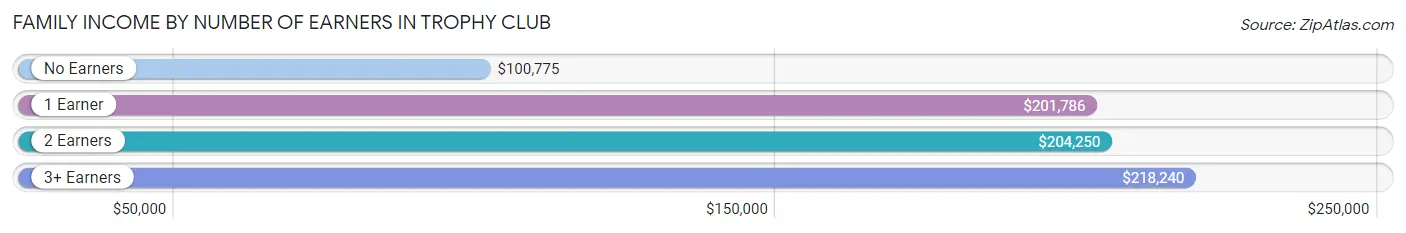
| Number of Earners | # Families | Median Income |
| No Earners | 329 (8.6%) | $100,775 |
| 1 Earner | 998 (26.1%) | $201,786 |
| 2 Earners | 1,976 (51.6%) | $204,250 |
| 3+ Earners | 527 (13.8%) | $218,240 |
| Total | 3,830 (100.0%) | $198,393 |
Household Income in Trophy Club
Household Income Brackets in Trophy Club
With 2,023 households falling in the category, the $200,000+ income range is the most frequent in Trophy Club, accounting for 44.6% of all households.
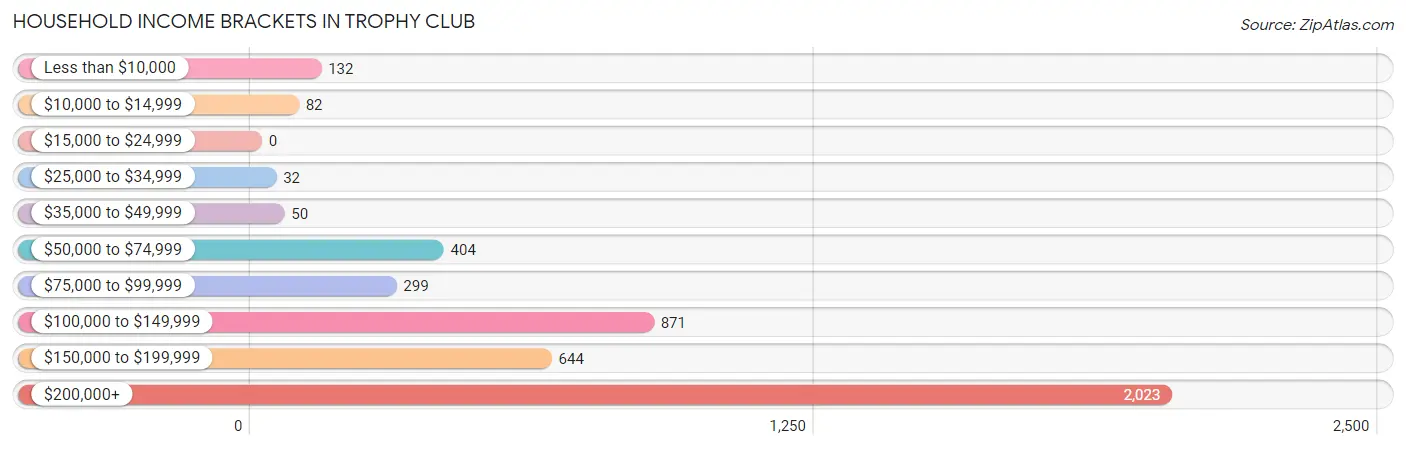
| Income Bracket | # Households | % Households |
| Less than $10,000 | 132 | 2.9% |
| $10,000 to $14,999 | 82 | 1.8% |
| $15,000 to $24,999 | 0 | 0.0% |
| $25,000 to $34,999 | 32 | 0.7% |
| $35,000 to $49,999 | 50 | 1.1% |
| $50,000 to $74,999 | 404 | 8.9% |
| $75,000 to $99,999 | 299 | 6.6% |
| $100,000 to $149,999 | 871 | 19.2% |
| $150,000 to $199,999 | 644 | 14.2% |
| $200,000+ | 2,023 | 44.6% |
Household Income by Householder Age in Trophy Club
The median household income in Trophy Club is $183,125, with the highest median household income of $206,140 found in the 25 to 44 years age bracket for the primary householder. A total of 1,287 households (28.4%) fall into this category.
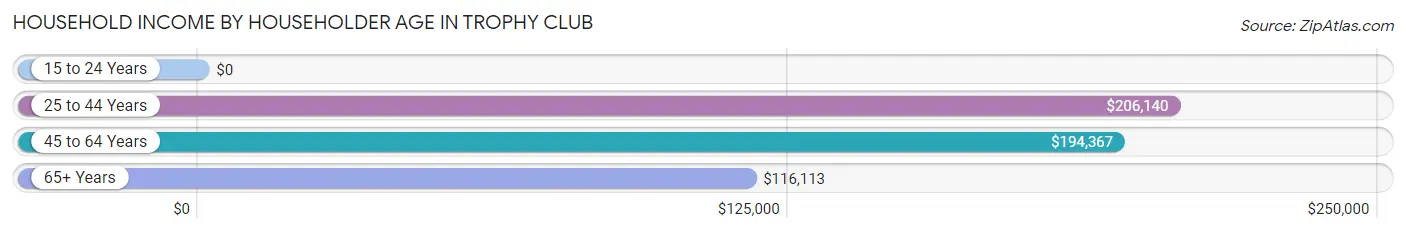
| Income Bracket | # Households | Median Income |
| 15 to 24 Years | 0 (0.0%) | $0 |
| 25 to 44 Years | 1,287 (28.4%) | $206,140 |
| 45 to 64 Years | 2,208 (48.7%) | $194,367 |
| 65+ Years | 1,041 (23.0%) | $116,113 |
| Total | 4,536 (100.0%) | $183,125 |
Poverty in Trophy Club
Income Below Poverty by Sex and Age in Trophy Club
With 1.7% poverty level for males and 3.5% for females among the residents of Trophy Club, 18 to 24 year old males and 65 to 74 year old females are the most vulnerable to poverty, with 67 males (12.8%) and 85 females (13.7%) in their respective age groups living below the poverty level.
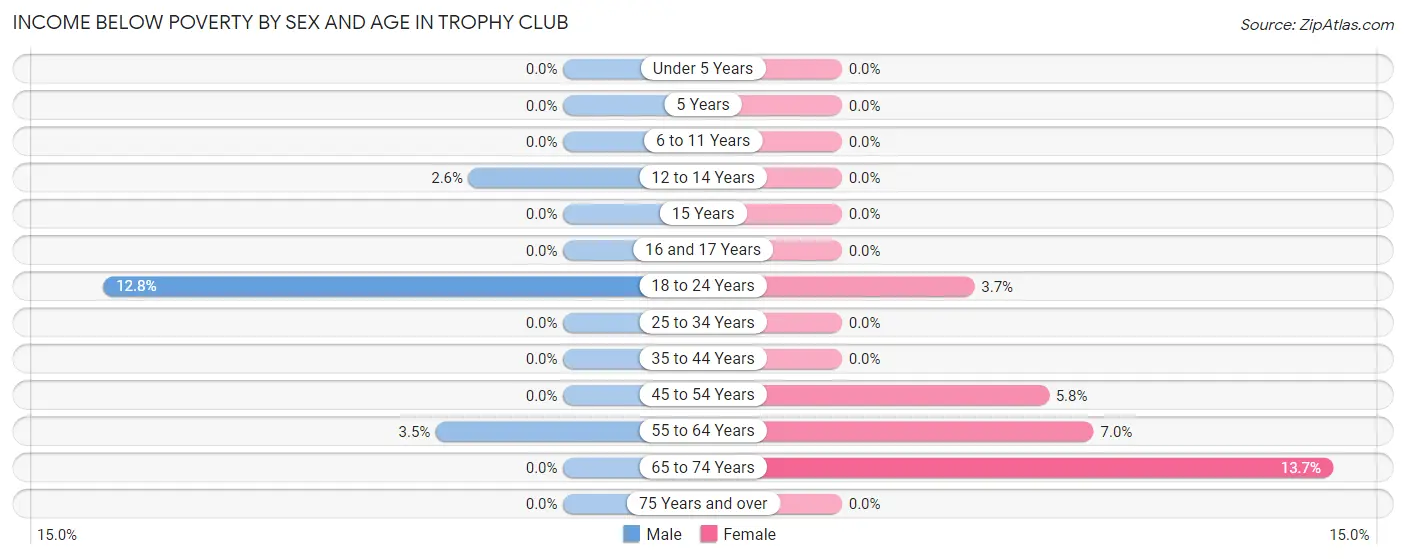
| Age Bracket | Male | Female |
| Under 5 Years | 0 (0.0%) | 0 (0.0%) |
| 5 Years | 0 (0.0%) | 0 (0.0%) |
| 6 to 11 Years | 0 (0.0%) | 0 (0.0%) |
| 12 to 14 Years | 11 (2.6%) | 0 (0.0%) |
| 15 Years | 0 (0.0%) | 0 (0.0%) |
| 16 and 17 Years | 0 (0.0%) | 0 (0.0%) |
| 18 to 24 Years | 67 (12.8%) | 18 (3.7%) |
| 25 to 34 Years | 0 (0.0%) | 0 (0.0%) |
| 35 to 44 Years | 0 (0.0%) | 0 (0.0%) |
| 45 to 54 Years | 0 (0.0%) | 71 (5.8%) |
| 55 to 64 Years | 35 (3.5%) | 58 (7.0%) |
| 65 to 74 Years | 0 (0.0%) | 85 (13.7%) |
| 75 Years and over | 0 (0.0%) | 0 (0.0%) |
| Total | 113 (1.7%) | 232 (3.5%) |
Income Above Poverty by Sex and Age in Trophy Club
According to the poverty statistics in Trophy Club, males aged under 5 years and females aged under 5 years are the age groups that are most secure financially, with 100.0% of males and 100.0% of females in these age groups living above the poverty line.
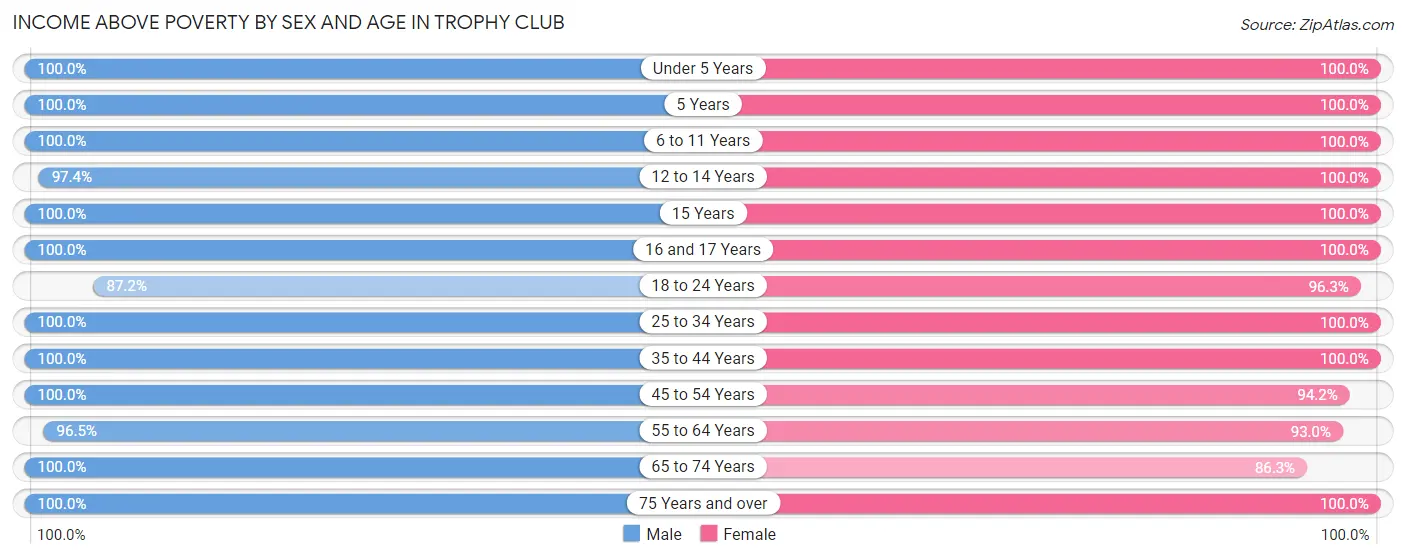
| Age Bracket | Male | Female |
| Under 5 Years | 314 (100.0%) | 285 (100.0%) |
| 5 Years | 68 (100.0%) | 104 (100.0%) |
| 6 to 11 Years | 512 (100.0%) | 613 (100.0%) |
| 12 to 14 Years | 407 (97.4%) | 374 (100.0%) |
| 15 Years | 32 (100.0%) | 174 (100.0%) |
| 16 and 17 Years | 339 (100.0%) | 196 (100.0%) |
| 18 to 24 Years | 456 (87.2%) | 470 (96.3%) |
| 25 to 34 Years | 677 (100.0%) | 689 (100.0%) |
| 35 to 44 Years | 725 (100.0%) | 785 (100.0%) |
| 45 to 54 Years | 1,117 (100.0%) | 1,161 (94.2%) |
| 55 to 64 Years | 954 (96.5%) | 769 (93.0%) |
| 65 to 74 Years | 681 (100.0%) | 537 (86.3%) |
| 75 Years and over | 178 (100.0%) | 244 (100.0%) |
| Total | 6,460 (98.3%) | 6,401 (96.5%) |
Income Below Poverty Among Married-Couple Families in Trophy Club
The poverty statistics for married-couple families in Trophy Club show that 1.0% or 33 of the total 3,398 families live below the poverty line. Families with no children have the highest poverty rate of 2.1%, comprising of 33 families. On the other hand, families with 1 or 2 children have the lowest poverty rate of 0.0%, which includes 0 families.
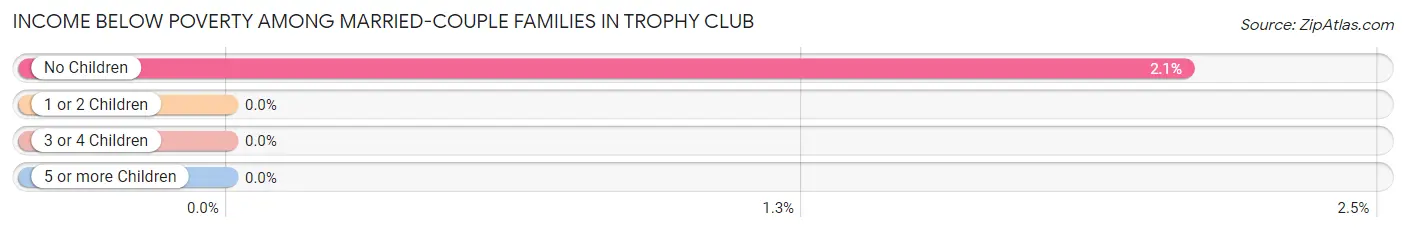
| Children | Above Poverty | Below Poverty |
| No Children | 1,556 (97.9%) | 33 (2.1%) |
| 1 or 2 Children | 1,429 (100.0%) | 0 (0.0%) |
| 3 or 4 Children | 380 (100.0%) | 0 (0.0%) |
| 5 or more Children | 0 (0.0%) | 0 (0.0%) |
| Total | 3,365 (99.0%) | 33 (1.0%) |
Income Below Poverty Among Single-Parent Households in Trophy Club
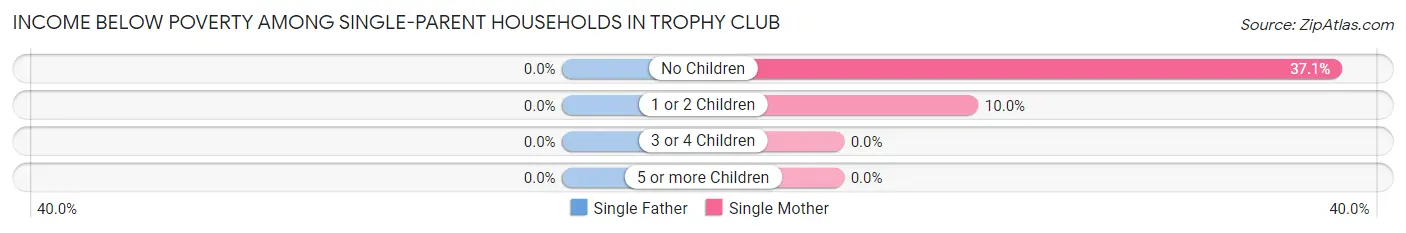
| Children | Single Father | Single Mother |
| No Children | 0 (0.0%) | 78 (37.1%) |
| 1 or 2 Children | 0 (0.0%) | 10 (10.0%) |
| 3 or 4 Children | 0 (0.0%) | 0 (0.0%) |
| 5 or more Children | 0 (0.0%) | 0 (0.0%) |
| Total | 0 (0.0%) | 88 (25.1%) |
Income Below Poverty Among Married-Couple vs Single-Parent Households in Trophy Club
The poverty data for Trophy Club shows that 33 of the married-couple family households (1.0%) and 88 of the single-parent households (20.4%) are living below the poverty level. Within the married-couple family households, those with no children have the highest poverty rate, with 33 households (2.1%) falling below the poverty line. Among the single-parent households, those with no children have the highest poverty rate, with 78 household (31.7%) living below poverty.
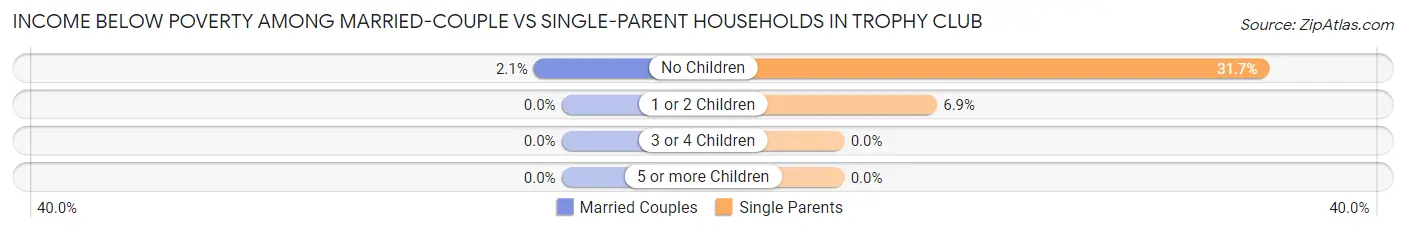
| Children | Married-Couple Families | Single-Parent Households |
| No Children | 33 (2.1%) | 78 (31.7%) |
| 1 or 2 Children | 0 (0.0%) | 10 (6.9%) |
| 3 or 4 Children | 0 (0.0%) | 0 (0.0%) |
| 5 or more Children | 0 (0.0%) | 0 (0.0%) |
| Total | 33 (1.0%) | 88 (20.4%) |
Race in Trophy Club
The most populous races in Trophy Club are White / Caucasian (10,708 | 80.8%), Hispanic or Latino (1,486 | 11.2%), and Two or more Races (1,445 | 10.9%).
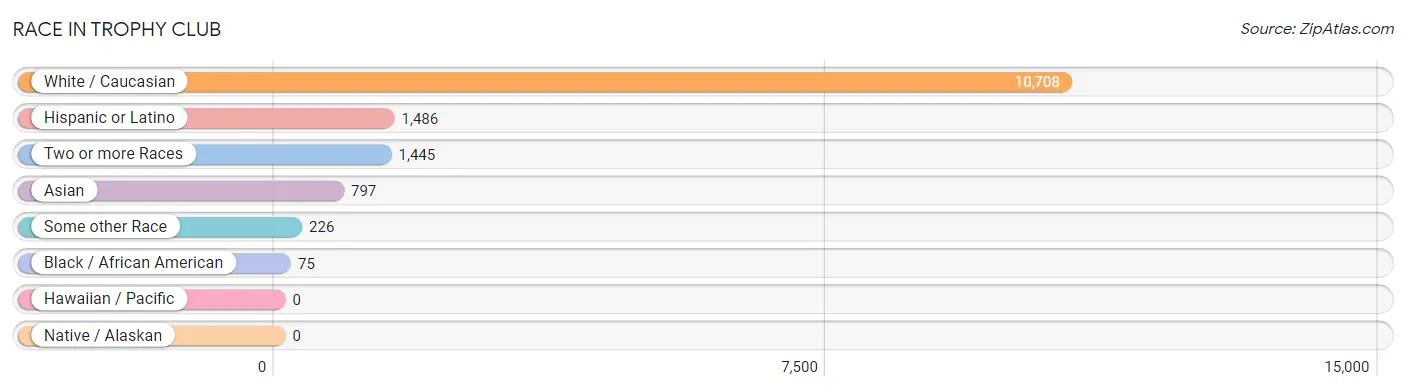
| Race | # Population | % Population |
| Asian | 797 | 6.0% |
| Black / African American | 75 | 0.6% |
| Hawaiian / Pacific | 0 | 0.0% |
| Hispanic or Latino | 1,486 | 11.2% |
| Native / Alaskan | 0 | 0.0% |
| White / Caucasian | 10,708 | 80.8% |
| Two or more Races | 1,445 | 10.9% |
| Some other Race | 226 | 1.7% |
| Total | 13,251 | 100.0% |
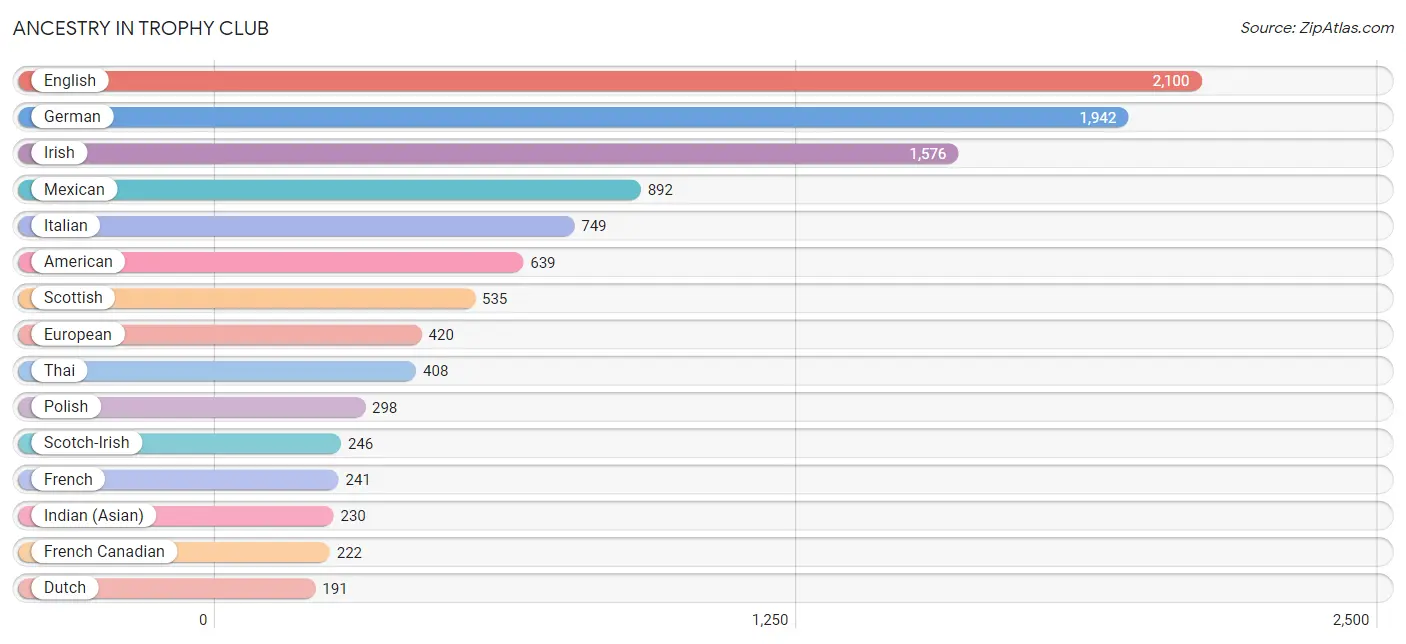
Ancestry in Trophy Club
The most populous ancestries reported in Trophy Club are English (2,100 | 15.9%), German (1,942 | 14.7%), Irish (1,576 | 11.9%), Mexican (892 | 6.7%), and Italian (749 | 5.7%), together accounting for 54.8% of all Trophy Club residents.
| Ancestry | # Population | % Population |
| American | 639 | 4.8% |
| Arab | 78 | 0.6% |
| Armenian | 16 | 0.1% |
| Australian | 27 | 0.2% |
| Austrian | 38 | 0.3% |
| Basque | 25 | 0.2% |
| Belgian | 13 | 0.1% |
| Bhutanese | 54 | 0.4% |
| Bolivian | 63 | 0.5% |
| British | 98 | 0.7% |
| Burmese | 94 | 0.7% |
| Central American | 10 | 0.1% |
| Cherokee | 55 | 0.4% |
| Choctaw | 9 | 0.1% |
| Cuban | 100 | 0.7% |
| Czech | 37 | 0.3% |
| Danish | 21 | 0.2% |
| Dutch | 191 | 1.4% |
| Eastern European | 101 | 0.8% |
| English | 2,100 | 15.9% |
| European | 420 | 3.2% |
| Filipino | 14 | 0.1% |
| Finnish | 53 | 0.4% |
| French | 241 | 1.8% |
| French Canadian | 222 | 1.7% |
| German | 1,942 | 14.7% |
| Greek | 19 | 0.1% |
| Hungarian | 94 | 0.7% |
| Indian (Asian) | 230 | 1.7% |
| Irish | 1,576 | 11.9% |
| Italian | 749 | 5.7% |
| Japanese | 102 | 0.8% |
| Korean | 11 | 0.1% |
| Lebanese | 60 | 0.4% |
| Lithuanian | 16 | 0.1% |
| Mexican | 892 | 6.7% |
| Nigerian | 35 | 0.3% |
| Northern European | 5 | 0.0% |
| Norwegian | 184 | 1.4% |
| Pakistani | 60 | 0.4% |
| Palestinian | 18 | 0.1% |
| Polish | 298 | 2.2% |
| Portuguese | 77 | 0.6% |
| Puerto Rican | 161 | 1.2% |
| Romanian | 18 | 0.1% |
| Russian | 51 | 0.4% |
| Salvadoran | 10 | 0.1% |
| Samoan | 46 | 0.4% |
| Scandinavian | 133 | 1.0% |
| Scotch-Irish | 246 | 1.9% |
| Scottish | 535 | 4.0% |
| Slavic | 10 | 0.1% |
| Slovak | 13 | 0.1% |
| Somali | 23 | 0.2% |
| South African | 36 | 0.3% |
| South American | 63 | 0.5% |
| Spaniard | 58 | 0.4% |
| Spanish American | 94 | 0.7% |
| Sri Lankan | 30 | 0.2% |
| Subsaharan African | 94 | 0.7% |
| Swedish | 161 | 1.2% |
| Swiss | 8 | 0.1% |
| Syrian | 18 | 0.1% |
| Thai | 408 | 3.1% |
| Welsh | 97 | 0.7% | View All 65 Rows |
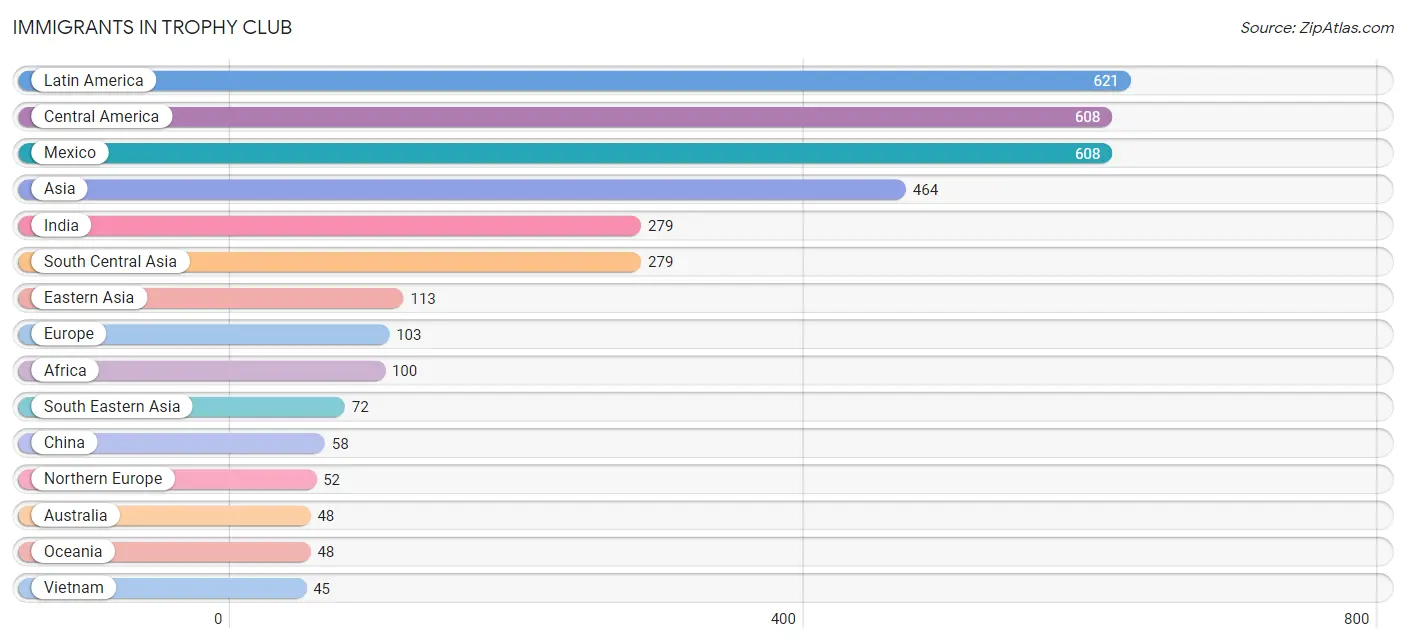
Immigrants in Trophy Club
The most numerous immigrant groups reported in Trophy Club came from Latin America (621 | 4.7%), Central America (608 | 4.6%), Mexico (608 | 4.6%), Asia (464 | 3.5%), and India (279 | 2.1%), together accounting for 19.5% of all Trophy Club residents.
| Immigration Origin | # Population | % Population |
| Africa | 100 | 0.7% |
| Asia | 464 | 3.5% |
| Australia | 48 | 0.4% |
| Central America | 608 | 4.6% |
| China | 58 | 0.4% |
| Colombia | 13 | 0.1% |
| Eastern Africa | 20 | 0.2% |
| Eastern Asia | 113 | 0.9% |
| Eastern Europe | 16 | 0.1% |
| England | 20 | 0.2% |
| Europe | 103 | 0.8% |
| Germany | 16 | 0.1% |
| India | 279 | 2.1% |
| Ireland | 17 | 0.1% |
| Italy | 19 | 0.1% |
| Japan | 12 | 0.1% |
| Korea | 43 | 0.3% |
| Latin America | 621 | 4.7% |
| Mexico | 608 | 4.6% |
| Nigeria | 44 | 0.3% |
| Northern Europe | 52 | 0.4% |
| Oceania | 48 | 0.4% |
| South Africa | 36 | 0.3% |
| South America | 13 | 0.1% |
| South Central Asia | 279 | 2.1% |
| South Eastern Asia | 72 | 0.5% |
| Southern Europe | 19 | 0.1% |
| Taiwan | 10 | 0.1% |
| Thailand | 27 | 0.2% |
| Uganda | 7 | 0.1% |
| Ukraine | 16 | 0.1% |
| Vietnam | 45 | 0.3% |
| Western Africa | 44 | 0.3% |
| Western Europe | 16 | 0.1% | View All 34 Rows |
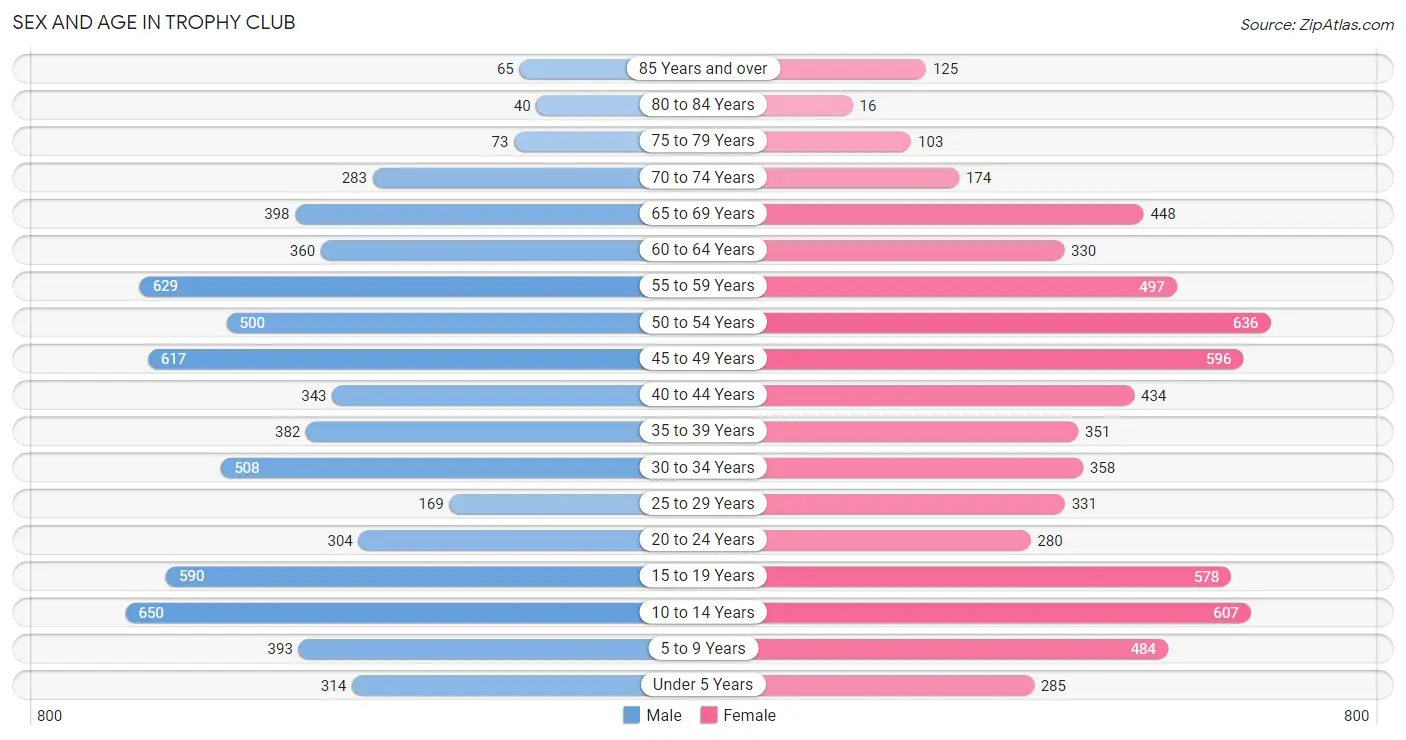
Sex and Age in Trophy Club
Sex and Age in Trophy Club
The most populous age groups in Trophy Club are 10 to 14 Years (650 | 9.8%) for men and 50 to 54 Years (636 | 9.6%) for women.
| Age Bracket | Male | Female |
| Under 5 Years | 314 (4.7%) | 285 (4.3%) |
| 5 to 9 Years | 393 (5.9%) | 484 (7.3%) |
| 10 to 14 Years | 650 (9.8%) | 607 (9.1%) |
| 15 to 19 Years | 590 (8.9%) | 578 (8.7%) |
| 20 to 24 Years | 304 (4.6%) | 280 (4.2%) |
| 25 to 29 Years | 169 (2.5%) | 331 (5.0%) |
| 30 to 34 Years | 508 (7.7%) | 358 (5.4%) |
| 35 to 39 Years | 382 (5.8%) | 351 (5.3%) |
| 40 to 44 Years | 343 (5.2%) | 434 (6.5%) |
| 45 to 49 Years | 617 (9.3%) | 596 (9.0%) |
| 50 to 54 Years | 500 (7.6%) | 636 (9.6%) |
| 55 to 59 Years | 629 (9.5%) | 497 (7.5%) |
| 60 to 64 Years | 360 (5.4%) | 330 (5.0%) |
| 65 to 69 Years | 398 (6.0%) | 448 (6.8%) |
| 70 to 74 Years | 283 (4.3%) | 174 (2.6%) |
| 75 to 79 Years | 73 (1.1%) | 103 (1.5%) |
| 80 to 84 Years | 40 (0.6%) | 16 (0.2%) |
| 85 Years and over | 65 (1.0%) | 125 (1.9%) |
| Total | 6,618 (100.0%) | 6,633 (100.0%) |
Families and Households in Trophy Club
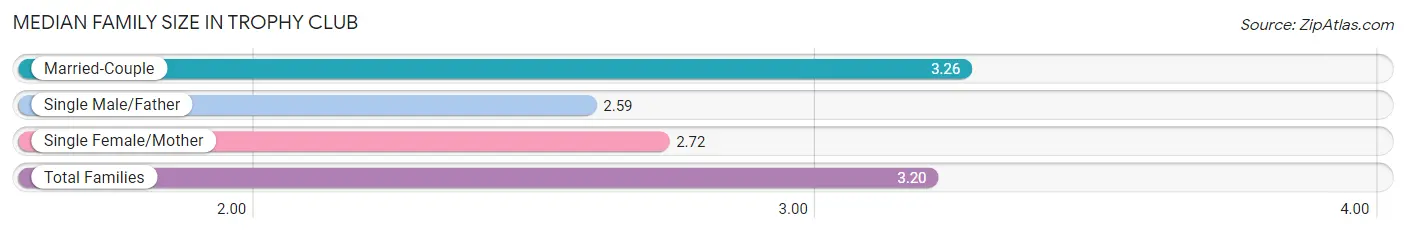
Median Family Size in Trophy Club
The median family size in Trophy Club is 3.20 persons per family, with married-couple families (3,398 | 88.7%) accounting for the largest median family size of 3.26 persons per family. On the other hand, single male/father families (81 | 2.1%) represent the smallest median family size with 2.59 persons per family.
| Family Type | # Families | Family Size |
| Married-Couple | 3,398 (88.7%) | 3.26 |
| Single Male/Father | 81 (2.1%) | 2.59 |
| Single Female/Mother | 351 (9.2%) | 2.72 |
| Total Families | 3,830 (100.0%) | 3.20 |
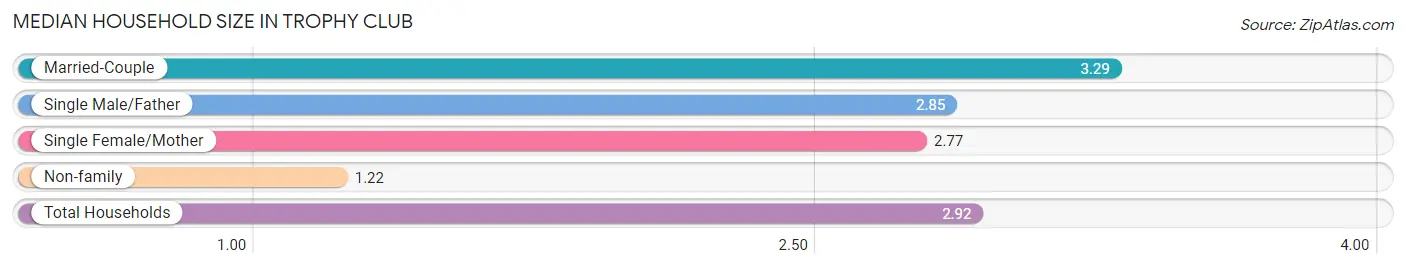
Median Household Size in Trophy Club
The median household size in Trophy Club is 2.92 persons per household, with married-couple households (3,398 | 74.9%) accounting for the largest median household size of 3.29 persons per household. non-family households (706 | 15.6%) represent the smallest median household size with 1.22 persons per household.
| Household Type | # Households | Household Size |
| Married-Couple | 3,398 (74.9%) | 3.29 |
| Single Male/Father | 81 (1.8%) | 2.85 |
| Single Female/Mother | 351 (7.7%) | 2.77 |
| Non-family | 706 (15.6%) | 1.22 |
| Total Households | 4,536 (100.0%) | 2.92 |
Household Size by Marriage Status in Trophy Club
Out of a total of 4,536 households in Trophy Club, 3,830 (84.4%) are family households, while 706 (15.6%) are nonfamily households. The most numerous type of family households are 2-person households, comprising 1,499, and the most common type of nonfamily households are 1-person households, comprising 563.
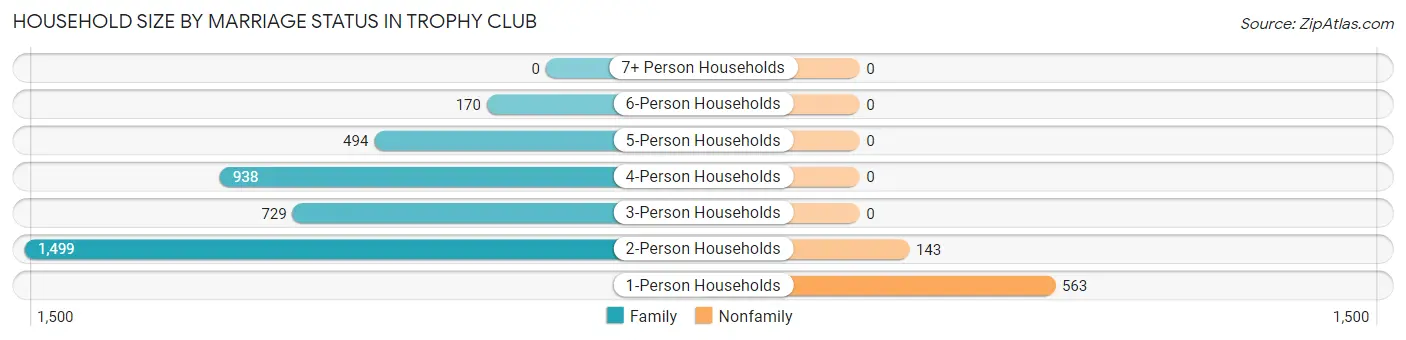
| Household Size | Family Households | Nonfamily Households |
| 1-Person Households | - | 563 (12.4%) |
| 2-Person Households | 1,499 (33.1%) | 143 (3.2%) |
| 3-Person Households | 729 (16.1%) | 0 (0.0%) |
| 4-Person Households | 938 (20.7%) | 0 (0.0%) |
| 5-Person Households | 494 (10.9%) | 0 (0.0%) |
| 6-Person Households | 170 (3.7%) | 0 (0.0%) |
| 7+ Person Households | 0 (0.0%) | 0 (0.0%) |
| Total | 3,830 (84.4%) | 706 (15.6%) |
Female Fertility in Trophy Club
Fertility by Age in Trophy Club
Average fertility rate in Trophy Club is 37.0 births per 1,000 women. Women in the age bracket of 20 to 34 years have the highest fertility rate with 71.0 births per 1,000 women. Women in the age bracket of 20 to 34 years acount for 60.5% of all women with births.
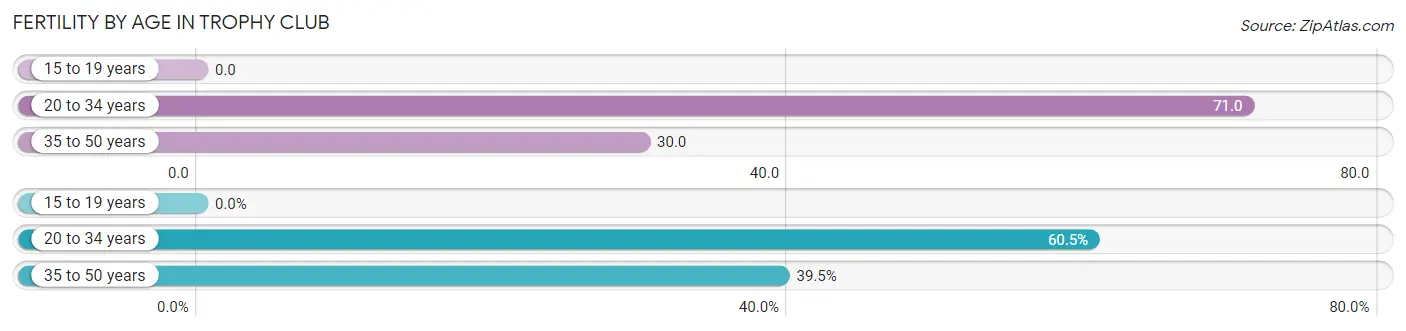
| Age Bracket | Women with Births | Births / 1,000 Women |
| 15 to 19 years | 0 (0.0%) | 0.0 |
| 20 to 34 years | 69 (60.5%) | 71.0 |
| 35 to 50 years | 45 (39.5%) | 30.0 |
| Total | 114 (100.0%) | 37.0 |
Fertility by Age by Marriage Status in Trophy Club
80.7% of women with births (114) in Trophy Club are married. The highest percentage of unmarried women with births falls into 20 to 34 years age bracket with 31.9% of them unmarried at the time of birth, while the lowest percentage of unmarried women with births belong to 35 to 50 years age bracket with 0.0% of them unmarried.
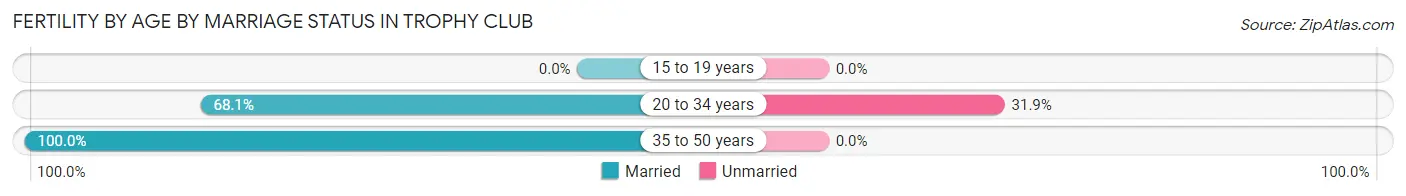
| Age Bracket | Married | Unmarried |
| 15 to 19 years | 0 (0.0%) | 0 (0.0%) |
| 20 to 34 years | 47 (68.1%) | 22 (31.9%) |
| 35 to 50 years | 45 (100.0%) | 0 (0.0%) |
| Total | 92 (80.7%) | 22 (19.3%) |
Fertility by Education in Trophy Club
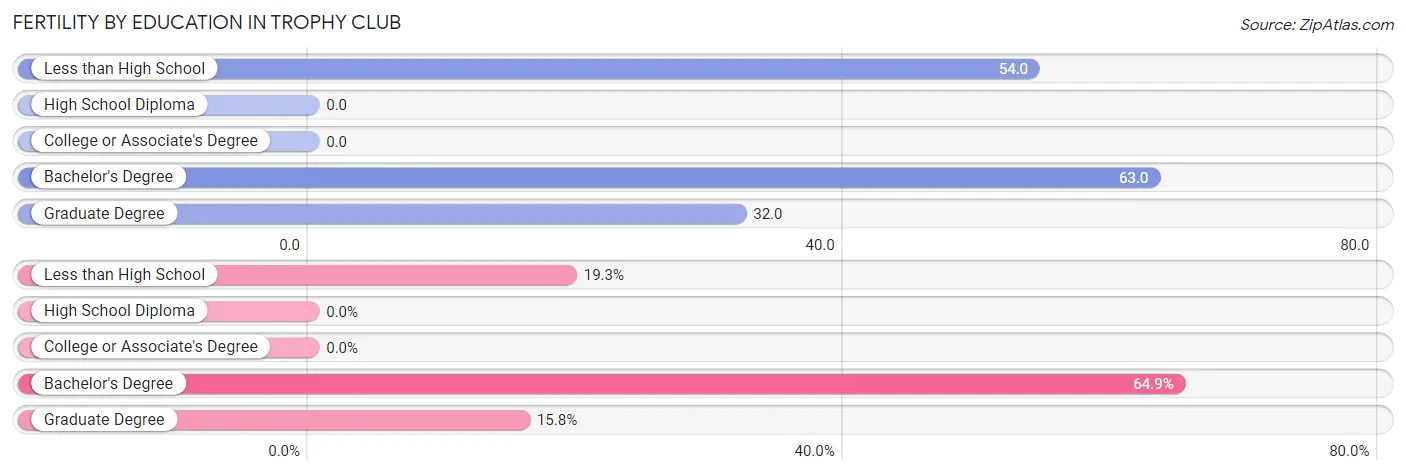
| Educational Attainment | Women with Births | Births / 1,000 Women |
| Less than High School | 22 (19.3%) | 54.0 |
| High School Diploma | 0 (0.0%) | 0.0 |
| College or Associate's Degree | 0 (0.0%) | 0.0 |
| Bachelor's Degree | 74 (64.9%) | 63.0 |
| Graduate Degree | 18 (15.8%) | 32.0 |
| Total | 114 (100.0%) | 37.0 |
Fertility by Education by Marriage Status in Trophy Club
19.3% of women with births in Trophy Club are unmarried. Women with the educational attainment of bachelor's degree are most likely to be married with 100.0% of them married at childbirth, while women with the educational attainment of less than high school are least likely to be married with 100.0% of them unmarried at childbirth.
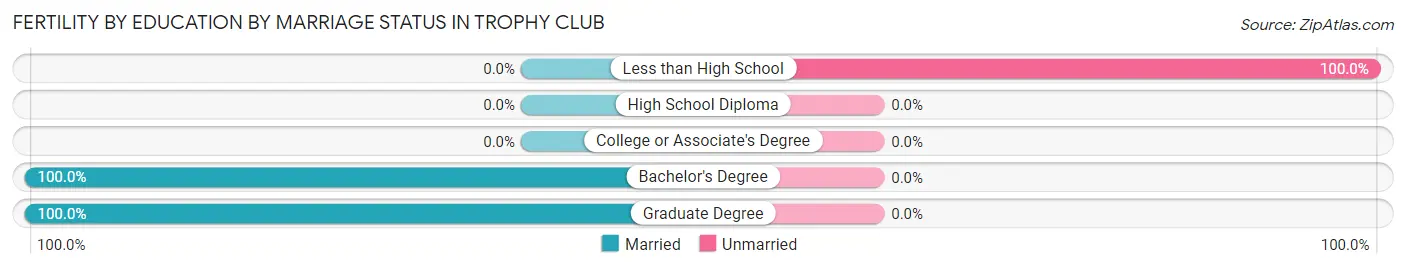
| Educational Attainment | Married | Unmarried |
| Less than High School | 0 (0.0%) | 22 (100.0%) |
| High School Diploma | 0 (0.0%) | 0 (0.0%) |
| College or Associate's Degree | 0 (0.0%) | 0 (0.0%) |
| Bachelor's Degree | 74 (100.0%) | 0 (0.0%) |
| Graduate Degree | 18 (100.0%) | 0 (0.0%) |
| Total | 92 (80.7%) | 22 (19.3%) |
Employment Characteristics in Trophy Club
Employment by Class of Employer in Trophy Club
Among the 6,909 employed individuals in Trophy Club, private company employees (4,721 | 68.3%), local government employees (703 | 10.2%), and self-employed (not incorporated) (575 | 8.3%) make up the most common classes of employment.
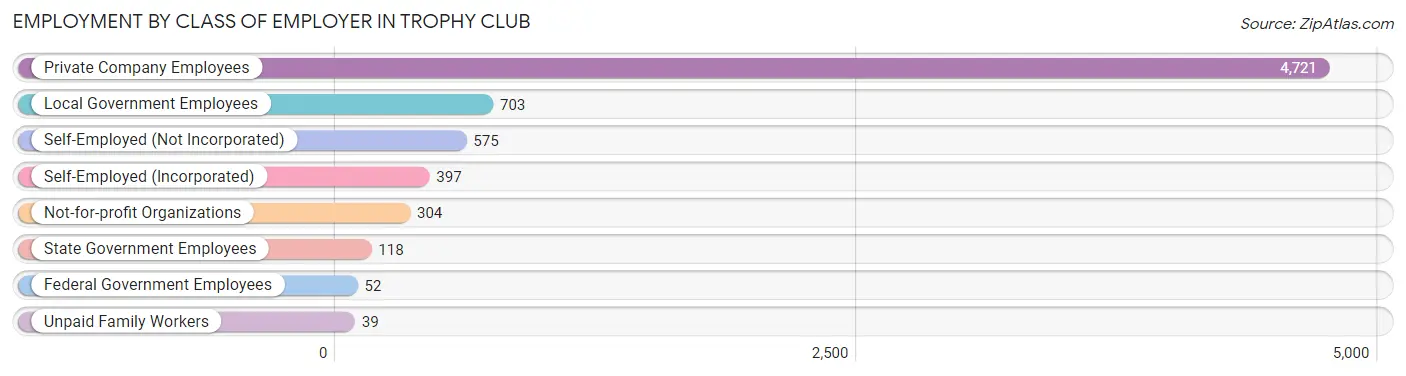
| Employer Class | # Employees | % Employees |
| Private Company Employees | 4,721 | 68.3% |
| Self-Employed (Incorporated) | 397 | 5.8% |
| Self-Employed (Not Incorporated) | 575 | 8.3% |
| Not-for-profit Organizations | 304 | 4.4% |
| Local Government Employees | 703 | 10.2% |
| State Government Employees | 118 | 1.7% |
| Federal Government Employees | 52 | 0.7% |
| Unpaid Family Workers | 39 | 0.6% |
| Total | 6,909 | 100.0% |
Employment Status by Age in Trophy Club
According to the labor force statistics for Trophy Club, out of the total population over 16 years of age (10,312), 70.8% or 7,301 individuals are in the labor force, with 4.0% or 292 of them unemployed. The age group with the highest labor force participation rate is 30 to 34 years, with 90.5% or 784 individuals in the labor force. Within the labor force, the 20 to 24 years age range has the highest percentage of unemployed individuals, with 12.5% or 60 of them being unemployed.
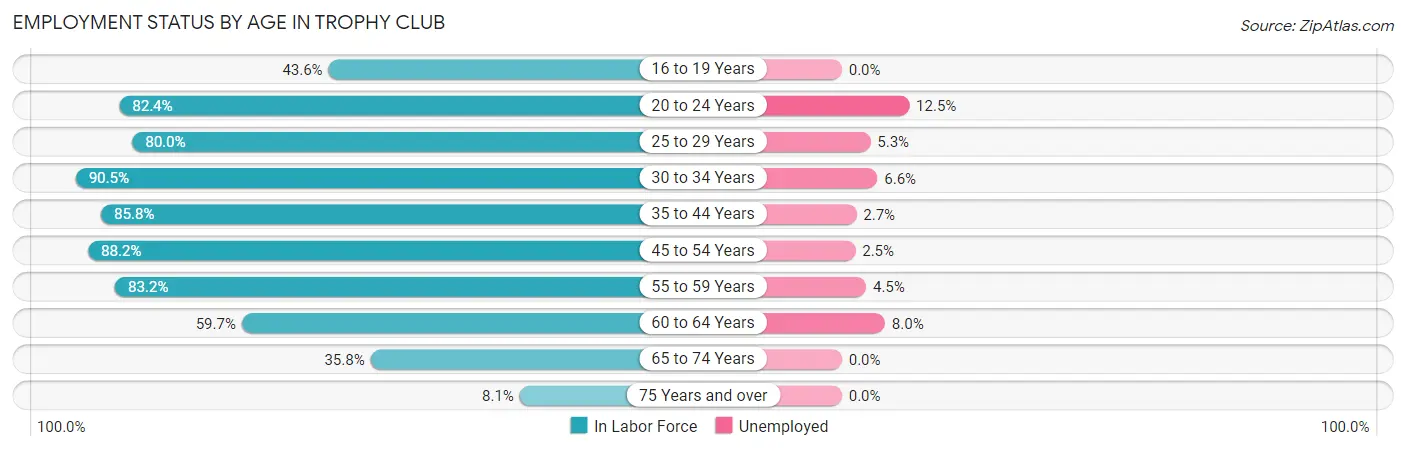
| Age Bracket | In Labor Force | Unemployed |
| 16 to 19 Years | 419 (43.6%) | 0 (0.0%) |
| 20 to 24 Years | 481 (82.4%) | 60 (12.5%) |
| 25 to 29 Years | 400 (80.0%) | 21 (5.3%) |
| 30 to 34 Years | 784 (90.5%) | 52 (6.6%) |
| 35 to 44 Years | 1,296 (85.8%) | 35 (2.7%) |
| 45 to 54 Years | 2,072 (88.2%) | 52 (2.5%) |
| 55 to 59 Years | 937 (83.2%) | 42 (4.5%) |
| 60 to 64 Years | 412 (59.7%) | 33 (8.0%) |
| 65 to 74 Years | 466 (35.8%) | 0 (0.0%) |
| 75 Years and over | 34 (8.1%) | 0 (0.0%) |
| Total | 7,301 (70.8%) | 292 (4.0%) |
Employment Status by Educational Attainment in Trophy Club
According to labor force statistics for Trophy Club, 83.8% of individuals (5,900) out of the total population between 25 and 64 years of age (7,041) are in the labor force, with 4.0% or 236 of them being unemployed. The group with the highest labor force participation rate are those with the educational attainment of college / associate degree, with 89.4% or 1,223 individuals in the labor force. Within the labor force, individuals with college / associate degree education have the highest percentage of unemployment, with 8.7% or 106 of them being unemployed.
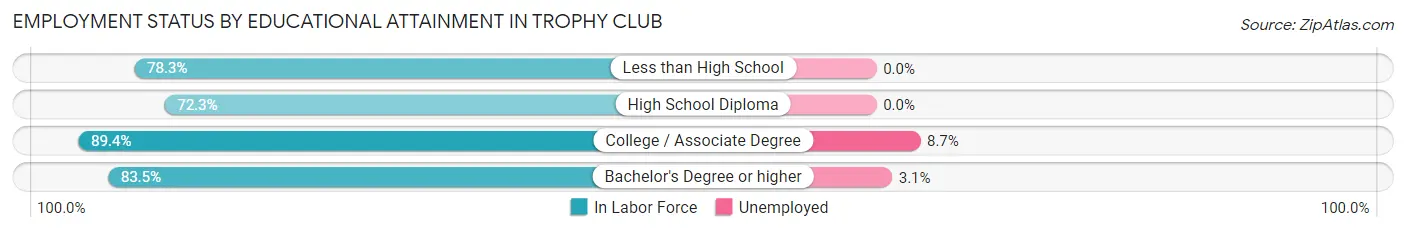
| Educational Attainment | In Labor Force | Unemployed |
| Less than High School | 202 (78.3%) | 0 (0.0%) |
| High School Diploma | 284 (72.3%) | 0 (0.0%) |
| College / Associate Degree | 1,223 (89.4%) | 119 (8.7%) |
| Bachelor's Degree or higher | 4,193 (83.5%) | 156 (3.1%) |
| Total | 5,900 (83.8%) | 282 (4.0%) |
Employment Occupations by Sex in Trophy Club
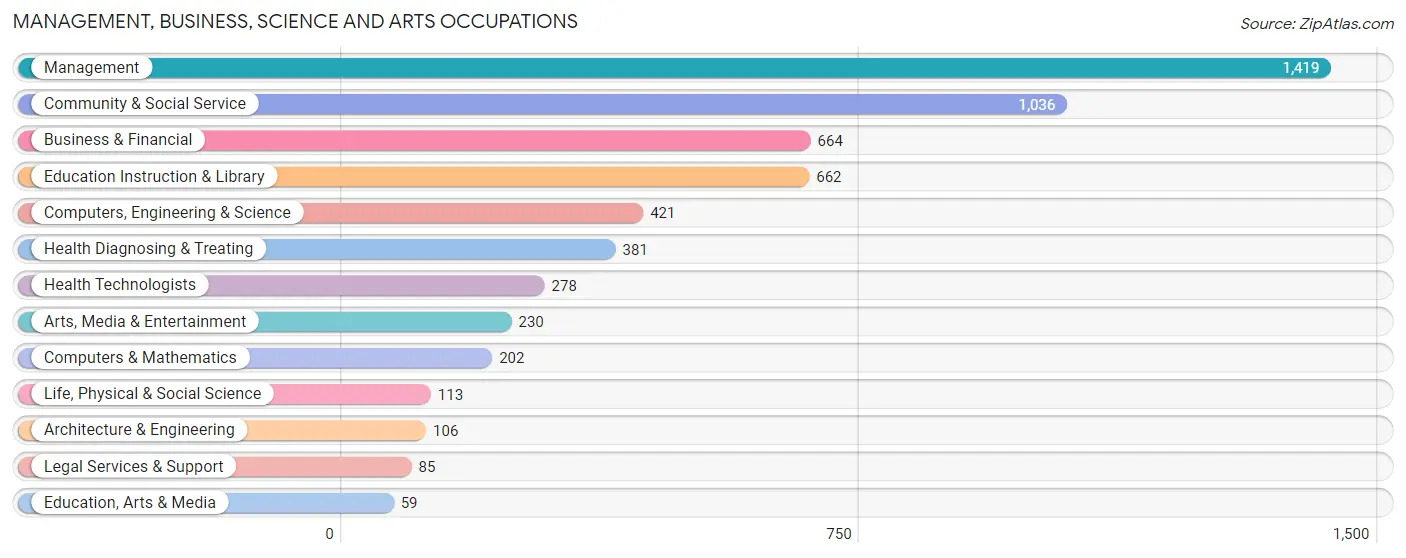
Management, Business, Science and Arts Occupations
The most common Management, Business, Science and Arts occupations in Trophy Club are Management (1,419 | 20.3%), Community & Social Service (1,036 | 14.8%), Business & Financial (664 | 9.5%), Education Instruction & Library (662 | 9.5%), and Computers, Engineering & Science (421 | 6.0%).
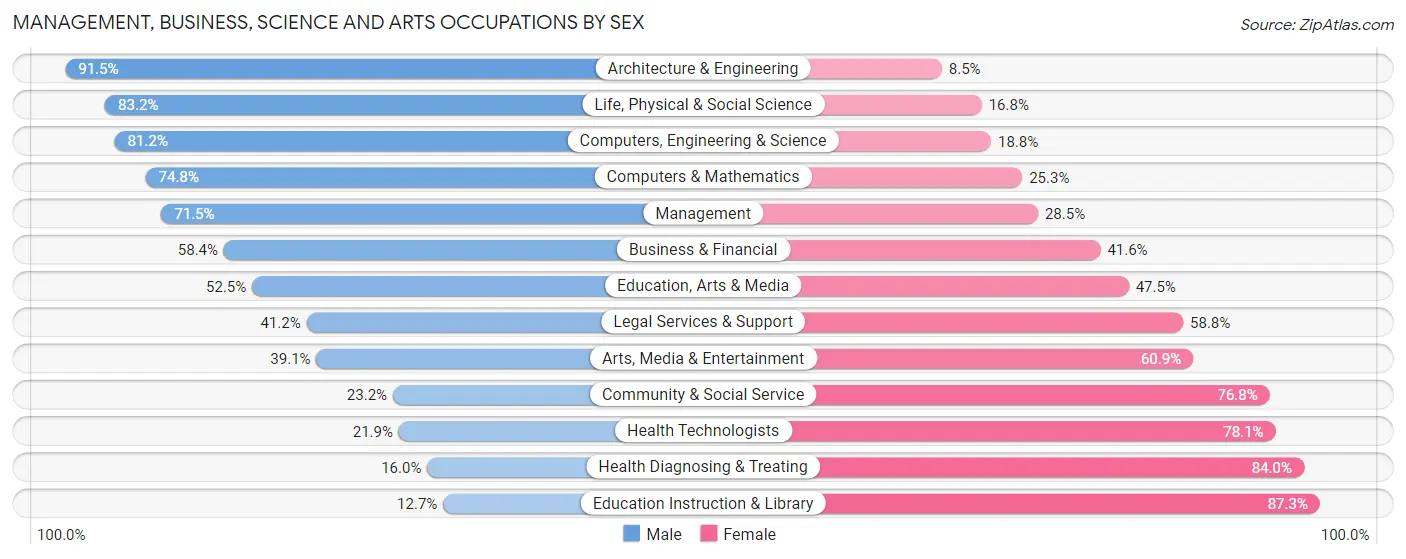
Management, Business, Science and Arts Occupations by Sex
Within the Management, Business, Science and Arts occupations in Trophy Club, the most male-oriented occupations are Architecture & Engineering (91.5%), Life, Physical & Social Science (83.2%), and Computers, Engineering & Science (81.2%), while the most female-oriented occupations are Education Instruction & Library (87.3%), Health Diagnosing & Treating (84.0%), and Health Technologists (78.1%).
| Occupation | Male | Female |
| Management | 1,014 (71.5%) | 405 (28.5%) |
| Business & Financial | 388 (58.4%) | 276 (41.6%) |
| Computers, Engineering & Science | 342 (81.2%) | 79 (18.8%) |
| Computers & Mathematics | 151 (74.8%) | 51 (25.3%) |
| Architecture & Engineering | 97 (91.5%) | 9 (8.5%) |
| Life, Physical & Social Science | 94 (83.2%) | 19 (16.8%) |
| Community & Social Service | 240 (23.2%) | 796 (76.8%) |
| Education, Arts & Media | 31 (52.5%) | 28 (47.5%) |
| Legal Services & Support | 35 (41.2%) | 50 (58.8%) |
| Education Instruction & Library | 84 (12.7%) | 578 (87.3%) |
| Arts, Media & Entertainment | 90 (39.1%) | 140 (60.9%) |
| Health Diagnosing & Treating | 61 (16.0%) | 320 (84.0%) |
| Health Technologists | 61 (21.9%) | 217 (78.1%) |
| Total (Category) | 2,045 (52.2%) | 1,876 (47.8%) |
| Total (Overall) | 3,760 (53.7%) | 3,245 (46.3%) |
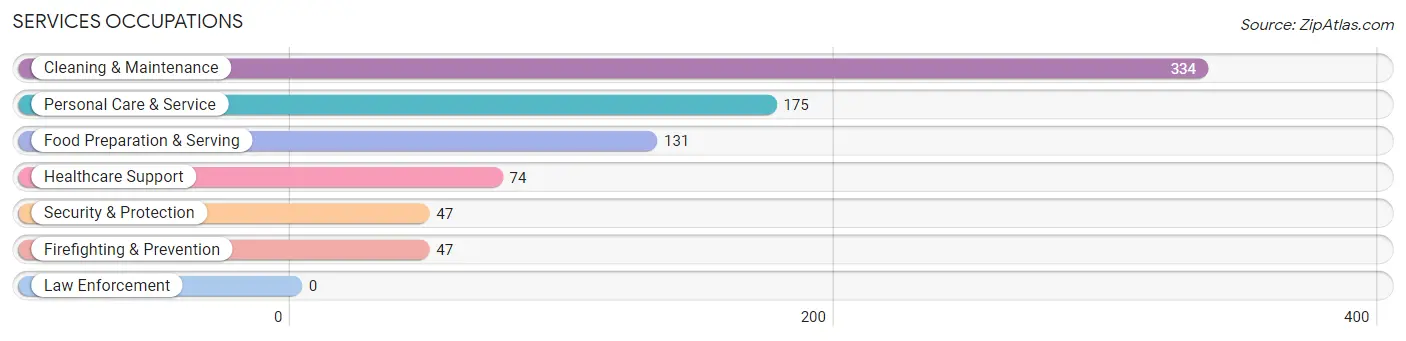
Services Occupations
The most common Services occupations in Trophy Club are Cleaning & Maintenance (334 | 4.8%), Personal Care & Service (175 | 2.5%), Food Preparation & Serving (131 | 1.9%), Healthcare Support (74 | 1.1%), and Security & Protection (47 | 0.7%).
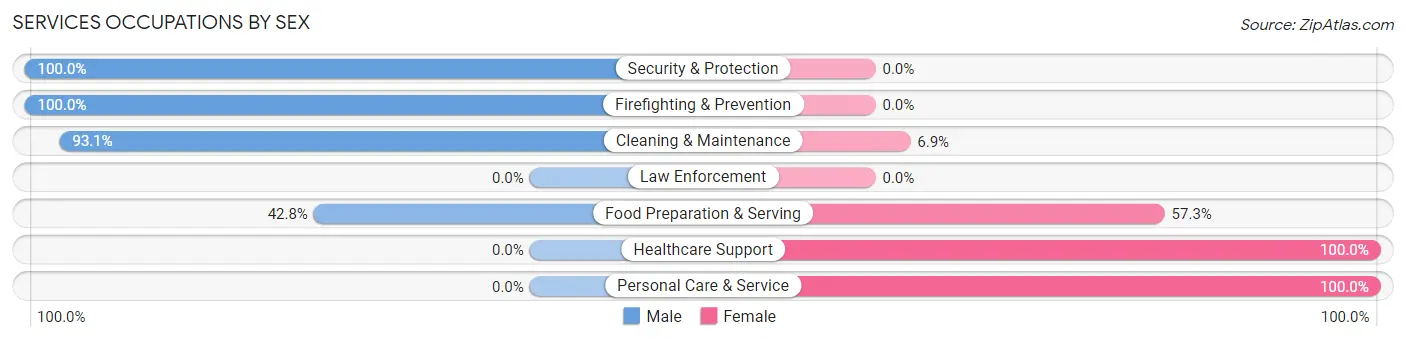
Services Occupations by Sex
Within the Services occupations in Trophy Club, the most male-oriented occupations are Security & Protection (100.0%), Firefighting & Prevention (100.0%), and Cleaning & Maintenance (93.1%), while the most female-oriented occupations are Healthcare Support (100.0%), Personal Care & Service (100.0%), and Food Preparation & Serving (57.3%).
| Occupation | Male | Female |
| Healthcare Support | 0 (0.0%) | 74 (100.0%) |
| Security & Protection | 47 (100.0%) | 0 (0.0%) |
| Firefighting & Prevention | 47 (100.0%) | 0 (0.0%) |
| Law Enforcement | 0 (0.0%) | 0 (0.0%) |
| Food Preparation & Serving | 56 (42.7%) | 75 (57.3%) |
| Cleaning & Maintenance | 311 (93.1%) | 23 (6.9%) |
| Personal Care & Service | 0 (0.0%) | 175 (100.0%) |
| Total (Category) | 414 (54.4%) | 347 (45.6%) |
| Total (Overall) | 3,760 (53.7%) | 3,245 (46.3%) |
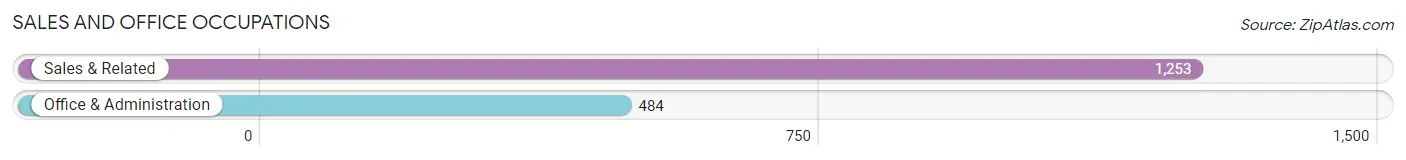
Sales and Office Occupations
The most common Sales and Office occupations in Trophy Club are Sales & Related (1,253 | 17.9%), and Office & Administration (484 | 6.9%).
Sales and Office Occupations by Sex
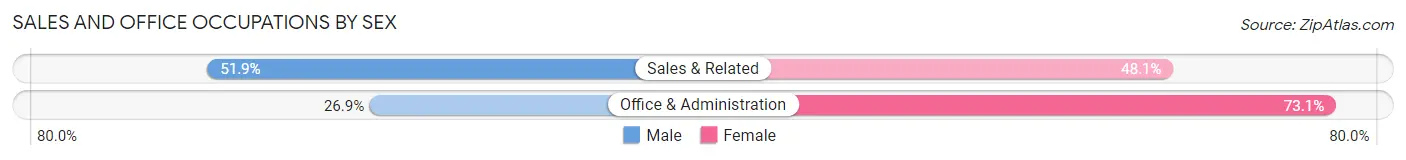
| Occupation | Male | Female |
| Sales & Related | 650 (51.9%) | 603 (48.1%) |
| Office & Administration | 130 (26.9%) | 354 (73.1%) |
| Total (Category) | 780 (44.9%) | 957 (55.1%) |
| Total (Overall) | 3,760 (53.7%) | 3,245 (46.3%) |
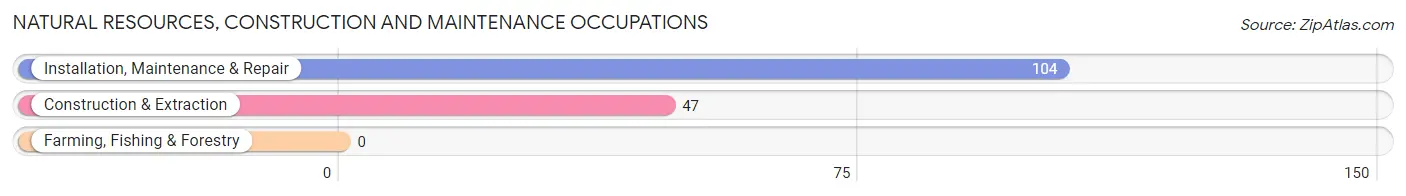
Natural Resources, Construction and Maintenance Occupations
The most common Natural Resources, Construction and Maintenance occupations in Trophy Club are Installation, Maintenance & Repair (104 | 1.5%), and Construction & Extraction (47 | 0.7%).
Natural Resources, Construction and Maintenance Occupations by Sex
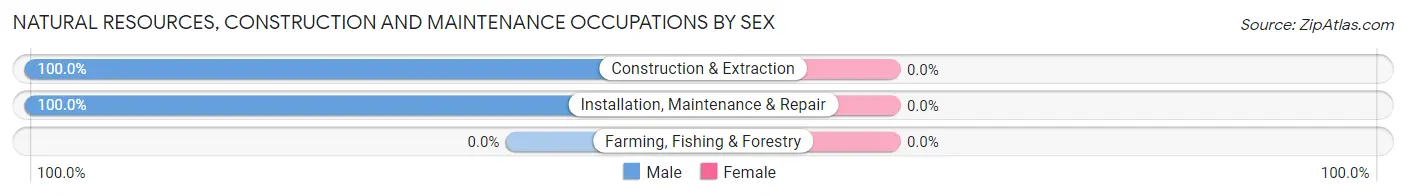
| Occupation | Male | Female |
| Farming, Fishing & Forestry | 0 (0.0%) | 0 (0.0%) |
| Construction & Extraction | 47 (100.0%) | 0 (0.0%) |
| Installation, Maintenance & Repair | 104 (100.0%) | 0 (0.0%) |
| Total (Category) | 151 (100.0%) | 0 (0.0%) |
| Total (Overall) | 3,760 (53.7%) | 3,245 (46.3%) |
Production, Transportation and Moving Occupations
The most common Production, Transportation and Moving occupations in Trophy Club are Production (161 | 2.3%), Transportation (152 | 2.2%), and Material Moving (122 | 1.7%).
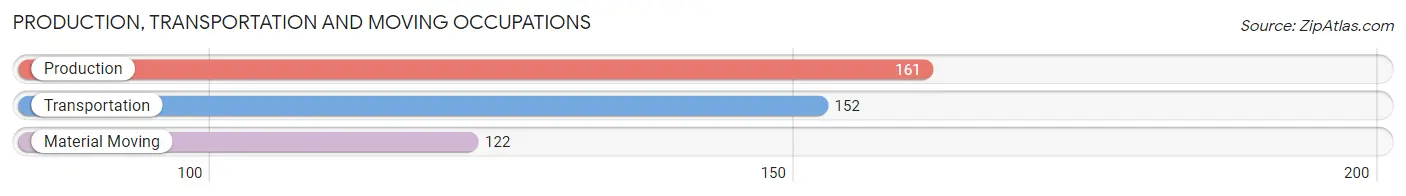
Production, Transportation and Moving Occupations by Sex
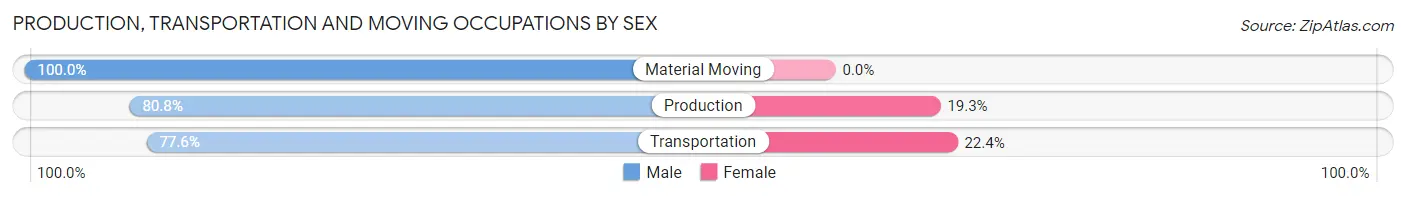
| Occupation | Male | Female |
| Production | 130 (80.7%) | 31 (19.3%) |
| Transportation | 118 (77.6%) | 34 (22.4%) |
| Material Moving | 122 (100.0%) | 0 (0.0%) |
| Total (Category) | 370 (85.1%) | 65 (14.9%) |
| Total (Overall) | 3,760 (53.7%) | 3,245 (46.3%) |
Employment Industries by Sex in Trophy Club
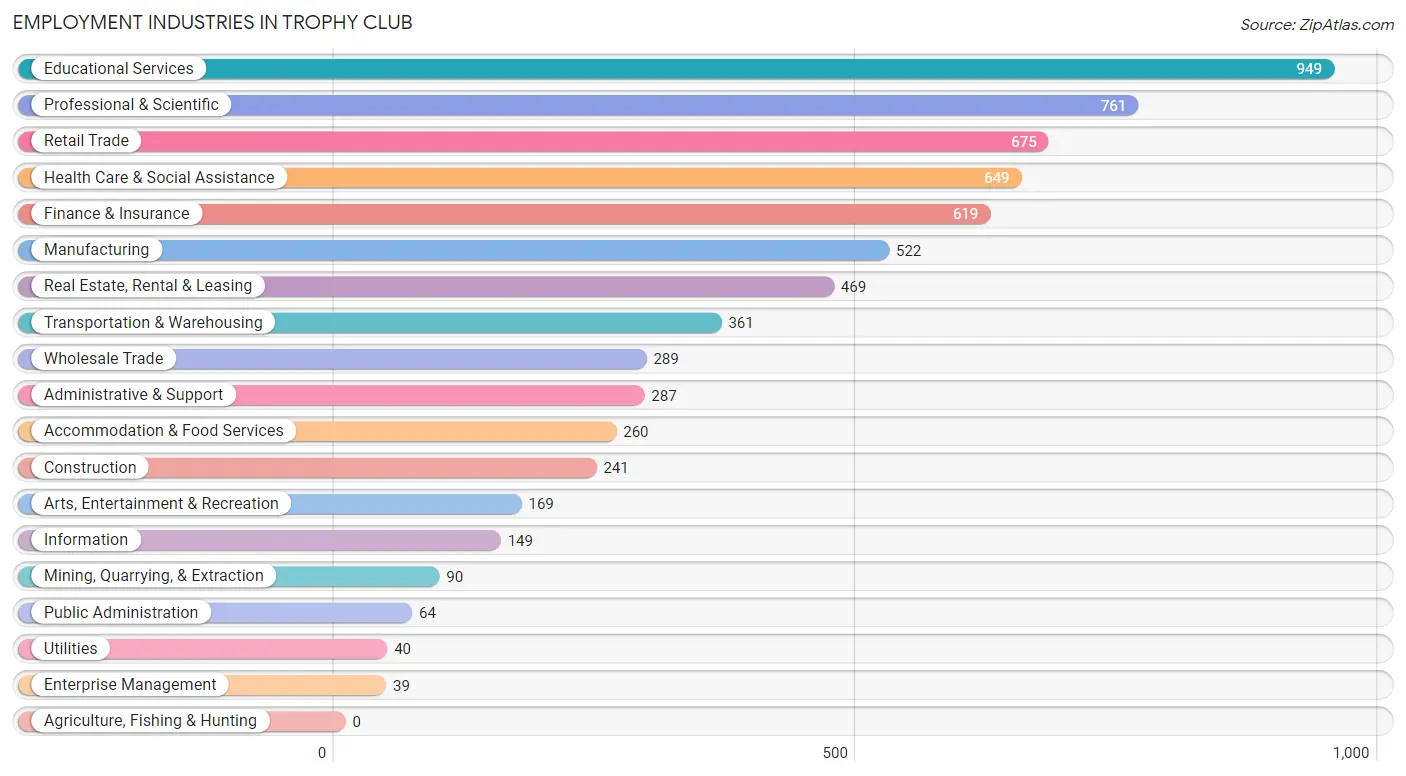
Employment Industries in Trophy Club
The major employment industries in Trophy Club include Educational Services (949 | 13.6%), Professional & Scientific (761 | 10.9%), Retail Trade (675 | 9.6%), Health Care & Social Assistance (649 | 9.3%), and Finance & Insurance (619 | 8.8%).
Employment Industries by Sex in Trophy Club
The Trophy Club industries that see more men than women are Utilities (100.0%), Enterprise Management (100.0%), and Information (88.6%), whereas the industries that tend to have a higher number of women are Educational Services (86.4%), Accommodation & Food Services (80.4%), and Mining, Quarrying, & Extraction (77.8%).
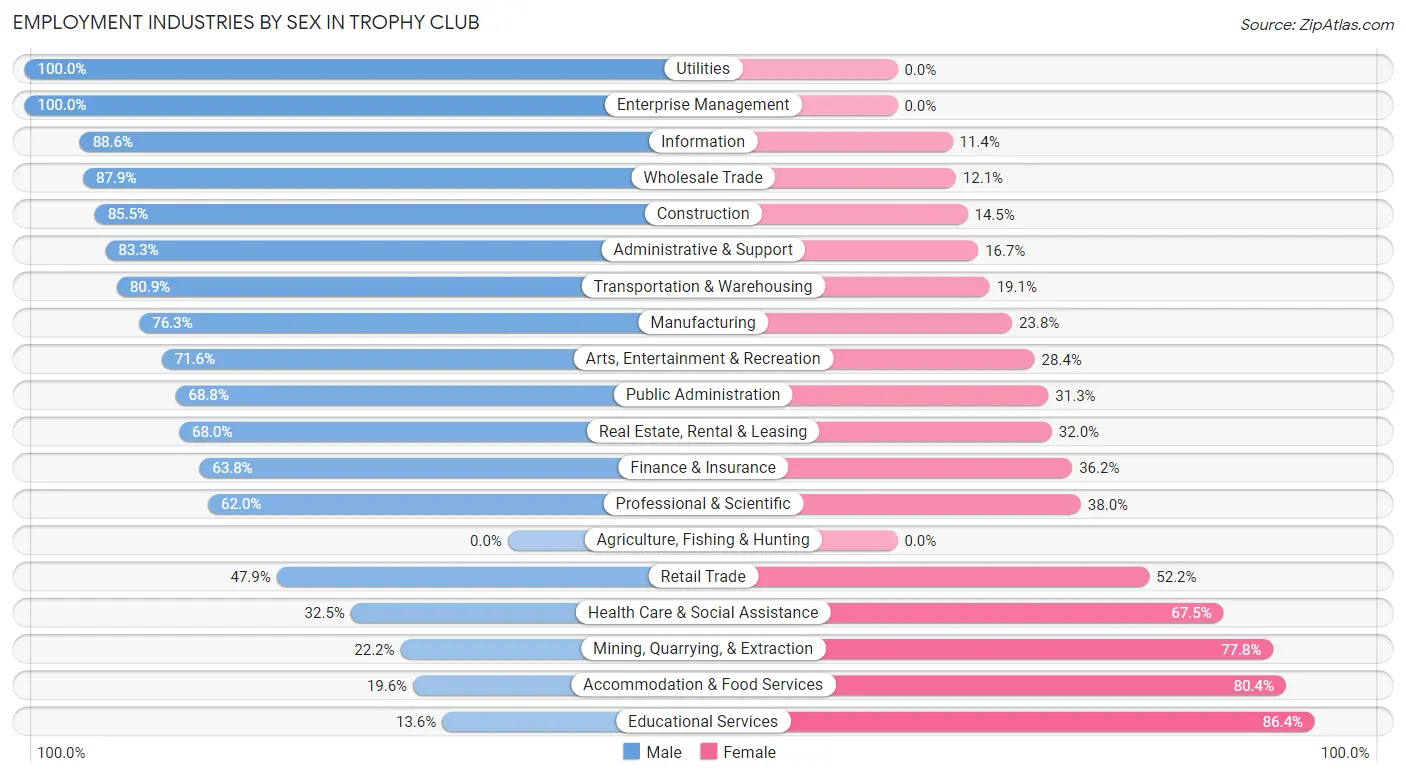
| Industry | Male | Female |
| Agriculture, Fishing & Hunting | 0 (0.0%) | 0 (0.0%) |
| Mining, Quarrying, & Extraction | 20 (22.2%) | 70 (77.8%) |
| Construction | 206 (85.5%) | 35 (14.5%) |
| Manufacturing | 398 (76.2%) | 124 (23.7%) |
| Wholesale Trade | 254 (87.9%) | 35 (12.1%) |
| Retail Trade | 323 (47.8%) | 352 (52.1%) |
| Transportation & Warehousing | 292 (80.9%) | 69 (19.1%) |
| Utilities | 40 (100.0%) | 0 (0.0%) |
| Information | 132 (88.6%) | 17 (11.4%) |
| Finance & Insurance | 395 (63.8%) | 224 (36.2%) |
| Real Estate, Rental & Leasing | 319 (68.0%) | 150 (32.0%) |
| Professional & Scientific | 472 (62.0%) | 289 (38.0%) |
| Enterprise Management | 39 (100.0%) | 0 (0.0%) |
| Administrative & Support | 239 (83.3%) | 48 (16.7%) |
| Educational Services | 129 (13.6%) | 820 (86.4%) |
| Health Care & Social Assistance | 211 (32.5%) | 438 (67.5%) |
| Arts, Entertainment & Recreation | 121 (71.6%) | 48 (28.4%) |
| Accommodation & Food Services | 51 (19.6%) | 209 (80.4%) |
| Public Administration | 44 (68.8%) | 20 (31.2%) |
| Total | 3,760 (53.7%) | 3,245 (46.3%) |
Education in Trophy Club
School Enrollment in Trophy Club
The most common levels of schooling among the 3,557 students in Trophy Club are high school (1,078 | 30.3%), middle school (743 | 20.9%), and elementary school (723 | 20.3%).
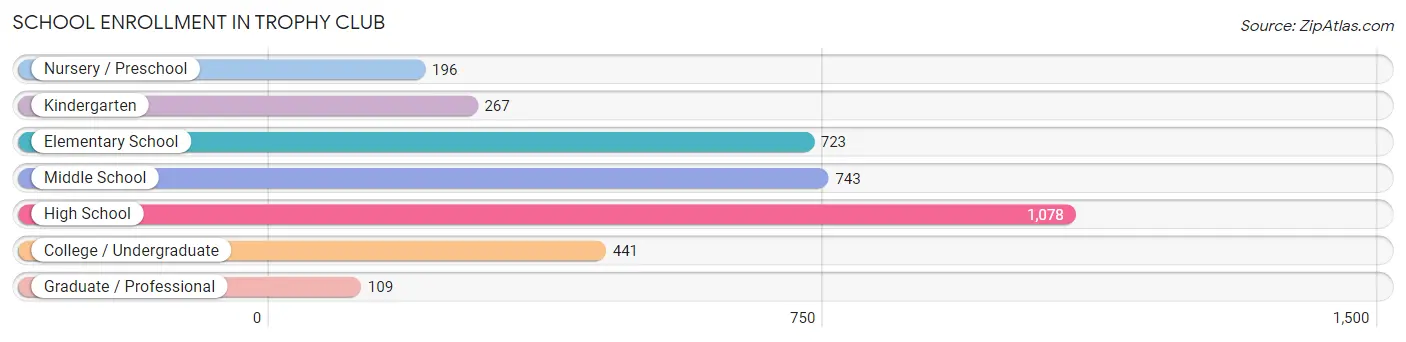
| School Level | # Students | % Students |
| Nursery / Preschool | 196 | 5.5% |
| Kindergarten | 267 | 7.5% |
| Elementary School | 723 | 20.3% |
| Middle School | 743 | 20.9% |
| High School | 1,078 | 30.3% |
| College / Undergraduate | 441 | 12.4% |
| Graduate / Professional | 109 | 3.1% |
| Total | 3,557 | 100.0% |
School Enrollment by Age by Funding Source in Trophy Club
Out of a total of 3,557 students who are enrolled in schools in Trophy Club, 580 (16.3%) attend a private institution, while the remaining 2,977 (83.7%) are enrolled in public schools. The age group of 3 to 4 year olds has the highest likelihood of being enrolled in private schools, with 69 (46.3% in the age bracket) enrolled. Conversely, the age group of 18 to 19 year olds has the lowest likelihood of being enrolled in a private school, with 319 (100.0% in the age bracket) attending a public institution.
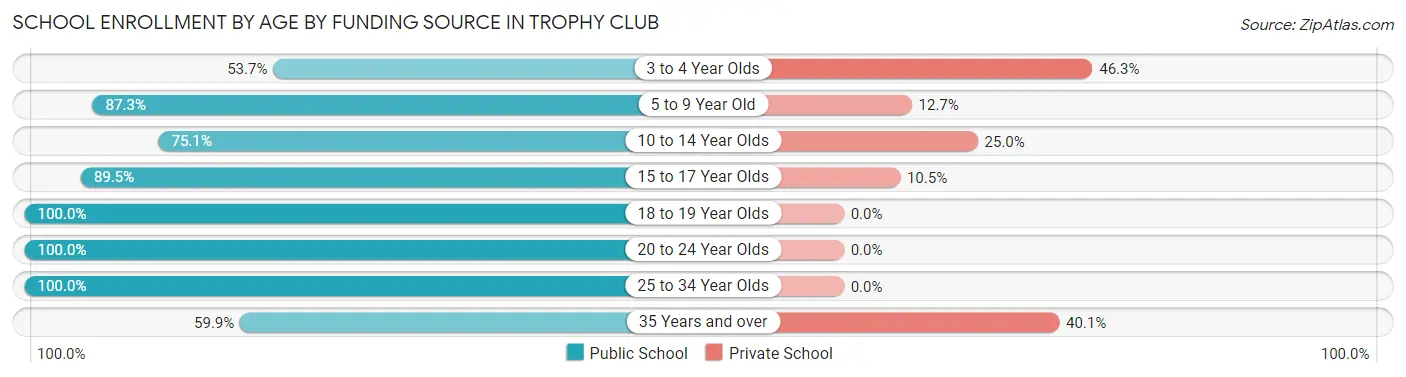
| Age Bracket | Public School | Private School |
| 3 to 4 Year Olds | 80 (53.7%) | 69 (46.3%) |
| 5 to 9 Year Old | 766 (87.3%) | 111 (12.7%) |
| 10 to 14 Year Olds | 794 (75.0%) | 264 (24.9%) |
| 15 to 17 Year Olds | 657 (89.5%) | 77 (10.5%) |
| 18 to 19 Year Olds | 319 (100.0%) | 0 (0.0%) |
| 20 to 24 Year Olds | 160 (100.0%) | 0 (0.0%) |
| 25 to 34 Year Olds | 113 (100.0%) | 0 (0.0%) |
| 35 Years and over | 88 (59.9%) | 59 (40.1%) |
| Total | 2,977 (83.7%) | 580 (16.3%) |
Educational Attainment by Field of Study in Trophy Club
Business (1,979 | 31.6%), education (795 | 12.7%), social sciences (635 | 10.1%), engineering (425 | 6.8%), and science & technology (370 | 5.9%) are the most common fields of study among 6,271 individuals in Trophy Club who have obtained a bachelor's degree or higher.
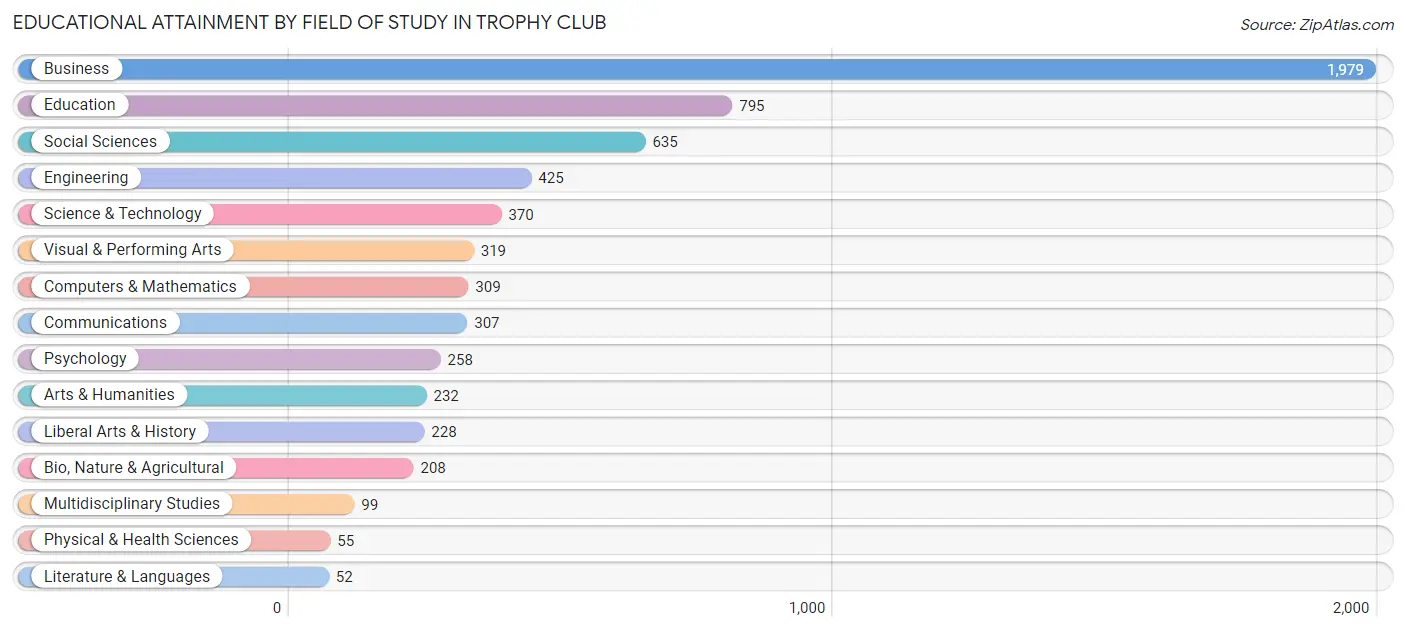
| Field of Study | # Graduates | % Graduates |
| Computers & Mathematics | 309 | 4.9% |
| Bio, Nature & Agricultural | 208 | 3.3% |
| Physical & Health Sciences | 55 | 0.9% |
| Psychology | 258 | 4.1% |
| Social Sciences | 635 | 10.1% |
| Engineering | 425 | 6.8% |
| Multidisciplinary Studies | 99 | 1.6% |
| Science & Technology | 370 | 5.9% |
| Business | 1,979 | 31.6% |
| Education | 795 | 12.7% |
| Literature & Languages | 52 | 0.8% |
| Liberal Arts & History | 228 | 3.6% |
| Visual & Performing Arts | 319 | 5.1% |
| Communications | 307 | 4.9% |
| Arts & Humanities | 232 | 3.7% |
| Total | 6,271 | 100.0% |
Transportation & Commute in Trophy Club
Vehicle Availability by Sex in Trophy Club
The most prevalent vehicle ownership categories in Trophy Club are males with 2 vehicles (1,781, accounting for 47.4%) and females with 2 vehicles (1,293, making up 56.6%).
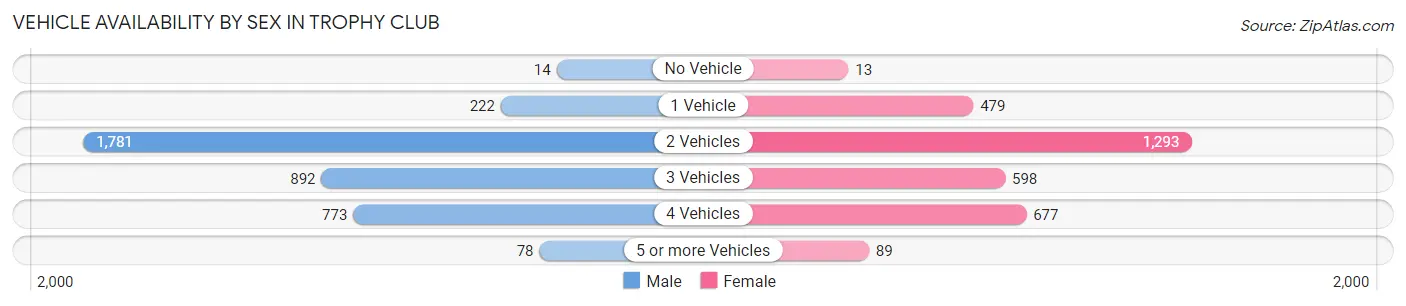
| Vehicles Available | Male | Female |
| No Vehicle | 14 (0.4%) | 13 (0.4%) |
| 1 Vehicle | 222 (5.9%) | 479 (15.2%) |
| 2 Vehicles | 1,781 (47.4%) | 1,293 (41.1%) |
| 3 Vehicles | 892 (23.7%) | 598 (19.0%) |
| 4 Vehicles | 773 (20.6%) | 677 (21.5%) |
| 5 or more Vehicles | 78 (2.1%) | 89 (2.8%) |
| Total | 3,760 (100.0%) | 3,149 (100.0%) |
Commute Time in Trophy Club
The most frequently occuring commute durations in Trophy Club are 30 to 34 minutes (947 commuters, 17.5%), 15 to 19 minutes (845 commuters, 15.6%), and 20 to 24 minutes (634 commuters, 11.7%).
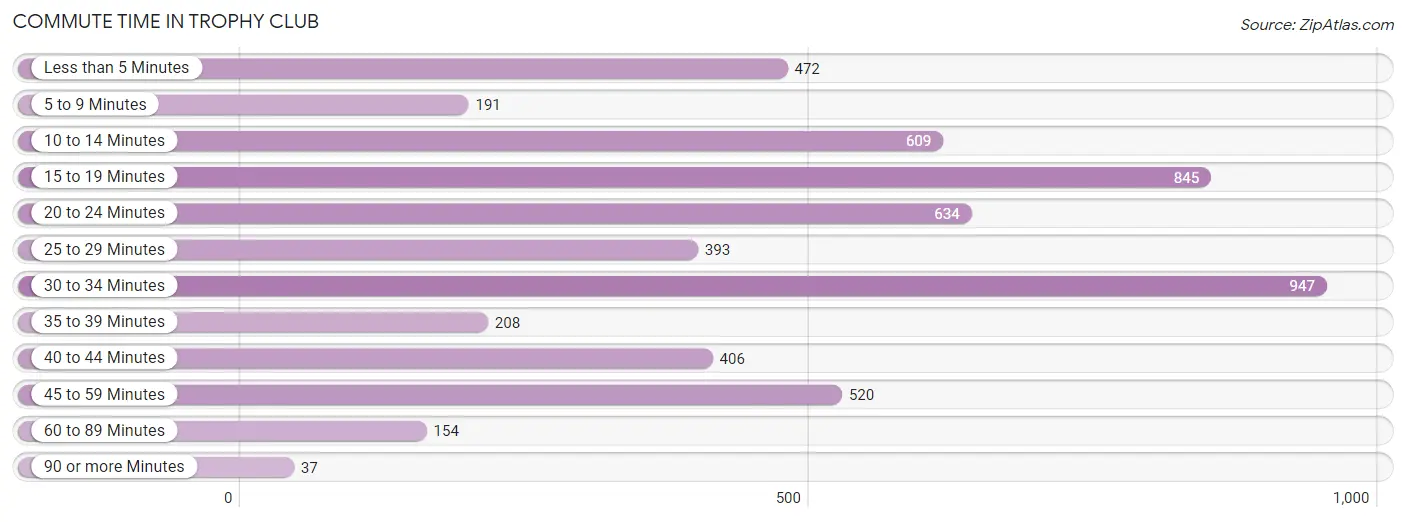
| Commute Time | # Commuters | % Commuters |
| Less than 5 Minutes | 472 | 8.7% |
| 5 to 9 Minutes | 191 | 3.5% |
| 10 to 14 Minutes | 609 | 11.2% |
| 15 to 19 Minutes | 845 | 15.6% |
| 20 to 24 Minutes | 634 | 11.7% |
| 25 to 29 Minutes | 393 | 7.3% |
| 30 to 34 Minutes | 947 | 17.5% |
| 35 to 39 Minutes | 208 | 3.8% |
| 40 to 44 Minutes | 406 | 7.5% |
| 45 to 59 Minutes | 520 | 9.6% |
| 60 to 89 Minutes | 154 | 2.8% |
| 90 or more Minutes | 37 | 0.7% |
Commute Time by Sex in Trophy Club
The most common commute times in Trophy Club are 15 to 19 minutes (517 commuters, 18.1%) for males and 30 to 34 minutes (461 commuters, 18.0%) for females.
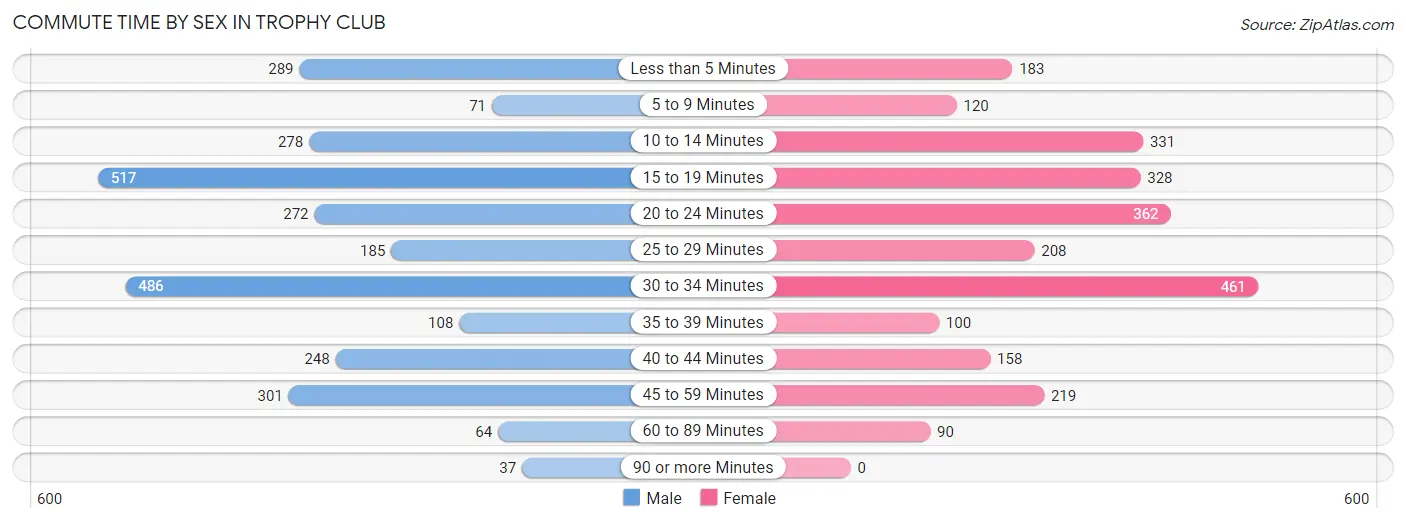
| Commute Time | Male | Female |
| Less than 5 Minutes | 289 (10.1%) | 183 (7.1%) |
| 5 to 9 Minutes | 71 (2.5%) | 120 (4.7%) |
| 10 to 14 Minutes | 278 (9.7%) | 331 (12.9%) |
| 15 to 19 Minutes | 517 (18.1%) | 328 (12.8%) |
| 20 to 24 Minutes | 272 (9.5%) | 362 (14.1%) |
| 25 to 29 Minutes | 185 (6.5%) | 208 (8.1%) |
| 30 to 34 Minutes | 486 (17.0%) | 461 (18.0%) |
| 35 to 39 Minutes | 108 (3.8%) | 100 (3.9%) |
| 40 to 44 Minutes | 248 (8.7%) | 158 (6.2%) |
| 45 to 59 Minutes | 301 (10.5%) | 219 (8.6%) |
| 60 to 89 Minutes | 64 (2.2%) | 90 (3.5%) |
| 90 or more Minutes | 37 (1.3%) | 0 (0.0%) |
Time of Departure to Work by Sex in Trophy Club
The most frequent times of departure to work in Trophy Club are 7:00 AM to 7:29 AM (615, 21.5%) for males and 6:30 AM to 6:59 AM (442, 17.3%) for females.
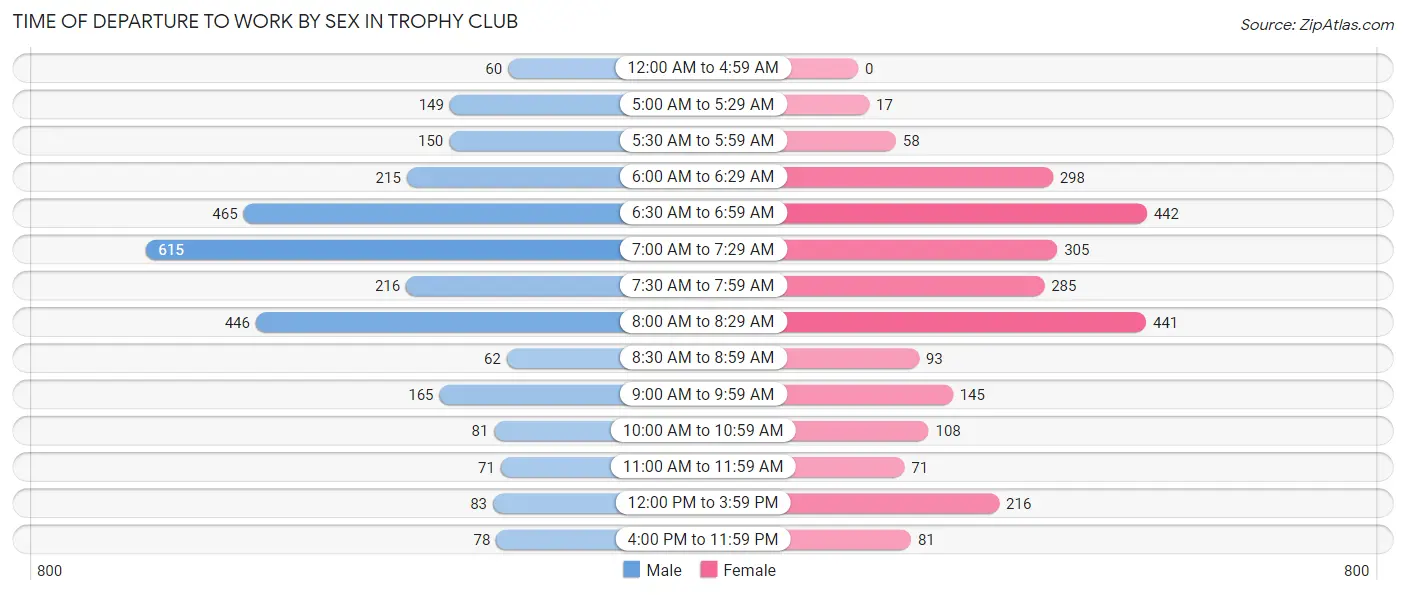
| Time of Departure | Male | Female |
| 12:00 AM to 4:59 AM | 60 (2.1%) | 0 (0.0%) |
| 5:00 AM to 5:29 AM | 149 (5.2%) | 17 (0.7%) |
| 5:30 AM to 5:59 AM | 150 (5.2%) | 58 (2.3%) |
| 6:00 AM to 6:29 AM | 215 (7.5%) | 298 (11.6%) |
| 6:30 AM to 6:59 AM | 465 (16.3%) | 442 (17.3%) |
| 7:00 AM to 7:29 AM | 615 (21.5%) | 305 (11.9%) |
| 7:30 AM to 7:59 AM | 216 (7.6%) | 285 (11.1%) |
| 8:00 AM to 8:29 AM | 446 (15.6%) | 441 (17.2%) |
| 8:30 AM to 8:59 AM | 62 (2.2%) | 93 (3.6%) |
| 9:00 AM to 9:59 AM | 165 (5.8%) | 145 (5.7%) |
| 10:00 AM to 10:59 AM | 81 (2.8%) | 108 (4.2%) |
| 11:00 AM to 11:59 AM | 71 (2.5%) | 71 (2.8%) |
| 12:00 PM to 3:59 PM | 83 (2.9%) | 216 (8.4%) |
| 4:00 PM to 11:59 PM | 78 (2.7%) | 81 (3.2%) |
| Total | 2,856 (100.0%) | 2,560 (100.0%) |
Housing Occupancy in Trophy Club
Occupancy by Ownership in Trophy Club
Of the total 4,536 dwellings in Trophy Club, owner-occupied units account for 4,138 (91.2%), while renter-occupied units make up 398 (8.8%).
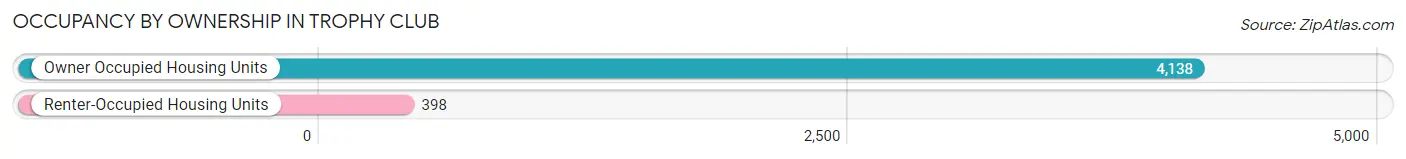
| Occupancy | # Housing Units | % Housing Units |
| Owner Occupied Housing Units | 4,138 | 91.2% |
| Renter-Occupied Housing Units | 398 | 8.8% |
| Total Occupied Housing Units | 4,536 | 100.0% |
Occupancy by Household Size in Trophy Club
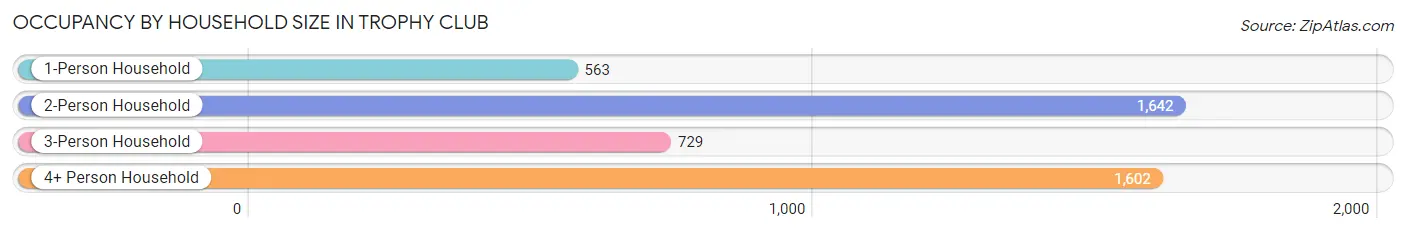
| Household Size | # Housing Units | % Housing Units |
| 1-Person Household | 563 | 12.4% |
| 2-Person Household | 1,642 | 36.2% |
| 3-Person Household | 729 | 16.1% |
| 4+ Person Household | 1,602 | 35.3% |
| Total Housing Units | 4,536 | 100.0% |
Occupancy by Ownership by Household Size in Trophy Club
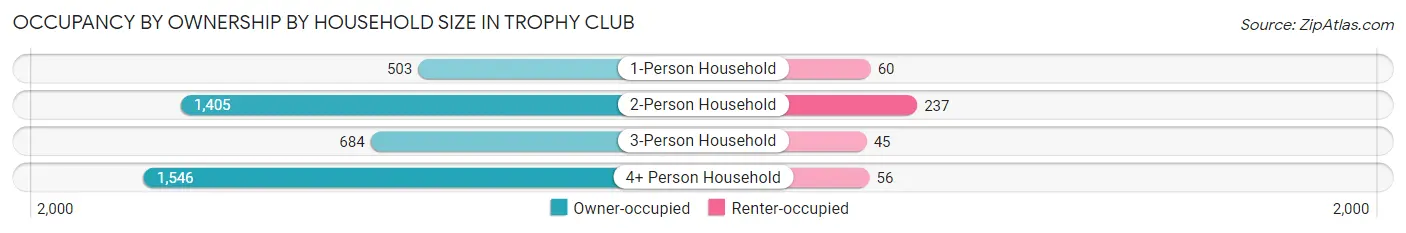
| Household Size | Owner-occupied | Renter-occupied |
| 1-Person Household | 503 (89.3%) | 60 (10.7%) |
| 2-Person Household | 1,405 (85.6%) | 237 (14.4%) |
| 3-Person Household | 684 (93.8%) | 45 (6.2%) |
| 4+ Person Household | 1,546 (96.5%) | 56 (3.5%) |
| Total Housing Units | 4,138 (91.2%) | 398 (8.8%) |
Occupancy by Educational Attainment in Trophy Club
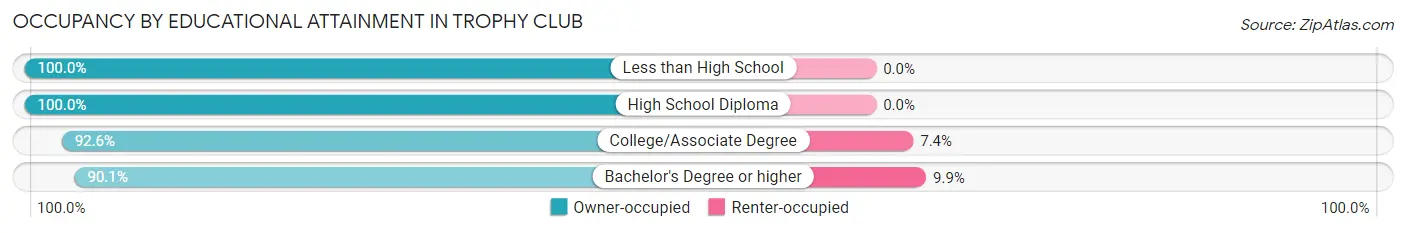
| Household Size | Owner-occupied | Renter-occupied |
| Less than High School | 35 (100.0%) | 0 (0.0%) |
| High School Diploma | 174 (100.0%) | 0 (0.0%) |
| College/Associate Degree | 1,107 (92.6%) | 88 (7.4%) |
| Bachelor's Degree or higher | 2,822 (90.1%) | 310 (9.9%) |
Occupancy by Age of Householder in Trophy Club
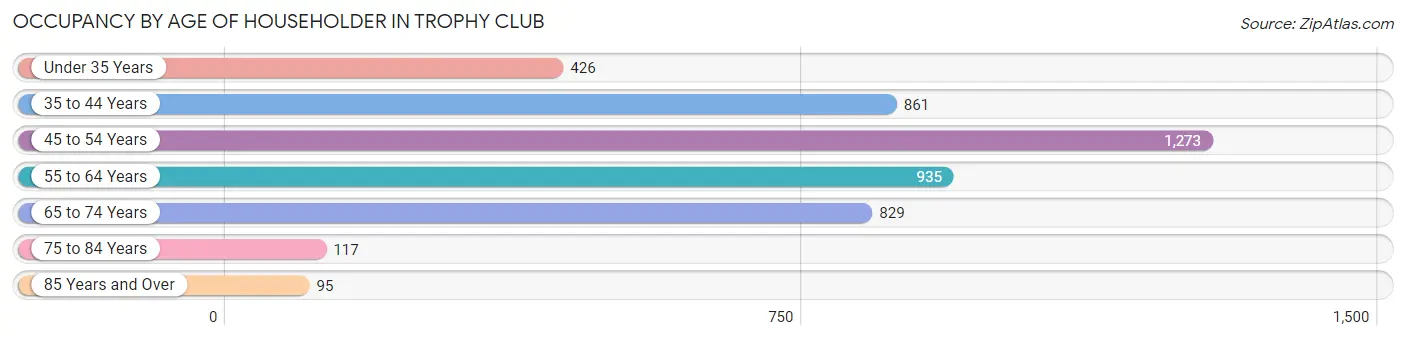
| Age Bracket | # Households | % Households |
| Under 35 Years | 426 | 9.4% |
| 35 to 44 Years | 861 | 19.0% |
| 45 to 54 Years | 1,273 | 28.1% |
| 55 to 64 Years | 935 | 20.6% |
| 65 to 74 Years | 829 | 18.3% |
| 75 to 84 Years | 117 | 2.6% |
| 85 Years and Over | 95 | 2.1% |
| Total | 4,536 | 100.0% |
Housing Finances in Trophy Club
Median Income by Occupancy in Trophy Club
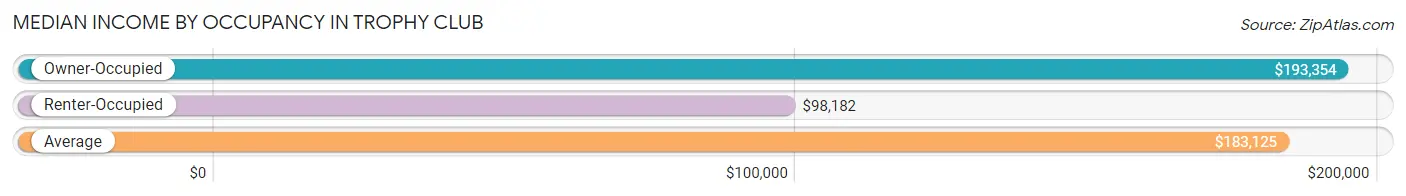
| Occupancy Type | # Households | Median Income |
| Owner-Occupied | 4,138 (91.2%) | $193,354 |
| Renter-Occupied | 398 (8.8%) | $98,182 |
| Average | 4,536 (100.0%) | $183,125 |
Occupancy by Householder Income Bracket in Trophy Club
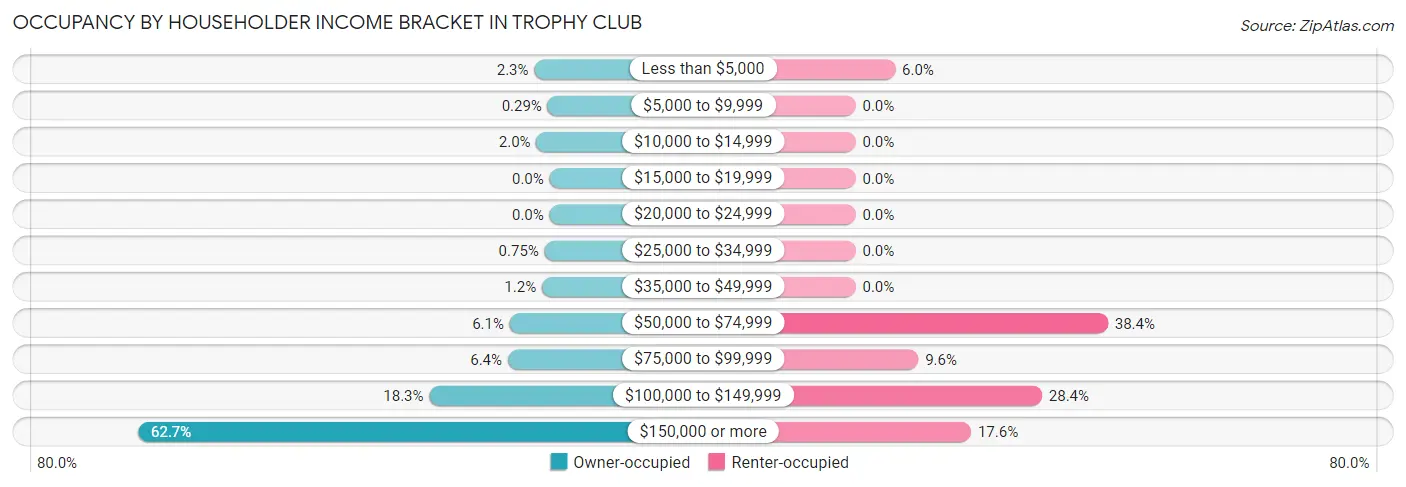
| Income Bracket | Owner-occupied | Renter-occupied |
| Less than $5,000 | 96 (2.3%) | 24 (6.0%) |
| $5,000 to $9,999 | 12 (0.3%) | 0 (0.0%) |
| $10,000 to $14,999 | 83 (2.0%) | 0 (0.0%) |
| $15,000 to $19,999 | 0 (0.0%) | 0 (0.0%) |
| $20,000 to $24,999 | 0 (0.0%) | 0 (0.0%) |
| $25,000 to $34,999 | 31 (0.7%) | 0 (0.0%) |
| $35,000 to $49,999 | 48 (1.2%) | 0 (0.0%) |
| $50,000 to $74,999 | 251 (6.1%) | 153 (38.4%) |
| $75,000 to $99,999 | 263 (6.4%) | 38 (9.6%) |
| $100,000 to $149,999 | 758 (18.3%) | 113 (28.4%) |
| $150,000 or more | 2,596 (62.7%) | 70 (17.6%) |
| Total | 4,138 (100.0%) | 398 (100.0%) |
Monthly Housing Cost Tiers in Trophy Club
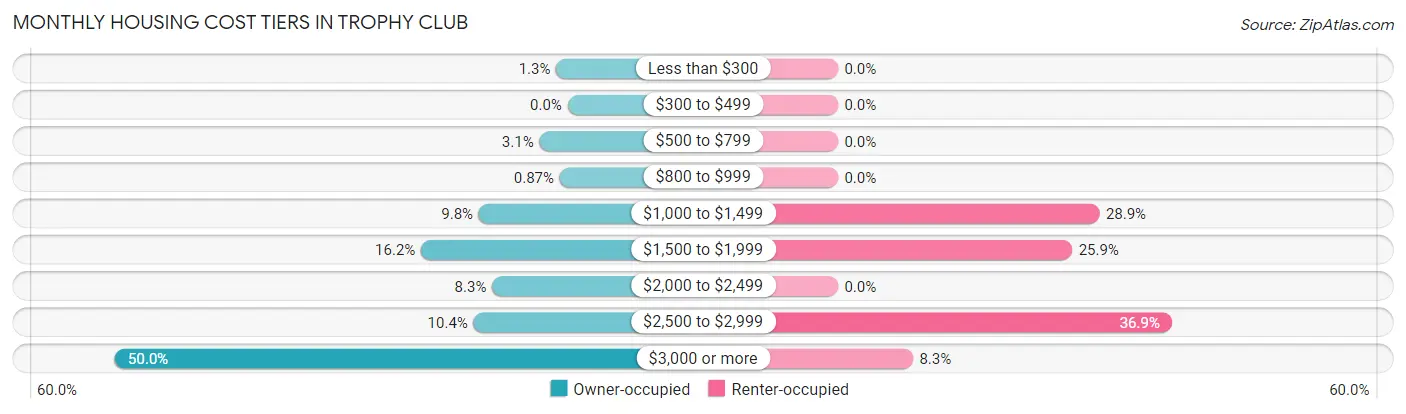
| Monthly Cost | Owner-occupied | Renter-occupied |
| Less than $300 | 52 (1.3%) | 0 (0.0%) |
| $300 to $499 | 0 (0.0%) | 0 (0.0%) |
| $500 to $799 | 129 (3.1%) | 0 (0.0%) |
| $800 to $999 | 36 (0.9%) | 0 (0.0%) |
| $1,000 to $1,499 | 406 (9.8%) | 115 (28.9%) |
| $1,500 to $1,999 | 670 (16.2%) | 103 (25.9%) |
| $2,000 to $2,499 | 345 (8.3%) | 0 (0.0%) |
| $2,500 to $2,999 | 430 (10.4%) | 147 (36.9%) |
| $3,000 or more | 2,070 (50.0%) | 33 (8.3%) |
| Total | 4,138 (100.0%) | 398 (100.0%) |
Physical Housing Characteristics in Trophy Club
Housing Structures in Trophy Club
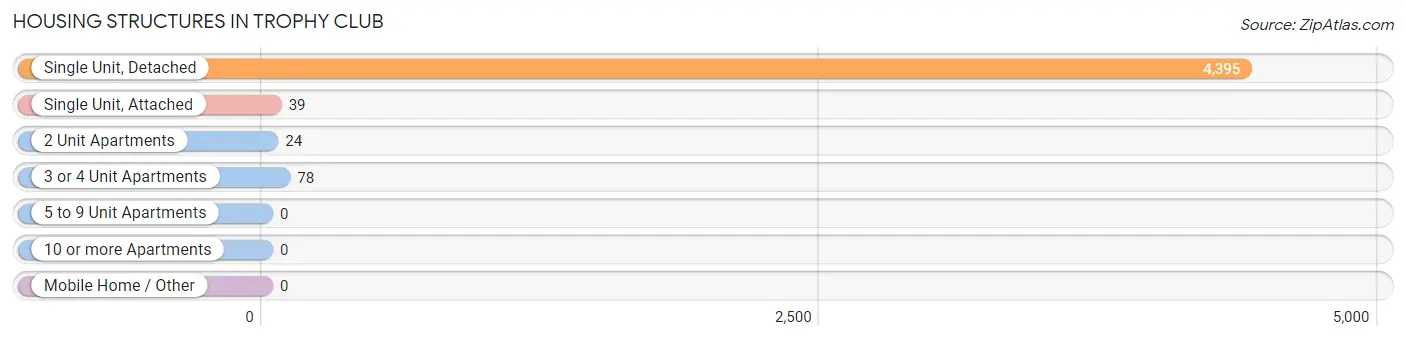
| Structure Type | # Housing Units | % Housing Units |
| Single Unit, Detached | 4,395 | 96.9% |
| Single Unit, Attached | 39 | 0.9% |
| 2 Unit Apartments | 24 | 0.5% |
| 3 or 4 Unit Apartments | 78 | 1.7% |
| 5 to 9 Unit Apartments | 0 | 0.0% |
| 10 or more Apartments | 0 | 0.0% |
| Mobile Home / Other | 0 | 0.0% |
| Total | 4,536 | 100.0% |
Housing Structures by Occupancy in Trophy Club
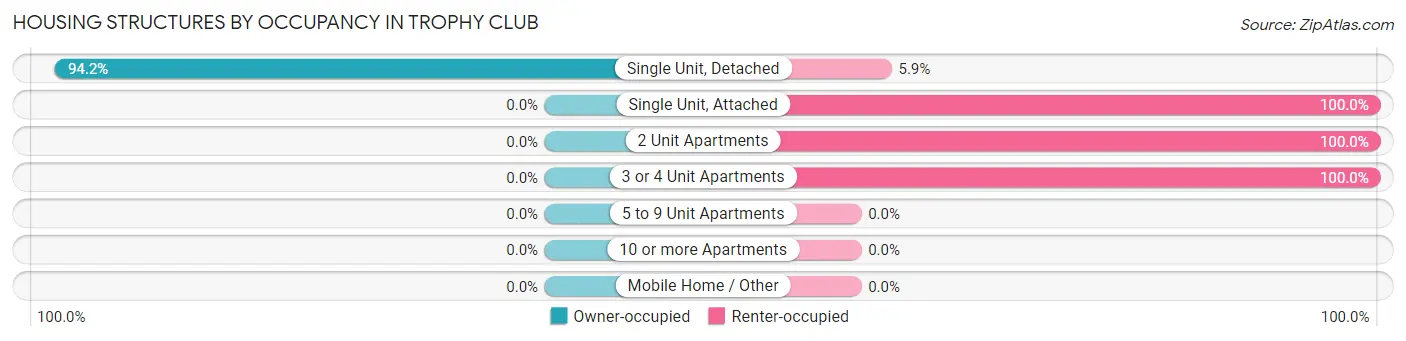
| Structure Type | Owner-occupied | Renter-occupied |
| Single Unit, Detached | 4,138 (94.2%) | 257 (5.9%) |
| Single Unit, Attached | 0 (0.0%) | 39 (100.0%) |
| 2 Unit Apartments | 0 (0.0%) | 24 (100.0%) |
| 3 or 4 Unit Apartments | 0 (0.0%) | 78 (100.0%) |
| 5 to 9 Unit Apartments | 0 (0.0%) | 0 (0.0%) |
| 10 or more Apartments | 0 (0.0%) | 0 (0.0%) |
| Mobile Home / Other | 0 (0.0%) | 0 (0.0%) |
| Total | 4,138 (91.2%) | 398 (8.8%) |
Housing Structures by Number of Rooms in Trophy Club
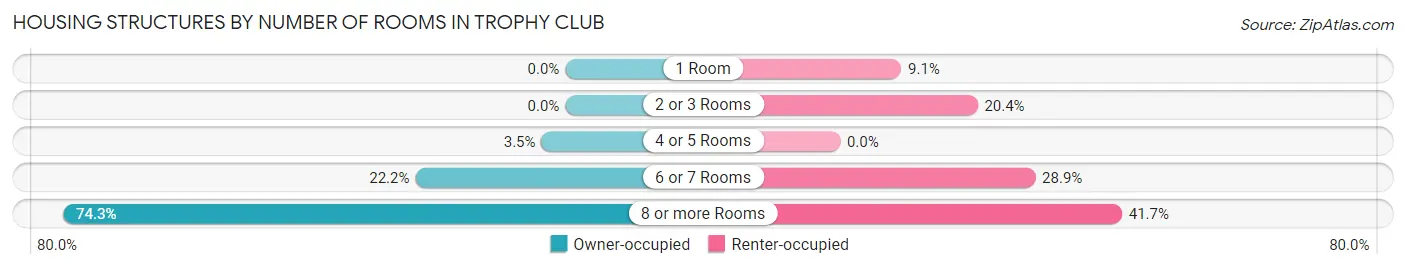
| Number of Rooms | Owner-occupied | Renter-occupied |
| 1 Room | 0 (0.0%) | 36 (9.0%) |
| 2 or 3 Rooms | 0 (0.0%) | 81 (20.3%) |
| 4 or 5 Rooms | 146 (3.5%) | 0 (0.0%) |
| 6 or 7 Rooms | 918 (22.2%) | 115 (28.9%) |
| 8 or more Rooms | 3,074 (74.3%) | 166 (41.7%) |
| Total | 4,138 (100.0%) | 398 (100.0%) |
Housing Structure by Heating Type in Trophy Club
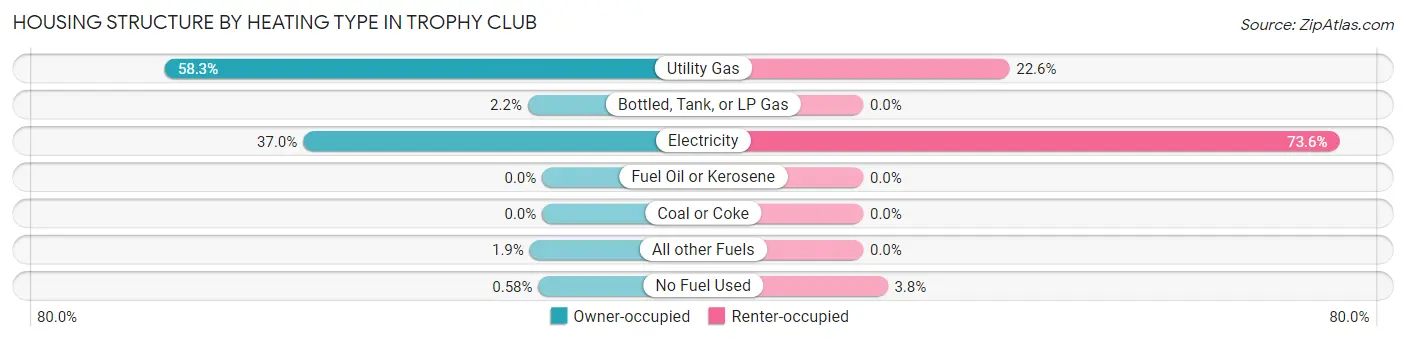
| Heating Type | Owner-occupied | Renter-occupied |
| Utility Gas | 2,413 (58.3%) | 90 (22.6%) |
| Bottled, Tank, or LP Gas | 92 (2.2%) | 0 (0.0%) |
| Electricity | 1,529 (36.9%) | 293 (73.6%) |
| Fuel Oil or Kerosene | 0 (0.0%) | 0 (0.0%) |
| Coal or Coke | 0 (0.0%) | 0 (0.0%) |
| All other Fuels | 80 (1.9%) | 0 (0.0%) |
| No Fuel Used | 24 (0.6%) | 15 (3.8%) |
| Total | 4,138 (100.0%) | 398 (100.0%) |
Household Vehicle Usage in Trophy Club
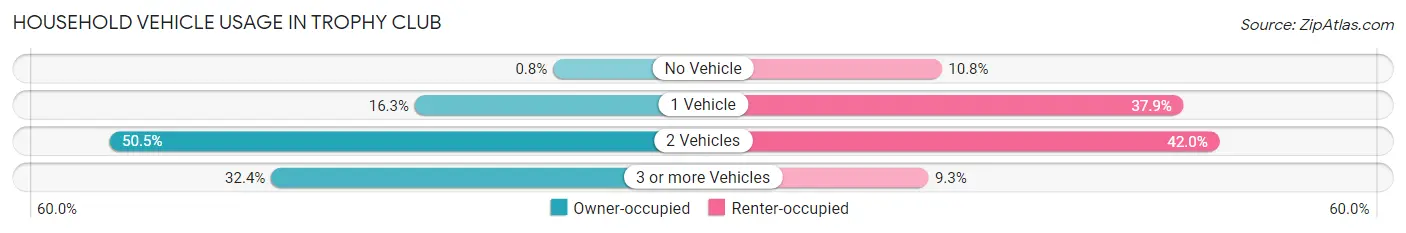
| Vehicles per Household | Owner-occupied | Renter-occupied |
| No Vehicle | 33 (0.8%) | 43 (10.8%) |
| 1 Vehicle | 674 (16.3%) | 151 (37.9%) |
| 2 Vehicles | 2,091 (50.5%) | 167 (42.0%) |
| 3 or more Vehicles | 1,340 (32.4%) | 37 (9.3%) |
| Total | 4,138 (100.0%) | 398 (100.0%) |
Real Estate & Mortgages in Trophy Club
Real Estate and Mortgage Overview in Trophy Club
| Characteristic | Without Mortgage | With Mortgage |
| Housing Units | 1,098 | 3,040 |
| Median Property Value | $589,300 | $577,200 |
| Median Household Income | $153,981 | $2,031 |
| Monthly Housing Costs | $1,496 | $2,054 |
| Real Estate Taxes | $10,001 | $0 |
Property Value by Mortgage Status in Trophy Club
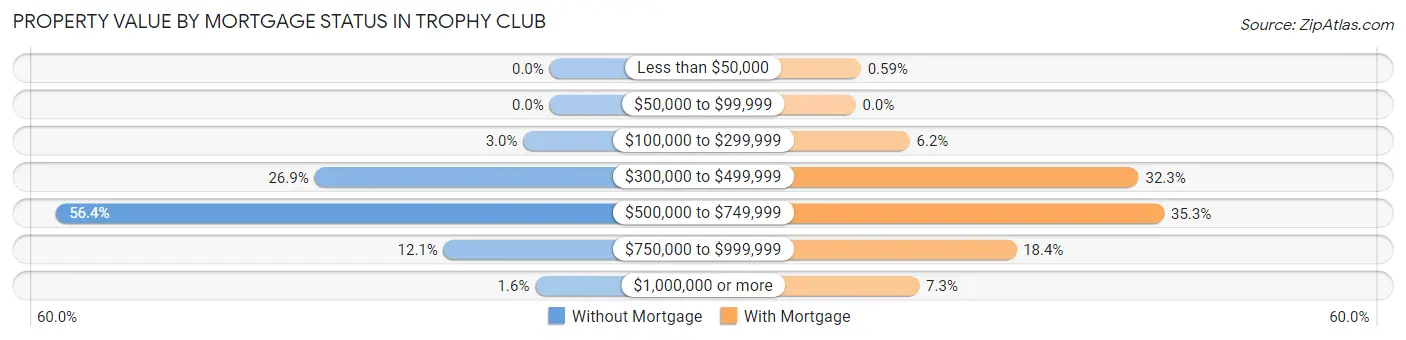
| Property Value | Without Mortgage | With Mortgage |
| Less than $50,000 | 0 (0.0%) | 18 (0.6%) |
| $50,000 to $99,999 | 0 (0.0%) | 0 (0.0%) |
| $100,000 to $299,999 | 33 (3.0%) | 188 (6.2%) |
| $300,000 to $499,999 | 295 (26.9%) | 983 (32.3%) |
| $500,000 to $749,999 | 619 (56.4%) | 1,072 (35.3%) |
| $750,000 to $999,999 | 133 (12.1%) | 558 (18.4%) |
| $1,000,000 or more | 18 (1.6%) | 221 (7.3%) |
| Total | 1,098 (100.0%) | 3,040 (100.0%) |
Household Income by Mortgage Status in Trophy Club
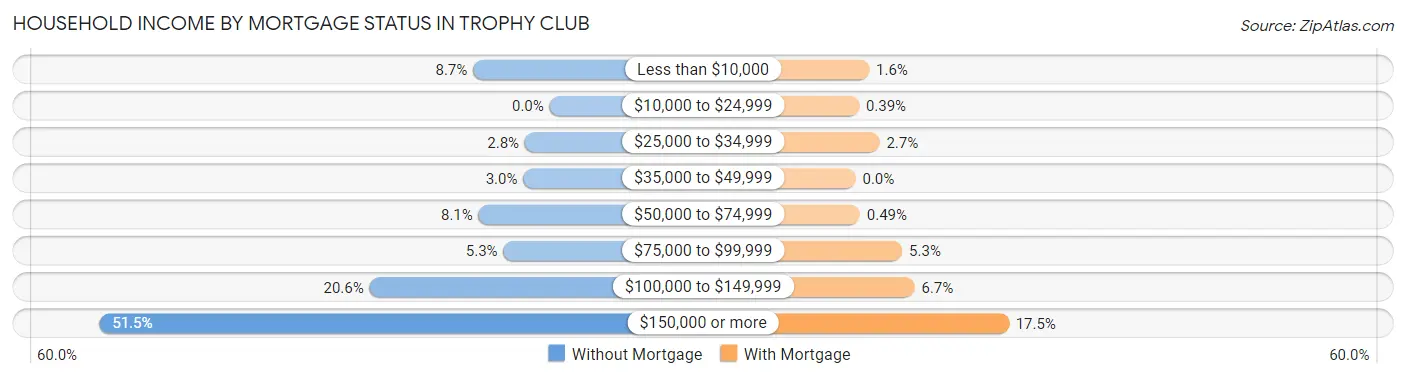
| Household Income | Without Mortgage | With Mortgage |
| Less than $10,000 | 96 (8.7%) | 47 (1.5%) |
| $10,000 to $24,999 | 0 (0.0%) | 12 (0.4%) |
| $25,000 to $34,999 | 31 (2.8%) | 83 (2.7%) |
| $35,000 to $49,999 | 33 (3.0%) | 0 (0.0%) |
| $50,000 to $74,999 | 89 (8.1%) | 15 (0.5%) |
| $75,000 to $99,999 | 58 (5.3%) | 162 (5.3%) |
| $100,000 to $149,999 | 226 (20.6%) | 205 (6.7%) |
| $150,000 or more | 565 (51.5%) | 532 (17.5%) |
| Total | 1,098 (100.0%) | 3,040 (100.0%) |
Property Value to Household Income Ratio in Trophy Club
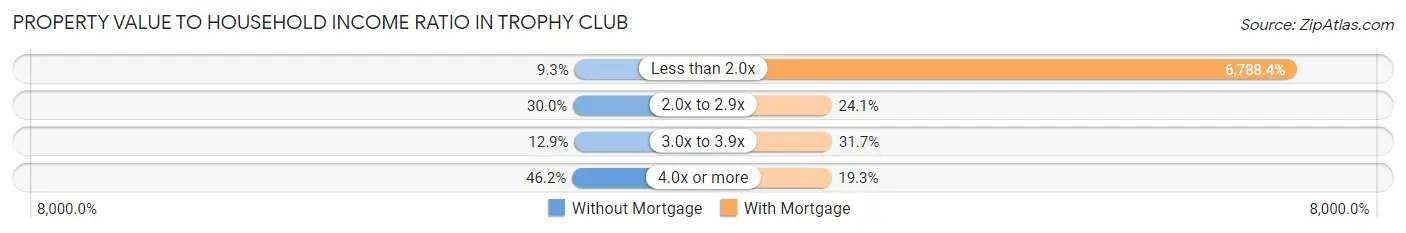
| Value-to-Income Ratio | Without Mortgage | With Mortgage |
| Less than 2.0x | 102 (9.3%) | 206,368 (6,788.4%) |
| 2.0x to 2.9x | 329 (30.0%) | 734 (24.1%) |
| 3.0x to 3.9x | 142 (12.9%) | 963 (31.7%) |
| 4.0x or more | 507 (46.2%) | 588 (19.3%) |
| Total | 1,098 (100.0%) | 3,040 (100.0%) |
Real Estate Taxes by Mortgage Status in Trophy Club
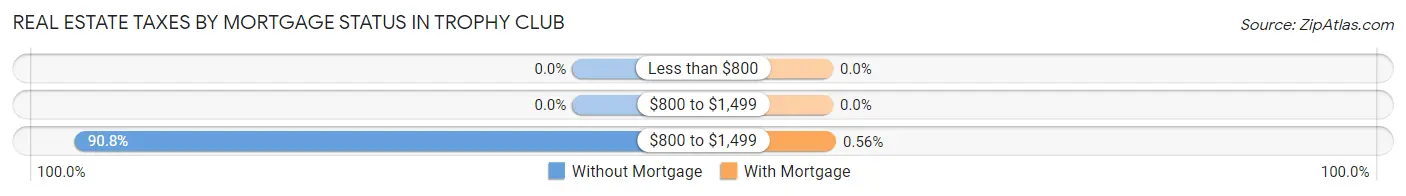
| Property Taxes | Without Mortgage | With Mortgage |
| Less than $800 | 0 (0.0%) | 0 (0.0%) |
| $800 to $1,499 | 0 (0.0%) | 0 (0.0%) |
| $800 to $1,499 | 997 (90.8%) | 17 (0.6%) |
| Total | 1,098 (100.0%) | 3,040 (100.0%) |
Health & Disability in Trophy Club
Health Insurance Coverage by Age in Trophy Club
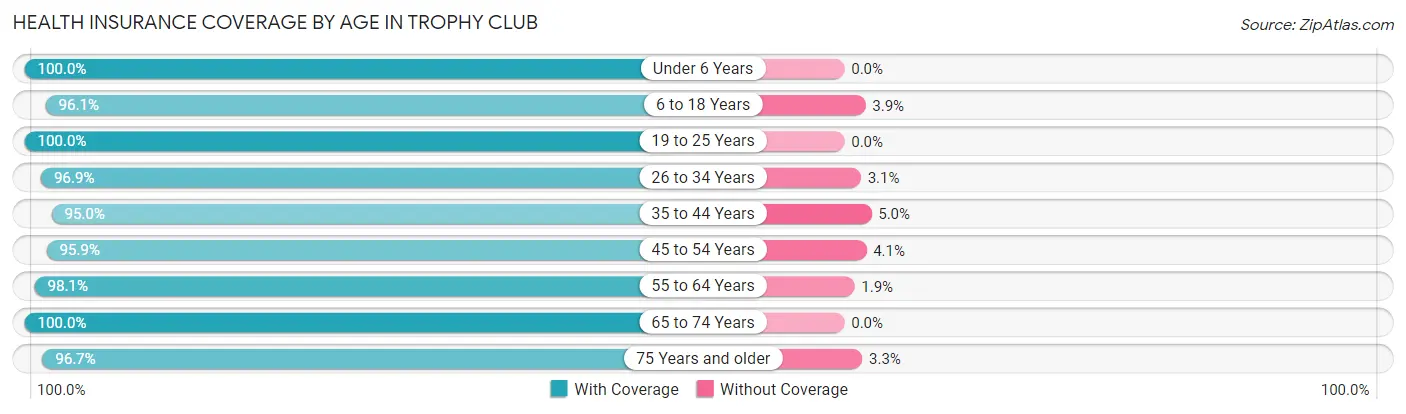
| Age Bracket | With Coverage | Without Coverage |
| Under 6 Years | 771 (100.0%) | 0 (0.0%) |
| 6 to 18 Years | 2,858 (96.1%) | 117 (3.9%) |
| 19 to 25 Years | 829 (100.0%) | 0 (0.0%) |
| 26 to 34 Years | 1,237 (96.9%) | 39 (3.1%) |
| 35 to 44 Years | 1,434 (95.0%) | 76 (5.0%) |
| 45 to 54 Years | 2,253 (95.9%) | 96 (4.1%) |
| 55 to 64 Years | 1,782 (98.1%) | 34 (1.9%) |
| 65 to 74 Years | 1,303 (100.0%) | 0 (0.0%) |
| 75 Years and older | 408 (96.7%) | 14 (3.3%) |
| Total | 12,875 (97.2%) | 376 (2.8%) |
Health Insurance Coverage by Citizenship Status in Trophy Club
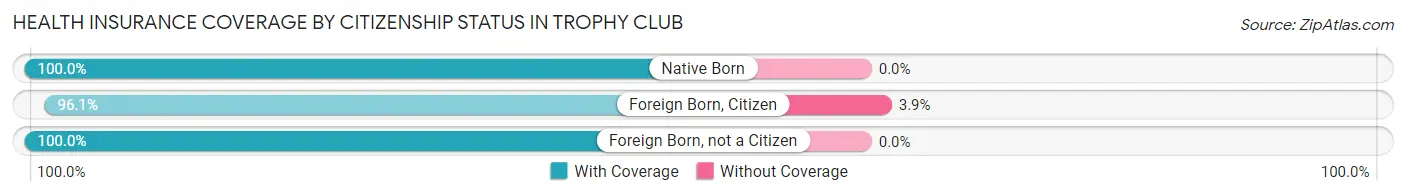
| Citizenship Status | With Coverage | Without Coverage |
| Native Born | 771 (100.0%) | 0 (0.0%) |
| Foreign Born, Citizen | 2,858 (96.1%) | 117 (3.9%) |
| Foreign Born, not a Citizen | 829 (100.0%) | 0 (0.0%) |
Health Insurance Coverage by Household Income in Trophy Club
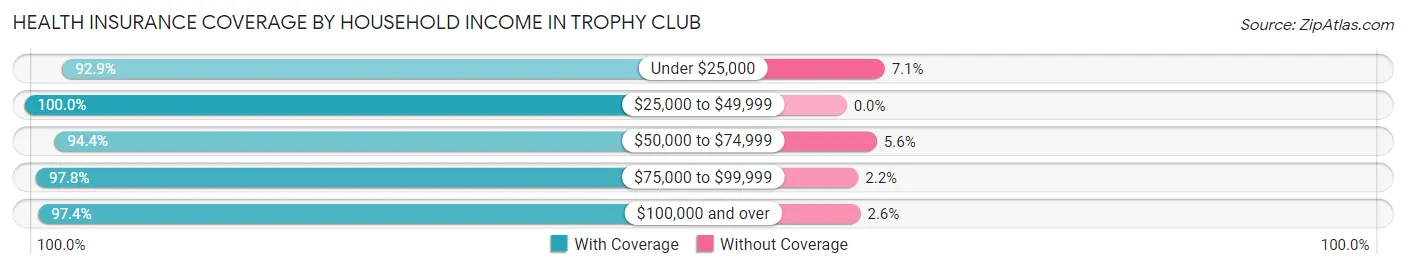
| Household Income | With Coverage | Without Coverage |
| Under $25,000 | 314 (92.9%) | 24 (7.1%) |
| $25,000 to $49,999 | 91 (100.0%) | 0 (0.0%) |
| $50,000 to $74,999 | 786 (94.4%) | 47 (5.6%) |
| $75,000 to $99,999 | 679 (97.8%) | 15 (2.2%) |
| $100,000 and over | 11,005 (97.4%) | 290 (2.6%) |
Public vs Private Health Insurance Coverage by Age in Trophy Club
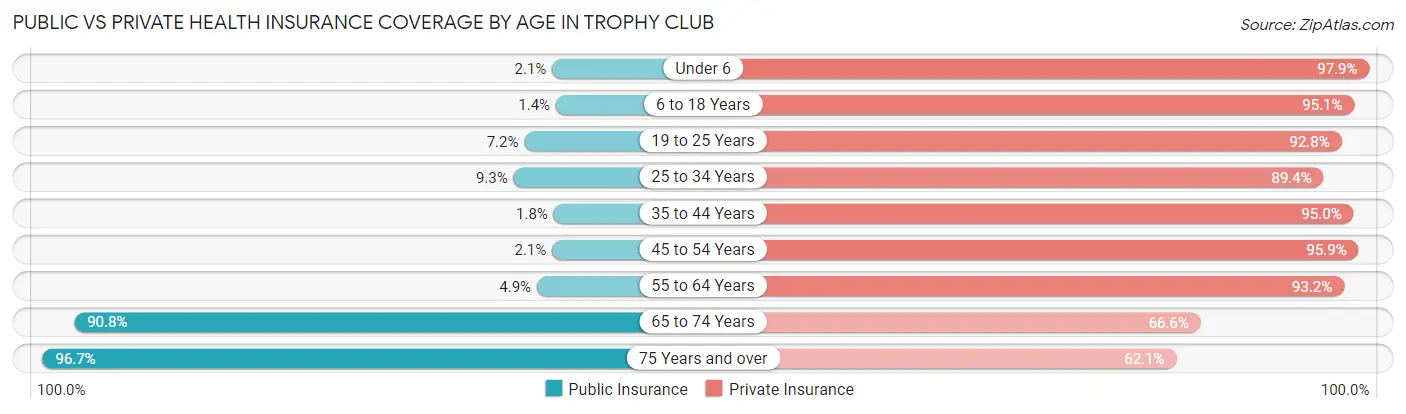
| Age Bracket | Public Insurance | Private Insurance |
| Under 6 | 16 (2.1%) | 755 (97.9%) |
| 6 to 18 Years | 41 (1.4%) | 2,830 (95.1%) |
| 19 to 25 Years | 60 (7.2%) | 769 (92.8%) |
| 25 to 34 Years | 118 (9.2%) | 1,141 (89.4%) |
| 35 to 44 Years | 27 (1.8%) | 1,434 (95.0%) |
| 45 to 54 Years | 49 (2.1%) | 2,253 (95.9%) |
| 55 to 64 Years | 89 (4.9%) | 1,693 (93.2%) |
| 65 to 74 Years | 1,183 (90.8%) | 868 (66.6%) |
| 75 Years and over | 408 (96.7%) | 262 (62.1%) |
| Total | 1,991 (15.0%) | 12,005 (90.6%) |
Disability Status by Sex by Age in Trophy Club
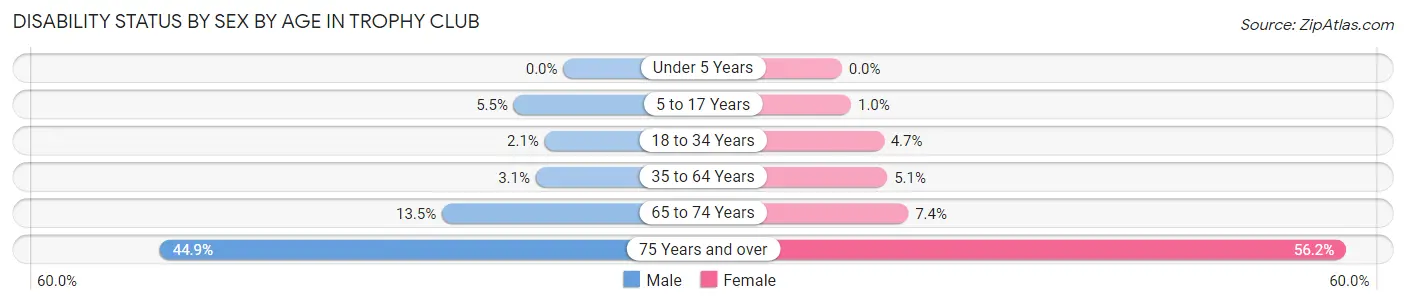
| Age Bracket | Male | Female |
| Under 5 Years | 0 (0.0%) | 0 (0.0%) |
| 5 to 17 Years | 78 (5.5%) | 15 (1.0%) |
| 18 to 34 Years | 25 (2.1%) | 55 (4.7%) |
| 35 to 64 Years | 87 (3.1%) | 144 (5.1%) |
| 65 to 74 Years | 92 (13.5%) | 46 (7.4%) |
| 75 Years and over | 80 (44.9%) | 137 (56.1%) |
Disability Class by Sex by Age in Trophy Club
Disability Class: Hearing Difficulty
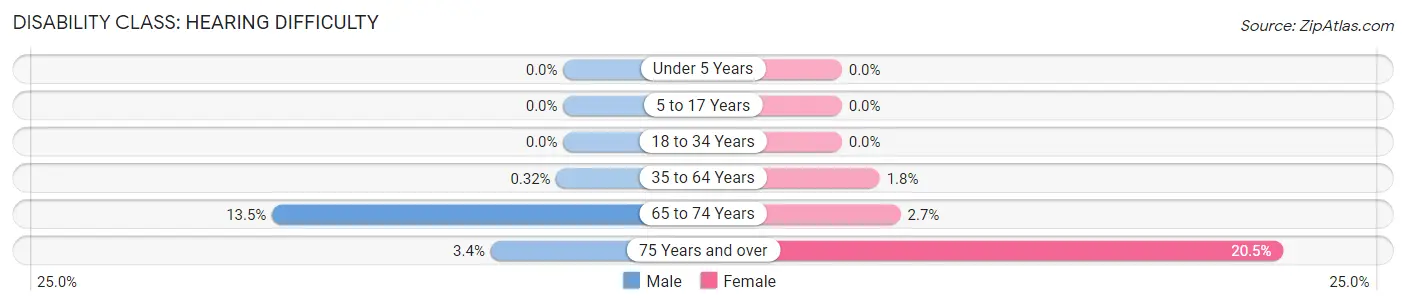
| Age Bracket | Male | Female |
| Under 5 Years | 0 (0.0%) | 0 (0.0%) |
| 5 to 17 Years | 0 (0.0%) | 0 (0.0%) |
| 18 to 34 Years | 0 (0.0%) | 0 (0.0%) |
| 35 to 64 Years | 9 (0.3%) | 50 (1.8%) |
| 65 to 74 Years | 92 (13.5%) | 17 (2.7%) |
| 75 Years and over | 6 (3.4%) | 50 (20.5%) |
Disability Class: Vision Difficulty
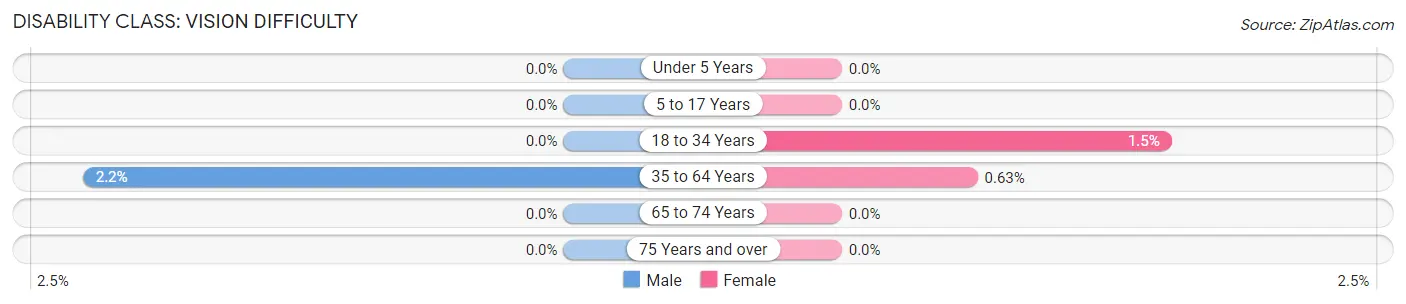
| Age Bracket | Male | Female |
| Under 5 Years | 0 (0.0%) | 0 (0.0%) |
| 5 to 17 Years | 0 (0.0%) | 0 (0.0%) |
| 18 to 34 Years | 0 (0.0%) | 18 (1.5%) |
| 35 to 64 Years | 63 (2.2%) | 18 (0.6%) |
| 65 to 74 Years | 0 (0.0%) | 0 (0.0%) |
| 75 Years and over | 0 (0.0%) | 0 (0.0%) |
Disability Class: Cognitive Difficulty
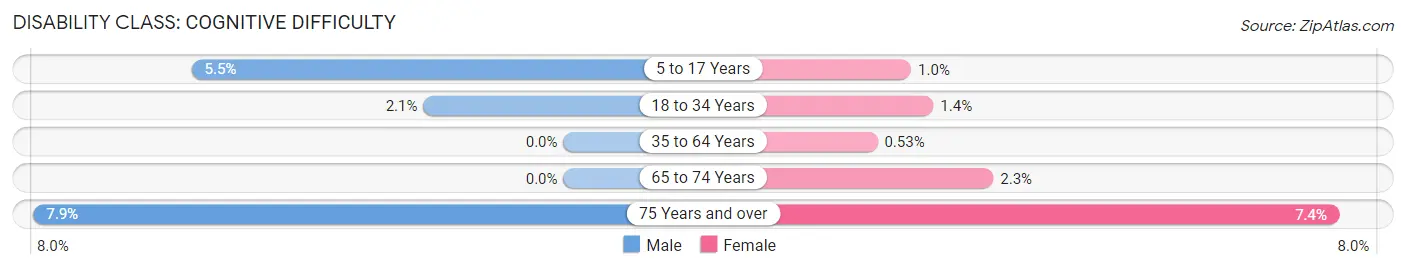
| Age Bracket | Male | Female |
| 5 to 17 Years | 78 (5.5%) | 15 (1.0%) |
| 18 to 34 Years | 25 (2.1%) | 16 (1.4%) |
| 35 to 64 Years | 0 (0.0%) | 15 (0.5%) |
| 65 to 74 Years | 0 (0.0%) | 14 (2.2%) |
| 75 Years and over | 14 (7.9%) | 18 (7.4%) |
Disability Class: Ambulatory Difficulty
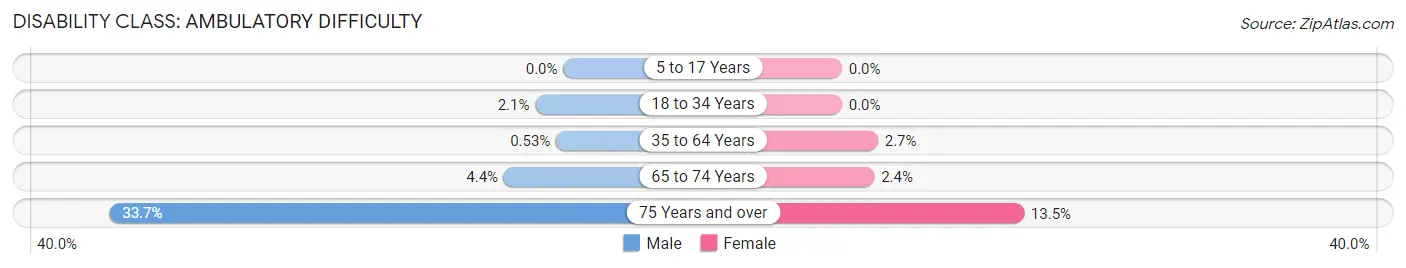
| Age Bracket | Male | Female |
| 5 to 17 Years | 0 (0.0%) | 0 (0.0%) |
| 18 to 34 Years | 25 (2.1%) | 0 (0.0%) |
| 35 to 64 Years | 15 (0.5%) | 76 (2.7%) |
| 65 to 74 Years | 30 (4.4%) | 15 (2.4%) |
| 75 Years and over | 60 (33.7%) | 33 (13.5%) |
Disability Class: Self-Care Difficulty
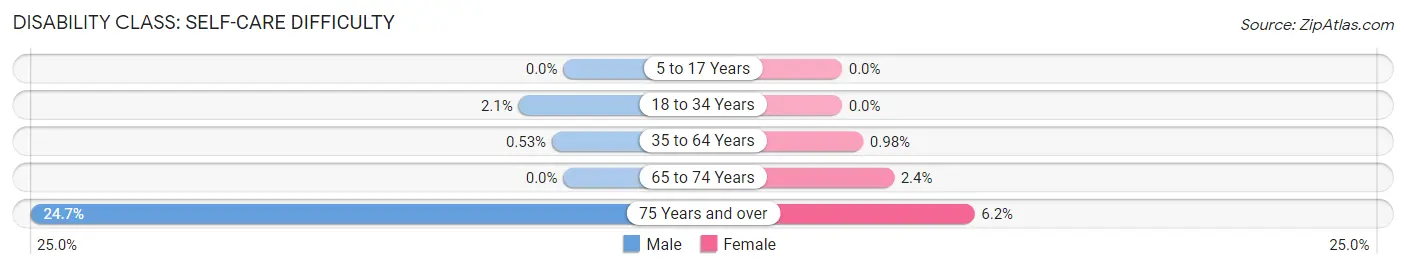
| Age Bracket | Male | Female |
| 5 to 17 Years | 0 (0.0%) | 0 (0.0%) |
| 18 to 34 Years | 25 (2.1%) | 0 (0.0%) |
| 35 to 64 Years | 15 (0.5%) | 28 (1.0%) |
| 65 to 74 Years | 0 (0.0%) | 15 (2.4%) |
| 75 Years and over | 44 (24.7%) | 15 (6.1%) |
Technology Access in Trophy Club
Computing Device Access in Trophy Club
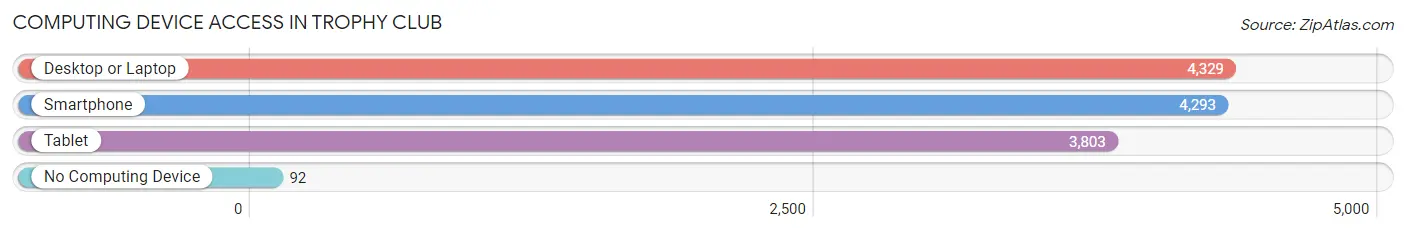
| Device Type | # Households | % Households |
| Desktop or Laptop | 4,329 | 95.4% |
| Smartphone | 4,293 | 94.6% |
| Tablet | 3,803 | 83.8% |
| No Computing Device | 92 | 2.0% |
| Total | 4,536 | 100.0% |
Internet Access in Trophy Club
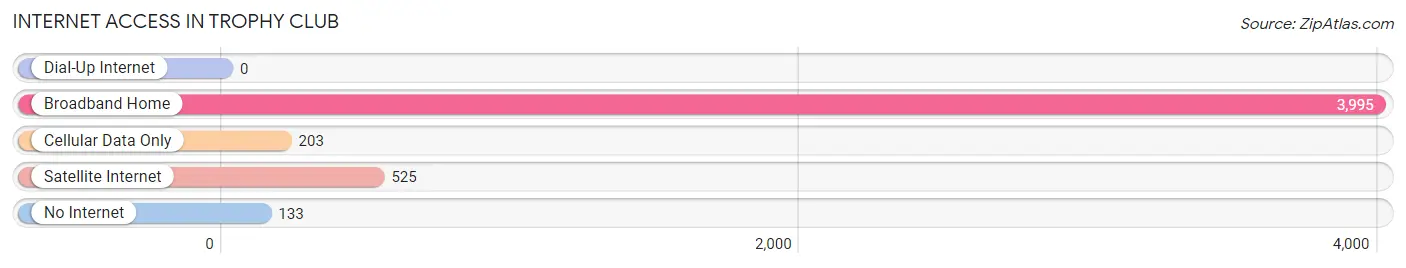
| Internet Type | # Households | % Households |
| Dial-Up Internet | 0 | 0.0% |
| Broadband Home | 3,995 | 88.1% |
| Cellular Data Only | 203 | 4.5% |
| Satellite Internet | 525 | 11.6% |
| No Internet | 133 | 2.9% |
| Total | 4,536 | 100.0% |
Trophy Club Summary
Trophy Club is a small town located in Denton County, Texas, United States. It is situated in the northwest corner of the Dallas-Fort Worth Metroplex, approximately 25 miles northwest of downtown Dallas. The town was incorporated in 1985 and is one of the most affluent communities in the area. As of the 2010 census, the population of Trophy Club was 11,089.
Geography
Trophy Club is located at 33°04'45" North, 97°09'45" West (33.07917, -97.16250). It is situated in the northwest corner of the Dallas-Fort Worth Metroplex, approximately 25 miles northwest of downtown Dallas. The town is bordered by Roanoke to the north, Westlake to the east, Southlake to the south, and Argyle to the west. The town is situated on a plateau, with elevations ranging from 500 to 800 feet above sea level.
The town is served by two major highways, Interstate 35W and State Highway 114. The town is also served by the Denton County Transportation Authority, which provides bus service to the surrounding area.
Climate
Trophy Club has a humid subtropical climate, with hot summers and mild winters. The average annual temperature is 68°F, with an average high of 91°F in July and an average low of 44°F in January. The average annual precipitation is 37.5 inches, with an average of 4.5 inches of snowfall per year.
Demographics
As of the 2010 census, the population of Trophy Club was 11,089. The racial makeup of the town was 91.3% White, 2.2% African American, 0.2% Native American, 4.2% Asian, 0.1% Pacific Islander, 0.9% from other races, and 1.2% from two or more races. Hispanic or Latino of any race were 4.7% of the population.
The median household income in Trophy Club was $133,945 in 2019, with a poverty rate of 2.3%. The median age of the town was 41.3 years.
Economy
The economy of Trophy Club is largely based on the service industry, with many residents employed in professional, scientific, and technical services. The town is also home to several corporate headquarters, including the headquarters of the Dr Pepper Snapple Group and the headquarters of the Texas Rangers baseball team.
The town is also home to several golf courses, including the Trophy Club Country Club, which is one of the most prestigious golf courses in the area. The town is also home to several parks and recreational facilities, including the Trophy Club Park, which features a playground, picnic areas, and a walking trail.
Conclusion
Trophy Club is a small town located in Denton County, Texas, United States. It is situated in the northwest corner of the Dallas-Fort Worth Metroplex, approximately 25 miles northwest of downtown Dallas. The town was incorporated in 1985 and is one of the most affluent communities in the area. As of the 2010 census, the population of Trophy Club was 11,089. The town is served by two major highways, Interstate 35W and State Highway 114. The town has a humid subtropical climate, with hot summers and mild winters. The economy of Trophy Club is largely based on the service industry, with many residents employed in professional, scientific, and technical services. The town is also home to several corporate headquarters, golf courses, and parks and recreational facilities.
Common Questions
What is Per Capita Income in Trophy Club?
Per Capita income in Trophy Club is $79,612.
What is the Median Family Income in Trophy Club?
Median Family Income in Trophy Club is $198,393.
What is the Median Household income in Trophy Club?
Median Household Income in Trophy Club is $183,125.
What is Income or Wage Gap in Trophy Club?
Income or Wage Gap in Trophy Club is 48.1%.
Women in Trophy Club earn 51.9 cents for every dollar earned by a man.
What is Family Income Deficit in Trophy Club?
Family Income Deficit in Trophy Club is $8,421.
Families that are below poverty line in Trophy Club earn $8,421 less on average than the poverty threshold level.
What is Inequality or Gini Index in Trophy Club?
Inequality or Gini Index in Trophy Club is 0.42.
What is the Total Population of Trophy Club?
Total Population of Trophy Club is 13,251.
What is the Total Male Population of Trophy Club?
Total Male Population of Trophy Club is 6,618.
What is the Total Female Population of Trophy Club?
Total Female Population of Trophy Club is 6,633.
What is the Ratio of Males per 100 Females in Trophy Club?
There are 99.77 Males per 100 Females in Trophy Club.
What is the Ratio of Females per 100 Males in Trophy Club?
There are 100.23 Females per 100 Males in Trophy Club.
What is the Median Population Age in Trophy Club?
Median Population Age in Trophy Club is 40.3 Years.
What is the Average Family Size in Trophy Club
Average Family Size in Trophy Club is 3.2 People.
What is the Average Household Size in Trophy Club
Average Household Size in Trophy Club is 2.9 People.
How Large is the Labor Force in Trophy Club?
There are 7,301 People in the Labor Forcein in Trophy Club.
What is the Percentage of People in the Labor Force in Trophy Club?
70.8% of People are in the Labor Force in Trophy Club.
What is the Unemployment Rate in Trophy Club?
Unemployment Rate in Trophy Club is 4.0%.