Durham, CA Map & Demographics
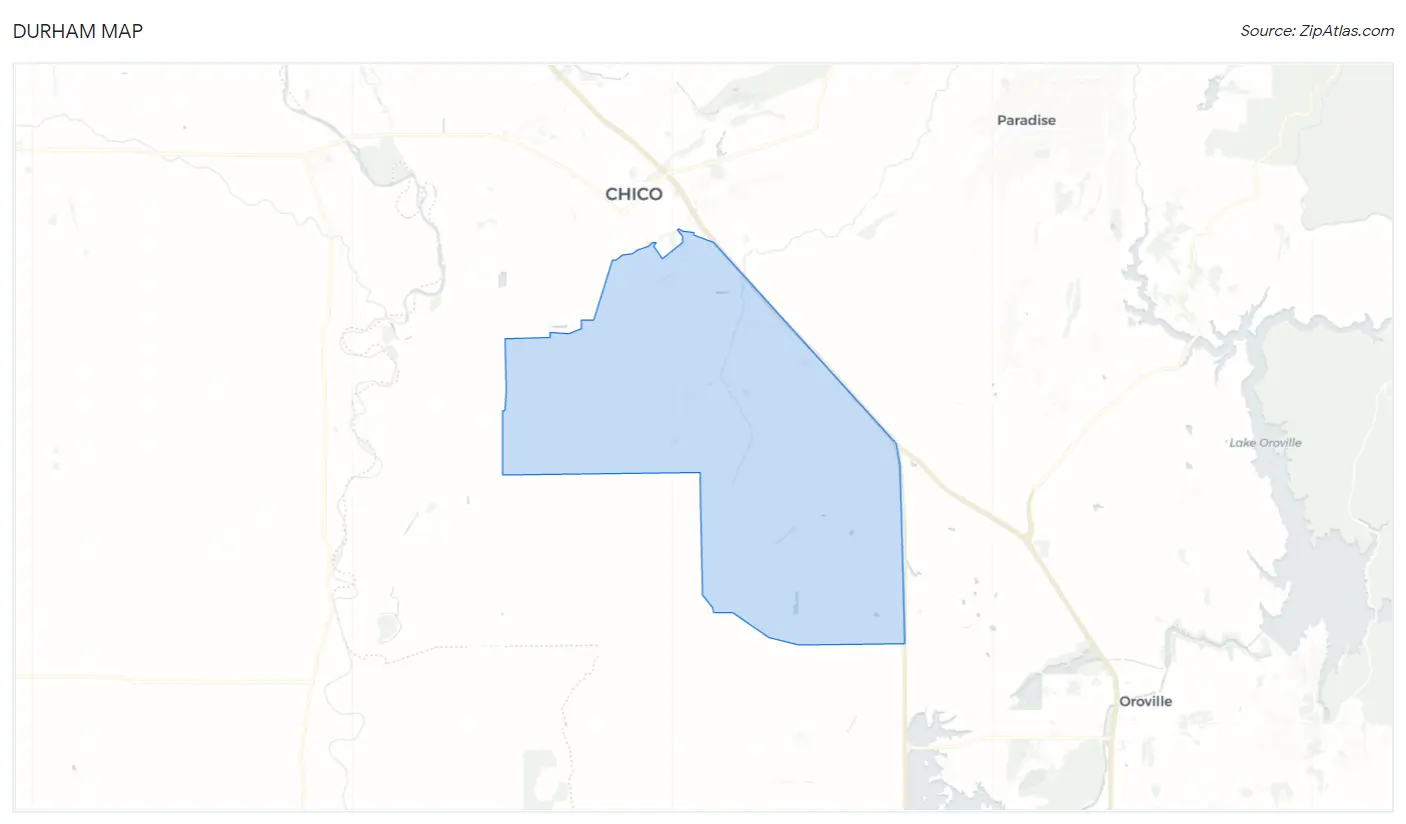
Durham Map
Durham Overview
$47,456
PER CAPITA INCOME
$136,609
AVG FAMILY INCOME
$125,789
AVG HOUSEHOLD INCOME
53.4%
WAGE / INCOME GAP [ % ]
46.6¢/ $1
WAGE / INCOME GAP [ $ ]
0.38
INEQUALITY / GINI INDEX
6,337
TOTAL POPULATION
3,403
MALE POPULATION
2,934
FEMALE POPULATION
115.99
MALES / 100 FEMALES
86.22
FEMALES / 100 MALES
49.6
MEDIAN AGE
3.1
AVG FAMILY SIZE
3.0
AVG HOUSEHOLD SIZE
3,037
LABOR FORCE [ PEOPLE ]
55.7%
PERCENT IN LABOR FORCE
5.8%
UNEMPLOYMENT RATE
Durham Zip Codes
Durham Area Codes
Income in Durham
Income Overview in Durham
Per Capita Income in Durham is $47,456, while median incomes of families and households are $136,609 and $125,789 respectively.
| Characteristic | Number | Measure |
| Per Capita Income | 6,337 | $47,456 |
| Median Family Income | 1,686 | $136,609 |
| Mean Family Income | 1,686 | $139,022 |
| Median Household Income | 2,110 | $125,789 |
| Mean Household Income | 2,110 | $140,150 |
| Income Deficit | 1,686 | $0 |
| Wage / Income Gap (%) | 6,337 | 53.42% |
| Wage / Income Gap ($) | 6,337 | 46.58¢ per $1 |
| Gini / Inequality Index | 6,337 | 0.38 |
Earnings by Sex in Durham
Average Earnings in Durham are $50,574, $61,016 for men and $28,419 for women, a difference of 53.4%.
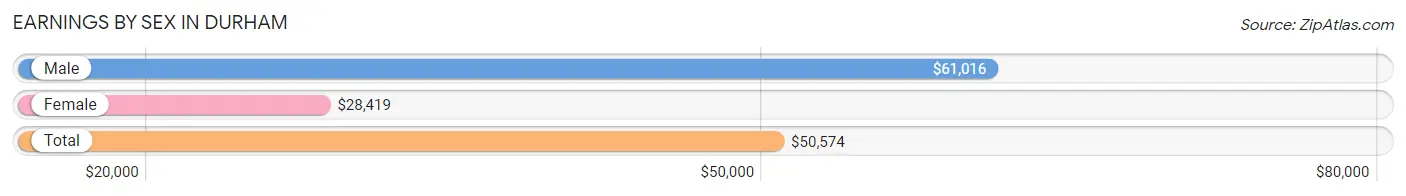
| Sex | Number | Average Earnings |
| Male | 2,015 (61.2%) | $61,016 |
| Female | 1,277 (38.8%) | $28,419 |
| Total | 3,292 (100.0%) | $50,574 |
Earnings by Sex by Income Bracket in Durham
The most common earnings brackets in Durham are $100,000+ for men (553 | 27.4%) and $100,000+ for women (154 | 12.1%).
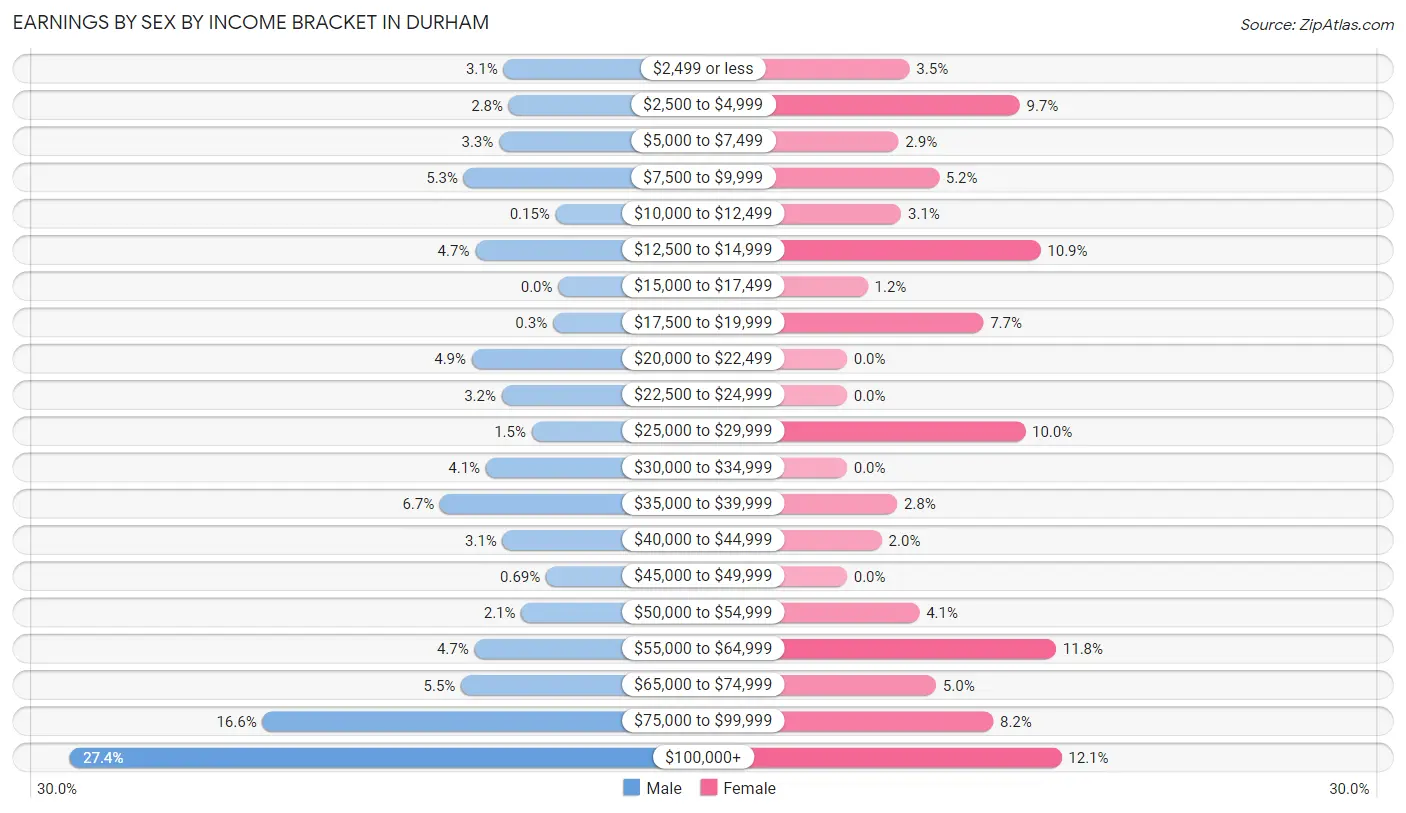
| Income | Male | Female |
| $2,499 or less | 62 (3.1%) | 45 (3.5%) |
| $2,500 to $4,999 | 56 (2.8%) | 124 (9.7%) |
| $5,000 to $7,499 | 67 (3.3%) | 37 (2.9%) |
| $7,500 to $9,999 | 107 (5.3%) | 66 (5.2%) |
| $10,000 to $12,499 | 3 (0.2%) | 39 (3.0%) |
| $12,500 to $14,999 | 94 (4.7%) | 139 (10.9%) |
| $15,000 to $17,499 | 0 (0.0%) | 15 (1.2%) |
| $17,500 to $19,999 | 6 (0.3%) | 98 (7.7%) |
| $20,000 to $22,499 | 98 (4.9%) | 0 (0.0%) |
| $22,500 to $24,999 | 64 (3.2%) | 0 (0.0%) |
| $25,000 to $29,999 | 30 (1.5%) | 128 (10.0%) |
| $30,000 to $34,999 | 82 (4.1%) | 0 (0.0%) |
| $35,000 to $39,999 | 134 (6.7%) | 36 (2.8%) |
| $40,000 to $44,999 | 63 (3.1%) | 25 (2.0%) |
| $45,000 to $49,999 | 14 (0.7%) | 0 (0.0%) |
| $50,000 to $54,999 | 42 (2.1%) | 52 (4.1%) |
| $55,000 to $64,999 | 95 (4.7%) | 150 (11.7%) |
| $65,000 to $74,999 | 110 (5.5%) | 64 (5.0%) |
| $75,000 to $99,999 | 335 (16.6%) | 105 (8.2%) |
| $100,000+ | 553 (27.4%) | 154 (12.1%) |
| Total | 2,015 (100.0%) | 1,277 (100.0%) |
Earnings by Sex by Educational Attainment in Durham
Average earnings in Durham are $72,398 for men and $29,096 for women, a difference of 59.8%. Men with an educational attainment of bachelor's degree enjoy the highest average annual earnings of $81,268, while those with college or associate's degree education earn the least with $62,188. Women with an educational attainment of bachelor's degree earn the most with the average annual earnings of $58,221, while those with high school diploma education have the smallest earnings of $17,723.
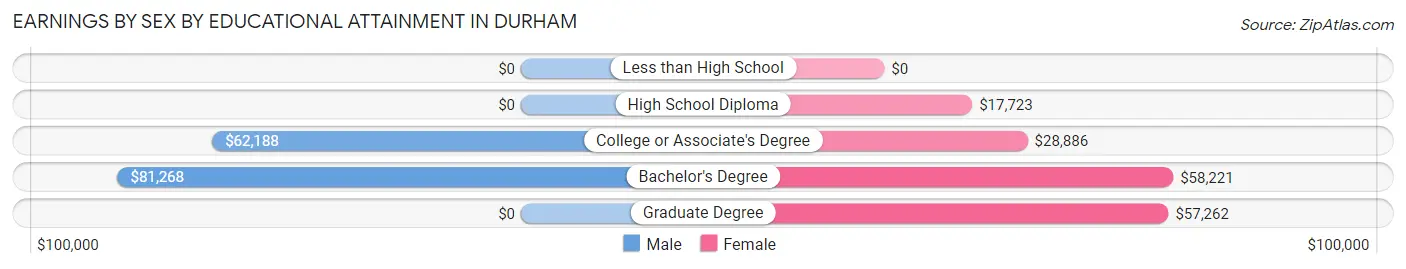
| Educational Attainment | Male Income | Female Income |
| Less than High School | - | - |
| High School Diploma | - | - |
| College or Associate's Degree | $62,188 | $28,886 |
| Bachelor's Degree | $81,268 | $58,221 |
| Graduate Degree | - | - |
| Total | $72,398 | $29,096 |
Family Income in Durham
Family Income Brackets in Durham
According to the Durham family income data, there are 401 families falling into the $150,000 to $199,999 income range, which is the most common income bracket and makes up 23.8% of all families. Conversely, the less than $10,000 income bracket is the least frequent group with only 8 families (0.5%) belonging to this category.
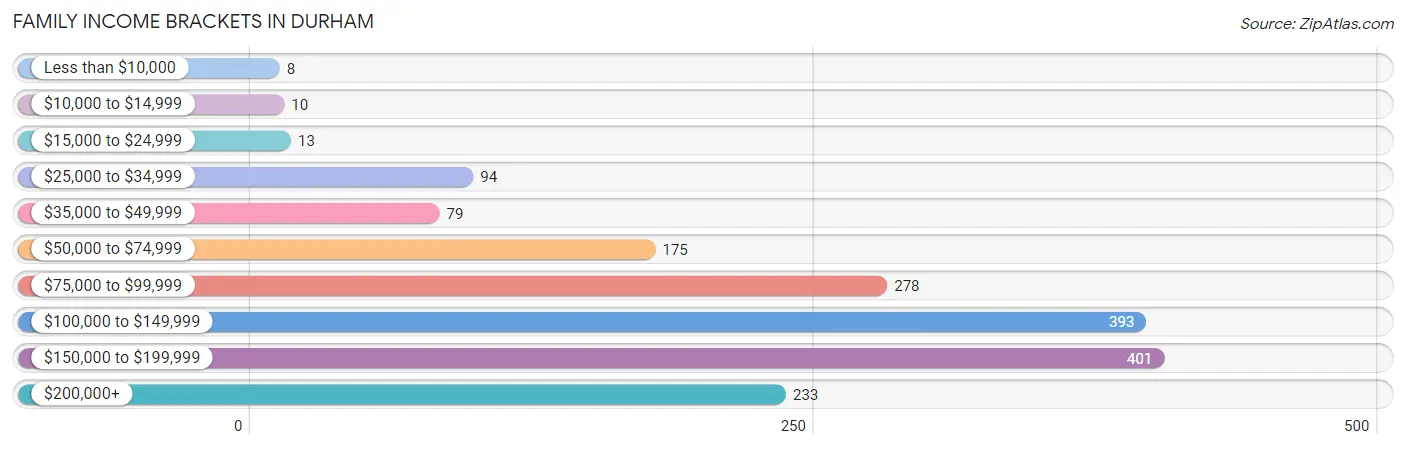
| Income Bracket | # Families | % Families |
| Less than $10,000 | 8 | 0.5% |
| $10,000 to $14,999 | 10 | 0.6% |
| $15,000 to $24,999 | 13 | 0.8% |
| $25,000 to $34,999 | 94 | 5.6% |
| $35,000 to $49,999 | 79 | 4.7% |
| $50,000 to $74,999 | 175 | 10.4% |
| $75,000 to $99,999 | 278 | 16.5% |
| $100,000 to $149,999 | 393 | 23.3% |
| $150,000 to $199,999 | 401 | 23.8% |
| $200,000+ | 233 | 13.8% |
Family Income by Famaliy Size in Durham
3-person families (390 | 23.1%) account for the highest median family income in Durham with $170,701 per family, while 3-person families (390 | 23.1%) have the highest median income of $56,900 per family member.
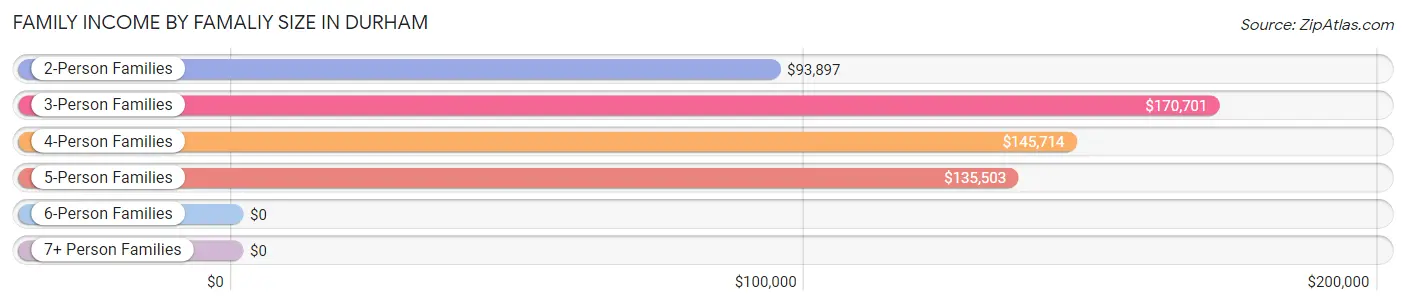
| Income Bracket | # Families | Median Income |
| 2-Person Families | 947 (56.2%) | $93,897 |
| 3-Person Families | 390 (23.1%) | $170,701 |
| 4-Person Families | 148 (8.8%) | $145,714 |
| 5-Person Families | 159 (9.4%) | $135,503 |
| 6-Person Families | 0 (0.0%) | $0 |
| 7+ Person Families | 42 (2.5%) | $0 |
| Total | 1,686 (100.0%) | $136,609 |
Family Income by Number of Earners in Durham
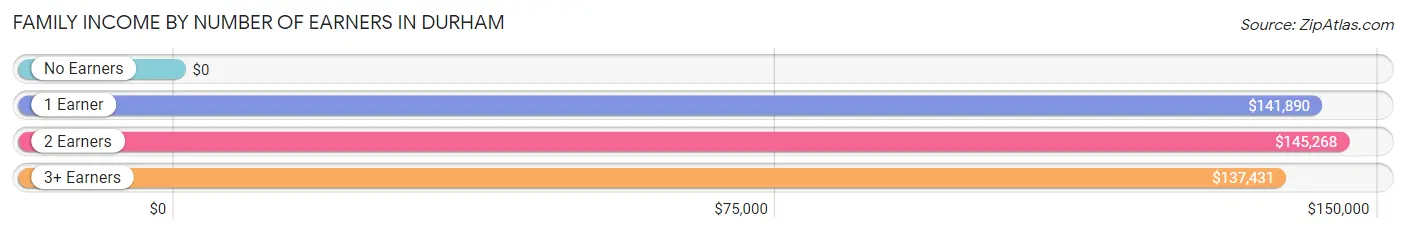
| Number of Earners | # Families | Median Income |
| No Earners | 312 (18.5%) | $0 |
| 1 Earner | 608 (36.1%) | $141,890 |
| 2 Earners | 580 (34.4%) | $145,268 |
| 3+ Earners | 186 (11.0%) | $137,431 |
| Total | 1,686 (100.0%) | $136,609 |
Household Income in Durham
Household Income Brackets in Durham
With 405 households falling in the category, the $100,000 to $149,999 income range is the most frequent in Durham, accounting for 19.2% of all households. In contrast, only 23 households (1.1%) fall into the $15,000 to $24,999 income bracket, making it the least populous group.
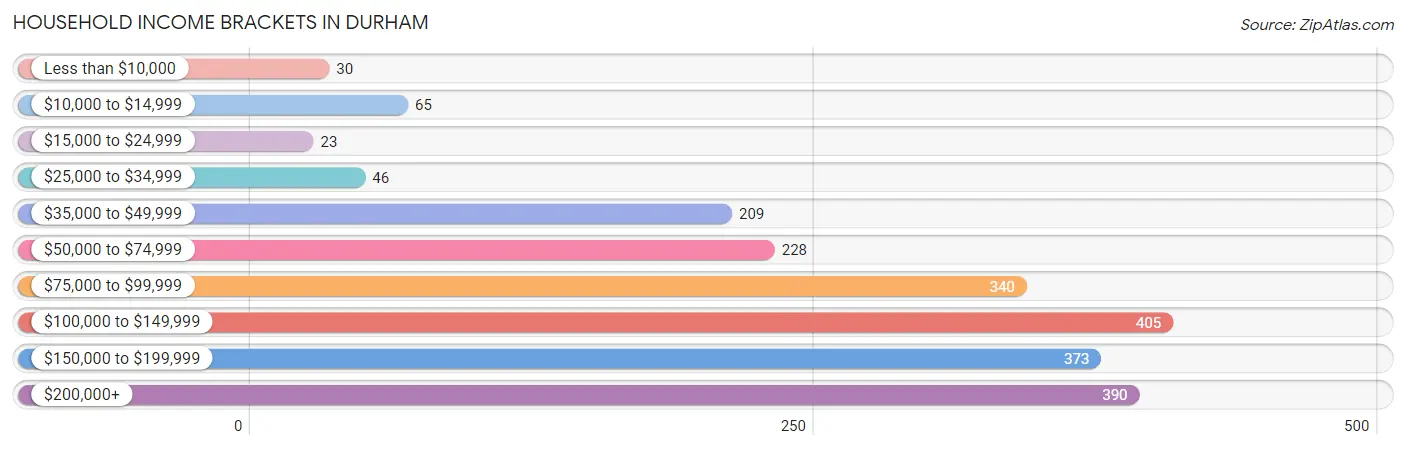
| Income Bracket | # Households | % Households |
| Less than $10,000 | 30 | 1.4% |
| $10,000 to $14,999 | 65 | 3.1% |
| $15,000 to $24,999 | 23 | 1.1% |
| $25,000 to $34,999 | 46 | 2.2% |
| $35,000 to $49,999 | 209 | 9.9% |
| $50,000 to $74,999 | 228 | 10.8% |
| $75,000 to $99,999 | 340 | 16.1% |
| $100,000 to $149,999 | 405 | 19.2% |
| $150,000 to $199,999 | 373 | 17.7% |
| $200,000+ | 390 | 18.5% |
Household Income by Householder Age in Durham
The median household income in Durham is $125,789, with the highest median household income of $158,906 found in the 45 to 64 years age bracket for the primary householder. A total of 931 households (44.1%) fall into this category.
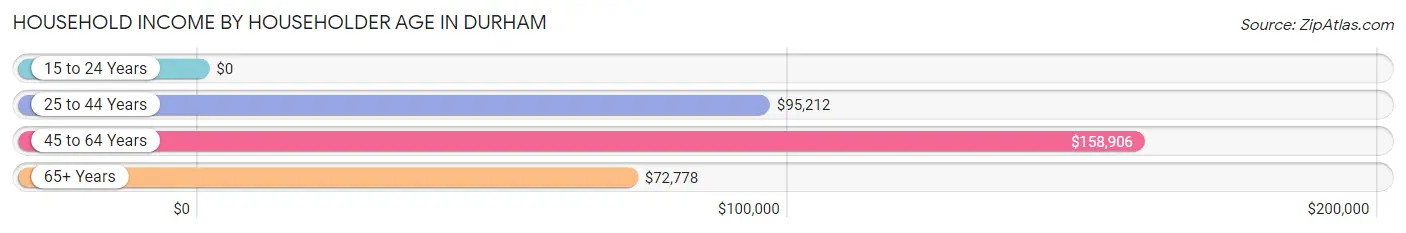
| Income Bracket | # Households | Median Income |
| 15 to 24 Years | 0 (0.0%) | $0 |
| 25 to 44 Years | 403 (19.1%) | $95,212 |
| 45 to 64 Years | 931 (44.1%) | $158,906 |
| 65+ Years | 776 (36.8%) | $72,778 |
| Total | 2,110 (100.0%) | $125,789 |
Poverty in Durham
Income Below Poverty by Sex and Age in Durham
With 5.4% poverty level for males and 6.0% for females among the residents of Durham, 65 to 74 year old males and 16 and 17 year old females are the most vulnerable to poverty, with 137 males (23.9%) and 20 females (20.0%) in their respective age groups living below the poverty level.
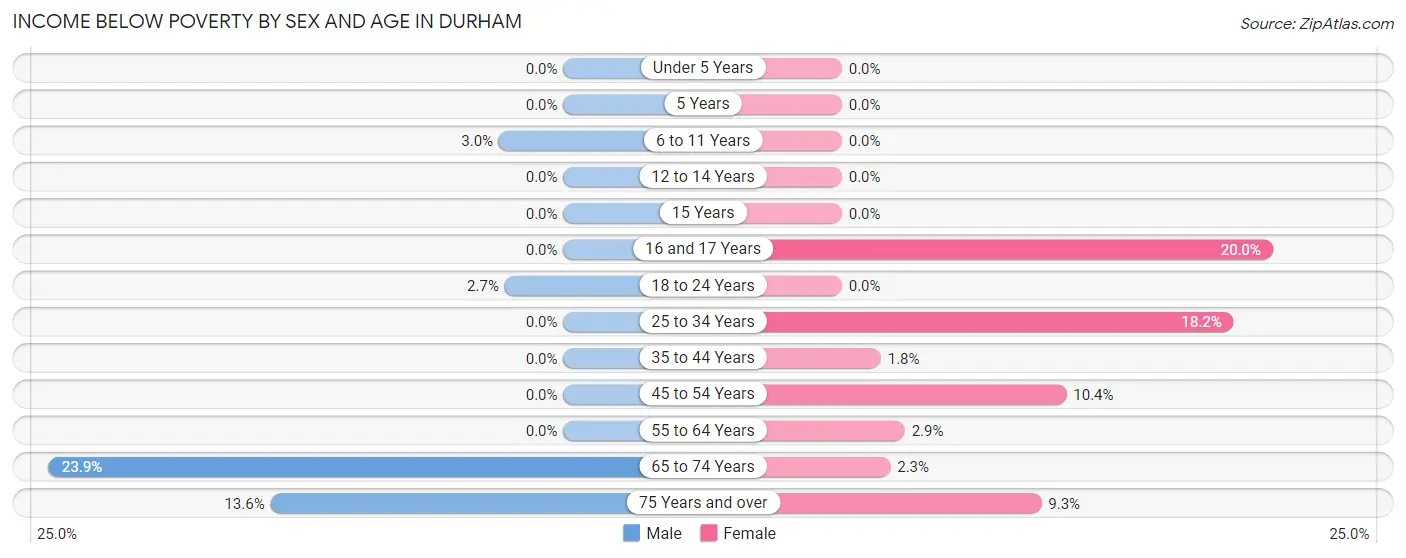
| Age Bracket | Male | Female |
| Under 5 Years | 0 (0.0%) | 0 (0.0%) |
| 5 Years | 0 (0.0%) | 0 (0.0%) |
| 6 to 11 Years | 4 (3.0%) | 0 (0.0%) |
| 12 to 14 Years | 0 (0.0%) | 0 (0.0%) |
| 15 Years | 0 (0.0%) | 0 (0.0%) |
| 16 and 17 Years | 0 (0.0%) | 20 (20.0%) |
| 18 to 24 Years | 14 (2.7%) | 0 (0.0%) |
| 25 to 34 Years | 0 (0.0%) | 34 (18.2%) |
| 35 to 44 Years | 0 (0.0%) | 3 (1.8%) |
| 45 to 54 Years | 0 (0.0%) | 77 (10.4%) |
| 55 to 64 Years | 0 (0.0%) | 14 (2.9%) |
| 65 to 74 Years | 137 (23.9%) | 8 (2.2%) |
| 75 Years and over | 28 (13.6%) | 20 (9.3%) |
| Total | 183 (5.4%) | 176 (6.0%) |
Income Above Poverty by Sex and Age in Durham
According to the poverty statistics in Durham, males aged under 5 years and females aged under 5 years are the age groups that are most secure financially, with 100.0% of males and 100.0% of females in these age groups living above the poverty line.
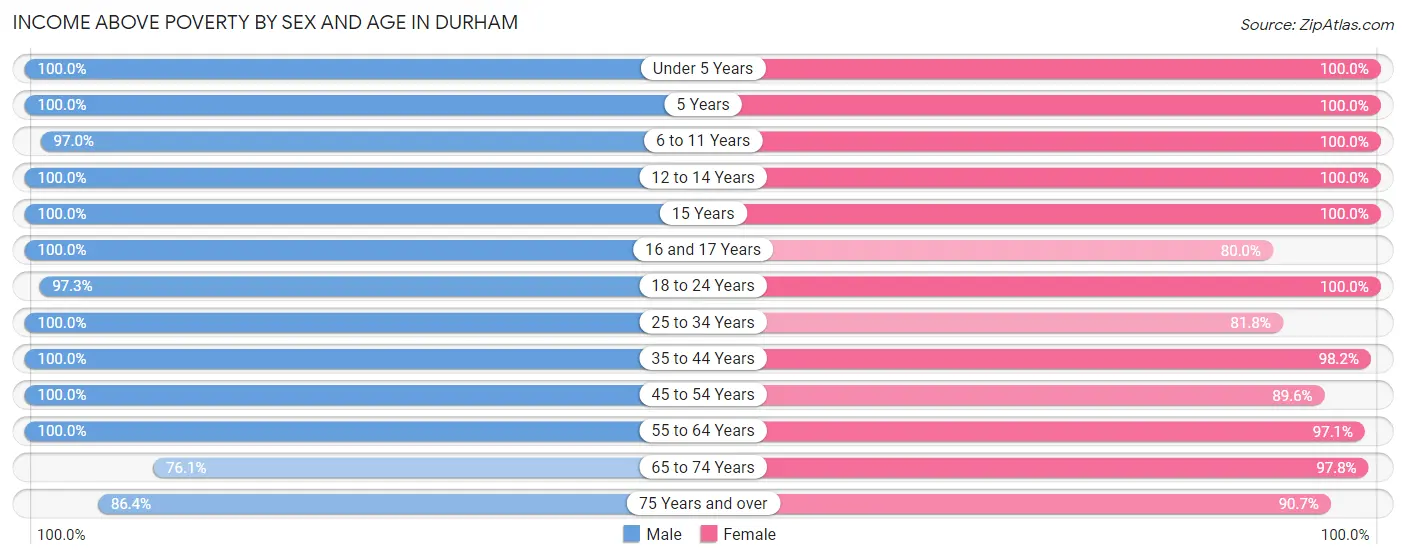
| Age Bracket | Male | Female |
| Under 5 Years | 134 (100.0%) | 161 (100.0%) |
| 5 Years | 16 (100.0%) | 33 (100.0%) |
| 6 to 11 Years | 130 (97.0%) | 121 (100.0%) |
| 12 to 14 Years | 49 (100.0%) | 88 (100.0%) |
| 15 Years | 15 (100.0%) | 134 (100.0%) |
| 16 and 17 Years | 66 (100.0%) | 80 (80.0%) |
| 18 to 24 Years | 501 (97.3%) | 129 (100.0%) |
| 25 to 34 Years | 318 (100.0%) | 153 (81.8%) |
| 35 to 44 Years | 397 (100.0%) | 163 (98.2%) |
| 45 to 54 Years | 317 (100.0%) | 662 (89.6%) |
| 55 to 64 Years | 655 (100.0%) | 465 (97.1%) |
| 65 to 74 Years | 437 (76.1%) | 347 (97.8%) |
| 75 Years and over | 178 (86.4%) | 196 (90.7%) |
| Total | 3,213 (94.6%) | 2,732 (94.0%) |
Income Below Poverty Among Married-Couple Families in Durham
The poverty statistics for married-couple families in Durham show that 1.0% or 15 of the total 1,463 families live below the poverty line. Families with no children have the highest poverty rate of 1.4%, comprising of 15 families. On the other hand, families with 1 or 2 children have the lowest poverty rate of 0.0%, which includes 0 families.
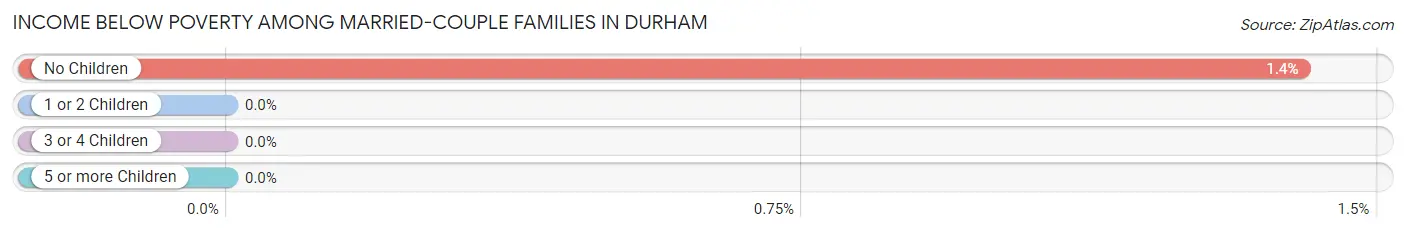
| Children | Above Poverty | Below Poverty |
| No Children | 1,053 (98.6%) | 15 (1.4%) |
| 1 or 2 Children | 280 (100.0%) | 0 (0.0%) |
| 3 or 4 Children | 115 (100.0%) | 0 (0.0%) |
| 5 or more Children | 0 (0.0%) | 0 (0.0%) |
| Total | 1,448 (99.0%) | 15 (1.0%) |
Income Below Poverty Among Single-Parent Households in Durham
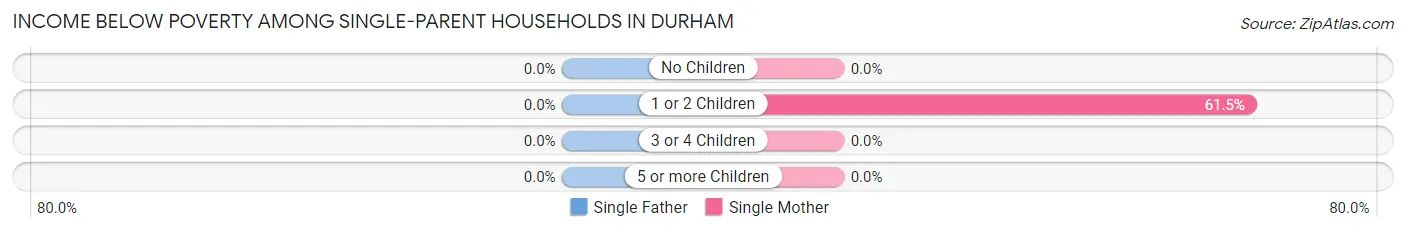
| Children | Single Father | Single Mother |
| No Children | 0 (0.0%) | 0 (0.0%) |
| 1 or 2 Children | 0 (0.0%) | 16 (61.5%) |
| 3 or 4 Children | 0 (0.0%) | 0 (0.0%) |
| 5 or more Children | 0 (0.0%) | 0 (0.0%) |
| Total | 0 (0.0%) | 16 (18.2%) |
Income Below Poverty Among Married-Couple vs Single-Parent Households in Durham
The poverty data for Durham shows that 15 of the married-couple family households (1.0%) and 16 of the single-parent households (7.2%) are living below the poverty level. Within the married-couple family households, those with no children have the highest poverty rate, with 15 households (1.4%) falling below the poverty line. Among the single-parent households, those with 1 or 2 children have the highest poverty rate, with 16 household (32.0%) living below poverty.
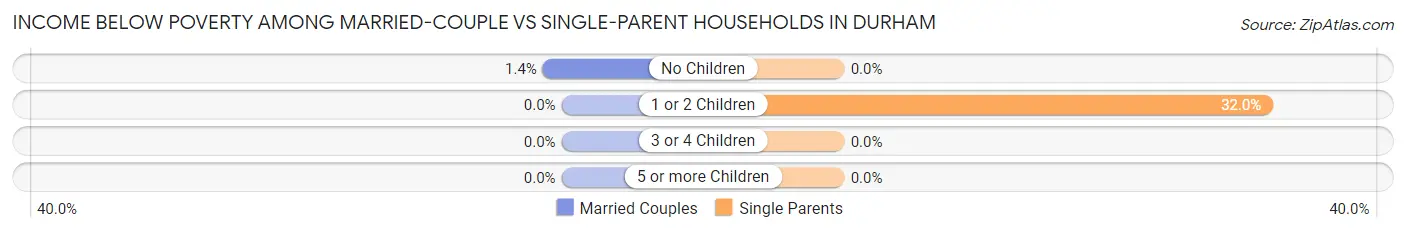
| Children | Married-Couple Families | Single-Parent Households |
| No Children | 15 (1.4%) | 0 (0.0%) |
| 1 or 2 Children | 0 (0.0%) | 16 (32.0%) |
| 3 or 4 Children | 0 (0.0%) | 0 (0.0%) |
| 5 or more Children | 0 (0.0%) | 0 (0.0%) |
| Total | 15 (1.0%) | 16 (7.2%) |
Race in Durham
The most populous races in Durham are White / Caucasian (5,159 | 81.4%), Hispanic or Latino (668 | 10.5%), and Some other Race (509 | 8.0%).
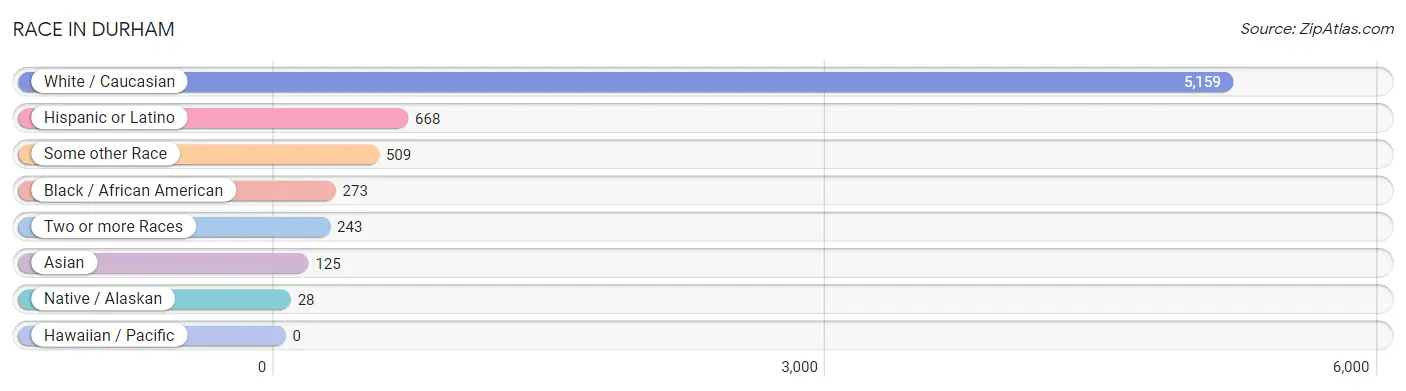
| Race | # Population | % Population |
| Asian | 125 | 2.0% |
| Black / African American | 273 | 4.3% |
| Hawaiian / Pacific | 0 | 0.0% |
| Hispanic or Latino | 668 | 10.5% |
| Native / Alaskan | 28 | 0.4% |
| White / Caucasian | 5,159 | 81.4% |
| Two or more Races | 243 | 3.8% |
| Some other Race | 509 | 8.0% |
| Total | 6,337 | 100.0% |
Ancestry in Durham
The most populous ancestries reported in Durham are German (774 | 12.2%), Mexican (643 | 10.2%), Irish (618 | 9.8%), American (484 | 7.6%), and English (481 | 7.6%), together accounting for 47.3% of all Durham residents.
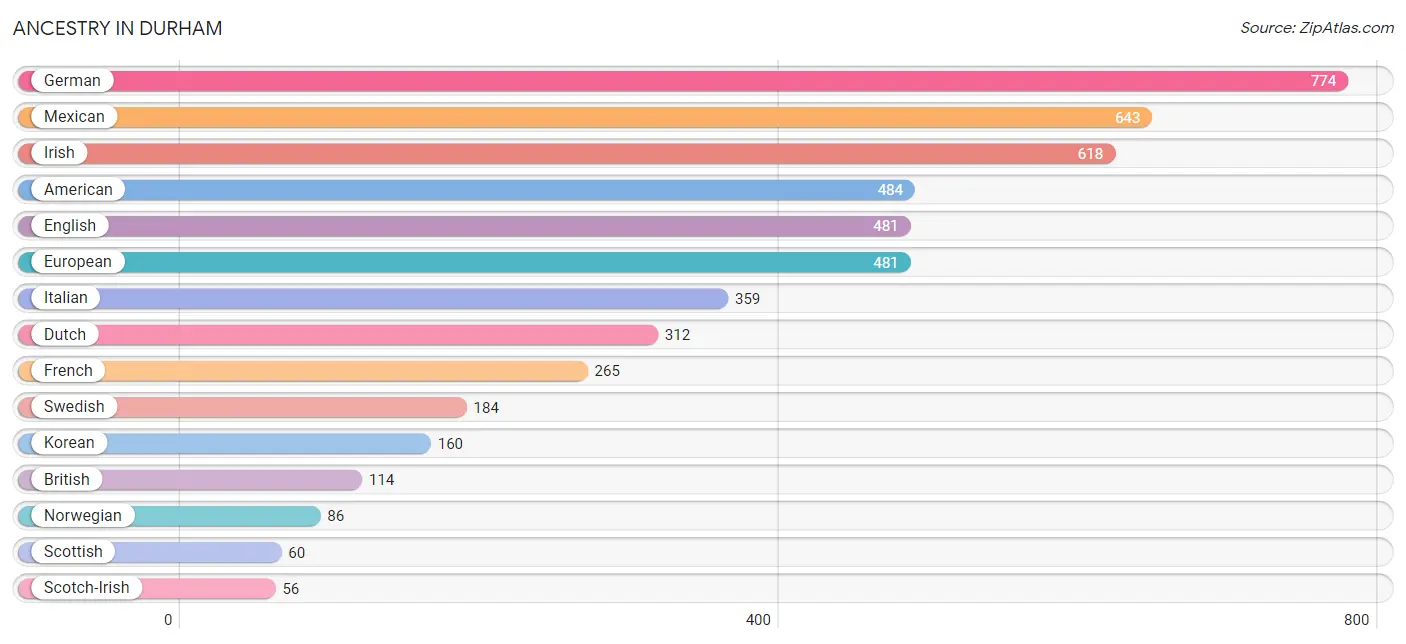
| Ancestry | # Population | % Population |
| American | 484 | 7.6% |
| Austrian | 9 | 0.1% |
| Bhutanese | 33 | 0.5% |
| British | 114 | 1.8% |
| Cherokee | 3 | 0.1% |
| Croatian | 20 | 0.3% |
| Czech | 50 | 0.8% |
| Danish | 44 | 0.7% |
| Dutch | 312 | 4.9% |
| English | 481 | 7.6% |
| European | 481 | 7.6% |
| Finnish | 30 | 0.5% |
| French | 265 | 4.2% |
| French Canadian | 11 | 0.2% |
| German | 774 | 12.2% |
| Greek | 9 | 0.1% |
| Hungarian | 16 | 0.3% |
| Irish | 618 | 9.8% |
| Italian | 359 | 5.7% |
| Korean | 160 | 2.5% |
| Lithuanian | 7 | 0.1% |
| Mexican | 643 | 10.2% |
| Native Hawaiian | 11 | 0.2% |
| Norwegian | 86 | 1.4% |
| Polish | 33 | 0.5% |
| Portuguese | 33 | 0.5% |
| Scotch-Irish | 56 | 0.9% |
| Scottish | 60 | 0.9% |
| Shoshone | 3 | 0.1% |
| Slovak | 20 | 0.3% |
| Spaniard | 25 | 0.4% |
| Swedish | 184 | 2.9% |
| Swiss | 20 | 0.3% | View All 33 Rows |
Immigrants in Durham
The most numerous immigrant groups reported in Durham came from Central America (145 | 2.3%), Latin America (145 | 2.3%), Mexico (145 | 2.3%), Europe (86 | 1.4%), and Asia (75 | 1.2%), together accounting for 9.4% of all Durham residents.
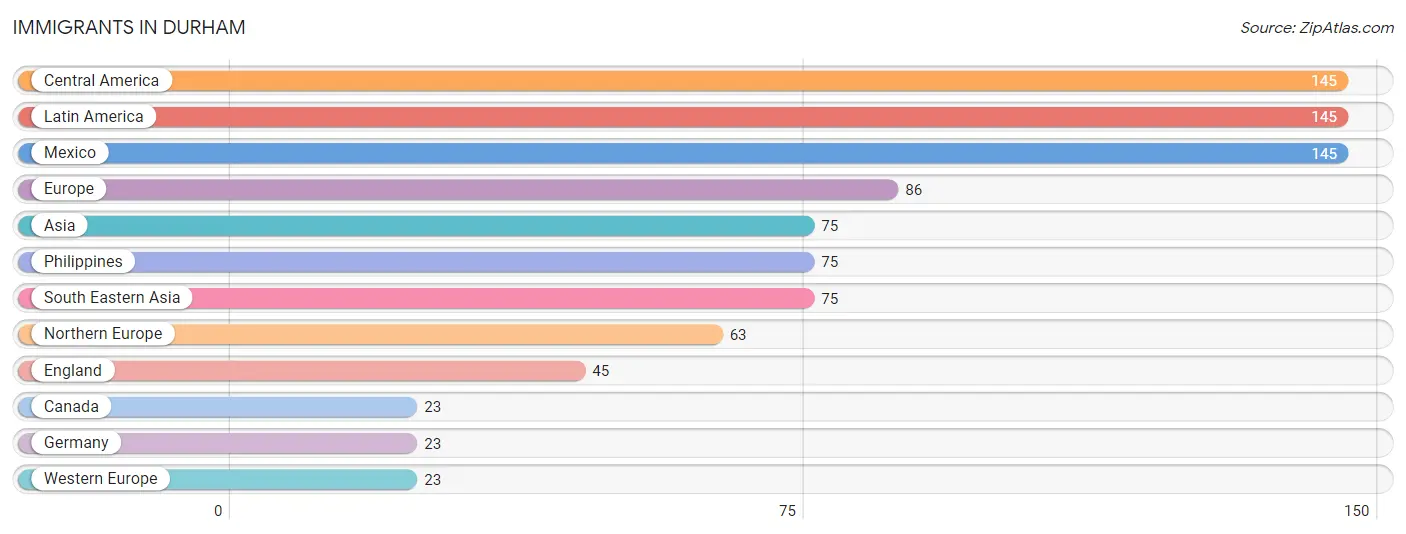
| Immigration Origin | # Population | % Population |
| Asia | 75 | 1.2% |
| Canada | 23 | 0.4% |
| Central America | 145 | 2.3% |
| England | 45 | 0.7% |
| Europe | 86 | 1.4% |
| Germany | 23 | 0.4% |
| Latin America | 145 | 2.3% |
| Mexico | 145 | 2.3% |
| Northern Europe | 63 | 1.0% |
| Philippines | 75 | 1.2% |
| South Eastern Asia | 75 | 1.2% |
| Western Europe | 23 | 0.4% | View All 12 Rows |
Sex and Age in Durham
Sex and Age in Durham
The most populous age groups in Durham are 65 to 69 Years (468 | 13.8%) for men and 50 to 54 Years (509 | 17.3%) for women.
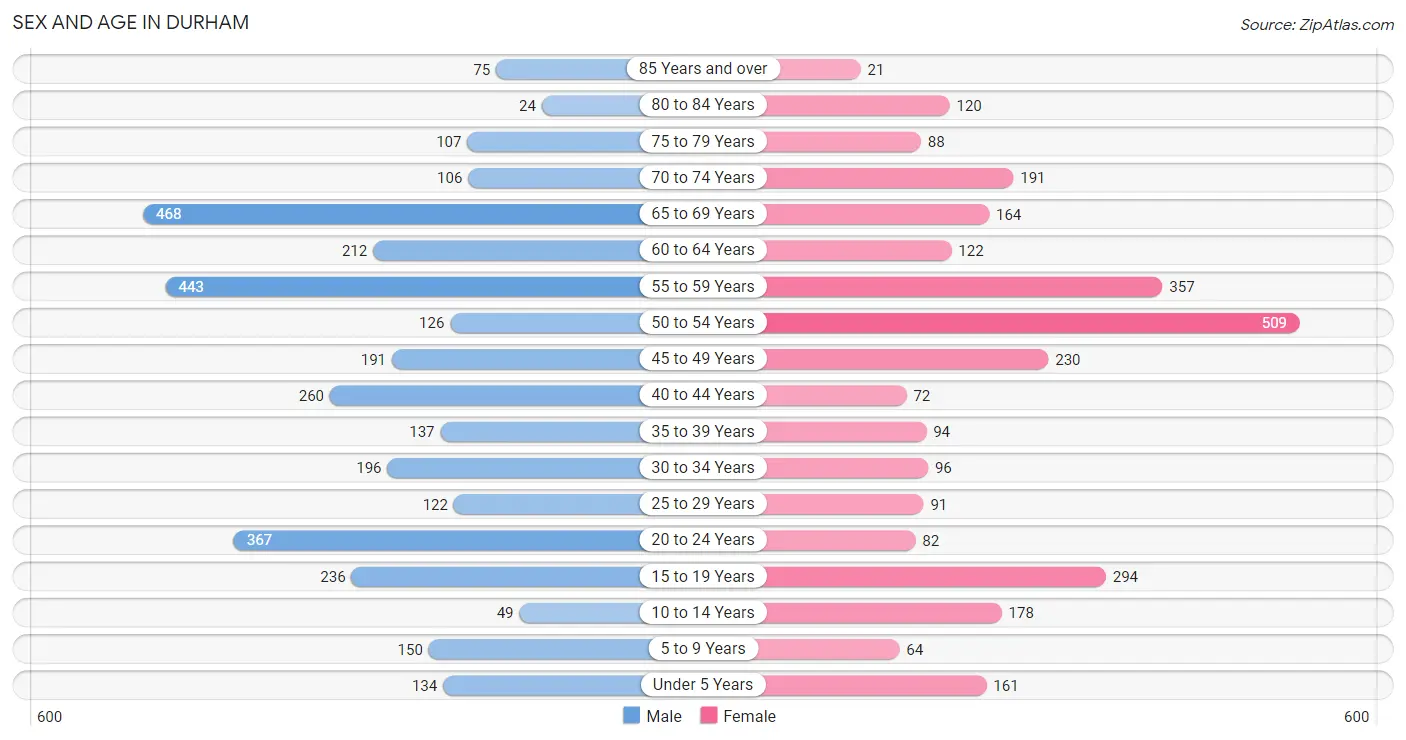
| Age Bracket | Male | Female |
| Under 5 Years | 134 (3.9%) | 161 (5.5%) |
| 5 to 9 Years | 150 (4.4%) | 64 (2.2%) |
| 10 to 14 Years | 49 (1.4%) | 178 (6.1%) |
| 15 to 19 Years | 236 (6.9%) | 294 (10.0%) |
| 20 to 24 Years | 367 (10.8%) | 82 (2.8%) |
| 25 to 29 Years | 122 (3.6%) | 91 (3.1%) |
| 30 to 34 Years | 196 (5.8%) | 96 (3.3%) |
| 35 to 39 Years | 137 (4.0%) | 94 (3.2%) |
| 40 to 44 Years | 260 (7.6%) | 72 (2.5%) |
| 45 to 49 Years | 191 (5.6%) | 230 (7.8%) |
| 50 to 54 Years | 126 (3.7%) | 509 (17.3%) |
| 55 to 59 Years | 443 (13.0%) | 357 (12.2%) |
| 60 to 64 Years | 212 (6.2%) | 122 (4.2%) |
| 65 to 69 Years | 468 (13.8%) | 164 (5.6%) |
| 70 to 74 Years | 106 (3.1%) | 191 (6.5%) |
| 75 to 79 Years | 107 (3.1%) | 88 (3.0%) |
| 80 to 84 Years | 24 (0.7%) | 120 (4.1%) |
| 85 Years and over | 75 (2.2%) | 21 (0.7%) |
| Total | 3,403 (100.0%) | 2,934 (100.0%) |
Families and Households in Durham
Median Family Size in Durham
The median family size in Durham is 3.10 persons per family, with single female/mother families (88 | 5.2%) accounting for the largest median family size of 4.81 persons per family. On the other hand, single male/father families (135 | 8.0%) represent the smallest median family size with 2.62 persons per family.
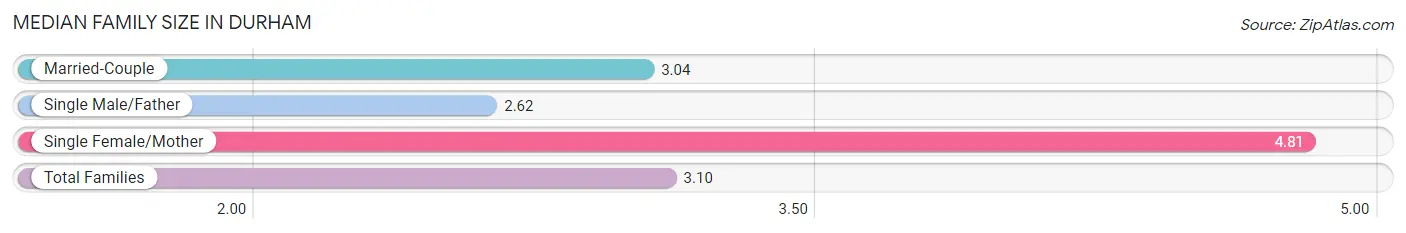
| Family Type | # Families | Family Size |
| Married-Couple | 1,463 (86.8%) | 3.04 |
| Single Male/Father | 135 (8.0%) | 2.62 |
| Single Female/Mother | 88 (5.2%) | 4.81 |
| Total Families | 1,686 (100.0%) | 3.10 |
Median Household Size in Durham
The median household size in Durham is 2.98 persons per household, with single female/mother households (88 | 4.2%) accounting for the largest median household size of 5.06 persons per household. non-family households (424 | 20.1%) represent the smallest median household size with 1.28 persons per household.
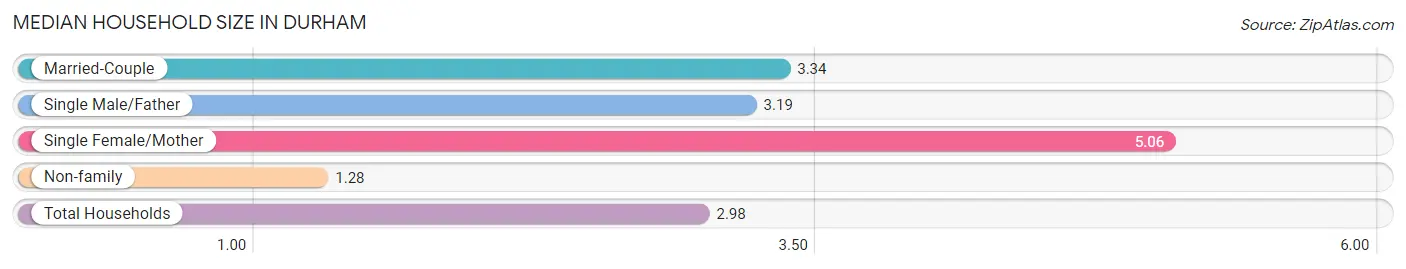
| Household Type | # Households | Household Size |
| Married-Couple | 1,463 (69.3%) | 3.34 |
| Single Male/Father | 135 (6.4%) | 3.19 |
| Single Female/Mother | 88 (4.2%) | 5.06 |
| Non-family | 424 (20.1%) | 1.28 |
| Total Households | 2,110 (100.0%) | 2.98 |
Household Size by Marriage Status in Durham
Out of a total of 2,110 households in Durham, 1,686 (79.9%) are family households, while 424 (20.1%) are nonfamily households. The most numerous type of family households are 2-person households, comprising 822, and the most common type of nonfamily households are 1-person households, comprising 321.
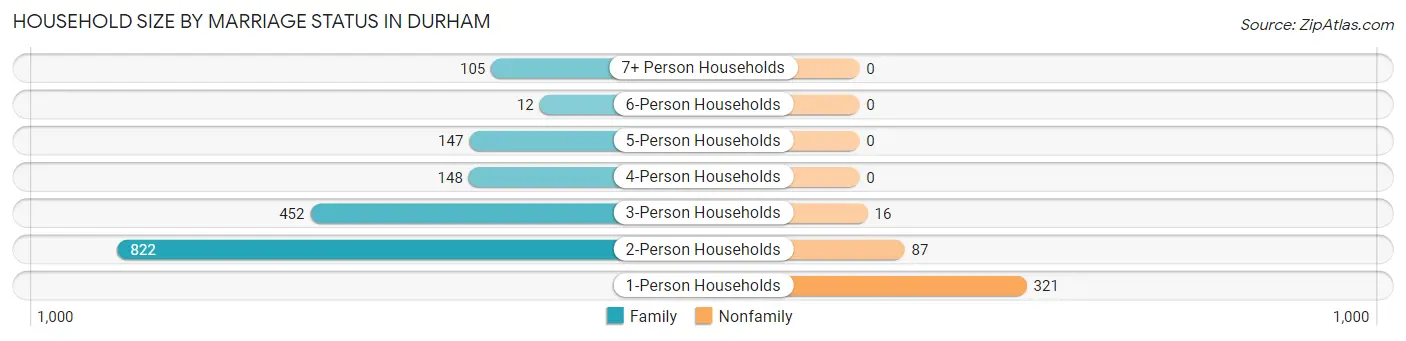
| Household Size | Family Households | Nonfamily Households |
| 1-Person Households | - | 321 (15.2%) |
| 2-Person Households | 822 (39.0%) | 87 (4.1%) |
| 3-Person Households | 452 (21.4%) | 16 (0.8%) |
| 4-Person Households | 148 (7.0%) | 0 (0.0%) |
| 5-Person Households | 147 (7.0%) | 0 (0.0%) |
| 6-Person Households | 12 (0.6%) | 0 (0.0%) |
| 7+ Person Households | 105 (5.0%) | 0 (0.0%) |
| Total | 1,686 (79.9%) | 424 (20.1%) |
Female Fertility in Durham
Fertility by Age in Durham
Average fertility rate in Durham is 54.0 births per 1,000 women. Women in the age bracket of 20 to 34 years have the highest fertility rate with 171.0 births per 1,000 women. Women in the age bracket of 20 to 34 years acount for 76.7% of all women with births.
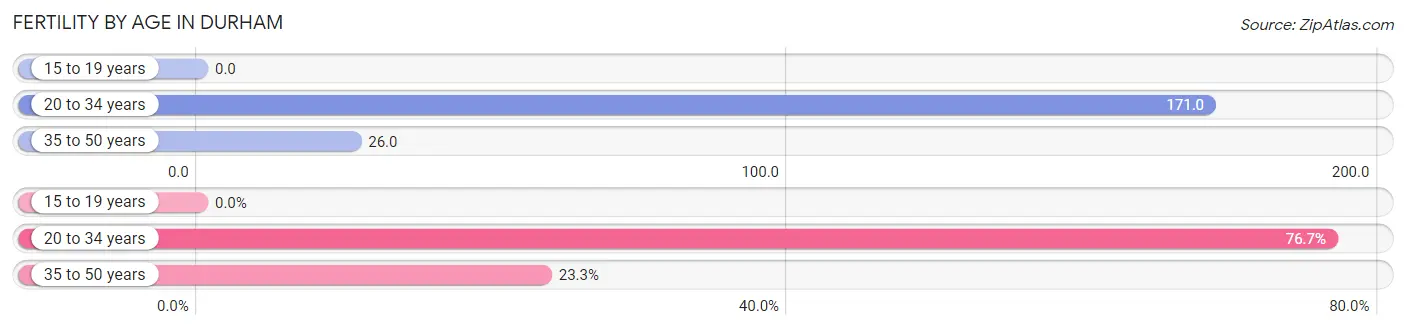
| Age Bracket | Women with Births | Births / 1,000 Women |
| 15 to 19 years | 0 (0.0%) | 0.0 |
| 20 to 34 years | 46 (76.7%) | 171.0 |
| 35 to 50 years | 14 (23.3%) | 26.0 |
| Total | 60 (100.0%) | 54.0 |
Fertility by Age by Marriage Status in Durham
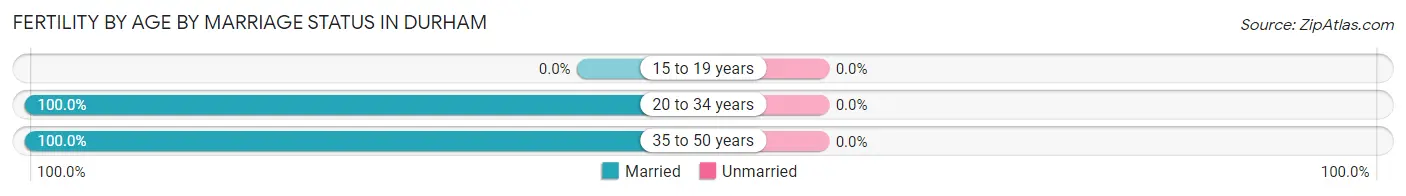
| Age Bracket | Married | Unmarried |
| 15 to 19 years | 0 (0.0%) | 0 (0.0%) |
| 20 to 34 years | 46 (100.0%) | 0 (0.0%) |
| 35 to 50 years | 14 (100.0%) | 0 (0.0%) |
| Total | 60 (100.0%) | 0 (0.0%) |
Fertility by Education in Durham
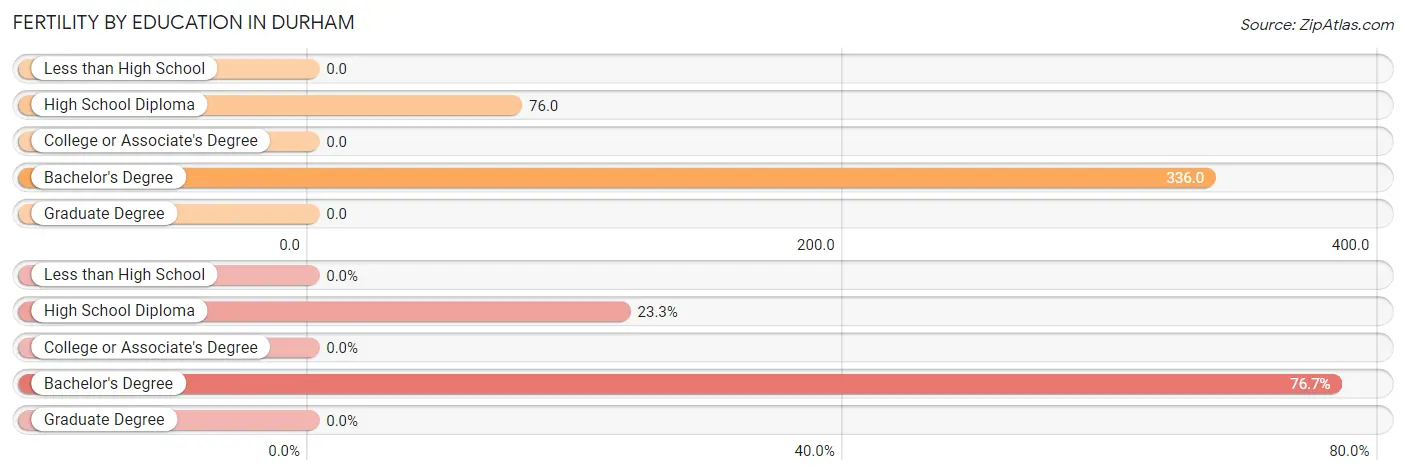
| Educational Attainment | Women with Births | Births / 1,000 Women |
| Less than High School | 0 (0.0%) | 0.0 |
| High School Diploma | 14 (23.3%) | 76.0 |
| College or Associate's Degree | 0 (0.0%) | 0.0 |
| Bachelor's Degree | 46 (76.7%) | 336.0 |
| Graduate Degree | 0 (0.0%) | 0.0 |
| Total | 60 (100.0%) | 54.0 |
Fertility by Education by Marriage Status in Durham
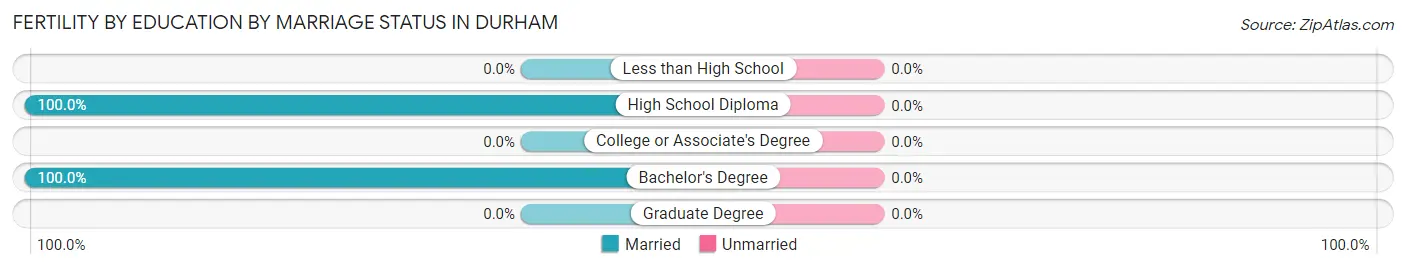
| Educational Attainment | Married | Unmarried |
| Less than High School | 0 (0.0%) | 0 (0.0%) |
| High School Diploma | 14 (100.0%) | 0 (0.0%) |
| College or Associate's Degree | 0 (0.0%) | 0 (0.0%) |
| Bachelor's Degree | 46 (100.0%) | 0 (0.0%) |
| Graduate Degree | 0 (0.0%) | 0 (0.0%) |
| Total | 60 (100.0%) | 0 (0.0%) |
Employment Characteristics in Durham
Employment by Class of Employer in Durham
Among the 2,796 employed individuals in Durham, private company employees (1,574 | 56.3%), local government employees (293 | 10.5%), and self-employed (incorporated) (285 | 10.2%) make up the most common classes of employment.
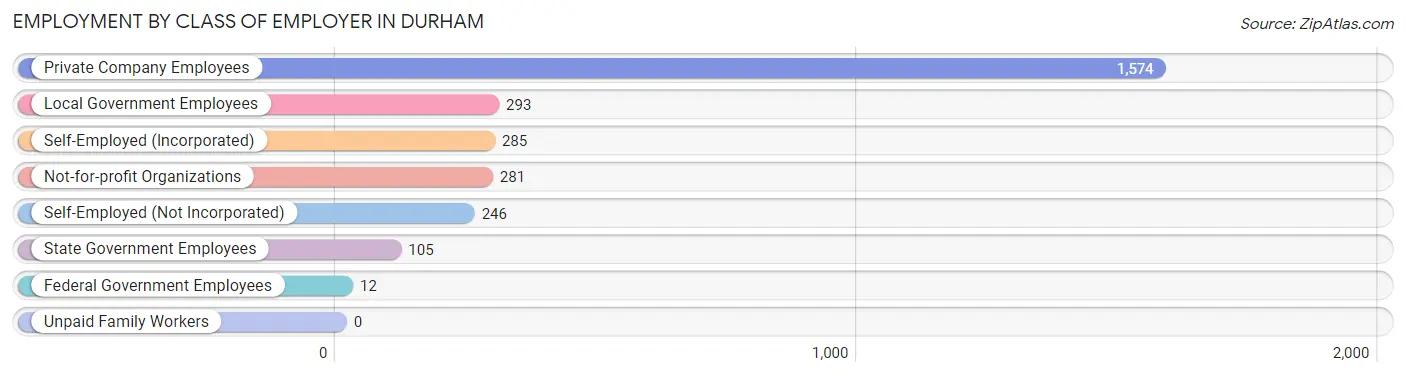
| Employer Class | # Employees | % Employees |
| Private Company Employees | 1,574 | 56.3% |
| Self-Employed (Incorporated) | 285 | 10.2% |
| Self-Employed (Not Incorporated) | 246 | 8.8% |
| Not-for-profit Organizations | 281 | 10.1% |
| Local Government Employees | 293 | 10.5% |
| State Government Employees | 105 | 3.8% |
| Federal Government Employees | 12 | 0.4% |
| Unpaid Family Workers | 0 | 0.0% |
| Total | 2,796 | 100.0% |
Employment Status by Age in Durham
According to the labor force statistics for Durham, out of the total population over 16 years of age (5,452), 55.7% or 3,037 individuals are in the labor force, with 5.8% or 176 of them unemployed. The age group with the highest labor force participation rate is 35 to 44 years, with 97.5% or 549 individuals in the labor force. Within the labor force, the 16 to 19 years age range has the highest percentage of unemployed individuals, with 28.3% or 13 of them being unemployed.
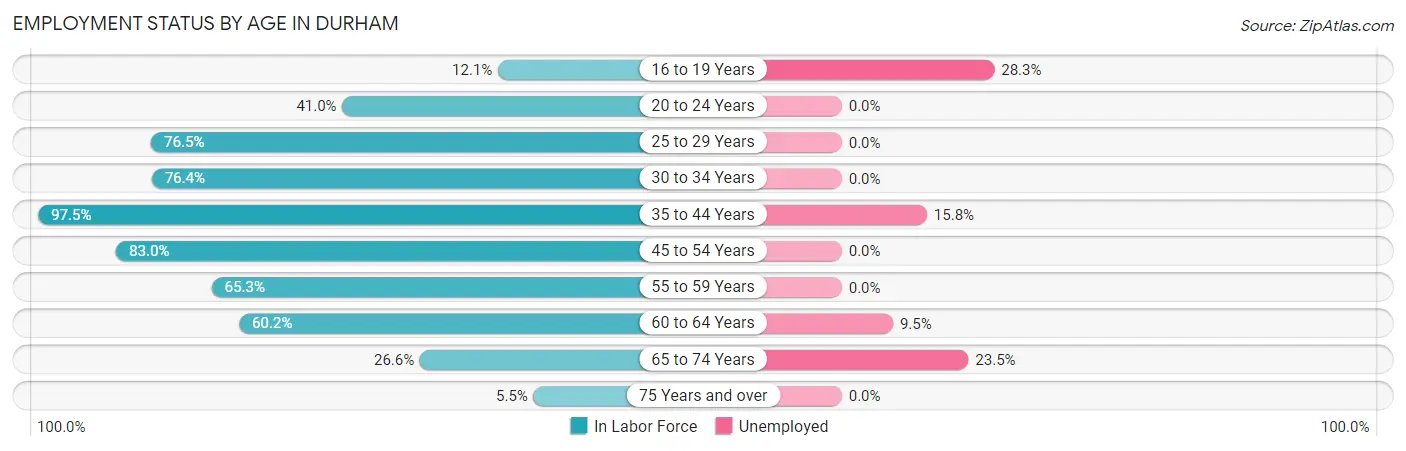
| Age Bracket | In Labor Force | Unemployed |
| 16 to 19 Years | 46 (12.1%) | 13 (28.3%) |
| 20 to 24 Years | 184 (41.0%) | 0 (0.0%) |
| 25 to 29 Years | 163 (76.5%) | 0 (0.0%) |
| 30 to 34 Years | 223 (76.4%) | 0 (0.0%) |
| 35 to 44 Years | 549 (97.5%) | 87 (15.8%) |
| 45 to 54 Years | 876 (83.0%) | 0 (0.0%) |
| 55 to 59 Years | 522 (65.3%) | 0 (0.0%) |
| 60 to 64 Years | 201 (60.2%) | 19 (9.5%) |
| 65 to 74 Years | 247 (26.6%) | 58 (23.5%) |
| 75 Years and over | 24 (5.5%) | 0 (0.0%) |
| Total | 3,037 (55.7%) | 176 (5.8%) |
Employment Status by Educational Attainment in Durham
According to labor force statistics for Durham, 77.8% of individuals (2,535) out of the total population between 25 and 64 years of age (3,258) are in the labor force, with 4.2% or 106 of them being unemployed. The group with the highest labor force participation rate are those with the educational attainment of college / associate degree, with 80.4% or 1,028 individuals in the labor force. Within the labor force, individuals with college / associate degree education have the highest percentage of unemployment, with 7.1% or 73 of them being unemployed.
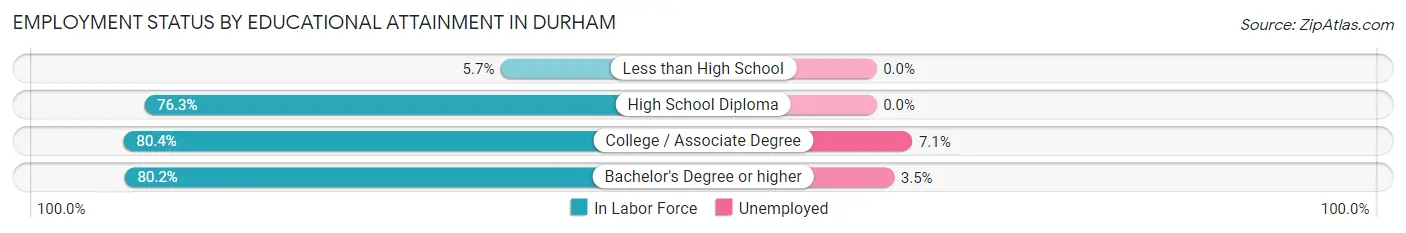
| Educational Attainment | In Labor Force | Unemployed |
| Less than High School | 4 (5.7%) | 0 (0.0%) |
| High School Diploma | 558 (76.3%) | 0 (0.0%) |
| College / Associate Degree | 1,028 (80.4%) | 91 (7.1%) |
| Bachelor's Degree or higher | 946 (80.2%) | 41 (3.5%) |
| Total | 2,535 (77.8%) | 137 (4.2%) |
Employment Occupations by Sex in Durham
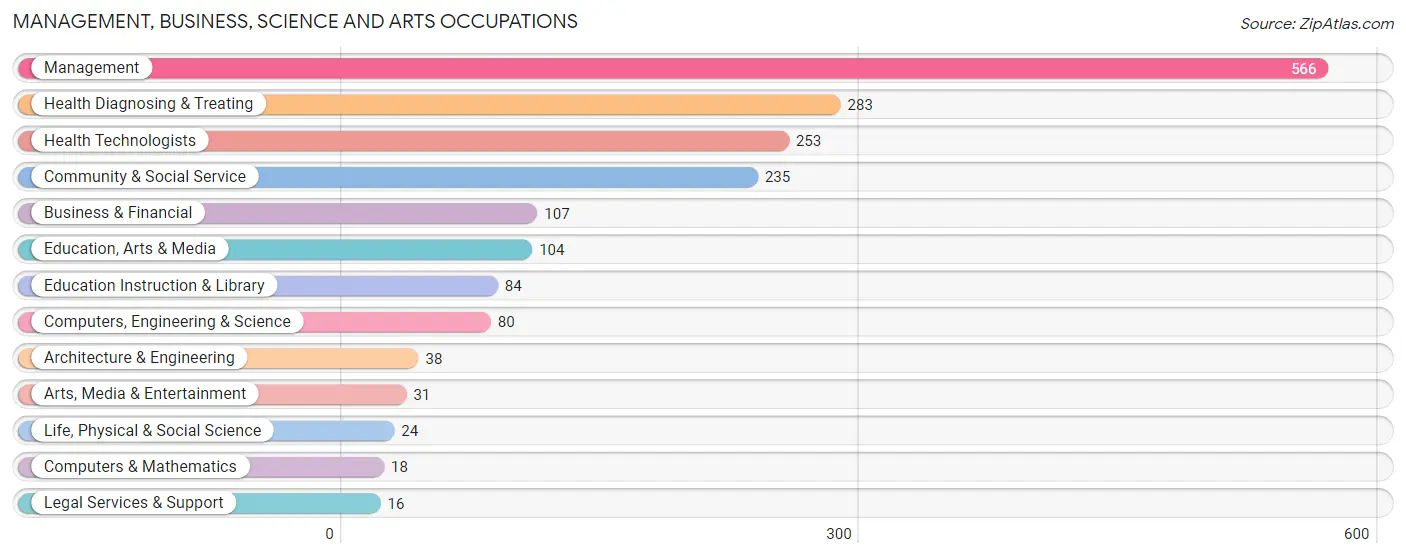
Management, Business, Science and Arts Occupations
The most common Management, Business, Science and Arts occupations in Durham are Management (566 | 19.8%), Health Diagnosing & Treating (283 | 9.9%), Health Technologists (253 | 8.8%), Community & Social Service (235 | 8.2%), and Business & Financial (107 | 3.7%).
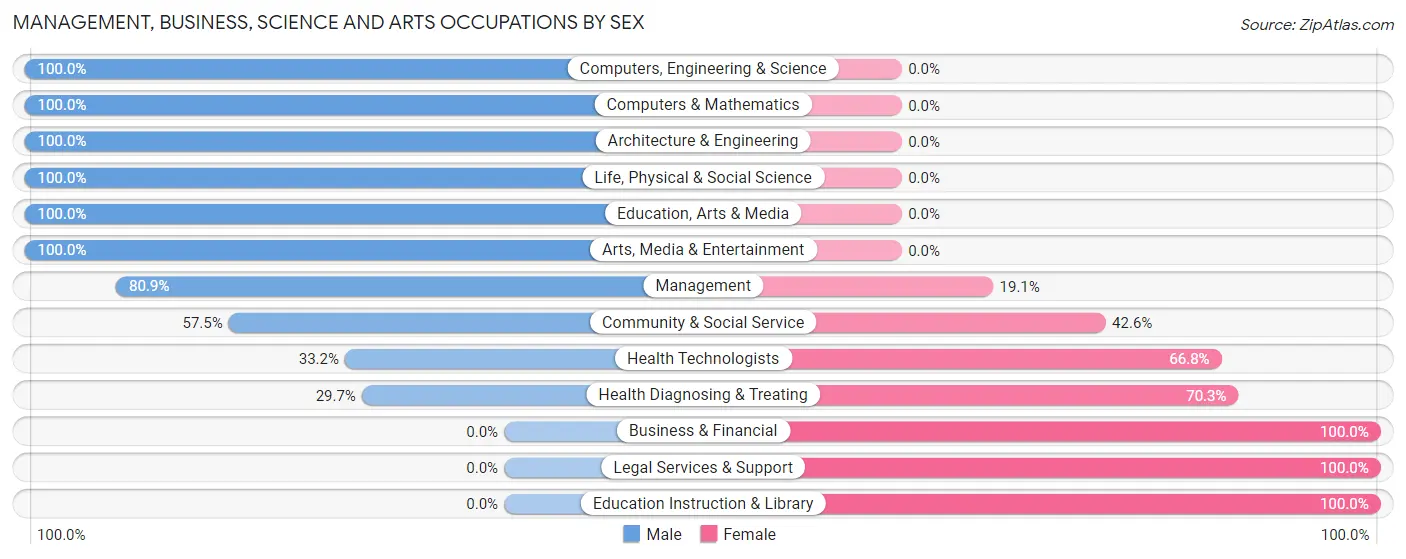
Management, Business, Science and Arts Occupations by Sex
Within the Management, Business, Science and Arts occupations in Durham, the most male-oriented occupations are Computers, Engineering & Science (100.0%), Computers & Mathematics (100.0%), and Architecture & Engineering (100.0%), while the most female-oriented occupations are Business & Financial (100.0%), Legal Services & Support (100.0%), and Education Instruction & Library (100.0%).
| Occupation | Male | Female |
| Management | 458 (80.9%) | 108 (19.1%) |
| Business & Financial | 0 (0.0%) | 107 (100.0%) |
| Computers, Engineering & Science | 80 (100.0%) | 0 (0.0%) |
| Computers & Mathematics | 18 (100.0%) | 0 (0.0%) |
| Architecture & Engineering | 38 (100.0%) | 0 (0.0%) |
| Life, Physical & Social Science | 24 (100.0%) | 0 (0.0%) |
| Community & Social Service | 135 (57.5%) | 100 (42.5%) |
| Education, Arts & Media | 104 (100.0%) | 0 (0.0%) |
| Legal Services & Support | 0 (0.0%) | 16 (100.0%) |
| Education Instruction & Library | 0 (0.0%) | 84 (100.0%) |
| Arts, Media & Entertainment | 31 (100.0%) | 0 (0.0%) |
| Health Diagnosing & Treating | 84 (29.7%) | 199 (70.3%) |
| Health Technologists | 84 (33.2%) | 169 (66.8%) |
| Total (Category) | 757 (59.6%) | 514 (40.4%) |
| Total (Overall) | 1,815 (63.5%) | 1,044 (36.5%) |
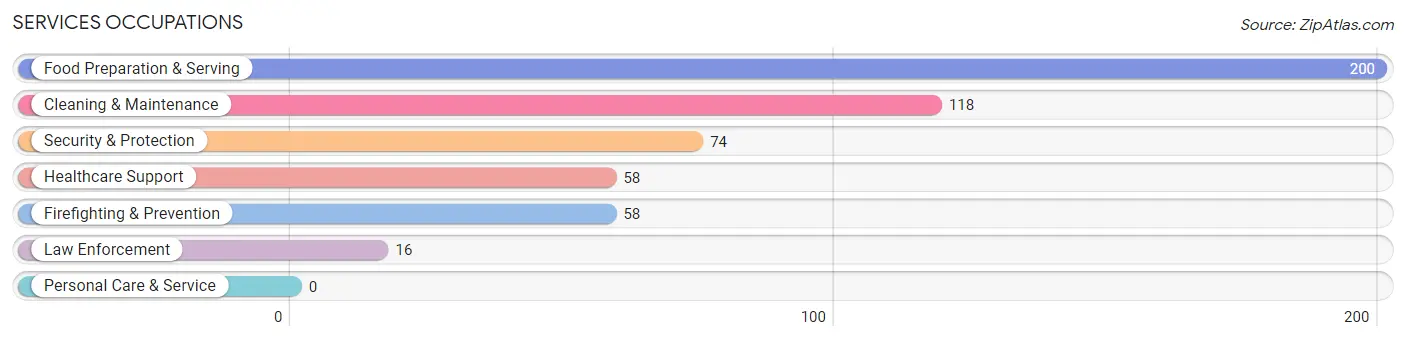
Services Occupations
The most common Services occupations in Durham are Food Preparation & Serving (200 | 7.0%), Cleaning & Maintenance (118 | 4.1%), Security & Protection (74 | 2.6%), Healthcare Support (58 | 2.0%), and Firefighting & Prevention (58 | 2.0%).
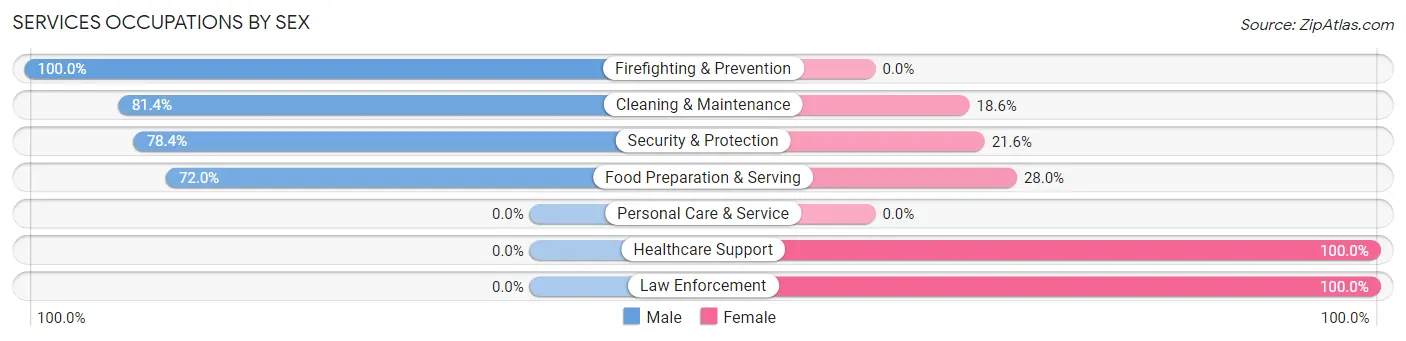
Services Occupations by Sex
Within the Services occupations in Durham, the most male-oriented occupations are Firefighting & Prevention (100.0%), Cleaning & Maintenance (81.4%), and Security & Protection (78.4%), while the most female-oriented occupations are Healthcare Support (100.0%), Law Enforcement (100.0%), and Food Preparation & Serving (28.0%).
| Occupation | Male | Female |
| Healthcare Support | 0 (0.0%) | 58 (100.0%) |
| Security & Protection | 58 (78.4%) | 16 (21.6%) |
| Firefighting & Prevention | 58 (100.0%) | 0 (0.0%) |
| Law Enforcement | 0 (0.0%) | 16 (100.0%) |
| Food Preparation & Serving | 144 (72.0%) | 56 (28.0%) |
| Cleaning & Maintenance | 96 (81.4%) | 22 (18.6%) |
| Personal Care & Service | 0 (0.0%) | 0 (0.0%) |
| Total (Category) | 298 (66.2%) | 152 (33.8%) |
| Total (Overall) | 1,815 (63.5%) | 1,044 (36.5%) |
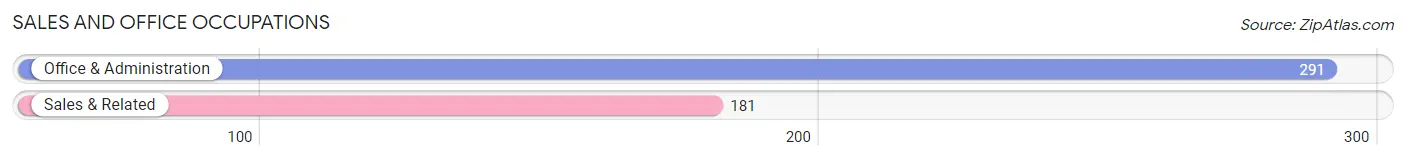
Sales and Office Occupations
The most common Sales and Office occupations in Durham are Office & Administration (291 | 10.2%), and Sales & Related (181 | 6.3%).
Sales and Office Occupations by Sex
| Occupation | Male | Female |
| Sales & Related | 166 (91.7%) | 15 (8.3%) |
| Office & Administration | 0 (0.0%) | 291 (100.0%) |
| Total (Category) | 166 (35.2%) | 306 (64.8%) |
| Total (Overall) | 1,815 (63.5%) | 1,044 (36.5%) |
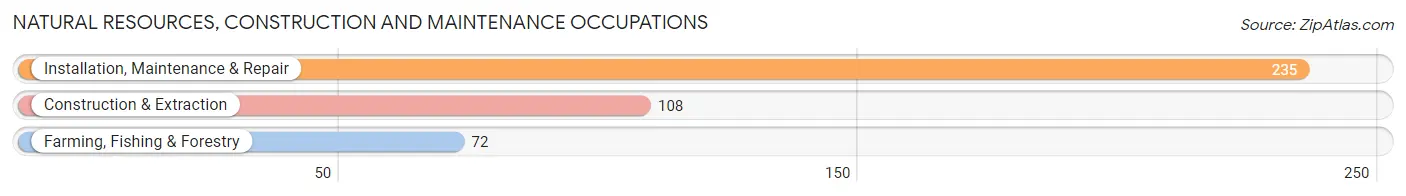
Natural Resources, Construction and Maintenance Occupations
The most common Natural Resources, Construction and Maintenance occupations in Durham are Installation, Maintenance & Repair (235 | 8.2%), Construction & Extraction (108 | 3.8%), and Farming, Fishing & Forestry (72 | 2.5%).
Natural Resources, Construction and Maintenance Occupations by Sex
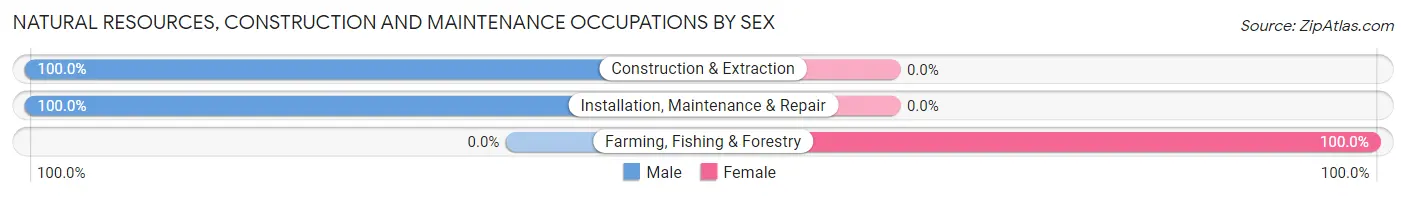
| Occupation | Male | Female |
| Farming, Fishing & Forestry | 0 (0.0%) | 72 (100.0%) |
| Construction & Extraction | 108 (100.0%) | 0 (0.0%) |
| Installation, Maintenance & Repair | 235 (100.0%) | 0 (0.0%) |
| Total (Category) | 343 (82.7%) | 72 (17.3%) |
| Total (Overall) | 1,815 (63.5%) | 1,044 (36.5%) |
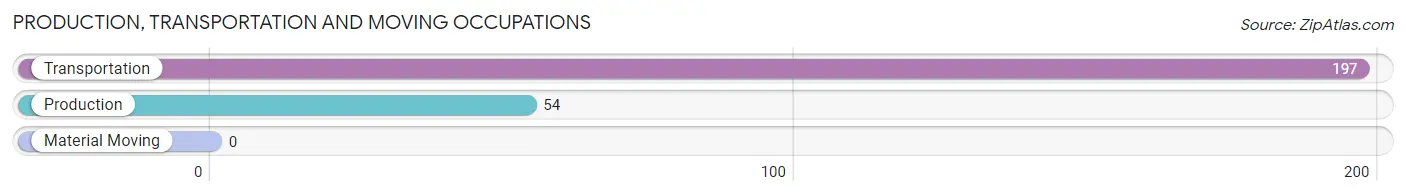
Production, Transportation and Moving Occupations
The most common Production, Transportation and Moving occupations in Durham are Transportation (197 | 6.9%), and Production (54 | 1.9%).
Production, Transportation and Moving Occupations by Sex
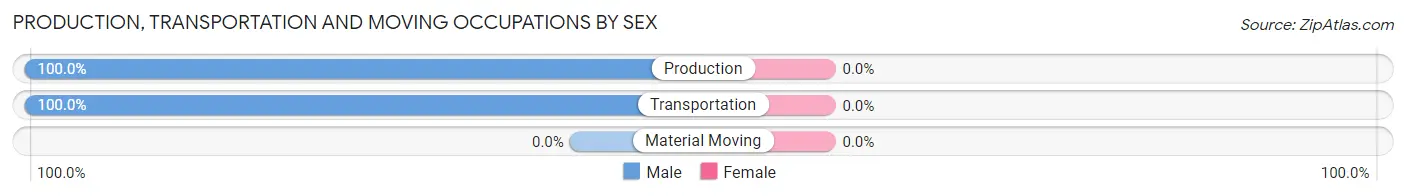
| Occupation | Male | Female |
| Production | 54 (100.0%) | 0 (0.0%) |
| Transportation | 197 (100.0%) | 0 (0.0%) |
| Material Moving | 0 (0.0%) | 0 (0.0%) |
| Total (Category) | 251 (100.0%) | 0 (0.0%) |
| Total (Overall) | 1,815 (63.5%) | 1,044 (36.5%) |
Employment Industries by Sex in Durham
Employment Industries in Durham
The major employment industries in Durham include Agriculture, Fishing & Hunting (378 | 13.2%), Health Care & Social Assistance (366 | 12.8%), Educational Services (321 | 11.2%), Retail Trade (285 | 10.0%), and Accommodation & Food Services (230 | 8.0%).
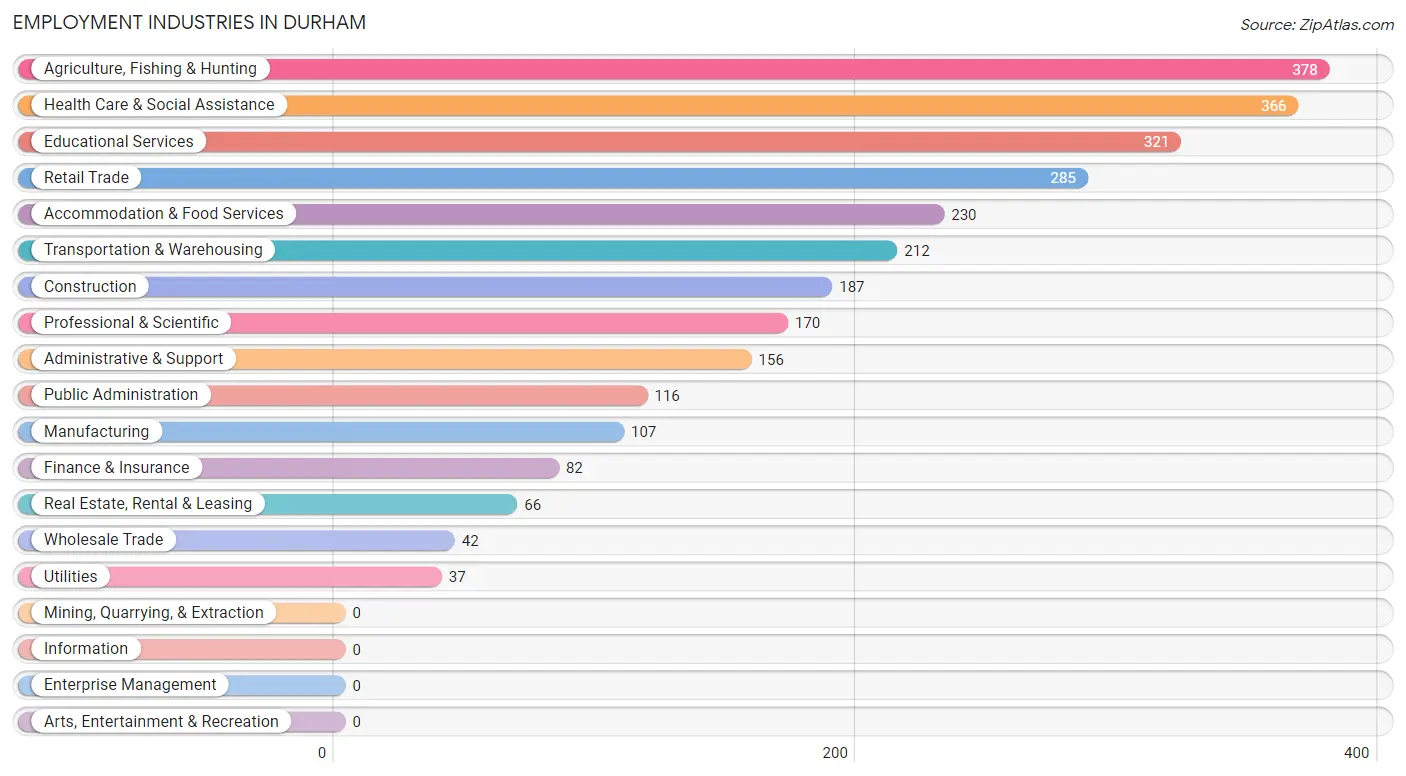
Employment Industries by Sex in Durham
The Durham industries that see more men than women are Construction (100.0%), Transportation & Warehousing (100.0%), and Utilities (100.0%), whereas the industries that tend to have a higher number of women are Real Estate, Rental & Leasing (80.3%), Finance & Insurance (79.3%), and Health Care & Social Assistance (77.0%).
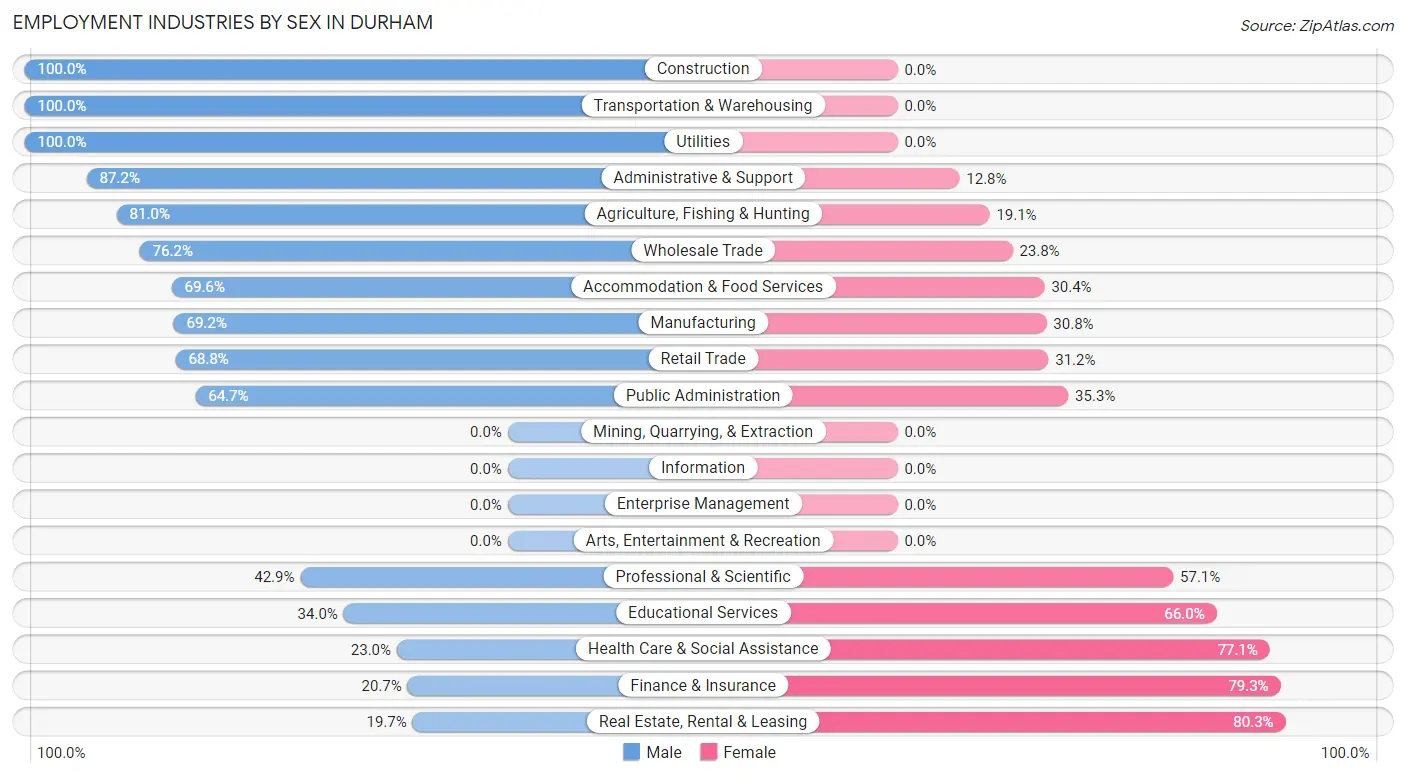
| Industry | Male | Female |
| Agriculture, Fishing & Hunting | 306 (80.9%) | 72 (19.1%) |
| Mining, Quarrying, & Extraction | 0 (0.0%) | 0 (0.0%) |
| Construction | 187 (100.0%) | 0 (0.0%) |
| Manufacturing | 74 (69.2%) | 33 (30.8%) |
| Wholesale Trade | 32 (76.2%) | 10 (23.8%) |
| Retail Trade | 196 (68.8%) | 89 (31.2%) |
| Transportation & Warehousing | 212 (100.0%) | 0 (0.0%) |
| Utilities | 37 (100.0%) | 0 (0.0%) |
| Information | 0 (0.0%) | 0 (0.0%) |
| Finance & Insurance | 17 (20.7%) | 65 (79.3%) |
| Real Estate, Rental & Leasing | 13 (19.7%) | 53 (80.3%) |
| Professional & Scientific | 73 (42.9%) | 97 (57.1%) |
| Enterprise Management | 0 (0.0%) | 0 (0.0%) |
| Administrative & Support | 136 (87.2%) | 20 (12.8%) |
| Educational Services | 109 (34.0%) | 212 (66.0%) |
| Health Care & Social Assistance | 84 (23.0%) | 282 (77.0%) |
| Arts, Entertainment & Recreation | 0 (0.0%) | 0 (0.0%) |
| Accommodation & Food Services | 160 (69.6%) | 70 (30.4%) |
| Public Administration | 75 (64.7%) | 41 (35.3%) |
| Total | 1,815 (63.5%) | 1,044 (36.5%) |
Education in Durham
School Enrollment in Durham
The most common levels of schooling among the 1,362 students in Durham are high school (474 | 34.8%), college / undergraduate (241 | 17.7%), and middle school (187 | 13.7%).
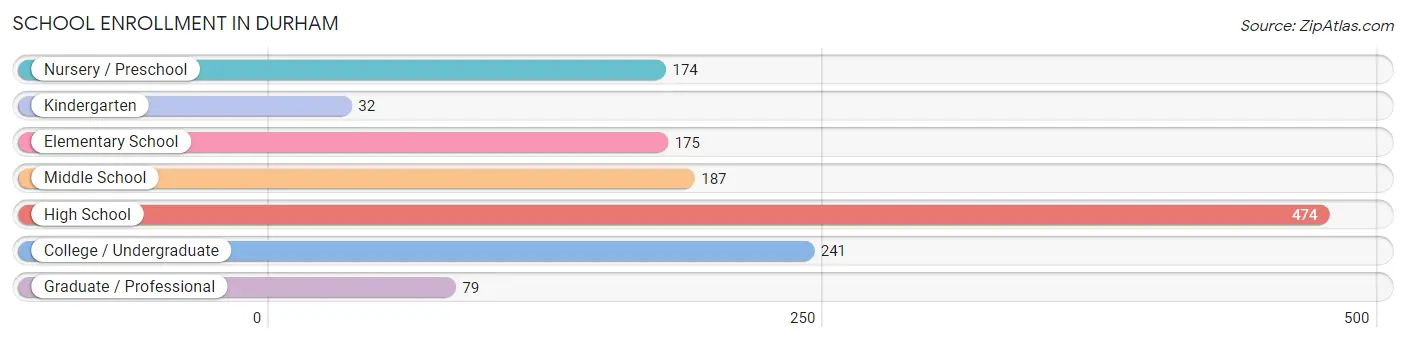
| School Level | # Students | % Students |
| Nursery / Preschool | 174 | 12.8% |
| Kindergarten | 32 | 2.4% |
| Elementary School | 175 | 12.9% |
| Middle School | 187 | 13.7% |
| High School | 474 | 34.8% |
| College / Undergraduate | 241 | 17.7% |
| Graduate / Professional | 79 | 5.8% |
| Total | 1,362 | 100.0% |
School Enrollment by Age by Funding Source in Durham
Out of a total of 1,362 students who are enrolled in schools in Durham, 253 (18.6%) attend a private institution, while the remaining 1,109 (81.4%) are enrolled in public schools. The age group of 3 to 4 year olds has the highest likelihood of being enrolled in private schools, with 174 (100.0% in the age bracket) enrolled. Conversely, the age group of 5 to 9 year old has the lowest likelihood of being enrolled in a private school, with 181 (100.0% in the age bracket) attending a public institution.
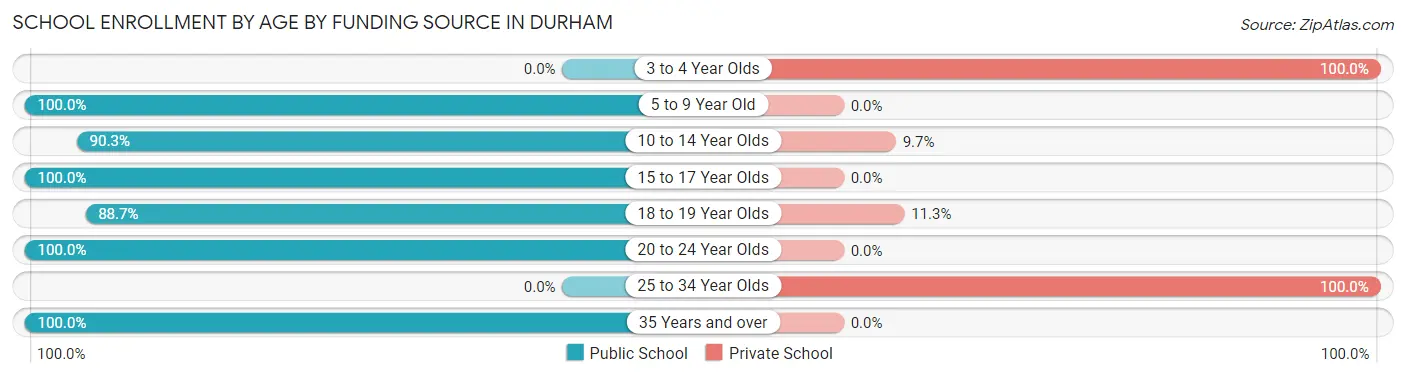
| Age Bracket | Public School | Private School |
| 3 to 4 Year Olds | 0 (0.0%) | 174 (100.0%) |
| 5 to 9 Year Old | 181 (100.0%) | 0 (0.0%) |
| 10 to 14 Year Olds | 205 (90.3%) | 22 (9.7%) |
| 15 to 17 Year Olds | 315 (100.0%) | 0 (0.0%) |
| 18 to 19 Year Olds | 165 (88.7%) | 21 (11.3%) |
| 20 to 24 Year Olds | 116 (100.0%) | 0 (0.0%) |
| 25 to 34 Year Olds | 0 (0.0%) | 36 (100.0%) |
| 35 Years and over | 127 (100.0%) | 0 (0.0%) |
| Total | 1,109 (81.4%) | 253 (18.6%) |
Educational Attainment by Field of Study in Durham
Business (416 | 21.0%), science & technology (259 | 13.1%), bio, nature & agricultural (246 | 12.4%), arts & humanities (186 | 9.4%), and education (159 | 8.0%) are the most common fields of study among 1,979 individuals in Durham who have obtained a bachelor's degree or higher.
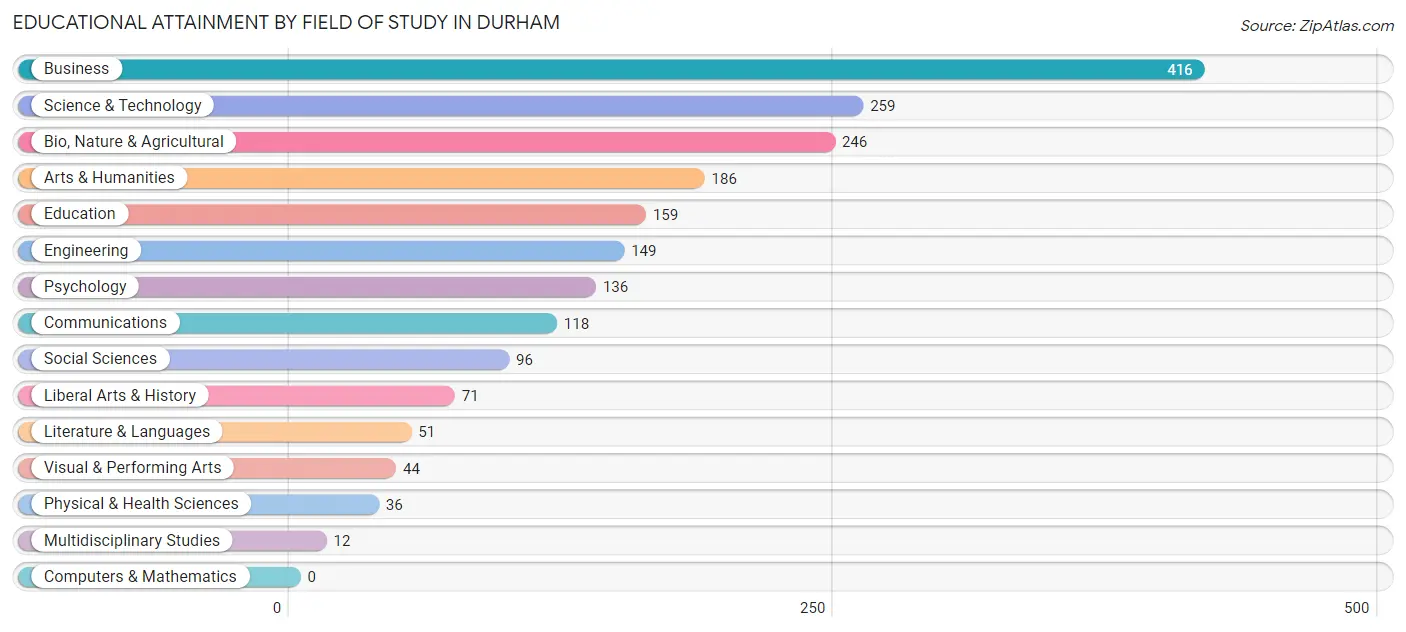
| Field of Study | # Graduates | % Graduates |
| Computers & Mathematics | 0 | 0.0% |
| Bio, Nature & Agricultural | 246 | 12.4% |
| Physical & Health Sciences | 36 | 1.8% |
| Psychology | 136 | 6.9% |
| Social Sciences | 96 | 4.9% |
| Engineering | 149 | 7.5% |
| Multidisciplinary Studies | 12 | 0.6% |
| Science & Technology | 259 | 13.1% |
| Business | 416 | 21.0% |
| Education | 159 | 8.0% |
| Literature & Languages | 51 | 2.6% |
| Liberal Arts & History | 71 | 3.6% |
| Visual & Performing Arts | 44 | 2.2% |
| Communications | 118 | 6.0% |
| Arts & Humanities | 186 | 9.4% |
| Total | 1,979 | 100.0% |
Transportation & Commute in Durham
Vehicle Availability by Sex in Durham
The most prevalent vehicle ownership categories in Durham are males with 2 vehicles (643, accounting for 36.8%) and females with 2 vehicles (412, making up 61.6%).
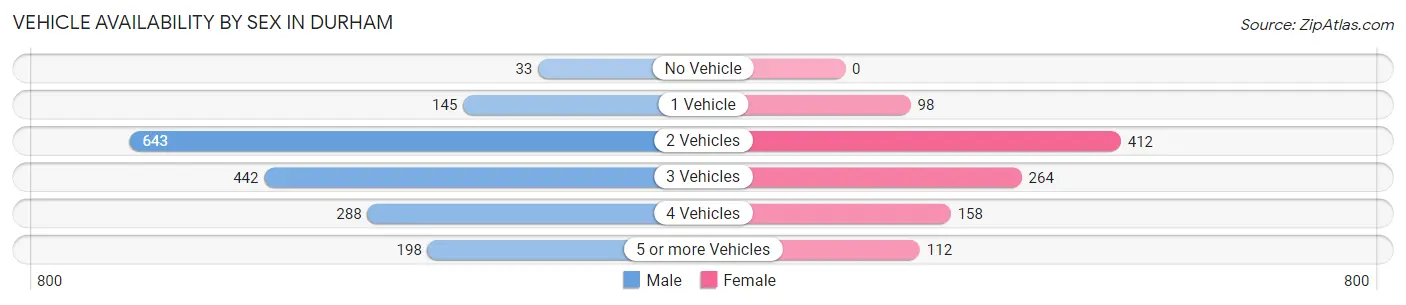
| Vehicles Available | Male | Female |
| No Vehicle | 33 (1.9%) | 0 (0.0%) |
| 1 Vehicle | 145 (8.3%) | 98 (9.4%) |
| 2 Vehicles | 643 (36.8%) | 412 (39.5%) |
| 3 Vehicles | 442 (25.3%) | 264 (25.3%) |
| 4 Vehicles | 288 (16.5%) | 158 (15.1%) |
| 5 or more Vehicles | 198 (11.3%) | 112 (10.7%) |
| Total | 1,749 (100.0%) | 1,044 (100.0%) |
Commute Time in Durham
The most frequently occuring commute durations in Durham are 10 to 14 minutes (468 commuters, 18.9%), 30 to 34 minutes (385 commuters, 15.5%), and 15 to 19 minutes (372 commuters, 15.0%).
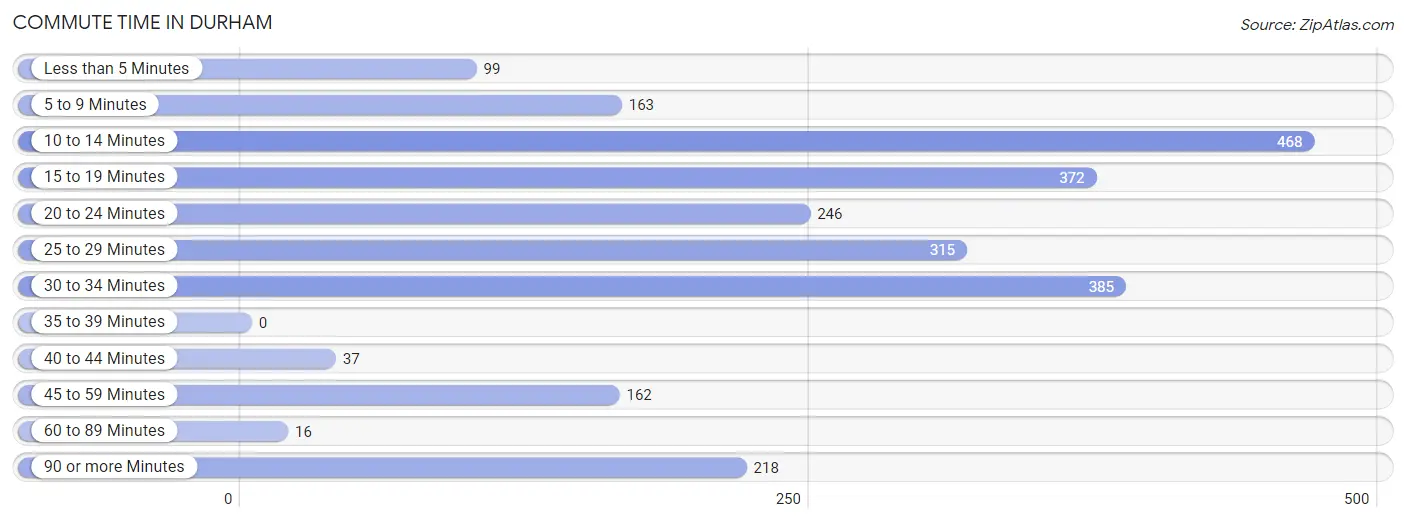
| Commute Time | # Commuters | % Commuters |
| Less than 5 Minutes | 99 | 4.0% |
| 5 to 9 Minutes | 163 | 6.6% |
| 10 to 14 Minutes | 468 | 18.9% |
| 15 to 19 Minutes | 372 | 15.0% |
| 20 to 24 Minutes | 246 | 9.9% |
| 25 to 29 Minutes | 315 | 12.7% |
| 30 to 34 Minutes | 385 | 15.5% |
| 35 to 39 Minutes | 0 | 0.0% |
| 40 to 44 Minutes | 37 | 1.5% |
| 45 to 59 Minutes | 162 | 6.5% |
| 60 to 89 Minutes | 16 | 0.6% |
| 90 or more Minutes | 218 | 8.8% |
Commute Time by Sex in Durham
The most common commute times in Durham are 30 to 34 minutes (324 commuters, 20.6%) for males and 15 to 19 minutes (236 commuters, 25.9%) for females.
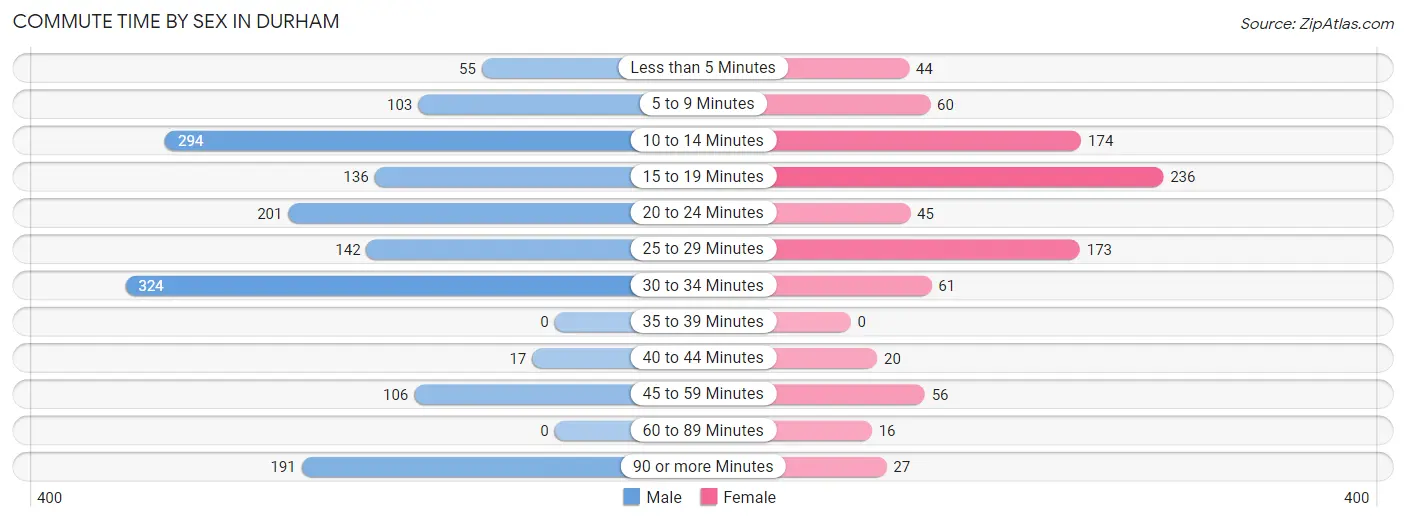
| Commute Time | Male | Female |
| Less than 5 Minutes | 55 (3.5%) | 44 (4.8%) |
| 5 to 9 Minutes | 103 (6.6%) | 60 (6.6%) |
| 10 to 14 Minutes | 294 (18.7%) | 174 (19.1%) |
| 15 to 19 Minutes | 136 (8.7%) | 236 (25.9%) |
| 20 to 24 Minutes | 201 (12.8%) | 45 (4.9%) |
| 25 to 29 Minutes | 142 (9.0%) | 173 (19.0%) |
| 30 to 34 Minutes | 324 (20.6%) | 61 (6.7%) |
| 35 to 39 Minutes | 0 (0.0%) | 0 (0.0%) |
| 40 to 44 Minutes | 17 (1.1%) | 20 (2.2%) |
| 45 to 59 Minutes | 106 (6.8%) | 56 (6.1%) |
| 60 to 89 Minutes | 0 (0.0%) | 16 (1.8%) |
| 90 or more Minutes | 191 (12.2%) | 27 (3.0%) |
Time of Departure to Work by Sex in Durham
The most frequent times of departure to work in Durham are 6:00 AM to 6:29 AM (474, 30.2%) for males and 7:30 AM to 7:59 AM (174, 19.1%) for females.
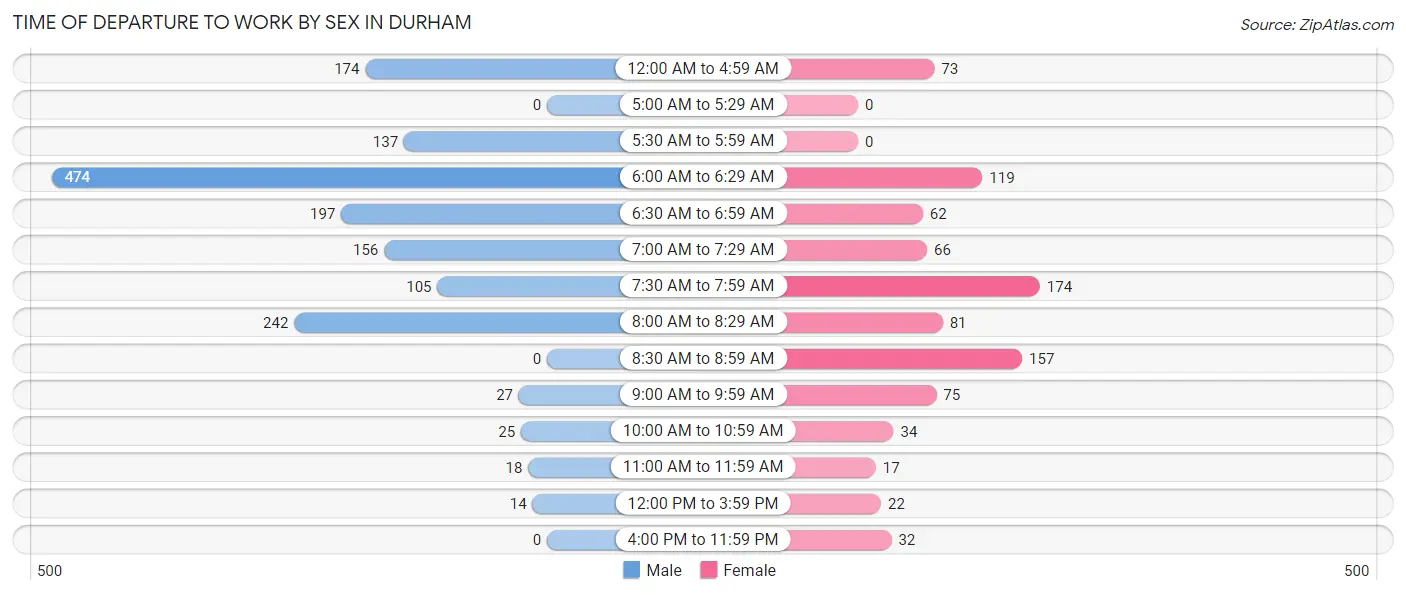
| Time of Departure | Male | Female |
| 12:00 AM to 4:59 AM | 174 (11.1%) | 73 (8.0%) |
| 5:00 AM to 5:29 AM | 0 (0.0%) | 0 (0.0%) |
| 5:30 AM to 5:59 AM | 137 (8.7%) | 0 (0.0%) |
| 6:00 AM to 6:29 AM | 474 (30.2%) | 119 (13.1%) |
| 6:30 AM to 6:59 AM | 197 (12.6%) | 62 (6.8%) |
| 7:00 AM to 7:29 AM | 156 (9.9%) | 66 (7.2%) |
| 7:30 AM to 7:59 AM | 105 (6.7%) | 174 (19.1%) |
| 8:00 AM to 8:29 AM | 242 (15.4%) | 81 (8.9%) |
| 8:30 AM to 8:59 AM | 0 (0.0%) | 157 (17.2%) |
| 9:00 AM to 9:59 AM | 27 (1.7%) | 75 (8.2%) |
| 10:00 AM to 10:59 AM | 25 (1.6%) | 34 (3.7%) |
| 11:00 AM to 11:59 AM | 18 (1.1%) | 17 (1.9%) |
| 12:00 PM to 3:59 PM | 14 (0.9%) | 22 (2.4%) |
| 4:00 PM to 11:59 PM | 0 (0.0%) | 32 (3.5%) |
| Total | 1,569 (100.0%) | 912 (100.0%) |
Housing Occupancy in Durham
Occupancy by Ownership in Durham
Of the total 2,110 dwellings in Durham, owner-occupied units account for 1,585 (75.1%), while renter-occupied units make up 525 (24.9%).
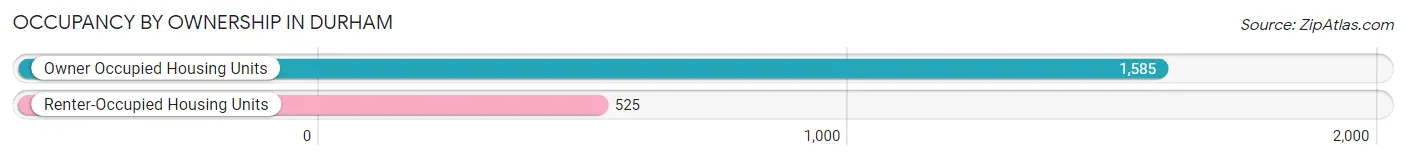
| Occupancy | # Housing Units | % Housing Units |
| Owner Occupied Housing Units | 1,585 | 75.1% |
| Renter-Occupied Housing Units | 525 | 24.9% |
| Total Occupied Housing Units | 2,110 | 100.0% |
Occupancy by Household Size in Durham
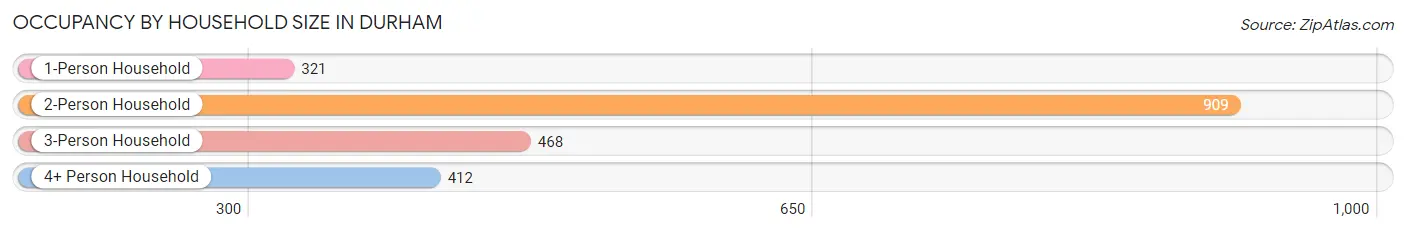
| Household Size | # Housing Units | % Housing Units |
| 1-Person Household | 321 | 15.2% |
| 2-Person Household | 909 | 43.1% |
| 3-Person Household | 468 | 22.2% |
| 4+ Person Household | 412 | 19.5% |
| Total Housing Units | 2,110 | 100.0% |
Occupancy by Ownership by Household Size in Durham
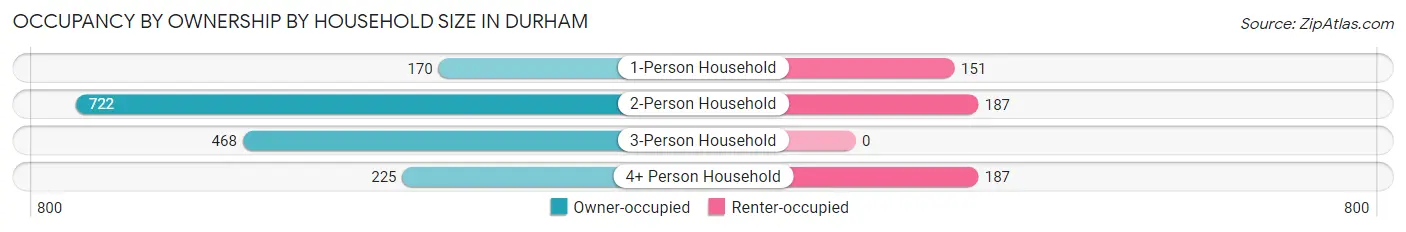
| Household Size | Owner-occupied | Renter-occupied |
| 1-Person Household | 170 (53.0%) | 151 (47.0%) |
| 2-Person Household | 722 (79.4%) | 187 (20.6%) |
| 3-Person Household | 468 (100.0%) | 0 (0.0%) |
| 4+ Person Household | 225 (54.6%) | 187 (45.4%) |
| Total Housing Units | 1,585 (75.1%) | 525 (24.9%) |
Occupancy by Educational Attainment in Durham
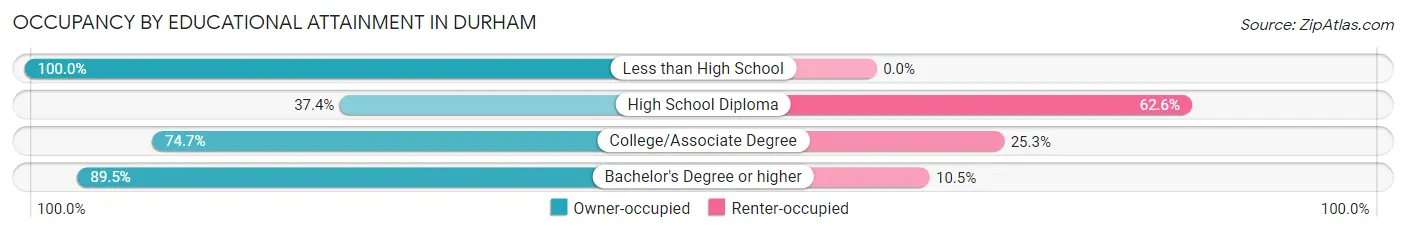
| Household Size | Owner-occupied | Renter-occupied |
| Less than High School | 13 (100.0%) | 0 (0.0%) |
| High School Diploma | 128 (37.4%) | 214 (62.6%) |
| College/Associate Degree | 641 (74.7%) | 217 (25.3%) |
| Bachelor's Degree or higher | 803 (89.5%) | 94 (10.5%) |
Occupancy by Age of Householder in Durham
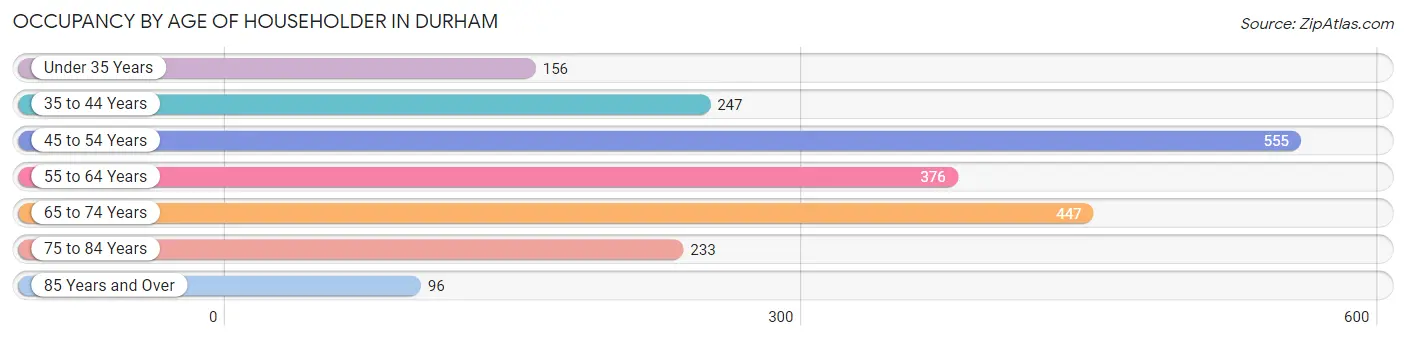
| Age Bracket | # Households | % Households |
| Under 35 Years | 156 | 7.4% |
| 35 to 44 Years | 247 | 11.7% |
| 45 to 54 Years | 555 | 26.3% |
| 55 to 64 Years | 376 | 17.8% |
| 65 to 74 Years | 447 | 21.2% |
| 75 to 84 Years | 233 | 11.0% |
| 85 Years and Over | 96 | 4.5% |
| Total | 2,110 | 100.0% |
Housing Finances in Durham
Median Income by Occupancy in Durham
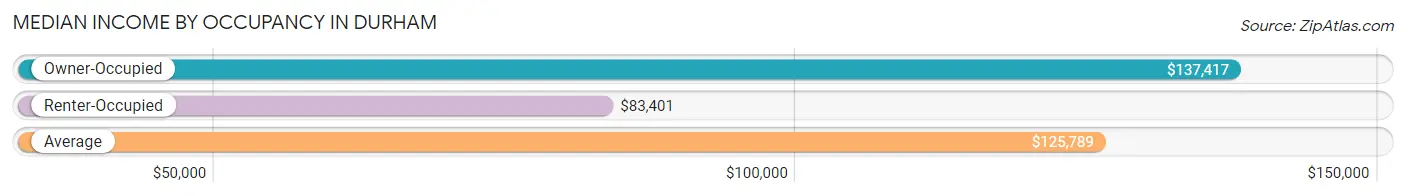
| Occupancy Type | # Households | Median Income |
| Owner-Occupied | 1,585 (75.1%) | $137,417 |
| Renter-Occupied | 525 (24.9%) | $83,401 |
| Average | 2,110 (100.0%) | $125,789 |
Occupancy by Householder Income Bracket in Durham
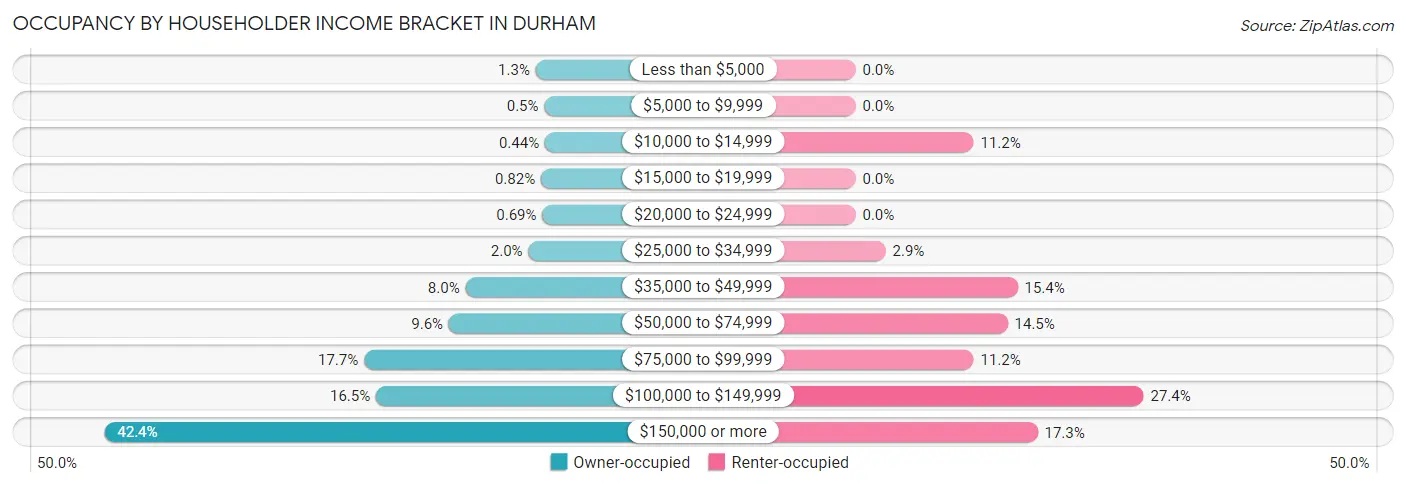
| Income Bracket | Owner-occupied | Renter-occupied |
| Less than $5,000 | 21 (1.3%) | 0 (0.0%) |
| $5,000 to $9,999 | 8 (0.5%) | 0 (0.0%) |
| $10,000 to $14,999 | 7 (0.4%) | 59 (11.2%) |
| $15,000 to $19,999 | 13 (0.8%) | 0 (0.0%) |
| $20,000 to $24,999 | 11 (0.7%) | 0 (0.0%) |
| $25,000 to $34,999 | 32 (2.0%) | 15 (2.9%) |
| $35,000 to $49,999 | 127 (8.0%) | 81 (15.4%) |
| $50,000 to $74,999 | 152 (9.6%) | 76 (14.5%) |
| $75,000 to $99,999 | 280 (17.7%) | 59 (11.2%) |
| $100,000 to $149,999 | 262 (16.5%) | 144 (27.4%) |
| $150,000 or more | 672 (42.4%) | 91 (17.3%) |
| Total | 1,585 (100.0%) | 525 (100.0%) |
Monthly Housing Cost Tiers in Durham
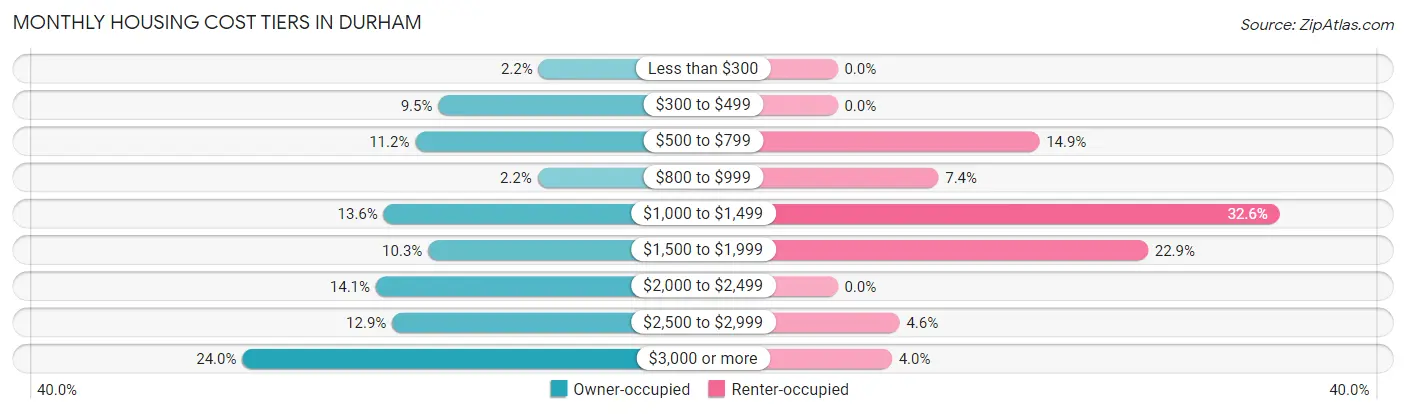
| Monthly Cost | Owner-occupied | Renter-occupied |
| Less than $300 | 34 (2.1%) | 0 (0.0%) |
| $300 to $499 | 151 (9.5%) | 0 (0.0%) |
| $500 to $799 | 178 (11.2%) | 78 (14.9%) |
| $800 to $999 | 35 (2.2%) | 39 (7.4%) |
| $1,000 to $1,499 | 215 (13.6%) | 171 (32.6%) |
| $1,500 to $1,999 | 163 (10.3%) | 120 (22.9%) |
| $2,000 to $2,499 | 224 (14.1%) | 0 (0.0%) |
| $2,500 to $2,999 | 205 (12.9%) | 24 (4.6%) |
| $3,000 or more | 380 (24.0%) | 21 (4.0%) |
| Total | 1,585 (100.0%) | 525 (100.0%) |
Physical Housing Characteristics in Durham
Housing Structures in Durham
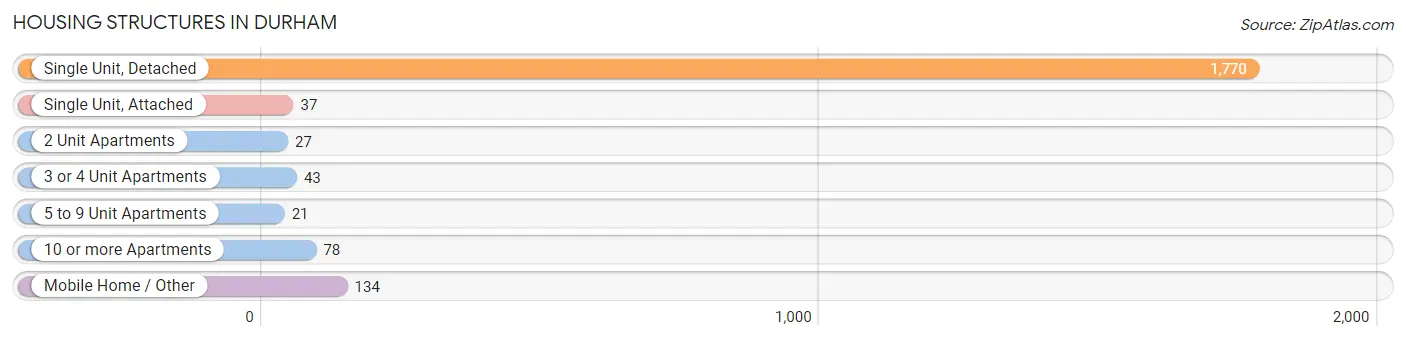
| Structure Type | # Housing Units | % Housing Units |
| Single Unit, Detached | 1,770 | 83.9% |
| Single Unit, Attached | 37 | 1.8% |
| 2 Unit Apartments | 27 | 1.3% |
| 3 or 4 Unit Apartments | 43 | 2.0% |
| 5 to 9 Unit Apartments | 21 | 1.0% |
| 10 or more Apartments | 78 | 3.7% |
| Mobile Home / Other | 134 | 6.4% |
| Total | 2,110 | 100.0% |
Housing Structures by Occupancy in Durham
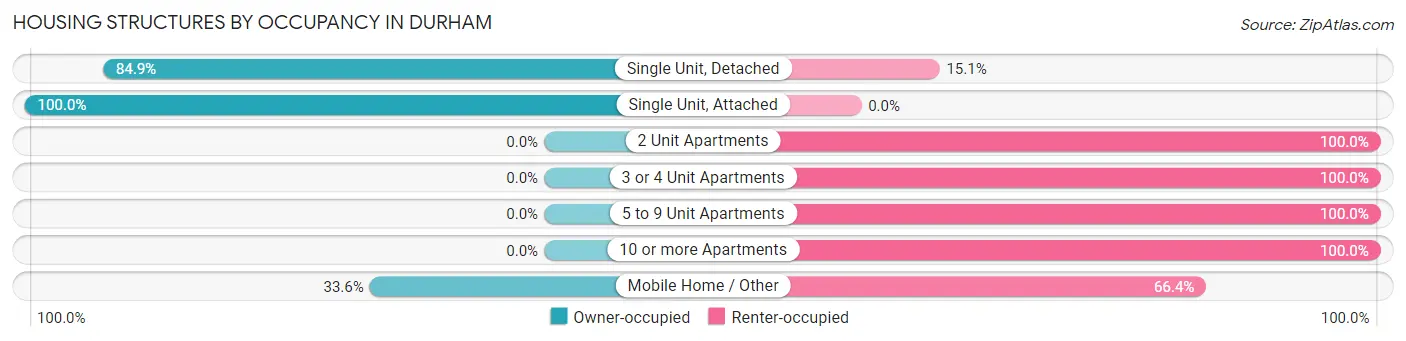
| Structure Type | Owner-occupied | Renter-occupied |
| Single Unit, Detached | 1,503 (84.9%) | 267 (15.1%) |
| Single Unit, Attached | 37 (100.0%) | 0 (0.0%) |
| 2 Unit Apartments | 0 (0.0%) | 27 (100.0%) |
| 3 or 4 Unit Apartments | 0 (0.0%) | 43 (100.0%) |
| 5 to 9 Unit Apartments | 0 (0.0%) | 21 (100.0%) |
| 10 or more Apartments | 0 (0.0%) | 78 (100.0%) |
| Mobile Home / Other | 45 (33.6%) | 89 (66.4%) |
| Total | 1,585 (75.1%) | 525 (24.9%) |
Housing Structures by Number of Rooms in Durham
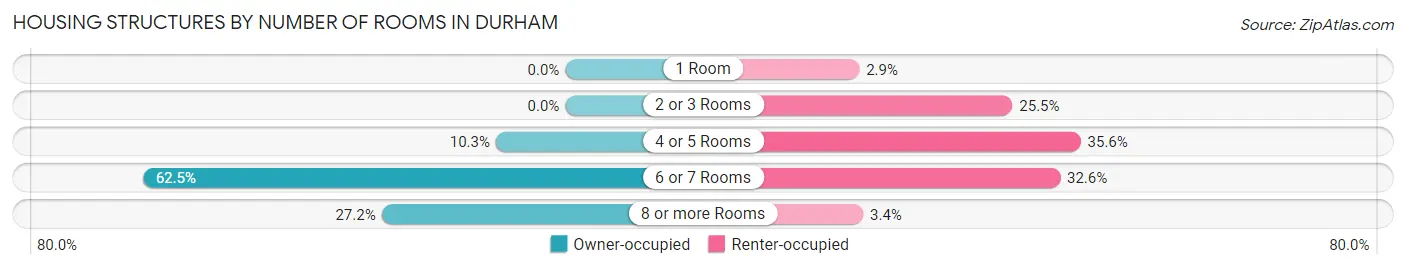
| Number of Rooms | Owner-occupied | Renter-occupied |
| 1 Room | 0 (0.0%) | 15 (2.9%) |
| 2 or 3 Rooms | 0 (0.0%) | 134 (25.5%) |
| 4 or 5 Rooms | 163 (10.3%) | 187 (35.6%) |
| 6 or 7 Rooms | 991 (62.5%) | 171 (32.6%) |
| 8 or more Rooms | 431 (27.2%) | 18 (3.4%) |
| Total | 1,585 (100.0%) | 525 (100.0%) |
Housing Structure by Heating Type in Durham
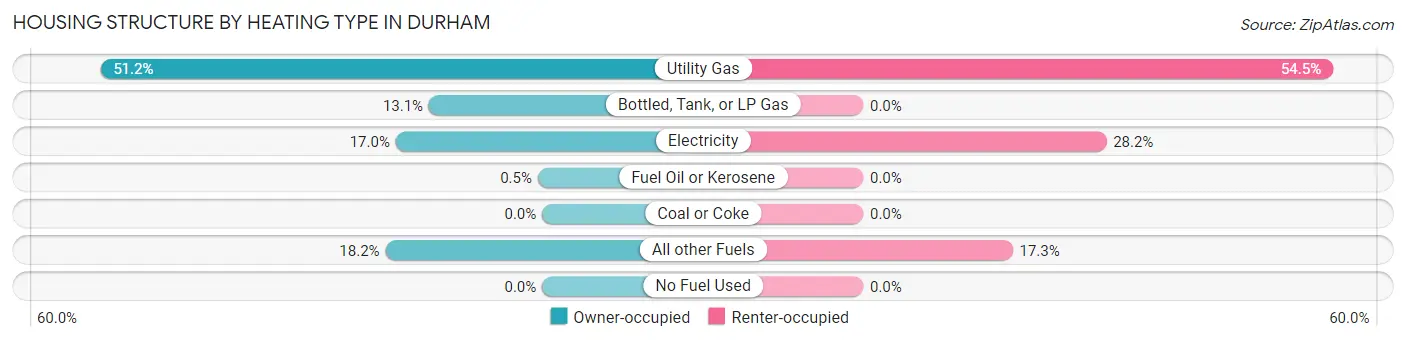
| Heating Type | Owner-occupied | Renter-occupied |
| Utility Gas | 812 (51.2%) | 286 (54.5%) |
| Bottled, Tank, or LP Gas | 208 (13.1%) | 0 (0.0%) |
| Electricity | 269 (17.0%) | 148 (28.2%) |
| Fuel Oil or Kerosene | 8 (0.5%) | 0 (0.0%) |
| Coal or Coke | 0 (0.0%) | 0 (0.0%) |
| All other Fuels | 288 (18.2%) | 91 (17.3%) |
| No Fuel Used | 0 (0.0%) | 0 (0.0%) |
| Total | 1,585 (100.0%) | 525 (100.0%) |
Household Vehicle Usage in Durham
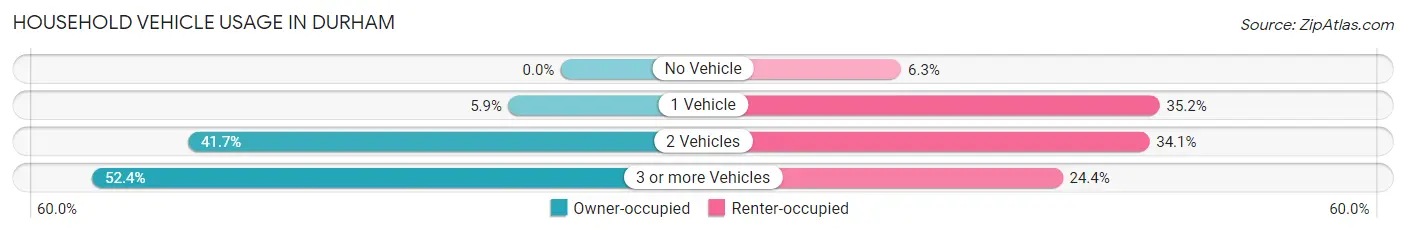
| Vehicles per Household | Owner-occupied | Renter-occupied |
| No Vehicle | 0 (0.0%) | 33 (6.3%) |
| 1 Vehicle | 93 (5.9%) | 185 (35.2%) |
| 2 Vehicles | 661 (41.7%) | 179 (34.1%) |
| 3 or more Vehicles | 831 (52.4%) | 128 (24.4%) |
| Total | 1,585 (100.0%) | 525 (100.0%) |
Real Estate & Mortgages in Durham
Real Estate and Mortgage Overview in Durham
| Characteristic | Without Mortgage | With Mortgage |
| Housing Units | 630 | 955 |
| Median Property Value | $678,000 | $573,700 |
| Median Household Income | - | - |
| Monthly Housing Costs | $722 | $380 |
| Real Estate Taxes | $4,115 | $12 |
Property Value by Mortgage Status in Durham
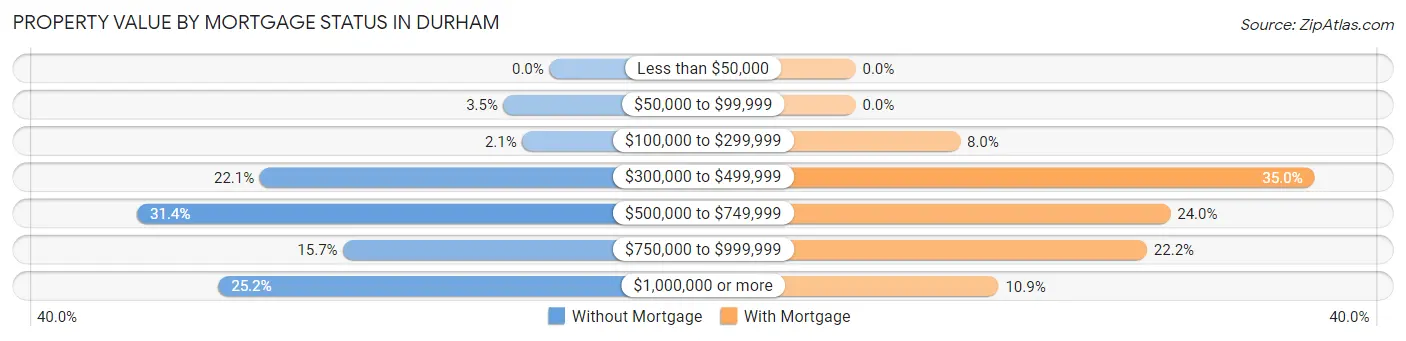
| Property Value | Without Mortgage | With Mortgage |
| Less than $50,000 | 0 (0.0%) | 0 (0.0%) |
| $50,000 to $99,999 | 22 (3.5%) | 0 (0.0%) |
| $100,000 to $299,999 | 13 (2.1%) | 76 (8.0%) |
| $300,000 to $499,999 | 139 (22.1%) | 334 (35.0%) |
| $500,000 to $749,999 | 198 (31.4%) | 229 (24.0%) |
| $750,000 to $999,999 | 99 (15.7%) | 212 (22.2%) |
| $1,000,000 or more | 159 (25.2%) | 104 (10.9%) |
| Total | 630 (100.0%) | 955 (100.0%) |
Household Income by Mortgage Status in Durham
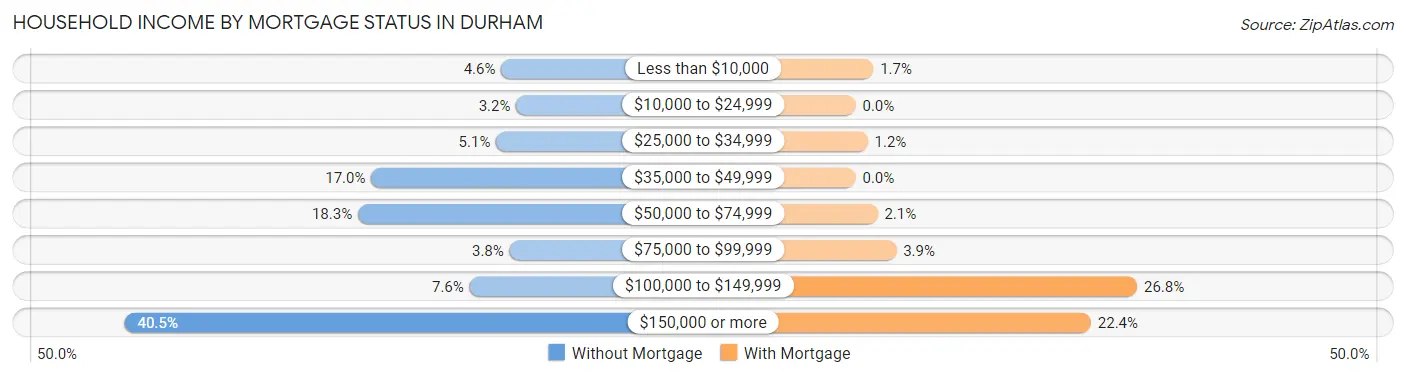
| Household Income | Without Mortgage | With Mortgage |
| Less than $10,000 | 29 (4.6%) | 16 (1.7%) |
| $10,000 to $24,999 | 20 (3.2%) | 0 (0.0%) |
| $25,000 to $34,999 | 32 (5.1%) | 11 (1.1%) |
| $35,000 to $49,999 | 107 (17.0%) | 0 (0.0%) |
| $50,000 to $74,999 | 115 (18.2%) | 20 (2.1%) |
| $75,000 to $99,999 | 24 (3.8%) | 37 (3.9%) |
| $100,000 to $149,999 | 48 (7.6%) | 256 (26.8%) |
| $150,000 or more | 255 (40.5%) | 214 (22.4%) |
| Total | 630 (100.0%) | 955 (100.0%) |
Property Value to Household Income Ratio in Durham
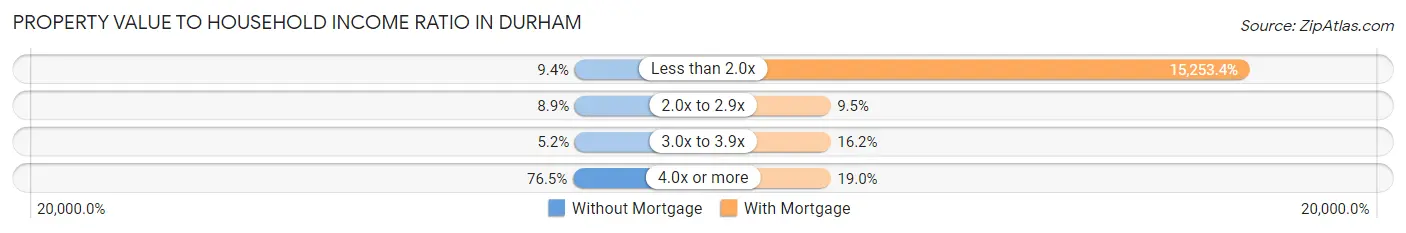
| Value-to-Income Ratio | Without Mortgage | With Mortgage |
| Less than 2.0x | 59 (9.4%) | 145,670 (15,253.4%) |
| 2.0x to 2.9x | 56 (8.9%) | 91 (9.5%) |
| 3.0x to 3.9x | 33 (5.2%) | 155 (16.2%) |
| 4.0x or more | 482 (76.5%) | 181 (19.0%) |
| Total | 630 (100.0%) | 955 (100.0%) |
Real Estate Taxes by Mortgage Status in Durham
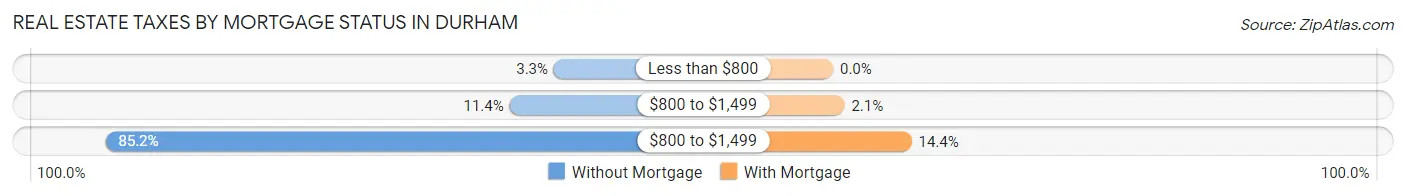
| Property Taxes | Without Mortgage | With Mortgage |
| Less than $800 | 21 (3.3%) | 0 (0.0%) |
| $800 to $1,499 | 72 (11.4%) | 20 (2.1%) |
| $800 to $1,499 | 537 (85.2%) | 137 (14.3%) |
| Total | 630 (100.0%) | 955 (100.0%) |
Health & Disability in Durham
Health Insurance Coverage by Age in Durham
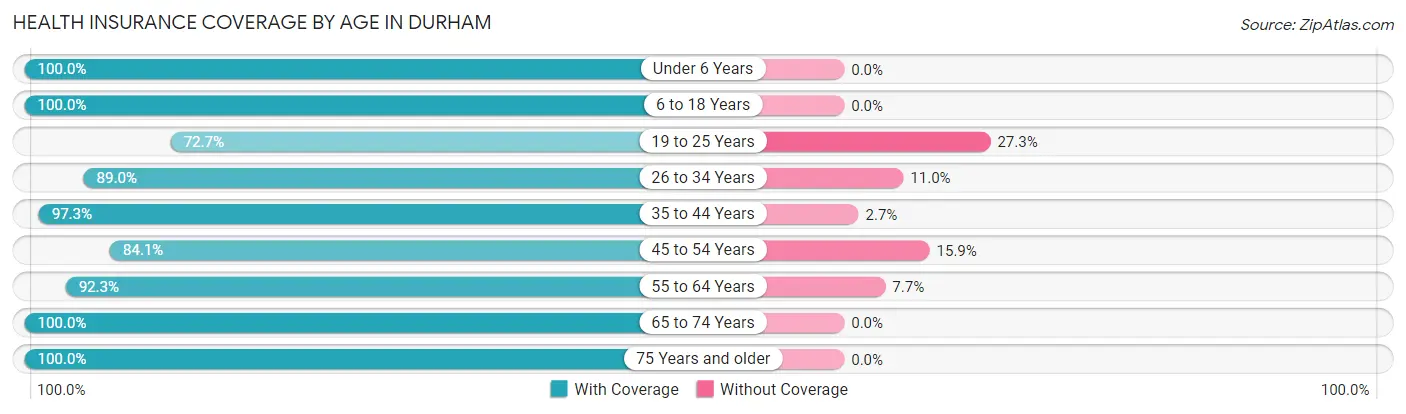
| Age Bracket | With Coverage | Without Coverage |
| Under 6 Years | 344 (100.0%) | 0 (0.0%) |
| 6 to 18 Years | 757 (100.0%) | 0 (0.0%) |
| 19 to 25 Years | 451 (72.7%) | 169 (27.3%) |
| 26 to 34 Years | 444 (89.0%) | 55 (11.0%) |
| 35 to 44 Years | 548 (97.3%) | 15 (2.7%) |
| 45 to 54 Years | 888 (84.1%) | 168 (15.9%) |
| 55 to 64 Years | 1,047 (92.3%) | 87 (7.7%) |
| 65 to 74 Years | 929 (100.0%) | 0 (0.0%) |
| 75 Years and older | 422 (100.0%) | 0 (0.0%) |
| Total | 5,830 (92.2%) | 494 (7.8%) |
Health Insurance Coverage by Citizenship Status in Durham
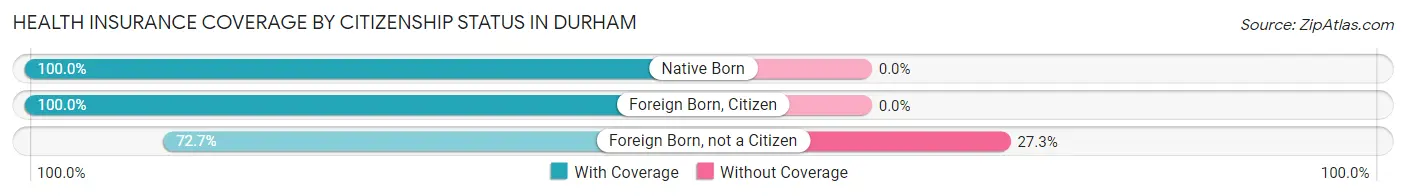
| Citizenship Status | With Coverage | Without Coverage |
| Native Born | 344 (100.0%) | 0 (0.0%) |
| Foreign Born, Citizen | 757 (100.0%) | 0 (0.0%) |
| Foreign Born, not a Citizen | 451 (72.7%) | 169 (27.3%) |
Health Insurance Coverage by Household Income in Durham
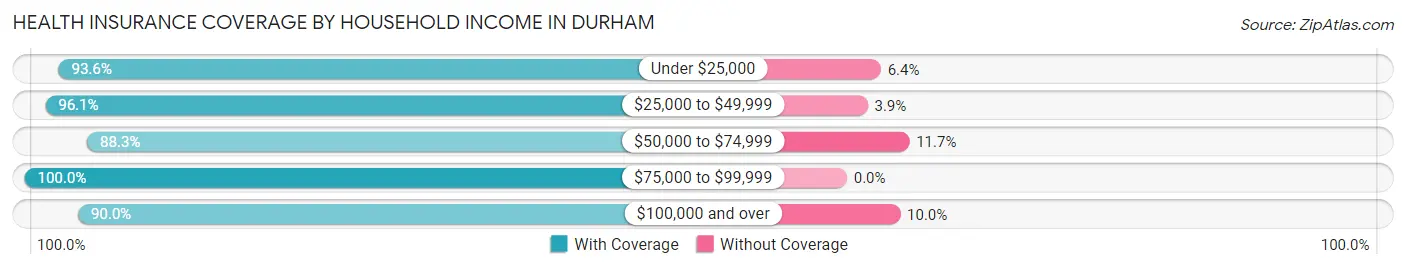
| Household Income | With Coverage | Without Coverage |
| Under $25,000 | 162 (93.6%) | 11 (6.4%) |
| $25,000 to $49,999 | 372 (96.1%) | 15 (3.9%) |
| $50,000 to $74,999 | 415 (88.3%) | 55 (11.7%) |
| $75,000 to $99,999 | 1,134 (100.0%) | 0 (0.0%) |
| $100,000 and over | 3,721 (90.0%) | 413 (10.0%) |
Public vs Private Health Insurance Coverage by Age in Durham
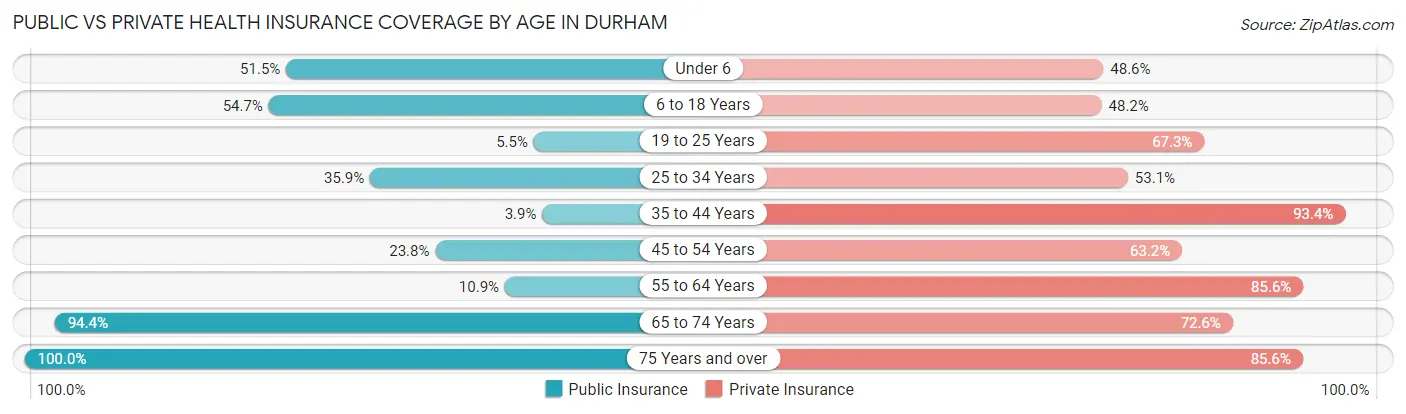
| Age Bracket | Public Insurance | Private Insurance |
| Under 6 | 177 (51.4%) | 167 (48.5%) |
| 6 to 18 Years | 414 (54.7%) | 365 (48.2%) |
| 19 to 25 Years | 34 (5.5%) | 417 (67.3%) |
| 25 to 34 Years | 179 (35.9%) | 265 (53.1%) |
| 35 to 44 Years | 22 (3.9%) | 526 (93.4%) |
| 45 to 54 Years | 251 (23.8%) | 667 (63.2%) |
| 55 to 64 Years | 123 (10.8%) | 971 (85.6%) |
| 65 to 74 Years | 877 (94.4%) | 674 (72.6%) |
| 75 Years and over | 422 (100.0%) | 361 (85.6%) |
| Total | 2,499 (39.5%) | 4,413 (69.8%) |
Disability Status by Sex by Age in Durham
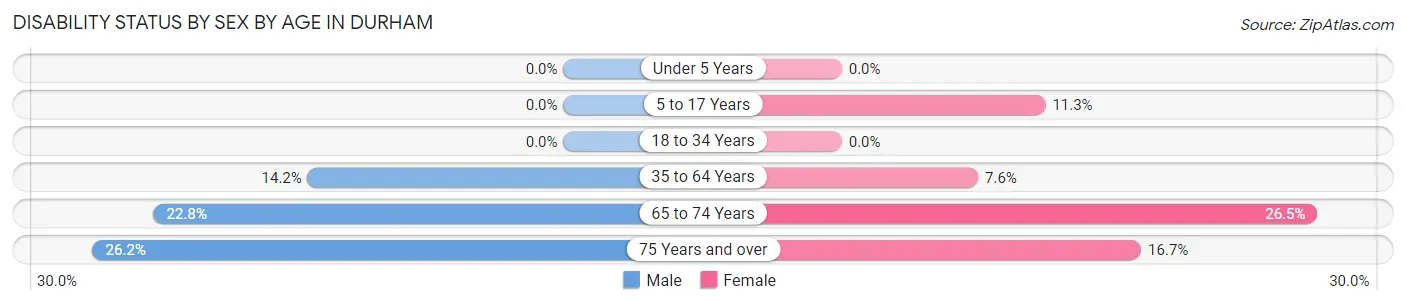
| Age Bracket | Male | Female |
| Under 5 Years | 0 (0.0%) | 0 (0.0%) |
| 5 to 17 Years | 0 (0.0%) | 54 (11.3%) |
| 18 to 34 Years | 0 (0.0%) | 0 (0.0%) |
| 35 to 64 Years | 195 (14.2%) | 105 (7.6%) |
| 65 to 74 Years | 131 (22.8%) | 94 (26.5%) |
| 75 Years and over | 54 (26.2%) | 36 (16.7%) |
Disability Class by Sex by Age in Durham
Disability Class: Hearing Difficulty
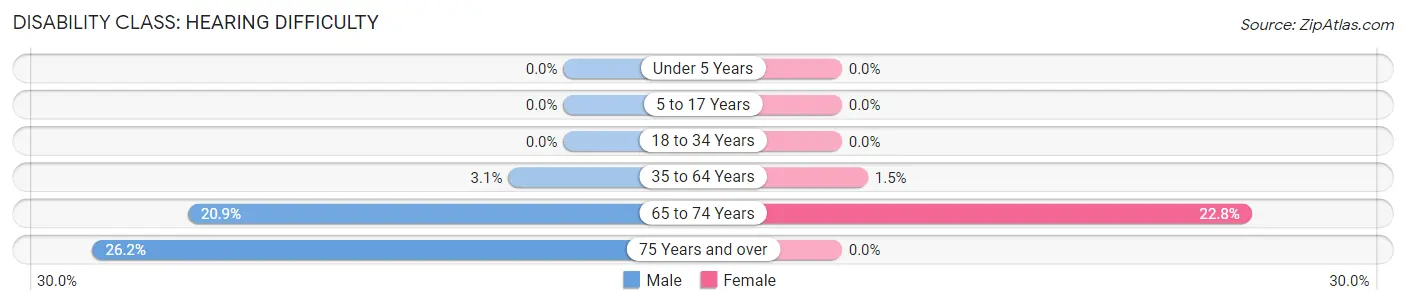
| Age Bracket | Male | Female |
| Under 5 Years | 0 (0.0%) | 0 (0.0%) |
| 5 to 17 Years | 0 (0.0%) | 0 (0.0%) |
| 18 to 34 Years | 0 (0.0%) | 0 (0.0%) |
| 35 to 64 Years | 42 (3.1%) | 20 (1.5%) |
| 65 to 74 Years | 120 (20.9%) | 81 (22.8%) |
| 75 Years and over | 54 (26.2%) | 0 (0.0%) |
Disability Class: Vision Difficulty
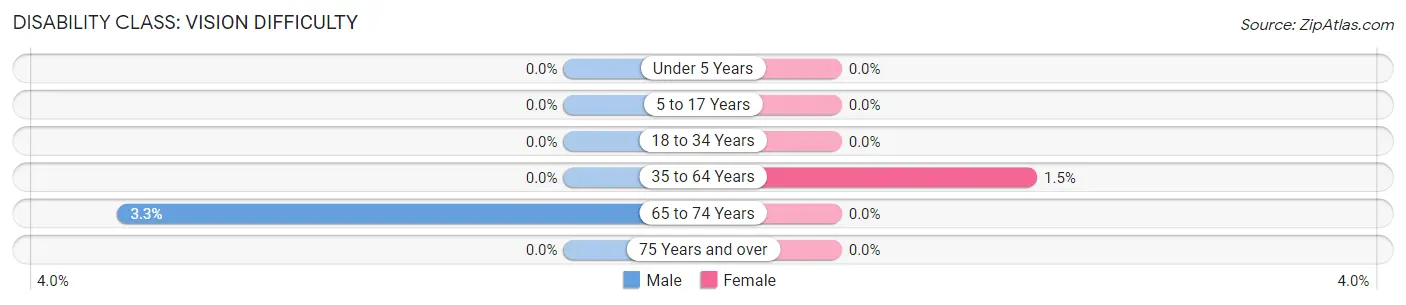
| Age Bracket | Male | Female |
| Under 5 Years | 0 (0.0%) | 0 (0.0%) |
| 5 to 17 Years | 0 (0.0%) | 0 (0.0%) |
| 18 to 34 Years | 0 (0.0%) | 0 (0.0%) |
| 35 to 64 Years | 0 (0.0%) | 20 (1.5%) |
| 65 to 74 Years | 19 (3.3%) | 0 (0.0%) |
| 75 Years and over | 0 (0.0%) | 0 (0.0%) |
Disability Class: Cognitive Difficulty
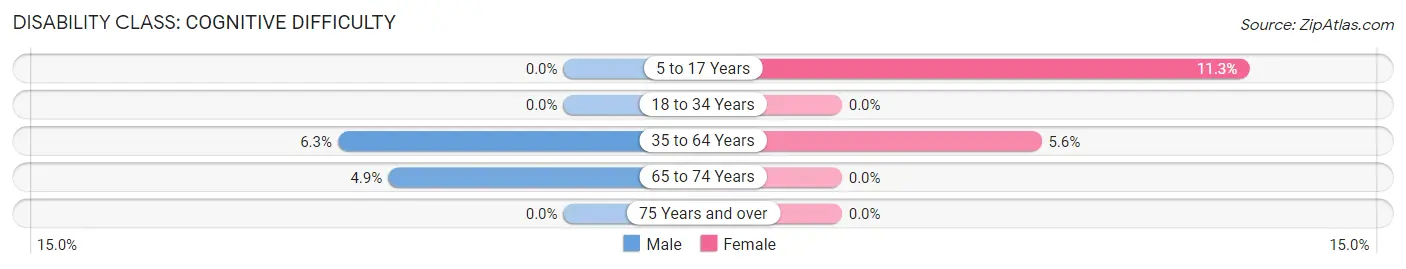
| Age Bracket | Male | Female |
| 5 to 17 Years | 0 (0.0%) | 54 (11.3%) |
| 18 to 34 Years | 0 (0.0%) | 0 (0.0%) |
| 35 to 64 Years | 86 (6.3%) | 77 (5.6%) |
| 65 to 74 Years | 28 (4.9%) | 0 (0.0%) |
| 75 Years and over | 0 (0.0%) | 0 (0.0%) |
Disability Class: Ambulatory Difficulty
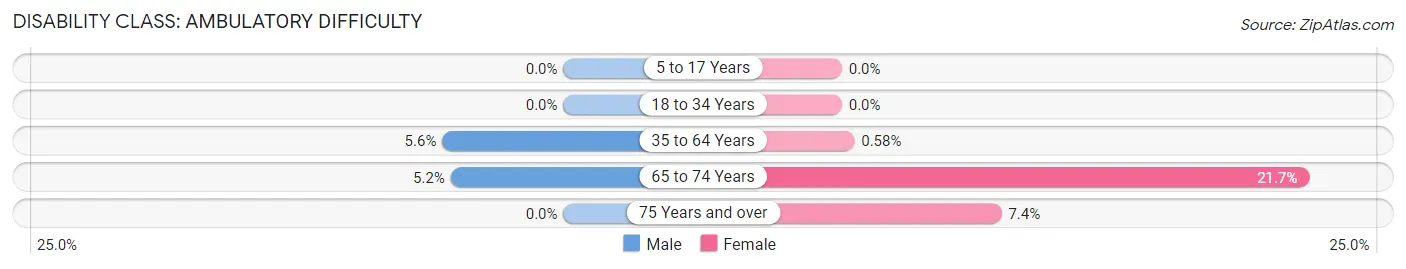
| Age Bracket | Male | Female |
| 5 to 17 Years | 0 (0.0%) | 0 (0.0%) |
| 18 to 34 Years | 0 (0.0%) | 0 (0.0%) |
| 35 to 64 Years | 77 (5.6%) | 8 (0.6%) |
| 65 to 74 Years | 30 (5.2%) | 77 (21.7%) |
| 75 Years and over | 0 (0.0%) | 16 (7.4%) |
Disability Class: Self-Care Difficulty
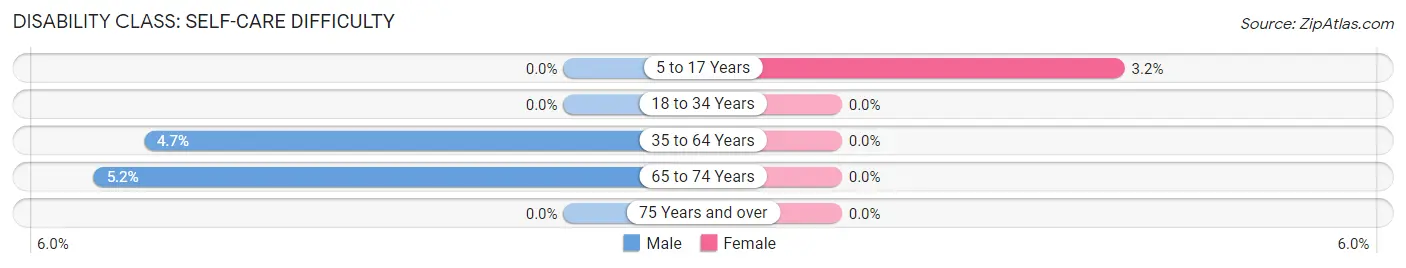
| Age Bracket | Male | Female |
| 5 to 17 Years | 0 (0.0%) | 15 (3.2%) |
| 18 to 34 Years | 0 (0.0%) | 0 (0.0%) |
| 35 to 64 Years | 64 (4.7%) | 0 (0.0%) |
| 65 to 74 Years | 30 (5.2%) | 0 (0.0%) |
| 75 Years and over | 0 (0.0%) | 0 (0.0%) |
Technology Access in Durham
Computing Device Access in Durham
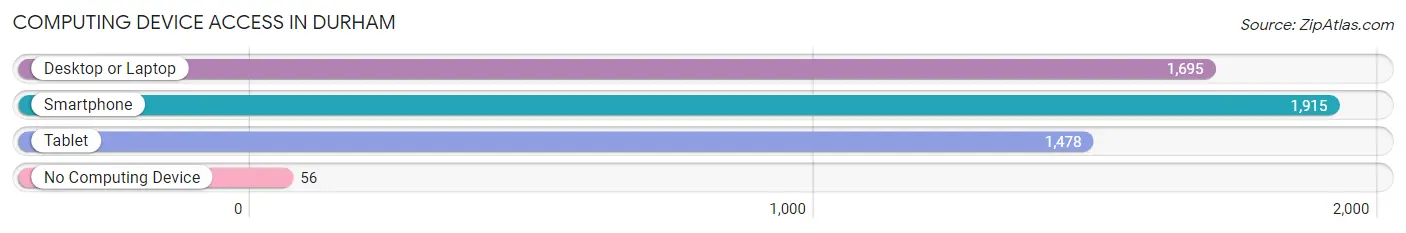
| Device Type | # Households | % Households |
| Desktop or Laptop | 1,695 | 80.3% |
| Smartphone | 1,915 | 90.8% |
| Tablet | 1,478 | 70.1% |
| No Computing Device | 56 | 2.6% |
| Total | 2,110 | 100.0% |
Internet Access in Durham
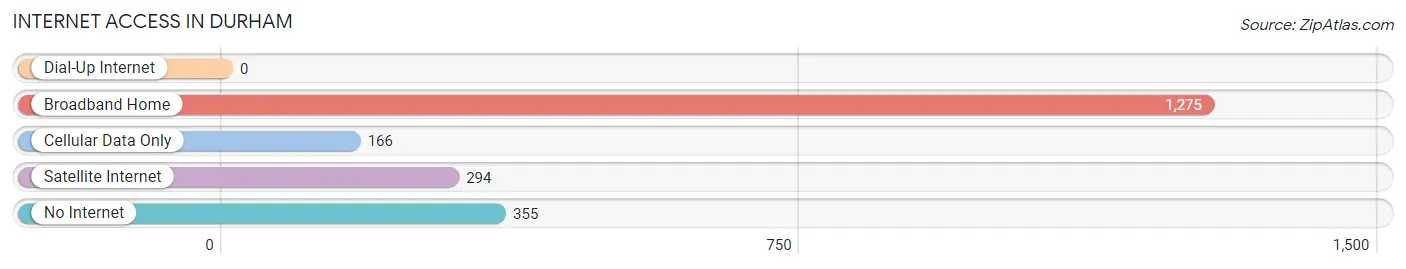
| Internet Type | # Households | % Households |
| Dial-Up Internet | 0 | 0.0% |
| Broadband Home | 1,275 | 60.4% |
| Cellular Data Only | 166 | 7.9% |
| Satellite Internet | 294 | 13.9% |
| No Internet | 355 | 16.8% |
| Total | 2,110 | 100.0% |
Durham Summary
Durham, California is a small city located in the Sacramento Valley in Northern California. It is situated in the foothills of the Sierra Nevada Mountains, about 30 miles northeast of Sacramento. The city has a population of approximately 8,000 people and is part of the greater Sacramento metropolitan area.
History
Durham was founded in 1855 by William and Mary Durham, who were among the first settlers in the area. The Durhams were originally from Missouri and had traveled to California in search of gold. They eventually settled in the area and established a small farm. The town was named after the Durhams and was incorporated in 1891.
In the early 1900s, Durham was a thriving agricultural community, with many farms and ranches in the area. The town was also home to a number of businesses, including a blacksmith shop, a general store, and a hotel.
Geography
Durham is located in the Sacramento Valley, in the foothills of the Sierra Nevada Mountains. The city is situated at an elevation of about 500 feet above sea level. The climate in Durham is mild, with hot summers and cool winters. The average annual temperature is around 60 degrees Fahrenheit.
The city is surrounded by rolling hills and is home to a number of parks and recreational areas. The nearby Sacramento River provides a variety of outdoor activities, including fishing, boating, and swimming.
Economy
Durham’s economy is largely based on agriculture. The city is home to a number of farms and ranches, which produce a variety of crops, including almonds, walnuts, and olives. The city is also home to a number of businesses, including restaurants, retail stores, and professional services.
Demographics
As of the 2010 census, the population of Durham was 8,000. The racial makeup of the city was 79.3% White, 0.7% African American, 0.7% Native American, 0.7% Asian, 0.2% Pacific Islander, and 17.5% from other races. The median household income was $45,000, and the median family income was $50,000.
Conclusion
Durham, California is a small city located in the Sacramento Valley in Northern California. It is situated in the foothills of the Sierra Nevada Mountains, about 30 miles northeast of Sacramento. The city has a population of approximately 8,000 people and is part of the greater Sacramento metropolitan area. Durham’s economy is largely based on agriculture, and the city is home to a number of farms and ranches, as well as businesses and professional services. The racial makeup of the city is 79.3% White, 0.7% African American, 0.7% Native American, 0.7% Asian, 0.2% Pacific Islander, and 17.5% from other races. The median household income was $45,000, and the median family income was $50,000.
Common Questions
What is Per Capita Income in Durham?
Per Capita income in Durham is $47,456.
What is the Median Family Income in Durham?
Median Family Income in Durham is $136,609.
What is the Median Household income in Durham?
Median Household Income in Durham is $125,789.
What is Income or Wage Gap in Durham?
Income or Wage Gap in Durham is 53.4%.
Women in Durham earn 46.6 cents for every dollar earned by a man.
What is Inequality or Gini Index in Durham?
Inequality or Gini Index in Durham is 0.38.
What is the Total Population of Durham?
Total Population of Durham is 6,337.
What is the Total Male Population of Durham?
Total Male Population of Durham is 3,403.
What is the Total Female Population of Durham?
Total Female Population of Durham is 2,934.
What is the Ratio of Males per 100 Females in Durham?
There are 115.99 Males per 100 Females in Durham.
What is the Ratio of Females per 100 Males in Durham?
There are 86.22 Females per 100 Males in Durham.
What is the Median Population Age in Durham?
Median Population Age in Durham is 49.6 Years.
What is the Average Family Size in Durham
Average Family Size in Durham is 3.1 People.
What is the Average Household Size in Durham
Average Household Size in Durham is 3.0 People.
How Large is the Labor Force in Durham?
There are 3,037 People in the Labor Forcein in Durham.
What is the Percentage of People in the Labor Force in Durham?
55.7% of People are in the Labor Force in Durham.
What is the Unemployment Rate in Durham?
Unemployment Rate in Durham is 5.8%.