Allison Park, PA Map & Demographics
Allison Park Map
Allison Park Overview
$54,435
PER CAPITA INCOME
$137,945
AVG FAMILY INCOME
$106,588
AVG HOUSEHOLD INCOME
27.5%
WAGE / INCOME GAP [ % ]
72.5¢/ $1
WAGE / INCOME GAP [ $ ]
$8,126
FAMILY INCOME DEFICIT
0.42
INEQUALITY / GINI INDEX
22,701
TOTAL POPULATION
11,220
MALE POPULATION
11,481
FEMALE POPULATION
97.73
MALES / 100 FEMALES
102.33
FEMALES / 100 MALES
42.9
MEDIAN AGE
3.0
AVG FAMILY SIZE
2.4
AVG HOUSEHOLD SIZE
12,847
LABOR FORCE [ PEOPLE ]
68.1%
PERCENT IN LABOR FORCE
4.5%
UNEMPLOYMENT RATE
Allison Park Zip Codes
Income in Allison Park
Income Overview in Allison Park
Per Capita Income in Allison Park is $54,435, while median incomes of families and households are $137,945 and $106,588 respectively.
| Characteristic | Number | Measure |
| Per Capita Income | 22,701 | $54,435 |
| Median Family Income | 6,117 | $137,945 |
| Mean Family Income | 6,117 | $164,845 |
| Median Household Income | 9,086 | $106,588 |
| Mean Household Income | 9,086 | $134,599 |
| Income Deficit | 6,117 | $8,126 |
| Wage / Income Gap (%) | 22,701 | 27.53% |
| Wage / Income Gap ($) | 22,701 | 72.47¢ per $1 |
| Gini / Inequality Index | 22,701 | 0.42 |
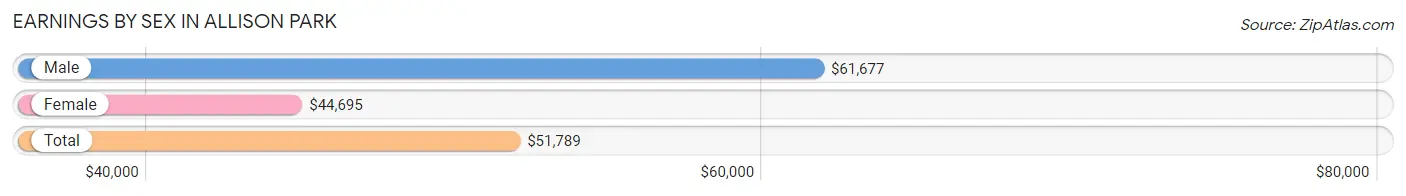
Earnings by Sex in Allison Park
Average Earnings in Allison Park are $51,789, $61,677 for men and $44,695 for women, a difference of 27.5%.
| Sex | Number | Average Earnings |
| Male | 7,160 (54.3%) | $61,677 |
| Female | 6,014 (45.7%) | $44,695 |
| Total | 13,174 (100.0%) | $51,789 |
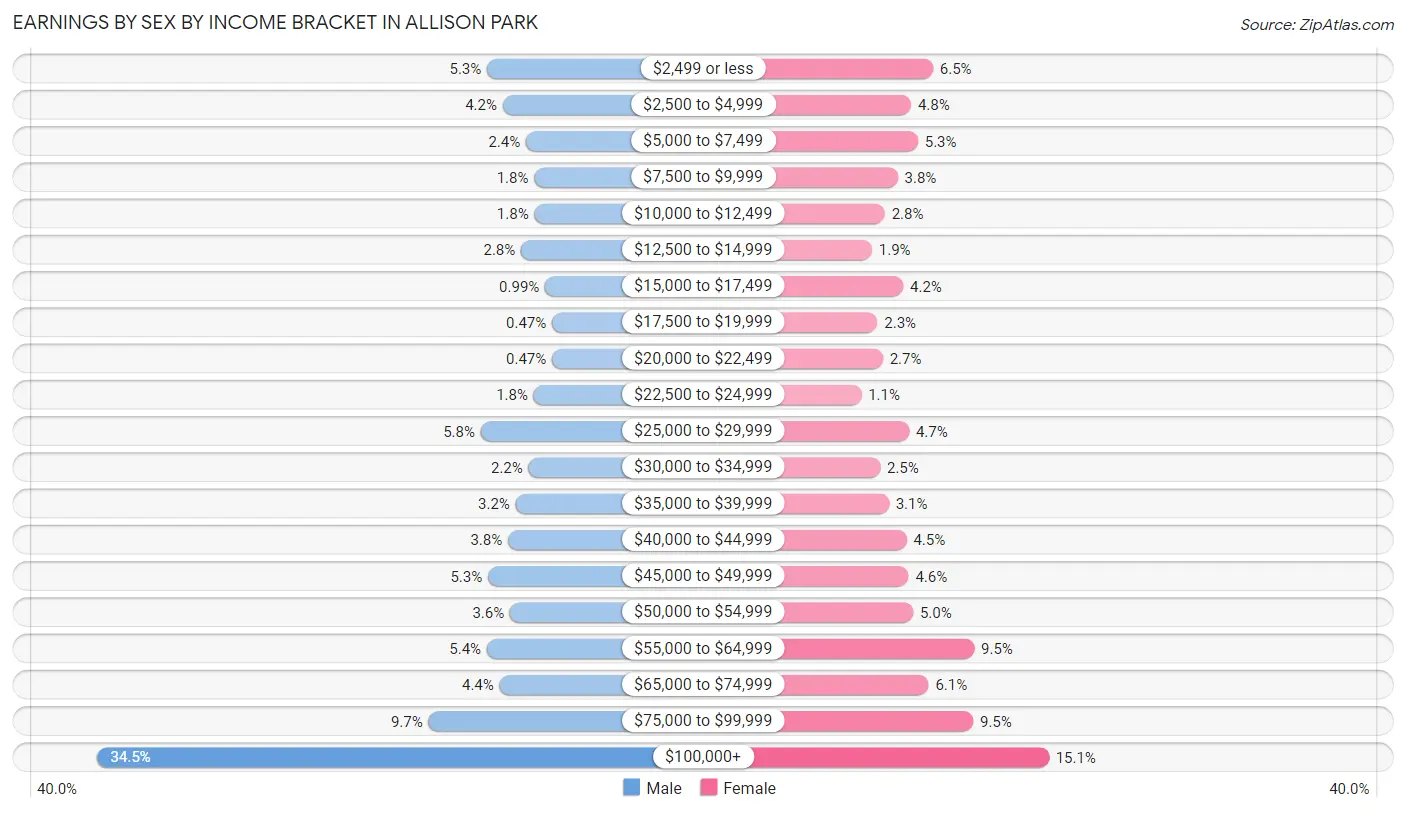
Earnings by Sex by Income Bracket in Allison Park
The most common earnings brackets in Allison Park are $100,000+ for men (2,473 | 34.5%) and $100,000+ for women (910 | 15.1%).
| Income | Male | Female |
| $2,499 or less | 382 (5.3%) | 388 (6.5%) |
| $2,500 to $4,999 | 298 (4.2%) | 289 (4.8%) |
| $5,000 to $7,499 | 173 (2.4%) | 320 (5.3%) |
| $7,500 to $9,999 | 129 (1.8%) | 229 (3.8%) |
| $10,000 to $12,499 | 128 (1.8%) | 171 (2.8%) |
| $12,500 to $14,999 | 200 (2.8%) | 113 (1.9%) |
| $15,000 to $17,499 | 71 (1.0%) | 254 (4.2%) |
| $17,500 to $19,999 | 34 (0.5%) | 138 (2.3%) |
| $20,000 to $22,499 | 34 (0.5%) | 162 (2.7%) |
| $22,500 to $24,999 | 132 (1.8%) | 65 (1.1%) |
| $25,000 to $29,999 | 416 (5.8%) | 280 (4.7%) |
| $30,000 to $34,999 | 160 (2.2%) | 150 (2.5%) |
| $35,000 to $39,999 | 229 (3.2%) | 189 (3.1%) |
| $40,000 to $44,999 | 270 (3.8%) | 269 (4.5%) |
| $45,000 to $49,999 | 377 (5.3%) | 278 (4.6%) |
| $50,000 to $54,999 | 259 (3.6%) | 298 (5.0%) |
| $55,000 to $64,999 | 383 (5.3%) | 574 (9.5%) |
| $65,000 to $74,999 | 315 (4.4%) | 368 (6.1%) |
| $75,000 to $99,999 | 697 (9.7%) | 569 (9.5%) |
| $100,000+ | 2,473 (34.5%) | 910 (15.1%) |
| Total | 7,160 (100.0%) | 6,014 (100.0%) |
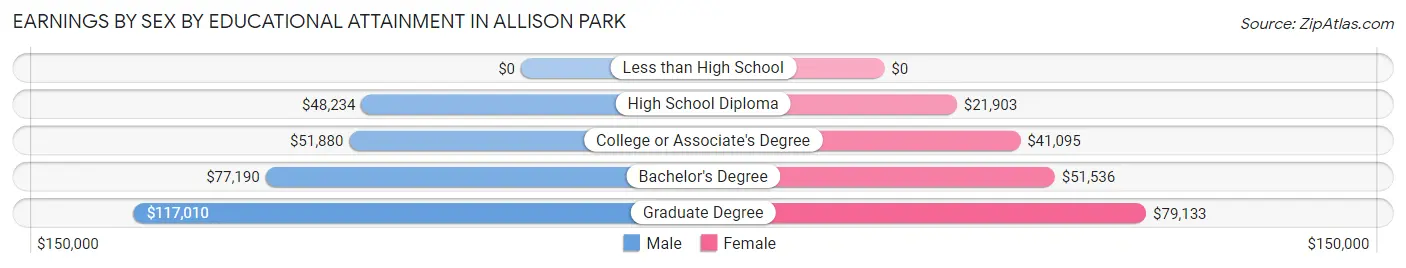
Earnings by Sex by Educational Attainment in Allison Park
Average earnings in Allison Park are $77,115 for men and $51,268 for women, a difference of 33.5%. Men with an educational attainment of graduate degree enjoy the highest average annual earnings of $117,010, while those with high school diploma education earn the least with $48,234. Women with an educational attainment of graduate degree earn the most with the average annual earnings of $79,133, while those with high school diploma education have the smallest earnings of $21,903.
| Educational Attainment | Male Income | Female Income |
| Less than High School | - | - |
| High School Diploma | $48,234 | $21,903 |
| College or Associate's Degree | $51,880 | $41,095 |
| Bachelor's Degree | $77,190 | $51,536 |
| Graduate Degree | $117,010 | $79,133 |
| Total | $77,115 | $51,268 |
Family Income in Allison Park
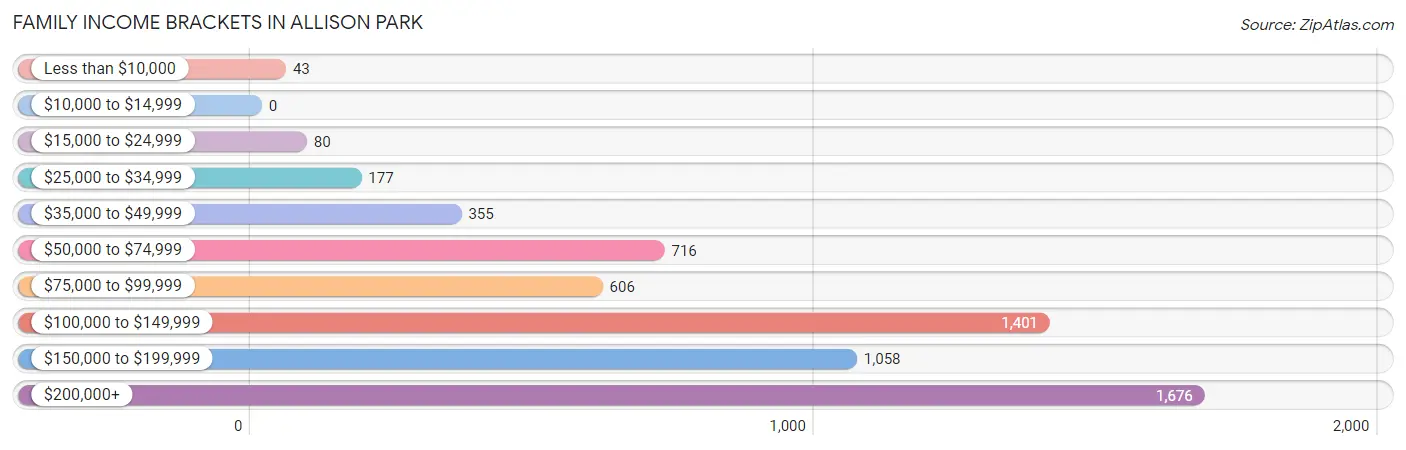
Family Income Brackets in Allison Park
According to the Allison Park family income data, there are 1,676 families falling into the $200,000+ income range, which is the most common income bracket and makes up 27.4% of all families.
| Income Bracket | # Families | % Families |
| Less than $10,000 | 43 | 0.7% |
| $10,000 to $14,999 | 0 | 0.0% |
| $15,000 to $24,999 | 80 | 1.3% |
| $25,000 to $34,999 | 177 | 2.9% |
| $35,000 to $49,999 | 355 | 5.8% |
| $50,000 to $74,999 | 716 | 11.7% |
| $75,000 to $99,999 | 606 | 9.9% |
| $100,000 to $149,999 | 1,401 | 22.9% |
| $150,000 to $199,999 | 1,058 | 17.3% |
| $200,000+ | 1,676 | 27.4% |
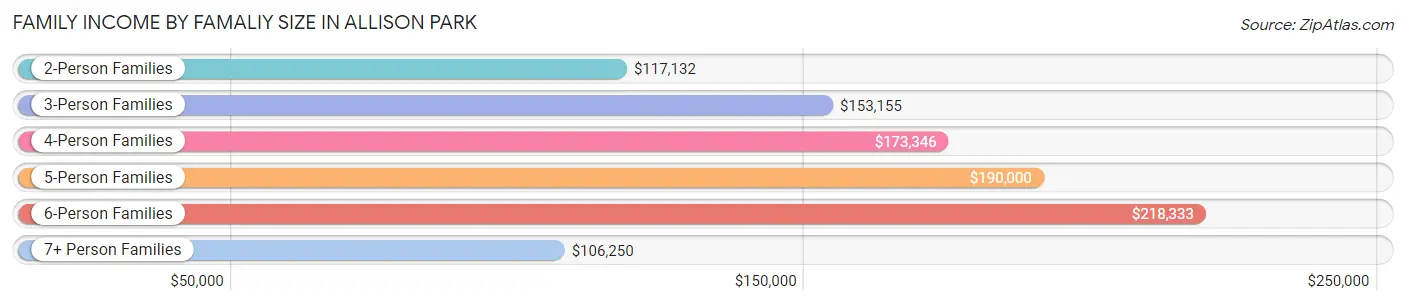
Family Income by Famaliy Size in Allison Park
6-person families (92 | 1.5%) account for the highest median family income in Allison Park with $218,333 per family, while 2-person families (2,845 | 46.5%) have the highest median income of $58,566 per family member.
| Income Bracket | # Families | Median Income |
| 2-Person Families | 2,845 (46.5%) | $117,132 |
| 3-Person Families | 1,605 (26.2%) | $153,155 |
| 4-Person Families | 1,112 (18.2%) | $173,346 |
| 5-Person Families | 430 (7.0%) | $190,000 |
| 6-Person Families | 92 (1.5%) | $218,333 |
| 7+ Person Families | 33 (0.5%) | $106,250 |
| Total | 6,117 (100.0%) | $137,945 |
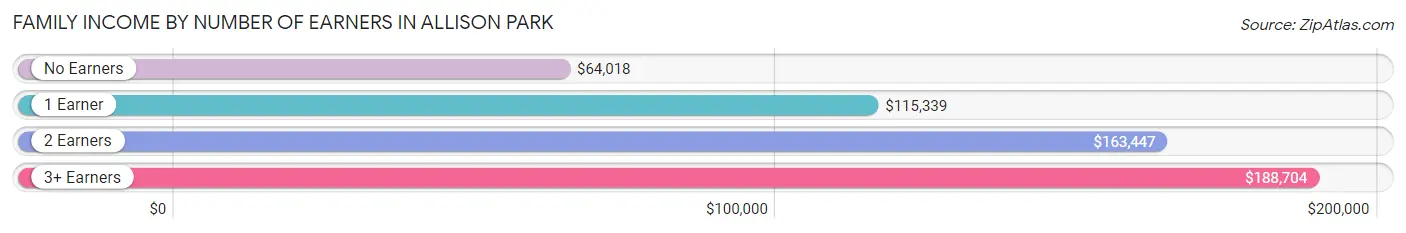
Family Income by Number of Earners in Allison Park
The median family income in Allison Park is $137,945, with families comprising 3+ earners (918) having the highest median family income of $188,704, while families with no earners (987) have the lowest median family income of $64,018, accounting for 15.0% and 16.1% of families, respectively.
| Number of Earners | # Families | Median Income |
| No Earners | 987 (16.1%) | $64,018 |
| 1 Earner | 1,701 (27.8%) | $115,339 |
| 2 Earners | 2,511 (41.0%) | $163,447 |
| 3+ Earners | 918 (15.0%) | $188,704 |
| Total | 6,117 (100.0%) | $137,945 |
Household Income in Allison Park
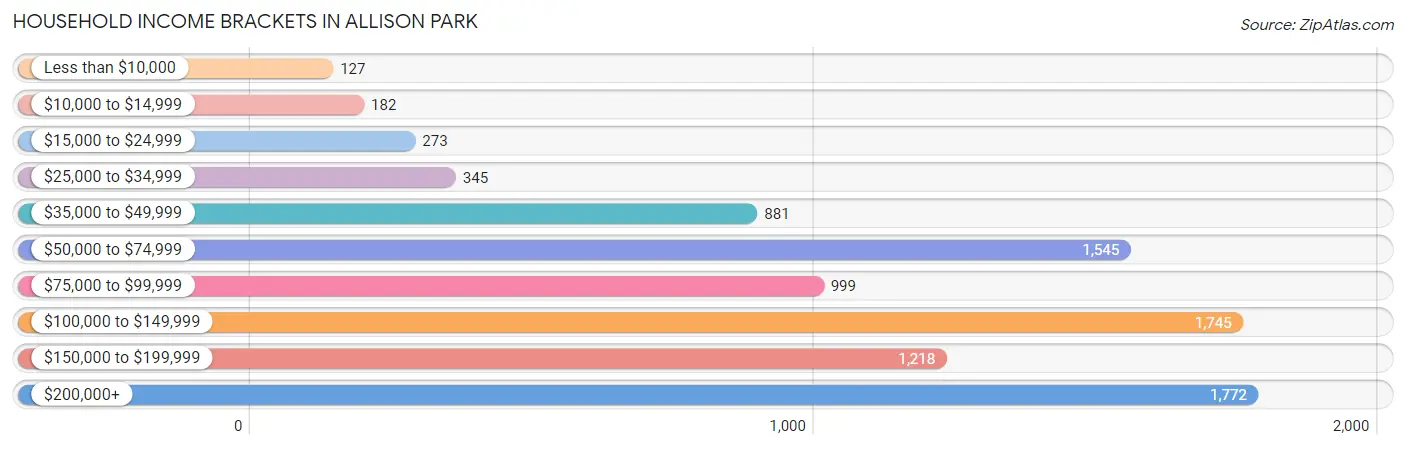
Household Income Brackets in Allison Park
With 1,772 households falling in the category, the $200,000+ income range is the most frequent in Allison Park, accounting for 19.5% of all households. In contrast, only 127 households (1.4%) fall into the less than $10,000 income bracket, making it the least populous group.
| Income Bracket | # Households | % Households |
| Less than $10,000 | 127 | 1.4% |
| $10,000 to $14,999 | 182 | 2.0% |
| $15,000 to $24,999 | 273 | 3.0% |
| $25,000 to $34,999 | 345 | 3.8% |
| $35,000 to $49,999 | 881 | 9.7% |
| $50,000 to $74,999 | 1,545 | 17.0% |
| $75,000 to $99,999 | 999 | 11.0% |
| $100,000 to $149,999 | 1,745 | 19.2% |
| $150,000 to $199,999 | 1,218 | 13.4% |
| $200,000+ | 1,772 | 19.5% |
Household Income by Householder Age in Allison Park
The median household income in Allison Park is $106,588, with the highest median household income of $132,931 found in the 45 to 64 years age bracket for the primary householder. A total of 3,518 households (38.7%) fall into this category. Meanwhile, the 15 to 24 years age bracket for the primary householder has the lowest median household income of $40,737, with 145 households (1.6%) in this group.
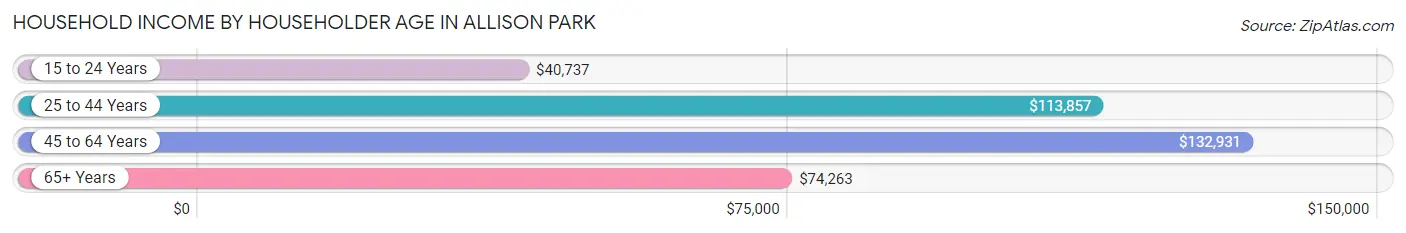
| Income Bracket | # Households | Median Income |
| 15 to 24 Years | 145 (1.6%) | $40,737 |
| 25 to 44 Years | 2,762 (30.4%) | $113,857 |
| 45 to 64 Years | 3,518 (38.7%) | $132,931 |
| 65+ Years | 2,661 (29.3%) | $74,263 |
| Total | 9,086 (100.0%) | $106,588 |
Poverty in Allison Park
Income Below Poverty by Sex and Age in Allison Park
With 2.7% poverty level for males and 4.3% for females among the residents of Allison Park, 75 year old and over males and 75 year old and over females are the most vulnerable to poverty, with 63 males (8.8%) and 123 females (11.4%) in their respective age groups living below the poverty level.
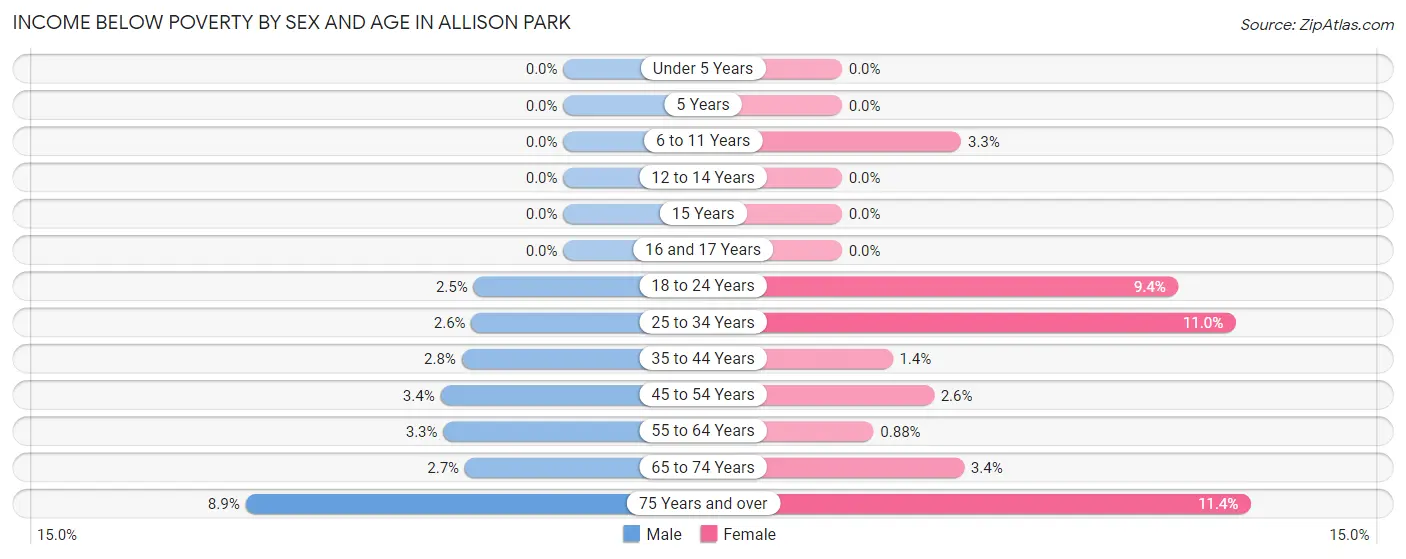
| Age Bracket | Male | Female |
| Under 5 Years | 0 (0.0%) | 0 (0.0%) |
| 5 Years | 0 (0.0%) | 0 (0.0%) |
| 6 to 11 Years | 0 (0.0%) | 16 (3.3%) |
| 12 to 14 Years | 0 (0.0%) | 0 (0.0%) |
| 15 Years | 0 (0.0%) | 0 (0.0%) |
| 16 and 17 Years | 0 (0.0%) | 0 (0.0%) |
| 18 to 24 Years | 18 (2.5%) | 66 (9.3%) |
| 25 to 34 Years | 35 (2.6%) | 158 (11.0%) |
| 35 to 44 Years | 41 (2.8%) | 19 (1.4%) |
| 45 to 54 Years | 47 (3.4%) | 36 (2.6%) |
| 55 to 64 Years | 55 (3.3%) | 16 (0.9%) |
| 65 to 74 Years | 38 (2.7%) | 42 (3.4%) |
| 75 Years and over | 63 (8.8%) | 123 (11.4%) |
| Total | 297 (2.7%) | 476 (4.3%) |
Income Above Poverty by Sex and Age in Allison Park
According to the poverty statistics in Allison Park, males aged under 5 years and females aged under 5 years are the age groups that are most secure financially, with 100.0% of males and 100.0% of females in these age groups living above the poverty line.
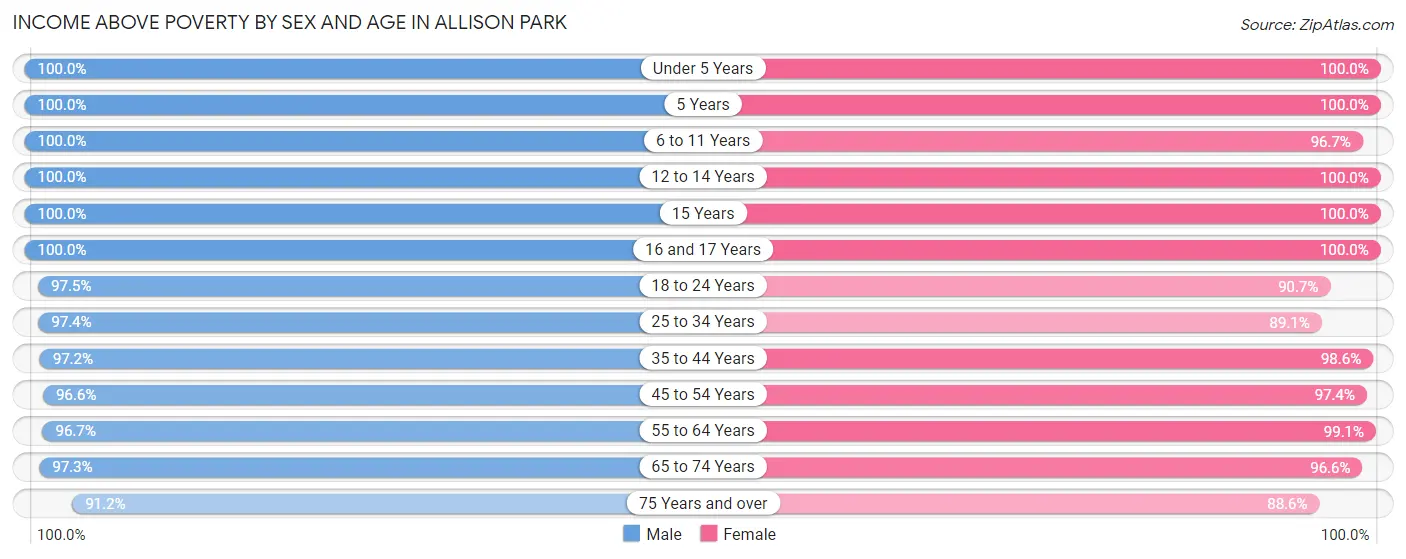
| Age Bracket | Male | Female |
| Under 5 Years | 506 (100.0%) | 752 (100.0%) |
| 5 Years | 76 (100.0%) | 67 (100.0%) |
| 6 to 11 Years | 737 (100.0%) | 466 (96.7%) |
| 12 to 14 Years | 438 (100.0%) | 412 (100.0%) |
| 15 Years | 73 (100.0%) | 129 (100.0%) |
| 16 and 17 Years | 365 (100.0%) | 289 (100.0%) |
| 18 to 24 Years | 703 (97.5%) | 640 (90.6%) |
| 25 to 34 Years | 1,331 (97.4%) | 1,285 (89.0%) |
| 35 to 44 Years | 1,409 (97.2%) | 1,328 (98.6%) |
| 45 to 54 Years | 1,328 (96.6%) | 1,373 (97.4%) |
| 55 to 64 Years | 1,594 (96.7%) | 1,794 (99.1%) |
| 65 to 74 Years | 1,348 (97.3%) | 1,195 (96.6%) |
| 75 Years and over | 649 (91.1%) | 959 (88.6%) |
| Total | 10,557 (97.3%) | 10,689 (95.7%) |
Income Below Poverty Among Married-Couple Families in Allison Park
The poverty statistics for married-couple families in Allison Park show that 1.4% or 73 of the total 5,292 families live below the poverty line. Families with no children have the highest poverty rate of 1.8%, comprising of 58 families. On the other hand, families with 3 or 4 children have the lowest poverty rate of 0.0%, which includes 0 families.
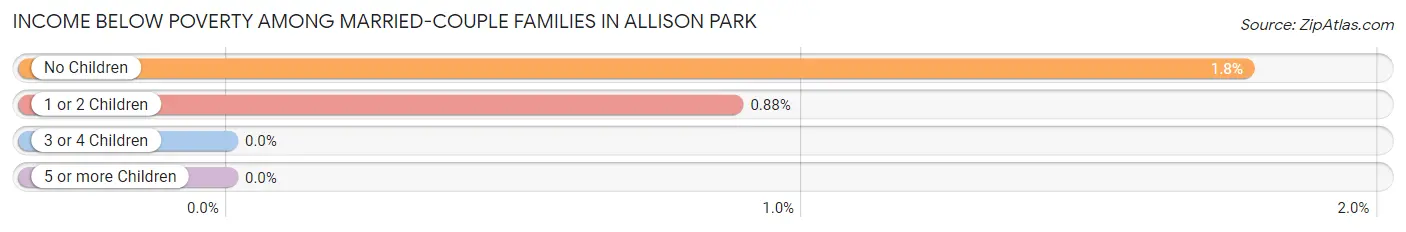
| Children | Above Poverty | Below Poverty |
| No Children | 3,215 (98.2%) | 58 (1.8%) |
| 1 or 2 Children | 1,696 (99.1%) | 15 (0.9%) |
| 3 or 4 Children | 275 (100.0%) | 0 (0.0%) |
| 5 or more Children | 33 (100.0%) | 0 (0.0%) |
| Total | 5,219 (98.6%) | 73 (1.4%) |
Income Below Poverty Among Single-Parent Households in Allison Park
| Children | Single Father | Single Mother |
| No Children | 0 (0.0%) | 0 (0.0%) |
| 1 or 2 Children | 0 (0.0%) | 0 (0.0%) |
| 3 or 4 Children | 0 (0.0%) | 0 (0.0%) |
| 5 or more Children | 0 (0.0%) | 0 (0.0%) |
| Total | 0 (0.0%) | 0 (0.0%) |
Income Below Poverty Among Married-Couple vs Single-Parent Households in Allison Park
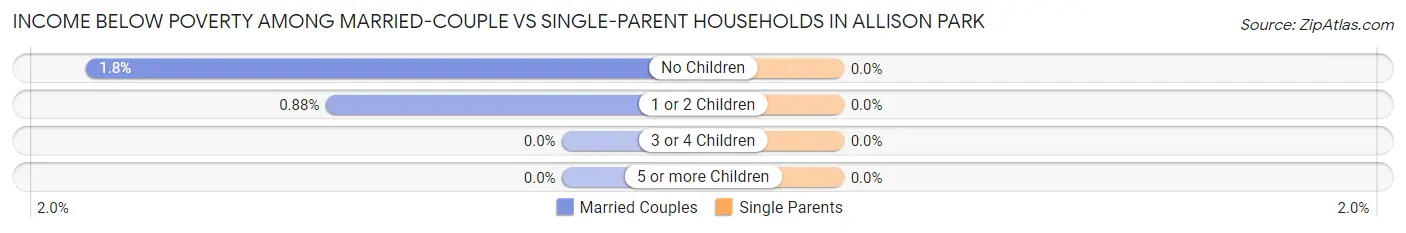
| Children | Married-Couple Families | Single-Parent Households |
| No Children | 58 (1.8%) | 0 (0.0%) |
| 1 or 2 Children | 15 (0.9%) | 0 (0.0%) |
| 3 or 4 Children | 0 (0.0%) | 0 (0.0%) |
| 5 or more Children | 0 (0.0%) | 0 (0.0%) |
| Total | 73 (1.4%) | 0 (0.0%) |
Race in Allison Park
The most populous races in Allison Park are White / Caucasian (20,765 | 91.5%), Asian (724 | 3.2%), and Two or more Races (633 | 2.8%).
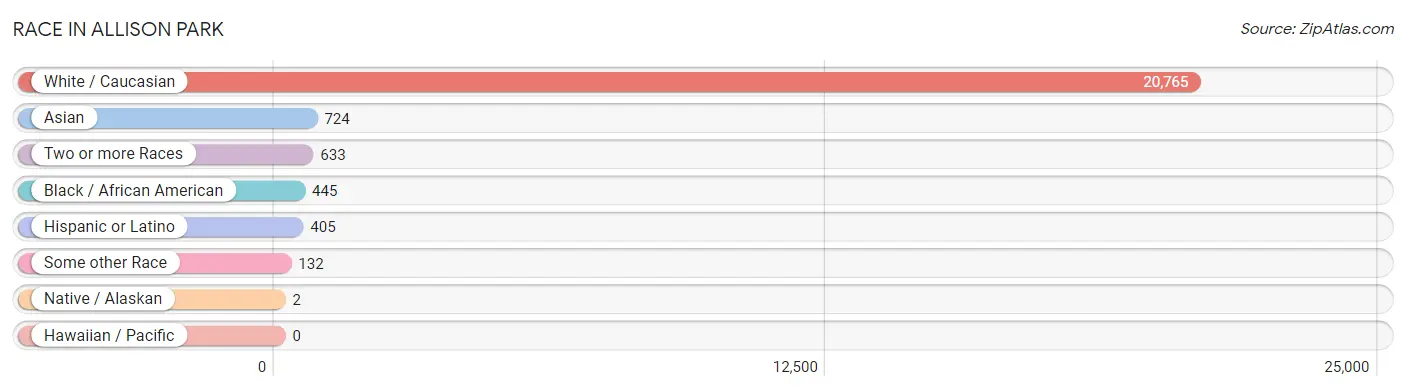
| Race | # Population | % Population |
| Asian | 724 | 3.2% |
| Black / African American | 445 | 2.0% |
| Hawaiian / Pacific | 0 | 0.0% |
| Hispanic or Latino | 405 | 1.8% |
| Native / Alaskan | 2 | 0.0% |
| White / Caucasian | 20,765 | 91.5% |
| Two or more Races | 633 | 2.8% |
| Some other Race | 132 | 0.6% |
| Total | 22,701 | 100.0% |
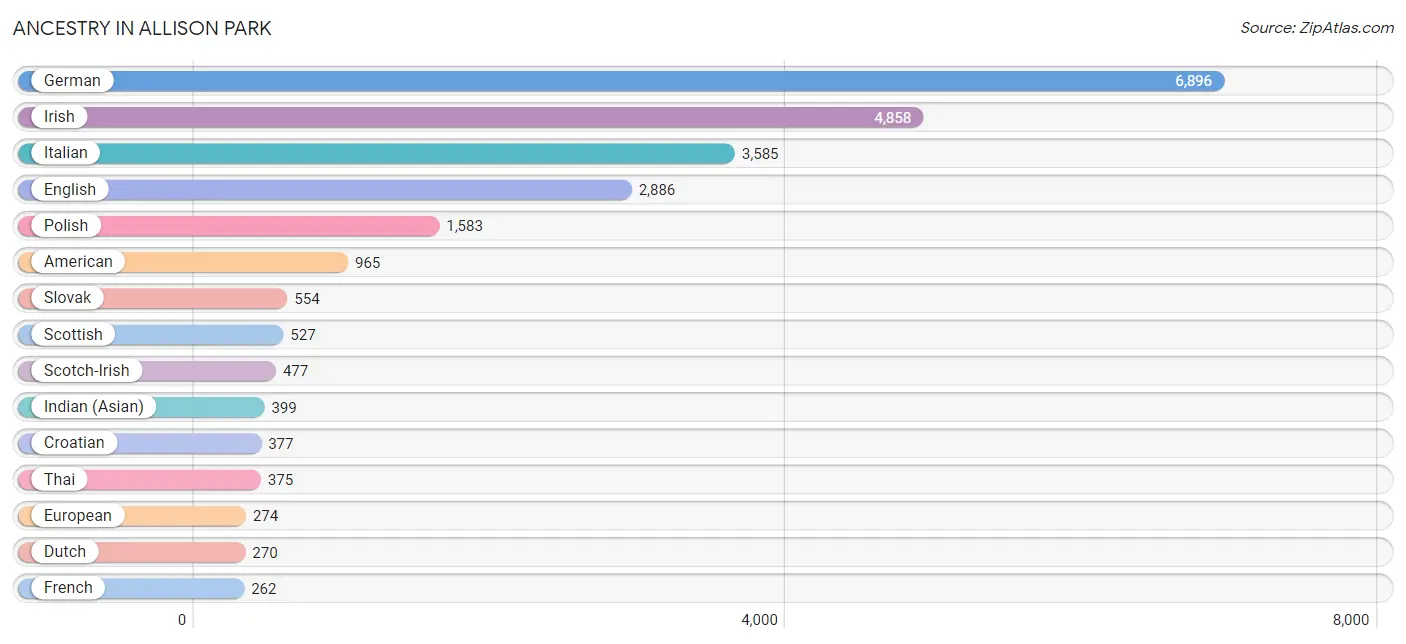
Ancestry in Allison Park
The most populous ancestries reported in Allison Park are German (6,896 | 30.4%), Irish (4,858 | 21.4%), Italian (3,585 | 15.8%), English (2,886 | 12.7%), and Polish (1,583 | 7.0%), together accounting for 87.3% of all Allison Park residents.
| Ancestry | # Population | % Population |
| African | 119 | 0.5% |
| American | 965 | 4.3% |
| Arab | 40 | 0.2% |
| Australian | 145 | 0.6% |
| Austrian | 148 | 0.6% |
| Bhutanese | 15 | 0.1% |
| British | 135 | 0.6% |
| British West Indian | 7 | 0.0% |
| Burmese | 95 | 0.4% |
| Canadian | 12 | 0.1% |
| Chilean | 22 | 0.1% |
| Colombian | 15 | 0.1% |
| Croatian | 377 | 1.7% |
| Czech | 248 | 1.1% |
| Czechoslovakian | 14 | 0.1% |
| Danish | 29 | 0.1% |
| Dominican | 33 | 0.2% |
| Dutch | 270 | 1.2% |
| Eastern European | 71 | 0.3% |
| Egyptian | 7 | 0.0% |
| English | 2,886 | 12.7% |
| Ethiopian | 18 | 0.1% |
| European | 274 | 1.2% |
| French | 262 | 1.1% |
| French Canadian | 43 | 0.2% |
| German | 6,896 | 30.4% |
| Greek | 109 | 0.5% |
| Hungarian | 125 | 0.5% |
| Indian (Asian) | 399 | 1.8% |
| Irish | 4,858 | 21.4% |
| Italian | 3,585 | 15.8% |
| Jamaican | 41 | 0.2% |
| Korean | 10 | 0.0% |
| Lithuanian | 152 | 0.7% |
| Mexican | 161 | 0.7% |
| Northern European | 69 | 0.3% |
| Norwegian | 33 | 0.2% |
| Pakistani | 83 | 0.4% |
| Pennsylvania German | 46 | 0.2% |
| Polish | 1,583 | 7.0% |
| Portuguese | 13 | 0.1% |
| Puerto Rican | 64 | 0.3% |
| Romanian | 87 | 0.4% |
| Russian | 139 | 0.6% |
| Scandinavian | 8 | 0.0% |
| Scotch-Irish | 477 | 2.1% |
| Scottish | 527 | 2.3% |
| Serbian | 113 | 0.5% |
| Slavic | 15 | 0.1% |
| Slovak | 554 | 2.4% |
| Slovene | 62 | 0.3% |
| South American | 37 | 0.2% |
| Spaniard | 21 | 0.1% |
| Spanish | 89 | 0.4% |
| Sri Lankan | 41 | 0.2% |
| Subsaharan African | 137 | 0.6% |
| Swedish | 109 | 0.5% |
| Swiss | 49 | 0.2% |
| Syrian | 33 | 0.2% |
| Thai | 375 | 1.7% |
| Ukrainian | 151 | 0.7% |
| Welsh | 213 | 0.9% |
| West Indian | 11 | 0.1% |
| Yugoslavian | 13 | 0.1% | View All 64 Rows |
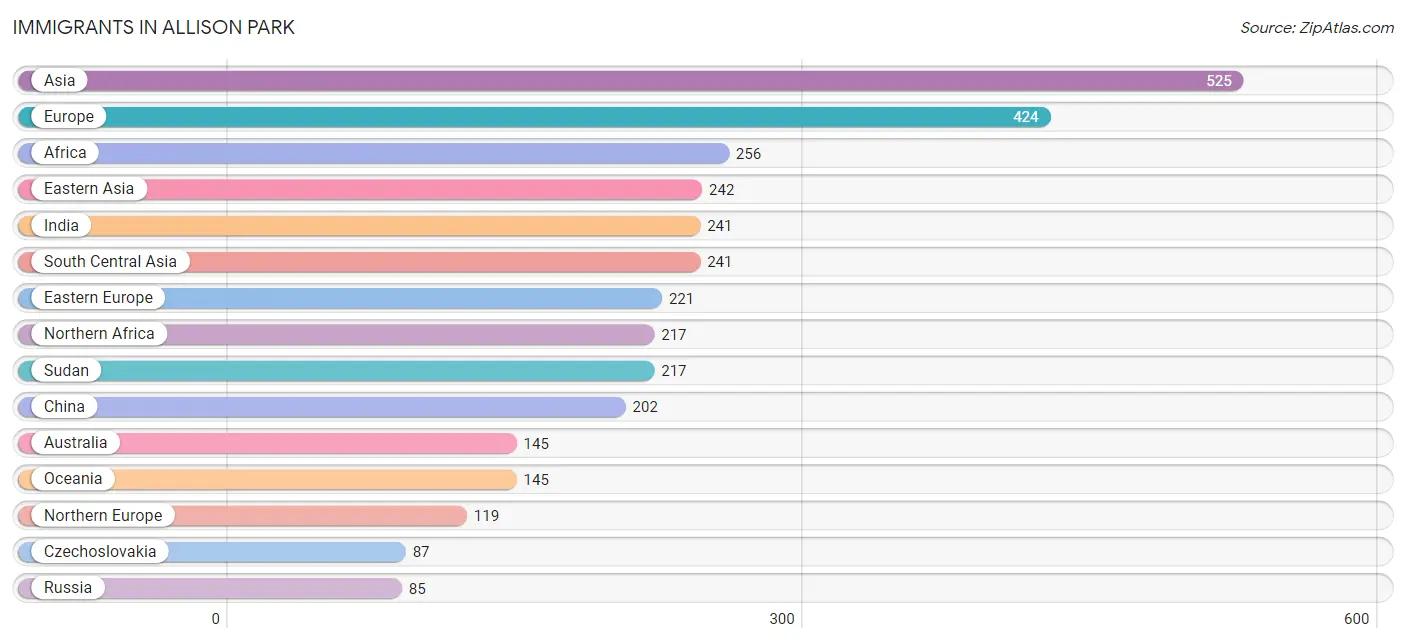
Immigrants in Allison Park
The most numerous immigrant groups reported in Allison Park came from Asia (525 | 2.3%), Europe (424 | 1.9%), Africa (256 | 1.1%), Eastern Asia (242 | 1.1%), and India (241 | 1.1%), together accounting for 7.4% of all Allison Park residents.
| Immigration Origin | # Population | % Population |
| Africa | 256 | 1.1% |
| Asia | 525 | 2.3% |
| Australia | 145 | 0.6% |
| Brazil | 7 | 0.0% |
| Canada | 33 | 0.2% |
| Caribbean | 30 | 0.1% |
| Chile | 7 | 0.0% |
| China | 202 | 0.9% |
| Colombia | 15 | 0.1% |
| Czechoslovakia | 87 | 0.4% |
| Eastern Africa | 18 | 0.1% |
| Eastern Asia | 242 | 1.1% |
| Eastern Europe | 221 | 1.0% |
| Ethiopia | 18 | 0.1% |
| Europe | 424 | 1.9% |
| Germany | 32 | 0.1% |
| Haiti | 30 | 0.1% |
| Hong Kong | 19 | 0.1% |
| India | 241 | 1.1% |
| Italy | 47 | 0.2% |
| Korea | 40 | 0.2% |
| Latin America | 59 | 0.3% |
| Lithuania | 23 | 0.1% |
| Northern Africa | 217 | 1.0% |
| Northern Europe | 119 | 0.5% |
| Oceania | 145 | 0.6% |
| Russia | 85 | 0.4% |
| South Africa | 21 | 0.1% |
| South America | 29 | 0.1% |
| South Central Asia | 241 | 1.1% |
| South Eastern Asia | 42 | 0.2% |
| Southern Europe | 52 | 0.2% |
| Spain | 5 | 0.0% |
| Sudan | 217 | 1.0% |
| Thailand | 13 | 0.1% |
| Vietnam | 29 | 0.1% |
| Western Europe | 32 | 0.1% | View All 37 Rows |
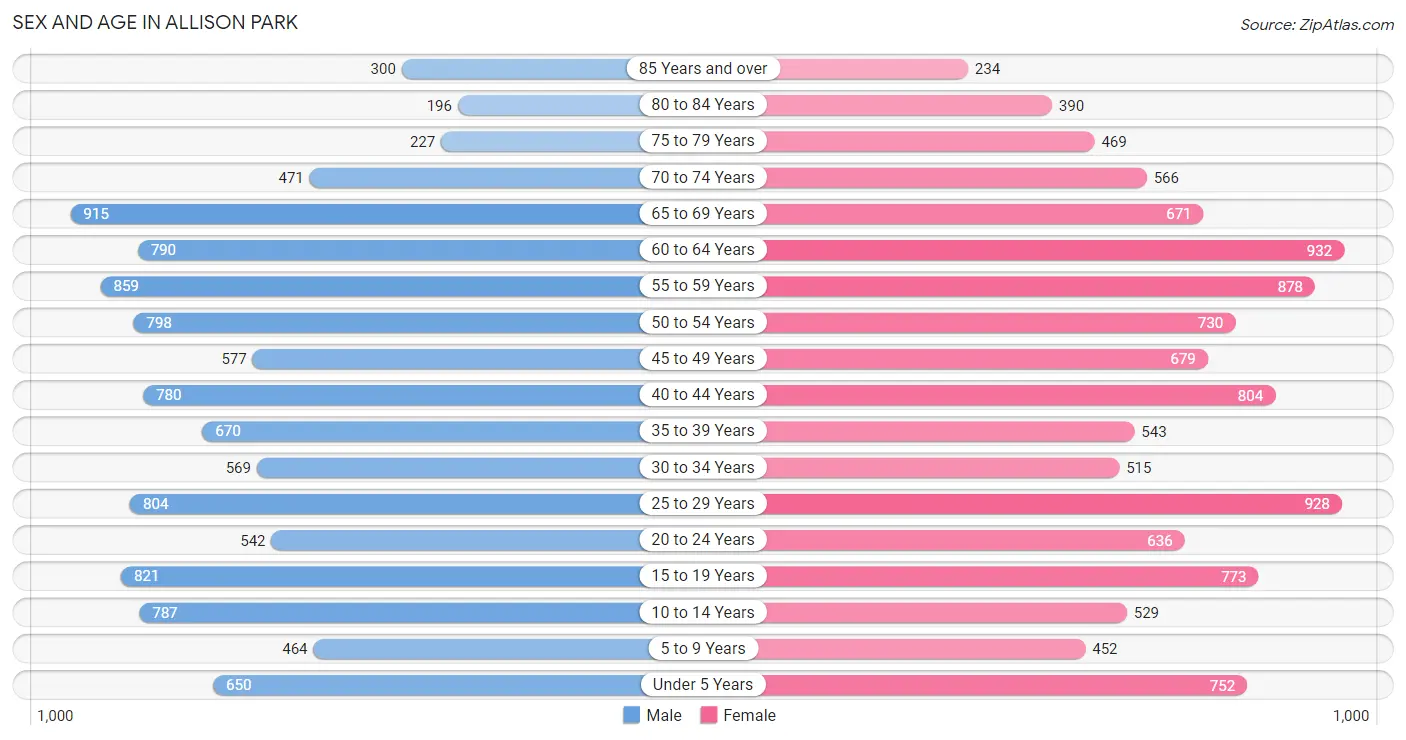
Sex and Age in Allison Park
Sex and Age in Allison Park
The most populous age groups in Allison Park are 65 to 69 Years (915 | 8.2%) for men and 60 to 64 Years (932 | 8.1%) for women.
| Age Bracket | Male | Female |
| Under 5 Years | 650 (5.8%) | 752 (6.6%) |
| 5 to 9 Years | 464 (4.1%) | 452 (3.9%) |
| 10 to 14 Years | 787 (7.0%) | 529 (4.6%) |
| 15 to 19 Years | 821 (7.3%) | 773 (6.7%) |
| 20 to 24 Years | 542 (4.8%) | 636 (5.5%) |
| 25 to 29 Years | 804 (7.2%) | 928 (8.1%) |
| 30 to 34 Years | 569 (5.1%) | 515 (4.5%) |
| 35 to 39 Years | 670 (6.0%) | 543 (4.7%) |
| 40 to 44 Years | 780 (7.0%) | 804 (7.0%) |
| 45 to 49 Years | 577 (5.1%) | 679 (5.9%) |
| 50 to 54 Years | 798 (7.1%) | 730 (6.4%) |
| 55 to 59 Years | 859 (7.7%) | 878 (7.6%) |
| 60 to 64 Years | 790 (7.0%) | 932 (8.1%) |
| 65 to 69 Years | 915 (8.2%) | 671 (5.8%) |
| 70 to 74 Years | 471 (4.2%) | 566 (4.9%) |
| 75 to 79 Years | 227 (2.0%) | 469 (4.1%) |
| 80 to 84 Years | 196 (1.8%) | 390 (3.4%) |
| 85 Years and over | 300 (2.7%) | 234 (2.0%) |
| Total | 11,220 (100.0%) | 11,481 (100.0%) |
Families and Households in Allison Park
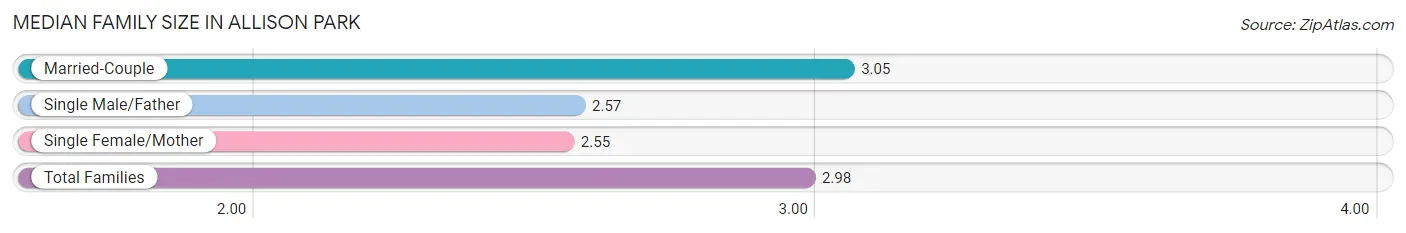
Median Family Size in Allison Park
The median family size in Allison Park is 2.98 persons per family, with married-couple families (5,292 | 86.5%) accounting for the largest median family size of 3.05 persons per family. On the other hand, single female/mother families (420 | 6.9%) represent the smallest median family size with 2.55 persons per family.
| Family Type | # Families | Family Size |
| Married-Couple | 5,292 (86.5%) | 3.05 |
| Single Male/Father | 405 (6.6%) | 2.57 |
| Single Female/Mother | 420 (6.9%) | 2.55 |
| Total Families | 6,117 (100.0%) | 2.98 |
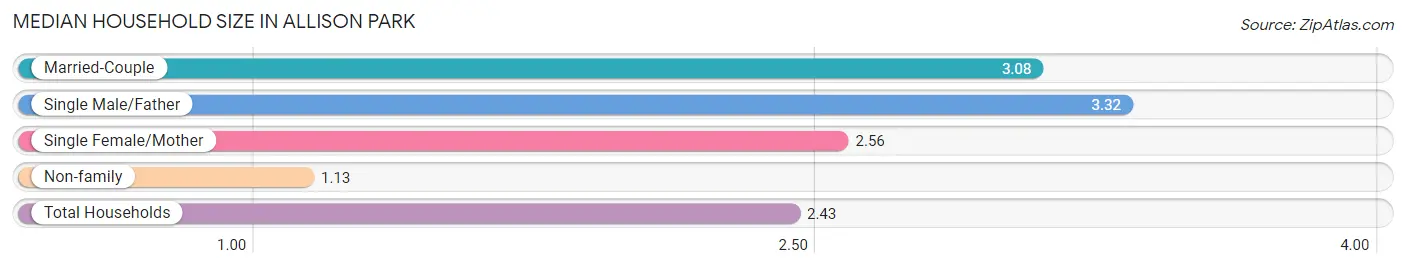
Median Household Size in Allison Park
The median household size in Allison Park is 2.43 persons per household, with single male/father households (405 | 4.5%) accounting for the largest median household size of 3.32 persons per household. non-family households (2,969 | 32.7%) represent the smallest median household size with 1.13 persons per household.
| Household Type | # Households | Household Size |
| Married-Couple | 5,292 (58.2%) | 3.08 |
| Single Male/Father | 405 (4.5%) | 3.32 |
| Single Female/Mother | 420 (4.6%) | 2.56 |
| Non-family | 2,969 (32.7%) | 1.13 |
| Total Households | 9,086 (100.0%) | 2.43 |
Household Size by Marriage Status in Allison Park
Out of a total of 9,086 households in Allison Park, 6,117 (67.3%) are family households, while 2,969 (32.7%) are nonfamily households. The most numerous type of family households are 2-person households, comprising 2,804, and the most common type of nonfamily households are 1-person households, comprising 2,657.
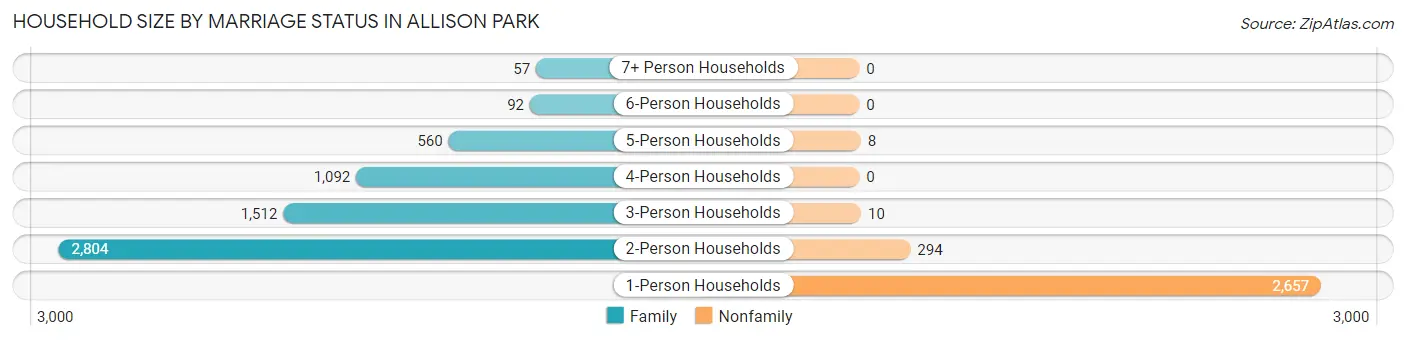
| Household Size | Family Households | Nonfamily Households |
| 1-Person Households | - | 2,657 (29.2%) |
| 2-Person Households | 2,804 (30.9%) | 294 (3.2%) |
| 3-Person Households | 1,512 (16.6%) | 10 (0.1%) |
| 4-Person Households | 1,092 (12.0%) | 0 (0.0%) |
| 5-Person Households | 560 (6.2%) | 8 (0.1%) |
| 6-Person Households | 92 (1.0%) | 0 (0.0%) |
| 7+ Person Households | 57 (0.6%) | 0 (0.0%) |
| Total | 6,117 (67.3%) | 2,969 (32.7%) |
Female Fertility in Allison Park
Fertility by Age in Allison Park
Average fertility rate in Allison Park is 58.0 births per 1,000 women. Women in the age bracket of 35 to 50 years have the highest fertility rate with 76.0 births per 1,000 women. Women in the age bracket of 35 to 50 years acount for 57.2% of all women with births.
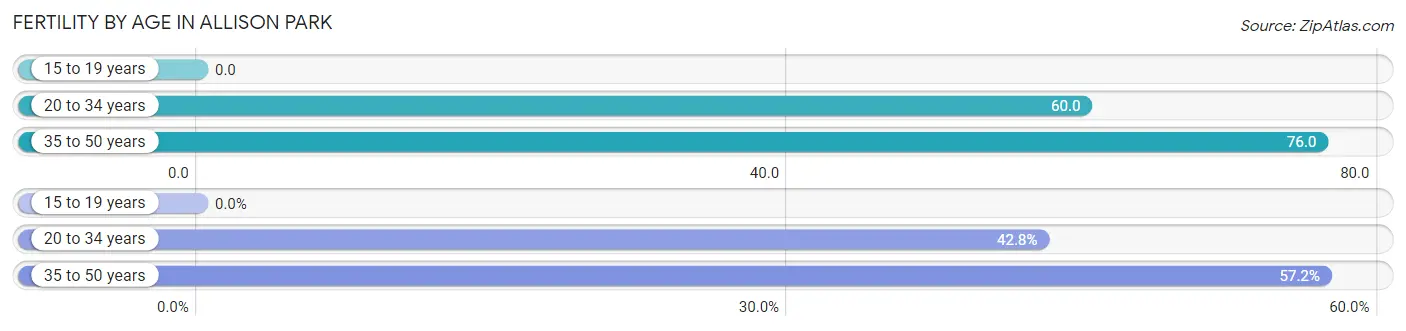
| Age Bracket | Women with Births | Births / 1,000 Women |
| 15 to 19 years | 0 (0.0%) | 0.0 |
| 20 to 34 years | 125 (42.8%) | 60.0 |
| 35 to 50 years | 167 (57.2%) | 76.0 |
| Total | 292 (100.0%) | 58.0 |
Fertility by Age by Marriage Status in Allison Park
66.8% of women with births (292) in Allison Park are married. The highest percentage of unmarried women with births falls into 35 to 50 years age bracket with 58.1% of them unmarried at the time of birth, while the lowest percentage of unmarried women with births belong to 20 to 34 years age bracket with 0.0% of them unmarried.
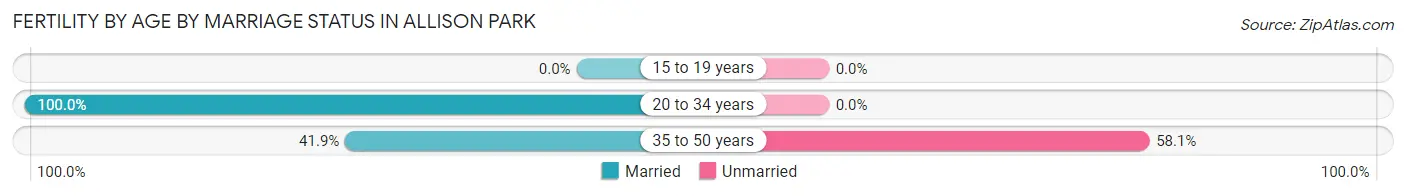
| Age Bracket | Married | Unmarried |
| 15 to 19 years | 0 (0.0%) | 0 (0.0%) |
| 20 to 34 years | 125 (100.0%) | 0 (0.0%) |
| 35 to 50 years | 70 (41.9%) | 97 (58.1%) |
| Total | 195 (66.8%) | 97 (33.2%) |
Fertility by Education in Allison Park
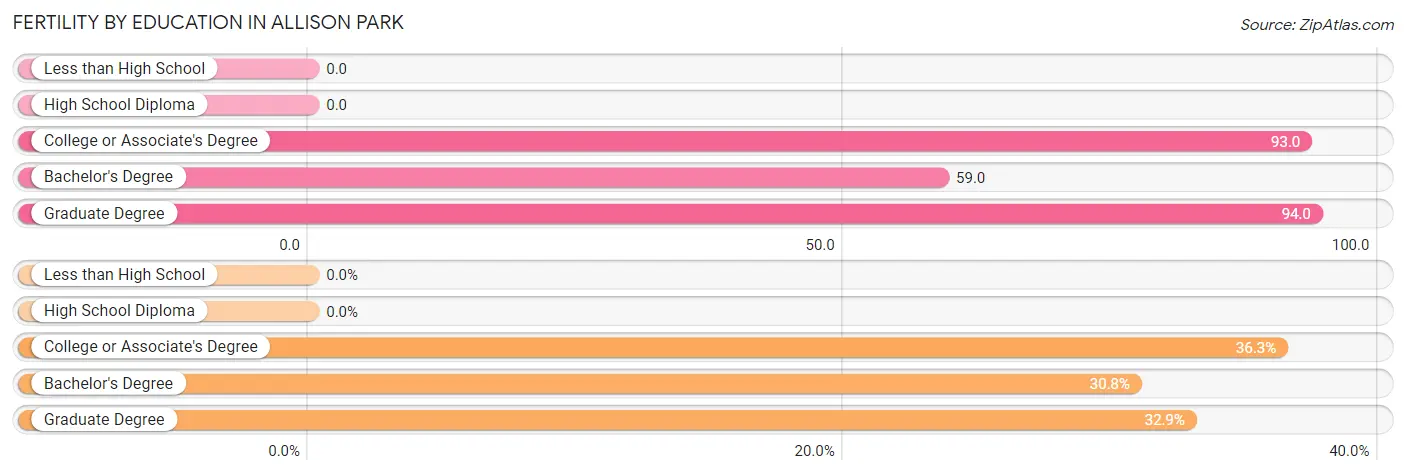
| Educational Attainment | Women with Births | Births / 1,000 Women |
| Less than High School | 0 (0.0%) | 0.0 |
| High School Diploma | 0 (0.0%) | 0.0 |
| College or Associate's Degree | 106 (36.3%) | 93.0 |
| Bachelor's Degree | 90 (30.8%) | 59.0 |
| Graduate Degree | 96 (32.9%) | 94.0 |
| Total | 292 (100.0%) | 58.0 |
Fertility by Education by Marriage Status in Allison Park
33.2% of women with births in Allison Park are unmarried. Women with the educational attainment of bachelor's degree are most likely to be married with 100.0% of them married at childbirth, while women with the educational attainment of college or associate's degree are least likely to be married with 91.5% of them unmarried at childbirth.
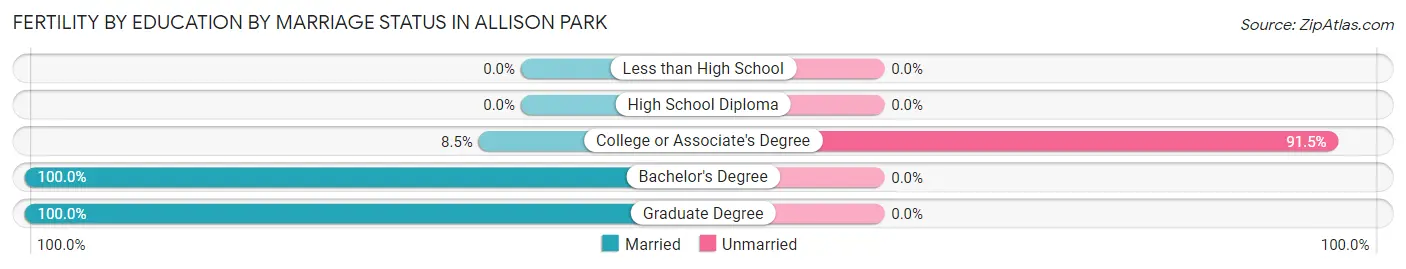
| Educational Attainment | Married | Unmarried |
| Less than High School | 0 (0.0%) | 0 (0.0%) |
| High School Diploma | 0 (0.0%) | 0 (0.0%) |
| College or Associate's Degree | 9 (8.5%) | 97 (91.5%) |
| Bachelor's Degree | 90 (100.0%) | 0 (0.0%) |
| Graduate Degree | 96 (100.0%) | 0 (0.0%) |
| Total | 195 (66.8%) | 97 (33.2%) |
Employment Characteristics in Allison Park
Employment by Class of Employer in Allison Park
Among the 12,078 employed individuals in Allison Park, private company employees (8,311 | 68.8%), not-for-profit organizations (1,891 | 15.7%), and local government employees (606 | 5.0%) make up the most common classes of employment.
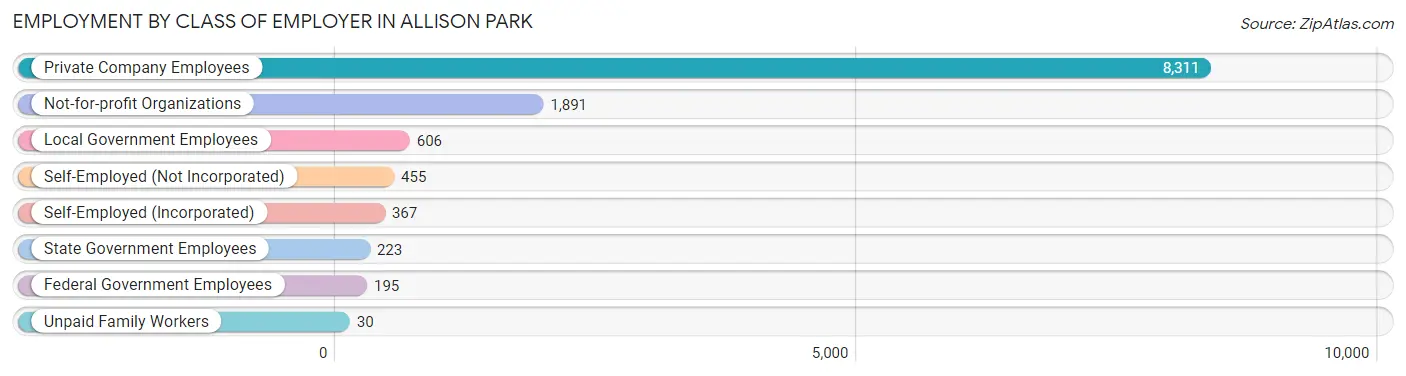
| Employer Class | # Employees | % Employees |
| Private Company Employees | 8,311 | 68.8% |
| Self-Employed (Incorporated) | 367 | 3.0% |
| Self-Employed (Not Incorporated) | 455 | 3.8% |
| Not-for-profit Organizations | 1,891 | 15.7% |
| Local Government Employees | 606 | 5.0% |
| State Government Employees | 223 | 1.8% |
| Federal Government Employees | 195 | 1.6% |
| Unpaid Family Workers | 30 | 0.3% |
| Total | 12,078 | 100.0% |
Employment Status by Age in Allison Park
According to the labor force statistics for Allison Park, out of the total population over 16 years of age (18,865), 68.1% or 12,847 individuals are in the labor force, with 4.5% or 578 of them unemployed. The age group with the highest labor force participation rate is 25 to 29 years, with 95.8% or 1,659 individuals in the labor force. Within the labor force, the 65 to 74 years age range has the highest percentage of unemployed individuals, with 9.3% or 76 of them being unemployed.
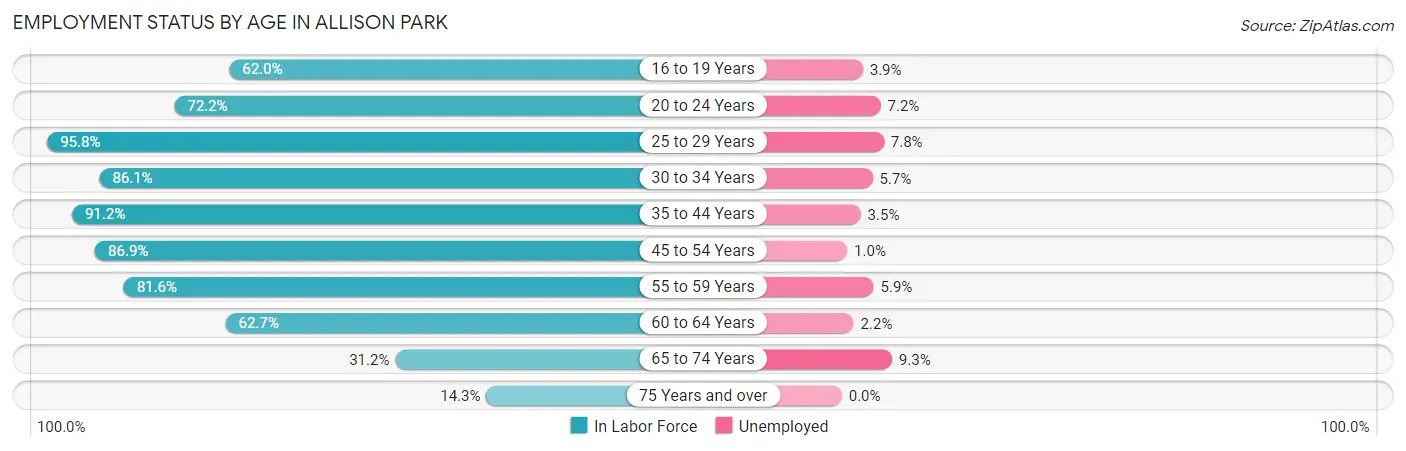
| Age Bracket | In Labor Force | Unemployed |
| 16 to 19 Years | 863 (62.0%) | 34 (3.9%) |
| 20 to 24 Years | 851 (72.2%) | 61 (7.2%) |
| 25 to 29 Years | 1,659 (95.8%) | 129 (7.8%) |
| 30 to 34 Years | 933 (86.1%) | 53 (5.7%) |
| 35 to 44 Years | 2,551 (91.2%) | 89 (3.5%) |
| 45 to 54 Years | 2,419 (86.9%) | 24 (1.0%) |
| 55 to 59 Years | 1,417 (81.6%) | 84 (5.9%) |
| 60 to 64 Years | 1,080 (62.7%) | 24 (2.2%) |
| 65 to 74 Years | 818 (31.2%) | 76 (9.3%) |
| 75 Years and over | 260 (14.3%) | 0 (0.0%) |
| Total | 12,847 (68.1%) | 578 (4.5%) |
Employment Status by Educational Attainment in Allison Park
According to labor force statistics for Allison Park, 84.8% of individuals (10,054) out of the total population between 25 and 64 years of age (11,856) are in the labor force, with 4.0% or 402 of them being unemployed. The group with the highest labor force participation rate are those with the educational attainment of bachelor's degree or higher, with 87.3% or 6,472 individuals in the labor force. Within the labor force, individuals with less than high school education have the highest percentage of unemployment, with 33.3% or 14 of them being unemployed.
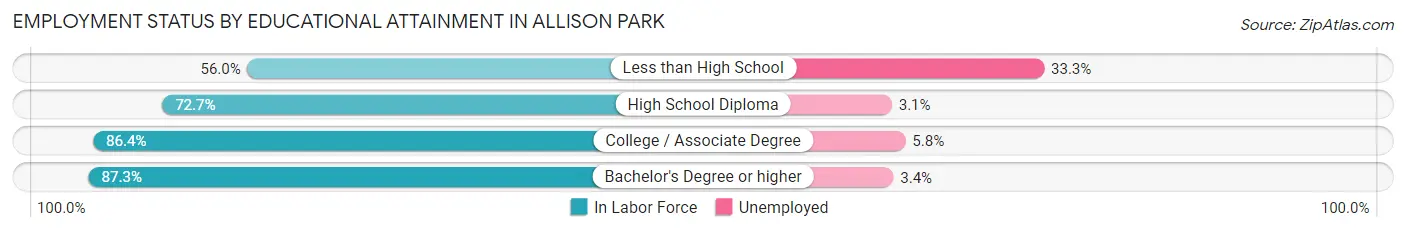
| Educational Attainment | In Labor Force | Unemployed |
| Less than High School | 42 (56.0%) | 25 (33.3%) |
| High School Diploma | 1,222 (72.7%) | 52 (3.1%) |
| College / Associate Degree | 2,322 (86.4%) | 156 (5.8%) |
| Bachelor's Degree or higher | 6,472 (87.3%) | 252 (3.4%) |
| Total | 10,054 (84.8%) | 474 (4.0%) |
Employment Occupations by Sex in Allison Park
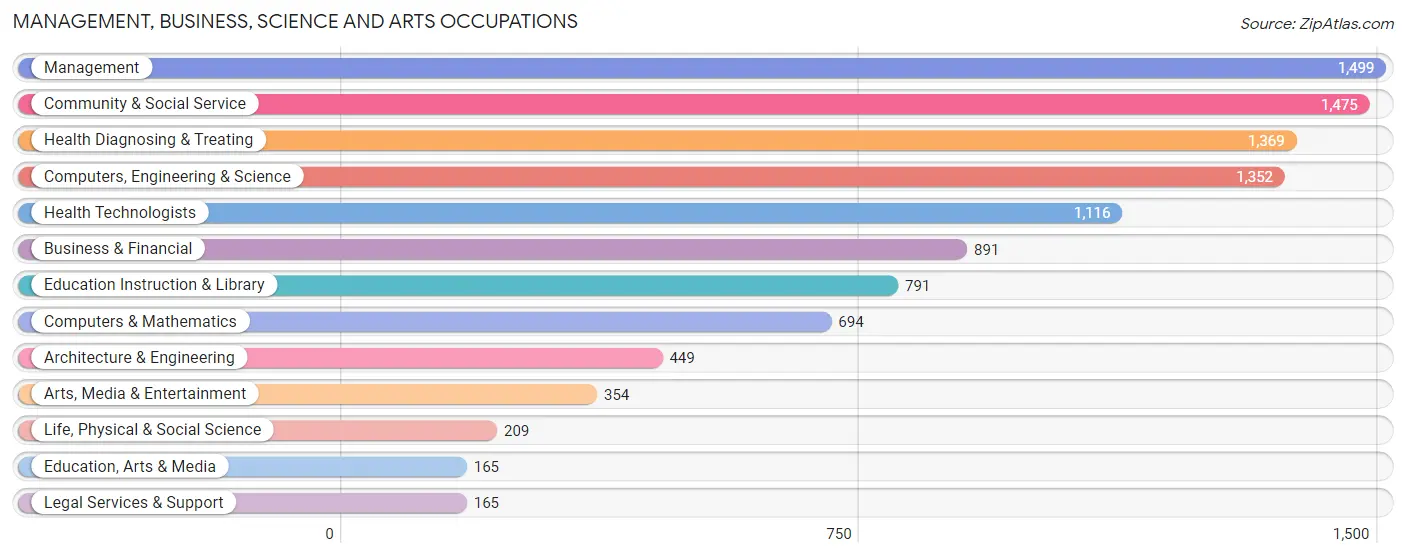
Management, Business, Science and Arts Occupations
The most common Management, Business, Science and Arts occupations in Allison Park are Management (1,499 | 12.2%), Community & Social Service (1,475 | 12.0%), Health Diagnosing & Treating (1,369 | 11.2%), Computers, Engineering & Science (1,352 | 11.0%), and Health Technologists (1,116 | 9.1%).
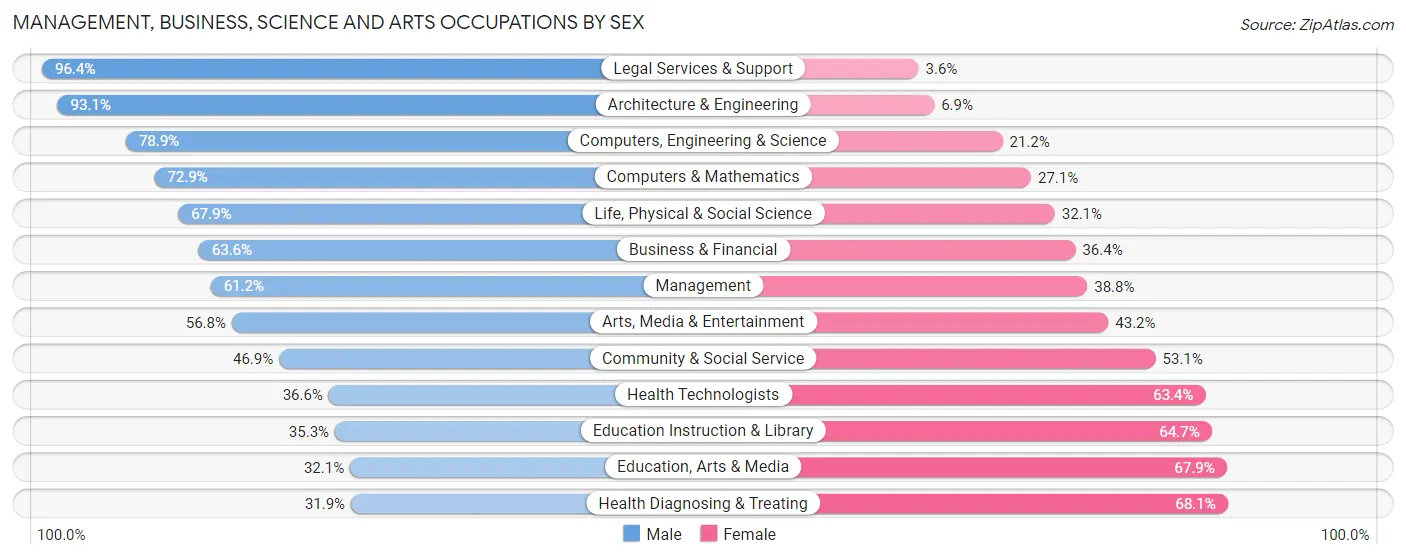
Management, Business, Science and Arts Occupations by Sex
Within the Management, Business, Science and Arts occupations in Allison Park, the most male-oriented occupations are Legal Services & Support (96.4%), Architecture & Engineering (93.1%), and Computers, Engineering & Science (78.8%), while the most female-oriented occupations are Health Diagnosing & Treating (68.1%), Education, Arts & Media (67.9%), and Education Instruction & Library (64.7%).
| Occupation | Male | Female |
| Management | 917 (61.2%) | 582 (38.8%) |
| Business & Financial | 567 (63.6%) | 324 (36.4%) |
| Computers, Engineering & Science | 1,066 (78.8%) | 286 (21.1%) |
| Computers & Mathematics | 506 (72.9%) | 188 (27.1%) |
| Architecture & Engineering | 418 (93.1%) | 31 (6.9%) |
| Life, Physical & Social Science | 142 (67.9%) | 67 (32.1%) |
| Community & Social Service | 692 (46.9%) | 783 (53.1%) |
| Education, Arts & Media | 53 (32.1%) | 112 (67.9%) |
| Legal Services & Support | 159 (96.4%) | 6 (3.6%) |
| Education Instruction & Library | 279 (35.3%) | 512 (64.7%) |
| Arts, Media & Entertainment | 201 (56.8%) | 153 (43.2%) |
| Health Diagnosing & Treating | 437 (31.9%) | 932 (68.1%) |
| Health Technologists | 408 (36.6%) | 708 (63.4%) |
| Total (Category) | 3,679 (55.9%) | 2,907 (44.1%) |
| Total (Overall) | 6,696 (54.6%) | 5,574 (45.4%) |
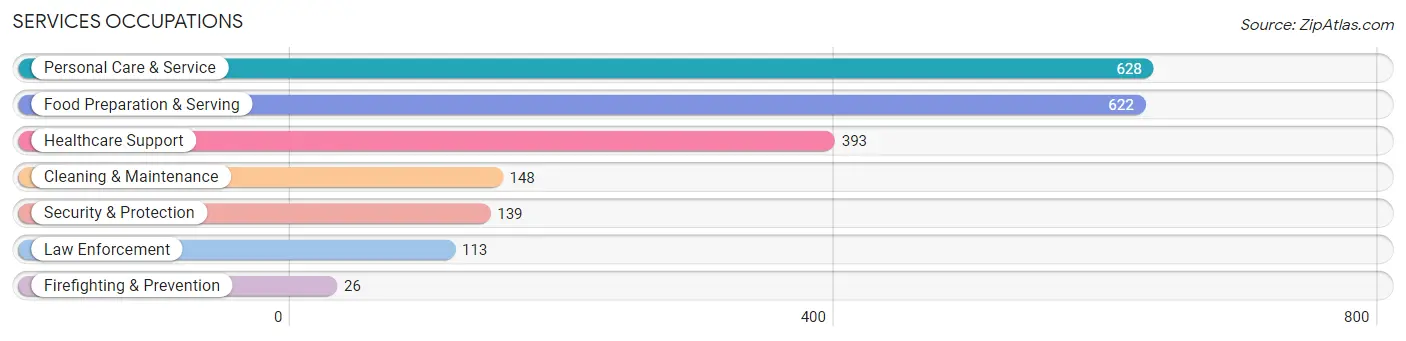
Services Occupations
The most common Services occupations in Allison Park are Personal Care & Service (628 | 5.1%), Food Preparation & Serving (622 | 5.1%), Healthcare Support (393 | 3.2%), Cleaning & Maintenance (148 | 1.2%), and Security & Protection (139 | 1.1%).
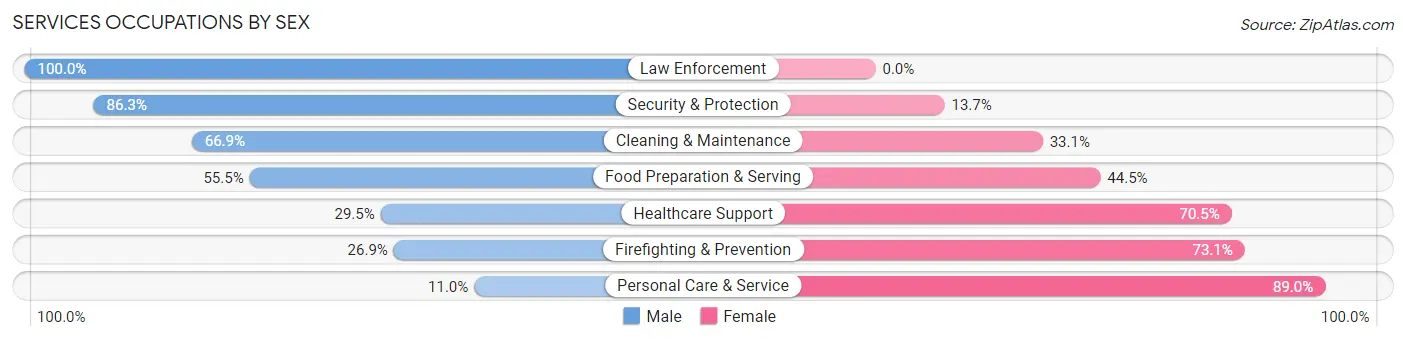
Services Occupations by Sex
Within the Services occupations in Allison Park, the most male-oriented occupations are Law Enforcement (100.0%), Security & Protection (86.3%), and Cleaning & Maintenance (66.9%), while the most female-oriented occupations are Personal Care & Service (89.0%), Firefighting & Prevention (73.1%), and Healthcare Support (70.5%).
| Occupation | Male | Female |
| Healthcare Support | 116 (29.5%) | 277 (70.5%) |
| Security & Protection | 120 (86.3%) | 19 (13.7%) |
| Firefighting & Prevention | 7 (26.9%) | 19 (73.1%) |
| Law Enforcement | 113 (100.0%) | 0 (0.0%) |
| Food Preparation & Serving | 345 (55.5%) | 277 (44.5%) |
| Cleaning & Maintenance | 99 (66.9%) | 49 (33.1%) |
| Personal Care & Service | 69 (11.0%) | 559 (89.0%) |
| Total (Category) | 749 (38.8%) | 1,181 (61.2%) |
| Total (Overall) | 6,696 (54.6%) | 5,574 (45.4%) |
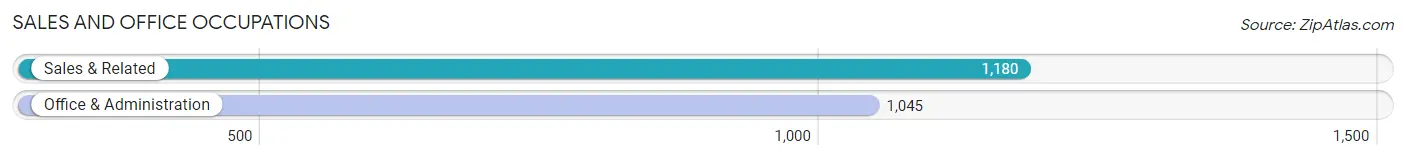
Sales and Office Occupations
The most common Sales and Office occupations in Allison Park are Sales & Related (1,180 | 9.6%), and Office & Administration (1,045 | 8.5%).
Sales and Office Occupations by Sex
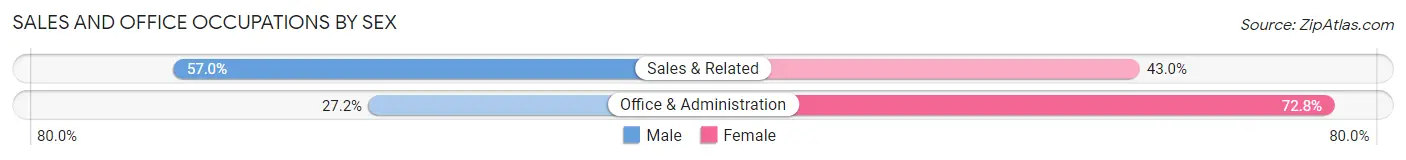
| Occupation | Male | Female |
| Sales & Related | 673 (57.0%) | 507 (43.0%) |
| Office & Administration | 284 (27.2%) | 761 (72.8%) |
| Total (Category) | 957 (43.0%) | 1,268 (57.0%) |
| Total (Overall) | 6,696 (54.6%) | 5,574 (45.4%) |
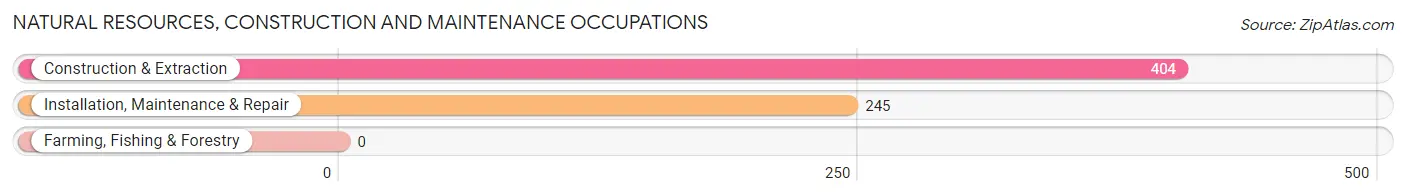
Natural Resources, Construction and Maintenance Occupations
The most common Natural Resources, Construction and Maintenance occupations in Allison Park are Construction & Extraction (404 | 3.3%), and Installation, Maintenance & Repair (245 | 2.0%).
Natural Resources, Construction and Maintenance Occupations by Sex
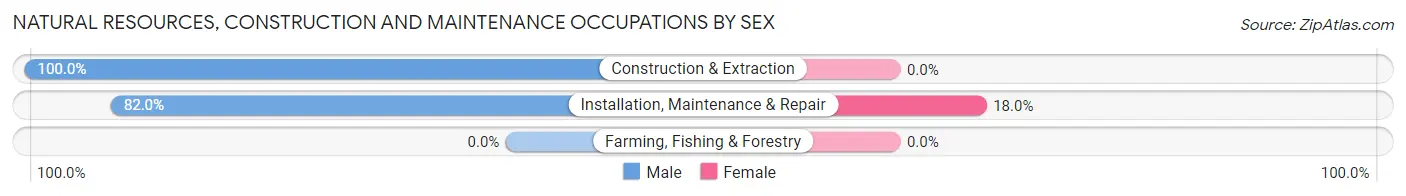
| Occupation | Male | Female |
| Farming, Fishing & Forestry | 0 (0.0%) | 0 (0.0%) |
| Construction & Extraction | 404 (100.0%) | 0 (0.0%) |
| Installation, Maintenance & Repair | 201 (82.0%) | 44 (18.0%) |
| Total (Category) | 605 (93.2%) | 44 (6.8%) |
| Total (Overall) | 6,696 (54.6%) | 5,574 (45.4%) |
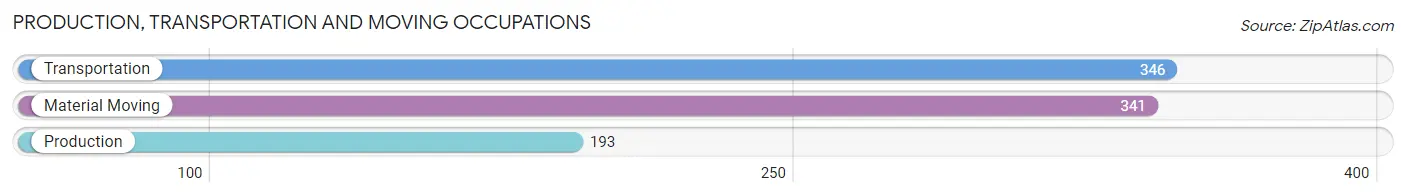
Production, Transportation and Moving Occupations
The most common Production, Transportation and Moving occupations in Allison Park are Transportation (346 | 2.8%), Material Moving (341 | 2.8%), and Production (193 | 1.6%).
Production, Transportation and Moving Occupations by Sex
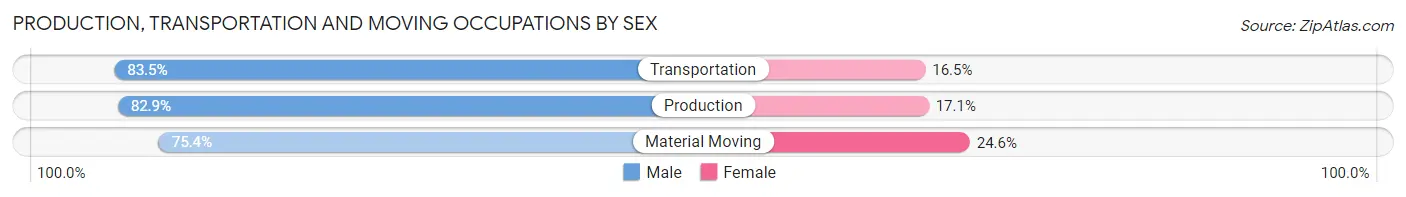
| Occupation | Male | Female |
| Production | 160 (82.9%) | 33 (17.1%) |
| Transportation | 289 (83.5%) | 57 (16.5%) |
| Material Moving | 257 (75.4%) | 84 (24.6%) |
| Total (Category) | 706 (80.2%) | 174 (19.8%) |
| Total (Overall) | 6,696 (54.6%) | 5,574 (45.4%) |
Employment Industries by Sex in Allison Park
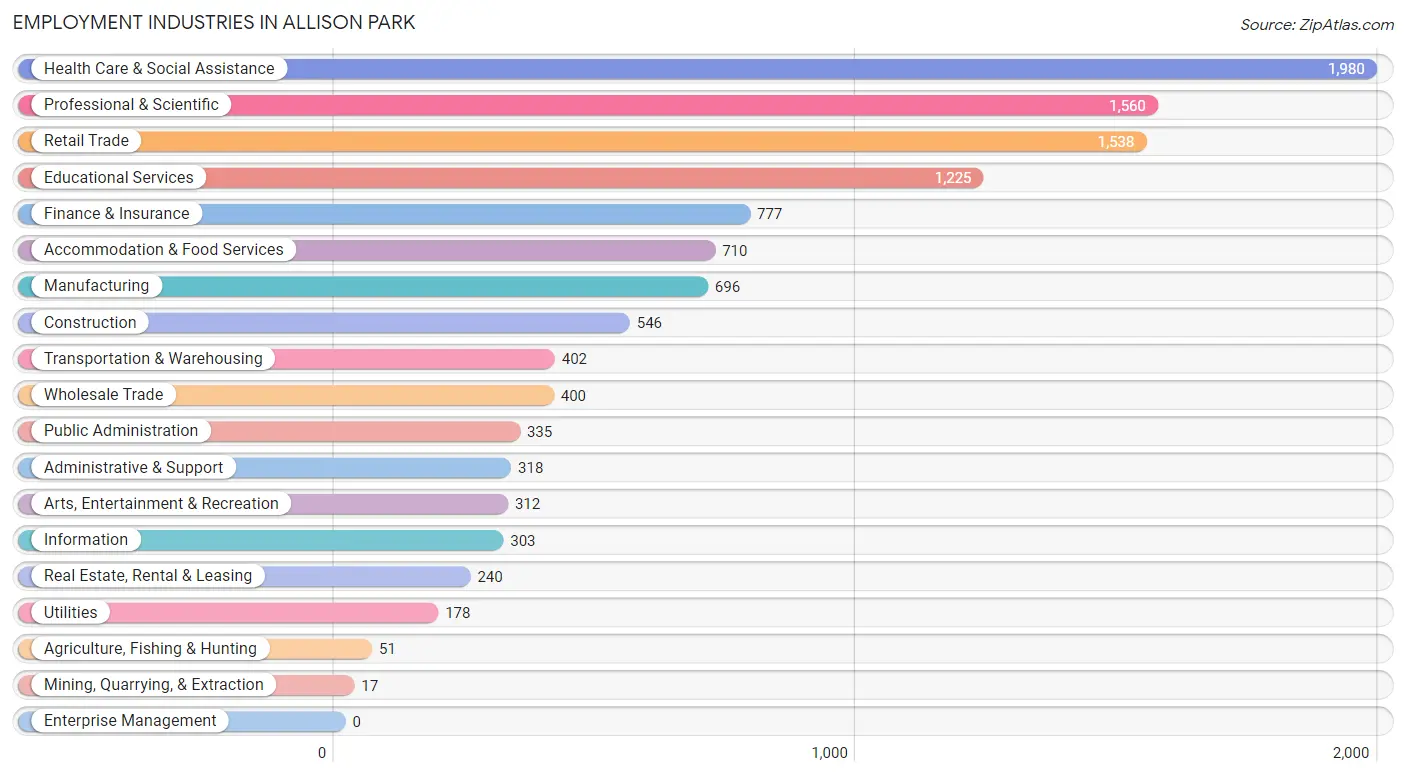
Employment Industries in Allison Park
The major employment industries in Allison Park include Health Care & Social Assistance (1,980 | 16.1%), Professional & Scientific (1,560 | 12.7%), Retail Trade (1,538 | 12.5%), Educational Services (1,225 | 10.0%), and Finance & Insurance (777 | 6.3%).
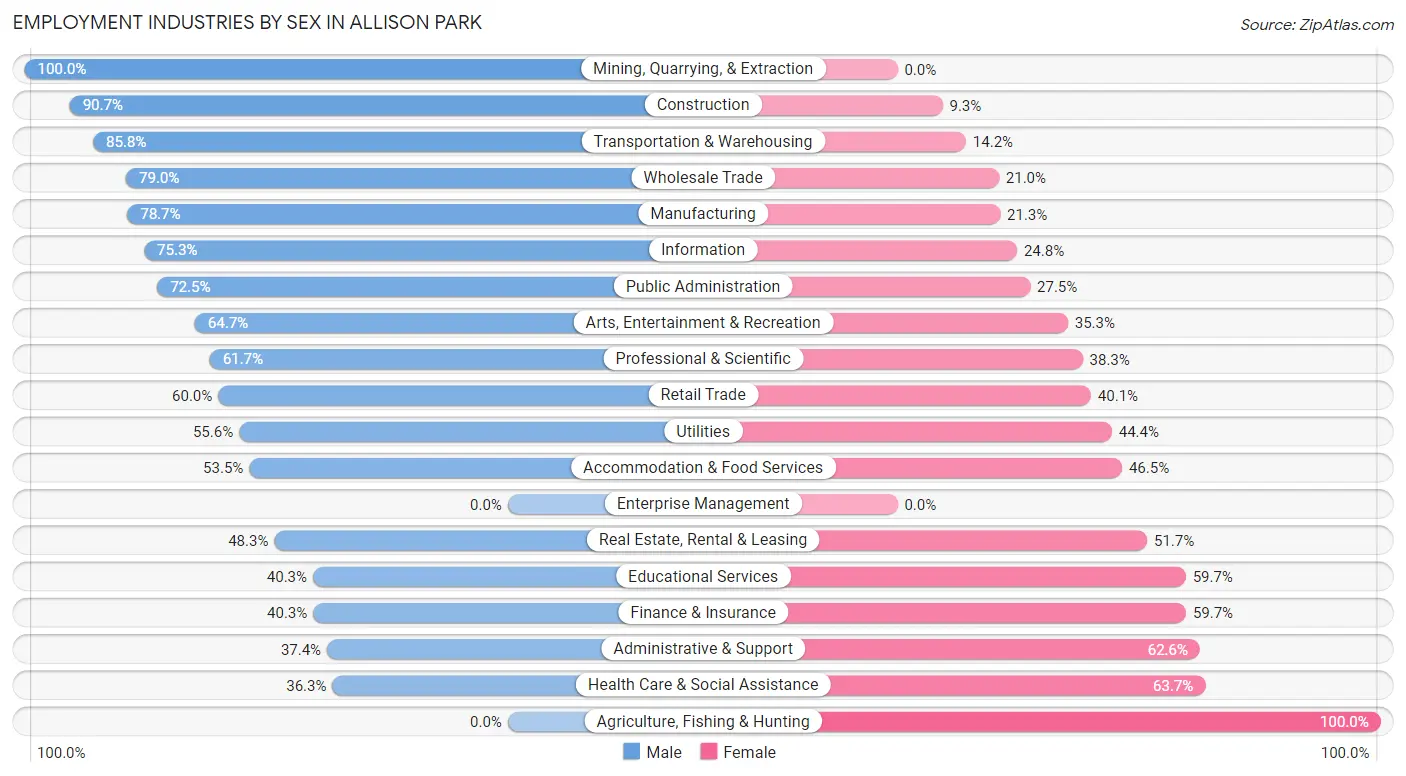
Employment Industries by Sex in Allison Park
The Allison Park industries that see more men than women are Mining, Quarrying, & Extraction (100.0%), Construction (90.7%), and Transportation & Warehousing (85.8%), whereas the industries that tend to have a higher number of women are Agriculture, Fishing & Hunting (100.0%), Health Care & Social Assistance (63.7%), and Administrative & Support (62.6%).
| Industry | Male | Female |
| Agriculture, Fishing & Hunting | 0 (0.0%) | 51 (100.0%) |
| Mining, Quarrying, & Extraction | 17 (100.0%) | 0 (0.0%) |
| Construction | 495 (90.7%) | 51 (9.3%) |
| Manufacturing | 548 (78.7%) | 148 (21.3%) |
| Wholesale Trade | 316 (79.0%) | 84 (21.0%) |
| Retail Trade | 922 (60.0%) | 616 (40.1%) |
| Transportation & Warehousing | 345 (85.8%) | 57 (14.2%) |
| Utilities | 99 (55.6%) | 79 (44.4%) |
| Information | 228 (75.2%) | 75 (24.7%) |
| Finance & Insurance | 313 (40.3%) | 464 (59.7%) |
| Real Estate, Rental & Leasing | 116 (48.3%) | 124 (51.7%) |
| Professional & Scientific | 962 (61.7%) | 598 (38.3%) |
| Enterprise Management | 0 (0.0%) | 0 (0.0%) |
| Administrative & Support | 119 (37.4%) | 199 (62.6%) |
| Educational Services | 494 (40.3%) | 731 (59.7%) |
| Health Care & Social Assistance | 719 (36.3%) | 1,261 (63.7%) |
| Arts, Entertainment & Recreation | 202 (64.7%) | 110 (35.3%) |
| Accommodation & Food Services | 380 (53.5%) | 330 (46.5%) |
| Public Administration | 243 (72.5%) | 92 (27.5%) |
| Total | 6,696 (54.6%) | 5,574 (45.4%) |
Education in Allison Park
School Enrollment in Allison Park
The most common levels of schooling among the 5,572 students in Allison Park are college / undergraduate (1,527 | 27.4%), high school (1,038 | 18.6%), and middle school (1,023 | 18.4%).
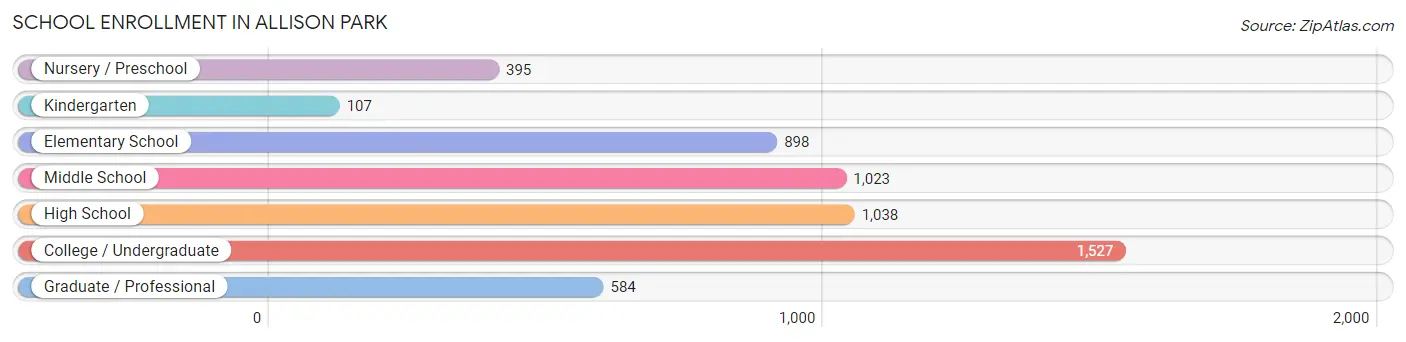
| School Level | # Students | % Students |
| Nursery / Preschool | 395 | 7.1% |
| Kindergarten | 107 | 1.9% |
| Elementary School | 898 | 16.1% |
| Middle School | 1,023 | 18.4% |
| High School | 1,038 | 18.6% |
| College / Undergraduate | 1,527 | 27.4% |
| Graduate / Professional | 584 | 10.5% |
| Total | 5,572 | 100.0% |
School Enrollment by Age by Funding Source in Allison Park
Out of a total of 5,572 students who are enrolled in schools in Allison Park, 1,387 (24.9%) attend a private institution, while the remaining 4,185 (75.1%) are enrolled in public schools. The age group of 35 years and over has the highest likelihood of being enrolled in private schools, with 225 (71.7% in the age bracket) enrolled. Conversely, the age group of 10 to 14 year olds has the lowest likelihood of being enrolled in a private school, with 1,258 (97.4% in the age bracket) attending a public institution.
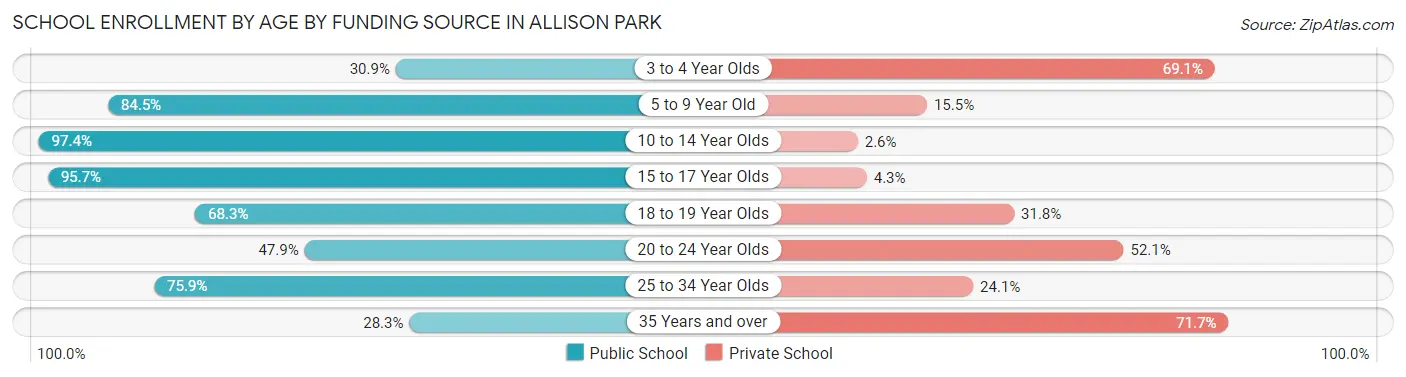
| Age Bracket | Public School | Private School |
| 3 to 4 Year Olds | 96 (30.9%) | 215 (69.1%) |
| 5 to 9 Year Old | 735 (84.5%) | 135 (15.5%) |
| 10 to 14 Year Olds | 1,258 (97.4%) | 34 (2.6%) |
| 15 to 17 Year Olds | 800 (95.7%) | 36 (4.3%) |
| 18 to 19 Year Olds | 402 (68.2%) | 187 (31.8%) |
| 20 to 24 Year Olds | 393 (47.9%) | 428 (52.1%) |
| 25 to 34 Year Olds | 409 (75.9%) | 130 (24.1%) |
| 35 Years and over | 89 (28.3%) | 225 (71.7%) |
| Total | 4,185 (75.1%) | 1,387 (24.9%) |
Educational Attainment by Field of Study in Allison Park
Business (1,846 | 17.8%), science & technology (1,416 | 13.7%), bio, nature & agricultural (974 | 9.4%), engineering (904 | 8.7%), and computers & mathematics (760 | 7.3%) are the most common fields of study among 10,347 individuals in Allison Park who have obtained a bachelor's degree or higher.
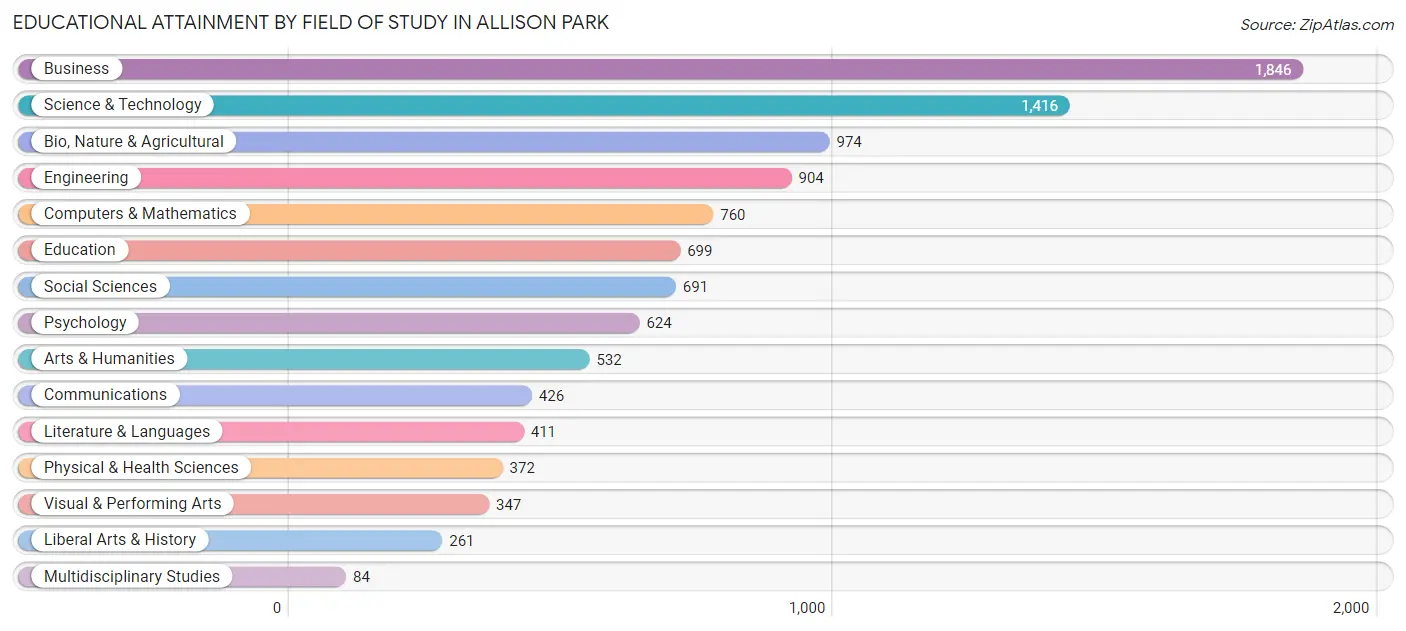
| Field of Study | # Graduates | % Graduates |
| Computers & Mathematics | 760 | 7.3% |
| Bio, Nature & Agricultural | 974 | 9.4% |
| Physical & Health Sciences | 372 | 3.6% |
| Psychology | 624 | 6.0% |
| Social Sciences | 691 | 6.7% |
| Engineering | 904 | 8.7% |
| Multidisciplinary Studies | 84 | 0.8% |
| Science & Technology | 1,416 | 13.7% |
| Business | 1,846 | 17.8% |
| Education | 699 | 6.8% |
| Literature & Languages | 411 | 4.0% |
| Liberal Arts & History | 261 | 2.5% |
| Visual & Performing Arts | 347 | 3.4% |
| Communications | 426 | 4.1% |
| Arts & Humanities | 532 | 5.1% |
| Total | 10,347 | 100.0% |
Transportation & Commute in Allison Park
Vehicle Availability by Sex in Allison Park
The most prevalent vehicle ownership categories in Allison Park are males with 2 vehicles (2,932, accounting for 44.8%) and females with 2 vehicles (2,148, making up 56.4%).
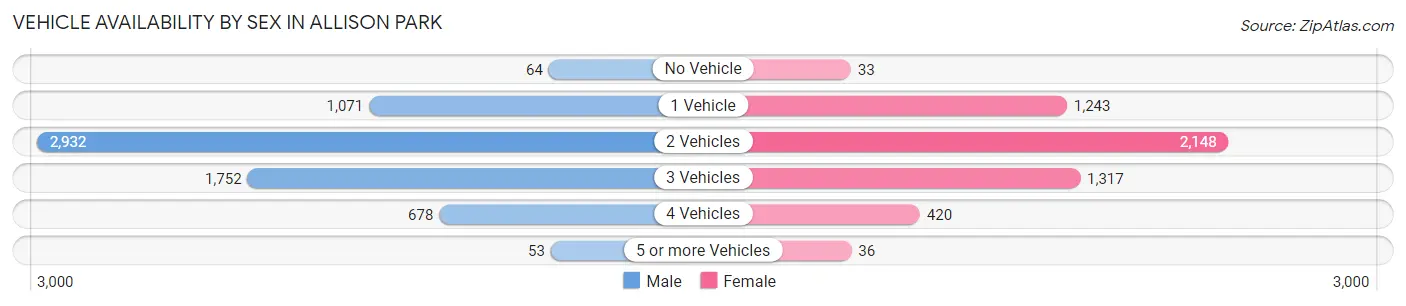
| Vehicles Available | Male | Female |
| No Vehicle | 64 (1.0%) | 33 (0.6%) |
| 1 Vehicle | 1,071 (16.4%) | 1,243 (23.9%) |
| 2 Vehicles | 2,932 (44.8%) | 2,148 (41.3%) |
| 3 Vehicles | 1,752 (26.8%) | 1,317 (25.3%) |
| 4 Vehicles | 678 (10.3%) | 420 (8.1%) |
| 5 or more Vehicles | 53 (0.8%) | 36 (0.7%) |
| Total | 6,550 (100.0%) | 5,197 (100.0%) |
Commute Time in Allison Park
The most frequently occuring commute durations in Allison Park are 30 to 34 minutes (1,763 commuters, 17.0%), 20 to 24 minutes (1,412 commuters, 13.6%), and 10 to 14 minutes (1,308 commuters, 12.6%).
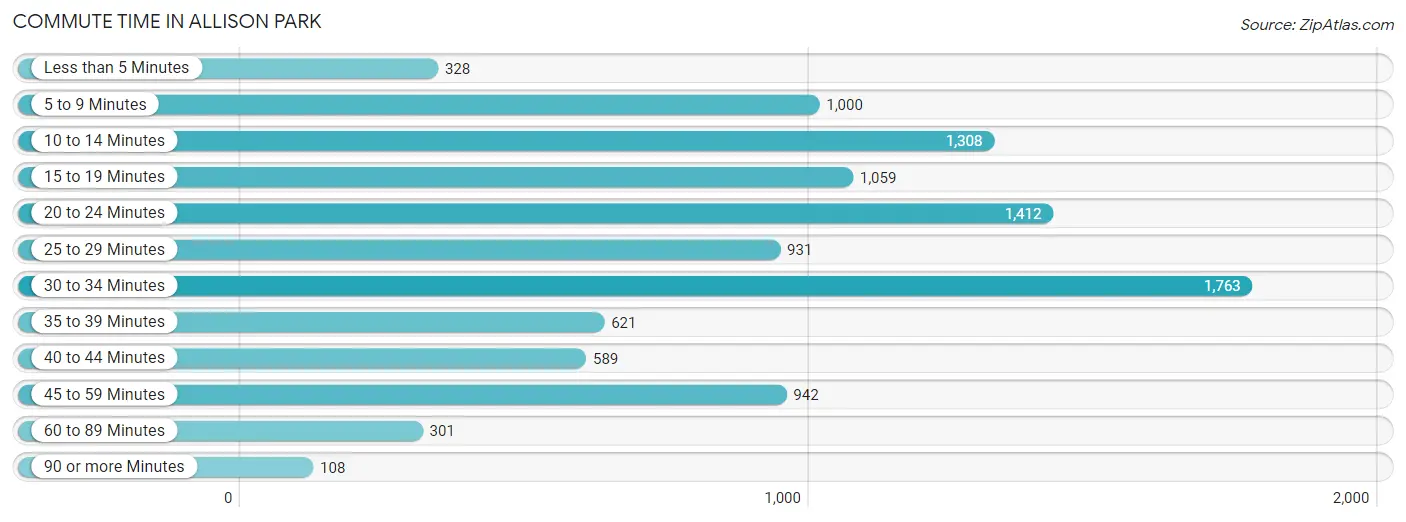
| Commute Time | # Commuters | % Commuters |
| Less than 5 Minutes | 328 | 3.2% |
| 5 to 9 Minutes | 1,000 | 9.7% |
| 10 to 14 Minutes | 1,308 | 12.6% |
| 15 to 19 Minutes | 1,059 | 10.2% |
| 20 to 24 Minutes | 1,412 | 13.6% |
| 25 to 29 Minutes | 931 | 9.0% |
| 30 to 34 Minutes | 1,763 | 17.0% |
| 35 to 39 Minutes | 621 | 6.0% |
| 40 to 44 Minutes | 589 | 5.7% |
| 45 to 59 Minutes | 942 | 9.1% |
| 60 to 89 Minutes | 301 | 2.9% |
| 90 or more Minutes | 108 | 1.0% |
Commute Time by Sex in Allison Park
The most common commute times in Allison Park are 30 to 34 minutes (965 commuters, 16.8%) for males and 30 to 34 minutes (798 commuters, 17.3%) for females.
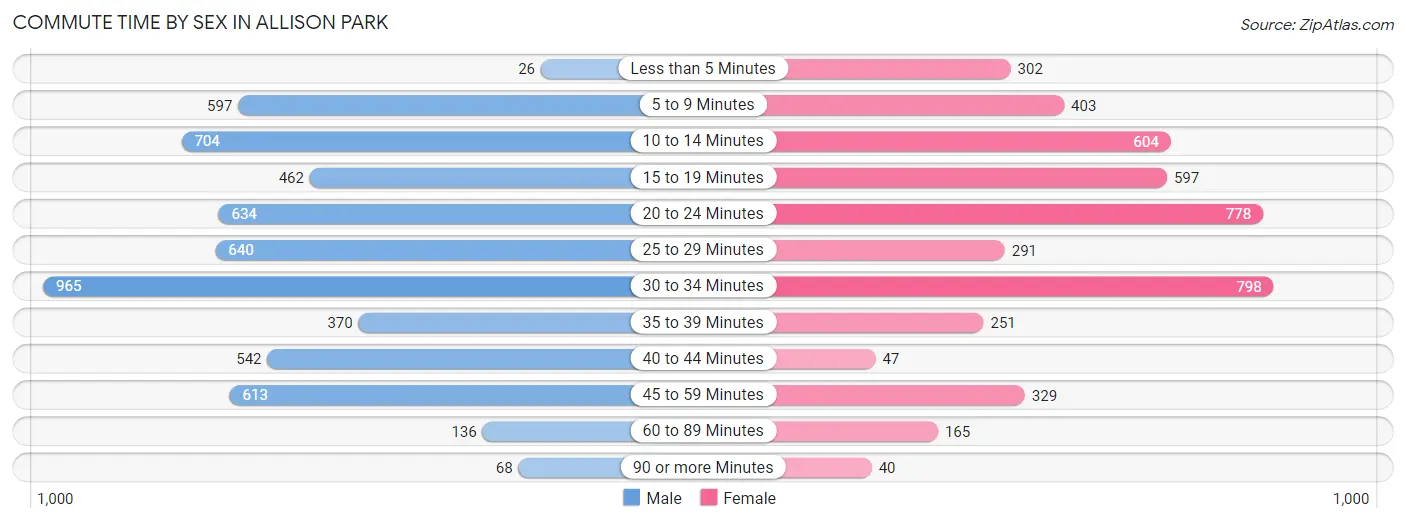
| Commute Time | Male | Female |
| Less than 5 Minutes | 26 (0.4%) | 302 (6.6%) |
| 5 to 9 Minutes | 597 (10.4%) | 403 (8.7%) |
| 10 to 14 Minutes | 704 (12.2%) | 604 (13.1%) |
| 15 to 19 Minutes | 462 (8.0%) | 597 (13.0%) |
| 20 to 24 Minutes | 634 (11.0%) | 778 (16.9%) |
| 25 to 29 Minutes | 640 (11.1%) | 291 (6.3%) |
| 30 to 34 Minutes | 965 (16.8%) | 798 (17.3%) |
| 35 to 39 Minutes | 370 (6.4%) | 251 (5.4%) |
| 40 to 44 Minutes | 542 (9.4%) | 47 (1.0%) |
| 45 to 59 Minutes | 613 (10.6%) | 329 (7.1%) |
| 60 to 89 Minutes | 136 (2.4%) | 165 (3.6%) |
| 90 or more Minutes | 68 (1.2%) | 40 (0.9%) |
Time of Departure to Work by Sex in Allison Park
The most frequent times of departure to work in Allison Park are 7:30 AM to 7:59 AM (946, 16.4%) for males and 7:00 AM to 7:29 AM (626, 13.6%) for females.
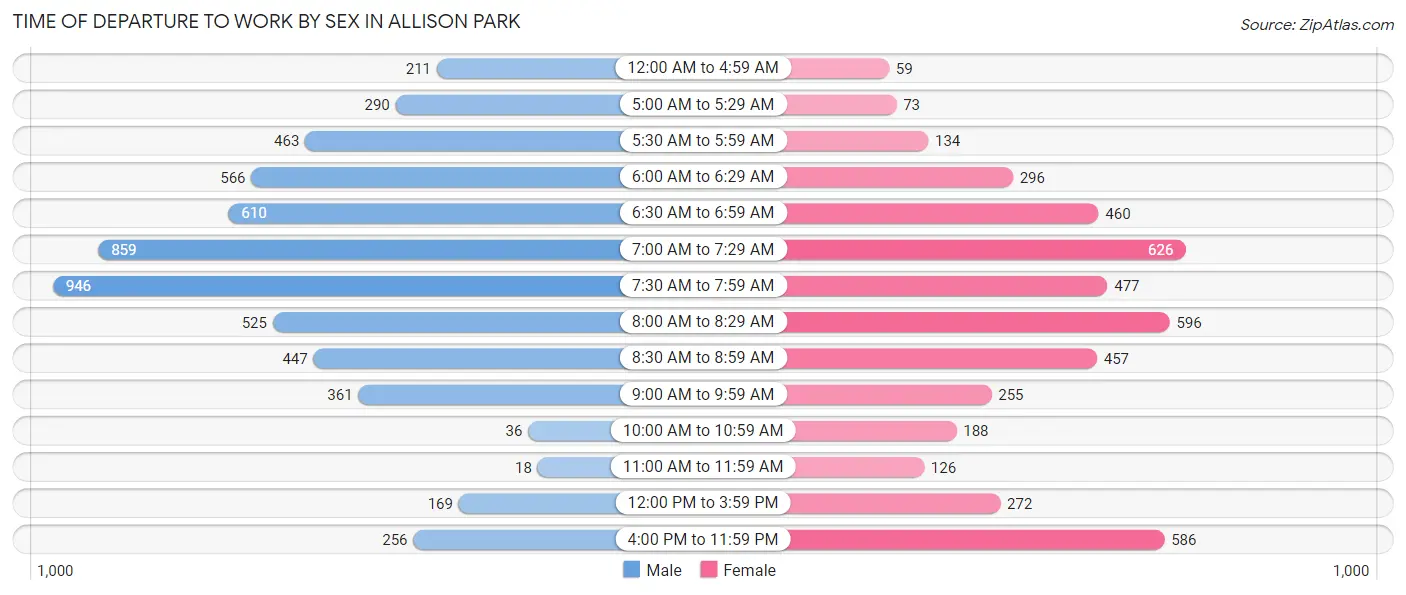
| Time of Departure | Male | Female |
| 12:00 AM to 4:59 AM | 211 (3.7%) | 59 (1.3%) |
| 5:00 AM to 5:29 AM | 290 (5.0%) | 73 (1.6%) |
| 5:30 AM to 5:59 AM | 463 (8.0%) | 134 (2.9%) |
| 6:00 AM to 6:29 AM | 566 (9.8%) | 296 (6.4%) |
| 6:30 AM to 6:59 AM | 610 (10.6%) | 460 (10.0%) |
| 7:00 AM to 7:29 AM | 859 (14.9%) | 626 (13.6%) |
| 7:30 AM to 7:59 AM | 946 (16.4%) | 477 (10.4%) |
| 8:00 AM to 8:29 AM | 525 (9.1%) | 596 (12.9%) |
| 8:30 AM to 8:59 AM | 447 (7.8%) | 457 (9.9%) |
| 9:00 AM to 9:59 AM | 361 (6.3%) | 255 (5.5%) |
| 10:00 AM to 10:59 AM | 36 (0.6%) | 188 (4.1%) |
| 11:00 AM to 11:59 AM | 18 (0.3%) | 126 (2.7%) |
| 12:00 PM to 3:59 PM | 169 (2.9%) | 272 (5.9%) |
| 4:00 PM to 11:59 PM | 256 (4.4%) | 586 (12.7%) |
| Total | 5,757 (100.0%) | 4,605 (100.0%) |
Housing Occupancy in Allison Park
Occupancy by Ownership in Allison Park
Of the total 9,086 dwellings in Allison Park, owner-occupied units account for 6,716 (73.9%), while renter-occupied units make up 2,370 (26.1%).
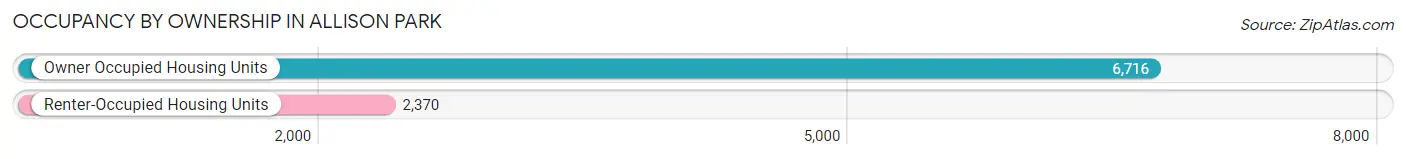
| Occupancy | # Housing Units | % Housing Units |
| Owner Occupied Housing Units | 6,716 | 73.9% |
| Renter-Occupied Housing Units | 2,370 | 26.1% |
| Total Occupied Housing Units | 9,086 | 100.0% |
Occupancy by Household Size in Allison Park
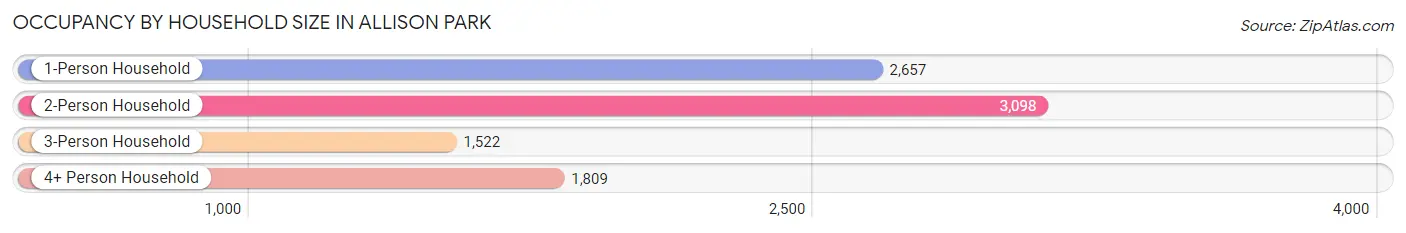
| Household Size | # Housing Units | % Housing Units |
| 1-Person Household | 2,657 | 29.2% |
| 2-Person Household | 3,098 | 34.1% |
| 3-Person Household | 1,522 | 16.8% |
| 4+ Person Household | 1,809 | 19.9% |
| Total Housing Units | 9,086 | 100.0% |
Occupancy by Ownership by Household Size in Allison Park
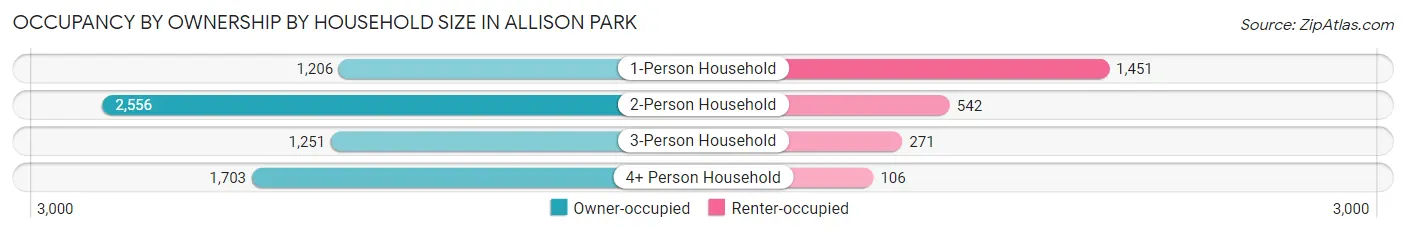
| Household Size | Owner-occupied | Renter-occupied |
| 1-Person Household | 1,206 (45.4%) | 1,451 (54.6%) |
| 2-Person Household | 2,556 (82.5%) | 542 (17.5%) |
| 3-Person Household | 1,251 (82.2%) | 271 (17.8%) |
| 4+ Person Household | 1,703 (94.1%) | 106 (5.9%) |
| Total Housing Units | 6,716 (73.9%) | 2,370 (26.1%) |
Occupancy by Educational Attainment in Allison Park
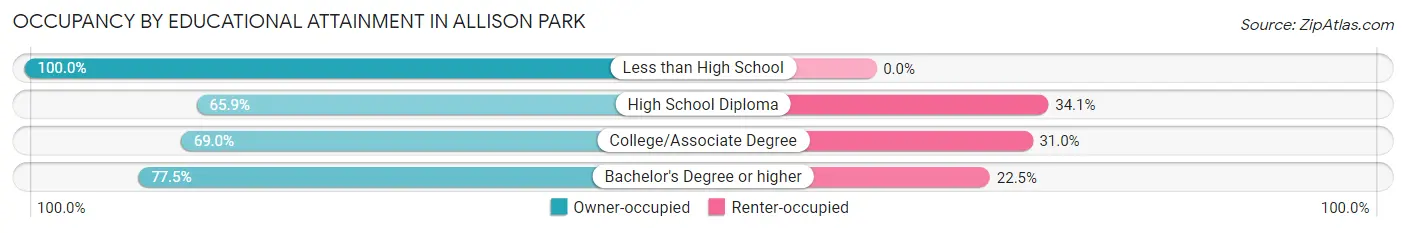
| Household Size | Owner-occupied | Renter-occupied |
| Less than High School | 63 (100.0%) | 0 (0.0%) |
| High School Diploma | 950 (65.9%) | 492 (34.1%) |
| College/Associate Degree | 1,381 (69.0%) | 620 (31.0%) |
| Bachelor's Degree or higher | 4,322 (77.5%) | 1,258 (22.5%) |
Occupancy by Age of Householder in Allison Park
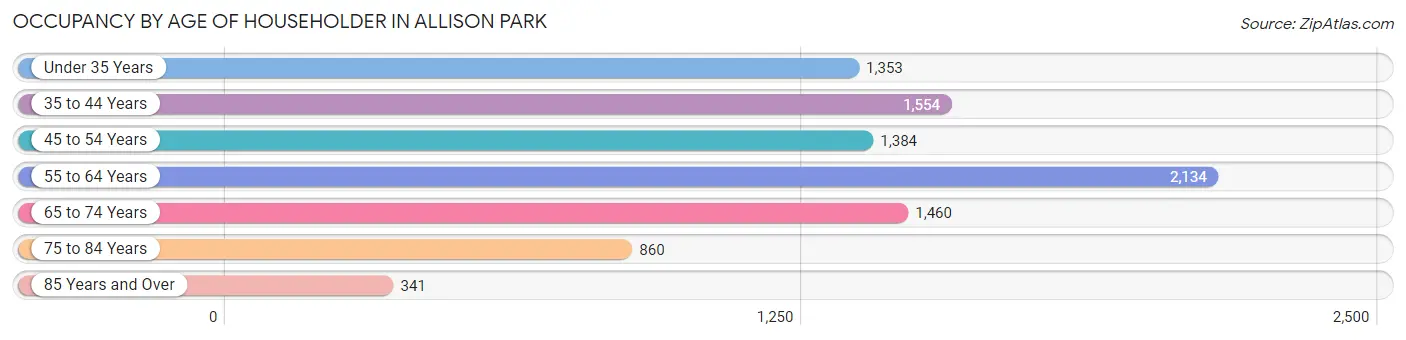
| Age Bracket | # Households | % Households |
| Under 35 Years | 1,353 | 14.9% |
| 35 to 44 Years | 1,554 | 17.1% |
| 45 to 54 Years | 1,384 | 15.2% |
| 55 to 64 Years | 2,134 | 23.5% |
| 65 to 74 Years | 1,460 | 16.1% |
| 75 to 84 Years | 860 | 9.5% |
| 85 Years and Over | 341 | 3.7% |
| Total | 9,086 | 100.0% |
Housing Finances in Allison Park
Median Income by Occupancy in Allison Park
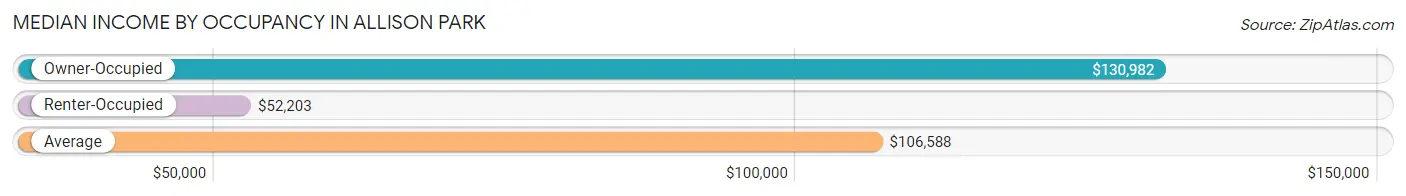
| Occupancy Type | # Households | Median Income |
| Owner-Occupied | 6,716 (73.9%) | $130,982 |
| Renter-Occupied | 2,370 (26.1%) | $52,203 |
| Average | 9,086 (100.0%) | $106,588 |
Occupancy by Householder Income Bracket in Allison Park
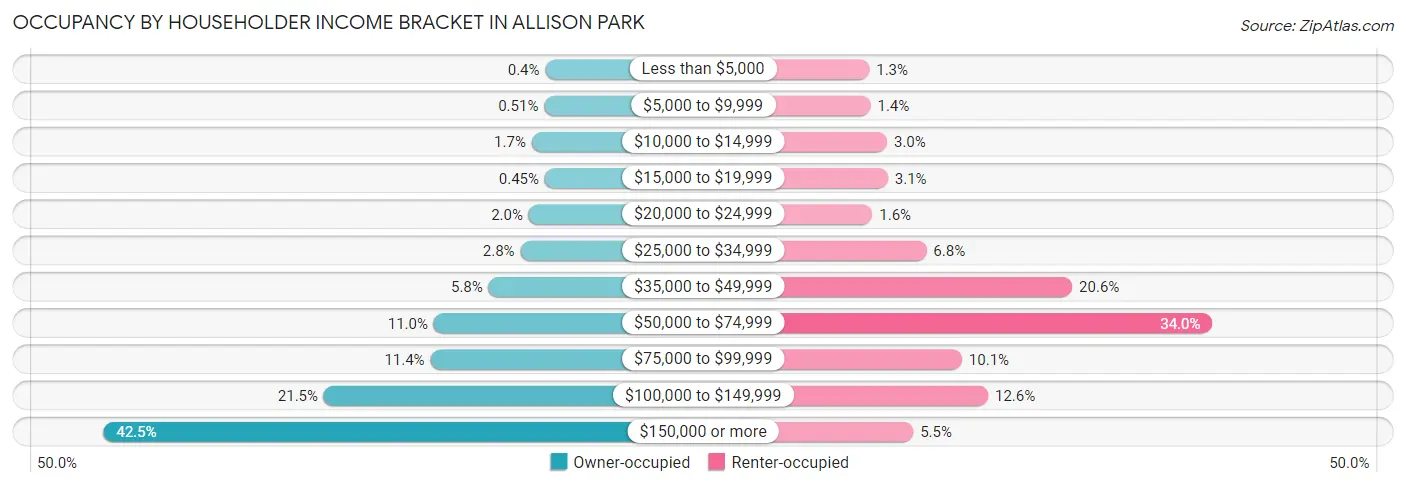
| Income Bracket | Owner-occupied | Renter-occupied |
| Less than $5,000 | 27 (0.4%) | 31 (1.3%) |
| $5,000 to $9,999 | 34 (0.5%) | 34 (1.4%) |
| $10,000 to $14,999 | 114 (1.7%) | 71 (3.0%) |
| $15,000 to $19,999 | 30 (0.4%) | 73 (3.1%) |
| $20,000 to $24,999 | 133 (2.0%) | 38 (1.6%) |
| $25,000 to $34,999 | 187 (2.8%) | 160 (6.8%) |
| $35,000 to $49,999 | 390 (5.8%) | 489 (20.6%) |
| $50,000 to $74,999 | 741 (11.0%) | 805 (34.0%) |
| $75,000 to $99,999 | 762 (11.4%) | 240 (10.1%) |
| $100,000 to $149,999 | 1,444 (21.5%) | 299 (12.6%) |
| $150,000 or more | 2,854 (42.5%) | 130 (5.5%) |
| Total | 6,716 (100.0%) | 2,370 (100.0%) |
Monthly Housing Cost Tiers in Allison Park
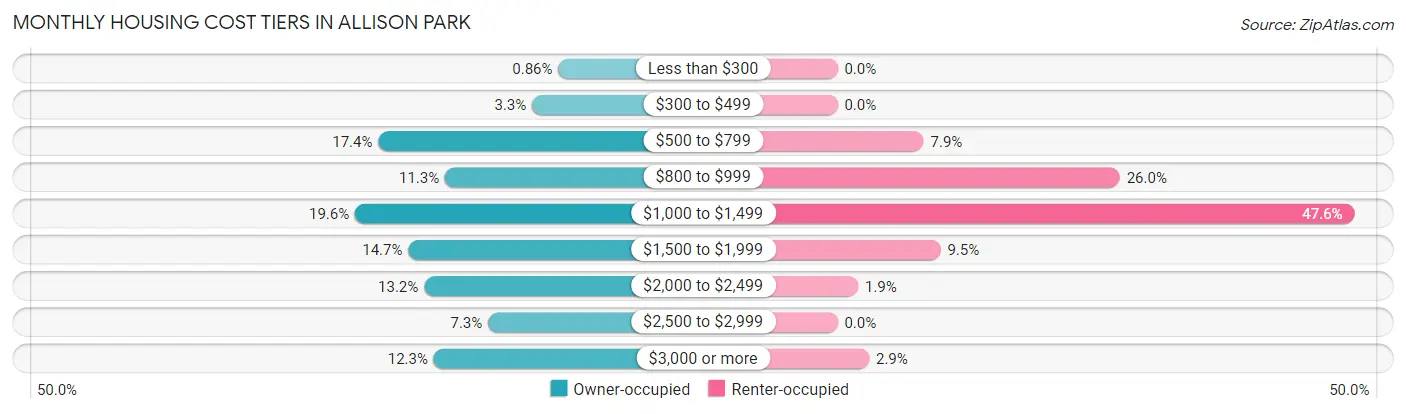
| Monthly Cost | Owner-occupied | Renter-occupied |
| Less than $300 | 58 (0.9%) | 0 (0.0%) |
| $300 to $499 | 220 (3.3%) | 0 (0.0%) |
| $500 to $799 | 1,171 (17.4%) | 188 (7.9%) |
| $800 to $999 | 758 (11.3%) | 616 (26.0%) |
| $1,000 to $1,499 | 1,315 (19.6%) | 1,128 (47.6%) |
| $1,500 to $1,999 | 986 (14.7%) | 225 (9.5%) |
| $2,000 to $2,499 | 888 (13.2%) | 45 (1.9%) |
| $2,500 to $2,999 | 492 (7.3%) | 0 (0.0%) |
| $3,000 or more | 828 (12.3%) | 69 (2.9%) |
| Total | 6,716 (100.0%) | 2,370 (100.0%) |
Physical Housing Characteristics in Allison Park
Housing Structures in Allison Park
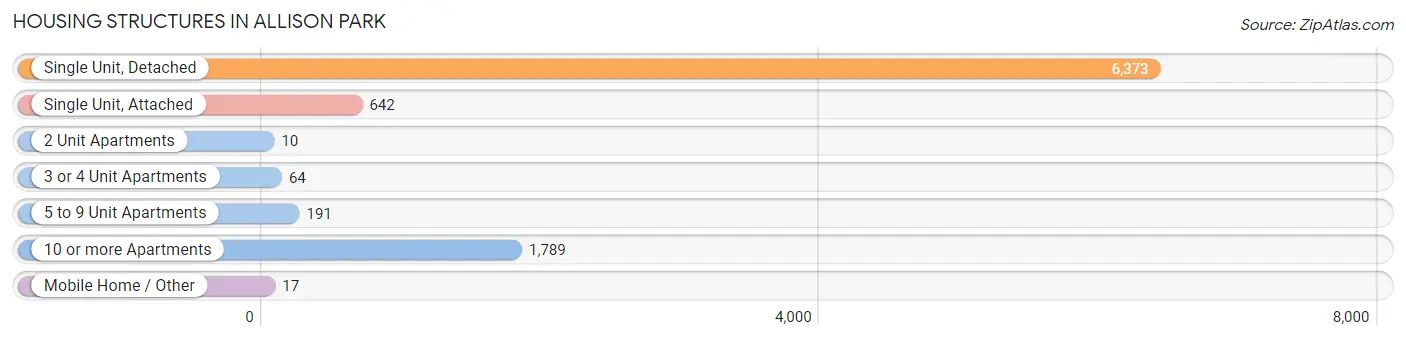
| Structure Type | # Housing Units | % Housing Units |
| Single Unit, Detached | 6,373 | 70.1% |
| Single Unit, Attached | 642 | 7.1% |
| 2 Unit Apartments | 10 | 0.1% |
| 3 or 4 Unit Apartments | 64 | 0.7% |
| 5 to 9 Unit Apartments | 191 | 2.1% |
| 10 or more Apartments | 1,789 | 19.7% |
| Mobile Home / Other | 17 | 0.2% |
| Total | 9,086 | 100.0% |
Housing Structures by Occupancy in Allison Park
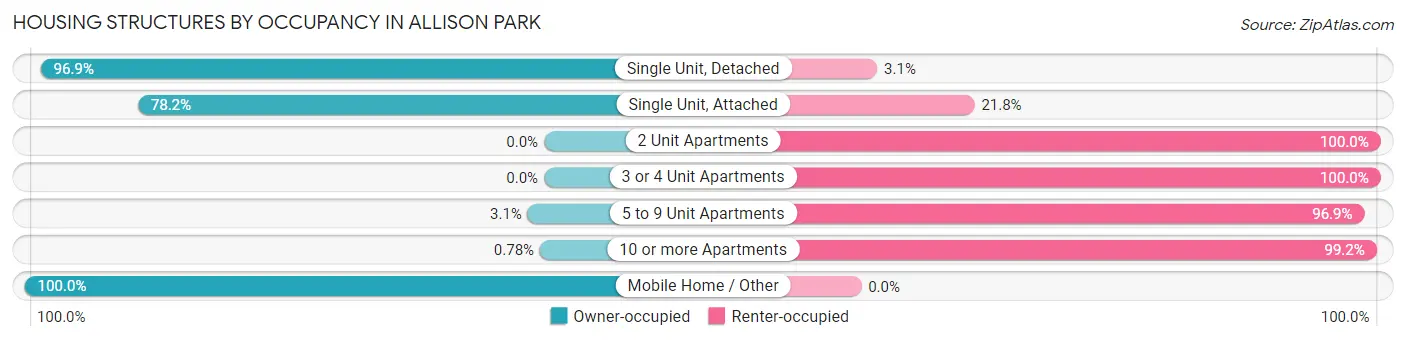
| Structure Type | Owner-occupied | Renter-occupied |
| Single Unit, Detached | 6,177 (96.9%) | 196 (3.1%) |
| Single Unit, Attached | 502 (78.2%) | 140 (21.8%) |
| 2 Unit Apartments | 0 (0.0%) | 10 (100.0%) |
| 3 or 4 Unit Apartments | 0 (0.0%) | 64 (100.0%) |
| 5 to 9 Unit Apartments | 6 (3.1%) | 185 (96.9%) |
| 10 or more Apartments | 14 (0.8%) | 1,775 (99.2%) |
| Mobile Home / Other | 17 (100.0%) | 0 (0.0%) |
| Total | 6,716 (73.9%) | 2,370 (26.1%) |
Housing Structures by Number of Rooms in Allison Park
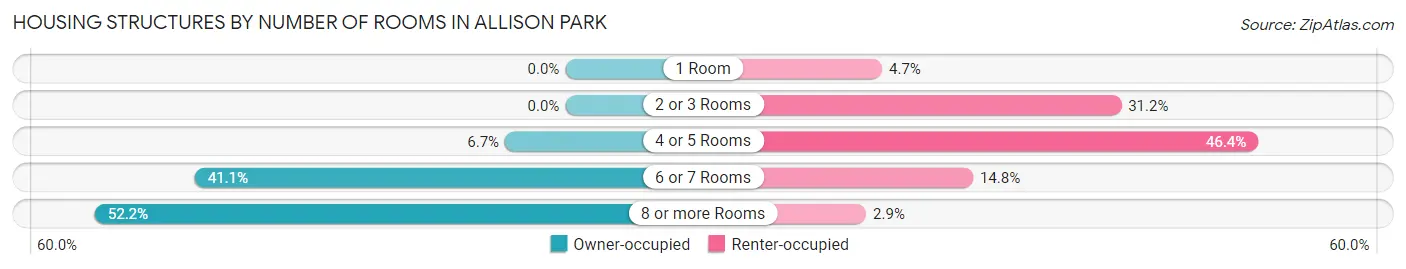
| Number of Rooms | Owner-occupied | Renter-occupied |
| 1 Room | 0 (0.0%) | 111 (4.7%) |
| 2 or 3 Rooms | 0 (0.0%) | 740 (31.2%) |
| 4 or 5 Rooms | 449 (6.7%) | 1,100 (46.4%) |
| 6 or 7 Rooms | 2,761 (41.1%) | 350 (14.8%) |
| 8 or more Rooms | 3,506 (52.2%) | 69 (2.9%) |
| Total | 6,716 (100.0%) | 2,370 (100.0%) |
Housing Structure by Heating Type in Allison Park
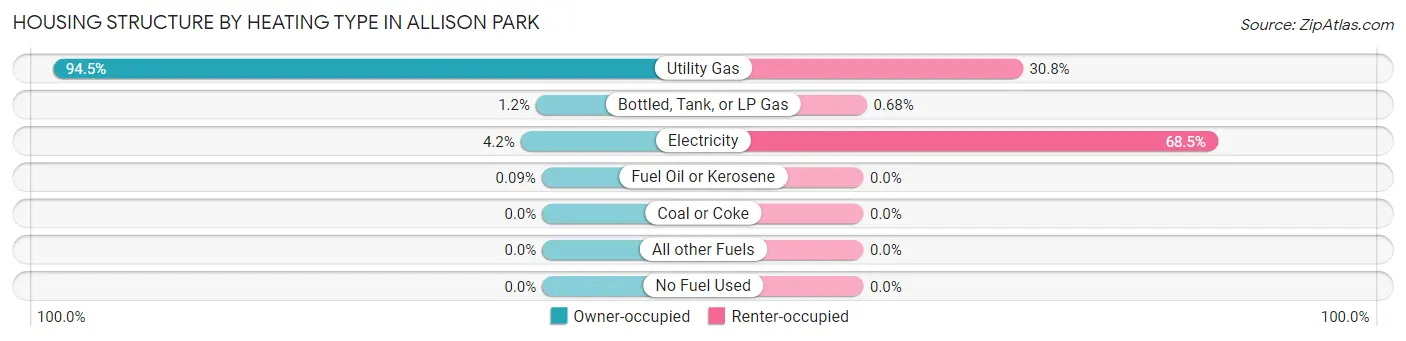
| Heating Type | Owner-occupied | Renter-occupied |
| Utility Gas | 6,348 (94.5%) | 730 (30.8%) |
| Bottled, Tank, or LP Gas | 82 (1.2%) | 16 (0.7%) |
| Electricity | 280 (4.2%) | 1,624 (68.5%) |
| Fuel Oil or Kerosene | 6 (0.1%) | 0 (0.0%) |
| Coal or Coke | 0 (0.0%) | 0 (0.0%) |
| All other Fuels | 0 (0.0%) | 0 (0.0%) |
| No Fuel Used | 0 (0.0%) | 0 (0.0%) |
| Total | 6,716 (100.0%) | 2,370 (100.0%) |
Household Vehicle Usage in Allison Park
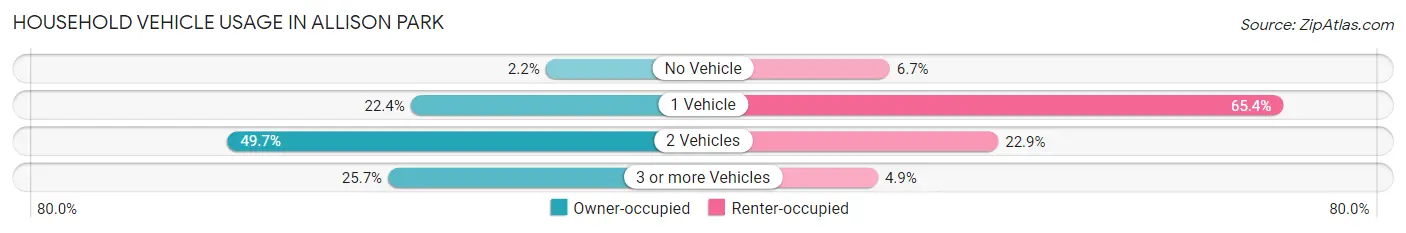
| Vehicles per Household | Owner-occupied | Renter-occupied |
| No Vehicle | 148 (2.2%) | 159 (6.7%) |
| 1 Vehicle | 1,502 (22.4%) | 1,551 (65.4%) |
| 2 Vehicles | 3,337 (49.7%) | 543 (22.9%) |
| 3 or more Vehicles | 1,729 (25.7%) | 117 (4.9%) |
| Total | 6,716 (100.0%) | 2,370 (100.0%) |
Real Estate & Mortgages in Allison Park
Real Estate and Mortgage Overview in Allison Park
| Characteristic | Without Mortgage | With Mortgage |
| Housing Units | 2,643 | 4,073 |
| Median Property Value | $296,100 | $317,400 |
| Median Household Income | $98,472 | $2,149 |
| Monthly Housing Costs | $828 | $817 |
| Real Estate Taxes | $5,181 | $50 |
Property Value by Mortgage Status in Allison Park
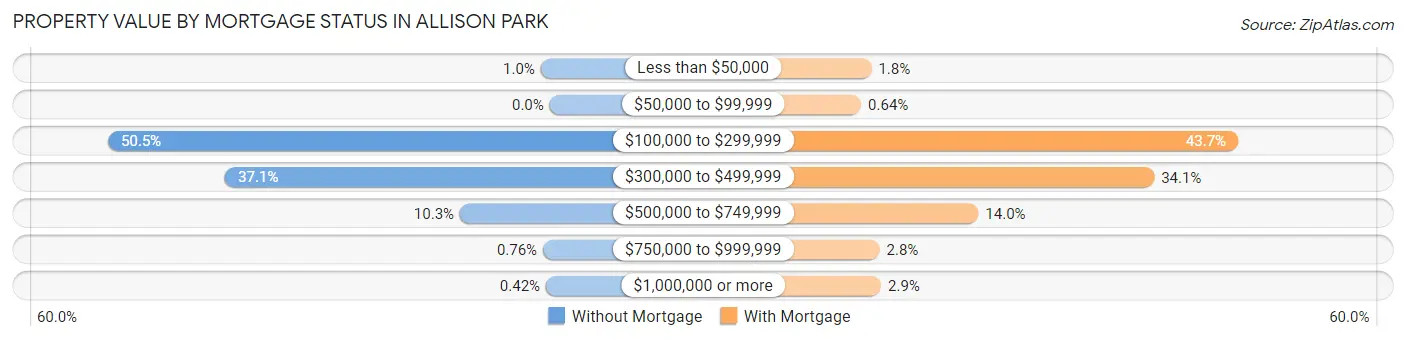
| Property Value | Without Mortgage | With Mortgage |
| Less than $50,000 | 27 (1.0%) | 74 (1.8%) |
| $50,000 to $99,999 | 0 (0.0%) | 26 (0.6%) |
| $100,000 to $299,999 | 1,334 (50.5%) | 1,780 (43.7%) |
| $300,000 to $499,999 | 980 (37.1%) | 1,390 (34.1%) |
| $500,000 to $749,999 | 271 (10.2%) | 572 (14.0%) |
| $750,000 to $999,999 | 20 (0.8%) | 112 (2.8%) |
| $1,000,000 or more | 11 (0.4%) | 119 (2.9%) |
| Total | 2,643 (100.0%) | 4,073 (100.0%) |
Household Income by Mortgage Status in Allison Park
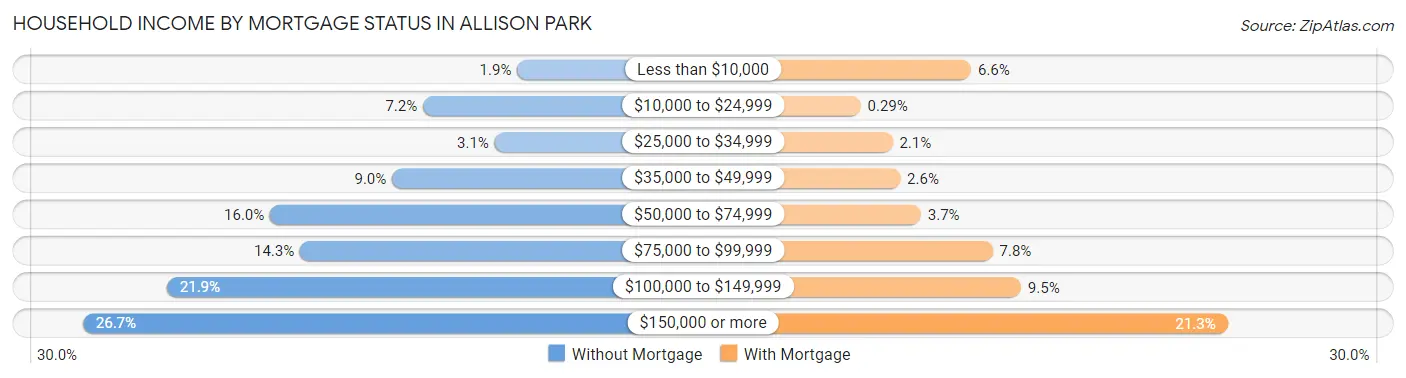
| Household Income | Without Mortgage | With Mortgage |
| Less than $10,000 | 49 (1.8%) | 269 (6.6%) |
| $10,000 to $24,999 | 191 (7.2%) | 12 (0.3%) |
| $25,000 to $34,999 | 83 (3.1%) | 86 (2.1%) |
| $35,000 to $49,999 | 238 (9.0%) | 104 (2.5%) |
| $50,000 to $74,999 | 422 (16.0%) | 152 (3.7%) |
| $75,000 to $99,999 | 377 (14.3%) | 319 (7.8%) |
| $100,000 to $149,999 | 578 (21.9%) | 385 (9.5%) |
| $150,000 or more | 705 (26.7%) | 866 (21.3%) |
| Total | 2,643 (100.0%) | 4,073 (100.0%) |
Property Value to Household Income Ratio in Allison Park
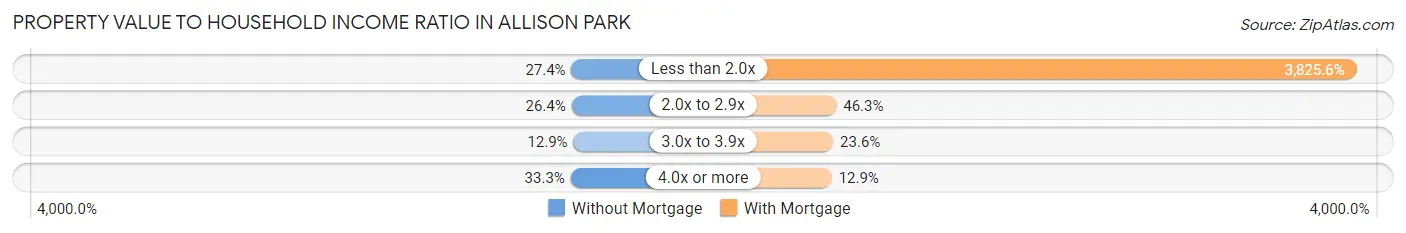
| Value-to-Income Ratio | Without Mortgage | With Mortgage |
| Less than 2.0x | 724 (27.4%) | 155,817 (3,825.6%) |
| 2.0x to 2.9x | 697 (26.4%) | 1,885 (46.3%) |
| 3.0x to 3.9x | 342 (12.9%) | 962 (23.6%) |
| 4.0x or more | 880 (33.3%) | 526 (12.9%) |
| Total | 2,643 (100.0%) | 4,073 (100.0%) |
Real Estate Taxes by Mortgage Status in Allison Park
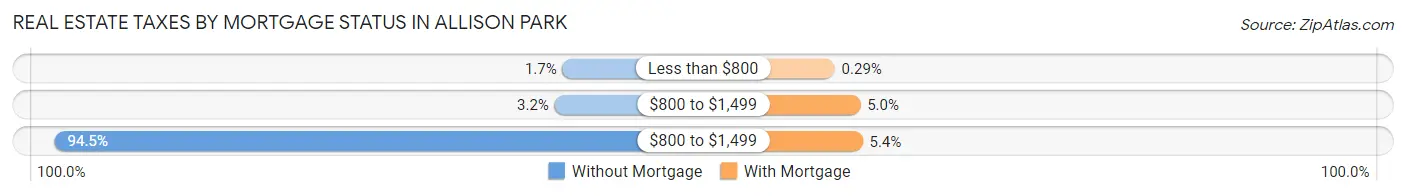
| Property Taxes | Without Mortgage | With Mortgage |
| Less than $800 | 46 (1.7%) | 12 (0.3%) |
| $800 to $1,499 | 84 (3.2%) | 202 (5.0%) |
| $800 to $1,499 | 2,498 (94.5%) | 219 (5.4%) |
| Total | 2,643 (100.0%) | 4,073 (100.0%) |
Health & Disability in Allison Park
Health Insurance Coverage by Age in Allison Park
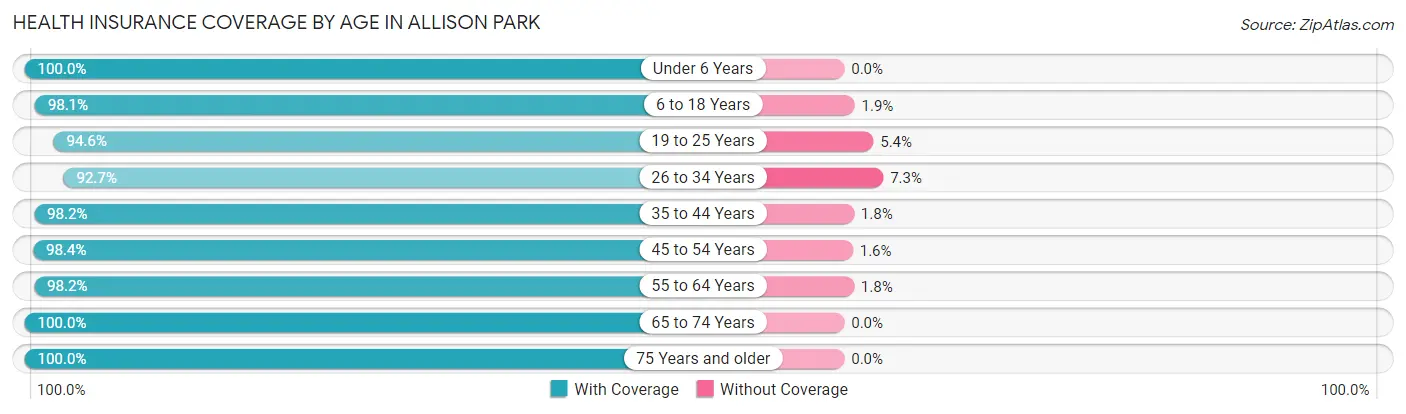
| Age Bracket | With Coverage | Without Coverage |
| Under 6 Years | 1,545 (100.0%) | 0 (0.0%) |
| 6 to 18 Years | 3,220 (98.1%) | 63 (1.9%) |
| 19 to 25 Years | 1,785 (94.6%) | 102 (5.4%) |
| 26 to 34 Years | 2,325 (92.7%) | 182 (7.3%) |
| 35 to 44 Years | 2,741 (98.2%) | 50 (1.8%) |
| 45 to 54 Years | 2,740 (98.4%) | 44 (1.6%) |
| 55 to 64 Years | 3,397 (98.2%) | 62 (1.8%) |
| 65 to 74 Years | 2,623 (100.0%) | 0 (0.0%) |
| 75 Years and older | 1,794 (100.0%) | 0 (0.0%) |
| Total | 22,170 (97.8%) | 503 (2.2%) |
Health Insurance Coverage by Citizenship Status in Allison Park
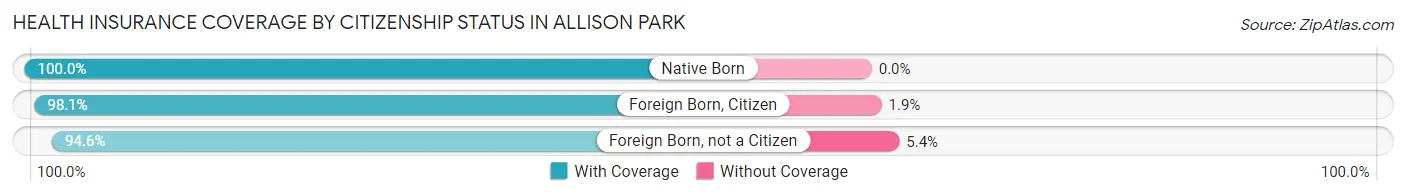
| Citizenship Status | With Coverage | Without Coverage |
| Native Born | 1,545 (100.0%) | 0 (0.0%) |
| Foreign Born, Citizen | 3,220 (98.1%) | 63 (1.9%) |
| Foreign Born, not a Citizen | 1,785 (94.6%) | 102 (5.4%) |
Health Insurance Coverage by Household Income in Allison Park
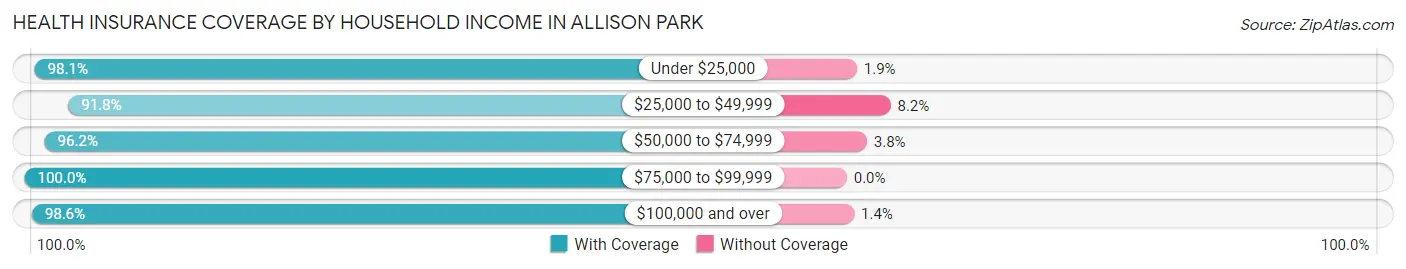
| Household Income | With Coverage | Without Coverage |
| Under $25,000 | 725 (98.1%) | 14 (1.9%) |
| $25,000 to $49,999 | 1,985 (91.8%) | 177 (8.2%) |
| $50,000 to $74,999 | 2,508 (96.2%) | 98 (3.8%) |
| $75,000 to $99,999 | 2,234 (100.0%) | 0 (0.0%) |
| $100,000 and over | 14,121 (98.6%) | 196 (1.4%) |
Public vs Private Health Insurance Coverage by Age in Allison Park
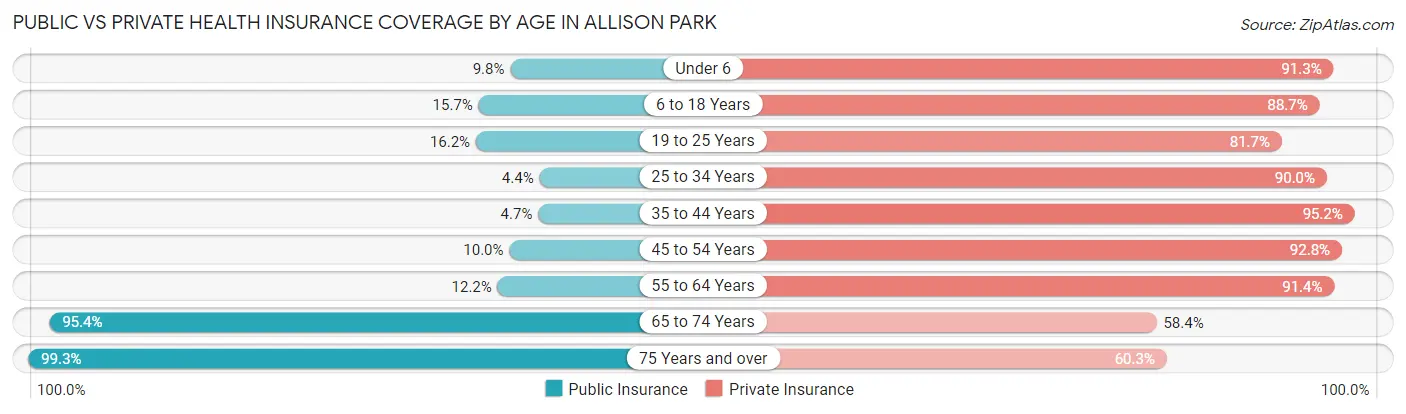
| Age Bracket | Public Insurance | Private Insurance |
| Under 6 | 152 (9.8%) | 1,410 (91.3%) |
| 6 to 18 Years | 516 (15.7%) | 2,911 (88.7%) |
| 19 to 25 Years | 306 (16.2%) | 1,541 (81.7%) |
| 25 to 34 Years | 111 (4.4%) | 2,257 (90.0%) |
| 35 to 44 Years | 130 (4.7%) | 2,657 (95.2%) |
| 45 to 54 Years | 279 (10.0%) | 2,584 (92.8%) |
| 55 to 64 Years | 422 (12.2%) | 3,162 (91.4%) |
| 65 to 74 Years | 2,503 (95.4%) | 1,532 (58.4%) |
| 75 Years and over | 1,782 (99.3%) | 1,082 (60.3%) |
| Total | 6,201 (27.4%) | 19,136 (84.4%) |
Disability Status by Sex by Age in Allison Park
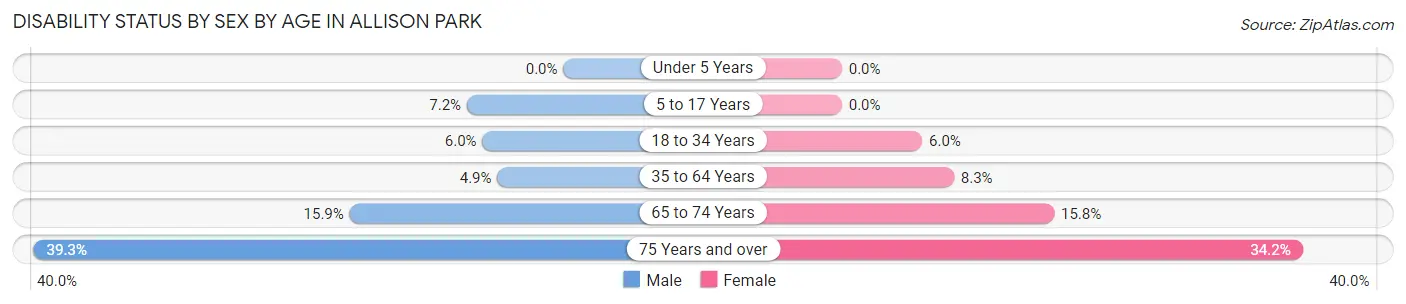
| Age Bracket | Male | Female |
| Under 5 Years | 0 (0.0%) | 0 (0.0%) |
| 5 to 17 Years | 121 (7.2%) | 0 (0.0%) |
| 18 to 34 Years | 138 (6.0%) | 145 (6.0%) |
| 35 to 64 Years | 219 (4.9%) | 380 (8.3%) |
| 65 to 74 Years | 220 (15.9%) | 195 (15.8%) |
| 75 Years and over | 280 (39.3%) | 370 (34.2%) |
Disability Class by Sex by Age in Allison Park
Disability Class: Hearing Difficulty
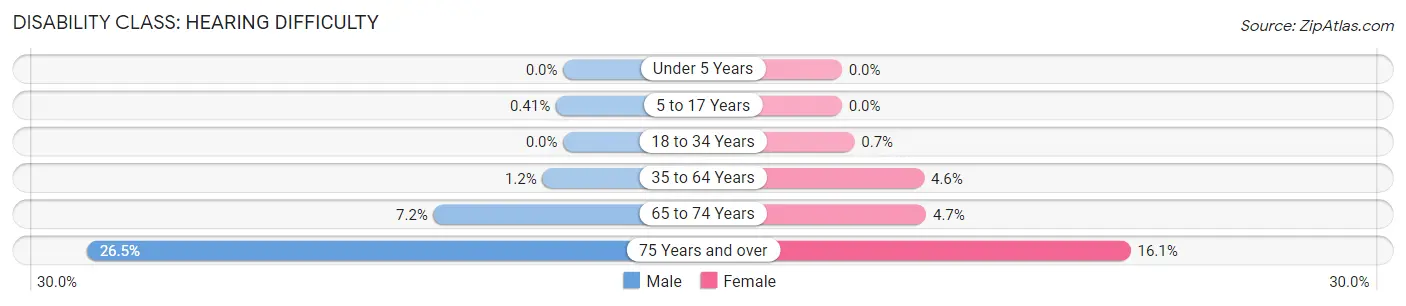
| Age Bracket | Male | Female |
| Under 5 Years | 0 (0.0%) | 0 (0.0%) |
| 5 to 17 Years | 7 (0.4%) | 0 (0.0%) |
| 18 to 34 Years | 0 (0.0%) | 17 (0.7%) |
| 35 to 64 Years | 52 (1.2%) | 209 (4.6%) |
| 65 to 74 Years | 100 (7.2%) | 58 (4.7%) |
| 75 Years and over | 189 (26.5%) | 174 (16.1%) |
Disability Class: Vision Difficulty
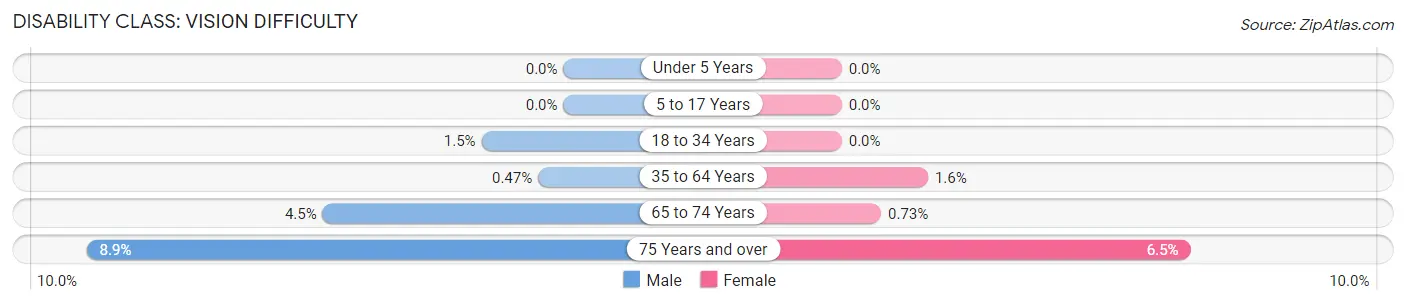
| Age Bracket | Male | Female |
| Under 5 Years | 0 (0.0%) | 0 (0.0%) |
| 5 to 17 Years | 0 (0.0%) | 0 (0.0%) |
| 18 to 34 Years | 35 (1.5%) | 0 (0.0%) |
| 35 to 64 Years | 21 (0.5%) | 73 (1.6%) |
| 65 to 74 Years | 62 (4.5%) | 9 (0.7%) |
| 75 Years and over | 63 (8.8%) | 70 (6.5%) |
Disability Class: Cognitive Difficulty
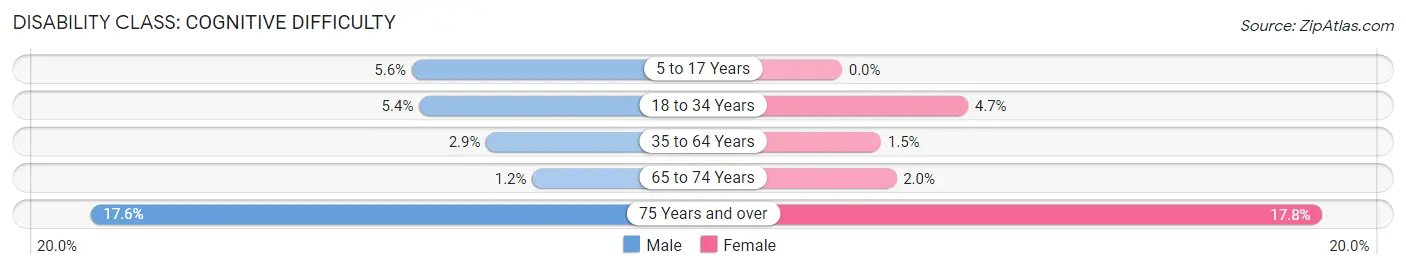
| Age Bracket | Male | Female |
| 5 to 17 Years | 95 (5.6%) | 0 (0.0%) |
| 18 to 34 Years | 123 (5.3%) | 114 (4.7%) |
| 35 to 64 Years | 128 (2.9%) | 66 (1.5%) |
| 65 to 74 Years | 16 (1.1%) | 25 (2.0%) |
| 75 Years and over | 125 (17.6%) | 193 (17.8%) |
Disability Class: Ambulatory Difficulty
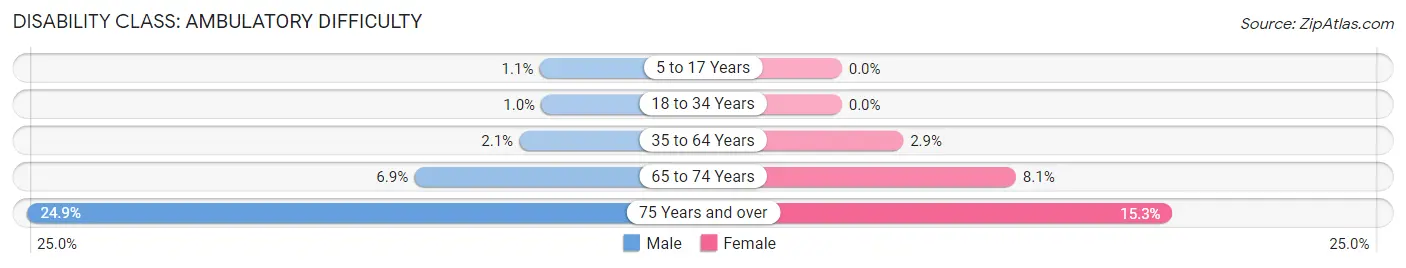
| Age Bracket | Male | Female |
| 5 to 17 Years | 19 (1.1%) | 0 (0.0%) |
| 18 to 34 Years | 24 (1.0%) | 0 (0.0%) |
| 35 to 64 Years | 92 (2.1%) | 130 (2.9%) |
| 65 to 74 Years | 96 (6.9%) | 100 (8.1%) |
| 75 Years and over | 177 (24.9%) | 166 (15.3%) |
Disability Class: Self-Care Difficulty
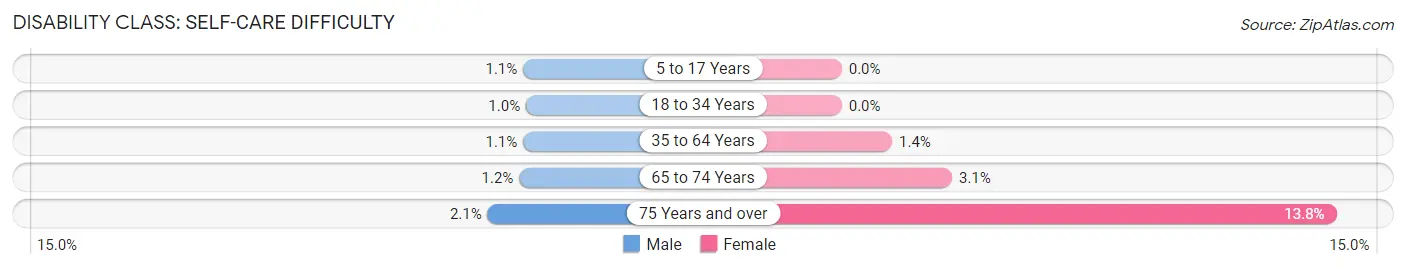
| Age Bracket | Male | Female |
| 5 to 17 Years | 19 (1.1%) | 0 (0.0%) |
| 18 to 34 Years | 24 (1.0%) | 0 (0.0%) |
| 35 to 64 Years | 50 (1.1%) | 64 (1.4%) |
| 65 to 74 Years | 17 (1.2%) | 38 (3.1%) |
| 75 Years and over | 15 (2.1%) | 149 (13.8%) |
Technology Access in Allison Park
Computing Device Access in Allison Park
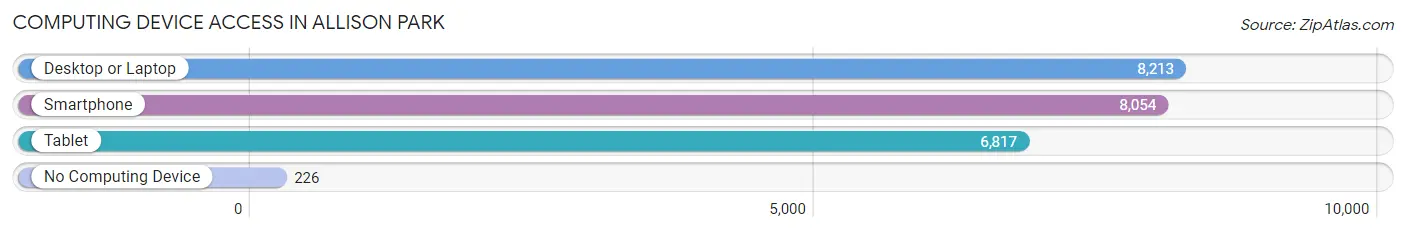
| Device Type | # Households | % Households |
| Desktop or Laptop | 8,213 | 90.4% |
| Smartphone | 8,054 | 88.6% |
| Tablet | 6,817 | 75.0% |
| No Computing Device | 226 | 2.5% |
| Total | 9,086 | 100.0% |
Internet Access in Allison Park
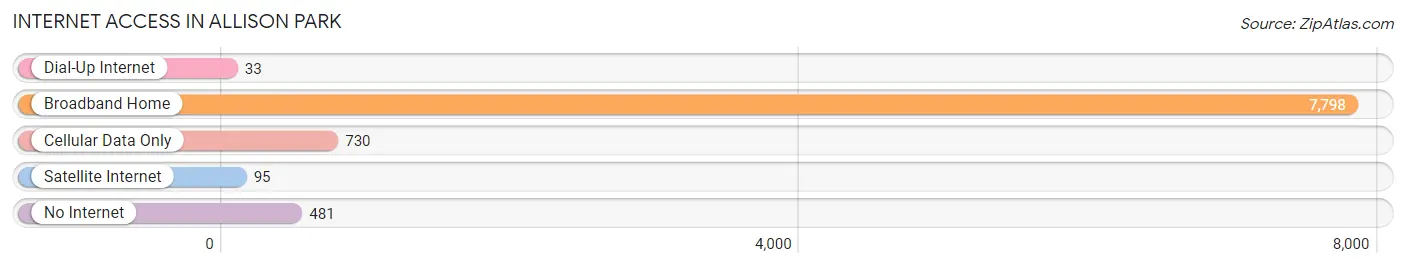
| Internet Type | # Households | % Households |
| Dial-Up Internet | 33 | 0.4% |
| Broadband Home | 7,798 | 85.8% |
| Cellular Data Only | 730 | 8.0% |
| Satellite Internet | 95 | 1.1% |
| No Internet | 481 | 5.3% |
| Total | 9,086 | 100.0% |
Allison Park Summary
Allison Park is a census-designated place (CDP) located in Allegheny County, Pennsylvania. It is a suburb of Pittsburgh, located approximately 15 miles north of the city. The population of Allison Park was 20,552 at the 2010 census.
Geography
Allison Park is located at 40°32'45" North, 79°59'45" West (40.545833, -79.995833). It is situated in the northeast corner of Allegheny County, bordered by the boroughs of Hampton and Shaler to the south, McCandless to the west, and the Butler County borough of Richland to the north. The CDP has a total area of 8.2 square miles, all of which is land.
History
Allison Park was first settled in the late 1700s by the Allison family, who were among the first settlers in the area. The Allison family owned a large tract of land in the area, which was eventually divided and sold off to other settlers. The area was known as Allison Park until the late 1800s, when it was renamed to Hampton Township. In the early 1900s, the area was annexed by the borough of Shaler, and the name was changed back to Allison Park.
Economy
Allison Park is home to a variety of businesses, including retail stores, restaurants, and professional services. The largest employers in the area are UPMC Passavant Hospital, Giant Eagle, and the Hampton Township School District. The area also has a number of small businesses, including auto repair shops, hair salons, and pet stores.
Demographics
As of the 2010 census, the population of Allison Park was 20,552. The racial makeup of the CDP was 92.3% White, 3.3% African American, 0.3% Native American, 1.7% Asian, 0.1% Pacific Islander, and 2.3% from other races. Hispanic or Latino of any race were 3.2% of the population.
The median household income in Allison Park was $68,945 in 2018, and the median family income was $77,945. The per capita income was $32,945. About 4.2% of families and 5.7% of the population were below the poverty line, including 8.2% of those under age 18 and 4.2% of those age 65 or over.
Education
Allison Park is served by the Hampton Township School District, which includes four elementary schools, one middle school, and one high school. The area is also home to several private schools, including St. Mary of the Assumption School and North Hills Christian School.
Common Questions
What is Per Capita Income in Allison Park?
Per Capita income in Allison Park is $54,435.
What is the Median Family Income in Allison Park?
Median Family Income in Allison Park is $137,945.
What is the Median Household income in Allison Park?
Median Household Income in Allison Park is $106,588.
What is Income or Wage Gap in Allison Park?
Income or Wage Gap in Allison Park is 27.5%.
Women in Allison Park earn 72.5 cents for every dollar earned by a man.
What is Family Income Deficit in Allison Park?
Family Income Deficit in Allison Park is $8,126.
Families that are below poverty line in Allison Park earn $8,126 less on average than the poverty threshold level.
What is Inequality or Gini Index in Allison Park?
Inequality or Gini Index in Allison Park is 0.42.
What is the Total Population of Allison Park?
Total Population of Allison Park is 22,701.
What is the Total Male Population of Allison Park?
Total Male Population of Allison Park is 11,220.
What is the Total Female Population of Allison Park?
Total Female Population of Allison Park is 11,481.
What is the Ratio of Males per 100 Females in Allison Park?
There are 97.73 Males per 100 Females in Allison Park.
What is the Ratio of Females per 100 Males in Allison Park?
There are 102.33 Females per 100 Males in Allison Park.
What is the Median Population Age in Allison Park?
Median Population Age in Allison Park is 42.9 Years.
What is the Average Family Size in Allison Park
Average Family Size in Allison Park is 3.0 People.
What is the Average Household Size in Allison Park
Average Household Size in Allison Park is 2.4 People.
How Large is the Labor Force in Allison Park?
There are 12,847 People in the Labor Forcein in Allison Park.
What is the Percentage of People in the Labor Force in Allison Park?
68.1% of People are in the Labor Force in Allison Park.
What is the Unemployment Rate in Allison Park?
Unemployment Rate in Allison Park is 4.5%.